Embed Size (px)
Citation preview

This work has been digitalized and published in 2013 by Verlag Zeitschrift für Naturforschung in cooperation with the Max Planck Society for the Advancement of Science under a Creative Commons Attribution4.0 International License.
Dieses Werk wurde im Jahr 2013 vom Verlag Zeitschrift für Naturforschungin Zusammenarbeit mit der Max-Planck-Gesellschaft zur Förderung derWissenschaften e.V. digitalisiert und unter folgender Lizenz veröffentlicht:Creative Commons Namensnennung 4.0 Lizenz.
E le c tro n ic R a m a n S p e c tra o f a L o w -S p in F e ra P o r p h y r in a n d
R e e x a m in a tio n o f th e V ib ra t io n a l S p e c tr a o f K 3[F e (C N )6]
a n d [F e (C 5H 5)2]B F4
Svend Sievertsen, Lutz Galich, and Heiner Homborg Institut für Anorganische Chemie der Christian-Albrechts-Universität, Olshausenstr. 40, D-24098 Kiel, Germany
Z. Naturforsch. 50 a, 881-887(1995); received May 26, 1995
The resonance Raman spectra of (nBu4N)[Fe(CN)2TPP] (("BiitN): tetra(n-butyl)ammonium; TPP: m-tetraphenylporphyrin), K3 [Fe(CN)6] and [Fe(C5H5)2]BF4 have been investigated. A molecular electronic Raman (ER) effect at 545 cm"1 is observed for (nBu4N)[Fe(CN)2TPP]. The transition occurs between lower 'TV' and upper 'Tg" level of the spin-orbit split ground state assuming pseudo-octahedral symmetry. In contrast to earlier studies no ER effect is detected for K3[Fe(CN)6] and [Fe(C5H5)2]BF4. For Raman shifts < 800 cm-1 only one strong Raman line is observed for [Fe(C5H5)2]BF4 at 311 cm-1, assigned to the iron ring stretch designated by u4 (aig in D5(j). Due to a phase transition of K3[Fe(CN)6], two additional strong vibrational lines at 329 and 352 cm-1 appear in the Raman spectrum taken at 10 K. Their intensities show A "term" behaviour of the resonance Raman effect with overtones and combinations for both lines. These are components of the vibronic combinations with the i/6, vi, and i/g modes (tiu in Oh) in the IR spectra, too.
Key words: Di(cyano)-m-tetraphenylporphinatoferrate(III), Hexacyanoferrate(III), Ferricenium, Electronic Raman Spectra, Vibrational Spectra.
Introduction
The detection of low lying electronic d-d or f-f transitions is one of the challenges of the resonance Raman effect because these transitions are (parity) allowed only in Raman scattering but forbidden in infrared absorbance. Currently, electronic Raman (ER) lines from electronic levels of lanthanide and heavier transition metal ions have been detected [1-4]. A textbook example are the intraconfigurational transitions within the levels of the spin-orbit split ground state of low-spin Os™ in the resonance Raman spectrum of (nBu4N)2[OsBr6] [5]. Nevertheless, the irrevocable spectral requirements for common use of this promising method are yet still unpredictable. For lighter transition metal ions further striking complications arise from coincidences with vibrational states. A distinction of the different originating states is sometimes achieved by depolarisation ratios or more generally by the temperature dependence of the Raman intensities, as will be illustrated later on.
Reprint requests to Dr. H. Homborg.
Iron porphyrins are of crucial importance in many life processes. Therefore any kind of information concerning the electronic properties of iron in the different spin and oxidation states is of great value. For ER spectroscopy low-spin Fem porphyrins, related "tetrapyrroles" or even any kind of complexes opting for this electronic ground state are of primary interest. Although there are numerous potential candidates irrefutable ER lines have been reported so far only for di(acido)phthalocyaninatoferrates(III) and the iron group homologues [6-10], but surprisingly not for iron porphyrins. This fact stimulated our systematic search for ER lines in the resonance Raman spectra of low-spin Fem porphyrins, particularly of m-tetraphenylporphyrin to start with, as it is one of the most thoroughly investigated model complexes mimicking natural iron porphyrins.
In this report we present evidence for an ER line in the resonance Raman spectrum of tetra(n-butyl)ammoniumdi(cyano)-m-tetraphenyl- porphinatoferrate(m), (nBu4N)[Fe(CN)2TPP]. To our knowledge only two further low-spin Fem complexes have been claimed to show ER lines: K3[Fe(CN)6] [11] and [Fe(C5H5)2]X (X = BF4, FeCU, I3) [12,13].
0932-0784 / 95 / 0900-0881 $ 06.00 © - Verlag der Zeitschrift für Naturforschung, D-72072 Tübingen
S. Sievertsen et al. • Electronic Raman Spectra of a Low-Spin Fe111 [Porphyrin]
In comparison with the aforementioned phthalocya- nines these presumed ER lines are shifted to far higher or far lower energy. It is for this reason that the respective vibrational spectra are reexamined in this report, too, and distinctly new assignments are proposed.
Results and Discussion
The resonance Raman spectra of (nBu4N)[Fe(CN)2TPP]
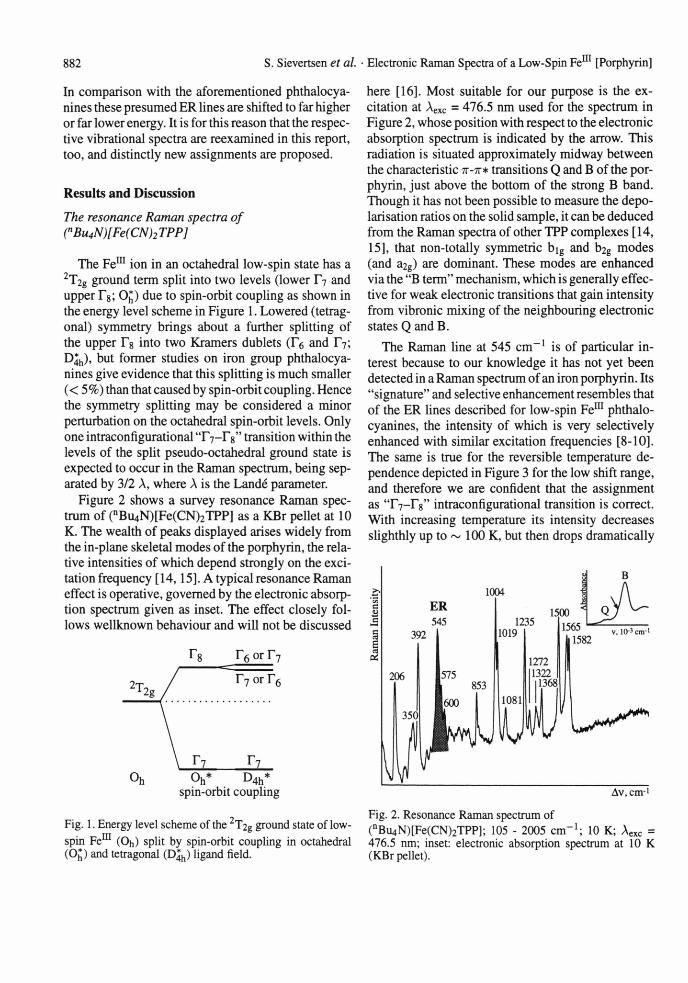
The Fem ion in an octahedral low-spin state has a 2T2g ground term split into two levels (lower T7 and upper Tg; O^) due to spin-orbit coupling as shown in the energy level scheme in Figure 1. Lowered (tetragonal) symmetry brings about a further splitting of the upper Tg into two Kramers dublets (Tö and T7; D |h), but former studies on iron group phthalocya- nines give evidence that this splitting is much smaller (< 5%) than that caused by spin-orbit coupling. Hence the symmetry splitting may be considered a minor perturbation on the octahedral spin-orbit levels. Only one intraconfigurational 'T 7-Fg" transition within the levels of the split pseudo-octahedral ground state is expected to occur in the Raman spectrum, being separated by 3/2 A, where A is the Lande parameter.
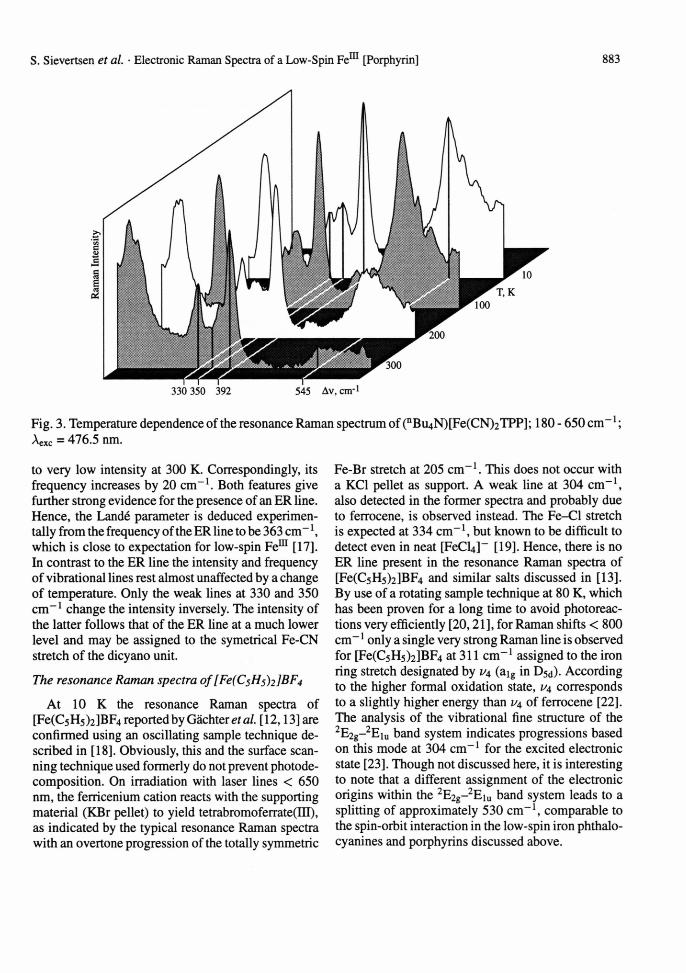
Figure 2 shows a survey resonance Raman spectrum of (nBu4N)[Fe(CN)2TPP] as a KBr pellet at 10 K. The wealth of peaks displayed arises widely from the in-plane skeletal modes of the porphyrin, the relative intensities of which depend strongly on the excitation frequency [14,15]. A typical resonance Raman effect is operative, governed by the electronic absorption spectrum given as inset. The effect closely follows wellknown behaviour and will not be discussed
r 8 r 6 or r 7
2T2g / 6
V j j ______! J _Oh Oh* D4h*
spin-orbit coupling
Fig. 1. Energy level scheme of the 2T2g ground state of low-spin Fe111 (Oh) split by spin-orbit coupling in octahedral (Op and tetragonal (D^) ligand field.
882
here [16]. Most suitable for our purpose is the excitation at Aexc = 476.5 nm used for the spectrum in Figure 2, whose position with respect to the electronic absorption spectrum is indicated by the arrow. This radiation is situated approximately midway between the characteristic 7r-7r* transitions Q and B of the porphyrin, just above the bottom of the strong B band. Though it has not been possible to measure the depo- larisation ratios on the solid sample, it can be deduced from the Raman spectra of other TPP complexes [14, 15], that non-totally symmetric big and b2g modes (and a2g) are dominant. These modes are enhanced via the "B term" mechanism, which is generally effective for weak electronic transitions that gain intensity from vibronic mixing of the neighbouring electronic states Q and B.
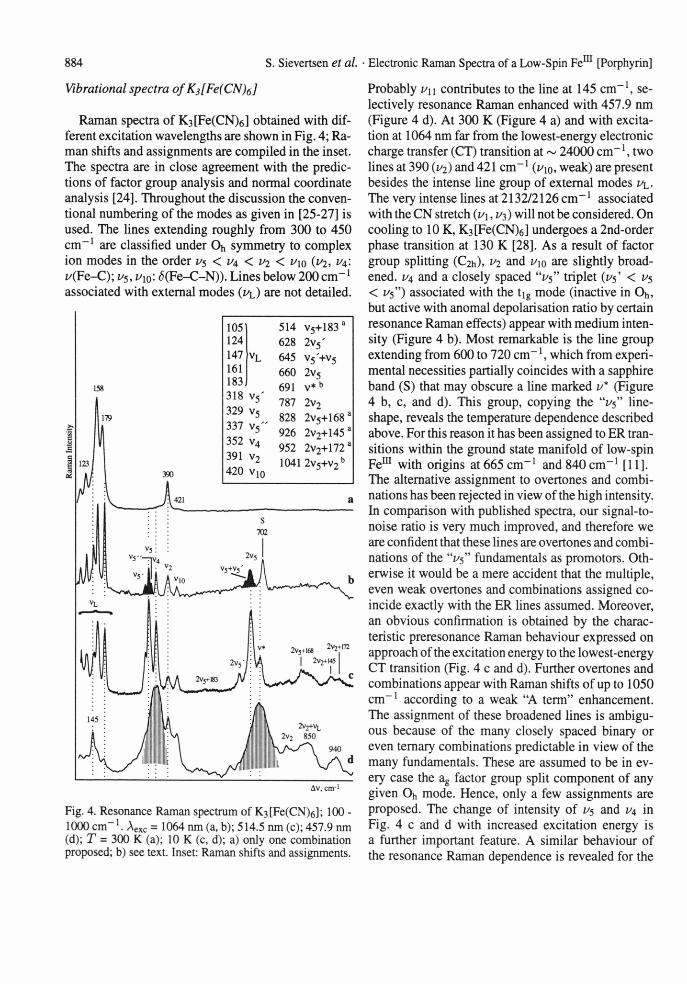
The Raman line at 545 cm-1 is of particular interest because to our knowledge it has not yet been detected in a Raman spectrum of an iron porphyrin. Its "signature" and selective enhancement resembles that of the ER lines described for low-spin Fem phthalo- cyanines, the intensity of which is very selectively enhanced with similar excitation frequencies [8-10]. The same is true for the reversible temperature dependence depicted in Figure 3 for the low shift range, and therefore we are confident that the assignment as 'T 7- r 8" intraconfigurational transition is correct. With increasing temperature its intensity decreases slighthly up to ~ 100 K, but then drops dramatically
& nc■23J3 i£
Fig. 2. Resonance Raman spectrum of (n B U4 N) [Fe(CN)2TPP]; 105 - 2005 cm"1; 10 K; Aexc = 476.5 nm; inset: electronic absorption spectrum at 10 K (KBr pellet).
883 S. Sievertsen et al. • Electronic Raman Spectra of a Low-Spin Fe111 [Porphyrin]
Fig. 3. Temperature dependence of the resonance Raman spectrum of (nBti4N)[Fe(CN)2TPP]; 180 - 650 cm Aexc = 476.5 nm.
to very low intensity at 300 K. Correspondingly, its frequency increases by 20 cm-1. Both features give further strong evidence for the presence of an ER line. Hence, the Land6 parameter is deduced experimentally from the frequency of the ER line to be 363 cm" \ which is close to expectation for low-spin Fem [17]. In contrast to the ER line the intensity and frequency of vibrational lines rest almost unaffected by a change of temperature. Only the weak lines at 330 and 350 cm-1 change the intensity inversely. The intensity of the latter follows that of the ER line at a much lower level and may be assigned to the symetrical Fe-CN stretch of the dicyano unit.
The resonance Raman spectra of [Fe(CsHs)2]BF4
At 10 K the resonance Raman spectra of [Fe(C5H5)2]BF4 reported by Gächter et al. [12,13] are confirmed using an oscillating sample technique described in [18]. Obviously, this and the surface scanning technique used formerly do not prevent photode- composition. On irradiation with laser lines < 650 nm, the ferricenium cation reacts with the supporting material (KBr pellet) to yield tetrabromoferrate(III), as indicated by the typical resonance Raman spectra with an overtone progression of the totally symmetric
Fe-Br stretch at 205 cm-1 . This does not occur with a KCl pellet as support. A weak line at 304 cm-1, also detected in the former spectra and probably due to ferrocene, is observed instead. The Fe-Cl stretch is expected at 334 cm-1, but known to be difficult to detect even in neat [FeCU]~ [19]. Hence, there is no ER line present in the resonance Raman spectra of [Fe(CsH5)2]BF4 and similar salts discussed in [13]. By use of a rotating sample technique at 80 K, which has been proven for a long time to avoid photoreac- tions very efficiently [20,21], for Raman shifts < 800 cm- 1 only a single very strong Raman line is observed for [Fe(C5H5)2]BF4 at 311 cm-1 assigned to the iron ring stretch designated by (aig in Dsd). According to the higher formal oxidation state, 1/4 corresponds to a slightly higher energy than 1/4 of ferrocene [22]. The analysis of the vibrational fine structure of the 2E2g-2Eiu band system indicates progressions based on this mode at 304 cm-1 for the excited electronic state [23]. Though not discussed here, it is interesting to note that a different assignment of the electronic origins within the 2E2g- 2Eiu band system leads to a splitting of approximately 530 cm-1, comparable to the spin-orbit interaction in the low-spin iron phthalo- cyanines and porphyrins discussed above.
Vibrational spectra of Kj[Fe(CN)(s]
Raman spectra of K3[Fe(CN)6] obtained with different excitation wavelengths are shown in Fig. 4; Raman shifts and assignments are compiled in the inset. The spectra are in close agreement with the predictions of factor group analysis and normal coordinate analysis [24]. Throughout the discussion the conventional numbering of the modes as given in [25-27] is used. The lines extending roughly from 300 to 450 cm-1 are classified under Oh symmetry to complex ion modes in the order v5 < i/4 < i/2 < v\o v*: i/(Fe-C); u5, v10: <5(Fe-C-N)). Lines below 200 cm "1 associated with external modes (i>l) are not detailed.
884 S. Sievertsen et al.
Fig. 4. Resonance Raman spectrum of K3[Fe(CN)6]; 100 - 1000 cm-1. Aexc = 1064 nm (a, b); 514.5 nm (c); 457.9 nm (d); T = 300 K (a); 10 K (c, d); a) only one combination proposed; b) see text. Inset: Raman shifts and assignments.
Probably vn contributes to the line at 145 cm-1, selectively resonance Raman enhanced with 457.9 nm (Figure 4 d). At 300 K (Figure 4 a) and with excitation at 1064 nm far from the lowest-energy electronic charge transfer (CT) transition at ~ 24000 cm-1, two lines at 390 (vi) and 421 cm-1 (uio, weak) are present besides the intense line group of external modes u^. The very intense lines at 2132/2126 cm- 1 associated with the CN stretch (vi, 1/3) will not be considered. On cooling to 10 K, K3[Fe(CN)6] undergoes a 2nd-order phase transition at 130 K [28]. As a result of factor group splitting (C2h), and z o are slightly broadened. U4 and a closely spaced "1/5" triplet (1/5' < 1/5 < 1/5") associated with the tig mode (inactive in Oh, but active with anomal depolarisation ratio by certain resonance Raman effects) appear with medium intensity (Figure 4 b). Most remarkable is the line group extending from 600 to 720 cm-1, which from experimental necessities partially coincides with a sapphire band (S) that may obscure a line marked u* (Figure 4 b, c, and d). This group, copying the "1/5" line- shape, reveals the temperature dependence described above. For this reason it has been assigned to ER transitions within the ground state manifold of low-spin Fem with origins at 665 cm-1 and 840 cm-1 [11]. The alternative assignment to overtones and combinations has been rejected in view of the high intensity. In comparison with published spectra, our signal-to- noise ratio is very much improved, and therefore we are confident that these lines are overtones and combinations of the "z/5" fundamentals as promotors. Otherwise it would be a mere accident that the multiple, even weak overtones and combinations assigned coincide exactly with the ER lines assumed. Moreover, an obvious confirmation is obtained by the characteristic preresonance Raman behaviour expressed on approach of the excitation energy to the lowest-energy CT transition (Fig. 4 c and d). Further overtones and combinations appear with Raman shifts of up to 1050 cm-1 according to a weak "A term" enhancement. The assignment of these broadened lines is ambiguous because of the many closely spaced binary or even ternary combinations predictable in view of the many fundamentals. These are assumed to be in every case the ag factor group split component of any given Oh mode. Hence, only a few assignments are proposed. The change of intensity of u5 and 1/4 in Fig. 4 c and d with increased excitation energy is a further important feature. A similar behaviour of the resonance Raman dependence is revealed for the
• Electronic Raman Spectra of a Low-Spin Fe111 [Porphyrin]
885 S. Sievertsen et al. • Electronic Raman Spectra of a Low-Spin Fe111 [Porphyrin]
higher shifted line groups, thus strengthening our assignment as overtones and combinations. There still remains some uncertainty concerning the assignment of v$ \ 1/4, and v*. Presumably, vibrational coupling broadens the 'Vs'Vi^ fundamentals. This is reflected by the shape of the overtones (Fig. 4 d) and the shift of v*, averaging the shifts of the promoting fundamentals.
At first glance, the high intensity of "1/5" and U4 (completely absent at high temperature) compared to the totally symmetric Fe-C stretch 1/2 is surprising, as one would expect a clear distinction favouring v2. With increasing excitation energy a resonance Raman effect becomes active, decreasing the intensity of u and increasing that of the "/1/4 group. An even more intriguing feature is the high intensity of the first overtone of "1/5", being as high as the fundamental together with the extreme drop for higher overtones. It seems that there is no example of a tig fundamental in the literature gaining intensity by factor group splitting, and hence the behaviour of this mode is not well documented. As a possible explanation it must be considered that, in contrast to the tig fundamental, its first harmonic is allowed in Raman scattering and may gain intensity by this mechanism. However,
v, cm-1
Fig. 5. Infrared spectrum of K3 [Fe(CN)6]. a, b) (absorbance expanded) 2122 - 3272 cm-1; c) Raman spectrum of Figure 4 c.
since the excitation energy is still far away from coincidence with the lowest-energy CT transition, only an ill-defined picture of the resonance Raman effect emerges. For a better mutual understanding of the resonance Raman effect and the individual coordinates involved in the lowest-energy CT transition, studies with higher energy excitations are necessary.
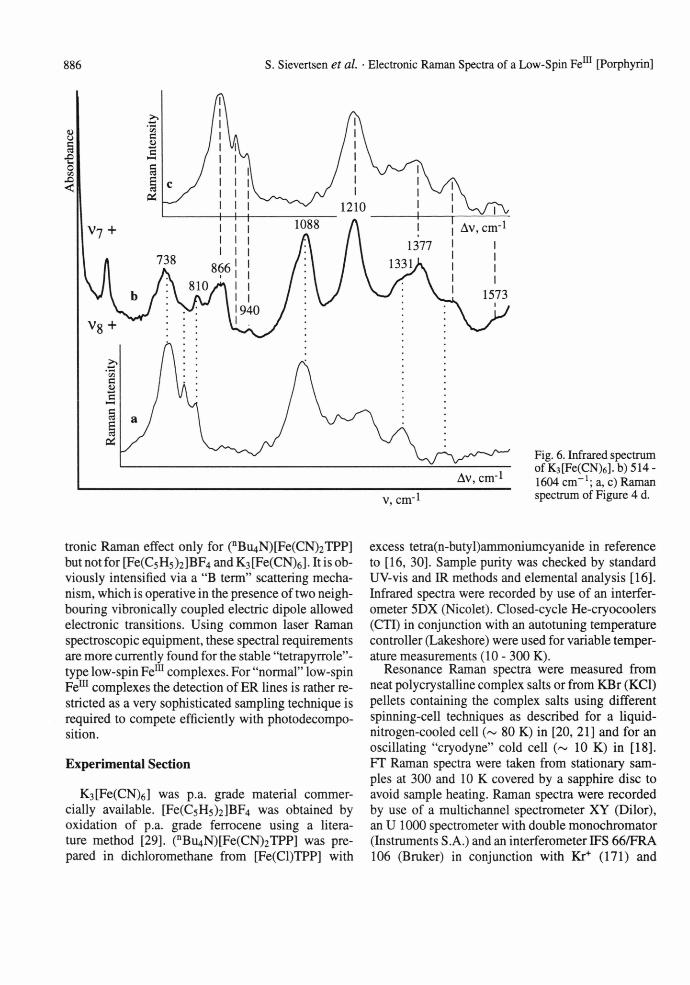
In Figs. 5 a, b and 6 b infrared spectra of K3[Fe(CN)6] at 10 K, extending from 2122 cm-1 to 3172 cm-1 and from 650 cm-1 to 1620 cm-1, are shown. In addition to the strong fundamentals, Naka- gawa and Shimanouchi [24] have quoted two groups of weak to medium absorption bands in the infrared spectrum which are assigned to combination bands by Ohata et al. [11]. Our spectroscopic results confirm these earlier data but a very different interpretation is proposed for three instead of two distinct band groups based on a skilful combination of the complementary infrared and Raman spectra. The infrared bands in Fig. 5 a and b (extended absorbance) are based on the Vfy fundamental maximizing at 2122 cm-1 (tiu, C-N stretch). According to group theory, every combination band composed of modes with even parity with any tiu mode becomes infrared active. Therefore, the Raman spectrum from Fig. 4 c and its inset demonstrates the correct assignment as combinations of 1/6 with most of the Raman active fundamentals, overtones and combinations. In principle, the phonon combinations are a copy of the Raman spectrum with the exception of the higher intensity of 1/2 in comparison to i l and "1/5"/1/4. The temperature dependence closely follows that of the Raman spectrum, too. A similar interpretation is valid for the infrared bands in Figure 6 b. These bands are remarkably broader than the former ones, and the Raman spectrum in Fig. 4 d is more suitable for a decoding of the vibrational fine structure. The superposition of this Raman spectrum as inset in Fig. 6 a and c reveals clearly two well separated progressions based on the fundamentals v-] (tiu, Fe-C stretch) at 514 cm-1 and (tiu, Fe-C-N deformation) at 385 cm-1 . These phonon combinations involve the skeletal Fe-C bond and therefore differ significantly from those discussed first, involving peripheral C-N bonds. As a consequence 1/2 is rather weak, while u4 is as strong as in the Raman spectrum.
ConclusionThe intraconfigurational 'T 7- r 8" transition has
been identified unambiguously as an molecular elec
886 S. Sievertsen et al. • Electronic Raman Spectra of a Low-Spin Fe111 [Porphyrin]
Av, cm"1v, cm-1
tronic Raman effect only for (nBu4N)[Fe(CN)2TPP] but not for [Fe(C5H5)2]BF4 and K3[Fe(CN)6]. It is obviously intensified via a "B term" scattering mechanism, which is operative in the presence of two neighbouring vibronically coupled electric dipole allowed electronic transitions. Using common laser Raman spectroscopic equipment, these spectral requirements are more currently found for the stable "tetrapyrrole"- type low-spin Fem complexes. For "normal" low-spin Fem complexes the detection of ER lines is rather restricted as a very sophisticated sampling technique is required to compete efficiently with photodecompo- sition.
Experimental Section
K3[Fe(CN)6] was p.a. grade material commercially available. [Fe(C5H5)2]BF4 was obtained by oxidation of p.a. grade ferrocene using a literature method [29]. (nBu4N)[Fe(CN)2TPP] was prepared in dichloromethane from [Fe(Cl)TPP] with
Fig. 6. Infrared spectrum ofK3[Fe(CN)6].b)514- 1604 cm-1; a, c) Raman spectrum of Figure 4 d.
excess tetra(n-butyl)ammoniumcyanide in reference to [16, 30]. Sample purity was checked by standard UV-vis and IR methods and elemental analysis [16]. Infrared spectra were recorded by use of an interferometer 5DX (Nicolet). Closed-cycle He-cryocoolers (CTI) in conjunction with an autotuning temperature controller (Lakeshore) were used for variable temperature measurements (10 - 300 K).
Resonance Raman spectra were measured from neat polycrystalline complex salts or from KBr (KCl) pellets containing the complex salts using different spinning-cell techniques as described for a liquid- nitrogen-cooled cell (~ 80 K) in [20, 21] and for an oscillating "cryodyne" cold cell 10 K) in [18]. FT Raman spectra were taken from stationary samples at 300 and 10 K covered by a sapphire disc to avoid sample heating. Raman spectra were recorded by use of a multichannel spectrometer XY (Dilor), an U 1000 spectrometer with double monochromator (Instruments S.A.) and an interferometer IFS 66/FRA 106 (Bruker) in conjunction with Kr+ (171) and
Av, cm*1v, cm-1
887 S. Sievertsen et al. • Electronic Raman Spectra of a Low-Spin Fe111 [Porphyrin]
Ar+ (2025) lasers (Spectra Physics) or an NDYAG half-maximum. Depolarisation measurements on thelaser (1064 nm; 300 mW (Adlas)). Detection of solid samples were unsuccessful.the scattered radiation was by standard techniques.Wavenumbers were calibrated by reference to theemission spectrum of neon. Line intensities were not Acknowledgementcorrected for spectral response of the spectrometers.The spectral slitwidths employed (< 4 cm-1) were in We gratefully acknowledge U. Cornelissen and K.all cases much smaller than the observed full-width at Harmel for valuable assistance.
[1] J. A. Koningstein, Introduction to the Theory of the Raman Effect, D. Reidel (ed.), Amsterdam 1973.
[2] A. Kiel and S. P. S. Porto, J. Mol. Spectrosc. 32, 458 (1969).
[3] H. Hamaguchi, J. Chem. Phys. 69,569 (1978).[4] R. J. H. Clark and P. C. Turtle, J. Chem. Soc. Faraday
Trans. II2063 (1978).[5] H. Homborg, Z. Anorg. Allg. Chem. 460, 27 (1980).[6] W. Kalz, H. Homborg, H. Küppers, B. J. Kennedy, and
K. S. Murray, Z. Naturforsch. 39b, 1478 (1984).[7] B. J. Kennedy, K. S. Murray, P. R. Zwack, H. Homborg,
and W. Kalz, Inorg. Chem. 25,2539 (1986).[8] S. Sievertsen, H. Schlehahn, and H. Homborg,
Z. Anorg. Allg. Chem. 619, 1064 (1993).[9] S. Sievertsen, H. Schlehahn, and H. Homborg,
Z. Naturforsch. 48b, 50 (1993).[10] S. Sievertsen, A. Kienast, and H. Homborg, Z. Anorg.
Allg. Chem., in press[11] A. Ohata, Y. Morioka, and I. Nakagawa, Chem. Lett.
239(1981).[12] B. Gächter, G. Jakubinek, B. E. Schneider-Poppe, and
J. A. Koningstein, Chem. Phys. Letters 28,160 (1974).[13] B. Gächter, J. A. Koningstein, and V. T. Aleksanjan, J.
Chem. Phys. 62,4628 (1975).[14] T. G. Spiro and R. S. Czernuszewicz, X.-Y. Li, Coord.
Chem. Rev. 100, 541 (1990).[15] X.-Y. Li, R. S. Czernuszewicz, J. R. Kincaid, O. Su,
and T. G. Spiro, J. Phys. Chem. 94, 31 (1990).
[16] L. Galich, Diplomarbeit, Kiel 1995.[17] B. A. Goodman and J. B. Raynor, Adv. Inorg. Chem.
Radiochem. 13, 135 (1970).[18] W. Preetz and E. Parzich, Z. Naturforsch. 48b, 1737
(1993).[19] R. J. H. Clark and T. J. Dines, Chem. Phys. 70, 269
(1982).[20] H. Homborg, Z. Anorg. Allg. Chem. 460, 17 (1980).[21] H. Homborg and W. Preetz, Spectrochim. Acta A22,
709 (1976).[22] E. R. Lippincott and R. D. Nelson, Spectrochim. Acta
10, 307 (1958).[23] D. N. Hendrickson, Y. S. Sohn, D. M. Duggan, and
H. B. Gray, J. Chem. Phys. 58,4666 (1973).[24] I. Nakagawa and T. Shimanouchi, Spectrochim. Acta
18, 101 (1962).[25] L. H. Jones, J. Chem. Phys. 36, 1209 (1962).[26] J. T. R. Dunsmuir and A. P. Lane, J. Chem. Soc. (A)
778 (1971).[27] D. M. Adams and M. A. Hooper, J. Chem. Soc, Dalton
Trans. 160 (1972).[28] Y. Morioka, K. Toriumi, T. Ito, A. Saito, and I. Nak
agawa, J. Phys. Soc. Japan 54,2184 (1985).[29] A. N. Nesmeyanov, E. G. Perevalova, L. P. Yuv'eva,
and K. I. Grandberg, Izv. Akad. Nauk. SSSR Otd. Khim. Nauk. 7,1772 (1962).
[30] W. R. Scheidt, K. J. Haller, and K. Hatano, J. Amer. Chem. Soc. 102, 3017 (1980).


![D µ o ] ( µ v l ] } v r^ } o Á Z o - Energie24.land Online · Photovoltaik. D l u o ... Solarwechselrichter mit programmierbaren Menüs Wechselrichter + 60A AC - und. 50A Solar-Ladegerät](https://img.pdfslide.org/doc/110x75/5aeae9367f8b9ad73f8dbd4b/d-o-v-l-v-r-o-z-o-online-d-l-u-o-solarwechselrichter-mit-programmierbaren.jpg)