Embed Size (px)
Citation preview
Kristina M. Mueller,1,2 Kerstin Hartmann,3 Doris Kaltenecker,2 Sabine Vettorazzi,3
Mandy Bauer,3 Lea Mauser,3 Sabine Amann,4 Sigrid Jall,5,6 Katrin Fischer,5,6
Harald Esterbauer,4 Timo D. Müller,5,6 Matthias H. Tschöp,5,6 Christoph Magnes,7
Johannes Haybaeck,8 Thomas Scherer,9 Natalie Bordag,10 Jan P. Tuckermann,3 andRichard Moriggl1,2,11
Adipocyte Glucocorticoid ReceptorDeficiency Attenuates Aging- andHFD-Induced Obesity and Impairs theFeeding-Fasting TransitionDiabetes 2017;66:272–286 | DOI: 10.2337/db16-0381
Glucocorticoids (GCs) are important regulators of sys-temic energy metabolism, and aberrant GC action islinked to metabolic dysfunctions. Yet, the extent to whichnormal and pathophysiological energymetabolism dependon the GC receptor (GR) in adipocytes remains unclear.Here, we demonstrate that adipocyte GR deficiency inmice significantly impacts systemic metabolism in differ-ent energetic states. Plasma metabolomics and bio-chemical analyses revealed a marked global effect ofGR deficiency on systemic metabolite abundance and,thus, substrate partitioning in fed and fasted states.This correlated with a decreased lipolytic capacity ofGR-deficient adipocytes under postabsorptive andfasting conditions, resulting from impaired signal trans-duction from b-adrenergic receptors to adenylate cy-clase. Upon prolonged fasting, the impaired lipolyticresponse resulted in abnormal substrate utilizationand lean mass wasting. Conversely, GR deficiency at-tenuated aging-/diet-associated obesity, adipocytehypertrophy, and liver steatosis. Systemic glucosetolerance was improved in obese GR-deficient mice,
which was associated with increased insulin signalingin muscle and adipose tissue. We conclude that the GRin adipocytes exerts central but diverging roles in theregulation of metabolic homeostasis depending on theenergetic state. The adipocyte GR is indispensable forthe feeding-fasting transition but also promotes adipos-ity and associated metabolic disorders in fat-fed andaged mice.
Energy homeostasis requires the integration of multiplesignals between the central nervous system and theperiphery to adjust substrate distribution in accordancewith metabolic demands. The steroid hormones glucocor-ticoids (GCs) are important integrators in the body’s adap-tation to energetic stress by regulating several componentsof energy homeostasis, including glucose and lipid metab-olism (1,2). Consequently, states of chronic GC exposureare associated with metabolic dysfunctions (1,2). The cel-lular effects of GCs are mediated in large part through
1Institute of Animal Breeding and Genetics, University of Veterinary MedicineVienna, Vienna, Austria2Ludwig Boltzmann Institute for Cancer Research, Vienna, Austria3Institute for Comparative Molecular Endocrinology, University of Ulm, Ulm,Germany4Department of Laboratory Medicine, Medical University of Vienna, Vienna, Austria5Institute for Diabetes and Obesity, Helmholtz Diabetes Center, Helmholtz ZentrumMünchen, German Research Center for Environmental Health (GmbH) and GermanCenter for Diabetes Research (DZD), Neuherberg, Germany6Division of Metabolic Diseases, Department of Medicine, Technische UniversitätMünchen, Munich, Germany7HEALTH Institute for Biomedicine and Health Sciences, JOANNEUM RESEARCH,Forschungsgesellschaft mbH, Graz, Austria8Institute of Pathology, Medical University of Graz, Graz, Austria9Division of Endocrinology and Metabolism, Department of Medicine III, MedicalUniversity of Vienna, Vienna, Austria
10Center for Biomarker Research in Medicine, CBmed GmbH, Graz, Austria11Medical University of Vienna, Vienna, Austria
Corresponding authors: Richard Moriggl, [email protected], andJan P. Tuckermann, [email protected].
Received 24 March 2016 and accepted 14 September 2016.
This article contains Supplementary Data online at http://diabetes.diabetesjournals.org/lookup/suppl/doi:10.2337/db16-0381/-/DC1.
K.M.M. and K.H. contributed equally to this work, and J.P.T. and R.M. contributedequally to this work.
© 2017 by the American Diabetes Association. Readers may use this article aslong as the work is properly cited, the use is educational and not for profit, and thework is not altered. More information is available at http://www.diabetesjournals.org/content/license.
272 Diabetes Volume 66, February 2017
METABOLISM
activation of the glucocorticoid receptor (GR). The under-standing of how tissue-specific functions of the GC-GR axiscontribute to systemic energy metabolism has been sub-stantially extended by mouse models of discrete GR defi-ciency in liver and muscle (1,3,4).
The most abundant energy reservoir in mammals iswhite adipose tissue (WAT), which allows nonadiposetissues to function normally under conditions of over-nutrition or fasting (5,6). Thus, an appropriate control inWAT to store and release energy in response to changes innutrient availability is critical for metabolic homeostasis.GCs were shown to induce lipolysis (7–9), to stimulatelipogenesis in the presence of insulin (10,11), and to pro-mote lipid storage, uptake, and mobilization (2,9,12). Anincrease of local GC regeneration by the enzyme 11b-hydroxysteroid dehydrogenase 1 (11b-HSD1) within WATsuggests a role of the adipocyte GC-GR axis in commonobesity (2,12–16). These lines of evidence are consistentwith a central role of GCs in regulating energy metabolism.However, the exact physiological importance of the adipo-cyte GR for the maintenance of systemic metabolic homeo-stasis is yet to be determined.
To delineate this undefined role of the GR, we used anadipocyte-specific gene knockout strategy in mice. We de-monstrate that adipocyte GR significantly impacts systemicnutrient partitioning in different energetic states. While GRdeficiency disrupts the feeding-fasting transition, it amelio-rates obesity and its associated metabolic disorders, thusexerting opposing roles in the regulation of metabolichomeostasis.
RESEARCH DESIGN AND METHODS
Animal ExperimentsAdipocyte-specific GR-deficient mice (Nr3c1tm2GscTg(Adipoq-cre)1Evdr: GRΔAdip; C57BL/6 x FVB/N) were generated bycrossing Nr3c1 floxed (17) with Adipoq-cre mice (18). Adipoq-cre negative littermates served as controls (Nr3c1tm2Gs). Ani-mals were housed under standardized conditions (12-hdark/12-h light cycle) and fed a regular diet (Ssniff EF,R/M Kontrolle; Ssniff GmbH, Soest, Germany). For high-fat diet (HFD) experiments, mice received either SsniffEF acc.D12492 (34.6% crude fat) or Ssniff EF D12450Bmod. Animal studies were approved by the Austriangovernment and the Medical University of Vienna(BMWF-66.009/0132-II/3b/2013) and by the Regional Com-mission Tuebingen, Germany (TVA1126). Except for HFDand aging experiments, 8-week-old male mice were used.
Body composition was determined using EchoMRI-100H(EchoMRI LLC, Houston, TX). m-CT was performed within vivo X-ray microtomograph Skyscan 1176 (RJL Micro &Analytic GmbH, Karlsdorf-Neuthard, Germany). Fat volumewas reconstructed and calculated using NRecon (version1.6.9.18) and CTAn (version 1.14.4.1+).
Glucose and pyruvate tolerance tests (GTTs and PTTs)were performed in 12–16 h–fasted mice; insulin tolerancetests (ITTs) were performed in 4 h–fasted mice. Glucose(2 g/kg) was administered orally or by intraperitoneal
injection (HFD experiments); pyruvate (2 g/kg) and in-sulin (0.75 units/kg) were given intraperitoneally. Bloodglucose levels were determined from the tail vein using aglucometer.
Cold tolerance was determined in 4 h–fasted animals.Mice were housed separately with free access to water at4°C. Rectal temperature was measured at indicated timepoints using a BIO-TK9882 thermometer (Bioseb, Vitrolles,France).
Energy expenditure (EE), locomotor activity, respiratoryexchange ratio (RER), and food intake were measured bycombined indirect calorimetry over 93.4 h (PhenoMaster;TSE Systems, Bad Homburg vor der Höhe, Germany) asdescribed previously (19).
Metabolite and Hormone Measurementsb-Ketones were measured from tail vein blood (FreestylePrecision Xceed, Abbott, Alameda, CA). Nonesterifiedfatty acids (NEFAs) were determined with the NEFA-HR(2) kit (Wako Chemicals, Neuss, Germany), glycerol withthe Free Glycerol Reagent (Sigma-Aldrich, St. Louis, MO),and triglycerides (TGs) and cholesterol were measuredwith a Reflotron Plus analyzer (Roche, Basel, Switzerland).Insulin, corticosterone, and FGF21 were determined byELISA (Ultra-Sensitive Mouse Insulin ELISA [Crystal Chem,Downers Grove, IL], Corticosterone ELISA [Enzo Life Sci-ences, Farmingdale, NY], and Mouse/Rat FGF-21 Quantikine-ELISA [R&D Systems, Minneapolis, MN]). Liver TG contentwas determined using a Triglyceride Colorimetric Assay(Cayman Chemical, Ann Arbor, MI).
Lipolysis AssaysEpididymal WAT (eWAT) was surgically removed andlipolysis was measured as previously described (20). Stim-ulations were performed with insulin (30 ng/mL), iso-proterenol, forskolin, formoterol, or CL-316,243 (all10 mmol/L) for 120 min. NEFA was determined as pre-viously described, and cAMP content in WAT explants bythe cAMP complete ELISA (Enzo Life Sciences). Measure-ments were normalized to tissue weights.
HistologyTissues were fixed in 4% buffered formalin, paraffinembedded, sectioned, and stained with hematoxylin-eosin(H-E) using standard procedures. Adipocyte sizes werequantified from at least three to five different fields permouse and at least 20–60 cells/field using ImageJ (Rasband,W.S., ImageJ; NIH, Bethesda, MD, https://imagej.nih.gov/ij/). Histological evaluation of livers was performed by aboard-certified pathologist (J.H.).
Molecular AnalysesRNA was extracted using commercial kits (Qiagen, Hilden,Germany; Peqlab, Erlangen, Germany). RNA (1 mg) wasreverse transcribed using cDNA synthesis kits (ThermoFisher Scientific, Waltham, MA; Applied Biosystems, FosterCity, CA). Quantitative real-time PCR (qRT-PCR) was per-formed on an Eppendorf Realplex system using the TaqDNA Polymerase Kit (Eppendorf, Hamburg, Germany) or
diabetes.diabetesjournals.org Mueller and Associates 273
on a ViiA7RT-PCR System using the Platinum Sybr GreenqPCR Supermix-UDG (Life Technologies, Carlsbad, CA).Gene expression was normalized to Gapdh or Actb (b-actin)mRNA. Primer sequences are provided in SupplementaryTable 1.
Western blot analyses (40 mg protein) were performedas previously described (21). Primary antibodies againstHSC70 (sc-7298), GR (sc-1004), AKT (sc-8312), GSa(sc-823), peroxisome proliferator–activated receptor a(PPARa; sc-9000) (all Santa Cruz Biotechnology, SantaCruz, CA), pS473-AKT (no. 9271), uncoupling protein1 (UCP1; no. 14670), adipose triglyceride lipase (ATGL;no. 2439), pSer563-HSL (no. 4139), pSer660-HSL (no.4126), hormone-sensitive lipase (HSL; no. 4107), pPKAsubstrate (RRXS*/T*; no. 9624) (all Cell Signaling Tech-nology, Danvers, MA) and b-actin (A1978; Sigma-Aldrich)were used.
Plasma Liquid Chromatography–Mass SpectrometryMetabolomicsAnimals were anesthetized with ketamine/xylazin (i.p.,100 mg/kg and 10 mg/kg, respectively) or CO2 inhalation.Blood was drawn (500–700 mL) via cardiac puncture, filledinto lithium-heparin– or EDTA-coated tubes (Greiner Bio-One, Kremsmünster, Austria), and centrifuged in ,30 minafter collection (15 min, 7,000 rpm, 4°C). Plasma was snapfrozen and stored at 280°C.
Metabolites were analyzed by targeted liquid chroma-tography (LC)–high resolution mass spectrometry (MS)metabolomics according to Bajad et al. (22) by hydrophilicinteraction LC at the HEALTH Institute for Biomedicineand Health Sciences, JOANNEUM RESEARCH (Graz, Aus-tria) as described previously (23). Samples were processedaccording to Yuan et al. (24). Raw data were convertedinto mzXML by msConvert (ProteoWizard Toolkit v3.0.5),and metabolites were targeted-searched by the in-housedeveloped tool PeakScout, with a reference list containingaccurate mass and retention times in agreement withstandards outlined by Sumner et al. (25). Pure substancesof all analytes, except lipids, were run on the same systemto obtain exact reference retention times and fragmen-tation spectra. The results for six samples had to beremoved from analysis due to considerable outlier behaviorin principal component analysis (PCA; two from GRDAdip
HFD cohort and one from each of the fasted control, fastedGRDAdip, fed control, and GRDAdip cohorts).
Statistical AnalysesStatistics were performed with GraphPad Prism or R (26)(v3.2.1, packages stats, missMDA, and nlme) usingTibcoSpotfire (v7.0.0). All data except LC-MS metabolo-mics are presented as mean 6 SEM. Two-tailed Student ttest or Wilcoxon rank-sum test was used for comparingtwo groups and one-way ANOVA followed by Tukey,Dunns, or Bonferroni post hoc tests for multiple compar-ison. Tolerance tests and body growth curves were analyzedwith repeated-measures two-way ANOVA followed byBonferroni post hoc tests. P , 0.05 was considered
statistically significant. Data for EE were analyzed usingANCOVA with body weight and body composition (fatand lean mass) as covariates as previously suggested(27). For LC-MS metabolomics, PCA analysis was per-formed centered and scaled to unit variance (R functionprcomp). Missing values were imputed by a regularizedexpectation-maximization (R function imputePCA andestim_ncpPCA). Log10-transformed data were found to besufficiently normally distributed according to Kolmogorov-Smirnov (86% of all metabolites were normally distributed)and sufficiently homoscedastic according to Levene (84%of all metabolites were homoscedastic). Differences be-tween independent groups were analyzed by ANOVA(R function aov) followed by Benjamini-Hochberg (R func-tion p.adjust) post hoc test.
RESULTS
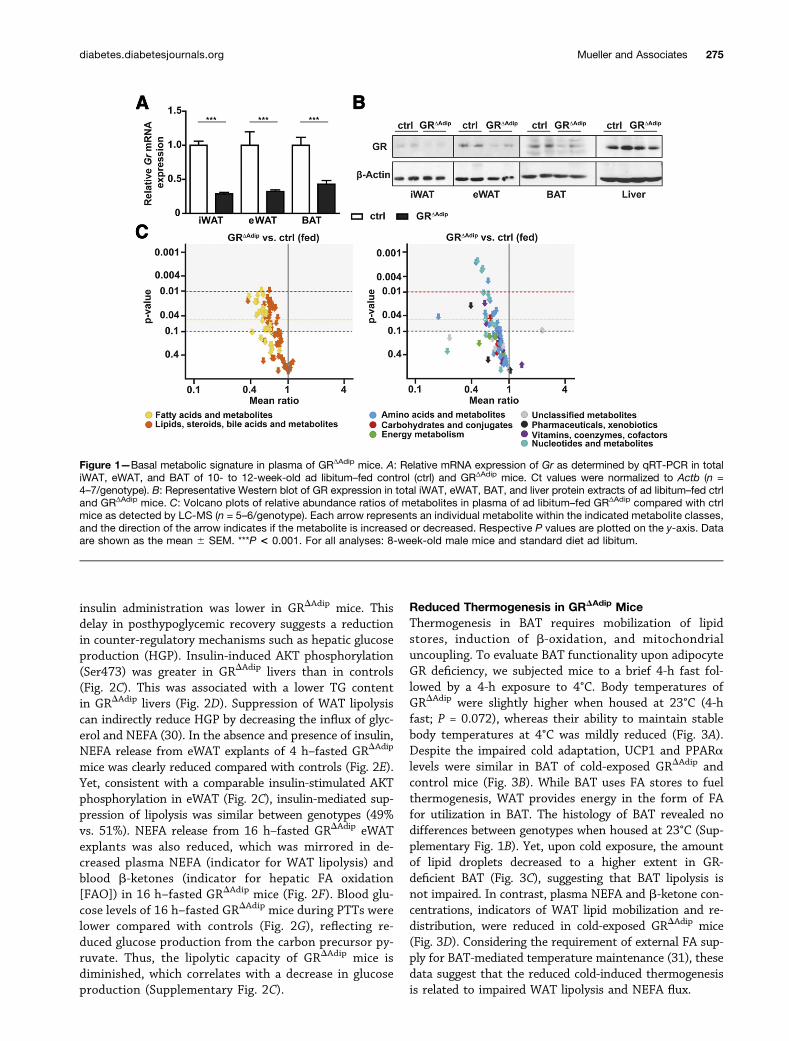
Abnormal Plasma Metabolome in GRΔAdip MiceDeletion of Nr3c1 was confirmed by mRNA and proteinexpression analyses of inguinal WAT (iWAT), eWAT, andbrown adipose tissue (BAT) (Fig. 1A and B). GRΔAdip micedisplayed no overt alterations in weights or morphologyof eWAT, iWAT, and BAT compartments (SupplementaryFig. 1A and B). Accordingly, adipogenic markers (Cebpb,Pparg, and Fabp4) and adipocyte-specific genes (Adiponec-tin, Leptin, and Ucp1) were not differentially expressedamong genotypes (Supplementary Table 2).
To initially illustrate the basal metabolic signature ofGRDAdip mice, plasma samples of ad libitum–fed mice wereanalyzed by targeted LC-MS metabolomics (Supplemen-tary Table 3; PCA results: Supplementary Fig. 2A). A totalof 157 metabolites were of suitable quality for multivar-iate statistical analysis, 20 metabolites only for univariatestatistical analysis. In GRDAdip mice compared with con-trols, 59 metabolites were significantly decreased (P ,0.05, ANOVA) and 22 were decreased by trend (0.05 ,P , 0.1, ANOVA). The majority of decreased metaboliteswere related to fatty acid (FA)/lipid metabolism (46, mostpronounced in long-chain FA), amino acid (AA) metabolism(14, mainly proteogenic and branched-chain AAs, whichhave been implicated as independent risk factors for di-abetes [28]), and nucleotide metabolism (10, mainly pyrim-idine metabolites) (Fig. 1C and Supplementary Table 3).This demonstrates a considerable impact of adipocyte GRdeficiency on the plasma metabolome and, thus, systemicsubstrate partitioning, which likely affects whole-body glu-cose and lipid metabolism in GRDAdip mice (6,29).
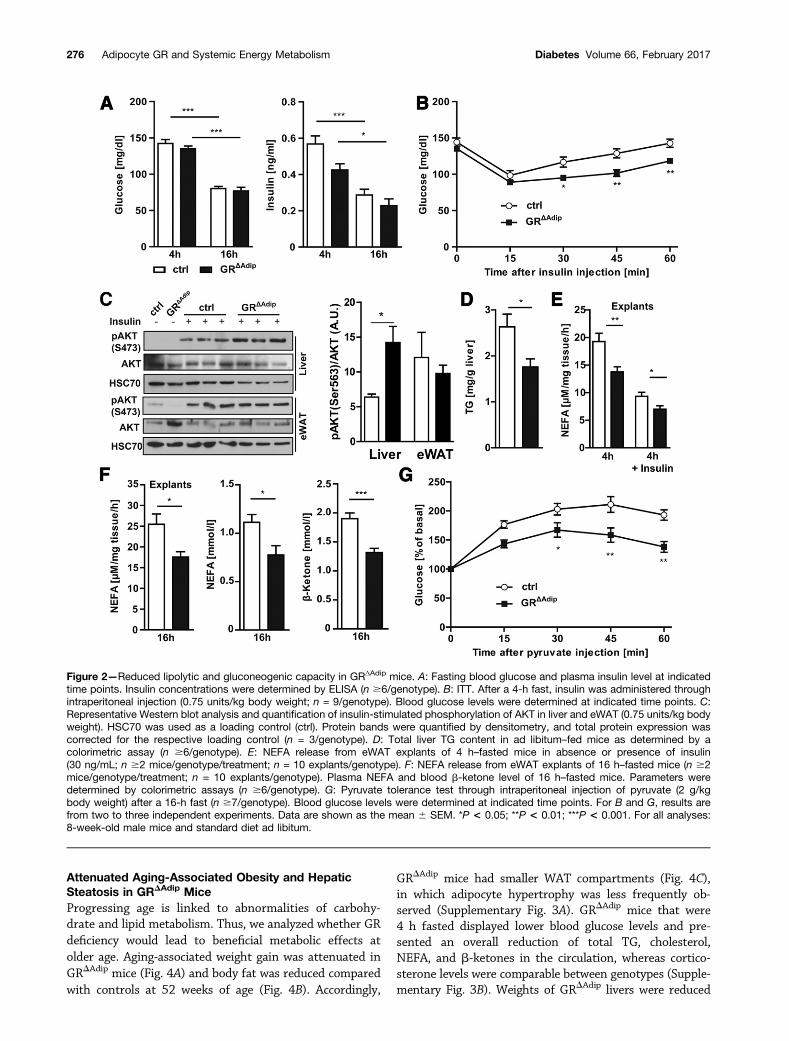
Reduced Lipolytic and Gluconeogenic Capacity inGRDAdip MiceFirst, we analyzed glucose homeostasis in GRDAdip mice. In4 h– and 16 h–fasted mice, blood glucose and plasmainsulin levels were not significantly altered (Fig. 2A).GTTs revealed no differences in glucose clearance betweenthe genotypes (Supplementary Fig. 2B). The hypoglycemicresponse during ITTs was similar in both genotypes (Fig.2B), whereas blood glucose starting from 30 min after
274 Adipocyte GR and Systemic Energy Metabolism Diabetes Volume 66, February 2017
insulin administration was lower in GRDAdip mice. Thisdelay in posthypoglycemic recovery suggests a reductionin counter-regulatory mechanisms such as hepatic glucoseproduction (HGP). Insulin-induced AKT phosphorylation(Ser473) was greater in GRDAdip livers than in controls(Fig. 2C). This was associated with a lower TG contentin GRDAdip livers (Fig. 2D). Suppression of WAT lipolysiscan indirectly reduce HGP by decreasing the influx of glyc-erol and NEFA (30). In the absence and presence of insulin,NEFA release from eWAT explants of 4 h–fasted GRDAdip
mice was clearly reduced compared with controls (Fig. 2E).Yet, consistent with a comparable insulin-stimulated AKTphosphorylation in eWAT (Fig. 2C), insulin-mediated sup-pression of lipolysis was similar between genotypes (49%vs. 51%). NEFA release from 16 h–fasted GRDAdip eWATexplants was also reduced, which was mirrored in de-creased plasma NEFA (indicator for WAT lipolysis) andblood b-ketones (indicator for hepatic FA oxidation[FAO]) in 16 h–fasted GRDAdip mice (Fig. 2F). Blood glu-cose levels of 16 h–fasted GRDAdip mice during PTTs werelower compared with controls (Fig. 2G), reflecting re-duced glucose production from the carbon precursor py-ruvate. Thus, the lipolytic capacity of GRDAdip mice isdiminished, which correlates with a decrease in glucoseproduction (Supplementary Fig. 2C).
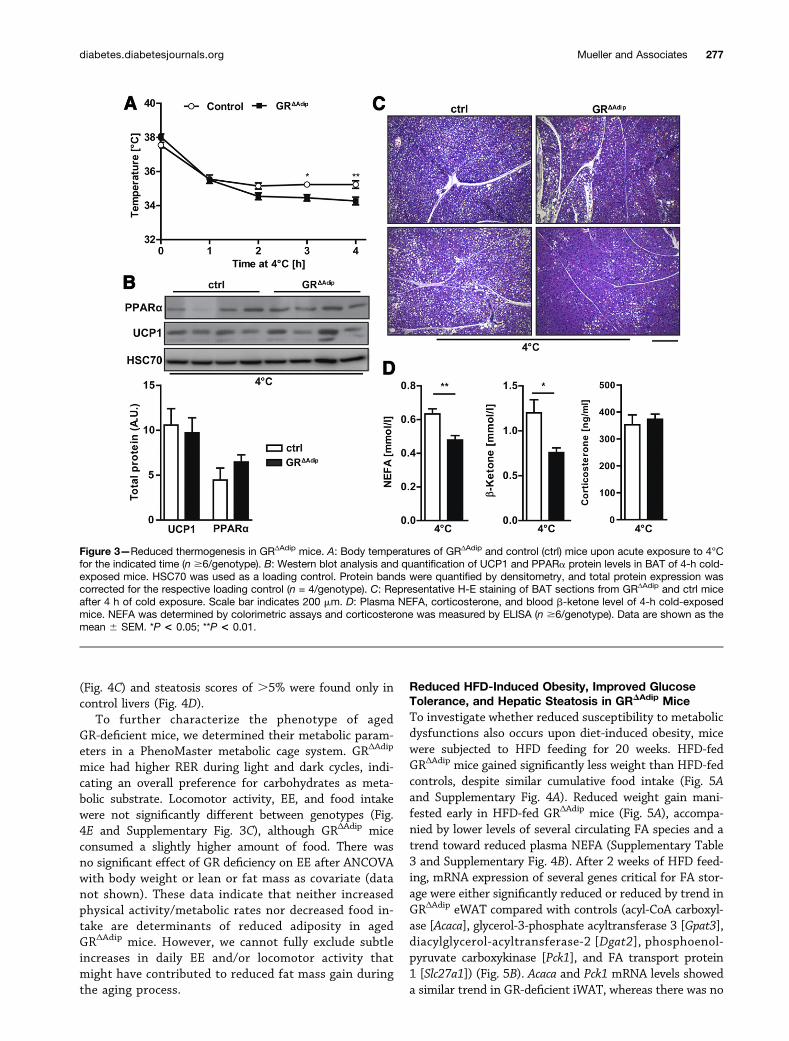
Reduced Thermogenesis in GRDAdip MiceThermogenesis in BAT requires mobilization of lipidstores, induction of b-oxidation, and mitochondrialuncoupling. To evaluate BAT functionality upon adipocyteGR deficiency, we subjected mice to a brief 4-h fast fol-lowed by a 4-h exposure to 4°C. Body temperatures ofGRDAdip were slightly higher when housed at 23°C (4-hfast; P = 0.072), whereas their ability to maintain stablebody temperatures at 4°C was mildly reduced (Fig. 3A).Despite the impaired cold adaptation, UCP1 and PPARalevels were similar in BAT of cold-exposed GRDAdip andcontrol mice (Fig. 3B). While BAT uses FA stores to fuelthermogenesis, WAT provides energy in the form of FAfor utilization in BAT. The histology of BAT revealed nodifferences between genotypes when housed at 23°C (Sup-plementary Fig. 1B). Yet, upon cold exposure, the amountof lipid droplets decreased to a higher extent in GR-deficient BAT (Fig. 3C), suggesting that BAT lipolysis isnot impaired. In contrast, plasma NEFA and b-ketone con-centrations, indicators of WAT lipid mobilization and re-distribution, were reduced in cold-exposed GRDAdip mice(Fig. 3D). Considering the requirement of external FA sup-ply for BAT-mediated temperature maintenance (31), thesedata suggest that the reduced cold-induced thermogenesisis related to impaired WAT lipolysis and NEFA flux.
Figure 1—Basal metabolic signature in plasma of GRΔAdip mice. A: Relative mRNA expression of Gr as determined by qRT-PCR in totaliWAT, eWAT, and BAT of 10- to 12-week-old ad libitum–fed control (ctrl) and GRΔAdip mice. Ct values were normalized to Actb (n =4–7/genotype). B: Representative Western blot of GR expression in total iWAT, eWAT, BAT, and liver protein extracts of ad libitum–fed ctrland GRΔAdip mice. C: Volcano plots of relative abundance ratios of metabolites in plasma of ad libitum–fed GRΔAdip compared with ctrlmice as detected by LC-MS (n = 5–6/genotype). Each arrow represents an individual metabolite within the indicated metabolite classes,and the direction of the arrow indicates if the metabolite is increased or decreased. Respective P values are plotted on the y-axis. Dataare shown as the mean 6 SEM. ***P < 0.001. For all analyses: 8-week-old male mice and standard diet ad libitum.
diabetes.diabetesjournals.org Mueller and Associates 275
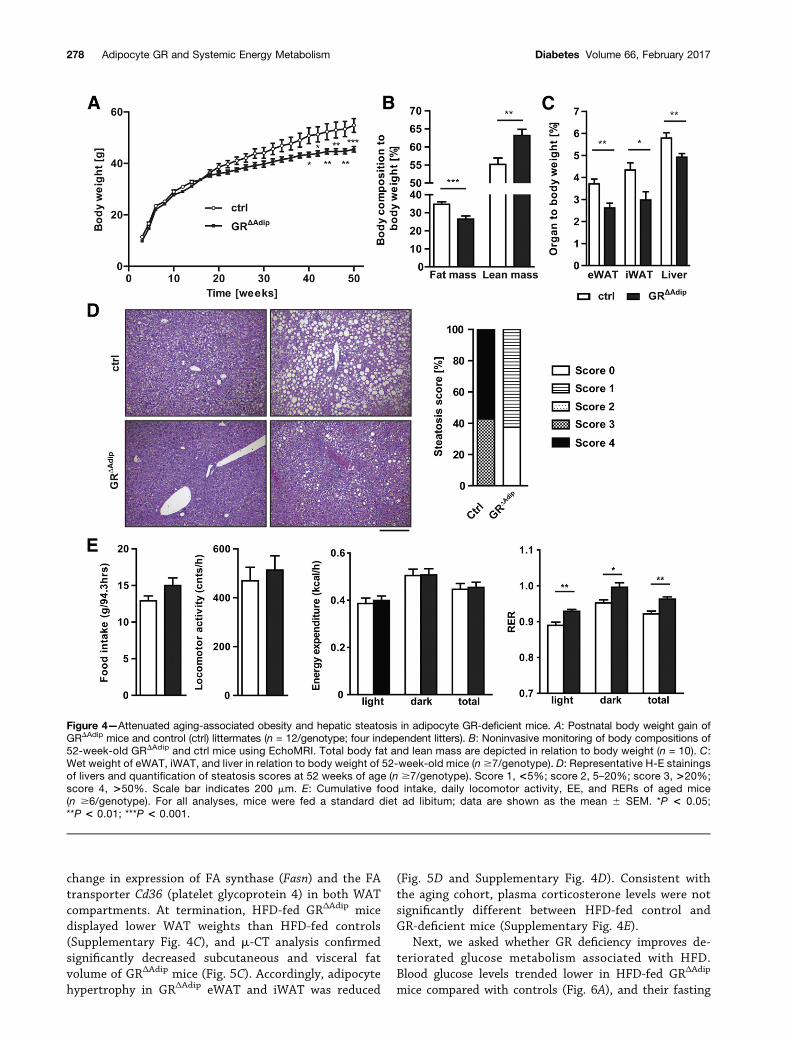
Attenuated Aging-Associated Obesity and HepaticSteatosis in GRDAdip MiceProgressing age is linked to abnormalities of carbohy-drate and lipid metabolism. Thus, we analyzed whether GRdeficiency would lead to beneficial metabolic effects atolder age. Aging-associated weight gain was attenuated inGRDAdip mice (Fig. 4A) and body fat was reduced comparedwith controls at 52 weeks of age (Fig. 4B). Accordingly,
GRDAdip mice had smaller WAT compartments (Fig. 4C),in which adipocyte hypertrophy was less frequently ob-served (Supplementary Fig. 3A). GRDAdip mice that were4 h fasted displayed lower blood glucose levels and pre-sented an overall reduction of total TG, cholesterol,NEFA, and b-ketones in the circulation, whereas cortico-sterone levels were comparable between genotypes (Supple-mentary Fig. 3B). Weights of GRDAdip livers were reduced
Figure 2—Reduced lipolytic and gluconeogenic capacity in GRΔAdip mice. A: Fasting blood glucose and plasma insulin level at indicatedtime points. Insulin concentrations were determined by ELISA (n $6/genotype). B: ITT. After a 4-h fast, insulin was administered throughintraperitoneal injection (0.75 units/kg body weight; n = 9/genotype). Blood glucose levels were determined at indicated time points. C:Representative Western blot analysis and quantification of insulin-stimulated phosphorylation of AKT in liver and eWAT (0.75 units/kg bodyweight). HSC70 was used as a loading control (ctrl). Protein bands were quantified by densitometry, and total protein expression wascorrected for the respective loading control (n = 3/genotype). D: Total liver TG content in ad libitum–fed mice as determined by acolorimetric assay (n $6/genotype). E: NEFA release from eWAT explants of 4 h–fasted mice in absence or presence of insulin(30 ng/mL; n $2 mice/genotype/treatment; n = 10 explants/genotype). F: NEFA release from eWAT explants of 16 h–fasted mice (n $2mice/genotype/treatment; n = 10 explants/genotype). Plasma NEFA and blood b-ketone level of 16 h–fasted mice. Parameters weredetermined by colorimetric assays (n $6/genotype). G: Pyruvate tolerance test through intraperitoneal injection of pyruvate (2 g/kgbody weight) after a 16-h fast (n $7/genotype). Blood glucose levels were determined at indicated time points. For B and G, results arefrom two to three independent experiments. Data are shown as the mean 6 SEM. *P < 0.05; **P < 0.01; ***P < 0.001. For all analyses:8-week-old male mice and standard diet ad libitum.
276 Adipocyte GR and Systemic Energy Metabolism Diabetes Volume 66, February 2017
(Fig. 4C) and steatosis scores of .5% were found only incontrol livers (Fig. 4D).
To further characterize the phenotype of agedGR-deficient mice, we determined their metabolic param-eters in a PhenoMaster metabolic cage system. GRΔAdip
mice had higher RER during light and dark cycles, indi-cating an overall preference for carbohydrates as meta-bolic substrate. Locomotor activity, EE, and food intakewere not significantly different between genotypes (Fig.4E and Supplementary Fig. 3C), although GRΔAdip miceconsumed a slightly higher amount of food. There wasno significant effect of GR deficiency on EE after ANCOVAwith body weight or lean or fat mass as covariate (datanot shown). These data indicate that neither increasedphysical activity/metabolic rates nor decreased food in-take are determinants of reduced adiposity in agedGRΔAdip mice. However, we cannot fully exclude subtleincreases in daily EE and/or locomotor activity thatmight have contributed to reduced fat mass gain duringthe aging process.
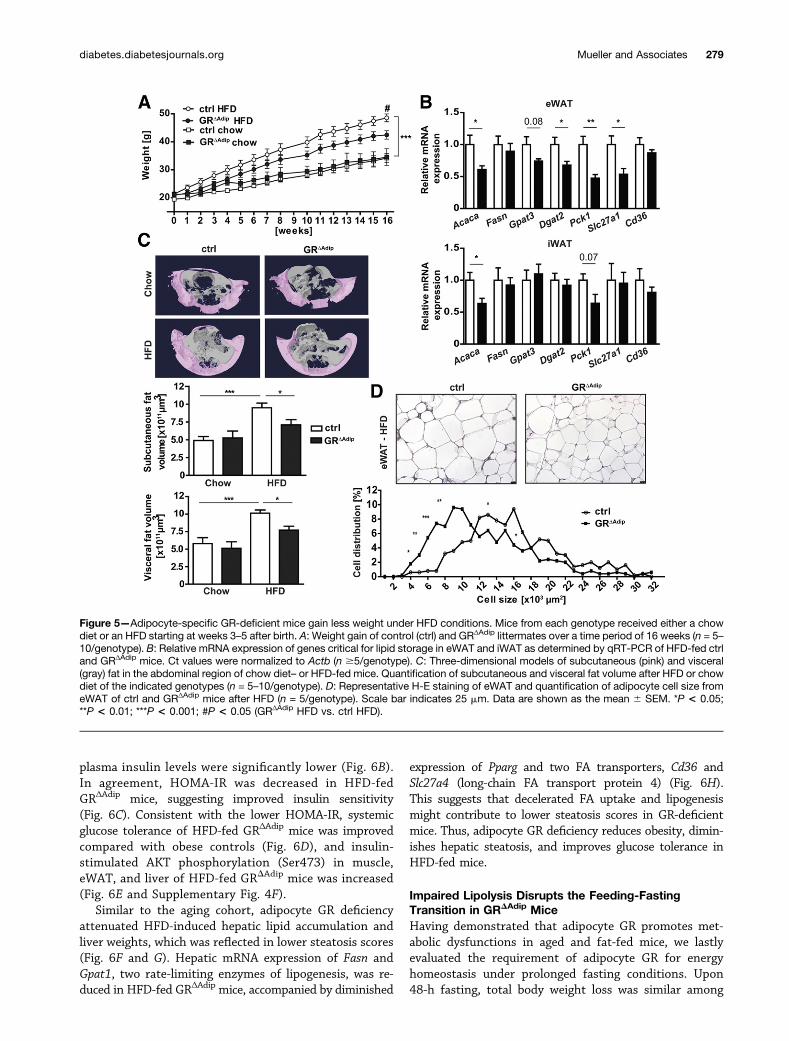
Reduced HFD-Induced Obesity, Improved GlucoseTolerance, and Hepatic Steatosis in GRDAdip MiceTo investigate whether reduced susceptibility to metabolicdysfunctions also occurs upon diet-induced obesity, micewere subjected to HFD feeding for 20 weeks. HFD-fedGRΔAdip mice gained significantly less weight than HFD-fedcontrols, despite similar cumulative food intake (Fig. 5Aand Supplementary Fig. 4A). Reduced weight gain mani-fested early in HFD-fed GRΔAdip mice (Fig. 5A), accompa-nied by lower levels of several circulating FA species and atrend toward reduced plasma NEFA (Supplementary Table3 and Supplementary Fig. 4B). After 2 weeks of HFD feed-ing, mRNA expression of several genes critical for FA stor-age were either significantly reduced or reduced by trend inGRΔAdip eWAT compared with controls (acyl-CoA carboxyl-ase [Acaca], glycerol-3-phosphate acyltransferase 3 [Gpat3],diacylglycerol-acyltransferase-2 [Dgat2], phosphoenol-pyruvate carboxykinase [Pck1], and FA transport protein1 [Slc27a1]) (Fig. 5B). Acaca and Pck1 mRNA levels showeda similar trend in GR-deficient iWAT, whereas there was no
Figure 3—Reduced thermogenesis in GRΔAdip mice. A: Body temperatures of GRΔAdip and control (ctrl) mice upon acute exposure to 4°Cfor the indicated time (n $6/genotype). B: Western blot analysis and quantification of UCP1 and PPARa protein levels in BAT of 4-h cold-exposed mice. HSC70 was used as a loading control. Protein bands were quantified by densitometry, and total protein expression wascorrected for the respective loading control (n = 4/genotype). C: Representative H-E staining of BAT sections from GRΔAdip and ctrl miceafter 4 h of cold exposure. Scale bar indicates 200 mm. D: Plasma NEFA, corticosterone, and blood b-ketone level of 4-h cold-exposedmice. NEFA was determined by colorimetric assays and corticosterone was measured by ELISA (n $6/genotype). Data are shown as themean 6 SEM. *P < 0.05; **P < 0.01.
diabetes.diabetesjournals.org Mueller and Associates 277
change in expression of FA synthase (Fasn) and the FAtransporter Cd36 (platelet glycoprotein 4) in both WATcompartments. At termination, HFD-fed GRΔAdip micedisplayed lower WAT weights than HFD-fed controls(Supplementary Fig. 4C), and m-CT analysis confirmedsignificantly decreased subcutaneous and visceral fatvolume of GRΔAdip mice (Fig. 5C). Accordingly, adipocytehypertrophy in GRΔAdip eWAT and iWAT was reduced
(Fig. 5D and Supplementary Fig. 4D). Consistent withthe aging cohort, plasma corticosterone levels were notsignificantly different between HFD-fed control andGR-deficient mice (Supplementary Fig. 4E).
Next, we asked whether GR deficiency improves de-teriorated glucose metabolism associated with HFD.Blood glucose levels trended lower in HFD-fed GRΔAdip
mice compared with controls (Fig. 6A), and their fasting
Figure 4—Attenuated aging-associated obesity and hepatic steatosis in adipocyte GR-deficient mice. A: Postnatal body weight gain ofGRDAdip mice and control (ctrl) littermates (n = 12/genotype; four independent litters). B: Noninvasive monitoring of body compositions of52-week-old GRDAdip and ctrl mice using EchoMRI. Total body fat and lean mass are depicted in relation to body weight (n = 10). C:Wet weight of eWAT, iWAT, and liver in relation to body weight of 52-week-old mice (n $7/genotype). D: Representative H-E stainingsof livers and quantification of steatosis scores at 52 weeks of age (n $7/genotype). Score 1, <5%; score 2, 5–20%; score 3, >20%;score 4, >50%. Scale bar indicates 200 mm. E: Cumulative food intake, daily locomotor activity, EE, and RERs of aged mice(n $6/genotype). For all analyses, mice were fed a standard diet ad libitum; data are shown as the mean 6 SEM. *P < 0.05;**P < 0.01; ***P < 0.001.
278 Adipocyte GR and Systemic Energy Metabolism Diabetes Volume 66, February 2017
plasma insulin levels were significantly lower (Fig. 6B).In agreement, HOMA-IR was decreased in HFD-fedGRΔAdip mice, suggesting improved insulin sensitivity(Fig. 6C). Consistent with the lower HOMA-IR, systemicglucose tolerance of HFD-fed GRΔAdip mice was improvedcompared with obese controls (Fig. 6D), and insulin-stimulated AKT phosphorylation (Ser473) in muscle,eWAT, and liver of HFD-fed GRDAdip mice was increased(Fig. 6E and Supplementary Fig. 4F).
Similar to the aging cohort, adipocyte GR deficiencyattenuated HFD-induced hepatic lipid accumulation andliver weights, which was reflected in lower steatosis scores(Fig. 6F and G). Hepatic mRNA expression of Fasn andGpat1, two rate-limiting enzymes of lipogenesis, was re-duced in HFD-fed GRΔAdip mice, accompanied by diminished
expression of Pparg and two FA transporters, Cd36 andSlc27a4 (long-chain FA transport protein 4) (Fig. 6H).This suggests that decelerated FA uptake and lipogenesismight contribute to lower steatosis scores in GR-deficientmice. Thus, adipocyte GR deficiency reduces obesity, dimin-ishes hepatic steatosis, and improves glucose tolerance inHFD-fed mice.
Impaired Lipolysis Disrupts the Feeding-FastingTransition in GRDAdip MiceHaving demonstrated that adipocyte GR promotes met-abolic dysfunctions in aged and fat-fed mice, we lastlyevaluated the requirement of adipocyte GR for energyhomeostasis under prolonged fasting conditions. Upon48-h fasting, total body weight loss was similar among
Figure 5—Adipocyte-specific GR-deficient mice gain less weight under HFD conditions. Mice from each genotype received either a chowdiet or an HFD starting at weeks 3–5 after birth. A: Weight gain of control (ctrl) and GRΔAdip littermates over a time period of 16 weeks (n = 5–10/genotype). B: Relative mRNA expression of genes critical for lipid storage in eWAT and iWAT as determined by qRT-PCR of HFD-fed ctrland GRΔAdip mice. Ct values were normalized to Actb (n $5/genotype). C: Three-dimensional models of subcutaneous (pink) and visceral(gray) fat in the abdominal region of chow diet– or HFD-fed mice. Quantification of subcutaneous and visceral fat volume after HFD or chowdiet of the indicated genotypes (n = 5–10/genotype). D: Representative H-E staining of eWAT and quantification of adipocyte cell size fromeWAT of ctrl and GRΔAdip mice after HFD (n = 5/genotype). Scale bar indicates 25 mm. Data are shown as the mean 6 SEM. *P < 0.05;**P < 0.01; ***P < 0.001; #P < 0.05 (GRΔAdip HFD vs. ctrl HFD).
diabetes.diabetesjournals.org Mueller and Associates 279
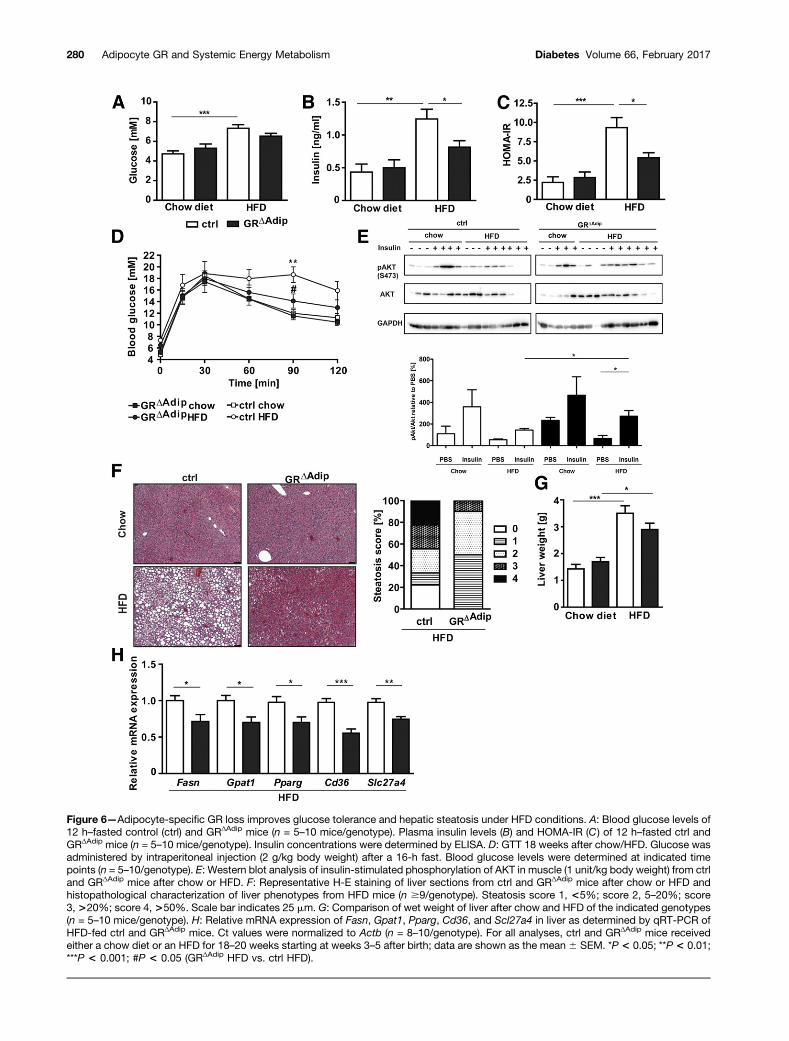
Figure 6—Adipocyte-specific GR loss improves glucose tolerance and hepatic steatosis under HFD conditions. A: Blood glucose levels of12 h–fasted control (ctrl) and GRΔAdip mice (n = 5–10 mice/genotype). Plasma insulin levels (B) and HOMA-IR (C) of 12 h–fasted ctrl andGRΔAdip mice (n = 5–10 mice/genotype). Insulin concentrations were determined by ELISA. D: GTT 18 weeks after chow/HFD. Glucose wasadministered by intraperitoneal injection (2 g/kg body weight) after a 16-h fast. Blood glucose levels were determined at indicated timepoints (n = 5–10/genotype). E: Western blot analysis of insulin-stimulated phosphorylation of AKT in muscle (1 unit/kg body weight) from ctrland GRΔAdip mice after chow or HFD. F: Representative H-E staining of liver sections from ctrl and GRΔAdip mice after chow or HFD andhistopathological characterization of liver phenotypes from HFD mice (n $9/genotype). Steatosis score 1, <5%; score 2, 5–20%; score3, >20%; score 4, >50%. Scale bar indicates 25 mm. G: Comparison of wet weight of liver after chow and HFD of the indicated genotypes(n = 5–10 mice/genotype). H: Relative mRNA expression of Fasn, Gpat1, Pparg, Cd36, and Scl27a4 in liver as determined by qRT-PCR ofHFD-fed ctrl and GRΔAdip mice. Ct values were normalized to Actb (n = 8–10/genotype). For all analyses, ctrl and GRΔAdip mice receivedeither a chow diet or an HFD for 18–20 weeks starting at weeks 3–5 after birth; data are shown as the mean 6 SEM. *P < 0.05; **P < 0.01;***P < 0.001; #P < 0.05 (GRΔAdip HFD vs. ctrl HFD).
280 Adipocyte GR and Systemic Energy Metabolism Diabetes Volume 66, February 2017
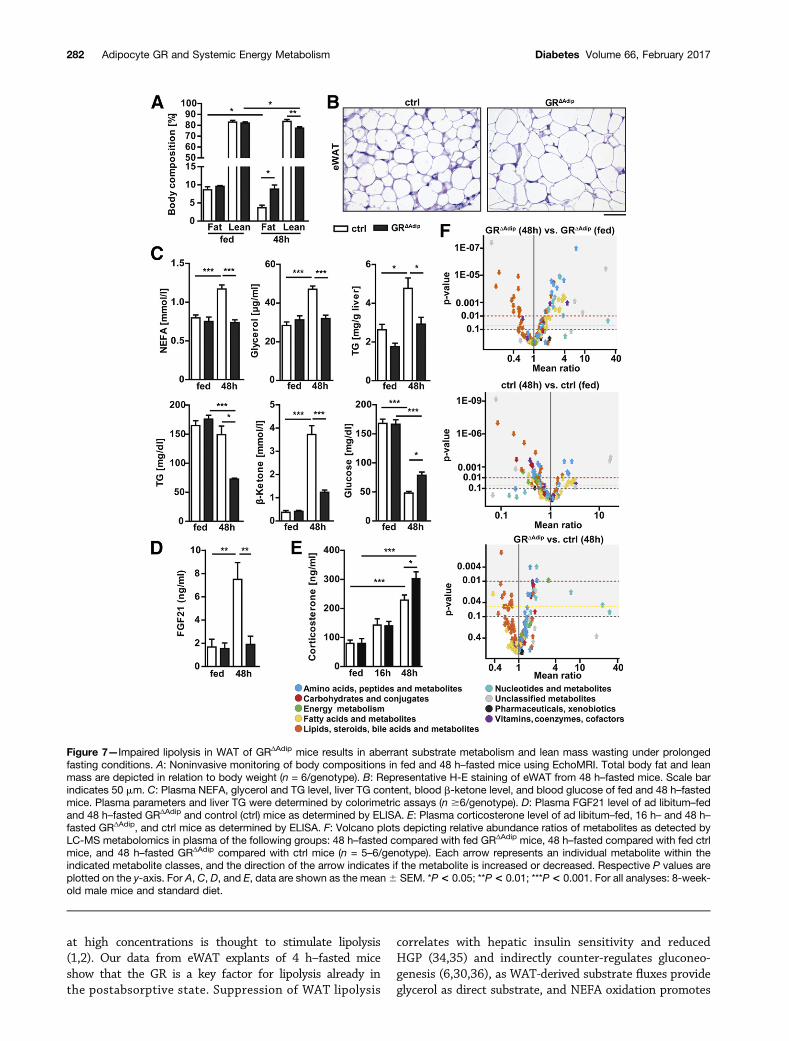
genotypes (Supplementary Fig. 5A). Notably, all mice sur-vived 48-h fasting and did not present symptoms ofa hypoglycemic shock (i.e., trembling, seizures, or un-consciousness). Body fat mass was approximatelytwofold higher in fasted GRDAdip mice compared withcontrols, whereas their lean mass was decreased (Fig. 7A).Accordingly, GRDAdip WAT compartments were enlarged,whereas their gastrocnemius, heart, and liver weightswere reduced (Supplementary Fig. 5B). Consistent withtheir preserved fat mass, GRDAdip mice presented in-creased adipocyte sizes, lower plasma NEFA and glycerolconcentrations, decreased hepatic TG accumulation, andreduced circulating TG levels (Fig. 7B and C, Supplemen-tary Fig. 1B, and Supplementary Fig. 5C and D). Bloodb-ketones were substantially lower (Fig. 7C), indicat-ing reduced FAO and ketogenesis. Hepatic PPARa andFGF21 are key mediators of fasted states and contributeto lipid utilization by increasing FAO in liver (32). Fasting-induced upregulation of Ppara and Fgf21 mRNA expres-sion was impaired in GRDAdip livers, accompanied bydecreased plasma FGF21 levels (Fig. 7D and Supplemen-tary Fig. 5E). In contrast to shorter fasting periods, 48-hfasting blood glucose was unexpectedly increased inGRDAdip mice compared with controls (Fig. 7C), suggestingthat the observed breakdown of lean mass might providesubstrates for glucose production. In support of this as-sumption, circulating corticosterone, which potently in-duces protein catabolism and HGP (1), increased to ahigher extent in 48 h– but not in 16 h–fasted GRDAdip
mice (Fig. 7E). Additionally, fasting-induced upregulationof gluconeogenic genes Pgc1a and Pck1 was similar inlivers of both genotypes (Supplementary Fig. 5F). To char-acterize the fasting metabolome of GRDAdip mice in moredetail, plasma samples were analyzed by targeted LC-MS.From 177 metabolites, 42% were significantly different in48 h–fasted compared with fed GRΔAdip mice (Fig. 7F andSupplementary Table 3). Strong increases in AAs and re-lated metabolites, several FA species, and nucleotideswere observed. Conversely, in fasted controls, abundanceof most AAs and nucleotides was either unchanged orlower than in fed controls. Eighteen percent of metabo-lites were significantly different between 48 h–fastedGRΔAdip mice and controls. These included hexose, pen-tose, nucleotides, and AAs, all of which, in contrast to thefed state, displayed a greater quantity in GRDAdip mice(Fig. 1C, Fig. 7F, and Supplementary Table 3). This revealsthat the GR in adipocytes is indispensable for normalsubstrate mobilization and energy metabolism under pro-longed fasting conditions.
Dysregulation of Lipolytic Signaling in GRDAdip MiceTo determine the molecular underpinning of impairedlipolysis, we compared mRNA and protein expression oflipolytic key factors in eWAT of fed and 48 h–fasted mice.HSL (Lipe) mRNA levels were similar among genotypes,whereas upregulation of ATGL (Pnpla2) and CGI58(comparative gene identification 58; Abhd5) mRNA
expression was significantly reduced in fasted GRΔAdip
eWAT (Fig. 8A). The protein level of ATGL and its coac-tivator CGI58 displayed a similar expression patternin eWAT of fasted mice (Fig. 8B). Fasting-induced lipol-ysis requires cAMP-mediated activation of protein kinaseA (PKA) with subsequent phosphorylation of HSL andperilipin, thereby indirectly activating ATGL via releaseof CGI58 (33). Upon fasting, total PKA substrate phosphor-ylation including HSL (Ser563/660) and perilipin was sub-stantially decreased in GRDAdip eWAT (Fig. 8B and C). Thus,we analyzed mRNA expression of genes critical forb-adrenergic activation of PKA. Expression of the in-hibitory a2-adrenergic receptor (a2-AR) and inhibitoryG-protein a-subunit isoforms was similar between geno-types (Supplementary Fig. 6A), whereas upregulation ofb2-AR (Adrb2) was reduced in GRDAdip eWAT under fast-ing conditions. Conversely, b3-AR (Adrb3) mRNA levelswere increased (Fig. 8D). Notably, fasting-induced upre-gulation of the stimulatory G-protein a-subunit (GSa;Gnas), which couples b-ARs to adenylate cyclase–mediatedproduction of intracellular cAMP (34), was signifi-cantly diminished in GR-deficient eWAT (Fig. 8Dand E). To functionally identify the GR-dependent sig-naling step in b-adrenergic signal transduction, weapplied pharmacological agonists on eWAT explantsfrom 16 h–fasted mice. GR deficiency reduced cAMPgeneration upon treatment with isoproterenol (nonse-lective b-adrenergic agonist) but not in response to for-skolin (direct adenylate cyclase agonist) (Fig. 8F). NEFArelease from GRΔAdip explants was decreased in responseto isoproterenol, CL-316,243 (b3-AR agonist), and for-moterol (b2-AR agonist), whereas forskolin-stimulatedlipolysis was similar between both genotypes (Fig. 8G).Similar results were obtained from isoproterenol- or for-skolin-treated eWAT explants of fed GRΔAdip mice (Sup-plementary Fig. 6B), albeit the defect in lipolysis was lesspronounced than in 16 h–fasted mice. These data demon-strate that the GR is a pivotal permissive factor forb-adrenergic signal transduction to adenylate cyclase andconcomitant activation of the lipolytic cascade in WAT.
DISCUSSION
Our study provides the first genetic evidence for the GRin adipocytes as a critical component in normal andpathophysiological energy metabolism. Initial plasmametabolomics revealed a marked global effect of GRdeficiency on systemic metabolite abundance, includ-ing a reduction in various FA species and proteogenic/branched-chain AAs (valine, leucine, and isoleucine).Albeit steady-state analysis of plasma represents a staticnet-balance between metabolite production and con-sumption, the broad changes indicate that systemicfuel partitioning is partly controlled by GR in adipocytes.Along this line, the diminished gluconeogenic capacity ofGRΔAdip mice during ITT/PTT may be due to increasedhepatic responsiveness to insulin but could also resultfrom a decrease in substrate availability (6). GC exposure
diabetes.diabetesjournals.org Mueller and Associates 281
at high concentrations is thought to stimulate lipolysis(1,2). Our data from eWAT explants of 4 h–fasted miceshow that the GR is a key factor for lipolysis already inthe postabsorptive state. Suppression of WAT lipolysis
correlates with hepatic insulin sensitivity and reducedHGP (34,35) and indirectly counter-regulates gluconeo-genesis (6,30,36), as WAT-derived substrate fluxes provideglycerol as direct substrate, and NEFA oxidation promotes
Figure 7—Impaired lipolysis in WAT of GRΔAdip mice results in aberrant substrate metabolism and lean mass wasting under prolongedfasting conditions. A: Noninvasive monitoring of body compositions in fed and 48 h–fasted mice using EchoMRI. Total body fat and leanmass are depicted in relation to body weight (n = 6/genotype). B: Representative H-E staining of eWAT from 48 h–fasted mice. Scale barindicates 50 mm. C: Plasma NEFA, glycerol and TG level, liver TG content, blood b-ketone level, and blood glucose of fed and 48 h–fastedmice. Plasma parameters and liver TG were determined by colorimetric assays (n $6/genotype). D: Plasma FGF21 level of ad libitum–fedand 48 h–fasted GRΔAdip and control (ctrl) mice as determined by ELISA. E: Plasma corticosterone level of ad libitum–fed, 16 h– and 48 h–fasted GRΔAdip, and ctrl mice as determined by ELISA. F: Volcano plots depicting relative abundance ratios of metabolites as detected byLC-MS metabolomics in plasma of the following groups: 48 h–fasted compared with fed GRΔAdip mice, 48 h–fasted compared with fed ctrlmice, and 48 h–fasted GRΔAdip compared with ctrl mice (n = 5–6/genotype). Each arrow represents an individual metabolite within theindicated metabolite classes, and the direction of the arrow indicates if the metabolite is increased or decreased. Respective P values areplotted on the y-axis. For A, C, D, and E, data are shown as the mean6 SEM. *P< 0.05; **P< 0.01; ***P< 0.001. For all analyses: 8-week-old male mice and standard diet.
282 Adipocyte GR and Systemic Energy Metabolism Diabetes Volume 66, February 2017
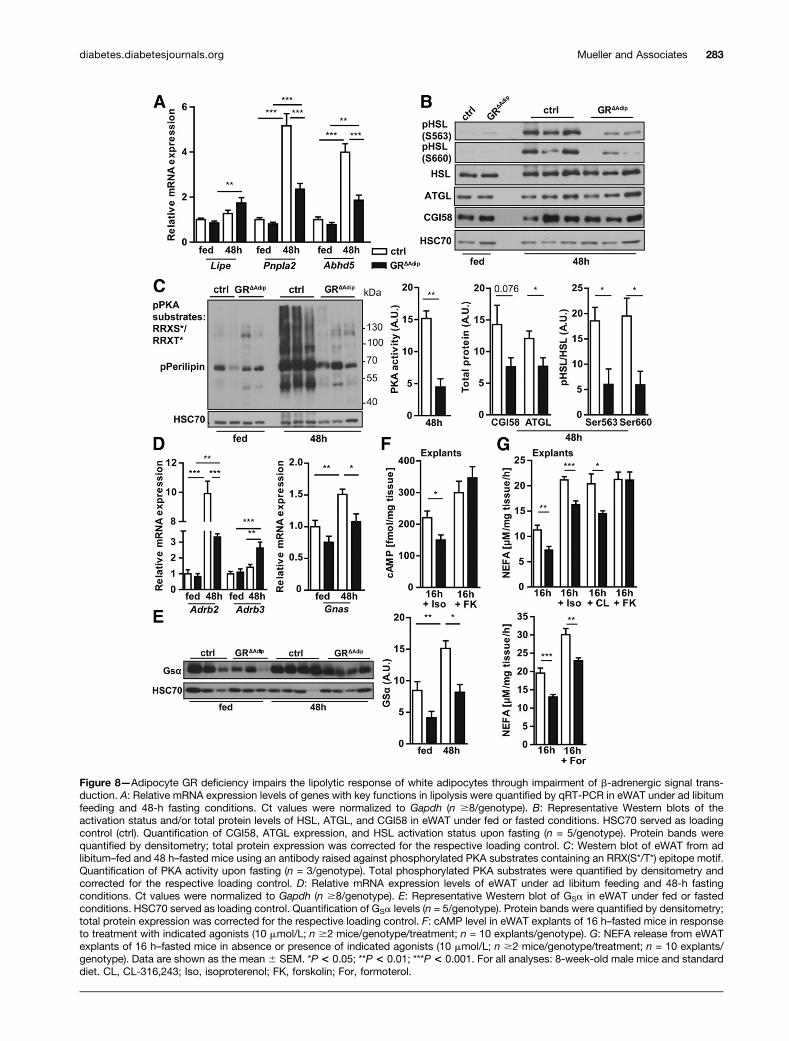
Figure 8—Adipocyte GR deficiency impairs the lipolytic response of white adipocytes through impairment of b-adrenergic signal trans-duction. A: Relative mRNA expression levels of genes with key functions in lipolysis were quantified by qRT-PCR in eWAT under ad libitumfeeding and 48-h fasting conditions. Ct values were normalized to Gapdh (n $8/genotype). B: Representative Western blots of theactivation status and/or total protein levels of HSL, ATGL, and CGI58 in eWAT under fed or fasted conditions. HSC70 served as loadingcontrol (ctrl). Quantification of CGI58, ATGL expression, and HSL activation status upon fasting (n = 5/genotype). Protein bands werequantified by densitometry; total protein expression was corrected for the respective loading control. C: Western blot of eWAT from adlibitum–fed and 48 h–fasted mice using an antibody raised against phosphorylated PKA substrates containing an RRX(S*/T*) epitope motif.Quantification of PKA activity upon fasting (n = 3/genotype). Total phosphorylated PKA substrates were quantified by densitometry andcorrected for the respective loading control. D: Relative mRNA expression levels of eWAT under ad libitum feeding and 48-h fastingconditions. Ct values were normalized to Gapdh (n $8/genotype). E: Representative Western blot of GSa in eWAT under fed or fastedconditions. HSC70 served as loading control. Quantification of GSa levels (n = 5/genotype). Protein bands were quantified by densitometry;total protein expression was corrected for the respective loading control. F: cAMP level in eWAT explants of 16 h–fasted mice in responseto treatment with indicated agonists (10 mmol/L; n $2 mice/genotype/treatment; n = 10 explants/genotype). G: NEFA release from eWATexplants of 16 h–fasted mice in absence or presence of indicated agonists (10 mmol/L; n $2 mice/genotype/treatment; n = 10 explants/genotype). Data are shown as the mean 6 SEM. *P < 0.05; **P < 0.01; ***P < 0.001. For all analyses: 8-week-old male mice and standarddiet. CL, CL-316,243; Iso, isoproterenol; FK, forskolin; For, formoterol.
diabetes.diabetesjournals.org Mueller and Associates 283
acetyl-CoA–mediated activation of pyruvate carboxylase(37). Therefore, it is conceivable that reduced lipolysis inGRΔAdip mice contributes in a similar manner to the observedreduction in gluconeogenic capacity.
GC-stimulated lipolysis has been linked to transcrip-tional upregulation of ATGL and HSL (7,9,38), elevatedadenylate cyclase activity (39), intracellular cAMP produc-tion, and HSL activation (7,8). Reduced lipolysis in GRΔAdip
mice largely resulted from a block in b-adrenergic activa-tion of PKA and lipolytic downstream signaling (33). Thesympathetic nervous system (SNS) regulates induction ofWAT lipolysis, and PKA-mediated phosphorylation ofHSL serves as surrogate marker for SNS outflow to WAT(40,41). In fasting states, systemic GR antagonism withRU486 decreased b-adrenergic signaling in WAT throughsuppression of angiopoietin-like 4 (Angptl4) (8). However,Angptl4 expression was not affected in GRΔAdip eWAT (Sup-plementary Fig. 6C). GR deficiency decreased the expres-sion of GSa, which mediates SNS-stimulated lipolysis bytransducing signals from b-ARs to adenylate cyclase. No-tably, adipocyte-specific deficiency in GSa blocks WAT li-polysis, mimicking the phenotype of the GRΔAdip mice (34).In agreement, cAMP generation and NEFA release fromGRΔAdip eWAT explants was reduced in response to b-ARagonists but could be normalized by direct adenylate cyclaseagonism. GCs were shown to positively regulate GSa expres-sion in rat brain (42), suggesting that a similar regulatorymechanism might exist in adipocytes to trigger b-adrenergiclipolytic responses. Accordingly, dexamethasone treatmentincreased GSa levels in eWAT of control mice but not inliver or GN muscle, suggesting that the GC-mediated induc-tion of GSa occurs in a tissue-selective manner (Supple-mentary Fig. 6D). However, sequence analysis of thecorresponding Gnas promoter region (NM_201616.2,NM_001077510.4, NM_001310083.1; 23,000 bp of TSS)did not reveal the presence of any sequences likely toact as GC response element. Notably, the GR positivelyregulates transcription through several mechanisms, in-cluding DNA-independent means, by acting as cofactorfor lineage-specific transcription factors (43). At this point,however, we cannot predict which molecular mechanismmight account for the reduction in Gnas expression inGR-deficient WAT, and further molecular studies will benecessary to decipher the underlying causes. Nevertheless,our current data support a model where the GR is requiredfor signal transduction from b2/3-AR to adenylate cyclaseand concomitant induction of lipolysis.
In mice and humans, an increase in GC regeneration bythe enzyme 11b-HSD1 within WAT compartments sug-gests a role of the GC-GR axis in common obesity(2,12–16). Our findings from aged and HFD-fed GRΔAdip
mice support that suppressing the adipocyte GC-GR axisrestricts obesity and its underlying disease state. We ob-served no differences in EE and/or food consumption thatwould explain the attenuated obesity of GRΔAdip mice.Recent studies established an interdependence of lipidmobilization and storage in WAT. Chronic stimulation
of lipolysis was shown to coincide with an upregulationof genes critical for FA storage and induction of de novolipogenesis in WAT (44). Conversely, blocking lipolysis inchow- and/or HFD-fed mice resulted in downregulation ofgenes critical for FA storage and in decreased lipogenesis/lipid synthesis in WAT (34,35). Although not function-ally proven by our data, the mild, yet collective reductionin several genes related to FA storage in HFD GRΔAdip
WAT suggests that a decrease in lipid synthesis mightcontribute to the attenuated obesity phenotype. How-ever, further studies are required to determine the exactmechanism(s) underlying the antiobesity effects of adi-pocyte GR deficiency.
Dysfunctional hypertrophic adipocytes are thought tobe in part causative for metabolic dysfunctions uponprogressive adiposity (5,45). Improved glucose toleranceand reduced hyperinsulinemia indicate enhanced periph-eral responsiveness to insulin in HFD-fed GRΔAdip mice.Indeed, increased insulin-stimulated AKT phosphoryla-tion was not confined to WAT but also present in muscleand liver of HFD-fed GRΔAdip mice. As NEFA/lipid accu-mulation can cause deleterious effects on insulin-sensitiveorgans (6), and inhibition of lipolysis improves systemicglucose metabolism (34,35), the attenuated adiposity andreduced lipolytic capacity are conceivable possibilities forthe ameliorated glucose tolerance in GRΔAdip mice. Alongthis line, adipocyte GR deficiency attenuated HFD-induced steatosis. HFD feeding promotes hepatic lipid ac-cumulation partly through upregulation of genes involvedin FA uptake and lipid synthesis (46–48), several of whichwere downregulated in the livers of HFD-fed GRΔAdip mice.Accordingly, reduced FA influx and endogenous lipid pro-duction likely contribute to the attenuation of steatosis inHFD-fed GRΔAdip mice. Similar to our observations, adipo-cyte-specific 11b-HSD1 deletion was shown to amelioratehypercortisolism-induced glucose intolerance and hepaticsteatosis (38). Along with the beneficial metabolic stateof the aged GR-deficient cohort, these findings indicatethat adipocyte GC-GR activity is involved in the develop-ment of systemic metabolic dysfunctions.
In contrast to HFD feeding, adipocyte GR deficiencyhad adverse consequences when FA became the majorenergy substrate during prolonged fasting. Fasting in-duces robust shifts in fuel selection, during which co-ordinated increases in lipolysis, FAO, and ketogenesisspare glucose and preserve lean mass. Similar to modelswith impairments in lipolytic enzymes (33,49–51), GRdeficiency disrupted the transition to lipid-based energyproduction (i.e., preserved fat, inefficient FA utilization,and ketogenesis). The simultaneous impaired upregula-tion of Ppara and Fgf21 in 48 h–fasted GRΔAdip livers isconsistent with a proposed necessity of lipolysis for theexpression of both genes (51). FGF21 was shown to berequired to sustain fasting hypoglycemia by stimulatingcorticotropin-releasing hormone in hypothalamic neuronsand concomitant release of adrenal corticosterone (52).The increased blood glucose levels in 48 h–fasted GRΔAdip
284 Adipocyte GR and Systemic Energy Metabolism Diabetes Volume 66, February 2017
mice combined with elevated corticosterone indicate auniquely different fasting response upon complete FGF21deficiency versus its scarcity due to defective lipolysis. GCsstimulate lipolysis, lean mass catabolism, AA utilization,and gluconeogenesis (1,4,53). Accordingly, fasting metabo-lism upon muscle-specific GR deficiency is opposite GRΔAdip
mice in that muscle mass is preserved and WAT depleted(3). Conversely, in fasted GRΔAdip mice, all tissues exceptWAT respond to GC, visible as increased circulating AAs(proteogenic and urea cycle related), their metabolites (i.e.,2-ketobutyrate, creatine, creatinine, and carnitine), and glu-cose (4,53). As gluconeogenesis is intimately connected to thetricarboxylic acid cycle by both substrate supply and energydemand (6,29), lean mass–derived AAs conceivably providedboth sources in 48 h–fasted GRΔAdip mice. The elevation ofpurine nucleotide precursor and degradation products (i.e.,xanthosine, hypoxanthine, xanthine, and urate) additionallysuggest that the energetic requirements of the disturbedfasting metabolism in GRΔAdip mice result in imbalancedATP synthesis/degradation rates and, thus, a reduction inenergy state. Thereby, our results show adipocyte GR as acritical regulator of energy homeostasis during prolongedfasting.
In conclusion, our results demonstrate that theadipocyte GR controls systemic fuel partitioning andenergy metabolism. In prolonged fasting states, GRactivity is vital to prevent aberrant fuel selection andlean mass wasting by permitting b-adrenergic stimula-tion of lipolysis and the switch to lipid-based energyproduction. Conversely, in models of diet- and aging-induced obesity, GR activity is a determinant of sys-temic metabolic dysfunctions.
Acknowledgments. The authors thank Ute Burret (Institute for Compar-ative Molecular Endocrinology, University of Ulm) and Safia Zahma (Institute ofAnimal Breeding and Genetics, University of Veterinary Medicine Vienna) forexcellent technical assistance, and the animal facility staff at the University ofUlm, Medical University of Vienna, and the University of Veterinary MedicineVienna for their support.Funding. This work was supported by the Austrian Science Fund (FWFP26766 to T.S. and SFB F2807-B20 and SFB F4707-B20 to R.M.), the DeutscheForschungsgemeinschaft (grants Priority Program Immunobone 1468/Tu 220/6-1, 6-2, Collaborative Research Centre 1149/C02/INST 40/492-1, and DFG-ANR/TU 220/13-1), and the European Union Research and Innovation fundingprogram (FP7 BRAINAGE) to J.P.T. Part of this work was funded by theÖsterreichische Forschungsförderungsgesellschaft (COMET Program/K1 COMETCompetence Center CBmed, Land Steiermark and Land Wien).
The funders had no role in study design, data collection and analysis, decisionto publish, or preparation of the manuscript.Duality of Interest. No potential conflicts of interest relevant to this articlewere reported.Author Contributions. K.M.M. and K.H. designed and coordinated thestudy, performed most experiments, supervised experiments, analyzed andinterpreted data, and wrote the manuscript. D.K., S.V., M.B., L.M., and S.A.provided major technical support. S.J., K.F., T.D.M., and M.H.T. performedmetabolic cage experiments and data analyses and interpretation. H.E. assistedin data interpretation and contributed to discussion and experimental design.C.M. performed LC-MS metabolomics and data analyses. J.H. conducted
histopathological liver analyses, assisted in data interpretation, and contributedto discussion and experimental design. T.S. assisted in data interpretation,contributed to discussion and experimental design, and contributed to thewriting of the manuscript. N.B. performed LC-MS metabolomics and dataanalyses, assisted in data interpretation, contributed to discussion andexperimental design, and contributed to the writing of the manuscript. J.P.T.and R.M. designed and coordinated the study and wrote the manuscript. J.P.T.and R.M. are the guarantors of this work and, as such, had full access to all thedata in the study and take responsibility for the integrity of the data and theaccuracy of the data analysis.
References1. Rose AJ, Herzig S. Metabolic control through glucocorticoid hormones: anupdate. Mol Cell Endocrinol 2013;380:65–782. Geer EB, Islam J, Buettner C. Mechanisms of glucocorticoid-induced insulinresistance: focus on adipose tissue function and lipid metabolism. EndocrinolMetab Clin North Am 2014;43:75–1023. Shimizu N, Maruyama T, Yoshikawa N, et al. A muscle-liver-fat signallingaxis is essential for central control of adaptive adipose remodelling. Nat Commun2015;6:66934. Okun JG, Conway S, Schmidt KV, et al. Molecular regulation of urea cyclefunction by the liver glucocorticoid receptor. Mol Metab 2015;4:732–7405. Rosen ED, Spiegelman BM. What we talk about when we talk about fat. Cell2014;156:20–446. Samuel VT, Shulman GI. The pathogenesis of insulin resistance: integratingsignaling pathways and substrate flux. J Clin Invest 2016;126:12–227. Xu C, He J, Jiang H, et al. Direct effect of glucocorticoids on lipolysis inadipocytes. Mol Endocrinol 2009;23:1161–11708. Gray NE, Lam LN, Yang K, Zhou AY, Koliwad S, Wang JC. Angiopoietin-like4 (Angptl4) protein is a physiological mediator of intracellular lipolysis in murineadipocytes. J Biol Chem 2012;287:8444–84569. Yu CY, Mayba O, Lee JV, et al. Genome-wide analysis of glucocorticoidreceptor binding regions in adipocytes reveal gene network involved in tri-glyceride homeostasis. PLoS One 2010;5:e1518810. Gathercole LL, Morgan SA, Bujalska IJ, Hauton D, Stewart PM, TomlinsonJW. Regulation of lipogenesis by glucocorticoids and insulin in human adiposetissue. PLoS One 2011;6:e2622311. Chimin P, Farias TdaS, Torres-Leal FL, et al. Chronic glucocorticoid treat-ment enhances lipogenic activity in visceral adipocytes of male Wistar rats. ActaPhysiol (Oxf) 2014;211:409–42012. Lee MJ, Fried SK, Mundt SS, et al. Depot-specific regulation of the con-version of cortisone to cortisol in human adipose tissue. Obesity (Silver Spring)2008;16:1178–118513. Engeli S, Böhnke J, Feldpausch M, et al. Regulation of 11beta-HSD genes inhuman adipose tissue: influence of central obesity and weight loss. Obes Res2004;12:9–1714. Masuzaki H, Paterson J, Shinyama H, et al. A transgenic model of visceralobesity and the metabolic syndrome. Science 2001;294:2166–217015. Morton NM, Paterson JM, Masuzaki H, et al. Novel adipose tissue-mediatedresistance to diet-induced visceral obesity in 11 beta-hydroxysteroid de-hydrogenase type 1-deficient mice. Diabetes 2004;53:931–93816. Kershaw EE, Morton NM, Dhillon H, Ramage L, Seckl JR, Flier JS. Adipo-cyte-specific glucocorticoid inactivation protects against diet-induced obesity.Diabetes 2005;54:1023–103117. Tronche F, Kellendonk C, Kretz O, et al. Disruption of the glucocorticoidreceptor gene in the nervous system results in reduced anxiety. Nat Genet 1999;23:99–10318. Eguchi J, Wang X, Yu S, et al. Transcriptional control of adipose lipidhandling by IRF4. Cell Metab 2011;13:249–25919. Müller TD, Müller A, Yi CX, et al. The orphan receptor Gpr83 regulatessystemic energy metabolism via ghrelin-dependent and ghrelin-independentmechanisms. Nat Commun 2013;4:1968
diabetes.diabetesjournals.org Mueller and Associates 285
20. Schweiger M, Eichmann TO, Taschler U, Zimmermann R, Zechner R, Lass A.
Measurement of lipolysis. Methods Enzymol 2014;538:171–19321. Engblom D, Kornfeld JW, Schwake L, et al. Direct glucocorticoid receptor-
Stat5 interaction in hepatocytes controls body size and maturation-related gene
expression. Genes Dev 2007;21:1157–116222. Bajad SU, Lu W, Kimball EH, Yuan J, Peterson C, Rabinowitz JD. Separation
and quantitation of water soluble cellular metabolites by hydrophilic interaction
chromatography-tandem mass spectrometry. J Chromatogr A 2006;1125:76–8823. Fröhlich EE, Farzi A, Mayerhofer R, et al. Cognitive impairment by antibiotic-
induced gut dysbiosis: analysis of gut microbiota-brain communication. Brain
Behav Immun 2016;56:140–15524. Yuan M, Breitkopf SB, Yang X, Asara JM. A positive/negative ion-switching,
targeted mass spectrometry-based metabolomics platform for bodily fluids, cells,
and fresh and fixed tissue. Nat Protoc 2012;7:872–88125. Sumner LW, Amberg A, Barrett D, et al. Proposed minimum reporting
standards for chemical analysis Chemical Analysis Working Group (CAWG) Me-
tabolomics Standards Initiative (MSI). Metabolomics 2007;3:211–22126. R Core Team. R: A language and environment for statistical computing. R
Foundation for Statistical Computing, Vienna, Austria 2014. Available from http://
www.R-project.org/. Accessed 2 July 201527. Tschöp MH, Speakman JR, Arch JR, et al. A guide to analysis of mouse
energy metabolism. Nat Methods 2011;9:57–6328. Wang TJ, Larson MG, Vasan RS, et al. Metabolite profiles and the risk of
developing diabetes. Nat Med 2011;17:448–45329. Satapati S, Sunny NE, Kucejova B, et al. Elevated TCA cycle function in the
pathology of diet-induced hepatic insulin resistance and fatty liver. J Lipid Res
2012;53:1080–109230. Rebrin K, Steil GM, Getty L, Bergman RN. Free fatty acid as a link in the reg-
ulation of hepatic glucose output by peripheral insulin. Diabetes 1995;44:1038–104531. Wu Q, Kazantzis M, Doege H, et al. Fatty acid transport protein 1 is required for
nonshivering thermogenesis in brown adipose tissue. Diabetes 2006;55:3229–323732. Badman MK, Pissios P, Kennedy AR, Koukos G, Flier JS, Maratos-Flier E.
Hepatic fibroblast growth factor 21 is regulated by PPARalpha and is a key me-
diator of hepatic lipid metabolism in ketotic states. Cell Metab 2007;5:426–43733. Zechner R, Zimmermann R, Eichmann TO, et al. FAT SIGNALS–lipases and
lipolysis in lipid metabolism and signaling. Cell Metab 2012;15:279–29134. Li YQ, Shrestha YB, Chen M, Chanturiya T, Gavrilova O, Weinstein LS. Gsa
deficiency in adipose tissue improves glucose metabolism and insulin sensitivity
without an effect on body weight. Proc Natl Acad Sci USA 2016;113:446–45135. Schreiber R, Hofer P, Taschler U, et al. Hypophagia and metabolic adap-
tations in mice with defective ATGL-mediated lipolysis cause resistance to HFD-
induced obesity. Proc Natl Acad Sci USA 2015;112:13850–1385536. Perry RJ, Zhang XM, Zhang D, et al. Leptin reverses diabetes by sup-
pression of the hypothalamic-pituitary-adrenal axis. Nat Med 2014;20:759–76337. Kumashiro N, Beddow SA, Vatner DF, et al. Targeting pyruvate carboxylase
reduces gluconeogenesis and adiposity and improves insulin resistance. Diabetes
2013;62:2183–2194
38. Morgan SA, McCabe EL, Gathercole LL, et al. 11b-HSD1 is the majorregulator of the tissue-specific effects of circulating glucocorticoid excess. ProcNatl Acad Sci USA 2014;111:E2482–E249139. Lacasa D, Agli B, Giudicelli Y. Permissive action of glucocorticoids oncatecholamine-induced lipolysis: direct “in vitro” effects on the fat cell beta-adrenoreceptor-coupled-adenylate cyclase system. Biochem Biophys Res Com-mun 1988;153:489–49740. Bartness TJ, Shrestha YB, Vaughan CH, Schwartz GJ, Song CK. Sensory andsympathetic nervous system control of white adipose tissue lipolysis. Mol CellEndocrinol 2010;318:34–4341. Scherer T, O’Hare J, Diggs-Andrews K, et al. Brain insulin controls adiposetissue lipolysis and lipogenesis. Cell Metab 2011;13:183–19442. Saito N, Guitart X, Hayward M, Tallman JF, Duman RS, Nestler EJ. Cortico-sterone differentially regulates the expression of Gs alpha and Gi alpha messengerRNA and protein in rat cerebral cortex. Proc Natl Acad Sci USA 1989;86:3906–391043. Lim HW, Uhlenhaut NH, Rauch A, et al. Genomic redistribution of GRmonomers and dimers mediates transcriptional response to exogenous gluco-corticoid in vivo. Genome Res 2015;25:836–84444. Mottillo EP, Balasubramanian P, Lee YH, Weng C, Kershaw EE, GrannemanJG. Coupling of lipolysis and de novo lipogenesis in brown, beige, and whiteadipose tissues during chronic b3-adrenergic receptor activation. J Lipid Res2014;55:2276–228645. Goossens GH. The role of adipose tissue dysfunction in the pathogenesis ofobesity-related insulin resistance. Physiol Behav 2008;94:206–21846. Morán-Salvador E, López-Parra M, García-Alonso V, et al. Role for PPARg inobesity-induced hepatic steatosis as determined by hepatocyte- and macrophage-specific conditional knockouts. FASEB J 2011;25:2538–255047. Koonen DP, Jacobs RL, Febbraio M, et al. Increased hepatic CD36 ex-pression contributes to dyslipidemia associated with diet-induced obesity. Di-abetes 2007;56:2863–287148. Wilson CG, Tran JL, Erion DM, Vera NB, Febbraio M, Weiss EJ. Hepatocyte-specific disruption of CD36 attenuates fatty liver and improves insulin sensitivityin HFD-fed mice. Endocrinology 2016;157:570–58549. Wu JW, Wang SP, Casavant S, Moreau A, Yang GS, Mitchell GA. Fastingenergy homeostasis in mice with adipose deficiency of desnutrin/adipose tri-glyceride lipase. Endocrinology 2012;153:2198–220750. Heckmann BL, Zhang X, Xie X, et al. Defective adipose lipolysis andaltered global energy metabolism in mice with adipose overexpression ofthe lipolytic inhibitor G0/G1 switch gene 2 (G0S2). J Biol Chem 2014;289:1905–191651. Jaeger D, Schoiswohl G, Hofer P, et al. Fasting-induced G0/G1 switch gene2 and FGF21 expression in the liver are under regulation of adipose tissue derivedfatty acids. J Hepatol 2015;63:437–44552. Liang Q, Zhong L, Zhang J, et al. FGF21 maintains glucose homeostasis bymediating the cross talk between liver and brain during prolonged fasting. Di-abetes 2014;63:4064–407553. Bordag N, Klie S, Jürchott K, et al. Glucocorticoid (dexamethasone)-inducedmetabolome changes in healthy males suggest prediction of response and sideeffects. Sci Rep 2015;5:15954
286 Adipocyte GR and Systemic Energy Metabolism Diabetes Volume 66, February 2017