Embed Size (px)
Citation preview
EDITING:
PUBLISCHER:
TYPESETTER:
PRINTER:
ISSN
Grasemann Bernhard, Wagreich Michael
Österreichische Geologische Gesellschaft
Neulinggasse 38, A-1031 Wien
Irnberger Norbert, www.irnberger.net
Copy-Shop Urban, Bahnstraße 26a, 2130 Mistelbach
Holzhausen Druck & Medien GmbH
Holzhausenplatz 1, 1140 Wien
0251-7493
[MITTEILUNGEN der ÖSTERREICHISCHEN GEOLOGISCHEN GESELLSCHAFT]AUSTRIAN JOURNAL of EARTH SCIENCES
an INTERNATIONAL JOURNAL of the AUSTRIAN GEOLOGICAL SOCIETY
volume 97 2004 2005
Marzio GIAMBONI, Andreas WETZEL & Bernhard SCHNEIDER:Geomorphic Response of Alluvial Rivers to Active Tectonics: Example from the Southern Rhinegraben
Austrian Journal of Earth Sciences Volume 97 Vienna 2005
Geomorphic Response of Alluvial Rivers to Active Tectonics: Example from the Southern Rhinegraben
Abstract
The folding of a middle Pliocene marker horizon documents the tectonic deformation of the southern Rhinegraben during the Plio-
Pleistocene. Morphometric analysis of drainage basins implies that tectonic activity is ongoing in the studied area, the Sundgau, where
lithology and climate can be considered as uniform. Two kinds of geomorphic properties were analyzed: properties related to channel
network geometries (stream gradient, drainage density, total stream length), and properties related to basin geometry (area, relief, slope,
hypsometry). Significant correlations are found between tectonic uplift and channel network properties. Drainage basin parameters are
only in part related to tectonic effects and seem to obey laws that are independent of uplift. The topographic record of tectonic activity
strongly depends on the spatial scale of the observed basins: The most significant relationships between uplift and geomorphic variables 2 2have been observed in basins of intermediate size (5-10 km ). Larger basins (>10 km ) lack geomorphic properties of tectonic origin
2suggesting that they are able to quickly adjust to changes in base level. Geomorphic response of small basins (<5 km ) is perturbed by local
aging processes (e.g. microclimate, agriculture, land cover) and noise.
The results demonstrate that the southern Rhinegraben is affected by active tectonism, and that, secondly, the applied methods are
useful tools for detecting ongoing deformation, even in regions of modest uplift rates (<0.1 mm/a).
Die tektonische Aktivität im südlichen Rheingraben während des Plio-Pleistozäns ist durch die Verfaltung eines mittelpliozänen
Referenzhorizontes dokumentiert. Morphometrische Analysen von Einzugsgebieten zeigen, dass die tektonische Aktivität im Sundgau,
dessen Lithologie und klimatische Verhältnisse als einheitlich betrachtet werden können, immer noch ablaufen. Es wurden zwei Gruppen
von geomorphologischen Merkmalen untersucht, solche, die mit der Geometrie des Entwässerungsnetzes zusammenhängen
(Gerinneneigung, Entwässerungsintensität und gesamte Gerinnelänge), und solche, die mit der Geometrie des Einzugsgebietes in
Verbindung stehen (Fläche, Relief, Hangneigung, Hypsometrie). Es zeigt sich eine ausgeprägte Korrelation zwischen tektonischen
Vertikalbewegungen und Merkmalen des Entwässerungsnetzes. Die Merkmale der Einzugsgebiete hingegen korrelieren nur teilweise mit
tektonischen Bewegungen und scheinen anderen, nicht mit der Tektonik in Zusammenhang stehenden Einflüssen unterworfen zu sein.
Die topographische Auswirkung tektonischer Aktivität ist stark von der Grösse der beobachteten Einzugsgebiete abhängig. Die wichtigste 2Korrelation zwischen Vertikalbewegung und geomorphologischen Variablen konnte in Einzugsgebieten mittlerer Grösse (5-10 km )
2beobachtet werden. Die Merkmale von Einzugsgebieten grösser als 10 km zeigen kaum Hinweise auf tektonische Bewegungen. Die 2geomorphologische Reaktion kleiner Einzugsgebiete (<5 km ) auf tektonische Bewegungen wird hingegen stärker durch lokale Faktoren
und Prozesse wie Mikroklima, landwirtschaftliche Nutzung, Variation in der Bodenbedeckung usw. beeinflusst.
Die Resultate zeigen (1) noch heute andauernde tektonische Aktivität im Gebiet des südlichen Rheingrabens und (2) die Eignung der
eingesetzten Methoden, um aktive Tektonik auch in Gebieten mit kleinen Vertikalbewegungen (<0.1 mm/a) nachzuweisen.
*)M. GIAMBONI , A. WETZEL & B. SCHNEIDER
Naturgefahren Bundesamt für Umwelt,Wald und Landschaft CH-3003 Bern
Geologisch-Paläontologisches Institut, Universität Basel, Bernoullistrasse 32, CH-4055 Basel
*) coresponding author (present address): Forstdirektion - Schutzwald und
KEYWORDS
morphometryNeotectonicsalluvial rivers
Upper Rhinegraben
1. Introduction
Relief results from interactions between climate, geologic
parameters such as rock type and structure, and tectonically
induced vertical crustal movements. Tectonism constructs
landscapes through uplift and subsidence; climate affects the
degradation of the landscapes by chemical and physical erosion
(e.g. Ouchi, 1985; Keller, 1986; Keller and Pinter, 2002). Rock
erodibility influences the efficiency of denudation processes
(e.g. McKeown et al., 1988).
The aim of this study is to substantiate in an inductive way that
the interplay between largely known tectonic processes and the
resultant morphological features is ongoing.
The study area is situated at the southern end of the
Rhinegraben and shows homogeneous climatic and geological
settings. Neotectonic activity has been substantiated recently
(Nivière and Winter, 2000; Laubscher, 2001; Meghraoui et al.,
2001; Giamboni et al., 2004a; Giamboni et al., 2004b).
The relation between tectonics and morphologic response has
been previously studied in strongly deforming areas, such as the
Himalayas (e.g. Seeber and Gornitz, 1983; Hurtrez et al., 1999),
California (e.g. Merritts and Vincent, 1989; Lifton and Chase,
1992), and Taiwan (Willemin and Knuepfer, 1994). However,
there have been no attempts to systematically investigate
geomorphic response to tectonism in areas with humid-
temperate climate, smooth relief, and moderate tectonic activity
such as the central European southern Rhinegraben (uplift rates
< 0.1 mm/a: Müller et al., 2001; Giamboni et al., 2004b). The
presented study shows that tectonic activity has a significant
impact on geomorphologic properties, even if the deformation
rates are modest. The selected test area allows investigating this
relationship because climate and lithological properties are
essentially homogeneous throughout the area.
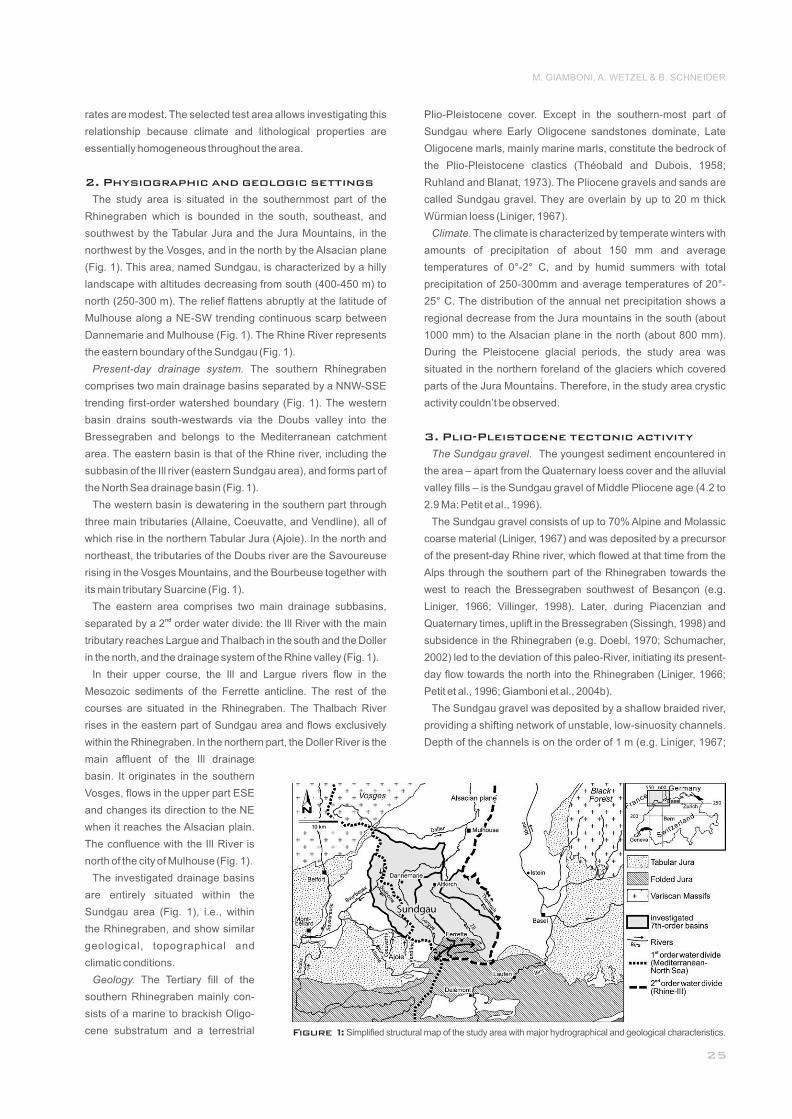
The study area is situated in the southernmost part of the
Rhinegraben which is bounded in the south, southeast, and
southwest by the Tabular Jura and the Jura Mountains, in the
northwest by the Vosges, and in the north by the Alsacian plane
(Fig. 1). This area, named Sundgau, is characterized by a hilly
landscape with altitudes decreasing from south (400-450 m) to
north (250-300 m). The relief flattens abruptly at the latitude of
Mulhouse along a NE-SW trending continuous scarp between
Dannemarie and Mulhouse (Fig. 1). The Rhine River represents
the eastern boundary of the Sundgau (Fig. 1).
Present-day drainage system. The southern Rhinegraben
comprises two main drainage basins separated by a NNW-SSE
trending first-order watershed boundary (Fig. 1). The western
basin drains south-westwards via the Doubs valley into the
Bressegraben and belongs to the Mediterranean catchment
area. The eastern basin is that of the Rhine river, including the
subbasin of the Ill river (eastern Sundgau area), and forms part of
the North Sea drainage basin (Fig. 1).
The western basin is dewatering in the southern part through
three main tributaries (Allaine, Coeuvatte, and Vendline), all of
which rise in the northern Tabular Jura (Ajoie). In the north and
northeast, the tributaries of the Doubs river are the Savoureuse
rising in the Vosges Mountains, and the Bourbeuse together with
its main tributary Suarcine (Fig. 1).
The eastern area comprises two main drainage subbasins, ndseparated by a 2 order water divide: the Ill River with the main
tributary reaches Largue and Thalbach in the south and the Doller
in the north, and the drainage system of the Rhine valley (Fig. 1).
In their upper course, the Ill and Largue rivers flow in the
Mesozoic sediments of the Ferrette anticline. The rest of the
courses are situated in the Rhinegraben. The Thalbach River
rises in the eastern part of Sundgau area and flows exclusively
within the Rhinegraben. In the northern part, the Doller River is the
2. Physiographic and geologic settings
main affluent of the Ill drainage
basin. It originates in the southern
Vosges, flows in the upper part ESE
and changes its direction to the NE
when it reaches the Alsacian plain.
The confluence with the Ill River is
north of the city of Mulhouse (Fig. 1).
The investigated drainage basins
are entirely situated within the
Sundgau area (Fig. 1), i.e., within
the Rhinegraben, and show similar
geological, topographical and
climatic conditions.
Geology. The Tertiary fill of the
southern Rhinegraben mainly con-
sists of a marine to brackish Oligo-
cene substratum and a terrestrial
Plio-Pleistocene cover. Except in the southern-most part of
Sundgau where Early Oligocene sandstones dominate, Late
Oligocene marls, mainly marine marls, constitute the bedrock of
the Plio-Pleistocene clastics (Théobald and Dubois, 1958;
Ruhland and Blanat, 1973). The Pliocene gravels and sands are
called Sundgau gravel. They are overlain by up to 20 m thick
Würmian loess (Liniger, 1967).
Climate. The climate is characterized by temperate winters with
amounts of precipitation of about 150 mm and average
temperatures of 0°-2° C, and by humid summers with total
precipitation of 250-300mm and average temperatures of 20°-
25° C. The distribution of the annual net precipitation shows a
regional decrease from the Jura mountains in the south (about
1000 mm) to the Alsacian plane in the north (about 800 mm).
During the Pleistocene glacial periods, the study area was
situated in the northern foreland of the glaciers which covered
parts of the Jura Mountains. Therefore, in the study area crystic
activity couldn’t be observed.
The Sundgau gravel. The youngest sediment encountered in
the area – apart from the Quaternary loess cover and the alluvial
valley fills – is the Sundgau gravel of Middle Pliocene age (4.2 to
2.9 Ma: Petit et al., 1996).
The Sundgau gravel consists of up to 70% Alpine and Molassic
coarse material (Liniger, 1967) and was deposited by a precursor
of the present-day Rhine river, which flowed at that time from the
Alps through the southern part of the Rhinegraben towards the
west to reach the Bressegraben southwest of Besançon (e.g.
Liniger, 1966; Villinger, 1998). Later, during Piacenzian and
Quaternary times, uplift in the Bressegraben (Sissingh, 1998) and
subsidence in the Rhinegraben (e.g. Doebl, 1970; Schumacher,
2002) led to the deviation of this paleo-River, initiating its present-
day flow towards the north into the Rhinegraben (Liniger, 1966;
Petit et al., 1996; Giamboni et al., 2004b).
The Sundgau gravel was deposited by a shallow braided river,
providing a shifting network of unstable, low-sinuosity channels.
Depth of the channels is on the order of 1 m (e.g. Liniger, 1967;
3. Plio-Pleistocene tectonic activity
M. GIAMBONI, A. WETZEL & B. SCHNEIDER
Figure1: Simplified structural map of the study area with major hydrographical and geological characteristics.
Geomorphic Response of Alluvial Rivers to Active Tectonics: Example from the Southern Rhinegraben
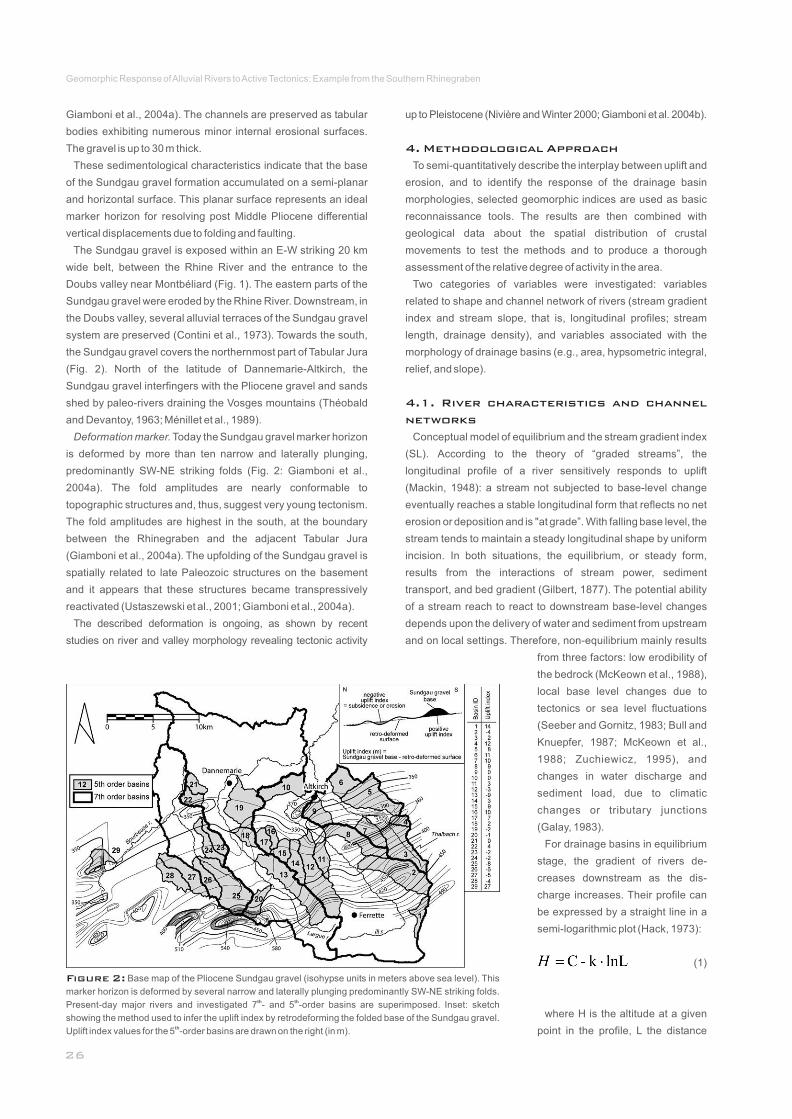
Figure 2: Base map of the Pliocene Sundgau gravel (isohypse units in meters above sea level). This
marker horizon is deformed by several narrow and laterally plunging predominantly SW-NE striking folds. th thPresent-day major rivers and investigated 7 - and 5 -order basins are superimposed. Inset: sketch
showing the method used to infer the uplift index by retrodeforming the folded base of the Sundgau gravel. thUplift index values for the 5 -order basins are drawn on the right (in m).
Giamboni et al., 2004a). The channels are preserved as tabular
bodies exhibiting numerous minor internal erosional surfaces.
The gravel is up to 30 m thick.
These sedimentological characteristics indicate that the base
of the Sundgau gravel formation accumulated on a semi-planar
and horizontal surface. This planar surface represents an ideal
marker horizon for resolving post Middle Pliocene differential
vertical displacements due to folding and faulting.
The Sundgau gravel is exposed within an E-W striking 20 km
wide belt, between the Rhine River and the entrance to the
Doubs valley near Montbéliard (Fig. 1). The eastern parts of the
Sundgau gravel were eroded by the Rhine River. Downstream, in
the Doubs valley, several alluvial terraces of the Sundgau gravel
system are preserved (Contini et al., 1973). Towards the south,
the Sundgau gravel covers the northernmost part of Tabular Jura
(Fig. 2). North of the latitude of Dannemarie-Altkirch, the
Sundgau gravel interfingers with the Pliocene gravel and sands
shed by paleo-rivers draining the Vosges mountains (Théobald
and Devantoy, 1963; Ménillet et al., 1989).
Deformation marker. Today the Sundgau gravel marker horizon
is deformed by more than ten narrow and laterally plunging,
predominantly SW-NE striking folds (Fig. 2: Giamboni et al.,
2004a). The fold amplitudes are nearly conformable to
topographic structures and, thus, suggest very young tectonism.
The fold amplitudes are highest in the south, at the boundary
between the Rhinegraben and the adjacent Tabular Jura
(Giamboni et al., 2004a). The upfolding of the Sundgau gravel is
spatially related to late Paleozoic structures on the basement
and it appears that these structures became transpressively
reactivated (Ustaszewski et al., 2001; Giamboni et al., 2004a).
The described deformation is ongoing, as shown by recent
studies on river and valley morphology revealing tectonic activity
up to Pleistocene (Nivière and Winter 2000; Giamboni et al. 2004b).
To semi-quantitatively describe the interplay between uplift and
erosion, and to identify the response of the drainage basin
morphologies, selected geomorphic indices are used as basic
reconnaissance tools. The results are then combined with
geological data about the spatial distribution of crustal
movements to test the methods and to produce a thorough
assessment of the relative degree of activity in the area.
Two categories of variables were investigated: variables
related to shape and channel network of rivers (stream gradient
index and stream slope, that is, longitudinal profiles; stream
length, drainage density), and variables associated with the
morphology of drainage basins (e.g., area, hypsometric integral,
relief, and slope).
Conceptual model of equilibrium and the stream gradient index
(SL). According to the theory of “graded streams”, the
longitudinal profile of a river sensitively responds to uplift
(Mackin, 1948): a stream not subjected to base-level change
eventually reaches a stable longitudinal form that reflects no net
erosion or deposition and is "at grade”. With falling base level, the
stream tends to maintain a steady longitudinal shape by uniform
incision. In both situations, the equilibrium, or steady form,
results from the interactions of stream power, sediment
transport, and bed gradient (Gilbert, 1877). The potential ability
of a stream reach to react to downstream base-level changes
depends upon the delivery of water and sediment from upstream
and on local settings. Therefore, non-equilibrium mainly results
4. Methodological Approach
4.1. River characteristics and channel
networks
from three factors: low erodibility of
the bedrock (McKeown et al., 1988),
local base level changes due to
tectonics or sea level fluctuations
(Seeber and Gornitz, 1983; Bull and
Knuepfer, 1987; McKeown et al.,
1988; Zuchiewicz, 1995), and
changes in water discharge and
sediment load, due to climatic
changes or tributary junctions
(Galay, 1983).
For drainage basins in equilibrium
stage, the gradient of rivers de-
creases downstream as the dis-
charge increases. Their profile can
be expressed by a straight line in a
semi-logarithmic plot (Hack, 1973):
(1)
where H is the altitude at a given
point in the profile, L the distance
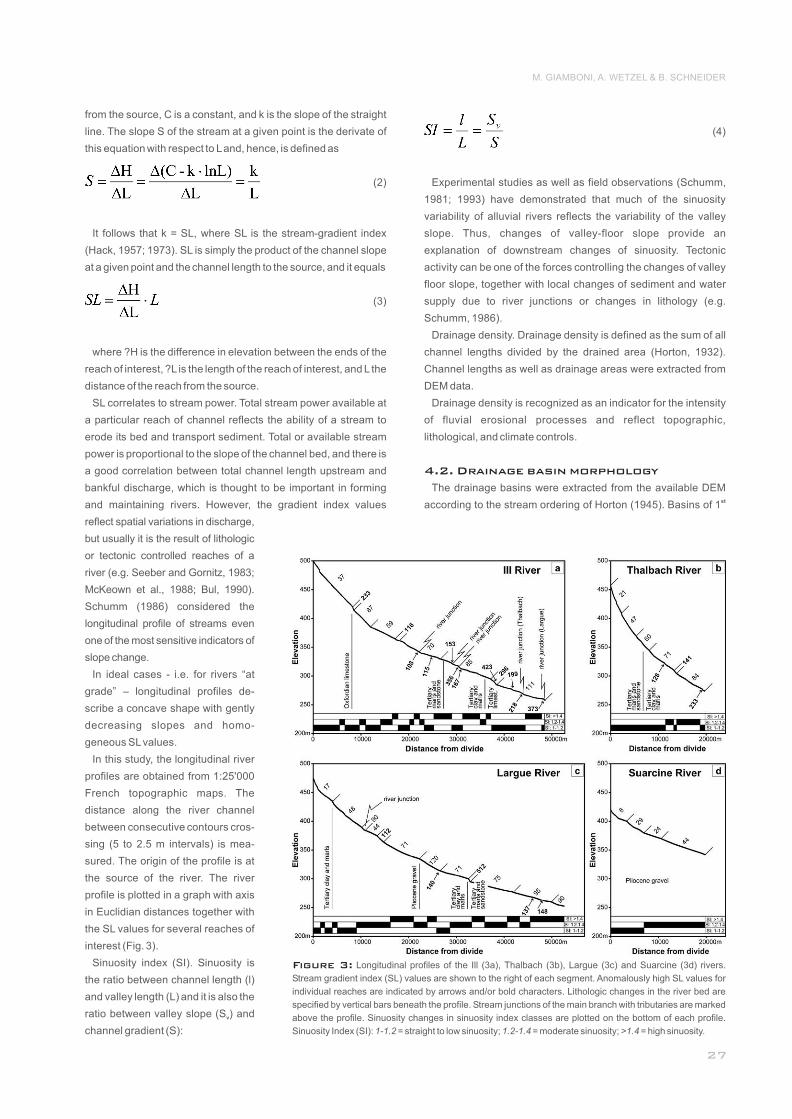
Figure 3: Longitudinal profiles of the Ill (3a), Thalbach (3b), Largue (3c) and Suarcine (3d) rivers.
Stream gradient index (SL) values are shown to the right of each segment. Anomalously high SL values for
individual reaches are indicated by arrows and/or bold characters. Lithologic changes in the river bed are
specified by vertical bars beneath the profile. Stream junctions of the main branch with tributaries are marked
above the profile. Sinuosity changes in sinuosity index classes are plotted on the bottom of each profile.
Sinuosity Index (SI): 1-1.2 = straight to low sinuosity; 1.2-1.4 = moderate sinuosity; >1.4 = high sinuosity.
from the source, C is a constant, and k is the slope of the straight
line. The slope S of the stream at a given point is the derivate of
this equation with respect to L and, hence, is defined as
(2)
It follows that k = SL, where SL is the stream-gradient index
(Hack, 1957; 1973). SL is simply the product of the channel slope
at a given point and the channel length to the source, and it equals
(3)
where ?H is the difference in elevation between the ends of the
reach of interest, ?L is the length of the reach of interest, and L the
distance of the reach from the source.
SL correlates to stream power. Total stream power available at
a particular reach of channel reflects the ability of a stream to
erode its bed and transport sediment. Total or available stream
power is proportional to the slope of the channel bed, and there is
a good correlation between total channel length upstream and
bankful discharge, which is thought to be important in forming
and maintaining rivers. However, the gradient index values
(4)
Experimental studies as well as field observations (Schumm,
1981; 1993) have demonstrated that much of the sinuosity
variability of alluvial rivers reflects the variability of the valley
slope. Thus, changes of valley-floor slope provide an
explanation of downstream changes of sinuosity. Tectonic
activity can be one of the forces controlling the changes of valley
floor slope, together with local changes of sediment and water
supply due to river junctions or changes in lithology (e.g.
Schumm, 1986).
Drainage density. Drainage density is defined as the sum of all
channel lengths divided by the drained area (Horton, 1932).
Channel lengths as well as drainage areas were extracted from
DEM data.
Drainage density is recognized as an indicator for the intensity
of fluvial erosional processes and reflect topographic,
lithological, and climate controls.
The drainage basins were extracted from the available DEM staccording to the stream ordering of Horton (1945). Basins of 1
4.2. Drainage basin morphology
reflect spatial variations in discharge,
but usually it is the result of lithologic
or tectonic controlled reaches of a
river (e.g. Seeber and Gornitz, 1983;
McKeown et al., 1988; Bul, 1990).
Schumm (1986) considered the
longitudinal profile of streams even
one of the most sensitive indicators of
slope change.
In ideal cases - i.e. for rivers “at
grade” – longitudinal profiles de-
scribe a concave shape with gently
decreasing slopes and homo-
geneous SL values.
In this study, the longitudinal river
profiles are obtained from 1:25'000
French topographic maps. The
distance along the river channel
between consecutive contours cros-
sing (5 to 2.5 m intervals) is mea-
sured. The origin of the profile is at
the source of the river. The river
profile is plotted in a graph with axis
in Euclidian distances together with
the SL values for several reaches of
interest (Fig. 3).
Sinuosity index (SI). Sinuosity is
the ratio between channel length (l)
and valley length (L) and it is also the
ratio between valley slope (S ) and v
channel gradient (S):
M. GIAMBONI, A. WETZEL & B. SCHNEIDER
Geomorphic Response of Alluvial Rivers to Active Tectonics: Example from the Southern Rhinegraben
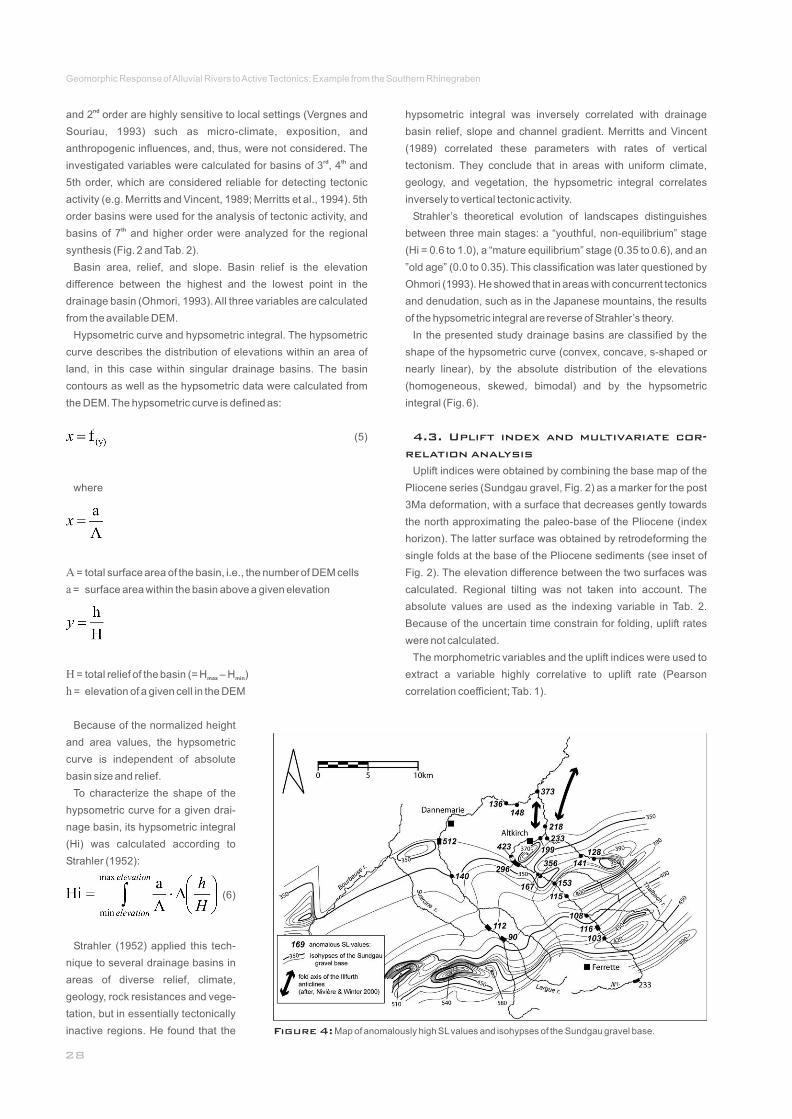
Figure 4: Map of anomalously high SL values and isohypses of the Sundgau gravel base.
ndand 2 order are highly sensitive to local settings (Vergnes and
Souriau, 1993) such as micro-climate, exposition, and
anthropogenic influences, and, thus, were not considered. The rd thinvestigated variables were calculated for basins of 3 , 4 and
5th order, which are considered reliable for detecting tectonic
activity (e.g. Merritts and Vincent, 1989; Merritts et al., 1994). 5th
order basins were used for the analysis of tectonic activity, and thbasins of 7 and higher order were analyzed for the regional
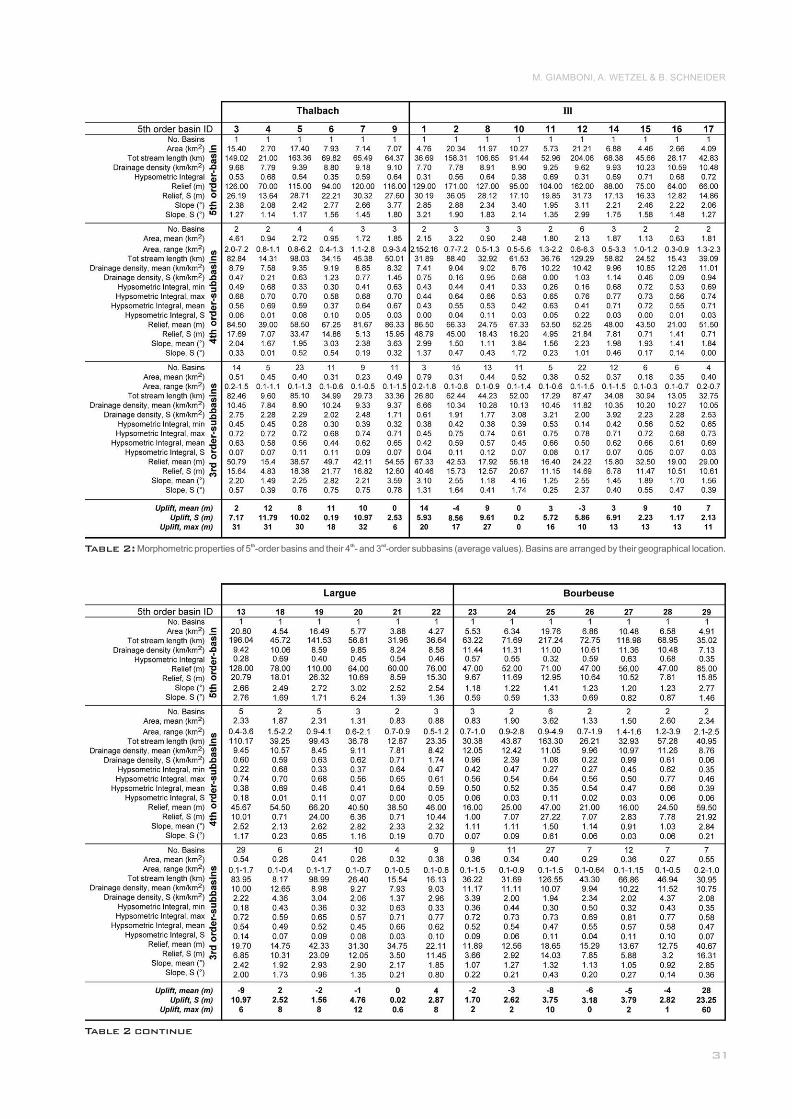
synthesis (Fig. 2 and Tab. 2).
Basin area, relief, and slope. Basin relief is the elevation
difference between the highest and the lowest point in the
drainage basin (Ohmori, 1993). All three variables are calculated
from the available DEM.
Hypsometric curve and hypsometric integral. The hypsometric
curve describes the distribution of elevations within an area of
land, in this case within singular drainage basins. The basin
contours as well as the hypsometric data were calculated from
the DEM. The hypsometric curve is defined as:
(5)
where
A =
a =
H =
h =
Because of the normalized height
and area values, the hypsometric
curve is independent of absolute
basin size and relief.
To characterize the shape of the
hypsometric curve for a given drai-
nage basin, its hypsometric integral
(Hi) was calculated according to
Strahler (1952):
(6)
Strahler (1952) applied this tech-
nique to several drainage basins in
areas of diverse relief, climate,
geology, rock resistances and vege-
tation, but in essentially tectonically
inactive regions. He found that the
hypsometric integral was inversely correlated with drainage
basin relief, slope and channel gradient. Merritts and Vincent
(1989) correlated these parameters with rates of vertical
tectonism. They conclude that in areas with uniform climate,
geology, and vegetation, the hypsometric integral correlates
inversely to vertical tectonic activity.
Strahler’s theoretical evolution of landscapes distinguishes
between three main stages: a “youthful, non-equilibrium” stage
(Hi = 0.6 to 1.0), a “mature equilibrium” stage (0.35 to 0.6), and an
”old age” (0.0 to 0.35). This classification was later questioned by
Ohmori (1993). He showed that in areas with concurrent tectonics
and denudation, such as in the Japanese mountains, the results
of the hypsometric integral are reverse of Strahler’s theory.
In the presented study drainage basins are classified by the
shape of the hypsometric curve (convex, concave, s-shaped or
nearly linear), by the absolute distribution of the elevations
(homogeneous, skewed, bimodal) and by the hypsometric
integral (Fig. 6).
Uplift indices were obtained by combining the base map of the
Pliocene series (Sundgau gravel, Fig. 2) as a marker for the post
3Ma deformation, with a surface that decreases gently towards
the north approximating the paleo-base of the Pliocene (index
horizon). The latter surface was obtained by retrodeforming the
single folds at the base of the Pliocene sediments (see inset of
Fig. 2). The elevation difference between the two surfaces was
calculated. Regional tilting was not taken into account. The
absolute values are used as the indexing variable in Tab. 2.
Because of the uncertain time constrain for folding, uplift rates
were not calculated.
The morphometric variables and the uplift indices were used to
extract a variable highly correlative to uplift rate (Pearson
correlation coefficient; Tab. 1).
4.3. Uplift index and multivariate cor-
relation analysis
total surface area of the basin, i.e., the number of DEM cells
surface area within the basin above a given elevation
total relief of the basin (= H – H )max min
elevation of a given cell in the DEM
M. GIAMBONI, A. WETZEL & B. SCHNEIDER
5. Geomorphic Response to Tectonism
5.1. Stream gradient index
The stream profiles of four main rivers were used to evaluate
the tectonic activity in the test area. The Thalbach, the Ill and the
Largue rivers belong to the Rhine river catchment and intersect
several folds (Fig. 3a-c), whereas the Suarcine river (Fig. 3d) is a
tributary of the Doubs and flows in a tectonically nearly
undeformed area (Fig. 4). The Thalbach and Suarcine rivers are
small and differ in the tectonic setting. The other rivers have
larger catchment areas and are expected to differ in the
tectonically controlled alluvial dynamic.
Reaches with constant or nearly constant SL values are
designated as segments and are delimited by oblique bars in the
plots (Fig. 3).
Ill River. The uppermost course of the Ill River flows completely
within Mesozoic sediments of the Ferrette Anticline (Fig. 1) and
shows a constant decreasing channel gradient with SL values of
37 (Fig. 3a). Sinuosity of 1-1.2 indicates straight channels. The
transition from the Jura Mountains into the Rhinegraben is
marked by a short but steep reach (SL = 233, Figs. 3b, 4).
The middle course (km10 to km 35) is characterized by
moderate SL values ranging from 59 to 87. Four zones of
anomalously high SL values were identified (Figs. 3a, 4). The first
one (SL = 116) is located in the prolongation of a fold observed in
the Sundgau gravel base map (Fig. 4). The second (SL = 108)
coincides with the junction of the Ill river with one of its major
tributaries (Fig. 4). Further downstream, a zone of remarkably
high SL is situated near the junction with the second main
tributary river and at the interference with the southwestern limb
of the Altkirch anticline (SL = 153, 356, 167) (Fig. 4).
The lower part of the Ill river is first characterized by a segment
with the highest SL value encountered (423) corresponding to
the reach flowing around the northwestern nose of the Altkirch
anticline (Fig. 4). Further down, the Ill river entrenches the Illfurth
anticline (Fig. 4) and flows in a S-N trending gorge (Nivière and
Winter, 2000; Giamboni et al., 2004b). The channel gradients are
generally high (SL = 111), with peaks at 199 and 218.
The Ill river is characterized by straight to lowly sinuous
channels (SI = 1-1.2) in the upper course and a gradual transition
to moderately (SI = 1.2-1.4) and highly (SI = >1.4) sinuous
channels in the middle part (Fig. 3a). The lower course is
subdivided into a straight to lowly sinuous channel along the
Illfurth gorge and a high-sinuosity reach further downstream.
Thalbach River. The river profile shows a strong gradient with a
general increase of SL values from 21 to 84 (Figs. 3b, 4),
disturbed by two high SL values (128, 141). In the middle course,
the channel changes from lowly to moderately sinuous.
Largue River. The Largue river has a number of segments with
alternating high and low SL values ranging from 17 to 120 (Fig.
3c). In general, the upper part has low average values around 45,
the middle part moderate (around 70), and the lower part higher
average values (around 90).
Reaches with anomalously high SL values occur (1) at the
transition from upper to middle course (SL=112), (2) at the
junction with a tributary (SL=140), and (3) at the transition from
the middle to the lower river course (SL=512) where the lithology
changes from clay to marls (Fig. 4). Other anomalies (137, 148)
were encountered in the lowermost part of the Largue River.
The river course changes from straight/low sinuous channels in
the upper valley to moderately/highly sinuous channels in the
middle and lower valley (Fig. 3c).
Suarcine River. The river shows a gently decreasing gradient to
the mouth and moderate increasing SL values. No anomalously high
SL values occur. The river course changes from straight/lowly sinu-
ous in the upper part to moderately sinuous in the lower part (Fig. 3d).
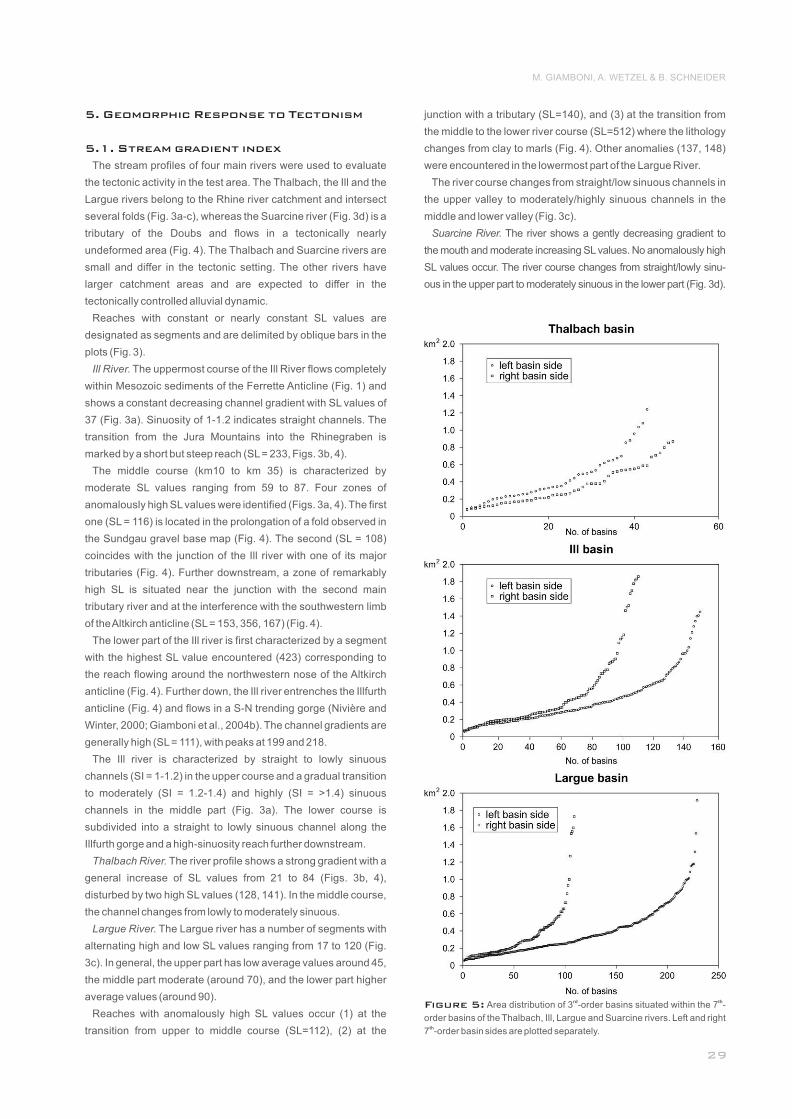
Figure 5: rd th Area distribution of 3 -order basins situated within the 7 -
order basins of the Thalbach, Ill, Largue and Suarcine rivers. Left and right th7 -order basin sides are plotted separately.
Geomorphic Response of Alluvial Rivers to Active Tectonics: Example from the Southern Rhinegraben
Synthesis. The presented data evince a multitude of anomalies
that may result from changes in lithology, form changes in
discharge at river junctions, and from tectonic uplift.
The stream-gradient index SL is useful for documenting
changes in lithology, if the resistance of the eroded rocks is
clearly different (e.g. McKeown et al., 1988). This is the case at
the transition from Oxfordian limestones to Tertiary marls along
the Ill river profile (Fig. 3a; SL = 233), as well as at the transitions
from Pliocene gravels to Tertiary clays (from SL 71 to SL 120) and
from Tertiary clays to marls (512), along the Largue river profile
(Fig. 3c). A clear correlation between the lithology and the
changes in sinuosity, however, could not be observed.
High SL values can also result from discharge growth caused
by the junction of the main river with its tributaries. This effect -
observable only along the two large rivers Ill and Largue - is
characterized in the river profile by a knick point with high SL
values followed by gentle gradients with moderate SL (Ill river: SL
108, 153, 356, 218, 373; Largue river: SL 90, 140).
The relation between SL indices and tectonic deformation is
threefold: (1) Local anomalies of the SL values are clearly related
to discrete tectonic structures (folds observed at the base of the
Sundgau gravel; Fig. 2), and are not influenced by other factors
such as lithology or discharge growth. Related anomalies occur
along the Ill River (SL 116, 115, 296, 423) and along the Thalbach
River (SL 128, 141). (2) SL values are partly a result of a lithology
or discharge change, but the anomalously high values are
emphasized by discrete uplift. Such reaches are found along the
Ill river (SL 356 at the junction point with a tributary) and along the
Largue river (SL 512, at the transition from Oligocene clay to
Oligocene marls and sandstone). (3) SL values of the different
drainage basins are generally different. For instance, the
average SL values between the Ill river (average SL 37-111)
differs from the SL values of the Largue river (average SL 15-95),
the latter being less affected by uplift deformation (Fig. 4). A more
pronounced difference is observed when comparing the small
basin of the Thalbach (average SL 21-85) and the Suarcine river
(average SL 8-44), the latter being situated in an area of very
small vertical movement (Fig. 4).
Furthermore, increased sinuosity indices due to the lowering of
slope produced by the rising anticlines are characteristic (Fig. 4).
Detailed Studies on fluvial morphology confirm these
observations with similar results on sinuosity and a radical
change on sedimentation from accumulation uphill from the
anticlines, to erosion with coarse bed layers over the anticline (L.
Schmitt, pers. Comm.).
Possible correlations between morphometric parameters and
uplift indices were evaluated by means of a Pearson linear
correlation analysis (e.g. Merritts and Vincent, 1989;
Summerfield and Hulton, 1994; Hurtrez et al., 1999). The
analyzed variables were: basin area, total stream length,
average basin slope, basin relief, hypsometric integral, and thdrainage density. All variables are calculated for the 5 order
th rdbasins and their 4 - and 3 -order subbasins (Tabs. 1, 2).
Significance of each correlation was determined by a t-test with
5.2. Linear correlation analysis (Pearson)
the 5% level of significance. Hence,
correlation coefficients greater than
0.38 were considered significant.
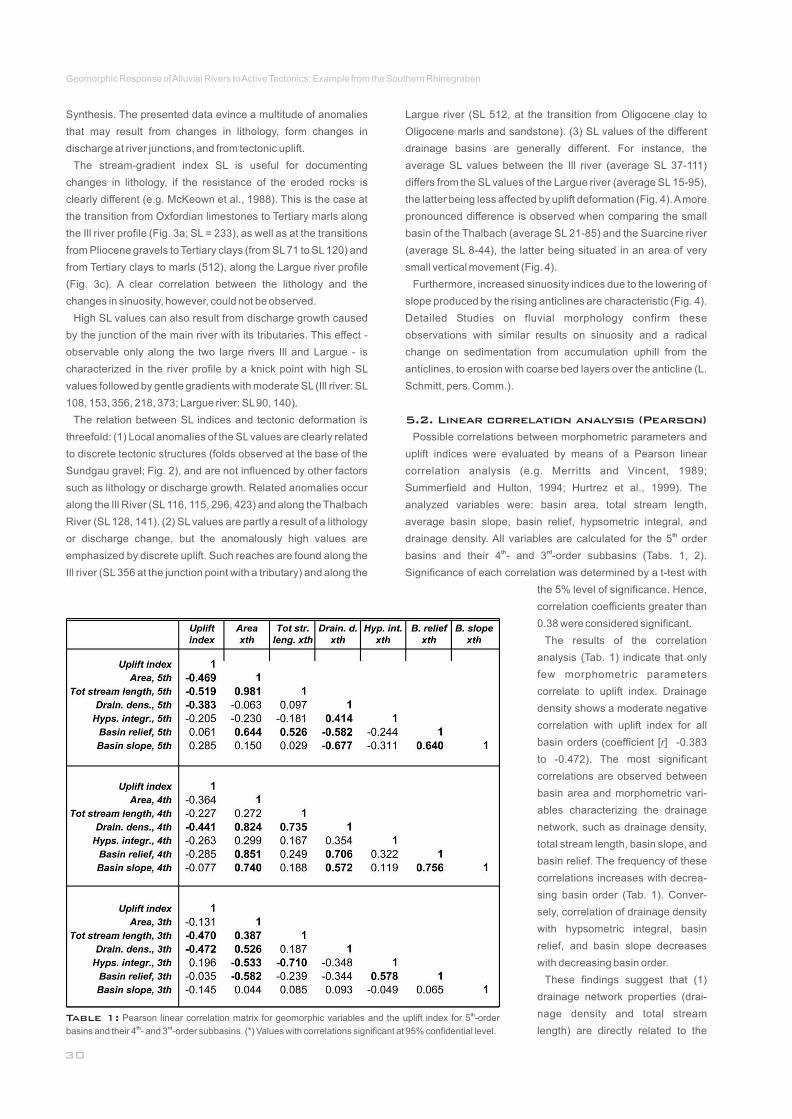
The results of the correlation
analysis (Tab. 1) indicate that only
few morphometric parameters
correlate to uplift index. Drainage
density shows a moderate negative
correlation with uplift index for all
basin orders (coefficient [r] -0.383
to -0.472). The most significant
correlations are observed between
basin area and morphometric vari-
ables characterizing the drainage
network, such as drainage density,
total stream length, basin slope, and
basin relief. The frequency of these
correlations increases with decrea-
sing basin order (Tab. 1). Conver-
sely, correlation of drainage density
with hypsometric integral, basin
relief, and basin slope decreases
with decreasing basin order.
These findings suggest that (1)
drainage network properties (drai-
nage density and total stream
length) are directly related to theTable 1: th Pearson linear correlation matrix for geomorphic variables and the uplift index for 5 -order
th rdbasins and their 4 - and 3 -order subbasins. (*) Values with correlations significant at 95% confidential level.
M. GIAMBONI, A. WETZEL & B. SCHNEIDER
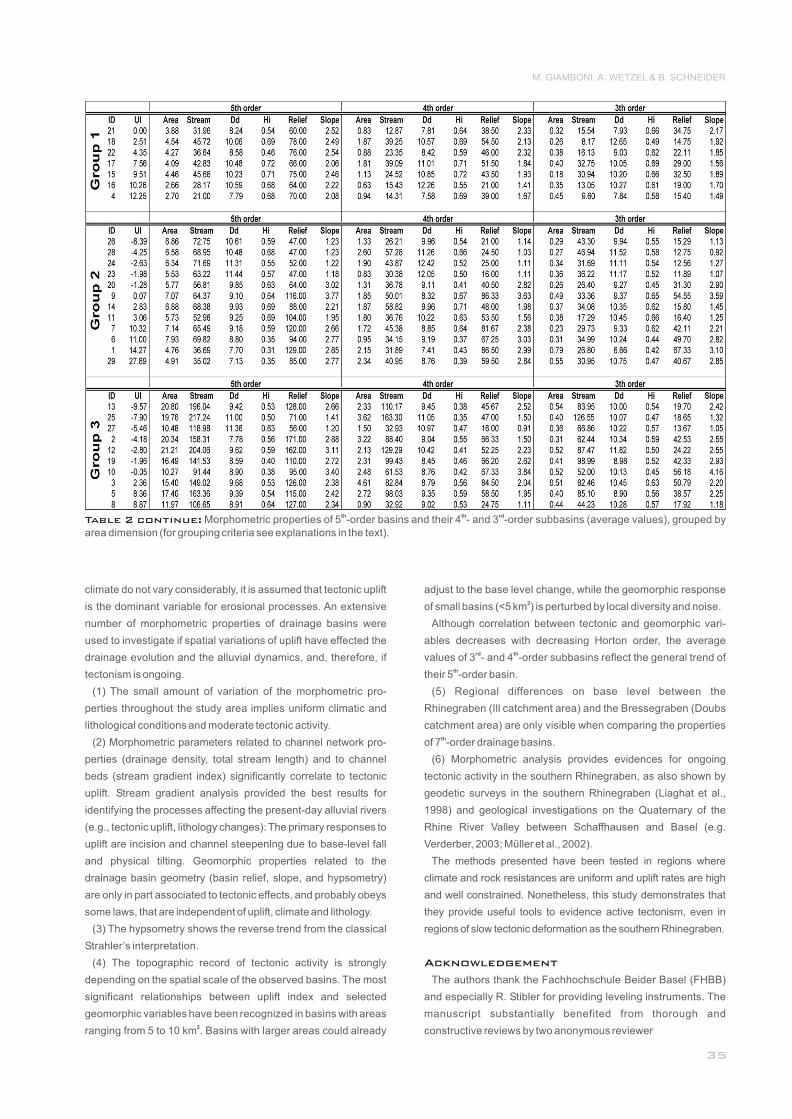
Table 2: th th rd Morphometric properties of 5 -order basins and their 4 - and 3 -order subbasins (average values). Basins are arranged by their geographical location.
Table 2 continue
Geomorphic Response of Alluvial Rivers to Active Tectonics: Example from the Southern Rhinegraben
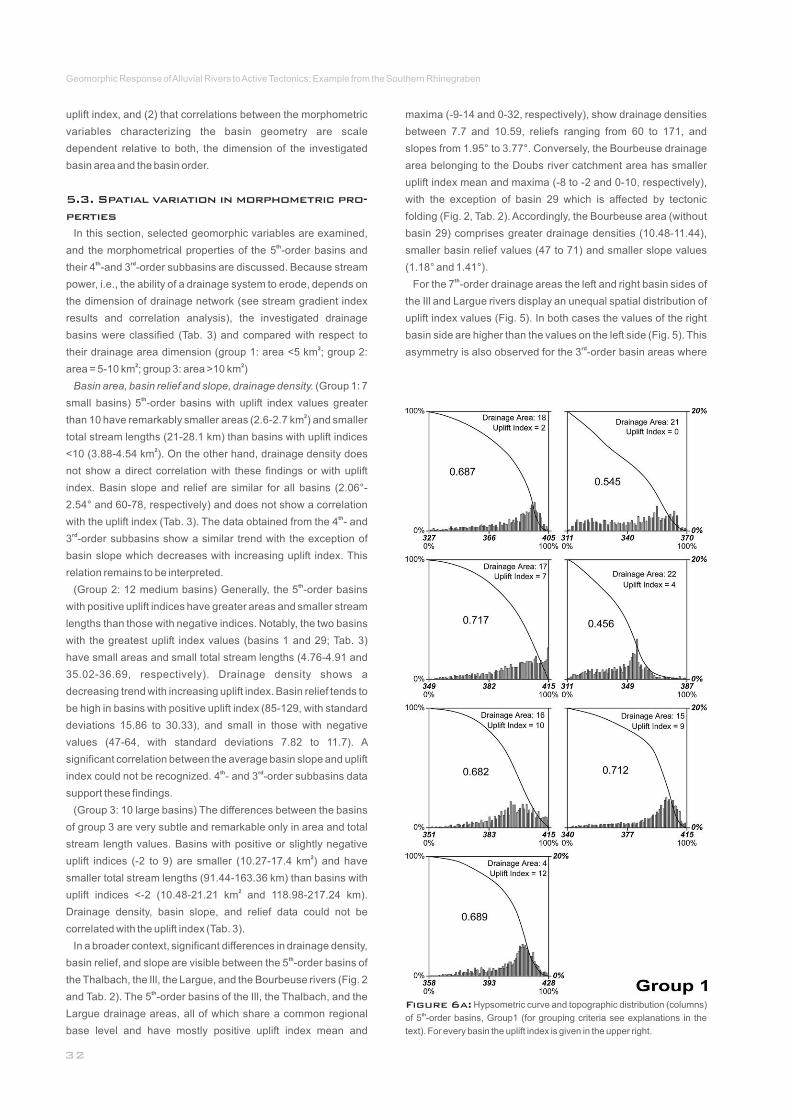
Figure 6a: Hypsometric curve and topographic distribution (columns) thof 5 -order basins, Group1 (for grouping criteria see explanations in the
text). For every basin the uplift index is given in the upper right.
uplift index, and (2) that correlations between the morphometric
variables characterizing the basin geometry are scale
dependent relative to both, the dimension of the investigated
basin area and the basin order.
In this section, selected geomorphic variables are examined, thand the morphometrical properties of the 5 -order basins and
th rdtheir 4 -and 3 -order subbasins are discussed. Because stream
power, i.e., the ability of a drainage system to erode, depends on
the dimension of drainage network (see stream gradient index
results and correlation analysis), the investigated drainage
basins were classified (Tab. 3) and compared with respect to 2their drainage area dimension (group 1: area <5 km ; group 2:
2 2area = 5-10 km ; group 3: area >10 km )
Basin area, basin relief and slope, drainage density. (Group 1: 7 thsmall basins) 5 -order basins with uplift index values greater
2than 10 have remarkably smaller areas (2.6-2.7 km ) and smaller
total stream lengths (21-28.1 km) than basins with uplift indices 2<10 (3.88-4.54 km ). On the other hand, drainage density does
not show a direct correlation with these findings or with uplift
index. Basin slope and relief are similar for all basins (2.06°-
2.54° and 60-78, respectively) and does not show a correlation thwith the uplift index (Tab. 3). The data obtained from the 4 - and
rd 3 -order subbasins show a similar trend with the exception of
basin slope which decreases with increasing uplift index. This
relation remains to be interpreted.th(Group 2: 12 medium basins) Generally, the 5 -order basins
with positive uplift indices have greater areas and smaller stream
lengths than those with negative indices. Notably, the two basins
with the greatest uplift index values (basins 1 and 29; Tab. 3)
have small areas and small total stream lengths (4.76-4.91 and
35.02-36.69, respectively). Drainage density shows a
decreasing trend with increasing uplift index. Basin relief tends to
be high in basins with positive uplift index (85-129, with standard
deviations 15.86 to 30.33), and small in those with negative
values (47-64, with standard deviations 7.82 to 11.7). A
significant correlation between the average basin slope and uplift th rdindex could not be recognized. 4 - and 3 -order subbasins data
support these findings.
(Group 3: 10 large basins) The differences between the basins
of group 3 are very subtle and remarkable only in area and total
stream length values. Basins with positive or slightly negative 2uplift indices (-2 to 9) are smaller (10.27-17.4 km ) and have
smaller total stream lengths (91.44-163.36 km) than basins with 2uplift indices <-2 (10.48-21.21 km and 118.98-217.24 km).
Drainage density, basin slope, and relief data could not be
correlated with the uplift index (Tab. 3).
In a broader context, significant differences in drainage density, thbasin relief, and slope are visible between the 5 -order basins of
the Thalbach, the Ill, the Largue, and the Bourbeuse rivers (Fig. 2thand Tab. 2). The 5 -order basins of the Ill, the Thalbach, and the
Largue drainage areas, all of which share a common regional
base level and have mostly positive uplift index mean and
5.3. Spatial variation in morphometric pro-
perties
maxima (-9-14 and 0-32, respectively), show drainage densities
between 7.7 and 10.59, reliefs ranging from 60 to 171, and
slopes from 1.95° to 3.77°. Conversely, the Bourbeuse drainage
area belonging to the Doubs river catchment area has smaller
uplift index mean and maxima (-8 to -2 and 0-10, respectively),
with the exception of basin 29 which is affected by tectonic
folding (Fig. 2, Tab. 2). Accordingly, the Bourbeuse area (without
basin 29) comprises greater drainage densities (10.48-11.44),
smaller basin relief values (47 to 71) and smaller slope values
(1.18° and 1.41°).thFor the 7 -order drainage areas the left and right basin sides of
the Ill and Largue rivers display an unequal spatial distribution of
uplift index values (Fig. 5). In both cases the values of the right
basin side are higher than the values on the left side (Fig. 5). This rdasymmetry is also observed for the 3 -order basin areas where
M. GIAMBONI, A. WETZEL & B. SCHNEIDER
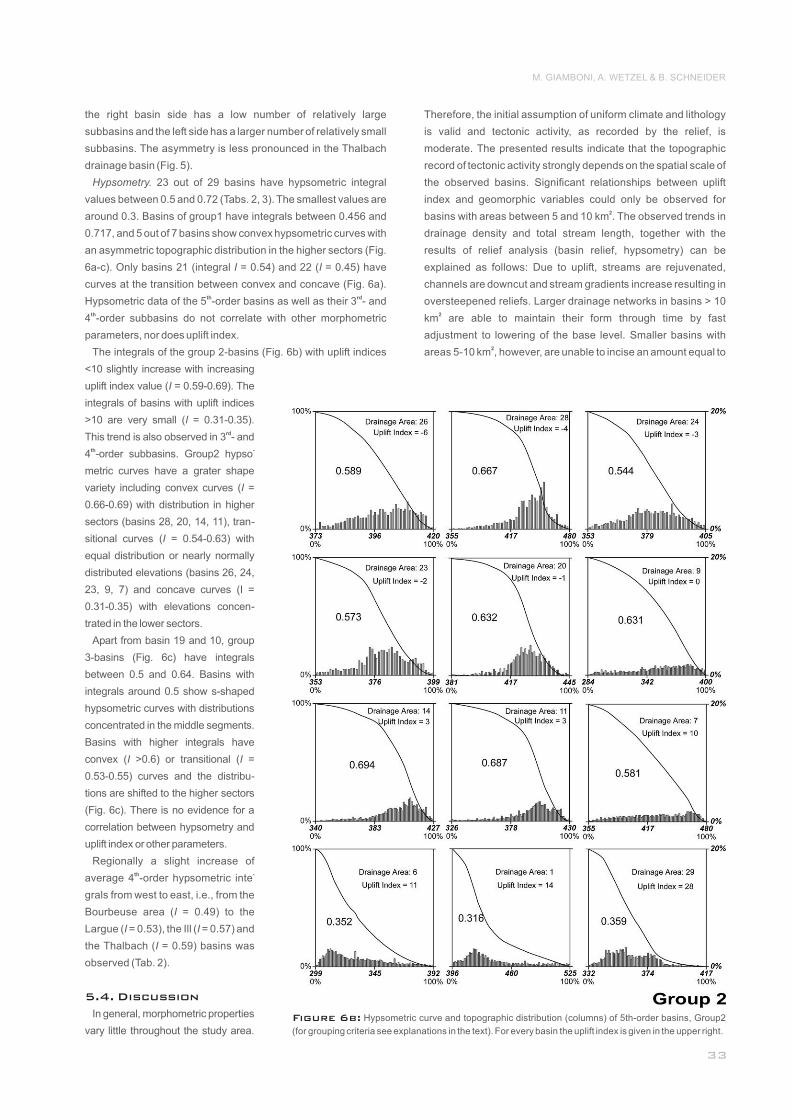
Figure 6b: Hypsometric curve and topographic distribution (columns) of 5th-order basins, Group2
(for grouping criteria see explanations in the text). For every basin the uplift index is given in the upper right.
the right basin side has a low number of relatively large
subbasins and the left side has a larger number of relatively small
subbasins. The asymmetry is less pronounced in the Thalbach
drainage basin (Fig. 5).
Hypsometry. 23 out of 29 basins have hypsometric integral
values between 0.5 and 0.72 (Tabs. 2, 3). The smallest values are
around 0.3. Basins of group1 have integrals between 0.456 and
0.717, and 5 out of 7 basins show convex hypsometric curves with
an asymmetric topographic distribution in the higher sectors (Fig.
6a-c). Only basins 21 (integral I = 0.54) and 22 (I = 0.45) have
curves at the transition between convex and concave (Fig. 6a). th rdHypsometric data of the 5 -order basins as well as their 3 - and
th4 -order subbasins do not correlate with other morphometric
parameters, nor does uplift index.
The integrals of the group 2-basins (Fig. 6b) with uplift indices
<10 slightly increase with increasing
uplift index value (I = 0.59-0.69). The
integrals of basins with uplift indices
>10 are very small (I = 0.31-0.35). rdThis trend is also observed in 3 - and
th -4 -order subbasins. Group2 hypso
metric curves have a grater shape
variety including convex curves (I =
0.66-0.69) with distribution in higher
sectors (basins 28, 20, 14, 11), tran-
sitional curves (I = 0.54-0.63) with
equal distribution or nearly normally
distributed elevations (basins 26, 24,
23, 9, 7) and concave curves (I =
0.31-0.35) with elevations concen-
trated in the lower sectors.
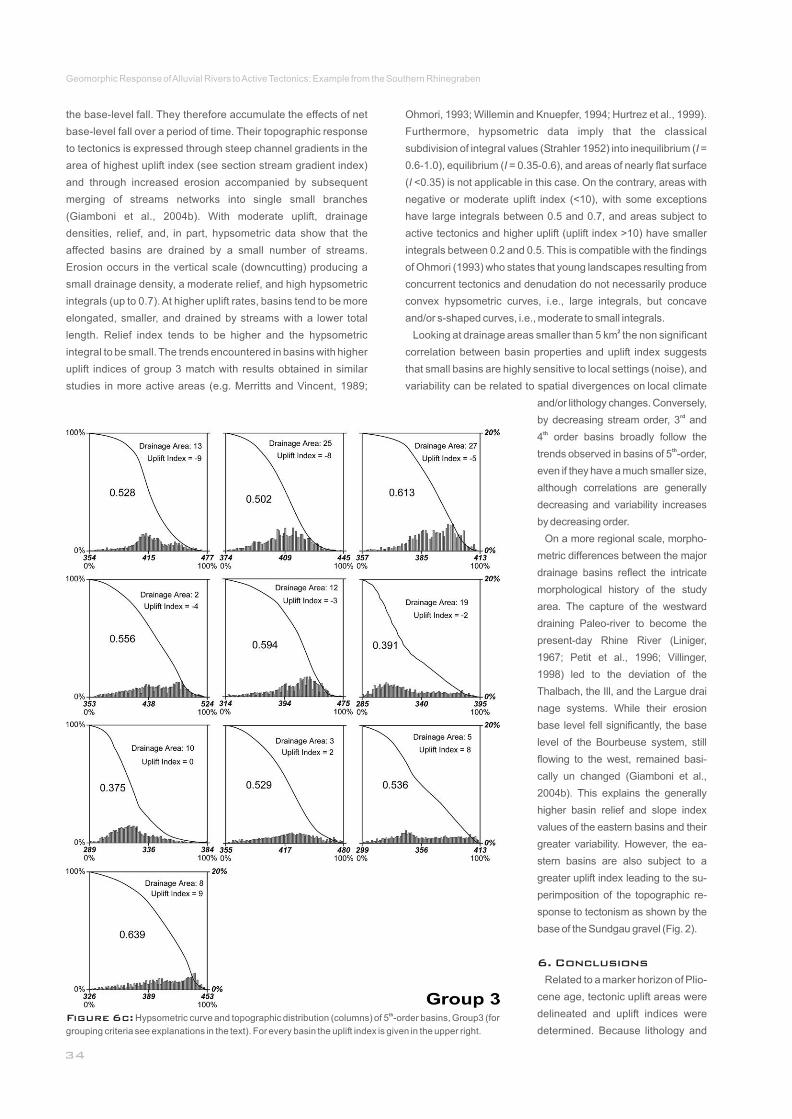
Apart from basin 19 and 10, group
3-basins (Fig. 6c) have integrals
between 0.5 and 0.64. Basins with
integrals around 0.5 show s-shaped
hypsometric curves with distributions
concentrated in the middle segments.
Basins with higher integrals have
convex (I >0.6) or transitional (I =
0.53-0.55) curves and the distribu-
tions are shifted to the higher sectors
(Fig. 6c). There is no evidence for a
correlation between hypsometry and
uplift index or other parameters.
Regionally a slight increase of th -average 4 -order hypsometric inte
grals from west to east, i.e., from the
Bourbeuse area (I = 0.49) to the
Largue (I = 0.53), the Ill (I = 0.57) and
the Thalbach (I = 0.59) basins was
observed (Tab. 2).
In general, morphometric properties
vary little throughout the study area.
5.4. Discussion
Therefore, the initial assumption of uniform climate and lithology
is valid and tectonic activity, as recorded by the relief, is
moderate. The presented results indicate that the topographic
record of tectonic activity strongly depends on the spatial scale of
the observed basins. Significant relationships between uplift
index and geomorphic variables could only be observed for 2basins with areas between 5 and 10 km . The observed trends in
drainage density and total stream length, together with the
results of relief analysis (basin relief, hypsometry) can be
explained as follows: Due to uplift, streams are rejuvenated,
channels are downcut and stream gradients increase resulting in
oversteepened reliefs. Larger drainage networks in basins > 10 2km are able to maintain their form through time by fast
adjustment to lowering of the base level. Smaller basins with 2areas 5-10 km , however, are unable to incise an amount equal to
Geomorphic Response of Alluvial Rivers to Active Tectonics: Example from the Southern Rhinegraben
Figure 6c: th Hypsometric curve and topographic distribution (columns) of 5 -order basins, Group3 (for
grouping criteria see explanations in the text). For every basin the uplift index is given in the upper right.
the base-level fall. They therefore accumulate the effects of net
base-level fall over a period of time. Their topographic response
to tectonics is expressed through steep channel gradients in the
area of highest uplift index (see section stream gradient index)
and through increased erosion accompanied by subsequent
merging of streams networks into single small branches
(Giamboni et al., 2004b). With moderate uplift, drainage
densities, relief, and, in part, hypsometric data show that the
affected basins are drained by a small number of streams.
Erosion occurs in the vertical scale (downcutting) producing a
small drainage density, a moderate relief, and high hypsometric
integrals (up to 0.7). At higher uplift rates, basins tend to be more
elongated, smaller, and drained by streams with a lower total
length. Relief index tends to be higher and the hypsometric
integral to be small. The trends encountered in basins with higher
uplift indices of group 3 match with results obtained in similar
studies in more active areas (e.g. Merritts and Vincent, 1989;
Ohmori, 1993; Willemin and Knuepfer, 1994; Hurtrez et al., 1999).
Furthermore, hypsometric data imply that the classical
subdivision of integral values (Strahler 1952) into inequilibrium (I =
0.6-1.0), equilibrium (I = 0.35-0.6), and areas of nearly flat surface
(I <0.35) is not applicable in this case. On the contrary, areas with
negative or moderate uplift index (<10), with some exceptions
have large integrals between 0.5 and 0.7, and areas subject to
active tectonics and higher uplift (uplift index >10) have smaller
integrals between 0.2 and 0.5. This is compatible with the findings
of Ohmori (1993) who states that young landscapes resulting from
concurrent tectonics and denudation do not necessarily produce
convex hypsometric curves, i.e., large integrals, but concave
and/or s-shaped curves, i.e., moderate to small integrals.2Looking at drainage areas smaller than 5 km the non significant
correlation between basin properties and uplift index suggests
that small basins are highly sensitive to local settings (noise), and variability can be related to spatial divergences on local climate
and/or lithology changes. Conversely, rdby decreasing stream order, 3 and
th4 order basins broadly follow the thtrends observed in basins of 5 -order,
even if they have a much smaller size,
although correlations are generally
decreasing and variability increases
by decreasing order.
On a more regional scale, morpho-
metric differences between the major
drainage basins reflect the intricate
morphological history of the study
area. The capture of the westward
draining Paleo-river to become the
present-day Rhine River (Liniger,
1967; Petit et al., 1996; Villinger,
1998) led to the deviation of the
Thalbach, the Ill, and the Largue drai
nage systems. While their erosion
base level fell significantly, the base
level of the Bourbeuse system, still
flowing to the west, remained basi-
cally un changed (Giamboni et al.,
2004b). This explains the generally
higher basin relief and slope index
values of the eastern basins and their
greater variability. However, the ea-
stern basins are also subject to a
greater uplift index leading to the su-
perimposition of the topographic re-
sponse to tectonism as shown by the
base of the Sundgau gravel (Fig. 2).
Related to a marker horizon of Plio-
cene age, tectonic uplift areas were
delineated and uplift indices were
determined. Because lithology and
6. Conclusions
M. GIAMBONI, A. WETZEL & B. SCHNEIDER
Table 2 continue: th th rd Morphometric properties of 5 -order basins and their 4 - and 3 -order subbasins (average values), grouped by area dimension (for grouping criteria see explanations in the text).
climate do not vary considerably, it is assumed that tectonic uplift
is the dominant variable for erosional processes. An extensive
number of morphometric properties of drainage basins were
used to investigate if spatial variations of uplift have effected the
drainage evolution and the alluvial dynamics, and, therefore, if
tectonism is ongoing.
(1) The small amount of variation of the morphometric pro-
perties throughout the study area implies uniform climatic and
lithological conditions and moderate tectonic activity.
(2) Morphometric parameters related to channel network pro-
perties (drainage density, total stream length) and to channel
beds (stream gradient index) significantly correlate to tectonic
uplift. Stream gradient analysis provided the best results for
identifying the processes affecting the present-day alluvial rivers
(e.g., tectonic uplift, lithology changes): The primary responses to
uplift are incision and channel steepening due to base-level fall
and physical tilting. Geomorphic properties related to the
drainage basin geometry (basin relief, slope, and hypsometry)
are only in part associated to tectonic effects, and probably obeys
some laws, that are independent of uplift, climate and lithology.
(3) The hypsometry shows the reverse trend from the classical
Strahler’s interpretation.
(4) The topographic record of tectonic activity is strongly
depending on the spatial scale of the observed basins. The most
significant relationships between uplift index and selected
geomorphic variables have been recognized in basins with areas 2ranging from 5 to 10 km . Basins with larger areas could already
adjust to the base level change, while the geomorphic response 2of small basins (<5 km ) is perturbed by local diversity and noise.
Although correlation between tectonic and geomorphic vari-
ables decreases with decreasing Horton order, the average rd thvalues of 3 - and 4 -order subbasins reflect the general trend of
ththeir 5 -order basin.
(5) Regional differences on base level between the
Rhinegraben (Ill catchment area) and the Bressegraben (Doubs
catchment area) are only visible when comparing the properties thof 7 -order drainage basins.
(6) Morphometric analysis provides evidences for ongoing
tectonic activity in the southern Rhinegraben, as also shown by
geodetic surveys in the southern Rhinegraben (Liaghat et al.,
1998) and geological investigations on the Quaternary of the
Rhine River Valley between Schaffhausen and Basel (e.g.
Verderber, 2003; Müller et al., 2002).
The methods presented have been tested in regions where
climate and rock resistances are uniform and uplift rates are high
and well constrained. Nonetheless, this study demonstrates that
they provide useful tools to evidence active tectonism, even in
regions of slow tectonic deformation as the southern Rhinegraben.
The authors thank the Fachhochschule Beider Basel (FHBB)
and especially R. Stibler for providing leveling instruments. The
manuscript substantially benefited from thorough and
constructive reviews by two anonymous reviewer
Acknowledgement
Geomorphic Response of Alluvial Rivers to Active Tectonics: Example from the Southern Rhinegraben
References
Bull, W.B. 1990.
Bull, W.L. and Knuepfer, P.L.K. 1987.
Contini, D., Kuntz, G., Angély, B., Laffly, J.L., Kerrien, Y., Landry, J.
and Théobald, N. 1973.
Doebl, F. 1970.
Galay, V.J. 1983.
Giamboni, M., Ustaszewski, K., Schmid, S.M., Schumacher, M.
and Wetzel, A. 2004 (a).
Giamboni, M., Wetzel, A., Nivière, B. and Schumacher, M. 2004
(b).
Gilbert, G.K., 1877.
Hack, J.T. 1957.
Hack, J.T. 1973.
Horton, R.E. 1932.
Horton, R.E. 1945.
Hurtrez, J.E., Lucazeau, F., Lavé, J. and Avouac, J.-P. 1999.
Keller, E.A. 1986.
Stream-terrace genesis: implications for soil
development. Geomorphology, 3, 351-367.
Adjustments by the
Charwell River, New Zealand, to uplift and climatic changes.
Geomorphology, 1, 15-32.
Carte Géologique et Notice Explicative,
Feuille 3522 Montbéliard. BRGM, Orleans.
Die tertiären und quartären Sedimente des
südlichen Rheingraben. In: J.H. Illies and S. Mueller (Editors),
Graben Problems. Schweizerbart, Stuttgart, pp. 56-66.
Causes of river bed degradation. Water
Resources Research, 19, 1057-1090.
Plio-Pleistocene transpressional
reactivation of Paleozoic and Paleogene structures in the Rhine-
Bresse Transform Zone (Northern Switzerland and Eastern
France). International Journal of Earth Sciences, 93, 207-223.
Plio-Pleistocene folding in the southern Rhinegraben
recorded by the evolution of the drainage network (Sundgau area;
northwestern Switzerland and France). Eclogae geologicae
Helvetiae 97(2004), 17-31.
Report on the Geology of the Henry
Mountains. U.S. Geographical and Geological Survey,
Washington, 160 pp.
Studies of longitudinal stream profiles in Virginia
and Maryland. U. S. Geolological Survey Professional Papers,
294-B, 97.
Stream-profile analysis and stream-gradient
index. Journal of Research U. S. Geolological Survey, 1(4), 421-
429.
Drainage basin characteristics. Transactions
of the American Geophysical Union, 14, 350-361.
Erosional development of streams and their
drainage basisn; hydrophysical approach to quantitative
morphology. Bulletin of the Geological Society of America, 56,
275-370.
Investigation of the relationship between basin morphology,
tectonic uplift, and denudation from the study of an active fold
belt in the Siwalik Hills, central Nepal. Journal of Geophysical
Research, 104(B6), 12779-12796.
Investigations of active tectonics: use of surficial
earth processes. In: R.E. Wallace (Editor), Active Tectonics.
National Academy Press, Washington DC, pp. 136-147.
Keller, E.A. and Pinter, N. 2002.
Laubscher, H. 2001.
Liaghat, C., Villemin, T. and Jouanne, F. 1998.
Lifton, N.A. and Chase, C.G. 1992.
Liniger, H. 1966. -
Liniger, H. 1967.
Mackin, J.H. 1948.
McKeown, F.A., Jones-Cecil, M., Askew, B.L. and McGrath, M.B.
1988.
Meghraoui, M., Delouis, B., Ferry, M., Giardini, D., Huggenberger,
P., Spottke, I. and Granet, M. 2001.
Ménillet, F., Coulon, M., Fourquin, C., Paicheler, J.-C., Lougnon,
J.-M. and Lettermann, M. 1989.
Merritts, D.J. and Vincent, K.R. 1989.
Merritts, D.J., Vincent, K.R. and Wohl, E.E. 1994.
Müller, W.H., Naef, H. and Graf, H.R. 2001.
Müller, W.H., Naef, H. and Graf, H.R., 2002.
-
Nivière, B. and Winter, T. 2000.
Active Tectonics: Earthquakes,
Uplift and Landscape. Prentice Hall, Upper Saddle River, 362 pp.
Plate interactions at the southern end of the
Rhine graben. Tectonophysics, 343, 1-19.
Déformation
verticale actuelle dans la partie sud du fossé d’Alsace (France).
Earth & Planetary Sciences 327, 55-60.
Tectonic, climatic and
lithologic influences on landscape fractal dimension and
hypsometry: implications for landscape evolution in the San
Gabriel Mountains, California. Geomorphology, 5, 77-114.
Das plio-altpleistozäne Flussnetz der Nord
schweiz. Regio Basiliensis, 7(2), 158-177.
Pliozän und Tektonik des Juragebirges.
Eclogae geolocicae Helvetiae, 60(2), 407-490.
Concept of the graded stream. Bulletin of the
Geological Society of America, 59, 463-512.
Analysis of stream-profile data and inferred tectonic
activity, eastern Ozark Mountains region. U. S. Geological
Survey Bulletin, 1807, 1-39.
Active normal faulting in the
Upper Rhine Graben and paleoseismic identification of the 1356
Basel earthquake. Science, 293, 2070-2073.
Carte Géologique et Notice
Explicative, Feuille 3620 Thann. BRGM, Orleans.
Geomorphic response of
coastal streams to low, intermediate, and high rates of uplift,
Mendocino triple junction region, northern California. Bulletin of
the Geological Society of America, 101, 1373-1388.
Long river
profiles, tectonism, and eustasy: A guide to interpreting fluvial
terraces. Journal of Geophysical Research, 99(B7), 14031-14050.
Zur Tektonik der
zentralen Nordschweiz - Interpretation aufgrund regionaler
Seismik, Oberflächengeologie und Tiefbohrugen. Nagra
Technischer Bericht NTB 99-08, Nagra, Wettingen, 226 pp.
Geologische
Entwicklung der Nordschweiz, Neotektonik und Langzeit
szenarien Zürcher Weinland. NAGRA Technischer Bericht, 99-
08. NAGRA, Wettingen, 237 pp.
Pleistocene nothwards fold
propagation of the Jura within the southern Upper Rhine Graben:
Seismotectonic implications. Global and Planetary Change, 27,
263-288.
M. GIAMBONI, A. WETZEL & B. SCHNEIDER
Received: 9. June 2004
Accepted: 8. June 2005
*)M. GIAMBONI , A. WETZEL & B. SCHNEIDER
Geologisch-Paläontologisches Institut, Universität Basel, Bernoulli-
strasse 32, CH-4055 Basel
*) coresponding author (present address): Forstdirektion - Schutzwald
und Naturgefahren Bundesamt für Umwelt, Wald und Landschaft CH-
3003 Bern
Ohmori, H. 1993.
Ouchi, S. 1985.
Petit, C., Campy, M., Chaline, J. and Bonvalot, J. 1996.
Ruhland, M. and Blanat, J.G. 1973.
Schumacher, M. 2002.
Schumm, A.S. 1981.
Schumm, S.A. 1986.
Schumm, S.A. 1993.
Seeber, L. and Gornitz, V. 1983.
Sissingh, W. 1998.
Strahler, A.N. 1952.
Summerfield, M.A. and Hulton, N.J. 1994.
Théobald, N. and Devantoy, J. 1963.
Théobald, N. and Dubois, G. 1958.
Ustaszewski, K., Schmid, S.M. and Giamboni, M. 2001.
Verderber, R. 2003.
Changes in the hypsometric curve through
mountain building resulting from concurrent tectonics and
denudation. Geomorphology, 8, 263-277.
Response of alluvial rivers to slow active tectonic
movement. Bulletin of the Geological Society of America, 96,
504-515.
Major
palaeohydrographic changes in Alpine foreland during the
Pliocene-Pleistocene. Boreas, 25, 131-143.
Carte Géologique et Notice
Explicative, Feuille 3722 Ferrette. BRGM, Orleans.
Upper Rhine Graben: Role of preexisting
structures during rift evolution. Tectonics, 21(1), 6.1 – 6.17.
Evolution and response of the fluvial
system, sedimentologic implications. International Association
of Sedimentology Special Publication, 31, 19-39.
Alluvial river response to active tectonics.
In: N.R. Council (Editor), Active Tectonics. National Academy
Press, Washington (D.C.), pp. 80-94.
River response to baselevel change:
implications for sequence stratigraphy. Journal of Geology, 101,
279-294.
River profiles along the
Himalayan arc as indicators of active tectonics. Tectonophysics,
92, 335-367.
Comparative Tertiary stratigraphy of the
Rhine Graben, Bresse Graben and Molasse Basin: correlation of
Alpine foreland events. Tectonophysics, 300, 249-284.
Hypsometric (area-altitude) analysis of
erosional topography. Bulletin of the Geological Society of
America, 63, 1117-1142.
Natural controls of
fluvial denudation rates in major world drainage basins. Journal
of Geophysical Research, 99(B7), 13871-13883.
Carte Géologique et Notice
Explicative, Feuille 3621 Belfort. BRGM, Orleans.
Carte Géologique et Notice
Explicative, Feuille 3721 Altkirch-Huningue. BRGM, Orleans.
The
frontal folds of the Jura mountains revisited: subsequent folding
of Oligocene extensional structures during a thick-skinned phase
of Jura folding? Journal of Conference Abstracts, 6(1), 630.
Quartärgeologie im Hochrheingebiet
zwischen Schaffhausen und Basel. Zeitschrift der deutschen
geologischen Gesellschaft 154, 369-406.
Vergnes, M. and Souriau, M. 1993.
Villinger, E. 1998.
-
Willemin, J.H. and Knuepfer, L.K. (1994).
Zuchiewicz, W. 1995.
Quantifying the transition
between tectonic trend and mesoscale texture in topographic
data. Geophysical Research Letters, 20, 2139-2141.
Zur Flussgeschichte von Rhein und Donau in
Südwestdeutschland. Jahrbuch der oberrheinischen geolo
gischen Vereinigung, 80, 361-398.
Kinematics of arc-
continent collision in the eastern Central Range of Taiwan
inferred from geomorphic analysis. Journal of Geophysical
Research, 99(B10), 20.267-20.280.
Time-series analysis of river bed gradients
in the Polish Carpathians: a statistical approach to the studies on
young tectonic activity. Zeitschrift für Geomorphologie Neue
Folge, 39(4), 461-477.