Embed Size (px)
Citation preview
BMU – 2007-696
„Retroperspektive individuelle Dosimetrie mit
Lumineszenz – und EPR-Messungen für den
Notfallschutz“
Retrospective individual dosimetry using
luminescence and EPR after radiation accidents
Dr. H.Y. Göksu
Dr. A. Wieser
Dr. A. Ulanovsky
GSF-Forschungszentrum
für Umwelt und Gesundheit
Neuherberg Institut für Strahlenschutz, Arbeitsgruppe Risikoanalyse (Dr. P. Jacob)
IMPRESSUM
Dieser Band enthält einen Abschlussbericht über ein vom Bundesministerium für
Umwelt, Naturschutz und Reaktorsicherheit (BMU) gefördertes Vorhaben.
Verantwortlich für den Inhalt sind allein die Autoren. Das BMU übernimmt keine
Gewähr für die Richtigkeit, die Genauigkeit und Vollständigkeit der Angaben sowie
die Beachtung privater Rechte Dritter. Der Eigentümer behält sich alle Rechte an der
weiteren Nutzung oder Vervielfältigung des Berichts vor.
Der Bericht gibt die Auffassung und Meinung des Auftragnehmers wieder und muss
nicht mit der des BMU übereinstimmen.
Herausgeber:
Bundesministerium für Umwelt, Naturschutz und Reaktorsicherheit
Referat RS I 2
Postfach 12 06 29
53048 Bonn
ISSN 1612-6386
Erscheinungsjahr: 2007
– 3 –
TABLE OF CONTENTS
ZUSAMMENFASSUNG 5
SUMMARY 7
1 INTRODUCTION 9
2 INDIVIDUAL DOSIMETRY 13
2.1 Individual dosimetry using luminescence 13 2.1.1 Method of TL and OSL 13 2.1.2 Measurement facilities of TL and OSL 13
2.2 Individual dosimetry using EPR 14 2.2.1 Method of EPR 14 2.2.2 Measurement facilities of EPR 16
2.3 Monte Carlo Simulations of photon energy response of deciduous teeth 16
2.4 Experimental evaluation of photon energy response of chip cards 19
2.5 Software tool for dose conversion to air kerma 20
3 CHIP CARDS 23
3.1 Measurements of luminescence properties of the component of chip cards 23 3.1.1 Experimental results and discussions 24 3.1.2 Conclusions and recommendations 31
3.2 Improving dosimetric properties of globe top 32 3.2.1 Preparation of globe tops with various type of artificial phosphors 32 3.2.2 Luminescence measurements, results and discussions 32 3.2.3 Conclusion and recommendation for producers 36
3.3 Photon energy response of chip card 38 3.3.1 Measurement of energy dose response of chip cards 38 3.3.2 Results and Discussions 38
4 TEETH 41
4.1 Investigation of EPR properties of tooth enamel 41 4.1.1 Analysis of the EPR spectrum of tooth enamel 41 4.1.2 Measurements of dose response of tooth enamel 44
4.2 Evaluation of photon energy response of deciduous teeth 47 4.2.1 Monte Carlo calculated photon energy response of tooth enamel from deciduous teeth 47 4.2.2 EPR measurements for verification of Monte Carlo calculated photon energy response 54
– 4 –
5 OVERALL CONCLUSIONS AND RECOMENDATIONS FOR PRODUCERS 57
5.1 Chip cards as individual dosimeters 57
5.2 Teeth as individual dosimeters 58
ACKNOWLEDGEMENTS 61
REFERENCES 63 Annex I. MEASUREMENT PROTOCOLS
A. The use of chip cards after radiation accidents as individual dosimeters B. EPR dosimetry using teeth enamel
Annex II. A SOFTWARE TOOL TO CONVERT MEASURED DOSE IN TOOTH
ENAMEL AND CHIP CARDS TO INTEGRAL AIR KERMA
– 5 –
ZUSAMMENFASSUNG
In radiologischen Unfallsituationen liegen in der Regel aufgrund fehlender Messungen nur unzureichende Informationen über die Strahlenexposition von betroffenen Personen vor. Für den Notfallschutz und zur Abschätzung von radiologischen Konsequenzen ist deshalb wichtig Materialien aus der exponierten Umgebung und Verfahren zu kennen mit denen schnell individuelle Strahlendosen rekonstruiert werden können.
Bestimmte Telefonkarten mit Mikrochips können als individuelle Dosimeter in radiologischen Unfallsituationen verwendet werden zum Nachweis von Strahlendosen über 250 mGy durch Lumineszenz Messungen. Zur Untersuchung der dosimetrischen Eigenschaften wurden Lumineszenz Messungen durchgeführt an Chip Karten aus verschiedenen Produktionsstufen, die von der Fa. INFINIEON bereitgestellt wurden. Der Glob Top, ein Vergussmaterial zum Schutze des Chips wurde als hauptverantwortlich für die Strahlenempfindlichkeit gefunden. Im gegenwärtigen Produktionsverfahren besteht der Glob Top aus SiO2 und Epoxydharz.
Für Untersuchungen zur Verbesserung der dosimetrischen Eigenschaften wurden dem Glob Top bei der Herstellung zusätzlich phosphoreszierenden Substanzen beigemischt. Die hieraus resultierenden Änderungen in der Dosiswirkung und der Nachweisgrenze wurden mit Thermolunineszenz (TL) und infrarot stimulierter Lumineszenz (IRSL) ermittelt.
In Hinblick auf die sich schnell ändernte Chip Karten Produktionstechnologie, wie z.B. die Verwendung von neuen Materialien und die Größe des Glob Top, wurde eine Software entwickelt mit der die in Chip Karten gemessene Dosis in Kerma frei in Luft konvertiert werden kann unter Berücksichtigung der Photonen Energie Wirkung der aktuellen Chip Karte und des Expositions-Szenario. Diese Konversion bildet die Grundlage zur Berechnung von effektiver Dosis und Organdosen.
Es wurde gezeigt, dass durch den Zusatz von phosphoreszierenden Substanzen wie z.B. Al2O3:C, LiF:Cu oder BeO zu dem SiO2/Epoxydharz-Gemisch des Glob Top Materials, die Nachweisgrenze für absorbierte Strahlendosen in Chipkarten auf wenige mGy sinkt. Allerdings sind die vorhandenen Hintergrund-Signale in UV-ausgehärtetem Material und ihre allmähliche Zunahme Einflussfaktoren die weitere Untersuchungen erforderlich machen. Die Anwendbarkeit des vorgeschlagenen Messverfahrens für Chipkarten sollte mit dem aktuellen Material sowie der aktuellen Technologie bald möglichst unter industriellen Produktionsbedingungen getestet werden.
Individuelle Strahlendosen nach Unfallsituationen können alternativ bestimmt werden durch die Ermittlung der absorbierten Dosis in Zahnschmelz durch paramagnetische Elektronenresonanz (EPR) Messungen. Aus der absorbierten Dosis in Zahnschmelz können Effektiv Dosis und Organdosen rekonstruiert werden unter Berücksichtigung der Photonen Energie Wirkung von Zahnschmelz und des Expositions-Szenarios. In dem Projekt wurde die Anwendbarkeit von EPR Messungen erweitert durch die Verringerung der Nachweisgrenze und die
– 6 –
Berechnung der Photenen Energie Wirkung von Milchzähnen durch Monte Carlo Simulation. Dosiskonversionskoeffizienten für Milchzähne wurden in Abhängigkeit der Photonen Energie und der Expositionsgeometrie mit Monte Carlo Simulation mit Verwendung eines mathematischen Kinder-Phantoms berechnet.
Es wurde gezeigt dass die gegenwärtigen Einschränkungen bei EPR Messungen von Zähnen mit geringen Strahlendosen vorwiegend durch die unvollständige Beschreibung des nicht strahlungserzeugten Hintergrund EPR Spektrum bedingt sind. Durch Verbesserung des Entfaltungsverfahrens für das EPR Spektrum von Zahnschmelz konnte die kritische Doses für den Nachweis einer Strahlenexposition des Zahnes auf 19 mGy reduziert werden.
– 7 –
SUMMARY
In areas where radiation dose monitoring has not been performed, it is essential to use material available in the environment be able to rapidly assess doses to individuals for immediate emergency medical care or for general estimation of the radiological consequences.
It was shown that certain types of telephone cards containing microchips have the potential to be used as individual radiation dosimeters in emergency situations to detect doses over 250 mGy by luminescence measurements. In order to understand the dosimetric properties of chip cards, the components obtained from INFINIEON Company at various stages of production were used for luminescence measurements. It is found that the protecting layer used above the chips so called ‘globe top’ is the main source of radiation induced signal in chip cards. The globe top produced by INFINIEON at that stage is found to contain SiO2 and Epoxy.
In order to improve the dosimetric properties of the chip cards, the raw material of the globe top is mixed with phosphorous material. The variation of the dose response and the detection limit with respect to the amount and the type of the phosphor added to the globe top is investigated using thermo luminescence (TL) and infrared stimulated luminescence (IRSL).
Taking into account the rapid changes in chip card producing technology such as material properties, size of the globe top, a special-purpose software tool has been developed to calculate integral free-in-air kerma or organ dose for a given energy dose response of the card and irradiation conditions (photon fluence spectrum and irradiation geometry).
It is also shown that adding phosphors powders such as Al2O3:C, LiF:Cu or BeO to SiO2/epoxy mixture of the globe top material, radiation detection limit of chip cards can be reduced as low as a few mGy but the presence of an initial signal in UV cured material as well as gradual increase of the signal are found to be the main limiting factors for detection of low doses requires further investigation.
Applicability of suggested procedure need to be tested under factory conditions using the latest material and card technology. Feasibility of production of such cards on an industrial scale is discussed.
Alternatively individual dose after emergency situations can be reconstructed by assessment of absorbed dose in human tooth enamel by electron paramagnetic resonance (EPR) measurements. From absorbed dose in tooth enamel the effective dose and dose in organs can be reconstructed in consideration of photon energy response characteristic of teeth, and photon energy spectrum and geometry of the exposure field. In this project the applicability of EPR measurements with teeth was extended by reducing the detection threshold and computation of the photon energy response characteristic of deciduous teeth.
It is shown that current limitation of EPR measurement with teeth at low absorbed dose is caused by incomplete consideration of the EPR spectrum of non-radiation induced (initial) radicals. By adding further components for simulation of the
– 8 –
initial EPR spectrum in the dose evaluation procedure, the critical value for detection of absorbed dose in tooth enamel could be decreased to 19 mGy.
Dose conversion coefficients for deciduous teeth in dependence of photon energy and exposure geometry were computed by Monte Carlo simulation using a mathematical child phantom. For use with luminescence measurements with chip cards and EPR measurements with teeth a software was established that allows conversion of the measured dose to integral free-in-air kerma, tissue dose or dose water in dependence on exposure scenario.
– 9 –
1 INTRODUCTION
There is a growing concern in the public about accidental radiation exposures due to the ageing of the nuclear power industry, illegal dumping of nuclear waste, or terrorist activities which may results in health risks to individuals, such as the accidents in Goiânia (Brazil) and in Tammiku (Estonia) (IAEA 1988, IAEA 1998). In such events, in areas where radiation dose monitoring has not been performed, it is essential to use material available in the environment be able to rapidly assess doses to individuals for immediate emergency medical care or for general estimation of the radiological consequences (Göksu and Bailiff 2006).
Previous research has shown that under ionizing radiation exposure, chip card materials and teeth undergo dose dependent changes in their electronic configuration and consequently provide a basis for retrospective dose assessment (see final reports of BMU funded projects St.Sch. 4223 and St.Sch. 4225). Thermoluminescence (TL), optically stimulated luminescence (OSL) and electron paramagnetic resonance (EPR) spectroscopy are possible methods that can detect the radiation-induced changes in chip cards and teeth. The methods need to be improved and complemented by Monte Carlo simulation calculations in order to extend their applicability in retrospective dosimetry.
The main advantage of a chip card as a personal dosimeter is that at present, almost every individual possesses a chip card, e.g. either in the form of health care identity cards (ID), or as a phone card. In case of an accidental radiation, chip cards can be collected and can be used for the assessment of radiation doses to individuals, e.g. from measurement of their infra-red stimulated luminescence (IRSL).
The application of IRSL using doped syntactic phosphors, i.e. the emission of light from irradiated phosphors observed upon stimulation by photons of proper energy, is a widely used technique in dating archaeological and geological material as well as in dosimetry (Huntley et al. 1985, Hütt and Jaek 1988, Bulur and Göksu 1999). The simplicity of the instrumentation makes the technique attractive for radiation dosimetry purposes using both natural materials such as bricks and porcelain in dose reconstruction following radiation accidents and using synthetic materials such as α-Al2O3:C and BeO in environmental gamma and beta dose assessment and personal monitoring (Bulur et al. 1998, Bulur and Göksu 1998).
It has been observed that a certain type of telephone chip card can be used as radiation detectors for individuals exposed to external gamma doses (Göksu 2003, Göksu at al. 2003, Göksu and Spoettle 2006, Mathur et al. 2006). The radiation dose responses of more than 200 chip-cards, produced by various companies since 1990, were investigated using IRSL. The radiation dose responses of some of the chip-cards were found to be compatible to commonly used synthetic phosphors that are used for routine occupational dose monitoring. The IRSL signal is shown to be linear with radiation dose over 250 mGy to 5 Gy and stable at ambient temperature, which allows the use of such chip cards for reconstruction of doses for individuals.
In this project, the luminescence properties of the individual components of chip cards were investigated in order to identify the source material that is responsible for
– 10 –
the luminescence. Possibilities of improving the dosimetric properties of the chip cards were investigated. The dose response of chip cards in dependence on photon energy was experimentally determined and can be used with the software tool ‘DCF Calculator’ which was established in this project for conversion of the measured dose to integral air kerma, dose to tissue or dose to water in dependence on exposure scenario. The estimated integral air kerma can be converted to organ or effective dose for a given individual using tabulated dose conversion coefficients that are currently available only for adults (ICRP 1996).
Human teeth can be considered as personal dosimeters that are permanently worn. Tooth enamel from permanent teeth and deciduous molars is a reliable biological dosimeter for retrospective detection of exposures by ionizing radiation (IAEA 2002; ICRU 2002; El-Faramawy and Wieser, 2006). The exposure of enamel to ionising radiation generates stable −
2CO radicals from carbonate impurities in enamel, which can be measured by EPR spectroscopy and used to determine the absorbed dose. The lifetime of the radiation induced radicals in enamel is at least 105 times longer than human life expectancy and EPR measurement of tooth enamel provides, therefore, the lifetime individual dose (Schwarcz 1985, Skinner et al. 2000). International intercomparison programmes on EPR tooth dosimetry have confirmed that doses above about 100 mGy can be measured (Wieser et al. 2006a). Absorbed dose in tooth enamel was reconstructed by EPR measurements for survivors of the atomic bomb explosions in Hiroshima and Nagasaki (Nakamura et al. 1998), the general population living close to the Semiplatinsk nuclear test site (Ivannikov et al. 2002), the population exposed by the Chernobyl accident (Chumak et al. 1996; Ivanikov et al. 1997; Skvortsov et al. 2000), residents of the Techa river valley exposed by releases of plutonium production plant Mayak PA in the South Urals (Degteva et al. 2005) and nuclear workers at Mayak PA (Wieser et al. 2006b).
In this project possibilities were investigated to reduce current limitation of EPR measurement with teeth at low absorbed dose in order to extend the applicability. The EPR spectra of only naturally exposed samples and from samples that were additionally exposed in the laboratory were analysed with the objective to identify a most complete set of EPR signal components that can be used for extraction of the dosimetric EPR signal from the total EPR spectrum of tooth enamel. The dose response curves were analysed in dependence on the applied dose evaluation procedure.
The EPR spectroscopy method is capable of assessing the absorbed dose in a given tooth enamel sample. To convert this dose to air kerma free in air or dose in an organ, it is necessary to apply appropriate conversion coefficients. Such coefficients are depending on type, energy and angular properties of the incident radiation as well as on the type and location of the given tooth sample. The dose coefficients for human tooth enamel were investigated both experimentally and by Monte Carlo method for exposure of molars with low-energy x-rays and 60Co gamma-rays in a physical head-sized Plexiglas phantom (Wieser et al. 2002). In an extended range of photon energy from 10 keV to 10 MeV, dose conversion coefficients for permanent teeth of adults were computed by the Monte Carlo method for standard irradiation geometries (Ulanovsky et al. 2005).
– 11 –
Recently, a growing interest to EPR dosimetry of deciduous teeth has created a motivation to study dose coefficients for non-adults. The use of deciduous teeth in EPR dose reconstruction has the unique potential to assess individual doses that were accumulated in the early childhood in the age up to 12 years. It was found previously that deciduous incisors are only of limited use in dose reconstruction but deciduous molars have higher radiation sensitivity and are well suited for reconstruction of low absorbed doses in tooth enamel (El-Faramawy and Wieser, 2006).
In this project, the dose conversion coefficients were computed by Monte Carlo method using a MIRD-like mathematical phantom of 5-year-old child (Ulanovsky and Eckerman, 1998) modified to incorporate tooth regions. The tooth enamel and dentin are treated separately. The dose conversion coefficients are estimated for external exposure to planar, rotational, and isotropic photon sources of energies in the range from 10 keV to 10 MeV.
For validation of the tooth model used in Monte CarIo simulation, deciduous molars were irradiated inside of a simplified phantom representing a child’s cheek and dose conversion coefficients obtained from EPR measurement and Monte Carlo calculation were compared.
The overall motivation of the project was the evaluation of possibilities to reconstruct individual doses after radiation accidents by measurements of the absorbed dose in chip cards and tooth enamel. All procedures, protocols and software tools that were developed in the framework of the project will be made available to BfS for installation.
– 13 –
2 INDIVIDUAL DOSIMETRY
2.1 Individual dosimetry using luminescence
2.1.1 Method of TL and OSL
All non-conducting solids emit light when they are stimulated with heat or light after exposure to ionizing radiation. The light produced during stimulation by heat or light is proportional to the cumulative dose in the material concerned and are called thermoluminescence (TL) or optically stimulated luminescence (OSL).
When ionizing radiation interacts with the material, it knocks out electrons from the atoms. Some of the ionized electrons can return to their original states by emitting light in the process. A small fraction of the ionized electrons are trapped in lattice imperfections of the material. These electrons can stay in these traps for various durations. When these solids are stimulated by heat or light in the laboratory, the trapped electrons are released and are thus able to recombine with other types of lattice imperfections. The energy released during this transition is emitted as visible light which can be detected by sensitive photomultipliers as TL or OSL.
Light emission intensity observed in the laboratory is proportional to the number of trapped electrons; therefore, luminescence dosimetry is based on the correlation between the observed light intensity and absorbed dose in the material.
In general the major requirements of a good dosimetric material for individual dose assessment are a) high sensitivity to radiation dose b) good storage stability, low thermal fading and c) Simple glow or decay curves (i.e. simple trap distribution) which allow the interpretation of the readings to be as simple as possible, without any thermal treatment after irradiation and d) detectors should have a similar photon energy response as the human tissue (Zeff≈7). Physical durability with regard to disturbing environmental factors such as humidity or physical pressure is also important properties.
Taking into account dosimetric requirements for individual dosimetry, the luminescence properties of chip cards available in the market and laboratory produced globe tops are investigated and results are presented in Chapter 3.
2.1.2 Measurement facilities of TL and OSL
TL measurements were performed using two Risø TL/OSL-DA-12 a reader (Bøtter-Jensen et al. 1991) containing a PM tube with a bialkali photocathode (Thorn–EMI 9635QB). The luminescence emission was recorded using optical filter providing emission at the range of λ= 320–650 nm (Schott BG 12). Irradiations were performed using 40 and 15 mCi 90Sr/90Yr beta source.
OSL measurements were performed using an automated Risø TL/OSL-DA-12b reader containing a PM tube with a bialkali photocathode (Thorn–EMI 9635QB) at GSF. Radiation dose response of the chip module was measured using continuous excitation of 32 light emitting IR diodes (λ= 850–950nm). (The excitations performed using this type of light will be referred as (Infrared stimulated Luminescence – IRSL
– 14 –
in this text). The prompt luminescence emission was recorded using broad band visible optical filter providing emission at the range of λ= 320–650 nm (Schott BG 38). During excitation and emission the samples are kept at 140°C. Irradiations were done at room temperature with a 40 mCi 90Sr/90Y beta source.
For the blue stimulated luminescence (BSL) measurements, a Risø TL/OSL-DA-15 with blue LEDs (470 nm) were used for stimulation. Irradiations were done using 40 mCi 90Sr/90Y beta source. All the sources were calibrated with respect to photon source (60Co) using Secondary Standard Dosimetry Laboratory facilities at GSF (Göksu et al. 1995). Luminescence emission is using a detected Hoya U-340 filters (transmission between 290 and 390 nm).
Measurement sequences used in the various stages of the project are described within the text of relevant chapter but the final optimized measurement sequences for TL, IRSL and BSL are described in Annex I-A.
2.2 Individual dosimetry using EPR
2.2.1 Method of EPR
Electron Paramagnetic Resonance (EPR), also known as Electron Spin Resonance (ESR), occurs in materials that possess unpaired electrons in the electronic configuration of their atoms. In an external magnetic field, the energy level of an unpaired electron is splitting according to the orientation of its magnetic moment. By exposure with microwave radiation of appropriate frequency transitions of electrons in different energy levels are induced under resonant absorption of microwave energy.
Exposure with ionising radiation of the carbonate lattice of bones and teeth is generating long lived radicals with unpaired electrons which can be detected by EPR. The EPR absorption is proportional to the extent of radiation exposure and allows the assessment of absorbed dose. Human tooth enamel is a reliable biological dosimeter for retrospective assessment of individual radiation doses (IAEA 2002, ICRU 2002).
The applicability of tooth enamel for detection of ionising radiation is known since almost 40 years (Brady et al., 1968). The radiosensitive compound in tooth enamel is hydroxyapatite, which constitutes approximately 96% by mass (Driessens and Verbeeck, 1990). The exposure of enamel to ionising radiation generates stable
−2CO radicals from carbonate impurities, which are attached to or incorporated into
hydroxyapatite crystals during formation (Moens et al., 1993). The concentration of −2CO radicals can be measured by EPR spectroscopy and used to determine the
absorbed dose in tooth enamel. According to current knowledge the radicals are generated by all kinds of ionising radiations (Ikeya 1993, Copeland et al. 1996, Stuglik and Sadlo 1996, Zdravkova et al. 2002, Fattibene et al. 2003) and UV-C light (Liidja et al. 1996, Ivannikov et al. 1997, Nilsson et al. 2001). In fossil tooth enamel a lifetime of at least 109 years at 25°C was determined (Schwarcz 1985, Skinner at al. 2000). Tooth enamel from full-grown permanent teeth does not undergo remodelling
– 15 –
like bone or dentine and therefore, can detect radiation exposures independent of time post exposure.
A tooth consists of tooth enamel in the crown of tooth and dentine contained below the crown and in the root of tooth. The root is covered by thin layer of tooth cement, which is available only in small amount and is not applicable for dosimetry. Dentine may be used in some cases for dose reconstruction. In contrast to tooth enamel, in the living tooth dentine will be permanently remodelled. Therefore, dentine can be used for dosimetry only short time after exposure. Dentine contains by about 30 weight-% organic components that increases the detection threshold for absorbed dose about ten times. Dose reconstruction at low absorbed dose is only possible with tooth enamel from which the attached dentine was completely removed.
At EPR measurement the intensity of microwave absorption is measured in dependence of the magnetic field strength. EPR spectrometers are usually equipped with ‚Lock-in amplifiers’ for noise reduction. This type of amplifier is recording the first derivative of microwave absorption versus magnetic field strengths, which is the typical presentation of EPR spectra. The first derivative of microwave absorption will be called EPR intensity in the following. The difference between maximal and minimal intensity of a resonance signal will be called EPR amplitude. The difference in magnetic field strengths at minimal and maximum intensity will be called peak-to-peak line width. The analysis of EPR spectra is performed after conversion of the quantity of magnetic field strength, H, to the quantity Landé-factor, g. Both quantities are connected by the following relation:
H
hgβν
= (2.1)
with Planck Constant, h, Bohr Magneton, β, and microwave frequency, ν. The position of an EPR signal in the spectrum, at a certain g-value is characteristic for a specific radical. Further characteristic parameters of an EPR signal are its symmetry (isotrope, axial or rhombic), line shape (Gaussian or Lorentzian) and line width. Due to these parameters an EPR signal can be attributed to a certain radical.
The EPR spectrum of tooth enamel consist of an EPR signal from −2CO
radicals which is used for dosimetry, and further EPR signals from various additional radicals which exist intrinsically in tooth enamel and are not useful for dosimetry. These additional radicals are referred as background radicals. Their origin is currently unknown; it is assumed that they are included in the organic component of tooth enamel. The concentration of background radicals is limiting the detection threshold of −
2CO radicals. The EPR signals of background and −2CO radicals are
interfering and complicate precise measurement of intensity of the EPR signal from intensity of −
2CO radicals, especially for absorbed dose below 500 mGy. Especially in this dose range the application of appropriate procedures is required for deconvolution of EPR spectra.
– 16 –
2.2.2 Measurement facilities of EPR
EPR measurements were performed with an spectrometer of the type Typ Bruker ECS 106. It is equipped with a X-band microwave bridge (microwave generator) of the type ER 041 XG, a microwave resonator of the type 4108 TMH and a 6-inch magnet of the type ER 070. The spectrometer is operating with X-band microwaves in the frequency range 9–10 GHz. The microwave bridge is capable to provide a maximal microwave power of 200 mW. The Lock-in amplifier of the signal channel is operating with a fixed magnetic field modulation frequency of 50 kHz. The EPR measurements of this project were performed using magnetic field modulation amplitude of 0.15 mT. At each measurement 40 single EPR spectra were accumulated. The analogue EPR signal was filtered with a low-pass filter with time constant of 164 ms, followed by analogue-to-digital conversion (ADC) in 1024 channels with conversion time of 82 ms. The resulting total measurement time was 56 minutes. At each measurement the magnetic field was swept over 5 mT with a central magnetic field strength of about 350 mT. Measurements were done with microwave frequency of about 9.8 GHz and microwave power of 25 mW.
2.3 Monte Carlo Simulations of photon energy response of deciduous teeth
The dose conversion coefficients have been computed by Monte Carlo simulation of radiation transport in the human body by using MCNP4 code (MCNP (2000)). Simulations have been performed for the photon sources of the following geometries: AP (antero-posterior), PA (postero-anterior), RLAT/LLAT (right/left lateral), ROT (rotational), and ISO (isotropic). The first three sources are unidirectional planar sources incident to the phantom from the front, back, and right sides, correspondingly. Due to apparent symmetry of the phantom, the LLAT (left lateral) source has not been considered. The other two sources (ROT and ISO) are radiation field isotropic in horizontal plane and in space, correspondingly.
A coupled electron-photon transport has been considered inside the phantom. The DCC for enamel has been calculated as analogue scoring of energy deposition events in the tooth cells. A direct analogue simulation of the tooth DCC is computationally inefficient due to small volumes of the target enamel cells and large spatial extensions of the considered sources. Therefore, photons from the unidirectional planar sources (AP, PA, and RLAT) have been uniformly sampled within a circle of 15-cm-radius centred against the teeth region and covering the whole head and upper trunk and shoulders of the phantom. For the ISO source, it was sufficient to exploit a standard technique as described in the MCNP4 Manual, namely, the ISO source has been simulated as an inward-directed cosine source on the surface of a sphere of 64-cm-radius around the phantom. The ROT source was simulated using source importance sampling (source biasing) technique. For this, a user-defined source subroutine has been prepared to specify parameters of source photons for MCNP4. For this, a source biasing technique described in (Ulanovsky et
– 17 –
al. 2005) has been implemented. Photons have been started from the vertical cylinder around phantom inward-directed. Their directions are isotropic in horizontal plane and all photons are started parallel to (x,y)-plane. Sampling bias has been selected along the z-axis. The source particles were preferentially sampled close to mid-height of the tooth region. The sampling bias has been compensated by an appropriate adjustment of the source particle weight.
Dose conversion coefficients are calculated using radiation sources regarded as standard in radiation protection practice (ICRP 1996). The standard sources have pre-defined angular properties of the emitted radiations (source geometry) and dose responses to such sources are specific for the given geometries. The present study is limited to photon sources, only.
Consider monoenergetic ( 0EE = ) photon source with pre-defined exposure geometry, irradiating a target object. If the target does not disturb the radiation field then the photon fluence, Φ , created by the source is uniform and independent on spatial co-ordinates
( ) ( )00, EEr Φ=Φ . (2.2) A dose conversion coefficient can be defined in different ways. One definition,
which is more convenient in radiation transport calculations, expresses the dose coefficient as absorbed dose in a target object, ( )0ED , per source particle fluence, ( )0EΦ :
( ) ( )( )0
00 E
EDECf Φ
= , (2.3)
where index “f” indicates the coefficient is defined through the fluence. The dose, given an arbitrary energy distribution of fluence, is given as
( ) ( )∫ Φ=E
f dEEECD ''' , (2.4)
or, if the fluence rate, ( ) ( )dt
EdtE Φ=,φ , and coefficients, ( )tECf , , are not stationary, as follows
( ) ( )∫ ∫=ET
f dEdttEtECD ',',' φ . (2.5)
In the present report, however, the dose conversion coefficients are considered time-independent as applicable to occupational exposure of adult professionals. Thus, eqn (2.5) reduces to the eqn (2.4).
Assessment of the incident particle fluence is straightforward in radiation transport calculations by Monte Carlo method. However, in most practical applications radiation sources cannot be assumed monoenergetic and the fluence of source particles is not directly measured. It is usual in practice that only integral quantities, like exposure or absorbed dose in air, are measured. That is, eqn (2.3) has to be redefined to include the quantities used in practice.
Taking into account definition of free-in-air photon kerma (see e.g. (ICRU 1992, Section A.2.1))
( ) ( ) ( ) ( ) ( )000000 EEkEEEEK tratr Φ=Φ= ρ
μ , (2.6)
– 18 –
where ( )0Etrρμ is a mass-energy transfer factor (cm2 g-1), then the fluence for
monoenergetic radiation can be expressed via air kerma
( ) ( )( )0
00 Ek
EKE
tr
a=Φ . (2.7)
Substituting now eqn (2.7) into eqn (2.3), one can obtain ( ) ( ) ( )000 ECEkEC ktrf = , (2.8)
where
( ) ( )( )0
00 EK
EDEC
ak = (2.9)
is a definition of dose conversion coefficients for external irradiation adopted by ICRP (1996). Index “k” indicates kerma-based definition of the dose coefficients.
Consider now integral quantities: kerma free-in-air, Ka, absorbed dose in an organ of the human body, DG, and absorbed dose for the tooth enamel, DT. From the Eqs. (2.4), (2.6), and (2.8) above it follows
( ) ( )∫ Φ=E
tra dEEEkK ''' , (2.10)
( ) ( ) ( )∫ Φ=E
trTkT dEEEkECD '''', , and (2.11)
( ) ( ) ( )∫ Φ=E
trGkG dEEEkECD '''', , (2.12)
where Ck,T and Ck,G are dose conversion coefficients for the tooth enamel and the organ, respectively.
Assume now the tooth dose is measured by the EPR-method, i.e. the teeth dose is known: measT DD = . Then, from Eqs. (2.10) – (2.12), it follows the way to calculate integral air kerma and organ (or effective) dose given the Dmeas:
( ) ( )( ) ( ) ( )∫
∫Φ
Φ=
E trTk
E trmeasa dEEEkEC
dEEEkDK
'''''''
,, (2.13)
( ) ( ) ( )( ) ( ) ( )∫
∫Φ
Φ=
E trTk
E trGkmeasG dEEEkEC
dEEEkECDD
''''''''
,
, . (2.14)
The values of ktr can be computed from tabulated mass-energy transfer factors (see e.g. (ICRU 1992) and (Hubbell and Seltzer, 1995)), the values of Ck,G are tabulated in (ICRP 1996), and the values of Ck,T for adults are derived in (Ulanovsky et al. 2005) and for children computed and presented in this report. The energy spectrum of incident radiation (energy-dependent fluence) and irradiation geometry (i.e. angular properties of the source) are problem-specific values and have to be determined or implied depending on the specific dose reconstruction problem.
The technique described in the above subsection can be also applied to absorbed doses measured with chip cards. As follows from eqn. (2.10)–(2.12), the key issue is to know so-called ‘dose response’, i.e. energy-dependent ratio of the absorbed dose in the dosimeter to kerma (or absorbed dose) in free air. If the dose response is known for specific geometry and spectrum of the photon source, then a
– 19 –
conversion can be performed in the same way as described for the absorbed dose in the human teeth obtained by means of EPR-spectra analysis.
2.4 Experimental evaluation of photon energy response of chip cards
The photon energy dose response is one of the important characteristics of a material to be used as individual dosimeters. A luminescent phosphor such as LiF(Zeff = 8.1) or BeO (Zeff = 7.13) having an effective atomic number rather similar to that of human tissue (Zeff = 7.4) are considered to be a tissue equivalent material. LiF is at present is one of the most widely used phosphors for detection of doses for occupationally exposed persons (Göksu et al. 1994 a,b).
The mass energy absorption coefficient is dependent upon the energy loss processes occurring during pair production, Compton scattering and photoelectric interactions. The extent to which each process takes place depends upon the energy of the absorbed radiation, the isotopic composition and the atomic number of the target material. In general, energy loss of the photons in the material occurs mainly through secondary effects i.e. through electrons and is directly proportional to Zeff n where n depends on the type of interactions occurring and varies between 1–5. This means that materials with similar Zeff will have similar mass absorption coefficients.
When a compound of a phosphor is exposed to photons with low energy photons it is often observed that the luminescence output for a given dose is higher than for photons with a higher energy. The energy dependent response S(E) is defined as the ratio of the mass energy absorption coefficient for the phosphor μen / ρ to the mass-energy absorption coefficient of a reference material (such as air):
1
)()(−
⎟⎟⎠
⎞⎜⎜⎝
⎛×⎟⎟
⎠
⎞⎜⎜⎝
⎛×⎟⎟
⎠
⎞⎜⎜⎝
⎛= EES
air
en
phosphor
en ηρμ
ρμ . (2.15)
where 0(E) is the relative luminescence response (the energy-dependent relative luminescence production efficiency) and usually normalized to the luminescence efficiency at 1.25 MeV (the mean energy of the photons emitted from 60Co source).
The photon energy response of a phosphor is often defined with respect to the response from a given energy, which is a measure of the average fractional amount of incident photon energy transfer to kinetic energy of charged particles. Thus this imparted charged particle kinetic energy is a measure of the amount of energy made available for the production of luminescence. It should be emphasized here that luminescence efficiency 0(E) can also be different than 1.
At 30 keV the over response of Al2O3:C is found to be a factor of 2,57 higher than at 1,25 MeV photons, that is, lower than the expected energy response based on the value of the mass energy absorption coefficient. Similar to the other TL materials such as CaF2, LiF:Mg, Cu, and P, the difference may be explained in terms of saturation of the dose response curve coupled with microdosimetric dose distribution for the various photon energies suggesting values other than 1 for 0(E) (Taranenko et al. 2004; Olko et al. 2006).
– 20 –
Knowledge of the energy response of chip cards is one of the essential properties of that would allow them to be used as individual dosimeters. The other major requirements of a good dosimetric material for environmental dose rate assessment can be summarized as follows:
• High radiation sensitivity. • Low detection limit. • Stability at ambient temperatures. • Simple glow or decay curves (i.e. simple trap distribution) which allow the
interpretation of the readings to be as simple as possible, without any thermal treatment after irradiation.
• Compatible photon energy response: luminescent phosphor should have a similar photon energy response as tissue
• Physical durability with regard to disturbing environmental factors such as humidity or physical pressure.
• Low self dose (exposure from internal radionuclide in the material). Taking into account the rapid changes in chip card producing technology such
as material properties, size of the globe top, it was essential to know individually the RER of each product. The card obtained from INFINEON (Module 4) is used to determine the RER of chip card with known composition as described in Section 3.3. A software tool as described below is developed in this project and used to calculate integral air kerma (dose in air/organ) from the luminescence measurements (Annex II).
2.5 Software tool for dose conversion to air kerma
The readings of chip cards (TL/IRSL) and teeth (EPR), provided with appropriate calibration data, can be converted to organ doses and to integral air kerma in the exposure places. The conversion factors can be derived from eqns (2.10) – (2.12) assuming that the absorbed dose in tooth enamel or chip card is evaluated using EPR or TL/IRSL methods: IRSLTLEPRT DD −−= . Then, the integral air kerma Ka and the organ (or effective) dose DG are expressed through the measured tooth enamel or chip card dose:
( ) ( )( ) ( ) ( )∫
∫Φ
Φ== −−
E trTk
E traIRSLTLEPRaa dEEEkEC
dEEEkcDcK
'''''''
where,,
(2.15)
( ) ( ) ( )( ) ( ) ( )∫
∫Φ
Φ== −−
E trTk
E trGkGIRSLTLEPRGG dEEEkEC
dEEEkECcDcD
''''''''
where,,
, (2.16)
It follows from eqns (2.15) and (2.16) that the conversion factors, ca and cG, depend on the energy distribution of photon fluence (photon spectrum) specific to a given exposure place as well as on irradiation geometry and location of the tooth sample or chip card. In other words, if the tooth enamel or chip card is regarded as individual ‘dosimeter’ then it must be remembered that this ‘dosimeter’ has non-linear
– 21 –
energy response; thus any conversion of tooth or chip card absorbed dose to integral air kerma or organ doses must account for energy distribution of the photon fluence.

– 22 –
– 23 –
3 CHIP CARDS
3.1 Measurements of luminescence properties of the component of chip cards
It is reported that (Göksu 2003; Göksu et al. 2003) some telephone chip cards possess luminescence properties that are suitable for use as individual dosemeters. Luminescence intensity is found to increase linearly between 250 mGy to 5 Gy. In some cases a large initial signal (zero dose signals) is observed that could be removed after heating to 250°C.
Luminescence properties over 200 cards produced in last 10 years were investigated and found that each product exhibit different luminescence characteristics. In general, chips covered with clear transparent globe top usually gave a very good linear response if they were cured with heat. The chips covered with black epoxy and cured with UV light, found to have a large initial signal but no radiation dose response at low doses.
In order to understand the differences in luminescence properties of variety of products available in the market, a non disclosure agreement signed between GSF and INFINEON to obtain series of products produced under control conditions with a known composition.
The luminescence studies are aimed to find out the component that is responsible for radiation response in chip cards as well as to find out the presence of initial signal that are observed in some chip cards.
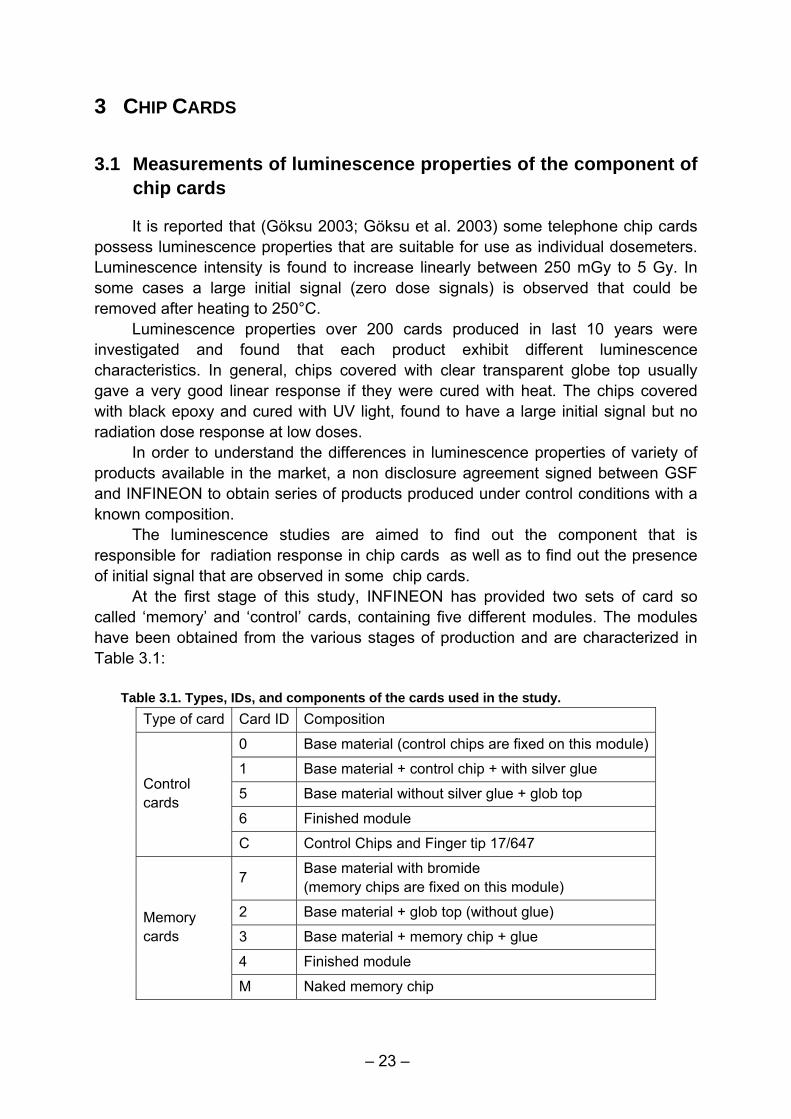
At the first stage of this study, INFINEON has provided two sets of card so called ‘memory’ and ‘control’ cards, containing five different modules. The modules have been obtained from the various stages of production and are characterized in Table 3.1:
Table 3.1. Types, IDs, and components of the cards used in the study.
Type of card Card ID Composition
0 Base material (control chips are fixed on this module)
1 Base material + control chip + with silver glue
5 Base material without silver glue + glob top
6 Finished module
Control cards
C Control Chips and Finger tip 17/647
7 Base material with bromide (memory chips are fixed on this module)
2 Base material + glob top (without glue)
3 Base material + memory chip + glue
4 Finished module
Memory cards
M Naked memory chip
– 24 –
It was quickly realized that the chip card production is a very fast developing technology; therefore, it was essential to have an access to the latest products from INFINEON.
At the second stage of this project, INFINEON provided latest model of chip cards called ‘flip chips’ where the chips are mounted on strips up side down with a small amount of glue containing SiO2 but without globe top.
The radiation dose response of all the modules and strips and flip chip cards are also measured using thermoluminescence (TL), infrared (IRSL) and blue stimulated (BSL) luminescence are described below using the methodology described in chapter 2 and Annex I. The results of the investigations are summarised below.
3.1.1 Experimental results and discussions
a) Memory and control cards It is observed that a naked card (i.e. Module M and C), similar to wafers
(obtained from Siemens) is not sensitive to radiation to produce luminescence signal. TL and IRSL emission is found to increase linearly with dose for Module 5 and 6
of the control cards and Modules 2 and 4 of the memory cards (Fig. 3.1), thus leading to a conclusion that the globe top is the component responsible for radiation induced signal. The measurements were performed after heating the modules to 225°C in 50 sec. (For details of luminescence measurement procedures see Section A in the Annex I).
Modules 0, 1 and 3 and 7 exhibited no radiation induced effects but a very strong initial signal (zero dose signals) that could be eliminated after heating to 250°C. Module No. 7 however exhibit an increase with radiation dose only above 7 Gy.
Modules 2, 4, 5, 6 all having a globe top are also found to have a substantially high initial zero signals but this signal could be eliminated after heating to 225°C.
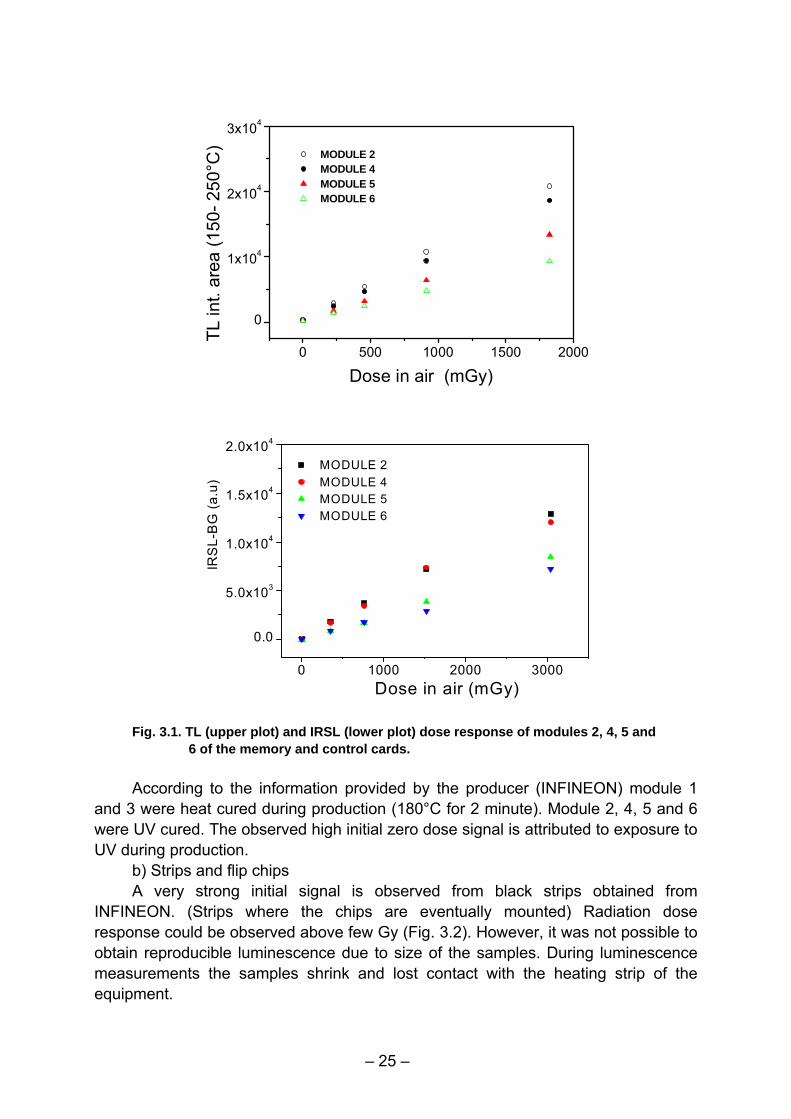
– 25 –
0 500 1000 1500 2000
0
1x10⁴
2x10⁴
3x10⁴
MODULE 2 MODULE 4 MODULE 5 MODULE 6
TL in
t. ar
ea (1
50- 2
50°C
)
Dose in air (mGy)
0 1000 2000 3000
0.0
5.0x10³
1.0x10⁴
1.5x10⁴
2.0x10⁴
IRS
L-B
G (a
.u)
Dose in air (mGy)
MODULE 2 MODULE 4 MODULE 5 MODULE 6
Fig. 3.1. TL (upper plot) and IRSL (lower plot) dose response of modules 2, 4, 5 and
6 of the memory and control cards. According to the information provided by the producer (INFINEON) module 1
and 3 were heat cured during production (180°C for 2 minute). Module 2, 4, 5 and 6 were UV cured. The observed high initial zero dose signal is attributed to exposure to UV during production.
b) Strips and flip chips A very strong initial signal is observed from black strips obtained from
INFINEON. (Strips where the chips are eventually mounted) Radiation dose response could be observed above few Gy (Fig. 3.2). However, it was not possible to obtain reproducible luminescence due to size of the samples. During luminescence measurements the samples shrink and lost contact with the heating strip of the equipment.
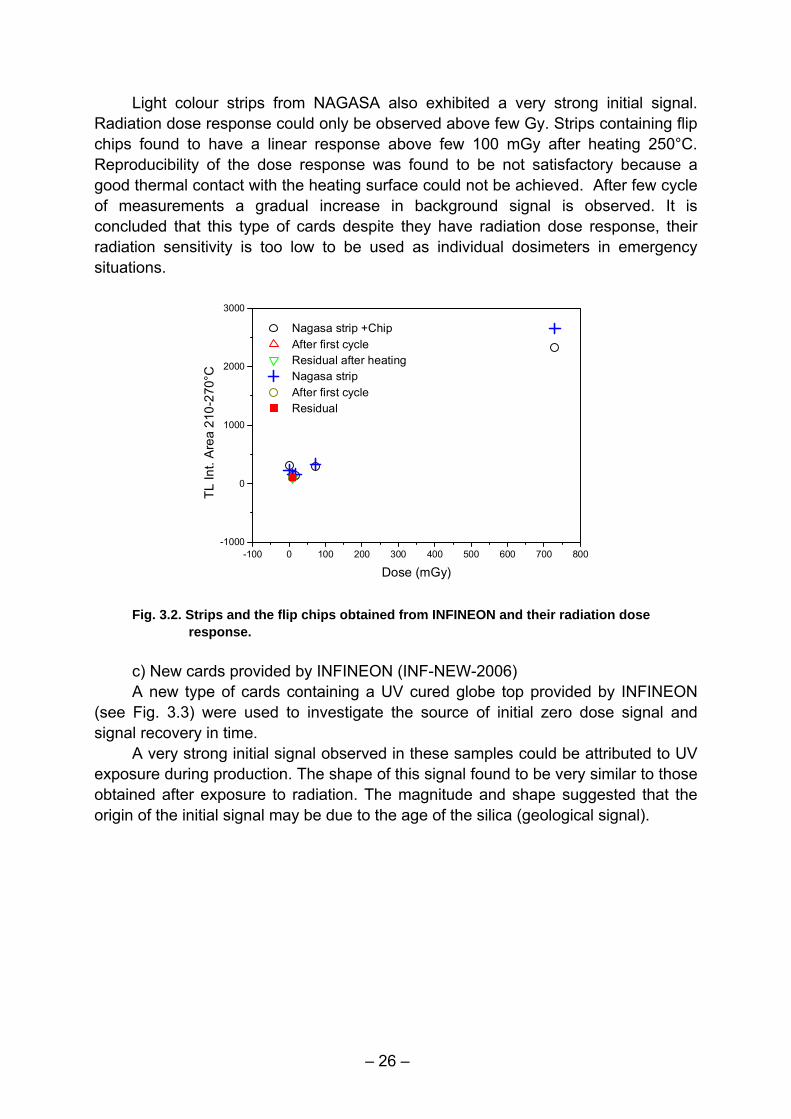
– 26 –
Light colour strips from NAGASA also exhibited a very strong initial signal. Radiation dose response could only be observed above few Gy. Strips containing flip chips found to have a linear response above few 100 mGy after heating 250°C. Reproducibility of the dose response was found to be not satisfactory because a good thermal contact with the heating surface could not be achieved. After few cycle of measurements a gradual increase in background signal is observed. It is concluded that this type of cards despite they have radiation dose response, their radiation sensitivity is too low to be used as individual dosimeters in emergency situations.
-100 0 100 200 300 400 500 600 700 800-1000
0
1000
2000
3000
Nagasa strip +Chip After first cycle Residual after heating Nagasa strip After first cycle Residual
TL In
t. A
rea
210-
270°
C
Dose (mGy)
Fig. 3.2. Strips and the flip chips obtained from INFINEON and their radiation dose
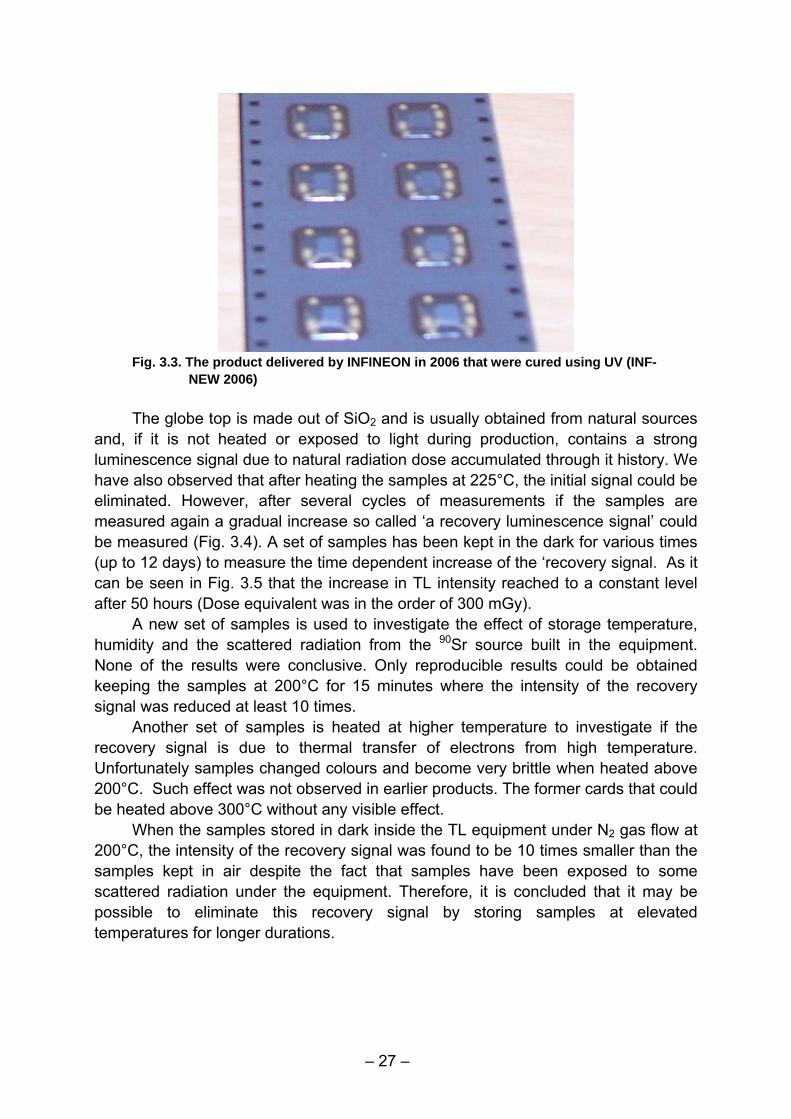
response. c) New cards provided by INFINEON (INF-NEW-2006) A new type of cards containing a UV cured globe top provided by INFINEON
(see Fig. 3.3) were used to investigate the source of initial zero dose signal and signal recovery in time.
A very strong initial signal observed in these samples could be attributed to UV exposure during production. The shape of this signal found to be very similar to those obtained after exposure to radiation. The magnitude and shape suggested that the origin of the initial signal may be due to the age of the silica (geological signal).
– 27 –
Fig. 3.3. The product delivered by INFINEON in 2006 that were cured using UV (INF-
NEW 2006) The globe top is made out of SiO2 and is usually obtained from natural sources
and, if it is not heated or exposed to light during production, contains a strong luminescence signal due to natural radiation dose accumulated through it history. We have also observed that after heating the samples at 225°C, the initial signal could be eliminated. However, after several cycles of measurements if the samples are measured again a gradual increase so called ‘a recovery luminescence signal’ could be measured (Fig. 3.4). A set of samples has been kept in the dark for various times (up to 12 days) to measure the time dependent increase of the ‘recovery signal. As it can be seen in Fig. 3.5 that the increase in TL intensity reached to a constant level after 50 hours (Dose equivalent was in the order of 300 mGy).
A new set of samples is used to investigate the effect of storage temperature, humidity and the scattered radiation from the 90Sr source built in the equipment. None of the results were conclusive. Only reproducible results could be obtained keeping the samples at 200°C for 15 minutes where the intensity of the recovery signal was reduced at least 10 times.
Another set of samples is heated at higher temperature to investigate if the recovery signal is due to thermal transfer of electrons from high temperature. Unfortunately samples changed colours and become very brittle when heated above 200°C. Such effect was not observed in earlier products. The former cards that could be heated above 300°C without any visible effect.
When the samples stored in dark inside the TL equipment under N2 gas flow at 200°C, the intensity of the recovery signal was found to be 10 times smaller than the samples kept in air despite the fact that samples have been exposed to some scattered radiation under the equipment. Therefore, it is concluded that it may be possible to eliminate this recovery signal by storing samples at elevated temperatures for longer durations.
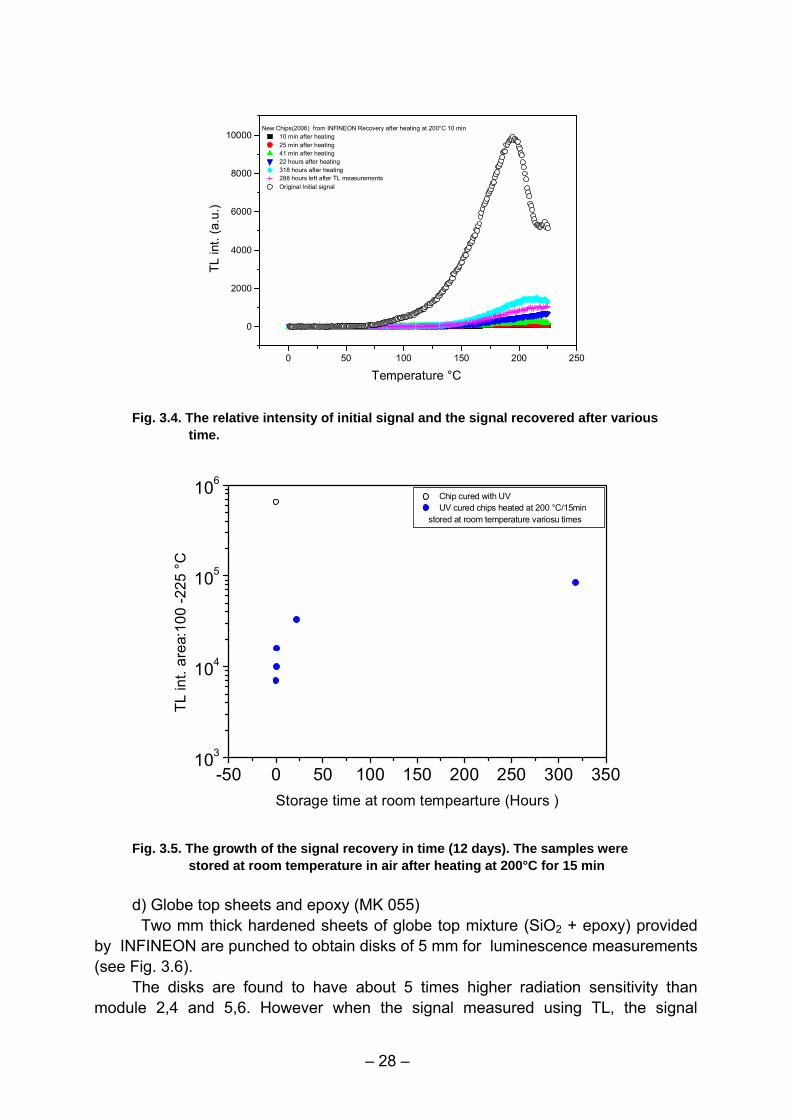
– 28 –
0 50 100 150 200 250
0
2000
4000
6000
8000
10000New Chips(2006) from INFINEON Recovery after heating at 200°C 10 min
10 min after heating 25 min after heating 41 min after heating 22 hours after heating 318 hours after heating 288 hours left after TL measurements Original Initial signal
TL in
t. (a
.u.)
Temperature °C
Fig. 3.4. The relative intensity of initial signal and the signal recovered after various
time.
-50 0 50 100 150 200 250 300 350103
104
105
106 Chip cured with UV UV cured chips heated at 200 °C/15min
stored at room temperature variosu times
TL in
t. ar
ea:1
00 -2
25 °
C
Storage time at room tempearture (Hours )
Fig. 3.5. The growth of the signal recovery in time (12 days). The samples were
stored at room temperature in air after heating at 200°C for 15 min d) Globe top sheets and epoxy (MK 055) Two mm thick hardened sheets of globe top mixture (SiO2 + epoxy) provided
by INFINEON are punched to obtain disks of 5 mm for luminescence measurements (see Fig. 3.6).
The disks are found to have about 5 times higher radiation sensitivity than module 2,4 and 5,6. However when the signal measured using TL, the signal
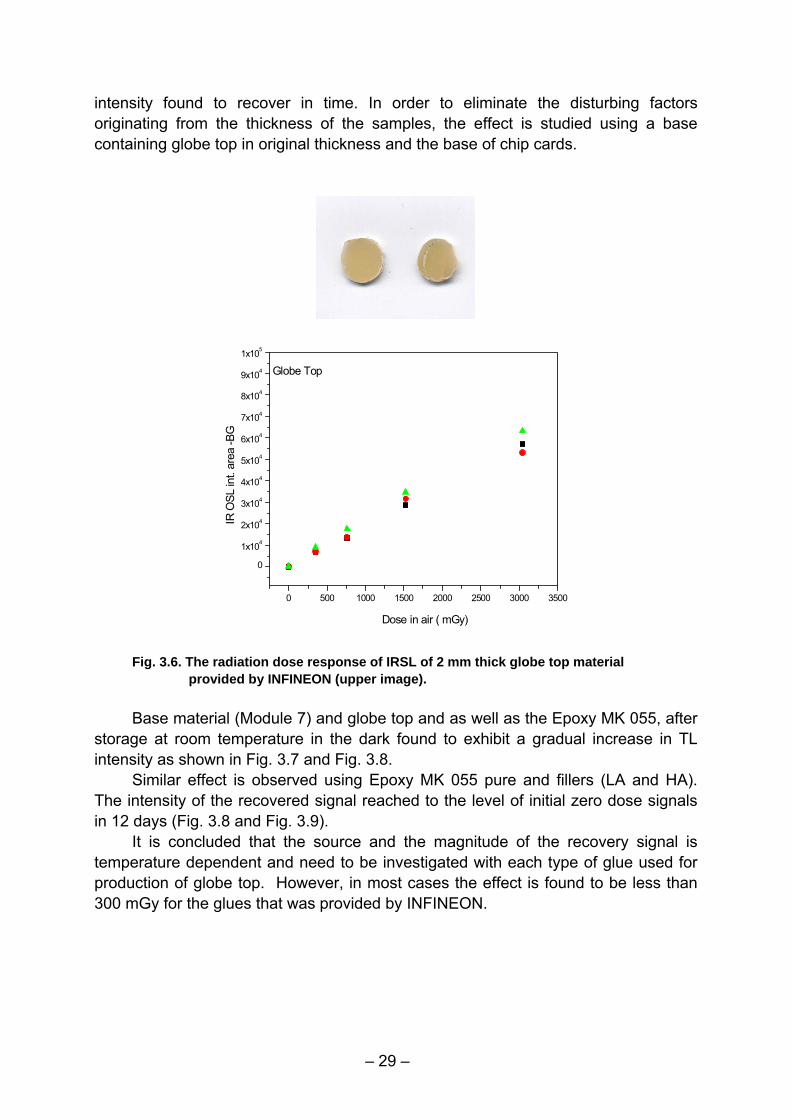
– 29 –
intensity found to recover in time. In order to eliminate the disturbing factors originating from the thickness of the samples, the effect is studied using a base containing globe top in original thickness and the base of chip cards.
0 500 1000 1500 2000 2500 3000 3500
0
1x10⁴
2x10⁴
3x10⁴
4x10⁴
5x10⁴
6x10⁴
7x10⁴
8x10⁴
9x10⁴
1x10⁵
IR O
SL in
t. ar
ea -B
G
Dose in air ( mGy)
Globe Top
Fig. 3.6. The radiation dose response of IRSL of 2 mm thick globe top material
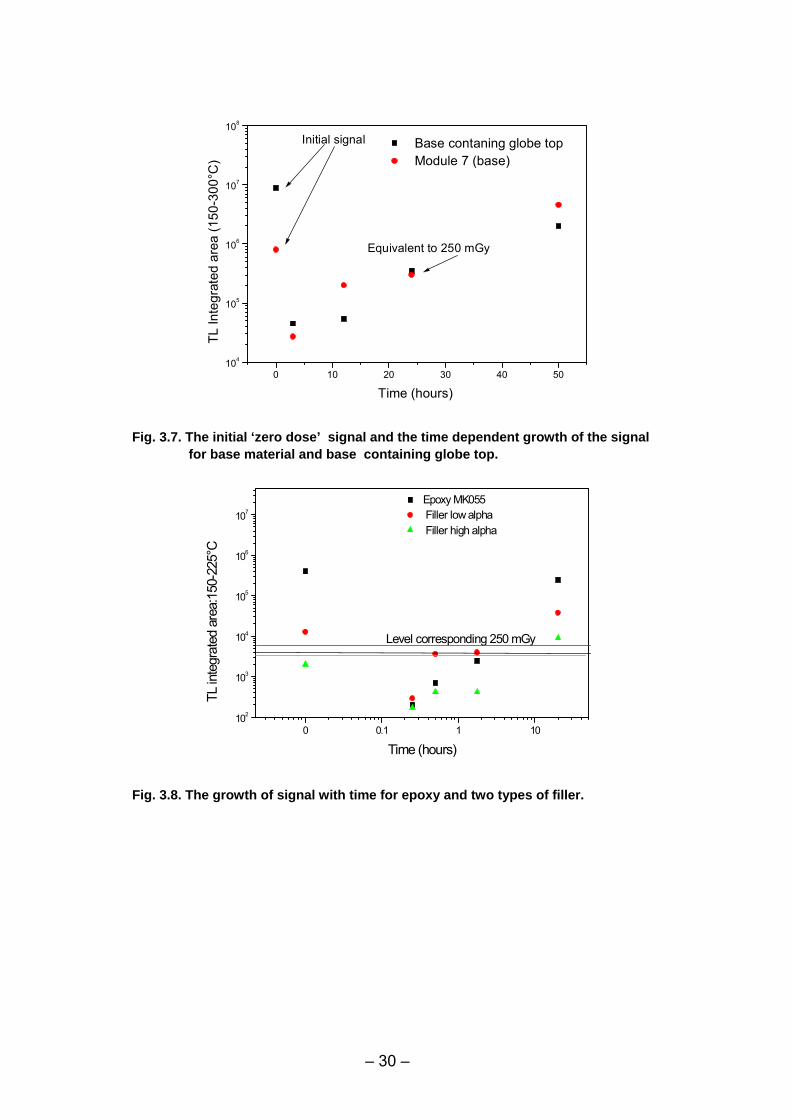
provided by INFINEON (upper image). Base material (Module 7) and globe top and as well as the Epoxy MK 055, after
storage at room temperature in the dark found to exhibit a gradual increase in TL intensity as shown in Fig. 3.7 and Fig. 3.8.
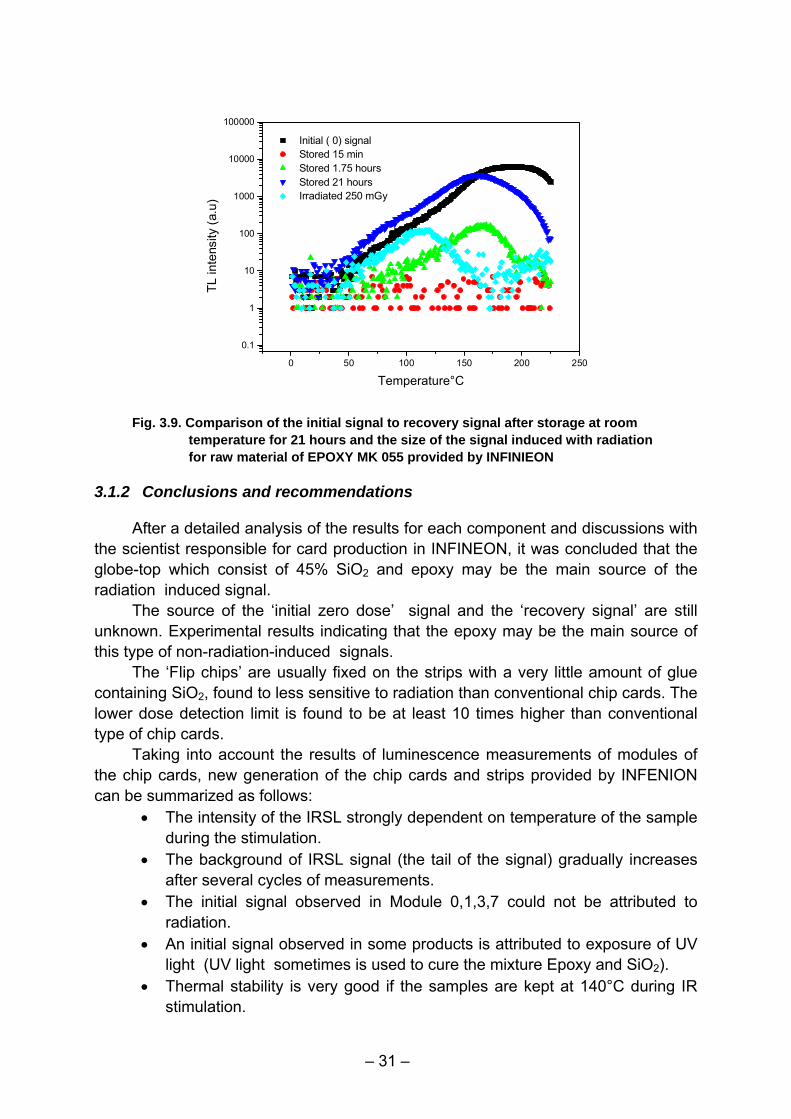
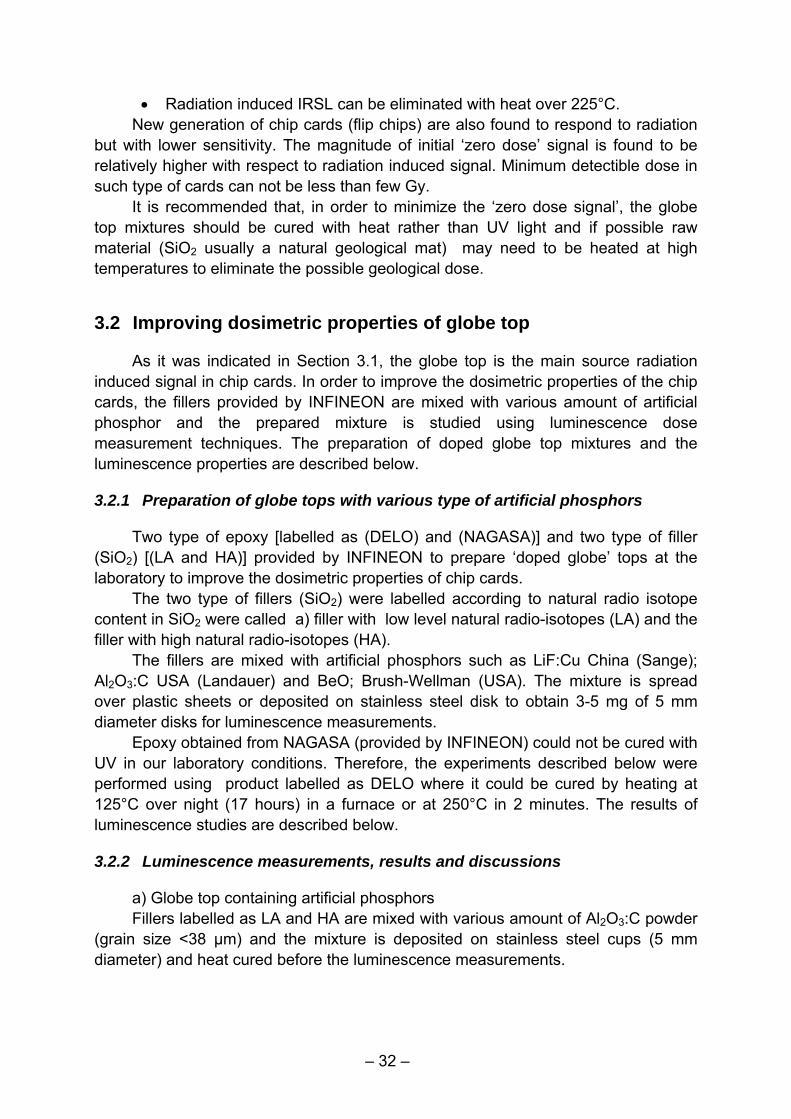
Similar effect is observed using Epoxy MK 055 pure and fillers (LA and HA). The intensity of the recovered signal reached to the level of initial zero dose signals in 12 days (Fig. 3.8 and Fig. 3.9).
It is concluded that the source and the magnitude of the recovery signal is temperature dependent and need to be investigated with each type of glue used for production of globe top. However, in most cases the effect is found to be less than 300 mGy for the glues that was provided by INFINEON.
– 30 –
0 10 20 30 40 50104
105
106
107
108
Initial signal
Equivalent to 250 mGy
Base contaning globe top Module 7 (base)
TL In
tegr
ated
are
a (1
50-3
00°C
)
Time (hours)
Fig. 3.7. The initial ‘zero dose’ signal and the time dependent growth of the signal
for base material and base containing globe top.
0 0.1 1 10102
103
104
105
106
107
Level corresponding 250 mGy
Epoxy MK055 Filler low alpha Filler high alpha
TL in
tegr
ated
are
a:15
0-22
5°C
Time (hours)
Fig. 3.8. The growth of signal with time for epoxy and two types of filler.
– 31 –
0 50 100 150 200 250
0.1
1
10
100
1000
10000
100000
Initial ( 0) signal Stored 15 min Stored 1.75 hours Stored 21 hours Irradiated 250 mGy
TL in
tens
ity (a
.u)
Temperature°C
Fig. 3.9. Comparison of the initial signal to recovery signal after storage at room
temperature for 21 hours and the size of the signal induced with radiation for raw material of EPOXY MK 055 provided by INFINIEON
3.1.2 Conclusions and recommendations
After a detailed analysis of the results for each component and discussions with the scientist responsible for card production in INFINEON, it was concluded that the globe-top which consist of 45% SiO2 and epoxy may be the main source of the radiation induced signal.
The source of the ‘initial zero dose’ signal and the ‘recovery signal’ are still unknown. Experimental results indicating that the epoxy may be the main source of this type of non-radiation-induced signals.
The ‘Flip chips’ are usually fixed on the strips with a very little amount of glue containing SiO2, found to less sensitive to radiation than conventional chip cards. The lower dose detection limit is found to be at least 10 times higher than conventional type of chip cards.
Taking into account the results of luminescence measurements of modules of the chip cards, new generation of the chip cards and strips provided by INFENION can be summarized as follows:
• The intensity of the IRSL strongly dependent on temperature of the sample during the stimulation.
• The background of IRSL signal (the tail of the signal) gradually increases after several cycles of measurements.
• The initial signal observed in Module 0,1,3,7 could not be attributed to radiation.
• An initial signal observed in some products is attributed to exposure of UV light (UV light sometimes is used to cure the mixture Epoxy and SiO2).
• Thermal stability is very good if the samples are kept at 140°C during IR stimulation.
– 32 –
• Radiation induced IRSL can be eliminated with heat over 225°C. New generation of chip cards (flip chips) are also found to respond to radiation
but with lower sensitivity. The magnitude of initial ‘zero dose’ signal is found to be relatively higher with respect to radiation induced signal. Minimum detectible dose in such type of cards can not be less than few Gy.
It is recommended that, in order to minimize the ‘zero dose signal’, the globe top mixtures should be cured with heat rather than UV light and if possible raw material (SiO2 usually a natural geological mat) may need to be heated at high temperatures to eliminate the possible geological dose.
3.2 Improving dosimetric properties of globe top
As it was indicated in Section 3.1, the globe top is the main source radiation induced signal in chip cards. In order to improve the dosimetric properties of the chip cards, the fillers provided by INFINEON are mixed with various amount of artificial phosphor and the prepared mixture is studied using luminescence dose measurement techniques. The preparation of doped globe top mixtures and the luminescence properties are described below.
3.2.1 Preparation of globe tops with various type of artificial phosphors
Two type of epoxy [labelled as (DELO) and (NAGASA)] and two type of filler (SiO2) [(LA and HA)] provided by INFINEON to prepare ‘doped globe’ tops at the laboratory to improve the dosimetric properties of chip cards.
The two type of fillers (SiO2) were labelled according to natural radio isotope content in SiO2 were called a) filler with low level natural radio-isotopes (LA) and the filler with high natural radio-isotopes (HA).
The fillers are mixed with artificial phosphors such as LiF:Cu China (Sange); Al2O3:C USA (Landauer) and BeO; Brush-Wellman (USA). The mixture is spread over plastic sheets or deposited on stainless steel disk to obtain 3-5 mg of 5 mm diameter disks for luminescence measurements.
Epoxy obtained from NAGASA (provided by INFINEON) could not be cured with UV in our laboratory conditions. Therefore, the experiments described below were performed using product labelled as DELO where it could be cured by heating at 125°C over night (17 hours) in a furnace or at 250°C in 2 minutes. The results of luminescence studies are described below.
3.2.2 Luminescence measurements, results and discussions
a) Globe top containing artificial phosphors Fillers labelled as LA and HA are mixed with various amount of Al2O3:C powder
(grain size <38 µm) and the mixture is deposited on stainless steel cups (5 mm diameter) and heat cured before the luminescence measurements.
– 33 –
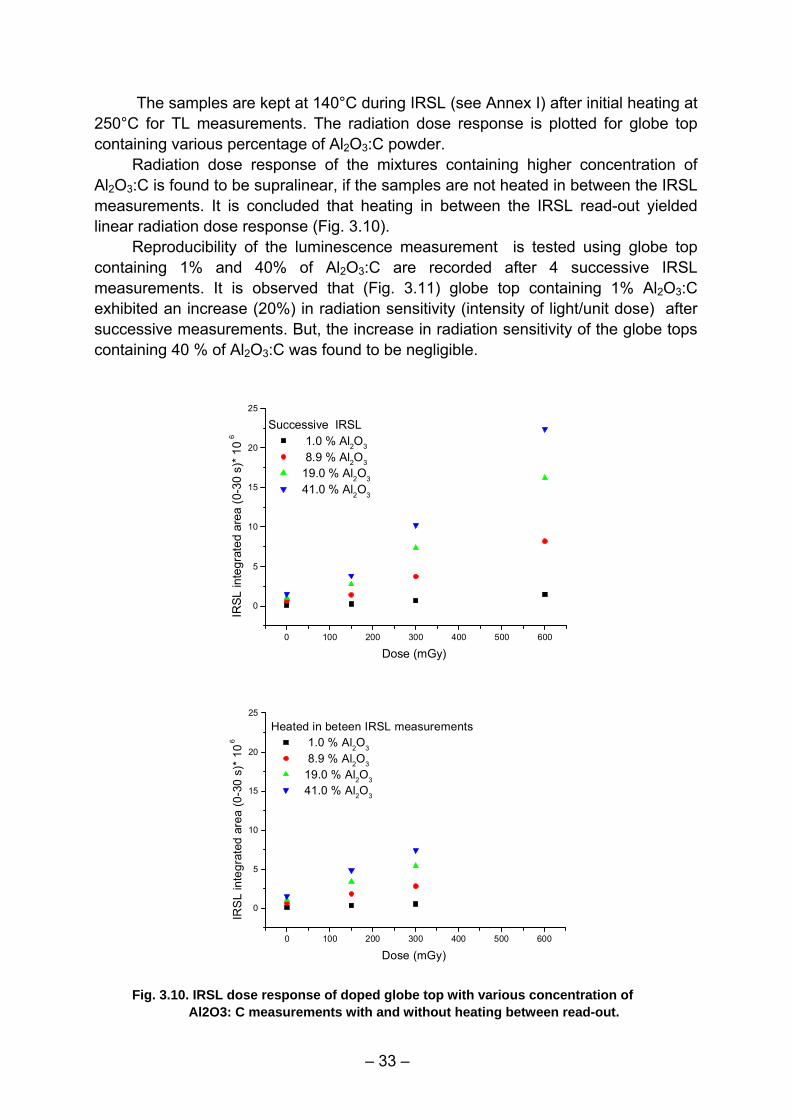
The samples are kept at 140°C during IRSL (see Annex I) after initial heating at 250°C for TL measurements. The radiation dose response is plotted for globe top containing various percentage of Al2O3:C powder.
Radiation dose response of the mixtures containing higher concentration of Al2O3:C is found to be supralinear, if the samples are not heated in between the IRSL measurements. It is concluded that heating in between the IRSL read-out yielded linear radiation dose response (Fig. 3.10).
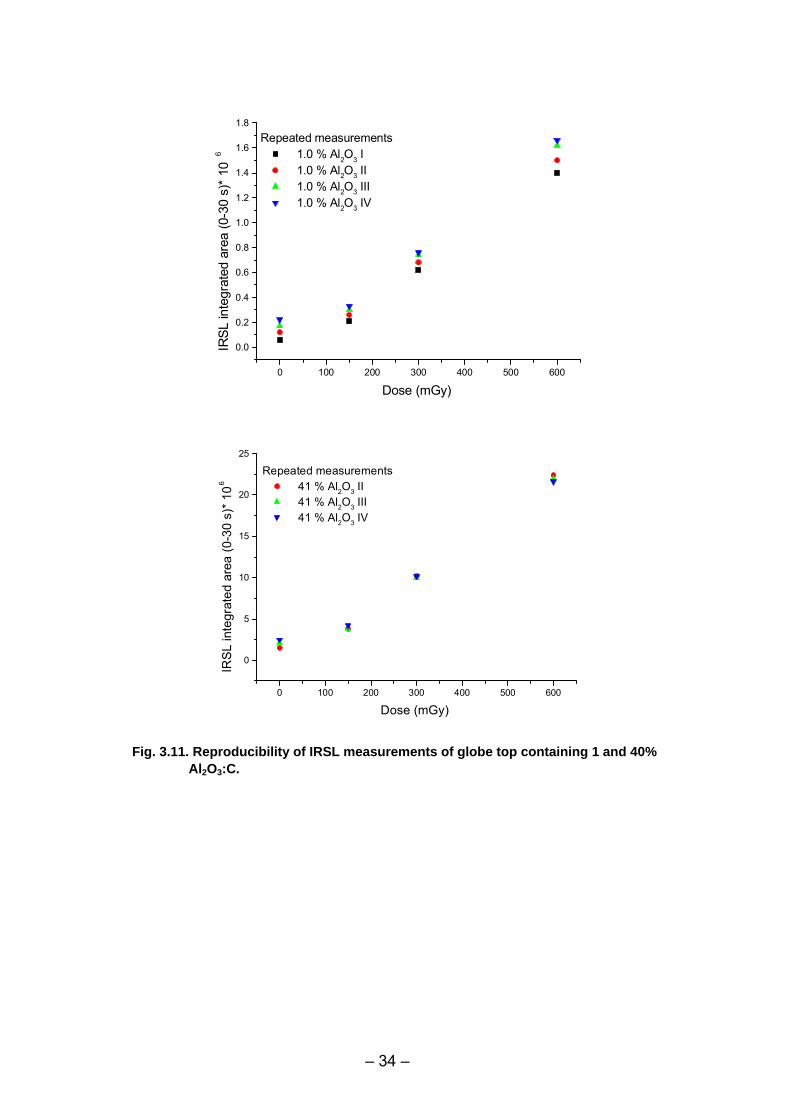
Reproducibility of the luminescence measurement is tested using globe top containing 1% and 40% of Al2O3:C are recorded after 4 successive IRSL measurements. It is observed that (Fig. 3.11) globe top containing 1% Al2O3:C exhibited an increase (20%) in radiation sensitivity (intensity of light/unit dose) after successive measurements. But, the increase in radiation sensitivity of the globe tops containing 40 % of Al2O3:C was found to be negligible.
0 100 200 300 400 500 600
0
5
10
15
20
25
Successive IRSL 1.0 % Al2O3
8.9 % Al2O3
19.0 % Al2O3
41.0 % Al2O3
IRSL
inte
grat
ed a
rea
(0-3
0 s)
* 10
6
Dose (mGy)
0 100 200 300 400 500 600
0
5
10
15
20
25Heated in beteen IRSL measurements
1.0 % Al2O3
8.9 % Al2O3
19.0 % Al2O3
41.0 % Al2O3
IRS
L in
tegr
ated
are
a (0
-30
s)*
10 6
Dose (mGy)
Fig. 3.10. IRSL dose response of doped globe top with various concentration of
Al2O3: C measurements with and without heating between read-out.
– 34 –
0 100 200 300 400 500 600
0.0
0.2
0.4
0.6
0.8
1.0
1.2
1.4
1.6
1.8Repeated measurements
1.0 % Al2O3 I 1.0 % Al2O3 II 1.0 % Al2O3 III 1.0 % Al2O3 IV
IRSL
inte
grat
ed a
rea
(0-3
0 s)
* 10
6
Dose (mGy)
0 100 200 300 400 500 600
0
5
10
15
20
25
Repeated measurements 41 % Al2O3 II 41 % Al2O3 III 41 % Al2O3 IV
IRSL
inte
grat
ed a
rea
(0-3
0 s)
* 10 6
Dose (mGy)
Fig. 3.11. Reproducibility of IRSL measurements of globe top containing 1 and 40%
Al2O3:C.
– 35 –
0 200 400 600 800 1000 12000
1
2
3
4
5
6
7
8
91% Al2O3 TL after IRSL measurements
First Second Third succesive measuremnt
TL in
t 100
-250
°C
Dose ( mGy)
0 100 200 300 400
0
50000
100000
150000
200000
250000
300000Filler doped with 1 % Al2O3:C
Recovered TL in 6 days TL after IRSL (1.5 Gy)
TL in
tens
ity (a
.u)
Temperature °C
Fig. 3.12. Radiation dose response of TL after successive IRSL measurements and
below recovery signal after 6 days. It is further observed that if TL measurements were performed after IRSL read-
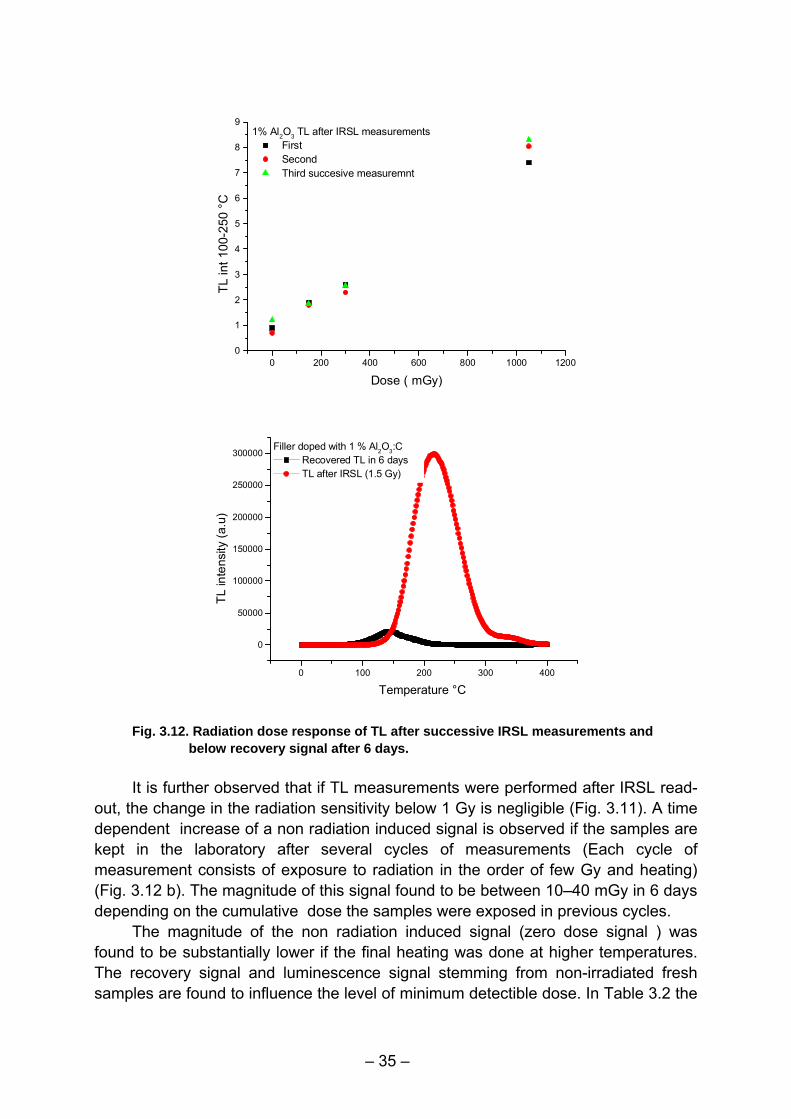
out, the change in the radiation sensitivity below 1 Gy is negligible (Fig. 3.11). A time dependent increase of a non radiation induced signal is observed if the samples are kept in the laboratory after several cycles of measurements (Each cycle of measurement consists of exposure to radiation in the order of few Gy and heating) (Fig. 3.12 b). The magnitude of this signal found to be between 10–40 mGy in 6 days depending on the cumulative dose the samples were exposed in previous cycles.
The magnitude of the non radiation induced signal (zero dose signal ) was found to be substantially lower if the final heating was done at higher temperatures. The recovery signal and luminescence signal stemming from non-irradiated fresh samples are found to influence the level of minimum detectible dose. In Table 3.2 the
– 36 –
range of minimum detectible doses are listed for globe top mixtures containing various amount of Al2O3:C.
Table 3.2. The minimum detectible dose (MDD) of laboratory produced globe top
doped with various concentration of Al2O3: C. Concentration of (%) MDD* (mGy) MDD** (mGy )
1% 75 10
8.9% 64 3
19% 60 2
41 % 60 2 MDD* (Minimum Detectible Dose) calculated by taking into account the initial and recovery signal. MDD** calculations are based on measurements performed immediately after heating to 400°C.
Radiation dose response of TL intensity at low doses is also studied using
RISØ–TL-DA-12 containing 15 mCi beta source (Dose rate at sample irradiation position is 3.9 mGy s-1) and a optical filter from Schott BG-12. It is observed that increasing concentration above 10% do not improve the detection limit under our experimental conditions. The recovery signal is found to be in the order of 20 mGy after it is left inside the equipment. Slow heating rate used during luminescence readings reduced the magnitude of the’ recovery signal’.
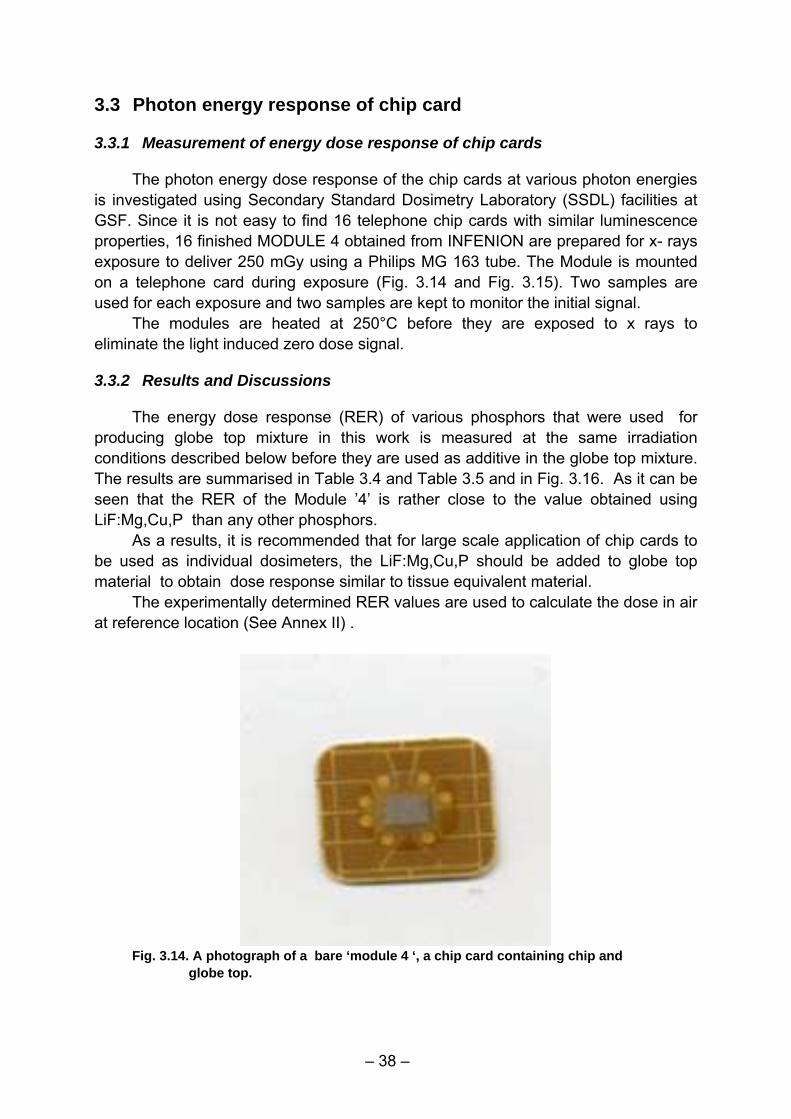
Similar experiments are performed to produce globe top material containing various amount of LiF:Cu and BeO. The samples are prepared using filler (LA) and Epox from DELO and cured at 180°C for 17 hours. The glow curves and radiation dose response are plotted in Fig. 3.12. The globe top obtained using three different type of phosphor all exhibited a linear dose response and their radiation sensitivity were found to be compatible with each other within the same order of magnitude.
3.2.3 Conclusion and recommendation for producers
Using heat cured epoxy and performing the measurements at low doses immediately after irradiation it is shown that 10 mGy of external dose can be detected using heat cured disks mixed 1% phosphors material such as Al2O3:C or LiF:Cu and 2% BeO. However, due to initial background signal and gradual increase of the non radiation induced signal, residual signal from previous read-out measurements, the realistic detectable limits were found to be in the order of 100 mGy as shown in Table 3.3. BeO and LiF have the advantage that they are tissue equivalent material. On the other hand Al2O3:C and BeO have the advantage that they can be evaluated using both TL and OSL. Furthermore, it is essential that the globe tops have to be heat cured to minimize the initial signal. It is further recommended that the geological material used for production of globe top (SiO2) need to be combusted at higher temperatures such as above 400°C to obtain fillers.
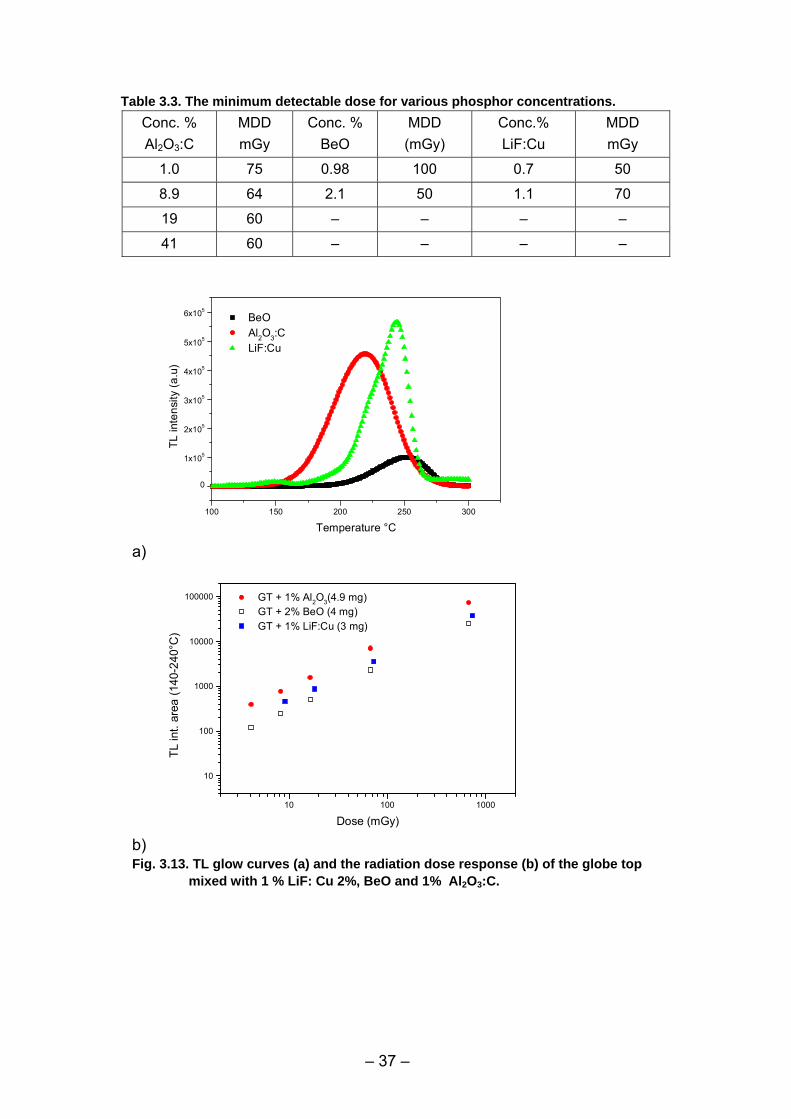
– 37 –
Table 3.3. The minimum detectable dose for various phosphor concentrations. Conc. % Al2O3:C
MDD mGy
Conc. % BeO
MDD (mGy)
Conc.% LiF:Cu
MDD mGy
1.0 75 0.98 100 0.7 50
8.9 64 2.1 50 1.1 70
19 60 – – – –
41 60 – – – –
a)
100 150 200 250 300
0
1x10⁵
2x10⁵
3x10⁵
4x10⁵
5x10⁵
6x10⁵
BeO Al2O3:C LiF:Cu
TL in
tens
ity (a
.u)
Temperature °C
b)
10 100 1000
10
100
1000
10000
100000 GT + 1% Al2O3(4.9 mg) GT + 2% BeO (4 mg) GT + 1% LiF:Cu (3 mg)
TL in
t. ar
ea (1
40-2
40°C
)
Dose (mGy)
Fig. 3.13. TL glow curves (a) and the radiation dose response (b) of the globe top
mixed with 1 % LiF: Cu 2%, BeO and 1% Al2O3:C.
– 38 –
3.3 Photon energy response of chip card
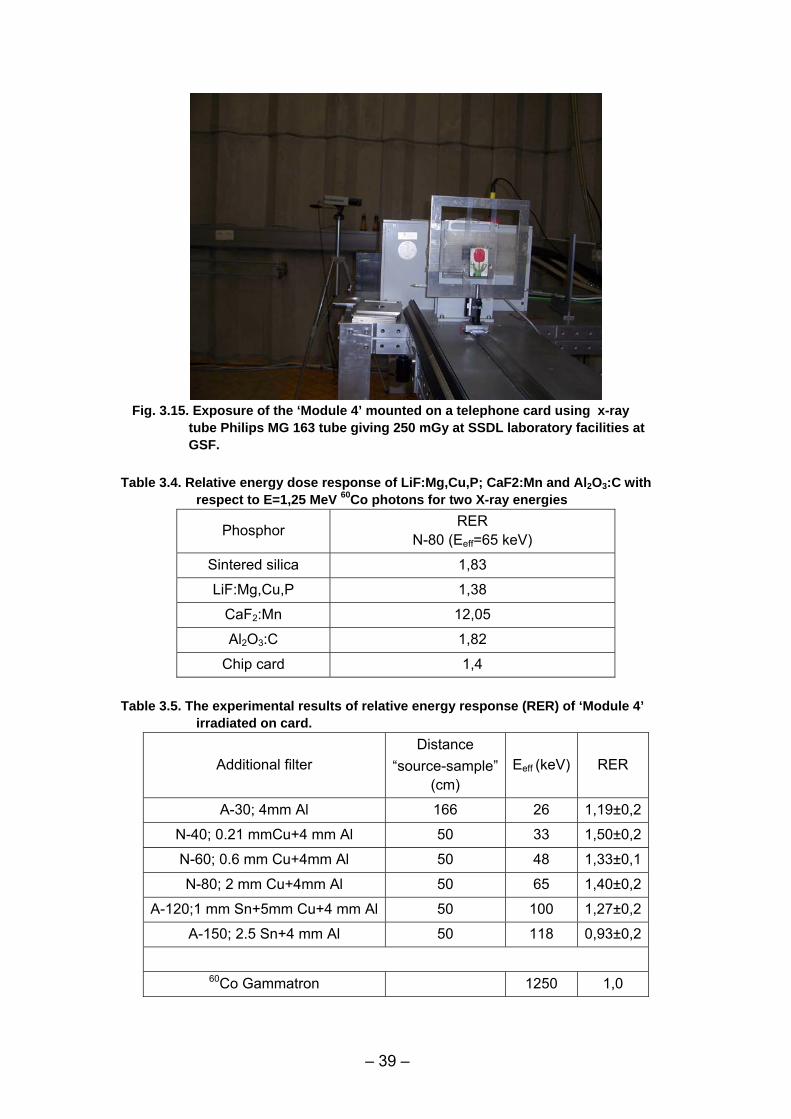
3.3.1 Measurement of energy dose response of chip cards
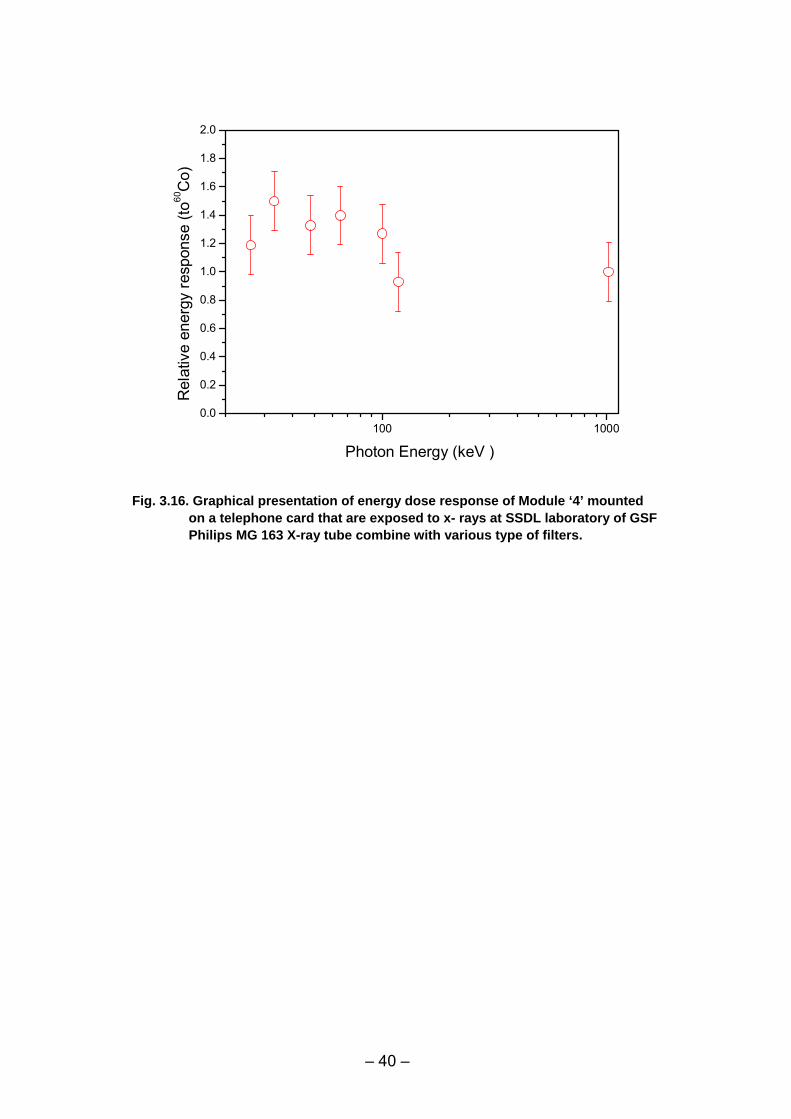
The photon energy dose response of the chip cards at various photon energies is investigated using Secondary Standard Dosimetry Laboratory (SSDL) facilities at GSF. Since it is not easy to find 16 telephone chip cards with similar luminescence properties, 16 finished MODULE 4 obtained from INFENION are prepared for x- rays exposure to deliver 250 mGy using a Philips MG 163 tube. The Module is mounted on a telephone card during exposure (Fig. 3.14 and Fig. 3.15). Two samples are used for each exposure and two samples are kept to monitor the initial signal.
The modules are heated at 250°C before they are exposed to x rays to eliminate the light induced zero dose signal.
3.3.2 Results and Discussions
The energy dose response (RER) of various phosphors that were used for producing globe top mixture in this work is measured at the same irradiation conditions described below before they are used as additive in the globe top mixture. The results are summarised in Table 3.4 and Table 3.5 and in Fig. 3.16. As it can be seen that the RER of the Module ’4’ is rather close to the value obtained using LiF:Mg,Cu,P than any other phosphors.
As a results, it is recommended that for large scale application of chip cards to be used as individual dosimeters, the LiF:Mg,Cu,P should be added to globe top material to obtain dose response similar to tissue equivalent material.
The experimentally determined RER values are used to calculate the dose in air at reference location (See Annex II) .
Fig. 3.14. A photograph of a bare ‘module 4 ‘, a chip card containing chip and
globe top.
– 39 –
Fig. 3.15. Exposure of the ‘Module 4’ mounted on a telephone card using x-ray
tube Philips MG 163 tube giving 250 mGy at SSDL laboratory facilities at GSF.
Table 3.4. Relative energy dose response of LiF:Mg,Cu,P; CaF2:Mn and Al2O3:C with
respect to E=1,25 MeV 60Co photons for two X-ray energies
Phosphor RER N-80 (Eeff=65 keV)
Sintered silica 1,83
LiF:Mg,Cu,P 1,38
CaF2:Mn 12,05
Al2O3:C 1,82
Chip card 1,4
Table 3.5. The experimental results of relative energy response (RER) of ‘Module 4’ irradiated on card.
Additional filter Distance
“source-sample”(cm)
Eeff (keV) RER
A-30; 4mm Al 166 26 1,19±0,2
N-40; 0.21 mmCu+4 mm Al 50 33 1,50±0,2
N-60; 0.6 mm Cu+4mm Al 50 48 1,33±0,1
N-80; 2 mm Cu+4mm Al 50 65 1,40±0,2
A-120;1 mm Sn+5mm Cu+4 mm Al 50 100 1,27±0,2
A-150; 2.5 Sn+4 mm Al 50 118 0,93±0,2
60Co Gammatron 1250 1,0
– 40 –
100 10000.0
0.2
0.4
0.6
0.8
1.0
1.2
1.4
1.6
1.8
2.0
Rel
ativ
e en
ergy
resp
onse
(to60
Co)
Photon Energy (keV )
Fig. 3.16. Graphical presentation of energy dose response of Module ‘4’ mounted
on a telephone card that are exposed to x- rays at SSDL laboratory of GSF Philips MG 163 X-ray tube combine with various type of filters.
– 41 –
4 TEETH
4.1 Investigation of EPR properties of tooth enamel
4.1.1 Analysis of the EPR spectrum of tooth enamel
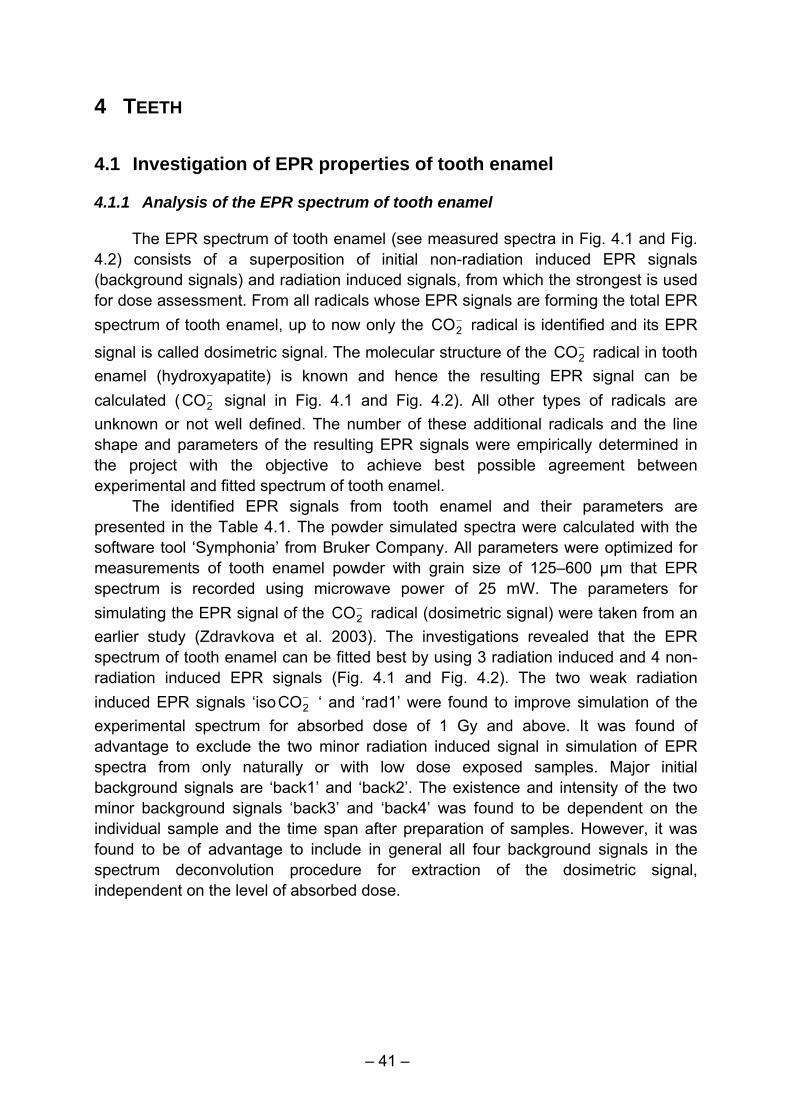
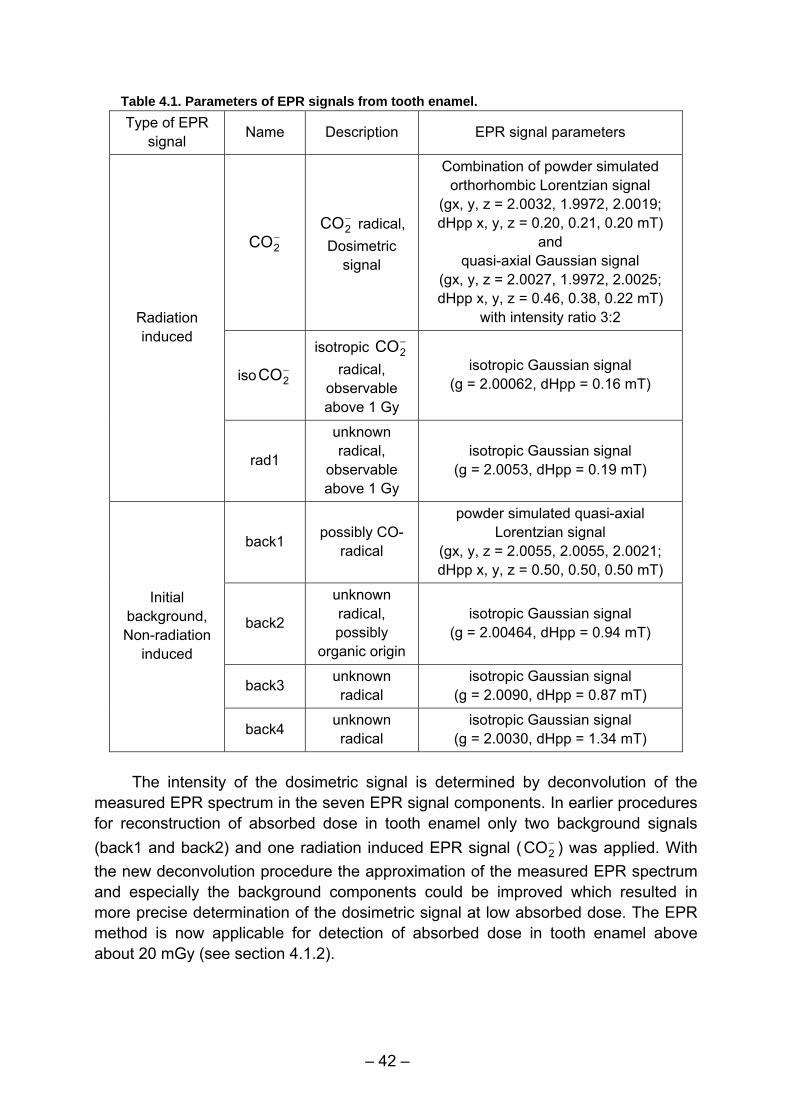
The EPR spectrum of tooth enamel (see measured spectra in Fig. 4.1 and Fig. 4.2) consists of a superposition of initial non-radiation induced EPR signals (background signals) and radiation induced signals, from which the strongest is used for dose assessment. From all radicals whose EPR signals are forming the total EPR spectrum of tooth enamel, up to now only the −
2CO radical is identified and its EPR
signal is called dosimetric signal. The molecular structure of the −2CO radical in tooth
enamel (hydroxyapatite) is known and hence the resulting EPR signal can be calculated ( −
2CO signal in Fig. 4.1 and Fig. 4.2). All other types of radicals are unknown or not well defined. The number of these additional radicals and the line shape and parameters of the resulting EPR signals were empirically determined in the project with the objective to achieve best possible agreement between experimental and fitted spectrum of tooth enamel.
The identified EPR signals from tooth enamel and their parameters are presented in the Table 4.1. The powder simulated spectra were calculated with the software tool ‘Symphonia’ from Bruker Company. All parameters were optimized for measurements of tooth enamel powder with grain size of 125–600 µm that EPR spectrum is recorded using microwave power of 25 mW. The parameters for simulating the EPR signal of the −
2CO radical (dosimetric signal) were taken from an earlier study (Zdravkova et al. 2003). The investigations revealed that the EPR spectrum of tooth enamel can be fitted best by using 3 radiation induced and 4 non-radiation induced EPR signals (Fig. 4.1 and Fig. 4.2). The two weak radiation induced EPR signals ‘iso −
2CO ‘ and ‘rad1’ were found to improve simulation of the experimental spectrum for absorbed dose of 1 Gy and above. It was found of advantage to exclude the two minor radiation induced signal in simulation of EPR spectra from only naturally or with low dose exposed samples. Major initial background signals are ‘back1’ and ‘back2’. The existence and intensity of the two minor background signals ‘back3’ and ‘back4’ was found to be dependent on the individual sample and the time span after preparation of samples. However, it was found to be of advantage to include in general all four background signals in the spectrum deconvolution procedure for extraction of the dosimetric signal, independent on the level of absorbed dose.
– 42 –
Table 4.1. Parameters of EPR signals from tooth enamel. Type of EPR
signal Name Description EPR signal parameters
−2CO
−2CO radical,
Dosimetric signal
Combination of powder simulated orthorhombic Lorentzian signal
(gx, y, z = 2.0032, 1.9972, 2.0019; dHpp x, y, z = 0.20, 0.21, 0.20 mT)
and quasi-axial Gaussian signal
(gx, y, z = 2.0027, 1.9972, 2.0025; dHpp x, y, z = 0.46, 0.38, 0.22 mT)
with intensity ratio 3:2
iso −2CO
isotropic −2CO
radical, observable above 1 Gy
isotropic Gaussian signal (g = 2.00062, dHpp = 0.16 mT)
Radiation induced
rad1
unknown radical,
observable above 1 Gy
isotropic Gaussian signal (g = 2.0053, dHpp = 0.19 mT)
back1 possibly CO- radical
powder simulated quasi-axial Lorentzian signal
(gx, y, z = 2.0055, 2.0055, 2.0021; dHpp x, y, z = 0.50, 0.50, 0.50 mT)
back2
unknown radical, possibly
organic origin
isotropic Gaussian signal (g = 2.00464, dHpp = 0.94 mT)
back3 unknown radical
isotropic Gaussian signal (g = 2.0090, dHpp = 0.87 mT)
Initial background, Non-radiation
induced
back4 unknown radical
isotropic Gaussian signal (g = 2.0030, dHpp = 1.34 mT)
The intensity of the dosimetric signal is determined by deconvolution of the
measured EPR spectrum in the seven EPR signal components. In earlier procedures for reconstruction of absorbed dose in tooth enamel only two background signals (back1 and back2) and one radiation induced EPR signal ( −
2CO ) was applied. With the new deconvolution procedure the approximation of the measured EPR spectrum and especially the background components could be improved which resulted in more precise determination of the dosimetric signal at low absorbed dose. The EPR method is now applicable for detection of absorbed dose in tooth enamel above about 20 mGy (see section 4.1.2).
– 43 –
2.015 2.010 2.005 2.000 1.995 1.990
-60000
-40000
-20000
0
20000
40000
60000
80000
EP
R in
tens
ity, a
.u.
g - value
meas. spectrum fitted spectrum CO2- back1 back2 back3 back4
applied dose: 0 Gy
Fig. 4.1. EPR spectrum of naturally exposed tooth enamel sample, including all
EPR components used for fitting the measured spectrum.
2.015 2.010 2.005 2.000 1.995 1.990-80000
-60000
-40000
-20000
0
20000
40000
60000
80000
100000
120000
140000
160000
EPR
inte
nsity
, a.u
.
g - value
meas. spectrum fitted spectrum CO2- isoCO2- rad1 back1 back2 back3 back4
applied dose: 1 Gy
Fig. 4.2. EPR spectrum of 1 Gy exposed tooth enamel sample, including all EPR
components used for fitting the measured spectrum.
– 44 –
EPR spectrum deconvolution in the project was performed with the software
tool ‘DOSIMETRY’, which was developed by GSF and IMP (Institute of Metal Physics, Yekaterinburg, Russia) in the framework of earlier research projects (Koshta et al. 2000). The personalised actual version of the tool can be obtained freely on request under [email protected]. The tool ‘DOSIMERTY’ is capable to use the EPR signal parameters listed in the Table 4.1 for evaluation of the dosimetric signal and dose evaluation.
4.1.2 Measurements of dose response of tooth enamel
The dose response of the −2CO EPR signal (dosimetric signal) of tooth enamel
samples was evaluated up to absorbed dose of 1500 mGy. Two different spectrum deconvolution procedures were applied to the same measured EPR spectrum of each of 30 samples. One of the deconvolution procedures (single signal background: SSB method) included only a single background component (back1) while in the second procedure (multi signal background: MSB method) all four background components as identified in the project were included. It was the intention of this study to investigate the effect of quality (number of applied EPR signal components) of spectrum deconvolution on the slope and bias of the dose response curve of the dosimetric signal and the standard deviation of the evaluated dosimetric signal from naturally exposed samples.
The investigations were performed with 30 enamel samples of each 100 mg which were taken from a homogenized pool of tooth enamel powder that were prepared following the GSF protocol from 30 molars. The teeth were extracted in 2000 in the course of medical health care in dental clinics of Cairo, Egypt from tooth donors with age of 19–65 years, with average age of 40 years. The irradiation of samples was done in groups of five at five doses. One group of five samples was left un-irradiated.
The samples were irradiated with a 60Co source (Gammatron) of the Secondary Standard Dosimetry Laboratory (SSDL) at GSF. Sets of five samples were irradiated in side of Plexiglas box phantom at doses of 100, 200, 500, 1000 and 1500 mGy air kerma. The Plexiglas box was 12 x 9 x 2.6 cm3 with 0.5 cm thick front and side walls, and 0.4 cm thick back wall. The radiation field size was 18 x 18 cm2.
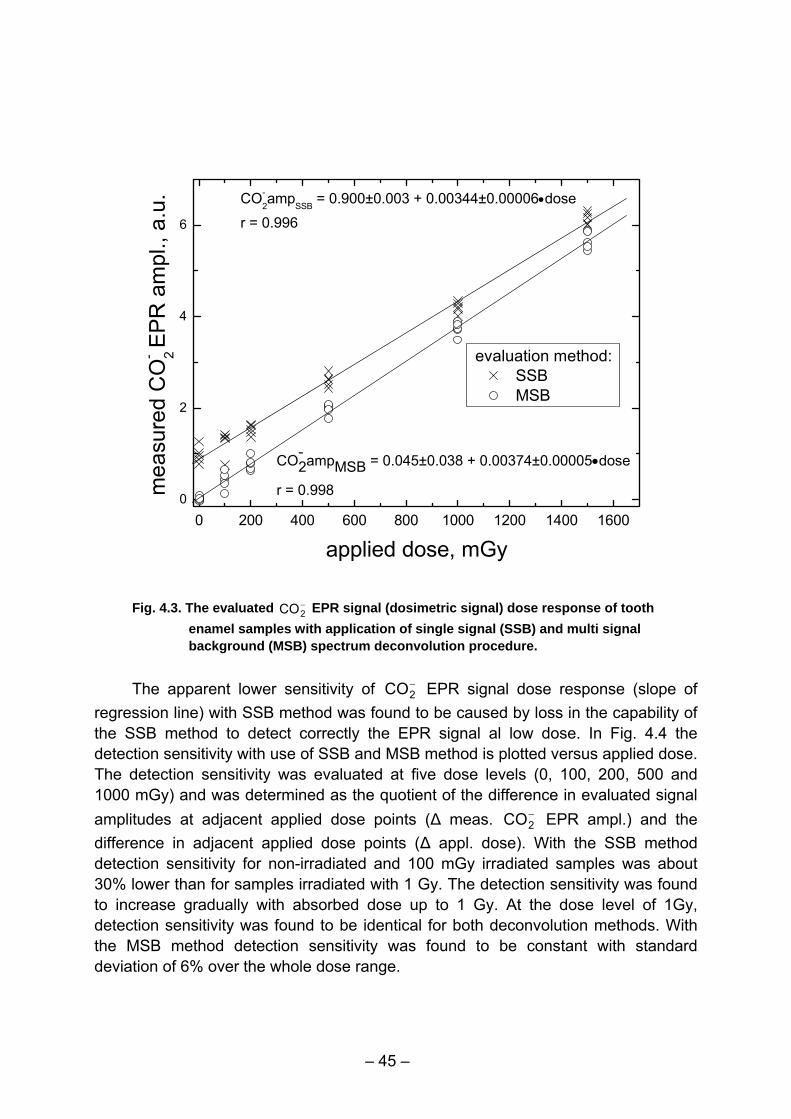
The −2CO EPR signal amplitudes of the 30 samples in dependence on applied
dose as evaluated with SSB and MSB deconvolution method are presented in the Fig. 4.3. With both methods the evaluated −
2CO EPR signal amplitudes were found to correlate very well with applied dose, with correlation coefficients of 0.996 and 0.998 for SSB and MSB method, respectively. However, significant differences of both methods were found in the slope and in the bias of the dose response curves. The slope of the curve (radiation sensitivity) was found to be about 9% larger in case of MSB evaluation. The bias of the dose response curve (intercept at zero applied dose) of 262 mGy in case of the SSB method was considerably reduced to only 12 mGy in case of the MSB method.
– 45 –
0 200 400 600 800 1000 1200 1400 16000
2
4
6
evaluation method: SSB MSB
mea
sure
d C
O- 2 EP
R a
mpl
., a.
u.
applied dose, mGy
CO-2ampMSB = 0.045±0.038 + 0.00374±0.00005•dose
r = 0.998
CO-2ampSSB = 0.900±0.003 + 0.00344±0.00006•dose
r = 0.996
Fig. 4.3. The evaluated −
2CO EPR signal (dosimetric signal) dose response of tooth enamel samples with application of single signal (SSB) and multi signal background (MSB) spectrum deconvolution procedure.
The apparent lower sensitivity of −
2CO EPR signal dose response (slope of regression line) with SSB method was found to be caused by loss in the capability of the SSB method to detect correctly the EPR signal al low dose. In Fig. 4.4 the detection sensitivity with use of SSB and MSB method is plotted versus applied dose. The detection sensitivity was evaluated at five dose levels (0, 100, 200, 500 and 1000 mGy) and was determined as the quotient of the difference in evaluated signal amplitudes at adjacent applied dose points (Δ meas. −
2CO EPR ampl.) and the difference in adjacent applied dose points (Δ appl. dose). With the SSB method detection sensitivity for non-irradiated and 100 mGy irradiated samples was about 30% lower than for samples irradiated with 1 Gy. The detection sensitivity was found to increase gradually with absorbed dose up to 1 Gy. At the dose level of 1Gy, detection sensitivity was found to be identical for both deconvolution methods. With the MSB method detection sensitivity was found to be constant with standard deviation of 6% over the whole dose range.
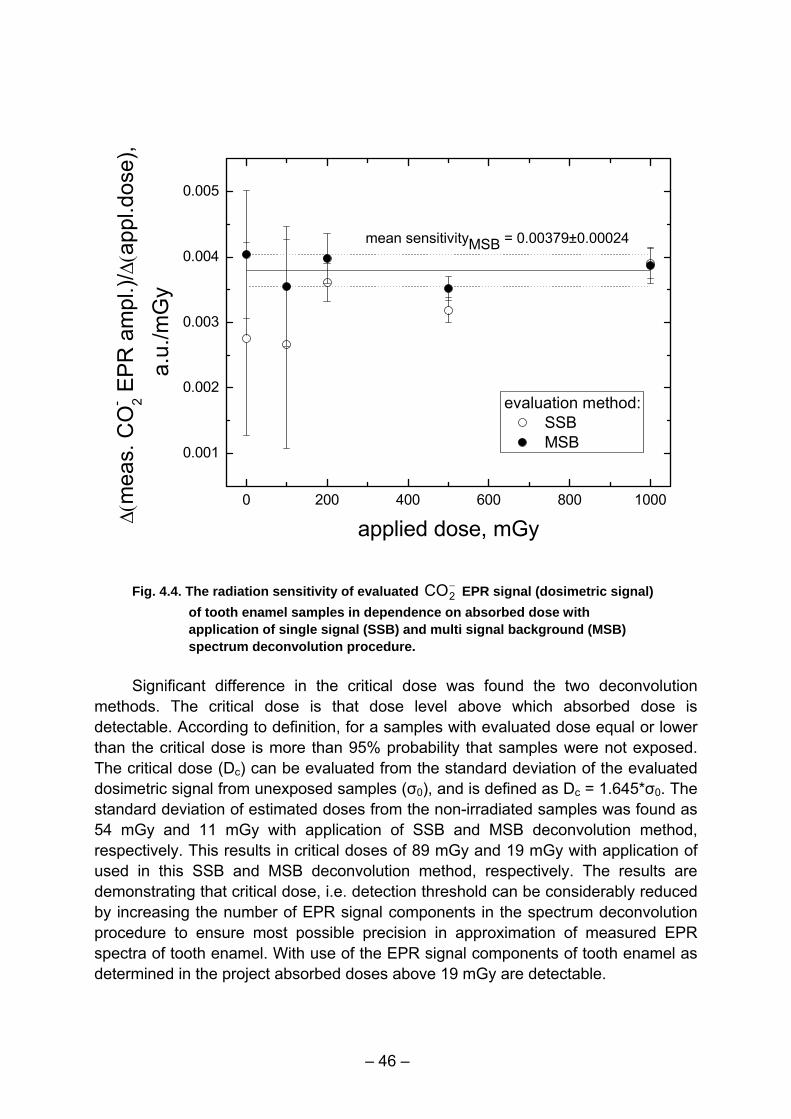
– 46 –
0 200 400 600 800 1000
0.001
0.002
0.003
0.004
0.005
evaluation method: SSB MSB
Δ(m
eas.
CO
- 2 EPR
am
pl.)/Δ(a
ppl.d
ose)
, a
.u./m
Gy
applied dose, mGy
mean sensitivityMSB = 0.00379±0.00024
Fig. 4.4. The radiation sensitivity of evaluated −
2CO EPR signal (dosimetric signal) of tooth enamel samples in dependence on absorbed dose with application of single signal (SSB) and multi signal background (MSB) spectrum deconvolution procedure.
Significant difference in the critical dose was found the two deconvolution
methods. The critical dose is that dose level above which absorbed dose is detectable. According to definition, for a samples with evaluated dose equal or lower than the critical dose is more than 95% probability that samples were not exposed. The critical dose (Dc) can be evaluated from the standard deviation of the evaluated dosimetric signal from unexposed samples (σ0), and is defined as Dc = 1.645*σ0. The standard deviation of estimated doses from the non-irradiated samples was found as 54 mGy and 11 mGy with application of SSB and MSB deconvolution method, respectively. This results in critical doses of 89 mGy and 19 mGy with application of used in this SSB and MSB deconvolution method, respectively. The results are demonstrating that critical dose, i.e. detection threshold can be considerably reduced by increasing the number of EPR signal components in the spectrum deconvolution procedure to ensure most possible precision in approximation of measured EPR spectra of tooth enamel. With use of the EPR signal components of tooth enamel as determined in the project absorbed doses above 19 mGy are detectable.
– 47 –
4.2 Evaluation of photon energy response of deciduous teeth
4.2.1 Monte Carlo calculated photon energy response of tooth enamel from deciduous teeth
The mathematical phantom of the 5-year-old child used in the present study has been originated from a family of phantoms developed in Oak Ridge National Laboratory (Cristy 1980, Cristy and Eckerman 1987) and their later modifications (Ulanovsky and Eckerman 1998). The ORNL family of the mathematical phantoms have been extensively used in a variety of the ICRP publications related to dosimetry. For the present study, the following modifications have been additionally introduced in the phantom (see Fig. 4.5):
A part of facial bone has been replaced with new regions corresponding to teeth, jaw bones, and soft tissue. The tooth region itself is defined as a volume bounded by two horizontal planes, four eccentric circular cylinders, and nine cutter planes parallel to z-axis.
The cutter planes divide the tooth region into sub-regions corresponding to various deciduous teeth: incisors (A,B), canines (C), first (D), and second (E) molars on left and right side, correspondingly (see Fig. 4.5).
Each teeth sub-region is separated into dentin and enamel parts. Enamel covers labial and lingual sides of the tooth region as well as it is represented by a horizontal layer in the middle. This layer separates between upper and lower dentin cells (see inset in the Fig. 4.5). Thus, the absorbed dose in the enamel is computed as an average for the total enamel in the given tooth.
Masses of the teeth have been selected according to reference data from publications of the ICRP (ICRP 2002, ICRP 1975). Absolute value of the teeth mass agrees with the reference value for 5-year-old child in (ICRP 2002), while data on mass distribution between teeth are derived from the earlier publication of the ICRP (ICRP 1975). A comparison of the reference masses and masses of the tooth regions are given in Table 4.2. In the ICRP Publication 89, the recommended value of the total teeth mass is equal to 15 g (ICRP 2002, p. 185), the total teeth mass in the present model equals to 15.07 g. Densities and elemental composition of enamel and dentin are also based on (ICRP 1975) and can be found elsewhere (Ulanovsky et al. 2005).
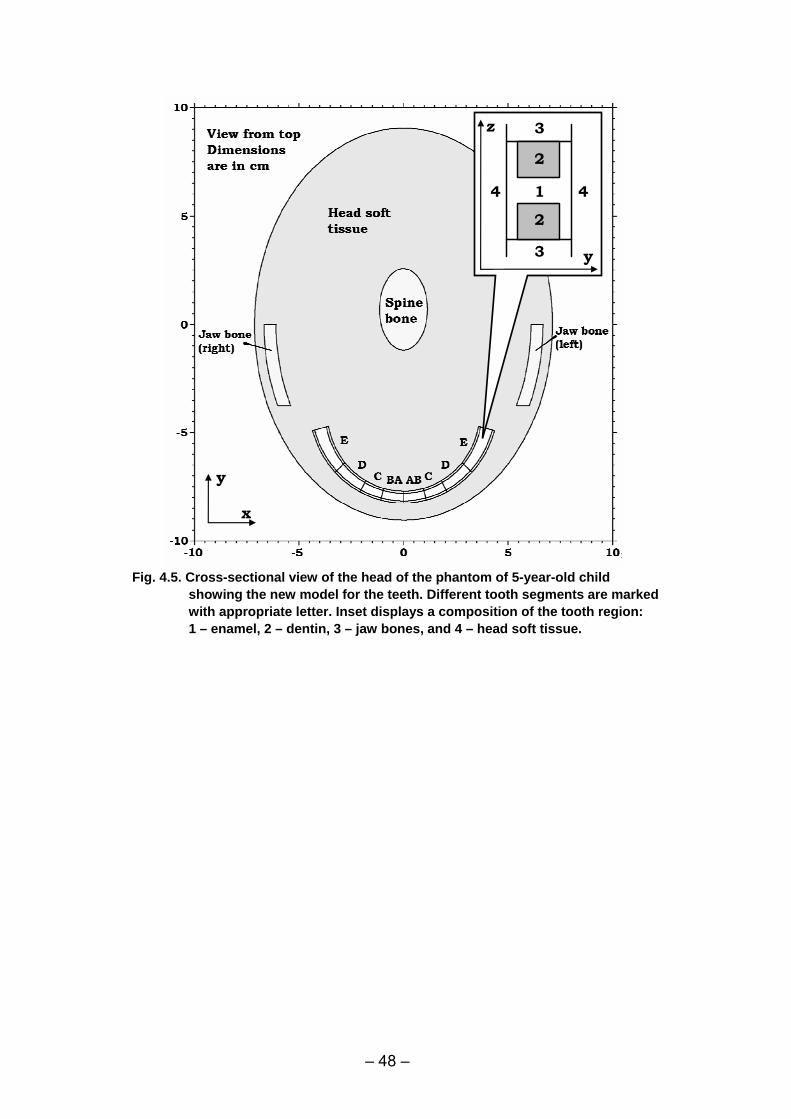
– 48 –
3
3
4 4
2
1
2
x
y
z
y
Fig. 4.5. Cross-sectional view of the head of the phantom of 5-year-old child
showing the new model for the teeth. Different tooth segments are marked with appropriate letter. Inset displays a composition of the tooth region: 1 – enamel, 2 – dentin, 3 – jaw bones, and 4 – head soft tissue.
– 49 –
Table 4.2. Relative mass distributions between deciduous teeth as used in the present work and derived from ICRP Publication 23 (ICRP 1975, Table 26, p. 83)
Tooth total mass distribution (%) Tooth
Present work Derived from (ICRP 1975)
A and B 16.3 16.5
C 16.7 16.7
D 24.9 24.9
E 42.0 42.1 The computed DCC are given in Table 4.3–Table 4.7. Shown there are
numerical values of the kerma-based dose coefficients (see eqn 2.3) ( )γEC Tk, and
their 2σ statistical errors. Due to the apparent symmetry of the human body, the DCC for AP-, PA-, ROT-, and ISO-sources are averaged over left and right side target tooth cells. The dose coefficients for RLAT-source (Table 4.5) are given separately for the left and right teeth. The DCC represent average values for the total enamel, i.e. for lingual, labial, top crown, and inter teeth enamel parts.
The enamel DCC for ROT- and ISO-sources are practically independent on a tooth location. Photon sources with rotational and isotropic symmetry can be good approximations for many practical scenarios of public exposure. On the other hand, the data for planar photon sources (AP-, PA-, RLAT-) demonstrate dependence on tooth locations, especially, in the range of low energies. This dependence can be attributed to different attenuation due to varying thickness of the overlaying soft tissue in real subjects or in the phantoms used for simulation (more on these see in (Ulanovsky et al. 2005))
The data in Table 4.3–Table 4.7 show apparent and strong energy dependence in the range of the source photon energies from 10 keV to 200 keV. This energy dependence is similar to that found in DCC for adult (Ulanovsky et al. 2005). Dose conversion coefficients for 5-year-old child and adult for the selected geometries are compared in Fig. 4.6–Fig. 4.8, from which one sees that the energy dependence of the DCC for children phantom is stronger than that for average enamel in the adult’s molars. Thus, it is anticipated that a shape of the photon spectrum is more influential to the value of accumulated dose absorbed dose in a tooth.
Due to apparent non-linearity of the DCC, the integral absorbed dose in teeth depends strongly on energy spectrum of the photon source, thus an appropriate conversion of the absorbed dose in the tooth enamel to integral air kerma or organ dose needs in a proper accounting for photon fluence spectrum. The data in Table 4.3–Table 4.7 demonstrate maxima at photon energies at 50–60 keV. That is, a ratio of absorbed dose in the enamel to air kerma maximizes for “soft” photon sources, like X-ray sources or natural background spectra where the spectrum shape is dominated by low-energy scattered photons.
– 50 –
Table 4.3. Dose conversion coefficients for enamel of deciduous teeth for AP photon source. Values are averages between left and right teeth.
Ck,T (Gy Gy−1) and 2σ-errors (%) E (MeV) Incisors (A,B) Canine (C) 1st molar (D) 2nd molar (E)
0.01 5.85×10⁻³ 2.7 4.24×10⁻³ 3.1 1.66×10⁻³ 4.2 1.42×10⁻⁴ 11.3 0.015 3.00×10⁻¹ 0.7 2.60×10⁻¹ 0.7 1.70×10⁻¹ 0.8 5.21×10⁻² 1.1 0.02 1.22 0.5 1.12 0.6 8.56×10⁻¹ 0.5 3.95×10⁻¹ 0.6 0.03 4.19 0.5 3.96 0.6 3.31 0.5 2.12 0.5 0.04 7.58 0.6 7.30 0.6 6.43 0.5 4.76 0.5 0.05 9.45 0.7 9.25 0.7 8.48 0.6 6.96 0.5 0.06 9.42 0.8 9.26 0.8 8.73 0.7 7.65 0.6 0.07 8.05 0.9 8.01 0.9 7.63 0.7 6.95 0.6 0.08 7.02 1.0 7.01 1.0 6.70 0.8 6.25 0.7 0.1 4.89 1.1 4.87 1.1 4.69 0.9 4.48 0.7 0.15 2.54 1.3 2.52 1.3 2.46 1.1 2.36 0.9 0.2 1.81 1.3 1.80 1.3 1.75 1.1 1.69 0.9 0.3 1.35 1.4 1.34 1.4 1.32 1.2 1.27 0.9 0.5 1.15 1.6 1.14 1.6 1.11 1.3 1.08 1.1 1 1.04 1.9 1.04 1.9 1.01 1.6 9.92×10⁻¹ 1.3 3 1.02 2.5 1.03 2.5 1.00 2.1 9.86×10⁻¹ 1.7 6 1.09 2.9 1.11 2.8 1.06 2.4 1.06 1.9
10 1.21 3.0 1.22 3.0 1.16 2.5 1.16 2.0
Table 4.4. Dose conversion coefficients for enamel of deciduous teeth for PA photon source. Values are averages between left and right teeth.
Ck,T (Gy Gy−1) and 2σ-errors (%) E (MeV) Incisors (A,B) Canine (C) 1st molar (D) 2nd molar (E)
0.01 — — — — 1.47×10⁻⁶ 139 — — 0.015 6.60×10⁻⁵ 46 4.77×10⁻⁵ 54 5.89×10⁻⁵ 41 4.06×10⁻⁵ 39 0.02 2.77×10⁻⁴ 35 4.34×10⁻⁴ 28 4.43×10⁻⁴ 23 3.89×10⁻⁴ 20 0.03 2.49×10⁻² 7.0 3.89×10⁻² 5.6 4.25×10⁻² 4.5 6.24×10⁻² 2.9 0.04 2.48×10⁻¹ 3.3 3.19×10⁻¹ 2.9 3.45×10⁻¹ 2.3 4.76×10⁻¹ 1.6 0.05 6.69×10⁻¹ 2.5 7.58×10⁻¹ 2.4 8.28×10⁻¹ 1.9 1.11 1.3 0.06 9.84×10⁻¹ 2.3 1.09 2.2 1.19 1.8 1.55 1.2 0.07 1.07 2.3 1.17 2.2 1.27 1.8 1.64 1.2 0.08 1.08 2.3 1.19 2.2 1.28 1.8 1.63 1.3 0.1 9.17×10⁻¹ 2.4 9.77×10⁻¹ 2.4 1.07 1.9 1.35 1.3 0.15 5.92×10⁻¹ 2.5 6.15×10⁻¹ 2.5 6.78×10⁻¹ 1.9 8.22×10⁻¹ 1.4 0.2 4.71×10⁻¹ 2.5 4.86×10⁻¹ 2.4 5.34×10⁻¹ 1.9 6.36×10⁻¹ 1.4 0.3 3.92×10⁻¹ 2.5 4.20×10⁻¹ 2.4 4.50×10⁻¹ 1.9 5.26×10⁻¹ 1.4 0.5 3.97×10⁻¹ 2.5 4.27×10⁻¹ 2.5 4.61×10⁻¹ 2.0 5.17×10⁻¹ 1.5 1 4.53×10⁻¹ 2.7 5.12×10⁻¹ 2.6 5.40×10⁻¹ 2.1 5.73×10⁻¹ 1.6 3 6.33×10⁻¹ 3.1 6.66×10⁻¹ 3.0 6.93×10⁻¹ 2.5 7.11×10⁻¹ 1.9 6 7.50×10⁻¹ 3.4 7.88×10⁻¹ 3.3 8.21×10⁻¹ 2.7 8.47×10⁻¹ 2.1
10 8.52×10⁻¹ 3.5 9.06×10⁻¹ 3.4 9.28×10⁻¹ 2.8 9.44×10⁻¹ 2.2
– 51 –
Table 4.5. Dose conversion coefficients for enamel of deciduous teeth for RLAT photon source. Values are given separately for left and right tooth segments.
Ck,T (Gy Gy−1) and 2σ-errors (%) E (MeV) Incisors (A,B) Canine (C) 1st molar (D) 2nd molar (E)
Left side 0.01 — — 2.10×10⁻⁶ 196 — — — — 0.015 1.09×10⁻³ 16 2.64×10⁻⁴ 33 7.12×10⁻⁵ 52 5.15×10⁻⁵ 49 0.02 2.09×10⁻² 5.8 5.64×10⁻³ 11 1.60×10⁻³ 18 7.52×10⁻⁴ 20 0.03 3.02×10⁻¹ 2.8 1.81×10⁻¹ 3.7 1.18×10⁻¹ 3.8 9.70×10⁻² 3.3 0.04 1.30 2.0 9.31×10⁻¹ 2.4 7.90×10⁻¹ 2.2 7.14×10⁻¹ 1.8 0.05 2.68 1.8 2.04 2.0 1.81 1.8 1.69 1.5 0.06 3.57 1.7 2.73 2.0 2.60 1.7 2.31 1.4 0.07 3.57 1.8 2.88 2.0 2.65 1.7 2.42 1.5 0.08 3.44 1.9 2.83 2.1 2.63 1.8 2.40 1.5 0.1 2.65 2.1 2.30 2.2 2.08 1.9 1.93 1.6 0.15 1.56 2.2 1.33 2.4 1.24 2.1 1.17 1.7 0.2 1.18 2.3 1.01 2.4 9.48×10⁻¹ 2.1 8.76×10⁻¹ 1.7 0.3 9.21×10⁻¹ 2.4 8.07×10⁻¹ 2.5 7.61×10⁻¹ 2.1 7.23×10⁻¹ 1.7 0.5 8.37×10⁻¹ 2.6 7.40×10⁻¹ 2.7 7.12×10⁻¹ 2.3 6.76×10⁻¹ 1.9 1 8.24×10⁻¹ 3.0 7.42×10⁻¹ 3.1 7.41×10⁻¹ 2.6 7.08×10⁻¹ 2.1 3 8.97×10⁻¹ 3.8 8.34×10⁻¹ 3.9 8.20×10⁻¹ 3.2 8.12×10⁻¹ 2.6 6 9.71×10⁻¹ 4.3 9.40×10⁻¹ 4.3 9.14×10⁻¹ 3.6 9.10×10⁻¹ 2.9
10 1.08 4.5 1.05 4.5 1.01 3.8 1.02 3.0 Right side
0.01 1.08×10⁻⁵ 88 4.96×10⁻⁵ 41 1.85×10⁻⁴ 18 1.93×10⁻⁴ 14 0.015 8.17×10⁻³ 6.0 3.17×10⁻² 3.0 7.20×10⁻² 1.7 9.18×10⁻² 1.2 0.02 1.01×10⁻¹ 2.7 2.92×10⁻¹ 1.6 5.16×10⁻¹ 1.0 6.48×10⁻¹ 0.7 0.03 9.31×10⁻¹ 1.7 1.79 1.2 2.49 0.8 2.91 0.6 0.04 2.73 1.4 4.16 1.2 5.19 0.9 5.92 0.6 0.05 4.52 1.4 6.09 1.2 7.15 0.9 7.99 0.7 0.06 5.28 1.5 6.64 1.3 7.54 1.0 8.38 0.8 0.07 4.97 1.6 5.95 1.4 6.69 1.1 7.37 0.8 0.08 4.55 1.7 5.34 1.6 5.99 1.2 6.55 0.9 0.1 3.38 1.8 3.89 1.7 4.22 1.4 4.61 1.1 0.15 1.86 2.1 2.11 1.9 2.28 1.6 2.44 1.2 0.2 1.39 2.1 1.54 2.0 1.66 1.6 1.74 1.2 0.3 1.08 2.2 1.18 2.1 1.27 1.7 1.31 1.3 0.5 9.68×10⁻¹ 2.4 1.03 2.3 1.09 1.9 1.12 1.5 1 9.15×10⁻¹ 2.8 9.88×10⁻¹ 2.8 1.01 2.3 1.02 1.8 3 9.28×10⁻¹ 3.7 9.81×10⁻¹ 3.6 1.00 3.0 1.01 2.4 6 9.97×10⁻¹ 4.2 1.06 4.1 1.07 3.4 1.08 2.7
10 1.10 4.4 1.15 4.3 1.16 3.6 1.18 2.8
– 52 –
Table 4.6. Dose conversion coefficients for enamel of deciduous teeth for ROT photon source. Values are averages between left and right teeth.
Ck,T (Gy Gy−1) and 2σ-errors (%) E (MeV) Incisors (A,B) Canine (C) 1st molar (D) 2nd molar (E)
0.01 1.02×10⁻³ 20 9.36×10⁻⁴ 20 5.21×10⁻⁴ 23 1.82×10⁻⁴ 31 0.015 7.33×10⁻² 4.4 7.28×10⁻² 4.4 6.10×10⁻² 4.0 3.75×10⁻² 4.0 0.02 3.62×10⁻¹ 3.1 3.58×10⁻¹ 3.1 3.25×10⁻¹ 2.7 2.40×10⁻¹ 2.5 0.03 1.52 2.8 1.51 2.8 1.41 2.4 1.19 2.1 0.04 3.31 2.8 3.23 2.8 3.06 2.4 2.86 2.0 0.05 4.77 3.0 4.70 3.0 4.52 2.5 4.42 2.0 0.06 5.23 3.2 5.16 3.3 5.04 2.7 5.01 2.2 0.07 4.74 3.5 4.65 3.6 4.58 3.0 4.78 2.4 0.08 4.38 3.8 4.19 3.8 4.24 3.2 4.29 2.5 0.1 3.26 4.2 3.12 4.2 3.13 3.5 3.16 2.8 0.15 1.80 4.7 1.73 4.8 1.74 3.9 1.75 3.1 0.2 1.25 4.8 1.28 4.9 1.27 4.0 1.28 3.1 0.3 9.78×10⁻¹ 4.9 9.69×10⁻¹ 5.0 9.88×10⁻¹ 4.1 9.94×10⁻¹ 3.3 0.5 8.60×10⁻¹ 5.5 8.57×10⁻¹ 5.5 8.71×10⁻¹ 4.5 8.57×10⁻¹ 3.6 1 8.72×10⁻¹ 6.4 8.46×10⁻¹ 6.4 8.59×10⁻¹ 5.3 8.18×10⁻¹ 4.3 3 8.84×10⁻¹ 8.2 8.78×10⁻¹ 8.2 9.13×10⁻¹ 6.7 8.89×10⁻¹ 5.4 6 9.89×10⁻¹ 9.2 9.79×10⁻¹ 9.2 9.80×10⁻¹ 7.6 9.72×10⁻¹ 6.1
10 1.11 9.5 1.09 9.5 1.09 8.0 1.05 6.5
Table 4.7. Dose conversion coefficients for enamel of deciduous teeth for ISO photon source. Values are averages between left and right teeth.
Ck,T (Gy Gy−1) and 2σ-errors (%) E (MeV) Incisors (A,B) Canine (C) 1st molar (D) 2nd molar (E)
0.01 4.32×10⁻⁴ 42 3.54×10⁻⁴ 46 2.85×10⁻⁴ 43 5.72×10⁻⁵ 75 0.015 4.86×10⁻² 7.4 4.54×10⁻² 7.7 3.80×10⁻² 7.0 2.14×10⁻² 7.4 0.02 2.76×10⁻¹ 4.9 2.61×10⁻¹ 5.0 2.33×10⁻¹ 4.4 1.65×10⁻¹ 4.2 0.03 1.33 4.2 1.27 4.3 1.18 3.7 9.80×10⁻¹ 3.2 0.04 2.98 4.1 2.92 4.1 2.76 3.5 2.45 3.0 0.05 4.28 4.3 4.21 4.4 4.10 3.7 3.84 3.0 0.06 4.76 4.7 4.63 4.7 4.53 4.0 4.25 3.2 0.07 4.26 5.1 4.23 5.1 4.06 4.3 3.87 3.5 0.08 3.94 5.4 3.82 5.5 3.79 4.6 3.57 3.7 0.1 2.83 6.1 2.86 6.1 2.68 5.2 2.75 4.1 0.15 1.59 6.7 1.57 6.8 1.52 5.7 1.58 4.5 0.2 1.16 6.9 1.14 6.8 1.15 5.8 1.17 4.5 0.3 8.99×10⁻¹ 7.3 8.65×10⁻¹ 7.2 8.69×10⁻¹ 6.0 9.05×10⁻¹ 4.7 0.5 8.48×10⁻¹ 7.9 7.75×10⁻¹ 7.9 7.75×10⁻¹ 6.6 8.21×10⁻¹ 5.2 1 7.72×10⁻¹ 9.3 7.39×10⁻¹ 9.5 7.74×10⁻¹ 7.6 8.06×10⁻¹ 6.0 3 9.13×10⁻¹ 11 8.62×10⁻¹ 12 8.21×10⁻¹ 9.8 8.88×10⁻¹ 7.6 6 1.03 13 8.99×10⁻¹ 13 9.10×10⁻¹ 11 9.74×10⁻¹ 8.5
10 1.11 13 9.46×10⁻¹ 14 9.94×10⁻¹ 12 1.10 8.8
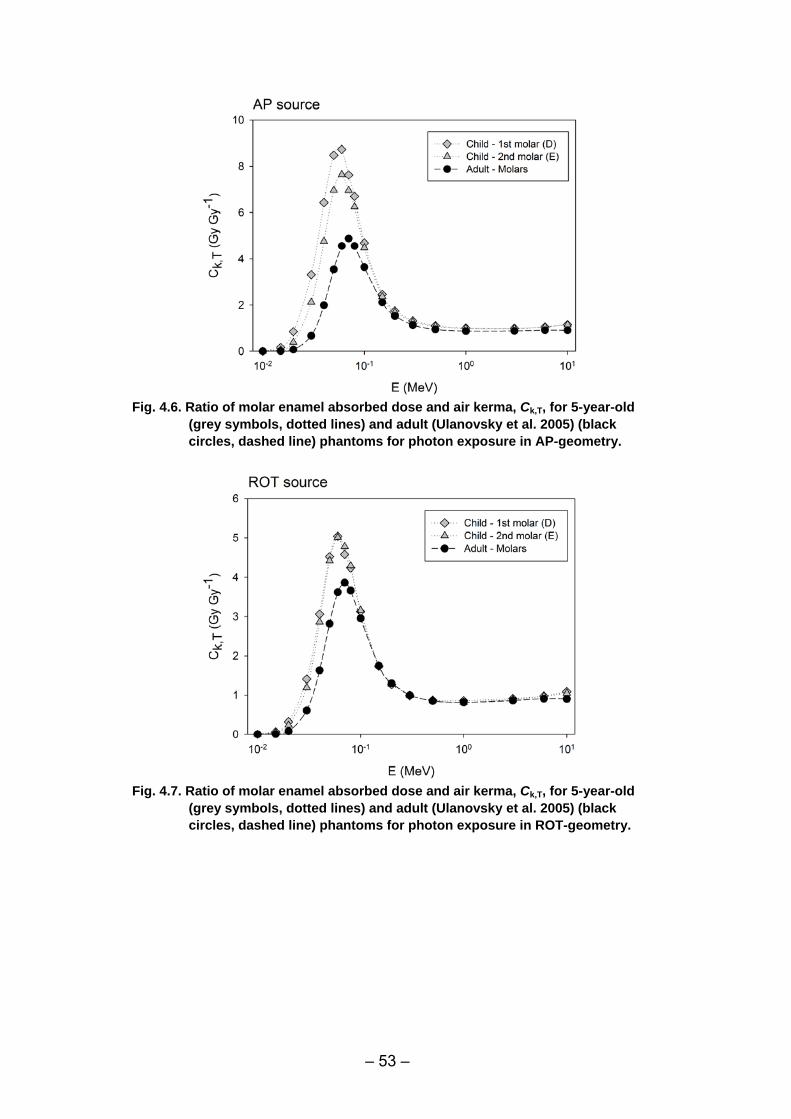
– 53 –
Fig. 4.6. Ratio of molar enamel absorbed dose and air kerma, Ck,T, for 5-year-old
(grey symbols, dotted lines) and adult (Ulanovsky et al. 2005) (black circles, dashed line) phantoms for photon exposure in AP-geometry.
Fig. 4.7. Ratio of molar enamel absorbed dose and air kerma, Ck,T, for 5-year-old
(grey symbols, dotted lines) and adult (Ulanovsky et al. 2005) (black circles, dashed line) phantoms for photon exposure in ROT-geometry.
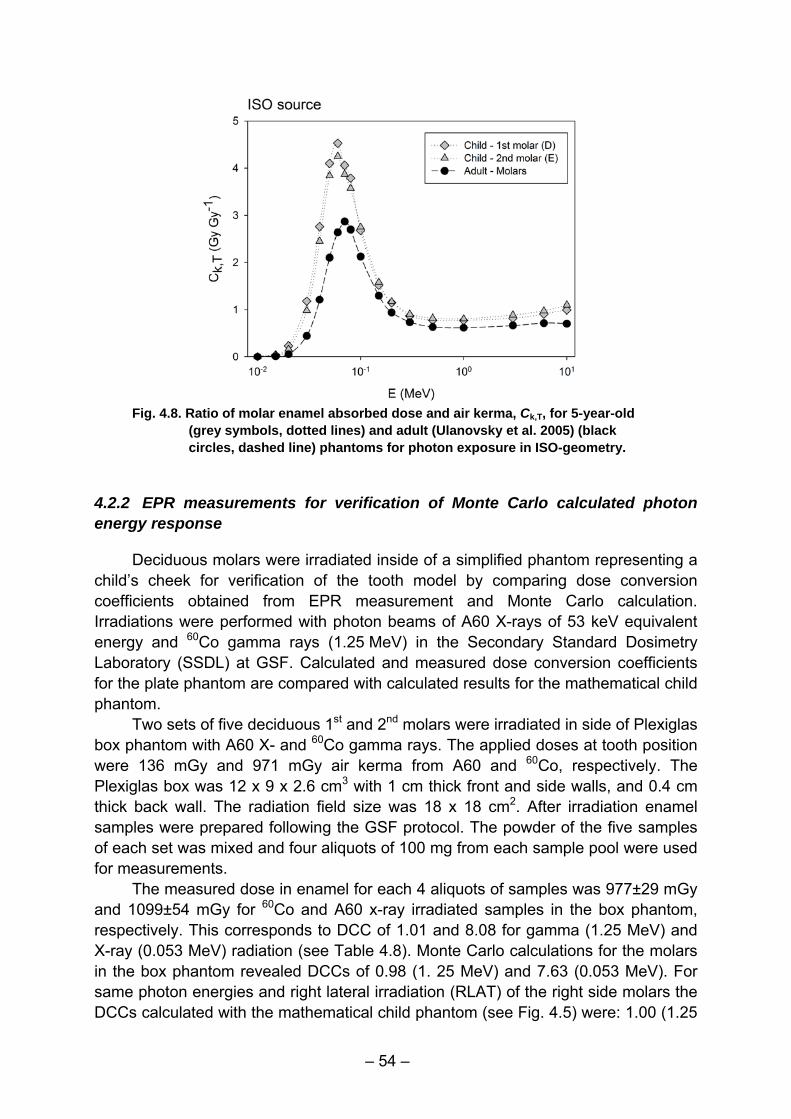
– 54 –
Fig. 4.8. Ratio of molar enamel absorbed dose and air kerma, Ck,T, for 5-year-old
(grey symbols, dotted lines) and adult (Ulanovsky et al. 2005) (black circles, dashed line) phantoms for photon exposure in ISO-geometry.
4.2.2 EPR measurements for verification of Monte Carlo calculated photon energy response
Deciduous molars were irradiated inside of a simplified phantom representing a child’s cheek for verification of the tooth model by comparing dose conversion coefficients obtained from EPR measurement and Monte Carlo calculation. Irradiations were performed with photon beams of A60 X-rays of 53 keV equivalent energy and 60Co gamma rays (1.25 MeV) in the Secondary Standard Dosimetry Laboratory (SSDL) at GSF. Calculated and measured dose conversion coefficients for the plate phantom are compared with calculated results for the mathematical child phantom.
Two sets of five deciduous 1st and 2nd molars were irradiated in side of Plexiglas box phantom with A60 X- and 60Co gamma rays. The applied doses at tooth position were 136 mGy and 971 mGy air kerma from A60 and 60Co, respectively. The Plexiglas box was 12 x 9 x 2.6 cm3 with 1 cm thick front and side walls, and 0.4 cm thick back wall. The radiation field size was 18 x 18 cm2. After irradiation enamel samples were prepared following the GSF protocol. The powder of the five samples of each set was mixed and four aliquots of 100 mg from each sample pool were used for measurements.
The measured dose in enamel for each 4 aliquots of samples was 977±29 mGy and 1099±54 mGy for 60Co and A60 x-ray irradiated samples in the box phantom, respectively. This corresponds to DCC of 1.01 and 8.08 for gamma (1.25 MeV) and X-ray (0.053 MeV) radiation (see Table 4.8). Monte Carlo calculations for the molars in the box phantom revealed DCCs of 0.98 (1. 25 MeV) and 7.63 (0.053 MeV). For same photon energies and right lateral irradiation (RLAT) of the right side molars the DCCs calculated with the mathematical child phantom (see Fig. 4.5) were: 1.00 (1.25
– 55 –
MeV, 1st and 2nd molar), 7.60 (0.053 MeV, 1st molar) and 8.40 (0.053 MeV, 2nd molar).
For irradiation of deciduous molars in a Plexiglas with photon energy at 1.25 MeV and 0.053 MeV the difference between calculated and measured DCCs was in the worst case 6%. This indicates the proper choice of the tooth model used in Monte Carlo calculations for the box phantom. It can be considered as validation of the tooth model which is also used for calculations in the mathematical child phantom (Wieser et al. 2006c).
Table 4.8. Results of measured and calculated dose conversion factors of deciduous
molars for absorbed dose in enamel to air kerma. absorbed dose in enamel dose / air kerma
Molar sample, phantom
Photon energy,
MeV measured calculated ratio meas./cal.
mixed 1st/2nd, box phantom 1.25 1.01 0.98 1.03
1st, math. phantom 1.25 – 1.00 –
2nd, math. phantom 1.25 – 1.00 –
mixed 1st/2nd, box phantom 0.053 8.08 7.63 1.06
1st, math. phantom 0.053 – 7.60 –
2nd, math. phantom. 0.053 – 8.40 –
– 57 –
5 OVERALL CONCLUSIONS AND RECOMENDATIONS FOR PRODUCERS
5.1 Chip cards as individual dosimeters
It is shown that some telephone chip cards possess luminescence properties that are suitable for use as individual dosimeters above 250 mGy. However, the chip card production is a very fast developing technology. Therefore, it was essential to find out the component that is responsible for producing radiation induced luminescence signal and improve its dosimetric properties that can be used in emergency situations as individual dosimeters.
Working close collaboration with one of the major card producing factory, (INFINEON), it was concluded that the globe-top which consist of 45% SiO2 and epoxy may be the main source of the radiation induced signal.
The source of the ‘initial zero dose’ signal and the ‘recovery signal’ are found to be the main limiting factors for detecting low doses. The latest products such as ‘Flip chips’ (2005) are usually fixed on the strips with a very little amount of glue containing SiO2, found to less sensitive to radiation than conventional chip cards. The lower dose detection limit is found to be at least 10 times higher than card produced before 2000.
Taking into account the results of luminescence measurements of modules of chip cards obtained various stage of production, and strips , glues and fillers used latest models of chip cards , it is concluded that:
• The intensity of the IRSL strongly dependent on temperature of the sample during the stimulation.
• The background of IRSL signal (the tail of the signal) gradually increases after several cycles of measurements.
• The initial signal observed in Module 0,1,3,7 could not be attributed to radiation.
• An initial signal observed in some products is attributed to exposure of UV light (UV light sometimes is used to cure the mixture Epoxy and SiO2).
• In most of the cases the initial signal could be eliminated using heat treatment over 225°C, TL and BLSL can also be to evaluate radiation dose.
New generation of chip cards (flip chips) are also found to respond to radiation but with lower sensitivity. The magnitude of initial ‘zero dose’ signal is found to be relatively higher with respect to radiation induced signal. Minimum detectible dose in such type of cards can not be less than few Gy.
It is recommended that, in order to minimize the ‘zero dose signal’, the globe top mixtures should be cured with heat rather than UV light and if possible raw material ( SiO2 usually a natural geological mat) may need to be heated at high temperatures to eliminate the possible geological dose.
As it was described in Section 3.1, that the globe top is the main source radiation induced signal in chip cards. In order to improve the dosimetric properties of
– 58 –
the chip cards, the fillers provided by INFINEON is mixed with various amount of artificial phosphor and the prepared mixture is studied using luminescence dose measurement techniques.
Using heat cured epoxy and performing the measurements at low doses immediately after irradiation it is shown that 10 mGy of external dose can be detected using heat cured disks mixed 1% phosphors material such as Al2O3:C or LiF:Cu and 2% BeO. However, due to initial background signal and gradual increase of the non radiation induced signal, residual signal from previous read-out measurements, the realistic detectable limits were found to be in the order of 100 mGy.
BeO and LiF have the advantage that they are tissue equivalent material. On the other hand Al2O3:C and BeO have the advantage that they can be evaluated using both TL and OSL. Furthermore, it is essential that the globe tops have to be heat cured to minimize the initial signal. It is further recommended that the geological material used for production of globe top (SiO2) need to be combusted at higher temperatures such as above 400°C to obtain fillers.
5.2 Teeth as individual dosimeters
It is known that individual dose after emergency situations can be reconstructed by assessment of absorbed dose in human tooth enamel by electron paramagnetic resonance (EPR) measurements. For permanent teeth photon energy response of tooth enamel from teeth in different tooth positions was calculated by Monte Carlo simulation and conversion coefficients for dose in organs are available for adults. Hence, if information on the exposure scenario is available integral air kerma, effective dose and dose in organs can be evaluated for adults from the absorbed dose in tooth enamel.
Limitations of reconstructing individual dose by EPR with teeth existed due to difficulties in performing reliable measurement of low doses close to 100 mGy and the lack of possibility to assess the integral air kerma for children from absorbed dose in deciduous molars. In this project the applicability of EPR measurements with teeth was extended by reducing the detection threshold and computation of the photon energy response for deciduous teeth. This will provide the possibility to evaluate integral air kerma for children from absorbed dose in enamel which is the basis for evaluation of dose in organs if conversion coefficients for dose in organs will be available for children later on.
It is shown that current limitation of EPR measurement with teeth at low absorbed dose is caused by incomplete consideration of the EPR spectrum of non-radiation induced (initial) radicals. By assessing the dosimetric signal using an earlier deconvolution method with insufficient number background signal components the critical dose, i.e. the detection threshold was found at 89 mGy. Application of the new improved deconvolution method with additional EPR signal components resulted in strong decrease of the critical dose to 19 mGy. Now, with EPR measurement of tooth enamel absorbed doses above 19 mGy are detectable.
– 59 –
A software tool was established that allows for conversion of the measured dose in tooth enamel from permanent and deciduous teeth by EPR, and chip cards by TL/IRSL to integral air kerma, dose to tissue and dose to water in dependence on exposure scenario. The tool includes data on photon energy response of permanent teeth and from this project Monte Carlo simulated dose conversion coefficients for deciduous teeth in dependence of photon energy and standard exposure geometry (AP, PA, RLAT/LLAT, ROT, ISO) and for chip cards experimentally determined dose conversion coefficients for AP exposure.

– 61 –
ACKNOWLEDGEMENTS
This work has been supported by the German Federal Ministry of Environment, Nature Preservation and Reactor Safety and the German Federal Office of Radiation Protection under contract number StSch 4411. Furthermore, we would like to thank to C. Pröhl for providing a large number of telephone cards from his valuable collection. We would also like to thank to Dr. P. Jacob for his scientific advice and contributions at various stages of this project. This work would not be possible without fruitful discussions with Dr. T. Spoettle from INFINEON which had provided chip cards at various stages of their production.
– 63 –
REFERENCES
Ankerhold U. (2000) Catalogue of X-ray spectra and their characteristic data – ISO and DIN radiation qualities, diagnostic and therapy radiation qualities, unfiltered X-ray spectra –. Braunschweig: PTB, Report PTB-Dos-34; ISBN 3-89701-513-7.
Bielajew A.F. and Rogers D.W.O. (1987) PRESTA: parameter reduced electron-step transport algorithm for electron Monte Carlo transport. Nuclear Instruments and Methods B, 18, 165–181.
Botter-Jensen, L. Ditlefsen, C. and Mejdahl, V., 1991. Combined OSL (infrared) and TL studies of feldspars. Nuclear Tracks and Radiation Measurements 18, pp. 257–263.
Brady J.M, Aerestad N.O, Swartz H.M. (1968) In vivo dosimetry by electron spin resonance spectroscopy. Health Phys., 15, 43-47.
Bulur E. and Göksu H.Y. (1999) Infrared stimulated luminescence from feldspar with linearly increasing light intensity. Radiat. Meas. 30/4, 505-512.
Bulur E. and Göksu H.Y., Wahl W. (1998) Infrared Stimulated Luminescence from α-Al2O3: C Radiat. Meas., 29, 625-636.
Bulur E., Göksu H.Y. (1998) OSL from BEO ceramics: new observations from an old material. Radiat. Meas. 29, 639-650
Chumak V.V., Sholom S.V., Likhtarev I.A. (1996) Some Results of Retrospective Dose Reconstruction for Selected Groups of Exposed Population in Ukraine. In: Proc. Symp. On The Radiological Consequences of the Chernobyl Accident. EUR 16544 EN, pp. 1059-1062
Copeland, J.F., Gall K.P., Lee S.Y., Chabot G.E. (1996) Proton dosimetry in bone using electron spin resonance. Appl. Radiat. Isot. 47, 1533-1538.
Cristy M. (1980) Mathematical phantoms representing children of various ages for use in estimates of internal dose. ORNL Report ORNL/NUREG/TM–367. Oak Ridge National Laboratory. Oak Ridge, TN.
Cristy M. and Eckerman K.F. (1987) Specific absorbed fractions of energy at various ages from internal photon sources. I. Methods. ORNL Report ORNL/TM–8381/V1. Oak Ridge National Laboratory. Oak Ridge, TN.
Degteva M.O., Anspaugh L.R., Akleyev A.V., Jacob P., Ivanov D.V., Wieser A., Vorobiova M.I., Shishkina E.A., Shved V.A., Vozilova A., Bayankin S.N., Napier B.A. (2005) Electron paramagnetic resonance and fluorescence in situ hybridization-based investigations of individual doses for persons living at Metlino in the upper reaches of the Techa River. Health Phys., 88, 139-153.
Driessens F.C.M., Verbeeck R.M.H. (1990) Biominerals. (CRC Press, Inc.) ISBN 0-8493-5280-0, 417 pages.
El-Faramawy N. and Wieser A. (2006) The use of deciduous molars in EPR dose reconstruction. Radiat. Environ. Biophys., 44, 273-277.
Fattibene P., Angelone M., Pillon M., De Coste V. (2003) Tooth enamel dosimetric response to 2.8 MeV neutrons. Nucl. Instr. Meth. B, 201, 480-490.
Göksu H.Y., Regulla D, Drexler G. (1994) Present status of practical aspects of individual dosimetry Part I: EU Member States, European Commission, Radiation Protection 78, ISBN 92-827-0174-3, Printed in UK.
Göksu H.Y., Regulla D, Drexler G. (1994) Present status of practical aspects of individual dosimetry Part II: East European Countries, European Commission, Radiation Protection 78, ISBN 92-827-0175-1, Printed in UK.
Göksu H.Y, Bulur E. (1999): Beta dosimetry using thin layer α-A1203: C TL detectors, Radiat. Prot. Dosim. 84, S. 451-457.
Göksu, H.Y., Meckbach R. Wieser A., Niedermayer M. (2003) St. Sch 4225, Dosisrekonstruktionen im Ereignisfall mit Hilfe von Lumineszenz- ESR-Methoden an Umgebungsmaterialen, Abschlussbericht, Un published report.
Göksu, H.Y. (2003) Telephone chip cards as individual dosemeters, Radiation Measurements, 37, 617-620
– 64 –
Göksu H.Y., Bailiff I.K., Bøtter Jensen L., Hütt G. (1995) Interlaboratory beta source calibration using TL and OSL on natural quartz, Radiat. Prot. Dosim. 24/4, 479-483.
Göksu, H.Y., Bailiff, I.K. (2006) Luminescence Dosimetry using building materials and Personal objects, Radiation Protection Dosimetry.
Göksu H.Y., Spoettle T. (2006) Improving the radiation sensitivity of chip cards. Poster presented at 10th Euro Physical Conference on Defects in Insulating Materials (EURODIM 2006) which will be held at the University of Milano-Bicocca on July 10-14, 2006.
Hubbell J.H. and Seltzer S.M. (1995) Tables of X-Ray Mass Attenuation Coefficients and Mass Energy-Absorption Coefficients (version 1.03) [online]. Available: http://physics.nist.gov/xaamdi. Assessed 24 March 2003. National Institute of Standards and Technology, Gaithersburg, MD. Originally published as NISTIR 5632, National Institute of Standards and Technology, Gaithersburg, MD.
Huntley D.J., Godfrey-Smith D.I. and Thewalt M.L.W. (1985) Optical Dating of Sediments. Nature, 313, 105-107.
Hütt G., Jaek I. and Tchonka J. (1988) Optical Dating: K feldspars optical response stimulation spectra. Quaternary Science Reviews 7, 381-385.
IAEA (1988) The radiological accident in Goiânia, IAEA, STI/PUB/815, 132pp, Vienna-Austria. IAEA (1998) The radiological accident in Tammiku- IAEA, STI/PUB/ 1053, 59pp, Vienna Austria. IAEA (2002) Use of electron paramagnetic resonance dosimetry with tooth enamel for retrospective
dose assessment. IAEA, Vienna 2002, IAEA-TECDOC-1331, ISBN 92-0-119402-1. ICRP (1975) Report of the Task Group on Reference Man. ICRP Publication 23. Pergamon, Oxford ICRP (1996) Conversion coefficients for use in radiological protection against external radiation. ICRP
Publication 74. Annals of the ICRP 26(3–4): 1–205. Pergamon Press, Oxford. ICRP (2002) Basic Anatomical and Physiological Data for Use in Radiological Protection: Reference
Values. ICRP Publication 89. Annals of the ICRP 32(3–4). Pergamon, Oxford ICRU (1992) Measurement of dose equivalents from external photon and electron radiations.
International Commission on Radiation Units and Measurements: Bethesda, MD; ICRU Publication 47
ICRU (1998) Fundamental quantities and units for ionizing radiation. International Commission on Radiation Units and Measurements: Bethesda, MD; ICRU Publication 60
ICRU (2002) Retrospective assessment of exposures to ionizing radiation. ICRU Report 68, ICRU, Bethesda 2002
Ikeya M. (1993) New applications of electron spin resonance-dating, dosimetry and microscopy. Singapore: World Scientific.
Ivannikov A.I., Skvortsov V.G., Stepanenko V.F., Tikunov D.D., Fedosov I.M., Romanyukha A.A., Wieser A. (1997) Wide scale EPR retrospective dosimetry. Results and problems. Radiat. Prot. Dosim., 71, 175-180.
Ivannikov A.I., Zhumadilov Zh., Gusev B.I., Miyazawa Ch., Jiao L., Skvortsov V.G., Stepanenko V.F., Takada J., Hoshi M. (2002) Individual dose reconstruction among residents living in the vicinity of the Semipalatinsk nuclear test site using EPR spectroscopy of tooth enamel. Health Phys., 83, 183-196.
Koshta A.A., Wieser A., Ignatiev E.A., Bayankin S., Romanyukha A.A., Degteva M.O. (2000) New computer procedure for routine EPR-dosimetry on tooth enamel. Description and verification. Appl. Radiat. lsot., 52, 1287-1290.
Liidja G., Past J., Puskar J., Lippmaa E. (1996) Paramagnetic resonance in tooth enamel created by ultraviolet light. Appl. Radiat. Isot., 47, 785-788.
Mathur V.K., Barkyoumb, J.H., Yukihara E.G., Göksu H.Y (2007) Radiation Sensitivity of memory chip module of an ID card. Radiation measurements, 42, 43-48.
MCNP (2000) MCNP4 – A general Monte Carlo N-particle transport code. Version 4c. J.F. Briesmeister, Ed. LANL Report LA-13079-M. Los Alamos National Laboratory, Los Alamos
Moens P.D.W., Callens F.J., Verbeeck R.M.H. and Naessens D.E. (1993) An EPR Spectrum Decomposition Study of Precipitated Carbonated Apatites (NCAP) Dried at 25°C: Absorption of Molecules from Atmosphere on the Apatite Powders. Appl. Radiat. Isot., 44, 279-285.
– 65 –
Nakamura N., Miyazawa C., Akiyama M., Sawada S., Awa AA. (1998) A close correlation between electron spin resonance (ESR) dosimetry from tooth enamel and cytogenetic dosimetry from lymphocytes of Hiroshima atomic-bomb survivors. Int. J. Radiat. Biol., 73, 619-627.
Nilsson J., Lund E., Lund A. (2001) The effects of UV-irradiation on the ESR-dosimetry of tooth enamel. Appl. Radiat. Isot., 54, 131-139.
Olko, P., Bilski, P., El Faramawy, N., Göksu, H.Y., Kim, J.L., Kopec, R., Waligorski, M.P.R., 2006. On the relationship between dose, energy and LET response of themoluminescence detectors. Radiation Protection Dosimetry 119, 15-22.
Schwarcz H.P (1985) ESR studies of tooth enamel. Nucl. Tracks and Rad. Meas., 10, 865-867 Skinner A.R., Blackwell B.A.B., Chasteen N.D., Shao J., Min S. S. (2000) Improvements in Dating
Tooth Enamel by ESR. Appl. Radiat. Isot., 52, 1337-1344. Skvortsov V.G., Ivannikov A.I., Stepanenko V.F., Tsyb A.F., Khamidova L.G., Kondrashov A.E.,
Tikunov D.D. (2000) Application of EPR retrospective dosimetry for large-scale accidental situation. Appl. Radiat. Isot., 52, 1275-1282.
Stuglik Z. and Sadlo J. (1996) A response of L-a alanine and standard bone powder on 3.4 MeV/amu 59Co ions beams. Appl. Radiat. Isot., 47, 1219-1222.
Taranenko V., Meckbach R., Panzer W., Göksu H.Y. and El-Faramawy N. (2004) Monte Carlo simulation of energy deposition in dental ceramics and aluminium oxide and comparison with luminescence measurement. 10th International Conference of Radiation Shielding (ICRS-10) on Madeira Island, Portugal, 2004.
Ulanovsky A. and Eckerman K. (1998) Modifications to the ORNL Phantom Series in Simulation of the Responses of Thyroid Detectors. Radiat. Prot. Dosim., 79, 429–431.
Ulanovsky A., Wieser A., Zankl M., Jacob P. (2005) Photon Dose Conversion Coefficients for Human Teeth in Standard Irradiation Geometries. Health Phys., 89, 645-659.
Vasilenko E.K., Smetanin M.Y., Knyazev V.A., Slaughter M., Jacob P., David J., Feherbaher G. (2000) Approach to retrospective reconstruction of the photon exposure spectra at the technological sites of "Mayak" PA. Radiation Safety Problems. Scientific Journal of "Mayak" PA 3:42–50; 2000. (In Russian)
Wieser A., El-Faramawy N., Meckbach R. (2001) Dependencies of the radiation sensitivity of human tooth enamel in EPR dosimetry. Appl. Radiat. Isot. 54, 793-799.
Wieser A., Aragno D., El-Faramawy N., Fattibene P., Meckbach R., Onori S., Presselo M.C., Pugliani L., Ulanovsky A., Zankl M. (2002) Monte Carlo calculation and experimental verification of the photon energy response of tooth enamel in a head-sized Plexiglas phantom. Radiat. Prot. Dosim., 101, 549–552.
Wieser A., Debuyst R., Fattibene P., Meghzifene A., Onori S., Bayankin S.N, Brik A., Bugay A., Chumak V., Ciesielski B., Hoshi M., Imata H., Ivannikov A., Ivanov D., Junczewska M., Miyazawa C., Penkowski M., Pivovarov S., Romanyukha A., Romanyukha L., Schauer D., Scherbina O., Schultka K., Sholom S., Skvortsov V., Stepanenko V., Thomas J.A., Tielewuhan E., Toyoda S., Trompier F. (2006a) The 3rd international intercomparison on EPR tooth dosimetry: Part 2, Final Analysis. Radiat. Prot. Dosim. 120, 176-183.
Wieser A., Vasilenko E., Fattibene P., Bayankin S., El-Faramawy N., Ivanov D., Jacob P., Knyazev V., Onori S., Pressello M.C., Romanyukha A., Smetanin M., Ulanovsky A. (2006b) Comparison of EPR occupational lifetime external dose assessments for Mayak nuclear workers and film badge dose data. Radiat. Environ. Biophys., 44, 279-288.
Wieser A., Güttler A., Ulanovsky A. (2006c) EPR measurement and Monte Carlo calculation of dose conversion coefficients for deciduous teeth. Presented at the 2nd International Conference on Biodosimetry and 7th International Symposium on EPR Dosimetry and Applications (BiodosEPR-2006), Uniformed Services University of the Health Sciences (USUHS), Bethesda, USA, 10-13 July 2006.
Zdravkova M., Denis J-M., Gallez B., Debuyst R. (2002) Sensitivity of whole human teeth to fast neutrons and gamma-rays estimated by L-band EPR spectroscopy. Radiat. Meas., 35, 603-608.
Zdravkova M., Wieser A., El-Faramawy N., Ivanov D., Gallez B., Debuyst R. (2003) An in vitro L-band EPR study with whole human teeth in a surface coil resonator. Radiat. Meas., 37, 347–353.


![Bachelorarbeit Optimierung eines Aufbaus zur ... · Die Luft- und Raumfahrt macht sich die Dosimetrie beispielsweise bei dem Matroschkaexperiment zu Nutzen [ESA]. Dieses Experiment](https://img.pdfslide.org/doc/110x75/5e0449bf0526621152356177/bachelorarbeit-optimierung-eines-aufbaus-zur-die-luft-und-raumfahrt-macht-sich.jpg)