Embed Size (px)
Citation preview
Canopy: An End-to-End PerformanceTracing And Analysis System
Jonathan Kaldor† Jonathan Mace∗ Michał Bejda† Edison Gao† Wiktor Kuropatwa†Joe O’Neill† KianWin Ong† Bill Schaller† Pingjia Shan† Brendan Viscomi†
Vinod Venkataraman† Kaushik Veeraraghavan† Yee Jiun Song†
†Facebook ∗Brown University
AbstractThis paper presents Canopy, Facebook’s end-to-end perfor-mance tracing infrastructure. Canopy records causally relatedperformance data across the end-to-end execution path ofrequests, including from browsers,mobile applications, andbackend services. Canopy processes traces in near real-time,derives user-specified features, and outputs to performancedatasets that aggregate across billions of requests.UsingCanopy,Facebook engineers can query and analyze performance datain real-time. Canopy addresses three challenges we have en-countered in scaling performance analysis: supporting therange of execution and performance models used by differ-ent components of the Facebook stack; supporting interac-tive ad-hoc analysis of performance data; and enabling deepcustomization by users, from sampling traces to extractingand visualizing features. Canopy currently records and pro-cesses over 1 billion traces per day.We discuss howCanopy hasevolved to apply to a wide range of scenarios, and present casestudies of its use in solving various performance challenges.
1 IntroductionEnd-users of Facebook services expect a consistently perfor-mant experience. However, understanding, analyzing, andtroubleshooting performance can be difficult. End-users canperform a wide range of actions and access Facebook throughheterogeneous clients, including web browsers and mobileapps, which offer varying levels of information and controlover the application. Each action, such as loading a page onFacebook.com, entails complex executions spanning clients,networks, and distributed back-end services.
Permission tomake digital or hard copies of part or all of thiswork for personalor classroom use is granted without fee provided that copies are not made ordistributed for profit or commercial advantage and that copies bear this noticeand the full citation on the first page. Copyrights for third-party componentsof this work must be honored. For all other uses, contact the owner/author(s).SOSP ’17, October 28, 2017, Shanghai, China© 2017 Copyright held by the owner/author(s).ACM ISBN 978-1-4503-5085-3/17/10.https://doi.org/10.1145/3132747.3132749
Dynamic factors also influence performance, such as con-tinuous deployment of new code, changing configurations,user-specific experiments, and datacenters with distinct char-acteristics. The metrics and events relevant to performanceare diverse and continually changing; different endpoints mayhave different metric definitions, while some endpoints en-compass end-to-end flows that cross multiple layers of thesystem stack. Engineers need ready access to performancedata, ideally tailored to the problem they’re trying to solve andthe questions they typically ask.
This paper describes the design and implementation ofCanopy, Facebook’s end-to-end performance tracing infras-tructure. Canopy is a pervasive tracing infrastructure thatrecords and processes performance traces, combining perfor-mance data from the end-to-end execution path with struc-tured and causally-related execution traces, to enable cus-tomized performance analysis. Canopy extends prior tracingsystems such as X-Trace [24] and Dapper [54]; at its core,Canopy constructs traces by propagating identifiers throughthe system to correlate information across components. How-ever, Canopy addresses three broader challenges we have facedat Facebook in using tracing to solve performance problems.
First, end-to-end performance data is heterogeneous, withmultiple execution models andwide variations in the granular-ity and quality of data available to be profiled. Consuming in-strumented data directly is cumbersome and infeasible at scalebecause engineers and tools must understand themappingsfrom low-level event data to higher-level semantic structuresacross all components of Facebook’s stack. However, designat-ing a higher-level model in instrumentation leads to issuesbecause instrumentation is pervasive, includes legacy compo-nents,must anticipate future components, and is difficult tochange even when integrated into common infrastructure.
Second, there is amismatch in granularity between the high-level, aggregated, exploratory analysis that operators performin practice, and the rich, fine-scale data in a single trace. Eval-uating interactive queries over raw traces is computationallyinfeasible, because Facebook captures over one billion tracesper day,with individual traces comprising thousands of events.Nonetheless, rapidly solving performance problems requires
SOSP ’17, October 28, 2017, Shanghai, China J. Kaldor et al.
tools that can efficiently slice, group, filter, aggregate, and sum-marize traces based on arbitrary features.
Finally, end-to-endperformance over thewhole stackmeansmany engineers share the same tracing infrastructure. Onlya small fraction of data in each tracemay be relevant to eachengineer, pertaining to specific features or products under in-vestigation. However, by design, traces contain all of the datanecessary for any engineer to identify issues. This presentsan information overload, andmotivates the need for both (1)generalized interfaces as an entry-point for casual usage andhigh-level scenarios, and (2) deep customization of everythingfrom the traces to sample, to the features to extract, to theways to navigate the extracted data.
Canopy addresses these challenges with a complete pipelinefor extracting performance data from system-generated tracesacross the stack, including browsers,mobile applications, andbackend services. Canopy emphasizes customization at eachstep of the pipeline, and provides a novel separation of con-cerns between components to allow for their individual evo-lution. At development time, Facebook engineers can instru-ment their systems using a range of APIs tailored to differentexecution models. At runtime, Canopy maps the generatedperformance data to a flexible underlying event-based repre-sentation. Canopy’s backend pipeline receives events in near-realtime; reconstructs a high-level trace model that is moreconvenient for analyzing and querying; extracts user-specifiedfeatures from traces; and outputs the results to datasets forcustomized aggregate visualizations.Canopy has been deployed in production at Facebook for
the past 2 years, where it generates and processes 1.3 billiontraces per day spanning end-user devices, web servers, andbackend services, and backs 129 performance datasets rangingfrom high-level end-to-endmetrics to specific customized usecases. This paper makes the following contributions:● A decoupled design for tracing that separates instrumenta-
tion from the tracemodel, enabling independent evolutionand the composition of different execution models.
● A complete pipeline to transform traces into a custom setof extracted features to enable rapid analysis.
● A set of customizable tracing components to providemulti-ple views of the same data for different use cases.
The rest of this paper proceeds as follows.We discuss previ-ous experiences with tracing andmotivate Canopy in §2. In§3-4 we describe Canopy’s design and implementation. Wepresent case studies and evaluation in §5. Finally, we discussour experiences, related work, and future challenges in §6-8.
2 MotivationFor several years prior toCanopy, a number of tracing systemswere developed at Facebook to address various single- and
cross-system performance scenarios. Each system was spe-cialized for a specific use case and difficult to extend to otherdomains. For example, backend services had RPC call-treeinstrumentation that was difficult to adapt to other executionmodels like event loops. Browser page-load tracing focusedon joining data from the client and a single server, and haddifficulty scaling to cover other backend systems. Mobile ap-plications had standaloneOS-provided tracing that lacked theability to look at aggregate production data. In each of thesecases, analysis over traces was confined to fixed workflows,with limited customization for per-domain features and slowiteration time for new features or analyses.
This siloed approach to tracing led to several problems. Itwas difficult to get cross-system insights when the tools them-selves didn’t cross all systems, and it meant that engineersneeded to understandmultiple tracing tools and when to useand switch between them. Each tracing system evolved tomeetspecific needs and respond to gaps in other tracing systems,but no single system could handle the broad spectrumof issuesthat arise in practice. The type of analysis supported by eachsystem was also fairly rigid and changes took days to deploy.
Based on these experiences we designed Canopy, a flexiblemulti-domain tracing system for consuming and analyzingtrace data in aggregate. Canopy addressed a growing need fora single tracing system, applicable to many domains, that engi-neers could customize to quickly target relevant information.2.1 Canopy in ActionWe begin bymotivating Canopy with an example of how engi-neers typically investigate regressions in our web stack.Whena performance issue arises in one component, its symptomsmight manifest in a different part of the stack; diagnosing per-formance issues thereby requires a global view, yet granularattribution, of performance.When an end-user loads a page on Facebook.com, it is as-
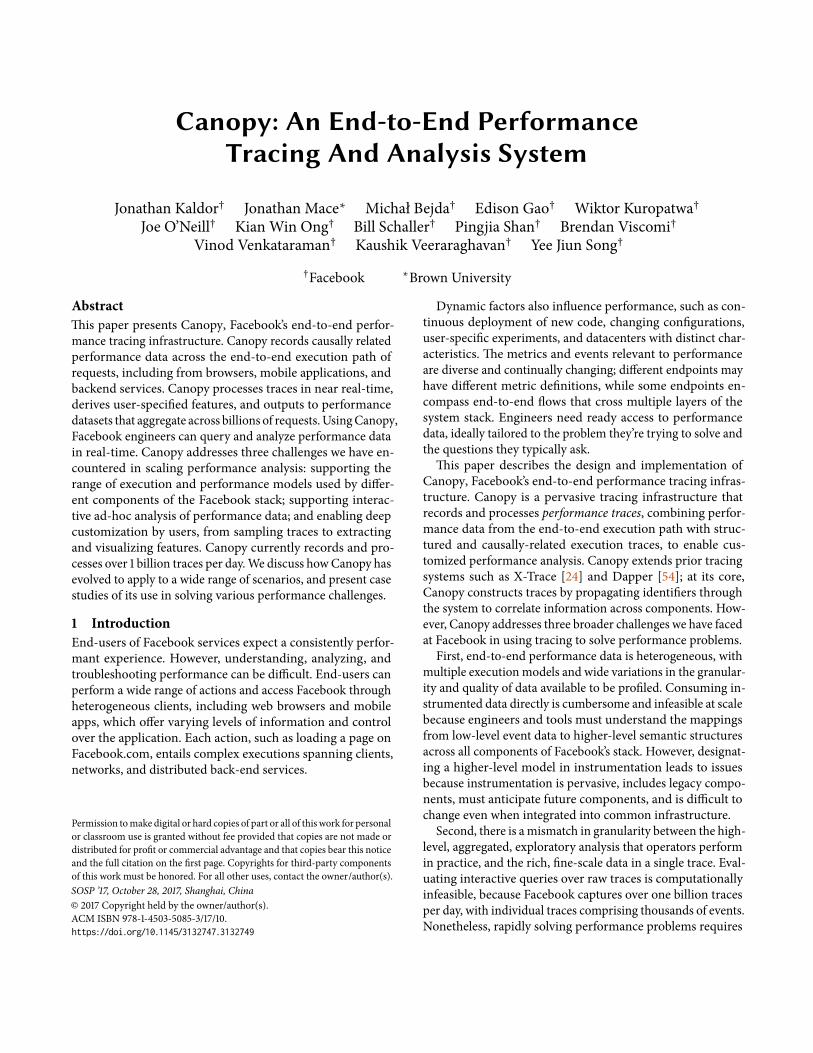
sembled from numerous page pieces that are developed bymany different product groups. Facebook’s core frameworkcode combines page pieces, and runs them both onweb serversand within client browsers. In March 2017, the average timeneeded to display the initial portion of a particular page re-gressed by 300ms, or approximately 13%, illustrated in Fig-ure 1a. Canopy calculates this metric by recording end-to-endtraces of requests, including execution in both the browserand throughout Facebook backends.Canopy backends receivetraces in near-realtime, derive a range of metrics includingpage load latency from each trace, and pipe them to variouslong-lived datasets of performancemetrics.
To investigate the regression, engineers typically start witha breakdown of page load time across the constituent compo-nents. Figure 1b shows how server execution time and networktime were relatively unchanged, whereas browser executiontime and resource-fetching time (CSS, JS, etc.) were elevated.
Canopy SOSP ’17, October 28, 2017, Shanghai, China
To calculate these metrics, Canopy derives the critical pathof requests, using comprehensive timing and dependency in-formation from the client and across all server-side processes.Canopy’s instrumentation APIs capture this for a range of dif-ferent execution models (e.g. threads, events, continuations,queues, RPCs); internally, Canopy unifies the information us-ing a generic underlying representation for trace data.
The next step in the investigationwas to diagnose the changein resource loading time. The useful high-level metrics forresource loading relate to a server-sidemechanism called earlyflush. Early flush optimizes the page load time by predictingand preemptively sending batches of resources that might beneeded by the client. Canopy measures the success of earlyflush by capturing informationwhen resources are received onthe client, then incorporating them into critical path metrics.Figure 1c plots the prediction accuracy for JavaScript and CSSresources – 80% accuracymeans that 80%of the resources sentwere actually necessary for the initial page display. The pageload regression corresponded to a 5% drop in CSS predictionaccuracy and an additional 10kB of CSS before the page coulddisplay (1d); this unnecessary CSS took the place of usefulresources, forcing clients towait for the next batch of resourcesbefore the page could display (an early flushmiss).
These metrics pointed to a problem at the page granular-ity, but do not yet point to what caused the change. Canopy’sdatasets further break down metrics at the granularity of pagepieces, and grouping by page piece (1e) identified the culprit– the UserInput page piece had added an additional 10kB ofCSS to the page load critical path. By comparison, other com-ponents were unchanged. This pointed at the root cause – thelaunch of a new feature in the UserInput page piece changedthe set of resources that it required. The early flush compo-nent was unaware of this change, and grouped resources sub-optimally. On the client, the UserInput page piece stalled wait-ing for resources that weren’t initially available, increasing itstime on the critical path (1f). Engineers fixed the regressionby re-configuring the early flush mechanism.2.2 ChallengesThis example illustrates how a range of different information,related across system components, is necessary to diagnoseproblems. However, it is difficult to predict the informationthat will be useful or the steps that engineers will take in theiranalysis. In practice at Facebook, successful approaches to di-agnosing performance problems are usually based on humanintuition: engineers develop and investigate hypotheses, draw-ing on different kinds of data presented in different ways: indi-vidual traces, aggregates across many traces, historical trends,filtered data and breakdowns, etc. In the research literature,a recent study of Splunk usage [3] drew similar conclusionsthat human inference tends to drive analysis, while the use ofautomated techniques is “relatively rare”. The goal of Canopy is
PreviousWeek
+13%Regression
0 0.5 Time (days) 1.5 2
+300ms
Page Load Latency
(a)
−25%Prev Wk+25%+50%
0 1 2 0 1 2 0 1 2 0 1 2 0 1 2
Client Browser Resources Network ServerCritical Path Latency Breakdown
(b)
40%
50%
0 0.5 1 1.5 2
−5%
CSS Prediction Accuracy
75%
85%
0 0.5 1 1.5 2
JS Prediction Accuracy
(c)
90kB
110kB
0 0.5 1 1.5 2
+10kB
CSS Bytes
0
1
2
0 0.5 1 1.5 2
Early-Flush Misses
+1(d)
−5kBPrev Wk
+10kB
0 1 2 0 1 2 0 1 2 0 1 2
+10kBSuggestions MainContent Navigation UserInput
Page Piece CSS Bytes
(e)
−25%Prev Wk+25%+50%
0 0.5 Time (days) 1.5 2 0 0.5 Time (days) 1.5 2
Page Piece Critical Path LatencyMainContent UserInput
+150ms(f)
Figure 1: Using Canopy, an engineer quickly identifies UserInput asresponsible for a 300ms page load time regression (cf. §2.1).
to allow human-generated hypotheses to be tested and provedor disproved quickly, enabling rapid iteration. To achieve this,wemust overcome three broad challenges.Modeling Trace Data Performance traces incorporate a widerange of information from all components on the executionpath of requests, from clients through backend services.Causalrelationships between eventsprovide further information aboutthe concurrency and dependencies of execution. In their mostgeneral form, these traces are directed, acyclic graphs (DAGs),with nodes representing events in time, and edges representingcausality [23,31]. However, exposing traces at this granularityis inappropriate for two reasons.
First, in order to reconstruct high-level concepts, engineersmust understand and interpret trace events and their causalrelationships. For example, a segment of processing might de-limit itself with start and end events, derive its latency fromevent timestamps, and describe interesting features using in-termediary events. Similarly, causal edges might be classifiedas network communication if they link events annotated withdifferent hostnames. However,many engineers and teams par-ticipate in recording traces,making ad-hoc decisions aboutthe events and information to record. There is wide variationin the granularity and quality of data captured by differentsoftware versions, and missing data is common due to best-effort delivery from remote clients. In practice it is infeasible
SOSP ’17, October 28, 2017, Shanghai, China J. Kaldor et al.
to consume traces of this granularity, as few, if any, engineersunderstand all mappings to high-level concepts.
Second, events are an inappropriate abstraction to expose toengineers adding instrumentation to systems. Engineers mustunderstand how to describe their system’s execution model –e.g. segments of computation, RPC calls – in terms of events,and do so in a coherent manner across all system components.However, researchers and practitioners consistently describeinstrumentation as themost time consuming and difficult partof deploying tracing frameworks [22–24,28, 50, 53].
To bridge these challenges, previous tracing frameworksproposed that a higher-level trace representation should be afirst-class primitive [12, 54, 60]. This approach aligns instru-mentation abstractions with the system’s execution model,making it easier to instrument systems; it also directly en-codes meaningful high level concepts in traces,making themeasier to consume. For example, Dapper models traces as treesof spans – segments of computation –which naturally describeexecutions in Google’s RPC-based infrastructure and can beintuitively visualized as a call stack. [54]However, promoting a first-class trace model led to sev-
eral problems in the open-source community. Frameworkslost generality; for example, Zipkin [60] users struggled to in-strument execution models not easily described as span trees,such as queues [65], asynchronous executions [41,42,44], andmultiple-parent causality [9, 10,43,45]. Changing tracemod-els entailed exhaustively revisiting system-level instrumenta-tion [4,8, 11, 13, 14], or elaborate workarounds such as inferringnew attributes [22,35,46]. Mismatchedmodels affected com-patibility between mixed system versions; e.g. Accumulo andHadoopwere impacted by the “continued lack of concern in theHTrace project around tracing during upgrades” [4, 5,7]. Sometracing frameworks suffered “severe signal loss” [40] because asimpler tracemodel discarded useful causal relationships.
We experienced similar challenges at Facebook. Instrument-ing core frameworks is useful for making tracing widely avail-able and reducing the need for every system to maintain itsown instrumentation. However, there are a wide variety ofcustom system designs, third party code, and other issues thatlimit use of those core frameworks. Furthermore, instrumenta-tion is typically compiled into services as they are released, soeven when tracing is integrated into core frameworks, a singletracemay cross through multiple services each with their ownversion of instrumentation. Thus, instrumentation must beflexible and adaptable in order to inter-operate correctly bothwithin the trace, and across system components.AnalyzingData Engineers need to be able to view, filter, andaggregatemetrics based on arbitrary features across all traces,e.g. to view changes in specific counters, track durations ofwell-defined subphases, compare metrics before and after aregression; etc. However, traces are an inappropriate level of
granularity for ad-hoc analysis, even when the they are ab-stracted to a higher level model as described in the previouschallenge. This is for two reasons.First, traces are very rich, with an individual trace com-
prising potentially tens of thousands of performance events.Queries over traces, including historical data, can apply to anextremely large volume of traces – Canopy currently records1.3 billion traces per day. Simultaneously we want to supportengineers analyzing traces at interactive time scales. It is com-putationally infeasible to directly query this volume of tracesin real-time in response to some user query.
Second, it is cognitively demanding to expect users to writequeries at the granularity of traces. It should not be necessaryto know how to calculate high-level metrics such as page loadtime, critical path breakdown, or CSS byte attributions (cf.§2.1); in practice it is non-trivial to derivemany such featuresfrom traces. However, unless we provide further abstractions,users will have to consume trace data directly, which entailscomplicated queries to extract simple high-level features.SupportingMultipleUseCases Facebook traceshave evolvedover time as operators find new data they are interested in, andnew subsystems integrate with our tracing systems. Traces areuseful to different people in different ways, and we continuallyencounter new use cases for tracing, newmetrics and labels ofinterest, new aggregations and breakdowns, etc. The volumeof data in a trace can overwhelm users andmake it difficult todistill the parts relevant to particular use cases.
This presents a delicate trade-off; on one hand, we wantsimplicity and ease-of-use for the broadest possible audience,implying a shared, curated, comprehensive entry point forusers. On the other hand, users should be able to view tracesthrough a lens appropriate for their particular task or compo-nent, i.e. avoiding features andmetrics that pertain to othercomponents.We must also support end-to-end analysis forproblems that spanmultiple components, and support drilling-down to the lowest-level details of individual traces.
These challenges imply that users should have control overthe data presented to them, especially in terms of exploratoryanalysis. This includes piping data to custom backends; view-ing data through custom visualizations; extracting customfeatures andmetrics; and ensuring low QPS systems and un-derrepresented execution types are sufficiently sampled.
3 DesignCanopy addresses these challenges by providing a pipelinefor extracting performance data from system-generated tracesacross the stack. Canopy emphasizes user-customization ateach step of the pipeline, and provides a separation of concernsbetween components to allow for their individual evolution.In this section we describe Canopy’s high level design and theflow for processing and analyzing performance traces.
Canopy SOSP ’17, October 28, 2017, Shanghai, China
2
1
4
TraceID3
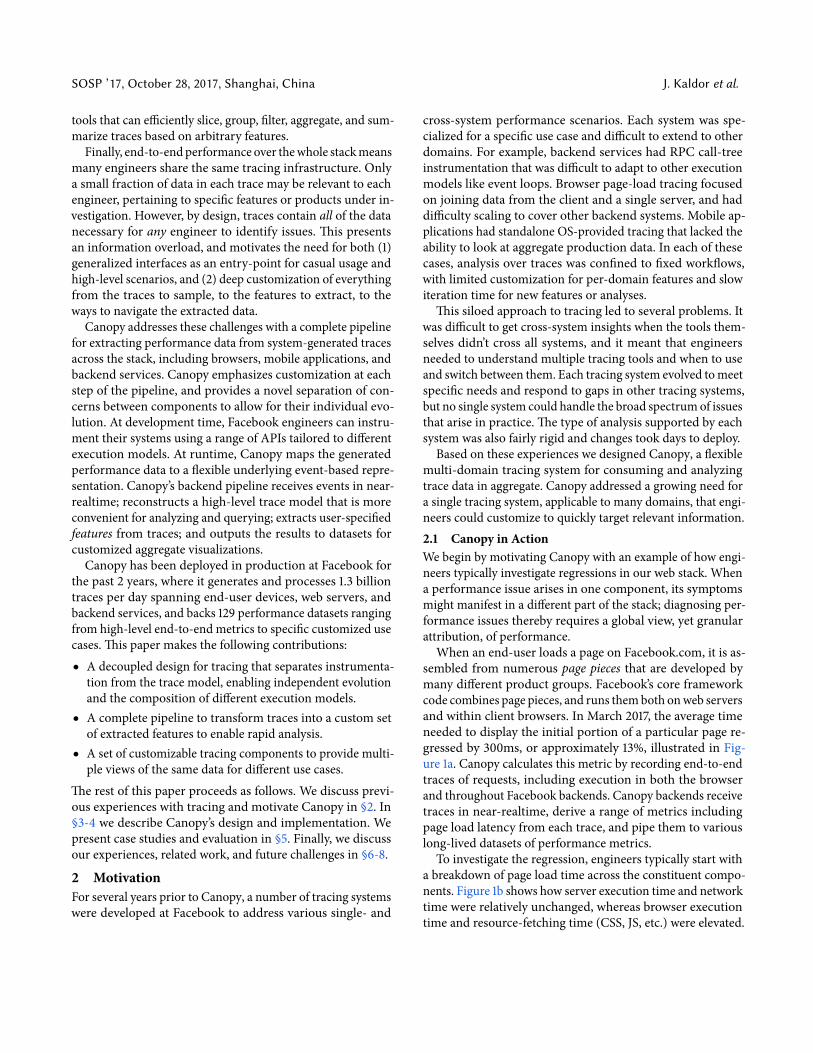
EngineersFacebookComponentsRequestsInstrumentationAPIsCanopy Events
Key
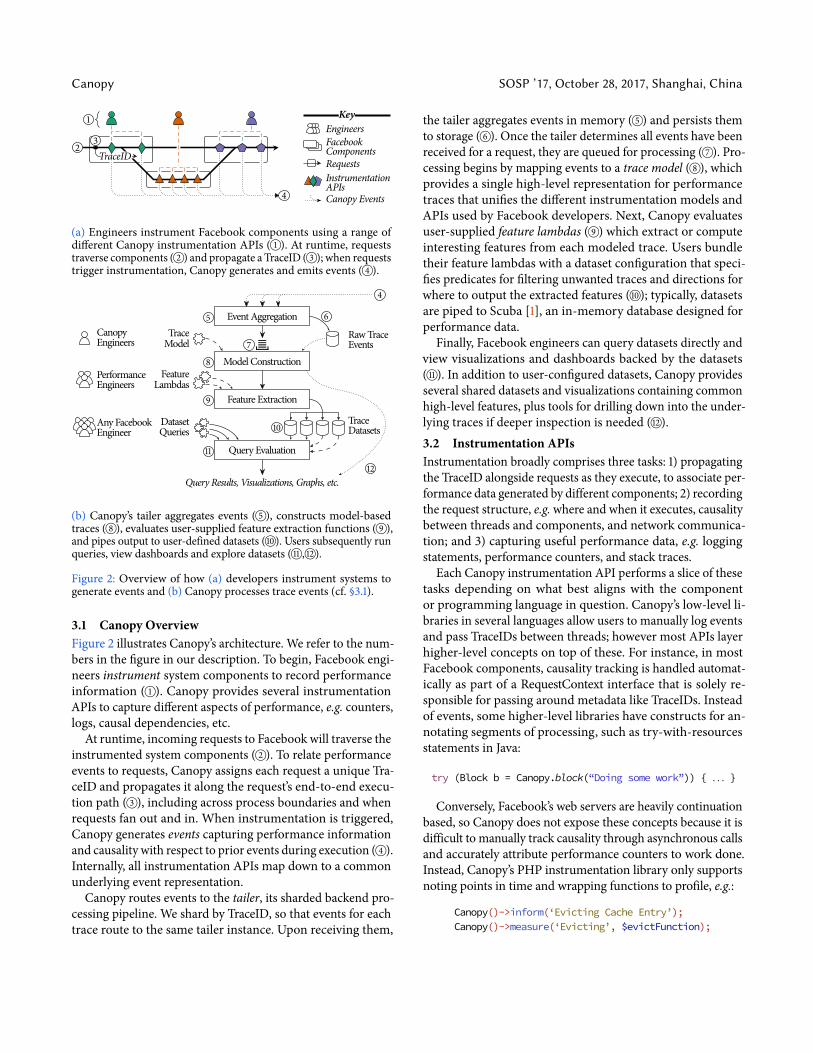
(a) Engineers instrument Facebook components using a range ofdifferent Canopy instrumentation APIs ( 1○). At runtime, requeststraverse components ( 2○) and propagate aTraceID ( 3○);when requeststrigger instrumentation, Canopy generates and emits events ( 4○).
4
EventAggregation5
7
ModelConstruction8
Feature Extraction9
QueryEvaluation11
QueryResults,Visualizations,Graphs, etc.
RawTraceEvents
6
TraceDatasets10
12
TraceModel
CanopyEngineers
FeatureLambdas
PerformanceEngineers
DatasetQueries
Any FacebookEngineer
(b) Canopy’s tailer aggregates events ( 5○), constructs model-basedtraces ( 8○), evaluates user-supplied feature extraction functions ( 9○),and pipes output to user-defined datasets ( 10○). Users subsequently runqueries, view dashboards and explore datasets ( 11○, 12○).
Figure 2: Overview of how (a) developers instrument systems togenerate events and (b) Canopy processes trace events (cf. §3.1).
3.1 CanopyOverviewFigure 2 illustrates Canopy’s architecture.We refer to the num-bers in the figure in our description. To begin, Facebook engi-neers instrument system components to record performanceinformation ( 1○). Canopy provides several instrumentationAPIs to capture different aspects of performance, e.g. counters,logs, causal dependencies, etc.
At runtime, incoming requests to Facebookwill traverse theinstrumented system components ( 2○). To relate performanceevents to requests, Canopy assigns each request a unique Tra-ceID and propagates it along the request’s end-to-end execu-tion path ( 3○), including across process boundaries and whenrequests fan out and in.When instrumentation is triggered,Canopy generates events capturing performance informationand causality with respect to prior events during execution ( 4○).Internally, all instrumentation APIs map down to a commonunderlying event representation.
Canopy routes events to the tailer, its sharded backend pro-cessing pipeline.We shard by TraceID, so that events for eachtrace route to the same tailer instance. Upon receiving them,
the tailer aggregates events in memory ( 5○) and persists themto storage ( 6○). Once the tailer determines all events have beenreceived for a request, they are queued for processing ( 7○). Pro-cessing begins bymapping events to a tracemodel ( 8○), whichprovides a single high-level representation for performancetraces that unifies the different instrumentation models andAPIs used by Facebook developers. Next, Canopy evaluatesuser-supplied feature lambdas ( 9○) which extract or computeinteresting features from each modeled trace. Users bundletheir feature lambdas with a dataset configuration that speci-fies predicates for filtering unwanted traces and directions forwhere to output the extracted features ( 10○); typically, datasetsare piped to Scuba [1], an in-memory database designed forperformance data.
Finally, Facebook engineers can query datasets directly andview visualizations and dashboards backed by the datasets( 11○). In addition to user-configured datasets, Canopy providesseveral shared datasets and visualizations containing commonhigh-level features, plus tools for drilling down into the under-lying traces if deeper inspection is needed ( 12○).3.2 Instrumentation APIsInstrumentation broadly comprises three tasks: 1) propagatingthe TraceID alongside requests as they execute, to associate per-formance data generated by different components; 2) recordingthe request structure, e.g.where andwhen it executes, causalitybetween threads and components, and network communica-tion; and 3) capturing useful performance data, e.g. loggingstatements, performance counters, and stack traces.
Each Canopy instrumentation API performs a slice of thesetasks depending on what best aligns with the componentor programming language in question. Canopy’s low-level li-braries in several languages allow users to manually log eventsand pass TraceIDs between threads; however most APIs layerhigher-level concepts on top of these. For instance, in mostFacebook components, causality tracking is handled automat-ically as part of a RequestContext interface that is solely re-sponsible for passing aroundmetadata like TraceIDs. Insteadof events, some higher-level libraries have constructs for an-notating segments of processing, such as try-with-resourcesstatements in Java:
try (Block b = Canopy.block(“Doing some work”)) { . . . }
Conversely, Facebook’s web servers are heavily continuationbased, so Canopy does not expose these concepts because it isdifficult tomanually track causality through asynchronous callsand accurately attribute performance counters to work done.Instead, Canopy’s PHP instrumentation library only supportsnoting points in time and wrapping functions to profile, e.g.:
Canopy()->inform(‘Evicting Cache Entry’);Canopy()->measure(‘Evicting’, $evictFunction);
SOSP ’17, October 28, 2017, Shanghai, China J. Kaldor et al.
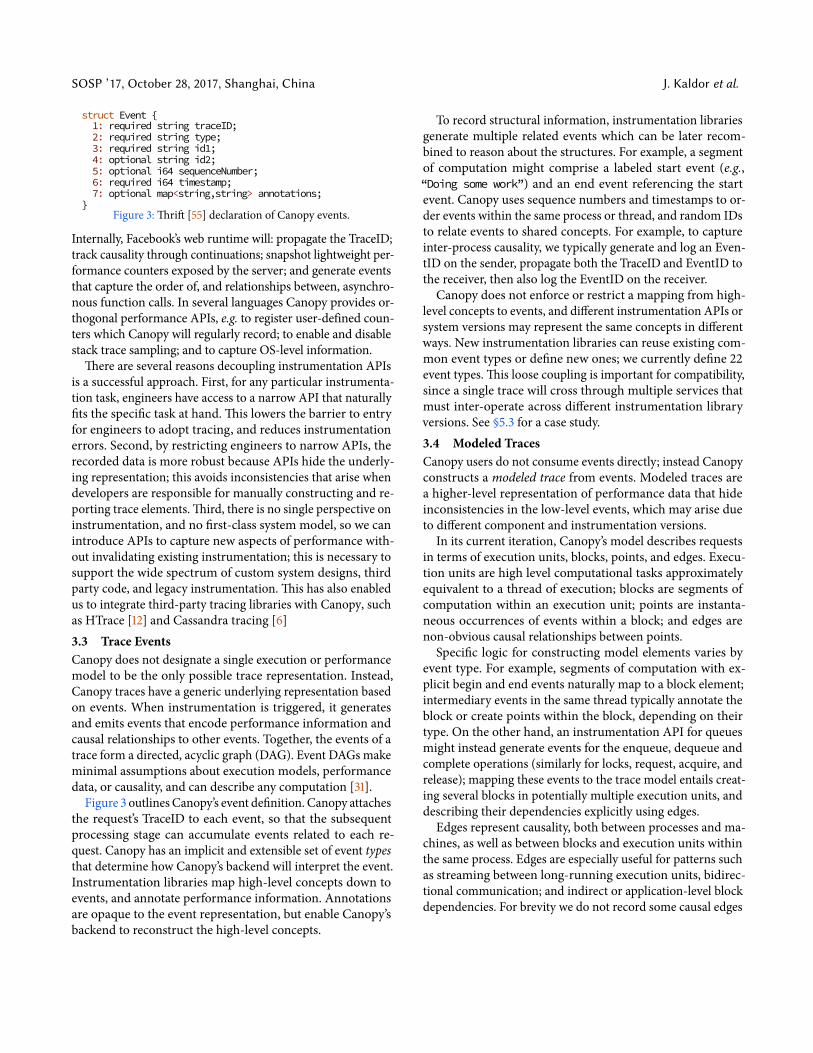
}7: optional map<string,string> annotations;6: required i64 timestamp;5: optional i64 sequenceNumber;4: optional string id2;3: required string id1;2: required string type;1: required string traceID;
struct Event {
Figure 3: Thrift [55] declaration of Canopy events.
Internally, Facebook’s web runtime will: propagate the TraceID;track causality through continuations; snapshot lightweight per-formance counters exposed by the server; and generate eventsthat capture the order of, and relationships between, asynchro-nous function calls. In several languages Canopy provides or-thogonal performance APIs, e.g. to register user-defined coun-ters which Canopy will regularly record; to enable and disablestack trace sampling; and to captureOS-level information.
There are several reasons decoupling instrumentation APIsis a successful approach. First, for any particular instrumenta-tion task, engineers have access to a narrow API that naturallyfits the specific task at hand. This lowers the barrier to entryfor engineers to adopt tracing, and reduces instrumentationerrors. Second, by restricting engineers to narrow APIs, therecorded data is more robust because APIs hide the underly-ing representation; this avoids inconsistencies that arise whendevelopers are responsible for manually constructing and re-porting trace elements. Third, there is no single perspective oninstrumentation, and no first-class systemmodel, so we canintroduce APIs to capture new aspects of performance with-out invalidating existing instrumentation; this is necessary tosupport the wide spectrum of custom system designs, thirdparty code, and legacy instrumentation. This has also enabledus to integrate third-party tracing libraries with Canopy, suchas HTrace [12] and Cassandra tracing [6]3.3 Trace EventsCanopy does not designate a single execution or performancemodel to be the only possible trace representation. Instead,Canopy traces have a generic underlying representation basedon events. When instrumentation is triggered, it generatesand emits events that encode performance information andcausal relationships to other events. Together, the events of atrace form a directed, acyclic graph (DAG). Event DAGs makeminimal assumptions about execution models, performancedata, or causality, and can describe any computation [31].
Figure 3 outlinesCanopy’s event definition.Canopy attachesthe request’s TraceID to each event, so that the subsequentprocessing stage can accumulate events related to each re-quest. Canopy has an implicit and extensible set of event typesthat determine how Canopy’s backend will interpret the event.Instrumentation libraries map high-level concepts down toevents, and annotate performance information. Annotationsare opaque to the event representation, but enable Canopy’sbackend to reconstruct the high-level concepts.
To record structural information, instrumentation librariesgenerate multiple related events which can be later recom-bined to reason about the structures. For example, a segmentof computation might comprise a labeled start event (e.g.,“Doing some work”) and an end event referencing the startevent. Canopy uses sequence numbers and timestamps to or-der events within the same process or thread, and random IDsto relate events to shared concepts. For example, to captureinter-process causality, we typically generate and log an Even-tID on the sender, propagate both the TraceID and EventID tothe receiver, then also log the EventID on the receiver.Canopy does not enforce or restrict amapping from high-
level concepts to events, and different instrumentationAPIs orsystem versions may represent the same concepts in differentways. New instrumentation libraries can reuse existing com-mon event types or define new ones; we currently define 22event types. This loose coupling is important for compatibility,since a single trace will cross through multiple services thatmust inter-operate across different instrumentation libraryversions. See §5.3 for a case study.3.4 Modeled TracesCanopy users do not consume events directly; instead Canopyconstructs a modeled trace from events. Modeled traces area higher-level representation of performance data that hideinconsistencies in the low-level events, which may arise dueto different component and instrumentation versions.In its current iteration, Canopy’s model describes requests
in terms of execution units, blocks, points, and edges. Execu-tion units are high level computational tasks approximatelyequivalent to a thread of execution; blocks are segments ofcomputation within an execution unit; points are instanta-neous occurrences of events within a block; and edges arenon-obvious causal relationships between points.
Specific logic for constructing model elements varies byevent type. For example, segments of computation with ex-plicit begin and end events naturallymap to a block element;intermediary events in the same thread typically annotate theblock or create points within the block, depending on theirtype. On the other hand, an instrumentation API for queuesmight instead generate events for the enqueue, dequeue andcomplete operations (similarly for locks, request, acquire, andrelease); mapping these events to the tracemodel entails creat-ing several blocks in potentiallymultiple execution units, anddescribing their dependencies explicitly using edges.Edges represent causality, both between processes andma-
chines, as well as between blocks and execution units withinthe same process. Edges are especially useful for patterns suchas streaming between long-running execution units, bidirec-tional communication; and indirect or application-level blockdependencies. For brevity we do not record some causal edges
Canopy SOSP ’17, October 28, 2017, Shanghai, China
within an execution unit; due to their nested structure, exe-cution units, blocks, and points have implicit causality that issufficiently captured by timestamps and sequence numbers.
All trace elements can be annotated with performance data,such as messages, labels, stack traces, sets of values, and coun-terswith an associated unit. Performance data is decoded fromevent annotations,with type information in the annotation key.Counters have no strict rules governing their usage; in prac-tice they either represent absolute values at a point, or deltasover the duration of a block or edge. On edges, annotationslet us conveymore information about relationships beyondjust causal ordering, e.g. timing and queuing information isuseful to accurately understand critical path dependencies, alimitation of prior systems [35,46].
All Canopy traces are backed by the same underlying tracemodel. This may seem counter-intuitive given that user cus-tomization is a goal of Canopy. However, this approach pro-vides a necessary bridge across all system components andperformance data. This allows analysis across system compo-nents; without it we risk siloed and incompatible performancemodels, and a loss of generality. So far, we have successfully in-corporated a wide range of systems and performance data. Bydecoupling the tracemodel from instrumentation,we can alsoupdate themodel as necessary to incorporate new structures,causal relationships, and types of performance data.3.5 Trace DatasetsTrace-derived datasets are Canopy’s high-level output. Theycomprise information collected acrossmany traces, and are themain access point for Facebook engineers doing performanceanalysis. Each row of a dataset corresponds to some elementin a trace – e.g. one high level dataset has a row per trace andaggregates statistics such as overall latency, country of origin,browser type, etc; conversely, a dataset for deeper analysis ofweb requests has one row for each page piece generated byeach request, i.e. it is keyed by (TraceID, PagePieceID). Thecase study in §2.1 used both of these datasets.Features Each column of a dataset is a feature derived froma trace. A featuremight simply be a label taken from a traceelement. It can also be a straightforward aggregation, suchas the count of block occurrences or the change in a countervalue over a particular range. More elaborate features mayconsider structural relationships, or compute statistics alongthe critical path between two points in the trace. Features maybe any database column type; in practice, wemake heavy useof numerics, strings, stacktraces, sets, and lists.Extraction Canopy transforms traces to features by applyingfeature extraction functions:
f:Trace�Collection<Row<Feature>>Functions are stateless and operate over a single trace at a time.A row corresponds to an element in the trace and comprisesfeatures computed over that element or related elements.
00.250.50.75
1
1k 10k 100k1 10 100
CDF
Usage Count of Column
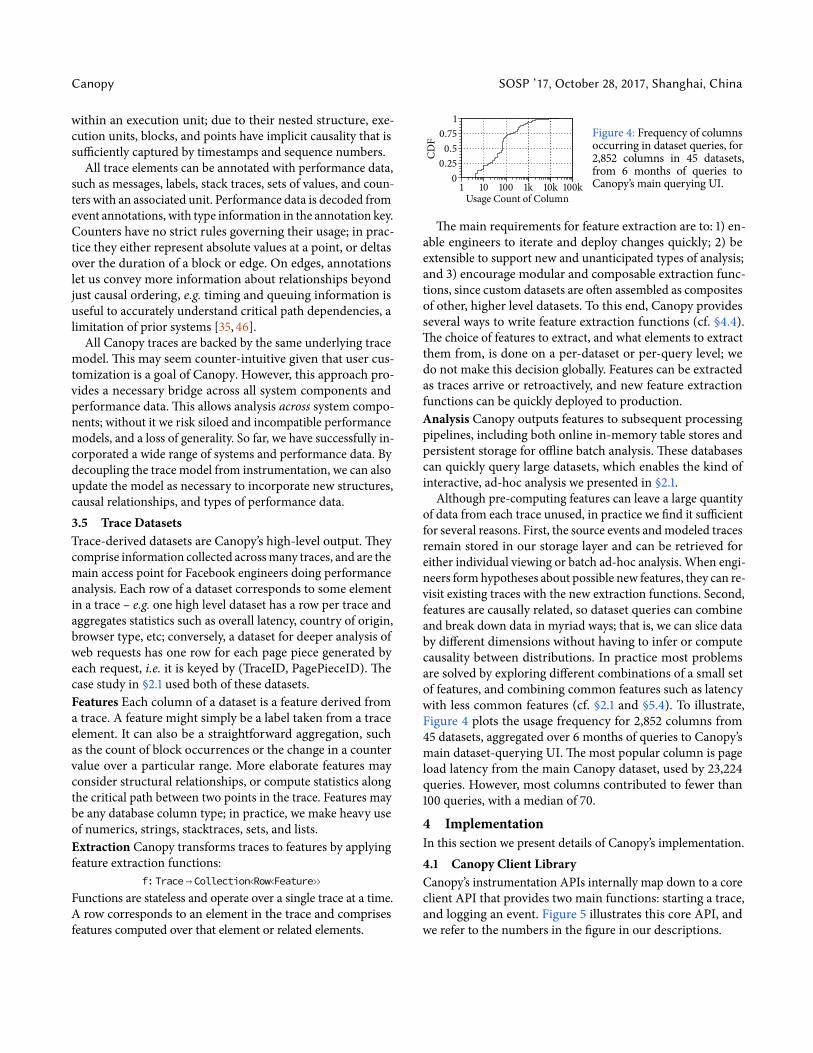
Figure 4: Frequency of columnsoccurring in dataset queries, for2,852 columns in 45 datasets,from 6 months of queries toCanopy’s main querying UI.
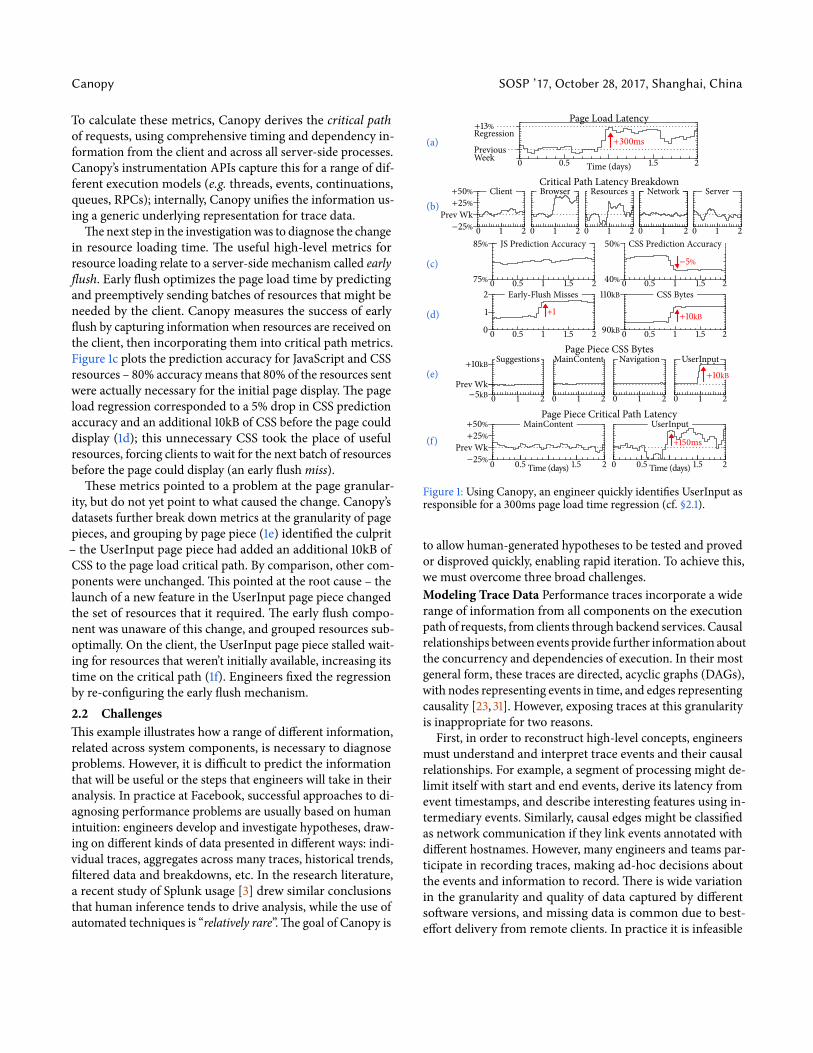
Themain requirements for feature extraction are to: 1) en-able engineers to iterate and deploy changes quickly; 2) beextensible to support new and unanticipated types of analysis;and 3) encouragemodular and composable extraction func-tions, since custom datasets are often assembled as compositesof other, higher level datasets. To this end, Canopy providesseveral ways to write feature extraction functions (cf. §4.4).The choice of features to extract, and what elements to extractthem from, is done on a per-dataset or per-query level; wedo not make this decision globally. Features can be extractedas traces arrive or retroactively, and new feature extractionfunctions can be quickly deployed to production.Analysis Canopy outputs features to subsequent processingpipelines, including both online in-memory table stores andpersistent storage for offline batch analysis. These databasescan quickly query large datasets, which enables the kind ofinteractive, ad-hoc analysis we presented in §2.1.
Although pre-computing features can leave a large quantityof data from each trace unused, in practice we find it sufficientfor several reasons. First, the source events andmodeled tracesremain stored in our storage layer and can be retrieved foreither individual viewing or batch ad-hoc analysis.When engi-neers formhypotheses about possible new features, they can re-visit existing traces with the new extraction functions. Second,features are causally related, so dataset queries can combineand break down data in myriad ways; that is, we can slice databy different dimensions without having to infer or computecausality between distributions. In practice most problemsare solved by exploring different combinations of a small setof features, and combining common features such as latencywith less common features (cf. §2.1 and §5.4). To illustrate,Figure 4 plots the usage frequency for 2,852 columns from45 datasets, aggregated over 6 months of queries to Canopy’smain dataset-querying UI. Themost popular column is pageload latency from the main Canopy dataset, used by 23,224queries. However, most columns contributed to fewer than100 queries, with amedian of 70.
4 ImplementationIn this section we present details of Canopy’s implementation.4.1 Canopy Client LibraryCanopy’s instrumentation APIs internallymap down to a coreclient API that provides two main functions: starting a trace,and logging an event. Figure 5 illustrates this core API, andwe refer to the numbers in the figure in our descriptions.
SOSP ’17, October 28, 2017, Shanghai, China J. Kaldor et al.
requests
Policy APIs Instr. APIs
CanopyAPI
DistributedToken Bucket
1©Start Trace
4© EvaluateSampling Policies
3© Start Trace
2©Acquire Token
Configerator Scribe
6©Write Event
Log Event
Convert To Events
5©Log Perf Data
In-MemoryBuffering
7© PublishEvents
Token BucketConfig(Canopy Engineers)
Sampling Policies(Performance Engineers)
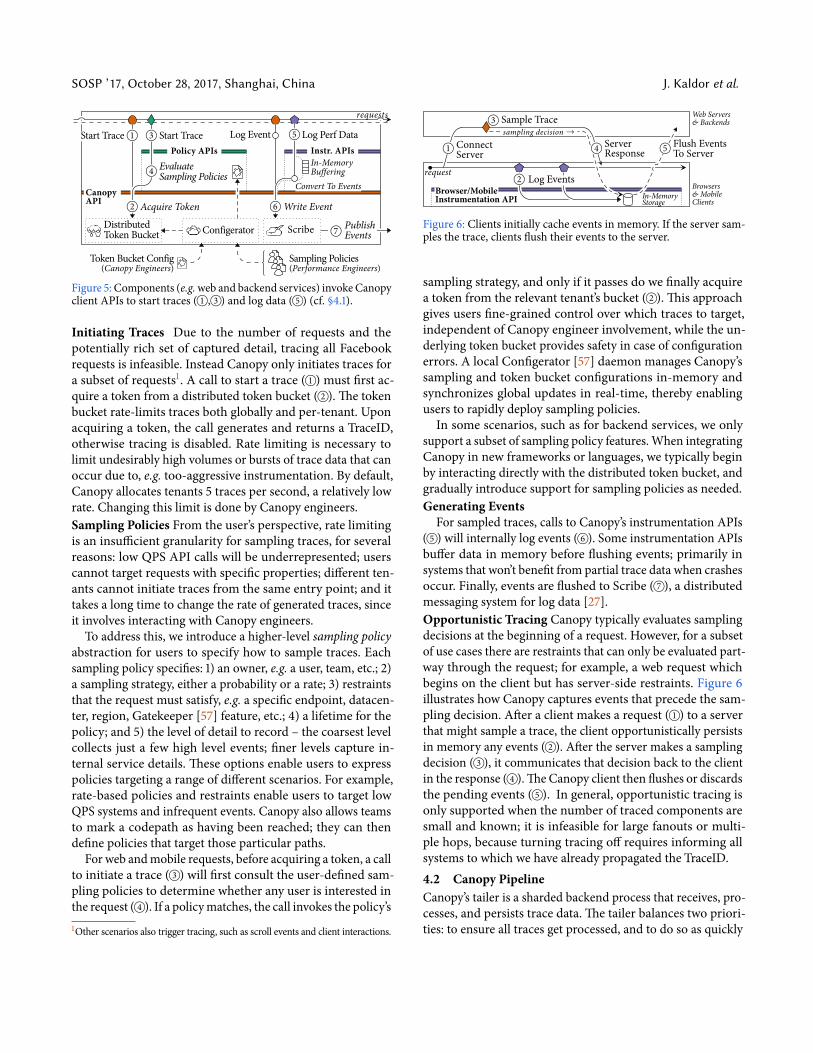
Figure 5: Components (e.g.web and backend services) invoke Canopyclient APIs to start traces ( 1○, 3○) and log data ( 5○) (cf. §4.1).
Initiating Traces Due to the number of requests and thepotentially rich set of captured detail, tracing all Facebookrequests is infeasible. Instead Canopy only initiates traces fora subset of requests1. A call to start a trace ( 1○) must first ac-quire a token from a distributed token bucket ( 2○). The tokenbucket rate-limits traces both globally and per-tenant. Uponacquiring a token, the call generates and returns a TraceID,otherwise tracing is disabled. Rate limiting is necessary tolimit undesirably high volumes or bursts of trace data that canoccur due to, e.g. too-aggressive instrumentation. By default,Canopy allocates tenants 5 traces per second, a relatively lowrate. Changing this limit is done by Canopy engineers.Sampling Policies From the user’s perspective, rate limitingis an insufficient granularity for sampling traces, for severalreasons: low QPS API calls will be underrepresented; userscannot target requests with specific properties; different ten-ants cannot initiate traces from the same entry point; and ittakes a long time to change the rate of generated traces, sinceit involves interacting with Canopy engineers.
To address this, we introduce a higher-level sampling policyabstraction for users to specify how to sample traces. Eachsampling policy specifies: 1) an owner, e.g. a user, team, etc.; 2)a sampling strategy, either a probability or a rate; 3) restraintsthat the request must satisfy, e.g. a specific endpoint, datacen-ter, region, Gatekeeper [57] feature, etc.; 4) a lifetime for thepolicy; and 5) the level of detail to record – the coarsest levelcollects just a few high level events; finer levels capture in-ternal service details. These options enable users to expresspolicies targeting a range of different scenarios. For example,rate-based policies and restraints enable users to target lowQPS systems and infrequent events. Canopy also allows teamsto mark a codepath as having been reached; they can thendefine policies that target those particular paths.
Forweb andmobile requests, before acquiring a token, a callto initiate a trace ( 3○) will first consult the user-defined sam-pling policies to determine whether any user is interested inthe request ( 4○). If a policymatches, the call invokes the policy’s1Other scenarios also trigger tracing, such as scroll events and client interactions.
Browsers&MobileClients
Web Servers& Backends
request
In-MemoryStorage
sampling decision �1©Connect
Server
2© Log Events
3© Sample Trace
4© ServerResponse
Browser/MobileInstrumentation API
5© Flush EventsTo Server
Figure 6: Clients initially cache events in memory. If the server sam-ples the trace, clients flush their events to the server.
sampling strategy, and only if it passes do we finally acquirea token from the relevant tenant’s bucket ( 2○). This approachgives users fine-grained control over which traces to target,independent of Canopy engineer involvement, while the un-derlying token bucket provides safety in case of configurationerrors. A local Configerator [57] daemon manages Canopy’ssampling and token bucket configurations in-memory andsynchronizes global updates in real-time, thereby enablingusers to rapidly deploy sampling policies.In some scenarios, such as for backend services, we only
support a subset of sampling policy features.When integratingCanopy in new frameworks or languages, we typically beginby interacting directly with the distributed token bucket, andgradually introduce support for sampling policies as needed.Generating Events
For sampled traces, calls to Canopy’s instrumentation APIs( 5○) will internally log events ( 6○). Some instrumentation APIsbuffer data in memory before flushing events; primarily insystems that won’t benefit from partial trace datawhen crashesoccur. Finally, events are flushed to Scribe ( 7○), a distributedmessaging system for log data [27].Opportunistic Tracing Canopy typically evaluates samplingdecisions at the beginning of a request. However, for a subsetof use cases there are restraints that can only be evaluated part-way through the request; for example, a web request whichbegins on the client but has server-side restraints. Figure 6illustrates how Canopy captures events that precede the sam-pling decision. After a client makes a request ( 1○) to a serverthat might sample a trace, the client opportunistically persistsin memory any events ( 2○). After the server makes a samplingdecision ( 3○), it communicates that decision back to the clientin the response ( 4○). The Canopy client then flushes or discardsthe pending events ( 5○). In general, opportunistic tracing isonly supported when the number of traced components aresmall and known; it is infeasible for large fanouts or multi-ple hops, because turning tracing off requires informing allsystems to which we have already propagated the TraceID.4.2 Canopy PipelineCanopy’s tailer is a sharded backend process that receives, pro-cesses, and persists trace data. The tailer balances two priori-ties: to ensure all traces get processed, and to do so as quickly
Canopy SOSP ’17, October 28, 2017, Shanghai, China
Scribe Fetchers
Poll Events1©H
client H HBase2©
In-MemoryCache
Builders
IsolationQueues
DelayedExtractor
3©
Scheduler
4©Evaluate Triggers
5©Timeout Elapsed (expired/evicted)6©
7©
8© (queue full)
Extractors
9©Deûcit Round-RobinScuba,etc.Config-
erator
Dataset Configs(PerformanceEngineers)
ad-hocjobs
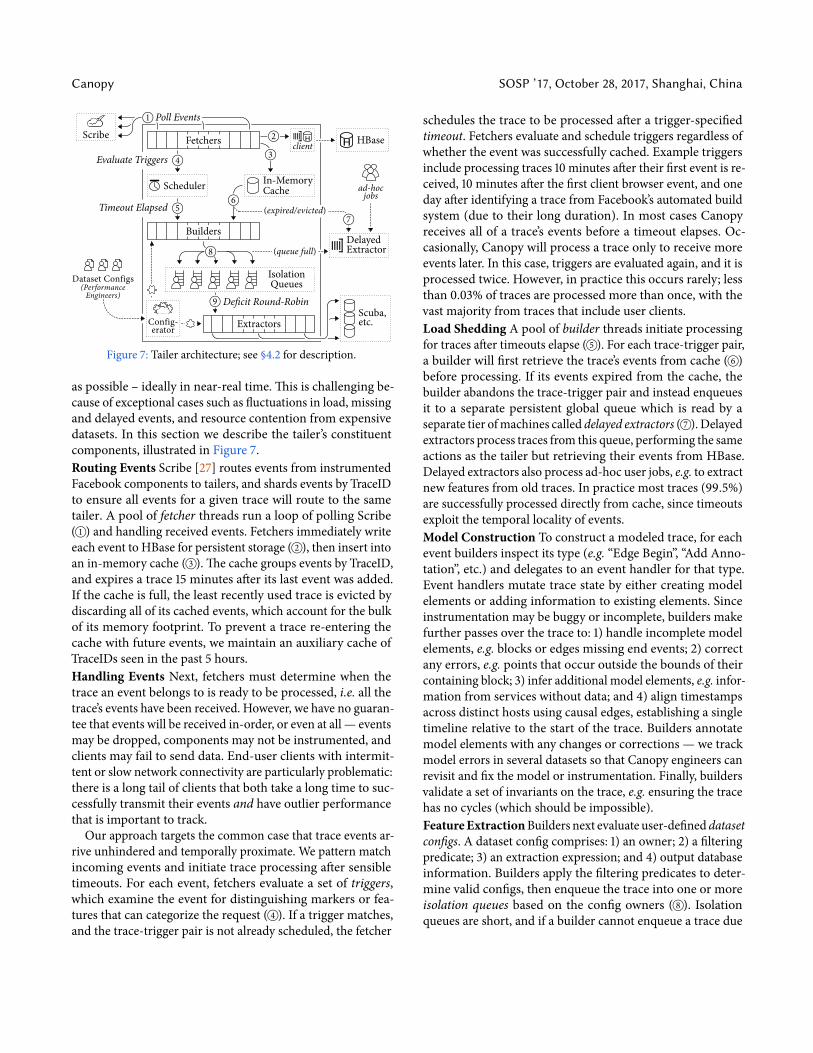
Figure 7: Tailer architecture; see §4.2 for description.
as possible – ideally in near-real time. This is challenging be-cause of exceptional cases such as fluctuations in load,missingand delayed events, and resource contention from expensivedatasets. In this section we describe the tailer’s constituentcomponents, illustrated in Figure 7.Routing Events Scribe [27] routes events from instrumentedFacebook components to tailers, and shards events by TraceIDto ensure all events for a given trace will route to the sametailer. A pool of fetcher threads run a loop of polling Scribe( 1○) and handling received events. Fetchers immediately writeeach event to HBase for persistent storage ( 2○), then insert intoan in-memory cache ( 3○). The cache groups events by TraceID,and expires a trace 15minutes after its last event was added.If the cache is full, the least recently used trace is evicted bydiscarding all of its cached events, which account for the bulkof its memory footprint. To prevent a trace re-entering thecache with future events, we maintain an auxiliary cache ofTraceIDs seen in the past 5 hours.Handling Events Next, fetchers must determine when thetrace an event belongs to is ready to be processed, i.e. all thetrace’s events have been received. However,we have no guaran-tee that events will be received in-order, or even at all—eventsmay be dropped, components may not be instrumented, andclients may fail to send data. End-user clients with intermit-tent or slow network connectivity are particularly problematic:there is a long tail of clients that both take a long time to suc-cessfully transmit their events and have outlier performancethat is important to track.
Our approach targets the common case that trace events ar-rive unhindered and temporally proximate.We pattern matchincoming events and initiate trace processing after sensibletimeouts. For each event, fetchers evaluate a set of triggers,which examine the event for distinguishing markers or fea-tures that can categorize the request ( 4○). If a trigger matches,and the trace-trigger pair is not already scheduled, the fetcher
schedules the trace to be processed after a trigger-specifiedtimeout. Fetchers evaluate and schedule triggers regardless ofwhether the event was successfully cached. Example triggersinclude processing traces 10minutes after their first event is re-ceived, 10minutes after the first client browser event, and oneday after identifying a trace from Facebook’s automated buildsystem (due to their long duration). In most cases Canopyreceives all of a trace’s events before a timeout elapses. Oc-casionally, Canopy will process a trace only to receivemoreevents later. In this case, triggers are evaluated again, and it isprocessed twice. However, in practice this occurs rarely; lessthan 0.03% of traces are processedmore than once, with thevast majority from traces that include user clients.Load Shedding A pool of builder threads initiate processingfor traces after timeouts elapse ( 5○). For each trace-trigger pair,a builder will first retrieve the trace’s events from cache ( 6○)before processing. If its events expired from the cache, thebuilder abandons the trace-trigger pair and instead enqueuesit to a separate persistent global queue which is read by aseparate tier ofmachines called delayed extractors ( 7○).Delayedextractors process traces from this queue, performing the sameactions as the tailer but retrieving their events from HBase.Delayed extractors also process ad-hoc user jobs, e.g. to extractnew features from old traces. In practicemost traces (99.5%)are successfully processed directly from cache, since timeoutsexploit the temporal locality of events.Model Construction To construct amodeled trace, for eachevent builders inspect its type (e.g. “Edge Begin”, “Add Anno-tation”, etc.) and delegates to an event handler for that type.Event handlers mutate trace state by either creating modelelements or adding information to existing elements. Sinceinstrumentation may be buggy or incomplete, builders makefurther passes over the trace to: 1) handle incompletemodelelements, e.g. blocks or edges missing end events; 2) correctany errors, e.g. points that occur outside the bounds of theircontaining block; 3) infer additional model elements, e.g. infor-mation from services without data; and 4) align timestampsacross distinct hosts using causal edges, establishing a singletimeline relative to the start of the trace. Builders annotatemodel elements with any changes or corrections — we trackmodel errors in several datasets so that Canopy engineers canrevisit and fix themodel or instrumentation. Finally, buildersvalidate a set of invariants on the trace, e.g. ensuring the tracehas no cycles (which should be impossible).FeatureExtractionBuildersnext evaluateuser-defined datasetconfigs. A dataset config comprises: 1) an owner; 2) a filteringpredicate; 3) an extraction expression; and 4) output databaseinformation. Builders apply the filtering predicates to deter-mine valid configs, then enqueue the trace into one or moreisolation queues based on the config owners ( 8○). Isolationqueues are short, and if a builder cannot enqueue a trace due
SOSP ’17, October 28, 2017, Shanghai, China J. Kaldor et al.
to capacity restrictions it abandons the trace and writes theTraceID to the delayed extractor queue.
A separate pool of extractor threads poll isolation queues fortraces, using deficit round-robin [52] to fairly share CPU timebetween queues ( 9○). Extractors evaluate extraction expres-sions and output to the configured databases. Most datasetsoutput to either Scuba [1], an in-memory database for real-time aggregation and queries, or Hive [59] tables, for offlineprocessing as part of a general data warehouse pipeline.Fair sharing is necessary for two reasons: arbitrary user-
supplied extraction expressions are potentially very expensive;and users maymisconfigure sampling policies to collect toomany traces.We offload surplus processing to delayed extrac-tors to prevent lag from impacting other users.4.3 ScalabilityRouting Events We shard Canopy’s backend by TraceID, sofor any given trace, all events will route to the same tailer.Consequently, there is no communication between tailers andCanopy’s backend trivially scales by provisioning more ma-chines. Routing events to tailers is Canopy’s main scalabil-ity bottleneck; TraceIDs are random, so events generated byone component can potentially route to any tailer. Canopycurrently generates and processes approximately 1.16 GB/s ofevent data. However, Scribe can scale several orders ofmag-nitude beyond this, and this is a small fraction of the overallcapacity of Facebook’s Scribe infrastructureEvents and Datasets Canopy has two secondary scalabilityconcerns. As instrumentation in Facebook components hasmatured, the number of events per trace has steadily grown:~160 for backend services;>4500 for browser traces; and>7500for mobile. This impacts the runtime overheads of generatingtrace data, which aremore pronounced for verbose traces (cf.§5.1). To address this, we introducedmultiple levels of tracedetail that users can specify in their sampling policies, as de-scribed in §4.1. The number of users of Canopy and generateddatasets has also grown over time, from 35 datasets in Novem-ber 2015 to 129 datasets in April 2017.Load Shedding Under normal operation, fetchers consume<5% CPU, builders ~25%, and extractors >55%. Under heavyload, isolation queues back up, and traces above each owner’sfair share offload to delayed extractors. On rare occasionsbuilders fail to keep up with the rate of traces, causing lagto accrue between triggers timing out and a builder pickingup the trace; consequently, builders encounter more tracesexpiring from cache. Due to the default expiry of 15minutes,builder lag does not exceed 5minutes; beyond that all tracesexpire, and it is cheap to clear expired traces. On several prioroccasions, issues with HBase caused fetcher threads to exhaustclient-side buffers and block onwriting events toHBase.Whenthis occurs events accumulate in Scribe, since fetchers onlyreceive events from Scribe by polling. Fetchers can lag by up
(a) Find the earliest client-side pointBegin = ExecUnits | Filter(name=“Client”) | Points | First
(b) Find the client-side “display done” marker.DisplayDone = ExecUnits | Filter(name=“Client”) | Points |
Filter(marker=“display_done”) | First
(c) Calculate display done latency.DisplayDone | Timestamp | Subtract(Begin | Timestamp) |RecordAs(“display_done”)
(d) Find all network resource loading on the critical path.ResourceEdges = CriticalPath(Begin->DisplayDone) | Edges |
Filter(type=“resource”)
(e) Calculate the total resource loading time on the critical path.ResourceEdges | Duration | Sum | RecordAs(“res_load”)
(f) Calculate the total CSS bytes on the critical path.ResourceEdges | Filter(resource=“css”) | Counter(bytes) |Sum | RecordAs(“css_bytes”)
Figure 8: Extraction expressions for features used in §2.1.
to 3 days due to Scribe’s data retention guarantees; however inpractice they only lag by between 20 and 40 seconds.4.4 Feature ExtractionCanopyprovides a domain-specific language (DSL) fordescrib-ing features as pipelines of functions. Each function specifiedin the DSL is optimized and compiled into an efficient under-lying implementation. Figure 8 illustrates DSL expressions forseveral features from the case study from §2.1.Feature extraction is Canopy’s most heavily iterated com-
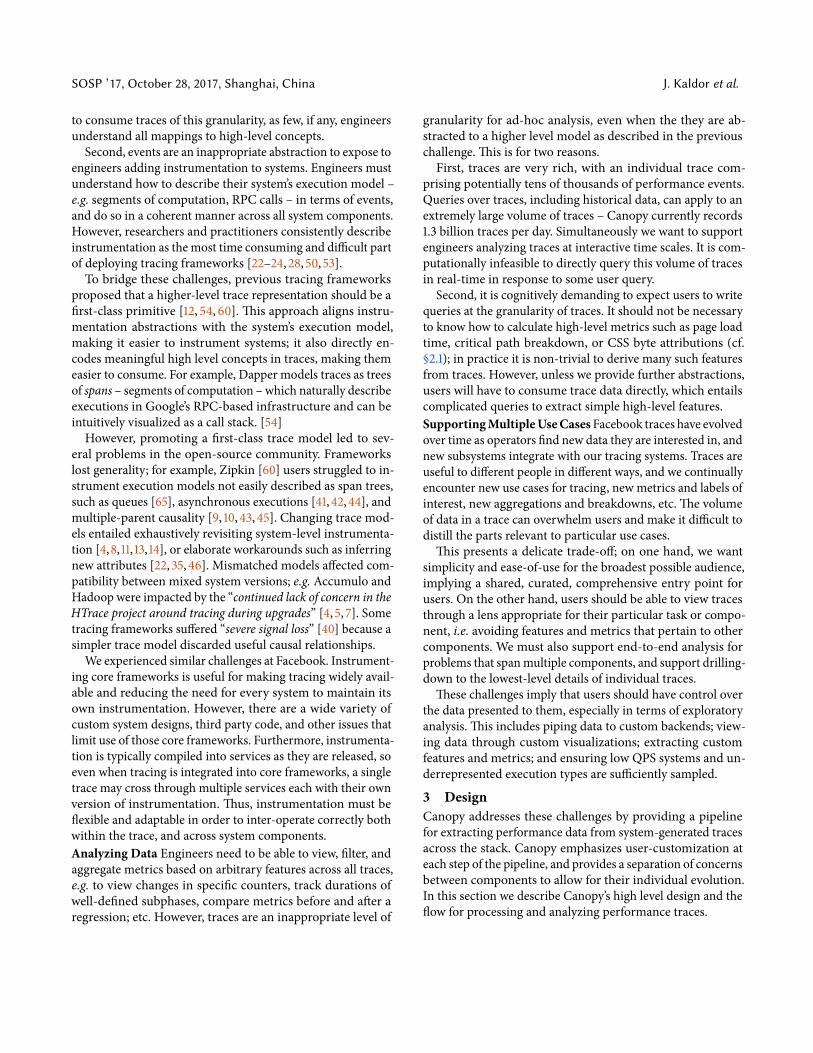
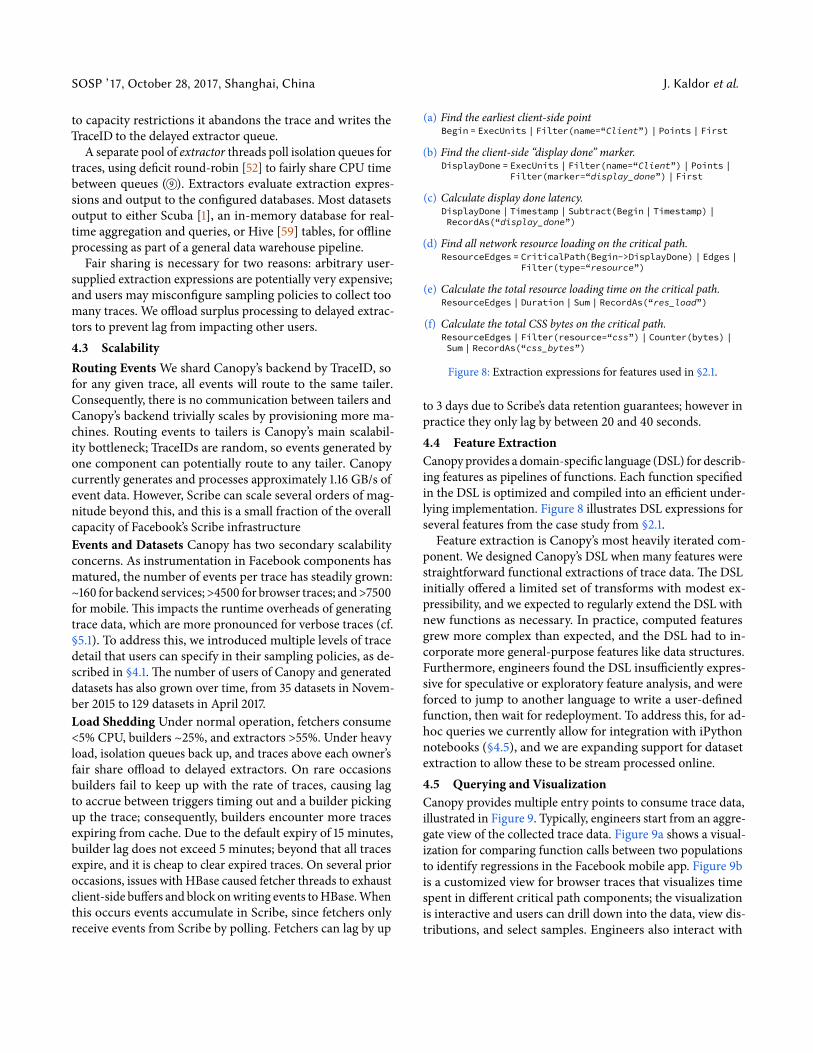
ponent.We designed Canopy’s DSL when many features werestraightforward functional extractions of trace data. The DSLinitially offered a limited set of transforms with modest ex-pressibility, and we expected to regularly extend the DSL withnew functions as necessary. In practice, computed featuresgrew more complex than expected, and the DSL had to in-corporatemore general-purpose features like data structures.Furthermore, engineers found the DSL insufficiently expres-sive for speculative or exploratory feature analysis, and wereforced to jump to another language to write a user-definedfunction, then wait for redeployment. To address this, for ad-hoc queries we currently allow for integration with iPythonnotebooks (§4.5), and we are expanding support for datasetextraction to allow these to be stream processed online.4.5 Querying and VisualizationCanopy provides multiple entry points to consume trace data,illustrated in Figure 9. Typically, engineers start from an aggre-gate view of the collected trace data. Figure 9a shows a visual-ization for comparing function calls between two populationsto identify regressions in the Facebook mobile app. Figure 9bis a customized view for browser traces that visualizes timespent in different critical path components; the visualizationis interactive and users can drill down into the data, view dis-tributions, and select samples. Engineers also interact with
Canopy SOSP ’17, October 28, 2017, Shanghai, China
1870 traces 734 traces 1136 traces
Sampled Functions filters...
Function Trace % Incl. ms Nrm. ms Nrm. Δms▼ Excl. ms50
0543
0269
0 269 00com/facebook/Layout::create
500
3920
1980 198 0
0com/facebook/layout/Lifecycle::createLayout…
5654
2,2782,017
1,2661,085 182 2
2com/facebook/tools/tracing/RunnableWrapper::run…
520
2660
1390 139 0
0com/facebook/layout/LayoutDefinition::prepare…
5654
559383
311206 105 0
0android/support/v7/widget/RecyclerView::dispatchLayout…
5654
557383
309206 103 0
0android/support/v7/widget/RecyclerView::onLayout……
Version [A] Date after Apr 11, 2017 Date before Apr 13, 2017 Version [B] Date after Apr 8, 2017 Date before Apr 10, 2017
mean
p5 p25
p50
p75
p95
Trace Duration Micros
Perc
ent
2M 3M 4M 5M 6M 7M 8M 9M 10M 11M 12M01234567Interaction Time
Total: XXXX ms
ClientJavascript
ServerResource
js: Rxqi7lfkvHd
0.0 0.5 1.0 1.5 2.0 2.5 3.0 3.5 4.0 4.5 5.0 5.5 6.0 6.5 7.0dd 5.5server_only 4.5tti 3.7
Main Thread_6430_P[0]
DataUnitCollection::addElementsAtTail [DataUnitCollection.add…
RecyclerView::onLayout [RV OnLayout]
DataLoaderUIHandler::doSendStoriesToUI [DataLoader] …
ObservableAdaptersCollection$ListItemCollectionObserver::onI…
RV OnLayoutNewsFeedRecyclerView::onLayout [NewsFeedRecyclerView.onLayout]
traversal to Missing
createLayout:FeedTreePropsWra…
FeedUnitAdapter::lazyGroupPrepare […
RV OnBindView
SinglePartHolder::prepare [SinglePartHolder.prepare]RecyclerView$Adapter::bindViewHolder [RV OnBindView] RecyclerView$Adapter::bind…
layout
RV CreateView
SinglePartHolder::prepare […
Choreographer#doFrame to Missing
RV OnBindViewRecyclerView$Adapter::createViewHo
createLayout:FeedStoryMessage…
cpu
cpu_duration 40.92ms
db
db_connect_duration 0.9301ms
db_duration 1.34ms
db_read_count 1
db_read_duration 0.4098ms
cache
cache_bytes 9.14 KB
cache_count 169
cache_duration 0.6320ms
mem
mem_alloc_bytes 859 KB
mem_peak_bytes 1.84 MB
page piece
page_piece_wait_duration 1.79ms
page_piece_user_input:RENDER Counters Details Points Edges
(a) (b) (c)
(d)
(e)
(f)
Figure 9: Engineers can use aggregate visualizations (a-c) to explore features. They can continue to drill down to individual traces (d-e) orelements within the trace (f). All visualizations support customizations to focus on relevant data for that view (cf. §4.5)
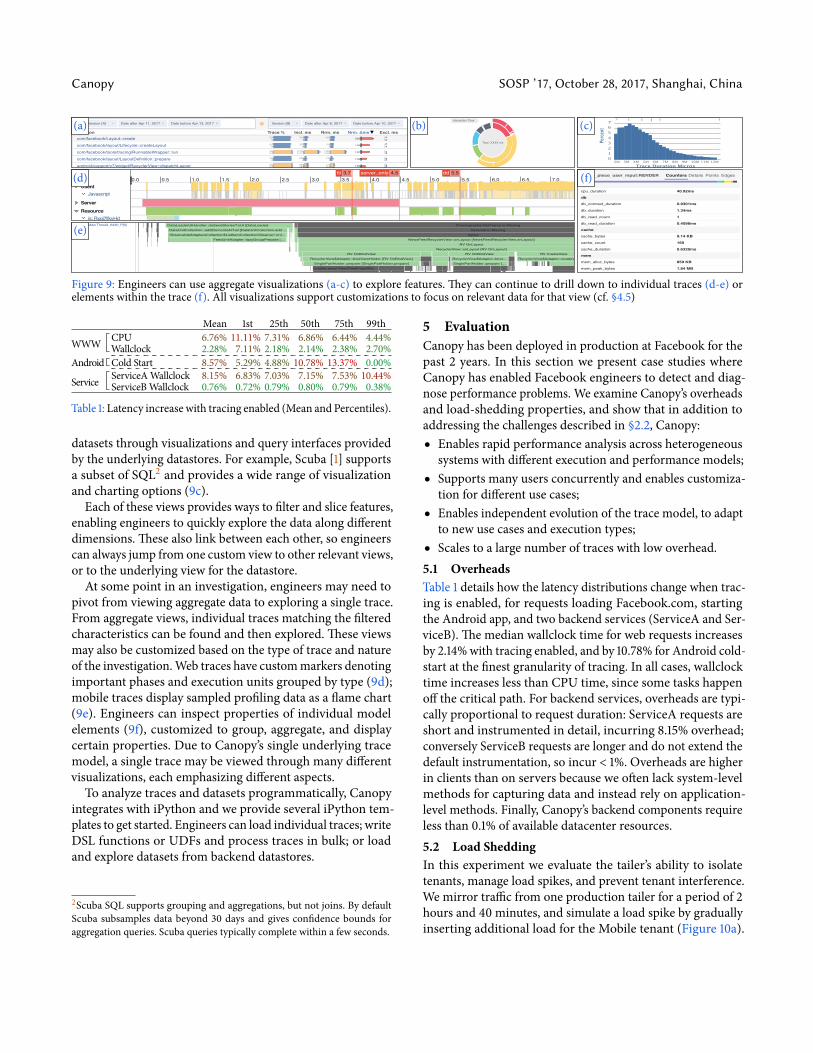
Mean 1st 25th 50th 75th 99th
WWW CPU 6.76% 11.1 1% 7.31% 6.86% 6.44% 4.44%Wallclock 2.28% 7.1 1% 2.18% 2.14% 2.38% 2.70%
Android Cold Start 8.57% 5.29% 4.88% 10.78% 13.37% 0.00%
Service ServiceAWallclock 8.15% 6.83% 7.03% 7.15% 7.53% 10.44%ServiceBWallclock 0.76% 0.72% 0.79% 0.80% 0.79% 0.38%
Table 1: Latency increasewith tracing enabled (Mean and Percentiles).
datasets through visualizations and query interfaces providedby the underlying datastores. For example, Scuba [1] supportsa subset of SQL2 and provides a wide range of visualizationand charting options (9c).
Each of these views provides ways to filter and slice features,enabling engineers to quickly explore the data along differentdimensions. These also link between each other, so engineerscan always jump from one custom view to other relevant views,or to the underlying view for the datastore.At some point in an investigation, engineers may need to
pivot from viewing aggregate data to exploring a single trace.From aggregate views, individual traces matching the filteredcharacteristics can be found and then explored. These viewsmay also be customized based on the type of trace and natureof the investigation.Web traces have custommarkers denotingimportant phases and execution units grouped by type (9d);mobile traces display sampled profiling data as a flame chart(9e). Engineers can inspect properties of individual modelelements (9f), customized to group, aggregate, and displaycertain properties. Due to Canopy’s single underlying tracemodel, a single tracemay be viewed through many differentvisualizations, each emphasizing different aspects.
To analyze traces and datasets programmatically, Canopyintegrates with iPython and we provide several iPython tem-plates to get started. Engineers can load individual traces;writeDSL functions or UDFs and process traces in bulk; or loadand explore datasets from backend datastores.
2Scuba SQL supports grouping and aggregations, but not joins. By defaultScuba subsamples data beyond 30 days and gives confidence bounds foraggregation queries. Scuba queries typically complete within a few seconds.
5 EvaluationCanopy has been deployed in production at Facebook for thepast 2 years. In this section we present case studies whereCanopy has enabled Facebook engineers to detect and diag-nose performance problems.We examine Canopy’s overheadsand load-shedding properties, and show that in addition toaddressing the challenges described in §2.2, Canopy:● Enables rapid performance analysis across heterogeneous
systems with different execution and performancemodels;● Supports many users concurrently and enables customiza-
tion for different use cases;● Enables independent evolution of the tracemodel, to adapt
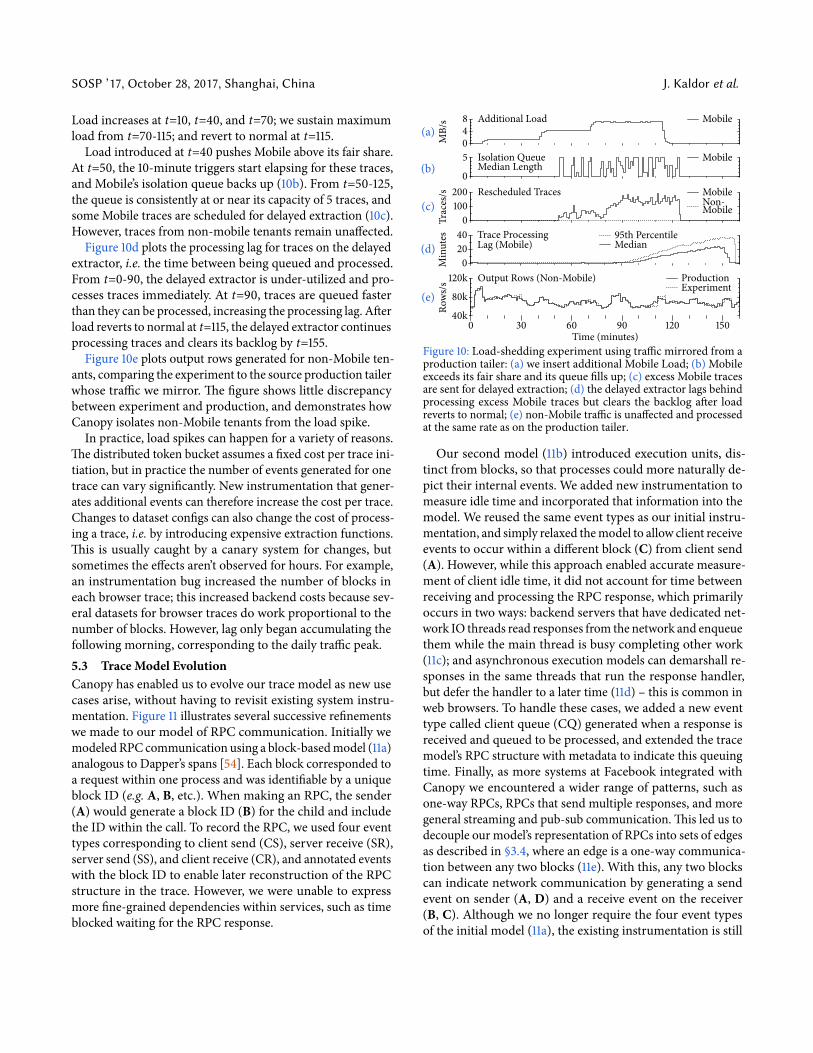
to new use cases and execution types;● Scales to a large number of traces with low overhead.5.1 OverheadsTable 1 details how the latency distributions change when trac-ing is enabled, for requests loading Facebook.com, startingthe Android app, and two backend services (ServiceA and Ser-viceB). Themedian wallclock time for web requests increasesby 2.14%with tracing enabled, and by 10.78% for Android cold-start at the finest granularity of tracing. In all cases, wallclocktime increases less than CPU time, since some tasks happenoff the critical path. For backend services, overheads are typi-cally proportional to request duration: ServiceA requests areshort and instrumented in detail, incurring 8.15% overhead;conversely ServiceB requests are longer and do not extend thedefault instrumentation, so incur < 1%. Overheads are higherin clients than on servers because we often lack system-levelmethods for capturing data and instead rely on application-level methods. Finally, Canopy’s backend components requireless than 0.1% of available datacenter resources.5.2 Load SheddingIn this experiment we evaluate the tailer’s ability to isolatetenants,manage load spikes, and prevent tenant interference.Wemirror traffic from one production tailer for a period of 2hours and 40minutes, and simulate a load spike by graduallyinserting additional load for theMobile tenant (Figure 10a).
SOSP ’17, October 28, 2017, Shanghai, China J. Kaldor et al.
Load increases at t=10, t=40, and t=70; we sustain maximumload from t=70-115; and revert to normal at t=115.
Load introduced at t=40 pushes Mobile above its fair share.At t=50, the 10-minute triggers start elapsing for these traces,andMobile’s isolation queue backs up (10b). From t=50-125,the queue is consistently at or near its capacity of 5 traces, andsomeMobile traces are scheduled for delayed extraction (10c).However, traces from non-mobile tenants remain unaffected.
Figure 10d plots the processing lag for traces on the delayedextractor, i.e. the time between being queued and processed.From t=0-90, the delayed extractor is under-utilized and pro-cesses traces immediately. At t=90, traces are queued fasterthan they can be processed, increasing the processing lag.Afterload reverts to normal at t=115, the delayed extractor continuesprocessing traces and clears its backlog by t=155.
Figure 10e plots output rows generated for non-Mobile ten-ants, comparing the experiment to the source production tailerwhose traffic we mirror. The figure shows little discrepancybetween experiment and production, and demonstrates howCanopy isolates non-Mobile tenants from the load spike.
In practice, load spikes can happen for a variety of reasons.The distributed token bucket assumes a fixed cost per trace ini-tiation, but in practice the number of events generated for onetrace can vary significantly. New instrumentation that gener-ates additional events can therefore increase the cost per trace.Changes to dataset configs can also change the cost of process-ing a trace, i.e. by introducing expensive extraction functions.This is usually caught by a canary system for changes, butsometimes the effects aren’t observed for hours. For example,an instrumentation bug increased the number of blocks ineach browser trace; this increased backend costs because sev-eral datasets for browser traces do work proportional to thenumber of blocks. However, lag only began accumulating thefollowing morning, corresponding to the daily traffic peak.5.3 TraceModel EvolutionCanopy has enabled us to evolve our tracemodel as new usecases arise, without having to revisit existing system instru-mentation. Figure 11 illustrates several successive refinementswemade to our model of RPC communication. Initially wemodeledRPC communication using a block-basedmodel (11a)analogous toDapper’s spans [54]. Each block corresponded toa request within one process and was identifiable by a uniqueblock ID (e.g. A, B, etc.).When making an RPC, the sender(A) would generate a block ID (B) for the child and includethe ID within the call. To record the RPC, we used four eventtypes corresponding to client send (CS), server receive (SR),server send (SS), and client receive (CR), and annotated eventswith the block ID to enable later reconstruction of the RPCstructure in the trace. However, we were unable to expressmore fine-grained dependencies within services, such as timeblocked waiting for the RPC response.
(a)048 Additional Load
MB/s Mobile
(b)0
5 Isolation QueueMedian Length
Mobile
(c)0
100200 Rescheduled Traces
Traces
/s MobileNon-Mobile
(d)0
2040 Trace Processing
Lag (Mobile)
Min
utes 95th Percentile
Median
(e)40k
80k
120k
0 30 60 90 120 150
Output Rows (Non-Mobile)
Rows/s
Time (minutes)
ProductionExperiment
Figure 10: Load-shedding experiment using trafficmirrored from aproduction tailer: (a) we insert additional Mobile Load; (b) Mobileexceeds its fair share and its queue fills up; (c) excess Mobile tracesare sent for delayed extraction; (d) the delayed extractor lags behindprocessing excess Mobile traces but clears the backlog after loadreverts to normal; (e) non-Mobile traffic is unaffected and processedat the same rate as on the production tailer.
Our second model (11b) introduced execution units, dis-tinct from blocks, so that processes couldmore naturally de-pict their internal events.We added new instrumentation tomeasure idle time and incorporated that information into themodel.We reused the same event types as our initial instru-mentation, and simply relaxed themodel to allow client receiveevents to occur within a different block (C) from client send(A). However, while this approach enabled accuratemeasure-ment of client idle time, it did not account for time betweenreceiving and processing the RPC response, which primarilyoccurs in two ways: backend servers that have dedicated net-work IO threads read responses from the network and enqueuethem while the main thread is busy completing other work(11c); and asynchronous execution models can demarshall re-sponses in the same threads that run the response handler,but defer the handler to a later time (11d) – this is common inweb browsers. To handle these cases, we added a new eventtype called client queue (CQ) generated when a response isreceived and queued to be processed, and extended the tracemodel’s RPC structure with metadata to indicate this queuingtime. Finally, as more systems at Facebook integrated withCanopy we encountered a wider range of patterns, such asone-way RPCs, RPCs that sendmultiple responses, andmoregeneral streaming and pub-sub communication. This led us todecouple our model’s representation of RPCs into sets of edgesas described in §3.4, where an edge is a one-way communica-tion between any two blocks (11e).With this, any two blockscan indicate network communication by generating a sendevent on sender (A, D) and a receive event on the receiver(B, C). Although we no longer require the four event typesof the initial model (11a), the existing instrumentation is still
Canopy SOSP ’17, October 28, 2017, Shanghai, China
CSA�B CRA�B
SRA�B SSA�B
Block A
Block B(a)
CSA�B CRC�B
SRA�B SSC�B
Block A
Block B
Block C
(b)
CSA�B CRA�BCQA�
B
SRA�B SSA�B
Block A
Block B(c)
CSA�B CRC�BCQC�
B
SRA�B SSC�B
Block A
Block B
Block C
(d)
SA�BRD�C
RA�B S
D�C
Block A
Block B
Block C
BlockD(e)
Figure 11: Evolution of Canopy’s instrumentation andmodel for RPCs and network communication (cf. §5.3)
MainContentMainLayout
HeadersReminders
ContentCardLastResponse
SuggestionsFooter
Announcements
Page Piece Frequency (millions)0 10 20 30 40 50
(a) The low-priority ‘Suggestions’ page piece un-expectedly appears on the execution critical pathin 10.4M requests, initiating the investigation.
Server:AwaitSuggestionsServer:ParseSuggestions
Client:SuggestionsReceivedClient:ShowSuggestions
Block Frequency (thousands)0 100 200 300 400 500
Page Load Latency (s)0 1 2 3 4 5
(b) ‘Suggestions’ appears on the critical path in two circumstances: on slow clients that receivesuggestions before the page is done loading; and on the server during initial page construction.
Time (s)Th
read
s
2 3 4 5 5.4
1○ 6○
2○
3○5○
4○ Server
ClientBrowser
SuggestionsBlocks
(c) ‘Suggestions’ blocks server execution ( 2○) and delays flush (ideal 3○, actual 5○).Figure 12: An engineer sees something unusual on the critical path and investigates, ultimately finding a server execution issue (cf. §5.4)
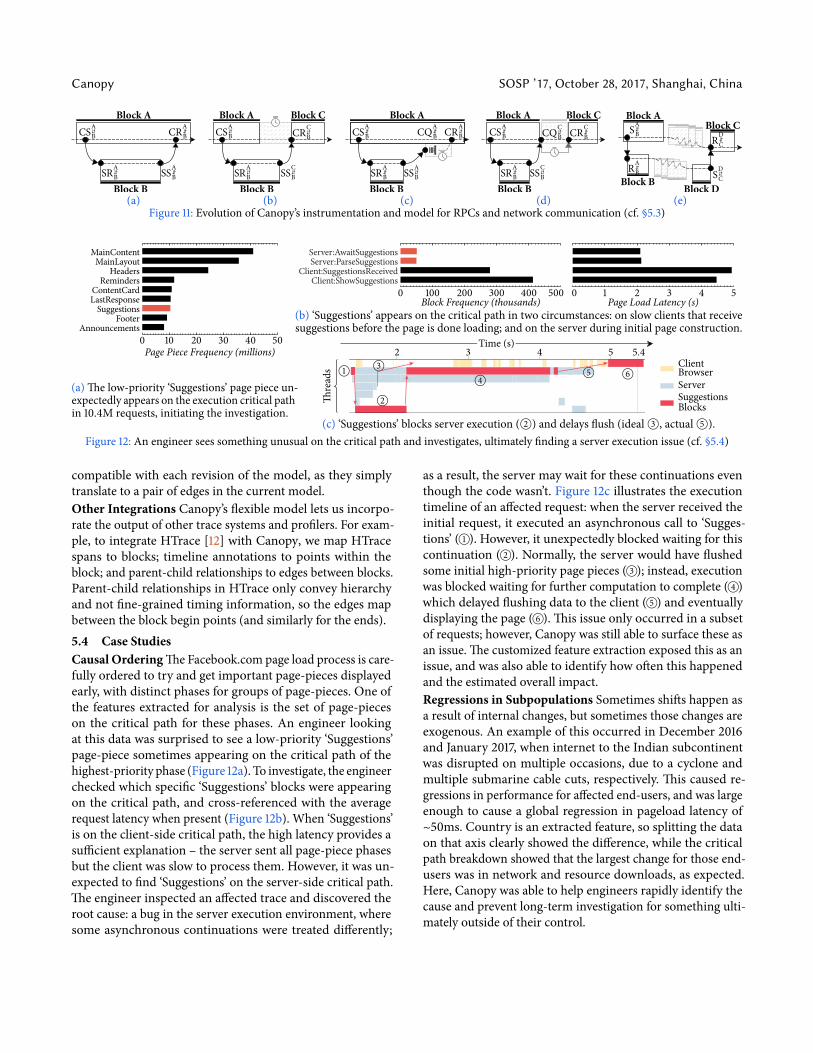
compatible with each revision of the model, as they simplytranslate to a pair of edges in the current model.Other Integrations Canopy’s flexiblemodel lets us incorpo-rate the output of other trace systems and profilers. For exam-ple, to integrate HTrace [12] with Canopy, we map HTracespans to blocks; timeline annotations to points within theblock; and parent-child relationships to edges between blocks.Parent-child relationships in HTrace only convey hierarchyand not fine-grained timing information, so the edges mapbetween the block begin points (and similarly for the ends).5.4 Case StudiesCausal Ordering The Facebook.com page load process is care-fully ordered to try and get important page-pieces displayedearly, with distinct phases for groups of page-pieces. One ofthe features extracted for analysis is the set of page-pieceson the critical path for these phases. An engineer lookingat this data was surprised to see a low-priority ‘Suggestions’page-piece sometimes appearing on the critical path of thehighest-priorityphase (Figure 12a).To investigate, the engineerchecked which specific ‘Suggestions’ blocks were appearingon the critical path, and cross-referenced with the averagerequest latency when present (Figure 12b).When ‘Suggestions’is on the client-side critical path, the high latency provides asufficient explanation – the server sent all page-piece phasesbut the client was slow to process them. However, it was un-expected to find ‘Suggestions’ on the server-side critical path.The engineer inspected an affected trace and discovered theroot cause: a bug in the server execution environment, wheresome asynchronous continuations were treated differently;
as a result, the server may wait for these continuations eventhough the code wasn’t. Figure 12c illustrates the executiontimeline of an affected request: when the server received theinitial request, it executed an asynchronous call to ‘Sugges-tions’ ( 1○). However, it unexpectedly blocked waiting for thiscontinuation ( 2○). Normally, the server would have flushedsome initial high-priority page pieces ( 3○); instead, executionwas blocked waiting for further computation to complete ( 4○)which delayed flushing data to the client ( 5○) and eventuallydisplaying the page ( 6○). This issue only occurred in a subsetof requests; however, Canopy was still able to surface these asan issue. The customized feature extraction exposed this as anissue, and was also able to identify how often this happenedand the estimated overall impact.Regressions in Subpopulations Sometimes shifts happen asa result of internal changes, but sometimes those changes areexogenous. An example of this occurred in December 2016and January 2017, when internet to the Indian subcontinentwas disrupted on multiple occasions, due to a cyclone andmultiple submarine cable cuts, respectively. This caused re-gressions in performance for affected end-users, and was largeenough to cause a global regression in pageload latency of~50ms. Country is an extracted feature, so splitting the dataon that axis clearly showed the difference, while the criticalpath breakdown showed that the largest change for those end-users was in network and resource downloads, as expected.Here, Canopy was able to help engineers rapidly identify thecause and prevent long-term investigation for something ulti-mately outside of their control.
SOSP ’17, October 28, 2017, Shanghai, China J. Kaldor et al.
Identifying Improvements In addition to dataset exploration,Canopy traces can also be used to perform hypothetical anal-ysis. Engineers responsible for the early flush component de-scribed in §2.1 improved page load time by considering thecause for the performance breakdowns in the critical path.Their analysis showed that clients were spending an inordinateamount of time on the critical path waiting for additional re-sources (CSS/JavaScript) before the page load was complete.This occurred because Facebook.com already sent down re-sources at the start of the page that were expected to be neededlater on, but it was possible for page pieces to require addi-tional resources after construction. They predicted that send-ing down a secondwave of resourcesmidway through the pageload, particularly those typically used by low priority page-pieces, would lead to a noticeable performance improvement,which was borne out when the feature was implemented.Mobile Clients Canopy is used across many domains at Face-book to analyze production trace data, including mobile ap-plications. Canopy helps to identify resource bottlenecks andexpensive function calls during various phases of importantflows like cold-start (the time to start the application) and long-scroll-frames (other applicationwork preventing timely displayupdates). Engineers used Canopy’s feature extraction of call-stacks to identify a slow-building regression over multiplereleases caused by a gradual increase in the number of initial-ization modules. Ad-hoc queries with Python notebooks havealso been used to investigate metric quality; a query foundcold-start traceswith large gapswith nothing executing,whichled engineers to find that their startup metric was includingbackground app starts that they wanted to exclude.Exploratory Analysis Features determined to be generallyuseful for a broad set of users are exposed in general datasetsfor engineers to use for quick investigations. Sometimes there’sa slow request, and engineers just want quick help to find thecause. As an example, in February 2017, an engineer noticeda poorly performing endpoint which frequently timed out,and so examined features from a few traces. One of these wasdatabase time along the critical path, which led the engineerto find and fix an expensive query without an index, speedingup the DB query by 99% and page load time by 50%.Custom Analysis For longer or more complex investigations,engineers can define custom views.Canopy allows these teamsto quickly set up a customized table, and reusemany of thefeatures from general tables, without forcing all features toexist in a shared global table. As an example, search resultswere broken up into several page-pieces, where the first maybe empty. The latency of this pagewas defined as the display ofthe first non-empty page-piece. Engineers defined this metricas a complex extracted feature in a dataset, added existing,modular critical path features to further break it down, andthen used this dataset for long-termmonitoring of the flow.
6 ExperiencesSome observations from our experiences with Canopy:● Common datasets give casual users an entry point withoutexposing them to the underlying trace structure. Since notall features are applicable to all trace types, our commondatasets vary by domain. For example,wewidely use criticalpath breakdowns for web stack analysis, but not for mobile,where it is more difficult to correctly instrument all block-ing (locks, CPU scheduling, framework code, etc.). Instead,mobile datasets center on common resource counters.● It is an open questionwhether a DSL can express all possibleanalyses, or if a general purpose language is required.● Canopy is applicable to average case, edge case, and taillatency analysis, because at scale,many strange behaviorsare frequent enough to identify as statistical outliers. Onelimitation is investigating a specific instance or request thatwasn’t sampled, e.g. a single user error report of an anomaly.● Canopy is suitable for tracing any action with a well-definedbegin and end.We currently trace user-facing systems (web,mobile), backend systems (services, data analytics), and dataprovenance scenarios (e.g. the end-to-end lifecycle of a usernotification). Trace durations vary bymultiple orders ofmag-nitude, which we handle with per-domain triggers and time-outs. Themain scenarios we’ve encountered where Canopy’sassumptions don’t apply are long running dataflow pipelinesand scenarios with multiple beginning points.● Our most effective and scalable instrumentation strategiesinclude instrumenting core frameworks, and capturing datafrom existing profilers and loggers.● Common instrumentation errors include conflatingTraceIDpropagation with tracing (and wanting to trace all requests),and propagating TraceIDs incorrectly (causing traces thatnever end). The latter leads to a large number of eventsbeing generated for a single trace; to dealwith this,we addedtriggers for blacklisting erroneous traces.●We only support opportunistic tracing (cf. §4.1) in a subsetof components, because it requires updating instrumenta-tion to propagate sampling metadata in addition to the Tra-ceID. It is an open question whether context propagationcan generalize, i.e. to propagate arbitrarymetadata withoutrequiring instrumentation changes.
7 RelatedWorkIn §2.2 we discuss the challenges Canopy addresses that areshared with many other tracing tools. We complement thediscussion on related work here.GeneratingPerformanceDataExisting tools for troubleshoot-ing distributed systems make use of a range of different inputdata. They include tools that ingest existing per-process and
Canopy SOSP ’17, October 28, 2017, Shanghai, China
per-component logs [29,37,66]; end-to-end tracing tools thatgenerate causally-related event data [12,24,39, 50, 54,60]; state-monitoring systems that track system-level metrics and per-formance counters [36]; and aggregation systems to collectand summarize application-level monitoring data [30,34,61].Wang et al. provide a comprehensive overview of datacentertroubleshooting tools in [63]. Canopy is designed to provide acommon entry point for this breadth of data, since all of theseinput types are useful for different kinds of analysis.
Like Canopy,many tools record causality between events ex-plicitly by propagating identifiers along the request executionpath [12,24,39,50,54,60]. Prior systems alleviate the instrumen-tation burden (cf. §2.2) by propagating context in shared under-lying communication and concurrency layers [24,49, 54, 56];recent work has also used source and binary rewriting tech-niques to automatically instrument common execution mod-els [26,32,34,48].An alternative approach to instrumenting systems is to in-
fer correlation or causality from existing outputs such as logs.Approaches include combining identifiers – i.e. call ID, IP ad-dress, etc.– present across multiple logging statements [16,22,29, 58,66,67]; inferring causality using machine learning andstatistical techniques [18,35,38,66]; and augmenting modelswith static source code analysis [66–68]. In practice it is chal-lenging to scale black-box analysis because inferring causalrelationships is expensive; for example, computing a Facebookmodel from 1.3M traces took 2 hours for the Mystery Ma-chine [22]. Canopy scales well beyond this, to 1.3 billion tracesper day currently, because of its sharded backend; we requireno communication between either traces or shards (cf. §4.3).Analyzing Data Prior work in troubleshooting distributedsystems has presented a variety of automated analysis tech-niques: semi-automatically honing in on root causes of perfor-mance anomalies [64]; identifying statistical anomalies [29];online statistical outlier monitoring [15]; analyzing criticalpath dependencies, slack, and speedup [22,47]; and explainingstructural and statistical differences between ‘before’ and ‘after’traces [35, 51]. Manual analysis has covered an even broaderrange of issues, such as requests whose structure or timingdeviate from the norm [2, 17, 20, 21, 46, 51]; identifying slowcomponents and functions [19,35, 54]; andmodelling work-loads and resource usage [16, 17,35, 58]. Use cases for tracingtools deployed in production at 26 companies range fromdebugging individual anomalous requests, to capturing perfor-mance, resource, and latencymetrics, to correlating failuresand behavioral clustering [33].Canopy does not obviate any of these techniques, but in-
stead provides the data extraction pipeline that generates theinput to many of them. For example, Spectroscope [51] di-agnoses regressions between before- and after- sets of traces,by comparing trace structures and performing ANOVA tests.
Similarly, Facebook developers have made extensive use ofstatistical comparison techniques to find correlations betweenfeatures and compare distributions, e.g. between applicationversions. However, operator-driven exploration is a prerequi-site to most automated approaches in order to identify salientfeatures [37]. In a recent analysis of Splunk usage, Alspaugh etal. noted that the use of statistical andmachine learning infer-ence techniques is “relatively rare” and that human inferenceis the key driver of analyses [3]. Canopy’s primary use caseis to support ad hoc high-level exploratory analysis, becauseproblems arising in practice are difficult to anticipate and thereare a wide range of potential features to explore [34].
Several prior systems support ad hoc exploration similarto the case studies we present. G2 [25] is a system for writ-ing queries over execution traces at the level of raw traces, sofaces the scalability and abstraction challenges of §2.2. Forexample, evaluating a G2 query over 130million events takes100 seconds; by comparison, interactive Canopy queries de-rive from trillions of events. Stratified sampling can improvequery time by returning approximate results [62]; similarly,for historical data older than 30 days, Scuba subsamples andprovides confidence bounds (cf. §4.5). Pivot Tracing [34] is adynamic instrumentation framework that enables operatorsto iteratively install new queries during the diagnosis process;however it does not apply to historical analysis, which is animportant Facebook use case that necessitates capturing andstoring full traces.
8 ConclusionIn this paper we presented Canopy,which emphasizes a decou-pled, customizable approach to instrumentation and analysis,allowing each to evolve independently. Canopy addresses sev-eral challenges in generating, collecting, and processing tracedata, and introduces feature extraction as an important inter-mediary step for aggregate analysis. Canopy has been used forthe past 2 years to solve numerous production performanceproblems across the Facebook stack, over both end-user clientcode as well as server-side code.
9 AcknowledgementsWe thank our shepherd Rebecca Isaacs and the anonymousSOSP reviewers for their invaluable feedback and suggestions,and Canopy teammembers and collaborators past and present,including Philippe Ajoux, David Chou, Jim Hunt, DelyanKratunov, Jérémie Marguerie, Ben Maurer, and Dawid Pus-tulka.
References[1] Abraham, L., Allen, J., Barykin, O., Borkar, V., Chopra, B., Gerea,
C.,Merl, D.,Metzler, J., Reiss, D., Subramanian, S.,Wiener, J. L.,and Zed, O. Scuba: Diving into Data at Facebook. In 39th InternationalConference on Very Large Data Bases (VLDB ’13). (§3.1, 4.2, and 4.5).

SOSP ’17, October 28, 2017, Shanghai, China J. Kaldor et al.
[2] Aguilera, M. K., Mogul, J. C., Wiener, J. L., Reynolds, P., andMuthitacharoen, A. Performance Debugging for Distributed Systemsof Black Boxes. In 19th ACM Symposium on Operating Systems Principles(SOSP ’03). (§7).
[3] Alspaugh, S., Di Chen, B., Lin, J., Ganapathi, A., Hearst, M. A.,and Katz, R. H. Analyzing Log Analysis: An Empirical Study of UserLog Mining. In 28th USENIX Large Installation System AdministrationConference (LISA ’14). (§2.2 and 7).
[4] Apache. ACCUMULO-3741: Reduce incompatibilities with htrace 3.2.0-incubating. Retrieved January 2017 from https://issues.apache.org/jira/browse/ACCUMULO-3741. (§2.2).
[5] Apache. ACCUMULO-4171: Update to htrace-core4. https://issues.apache.org/jira/browse/ACCUMULO-4171. [Online; accessed January2017]. (§2.2).
[6] Apache. CASSANDRA-10392: Allow Cassandra to trace to customtracing implementations. Retrieved January 2017 from https://issues.apache.org/jira/browse/CASSANDRA-10392. (§3.2).
[7] Apache. HBASE-12938: Upgrade HTrace to a recent supportable in-cubating version. Retrieved January 2017 from https://issues.apache.org/jira/browse/HBASE-12938. (§2.2).
[8] Apache. HBASE-9121: Update HTrace to 2.00 and add new exampleusage. Retrieved January 2017 from https://issues.apache.org/jira/browse/HBASE-9121. (§2.2).
[9] Apache. HDFS-11622 TraceId hardcoded to 0 in DataStreamer, cor-relation between multiple spans is lost. Retrieved April 2017 fromhttps://issues.apache.org/jira/browse/HDFS-11622. (§2.2).
[10] Apache. HDFS-7054: Make DFSOutputStream tracing more fine-grained.Retrieved January 2017 from https://issues.apache.org/jira/browse/HDFS-7054. (§2.2).
[11] Apache. HDFS-9080: update htrace version to 4.0.1. Retrieved January2017 from https://issues.apache.org/jira/browse/HDFS-9080. (§2.2).
[12] Apache. HTrace. Retrieved January 2017 from http://htrace.incubator.apache.org/. (§2.2, 3.2, 5.3, and 7).
[13] Apache. HTRACE-118: support setting the parents of a span after thespan is created. Retrieved January 2017 from https://issues.apache.org/jira/browse/HTRACE-118. (§2.2).
[14] Apache. HTRACE-209:Make span ID 128 bit to avoid collisions. Re-trieved January 2017 from https://issues.apache.org/jira/browse/HTRACE-209. (§2.2).
[15] Bailis, P., Gan, E.,Madden, S., Narayanan, D., Rong, K., and Suri,S. MacroBase: Analytic Monitoring for the Internet of Things. arXivpreprint arXiv:1603.00567 (2016). (§7).
[16] Barham, P., Donnelly, A., Isaacs, R., andMortier, R. Using Mag-pie for Request Extraction and Workload Modelling. In 6th USENIXSymposium on Operating Systems Design and Implementation (OSDI ’04).(§7).
[17] Barham, P., Isaacs, R., Mortier, R., and Narayanan, D. Magpie:Online Modelling and Performance-Aware Systems. In 9th USENIXWorkshop on Hot Topics in Operating Systems (HotOS ’03). (§7).
[18] Beschastnikh, I., Brun, Y., Ernst,M. D., and Krishnamurthy, A. In-ferring Models of Concurrent Systems from Logs of Their Behavior withCSight. In 36th ACM International Conference on Software Engineering(ICSE ’14). (§7).
[19] Chanda, A., Cox, A. L., and Zwaenepoel,W.Whodunit: TransactionalProfiling for Multi-Tier Applications. In 2nd ACM European Conferenceon Computer Systems (EuroSys ’07). (§7).
[20] Chen,M.Y., Accardi, A.,Kiciman, E., Patterson, D.A., Fox, A., andBrewer, E. A. Path-Based Failure and Evolution Management. In 1stUSENIX Symposium on Networked Systems Design and Implementation(NSDI ’04). (§7).
[21] Chen,M. Y., Kiciman, E., Fratkin, E., Fox, A., and Brewer, E. Pin-point: Problem Determination in Large, Dynamic Internet Services. In
32nd IEEE/IFIP International Conference on Dependable Systems andNetworks (DSN ’02). (§7).
[22] Chow,M.,Meisner, D., Flinn, J., Peek, D., andWenisch, T. F. TheMysteryMachine: End-to-end Performance Analysis of Large-scale In-ternet Services. In 11th USENIX Symposium on Operating Systems Designand Implementation (OSDI ’14). (§2.2 and 7).
[23] Fonseca, R., Freedman,M. J., and Porter, G. Experiences with Trac-ing Causality in Networked Services. In 2010 USENIX Internet NetworkManagement Workshop/Workshop on Research on Enterprise Networking(INM/WREN ’10). (§2.2).
[24] Fonseca, R., Porter, G., Katz, R. H., Shenker, S., and Stoica, I.X-Trace: A Pervasive Network Tracing Framework. In 4th USENIX Sym-posium on Networked Systems Design and Implementation (NSDI ’07).(§1, 2.2, and 7).
[25] Guo, Z., Zhou, D., Lin, H., Yang,M., Long, F., Deng, C., Liu, C., andZhou, L. G2 : A Graph Processing System for Diagnosing DistributedSystems. In 2011 USENIX Annual Technical Conference (ATC). (§7).
[26] Jiang, Y., Ravindranath, L.,Nath, S., and Govindan, R.WebPerf:Evaluating “What-If ” Scenarios for Cloud-hostedWeb Applications. In2016 Conference of the ACM Special Interest Group on Data Communica-tion (SIGCOMM). (§7).
[27] Johnson, R. Facebook’s Scribe technology now open source. (Octo-ber 2008). Retrieved August 2017 from https://www.facebook.com/note.php?note_id=32008268919. (§4.1 and 4.2).
[28] Karumuri, S. PinTrace: Distributed Tracing at Pinterest. (August 2016).Retrieved July 2017 from https://www.slideshare.net/mansu/pintrace-advanced-aws-meetup. (§2.2).
[29] Kavulya, S. P., Daniels, S., Joshi, K., Hiltunen,M., Gandhi, R., andNarasimhan, P. Draco: Statistical Diagnosis of Chronic Problems inLarge Distributed Systems. In 42nd IEEE/IFIP Conference onDependableSystems and Networks (DSN ’12). (§7).
[30] Ko, S. Y., Yalagandula, P., Gupta, I., Talwar, V.,Milojicic, D., andIyer, S. Moara: Flexible and Scalable Group-Based Querying System. In9th ACM/IFIP/USENIX International Conference on Middleware (Mid-dleware ’08). (§7).
[31] Leavitt, J. End-to-End Tracing Models: Analysis and Unification. B.Sc.Thesis, Brown University, 2014. (§2.2 and 3.3).
[32] Li, D.,Mickens, J., Nath, S., and Ravindranath, L. Domino: Under-standingWide-Area, AsynchronousEventCausality inWebApplications.In 6th ACM Symposium on Cloud Computing (SoCC ’15). (§7).
[33] Mace, J. End-to-End Tracing: Adoption and Use Cases. Survey,Brown University, 2017. http://cs.brown.edu/people/jcmace/papers/mace2017survey.pdf. (§7).
[34] Mace, J., Roelke, R., and Fonseca, R. Pivot Tracing: Dynamic CausalMonitoring for Distributed Systems. In 25th ACM Symposium on Oper-ating Systems Principles (SOSP ’15). (§7).
[35] Mann, G., Sandler,M., Krushevskaja, D., Guha, S., and Even-Dar,E. Modeling the Parallel Execution of Black-Box Services. In 3rdUSENIXWorkshop on Hot Topics in Cloud Computing (HotCloud ’11). (§2.2, 3.4,and 7).
[36] Massie,M. L., Chun, B. N., and Culler, D. E. TheGanglia DistributedMonitoring System: Design, Implementation, and Experience. ParallelComputing 30, 7 (2004), 817–840. (§7).
[37] Nagaraj, K., Killian, C. E., and Neville, J. Structured ComparativeAnalysis of Systems Logs to Diagnose Performance Problems. In 9thUSENIX Symposium on Networked Systems Design and Implementation(NSDI ’12). (§7).
[38] Oliner, A. J.,Kulkarni, A.V., andAiken, A.UsingCorrelated Surpriseto Infer Shared Influence. In 40th IEEE/IFIP International Conference onDependable Systems and Networks (DSN ’10). (§7).
[39] OpenTracing. OpenTracing. Retrieved January 2017 from http://opentracing.io/. (§7).

Canopy SOSP ’17, October 28, 2017, Shanghai, China
[40] OpenTracing. Specification 5: Non-RPC Spans and Mapping toMultiple Parents. Retrieved February 2017 from https://github.com/opentracing/specification/issues/5. (§2.2).
[41] OpenZipkin. Zipkin 1189: Representing an asynchronous span in Zipkin.Retrieved January 2017 from https://github.com/openzipkin/zipkin/issues/1189. (§2.2).
[42] OpenZipkin. Zipkin 1243: Support async spans. Retrieved January 2017from https://github.com/openzipkin/zipkin/issues/1243. (§2.2).
[43] OpenZipkin. Zipkin 1244: Multiple parents aka Linked traces. Re-trieved January 2017 from https://github.com/openzipkin/zipkin/issues/1244. (§2.2).
[44] OpenZipkin. Zipkin 925:How to track async spans? Retrieved January2017 from https://github.com/openzipkin/zipkin/issues/925. (§2.2).
[45] OpenZipkin. Zipkin 939: Zipkin v2 span model. Retrieved January 2017from https://github.com/openzipkin/zipkin/issues/939. (§2.2).
[46] Ostrowski, K.,Mann, G., and Sandler,M. Diagnosing Latency inMulti-Tier Black-Box Services. In 5th Workshop on Large Scale Dis-tributed Systems andMiddleware (LADIS ’11). (§2.2, 3.4, and 7).
[47] Ousterhout, K., Rasti, R., Ratnasamy, S., Shenker, S., and Chun,B.-G. Making Sense of Performance in Data Analytics Frameworks. In12th USENIX Symposium on Networked Systems Design and Implementa-tion (NSDI ’15). (§7).
[48] Ravindranath, L., Padhye, J.,Mahajan, R., and Balakrishnan, H.Timecard: Controlling User-Perceived Delays in Server-BasedMobileApplications. In 24th ACM Symposium on Operating Systems Principles(SOSP ’13). (§7).
[49] Reynolds, P., Killian, C. E.,Wiener, J. L.,Mogul, J. C., Shah,M. A.,and Vahdat, A. Pip: Detecting the Unexpected in Distributed Systems.In 3rd USENIX Symposium on Networked Systems Design and Implemen-tation (NSDI ’06). (§7).
[50] Sambasivan, R. R., Shafer, I.,Mace, J., Sigelman, B. H., Fonseca, R.,andGanger,G. R. PrincipledWorkflow-Centric Tracing of DistributedSystems. In 7th ACM Symposium on Cloud Computing (SOCC ’16). (§2.2and 7).
[51] Sambasivan, R. R., Zheng, A. X., De Rosa,M., Krevat, E.,Whitman,S., Stroucken,M.,Wang,W., Xu, L., and Ganger, G. R. DiagnosingPerformance Changes by Comparing Request Flows. In 8th USENIXSymposium on Networked Systems Design and Implementation (NSDI ’11).(§7).
[52] Shreedhar,M., andVarghese,G. Efficient Fair Queuing UsingDeficitRound Robin. In 1995 Conference of the ACM Special Interest Group onData Communication (SIGCOMM). (§4.2).
[53] Sigelman, B. H. Towards Turnkey Distributed Tracing. (June 2016). Re-trieved January 2017 from https://medium.com/opentracing/towards-turnkey-distributed-tracing-5f4297d1736. (§2.2).
[54] Sigelman, B. H., Barroso, L. A., Burrows, M., Stephenson, P.,Plakal, M., Beaver, D., Jaspan, S., and Shanbhag, C. Dapper, aLarge-Scale Distributed Systems Tracing Infrastructure. Technical Re-port, Google, 2010. (§1, 2.2, 5.3, and 7).
[55] Slee,M., Agarwal, A., and Kwiatkowski,M. Thrift: Scalable Cross-Language Services Implementation. Technical Report, Facebook, 2007.(§3).
[56] Spring. SpringCloud Sleuth.Retrieved January 2017 from http://cloud.spring.io/spring-cloud-sleuth/. (§7).
[57] Tang, C., Kooburat, T., Venkatachalam, P., Chander, A., Wen,Z., Narayanan, A., Dowell, P., and Karl, R. Holistic ConfigurationManagement at Facebook. In 25thACM SymposiumonOperating SystemsPrinciples (SOSP ’15). (§4.1 and 4.1).
[58] Thereska, E., Salmon, B., Strunk, J.,Wachs,M., Abd-El-Malek,M.,Lopez, J., andGanger,G.R. Stardust:TrackingActivity in a DistributedStorage System. In 2006 ACM International Conference on MeasurementandModeling of Computer Systems (SIGMETRICS). (§7).
[59] Thusoo, A., Sarma, J. S., Jain,N., Shao, Z., Chakka, P., Zhang,N.,Antony, S., Liu, H., and Murthy, R. Hive - A Petabyte Scale DataWarehouse Using Hadoop. In 26th IEEE International Conference onData Engineering (ICDE ’10). (§4.2).
[60] Twitter. Zipkin. Retrieved July 2017 from http://zipkin.io/. (§2.2and 7).
[61] Van Renesse, R., Birman, K. P., and Vogels,W. Astrolabe: A Robustand Scalable Technology For Distributed SystemMonitoring,Manage-ment, and DataMining. ACM Transactions on Computer Systems 21, 2(2003), 164–206. (§7).
[62] Wagner, T., Schkufza, E., and Wieder, U. A Sampling-Based Ap-proach to Accelerating Queries in Log Management Systems. In Posterpresented at: 7thACM SIGPLAN InternationalConference on Systems,Pro-gramming, Languages and Applications: Software for Humanity (SPLASH’16). (§7).
[63] Wang, C., Kavulya, S. P., Tan, J., Hu, L., Kutare, M., Kasick, M.,Schwan, K., Narasimhan, P., and Gandhi, R. Performance Trou-bleshooting in Data Centers: An Annotated Bibliography. ACM SIGOPSOperating Systems Review 47, 3 (2013), 50–62. (§7).
[64] Wang, C., Rayan, I. A., Eisenhauer, G., Schwan, K., Talwar, V.,Wolf,M., andHuneycutt, C.VScope:Middleware for TroubleshootingTime-Sensitive Data Center Applications. In 13th ACM/IFIP/USENIXInternational Middleware Conference (Middleware ’12). (§7).
[65] Workgroup, D. T. TracingWorkshop. (February 2017). Retrieved Feb-ruary 2017 from https://goo.gl/2WKjhR. (§2.2).
[66] Xu,W.,Huang, L., Fox, A.,Patterson, D., and Jordan,M. I.DetectingLarge-Scale System Problems byMining Console Logs. In 22nd ACMSymposium on Operating Systems Principles (SOSP ’09). (§7).
[67] Zhao, X., Rodrigues, K., Luo, Y., Yuan, D., and Stumm, M. Non-Intrusive Performance Profiling for Entire Software Stacks Based on theFlowReconstruction Principle. In 12thUSENIX SymposiumonOperatingSystems Design and Implementation (OSDI ’16). (§7).
[68] Zhao, X., Zhang, Y., Lion, D., Faizan, M., Luo, Y., Yuan, D., andStumm,M. lprof: A Non-intrusive Request Flow Profiler for DistributedSystems. In 11th USENIX Symposium on Operating Systems Design andImplementation (OSDI ’14). (§7).