Embed Size (px)
Citation preview
Cationic and Anionic Ordering in Tetrahedral
and Octahedral Sheets of Synthetic Al-rich
Phlogopite Investigated by Solid-State NMR
Spectroscopy and Monte-Carlo Simulations
Dissertation
zur Erlangung des Grades der Doktorwürde
der Naturwissenschaften
Dr. rer. nat.
der Fakultät für Geowissenschaften
der Ruhr-Universität Bochum
vorgelegt von
Dipl.-Min. Ramona Langner
aus Rochlitz
im Juli 2010


Erster Gutachter: Priv.-Doz. Dr. Michael Fechtelkord
Zweiter Gutachter: Dr. Alberto García Arribas
Fachfremder Gutachter: Prof. Dr. Harald Zepp
Datum der Abgabe: 14.07.2010
Datum der Disputation: 26.10.2010
Abstract
II
Abstract
The aim of this study was to investigate the relationship between cation and
anion ordering in the tetrahedral and octahedral sheets of the mica phlogopite.
Phlogopite samples have been synthesised at T = 600 °C and p = 2 kbar with a
run duration of one week. A wide range of nominal compositions
K (Mg3-xAlx) (Al1+xSi3-xO10) (OH)y F2-y has been covered, reaching from F-free to
water-free compositions (0.0 ≤ y ≤ 2.0) and from Mg-phlogopites to very Al-rich
samples (0.0 ≤ x ≤ 1.6). The obtained samples have been investigates using solid-
state NMR spectroscopy, powder X-ray diffraction and scanning electron microscopy.
At the same time, Monte-Carlo simulations have been performed by Dr. Alberto
García Arribas, Institut de Ciència de Materials de Barcelona, CSIC, Bellaterra,
Spain, and Dr. Javier López-Solano, Universidad del Pais Vasco, Bilbao, Spain, for
F-free compositions. These simulations were based on the so-called ‘J-formalism’
describing ordering in terms of exchange reactions concerning neighbouring sites.
The ordering patterns found in the atomic configurations obtained from the
simulations were then compared to the experimental results.
For all compositions, the Al-content of the tetrahedral sheets estimated from 29Si
MAS NMR spectra has been found to be lower than the Al-content of the initial oxide
mixtures. The highest amount of Al incorporated into the structure was observed for
hydroxyl-phlogopites (y = 2.0). For nominal compositions of xnom = 1.0 and 1.2 the
estimated Al-content xest was 0.83. At even higher initial Al-contents (xnom = 1.6) the
amount of Al incorporated decreased again.
Phlogopites containing fluorine showed a reduced ability to incorporate Al into
their crystal structure. As soon as F was added to the initial oxide mixture the
estimated Al-content of the phlogopites decreased considerably compared to F-free
compositions. However, the exact amount of F was not significant as for a given
nominal Al-content the amount of Al incorporated into the structure has been roughly
the same for all F-contents. Only for water-free systems a sharp decrease in xest has
been observed again. It can be concluded that the mere presence of F in the mixture
has a much stronger influence on the phlogopites’ ability to incorporate Al than the
exact ratio of OH/F.
Abstract
III
Excess Al led to the formation of impurity phases. Except for samples of very low
initial Al-contents, aluminium oxide (Al2O3) has been observed for all compositions.
Another impurity phase was potassium aluminium hexafluoride (K3AlF6*0.5H2O)
which was not only formed at high F- and Al-contents, but also in samples containing
only small amounts of F if the Al-content was high enough. The formation of kalsilite
has not been observed in the samples studied here.
The ordering of tetrahedral cations is dominated by next-nearest-neighbour
interactions. The corresponding interaction parameter 1J has been found to be highly
positive which means occupation of directly neighboured tetrahedra by two Al-atoms
is avoided. At a maximum Al-content of x = 1.0, long-range ordering occurs with Al
and Si occupying tetrahedra alternately. At lower amounts of Al a separation into two
areas of different compositions has been observed in the configurations of lowest
energy obtained from Monte Carlo simulations. On the one hand the ordered
structure is preserved in clusters of composition Si/[4]Al = 1:1. On the other hand the
lower Al-content is compensated by the formation of clusters showing a composition
similar to phlogopite in the narrower sense, i.e. without additional tetrahedral Al
(Si/[4]Al = 3:1). The Al-poor clusters are characterised by short-range ordering
controlled by the avoidance of [4]Al-O-[4]Al linkages.
19F and 1H MAS NMR spectroscopy has been applied to investigate the ordering
of Mg/Al and OH/F in the octahedral sheets. A strong preference of F for a co-
ordination by 3 Mg and of OH for 2MgAl has been observed, respectively. For
hydroxyl-groups this preference decreases with increasing nominal Al-content of the
samples. In contrast, the amount of F being co-ordinated by Mg only increases for
higher initial Al-contents.
Octahedral cations have been found to be completely ordered for x = 1.0. [6]Al is
always co-ordinated by six Mg-atoms, therefore avoiding a direct neighbourhood of
two Al-atoms in adjacent octahedra, similar to [4]Al-O-[4]Al avoidance in the tetrahedral
sheet. Again, clustering is observed for lower Al-contents. Ordered clusters of a
composition with Mg/[6]Al = 2:1 are separated by areas containing only Mg.
The relationship between both ordering patterns has also been investigated.
{1H} → 29Si HETCOR NMR experiments revealed a close neighbourhood of Al-rich
tetrahedral and octahedral clusters, and this has been confirmed by the simulation
results. Two Al-atoms occupying directly neighboured sites has been observed to be
Abstract
IV
favourable if two different types of polyhedra are involved. Moreover, {1H/19F} → 29Si
CPMAS NMR experiments showed a clustering of OH and F in the octahedral sheet.
F-rich octahedral environments are more likely to be found near Al-poor tetrahedral
areas. It can be concluded that the clustering involves all sheets of a single layer
package, leading to a separation of clusters of the two end-member compositions
K Mg (AlSi3O10) F2 (fluoro-phlogopite) and K (Mg2Al) (Al2Si2O10) (OH)2 (‘eastonite’),
respectively.
Powder X-ray diffraction patterns showed that the exchange of Mg/Si by [6]Al/[4]Al
not only influences the local atomic arrangement, but also affects the crystallisation of
polytypes. Structural changes resulting from the different cationic radii of Mg2+ and
Al3+ lead to the formation phlogopite-2M1 next to the 1M-polytype which is more
common in natural samples. These two polytypes are intergrown leading to stacking
faults and a high degree of disorder in the whole structure.
Kurzfassung
V
Kurzfassung
Ziel der vorliegenden Arbeit war die Aufklärung des Zusammenhangs zwischen
Kationen- und Anionenordnung in den Tetraeder- und Oktaederschichten des
Glimmers Phlogopit.
Dazu wurden Phlogopit-Proben bei einer Temperatur von 600 °C und einem
Druck von 2 kbar sowie einer Synthesedauer von einer Woche hergestellt. Ein großer
Bereich an nominellen Zusammensetzungen K (Mg3-xAlx) (Al1+xSi3-xO10) (OH)y F2-y
wurde abgedeckt, der von fluor- zu wasserfreien Zusammensetzungen reichte (0.0 ≤
y ≤ 2.0) und sowohl Al-freie als auch Al-reiche Proben umfasste (0.0 ≤ x ≤ 1.6). Die
auf diese Weise erhaltenen Proben wurden mittels Festkörper-NMR-Spektroskopie,
Röntgenpulverdiffraktion und Rasterelektronenmikroskopie untersucht.
Zugleich führten Dr. Alberto García Arribas, Institut de Ciència de Materials de
Barcelona, CSIC, Bellaterra, Spanien, und Dr. Javier López-Solano, Universidad del
Pais Vasco, Bilbao, Spanien, Monte-Carlo-Simulationsrechnungen für F-freie
Zusammensetzungen durch, basierend auf dem sogenannten „J-Formalismus“.
Dieser beschreibt Ordnung auf benachbarten Kationenplätzen durch
Austauschreaktionen. Die Ordnungsmuster in den durch die Simulationen erhaltenen
atomaren Konfigurationen konnten dann mit den experimentellen Ergebnissen
verglichen werden.
In allen Proben war der mithilfe von 29Si MAS NMR-Spektren bestimmte Al-
Gehalt der Phlogopite geringer als der der Ausgangsmischung. Reine Hydroxyl-
Phlogopite zeigten den höchsten Al-Gehalt: Für eine nominelle Zusammensetzung
von xnom = 1.0 und 1.2 wurde ein geschätzer Wert xest = 0.82 gefunden. Ein
Sättigungseffekt wurde insofern beobachtet, als dass bei noch höherem nominellen
Al-Gehalt die Menge an eingebautem Al wieder abnahm.
Im Vergleich dazu zeigten F-haltige Phlogopite ein geringeres Vermögen, Al in
ihre Struktur aufzunehmen. Für Proben unterschiedlichen F-Gehalts war die Menge
an aufgenommenem Al für gleiche nominelle Zusammensetzung jedoch ähnlich.
Lediglich bei wasserfreien Proben zeigte sich eine deutliche Abnahme des Al-
Gehalts bei gleichem nominellem Al-Gehalt. Daraus folgt, dass die Präsenz von F in
der Ausgangsmischung einen deutlichen Effekt auf das Vermögen der Phlogopite Al
aufzunehmen hat, während der genaue F-Gehalt keine so wichtige Rolle spielt.
Kurzfassung
VI
Das überschüssige Aluminium führte zur Bildung von Nebenphasen. Mit
Ausnahme von Proben mit sehr niedrigem nominellen Al-Gehalt wurde für alle
Zusammensetzungen Aluminiumoxid (Al2O3) gefunden. Eine weitere Nebenphase
war Kaliumaluminiumhexafluorid (K3AlF6*0.5H2O), welches nicht nur bei hohen F-
Gehalten auftrat, sondern sich auch bei zwar F-armen aber sehr Al-reichen
Zusammensetzungen bildete.
Die Kationenordnung der Tetraederschicht wird von der Wechselwirkung
zwischen nächsten Nachbarn dominiert. Der hohe positive Wert des 1J -Parameters,
der die zugehörige Wechselwirkung beschreibt, führt zu einer Vermeidung von zwei
Al-Atomen auf benachbarten Tetraederplätzen. Beim maximalen Al-Gehalt von
x = 1.0 herrscht langreichweitige Ordnung vor, bei der Si und Al abwechselnd
Tetraederpositionen besetzen. Bei niedrigeren Al-Gehalten wurde eine Zweiteilung
der Struktur beobachtet: Einerseits bleibt die geordnete Struktur in Clustern mit einer
Zusammensetzung von Si/[4]Al = 1:1 erhalten, andererseits wird der geringere Gehalt
an Aluminium durch die Ausbildung von Clustern aus Phlogopit im engeren Sinne
ausgeglichen, in denen das Verhältnis von Si/[4]Al 1:1 beträgt. Letztere weisen nur
noch Ordnung von kurzer Reichweite auf, bedingt durch die Vermeidung von [4]Al-O-[4]Al-Bindungen im Sinne der Loewenstein’schen Regel.
Die Ordnung von Mg/Al und OH/F in der Oktaederschicht wurde mithilfe von 19F
und 1H MAS NMR-Spektroskopie untersucht. Es zeigte sich, dass F eine
Koordination durch 3 Mg bevorzugt, während OH eine Mg2Al-Umgebung vorzieht. Mit
zunehmender Menge an eingebautem Al nähert sich der Al-Gehalt der OH-
Umgebungen dem der gesamten Oktaederschicht an. Im Gegensatz dazu steigt die
Neigung des Fluors, Plätze mit reiner Mg-Umgebung aufzusuchen, bei höheren Al-
Gehalten.
Auch die Kationen der Oktaederschicht weisen für eine Zusammensetzung von
xnom = 1.0 eine Ordnung von langer Reichweite auf. Dabei wird Al stets von sechs
Mg-Atomen auf den benachbarten Plätzen umgeben, um zu vermeiden das Al-Atome
als nächste Nachbarn auftreten. Ähnlich den Verhältnissen in der Tetraederschicht
wurde auch hier die Ausbildung von Clustern beobachtet. Dabei treten Cluster mit
einer Zusammensetzung von Mg/[6]Al = 2:1 neben Al-freien Clustern auf.
Der Zusammenhang zwischen beiden Ordnungsmustern wurde ebenfalls
untersucht. Mithilfe von {1H} → 29Si HETCOR NMR-Experimenten konnte gezeigt
Kurzfassung
VII
werden, dass solche Cluster der Tetraederschicht, die einen hohen Al-Gehalt
aufweisen, sich in direkter Nachbarschaft von gleichfalls Al-reichen Clustern der
Oktaederschicht befinden. Dies wurde auch durch Monte-Carlo-Simulationen
bestätigt. Das bedeutet, dass die Besetzung zweier benachbarter Plätze durch zwei
Al-Atome doch energetisch günstig sein kann, wenn es sich dabei um zwei
verschiedene Typen von Koordinationspolyedern handelt. Darüber hinaus
bestätigten {1H/19F} → 29Si CPMAS-Experimente, dass auch OH und F jeweils in
Clustern angeordnet sind. F-reiche Cluster befinden sich dabei in nächster Nähe zu
Al-armen Bereichen in der Tetraederschicht. Daraus folgt, dass die Clusterbildung
alle Schichten eines einzelnen Schichtpaketes umfasst und dabei eine Trennung in
Cluster der zwei Endglied-Zusammensetzungen K Mg (AlSi3O10) F2 (Fluoro-
Phlogopit) und K (Mg2Al) (Al2Si2O10) (OH)2 (‚Eastonite’) stattfindet.
Röntgenpulverdiffraktogramme zeigten weiterhin, dass der Austausch von Mg/Si
durch [6]Al/[4]Al nicht nur die atomare Umgebung beeinflusst, sondern sich auch auf
die Kristallisation verschiedener Polytype auswirkt. Bedingt durch unterschiedliche
Kationenradien von Al3+ und Mg2+ führen strukturelle Veränderungen zur Bildung von
Phlogopit-2M1 neben dem in natürlichen Proben bedeutenderen 1M-Polytyp. Beide
Polytype sind miteinander verwachsen, was zu Stapelfehlern und Fehlordnung in der
gesamten Kristallstruktur führt.

IX
Table of Contents
ABSTRACT ................................................................................................................ II
KURZFASSUNG ........................................................................................................ V
1. INTRODUCTION .................................................................................................... 1
2. THEORY ................................................................................................................. 7
2.1. Phlogopite structure and mineralogy ........................................................................................... 7 2.1.1 General chemical composition of micas .................................................................................... 7 2.1.2. The phlogopite structure ........................................................................................................... 8 2.1.3. Polytypism ............................................................................................................................... 10 2.1.4. Ordering of tetrahedral cations ............................................................................................... 14 2.1.5. Ordering of octahedral cations ................................................................................................ 15 2.1.6. Exchange of OH by F in the octahedral sheet ........................................................................ 17 2.1.7. Phlogopite mineralogy ............................................................................................................. 18
2.2 Solid-state NMR spectroscopy .................................................................................................... 20 2.2.1. Interactions influencing NMR lineshapes ................................................................................ 21
2.2.1.1. Zeeman interaction .......................................................................................................... 21 2.2.1.2. Chemical shift interaction ................................................................................................. 22 2.2.1.3. Dipolar interaction ............................................................................................................ 23 2.2.1.4. Quadrupolar interaction ................................................................................................... 26
2.2.2. Experimental techniques ......................................................................................................... 28 2.2.2.1. Magic angle spinning NMR spectroscopy ....................................................................... 28 2.2.2.2. Cross-polarisation magic angle spinning NMR spectroscopy ......................................... 29 2.2.2.3. 2D hetero-nuclear correlation CPMAS NMR experiments .............................................. 34 2.2.2.4. Multiple quantum MAS NMR spectroscopy ..................................................................... 35
2.3 J-formalism and Monte-Carlo simulations .................................................................................. 40
3. EXPERIMENTAL AND ANALYTICAL METHODS .............................................. 47
3.1. General approach ......................................................................................................................... 47
3.2 Sample preparation ....................................................................................................................... 50 3.2.1. Preparation of gels .................................................................................................................. 50 3.2.2. Hydrothermal synthesis ........................................................................................................... 50
3.3. NMR spectroscopic experiments ................................................................................................ 52 3.3.1. 1H MAS NMR experiments ...................................................................................................... 52 3.3.2. 29Si MAS NMR experiments .................................................................................................... 52 3.3.3. 27Al MAS NMR and 27Al 3QMAS NMR experiments ............................................................... 52 3.3.4. 19F MAS NMR experiments ..................................................................................................... 53 3.3.5. 17O MAS and 17O MQMAS NMR experiments ........................................................................ 54 3.3.6. {1H} → 29Si CPMAS/HETCOR experiments ............................................................................ 55 3.3.7. {19F} → 29Si CPMAS/HETCOR experiments ........................................................................... 55
3.4. X-ray diffraction experiments ...................................................................................................... 56
3.5. Scanning electron microscopy ................................................................................................... 57
X
4. RESULTS AND DISCUSSION ............................................................................. 59
4.1. General description of samples .................................................................................................. 59
4.2. Ordering of cations in the tetrahedral sheets of phlogopite .................................................... 64 4.2.1. Samples of intermediate to low F-contents (1.0 ≤ y ≤1.8) ...................................................... 64 4.2.2. Hydroxyl-phlogopites and Al- and OH-rich phlogopites (0.8 ≤ x ≤ 1.6; 1.6 ≤ y ≤2.0) .............. 68 4.2.3. Samples of high F-contents (y < 1.0) ...................................................................................... 72 4.2.4. J-formalism and Monte-Carlo simulations ............................................................................... 74
4.3. Ordering of cations and anions in the octahedral sheets of phlogopite ................................ 82 4.3.1. Samples of intermediate to low F-contents (1.0 ≤ y ≤ 1.8) ..................................................... 82
4.3.1.1. 1H MAS NMR spectroscopy ............................................................................................. 82 4.3.1.2. 19F MAS NMR .................................................................................................................. 86
4.3.2. Hydroxyl-phlogopites and Al- and OH-rich phlogopites .......................................................... 89 (0.8 ≤ x ≤ 1.6; 1.6 ≤ y ≤2.0) ............................................................................................................... 89
4.3.2.1. 1H MAS NMR spectroscopy ............................................................................................. 89 4.3.2.2. 19F MAS NMR spectroscopy ............................................................................................ 93
4.3.3. Samples of high F-contents (y < 1.0) ...................................................................................... 97 4.3.3.1. 1H MAS NMR spectroscopy ............................................................................................. 97 4.3.3.2. 19F MAS NMR spectroscopy ............................................................................................ 97
4.3.4. J-formalism and Monte-Carlo simulations ............................................................................. 101
4.4. Relationship between the ordering of ions in the tetrahedral and in the octahedral sheets of phlogopite .......................................................................................................................................... 106
4.4.1. Hydroxyl-phlogopites (y = 2.0) .............................................................................................. 106 4.4.1.1. 2D {1H} → 29Si HETCOR CPMAS NMR spectroscopy .................................................. 106 4.4.1.2. J-formalism and Monte-Carlo simulations ..................................................................... 108
4.4.2. F-containing phlogopites ....................................................................................................... 114
4.5. 27Al MAS and 27Al 3Q-MAS NMR spectroscopy ....................................................................... 122
4.6. 17O MAS and 17O 3Q-MAS NMR spectroscopy ........................................................................ 134
4.7. Analysis of X-ray diffraction powder patterns ........................................................................ 139
5. CONCLUSIONS AND OUTLOOK ..................................................................... 147
A. APPENDIX ......................................................................................................... 150
A.1. List of abbreviations .................................................................................................................. 150
A.2. NMR spectroscopic results ...................................................................................................... 153
B. REFERENCES .................................................................................................. 171
LIST OF TABLES .................................................................................................. 181
LIST OF FIGURES ................................................................................................. 183
DANKSAGUNG ..................................................................................................... 189
LEBENSLAUF ....................................................................................................... 191
ERKLÄRUNG ......................................................................................................... 193
1. Introduction
1
1. Introduction
Micas are a class of widely distributed minerals, formed in virtually all types of
rocks under varying conditions. They are present in sediments and sedimentary
rocks on Earth’s surface and remain stable through all fields of metamorphic rocks
down to the lower crust. In rocks like kimberlites which are thought to originate from
the mantle, micas occur next to high-pressure minerals like diamond. These minerals
also crystallise in many types of plutonic and volcanic igneous rocks. Especially in
granitic pegmatites huge crystals of several meters in diameter may occur
(Rickwood, 1981).
Accordingly, a large number of publications dedicated to micas have been
published so far, and micas in general have been reviewed extensively in 1984
(Reviews in Mineralogy 13, Bailey, Ed.) and a second time in 2002 (Reviews in
Mineralogy 46, Mottana et al., Eds.). Nevertheless, there is only little knowledge
about their structural details and their chemical composition and stability. This is
partly due to the complex crystal chemistry of this mineral class: A large variety of
ions may be incorporated into their crystal structure and excessive exchange
reactions may take place, as they form under a wide range of pressure and
temperature conditions. On the other hand, their structural disorder and the layered
texture make it difficult to obtain samples suitable for detailed structural analysis.
However, additional knowledge about micas may be useful to obtain information
on the formation conditions of metamorphic and igneous rocks, on the release of
water and the resulting production of melt in the lower crust and upper mantle, the
alteration of sediments and the formations of soils. Due to its extraordinary capability
to incorporate larger amounts of F than most other minerals, this is especially true for
phlogopite, the Mg-end-member of the biotite solid-solution series (K Mg3 (AlSi3O10)
(OH,F)2). Within the class of mica minerals this is only exceeded by the Li-mica
lepidolite (Foster, 1960). Besides, not many other minerals have been found to obtain
considerable amounts of F.
F is often present in silicic magmas only in minor amounts, but it may be strongly
enriched in the melt during ongoing crystallisation because of its incompatible
character. As a result, F-rich minerals like phlogopite form in late-stage magmatic
rocks like pegmatites (e.g., Christiansen et al., 1983; London, 1987). For certain A-
1. Introduction
2
type granites, F-contents up to 1.8 wt% have been found (Whalen et al., 1987), and
even larger amounts of 3.2 wt% F have been reported for topaz rhyolites by
Pichavant and Manning (1984). These amounts may have a strong influence on the
physical and chemical properties of magma with effects similar to those of water
solved in the melt. F lowers the crystallisation temperature of a melt (Manning, 1981;
Webster et al., 1987; Weidner and Martin, 1987), it decreases melt density (Dingwell
et al., 1993; Knoche et al., 1995) and melt viscosity (Dingwell et al., 1985; Baker and
Vaillancourt, 1995; Giordano et al., 2004), and increases element diffusivity in the
melt (Baker and Bossànyi, 1994). However, there is an important difference in the
behaviour of F and H2O: The water solubility decreases upon ascent of the magma,
leading to a higher viscosity and higher solidus temperatures, and thus a more
explosive nature of eruptions. In contrast, the fluorine solubility may still achieve
several wt% of fluorine even at low pressures, inhibiting degassing upon extrusion,
corresponding to a completely different behaviour of the melt (Carroll and Webster,
1994)
Therefore, it is essential to gain a deeper understanding of the stability of such F-
rich minerals and the processes controlling a partitioning of F between mineral and
co-existing melt. This includes studies of phase equilibria, partitioning coefficients
and thermal stability of micas. However, it is also necessary to obtain further
information on the local F-environment in the melt as well as in the F-containing
crystal structures. In contrast to standard techniques like X-ray and neutron
diffraction, spectroscopic methods are ideal tools to obtain information on the local
environment of single atoms in the structure.
In micas, F-incorporation is strongly related to the Al-content of the minerals: The
higher the Al-content, the less the mica’s ability to replace OH by F. Phlogopite in the
narrower sense does not contain any octahedral Al, but natural phlogopite crystals
always contain additional Al in the octahedral as well as the tetrahedral sheet. The
composition then ranges towards the hypothetical end-member ‘eastonite’ (K (Mg2Al)
(Al2Si2O10) (OH,F)2). Therefore, the investigation of both elements in the phlogopite
structure cannot be undertaken separately.
The relationship between Al-content and F-incorporation has first been described
in detail by Robert and Kodama (1988) in their IR-spectroscopic study of trioctahedral
micas. These authors observed a weaking of the interaction of OH-groups with apical
1. Introduction
3
oxygen atoms of (Si,Al)O4-tetrahedra at lower overall Al-contents. This effect led to
an increase in K+-H+-repulsion and allowed for an easy substitution of OH by F. In
contrast, higher Al-contents strengthened the OH…O interaction and lowered the
K+-H+-repulsion, and F was only incorporated into the structure in limited amounts.
Further studies showed that the F-Al avoidance was not only present on a
macroscopic scale but also on the atomic level. Huve et al. (1992a,b) studied the F-
environment in several natural and synthetic layer silicates with 19F MAS NMR
spectroscopy and observed a relationship between the position of the signal resulting
from F co-ordinated by three Mg-atoms and the Al-content of the mineral. Papin et al.
(1997) investigated the environment of OH-groups in the octahedral sheets of Al-rich
phlogopite and observed a strong preference of OH for a co-ordination by Mg2Al on
the neighbouring cation sites over a co-ordination by three Mg-atoms.
This observation has been confirmed by Fechtelkord et al. (2003a) for synthetic
phlogopites of various Al- and F-contents using 1H, 29Si and 19F MAS NMR
spectroscopy. Moreover, the opposite trend has been found for F which favours pure
Mg-environments. These authors also investigated the Al-content of phlogopite in
relationship to the F-content of the initial starting composition and found a
destabilizing effect on Al-rich phlogopites by F (Fechtelkord et al., 2003a,b).
However, only phlogopites synthesised at 800 °C and 2 kbar have been investigated.
Circone et al. (1991) and Circone and Navrotsky (1992) investigated the
incorporation of Al into the tetrahedral and octahedral sheets by 29Si and 27Al MAS
NMR spectroscopy of synthetic phlogopites synthesised at different temperatures
and pressures. These authors were also the first to combine their experimental data
with computational modelling of cation ordering in the tetrahedral sheets. They
suggested an increased ordering of Si/[4]Al with increasing Al-content of the
phlogopites due to avoidance of Al-O-Al linkages according to Loewenstein’s rule
(Loewenstein, 1954). The influence of fluorine on the observed ordering pattern has
not been considered.
All of these studies have in common that the ordering in both sheets of phlogopite
has been studied separately. However, a relationship between the ordering pattern of
both the tetrahedral and the octahedral sheets is conceivable.
Recently, efforts have been made to describe order/disorder phenomena in
layered silicate structures by means of computational methods. Palin et al. (2001)
1. Introduction
4
first demonstrated the effectiveness of the so-called ‘J-formalism’ in combination with
Monte Carlo (MC) simulations to shed light on Si/[4]Al ordering in the tetrahedral
sheets of muscovite, K Al2 (AlSi3O10) (OH)2. In 2003, these authors extended their
studies to tetrahedral (Si/[4]Al) and octahedral ([6]Al/Mg) ordering in phengite
(K (Al1.5Mg0.5) (Al0.5Si3.5O10) (OH)2). Indeed, a coupling between the ordering in both
sheets was observed, with two [6]Mg-atoms and two [4]Al-atoms forming small clusters
within the structure. Experimental data confirming these results are still missing.
To my knowledge, this study is the first one combining experimental and
computational efforts to obtain an overall picture of the cation and anion distribution
in tetrahedral and octahedral sheets of synthetic Al-rich phlogopite.
29Si, 19F, 1H, and 27Al MAS NMR spectroscopic experiments have been carried
out to gather information on the ordering schemes in both sheets separately.
Moreover, the amount of additional Al incorporated into the phlogopite structure was
estimated from the 29Si MAS NMR spectra to find the maximum of Al-content in
dependence of the F-content of the initial oxide mixture. In contrast to previous
studies, a large number of compositions have been analysed, ranging from hydroxyl-
phlogopites to F-rich compositions and from Al-free to extremely Al-rich starting
mixtures. A synthesis temperature of 600 °C and a pressure of 2 kbar have been
chosen as to complement the data reported by Fechtelkord et al. (2003a,b).
Moreover, {1H/19F} → 29Si CPMAS/HETCOR spectra were recorded to allow an
investigation of the ordering of Mg/[6]Al and OH/F in the octahedral sheet coupled to
that of Si/[4]Al in the tetrahedral sheet. 17O MAS and MQMAS NMR spectroscopic
experiments were performed to check the validation of Loewenstein’s rule. Powder
X-ray diffraction patterns have been analysed to obtain additional information on the
structure on a larger scale. The changes of lattice parameters with increasing Al-
content and the polytypes formed during synthesis have been studied.
The experimental investigations were completed by theoretical calculations
allowing for a deeper understanding of the ordering mechanisms showing in the NMR
spectroscopic results. The calculations were based on the ‘J-formalism’ used by Palin
et al. (2001, 2003) which describes ordering in terms of exchange reactions between
neighboured sites. For each couple of sites the interaction parameter has been
determined and used in Monte Carlo (MC) simulations in order to generate atomic
configurations of lowest energy showing possible ordering patterns. OH-phlogopites

1. Introduction
5
of all Al-contents have been investigated, covering the whole range between
phlogopite (K Mg3 (AlSi3O10) (OH)2) and ‘eastonite’ (K (Mg2Al) (Al2Si2O10) (OH)2). In
this way, it was possible to even study very Al-rich compositions that have not been
accessible experimentally.


2.1. Phlogopite structure and mineralogy
7
2. Theory
2.1. Phlogopite structure and mineralogy
2.1.1 General chemical composition of micas
Phlogopite is a trioctahedral 2:1 layer silicate and belongs to the group of the true
micas. Only a brief introduction to the mica chemistry will be given here. For the
classification and detailed information on the chemistry of true and brittle micas the
reader is referred to Tischendorf et al. (2007) and Rieder et al. (1998).
The general composition formula of the micas can be expressed as
A1 X2-3 (T4O10) (OH)2 (2.1)
In true micas, A is a monovalent cation like K+, Na+, Rb+, Cs+ and (NH4)+. K+ micas
are by far the most common true micas (Tischendorf et al., 2007). Examples for this
type of micas are phlogopite, annite, celadonite, muscovite and polylithionite. A more
abundant true non-K mica is paragonite with Na+ as A-cation. The brittle micas are
defined as having divalent cations like Ca2+ and Ba2+ on the A position. Typical
examples are clintonite and margarite.
A wider range of cations may be incorporated into the X position in the octahedral
layer: Ti, [6]Al, [6]Fe3+, Mn3+, Cr3+, V2+, Fe2+, Mn2+, Mg2+ and Li+. A separation can be
made between dioctahedral and trioctahedral micas. In trioctahedral micas all three
octahedral sites per half unit-cell are occupied (usually by divalent cations), whereas
in dioctahedral micas only ⅔ of these sites are occupied (usually by trivalent cations),
leaving one vacancy for reasons of charge-balancing.
The tetrahedral sheet is mainly occupied by Si and [4]Al, but [4]Fe3+, B and Be may
also be incorporated. For true mica end-members the ratio of tetrahedral Al to Si is
1:3, for the brittle micas this ratio increases to 1:1. OH-groups are mostly found as
anions, but they may also be replaced by F, O, Cl or S.
Phlogopite (K Mg3 (AlSi3O10) (OH)2) belongs to the group of trioctahedral K micas
with Mg being the only cation occupying the X position. Its dioctahedral counterpart is
muscovite (K Al2 (AlSi3O10) (OH)2) with which it does not form a straight solid solution
series (Green, 1981; Robert, 1976). Green (1981) suggested complete solid solution
2. Theory
8
between trioctahedral and ‘2.5-octahedral’ micas while a large immiscibility gap
should exist between the intermediate compositions and dioctahedral micas. Natural
phlogopites often contain considerable amounts of iron and aluminium. There is
complete solid solution between phlogopite and annite (K Fe2+3 (AlSi3O10) (OH)2)
(Wones and Eugster, 1965; Müller, 1972; Wones, 1972). To some extent substitution
of Fe3+ and [6]Al for Mg and [4]Al for Si may occur, with compositions ranging towards
siderophyllite (K (Fe2+2.5Al0.5) (Al1.5Si2.5O10) (OH)2) and ‘K Fe3+
2 (AlSi3O10) (OH)2)’
(Rutherford, 1973; Hewitt and Wones, 1975). Intermediate compositions of the four
end members phlogopite, annite, siderophyllite and the hypothetical composition
‘K Fe2 (AlSi3O10) (OH)2’ are called biotite. Hewitt and Wones (1975) found an upper
substitution limit of Al in synthetic phlogopite corresponding to a composition of
K (Mg2.38Al0.62) (Al1.62Si2.38O10) (OH)2. A phlogopite sample of composition
K (Mg2.08Al0.92) (Al1.92Si2.08O10) (OH)2 has been synthesised by Circone et al. (1991).
Few natural phlogopites also exhibit larger amounts of Mn in the octahedral
sheets. More common is the presence of Fe3+ and/or Ti4+ in the tetrahedral sheet. K
is rarely substituted by Cs, Rb, or Ba. Extensive replacement of OH by F has been
observed for some Fe-poor compositions. For further details see review of
Tischendorf et al. (2007).
Due to experimental restrictions only Fe-free samples have been investigated in
this study. The large diamagnetic effect of iron in the phlogopite crystal structure
leads to broad and featureless lineshapes in the NMR spectra, and no structural
information can be obtained from these samples. Thus, only Al-incorporation via
Tschermak’s substitution and OH ↔ F exchange have been considered.
Al-incorporation is described by a solution of x ‘eastonite’
(K (Mg2Al) (Al2Si2O10) (OH,F)2, a hypothetical end-member) in phlogopite. The
replacement of OH-groups by F is illustrated by the variable y with 0.0 ≤ y ≤ 2.0. The
resulting nominal composition of all samples is then given by
K (Mg3-xAlx) (Al1+xSi3-xO10) (OH)y F2-y.
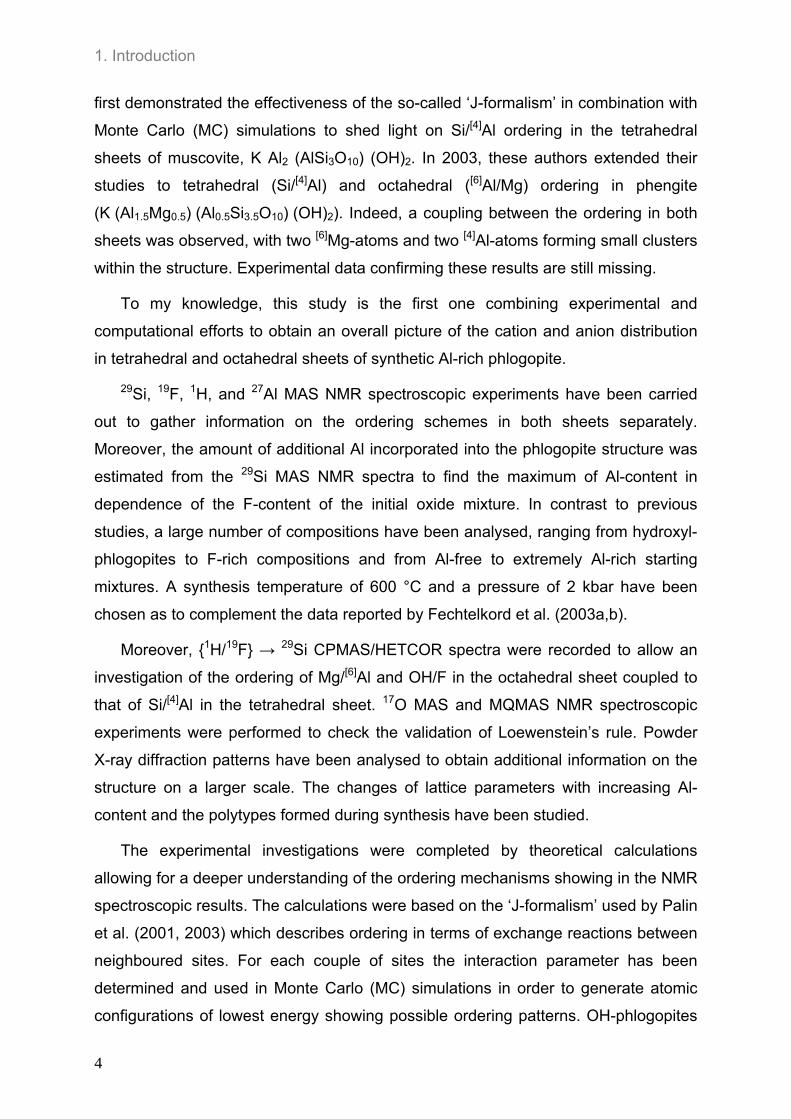
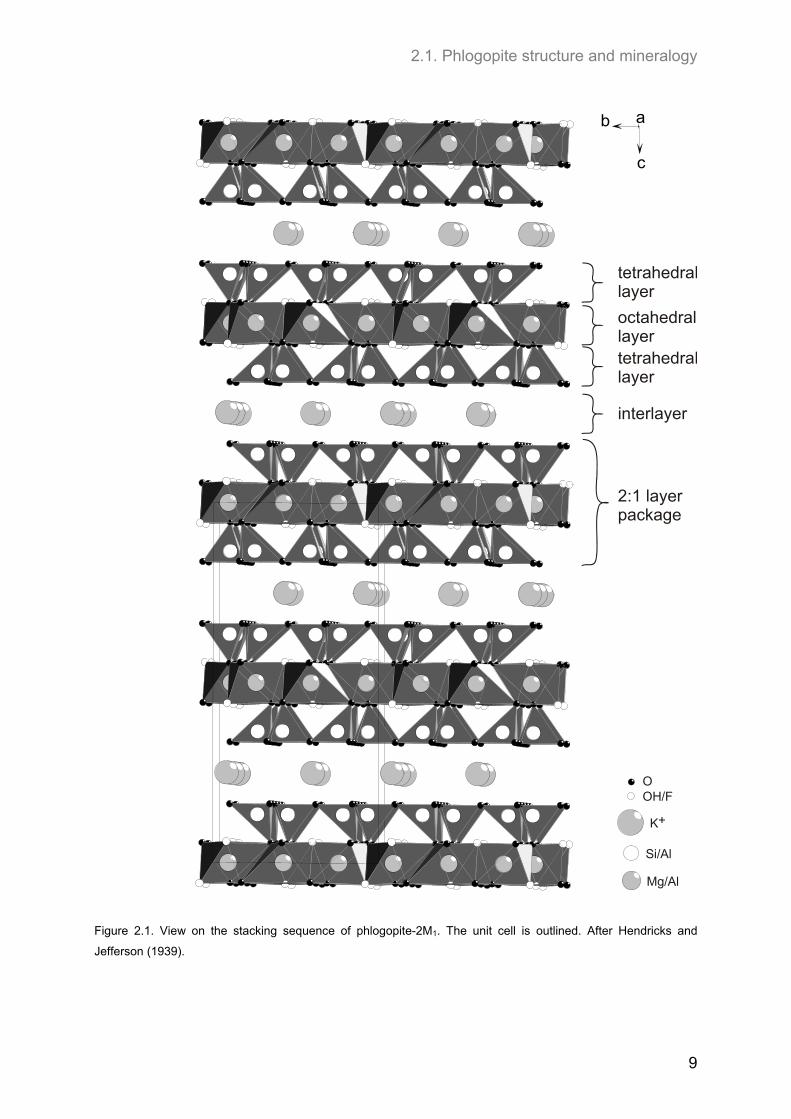
2.1.2. The phlogopite structure
Phlogopite, as all micas, is a 2:1 layer silicate: Its structure is formed by layer
packages consisting of two tetrahedral layers and one octahedral layer (see Figure
2.1). The octahedral layer is formed by XO4(OH)2-octahedra that share edges and
form a two-dimensional infinite layer. These layers are sandwiched by two layers of
2.1. Phlogopite structure and mineralogy
9
ab
c
K
Mg
SiAl
O
OF
2:1 layerpackage
interlayer
tetrahedrallayer
octahedrallayer
tetrahedrallayer
OOH/F
K+
Si/Al
Mg/Al
Figure 2.1. View on the stacking sequence of phlogopite-2M1. The unit cell is outlined. After Hendricks and
Jefferson (1939).
2. Theory
10
a
bc
Mg/Al
OH/F
O
K+
Si/Al
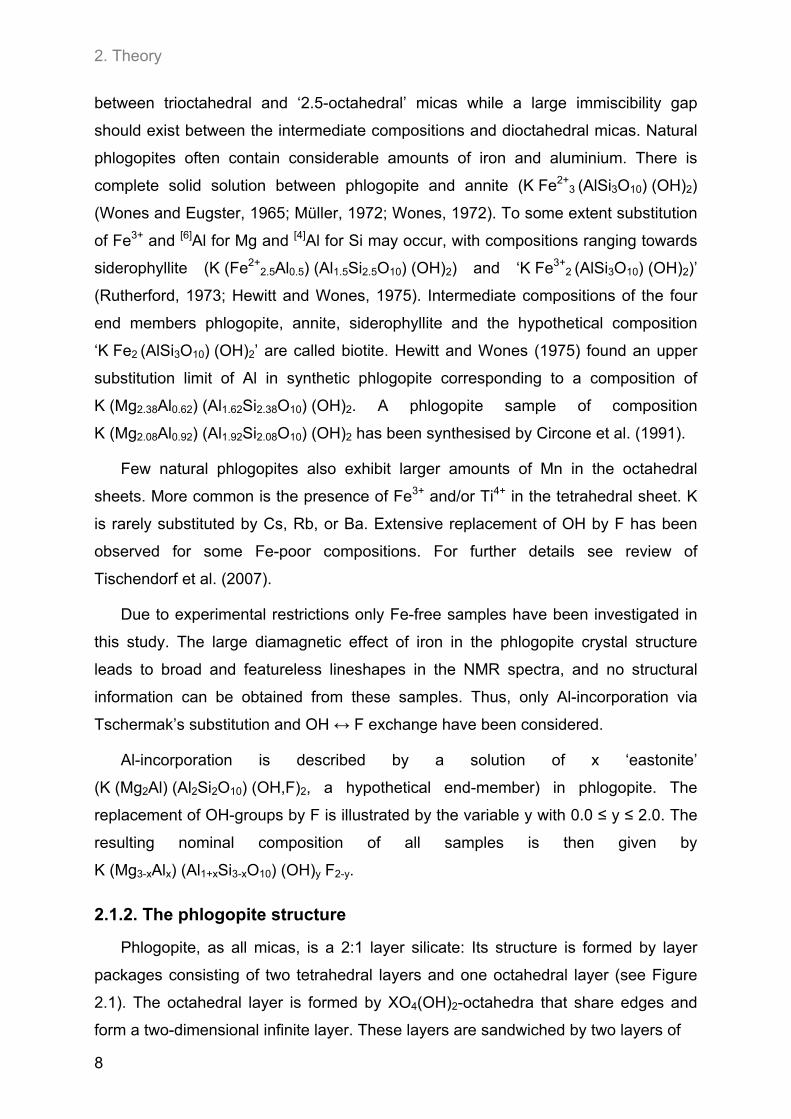
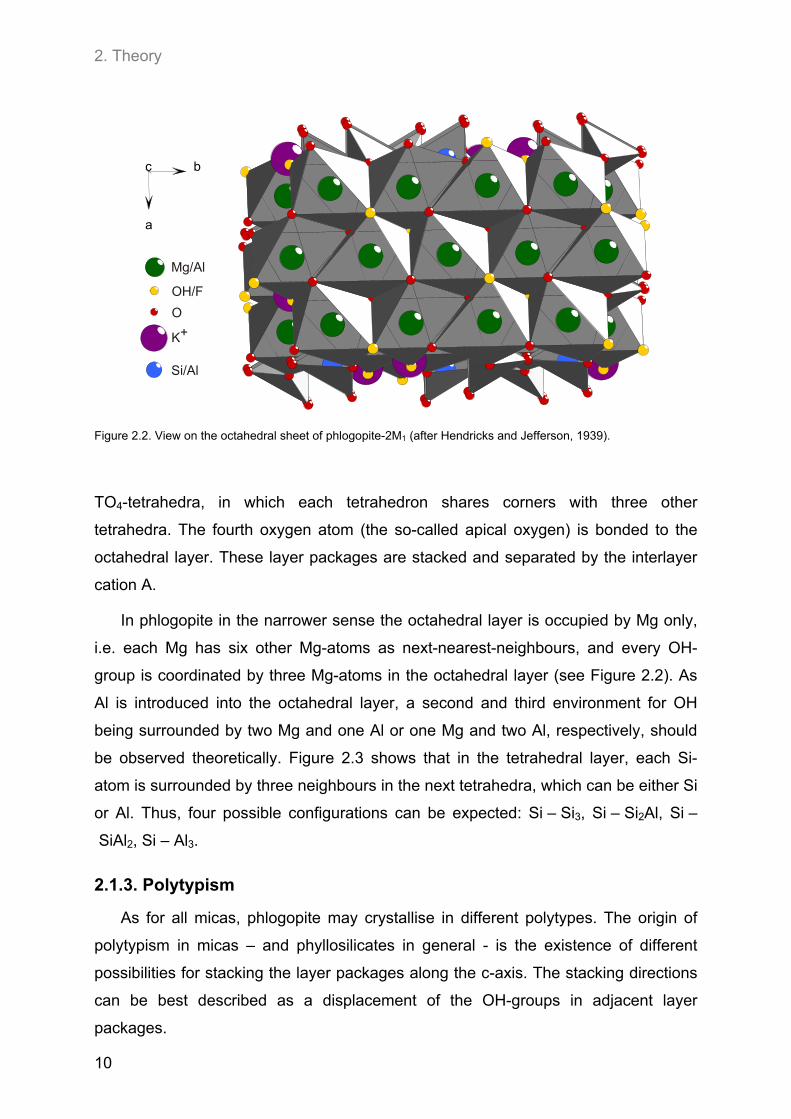
Figure 2.2. View on the octahedral sheet of phlogopite-2M1 (after Hendricks and Jefferson, 1939).
TO4-tetrahedra, in which each tetrahedron shares corners with three other
tetrahedra. The fourth oxygen atom (the so-called apical oxygen) is bonded to the
octahedral layer. These layer packages are stacked and separated by the interlayer
cation A.
In phlogopite in the narrower sense the octahedral layer is occupied by Mg only,
i.e. each Mg has six other Mg-atoms as next-nearest-neighbours, and every OH-
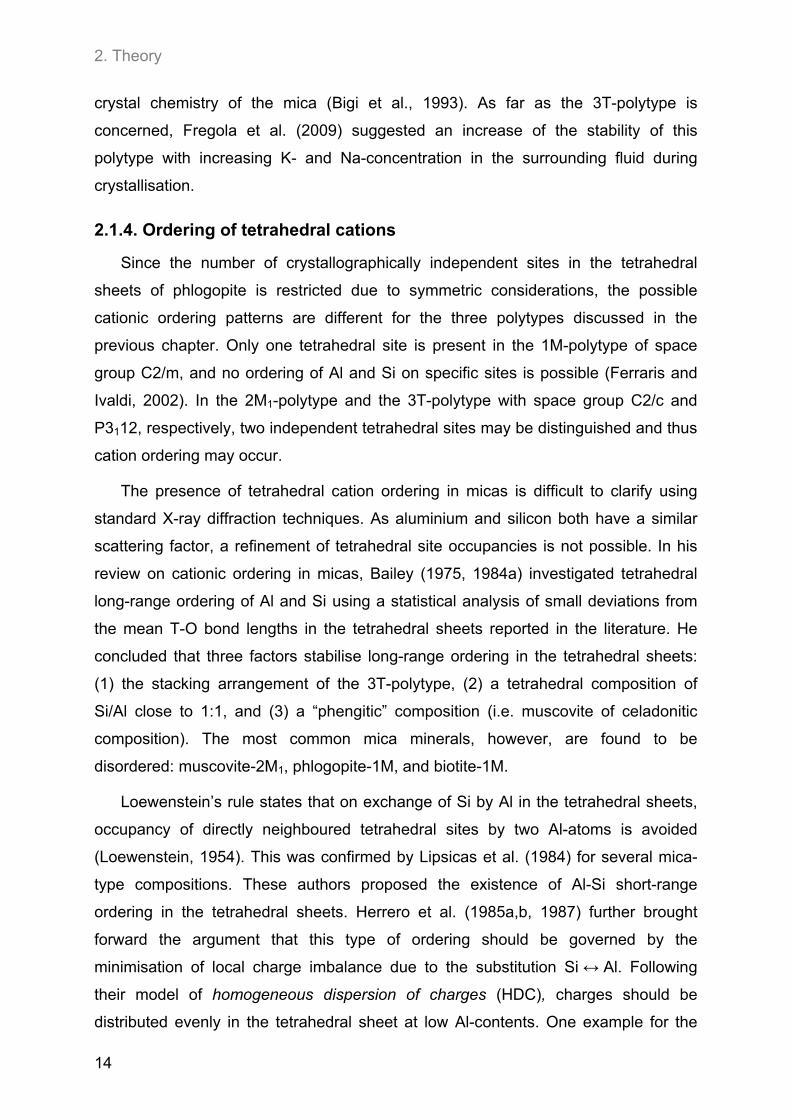
group is coordinated by three Mg-atoms in the octahedral layer (see Figure 2.2). As
Al is introduced into the octahedral layer, a second and third environment for OH
being surrounded by two Mg and one Al or one Mg and two Al, respectively, should
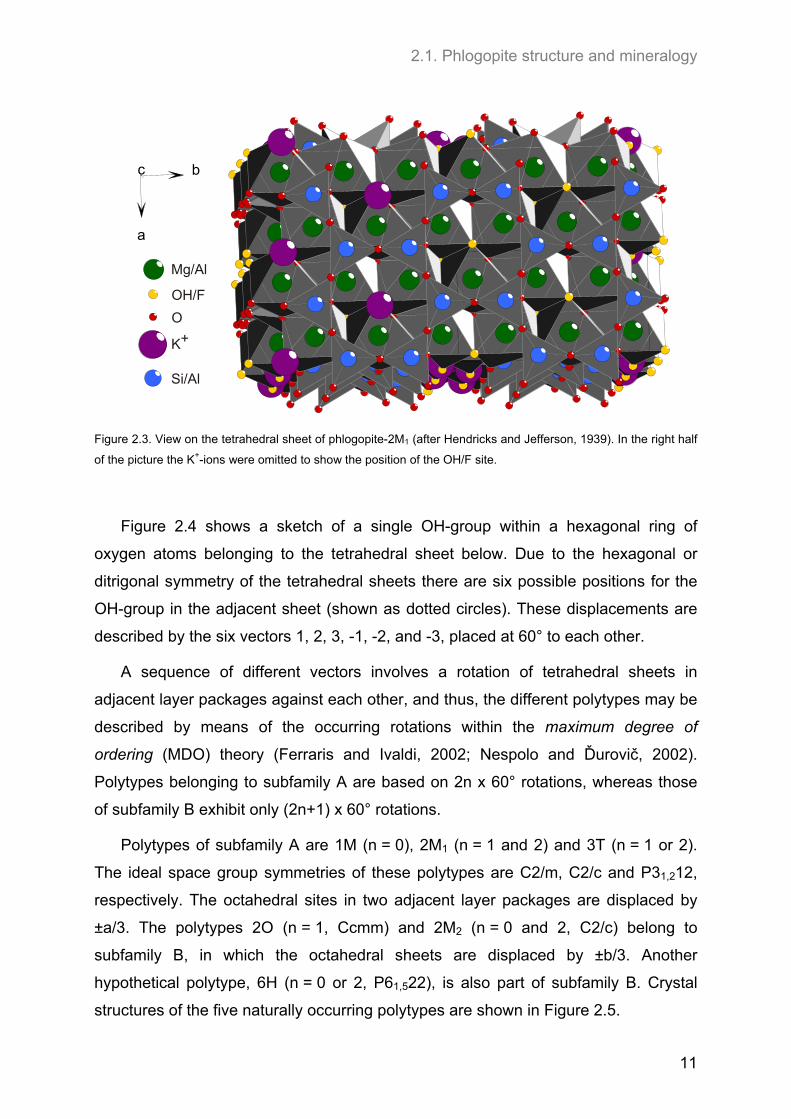
be observed theoretically. Figure 2.3 shows that in the tetrahedral layer, each Si-
atom is surrounded by three neighbours in the next tetrahedra, which can be either Si
or Al. Thus, four possible configurations can be expected: Si – Si3, Si – Si2Al, Si –
SiAl2, Si – Al3.
2.1.3. Polytypism
As for all micas, phlogopite may crystallise in different polytypes. The origin of
polytypism in micas – and phyllosilicates in general - is the existence of different
possibilities for stacking the layer packages along the c-axis. The stacking directions
can be best described as a displacement of the OH-groups in adjacent layer
packages.
2.1. Phlogopite structure and mineralogy
11
a
bc
Mg/Al
OH/F
O
K+
Si/Al
Figure 2.3. View on the tetrahedral sheet of phlogopite-2M1 (after Hendricks and Jefferson, 1939). In the right half
of the picture the K+-ions were omitted to show the position of the OH/F site.
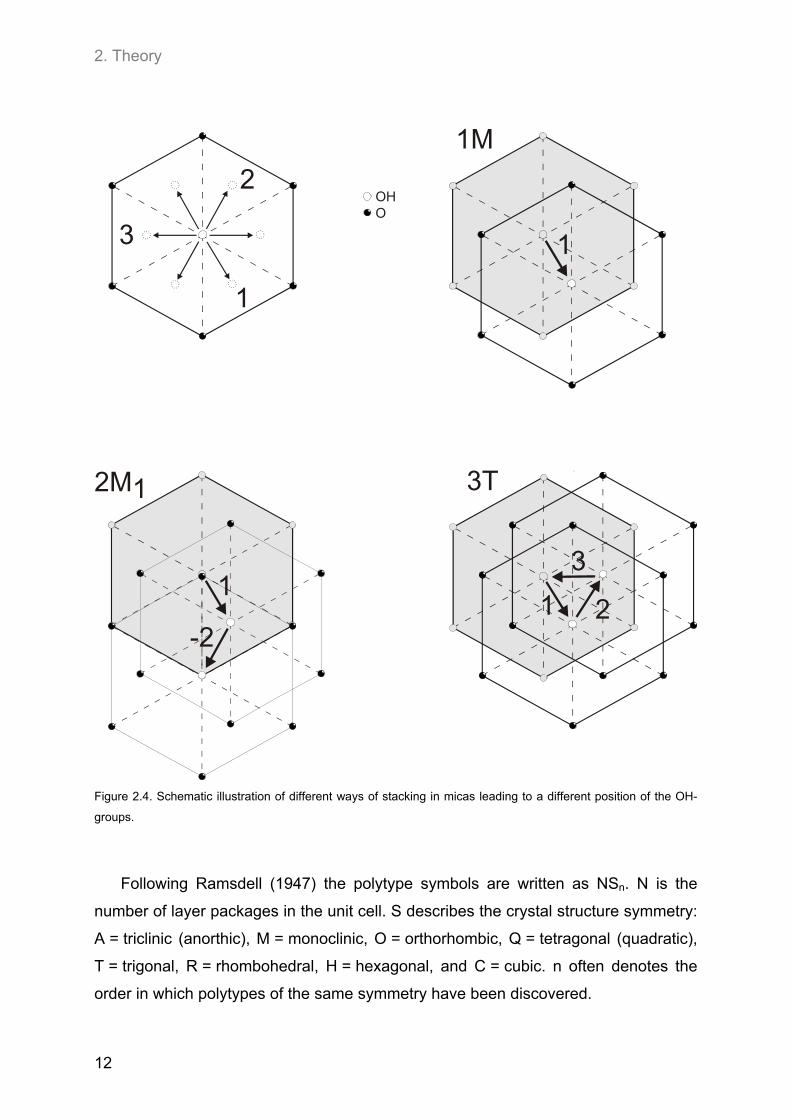
Figure 2.4 shows a sketch of a single OH-group within a hexagonal ring of
oxygen atoms belonging to the tetrahedral sheet below. Due to the hexagonal or
ditrigonal symmetry of the tetrahedral sheets there are six possible positions for the
OH-group in the adjacent sheet (shown as dotted circles). These displacements are
described by the six vectors 1, 2, 3, -1, -2, and -3, placed at 60° to each other.
A sequence of different vectors involves a rotation of tetrahedral sheets in
adjacent layer packages against each other, and thus, the different polytypes may be
described by means of the occurring rotations within the maximum degree of
ordering (MDO) theory (Ferraris and Ivaldi, 2002; Nespolo and Ďurovič, 2002).
Polytypes belonging to subfamily A are based on 2n x 60° rotations, whereas those
of subfamily B exhibit only (2n+1) x 60° rotations.
Polytypes of subfamily A are 1M (n = 0), 2M1 (n = 1 and 2) and 3T (n = 1 or 2).
The ideal space group symmetries of these polytypes are C2/m, C2/c and P31,212,
respectively. The octahedral sites in two adjacent layer packages are displaced by
±a/3. The polytypes 2O (n = 1, Ccmm) and 2M2 (n = 0 and 2, C2/c) belong to
subfamily B, in which the octahedral sheets are displaced by ±b/3. Another
hypothetical polytype, 6H (n = 0 or 2, P61,522), is also part of subfamily B. Crystal
structures of the five naturally occurring polytypes are shown in Figure 2.5.
2. Theory
12
OHO
1M
2M1 3T
1
1
-2
1
2
3
1 2
3
Figure 2.4. Schematic illustration of different ways of stacking in micas leading to a different position of the OH-
groups.
Following Ramsdell (1947) the polytype symbols are written as NSn. N is the
number of layer packages in the unit cell. S describes the crystal structure symmetry:
A = triclinic (anorthic), M = monoclinic, O = orthorhombic, Q = tetragonal (quadratic),
T = trigonal, R = rhombohedral, H = hexagonal, and C = cubic. n often denotes the
order in which polytypes of the same symmetry have been discovered.
2.1. Phlogopite structure and mineralogy
13
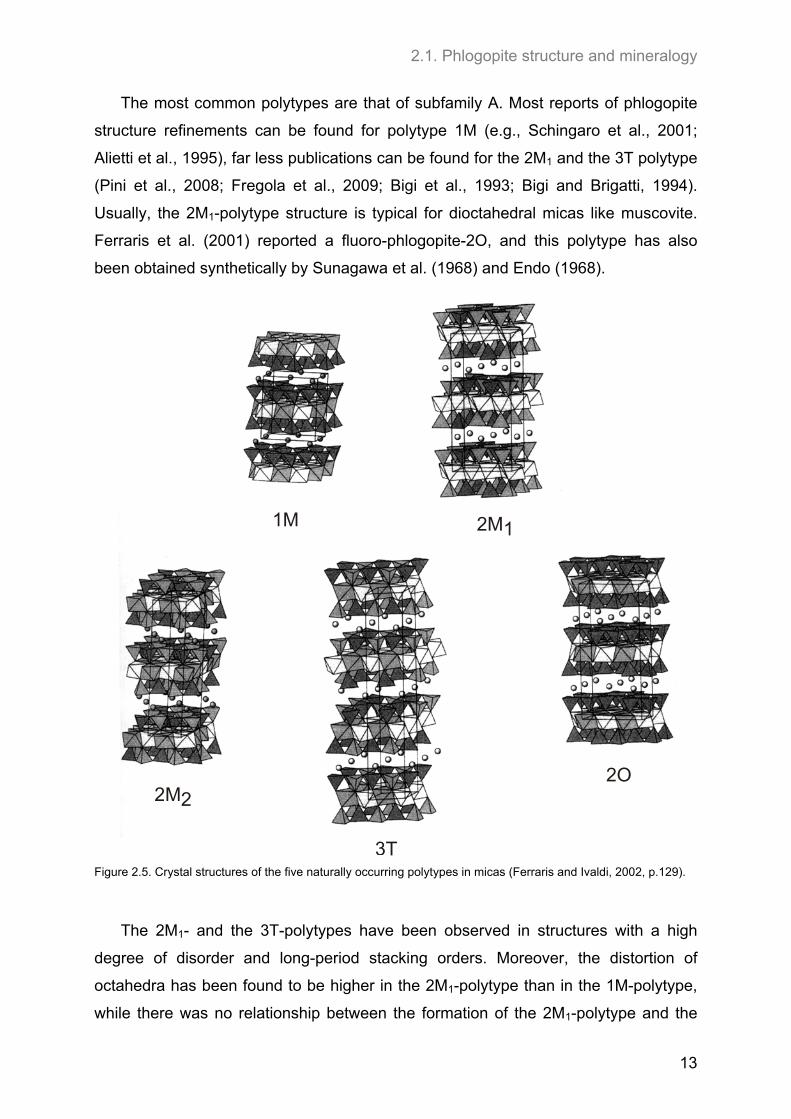
The most common polytypes are that of subfamily A. Most reports of phlogopite
structure refinements can be found for polytype 1M (e.g., Schingaro et al., 2001;
Alietti et al., 1995), far less publications can be found for the 2M1 and the 3T polytype
(Pini et al., 2008; Fregola et al., 2009; Bigi et al., 1993; Bigi and Brigatti, 1994).
Usually, the 2M1-polytype structure is typical for dioctahedral micas like muscovite.
Ferraris et al. (2001) reported a fluoro-phlogopite-2O, and this polytype has also
been obtained synthetically by Sunagawa et al. (1968) and Endo (1968).
1M 2M1
2M2
3T
2O
Figure 2.5. Crystal structures of the five naturally occurring polytypes in micas (Ferraris and Ivaldi, 2002, p.129).
The 2M1- and the 3T-polytypes have been observed in structures with a high
degree of disorder and long-period stacking orders. Moreover, the distortion of
octahedra has been found to be higher in the 2M1-polytype than in the 1M-polytype,
while there was no relationship between the formation of the 2M1-polytype and the
2. Theory
14
crystal chemistry of the mica (Bigi et al., 1993). As far as the 3T-polytype is
concerned, Fregola et al. (2009) suggested an increase of the stability of this
polytype with increasing K- and Na-concentration in the surrounding fluid during
crystallisation.
2.1.4. Ordering of tetrahedral cations
Since the number of crystallographically independent sites in the tetrahedral
sheets of phlogopite is restricted due to symmetric considerations, the possible
cationic ordering patterns are different for the three polytypes discussed in the
previous chapter. Only one tetrahedral site is present in the 1M-polytype of space
group C2/m, and no ordering of Al and Si on specific sites is possible (Ferraris and
Ivaldi, 2002). In the 2M1-polytype and the 3T-polytype with space group C2/c and
P3112, respectively, two independent tetrahedral sites may be distinguished and thus
cation ordering may occur.
The presence of tetrahedral cation ordering in micas is difficult to clarify using
standard X-ray diffraction techniques. As aluminium and silicon both have a similar
scattering factor, a refinement of tetrahedral site occupancies is not possible. In his
review on cationic ordering in micas, Bailey (1975, 1984a) investigated tetrahedral
long-range ordering of Al and Si using a statistical analysis of small deviations from
the mean T-O bond lengths in the tetrahedral sheets reported in the literature. He
concluded that three factors stabilise long-range ordering in the tetrahedral sheets:
(1) the stacking arrangement of the 3T-polytype, (2) a tetrahedral composition of
Si/Al close to 1:1, and (3) a “phengitic” composition (i.e. muscovite of celadonitic
composition). The most common mica minerals, however, are found to be
disordered: muscovite-2M1, phlogopite-1M, and biotite-1M.
Loewenstein’s rule states that on exchange of Si by Al in the tetrahedral sheets,
occupancy of directly neighboured tetrahedral sites by two Al-atoms is avoided
(Loewenstein, 1954). This was confirmed by Lipsicas et al. (1984) for several mica-
type compositions. These authors proposed the existence of Al-Si short-range
ordering in the tetrahedral sheets. Herrero et al. (1985a,b, 1987) further brought
forward the argument that this type of ordering should be governed by the
minimisation of local charge imbalance due to the substitution Si ↔ Al. Following
their model of homogeneous dispersion of charges (HDC), charges should be
distributed evenly in the tetrahedral sheet at low Al-contents. One example for the
2.1. Phlogopite structure and mineralogy
15
consequences resulting from this type of ordering is that at least one AlO4-
tetrahedron will be found in each of the hexagonal rings of tetrahedra.
Closer to a composition of Si/[4]Al = 1:1, as found in margarite, long-range
ordering should be established due to a coupling between adjacent hexagonal rings,
with Al and Si occupying the tetrahedral sites alternately. Circone et al. (1991)
confirmed these conclusions for hydroxyl-phlogopites of different Al-contents. These
authors emphasised the non-existence of Al-O-Al linkages in phlogopite. However,
Loewenstein’s rule may not be valid in disordered high-temperature structures, and
several authors (e.g., Langer et al., 1981) claimed to have evidence of Al-O-Al
linkages in micas due to specific infra-red absorption bands.
2.1.5. Ordering of octahedral cations
Octahedral cation ordering is possible for all three phlogopite polytypes (Brigatti
and Guggenheim, 2002). Three distinct octahedral sites are present in the 3T-
polytype with space group P3112 (Ferraris and Ivaldi, 2002). Two of them, M2 and
M3, are cis-coordinated by OH, while the third, M1, is trans-coordinated (Brigatti and
Guggenheim, 2002). The latter is usually vacant in dioctahedral micas. In the 1M-
and 2M1-polytypes (space group C2/m and C2/c, respectively) the two cis-
coordinated sites M2 and M3 are symmetrically related by a mirror plane, and thus,
only two octahedral sites may be distinguished, M1 and M2 (Ferraris and Ivaldi,
2002).
Based on refinements of octahedral site occupancies the micas may be divided
into three subgroups (Ďurovič, 1994, Nespolo and Ďurovič, 2002, Brigatti and
Guggenheim, 2002, Ferraris and Ivaldi, 2002, Mercier et al., 2005): I. Homo-
octahedral micas in which all three octahedral sites are occupied by the same kind of
cation or the same statistical average of different kinds of cations, II. meso-
octahedral micas in which two of the octahedral sites are occupied by one cation and
the third by a different one, and III. hetero-octahedral micas in which each of the
three octahedral sites is occupied by a different cation. This classification is
independent from a division into several types of micas based on differences in the
size of the octahedral sites, i.e. the average cation-anion bond lengths of the different
sites as proposed by Weiss et al. (1992). Mercier et al. (2005) and Brigatti and
Guggenheim (2002) emphasised that even for structures having equal average
occupancies for all three octahedral sites the size of the octahedra may be different
2. Theory
16
and vice versa. Therefore, the investigation of ordering in the octahedral sheets of
micas via X-ray diffraction techniques must take into account differences in the
average cation-anion bond lengths as well as a refinement of octahedral-site
occupancies.
Toraya (1981) argued that larger cations of lower charge should be ordered on
the M1 site to ensure minimum cation-cation repulsion between neighbouring
octahedra. Indeed, Cruciani and Zanazzi (1994) found a preferential partitioning of
highly charged cations like Al3+ on the M2 site. Also, as Fe2+ enters the octahedral
sheet following the phlogopite-annite join, there are usually differences in the site
occupancy factors and the size of the octahedra, with Fe2+ slightly preferring the M1
site while the tendency for Al3+ to occupy the M2 site is increased (Brigatti et al.,
2000). Nevertheless, it is not uncommon for all three sites to be equal in size and to
show the same site occupancies in 1M-polytype micas (Brigatti and Guggenheim,
2002).
According to Brigatti and Guggenheim (2002) there have been several reports of
micas with intermediate compositions between dioctahedral and trioctahedral micas.
However, these are most likely to be mixtures of one dioctahedral and one
trioctahedral phase. In dioctahedral micas the vacant site is usually the M1 site, so
this should also be the case for any intermediate compositions.
In their study, Mercier et al. (2005) found that natural and synthetic 1M-polytype
single crystals were geometric meso-octahedral and always showed some degree of
ordering cations into octahedral sites of different size. In contrast the authors showed
that synthetic powder samples were always of the homo-octahedral type, and the
cations were statistically distributed in the octahedral sheet. They concluded that the
synthetic powder samples had not reached the equilibrium state yet, which was
present in the single crystals due to a much longer crystallisation time. The small
difference in configuration energies between the homo- and the hetero-octahedral
structure indicates that geometrical reasons cannot be the driving force of a potential
ordering in tri-octahedral micas.
Papin et al. (1997) showed in their IR spectroscopic investigation of phlogopite
that Mg and Al are not distributed statistically in the octahedral sheet. It has been
found that F prefers a co-ordination by Mg only, whereas OH-groups favour an
2.1. Phlogopite structure and mineralogy
17
environment containing also Al. These results have been confirmed by Fechtelkord et
al. (2003a) using 1H and 19F MAS NMR spectroscopy.
It should also be noted that partial ordering of the octahedral sites is not
uncommon in micas in general (Bailey, 1984a). An example would be atoms of type
A occupying one of the two M2 sites, and the same atom type A being randomly
distributed on the other M2 and the M1 sites together with atom type B.
2.1.6. Exchange of OH by F in the octahedral sheet
In the basic mica structure octahedral cations are co-ordinated by four oxygen
atoms and two hydroxyl-groups. Theoretically, OH may easily be replaced by F, as
both anions exhibit the same charge of -1 and a similar anionic radius in a threefold
co-ordination of 1.34 and 1.30 Å, respectively, (Shannon, 1976). Nevertheless, OH-
substitution by F is limited for most mica compositions. Synthesis of pure-F
trioctahedral and dioctahedral micas is possible in water-free systems. On addition of
water, however, F strongly prefers a trioctahedral over a dioctahedral environment
(Robert et al., 1993; Papin et al., 1997; Boukili et al., 2001).
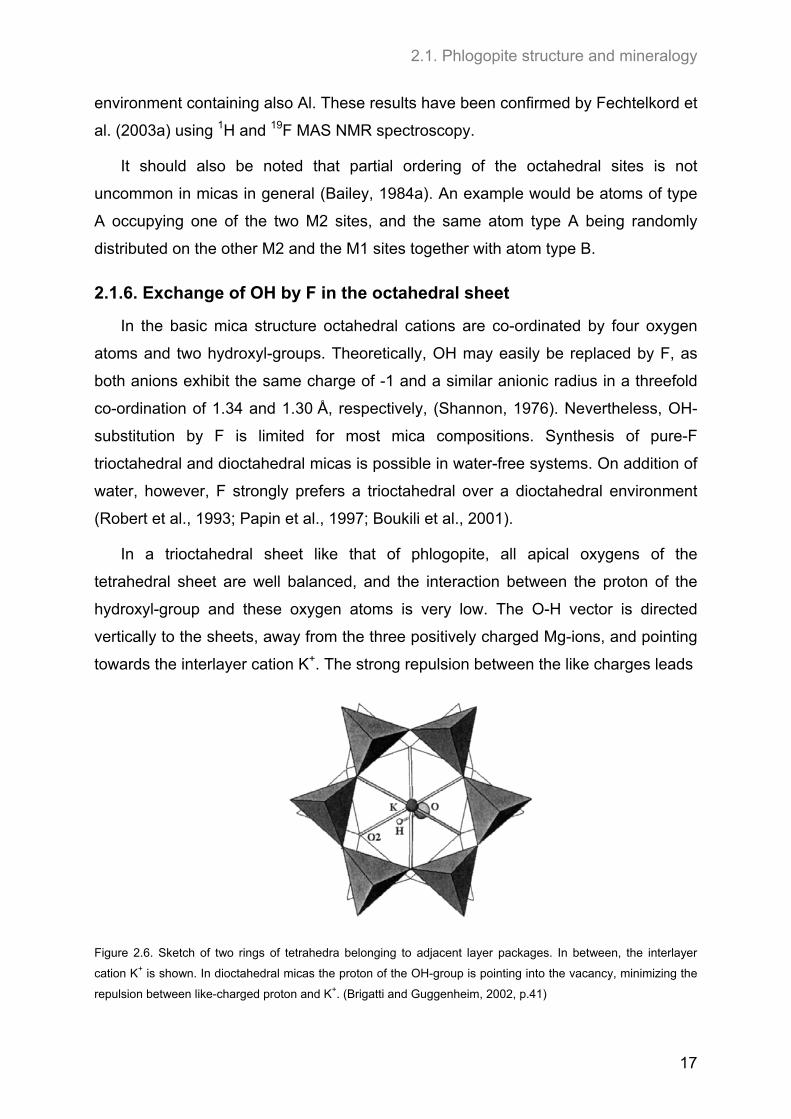
In a trioctahedral sheet like that of phlogopite, all apical oxygens of the
tetrahedral sheet are well balanced, and the interaction between the proton of the
hydroxyl-group and these oxygen atoms is very low. The O-H vector is directed
vertically to the sheets, away from the three positively charged Mg-ions, and pointing
towards the interlayer cation K+. The strong repulsion between the like charges leads
Figure 2.6. Sketch of two rings of tetrahedra belonging to adjacent layer packages. In between, the interlayer
cation K+ is shown. In dioctahedral micas the proton of the OH-group is pointing into the vacancy, minimizing the
repulsion between like-charged proton and K+. (Brigatti and Guggenheim, 2002, p.41)
2. Theory
18
to a widening of the structure with larger distances between the single layer
packages. In this situation, it is highly advantageous to substitute OH by F and at the
same time replace the H+-K+ repulsion by a K+-F- attraction.
The opposite is true for dioctahedral micas where the surrounding tetrahedral
apical oxygen atoms are strongly underbonded due to the vacancy. The hydroxyl-
group may no longer be regarded as an entity but rather acts as a dipole with the
proton being directed away from the two occupied sites and pointing towards the
vacancy (Figure 2.6). This leads to a much lower H+-K+ repulsion while the
interaction between proton and apical oxygen atoms is increased. OH ↔ F exchange
is less favourable because F is not able to contribute to the local charge balancing in
the way OH does.
These effects also have a strong influence on the thermal stability of phlogopite:
Wones (1967) found a decomposing temperature of less than 905 °C at 100 bar for
pure hydroxyl-phlogopite, whereas melting temperatures of 1345 – 1390 °C (at 1
kbar) have been reported for fluoro-phlogopite (Van Valkenburg and Pike, 1952;
Shell and Ivey, 1969).
2.1.7. Phlogopite mineralogy
Micas in general occur in a wide range of rocks. They can be found in intrusive
and extrusive igneous rocks and in upper mantle rocks as well as in metamorphic
rocks formed over a wide range of pressure and temperature conditions.
The main occurrence for phlogopite is in contact-metamorphosed limestones,
dolomites and ultrabasic rocks. These rocks often show low iron contents, so that
nearly pure Mg-phlogopites can be found (e.g., Schreyer et. al, 1980). The mineral is
also often found in kimberlites in India, South Africa and Canada (e.g., Rao et al.,
2009; Zurevinski et al., 2008), and thus, thought to be present in considerable
amounts in the upper mantle. In these depths, phlogopite and other micas are
supposed to play a key role as a carrier of volatiles which can be released through
complex reactions and then change the melting conditions of the surrounding rocks
(Virgo and Popp, 2000).
Phlogopite is also common in intrusive igneous rocks of granitic compositions,
especially in those of late magmatic stages, where F can be strongly enriched
(Carroll and Webster, 1994). In these rocks it often contains higher amounts of iron,

2.1. Phlogopite structure and mineralogy
19
ranging to biotite in composition, and large crystals up to several meters in size can
be formed.
In metapelitic rocks of nearly all temperature and pressure ranges, phlogopite
may occur as an accessory mineral. However, more often biotite is formed instead
due to the higher iron content of these rocks. Other phlogopite-bearing rocks are
contact-metamorphic calc-silicate rocks and marbles.
2. Theory
20
2.2 Solid-state NMR spectroscopy
Solid-state nuclear magnetic resonance (NMR) spectroscopy is a useful tool for
structural investigations which probes the local environment of the atoms in the
lattice up to the second co-ordination sphere. Hence, it is a complementary method
to other techniques like X-ray diffraction (XRD) and infra-red (IR) spectroscopy.
Information which can be obtained in NMR spectroscopic experiments contains
the co-ordination number and type of co-ordinating atoms, bond angles, and dynamic
processes in the lattice. In contrast to X-ray diffraction experiments, NMR
spectroscopy is able to easily detect the position and local environment of protons in
the lattice, and even amorphous structures can be investigated.
NMR spectroscopy is especially useful for the investigation of micas like
phlogopite. These materials often cause severe problems in the analysis of their
X-ray diffraction patterns: The small crystallite size of synthetic samples gives rise to
broad reflections, and the plate-like shape makes it necessary to integrate models in
the fitting procedures which deal with the preferred orientation of crystals during the
experiments. Moreover, these structures are often of low symmetry, mostly
monoclinic, leading to a large number of reflections which makes it difficult to
distinguish between the mica reflections and those of impurity phases. Another
problem is caused by stacking faults and mixtures of several different polytypes of
one single phase leading to broad bumps in the background of the patterns (Chapter
4.7).
Therefore, NMR spectroscopy is an ideal tool to investigate the cation and anion
distribution in the layers of phlogopite. Nuclei which can be measured are 1H, 19F, 27Al and 29Si, and – if enriched in the sample - 17O. Another potential nucleus is 25Mg.
However, 25Mg NMR experiments are not as easy to perform given the low
magnetogyric ratio of this nucleus.
The next chapters will give a short introduction to the basics of the NMR
spectroscopic experiments used to investigate the atomic arrangement in the sheets
of phlogopite. The interactions influencing the spectra as well as techniques based
on these will be explained briefly. For more detailed information, the reader is
referred to textbooks on solid-state NMR spectroscopy like those of Abragam (2007),
Ernst et al. (1994), and Slichter (1996).
2.2 Solid-state NMR spectroscopy
21
2.2.1. Interactions influencing NMR lineshapes
2.2.1.1. Zeeman interaction
NMR spectroscopic experiments are based on the interaction between the
magnetic part of a radio-frequency wave and the magnetic moment of a specific type
of nucleus in the structure.
The magnetic moment results from the nuclear spin I, thus, all nuclei with I > 0
possess a magnetic moment which is connected to the nuclear spin I by
Iµ ˆˆ , 2h
(2.2)
with being the magnetogyric ratio of the specific nucleus and h being Planck’s
constant. The energy levels corresponding to the (2I+1) eigenstates are degenerated
unless brought into an external magnetic field 0B
. In this case, the energy levels split
up. This effect is called Zeeman interaction, and the corresponding Hamiltonian is
defined as
00ˆˆˆ BIBH zz
. (2.3)
zI is the z-component of the nuclear spin operator which interacts with the external
magnetic field 0B
. Solving the Schrödinger equation for the Zeeman interaction, one
obtains the corresponding energy eigenvalues
0BmEm
(2.4)
where m is the magnetic quantum number.
In NMR spectroscopic experiments, an electromagnetic wave is irradiated to
induce transitions between the energy levels. These transitions are only allowed for
∆m = ±1 (selection rule) and the energy of the incoming wave must be equal to the
difference in energy between the two energy levels, ∆E:
00 BE . (2.5)
The resonance frequency 0 is called the Larmor precession frequency of the
specific nucleus.
2. Theory
22
2.2.1.2. Chemical shift interaction
The chemical shift interaction is caused by the influence of the electron shell on
the nucleus. The external magnetic field induces a motion of electrons in the electron
shell. This movement in return induces a secondary magnetic field which changes
the resulting magnetic field at the nucleus. It may either enhance the static magnetic
field leading to a higher effective magnetic field at the nucleus, the so-called de-
shielding effect. The external magnetic field may also be lowered by this secondary
magnetic field, and thus, the nucleus be shielded.
The result is a change in the frequency of the electromagnetic wave necessary
for the excitement of transitions between energy levels and a shift of the signal in the
spectrum: The signal position is moved to higher frequencies for de-shielding effects
and to lower frequencies for shielding effects. The secondary magnetic field depends
on the electron density distribution around the nucleus which in return is influenced
by the chemical environment of the atom. Each separate environment will therefore
lead to a different signal in the resulting NMR spectrum.
The chemical shift Hamiltonian CSH is defined as
0ˆˆ BIH zCS
(2.6)
where is the chemical shielding tensor. This tensor is first described in the so-
called principle axes system (PAS) with the origin placed in the centre of the nucleus.
However, for a simpler mathematical treatment the tensor is then transformed to the
laboratory axes system (LS), with the z-direction of the LS being equal to the z-
direction of the external magnetic field.
The chemical shielding tensor is set up in the PAS in a way that the strongest
absolute interaction is directed along the z-direction:
isoyyisoxxisozz
zz
yy
xx
,
00
00
00
(2.7)
with iso being the isotropic chemical shift which is defined by the trace of the
symmetric chemical shielding tensor.
2.2 Solid-state NMR spectroscopy
23
Triso 3
1 . (2.8)
Another parameter influencing the chemical shift lineshape of an NMR signal is
the chemical shift anisotropy aniso which is defined as follows (Duer, 2002):
)( isozzaniso . (2.9)
The asymmetry parameter describes the deviation from axial symmetry
isozz
xxyy
(2.10)
and ranges between 0 ≤ ≤ 1. Thus, the chemical shift anisotropy lineshape can
give information on the symmetry of the co-ordination polyhedron around a specific
nucleus.
As the Larmor-frequency is dependent of the external magnetic field, the exact
signal position also changes with increasing field strength. This makes it difficult to
compare spectra recorded at different spectrometers unless the field strength is
exactly the same. Therefore, the chemical shift is given relative to a reference
material:
ppmref
refxiso
610
. (2.11)
x is the resonance frequency of the observed nucleus, and ref is the resonance
frequency of the reference material.
2.2.1.3. Dipolar interaction
Another interaction influencing the magnetic field at the observed nucleus is the
interaction with other nuclei possessing a magnetic moment nearby, the so-called
dipolar interaction. These nuclei can be either of the same type of nucleus, i.e.,
homo-nuclear dipolar interaction, or the interaction can take place with a different
type of nucleus, i.e., hetero-nuclear interaction.
In the laboratory frame the Hamiltonian for the homo-nuclear dipolar interaction
between two atoms i and j with nuclear spin operators iI and jI can be written as:
2. Theory
24
jijz
iz
ij
iDD IIII
rH ˆˆˆˆ1cos3
2
1
4ˆ 2
3
20
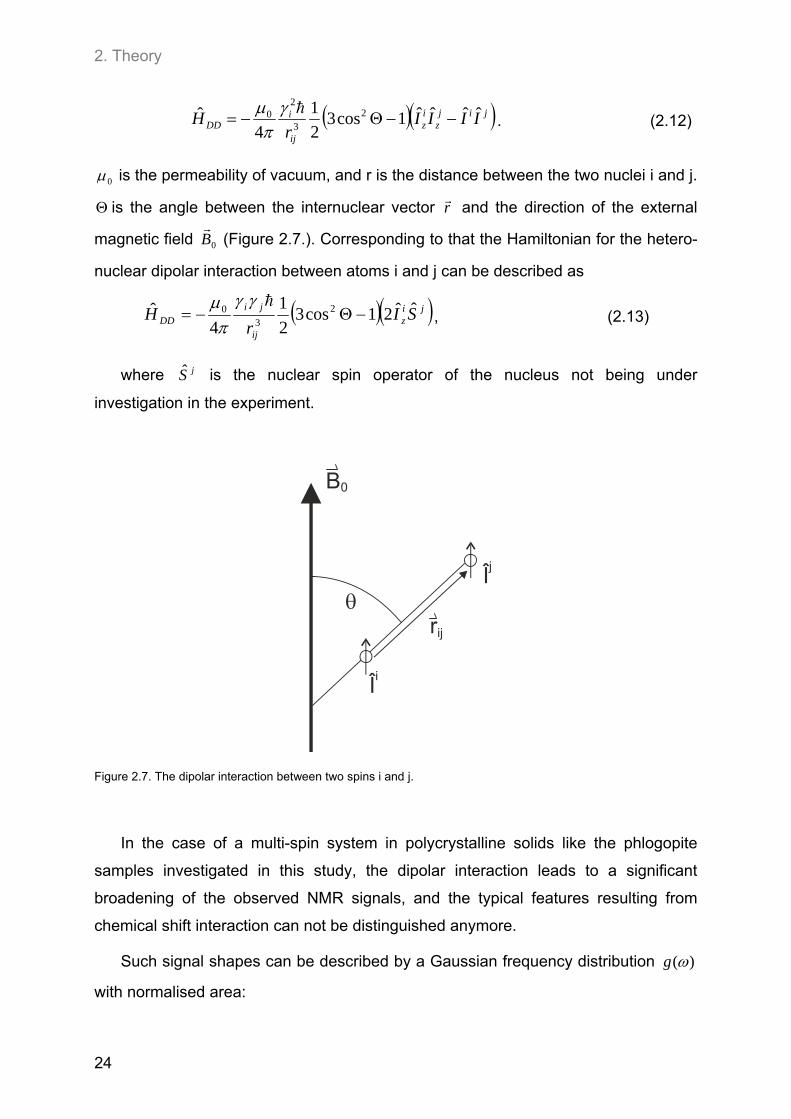
. (2.12)
0 is the permeability of vacuum, and r is the distance between the two nuclei i and j.
is the angle between the internuclear vector r
and the direction of the external
magnetic field 0B
(Figure 2.7.). Corresponding to that the Hamiltonian for the hetero-
nuclear dipolar interaction between atoms i and j can be described as
jiz
ij
jiDD SI
rH ˆˆ21cos3
2
1
4ˆ 2
30
, (2.13)
where jS is the nuclear spin operator of the nucleus not being under
investigation in the experiment.
B0
rij
Îi
Îj
Figure 2.7. The dipolar interaction between two spins i and j.
In the case of a multi-spin system in polycrystalline solids like the phlogopite
samples investigated in this study, the dipolar interaction leads to a significant
broadening of the observed NMR signals, and the typical features resulting from
chemical shift interaction can not be distinguished anymore.
Such signal shapes can be described by a Gaussian frequency distribution )(g
with normalised area:
2.2 Solid-state NMR spectroscopy
25
2
20
)(
)(2ln12ln
)(
eg . (2.14)
0 is the frequency of the maximum of function )(g , and is the full width at half
maximum. However, in most cases the lineshape is best described by the so-called
second moment 2M , which is given by the mean quadratic linewidth.
dgM )()( 202 . (2.15)
In the special case of a pure Gaussian lineshape the second moment can be
calculated directly from the full width at have maximum:
2ln2
2
2
M . (2.16)
In return, from the second moment 2M , information on the structural arrangement
can be obtained using the van Vleck equation (van Vleck, 1948) which is valid for
polycrystalline materials in which all environments for the observed nucleus i are on
average the same throughout the whole structure:
2222 ISIIM . (2.17)
rij and rik are the average internuclear distances between interacting nuclei, 2II is
the homo-nuclear second moment and described as
624
2
02 1)1(
45
3
ijiiiII r
II
. (2.18)
2IS is the hetero-nuclear second moment and can be written as
6222
2
02 1)1(
415
4
ikkkkiIS r
II
. (2.19)
This connection between the second moment and the direct environment of the
nucleus allows the estimation of distances between atoms in cross-polarisation
experiments discussed in Chapter 2.2.2.2.
2. Theory
26
As phlogopite contains many nuclei with magnetic moments and some of them
even with a natural abundance of the specific nucleus of 100 % (19F, 27Al) or a value
close to that (1H), dipolar interaction of both types must be considered for every
experiment. This means that all experiments have been performed using the magic
angle spinning technique (Chapter 2.2.2.1.) to average out dipolar interactions and to
decrease the line-broadening caused by this interaction.
2.2.1.4. Quadrupolar interaction
For nuclei with a nuclear spin of I > 1/2, another interaction must be taken into
account, the quadrupolar interaction. This is due to the electric charges not being
distributed equally in the nucleus but in form of a quadrupol leading to an electric
quadrupolar moment Q. In case of a non-spherical distribution of electric charges in
the surrounding electron shell, an electric field gradient (EFG) ikV is generated with
which the quadrupolar moment may interact.
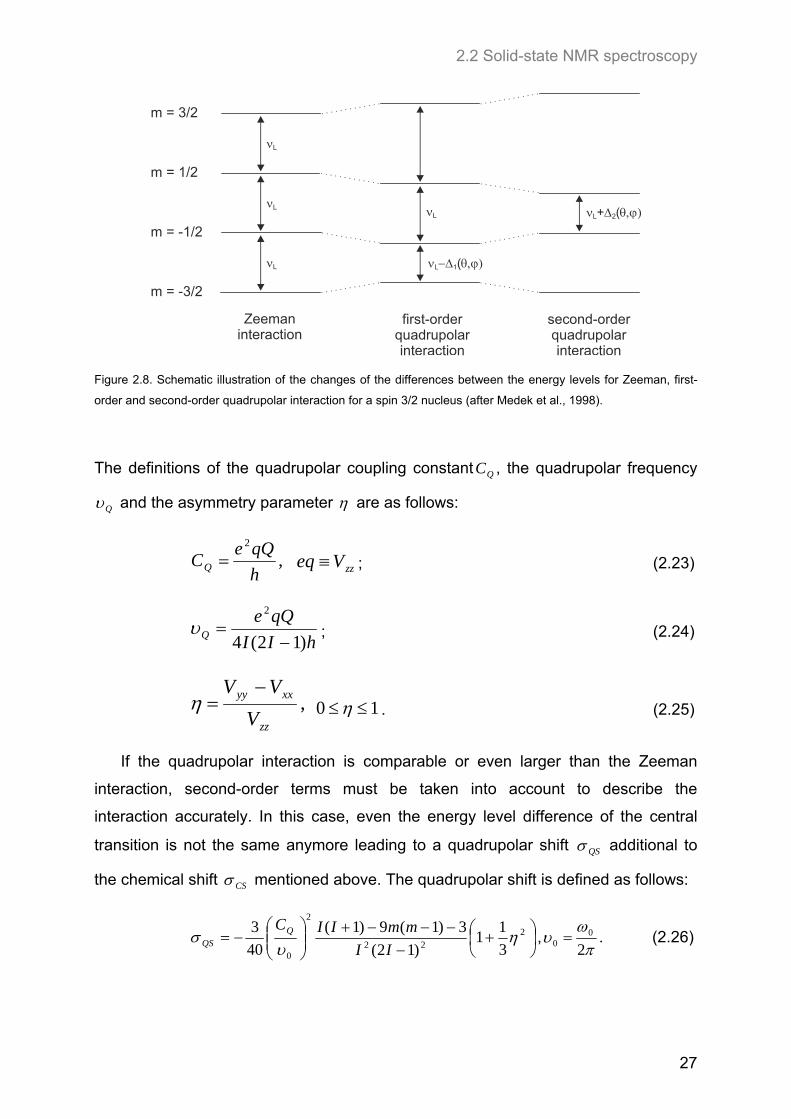
As a result the difference between the energy levels is not equal for all levels
anymore (Figure 2.8). However, in case of a first-order perturbation, when the
quadrupolar interaction is low in comparison to the Zeeman interaction, the energy
level difference of the central transition (1/2 → -1/2) remains unchanged. The
quadrupolar Hamiltonian QH may then be written as
N
i
ii
i
ii
iQ IVI
II
eQH
1
ˆˆ)1(2
ˆ
. (2.20)
After insertion of the Wigner matrixes this equation becomes
2cossin
2
1
2
1cos3)1(ˆ3
)12(4ˆ 2
22
2
IIIII
qQeH z
iiQ
(2.21)
with the two Euler angles and . The principal elements of the EFG are then
defined as
,
00
00
00
zz
yy
xx
V
V
V
V xxyyzz VVV . (2.22)
2.2 Solid-state NMR spectroscopy
27
m = 3/2
m = 1/2
m = -1/2
m = -3/2
L
L
L
L 2+ (L
L 1(
Zeemaninteraction
first-orderquadrupolarinteraction
second-orderquadrupolarinteraction
Figure 2.8. Schematic illustration of the changes of the differences between the energy levels for Zeeman, first-
order and second-order quadrupolar interaction for a spin 3/2 nucleus (after Medek et al., 1998).
The definitions of the quadrupolar coupling constant QC , the quadrupolar frequency
Q and the asymmetry parameter are as follows:
,2
h
qQeCQ zzVeq ; (2.23)
hII
qQeQ )12(4
2
; (2.24)
,zz
xxyy
V
VV 10 . (2.25)
If the quadrupolar interaction is comparable or even larger than the Zeeman
interaction, second-order terms must be taken into account to describe the
interaction accurately. In this case, even the energy level difference of the central
transition is not the same anymore leading to a quadrupolar shift QS additional to
the chemical shift CS mentioned above. The quadrupolar shift is defined as follows:
2
22
2
0 3
11
)12(
3)1(9)1(
40
3
II
mmIICQQS ,
2
00 . (2.26)
2. Theory
28
0 is the Larmor frequency of the nucleus, and m is the magnetic quantum number.
The second-order quadrupolar interaction also leads to a significant broadening of
the signal for the central transition.
When investigating phlogopites, the quadrupolar interaction has to be considered
for 27Al and 17O which possess a nuclear spin of I = 5/2. As for the dipolar interaction,
magic-angle spinning (Chapter 2.2.2.1) has been performed to average out first-order
quadrupolar interaction. However, this is not possible for the case of second-order
quadrupolar interaction. The existence of several possible transitions has been used
for multiple quantum magic angle spinning experiments (Chapter 2.2.2.4).
2.2.2. Experimental techniques
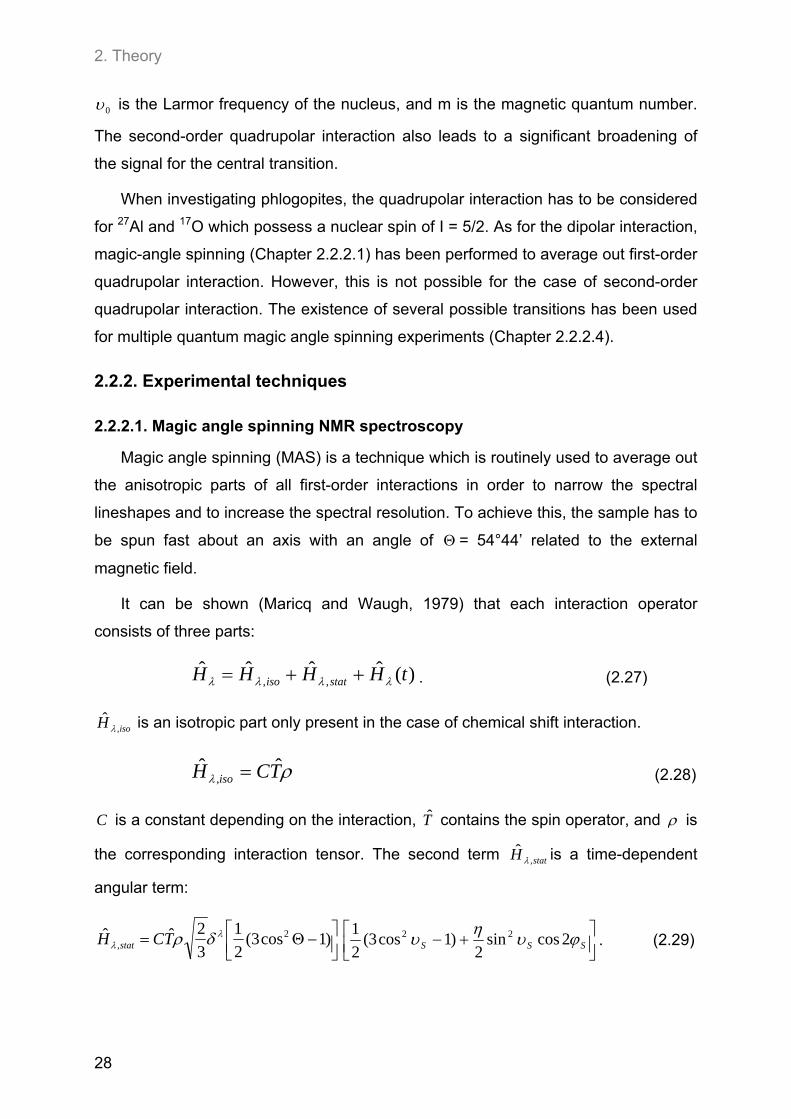
2.2.2.1. Magic angle spinning NMR spectroscopy
Magic angle spinning (MAS) is a technique which is routinely used to average out
the anisotropic parts of all first-order interactions in order to narrow the spectral
lineshapes and to increase the spectral resolution. To achieve this, the sample has to
be spun fast about an axis with an angle of = 54°44’ related to the external
magnetic field.
It can be shown (Maricq and Waugh, 1979) that each interaction operator
consists of three parts:
)(ˆˆˆˆ,, tHHHH statiso . (2.27)
isoH ,ˆ is an isotropic part only present in the case of chemical shift interaction.
TCH isoˆˆ
, (2.28)
C is a constant depending on the interaction, T contains the spin operator, and is
the corresponding interaction tensor. The second term statH ,ˆ is a time-dependent
angular term:
)1cos3(2
1
3
2ˆˆ 2,
TCH stat
SSS 2cossin
2)1cos3(
2
1 22 . (2.29)
2.2 Solid-state NMR spectroscopy
29
statH ,ˆ becomes zero if the spinning axis is oriented with an angle of 54°44’ to the z-
axis of the external magnetic field due to the term )1cos3( 2 . The last term )(ˆ tH is
a time-dependent term:
tStCtStCTCtH rrrr 2sin2cossincos
3
2ˆ)(ˆ2211 (2.30)
nC and nS are time-independent trigonometric terms (Maricq and Waugh, 1979). If
the rotation frequency r is much larger than the spectral frequency width of the
static signal, )(ˆ tH is time-averaged and only the isotropic signal will be present in
the resulting spectrum. If the rotation frequency r is smaller than , so-called
spinning sidebands will appear in the spectrum at distances equal to the rotation
frequency. These are marked by asterisks in the spectra discussed in the results
section.
2.2.2.2. Cross-polarisation magic angle spinning NMR spectroscopy
As has been mentioned earlier, the dipolar interaction between neighbouring
nuclei can be used to gather information on the distance between these nuclei and
on atomic arrangements in the structure.
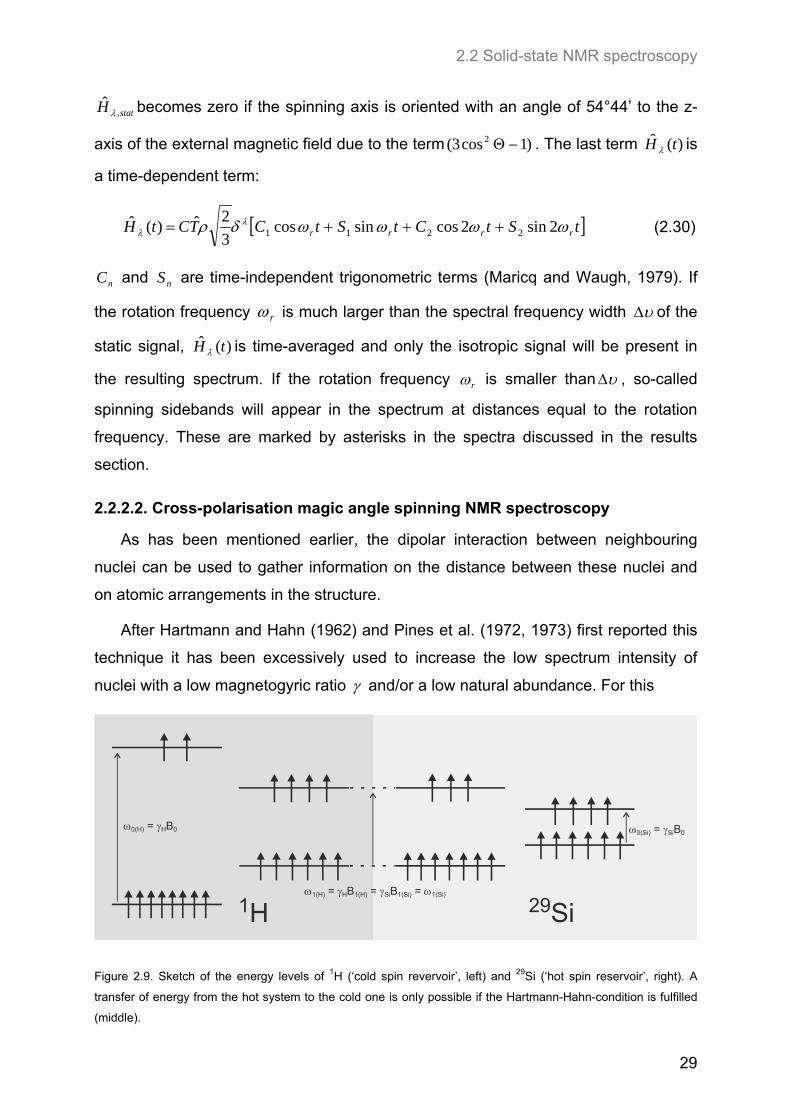
After Hartmann and Hahn (1962) and Pines et al. (1972, 1973) first reported this
technique it has been excessively used to increase the low spectrum intensity of
nuclei with a low magnetogyric ratio and/or a low natural abundance. For this
1(H) H 1(H) Si 1(Si) 1(Si) = B = B =
0(H) H = B0 0(Si) Si = B0
1H 29Si
Figure 2.9. Sketch of the energy levels of 1H (‘cold spin revervoir’, left) and 29Si (‘hot spin reservoir’, right). A
transfer of energy from the hot system to the cold one is only possible if the Hartmann-Hahn-condition is fulfilled
(middle).

2. Theory
30
purpose, magnetisation is transferred from another nucleus with a high natural
abundance and a high magnetogyric ratio to this specific nucleus via dipolar
interaction. In the framework of this study, 29Si has been chosen to accept
magnetisation which has been transferred from either the 1H or the 19F nucleus.
However, it was not the purpose to increase signal intensity for 29 Si, but to use the
dipolar interaction to gather information on the distance between these nuclei and on
atomic arrangements in the structure. In this chapter the basics of this technique will
be explained shortly for {1H} → 29Si cross-polarisation magic angle spinning
(CPMAS) NMR spectroscopy, but the method works for {19F} → 29Si CPMAS NMR
alike.
To allow the energy transfer between both nuclei, the radiofrequency field 1B has
to be adjusted in such a way that the distance in energy between the energy levels is
the same in both systems S and I, and the so-called Hartmann-Hahn condition is
fulfilled (Hartmann and Hahn, 1962):
)29(129)1(11 SiSiHH BB . (2.31)
Thermodynamically, this process can be described as a heat exchange between a
cold and a hot spin reservoir (Figure 2.9). The distribution of spins in the two systems
is a Boltzmann distribution, and the fractional number Ni/N of spins occupying a
certain energy level Ei is given by
i
Tk
E
Tk
E
i
B
i
B
i
e
e
N
N
, (2.32)
where Bk is the Boltzmann constant. If the energy difference is low, many spins
already occupy the excited state and, thus, cannot undergo a transition any more,
leading to low signal intensities. However, if the spin temperature of the system and
thus, the energy difference is increased more spins occupy the ground state and are
available for excitation.
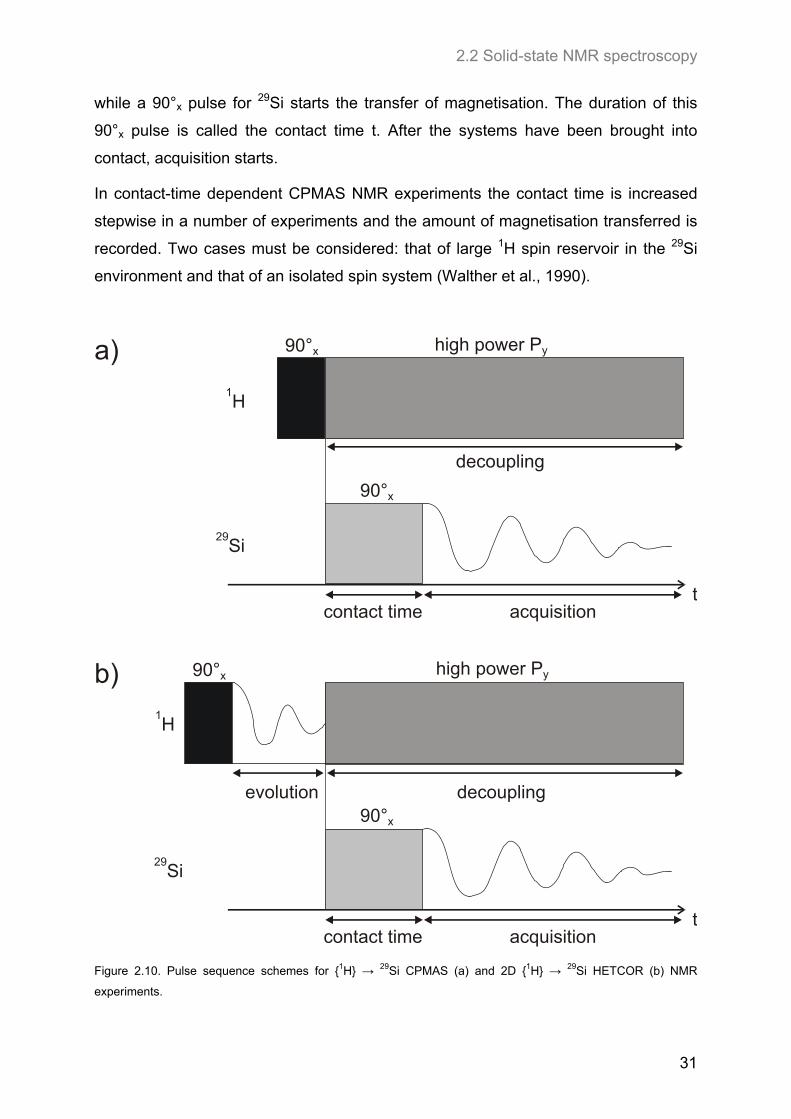
A two-pulse sequence has to be applied for the magnetisation transfer, as shown
in Figure 2.10a. The first pulse in the 1H channel brings the 1H magnetisation into the
xy-plane. This is followed by a long spin-lock pulse to hold the magnetisation there,
2.2 Solid-state NMR spectroscopy
31
while a 90°x pulse for 29Si starts the transfer of magnetisation. The duration of this
90°x pulse is called the contact time t. After the systems have been brought into
contact, acquisition starts.
In contact-time dependent CPMAS NMR experiments the contact time is increased
stepwise in a number of experiments and the amount of magnetisation transferred is
recorded. Two cases must be considered: that of large 1H spin reservoir in the 29Si
environment and that of an isolated spin system (Walther et al., 1990).
90°x
1H
29Si
tcontact time acquisition
90°x
high power Pya)
90°x
1H
29Si
tcontact time acquisition
90°x
high power Pyb)
evolution
decoupling
decoupling
Figure 2.10. Pulse sequence schemes for {1H} → 29Si CPMAS (a) and 2D {1H} → 29Si HETCOR (b) NMR
experiments.
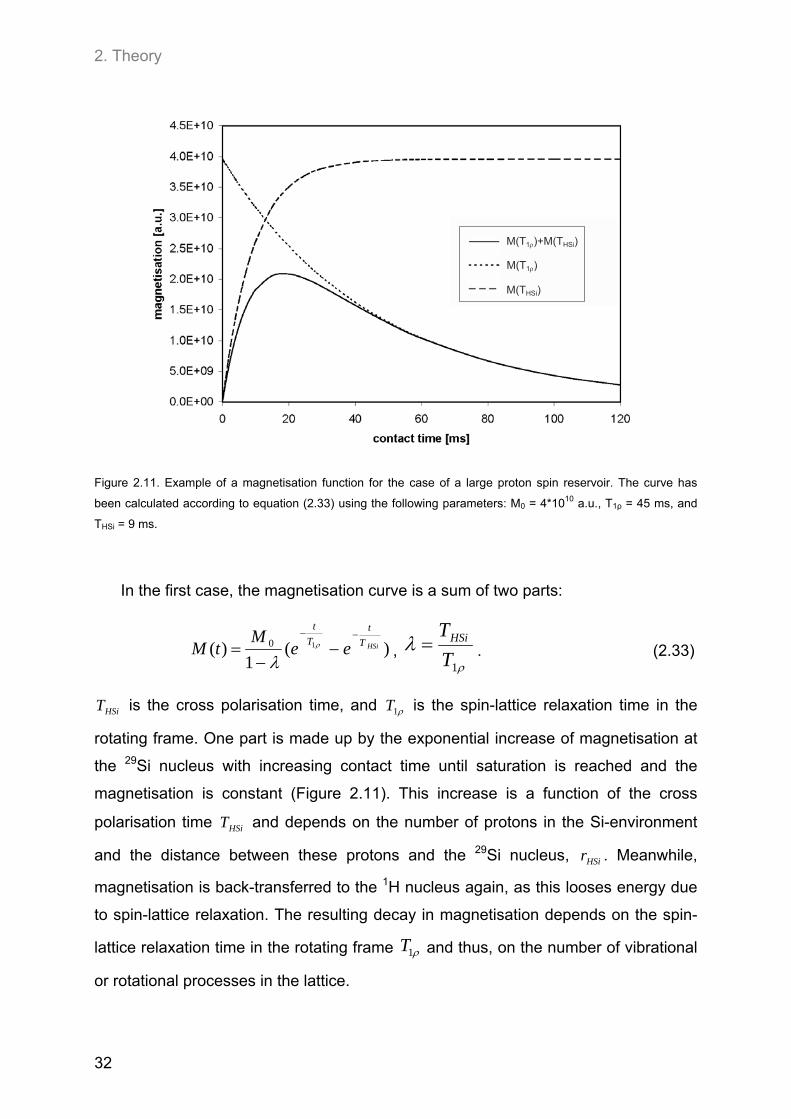
2. Theory
32
M(T )+M(T )1 HSi
M(T )1
M(T )HSi
Figure 2.11. Example of a magnetisation function for the case of a large proton spin reservoir. The curve has
been calculated according to equation (2.33) using the following parameters: M0 = 4*1010 a.u., T1ρ = 45 ms, and
THSi = 9 ms.
In the first case, the magnetisation curve is a sum of two parts:
)(1
)( 10 HSiT
tT
t
eeM
tM
,
1T
THSi . (2.33)
HSiT is the cross polarisation time, and 1T is the spin-lattice relaxation time in the
rotating frame. One part is made up by the exponential increase of magnetisation at
the 29Si nucleus with increasing contact time until saturation is reached and the
magnetisation is constant (Figure 2.11). This increase is a function of the cross
polarisation time HSiT and depends on the number of protons in the Si-environment
and the distance between these protons and the 29Si nucleus, HSir . Meanwhile,
magnetisation is back-transferred to the 1H nucleus again, as this looses energy due
to spin-lattice relaxation. The resulting decay in magnetisation depends on the spin-
lattice relaxation time in the rotating frame 1T and thus, on the number of vibrational
or rotational processes in the lattice.
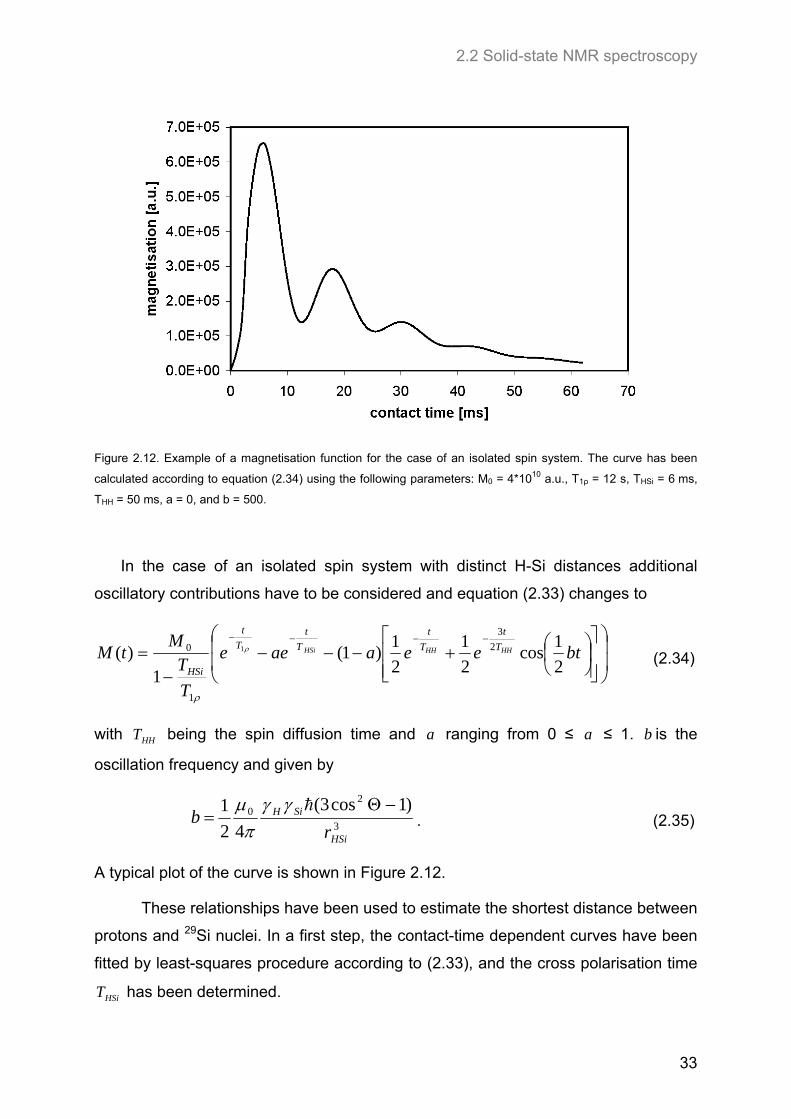
2.2 Solid-state NMR spectroscopy
33
Figure 2.12. Example of a magnetisation function for the case of an isolated spin system. The curve has been
calculated according to equation (2.34) using the following parameters: M0 = 4*1010 a.u., T1ρ = 12 s, THSi = 6 ms,
THH = 50 ms, a = 0, and b = 500.
In the case of an isolated spin system with distinct H-Si distances additional
oscillatory contributions have to be considered and equation (2.33) changes to
bteeaaee
T
TM
tM HHHHHSi T
t
T
t
T
tT
t
HSi 2
1cos
2
1
2
1)1(
1)( 2
3
1
0 1
(2.34)
with HHT being the spin diffusion time and a ranging from 0 ≤ a ≤ 1. b is the
oscillation frequency and given by
3
20 )1cos3(
42
1
HSi
SiH
rb
. (2.35)
A typical plot of the curve is shown in Figure 2.12.
These relationships have been used to estimate the shortest distance between
protons and 29Si nuclei. In a first step, the contact-time dependent curves have been
fitted by least-squares procedure according to (2.33), and the cross polarisation time
HSiT has been determined.
2. Theory
34
According to Pines et al. (1973), the cross polarisation time is connected to the
homo-nuclear second moment 2HH and the hetero-nuclear second moment
2HSi in the following way:
2
21
HH
HSi
HSiHSi
CT
. (2.36)
HSiC is a geometrical constant for which as an approximation the value for the similar
kaolinite structure has been taken:
2
HSiC . (2.37)
(Hayashi and Akiba, 1994). 2HH has been calculated according to equation (2.18)
after a structural model of Tateyama et al. (1974), considering only the five shortest
given H-H distances. This allowed for the calculation of 2HSi from equation (2.36)
and the calculation of the mean H-Si distance according to equation (2.19).
2.2.2.3. 2D hetero-nuclear correlation CPMAS NMR experiments
A variation of the CPMAS NMR experiment described above, the 2D hetero-
nuclear correlation (HETCOR) CPMAS experiment, can be used to gather
information on the atomic arrangement in the octahedral sheets of phlogopite related
to that in the tetrahedral sheets. Information on the proton environment can be
transferred together with the magnetisation and correlated to the corresponding 29Si
environment.
In this experiment, the contact time is kept constant. Instead, an additional delay
is inserted between the first pulse in the 1H channel and the contact pulse, and the
length of this delay is increased in a number of experiments (Figure 2.10b). In this
way, the amount of magnetisation being transferred changes as the proton
magnetisation decreases and information on the proton environment can be detected
indirectly.
The result is a two-dimensional spectrum giving connectivity information: The
more often two specific environments are located next to each other in the structure,
the higher the corresponding signal.
2.2 Solid-state NMR spectroscopy
35
2.2.2.4. Multiple quantum MAS NMR spectroscopy
It has already been discussed earlier (Chapter 2.2.1.4) that first- and second-
order quadrupolar interactions lead to a significant broadening of signals in spectra of
nuclei with spin I > ½. For the investigation of phlogopite this causes problems for 27Al (I = 5/2) and 17O (I = 5/2) NMR spectra, making it difficult to distinguish between
signals of different environments in the phlogopite structure as well as in impurity
phases. Therefore, multiple quantum magic angle spinning (MQMAS) experiments
have been performed to obtain additional information on the lineshape of the
observed NMR signals.
Spinning the sample rapidly about an axis has been routinely used in the MAS
technique (Chapter 2.2.2.1) to average out first-order interaction. Then the evolution
of a spin coherence after excitation can be described by multirank expansion of its
phase :
tPmCmttm SQCS )(cos)(2),,( 000
tPmCtPmC SQSQ )(cos)(),()(cos)(),( 444222 . (2.38)
CS is the isotropic chemical shift, and and are the Euler angles describing the
orientation of the principle axes system of the quadrupolar tensor to the external
magnetic field. Q0 is the zero-rank, i.e. isotropic, quadrupolar shift, ),(2 Q is a
second-rank anisotropic frequency similar to the chemical shielding and dipolar
interaction anisotropies, and ),(4 Q is a fourth-rank anisotropic frequency resulting
from the fact that second-order effects are proportional to the interaction squared.
20 3)1(2)( mSSmmCS , (2.39)
312)1(82)( 22 mSSmmC S , (2.40)
534)1(182)( 24 mSSmmC S
(2.41)
are zero-, second- and fourth-rank coefficients depending on the spin S and the order
m of the transition. )(cos nP are Légendre polynomials of cos :
1)(cos0 P ; (2.42)
2. Theory
36
2
1cos3)(cos
2
2
P ; (2.43)
8
3cos30cos35)(cos
24
4
P . (2.44)
Now it becomes obvious that it is impossible to average out all anisotropic terms
of equation (2.38) by spinning about just one angle. First approaches to get rid of the
line-broadening anisotropic parts have been dynamic angle spinning (DAS) and
double rotation (DOR). In the DAS method the sample is spun about two different
angles alternately (Mueller et al., 1990), while the DOR equipment consists of a
smaller rotor placed in an outer rotor, and both rotors are let spun simultaneously to
fulfil both angle conditions (Samoson et al., 1988).
However, both methods are technically complex, which is why for this study the
MQMAS technique (Frydman and Harwood, 1995; Medek et al., 1995) has been
chosen, in which the spinning angle , usually the magic angle, is fixed. Instead,
spins are allowed to evolve during times 1t and 2t under the effect of two transitions
1m and 2m , chosen in such a way that the following second-order averaging
conditions are fulfilled:
0)()( 222112 tmCtmC SS, (2.45)
0)()( 224114 tmCtmC SS. (2.46)
In the upper part of Figure 2.13, the pulse scheme used for most of the MQMAS
experiments performed in the framework of this study is shown. The lower part of the
same figure shows the corresponding coherence scheme with the coherence
pathways. At the beginning of the experiment the coherence order p is always zero.
During the first pulse – the preparation pulse - all possible transitions with coherence
orders p = +5, +4, +3, …, -4, -5 are excited because the 1m selection rule is
not valid any more due to perturbations of the quadrupolar interaction.
1m has been chosen to be 3/2 which means that the corresponding transitions
with coherence orders p = +3 and p = -3 have to be filtered. This can be easily
done due to the fact that upon shifting the excitation pulse of n -quantum coherences
by degrees the resulting signals will undergo a phase shift of n .
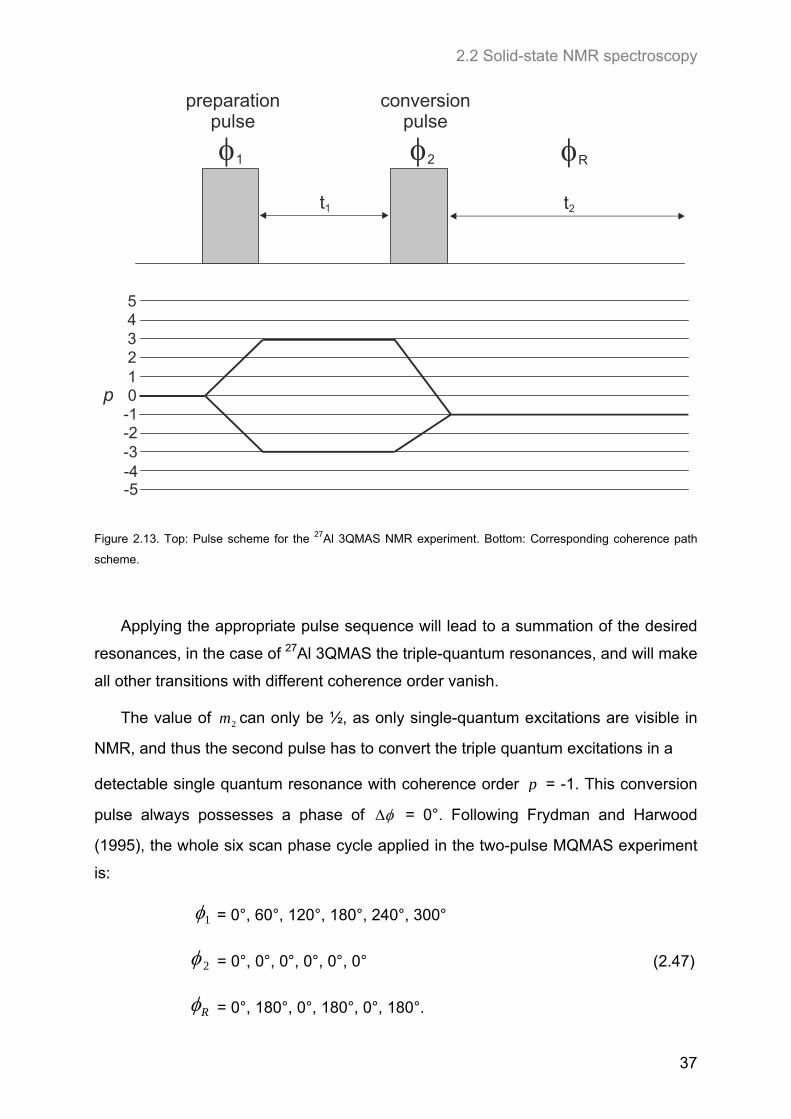
2.2 Solid-state NMR spectroscopy
37
3 2 1 0-1-2-3
p
preparation pulse
conversionpulse
t1 t2
-4-5
4 5
1 2 R
Figure 2.13. Top: Pulse scheme for the 27Al 3QMAS NMR experiment. Bottom: Corresponding coherence path
scheme.
Applying the appropriate pulse sequence will lead to a summation of the desired
resonances, in the case of 27Al 3QMAS the triple-quantum resonances, and will make
all other transitions with different coherence order vanish.
The value of 2m can only be ½, as only single-quantum excitations are visible in
NMR, and thus the second pulse has to convert the triple quantum excitations in a
detectable single quantum resonance with coherence order p = -1. This conversion
pulse always possesses a phase of = 0°. Following Frydman and Harwood
(1995), the whole six scan phase cycle applied in the two-pulse MQMAS experiment
is:
1 = 0°, 60°, 120°, 180°, 240°, 300°
2 = 0°, 0°, 0°, 0°, 0°, 0° (2.47)
R = 0°, 180°, 0°, 180°, 0°, 180°.
2. Theory
38
However, the resulting signal ),( 21 ttS X is a linear combination of the echo and anti-
echo signals, where the echo pathway is p = 0 → 3 → -1 and the anti-echo pathway
is p = 0 → -3 → -1. To obtain a pure absorption mode real spectrum, these two
signals have to be separated which can be achieved by shifting the first pulse by
90°/ p , where p is the order of the coherence in the 1t evolution period, in this case
3 (Massiot et al., 1996). The new phase cycle is then:
1 = 30°, 90°, 150°, 210°, 270°, 330°
2 = 0°, 0°, 0°, 0°, 0°, 0° (2.48)
R = 0°, 180°, 0°, 180°, 0°, 180°
and a second signal ),( 21 ttSY is generated. The echo and anti-echo signals,
),( 21 ttS E and ),( 21 ttS A respectively, can then be calculated from
),(),(),( 212121 ttiSttSttS YXE (2.49)
),(),(),( 212121 ttiSttSttS YXA (2.50)
Afterwards, a shearing transformation is necessary to obtain the isotropic spectrum,
and a 1t -dependent first-order phase correction has to be applied:
).()','(' 21),(
2121 tSetS E
tiE
(2.51)
).()','(' 21),(
2121 tSetS A
tiA
(2.52)
where
122,1 12
19)( tt (2.53)
(Massiot et al., 1996). The pure absorption mode 2D spectrum ),( 21 S is obtained
by Fourier-transforming both signals with respect to 1't and then combining in the
following way:
)','(')','(')','( 212121 AE SSS . (2.54)
The position of the signals (in ppm) in the isotropic projection is then given by
2.2 Solid-state NMR spectroscopy
39
1
393
108
31
17 2
20
26
Qiso
(2.55)
for I = 5/2. is the difference between the isotropic chemical shift and the
reference, 0 is the Larmor-frequency of the nucleus, and QC and are the
quadrupolar coupling parameters. Q is the Zeeman-frequency and defined as:
)12(2
6
II
CQQ
. (2.56)
Equation (2.55) is also a useful tool to check the goodness of the fit of a 27Al
MAS NMR spectrum by calculating the theoretical signal position in the isotropic
dimension from the fitted quadrupolar parameters and then comparing this value to
the signal position found in the 27Al MQMAS NMR spectra.
2. Theory
40
2.3 J-formalism and Monte-Carlo simulations
The combination of the so-called ‘J-formalism’ and Monte Carlo simulations used
for this study has been first reported by Bosenick et al. (2001) and Warren et al.
(2001), and since then the method has been applied to cation ordering in various
mineral systems like spinels (Palin and Harrison, 2007) and pyroxenes (Warren et
al., 2001). It has been shown to be a very effective technique to study cation ordering
in layered structures through investigation of the tetrahedral sheets of muscovite
(Palin et al., 2001), the tetrahedral and octahedral sheets of phengite (Palin et al.,
2003) and the octahedral sheets of minerals of the illite/smectite-group (Sainz-Díaz
et al., 2003a,b; Palin and Dove, 2004). However, these have all been dioctahedral
phyllosilicates whereas the phlogopite structure studied here is trioctahedral.
The J-formalism describes the energy of a given cation configuration as a sum of
separate pair interactions among the ordering cations. A set of pair interaction
parameters, the ‘Js’, is generated from empirical interatomic potentials and lattice
energy minimisation methods using the General Utility Lattice Program (GULP)
(Gale, 1997). These parameters are then used in Monte Carlo simulations of the
cation ordering as a function of temperature. This chapter will present a short outline
of the computation techniques.
For the simulations, the phlogopite structure is considered a network of sites on
which atoms may order, and at first only the tetrahedral sheet has been studied.
The energy for the ordering of the two atom types Si and Al on the network sites
of the tetrahedral sheet can then be described as a sum over all interactions:
)(0n
SiAln
SiAln
SiSin
SiSin
AlAln
nAlAl ENENENEE , (2.57)
where nN are the numbers of pairs of kind n . It can be shown that this relationship
may be simplified to
)2('0n
SiAln
nSiSi
nAlAl
nAlAl EEENEE (2.58)
(Bosenick et al., 2001).
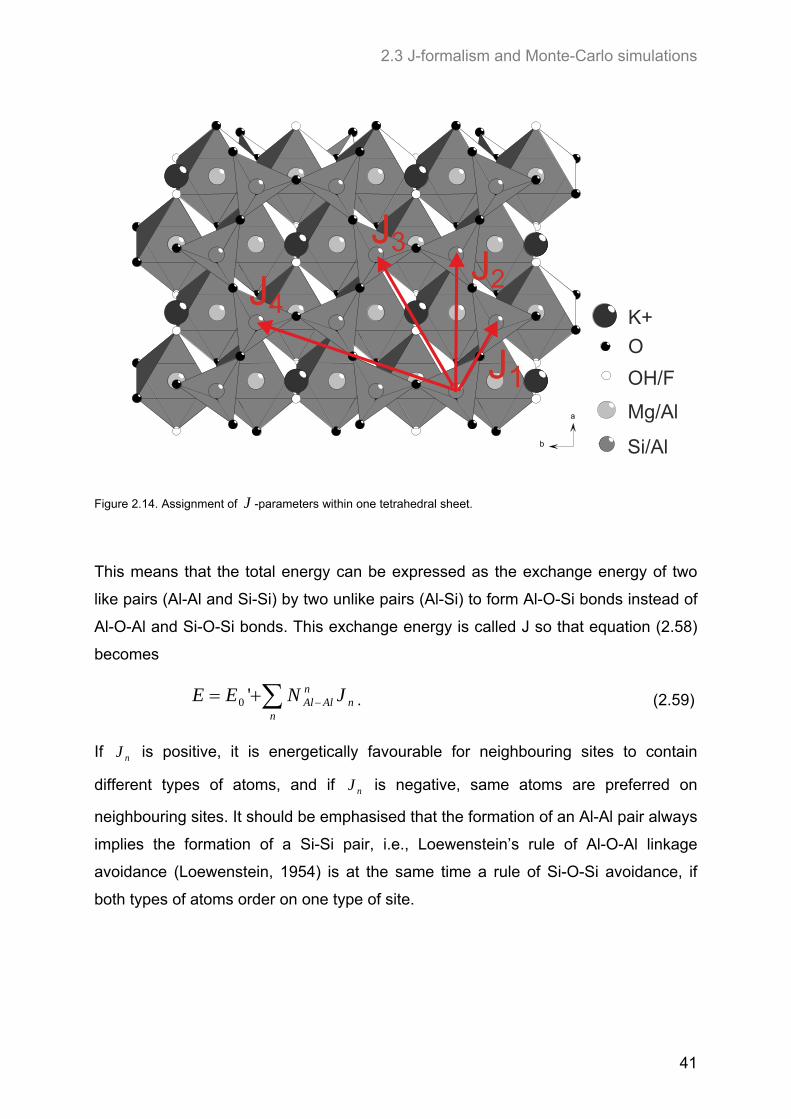
2.3 J-formalism and Monte-Carlo simulations
41
a
b
J1
J2
J3
J4K+
O
OH/F
Mg/Al
Si/Al
Figure 2.14. Assignment of J -parameters within one tetrahedral sheet.
This means that the total energy can be expressed as the exchange energy of two
like pairs (Al-Al and Si-Si) by two unlike pairs (Al-Si) to form Al-O-Si bonds instead of
Al-O-Al and Si-O-Si bonds. This exchange energy is called J so that equation (2.58)
becomes
nn
nAlAl JNEE '0 . (2.59)
If nJ is positive, it is energetically favourable for neighbouring sites to contain
different types of atoms, and if nJ is negative, same atoms are preferred on
neighbouring sites. It should be emphasised that the formation of an Al-Al pair always
implies the formation of a Si-Si pair, i.e., Loewenstein’s rule of Al-O-Al linkage
avoidance (Loewenstein, 1954) is at the same time a rule of Si-O-Si avoidance, if
both types of atoms order on one type of site.

2. Theory
42
a
b
K
Mg
SiAl
O
OF
OOH/F
K+
Si/Al
Mg/Al
Figure 2.15 Assignment of octahedral J -parameters.
Interaction pairs are defined by the distance between the two corresponding
sites. At first, J -parameters for the interactions within a single tetrahedral sheet
have been defined (Figure 2.14). 1J describes the interaction between two directly
neighboured tetrahedra, 2J that of second-nearest tetrahedra, 3J that of third-
nearest tetrahedra, and so on. In the same way interaction parameters present within
a single octahedral sheet have been defined (Figure 2.15). Additionally, for an
investigation of a relationship between the ordering in the different sheets, J -
parameters for sites in directly neighboured sheets have been assigned (Figure
2.16). These are active for adjacent octahedral and tetrahedral sheets, for two
tetrahedral sheets of the same layer package, and for tetrahedral sheets of different
layer packages. All defined interaction parameters iJ and the values determined with
GULP are given in Table 2.1.
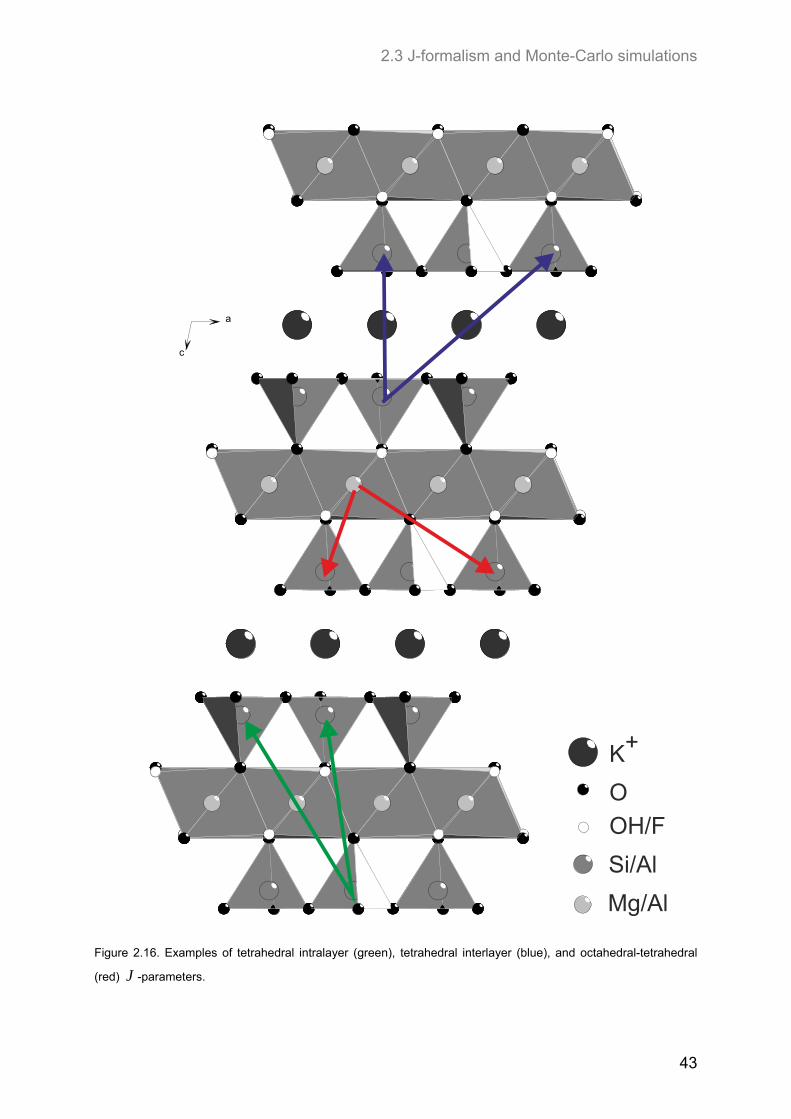
2.3 J-formalism and Monte-Carlo simulations
43
a
c
K+
O
OH/F
Si/Al
Mg/Al
Figure 2.16. Examples of tetrahedral intralayer (green), tetrahedral interlayer (blue), and octahedral-tetrahedral
(red) J -parameters.
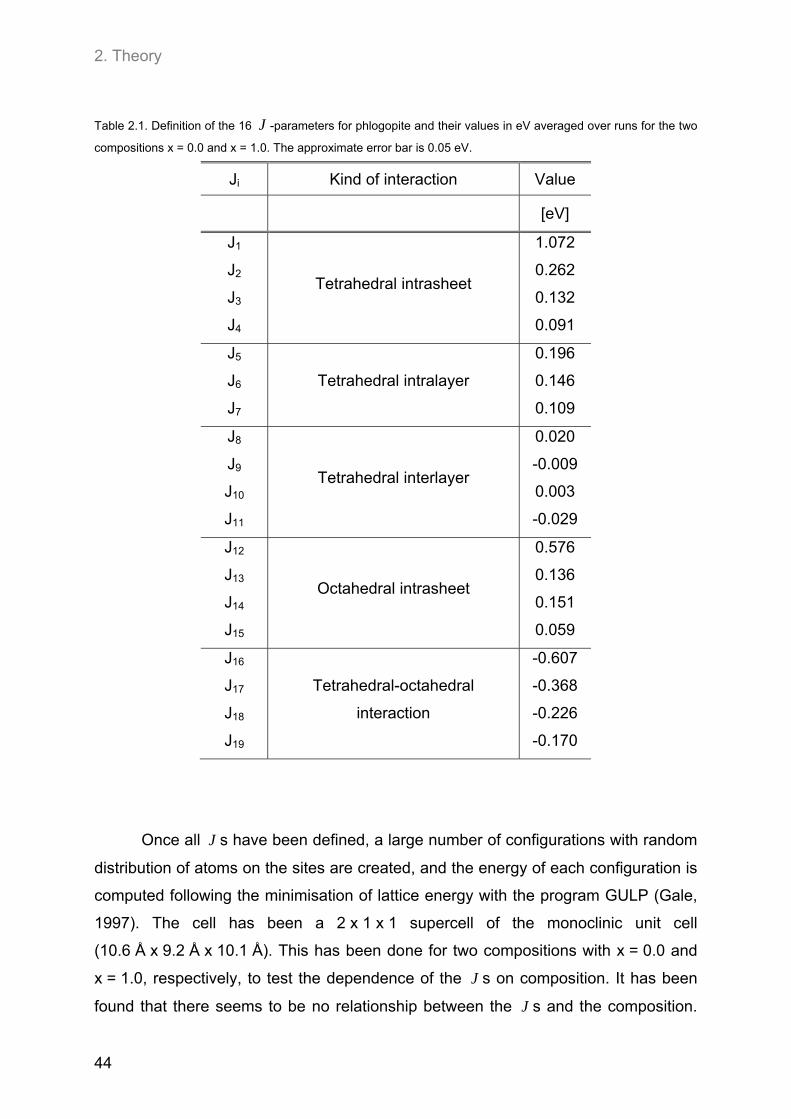
2. Theory
44
Table 2.1. Definition of the 16 J -parameters for phlogopite and their values in eV averaged over runs for the two
compositions x = 0.0 and x = 1.0. The approximate error bar is 0.05 eV.
Ji Kind of interaction Value
[eV]
J1
J2
J3
J4
Tetrahedral intrasheet
1.072
0.262
0.132
0.091
J5
J6
J7
Tetrahedral intralayer
0.196
0.146
0.109
J8
J9
J10
J11
Tetrahedral interlayer
0.020
-0.009
0.003
-0.029
J12
J13
J14
J15
Octahedral intrasheet
0.576
0.136
0.151
0.059
J16
J17
J18
J19
Tetrahedral-octahedral
interaction
-0.607
-0.368
-0.226
-0.170
Once all J s have been defined, a large number of configurations with random
distribution of atoms on the sites are created, and the energy of each configuration is
computed following the minimisation of lattice energy with the program GULP (Gale,
1997). The cell has been a 2 x 1 x 1 supercell of the monoclinic unit cell
(10.6 Å x 9.2 Å x 10.1 Å). This has been done for two compositions with x = 0.0 and
x = 1.0, respectively, to test the dependence of the J s on composition. It has been
found that there seems to be no relationship between the J s and the composition.
2.3 J-formalism and Monte-Carlo simulations
45
For the intrasheet J s, the values achieved with GULP have been tested against a
first-principles fitting with the SIESTA code (Ordejón et al., 1996). The values
obtained with the SIESTA code were slightly smaller than those of the GULP fitting;
except for 4J . However, both values follow the same trends of relative magnitude.
With these J -parameters Monte-Carlo (MC), simulations have been
performed, using the programme Ossia99 (Warren et al., 2001) to obtain the atomic
arrangements of lowest energy for 0.0 ≤ x ≤ 1.0. This code uses an implementation of
the density functional theory (DFT) which is based on a real-space description of the
electron density. The size of the calculation scales linearly with the system size
making possible a description of large and complex systems. Moreover, Ossia99
uses the pseudo-potential method taking into account only valence electrons while
the inner electrons are represented by pseudo-potentials.
The model Hamiltonian has been derived from the Ising-model, a
mathematical model for the description of ferromagnetic structures which can be
easily transferred to the ordering of atoms on sites (Warren et al., 2001). An ordering
variable jS describing the occupancy of site j is defined in such a way that 1jS if
the site is occupied by Si, and 0jS if this site is occupied by Al. Then, the sum over
all interactions is formed whereby every interaction is only counted once, and the
corresponding Hamiltonian can be written as
ij
jjjiij SSSJH ˆ (2.60)
The last term is a chemical potential which operates if the A atoms prefer specific
sites in the structure, while the first term is associated with the bonds.
A random distribution of atoms is then applied to the supercell, and a random
change is proposed which results in an energy change of EEE , with the aim
to find the configuration of lowest energy. The change is accepted, if the energy of
the new state is lower than that of the actual state. However, it must also be allowed
for the system to accept a new state of higher energy in order to find the global
minimum instead of only a local minimum. Thus, a probability function is applied in
this case:
2. Theory
46
Tk
E
BeEEEp
)( (2.61)
where Bk is the Boltzmann constant and T is the temperature of the system. For the
first steps, the temperature is set to very high values of 3000 K to allow atomic
movement in the structure. In a process of ‘simulated annealing’ the temperature is
stepwise lowered to about 100 K. This makes large changes in energy more unlikely,
and the movement of atoms is ‘frozen’.
More than 800M steps have been performed for each run, and for each
composition five runs have been simulated for better statistics. Most runs have used
a supercell of 16 x 16 x 2 of the phlogopite unit-cell containing 7168 active sites on
which ordering may occur. However, also 24 x 24 x 2 supercells have been used for
comparison. As expected, the latter showed a smaller dispersion in the values for the
occupancy of specific sites, but the ordering patterns were similar for both types of
supercells.
All simulations have been carried out by Dr. Alberto García Arribas, Institut de
Ciència de Materials de Barcelona, CSIC, Bellaterra, Spain, and Dr. Javier López-
Solano, Universidad del Pais Vasco, Bilbao, Spain.
3.1. General approach
47
3. Experimental and analytical methods
3.1. General approach
A number of 85 phlogopite samples have been synthesised and investigated
using NMR spectroscopy and powder X-ray diffraction techniques (Figure 3.1).
Fine-grained oxide powders have been prepared by the gelling method according
to Hamilton and Henderson (1968), and from these, phlogopite samples have been
synthesised via hydrothermal synthesis in cold seal bombs at T = 600 °C and
p = 2 kbar. Following the incorporation of aluminium into the structure via
Tschermak’s substitution and the exchange of OH-groups by fluorine, the nominal
composition of the reagent powder was
K (Mg3-xAlx) (Al1+xSi3-xO10) (OH)y F(2-y). (3.1)
The nominal Al-content of the samples is denoted as xnom. As not all aluminium
was incorporated into the phlogopite structure, this value must not be mixed up with
the real Al-content of the phlogopites, which can be estimated using 29Si MAS NMR
spectroscopy (see Chapter 4.2.1) and is therefore named xest.
Figure 3.2 gives an overview on the composition of the synthesised samples. The
majority of samples have been prepared at the Ruhr-Universität Bochum. Some
additional samples synthesised at the same conditions have been prepared by
Predrag Vulić at the University of Innsbruck and kindly provided for analysis in the
frame of this thesis. Samples synthesised at a temperature of 800 °C and a pressure
of 2 kbar, have been provided by Dr. Michael Fechtelkord (Ruhr-Universität Bochum).
The preparation of these samples has been described in Fechtelkord et al. (2003a).
Two more samples with compositions xnom = 0.6, y = 0.5 and xnom = 0.8, y = 0.5,
respectively, have been prepared at a temperature of 800 °C to check the
dependence of the starting materials used on the formation of impurity phases (see
Chapter 3.2 for details).
Only 64 of the 85 samples synthesised at 600 °C have been used for further
analysis. The samples with low Al- and high OH-contents had to be discarded due to
problems with the crystallisation of forsterite during burning the gel over the Bunsen
flame. Due to their high Si-content amorphous oxide mixtures of this composition

3. Experimental and analytical methods
48
KNO (aq)3 Mg(NO ) (aq)3 2 Al(NO ) (aq)3 3 TEOS KF(aq) / NH F(aq)4
+NH (aq) Sol-Gel3
heating up to 800°C
sealing in gold capsules
hydrothermal synthesis runT = 600°C, p = 2 kbar
NMR experiments
29
19
Si MAS
F MAS
Al MAS
H MAS
( O MAS)
27
1
17
{ H} -> Si CPMAS
{ F} -> Si CPMAS
Al MQMAS
( O MQMAS)
1 29
19 29
27
17
powder XRD
characterisation
+ethanol + water
Figure 3.1. Flow chart of synthesis and characterisation of phlogopite samples.
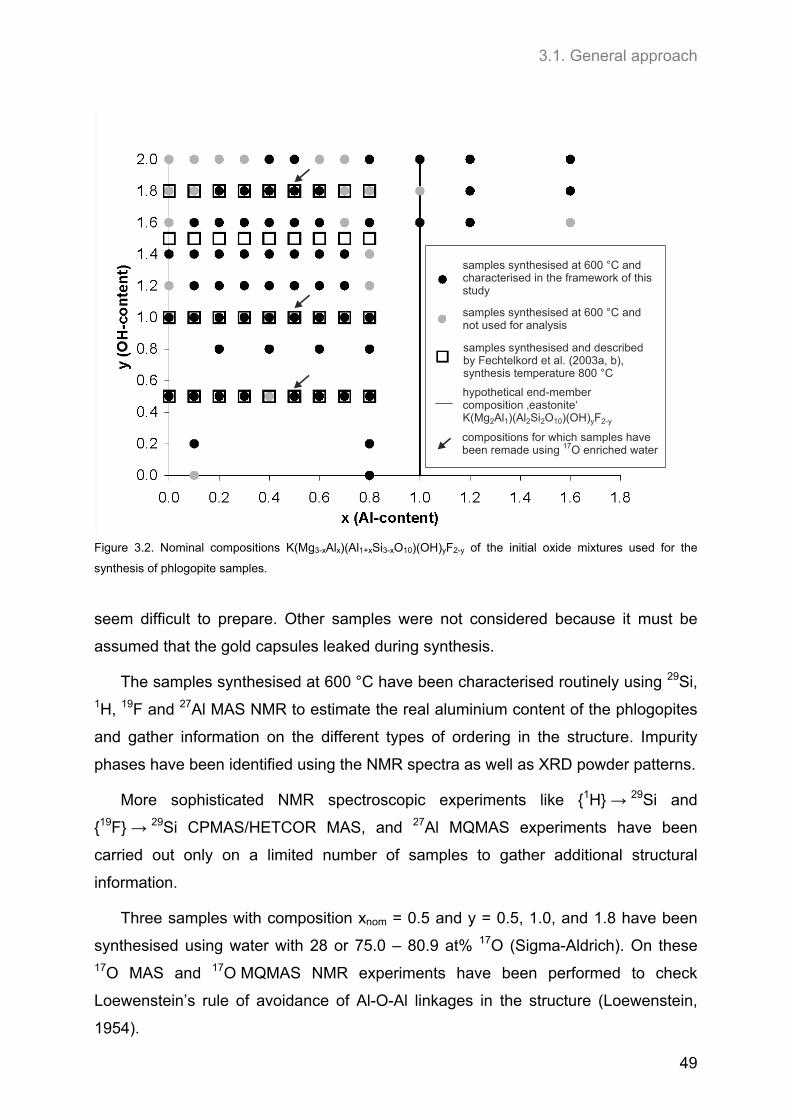
3.1. General approach
49
hypothetical end-membercomposition ‚eastonite‘ K(Mg Al )(Al Si O )(OH) F2 1 2 2 10 y 2-y
samples synthesised and describedby Fechtelkord et al. (2003a, b), synthesis temperature 800 °C
samples synthesised at 600 °C andnot used for analysis
samples synthesised at 600 °C andcharacterised in the framework of this study
compositions for which samples have been remade using O enriched water17
Figure 3.2. Nominal compositions K(Mg3-xAlx)(Al1+xSi3-xO10)(OH)yF2-y of the initial oxide mixtures used for the
synthesis of phlogopite samples.
seem difficult to prepare. Other samples were not considered because it must be
assumed that the gold capsules leaked during synthesis.
The samples synthesised at 600 °C have been characterised routinely using 29Si, 1H, 19F and 27Al MAS NMR to estimate the real aluminium content of the phlogopites
and gather information on the different types of ordering in the structure. Impurity
phases have been identified using the NMR spectra as well as XRD powder patterns.
More sophisticated NMR spectroscopic experiments like {1H} → 29Si and
{19F} → 29Si CPMAS/HETCOR MAS, and 27Al MQMAS experiments have been
carried out only on a limited number of samples to gather additional structural
information.
Three samples with composition xnom = 0.5 and y = 0.5, 1.0, and 1.8 have been
synthesised using water with 28 or 75.0 – 80.9 at% 17O (Sigma-Aldrich). On these 17O MAS and 17O MQMAS NMR experiments have been performed to check
Loewenstein’s rule of avoidance of Al-O-Al linkages in the structure (Loewenstein,
1954).
3. Experimental and analytical methods
50
3.2 Sample preparation
3.2.1. Preparation of gels
In order to obtain highly reactive and homogenous starting materials for the
hydrothermal synthesis of phlogopite samples, the method of Hamilton and
Henderson (1968) has been used to prepare amorphous, fine-grained oxide mixtures
(‘gels’). In these, a network of amorphous SiO2 forms a ‘gel’ in which the other
reagents are held.
1M aqueous solutions of KNO3 (VWR International), Mg(NO3)2*6H2O (Sigma-
Aldrich), Al(NO3)3*9H2O (Sigma-Aldrich), KF (VWR International), and NH4F (Merck)
have been prepared to add potassium, magnesium, aluminium and fluorine. For
hydroxyl-rich compositions (y ≥ 1) both potassium and fluorine have been added in
form of KF, and KNO3 has been used to add more potassium if necessary. For
fluorine-rich compositions (y < 1), potassium has been added in form of KNO3, and
NH4F has been used for fluorine to avoid excess potassium in the mixture.
The aqueous solutions have been titrated in Teflon containers. Liquid tetraethyl
orthosilicate (TEOS, Merck) has been used as source of silicon. TEOS has also been
titrated considering its density at room temperature. Afterwards ethanol has been
added in order to obtain a homogenous solution of nitrates and TEOS.
To start the gelling process, a solution of ammonium hydroxide (33%) has been
added until the solution was alkaline and a mixture of metal oxides and hydroxides
precipitated. The mixture has then been dried in a drying-cabinet that was heated
stepwise from 50 to 120 °C. Afterwards the resulting hard pellets have been broken
and heated up to 800 °C in a platinum crucible over a Bunsen flame to evaporate
water, ethanol, ammonia and nitrogen oxides. The powder has been ground in an
agate mortar and used for hydrothermal synthesis.
3.2.2. Hydrothermal synthesis
For synthesis the oxide mixtures have been sealed in gold tubes with
approximately 9 wt% of water. Typically, an amount of 150 to 300 mg of powder has
been used. The outer diameter of the gold tubes was 4 mm, and the thickness of the
gold was 0.5 mm. After sealing, the capsules had a length of 4 to 5 cm.
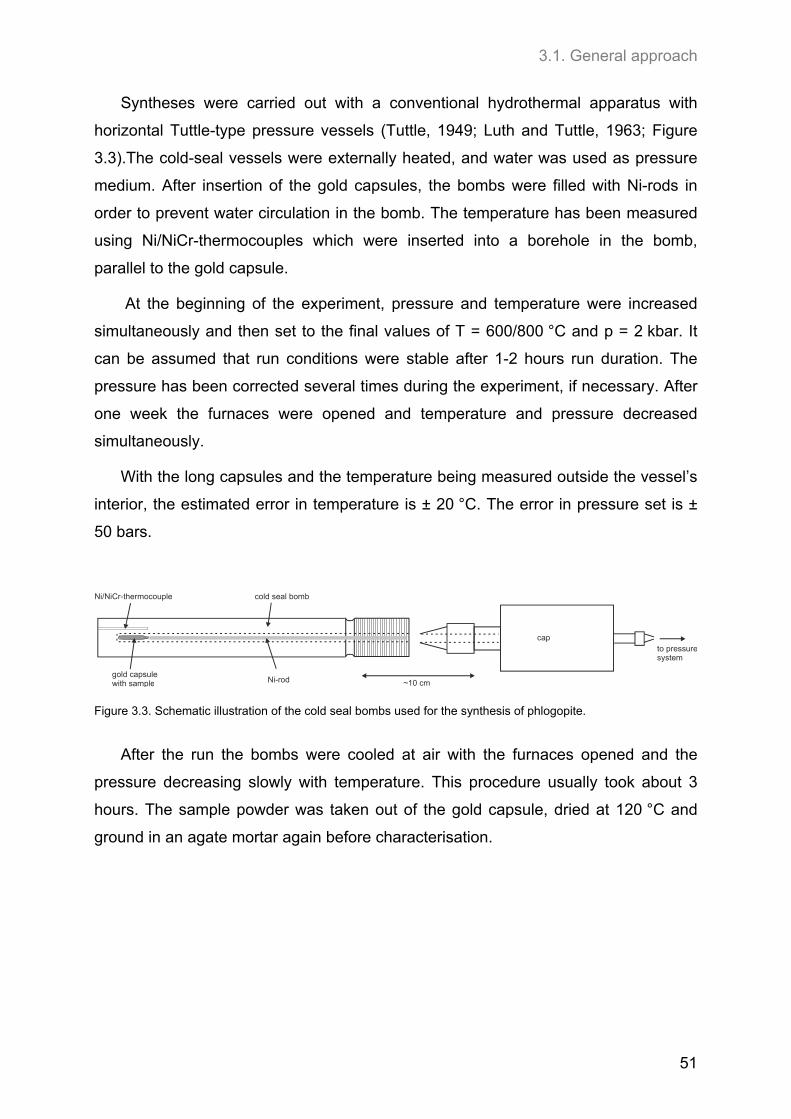
3.1. General approach
51
Syntheses were carried out with a conventional hydrothermal apparatus with
horizontal Tuttle-type pressure vessels (Tuttle, 1949; Luth and Tuttle, 1963; Figure
3.3).The cold-seal vessels were externally heated, and water was used as pressure
medium. After insertion of the gold capsules, the bombs were filled with Ni-rods in
order to prevent water circulation in the bomb. The temperature has been measured
using Ni/NiCr-thermocouples which were inserted into a borehole in the bomb,
parallel to the gold capsule.
At the beginning of the experiment, pressure and temperature were increased
simultaneously and then set to the final values of T = 600/800 °C and p = 2 kbar. It
can be assumed that run conditions were stable after 1-2 hours run duration. The
pressure has been corrected several times during the experiment, if necessary. After
one week the furnaces were opened and temperature and pressure decreased
simultaneously.
With the long capsules and the temperature being measured outside the vessel’s
interior, the estimated error in temperature is ± 20 °C. The error in pressure set is ±
50 bars.
Ni/NiCr-thermocouple
gold capsulewith sample Ni-rod
cold seal bomb
to pressuresystem
~10 cm
cap
Figure 3.3. Schematic illustration of the cold seal bombs used for the synthesis of phlogopite.
After the run the bombs were cooled at air with the furnaces opened and the
pressure decreasing slowly with temperature. This procedure usually took about 3
hours. The sample powder was taken out of the gold capsule, dried at 120 °C and
ground in an agate mortar again before characterisation.
3. Experimental and analytical methods
52
3.3. NMR spectroscopic experiments
The majority of NMR experiments have been performed at room temperature on
a Bruker ASX 400 NMR spectrometer using a 89 mm wide-bore magnet with a field-
strength of 9.34 T. The obtained spectra have been fitted using the DMFIT software
developed by Dr. Dominique Massiot (Massiot et al., 2002).
High field MQMAS experiments have been performed by Dr. Ulrike Werner-
Zwanziger, Dr. Josef Zwanziger, and Dr. Michael Fechtelkord at a field strength of
16.45 T on a Bruker Avance NMR spectrometer at Dalhousie University, Halifax, NS,
Canada. Additional experiments have been performed by the group of Dr. Jürgen
Haase on a Bruker Avance NMR spectrometer at a field strength of 17.6 T at the
Department of Interface Physics and the Magnet-Resonanz-Zentrum of the University
of Leipzig.
3.3.1. 1H MAS NMR experiments
1H MAS NMR experiments have been performed at 400.13 MHz with a standard
Bruker 4 mm MAS probe at rotation frequencies of 12.5 kHz. Liquid tetramethylsilane
(TMS) was used as an external standard. A pulse length of 2 µs and a recycle delay
of 10 s were used, and 128 scans were accumulated. The spectral width was
125 kHz. After the measurements, a spectrum of the rotor without sample has been
recorded and subtracted from the original spectrum to eliminate the broad signal
resulting from protons in the rotor and the rotor cap.
3.3.2. 29Si MAS NMR experiments
The 29Si MAS NMR spectra were recorded at an operating frequency of
79.49 MHz with liquid tetramethylsilane (TMS) as external standard. A standard
Bruker 7 mm MAS probe has been used with spinning frequencies of 4 kHz, a single
pulse duration of 4 µs, a recycle delay of 10 s, and a spectral width of 50 kHz. Some
experiments have been repeated with a recycle delay up to 120 s, but no change in
signal intensity has been observed. A number of 7000 to 25000 scans have been
accumulated.
3.3.3. 27Al MAS NMR and 27Al 3QMAS NMR experiments
The 27Al MAS NMR experiments have been performed at 104.268 MHz with a
standard Bruker 4 mm MAS probe at rotation frequencies of 12.5 kHz. Single pulse
3.3. NMR spectroscopic experiments
53
duration was 0.6 µs to ensure homogeneous excitation of the central as well as all
satellite transitions. A recycle delay of 0.1 s was used and a number of 25000 scans
have been accumulated. The spectral width was 125 kHz, and an aqueous solution
of AlCl3 has been used as an external standard.
For the 27Al 3QMAS spectra recorded at 9.34 T, the spectral width has been
reduced to 50 kHz in the F2-dimension. A recycle delay of 0.2 s has been used.
Pulse lengths were 2.5 and 2.0 µs for the excitation and the conversion pulse,
respectively. An initial delay between the two pulses of 3 µs has been chosen which
has then been increased stepwise by 20 µs in a number of 56 or 128 experiments.
For each experiment a number 400 to 1000 scans have been accumulated, and
before each scan a number of 12 dummy scans were performed to ensure complete
saturation. F1-axis labelling has been done following the C3a-convention (Amoureux
and Fernandez, 1998; Millot and Man, 2002).
The experiments at 16.45 T have been recorded at a transmitter frequency of
182.47 MHz, a H-F/C-P probe head and 2.5 mm rotors. Potassium alaun has been
used as a secondary reference with a chemical shift of -0.033 ppm. The 1D 27Al MAS
NMR spectra were acquired with a nominally 9° pulse at 95 kHz rf field strength at
10.0 and 22.0 kHz sample spinning with a repetition time of 500 ms. The 27Al 3QMAS
spectra have been recorded with a three pulse sequence, where the last echo pulse
and its timings allowed for split-t1 mode and whole echo acquisition. The excitation
pulse length was 3.6 µs, the conversion pulse length was 1.2 µs. The selective echo
pulse lasted for 11.0 µs, and a recycle delay of 1s has been chosen. 672 - 2016
scans have been accumulated for each of the 80 to 100 slices. The F1 axis was
scaled and referenced according to the Cz-convention (Millot and Man, 2002) but
inverted due to the echo acquisition.
Additional high-field 27Al MAS NMR experiments have been performed at 17.6 T.
The transmitter frequency was 195.28 MHz, and a 2.5 mm MAS probe has been
used at spinning rates of 25 kHz. The single pulse duration and recycle delay were
0.4 µs and 0.5 s, respectively. 400 scans have been accumulated for each
experiment.
3.3.4. 19F MAS NMR experiments
For 19F MAS NMR experiments a Bruker 4 mm MAS probe has been used. 300
scans were accumulated at a frequency of 376.46 MHz and rotation frequencies of
3. Experimental and analytical methods
54
12.5 kHz. Single pulse duration was 2 µs, and a spectral width of 125 kHz and a
recycle delay of 10 s have been used. As external reference a liquid p-C6H4F2 sample
has been measured, and the frequency with highest signal intensity has been set to
-120 ppm with respect to liquid CFCl3.
3.3.5. 17O MAS and 17O MQMAS NMR experiments
The 17O MAS NMR experiments were performed at a frequency of 54.25 MHz
and a sample spinning speed of 12.5 kHz using a 4 mm Bruker MAS probe. De-
ionised water enriched with 28 at% 17O has been used as reference.
For the 1D 17O NMR experiments, a short pulse length of 0.6 µs has been chosen
in order to ensure equal excitation of all possible transitions, and the recycle delay
has been set to 1 s. A number of 50000 to 70000 scans have been accumulated. The
spectral width was 50 kHz.
For the 17O 3QMAS experiments at 9.34 T, excitation and conversion pulse
lengths of 22.5 µs and 9.5 µs have been used, respectively, and the recycle delay
was 2 s. 900 scans have been accumulated for each experiment, and 128
experiments have been recorded for each spectrum. The initial delay between the
excitation and the reconversion pulse was 3 µs and the delay has been increased in
steps of 40 µs. The F1-axis has been labelled according to the C3a-convention
(Amoureux and Ferandez, 1998; Millot and Man, 2002).
For the 17O 3QMAS NMR experiments performed at 16.45 T, a H-F/C-P probe
head and 4 mm rotors have been used, and the chemical shift was referenced
against water. The 1D 17O MAS NMR spectra have been recorded with pulse length
of 1.6 µs, a repetition time of 1s and spinning speeds of 10.0 and 22.0 kHz. For the 17O MQMAS NMR experiments, excitation and conversion pulse lengths of 10 µs and
2 µs, respectively, have been used. A third echo pulse of 12.8 µs was used for split-
1d mode and whole echo acquisition. For the sample with nominal enrichment of 17O
of 80.5 to 89 at%, a recycle delay of 2s has been chosen, and 192 scans were
accumulated for each of the 128 experiments. The recycle delay for the sample with 17O nominal enrichment of 28 at% was 1 s, and 7200 scans have been acquired for
36 experiments. The F1 axis was scaled according to the Cz-convention (Millot and
Man, 2002) and inverted due to the echo acquisition.
3.3. NMR spectroscopic experiments
55
3.3.6. {1H} → 29Si CPMAS/HETCOR experiments
The {1H} → 29Si CPMAS/HETCOR NMR spectra were recorded at transmitter
frequencies of 400.13 MHz and 79.49 MHz for 1H and 29Si, respectively. A standard
7 mm Bruker MAS probe has been used at rotation frequencies of 4 kHz. The 90°
pulse length for 1H was 7.6 µs (rf(1H) = rf(
29Si) = 33 kHz), and the recycle delay was
5 s. A number of 360 – 400 scans were accumulated for each experiment, and
tetramethylsilane was used as a reference for the chemical shift of both 1H and29Si.
For the CPMAS contact-time dependent experiments contact times of 0.1 to 120 ms
have been chosen. For the 2D cross polarisation (HETCOR) experiment a contact
time of 2 ms and a t1-increment of 20 µs have been used.
3.3.7. {19F} → 29Si CPMAS/HETCOR experiments
The transmitter frequencies for the {19F} → 29Si CPMAS/HETCOR NMR
experiments have been 79.49 MHz and 376.45 MHz for 29Si and 19F, respectively.
Sample spinning speed was 5.8 kHz in a standard 7 mm Bruker MAS probe.
Tetramethylsilane (TMS) and p-C6H4F2 (δ = -120 ppm) have been used as reference
for 29Si and 19F, respectively. The 90° pulse length for 19F was 5.6 µs (rf(19F) =
rf(29Si) = 45 kHz), and a recycle delay of 5 s has been used. For the 1D CPMAS
contact-time dependent experiments contact times of 0.1 to 120 ms have been
chosen. In the 2D CPMAS HETCOR experiment a contact time of 5 ms and a t1-
increment of 10 µs have been used. A number of 64 experiments have been
performed for each spectrum.
3. Experimental and analytical methods
56
3.4. X-ray diffraction experiments
Powder X-ray diffraction (XRD) patterns have been recorded in collaboration with
the group of Prof. Dr. Tonči Balić-Žunić on a Bruker D8 powder diffractometer at the
University of Copenhagen. The samples have been measured in Bragg-Brentano
geometry with Cu Kα1 radiation (λ = 1.5406 Å, 45 kV, 40 mA) and a Ge(111)-crystal
as primary monochromator. A 2θ range of 2 to 70° has been covered, the step size
was 0.02 °2θ and the counting time was 1 second per step. Samples were prepared
on flat Si-sample holders providing a sample thickness of 0.5 mm.
Additional measurements have been performed on a Philips PW1830/40 powder
diffractometer at the Ruhr-Universität Bochum using Cu Kα radiation (λ = 1.5418 Å,
45 kV, 30 mA) and a secondary monochromator. Intensities have been recorded
between 5 and 60 °2θ with a step size of 0.02 °2θ and a counting rate of 2 seconds
per step. Flat glass sample holders have been used for the experiments.
More detailed measurements have been recorded on a Siemens D5000
difractometer in collaboration with Dr. Bernd Marler at the Ruhr-Universität Bochum.
Cu Kα1 radiation (λ = 1.5406 Å, 45 kV, 35 mA) and a Ge(111)-crystal as primary
monochromator have been used. Only a 2θ range of 22-28° has been investigated
because this was the part of the pattern in which satellite reflections had been
observed before. The step size was 0.0078 °2θ, and a position sensitive detector
(PSD) with an opening angle of 6 °2θ has been used. Samples have been prepared
in glass capillaries with 0.03 mm diameter. Temperature-dependent measurements
have been carried out by heating the sample with hot air up to about 500 °C.
3.5. Scanning electron microscopy
57
3.5. Scanning electron microscopy
Scanning electron microscopy (SEM) has been performed to investigate the
crystal shapes and sizes of phlogopite and impurity phases using a LEO Model 1530
(ZEISS SMT) field emission gun scanning electron microscope with an acceleration
voltage of 20 kV.
For the investigations small amounts of sample powder have been brought on
aluminium mounts coated with adhesive conducting carbon tabs. The sample has
been coated with gold and brought into a vacuum chamber, and the SEM images
have been recorded by scanning the sample surface with the high-energy electron
beam in a raster-scan pattern.
When the electron beam hits the sample surface, a number of radiation signals
are generated including secondary electrons (SE) and X-rays. For a detailed analysis
of the surface structure of a sample, the secondary electrons are detected which
result from an ionisation of the k-orbitals of atoms at or near the sample surface and
are usually of low energy (< 50 eV). The number of secondary electrons produced
depends on the angle between the electron beam and the surface, making it possible
to generate images with a three-dimensional appearance.
The X-rays generated may be analysed using an energy dispersive X-ray
detector system (EDX) which allows for the detection of all emitted wavelengths at
once. As these X-rays are element specific, the chemical composition of a small part
of the sample can be determined. However, the chemical data obtained in this way
are of rather low quality compared to electron microprobe analyses because of the
rough surface of the samples.

4.1. General description of samples
59
4. Results and discussion
4.1. General description of samples
A number of 64 phlogopite samples has been prepared having a nominal
composition of
K (Mg3-xAlx) (Al1+xSi3-xO10) (OH)y F(2-y) (4.1)
with 0.0 ≤ xnom ≤ 1.6 and 0.0 ≤ y ≤ 2.0. Synthesis runs were performed at
temperatures of 600 °C and pressures of 2 kbar and a run duration of one week. As
expected, the obtained powder samples consist mainly of phlogopite (at least 70 %).
The phlogopite crystals exhibit a plate-like shape typical for the mica minerals
with their cleavage along the (001)-plane (see scanning electron microscope (SEM)
images in Figure 4.1). The crystal size is very small, ranging from 0.2 to 1 µm in
diameter. The impurity phases could not be identified directly in these images.
However, analyses of the several µm large clusters shown in Figure 4.1a taken with
an energy-dispersive X-ray (EDX) detector indicate that these are actually crystals of
several impurity phases with much smaller phlogopite platelets sticking to them. The
samples have been used for NMR experiments before taking SEM images so that
pressing the sample into the rotors may have led to this effect.
The low crystallinity of the samples leads to broad NMR signals and XRD peaks.
This is especially a problem for the determination of the chemical composition of the
phlogopites. Electron-microprobe (EMP) analysis was not possible due to the small
crystal size, so that 29Si MAS NMR spectroscopy was the only way to estimate the
real Al-content incorporated into the phlogopite structure.
Several impurity phases have been identified by the corresponding signals in the
NMR spectra and in the powder XRD patterns (see also Chapter 4.7). A list of
phases determined by XRD is given in Table 4.1. Nearly pure phlogopite formed at
low Al-contents (x < 0.2), and the amount of phlogopite in the sample steadily
decreases with increasing amount of Al in the initial oxide mixture. The minimum
fraction of phlogopite determined by XRD was about 70% for Al-rich samples
(0.8 ≤ xnom ≤ 1.6), but this need not necessarily be the true amount of phlogopite in
the mixture. Only crystalline phases will appear in the XRD patterns whereas,
amorphous phases cannot be detected this way.
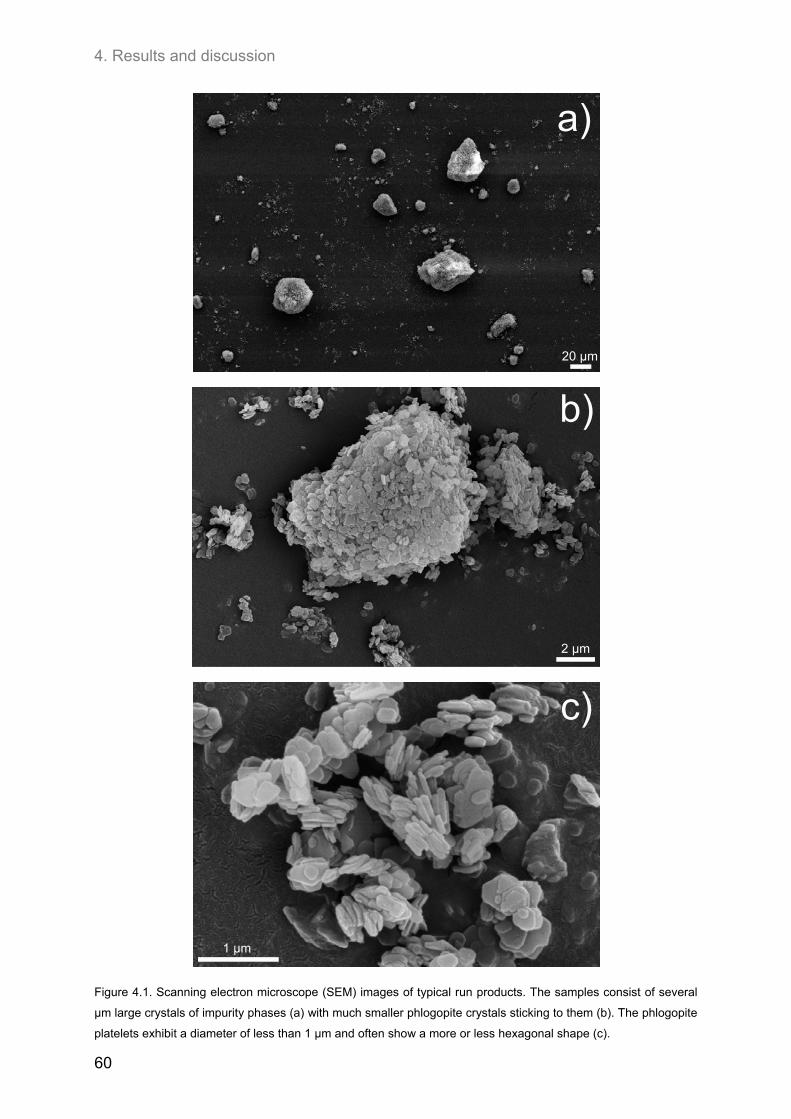
4. Results and discussion
60
2 µm
a)
b)
c)
Figure 4.1. Scanning electron microscope (SEM) images of typical run products. The samples consist of several
µm large crystals of impurity phases (a) with much smaller phlogopite crystals sticking to them (b). The phlogopite
platelets exhibit a diameter of less than 1 µm and often show a more or less hexagonal shape (c).
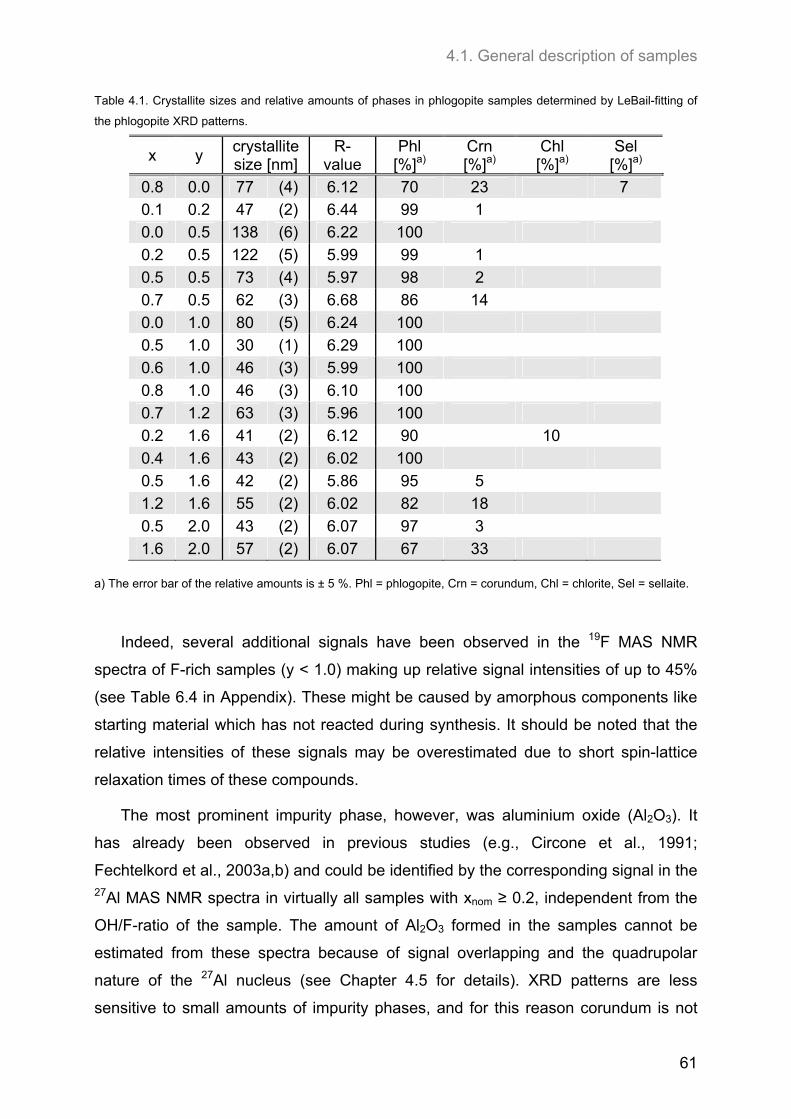
4.1. General description of samples
61
Table 4.1. Crystallite sizes and relative amounts of phases in phlogopite samples determined by LeBail-fitting of
the phlogopite XRD patterns.
x y crystallite size [nm]
R-value
Phl [%]a)
Crn [%]a)
Chl [%]a)
Sel [%]a)
0.8 0.0 77 (4) 6.12 70 23 7
0.1 0.2 47 (2) 6.44 99 1
0.0 0.5 138 (6) 6.22 100
0.2 0.5 122 (5) 5.99 99 1
0.5 0.5 73 (4) 5.97 98 2
0.7 0.5 62 (3) 6.68 86 14
0.0 1.0 80 (5) 6.24 100
0.5 1.0 30 (1) 6.29 100
0.6 1.0 46 (3) 5.99 100
0.8 1.0 46 (3) 6.10 100
0.7 1.2 63 (3) 5.96 100
0.2 1.6 41 (2) 6.12 90 10
0.4 1.6 43 (2) 6.02 100
0.5 1.6 42 (2) 5.86 95 5
1.2 1.6 55 (2) 6.02 82 18
0.5 2.0 43 (2) 6.07 97 3
1.6 2.0 57 (2) 6.07 67 33
a) The error bar of the relative amounts is ± 5 %. Phl = phlogopite, Crn = corundum, Chl = chlorite, Sel = sellaite.
Indeed, several additional signals have been observed in the 19F MAS NMR
spectra of F-rich samples (y < 1.0) making up relative signal intensities of up to 45%
(see Table 6.4 in Appendix). These might be caused by amorphous components like
starting material which has not reacted during synthesis. It should be noted that the
relative intensities of these signals may be overestimated due to short spin-lattice
relaxation times of these compounds.
The most prominent impurity phase, however, was aluminium oxide (Al2O3). It
has already been observed in previous studies (e.g., Circone et al., 1991;
Fechtelkord et al., 2003a,b) and could be identified by the corresponding signal in the 27Al MAS NMR spectra in virtually all samples with xnom ≥ 0.2, independent from the
OH/F-ratio of the sample. The amount of Al2O3 formed in the samples cannot be
estimated from these spectra because of signal overlapping and the quadrupolar
nature of the 27Al nucleus (see Chapter 4.5 for details). XRD patterns are less
sensitive to small amounts of impurity phases, and for this reason corundum is not
4. Results and discussion
62
mentioned for most of the samples listed in Table 4.1. Nevertheless, the amount of
Al2O3 can roughly be estimated by analyzing the patterns of high-Al samples. The
most Al-rich sample (xnom = 1.6, y = 2.0) contains about 30% Al2O3, for samples
containing slightly less Al this is in the range of 15 – 25%. Moreover, 27Al MAS and
MQMAS spectra revealed that Al2O3 has not completely crystallised as corundum (α-
Al2O3) as has been observed by Fechtelkord et al. (2003a,b), but is a probably some
disordered pre-phase resulting from lower synthesis temperatures.
Fechtelkord et al. (2003a,b) also reported the formation of potassium aluminium
hexafluoride, K3AlF6*0.5H2O, for their F-rich (y = 0.5) samples synthesised at 800 °C.
This is confirmed by the samples investigated in the frame of this study in which
potassium aluminium hexafluoride is present for all samples of y = 0.5 and xnom ≥ 0.6
(Table 6.4 in Appendix). However, this impurity phase has also been observed in
samples of intermediate (y = 1.0, xnom = 0.7) and very low (y = 1.8, xnom ≥ 1.2)
F-contents. In the latter, it makes up about 30% of the whole signal intensity in the 19F MAS NMR spectrum. Although this value is highly overestimated due to the fast
spin-lattice relaxation of the AlF63- complex, considerable amounts of potassium
aluminium hexafluoride must be present in these samples. A corresponding signal in
the 27Al MAS NMR spectra was difficult to observe due to signal overlapping.
Compared to the samples synthesised at 800 °C, the amount of potassium
aluminium hexafluoride formed in these samples is rather low (Chapter 4.3.3.2).
A second F-rich impurity phase is MgF2. It could be identified in the 19F NMR
spectra and in the XRD pattern of the sample with x = 0.8 and y = 0.0.
Some of the samples still contained ammonia, which indicates that not all of the
nitrogen has been removed from the gel before synthesis. However, the maximum
relative intensity of this signal in the 1H MAS NMR spectra was 2%, so it can be
assumed that this does not influence the phlogopite synthesis.
Kalsilite (KAlSiO4) has been observed by Fechtelkord et al. (2003a,b), but this
phase was never present in the samples synthesised at 600 °C. No corresponding
signal was present in the tetrahedral region in the 27Al MAS NMR spectra, and that
has been checked with 27Al MQMAS NMR experiments. These authors used KF
instead of NH4F for adding fluorine to the initial gel mixture which could have lead to
a formation of the K-rich impurity phase kalsilite. However, kalsilite was also present

4.1. General description of samples
63
in two samples synthesised in the framework of this thesis but at 800 °C. It can be
concluded that this impurity phase only forms at elevated temperatures.
4. Results and discussion
64
4.2. Ordering of cations in the tetrahedral sheets of phlogopite
4.2.1. Samples of intermediate to low F-contents (1.0 ≤ y ≤1.8)
In 29Si MAS NMR experiments the local environment of Si-atoms and the
ordering of Si/[4]Al in the tetrahedral sheet can be probed. Moreover, 29Si MAS NMR
spectroscopy is the most precise method to determine the amount of Al incorporated
into the structure during synthesis.
The 29Si MAS NMR spectra of the phlogopite samples show up to five signals
(Figure 4.2). Four of them, positioned at at -80, -83, -87, and -90 ppm, result from
different Si environments in the phlogopite structure (Weiss et al., 1987). An
additional signal due to an impurity phase has been found in the 29Si MAS NMR
spectra at about -94 to -95 ppm for some of the samples. This has already been
reported by Circone et al. (1991) who suggested that it should result from some K-
deficient clay-like layers in the phlogopites. This signal was only observed as a small
shoulder but in some rare cases it showed up to 10% relative signal intensity. It has
only been observed for low Al-contents (x ≤ 0.6), but no correlation between its
occurrence and the fluorine content of the samples has been found. It could be due
to clinochlore which was identified in the XRD patterns of some samples. In any
case, this additional signal could be easily distinguished from those resulting from
phlogopite and did not disturb during analysis of the data.
Figure 4.2 shows a comparison of 29Si MAS NMR spectra of phlogopites with
different F- and Al-contents. The spectra of phlogopites of different F-contents but of
same nominal Al-content xnom do not differ much. However, a change of signal
intensities for constant F-content but increasing Al-content can clearly be seen. At
low Al-contents the Si-Si2Al-signal shows the highest signal intensity, and the ratio of
Si-SiAl2 : Si-Si2Al : Si-Si3 is about 25:50:25. With increasing Al-content, the intensity
of the Si-SiAl2-signal increases until this signal becomes equal to or slightly higher
than the Si-Si2Al signal. At the same time, a fourth signal corresponding to the Si-Al3
environment rises in intensity. All observations indicate that no kind of tetrahedral
ordering is present in these structures except for a short-range ordering controlled by
avoidance of Al-O-Al linkages.
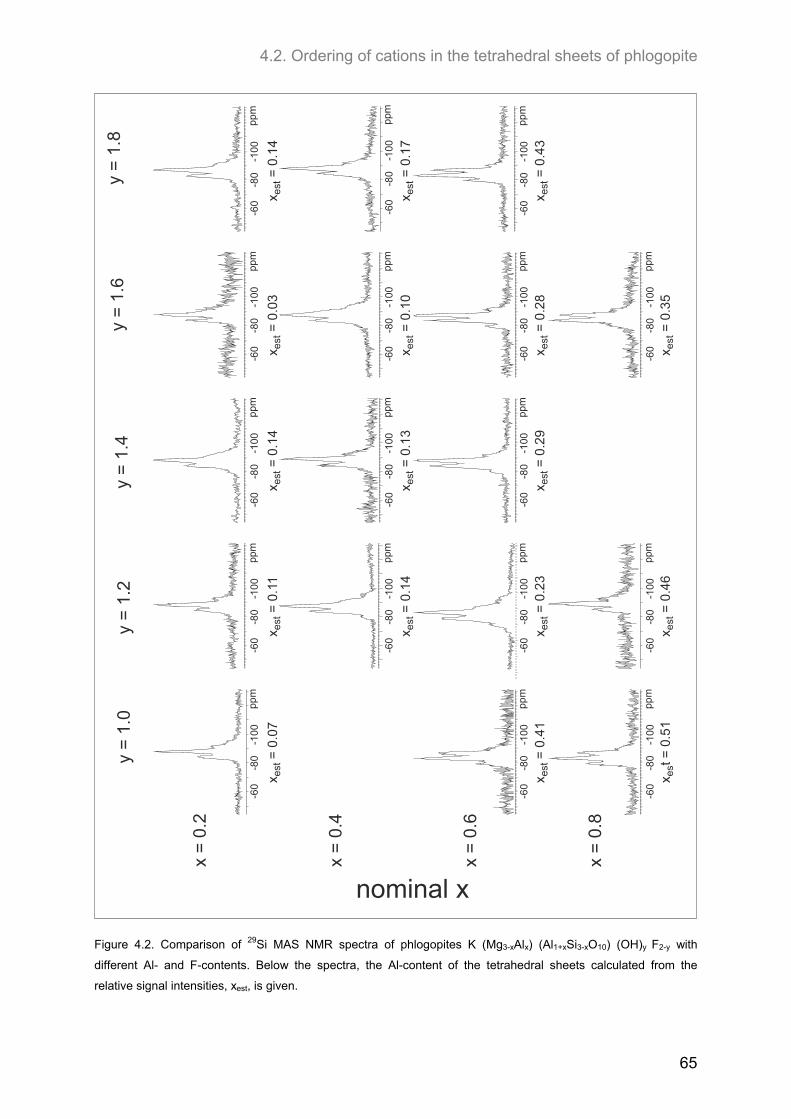
4.2. Ordering of cations in the tetrahedral sheets of phlogopite
65
x =
0.2
x =
0.4
x =
0.6
x =
0.8
y =
1.0
y =
1.2
y =
1.4
y =
1.6
y =
1.8
x =
0.0
7es
tx
= 0
.11
est
x =
0.1
4e
stx
= 0
.03
est
x =
0.1
4e
st
x =
0.1
4e
stx
= 0
.13
est
x =
0.1
0e
stx
= 0
.17
est
x =
0.4
1es
tx
= 0
.23
est
x =
0.2
9e
stx
= 0
.28
est
x =
0.4
3e
st
xt =
0.5
1es
x =
0.4
6e
stx
= 0
.35
est
-80
-10
0-6
0pp
m-8
0-1
00
-60
ppm
-80
-100
-60
ppm
-80
-10
0-6
0pp
m-8
0-1
00-6
0p
pm
-80
-10
0-6
0pp
m-8
0-1
00-6
0p
pm-8
0-1
00
-60
ppm
-80
-10
0-6
0p
pm
-80
-10
0-6
0pp
m-8
0-1
00
-60
ppm
-80
-100
-60
ppm
-80
-10
0-6
0pp
m-8
0-1
00-6
0p
pm
-80
-10
0-6
0pp
m-8
0-1
00
-60
ppm
-80
-10
0-6
0pp
m
nominal x
Figure 4.2. Comparison of 29Si MAS NMR spectra of phlogopites K (Mg3-xAlx) (Al1+xSi3-xO10) (OH)y F2-y with
different Al- and F-contents. Below the spectra, the Al-content of the tetrahedral sheets calculated from the
relative signal intensities, xest, is given.
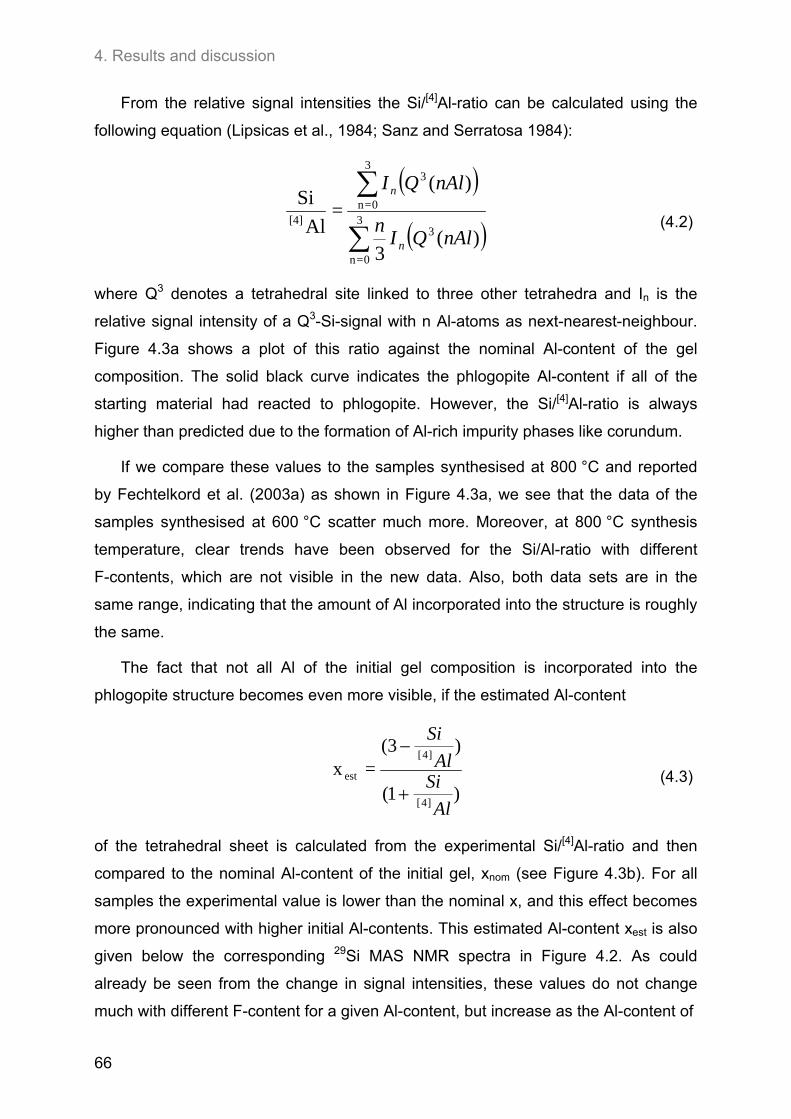
4. Results and discussion
66
From the relative signal intensities the Si/[4]Al-ratio can be calculated using the
following equation (Lipsicas et al., 1984; Sanz and Serratosa 1984):
3
0=n
3
3
0=n
3
[4]
)(3
)( =
Al
Si
nAlQIn
nAlQI
n
n
(4.2)
where Q3 denotes a tetrahedral site linked to three other tetrahedra and In is the
relative signal intensity of a Q3-Si-signal with n Al-atoms as next-nearest-neighbour.
Figure 4.3a shows a plot of this ratio against the nominal Al-content of the gel
composition. The solid black curve indicates the phlogopite Al-content if all of the
starting material had reacted to phlogopite. However, the Si/[4]Al-ratio is always
higher than predicted due to the formation of Al-rich impurity phases like corundum.
If we compare these values to the samples synthesised at 800 °C and reported
by Fechtelkord et al. (2003a) as shown in Figure 4.3a, we see that the data of the
samples synthesised at 600 °C scatter much more. Moreover, at 800 °C synthesis
temperature, clear trends have been observed for the Si/Al-ratio with different
F-contents, which are not visible in the new data. Also, both data sets are in the
same range, indicating that the amount of Al incorporated into the structure is roughly
the same.
The fact that not all Al of the initial gel composition is incorporated into the
phlogopite structure becomes even more visible, if the estimated Al-content
)1(
)3( =x
]4[
]4[
est
Al
SiAl
Si
(4.3)
of the tetrahedral sheet is calculated from the experimental Si/[4]Al-ratio and then
compared to the nominal Al-content of the initial gel, xnom (see Figure 4.3b). For all
samples the experimental value is lower than the nominal x, and this effect becomes
more pronounced with higher initial Al-contents. This estimated Al-content xest is also
given below the corresponding 29Si MAS NMR spectra in Figure 4.2. As could
already be seen from the change in signal intensities, these values do not change
much with different F-content for a given Al-content, but increase as the Al-content of
4.2. Ordering of cations in the tetrahedral sheets of phlogopite
67
uncertainty:(this study)
uncertainty:
Fechtelkord et al. (2003a)
a)
b)
Figure 4.3. a) The Si/[4]Al-ratio calculated from the relative signal intensities in the 29Si MAS NMR spectra plotted
against the nominal Al-content of the initial oxide mixture. The solid black curve indicates the phlogopite
composition if all starting material had reacted to phlogopite. b) Plot of the experimentally derived (additional) Al-
content of the tetrahedral sheets of the phlogopites against the Al-content of the initial gel mixture. The black line
indicates a complete reaction of the starting material to phlogopite.
the nominal gel composition increases. The highest Al-content of the initial gel
compositions was xnom = 0.8, however, in these samples the highest estimated Al-
content xest was far lower with xest ~ 0.45.
4. Results and discussion
68
4.2.2. Hydroxyl-phlogopites and Al- and OH-rich phlogopites
(0.8 ≤ x ≤ 1.6; 1.6 ≤ y ≤2.0)
A number of pure hydroxyl-phlogopite samples have been prepared to allow for a
comparison of F-free and F-containing compositions. Moreover, to investigate the
maximum amount of Al-incorporation into the phlogopite structure at synthesis
conditions of 600 °C and 2 kbar, a few samples with high nominal Al-content
(xnom = 1.0, 1.2, and 1.6) have been prepared. These only contain low amounts of
fluorine (y = 1.6, 1.8, and 2.0) as it can be expected that more F-rich compositions
will not be able to incorporate more Al anyway.
Theoretically, the limit for an incorporation of Al into the phlogopite structure is
x = 1.0 because then a ratio of Si/[4]Al of 1:1 is reached. Incorporating further Al into
the tetrahedral sheets would force Al-atoms to occupy neighbouring tetrahedra which
is expected to be highly energetically unfavourable. However, values of xnom higher
than 1.0 have been chosen for the preparation of gels because not all of the Al
present in the initial gel composition is incorporated into the phlogopite structure, as
has been discussed in Chapter 4.2.1 for samples of lower Al-contents.
The 29Si MAS NMR spectra of the Al-rich phlogopites shown in Figure 4.4 exhibit
the same signals as have been observed for low Al-phlogopites: The Si-Al3, the
Si-SiAl2, the Si-Si2Al, and the Si-Si3 signal at -80, -83, -87, and -90 ppm, respectively.
At Al-contents lower than xest = 0.6 the Si-SiAl2 and the Si-Si2Al signals dominate, but
at higher Al-contents the Si-Al3 signal shows the highest signal intensity. This
indicates that long-range ordering is established, with Si and Al occupying tetrahedral
sites alternately. This kind of ordering also leads to a narrowing of the Si-SiAl3 signal
from 2.7 ppm to 1.3 ppm because the Si environment becomes more uniform
throughout the structure (see Table 6.2 in the Appendix). These results are in good
agreement with the findings of Circone et al. (1991) who reported the same for
hydroxyl-phlogopites coming close to Si/[4]Al-ratios of 1:1.
Still, a higher Al-content of the initial gel composition also means a higher
incorporation of this element into the phlogopite structure. However, a saturation
effect could be observed: For y = 1.8, a maximum value of xest = 0.71 has been
achieved for xnom = 1.2. For higher xnom of 1.6, the value is nearly the same with
xest = 0.68.
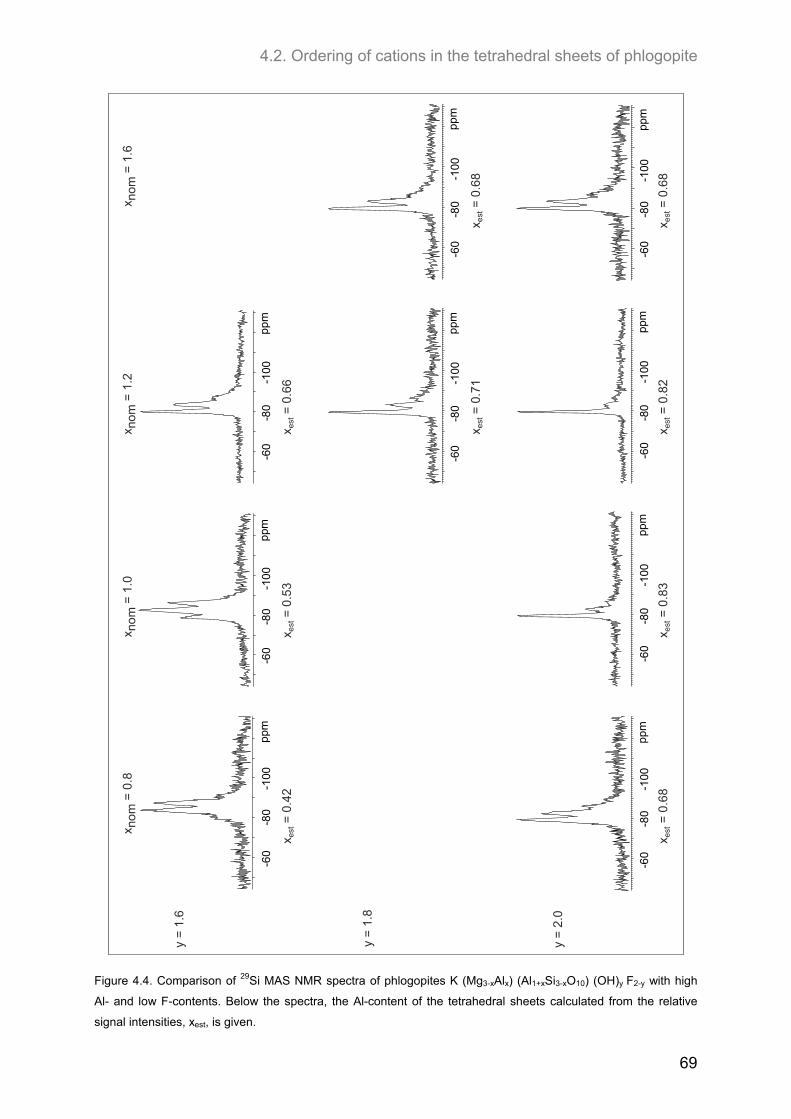
4.2. Ordering of cations in the tetrahedral sheets of phlogopite
69
x no
m =
1.0
x nom
= 1
.2x n
om =
1.6
-60
-80
-100
ppm
-60
-80
-100
ppm
y =
2.0
y =
1.6
-60
-80
-100
ppm
-60
-80
-100
ppm
-60
-80
-100
ppm
x nom
= 0
.8
-60
-80
-100
ppm
-60
-80
-100
ppm
x =
0.8
3e
stx
= 0
.68
est
x =
0.8
2es
tx
= 0
.68
est
x =
0.4
2es
tx
= 0
.53
est
x =
0.6
6es
t
y =
1.8
x =
0.7
1es
tx
= 0
.68
est
-60
-80
-100
ppm
-60
-80
-100
ppm
Figure 4.4. Comparison of 29Si MAS NMR spectra of phlogopites K (Mg3-xAlx) (Al1+xSi3-xO10) (OH)y F2-y with high
Al- and low F-contents. Below the spectra, the Al-content of the tetrahedral sheets calculated from the relative
signal intensities, xest, is given.
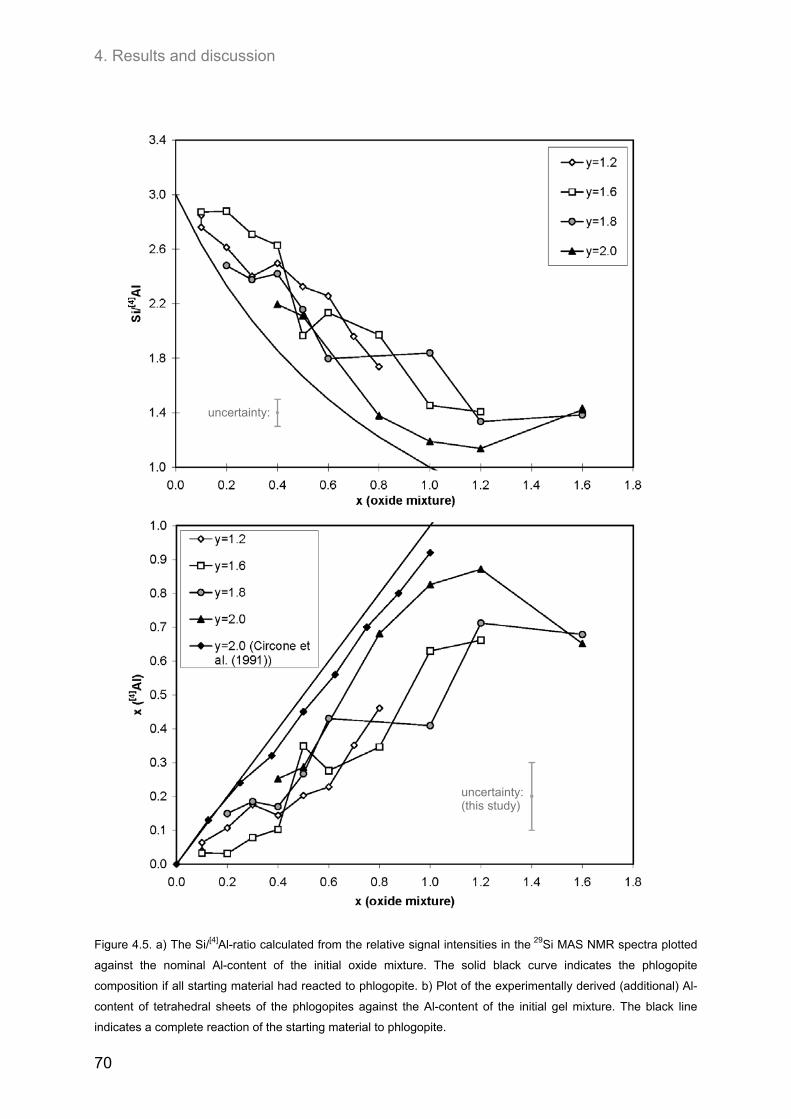
4. Results and discussion
70
uncertainty:(this study)
uncertainty:
Figure 4.5. a) The Si/[4]Al-ratio calculated from the relative signal intensities in the 29Si MAS NMR spectra plotted
against the nominal Al-content of the initial oxide mixture. The solid black curve indicates the phlogopite
composition if all starting material had reacted to phlogopite. b) Plot of the experimentally derived (additional) Al-
content of tetrahedral sheets of the phlogopites against the Al-content of the initial gel mixture. The black line
indicates a complete reaction of the starting material to phlogopite.
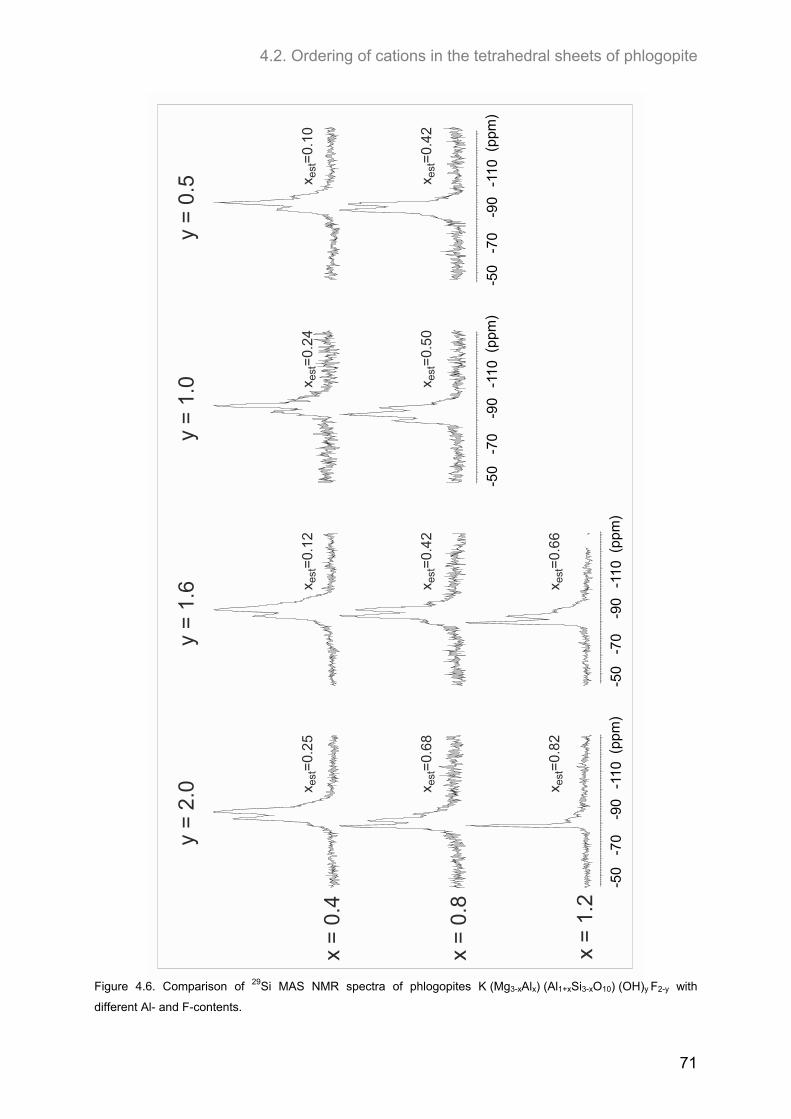
4.2. Ordering of cations in the tetrahedral sheets of phlogopite
71
y =
2.0
y =
1.6
y =
1.0
x =
0.8
x =
1.2
-50
-70
-90
-11
0(p
pm)
-50
-70
-90
-11
0(p
pm)
-50
-70
-90
-11
0(p
pm)
x =
0.4
-50
-70
-90
-110
(ppm
)
y =
0.5
x=
0.2
5es
t
x=
0.6
8es
t
x=
0.8
2es
t
x=
0.1
2es
t
x=
0.4
2es
t
x=
0.6
6es
t
x=
0.2
4es
t
x=
0.5
0es
t
x=
0.1
0es
t
x=
0.4
2es
t
Figure 4.6. Comparison of 29Si MAS NMR spectra of phlogopites K (Mg3-xAlx) (Al1+xSi3-xO10) (OH)y F2-y with
different Al- and F-contents.
4. Results and discussion
72
Higher Al-contents up to xest = 0.83 have been reached using F-free starting
materials (y = 2.0). In this case the incorporation of Al is closer to the stoichiometric
composition, especially at higher Al-contents (Figure 4.5). The maximum value has
been reached for a nominal xnom of 1.0 and 1.2. For xnom = 1.6, the estimated
Al-content is lowered again, indicating a preferred formation of other phases than
phlogopite at such high Al-contents of the F-free oxide mixture.
The maximum Al-contents found in this study are still lower than the highest value
reached so far, xest = 0.92, reported by Circone et al. (1991). However, these authors
had slightly lower synthesis temperatures of 400-600 °C and higher pressures of 5
kbar.
If one compares the 29Si MAS NMR spectra of F-free phlogopites with those of
phlogopites of different F-contents, as shown in Figure 4.6, it becomes obvious that
the spectra and the amount of Al incorporated into the structure do not change much
with increasing F-content. In contrast, the difference between pure OH-phlogopites
(y = 2.0) and those containing only little F (y = 1.8) is much larger than the difference
between phlogopites of varying F-contents. Therefore, it can be concluded that the
mere presence of F in the mixture is much more important than the exact ratio of
OH/F. As soon as the system contains F, the ability of the phlogopites to incorporate
Al is lowered drastically.
4.2.3. Samples of high F-contents (y < 1.0)
In addition to the samples discussed before, a number of phlogopites with higher
F-contents, i.e., y = 0.8 and y = 0.5 have been prepared. Moreover, two very F-rich
samples with compositions xnom = 0.1, y = 0.2 and xnom = 0.8, y = 0.0, respectively,
have been synthesised and analysed.
The 29Si NMR spectra of these F-rich samples are shown in Figure 4.7. Many of
them have a lower signal to noise ratio than that of the more OH-rich samples
indicating a lower amount of phlogopite formed in these samples. Even for Mg- and
Si-rich compositions the crystallisation of phlogopite seems to be less favourable
under these conditions.
The signals present are the same as have been observed for other compositions,
with the Si-Si3-signal at -90 ppm, the Si-Si2Al-signal at -87 ppm, the Si-SiAl2-signal at
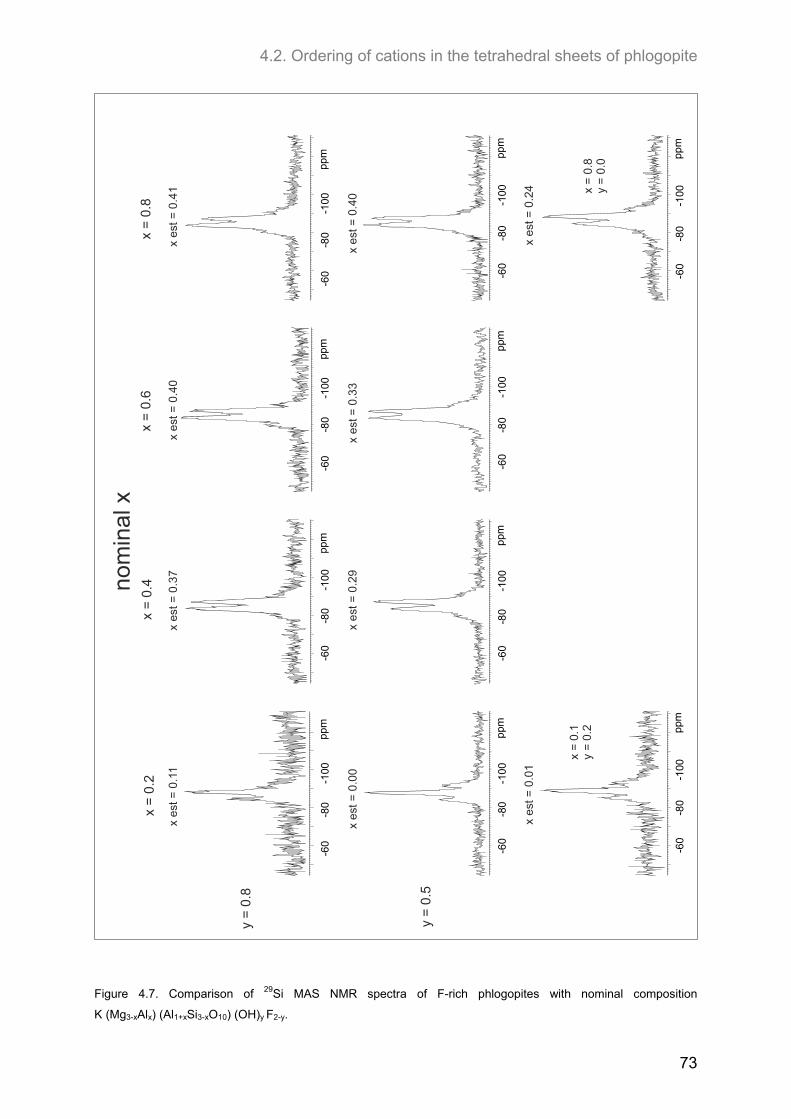
4.2. Ordering of cations in the tetrahedral sheets of phlogopite
73
y =
0.5
-60
-80
-100
ppm
-60
-80
-100
ppm
-60
-80
-100
ppm
x e
st =
0.0
0x
est
= 0
.29
x es
t = 0
.33
x es
t =
0.0
1x
est
= 0
.24
-60
-80
-100
ppm
-60
-80
-100
ppm
-60
-80
-100
ppm
-60
-80
-100
ppm
-60
-80
-100
ppm
-60
-80
-100
ppm
y =
0.8
x =
0.2
x =
0.4
x =
0.6
x =
0.8
x e
st =
0.4
0x
est
= 0
.41
x es
t =
0.3
7x
est
= 0
.11
-60
-80
-100
ppm
x es
t =
0.4
0
nom
inal
x
x =
0.1
y =
0.2
x =
0.8
y =
0.0
Figure 4.7. Comparison of 29Si MAS NMR spectra of F-rich phlogopites with nominal composition
K (Mg3-xAlx) (Al1+xSi3-xO10) (OH)y F2-y.
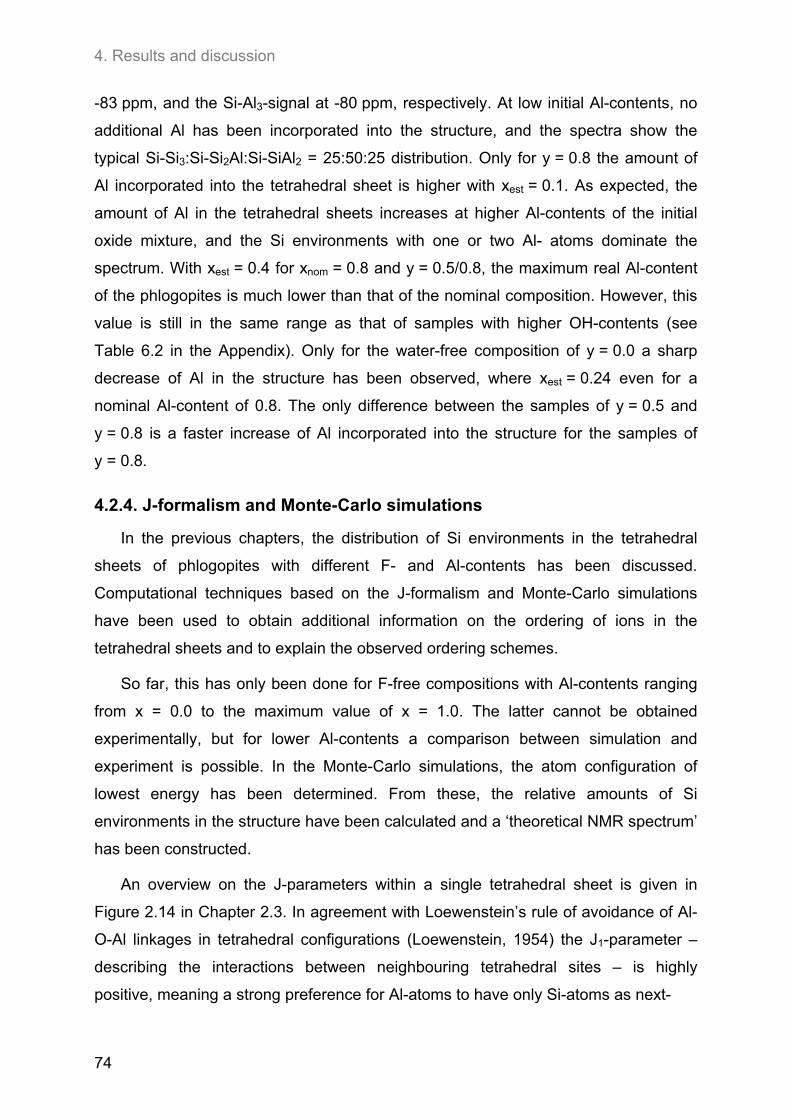
4. Results and discussion
74
-83 ppm, and the Si-Al3-signal at -80 ppm, respectively. At low initial Al-contents, no
additional Al has been incorporated into the structure, and the spectra show the
typical Si-Si3:Si-Si2Al:Si-SiAl2 = 25:50:25 distribution. Only for y = 0.8 the amount of
Al incorporated into the tetrahedral sheet is higher with xest = 0.1. As expected, the
amount of Al in the tetrahedral sheets increases at higher Al-contents of the initial
oxide mixture, and the Si environments with one or two Al- atoms dominate the
spectrum. With xest = 0.4 for xnom = 0.8 and y = 0.5/0.8, the maximum real Al-content
of the phlogopites is much lower than that of the nominal composition. However, this
value is still in the same range as that of samples with higher OH-contents (see
Table 6.2 in the Appendix). Only for the water-free composition of y = 0.0 a sharp
decrease of Al in the structure has been observed, where xest = 0.24 even for a
nominal Al-content of 0.8. The only difference between the samples of y = 0.5 and
y = 0.8 is a faster increase of Al incorporated into the structure for the samples of
y = 0.8.
4.2.4. J-formalism and Monte-Carlo simulations
In the previous chapters, the distribution of Si environments in the tetrahedral
sheets of phlogopites with different F- and Al-contents has been discussed.
Computational techniques based on the J-formalism and Monte-Carlo simulations
have been used to obtain additional information on the ordering of ions in the
tetrahedral sheets and to explain the observed ordering schemes.
So far, this has only been done for F-free compositions with Al-contents ranging
from x = 0.0 to the maximum value of x = 1.0. The latter cannot be obtained
experimentally, but for lower Al-contents a comparison between simulation and
experiment is possible. In the Monte-Carlo simulations, the atom configuration of
lowest energy has been determined. From these, the relative amounts of Si
environments in the structure have been calculated and a ‘theoretical NMR spectrum’
has been constructed.
An overview on the J-parameters within a single tetrahedral sheet is given in
Figure 2.14 in Chapter 2.3. In agreement with Loewenstein’s rule of avoidance of Al-
O-Al linkages in tetrahedral configurations (Loewenstein, 1954) the J1-parameter –
describing the interactions between neighbouring tetrahedral sites – is highly
positive, meaning a strong preference for Al-atoms to have only Si-atoms as next-
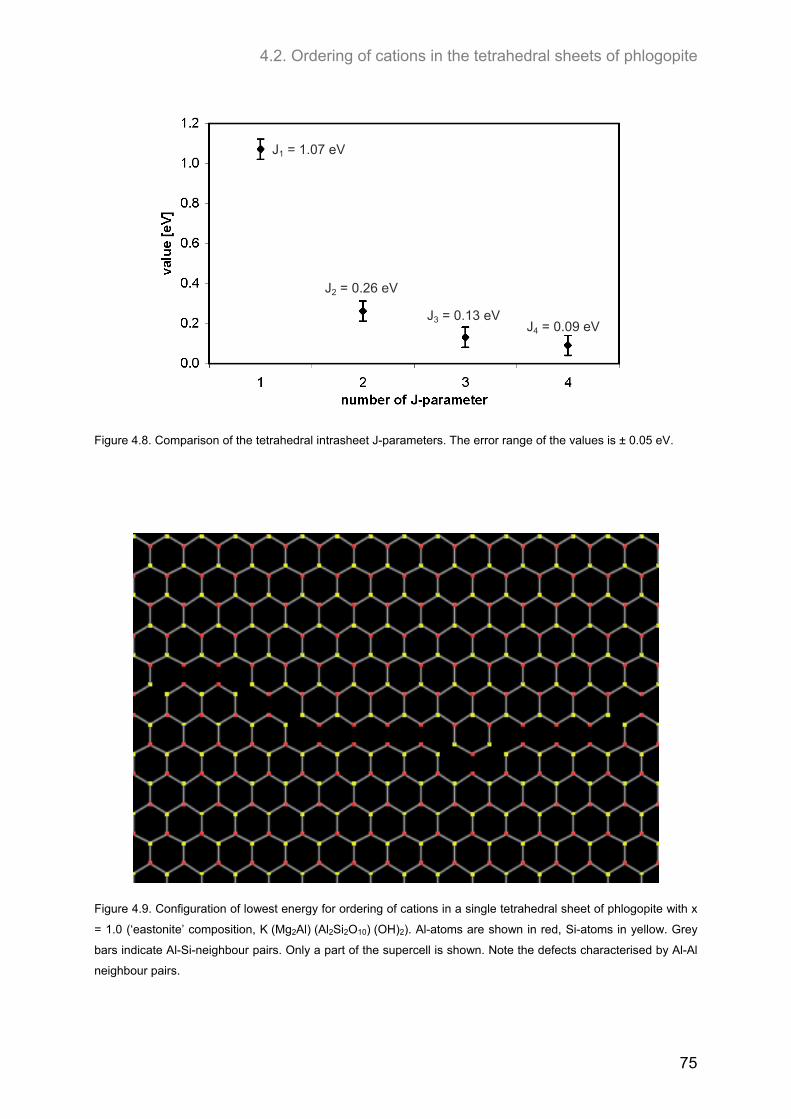
4.2. Ordering of cations in the tetrahedral sheets of phlogopite
75
J = 1.07 eV1
J = 0.26 eV2
J = 0.13 eV3J = 0.09 eV4
Figure 4.8. Comparison of the tetrahedral intrasheet J-parameters. The error range of the values is ± 0.05 eV.
Figure 4.9. Configuration of lowest energy for ordering of cations in a single tetrahedral sheet of phlogopite with x
= 1.0 (‘eastonite’ composition, K (Mg2Al) (Al2Si2O10) (OH)2). Al-atoms are shown in red, Si-atoms in yellow. Grey
bars indicate Al-Si-neighbour pairs. Only a part of the supercell is shown. Note the defects characterised by Al-Al
neighbour pairs.
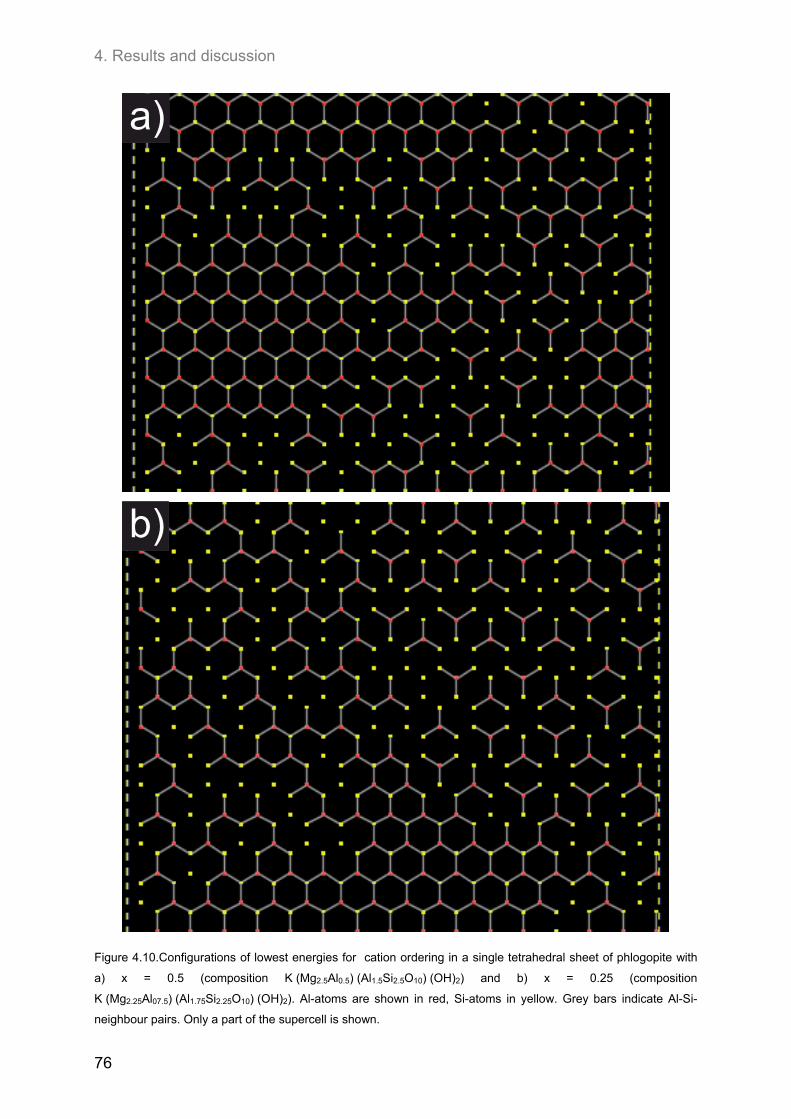
4. Results and discussion
76
b)
a)
Figure 4.10.Configurations of lowest energies for cation ordering in a single tetrahedral sheet of phlogopite with
a) x = 0.5 (composition K (Mg2.5Al0.5) (Al1.5Si2.5O10) (OH)2) and b) x = 0.25 (composition
K (Mg2.25Al07.5) (Al1.75Si2.25O10) (OH)2). Al-atoms are shown in red, Si-atoms in yellow. Grey bars indicate Al-Si-
neighbour pairs. Only a part of the supercell is shown.
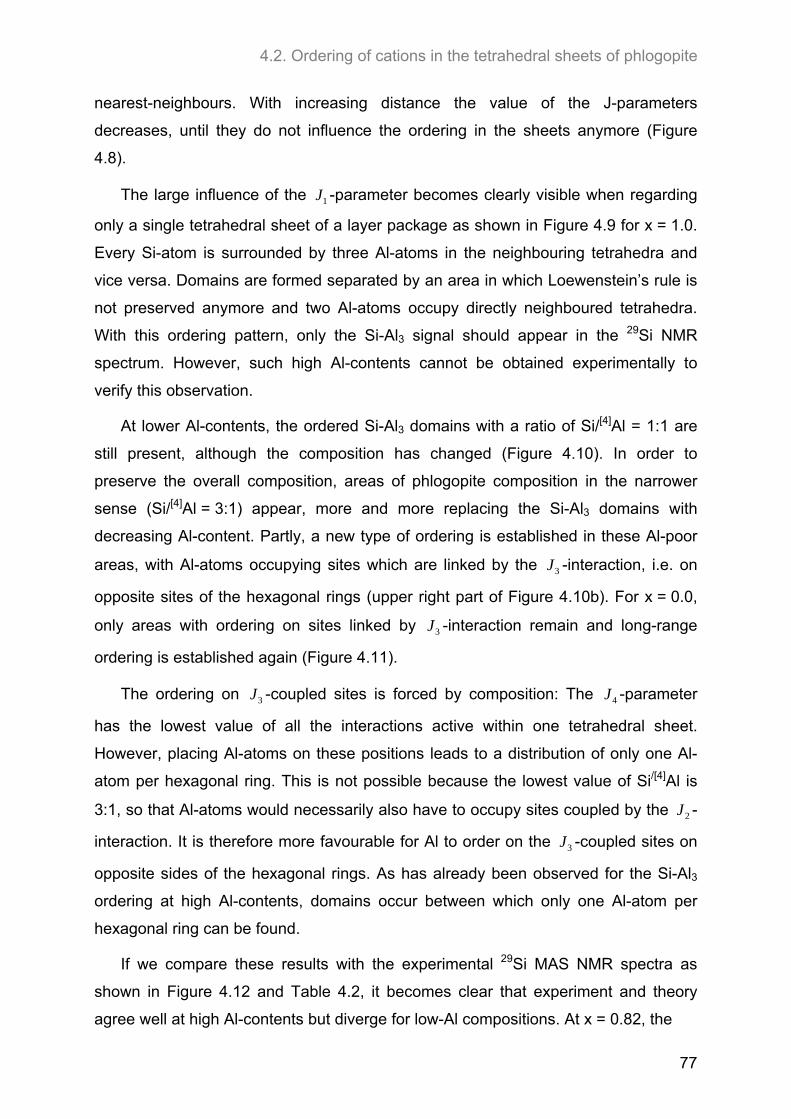
4.2. Ordering of cations in the tetrahedral sheets of phlogopite
77
nearest-neighbours. With increasing distance the value of the J-parameters
decreases, until they do not influence the ordering in the sheets anymore (Figure
4.8).
The large influence of the 1J -parameter becomes clearly visible when regarding
only a single tetrahedral sheet of a layer package as shown in Figure 4.9 for x = 1.0.
Every Si-atom is surrounded by three Al-atoms in the neighbouring tetrahedra and
vice versa. Domains are formed separated by an area in which Loewenstein’s rule is
not preserved anymore and two Al-atoms occupy directly neighboured tetrahedra.
With this ordering pattern, only the Si-Al3 signal should appear in the 29Si NMR
spectrum. However, such high Al-contents cannot be obtained experimentally to
verify this observation.
At lower Al-contents, the ordered Si-Al3 domains with a ratio of Si/[4]Al = 1:1 are
still present, although the composition has changed (Figure 4.10). In order to
preserve the overall composition, areas of phlogopite composition in the narrower
sense (Si/[4]Al = 3:1) appear, more and more replacing the Si-Al3 domains with
decreasing Al-content. Partly, a new type of ordering is established in these Al-poor
areas, with Al-atoms occupying sites which are linked by the 3J -interaction, i.e. on
opposite sites of the hexagonal rings (upper right part of Figure 4.10b). For x = 0.0,
only areas with ordering on sites linked by 3J -interaction remain and long-range
ordering is established again (Figure 4.11).
The ordering on 3J -coupled sites is forced by composition: The 4J -parameter
has the lowest value of all the interactions active within one tetrahedral sheet.
However, placing Al-atoms on these positions leads to a distribution of only one Al-
atom per hexagonal ring. This is not possible because the lowest value of Si/[4]Al is
3:1, so that Al-atoms would necessarily also have to occupy sites coupled by the 2J -
interaction. It is therefore more favourable for Al to order on the 3J -coupled sites on
opposite sides of the hexagonal rings. As has already been observed for the Si-Al3
ordering at high Al-contents, domains occur between which only one Al-atom per
hexagonal ring can be found.
If we compare these results with the experimental 29Si MAS NMR spectra as
shown in Figure 4.12 and Table 4.2, it becomes clear that experiment and theory
agree well at high Al-contents but diverge for low-Al compositions. At x = 0.82, the
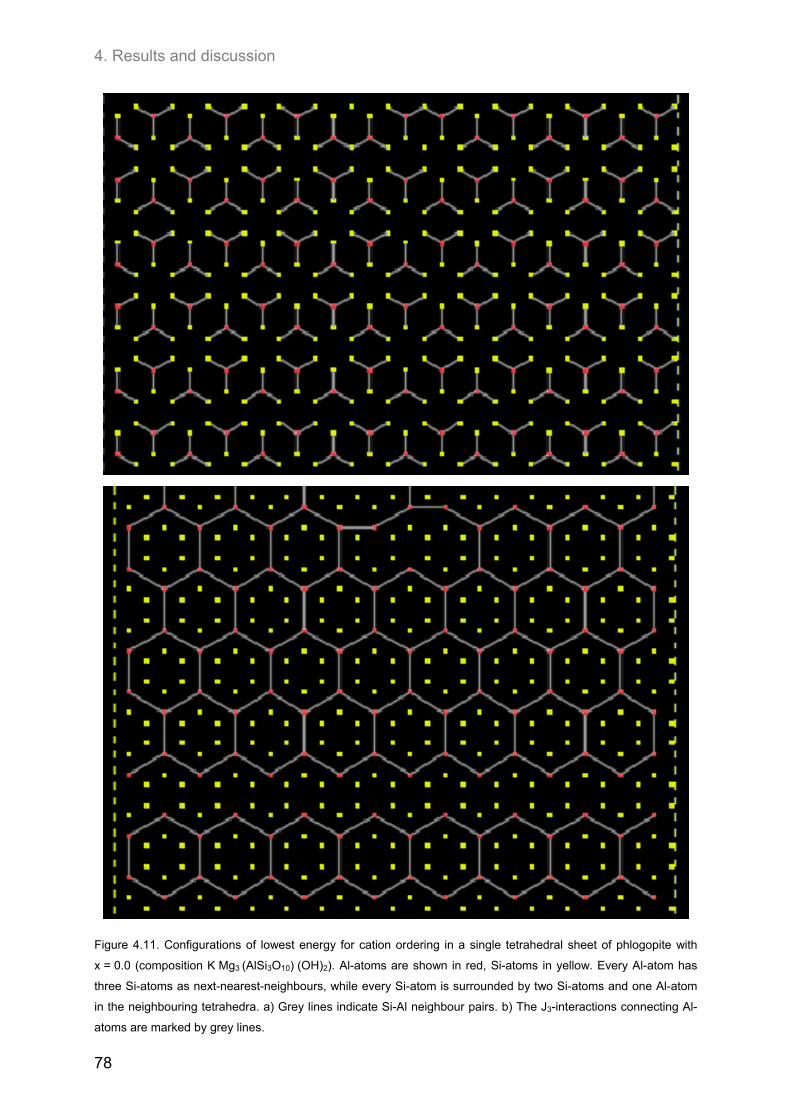
4. Results and discussion
78
Figure 4.11. Configurations of lowest energy for cation ordering in a single tetrahedral sheet of phlogopite with
x = 0.0 (composition K Mg3 (AlSi3O10) (OH)2). Al-atoms are shown in red, Si-atoms in yellow. Every Al-atom has
three Si-atoms as next-nearest-neighbours, while every Si-atom is surrounded by two Si-atoms and one Al-atom
in the neighbouring tetrahedra. a) Grey lines indicate Si-Al neighbour pairs. b) The J3-interactions connecting Al-
atoms are marked by grey lines.
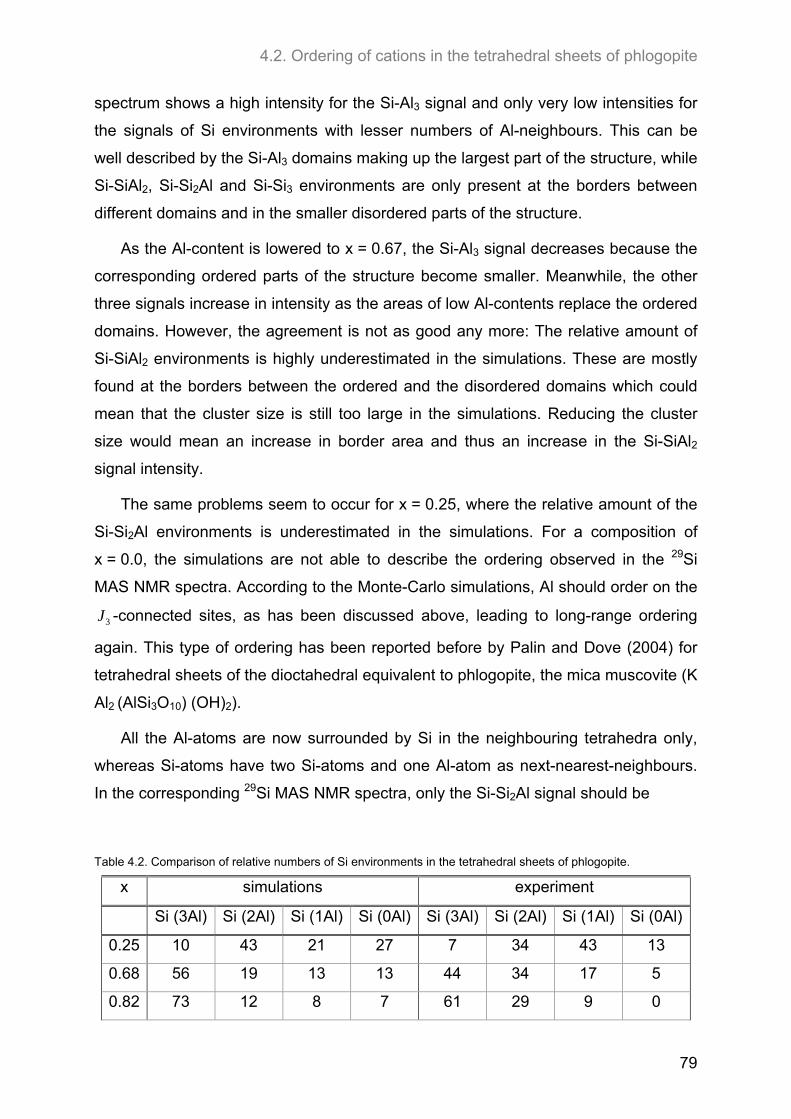
4.2. Ordering of cations in the tetrahedral sheets of phlogopite
79
spectrum shows a high intensity for the Si-Al3 signal and only very low intensities for
the signals of Si environments with lesser numbers of Al-neighbours. This can be
well described by the Si-Al3 domains making up the largest part of the structure, while
Si-SiAl2, Si-Si2Al and Si-Si3 environments are only present at the borders between
different domains and in the smaller disordered parts of the structure.
As the Al-content is lowered to x = 0.67, the Si-Al3 signal decreases because the
corresponding ordered parts of the structure become smaller. Meanwhile, the other
three signals increase in intensity as the areas of low Al-contents replace the ordered
domains. However, the agreement is not as good any more: The relative amount of
Si-SiAl2 environments is highly underestimated in the simulations. These are mostly
found at the borders between the ordered and the disordered domains which could
mean that the cluster size is still too large in the simulations. Reducing the cluster
size would mean an increase in border area and thus an increase in the Si-SiAl2
signal intensity.
The same problems seem to occur for x = 0.25, where the relative amount of the
Si-Si2Al environments is underestimated in the simulations. For a composition of
x = 0.0, the simulations are not able to describe the ordering observed in the 29Si
MAS NMR spectra. According to the Monte-Carlo simulations, Al should order on the
3J -connected sites, as has been discussed above, leading to long-range ordering
again. This type of ordering has been reported before by Palin and Dove (2004) for
tetrahedral sheets of the dioctahedral equivalent to phlogopite, the mica muscovite (K
Al2 (AlSi3O10) (OH)2).
All the Al-atoms are now surrounded by Si in the neighbouring tetrahedra only,
whereas Si-atoms have two Si-atoms and one Al-atom as next-nearest-neighbours.
In the corresponding 29Si MAS NMR spectra, only the Si-Si2Al signal should be
Table 4.2. Comparison of relative numbers of Si environments in the tetrahedral sheets of phlogopite.
x simulations experiment
Si (3Al) Si (2Al) Si (1Al) Si (0Al) Si (3Al) Si (2Al) Si (1Al) Si (0Al)
0.25 10 43 21 27 7 34 43 13
0.68 56 19 13 13 44 34 17 5
0.82 73 12 8 7 61 29 9 0
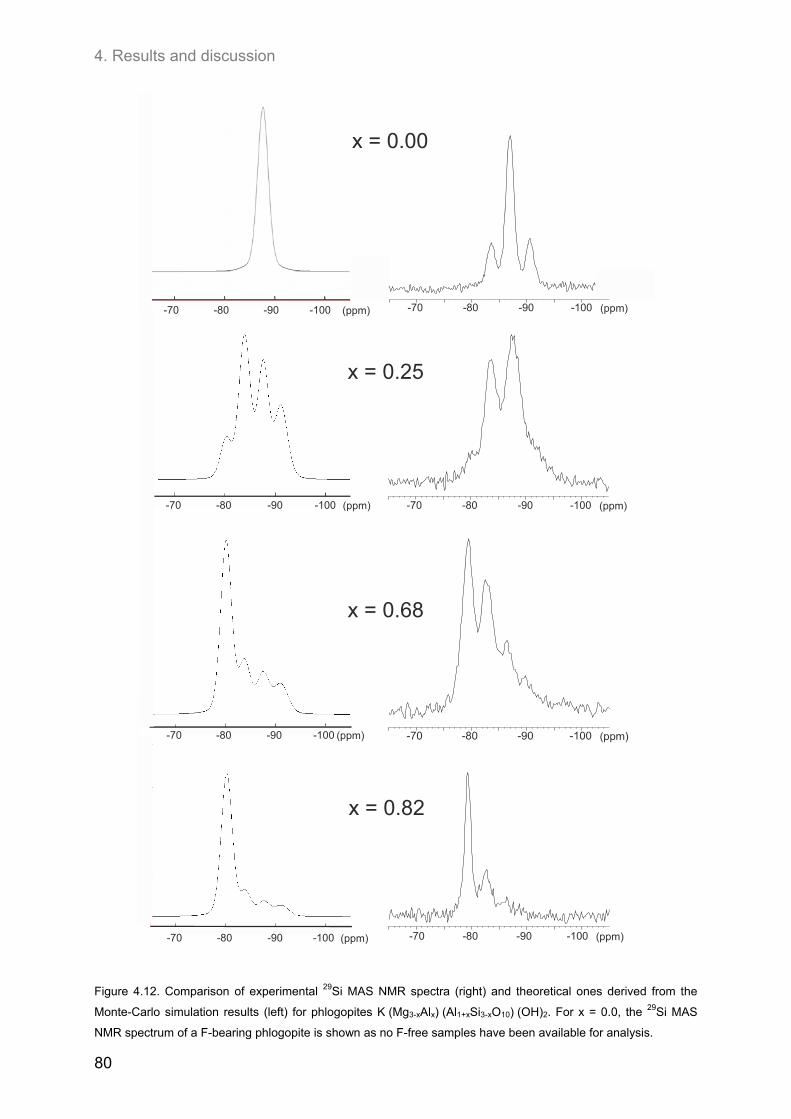
4. Results and discussion
80
-70 -80 -90 -100 (ppm) -80-70 -90 -100 (ppm)
-70 -80 -90 -100 (ppm) -70 -80 -90 -100 (ppm)
-70 -80 -90 -100 (ppm)
x = 0.25
x = 0.68
x = 0.82
-70 -80 -90 -100 (ppm) -70 -80 -90 -100 (ppm)
x = 0.00
Figure 4.12. Comparison of experimental 29Si MAS NMR spectra (right) and theoretical ones derived from the
Monte-Carlo simulation results (left) for phlogopites K (Mg3-xAlx) (Al1+xSi3-xO10) (OH)2. For x = 0.0, the 29Si MAS
NMR spectrum of a F-bearing phlogopite is shown as no F-free samples have been available for analysis.
4.2. Ordering of cations in the tetrahedral sheets of phlogopite
81
visible, having a relative signal intensity of 98 %. Two small shoulders result from the
Si-Si3 and the Si-SiAl2 environments present at the borders between the domains,
and both have a signal intensity of 1 %.
The experimentally observed 29Si MAS NMR spectrum, however, differs
completely from the theoretical one. The relative signal intensities of the Si-Si3 and
the Si-SiAl2 environments are much higher, leading to a ratio of
Si-SiAl2 : Si-Si2Al : Si-Si3 of 25:50:25 instead of 1:98:1. This means that long-range
ordering is not present, but Al is distributed statistically in pure Mg-phlogopite,
regarding one tetrahedral sheet only.
One possible explanation for the deviation between simulations and experiment
could be that pure Mg-phlogopites have only been synthesised for F-bearing
compositions, whereas fluorine is not considered in the simulations. However, this is
not likely as the 25:50:25 signal distribution has been observed in all low-Al samples
independently from the exact F-content. These findings are also in agreement with
the results of Circone et al. (1991) who proposed that only short-range ordering due
to the avoidance of Al-O-Al linkages should be present in phlogopites of low Al-
contents.
4. Results and discussion
82
4.3. Ordering of cations and anions in the octahedral sheets of
phlogopite
4.3.1. Samples of intermediate to low F-contents (1.0 ≤ y ≤ 1.8)
Both 1H and 19F MAS NMR spectroscopy give the opportunity to probe the OH/F
environment in the octahedral sheet and to obtain information on the distribution of
Mg/Al in this sheet. Theoretically, several signals corresponding to different amounts
of Al in the OH/F coordination sphere may occur in both types of spectra: OH/F-Mg3,
OH/F-Mg2Al, OH/F-MgAl2, and OH/F-Al3.
4.3.1.1. 1H MAS NMR spectroscopy
In the 1H MAS NMR spectra shown in Figure 4.13, only two of the expected
signals have been observed: the H-OMg3 signal at about 0.5 ppm and the H-OMg2Al
at about 1.8 ppm. If the overall Al-content of the samples is low, the amount of Al-
atoms in the octahedral sheet is not high enough for H-OMgAl2 and H-OAl3 signals to
appear, but with increasing Al-content it should become more and more likely for two
aluminium atoms to occupy neighbouring octahedra. Those signals were always
absent, regardless of the Al-content. This implies an avoidance of Al in neighbouring
octahedra, similar to the avoidance of Al-O-Al linkages in the tetrahedral layers.
The relative intensity of the H-OMg3 and the H-OMg2Al signals clearly changes
with composition. With more Al being incorporated into the structure (at constant F-
content), the H-OMg2Al signal intensity clearly increases, becoming even higher than
that of the H-OMg3 signal. For F-rich compositions the H-OMg2Al signal intensity is
higher than for OH-rich samples (at constant Al-content), although one might expect
the opposite as OH-rich phlogopites are able to incorporate larger amounts of Al.
Fechtelkord et al. (2003a) reasoned that the strong preference of OH to be co-
ordinated by Al instead of Mg should be responsible for this observation. At
intermediate OH contents, Al is gathered around the OH-groups instead of being
distributed statistically. For OH-rich compositions the Al-content is not high enough
for a co-ordination of all hydroxyl groups by Mg2Al. Therefore, a larger number of OH
is forced to occupy Mg3-sites, too.
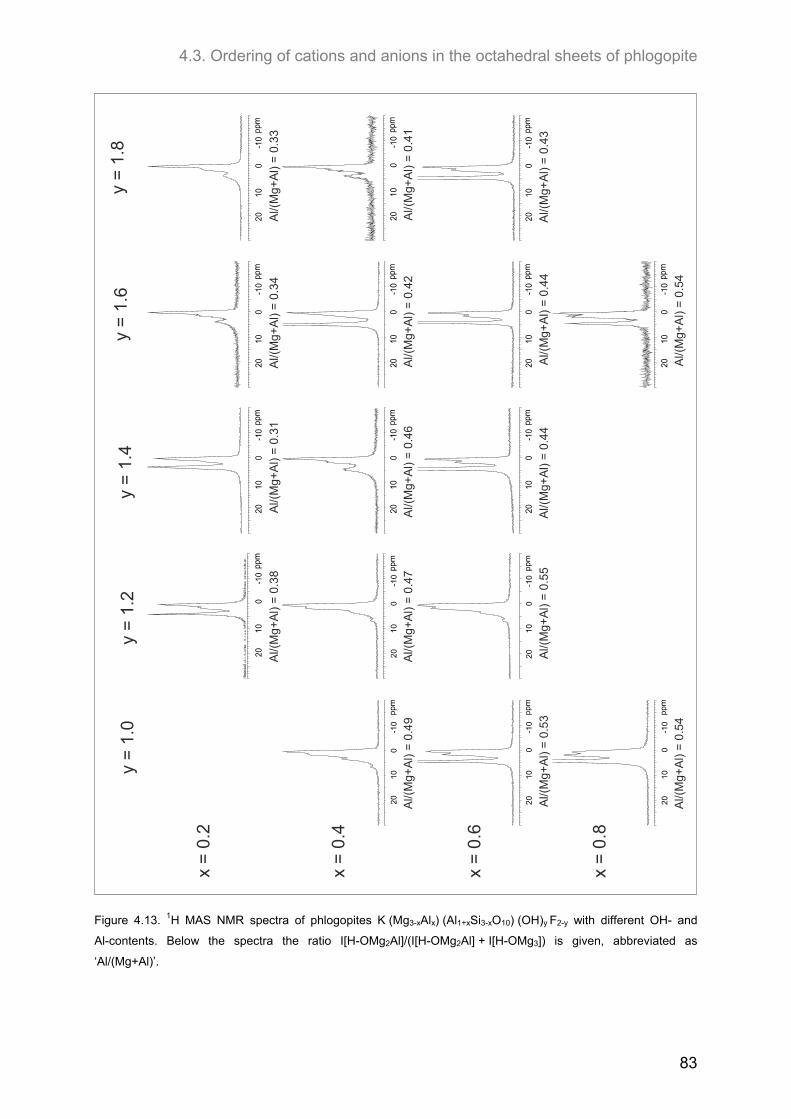
4.3. Ordering of cations and anions in the octahedral sheets of phlogopite
83
x =
0.2
x =
0.4
x =
0.6
x =
0.8
y =
1.0
y =
1.2
y =
1.4
y =
1.6
y =
1.8
Al/(
Mg+
Al)
= 0
.49
Al/(
Mg+
Al)
= 0
.38
Al/(
Mg+
Al)
= 0
.47
Al/(
Mg
+A
l) =
0.5
3A
l/(M
g+A
l) =
0.5
5
Al/(
Mg+
Al)
= 0
.54
Al/(
Mg+
Al)
= 0
.46
Al/(
Mg+
Al)
= 0
.44
Al/(
Mg+
Al)
= 0
.31
Al/(
Mg+
Al)
= 0
.34
Al/(
Mg+
Al)
= 0
.42
Al/(
Mg+
Al)
= 0
.44
Al/(
Mg+
Al)
= 0
.54
Al/(
Mg+
Al)
= 0
.43
Al/(
Mg+
Al)
= 0
.41
Al/(
Mg+
Al)
= 0
.33
Figure 4.13. 1H MAS NMR spectra of phlogopites K (Mg3-xAlx) (Al1+xSi3-xO10) (OH)y F2-y with different OH- and
Al-contents. Below the spectra the ratio I[H-OMg2Al]/(I[H-OMg2Al] + I[H-OMg3]) is given, abbreviated as
‘Al/(Mg+Al)’.
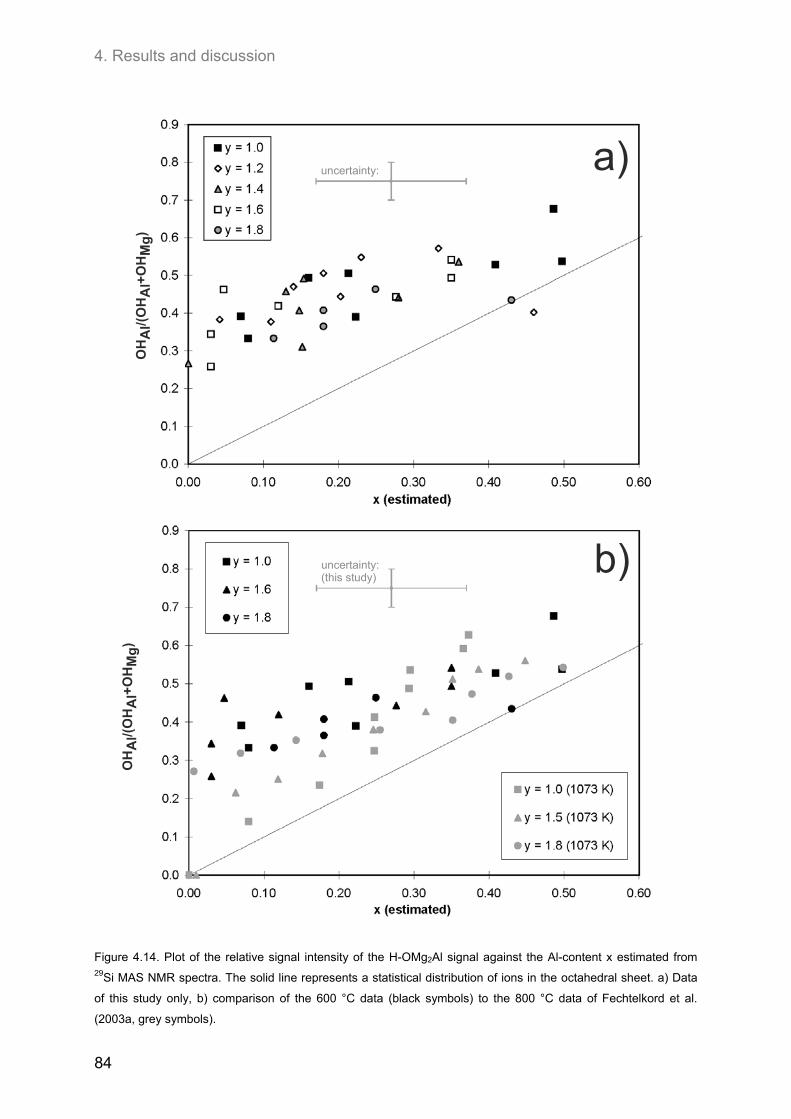
4. Results and discussion
84
uncertainty:(this study)
OH
Al/(
OH
Al+
OH
Mg
)
uncertainty:
OH
Al/(
OH
Al+
OH
Mg
)
a)
b)
Figure 4.14. Plot of the relative signal intensity of the H-OMg2Al signal against the Al-content x estimated from 29Si MAS NMR spectra. The solid line represents a statistical distribution of ions in the octahedral sheet. a) Data
of this study only, b) comparison of the 600 °C data (black symbols) to the 800 °C data of Fechtelkord et al.
(2003a, grey symbols).
4.3. Ordering of cations and anions in the octahedral sheets of phlogopite
85
This non-statistical distribution of Mg and Al in the octahedral sheet is more
obvious in plots of the relative signal intensity of the H-OMg2Al signal,
I[H-OMg2Al]/(I[H-OMg2Al] + I[H-OMg3]), against the Al-content of the phlogopites
estimated from the 29Si MAS NMR spectra, xest (Figure 4.14a, see also data given in
Table 6.3 in the Appendix). Assuming that Al is incorporated into both sheets equally
(according to Tschermak’s substitution), xest should also be the Al-content of the
octahedral sheet. H-OMgAl2 and H-OAl3-signals have not been observed which
means only H-OMg3 and H-OMg2Al environments are present. Two of the sites co-
ordinating each hydroxyl-group are always occupied by Mg, and Mg ↔ Al exchange
only takes place on the third site. For compositions of xest = 0.0, this site is occupied
by Mg only, while at xest = 1.0 all sites are occupied by Al. Therefore, the H-OMg2Al
and the H-OMg3 signal intensities directly correlate to xest and (1-xest), respectively,
and the Al-content of the octahedral sheet is equal to the relative H-OMg2Al signal
intensity:
estestest
est xxx
x
OMgHIAlOMgHI
AlOMgHI
)1(]) [][(
] [
32
2 (4.4)
This relationship is valid for a statistical distribution of ions in the octahedral sheet.
However, Figure 4.14a shows that the H-OMg2Al signal intensity is much higher than
expected, confirming the non-statistical Mg/Al distribution with Al preferring OH
environments over F environments. At high Al-contents of xest > 0.40 the
experimental data approach the theoretical values and the ordering pattern observed
before is not present any more.
Fechtelkord et al. (2003a) published similar data for their phlogopite samples
synthesised at 800 °C (1073 K). However, in their publication these values were
plotted against the nominal Al-content of the sample and not the real Al-content of
the phlogopites. The amount of Al incorporated into these phlogopites has been
calculated from their data according to equation (4.3) in order to compare the
resulting curves to the ones obtained in this study (Figure 4.14b). The data are
roughly in the same range for x > 0.30, but at lower Al-contents there is a larger
discrepancy between both data sets. The low-T phlogopites already show a strong
enrichment of Al-atoms around OH-groups for very low overall aluminium contents,
while the samples synthesised at 800 °C show this only for OH-rich compositions of
4. Results and discussion
86
y = 1.8. A possible explanation for this observation could be a higher degree of
ordering at lower temperatures.
4.3.1.2. 19F MAS NMR
As fluorine substitutes for OH in the phlogopite structure we expect the same two
signals as have already been observed for 1H: The first one is due to a co-ordination
by three Mg-ions, and the other one results from an environment with two Mg and
one Al. According to Huve et al. (1992a,b) a signal observed at -175 ppm can be
assigned to the F-Mg3 environment in the phlogopite structure, while another signal
located at -150 ppm results from a co-ordination by 2Mg and 1 Al (Figure 4.15).
For the compositions discussed in this chapter hardly any signals resulting from
impurity phases have been observed. A sharp signal has been found at -177 to
-179 ppm for xnom = 0.2 / y = 1.2 and xnom = 0.6 / y = 1.8. It is not clear where this
signal results from, and its appearance does not depend on the sample composition.
Another signal with a broad Lorentzian lineshape has been found in the spectra of
intermediate F-contents (y = 1.0) and high Al-contents (xnom = 0.6 and 0.8). It makes
up a large amount of the whole signal intensity with 34 and 45 % relative signal
intensity, respectively, and possibly results from a F- and Al-containing amorphous
part of the sample. However, the intensity of this signal might be overestimated due
to short spin-lattice relaxation of the corresponding compound, so that the real
amount of amorphous material is lower.
The signal intensity of spinning sidebands resulting from the two phlogopite
signals, marked by asterisks in the spectra, is very low, indicating low chemical shift
anisotropy due to the nearly axial symmetry of the F-Mg3 environment. The intensity
of the F-Mg2Al signal has been very low, so the corresponding spinning sidebands of
this signal could not be observed.
Similar to the 1H MAS NMR spectra the relative intensities of the F-Mg3 and the
F-Mg2Al signals change with composition (Figure 4.15, Table 6.4 in the Appendix). At
low Al contents hardly any F-Mg2Al environments are present in the structure
because F strongly prefers a co-ordination by three Mg-ions. As the amount of Al in
the structure increases, more and more F-ions are forced to be co-ordinated by Al,
too, leading to an increase of the corresponding signal intensity. However, the
amount of F-Mg2Al environments is still very low compared to that of the H-Mg2Al
environments due to the strong F-Al-avoidance previously observed in micas. This is
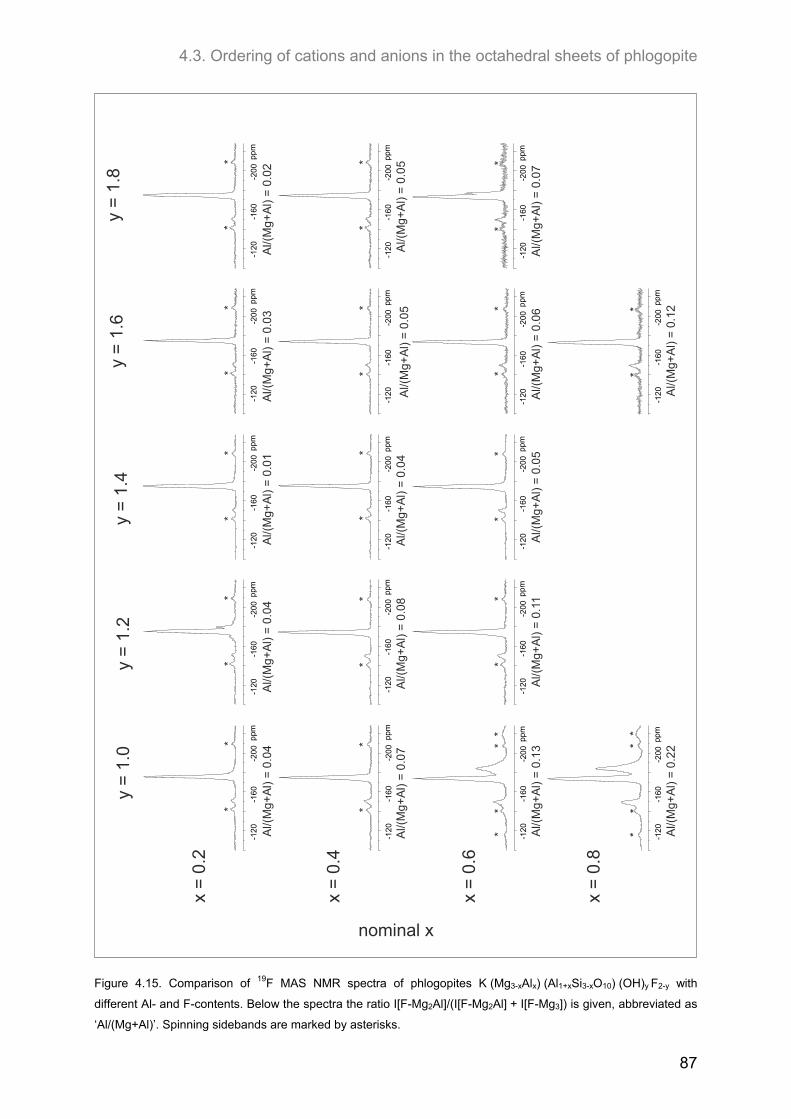
4.3. Ordering of cations and anions in the octahedral sheets of phlogopite
87
x =
0.2
x =
0.4
x =
0.6
x =
0.8
y =
1.0
y =
1.2
y =
1.4
y =
1.6
y =
1.8
nominal x
-120
-160
-20
0pp
m
-120
-160
-200
ppm
-120
-16
0-2
00p
pm
-120
-160
-200
ppm
-120
-160
-200
ppm
-120
-160
-200
ppm
-120
-160
-200
ppm
-120
-160
-200
ppm
-120
-160
-200
ppm
-12
0-1
60-2
00pp
m
-120
-160
-200
ppm
-12
0-1
60-2
00pp
m
-120
-160
-200
ppm
-120
-16
0-2
00p
pm
Al/(
Mg+
Al)
= 0
.08
Al/(
Mg+
Al)
= 0
.11
Al/(
Mg+
Al)
= 0
.04
Al/(
Mg+
Al)
= 0
.22
Al/(
Mg+
Al)
= 0
.13
Al/(
Mg+
Al)
= 0
.07
Al/(
Mg+
Al)
= 0
.04
Al/(
Mg+
Al)
= 0
.01
Al/(
Mg+
Al)
= 0
.04
Al/(
Mg+
Al)
= 0
.05
Al/(
Mg+
Al)
= 0
.03
Al/(
Mg+
Al)
= 0
.02
Al/(
Mg+
Al)
= 0
.05
Al/(
Mg+
Al)
= 0
.05
Al/(
Mg+
Al)
= 0
.06
Al/(
Mg+
Al)
= 0
.12
Al/(
Mg+
Al)
= 0
.07
-12
0-1
60-2
00pp
m
-120
-160
-200
ppm
-120
-160
-200
ppm
**
**
**
**
**
**
**
** *
**
***
**
** *
* **
***
*
**
**
Figure 4.15. Comparison of 19F MAS NMR spectra of phlogopites K (Mg3-xAlx) (Al1+xSi3-xO10) (OH)y F2-y with
different Al- and F-contents. Below the spectra the ratio I[F-Mg2Al]/(I[F-Mg2Al] + I[F-Mg3]) is given, abbreviated as
‘Al/(Mg+Al)’. Spinning sidebands are marked by asterisks.
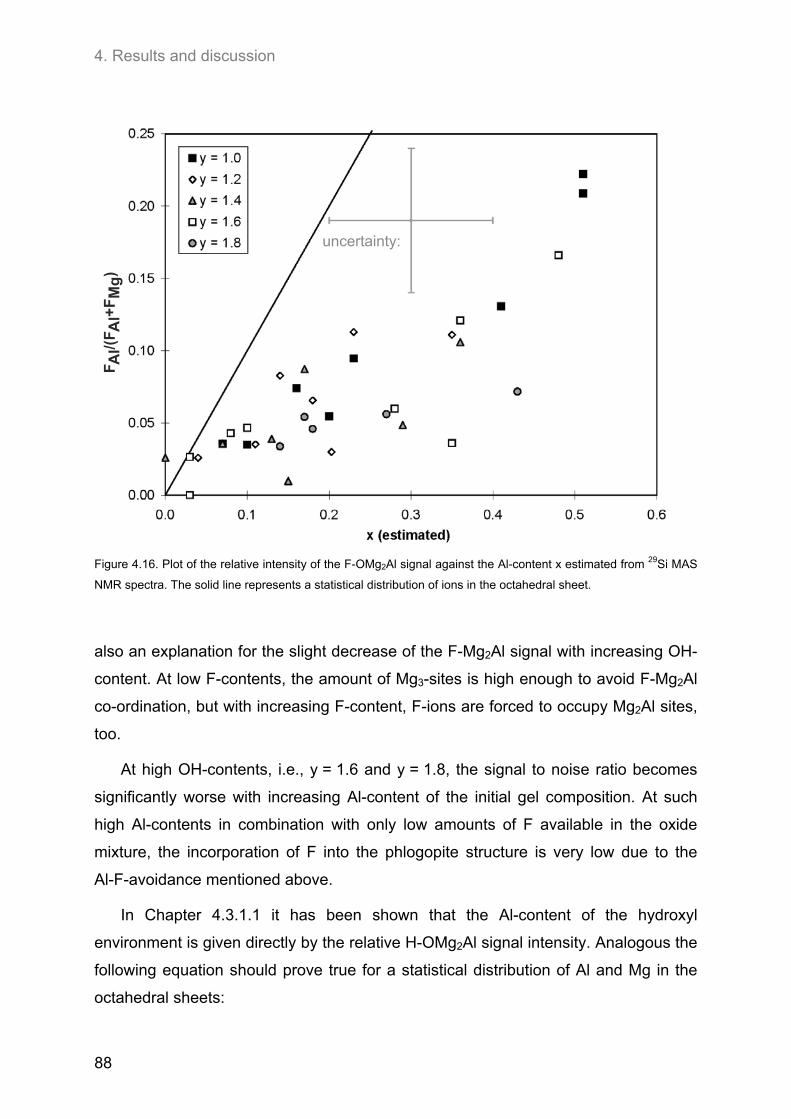
4. Results and discussion
88
F Al/(
F Al+
FM
g)
uncertainty:
Figure 4.16. Plot of the relative intensity of the F-OMg2Al signal against the Al-content x estimated from 29Si MAS
NMR spectra. The solid line represents a statistical distribution of ions in the octahedral sheet.
also an explanation for the slight decrease of the F-Mg2Al signal with increasing OH-
content. At low F-contents, the amount of Mg3-sites is high enough to avoid F-Mg2Al
co-ordination, but with increasing F-content, F-ions are forced to occupy Mg2Al sites,
too.
At high OH-contents, i.e., y = 1.6 and y = 1.8, the signal to noise ratio becomes
significantly worse with increasing Al-content of the initial gel composition. At such
high Al-contents in combination with only low amounts of F available in the oxide
mixture, the incorporation of F into the phlogopite structure is very low due to the
Al-F-avoidance mentioned above.
In Chapter 4.3.1.1 it has been shown that the Al-content of the hydroxyl
environment is given directly by the relative H-OMg2Al signal intensity. Analogous the
following equation should prove true for a statistical distribution of Al and Mg in the
octahedral sheets:
4.3. Ordering of cations and anions in the octahedral sheets of phlogopite
89
estxMgFIAlMgFI
AlMgFI
])[] [(
] [
3 2
2. (4.5)
This relationship is maintained at low values of xest, but with increasing Al-content the
experimental data strongly deviate from the theoretical values (Figure 4.16).
Especially at high overall Al-contents the F environment contains less Al then
expected indicating a non-statistical distribution of ions in the octahedral sheet. This
confirms the results of Papin et al. (1997) and Fechtelkord et al. (2003a) who
suggested a preference for F to be co-ordinated by Mg only.
It could be expected that larger Al-contents might make it more difficult for F to be
co-ordinated by Mg only, and the deviation from a statistical distribution should be
less pronounced. However, this is not the case. One possible explanation might be a
rather low amount of F-incorporation into these Al-rich phlogopites due to excess
water during the synthesis and F-Al-avoidance. In this case the amount of Mg-atoms
in the octahedral sheet was still sufficient to ensure a co-ordination of F mostly by
three Mg. Indeed, the F-contents of high-Al phlogopites have found to be relatively
low (for details see Chapter 4.3.2.2).
4.3.2. Hydroxyl-phlogopites and Al- and OH-rich phlogopites
(0.8 ≤ x ≤ 1.6; 1.6 ≤ y ≤2.0)
4.3.2.1. 1H MAS NMR spectroscopy
The 1H MAS NMR spectra of OH- and Al-rich phlogopites shown in Figure 4.17
are in principle similar to those discussed in Chapter 4.3.1.1 for samples of lower Al-
and OH-contents. Again, parameters obtained from fits of the spectra are given in
Table 6.3 in the Appendix. They show the same rise of relative H-OMg2Al signal
intensity with increasing Al-content of the initial gel composition. A slight decrease
has only been observed for y = 2.0 where the sample of xnom = 1.6 shows a lower
ratio of I[H-OMg2Al]/(I[H-OMg2Al] + I[H-OMg3]) than the sample of xnom = 1.2. This
agrees with the 29Si MAS NMR spectroscopic results discussed in Chapter 4.2.2
where a slight decrease of the amount of Al incorporated into the tetrahedral sheet
has been found for this composition.
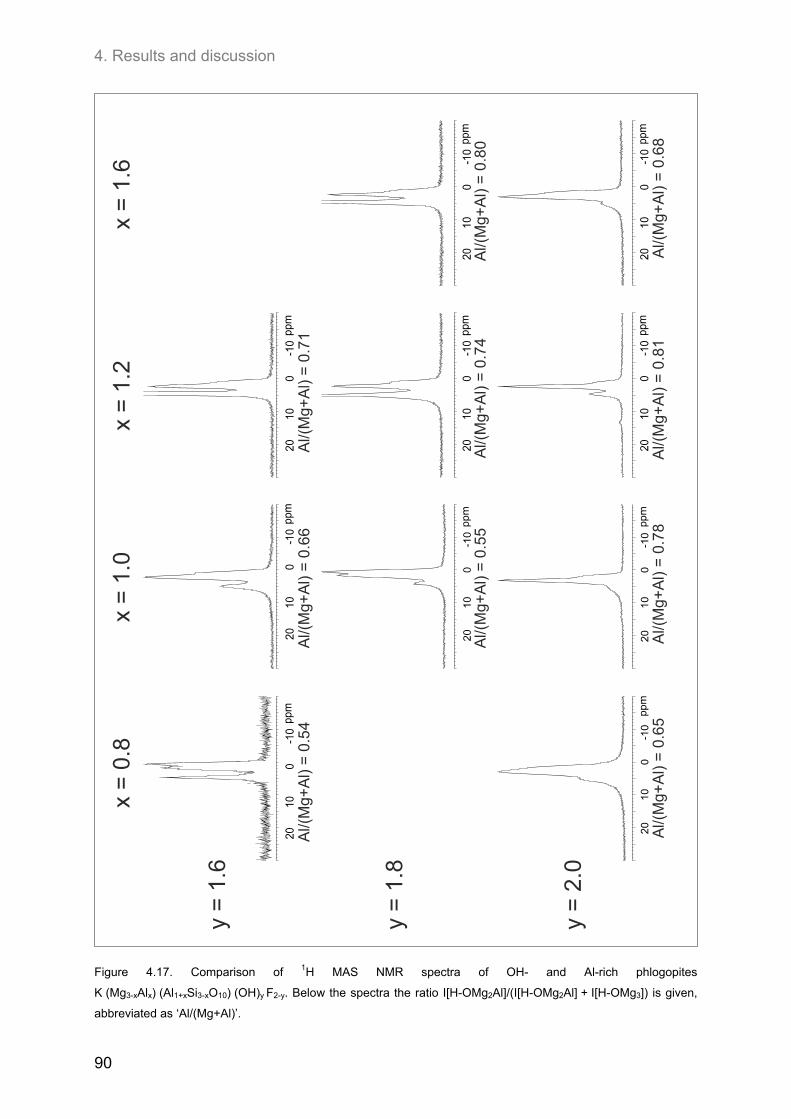
4. Results and discussion
90
y =
1.6
y =
1.8
y =
2.0
x =
0.8
x =
1.0
x =
1.2
x =
1.6
Al/(
Mg+
Al)
= 0
.66
Al/(
Mg+
Al)
= 0
.55
Al/(
Mg+
Al)
= 0
.65
Al/(
Mg+
Al)
= 0
.78
Al/(
Mg+
Al)
= 0
.74
Al/(
Mg+
Al)
= 0
.81
Al/(
Mg+
Al)
= 0
.71
Al/(
Mg+
Al)
= 0
.54
Al/(
Mg+
Al)
= 0
.80
Al/(
Mg+
Al)
= 0
.68
Figure 4.17. Comparison of 1H MAS NMR spectra of OH- and Al-rich phlogopites
K (Mg3-xAlx) (Al1+xSi3-xO10) (OH)y F2-y. Below the spectra the ratio I[H-OMg2Al]/(I[H-OMg2Al] + I[H-OMg3]) is given,
abbreviated as ‘Al/(Mg+Al)’.
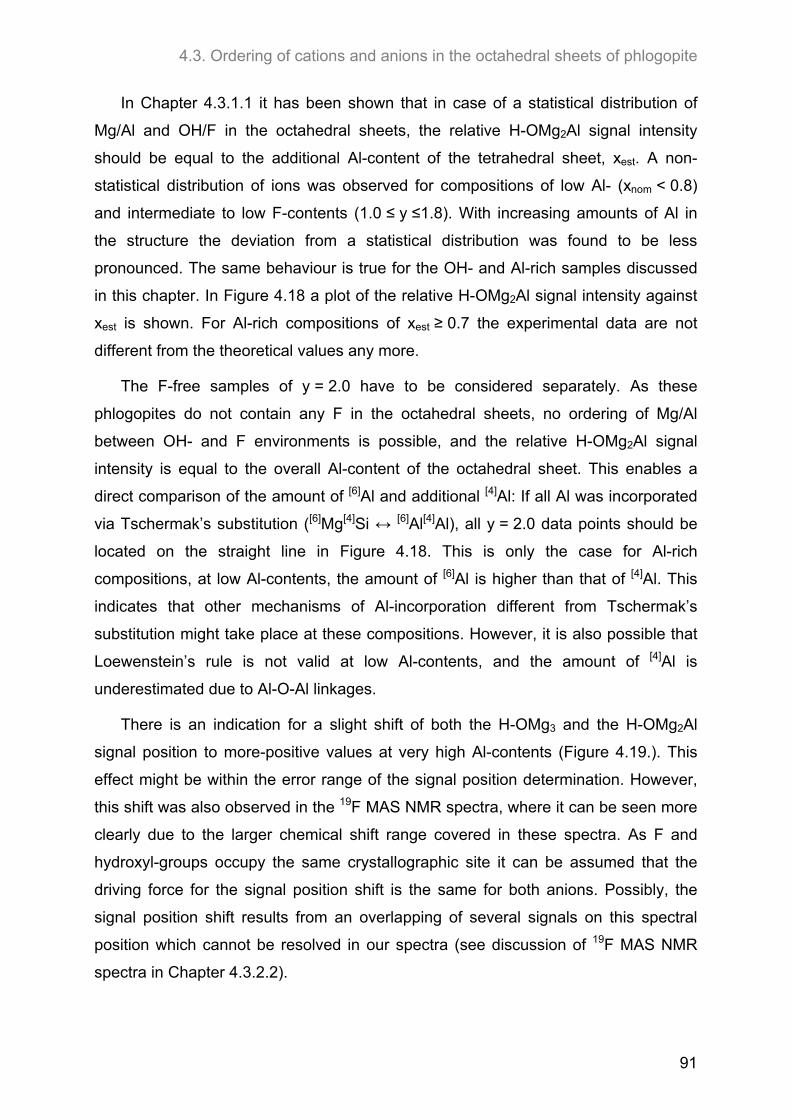
4.3. Ordering of cations and anions in the octahedral sheets of phlogopite
91
In Chapter 4.3.1.1 it has been shown that in case of a statistical distribution of
Mg/Al and OH/F in the octahedral sheets, the relative H-OMg2Al signal intensity
should be equal to the additional Al-content of the tetrahedral sheet, xest. A non-
statistical distribution of ions was observed for compositions of low Al- (xnom < 0.8)
and intermediate to low F-contents (1.0 ≤ y ≤1.8). With increasing amounts of Al in
the structure the deviation from a statistical distribution was found to be less
pronounced. The same behaviour is true for the OH- and Al-rich samples discussed
in this chapter. In Figure 4.18 a plot of the relative H-OMg2Al signal intensity against
xest is shown. For Al-rich compositions of xest ≥ 0.7 the experimental data are not
different from the theoretical values any more.
The F-free samples of y = 2.0 have to be considered separately. As these
phlogopites do not contain any F in the octahedral sheets, no ordering of Mg/Al
between OH- and F environments is possible, and the relative H-OMg2Al signal
intensity is equal to the overall Al-content of the octahedral sheet. This enables a
direct comparison of the amount of [6]Al and additional [4]Al: If all Al was incorporated
via Tschermak’s substitution ([6]Mg[4]Si ↔ [6]Al[4]Al), all y = 2.0 data points should be
located on the straight line in Figure 4.18. This is only the case for Al-rich
compositions, at low Al-contents, the amount of [6]Al is higher than that of [4]Al. This
indicates that other mechanisms of Al-incorporation different from Tschermak’s
substitution might take place at these compositions. However, it is also possible that
Loewenstein’s rule is not valid at low Al-contents, and the amount of [4]Al is
underestimated due to Al-O-Al linkages.
There is an indication for a slight shift of both the H-OMg3 and the H-OMg2Al
signal position to more-positive values at very high Al-contents (Figure 4.19.). This
effect might be within the error range of the signal position determination. However,
this shift was also observed in the 19F MAS NMR spectra, where it can be seen more
clearly due to the larger chemical shift range covered in these spectra. As F and
hydroxyl-groups occupy the same crystallographic site it can be assumed that the
driving force for the signal position shift is the same for both anions. Possibly, the
signal position shift results from an overlapping of several signals on this spectral
position which cannot be resolved in our spectra (see discussion of 19F MAS NMR
spectra in Chapter 4.3.2.2).
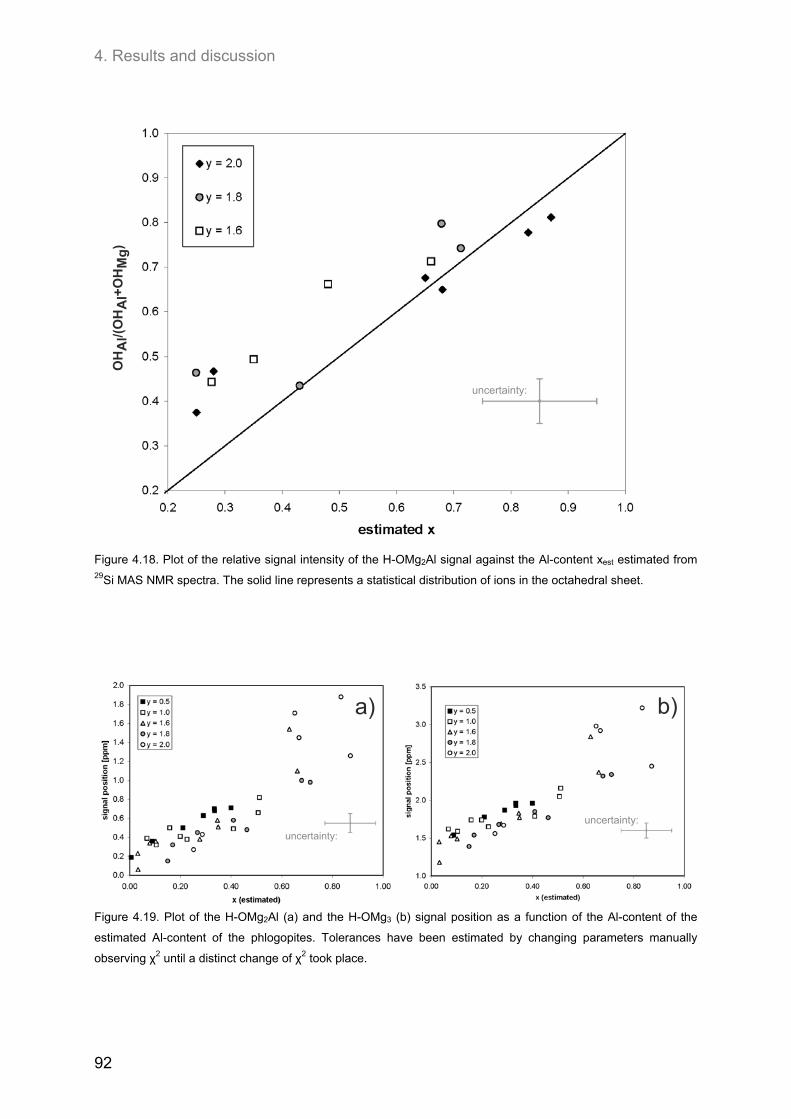
4. Results and discussion
92
OH
Al/(
OH
Al+
OH
Mg
)
uncertainty:
Figure 4.18. Plot of the relative signal intensity of the H-OMg2Al signal against the Al-content xest estimated from 29Si MAS NMR spectra. The solid line represents a statistical distribution of ions in the octahedral sheet.
uncertainty:
a) b)
uncertainty:
Figure 4.19. Plot of the H-OMg2Al (a) and the H-OMg3 (b) signal position as a function of the Al-content of the
estimated Al-content of the phlogopites. Tolerances have been estimated by changing parameters manually
observing χ2 until a distinct change of χ2 took place.
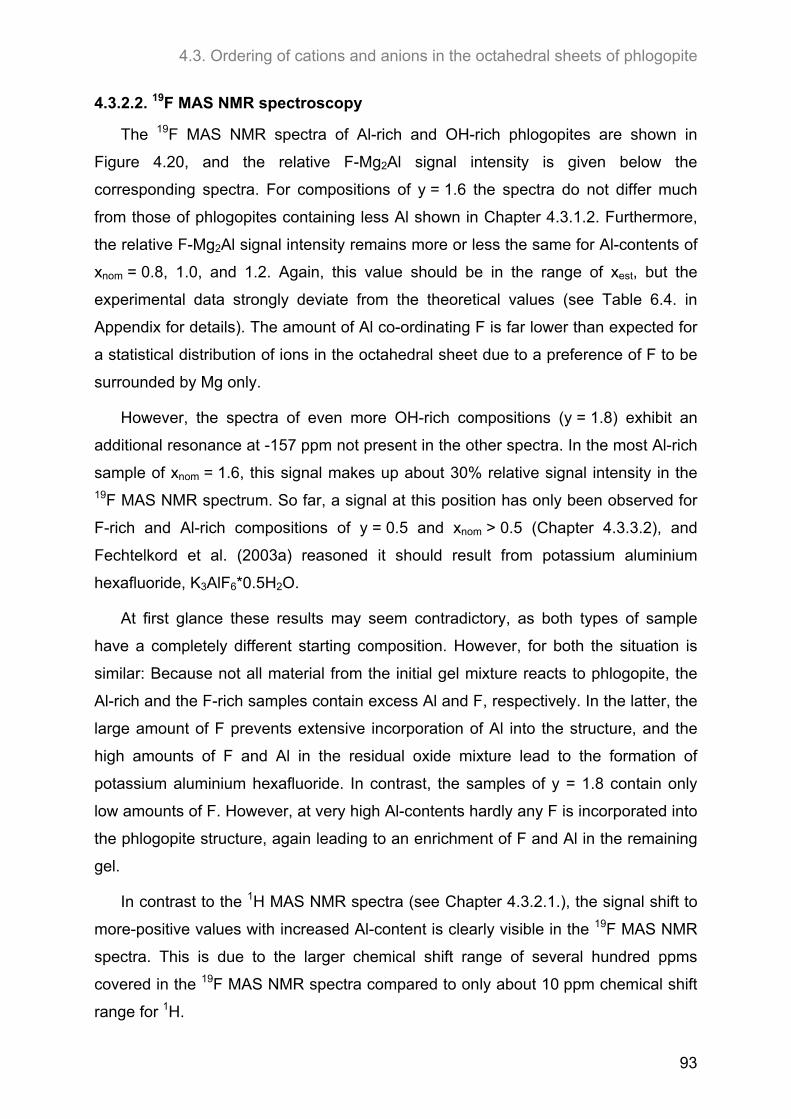
4.3. Ordering of cations and anions in the octahedral sheets of phlogopite
93
4.3.2.2. 19F MAS NMR spectroscopy
The 19F MAS NMR spectra of Al-rich and OH-rich phlogopites are shown in
Figure 4.20, and the relative F-Mg2Al signal intensity is given below the
corresponding spectra. For compositions of y = 1.6 the spectra do not differ much
from those of phlogopites containing less Al shown in Chapter 4.3.1.2. Furthermore,
the relative F-Mg2Al signal intensity remains more or less the same for Al-contents of
xnom = 0.8, 1.0, and 1.2. Again, this value should be in the range of xest, but the
experimental data strongly deviate from the theoretical values (see Table 6.4. in
Appendix for details). The amount of Al co-ordinating F is far lower than expected for
a statistical distribution of ions in the octahedral sheet due to a preference of F to be
surrounded by Mg only.
However, the spectra of even more OH-rich compositions (y = 1.8) exhibit an
additional resonance at -157 ppm not present in the other spectra. In the most Al-rich
sample of xnom = 1.6, this signal makes up about 30% relative signal intensity in the 19F MAS NMR spectrum. So far, a signal at this position has only been observed for
F-rich and Al-rich compositions of y = 0.5 and xnom > 0.5 (Chapter 4.3.3.2), and
Fechtelkord et al. (2003a) reasoned it should result from potassium aluminium
hexafluoride, K3AlF6*0.5H2O.
At first glance these results may seem contradictory, as both types of sample
have a completely different starting composition. However, for both the situation is
similar: Because not all material from the initial gel mixture reacts to phlogopite, the
Al-rich and the F-rich samples contain excess Al and F, respectively. In the latter, the
large amount of F prevents extensive incorporation of Al into the structure, and the
high amounts of F and Al in the residual oxide mixture lead to the formation of
potassium aluminium hexafluoride. In contrast, the samples of y = 1.8 contain only
low amounts of F. However, at very high Al-contents hardly any F is incorporated into
the phlogopite structure, again leading to an enrichment of F and Al in the remaining
gel.
In contrast to the 1H MAS NMR spectra (see Chapter 4.3.2.1.), the signal shift to
more-positive values with increased Al-content is clearly visible in the 19F MAS NMR
spectra. This is due to the larger chemical shift range of several hundred ppms
covered in the 19F MAS NMR spectra compared to only about 10 ppm chemical shift
range for 1H.
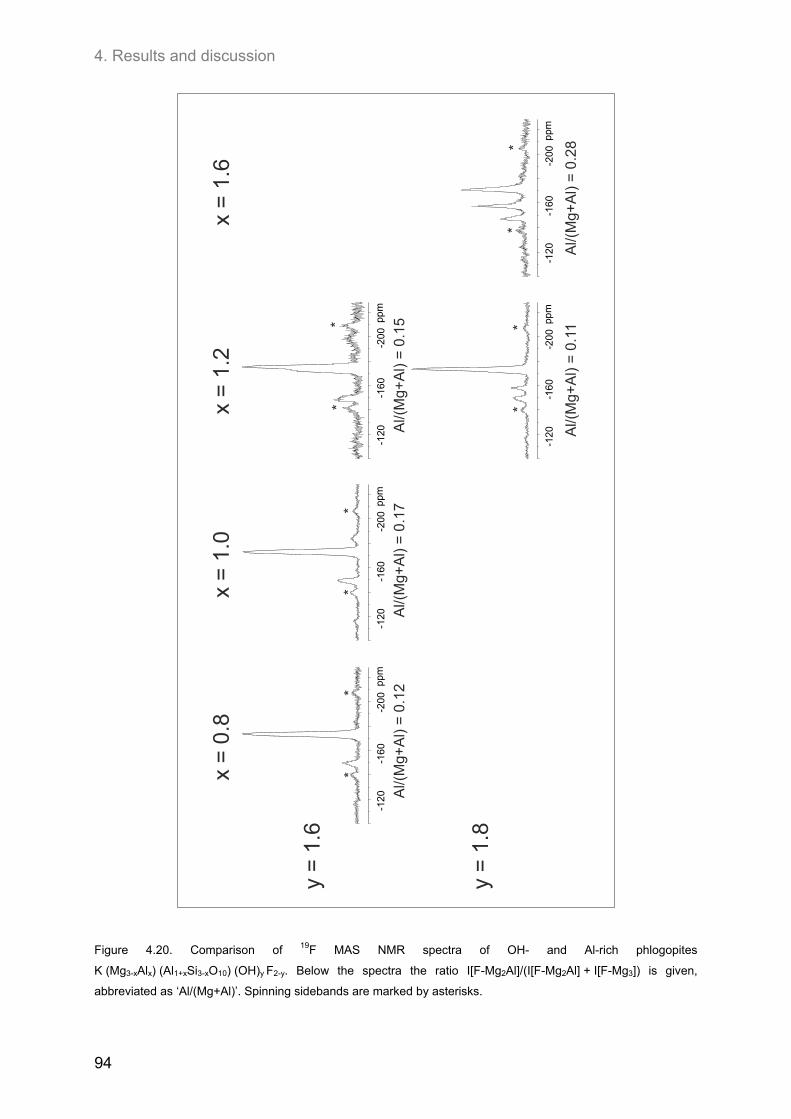
4. Results and discussion
94
y =
1.6
y =
1.8
x =
0.8
x =
1.0
x =
1.2
x =
1.6
-12
0-1
60
-20
0pp
m-1
20-1
60
-20
0pp
m-1
20-1
60-2
00
ppm
-120
-160
-200
ppm
-120
-16
0-2
00
ppm
Al/(
Mg+
Al)
= 0
.17
Al/(
Mg+
Al)
= 0
.12
Al/(
Mg+
Al)
= 0
.15
Al/(
Mg+
Al)
= 0
.11
Al/(
Mg+
Al)
= 0
.28
**
**
** *
**
*
Figure 4.20. Comparison of 19F MAS NMR spectra of OH- and Al-rich phlogopites
K (Mg3-xAlx) (Al1+xSi3-xO10) (OH)y F2-y. Below the spectra the ratio I[F-Mg2Al]/(I[F-Mg2Al] + I[F-Mg3]) is given,
abbreviated as ‘Al/(Mg+Al)’. Spinning sidebands are marked by asterisks.
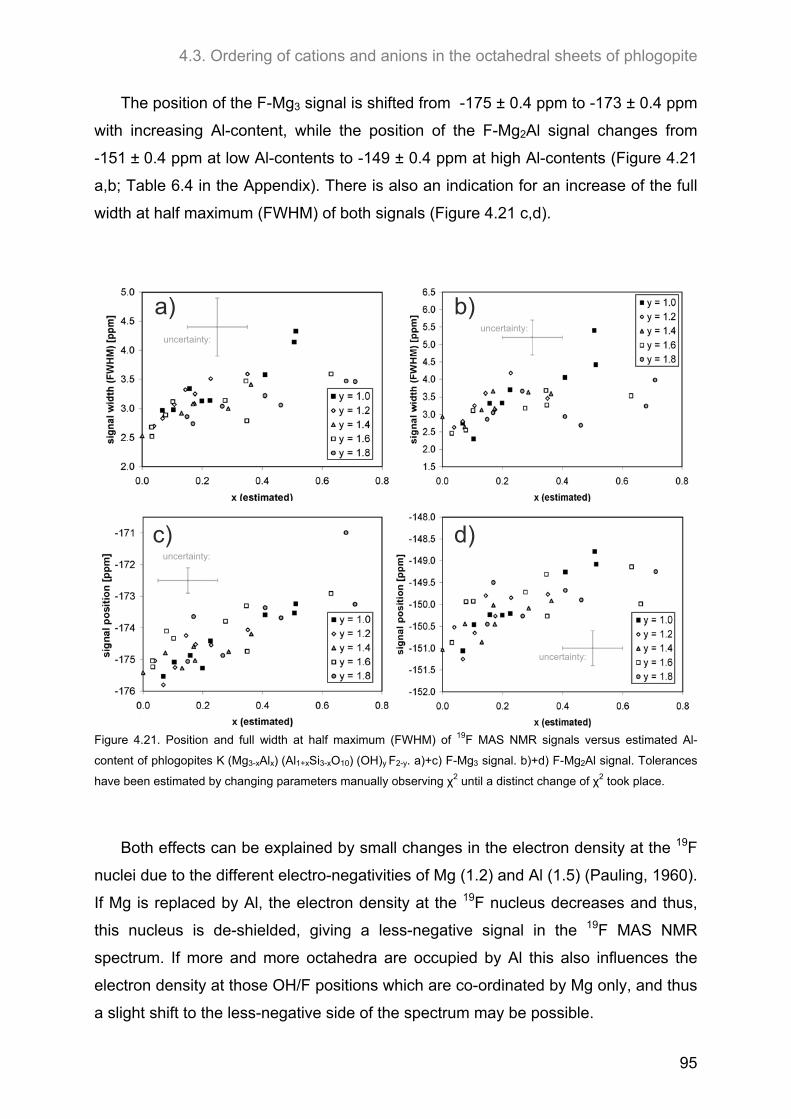
4.3. Ordering of cations and anions in the octahedral sheets of phlogopite
95
The position of the F-Mg3 signal is shifted from -175 ± 0.4 ppm to -173 ± 0.4 ppm
with increasing Al-content, while the position of the F-Mg2Al signal changes from
-151 ± 0.4 ppm at low Al-contents to -149 ± 0.4 ppm at high Al-contents (Figure 4.21
a,b; Table 6.4 in the Appendix). There is also an indication for an increase of the full
width at half maximum (FWHM) of both signals (Figure 4.21 c,d).
a)
c)
uncertainty:
uncertainty:
d)
uncertainty:
b)uncertainty:
Figure 4.21. Position and full width at half maximum (FWHM) of 19F MAS NMR signals versus estimated Al-
content of phlogopites K (Mg3-xAlx) (Al1+xSi3-xO10) (OH)y F2-y. a)+c) F-Mg3 signal. b)+d) F-Mg2Al signal. Tolerances
have been estimated by changing parameters manually observing χ2 until a distinct change of χ2 took place.
Both effects can be explained by small changes in the electron density at the 19F
nuclei due to the different electro-negativities of Mg (1.2) and Al (1.5) (Pauling, 1960).
If Mg is replaced by Al, the electron density at the 19F nucleus decreases and thus,
this nucleus is de-shielded, giving a less-negative signal in the 19F MAS NMR
spectrum. If more and more octahedra are occupied by Al this also influences the
electron density at those OH/F positions which are co-ordinated by Mg only, and thus
a slight shift to the less-negative side of the spectrum may be possible.
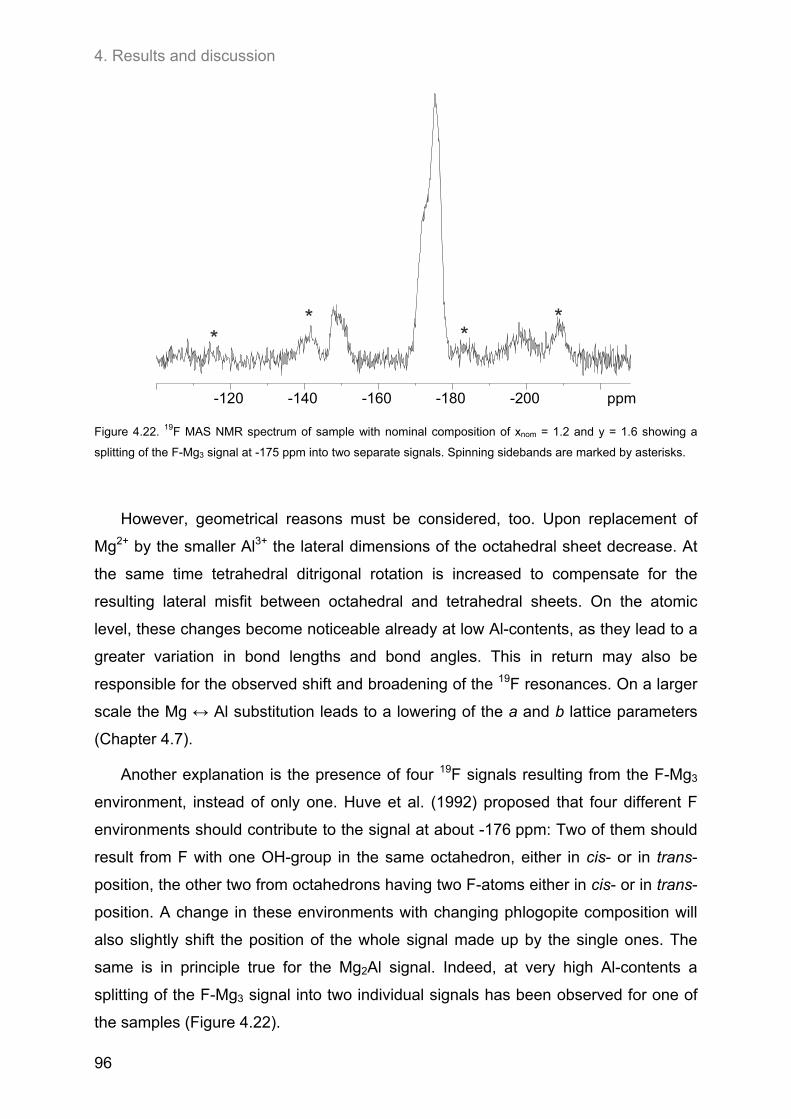
4. Results and discussion
96
-120 -140 -160 -180 -200 ppm
* ***
Figure 4.22. 19F MAS NMR spectrum of sample with nominal composition of xnom = 1.2 and y = 1.6 showing a
splitting of the F-Mg3 signal at -175 ppm into two separate signals. Spinning sidebands are marked by asterisks.
However, geometrical reasons must be considered, too. Upon replacement of
Mg2+ by the smaller Al3+ the lateral dimensions of the octahedral sheet decrease. At
the same time tetrahedral ditrigonal rotation is increased to compensate for the
resulting lateral misfit between octahedral and tetrahedral sheets. On the atomic
level, these changes become noticeable already at low Al-contents, as they lead to a
greater variation in bond lengths and bond angles. This in return may also be
responsible for the observed shift and broadening of the 19F resonances. On a larger
scale the Mg ↔ Al substitution leads to a lowering of the a and b lattice parameters
(Chapter 4.7).
Another explanation is the presence of four 19F signals resulting from the F-Mg3
environment, instead of only one. Huve et al. (1992) proposed that four different F
environments should contribute to the signal at about -176 ppm: Two of them should
result from F with one OH-group in the same octahedron, either in cis- or in trans-
position, the other two from octahedrons having two F-atoms either in cis- or in trans-
position. A change in these environments with changing phlogopite composition will
also slightly shift the position of the whole signal made up by the single ones. The
same is in principle true for the Mg2Al signal. Indeed, at very high Al-contents a
splitting of the F-Mg3 signal into two individual signals has been observed for one of
the samples (Figure 4.22).
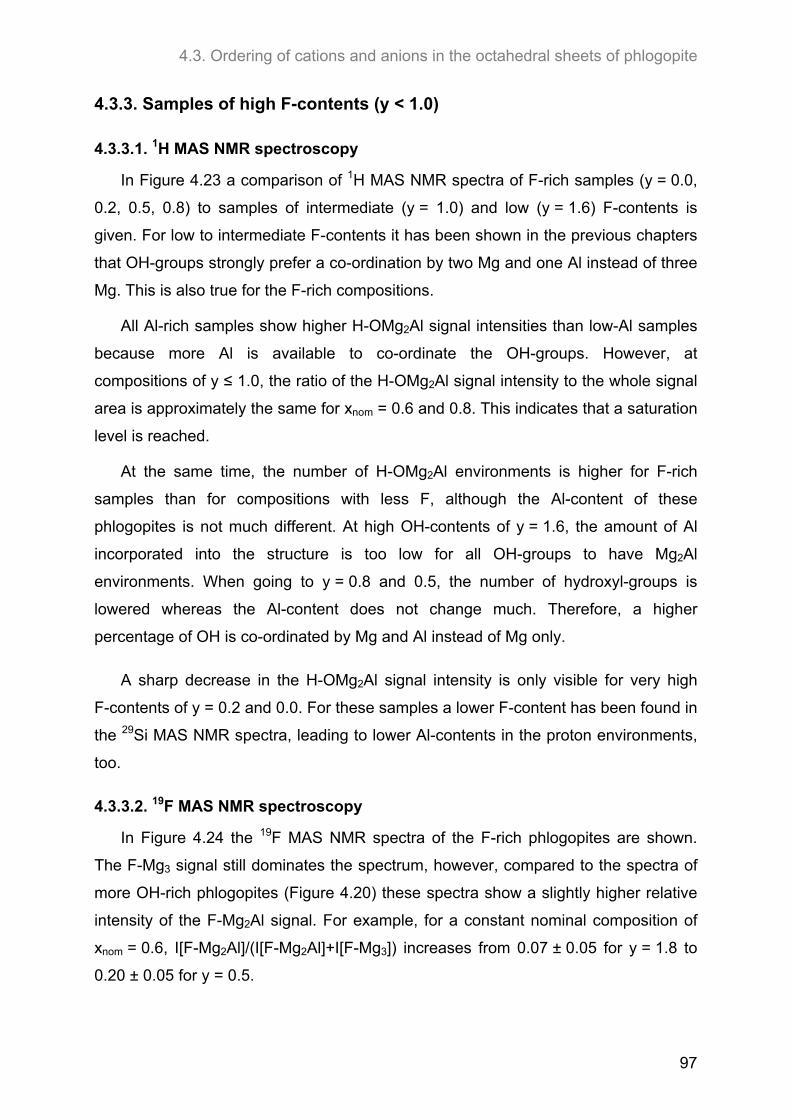
4.3. Ordering of cations and anions in the octahedral sheets of phlogopite
97
4.3.3. Samples of high F-contents (y < 1.0)
4.3.3.1. 1H MAS NMR spectroscopy
In Figure 4.23 a comparison of 1H MAS NMR spectra of F-rich samples (y = 0.0,
0.2, 0.5, 0.8) to samples of intermediate (y = 1.0) and low (y = 1.6) F-contents is
given. For low to intermediate F-contents it has been shown in the previous chapters
that OH-groups strongly prefer a co-ordination by two Mg and one Al instead of three
Mg. This is also true for the F-rich compositions.
All Al-rich samples show higher H-OMg2Al signal intensities than low-Al samples
because more Al is available to co-ordinate the OH-groups. However, at
compositions of y ≤ 1.0, the ratio of the H-OMg2Al signal intensity to the whole signal
area is approximately the same for xnom = 0.6 and 0.8. This indicates that a saturation
level is reached.
At the same time, the number of H-OMg2Al environments is higher for F-rich
samples than for compositions with less F, although the Al-content of these
phlogopites is not much different. At high OH-contents of y = 1.6, the amount of Al
incorporated into the structure is too low for all OH-groups to have Mg2Al
environments. When going to y = 0.8 and 0.5, the number of hydroxyl-groups is
lowered whereas the Al-content does not change much. Therefore, a higher
percentage of OH is co-ordinated by Mg and Al instead of Mg only.
A sharp decrease in the H-OMg2Al signal intensity is only visible for very high
F-contents of y = 0.2 and 0.0. For these samples a lower F-content has been found in
the 29Si MAS NMR spectra, leading to lower Al-contents in the proton environments,
too.
4.3.3.2. 19F MAS NMR spectroscopy
In Figure 4.24 the 19F MAS NMR spectra of the F-rich phlogopites are shown.
The F-Mg3 signal still dominates the spectrum, however, compared to the spectra of
more OH-rich phlogopites (Figure 4.20) these spectra show a slightly higher relative
intensity of the F-Mg2Al signal. For example, for a constant nominal composition of
xnom = 0.6, I[F-Mg2Al]/(I[F-Mg2Al]+I[F-Mg3]) increases from 0.07 ± 0.05 for y = 1.8 to
0.20 ± 0.05 for y = 0.5.
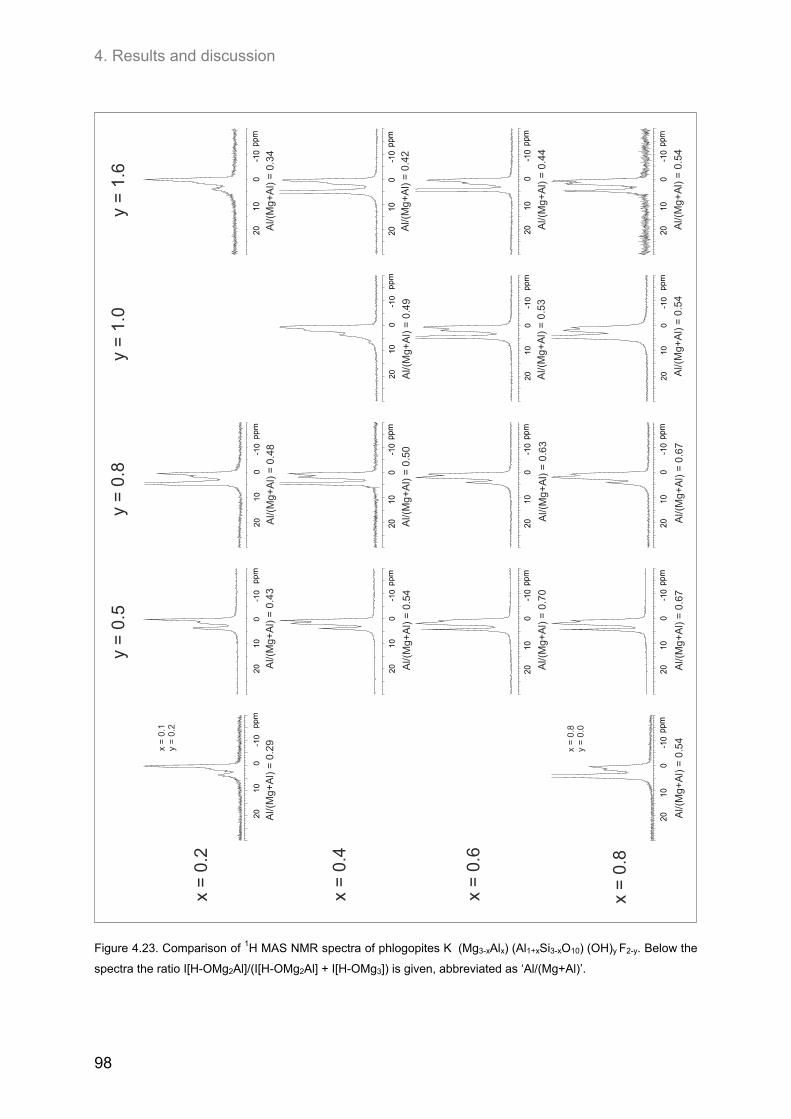
4. Results and discussion
98
y
= 0
.8y
= 0
.5
x =
0.2
x =
0.4
x =
0.6
x =
0.8
y =
1.0
y =
1.6
Al/(
Mg+
Al)
= 0
.48
Al/(
Mg+
Al)
= 0
.43
Al/(
Mg
+A
l) =
0.2
9
Al/(
Mg
+A
l) =
0.5
0A
l/(M
g+
Al)
= 0
.54
Al/(
Mg
+A
l) =
0.6
3A
l/(M
g+A
l) =
0.7
0
Al/(
Mg
+A
l) =
0.6
7A
l/(M
g+
Al)
= 0
.67
Al/(
Mg
+A
l) =
0.5
4
Al/(
Mg+
Al)
= 0
.49
Al/(
Mg+
Al)
= 0
.53
Al/(
Mg
+A
l) =
0.5
4
Al/(
Mg+
Al)
= 0
.34
Al/(
Mg
+A
l) =
0.4
2
Al/(
Mg+
Al)
= 0
.44
Al/(
Mg+
Al)
= 0
.54
Figure 4.23. Comparison of 1H MAS NMR spectra of phlogopites K (Mg3-xAlx) (Al1+xSi3-xO10) (OH)y F2-y. Below the
spectra the ratio I[H-OMg2Al]/(I[H-OMg2Al] + I[H-OMg3]) is given, abbreviated as ‘Al/(Mg+Al)’.
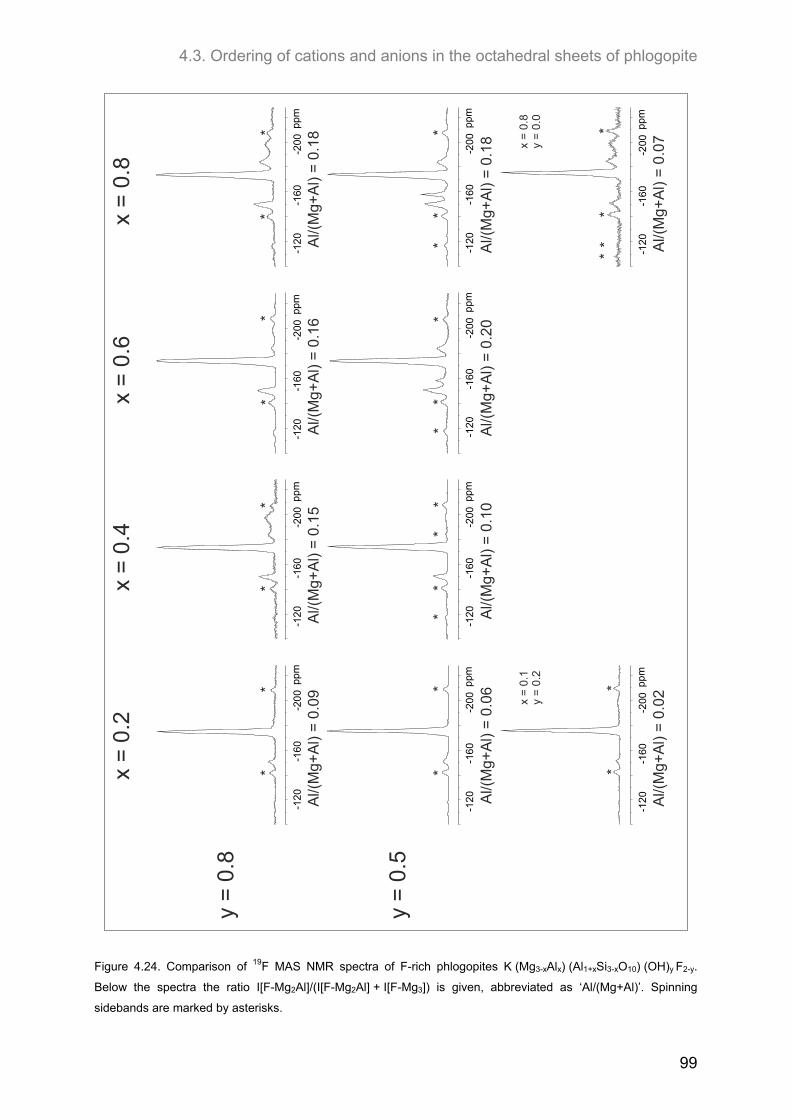
4.3. Ordering of cations and anions in the octahedral sheets of phlogopite
99
y =
0.8
y =
0.5
x =
0.2
x =
0.4
x =
0.6
x =
0.8
-120
-160
-20
0pp
m
-120
-16
0-2
00p
pm-1
20-1
60-2
00pp
m
-120
-160
-200
ppm
-120
-160
-200
ppm
-120
-160
-200
ppm
Al/(
Mg+
Al)
= 0
.09
Al/(
Mg+
Al)
= 0
.06
Al/(
Mg+
Al)
= 0
.02
Al/(
Mg+
Al)
= 0
.15
Al/(
Mg+
Al)
= 0
.10
Al/(
Mg+
Al)
= 0
.18
Al/(
Mg+
Al)
= 0
.16
Al/(
Mg+
Al)
= 0
.20
Al/(
Mg+
Al)
= 0
.07
Al/(
Mg+
Al)
= 0
.18
x =
0.1
y =
0.2
x =
0.8
y =
0.0
-120
-160
-200
ppm
-120
-160
-200
ppm
-120
-160
-200
ppm
-12
0-1
60-2
00pp
m
**
**
**
** *
**
**
**
**
**
* **
**
**
Figure 4.24. Comparison of 19F MAS NMR spectra of F-rich phlogopites K (Mg3-xAlx) (Al1+xSi3-xO10) (OH)y F2-y.
Below the spectra the ratio I[F-Mg2Al]/(I[F-Mg2Al] + I[F-Mg3]) is given, abbreviated as ‘Al/(Mg+Al)’. Spinning
sidebands are marked by asterisks.
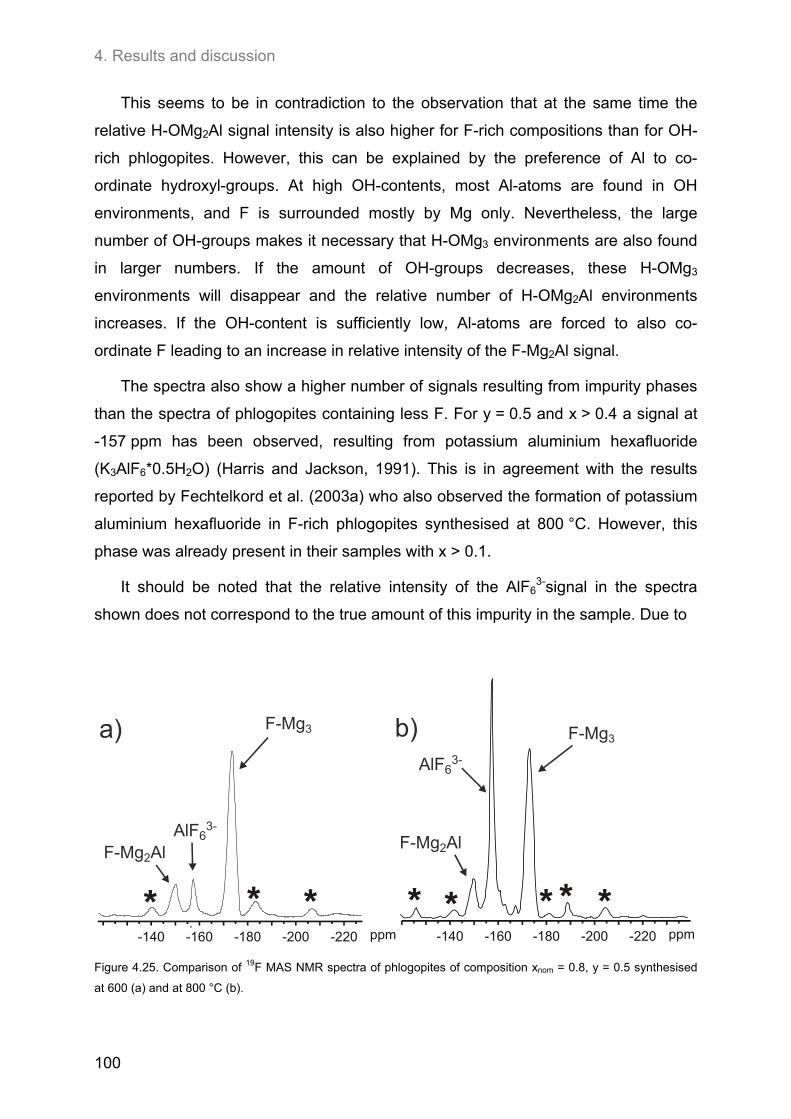
4. Results and discussion
100
This seems to be in contradiction to the observation that at the same time the
relative H-OMg2Al signal intensity is also higher for F-rich compositions than for OH-
rich phlogopites. However, this can be explained by the preference of Al to co-
ordinate hydroxyl-groups. At high OH-contents, most Al-atoms are found in OH
environments, and F is surrounded mostly by Mg only. Nevertheless, the large
number of OH-groups makes it necessary that H-OMg3 environments are also found
in larger numbers. If the amount of OH-groups decreases, these H-OMg3
environments will disappear and the relative number of H-OMg2Al environments
increases. If the OH-content is sufficiently low, Al-atoms are forced to also co-
ordinate F leading to an increase in relative intensity of the F-Mg2Al signal.
The spectra also show a higher number of signals resulting from impurity phases
than the spectra of phlogopites containing less F. For y = 0.5 and x > 0.4 a signal at
-157 ppm has been observed, resulting from potassium aluminium hexafluoride
(K3AlF6*0.5H2O) (Harris and Jackson, 1991). This is in agreement with the results
reported by Fechtelkord et al. (2003a) who also observed the formation of potassium
aluminium hexafluoride in F-rich phlogopites synthesised at 800 °C. However, this
phase was already present in their samples with x > 0.1.
It should be noted that the relative intensity of the AlF63-signal in the spectra
shown does not correspond to the true amount of this impurity in the sample. Due to
* * *
F-Mg3
F-Mg Al2
AlF63-
a)
* ** *ppm-220-200-180-160-140
*
F-Mg3
F-Mg Al2
AlF63-
b)
ppm-220-200-180-160-140
Figure 4.25. Comparison of 19F MAS NMR spectra of phlogopites of composition xnom = 0.8, y = 0.5 synthesised
at 600 (a) and at 800 °C (b).
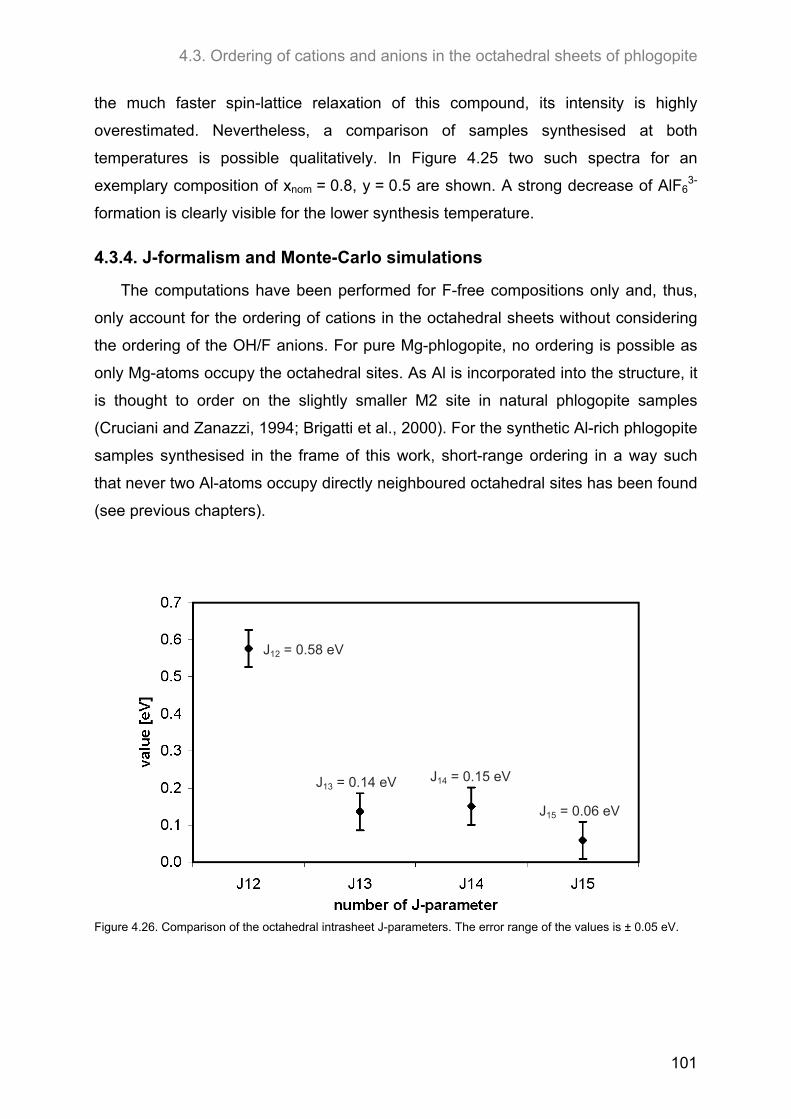
4.3. Ordering of cations and anions in the octahedral sheets of phlogopite
101
the much faster spin-lattice relaxation of this compound, its intensity is highly
overestimated. Nevertheless, a comparison of samples synthesised at both
temperatures is possible qualitatively. In Figure 4.25 two such spectra for an
exemplary composition of xnom = 0.8, y = 0.5 are shown. A strong decrease of AlF63-
formation is clearly visible for the lower synthesis temperature.
4.3.4. J-formalism and Monte-Carlo simulations
The computations have been performed for F-free compositions only and, thus,
only account for the ordering of cations in the octahedral sheets without considering
the ordering of the OH/F anions. For pure Mg-phlogopite, no ordering is possible as
only Mg-atoms occupy the octahedral sites. As Al is incorporated into the structure, it
is thought to order on the slightly smaller M2 site in natural phlogopite samples
(Cruciani and Zanazzi, 1994; Brigatti et al., 2000). For the synthetic Al-rich phlogopite
samples synthesised in the frame of this work, short-range ordering in a way such
that never two Al-atoms occupy directly neighboured octahedral sites has been found
(see previous chapters).
J = 0.58 eV12
J = 0.14 eV13J = 0.15 eV14
J = 0.06 eV15
Figure 4.26. Comparison of the octahedral intrasheet J-parameters. The error range of the values is ± 0.05 eV.
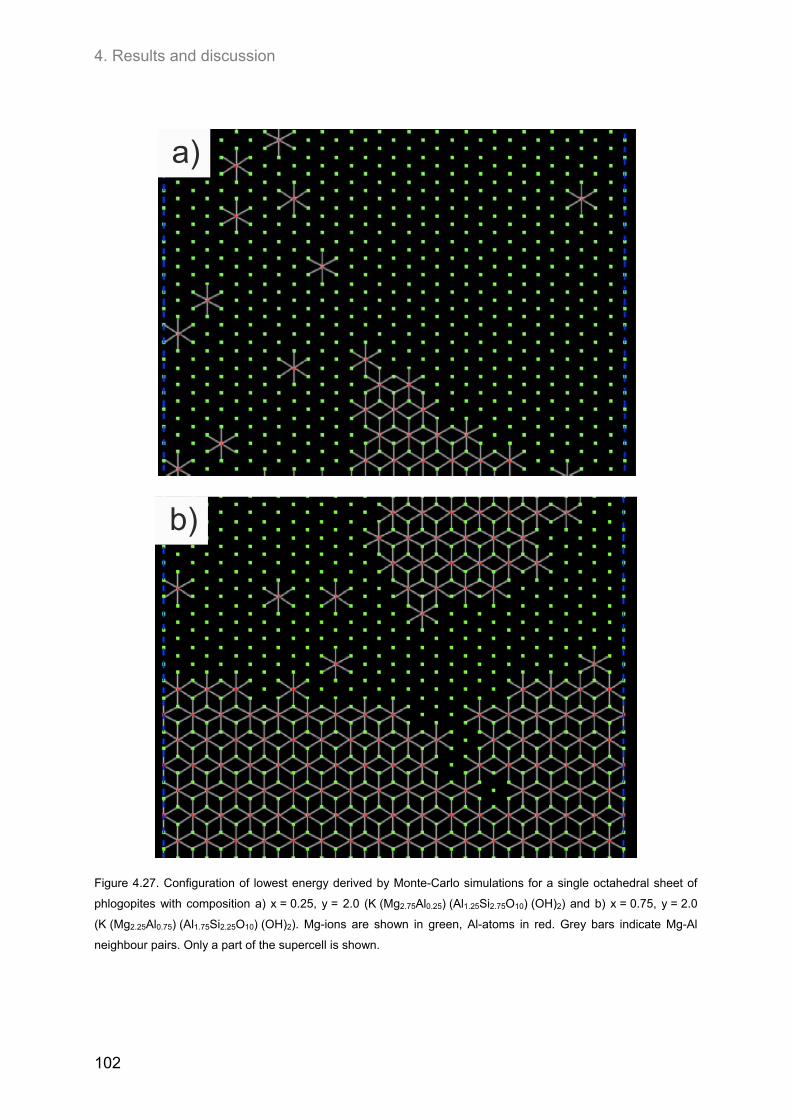
4. Results and discussion
102
a)
b)
Figure 4.27. Configuration of lowest energy derived by Monte-Carlo simulations for a single octahedral sheet of
phlogopites with composition a) x = 0.25, y = 2.0 (K (Mg2.75Al0.25) (Al1.25Si2.75O10) (OH)2) and b) x = 0.75, y = 2.0
(K (Mg2.25Al0.75) (Al1.75Si2.25O10) (OH)2). Mg-ions are shown in green, Al-atoms in red. Grey bars indicate Mg-Al
neighbour pairs. Only a part of the supercell is shown.
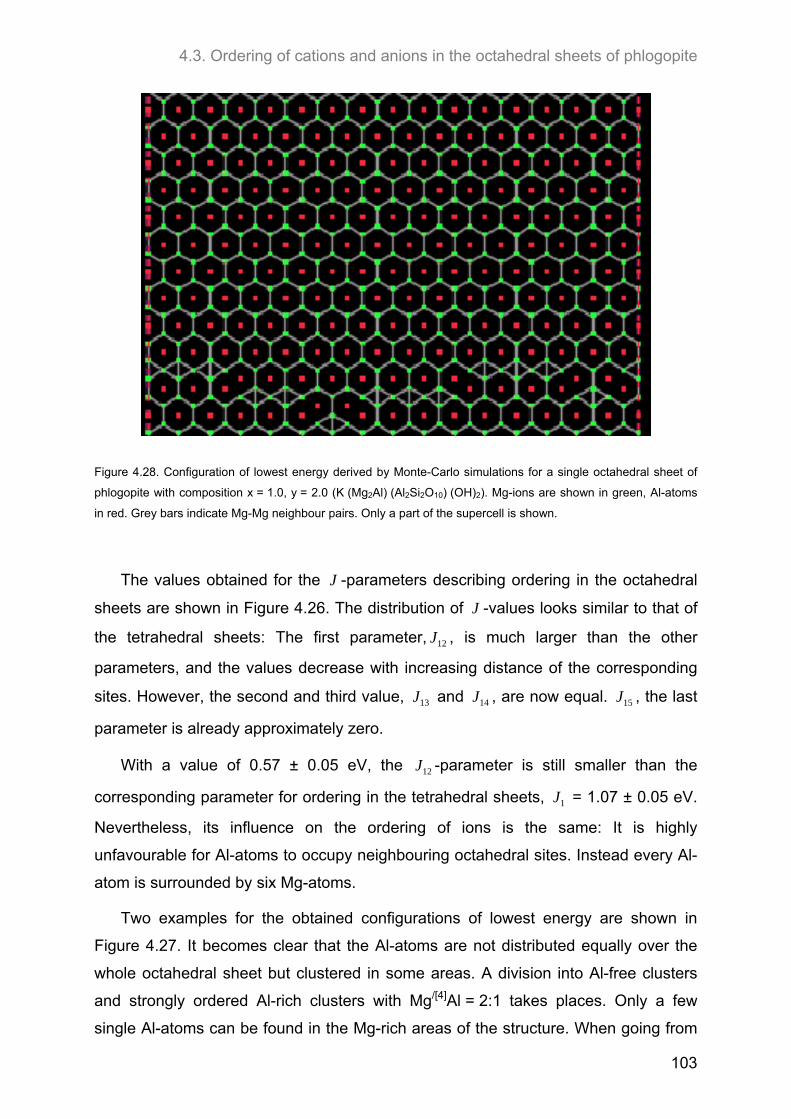
4.3. Ordering of cations and anions in the octahedral sheets of phlogopite
103
Figure 4.28. Configuration of lowest energy derived by Monte-Carlo simulations for a single octahedral sheet of
phlogopite with composition x = 1.0, y = 2.0 (K (Mg2Al) (Al2Si2O10) (OH)2). Mg-ions are shown in green, Al-atoms
in red. Grey bars indicate Mg-Mg neighbour pairs. Only a part of the supercell is shown.
The values obtained for the J -parameters describing ordering in the octahedral
sheets are shown in Figure 4.26. The distribution of J -values looks similar to that of
the tetrahedral sheets: The first parameter, 12J , is much larger than the other
parameters, and the values decrease with increasing distance of the corresponding
sites. However, the second and third value, 13J and 14J , are now equal. 15J , the last
parameter is already approximately zero.
With a value of 0.57 ± 0.05 eV, the 12J -parameter is still smaller than the
corresponding parameter for ordering in the tetrahedral sheets, 1J = 1.07 ± 0.05 eV.
Nevertheless, its influence on the ordering of ions is the same: It is highly
unfavourable for Al-atoms to occupy neighbouring octahedral sites. Instead every Al-
atom is surrounded by six Mg-atoms.
Two examples for the obtained configurations of lowest energy are shown in
Figure 4.27. It becomes clear that the Al-atoms are not distributed equally over the
whole octahedral sheet but clustered in some areas. A division into Al-free clusters
and strongly ordered Al-rich clusters with Mg/[4]Al = 2:1 takes places. Only a few
single Al-atoms can be found in the Mg-rich areas of the structure. When going from
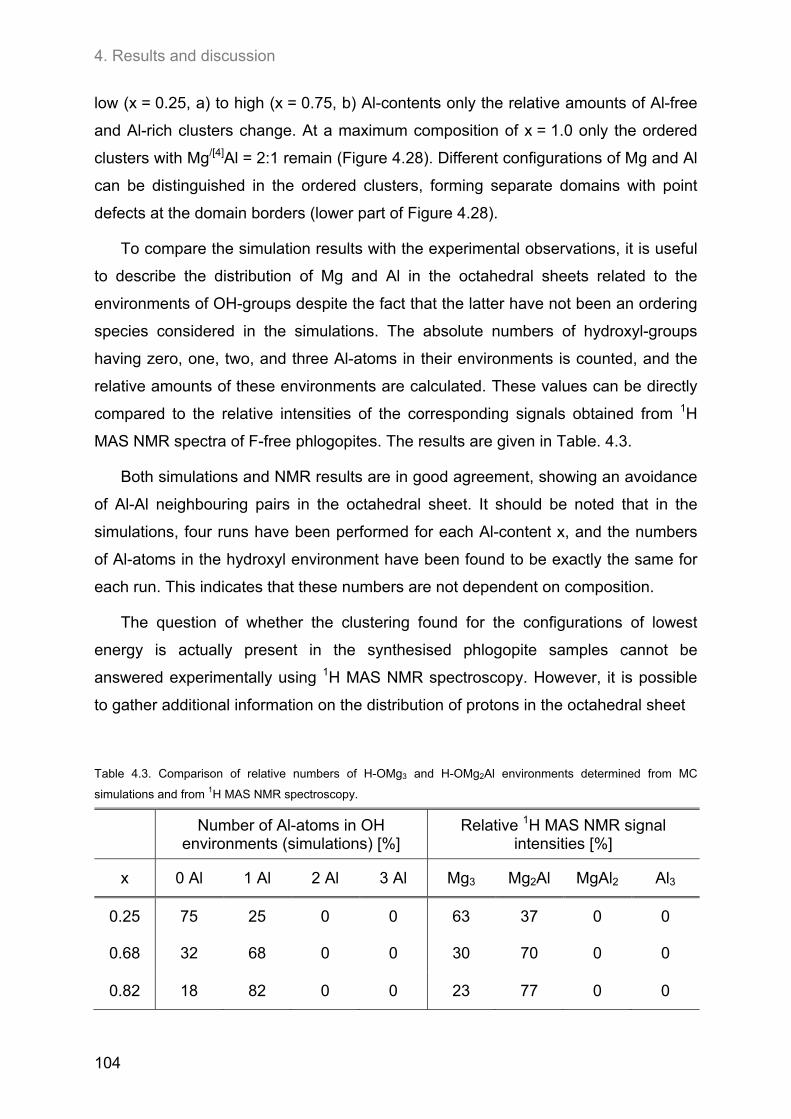
4. Results and discussion
104
low (x = 0.25, a) to high (x = 0.75, b) Al-contents only the relative amounts of Al-free
and Al-rich clusters change. At a maximum composition of x = 1.0 only the ordered
clusters with Mg/[4]Al = 2:1 remain (Figure 4.28). Different configurations of Mg and Al
can be distinguished in the ordered clusters, forming separate domains with point
defects at the domain borders (lower part of Figure 4.28).
To compare the simulation results with the experimental observations, it is useful
to describe the distribution of Mg and Al in the octahedral sheets related to the
environments of OH-groups despite the fact that the latter have not been an ordering
species considered in the simulations. The absolute numbers of hydroxyl-groups
having zero, one, two, and three Al-atoms in their environments is counted, and the
relative amounts of these environments are calculated. These values can be directly
compared to the relative intensities of the corresponding signals obtained from 1H
MAS NMR spectra of F-free phlogopites. The results are given in Table. 4.3.
Both simulations and NMR results are in good agreement, showing an avoidance
of Al-Al neighbouring pairs in the octahedral sheet. It should be noted that in the
simulations, four runs have been performed for each Al-content x, and the numbers
of Al-atoms in the hydroxyl environment have been found to be exactly the same for
each run. This indicates that these numbers are not dependent on composition.
The question of whether the clustering found for the configurations of lowest
energy is actually present in the synthesised phlogopite samples cannot be
answered experimentally using 1H MAS NMR spectroscopy. However, it is possible
to gather additional information on the distribution of protons in the octahedral sheet
Table 4.3. Comparison of relative numbers of H-OMg3 and H-OMg2Al environments determined from MC
simulations and from 1H MAS NMR spectroscopy.
Number of Al-atoms in OH
environments (simulations) [%] Relative 1H MAS NMR signal
intensities [%]
x 0 Al 1 Al 2 Al 3 Al Mg3 Mg2Al MgAl2 Al3
0.25 75 25 0 0 63 37 0 0
0.68 32 68 0 0 30 70 0 0
0.82 18 82 0 0 23 77 0 0

4.3. Ordering of cations and anions in the octahedral sheets of phlogopite
105
when investigating the relationship between the ordering in the two types of sheets
by {1H} → 29Si CPMAS NMR spectroscopy as is described in Chapter 4.4. The
results presented there confirm the observed clustering of Al in the octahedral
sheets.
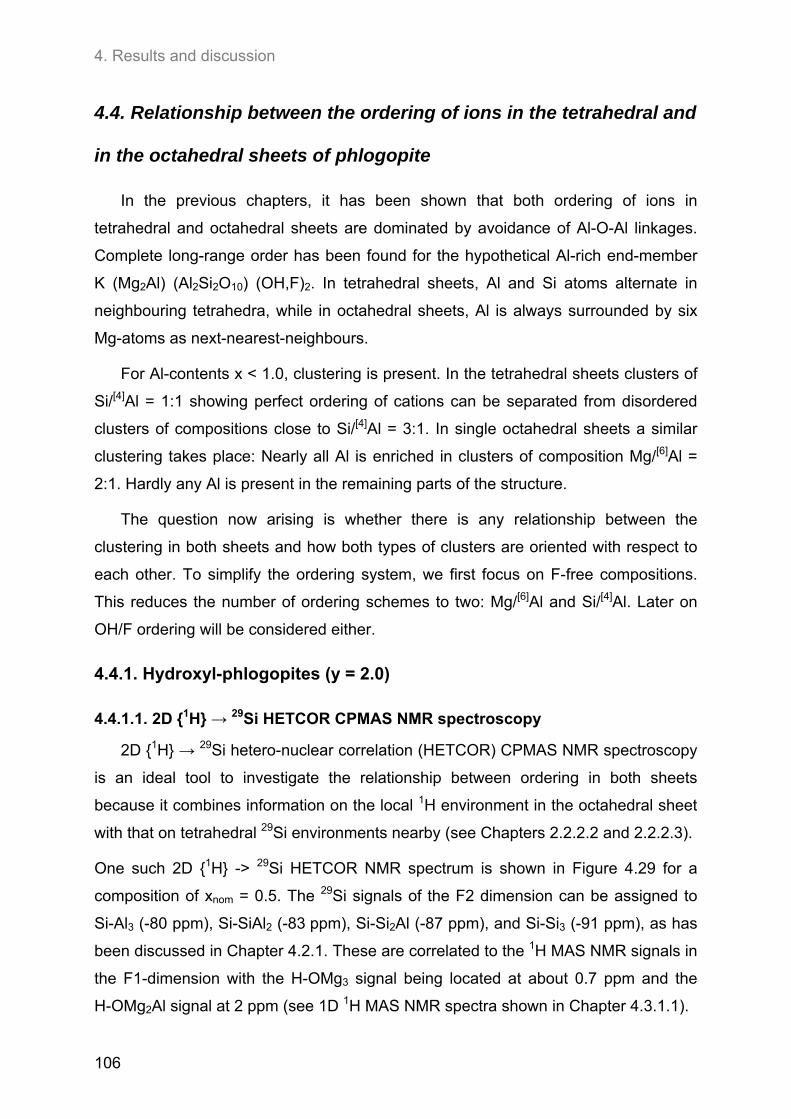
4. Results and discussion
106
4.4. Relationship between the ordering of ions in the tetrahedral and
in the octahedral sheets of phlogopite
In the previous chapters, it has been shown that both ordering of ions in
tetrahedral and octahedral sheets are dominated by avoidance of Al-O-Al linkages.
Complete long-range order has been found for the hypothetical Al-rich end-member
K (Mg2Al) (Al2Si2O10) (OH,F)2. In tetrahedral sheets, Al and Si atoms alternate in
neighbouring tetrahedra, while in octahedral sheets, Al is always surrounded by six
Mg-atoms as next-nearest-neighbours.
For Al-contents x < 1.0, clustering is present. In the tetrahedral sheets clusters of
Si/[4]Al = 1:1 showing perfect ordering of cations can be separated from disordered
clusters of compositions close to Si/[4]Al = 3:1. In single octahedral sheets a similar
clustering takes place: Nearly all Al is enriched in clusters of composition Mg/[6]Al =
2:1. Hardly any Al is present in the remaining parts of the structure.
The question now arising is whether there is any relationship between the
clustering in both sheets and how both types of clusters are oriented with respect to
each other. To simplify the ordering system, we first focus on F-free compositions.
This reduces the number of ordering schemes to two: Mg/[6]Al and Si/[4]Al. Later on
OH/F ordering will be considered either.
4.4.1. Hydroxyl-phlogopites (y = 2.0)
4.4.1.1. 2D {1H} → 29Si HETCOR CPMAS NMR spectroscopy
2D {1H} → 29Si hetero-nuclear correlation (HETCOR) CPMAS NMR spectroscopy
is an ideal tool to investigate the relationship between ordering in both sheets
because it combines information on the local 1H environment in the octahedral sheet
with that on tetrahedral 29Si environments nearby (see Chapters 2.2.2.2 and 2.2.2.3).
One such 2D {1H} -> 29Si HETCOR NMR spectrum is shown in Figure 4.29 for a
composition of xnom = 0.5. The 29Si signals of the F2 dimension can be assigned to
Si-Al3 (-80 ppm), Si-SiAl2 (-83 ppm), Si-Si2Al (-87 ppm), and Si-Si3 (-91 ppm), as has
been discussed in Chapter 4.2.1. These are correlated to the 1H MAS NMR signals in
the F1-dimension with the H-OMg3 signal being located at about 0.7 ppm and the
H-OMg2Al signal at 2 ppm (see 1D 1H MAS NMR spectra shown in Chapter 4.3.1.1).
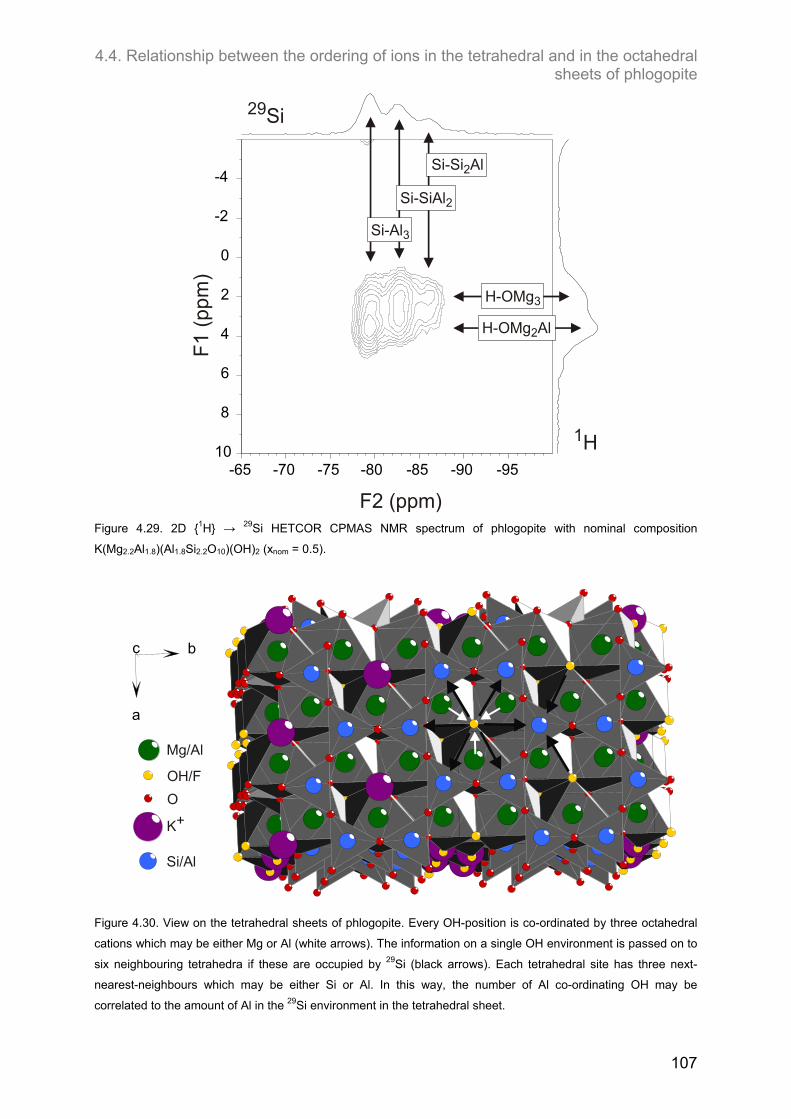
4.4. Relationship between the ordering of ions in the tetrahedral and in the octahedral sheets of phlogopite
107
-65 -70 -75 -80 -85 -90 -95
-4
-2
10
8
6
4
2
0
F2 (ppm)
F1
(ppm
)
29Si
1H
Si-Si2Al
Si-SiAl2
Si-Al3
H-OMg3
H-OMg Al2
Figure 4.29. 2D {1H} → 29Si HETCOR CPMAS NMR spectrum of phlogopite with nominal composition
K(Mg2.2Al1.8)(Al1.8Si2.2O10)(OH)2 (xnom = 0.5).
a
bc
Mg/Al
OH/F
O
K+
Si/Al
Figure 4.30. View on the tetrahedral sheets of phlogopite. Every OH-position is co-ordinated by three octahedral
cations which may be either Mg or Al (white arrows). The information on a single OH environment is passed on to
six neighbouring tetrahedra if these are occupied by 29Si (black arrows). Each tetrahedral site has three next-
nearest-neighbours which may be either Si or Al. In this way, the number of Al co-ordinating OH may be
correlated to the amount of Al in the 29Si environment in the tetrahedral sheet.
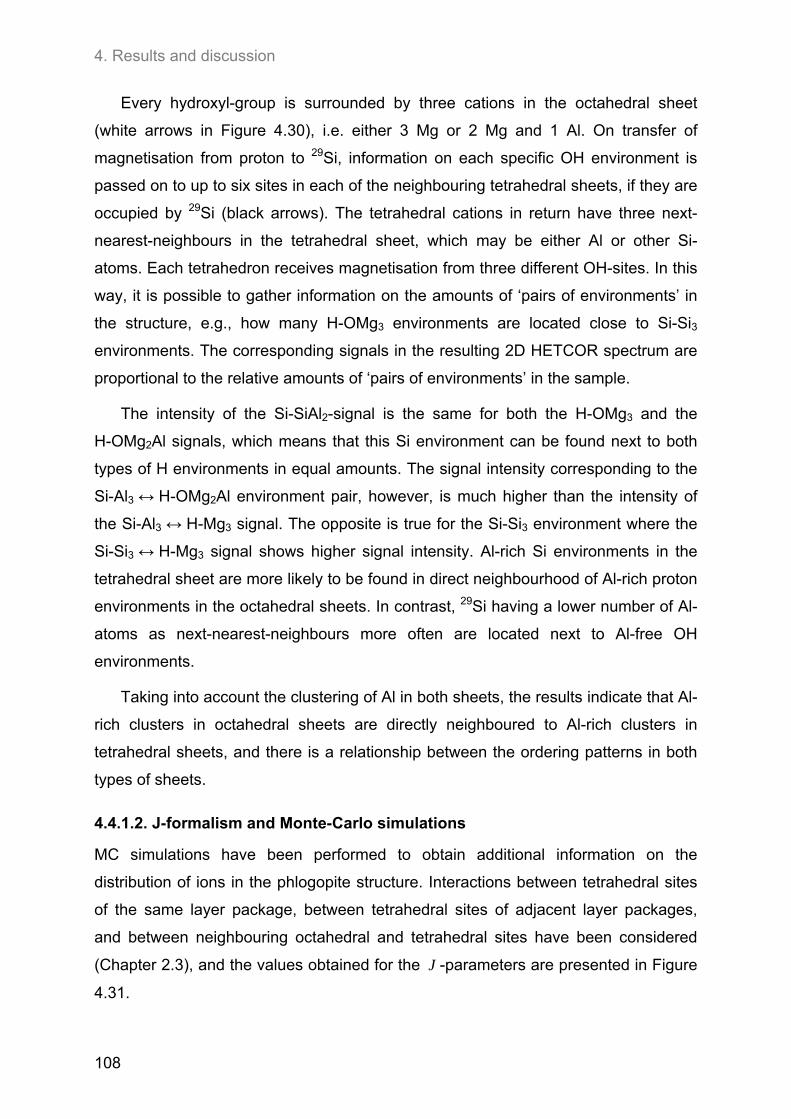
4. Results and discussion
108
Every hydroxyl-group is surrounded by three cations in the octahedral sheet
(white arrows in Figure 4.30), i.e. either 3 Mg or 2 Mg and 1 Al. On transfer of
magnetisation from proton to 29Si, information on each specific OH environment is
passed on to up to six sites in each of the neighbouring tetrahedral sheets, if they are
occupied by 29Si (black arrows). The tetrahedral cations in return have three next-
nearest-neighbours in the tetrahedral sheet, which may be either Al or other Si-
atoms. Each tetrahedron receives magnetisation from three different OH-sites. In this
way, it is possible to gather information on the amounts of ‘pairs of environments’ in
the structure, e.g., how many H-OMg3 environments are located close to Si-Si3
environments. The corresponding signals in the resulting 2D HETCOR spectrum are
proportional to the relative amounts of ‘pairs of environments’ in the sample.
The intensity of the Si-SiAl2-signal is the same for both the H-OMg3 and the
H-OMg2Al signals, which means that this Si environment can be found next to both
types of H environments in equal amounts. The signal intensity corresponding to the
Si-Al3 ↔ H-OMg2Al environment pair, however, is much higher than the intensity of
the Si-Al3 ↔ H-Mg3 signal. The opposite is true for the Si-Si3 environment where the
Si-Si3 ↔ H-Mg3 signal shows higher signal intensity. Al-rich Si environments in the
tetrahedral sheet are more likely to be found in direct neighbourhood of Al-rich proton
environments in the octahedral sheets. In contrast, 29Si having a lower number of Al-
atoms as next-nearest-neighbours more often are located next to Al-free OH
environments.
Taking into account the clustering of Al in both sheets, the results indicate that Al-
rich clusters in octahedral sheets are directly neighboured to Al-rich clusters in
tetrahedral sheets, and there is a relationship between the ordering patterns in both
types of sheets.
4.4.1.2. J-formalism and Monte-Carlo simulations
MC simulations have been performed to obtain additional information on the
distribution of ions in the phlogopite structure. Interactions between tetrahedral sites
of the same layer package, between tetrahedral sites of adjacent layer packages,
and between neighbouring octahedral and tetrahedral sites have been considered
(Chapter 2.3), and the values obtained for the J -parameters are presented in Figure
4.31.
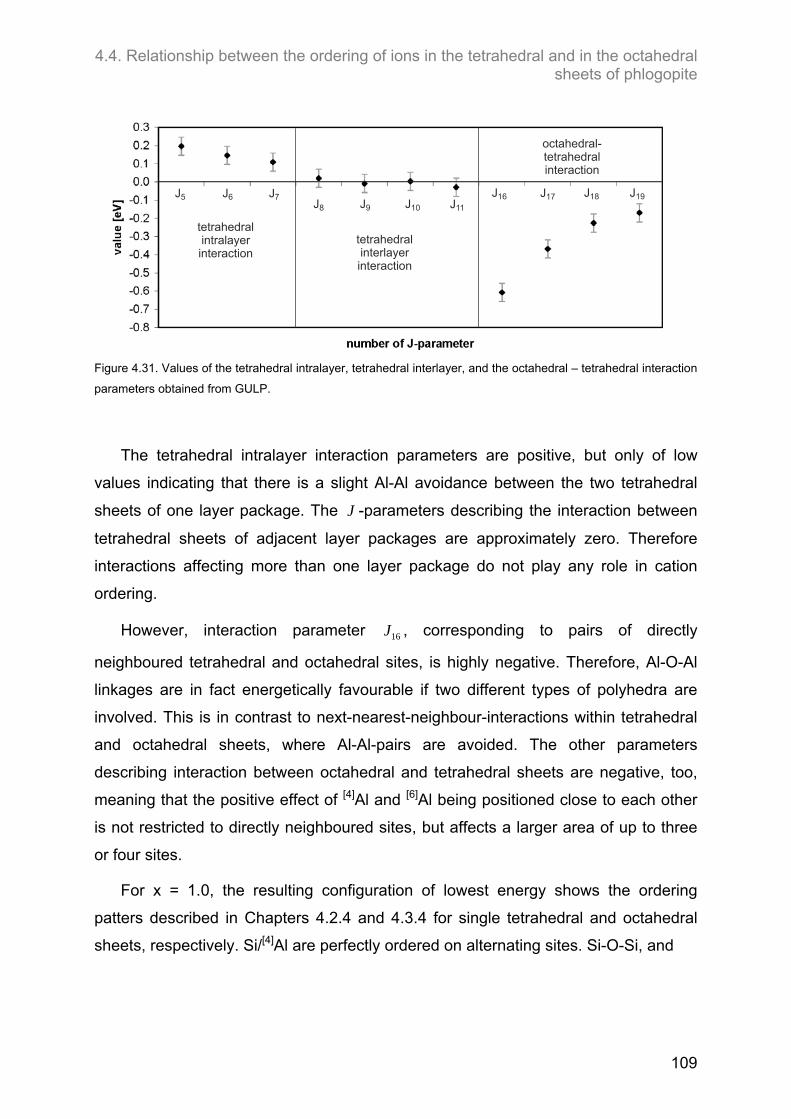
4.4. Relationship between the ordering of ions in the tetrahedral and in the octahedral sheets of phlogopite
109
J5 J6J11J8 J9 J10
J7 J16 J17 J18 J19
tetrahedralintralayerinteraction
tetrahedralinterlayerinteraction
octahedral-tetrahedralinteraction
Figure 4.31. Values of the tetrahedral intralayer, tetrahedral interlayer, and the octahedral – tetrahedral interaction
parameters obtained from GULP.
The tetrahedral intralayer interaction parameters are positive, but only of low
values indicating that there is a slight Al-Al avoidance between the two tetrahedral
sheets of one layer package. The J -parameters describing the interaction between
tetrahedral sheets of adjacent layer packages are approximately zero. Therefore
interactions affecting more than one layer package do not play any role in cation
ordering.
However, interaction parameter 16J , corresponding to pairs of directly
neighboured tetrahedral and octahedral sites, is highly negative. Therefore, Al-O-Al
linkages are in fact energetically favourable if two different types of polyhedra are
involved. This is in contrast to next-nearest-neighbour-interactions within tetrahedral
and octahedral sheets, where Al-Al-pairs are avoided. The other parameters
describing interaction between octahedral and tetrahedral sheets are negative, too,
meaning that the positive effect of [4]Al and [6]Al being positioned close to each other
is not restricted to directly neighboured sites, but affects a larger area of up to three
or four sites.
For x = 1.0, the resulting configuration of lowest energy shows the ordering
patters described in Chapters 4.2.4 and 4.3.4 for single tetrahedral and octahedral
sheets, respectively. Si/[4]Al are perfectly ordered on alternating sites. Si-O-Si, and
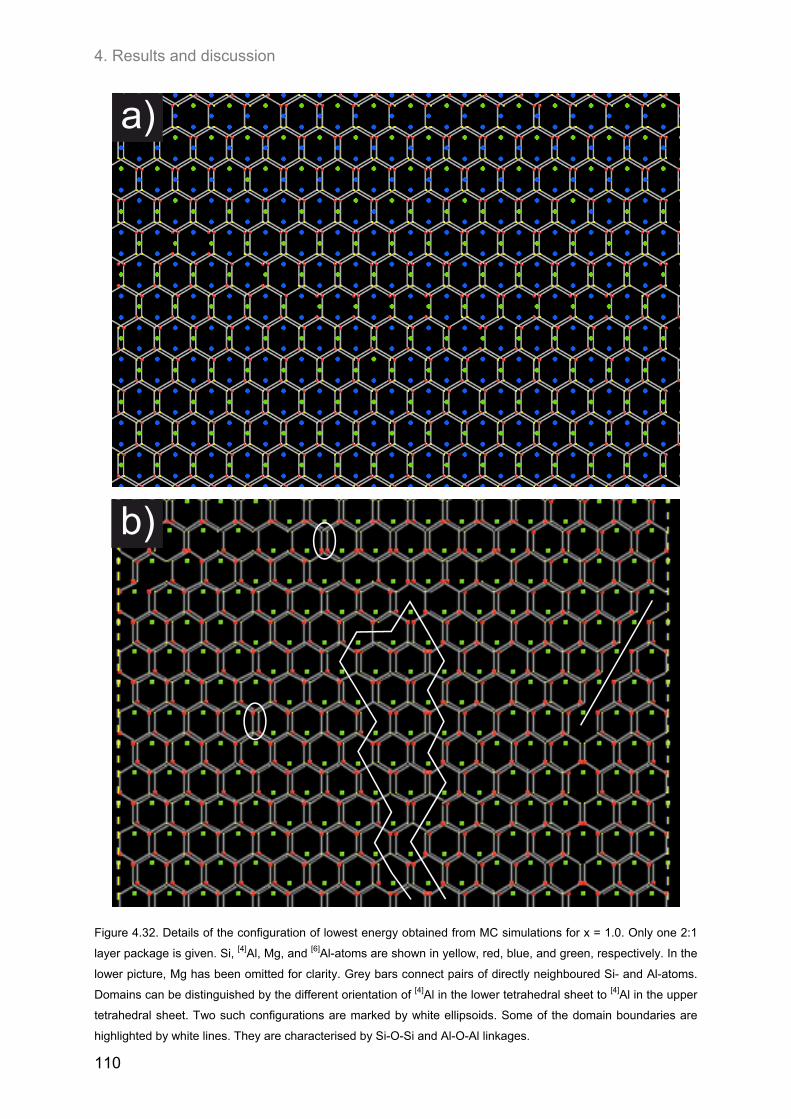
4. Results and discussion
110
a)
b)
Figure 4.32. Details of the configuration of lowest energy obtained from MC simulations for x = 1.0. Only one 2:1
layer package is given. Si, [4]Al, Mg, and [6]Al-atoms are shown in yellow, red, blue, and green, respectively. In the
lower picture, Mg has been omitted for clarity. Grey bars connect pairs of directly neighboured Si- and Al-atoms.
Domains can be distinguished by the different orientation of [4]Al in the lower tetrahedral sheet to [4]Al in the upper
tetrahedral sheet. Two such configurations are marked by white ellipsoids. Some of the domain boundaries are
highlighted by white lines. They are characterised by Si-O-Si and Al-O-Al linkages.
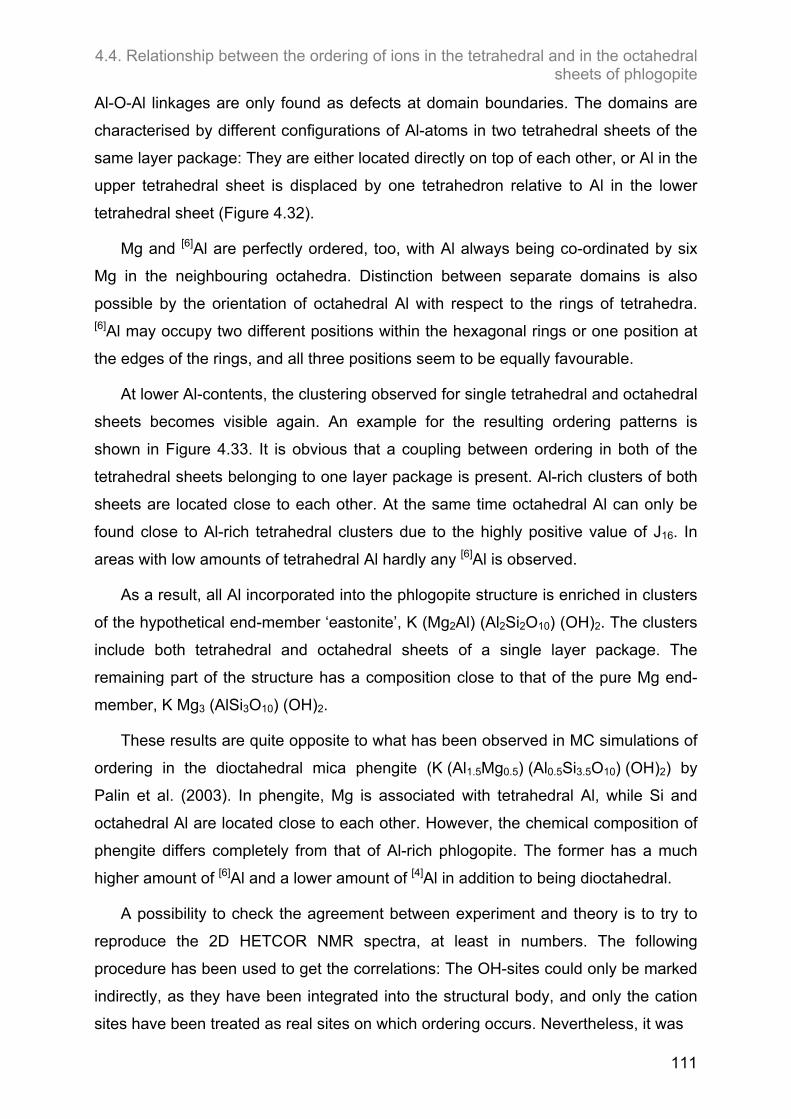
4.4. Relationship between the ordering of ions in the tetrahedral and in the octahedral sheets of phlogopite
111
Al-O-Al linkages are only found as defects at domain boundaries. The domains are
characterised by different configurations of Al-atoms in two tetrahedral sheets of the
same layer package: They are either located directly on top of each other, or Al in the
upper tetrahedral sheet is displaced by one tetrahedron relative to Al in the lower
tetrahedral sheet (Figure 4.32).
Mg and [6]Al are perfectly ordered, too, with Al always being co-ordinated by six
Mg in the neighbouring octahedra. Distinction between separate domains is also
possible by the orientation of octahedral Al with respect to the rings of tetrahedra. [6]Al may occupy two different positions within the hexagonal rings or one position at
the edges of the rings, and all three positions seem to be equally favourable.
At lower Al-contents, the clustering observed for single tetrahedral and octahedral
sheets becomes visible again. An example for the resulting ordering patterns is
shown in Figure 4.33. It is obvious that a coupling between ordering in both of the
tetrahedral sheets belonging to one layer package is present. Al-rich clusters of both
sheets are located close to each other. At the same time octahedral Al can only be
found close to Al-rich tetrahedral clusters due to the highly positive value of J16. In
areas with low amounts of tetrahedral Al hardly any [6]Al is observed.
As a result, all Al incorporated into the phlogopite structure is enriched in clusters
of the hypothetical end-member ‘eastonite’, K (Mg2Al) (Al2Si2O10) (OH)2. The clusters
include both tetrahedral and octahedral sheets of a single layer package. The
remaining part of the structure has a composition close to that of the pure Mg end-
member, K Mg3 (AlSi3O10) (OH)2.
These results are quite opposite to what has been observed in MC simulations of
ordering in the dioctahedral mica phengite (K (Al1.5Mg0.5) (Al0.5Si3.5O10) (OH)2) by
Palin et al. (2003). In phengite, Mg is associated with tetrahedral Al, while Si and
octahedral Al are located close to each other. However, the chemical composition of
phengite differs completely from that of Al-rich phlogopite. The former has a much
higher amount of [6]Al and a lower amount of [4]Al in addition to being dioctahedral.
A possibility to check the agreement between experiment and theory is to try to
reproduce the 2D HETCOR NMR spectra, at least in numbers. The following
procedure has been used to get the correlations: The OH-sites could only be marked
indirectly, as they have been integrated into the structural body, and only the cation
sites have been treated as real sites on which ordering occurs. Nevertheless, it was
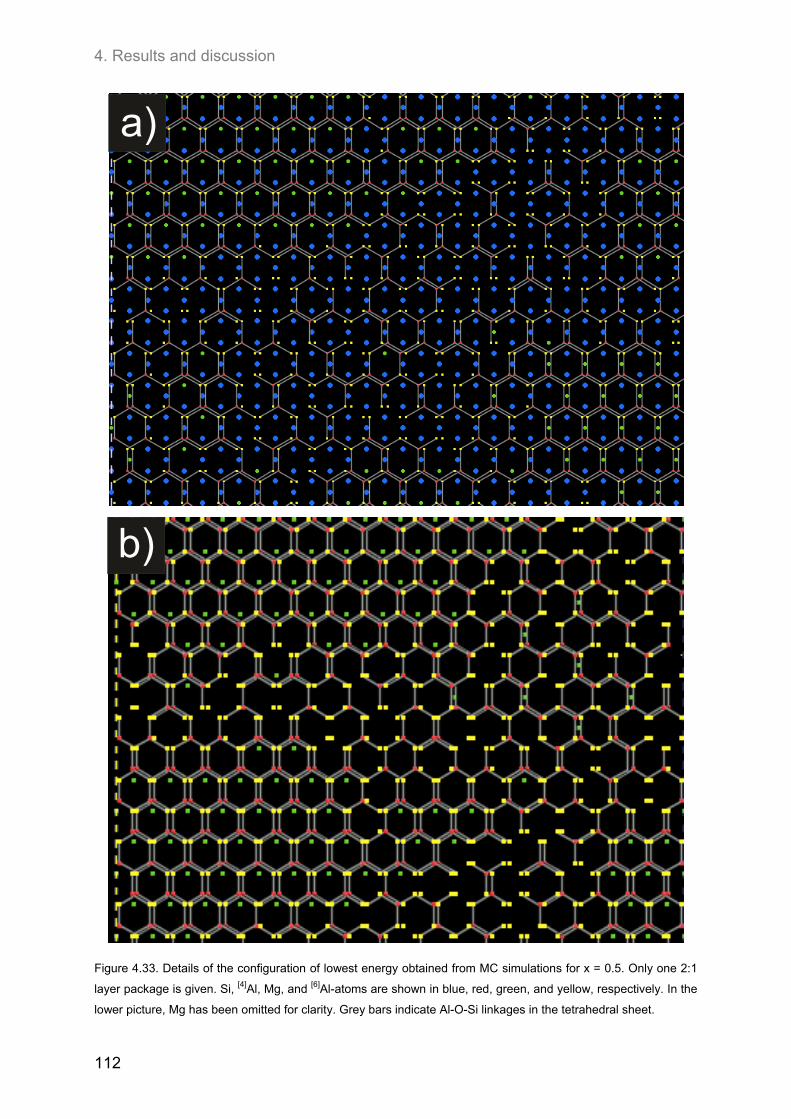
4. Results and discussion
112
b)
a)
Figure 4.33. Details of the configuration of lowest energy obtained from MC simulations for x = 0.5. Only one 2:1
layer package is given. Si, [4]Al, Mg, and [6]Al-atoms are shown in blue, red, green, and yellow, respectively. In the
lower picture, Mg has been omitted for clarity. Grey bars indicate Al-O-Si linkages in the tetrahedral sheet.
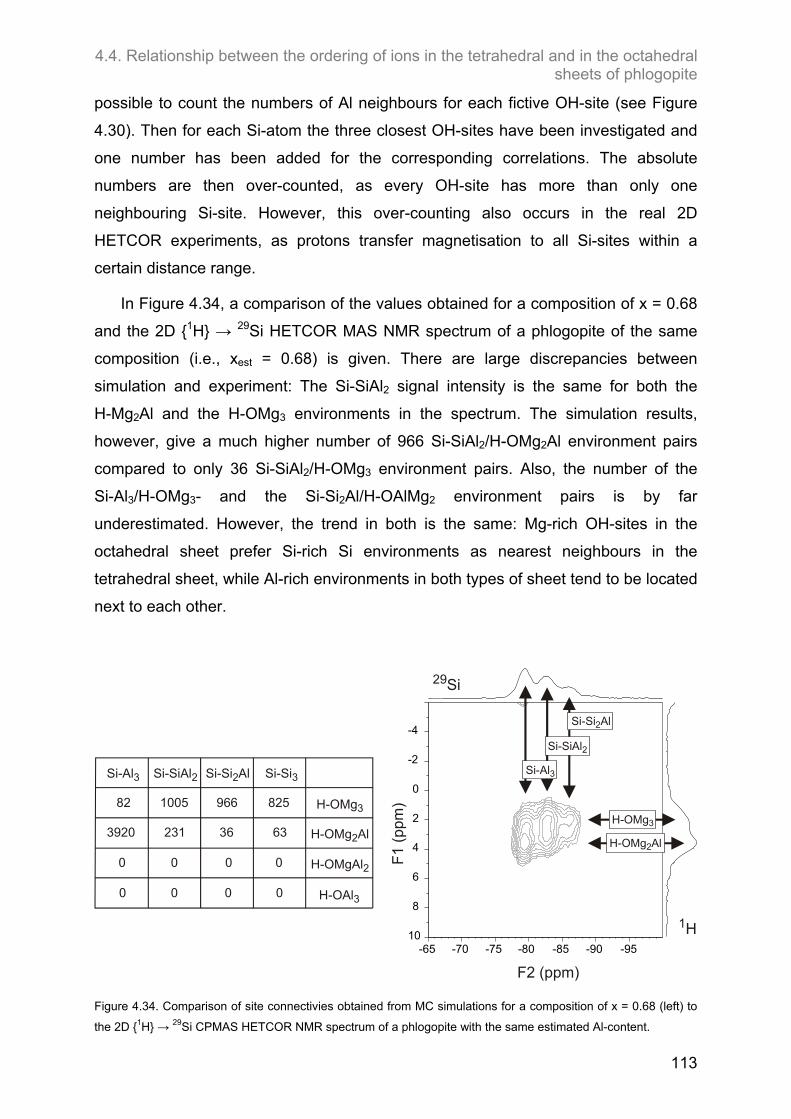
4.4. Relationship between the ordering of ions in the tetrahedral and in the octahedral sheets of phlogopite
113
possible to count the numbers of Al neighbours for each fictive OH-site (see Figure
4.30). Then for each Si-atom the three closest OH-sites have been investigated and
one number has been added for the corresponding correlations. The absolute
numbers are then over-counted, as every OH-site has more than only one
neighbouring Si-site. However, this over-counting also occurs in the real 2D
HETCOR experiments, as protons transfer magnetisation to all Si-sites within a
certain distance range.
In Figure 4.34, a comparison of the values obtained for a composition of x = 0.68
and the 2D {1H} → 29Si HETCOR MAS NMR spectrum of a phlogopite of the same
composition (i.e., xest = 0.68) is given. There are large discrepancies between
simulation and experiment: The Si-SiAl2 signal intensity is the same for both the
H-Mg2Al and the H-OMg3 environments in the spectrum. The simulation results,
however, give a much higher number of 966 Si-SiAl2/H-OMg2Al environment pairs
compared to only 36 Si-SiAl2/H-OMg3 environment pairs. Also, the number of the
Si-Al3/H-OMg3- and the Si-Si2Al/H-OAlMg2 environment pairs is by far
underestimated. However, the trend in both is the same: Mg-rich OH-sites in the
octahedral sheet prefer Si-rich Si environments as nearest neighbours in the
tetrahedral sheet, while Al-rich environments in both types of sheet tend to be located
next to each other.
-65 -70 -75 -80 -85 -90 -95
-4
-2
10
8
6
4
2
0
F2 (ppm)
F1
(ppm
)
29Si
1H
Si-Si2Al
Si-SiAl2
Si-Al3
H-OMg3
H-OMg Al2
Si-Al3 Si-SiAl2 Si-Si Al2 Si-Si3
H-OMg3
H-OMg Al2
H-OMgAl2
H-OAl3
82 1005 966 825
3920 231 36 63
0 0 0
0 0 0 0
0
Figure 4.34. Comparison of site connectivies obtained from MC simulations for a composition of x = 0.68 (left) to
the 2D {1H} → 29Si CPMAS HETCOR NMR spectrum of a phlogopite with the same estimated Al-content.
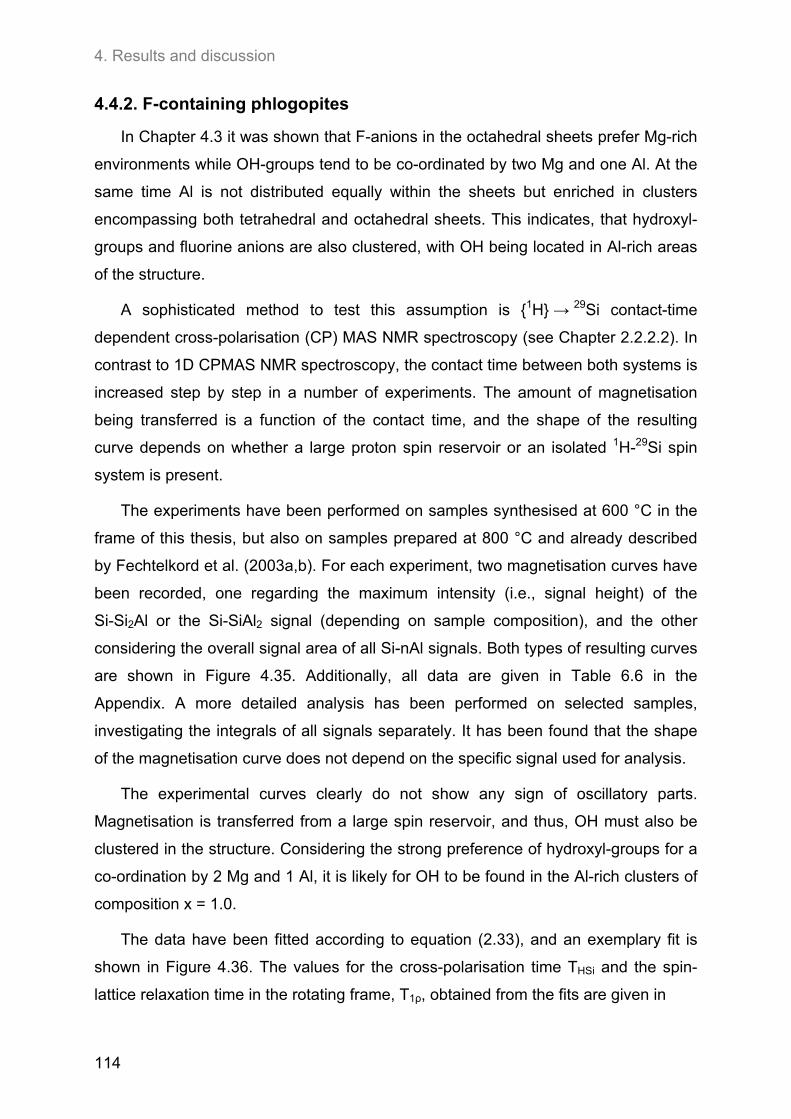
4. Results and discussion
114
4.4.2. F-containing phlogopites
In Chapter 4.3 it was shown that F-anions in the octahedral sheets prefer Mg-rich
environments while OH-groups tend to be co-ordinated by two Mg and one Al. At the
same time Al is not distributed equally within the sheets but enriched in clusters
encompassing both tetrahedral and octahedral sheets. This indicates, that hydroxyl-
groups and fluorine anions are also clustered, with OH being located in Al-rich areas
of the structure.
A sophisticated method to test this assumption is {1H} → 29Si contact-time
dependent cross-polarisation (CP) MAS NMR spectroscopy (see Chapter 2.2.2.2). In
contrast to 1D CPMAS NMR spectroscopy, the contact time between both systems is
increased step by step in a number of experiments. The amount of magnetisation
being transferred is a function of the contact time, and the shape of the resulting
curve depends on whether a large proton spin reservoir or an isolated 1H-29Si spin
system is present.
The experiments have been performed on samples synthesised at 600 °C in the
frame of this thesis, but also on samples prepared at 800 °C and already described
by Fechtelkord et al. (2003a,b). For each experiment, two magnetisation curves have
been recorded, one regarding the maximum intensity (i.e., signal height) of the
Si-Si2Al or the Si-SiAl2 signal (depending on sample composition), and the other
considering the overall signal area of all Si-nAl signals. Both types of resulting curves
are shown in Figure 4.35. Additionally, all data are given in Table 6.6 in the
Appendix. A more detailed analysis has been performed on selected samples,
investigating the integrals of all signals separately. It has been found that the shape
of the magnetisation curve does not depend on the specific signal used for analysis.
The experimental curves clearly do not show any sign of oscillatory parts.
Magnetisation is transferred from a large spin reservoir, and thus, OH must also be
clustered in the structure. Considering the strong preference of hydroxyl-groups for a
co-ordination by 2 Mg and 1 Al, it is likely for OH to be found in the Al-rich clusters of
composition x = 1.0.
The data have been fitted according to equation (2.33), and an exemplary fit is
shown in Figure 4.36. The values for the cross-polarisation time THSi and the spin-
lattice relaxation time in the rotating frame, T1ρ, obtained from the fits are given in
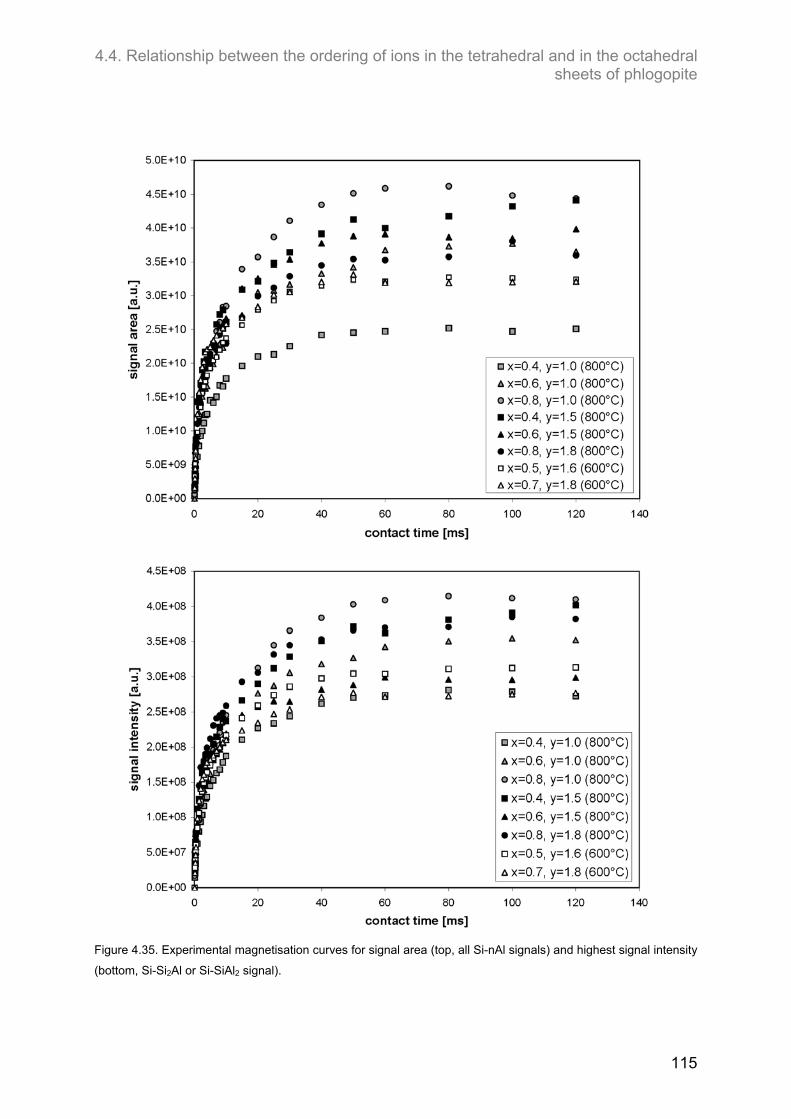
4.4. Relationship between the ordering of ions in the tetrahedral and in the octahedral sheets of phlogopite
115
Figure 4.35. Experimental magnetisation curves for signal area (top, all Si-nAl signals) and highest signal intensity
(bottom, Si-Si2Al or Si-SiAl2 signal).
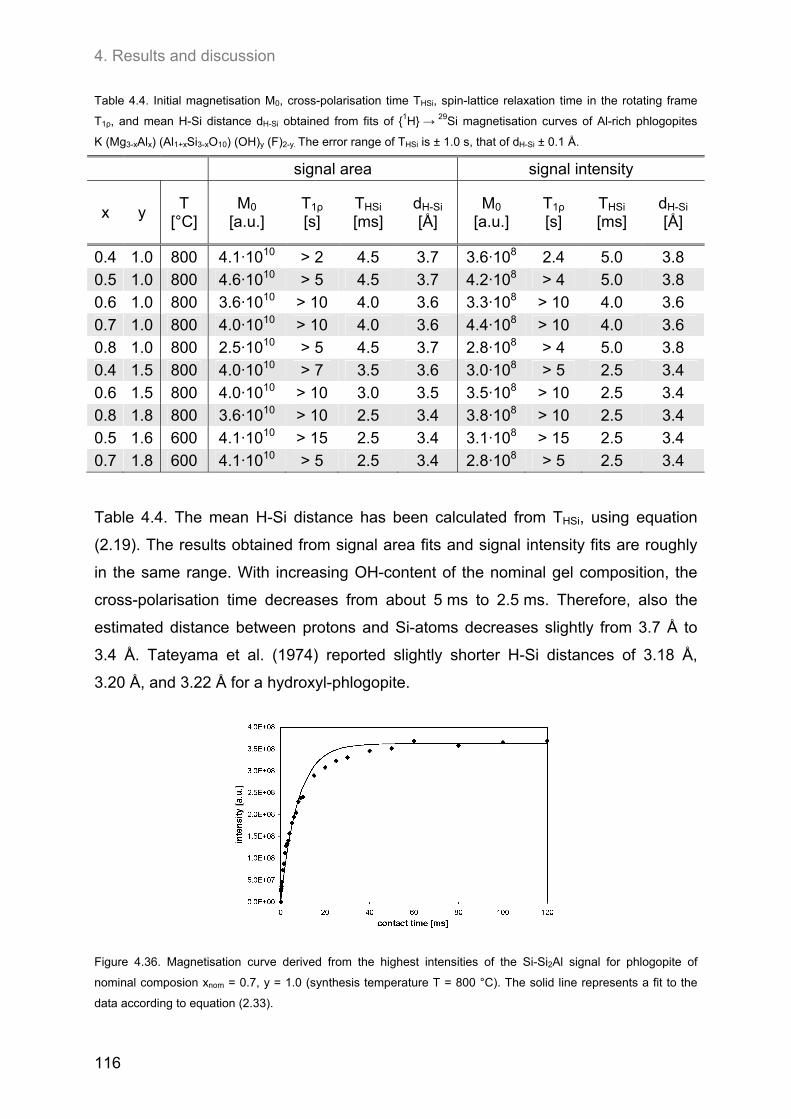
4. Results and discussion
116
Table 4.4. Initial magnetisation M0, cross-polarisation time THSi, spin-lattice relaxation time in the rotating frame
T1ρ, and mean H-Si distance dH-Si obtained from fits of {1H} → 29Si magnetisation curves of Al-rich phlogopites
K (Mg3-xAlx) (Al1+xSi3-xO10) (OH)y (F)2-y. The error range of THSi is ± 1.0 s, that of dH-Si ± 0.1 Å.
signal area signal intensity
x y T
[°C] M0
[a.u.] T1ρ [s]
THSi [ms]
dH-Si [Å]
M0 [a.u.]
T1ρ [s]
THSi [ms]
dH-Si [Å]
0.4 1.0 800 4.1·1010 > 2 4.5 3.7 3.6·108 2.4 5.0 3.8
0.5 1.0 800 4.6·1010 > 5 4.5 3.7 4.2·108 > 4 5.0 3.8
0.6 1.0 800 3.6·1010 > 10 4.0 3.6 3.3·108 > 10 4.0 3.6
0.7 1.0 800 4.0·1010 > 10 4.0 3.6 4.4·108 > 10 4.0 3.6
0.8 1.0 800 2.5·1010 > 5 4.5 3.7 2.8·108 > 4 5.0 3.8
0.4 1.5 800 4.0·1010 > 7 3.5 3.6 3.0·108 > 5 2.5 3.4
0.6 1.5 800 4.0·1010 > 10 3.0 3.5 3.5·108 > 10 2.5 3.4
0.8 1.8 800 3.6·1010 > 10 2.5 3.4 3.8·108 > 10 2.5 3.4
0.5 1.6 600 4.1·1010 > 15 2.5 3.4 3.1·108 > 15 2.5 3.4
0.7 1.8 600 4.1·1010 > 5 2.5 3.4 2.8·108 > 5 2.5 3.4
Table 4.4. The mean H-Si distance has been calculated from THSi, using equation
(2.19). The results obtained from signal area fits and signal intensity fits are roughly
in the same range. With increasing OH-content of the nominal gel composition, the
cross-polarisation time decreases from about 5 ms to 2.5 ms. Therefore, also the
estimated distance between protons and Si-atoms decreases slightly from 3.7 Å to
3.4 Å. Tateyama et al. (1974) reported slightly shorter H-Si distances of 3.18 Å,
3.20 Å, and 3.22 Å for a hydroxyl-phlogopite.
Figure 4.36. Magnetisation curve derived from the highest intensities of the Si-Si2Al signal for phlogopite of
nominal composion xnom = 0.7, y = 1.0 (synthesis temperature T = 800 °C). The solid line represents a fit to the
data according to equation (2.33).
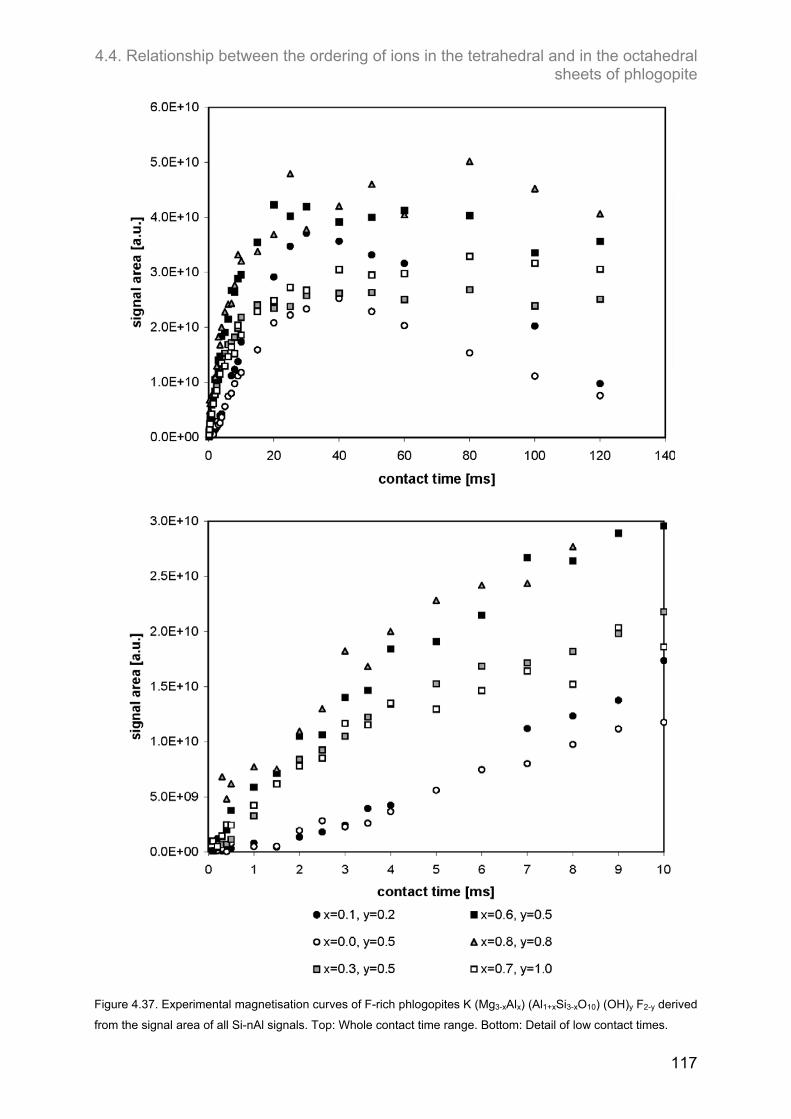
4.4. Relationship between the ordering of ions in the tetrahedral and in the octahedral sheets of phlogopite
117
Figure 4.37. Experimental magnetisation curves of F-rich phlogopites K (Mg3-xAlx) (Al1+xSi3-xO10) (OH)y F2-y derived
from the signal area of all Si-nAl signals. Top: Whole contact time range. Bottom: Detail of low contact times.
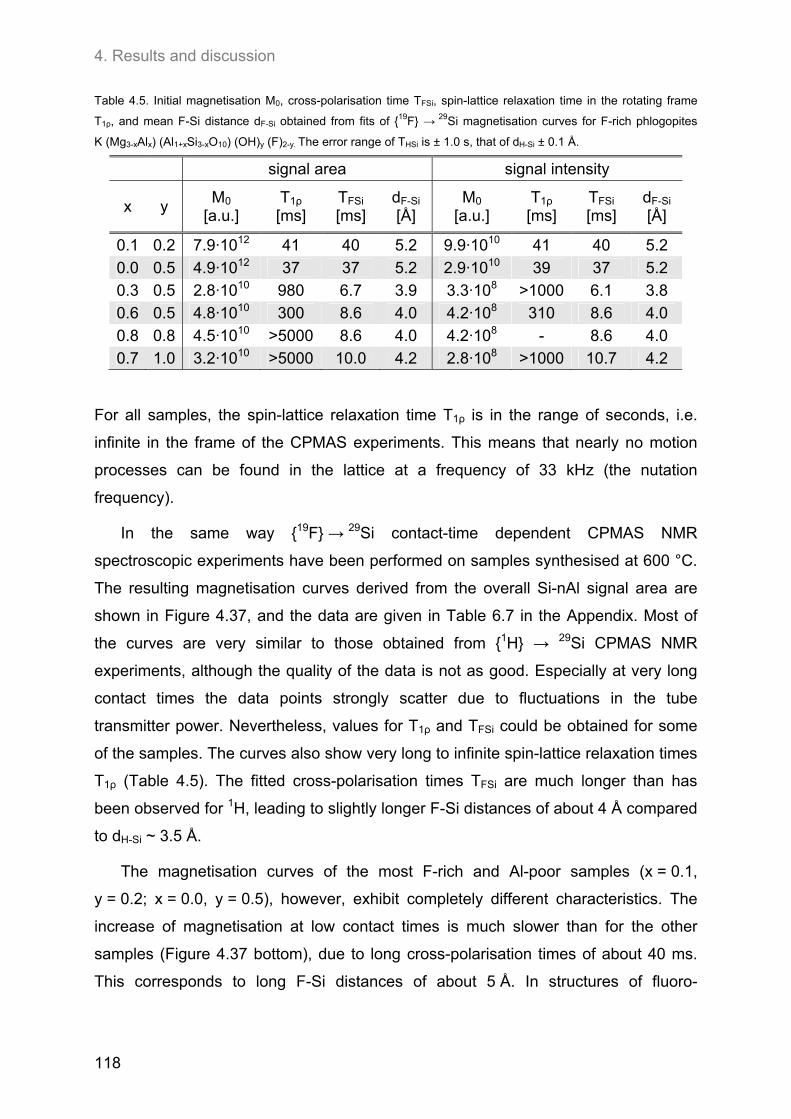
4. Results and discussion
118
Table 4.5. Initial magnetisation M0, cross-polarisation time TFSi, spin-lattice relaxation time in the rotating frame
T1ρ, and mean F-Si distance dF-Si obtained from fits of {19F} → 29Si magnetisation curves for F-rich phlogopites
K (Mg3-xAlx) (Al1+xSi3-xO10) (OH)y (F)2-y. The error range of THSi is ± 1.0 s, that of dH-Si ± 0.1 Å.
signal area signal intensity
x y M0
[a.u.] T1ρ [ms]
TFSi [ms]
dF-Si [Å]
M0 [a.u.]
T1ρ [ms]
TFSi [ms]
dF-Si [Å]
0.1 0.2 7.9·1012 41 40 5.2 9.9·1010 41 40 5.2
0.0 0.5 4.9·1012 37 37 5.2 2.9·1010 39 37 5.2
0.3 0.5 2.8·1010 980 6.7 3.9 3.3·108 >1000 6.1 3.8
0.6 0.5 4.8·1010 300 8.6 4.0 4.2·108 310 8.6 4.0
0.8 0.8 4.5·1010 >5000 8.6 4.0 4.2·108 - 8.6 4.0
0.7 1.0 3.2·1010 >5000 10.0 4.2 2.8·108 >1000 10.7 4.2
For all samples, the spin-lattice relaxation time T1ρ is in the range of seconds, i.e.
infinite in the frame of the CPMAS experiments. This means that nearly no motion
processes can be found in the lattice at a frequency of 33 kHz (the nutation
frequency).
In the same way {19F} → 29Si contact-time dependent CPMAS NMR
spectroscopic experiments have been performed on samples synthesised at 600 °C.
The resulting magnetisation curves derived from the overall Si-nAl signal area are
shown in Figure 4.37, and the data are given in Table 6.7 in the Appendix. Most of
the curves are very similar to those obtained from {1H} → 29Si CPMAS NMR
experiments, although the quality of the data is not as good. Especially at very long
contact times the data points strongly scatter due to fluctuations in the tube
transmitter power. Nevertheless, values for T1ρ and TFSi could be obtained for some
of the samples. The curves also show very long to infinite spin-lattice relaxation times
T1ρ (Table 4.5). The fitted cross-polarisation times TFSi are much longer than has
been observed for 1H, leading to slightly longer F-Si distances of about 4 Å compared
to dH-Si ~ 3.5 Å.
The magnetisation curves of the most F-rich and Al-poor samples (x = 0.1,
y = 0.2; x = 0.0, y = 0.5), however, exhibit completely different characteristics. The
increase of magnetisation at low contact times is much slower than for the other
samples (Figure 4.37 bottom), due to long cross-polarisation times of about 40 ms.
This corresponds to long F-Si distances of about 5 Å. In structures of fluoro-
4.4. Relationship between the ordering of ions in the tetrahedral and in the octahedral sheets of phlogopite
119
phlogopites reported by Takeda and Morosin (1975) and McCauley et al. (1973) this
distance is much shorter with 3.53 – 3.54 Å.
At the same time, a decrease of magnetisation has been observed for high
contact times, with T1ρ being only slightly longer or equal to TFSi. Motion processes
with frequencies of about 45 kHz (the nutation frequency) must be present in the
lattice responsible for a loss of energy.
The discrepancy between both {19F} → 29Si CPMAS data sets is very large (~1 Å)
and cannot be explained solely by structural changes due to varying compositions of
the phlogopites. Nevertheless, the results indicate that F-rich, Al-poor samples show
completely different structural characteristics than more OH- and Al-rich phlogopites.
The lack of oscillatory parts in the {19F} → 29Si CPMAS magnetisation curves
indicated that F is also clustered in the structure. 1D {19F} → 29Si CPMAS NMR
experiments should be able to relate this result to the clustering of cations in the
tetrahedral sheets. In Chapter 4.3 it has been shown that the amount of F being co-
ordinated by Mg2Al is always very low compared to the whole amount of F in the
structure. This means nearly all of the magnetisation transferred from 19F to 29Si
nuclei comes from F-Mg3 environments. Therefore, 1D {19F} → 29Si CPMAS NMR
spectra should reflect the local composition and distribution of Si environments next
to F-rich clusters.
The fit parameters obtained from 1D {19F} → 29Si CPMAS NMR spectra of
selected phlogopite samples are given in Table 4.6. For comparison, the
corresponding parameters retrieved from 29Si MAS NMR spectra are also shown. For
the three last samples, the 19F environment has been found to be more Si-rich than
the average composition because the Al-content estimated from CPMAS data is
slightly lower than that calculated from 29Si MAS NMR spectra. In many cases the
lower Al-content is also visible from a shift of the Si-nAl signal positions to more
shielded values.
In principle, the sample with composition xnom = 0.4,y = 0.5 shows the same
trend. For a contact time of 3 and 7 ms, xest determined from CPMAS NMR is lower
than the overall xest. However, for a contact time of 5 ms the estimated Al-content is
equal to the average value.
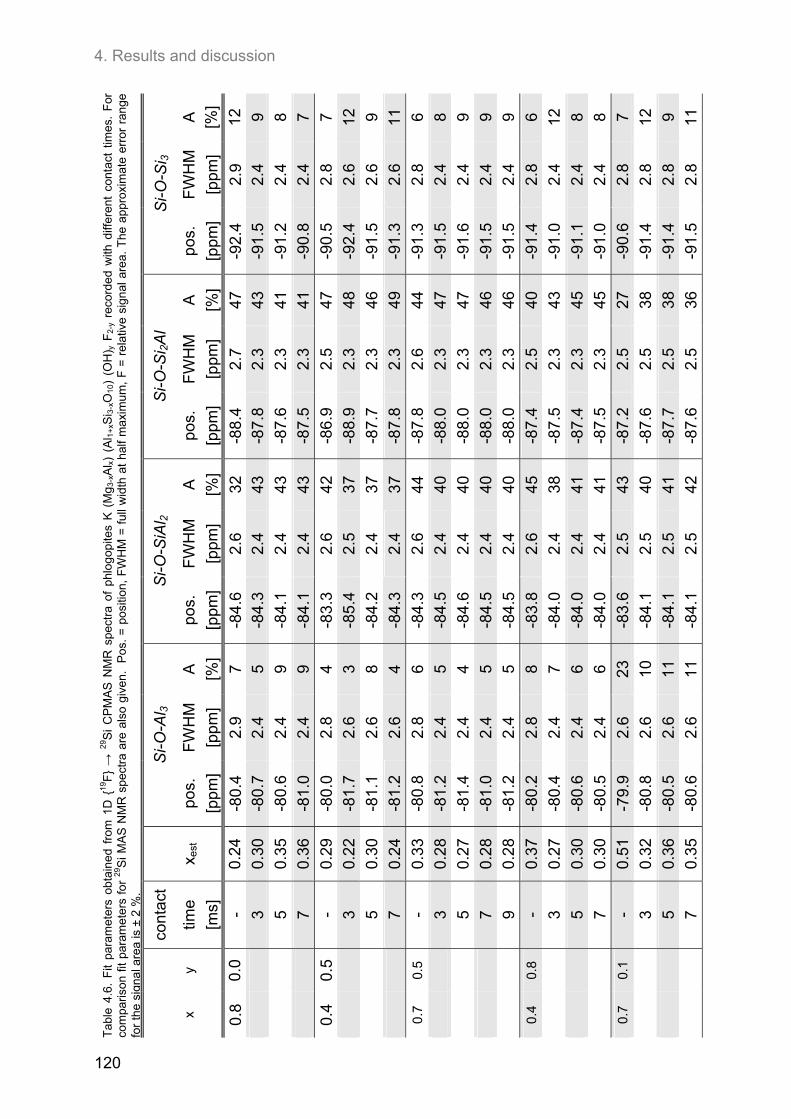
4. Results and discussion
120
Tab
le 4
.6.
Fit
para
met
ers
obta
ine
d fr
om 1
D {
19F
} →
29S
i C
PM
AS
NM
R s
pect
ra o
f ph
logo
pite
s K
(M
g 3-xA
l x) (
Al 1
+xS
i 3-x
O1
0)
(OH
) y F
2-y r
ecor
ded
with
diff
eren
t co
ntac
t tim
es.
For
co
mpa
rison
fit
para
met
ers
for
29S
i MA
S N
MR
spe
ctra
are
als
o g
iven
. P
os.
= p
ositi
on,
FW
HM
= f
ull w
idth
at
half
max
imum
, F
= r
elat
ive
sign
al a
rea.
The
app
roxi
mat
e er
ror
rang
e
for
the
sign
al a
rea
is ±
2 %
.
Si-O
-Si 3
A
[%]
12
9 8 7 7 12
9 11
6 8 9 9 9 6 12
8 8 7 12
9 11
FW
HM
[ppm
]
2.9
2.4
2.4
2.4
2.8
2.6
2.6
2.6
2.8
2.4
2.4
2.4
2.4
2.8
2.4
2.4
2.4
2.8
2.8
2.8
2.8
pos.
[ppm
]
-92.
4 -9
1.5
-91.
2
-90.
8
-90.
5
-92.
4
-91.
5
-91.
3
-91.
3
-91.
5
-91.
6
-91.
5
-91.
5
-91.
4
-91.
0
-91.
1
-91.
0
-90.
6
-91.
4
-91.
4
-91.
5
Si-O
-Si 2
Al
A
[%]
47
43
41
41
47
48
46
49
44
47
47
46
46
40
43
45
45
27
38
38
36
FW
HM
[ppm
]
2.7
2.3
2.3
2.3
2.5
2.3
2.3
2.3
2.6
2.3
2.3
2.3
2.3
2.5
2.3
2.3
2.3
2.5
2.5
2.5
2.5
pos.
[ppm
]
-88.
4 -8
7.8
-87.
6
-87.
5
-86.
9
-88.
9
-87.
7
-87.
8
-87.
8
-88.
0
-88.
0
-88.
0
-88.
0
-87.
4
-87.
5
-87.
4
-87.
5
-87.
2
-87.
6
-87.
7
-87.
6
Si-O
-SiA
l 2
A
[%]
32
43
43
43
42
37
37
37
44
40
40
40
40
45
38
41
41
43
40
41
42
FW
HM
[ppm
]
2.6
2.4
2.4
2.4
2.6
2.5
2.4
2.4
2.6
2.4
2.4
2.4
2.4
2.6
2.4
2.4
2.4
2.5
2.5
2.5
2.5
pos.
[ppm
]
-84.
6 -8
4.3
-84.
1
-84.
1
-83.
3
-85.
4
-84.
2
-84.
3
-84.
3
-84.
5
-84.
6
-84.
5
-84.
5
-83.
8
-84.
0
-84.
0
-84.
0
-83.
6
-84.
1
-84.
1
-84.
1
Si-O
-Al 3
A
[%]
7 5 9 9 4 3 8 4 6 5 4 5 5 8 7 6 6 23
10
11
11
FW
HM
[ppm
]
2.9
2.4
2.4
2.4
2.8
2.6
2.6
2.6
2.8
2.4
2.4
2.4
2.4
2.8
2.4
2.4
2.4
2.6
2.6
2.6
2.6
pos.
[ppm
]
-80.
4 -8
0.7
-80.
6
-81.
0
-80.
0
-81.
7
-81.
1
-81.
2
-80.
8
-81.
2
-81.
4
-81.
0
-81.
2
-80.
2
-80.
4
-80.
6
-80.
5
-79.
9
-80.
8
-80.
5
-80.
6
x est
0.24
0.30
0.35
0.36
0.29
0.22
0.30
0.24
0.33
0.28
0.27
0.28
0.28
0.37
0.27
0.30
0.30
0.51
0.32
0.36
0.35
cont
act
time
[ms]
- 3 5 7 - 3 5 7 - 3 5 7 9 - 3 5 7 - 3 5 7
y
0.0
0.5 0.5 0.8 0.1
x
0.8
0.4
0.7
0.4
0.7

4.4. Relationship between the ordering of ions in the tetrahedral and in the octahedral sheets of phlogopite
121
Only for the F-free composition (y = 0.0) an opposite trend has been observed
with the 19F environment showing a higher Al-content. So far, no explanation has
been found for this contradictory result.
Nearly all samples also showed a decrease in FWHM of the CPMAS signals
compared to 29Si MAS NMR signals. The latter contain information on all the Si
environments throughout the structure. Si-O-Al bond length and bond angles slightly
differ for Si-atoms in both types of clusters leading to broad 29Si MAS NMR signals.
In contrast, in {19F} → 29Si CPMAS NMR experiments only Si-atoms in one type of
cluster are considered. These environments are more homogeneous resulting in a
smaller signal width.
4. Results and discussion
122
4.5. 27Al MAS and 27Al 3Q-MAS NMR spectroscopy
In addition to the experiments described before 27Al MAS and MQMAS spectra
have been recorded. These are usually difficult to interpret because 27Al belongs to
the group of quadrupolar nuclei, and signals are expected to be broadened due to
quadrupolar interaction in addition to other line-broadening effects. Nevertheless,
additional information may be obtained on the Al environments in the octahedral and
tetrahedral sheets of phlogopite. Moreover, apart from the powder X-ray diffraction
patterns discussed in Chapter 4.7 27Al MAS and MQMAS spectra are the only way to
obtain information on Al2O3, the most prominent impurity phase in the samples under
investigation.
Figure 4.38 shows a comparison of 27Al MAS NMR spectra of phlogopite samples
with different Al- and OH-contents. The signals at about 60 to 70 ppm result from
tetrahedrally co-ordinated Al, while octahedrally co-ordinated Al gives rise to signals
in the range of 0 – 20 ppm (Müller et al., 1981; Lipsicas et al., 1984). The signals are
broadened due to distributions of chemical shifts and electric field gradients, dipolar
coupling, and low crystallinity of the samples, and hardly any features of typical
quadrupolar patterns can be distinguished.
All spectra are dominated by a strongly asymmetric signal at δ(27Al) = 71 ppm.
This signal is due to [4]Al which substitutes for Si in the tetrahedral sheets of
phlogopite. It has been fitted using a simple version of the Czjzek distribution model
which is implemented in the DMFit software and takes into account a distribution of
chemical shifts (Massiot et al, 2002). The position of δ(27Al) = 69.5 to 72.6 ppm is in
agreement with the findings of Circone et al. (1991) and Fechtelkord et al. (2003b). In
consistence with Woessner (1989), the [4]Al signal position shifts to less-shielded, i.e.
more-positive values with increasing substitution of Si by Al due to an increase of
distortion of the tetrahedral layer (Figure 4.38). The quadrupolar coupling constant
CQ is in the range of 2.4 to 2.9 MHz, the full width at half maximum of the Gaussian
distribution of chemical shifts is between 3.2 and 4.6 ppm, and no trends with
changing sample composition have been observed. The asymmetry parameter η has
not been taken into account in the distribution model and thus could not be
determined.
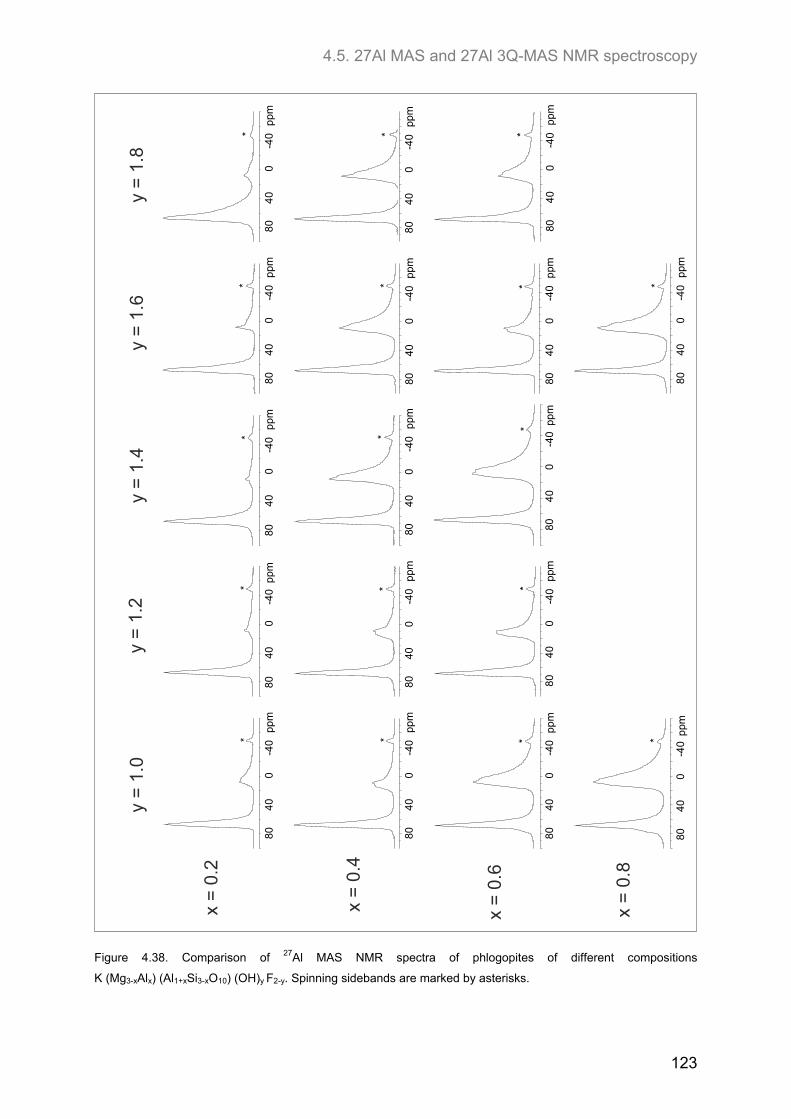
4.5. 27Al MAS and 27Al 3Q-MAS NMR spectroscopy
123
y =
1.0
y =
1.2
y =
1.4
y =
1.6
y =
1.8
x =
0.2
x =
0.4
x =
0.6
x =
0.8
-40
804
00
ppm
-40
8040
0p
pm-4
080
40
0pp
m
-40
80
40
0p
pm
-40
804
00
ppm
-40
8040
0p
pm
-40
8040
0p
pm
-40
80
40
0p
pm
-40
8040
0p
pm
-40
8040
0
ppm
-40
80
400
-40
80
40
0
ppm
ppm
-40
8040
0-4
080
400
ppm
ppm
**
**
**
*
* ***
**
**
-40
8040
0p
pm-4
080
400
ppm
-40
804
00
ppm
*
*
Figure 4.38. Comparison of 27Al MAS NMR spectra of phlogopites of different compositions
K (Mg3-xAlx) (Al1+xSi3-xO10) (OH)y F2-y. Spinning sidebands are marked by asterisks.
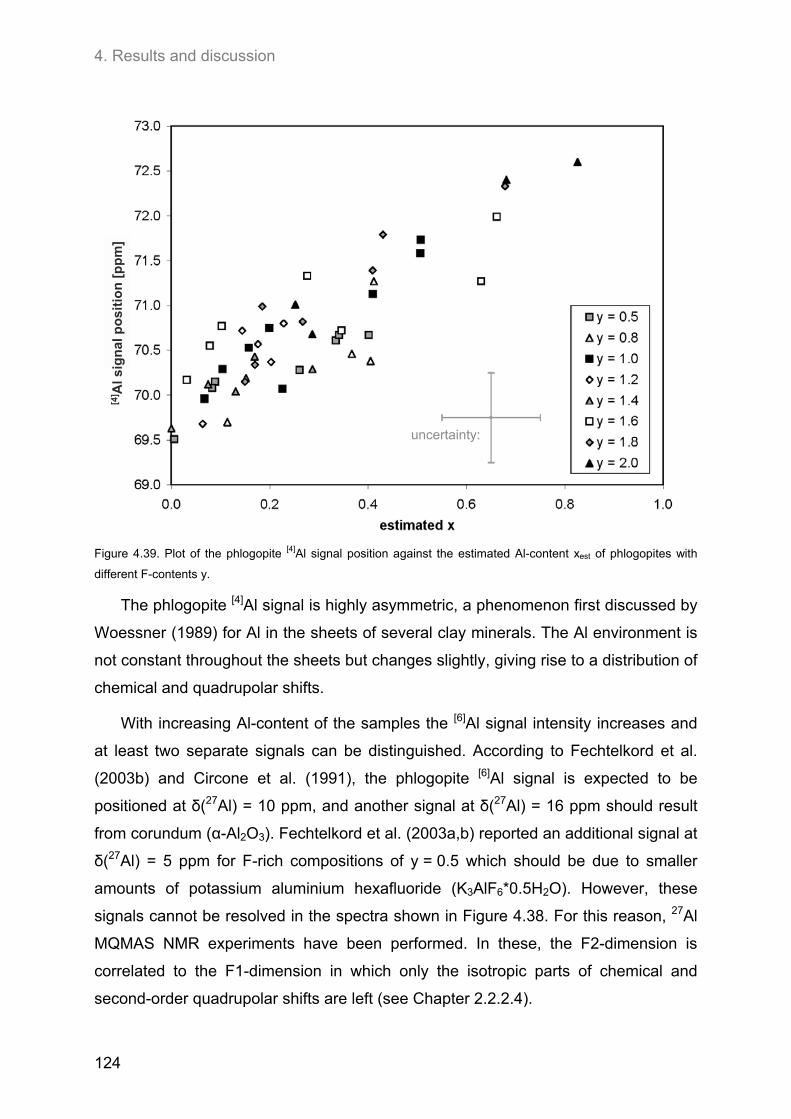
4. Results and discussion
124
uncertainty:
[4] A
l sig
nal
po
siti
on
[p
pm
]
Figure 4.39. Plot of the phlogopite [4]Al signal position against the estimated Al-content xest of phlogopites with
different F-contents y.
The phlogopite [4]Al signal is highly asymmetric, a phenomenon first discussed by
Woessner (1989) for Al in the sheets of several clay minerals. The Al environment is
not constant throughout the sheets but changes slightly, giving rise to a distribution of
chemical and quadrupolar shifts.
With increasing Al-content of the samples the [6]Al signal intensity increases and
at least two separate signals can be distinguished. According to Fechtelkord et al.
(2003b) and Circone et al. (1991), the phlogopite [6]Al signal is expected to be
positioned at δ(27Al) = 10 ppm, and another signal at δ(27Al) = 16 ppm should result
from corundum (α-Al2O3). Fechtelkord et al. (2003a,b) reported an additional signal at
δ(27Al) = 5 ppm for F-rich compositions of y = 0.5 which should be due to smaller
amounts of potassium aluminium hexafluoride (K3AlF6*0.5H2O). However, these
signals cannot be resolved in the spectra shown in Figure 4.38. For this reason, 27Al
MQMAS NMR experiments have been performed. In these, the F2-dimension is
correlated to the F1-dimension in which only the isotropic parts of chemical and
second-order quadrupolar shifts are left (see Chapter 2.2.2.4).
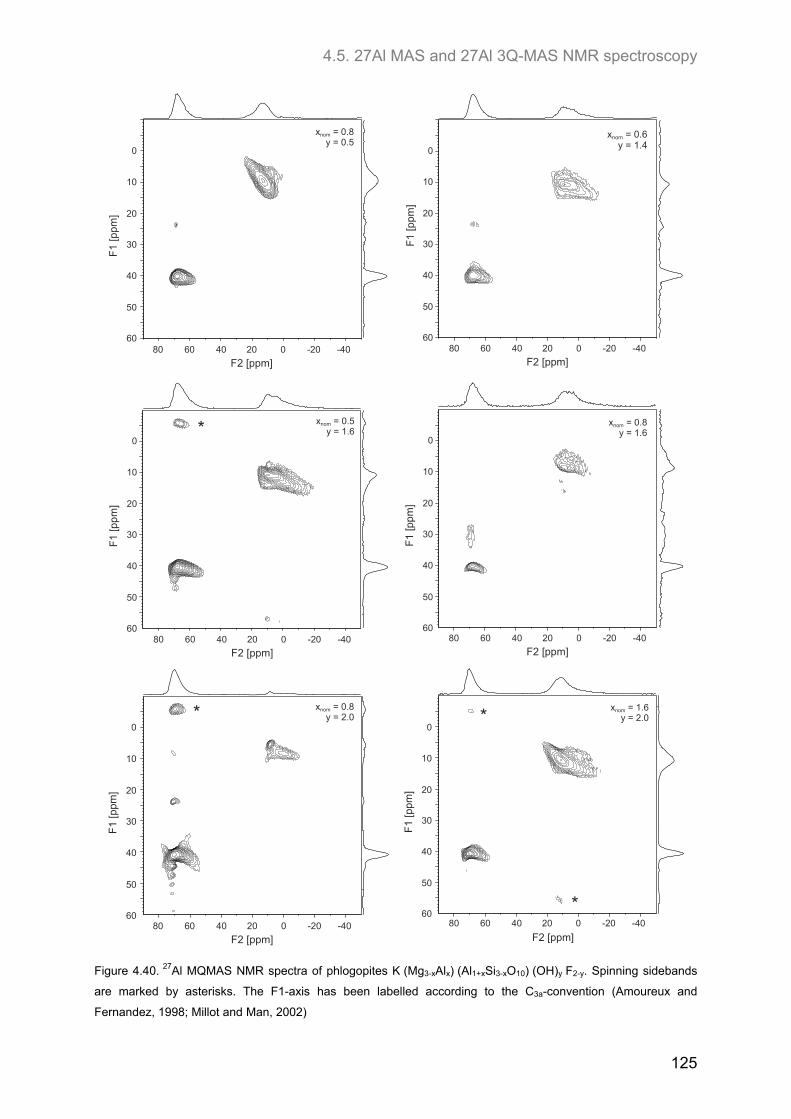
4.5. 27Al MAS and 27Al 3Q-MAS NMR spectroscopy
125
x = 0.8y = 0.5
nom
0 -202060 4080 -40
F2 [ppm]
0
10
20
30
40
50
60
F1
[ppm
]
x = 0.6y = 1.4
nom
x = 0.5y = 1.6
nom
0
10
20
30
40
50
60
F1
[pp
m]
0 -202060 4080 -40
F2 [ppm]
0
10
20
30
40
50
60
F1
[ppm
]
0 -202060 4080 -40
F2 [ppm]
0 -202060 4080 -40
F2 [ppm]
x = 0.8y = 1.6
nom
0
10
20
30
40
50
60
F1
[pp
m]
x = 1.6y = 2.0
nom
0 -202060 4080 -40
F2 [ppm]
0
10
20
30
40
50
60
F1
[ppm
]
*
*
*
x = 0.8y = 2.0
nom
0 -202060 4080 -40
F2 [ppm]
0
10
20
30
40
50
60
F1
[ppm
]
*
Figure 4.40. 27Al MQMAS NMR spectra of phlogopites K (Mg3-xAlx) (Al1+xSi3-xO10) (OH)y F2-y. Spinning sidebands
are marked by asterisks. The F1-axis has been labelled according to the C3a-convention (Amoureux and
Fernandez, 1998; Millot and Man, 2002)
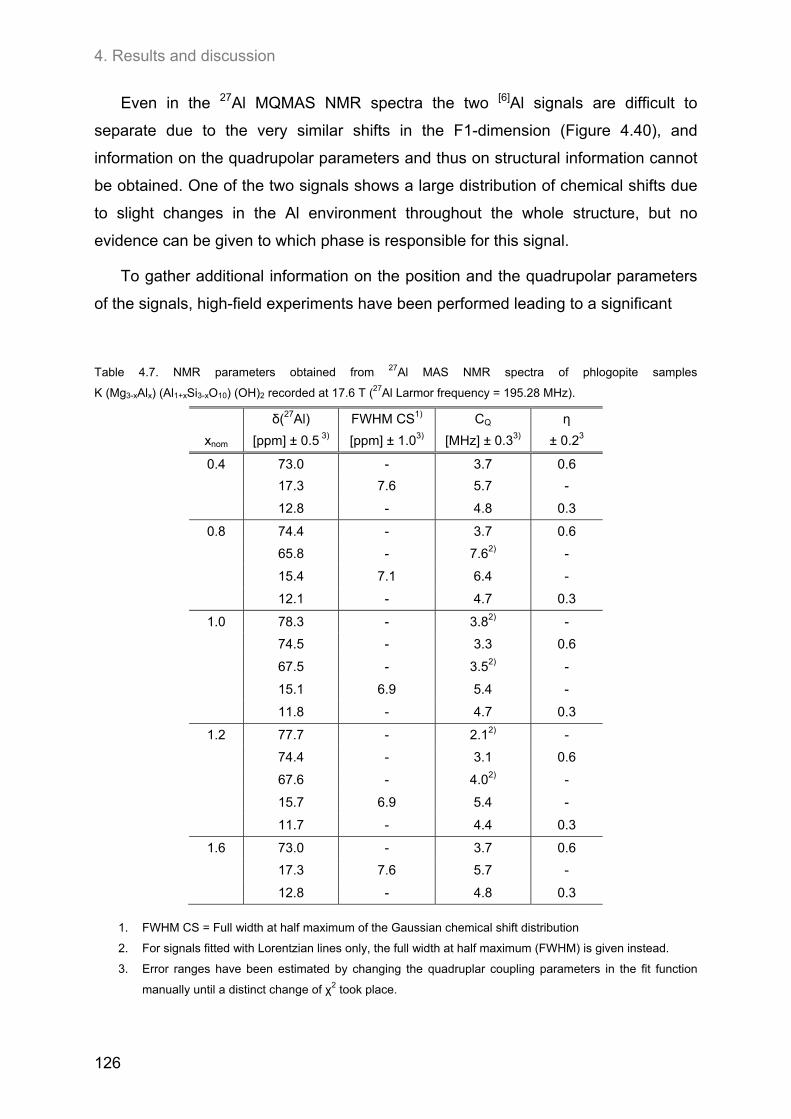
4. Results and discussion
126
Even in the 27Al MQMAS NMR spectra the two [6]Al signals are difficult to
separate due to the very similar shifts in the F1-dimension (Figure 4.40), and
information on the quadrupolar parameters and thus on structural information cannot
be obtained. One of the two signals shows a large distribution of chemical shifts due
to slight changes in the Al environment throughout the whole structure, but no
evidence can be given to which phase is responsible for this signal.
To gather additional information on the position and the quadrupolar parameters
of the signals, high-field experiments have been performed leading to a significant
Table 4.7. NMR parameters obtained from 27Al MAS NMR spectra of phlogopite samples
K (Mg3-xAlx) (Al1+xSi3-xO10) (OH)2 recorded at 17.6 T (27Al Larmor frequency = 195.28 MHz).
δ(27Al) FWHM CS1) CQ η
xnom [ppm] ± 0.5 3) [ppm] ± 1.03) [MHz] ± 0.33) ± 0.23
0.4 73.0 - 3.7 0.6
17.3 7.6 5.7 -
12.8 - 4.8 0.3
0.8 74.4 - 3.7 0.6
65.8 - 7.62) -
15.4 7.1 6.4 -
12.1 - 4.7 0.3
1.0 78.3 - 3.82) -
74.5 - 3.3 0.6
67.5 - 3.52) -
15.1 6.9 5.4 -
11.8 - 4.7 0.3
1.2 77.7 - 2.12) -
74.4 - 3.1 0.6
67.6 - 4.02) -
15.7 6.9 5.4 -
11.7 - 4.4 0.3
1.6 73.0 - 3.7 0.6
17.3 7.6 5.7 -
12.8 - 4.8 0.3
1. FWHM CS = Full width at half maximum of the Gaussian chemical shift distribution
2. For signals fitted with Lorentzian lines only, the full width at half maximum (FWHM) is given instead.
3. Error ranges have been estimated by changing the quadruplar coupling parameters in the fit function
manually until a distinct change of χ2 took place.
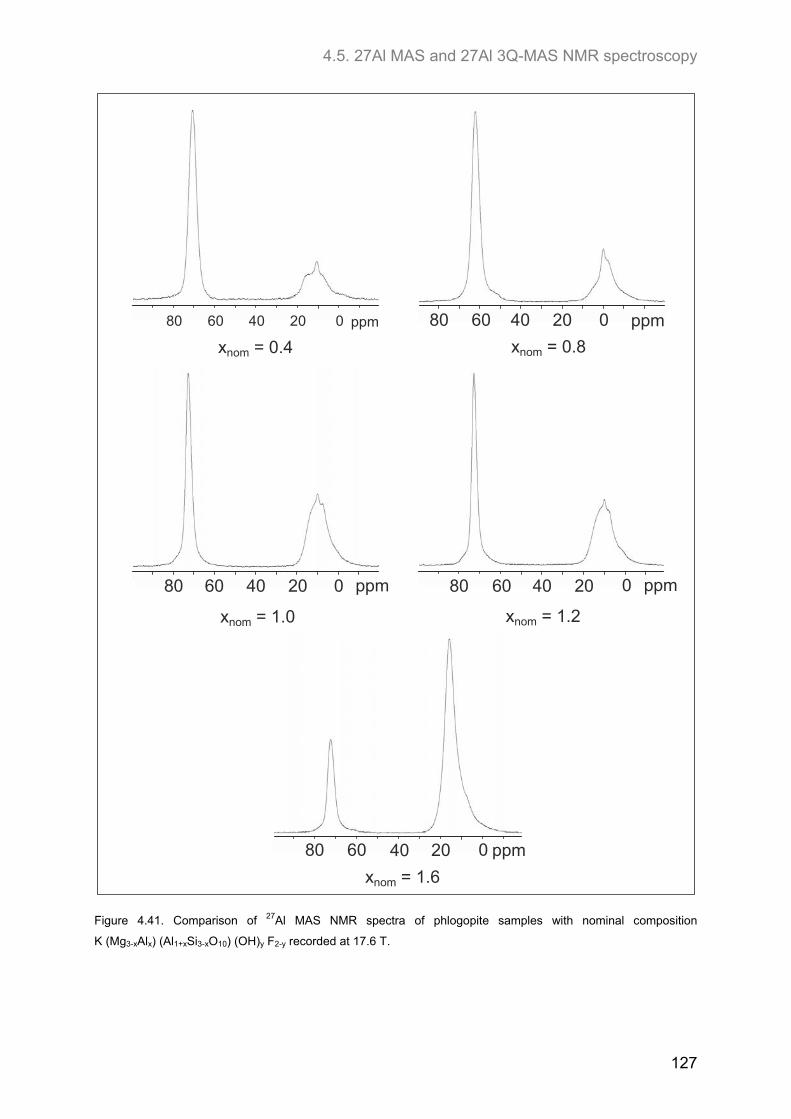
4.5. 27Al MAS and 27Al 3Q-MAS NMR spectroscopy
127
020406080 ppm
x = 0.4nom
020406080 ppm
x = 0.8nom
020406080 ppm
x = 1.0nom
020406080 ppm
x = 1.2nom
020406080 ppm
x = 1.6nom
Figure 4.41. Comparison of 27Al MAS NMR spectra of phlogopite samples with nominal composition
K (Mg3-xAlx) (Al1+xSi3-xO10) (OH)y F2-y recorded at 17.6 T.
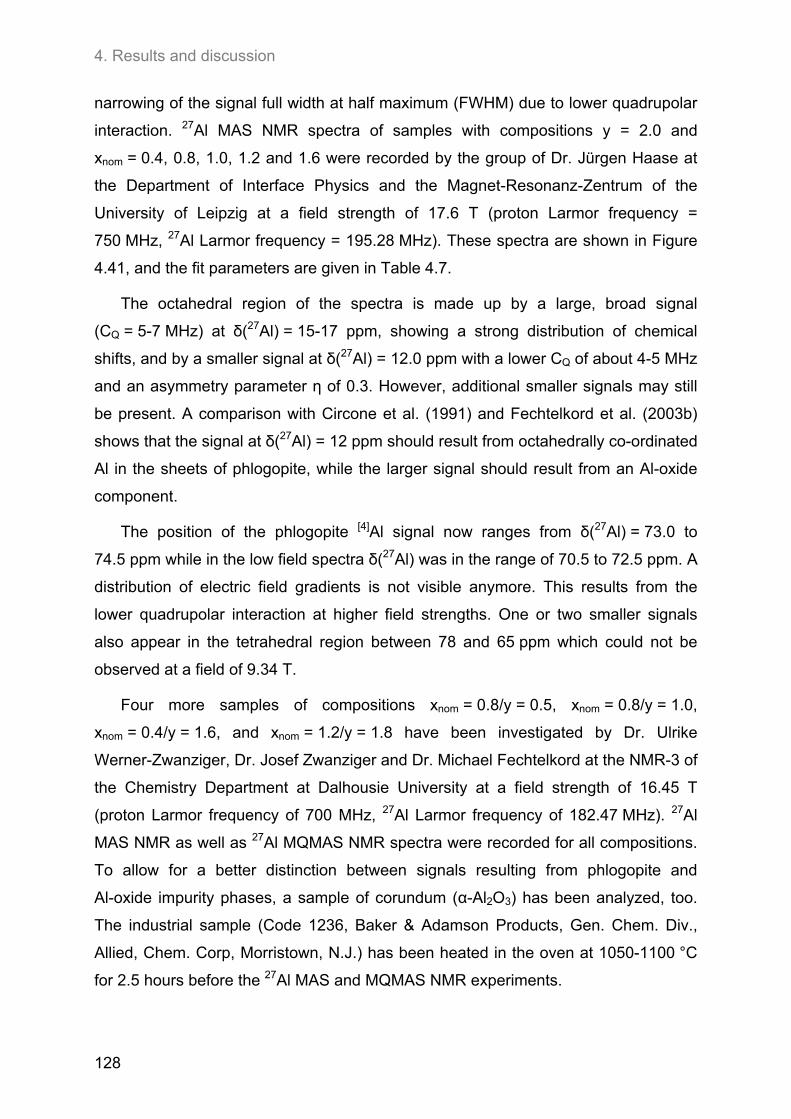
4. Results and discussion
128
narrowing of the signal full width at half maximum (FWHM) due to lower quadrupolar
interaction. 27Al MAS NMR spectra of samples with compositions y = 2.0 and
xnom = 0.4, 0.8, 1.0, 1.2 and 1.6 were recorded by the group of Dr. Jürgen Haase at
the Department of Interface Physics and the Magnet-Resonanz-Zentrum of the
University of Leipzig at a field strength of 17.6 T (proton Larmor frequency =
750 MHz, 27Al Larmor frequency = 195.28 MHz). These spectra are shown in Figure
4.41, and the fit parameters are given in Table 4.7.
The octahedral region of the spectra is made up by a large, broad signal
(CQ = 5-7 MHz) at δ(27Al) = 15-17 ppm, showing a strong distribution of chemical
shifts, and by a smaller signal at δ(27Al) = 12.0 ppm with a lower CQ of about 4-5 MHz
and an asymmetry parameter η of 0.3. However, additional smaller signals may still
be present. A comparison with Circone et al. (1991) and Fechtelkord et al. (2003b)
shows that the signal at δ(27Al) = 12 ppm should result from octahedrally co-ordinated
Al in the sheets of phlogopite, while the larger signal should result from an Al-oxide
component.
The position of the phlogopite [4]Al signal now ranges from δ(27Al) = 73.0 to
74.5 ppm while in the low field spectra δ(27Al) was in the range of 70.5 to 72.5 ppm. A
distribution of electric field gradients is not visible anymore. This results from the
lower quadrupolar interaction at higher field strengths. One or two smaller signals
also appear in the tetrahedral region between 78 and 65 ppm which could not be
observed at a field of 9.34 T.
Four more samples of compositions xnom = 0.8/y = 0.5, xnom = 0.8/y = 1.0,
xnom = 0.4/y = 1.6, and xnom = 1.2/y = 1.8 have been investigated by Dr. Ulrike
Werner-Zwanziger, Dr. Josef Zwanziger and Dr. Michael Fechtelkord at the NMR-3 of
the Chemistry Department at Dalhousie University at a field strength of 16.45 T
(proton Larmor frequency of 700 MHz, 27Al Larmor frequency of 182.47 MHz). 27Al
MAS NMR as well as 27Al MQMAS NMR spectra were recorded for all compositions.
To allow for a better distinction between signals resulting from phlogopite and
Al-oxide impurity phases, a sample of corundum (α-Al2O3) has been analyzed, too.
The industrial sample (Code 1236, Baker & Adamson Products, Gen. Chem. Div.,
Allied, Chem. Corp, Morristown, N.J.) has been heated in the oven at 1050-1100 °C
for 2.5 hours before the 27Al MAS and MQMAS NMR experiments.
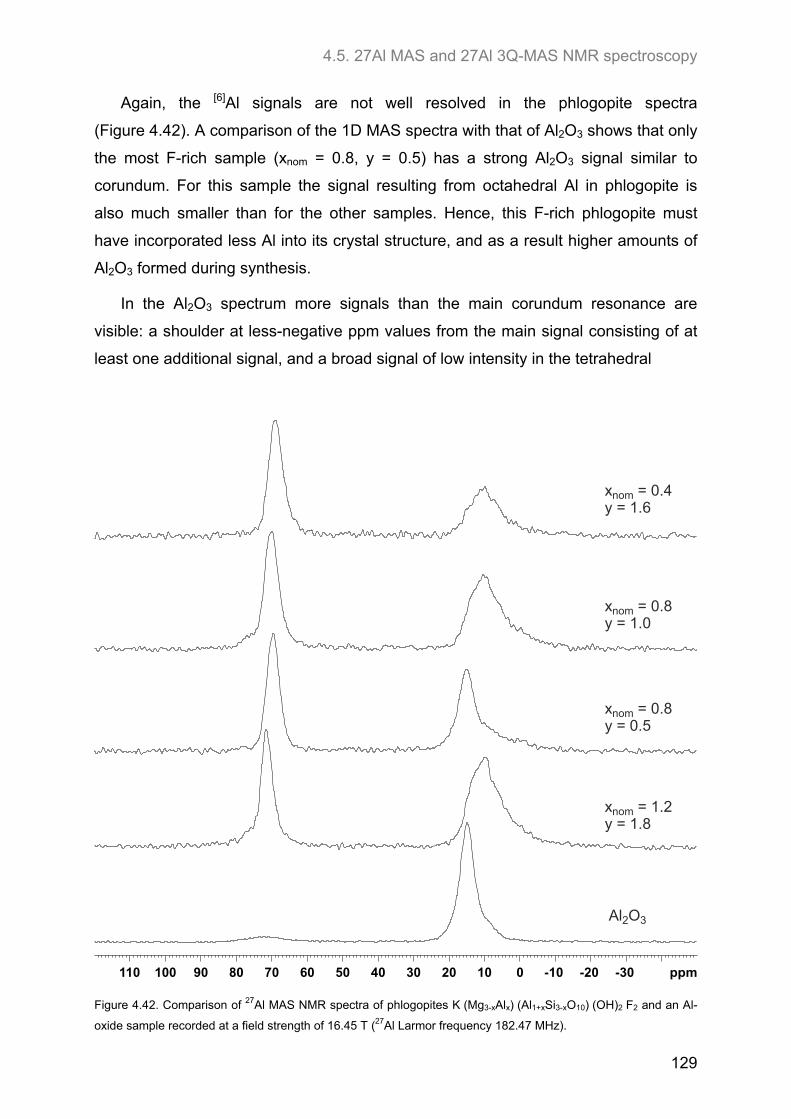
4.5. 27Al MAS and 27Al 3Q-MAS NMR spectroscopy
129
Again, the [6]Al signals are not well resolved in the phlogopite spectra
(Figure 4.42). A comparison of the 1D MAS spectra with that of Al2O3 shows that only
the most F-rich sample (xnom = 0.8, y = 0.5) has a strong Al2O3 signal similar to
corundum. For this sample the signal resulting from octahedral Al in phlogopite is
also much smaller than for the other samples. Hence, this F-rich phlogopite must
have incorporated less Al into its crystal structure, and as a result higher amounts of
Al2O3 formed during synthesis.
In the Al2O3 spectrum more signals than the main corundum resonance are
visible: a shoulder at less-negative ppm values from the main signal consisting of at
least one additional signal, and a broad signal of low intensity in the tetrahedral
-30-20-10110 100 90 80 70 60 50 40 30 20 10 0 ppm
x = 0.4y = 1.6
nom
x = 0.8y = 1.0
nom
x = 0.8y = 0.5
nom
x = 1.2y = 1.8
nom
Al O2 3
Figure 4.42. Comparison of 27Al MAS NMR spectra of phlogopites K (Mg3-xAlx) (Al1+xSi3-xO10) (OH)2 F2 and an Al-
oxide sample recorded at a field strength of 16.45 T (27Al Larmor frequency 182.47 MHz).
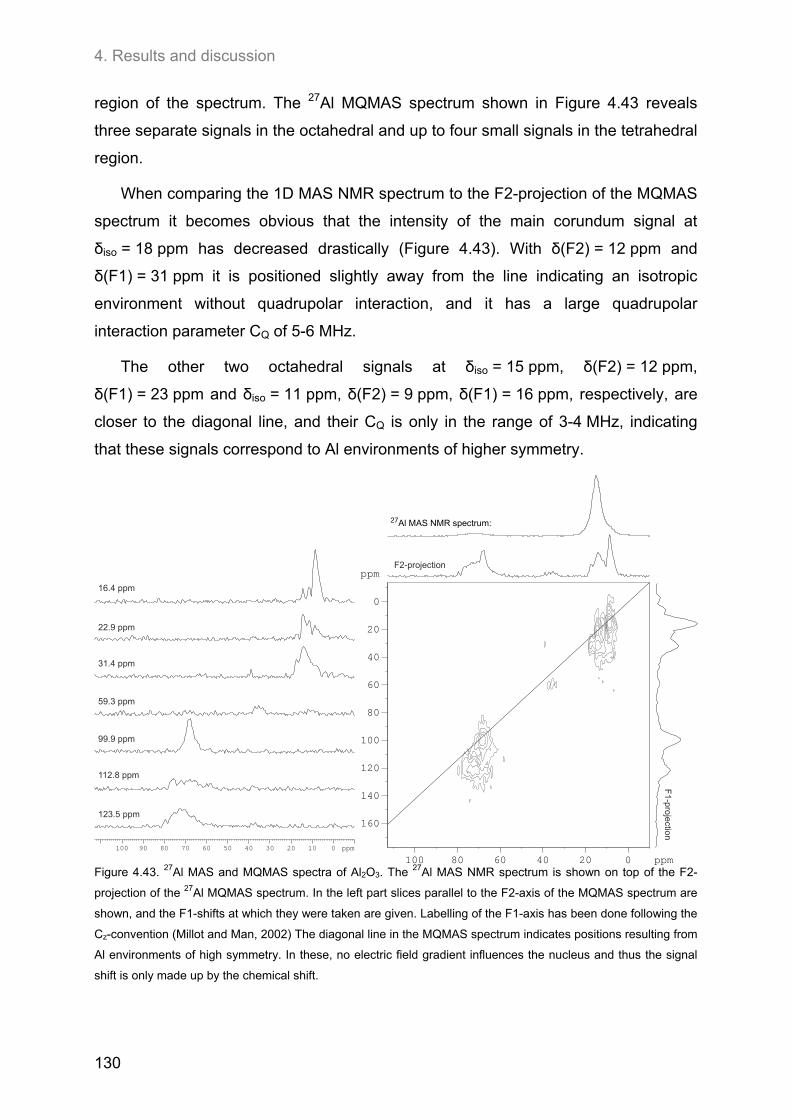
4. Results and discussion
130
region of the spectrum. The 27Al MQMAS spectrum shown in Figure 4.43 reveals
three separate signals in the octahedral and up to four small signals in the tetrahedral
region.
When comparing the 1D MAS NMR spectrum to the F2-projection of the MQMAS
spectrum it becomes obvious that the intensity of the main corundum signal at
δiso = 18 ppm has decreased drastically (Figure 4.43). With δ(F2) = 12 ppm and
δ(F1) = 31 ppm it is positioned slightly away from the line indicating an isotropic
environment without quadrupolar interaction, and it has a large quadrupolar
interaction parameter CQ of 5-6 MHz.
The other two octahedral signals at δiso = 15 ppm, δ(F2) = 12 ppm,
δ(F1) = 23 ppm and δiso = 11 ppm, δ(F2) = 9 ppm, δ(F1) = 16 ppm, respectively, are
closer to the diagonal line, and their CQ is only in the range of 3-4 MHz, indicating
that these signals correspond to Al environments of higher symmetry.
ppm
100 80 60 40 20 0 ppm
160
140
120
100
80
60
40
20
0
100 90 80 70 60 50 40 30 20 10 0 ppm
27Al MAS NMR spectrum:
16.4 ppm
22.9 ppm
31.4 ppm
112.8 ppm
123.5 ppm
59.3 ppm
99.9 ppm
F2-projection
F1
-projection
Figure 4.43. 27Al MAS and MQMAS spectra of Al2O3. The 27Al MAS NMR spectrum is shown on top of the F2-
projection of the 27Al MQMAS spectrum. In the left part slices parallel to the F2-axis of the MQMAS spectrum are
shown, and the F1-shifts at which they were taken are given. Labelling of the F1-axis has been done following the
Cz-convention (Millot and Man, 2002) The diagonal line in the MQMAS spectrum indicates positions resulting from
Al environments of high symmetry. In these, no electric field gradient influences the nucleus and thus the signal
shift is only made up by the chemical shift.
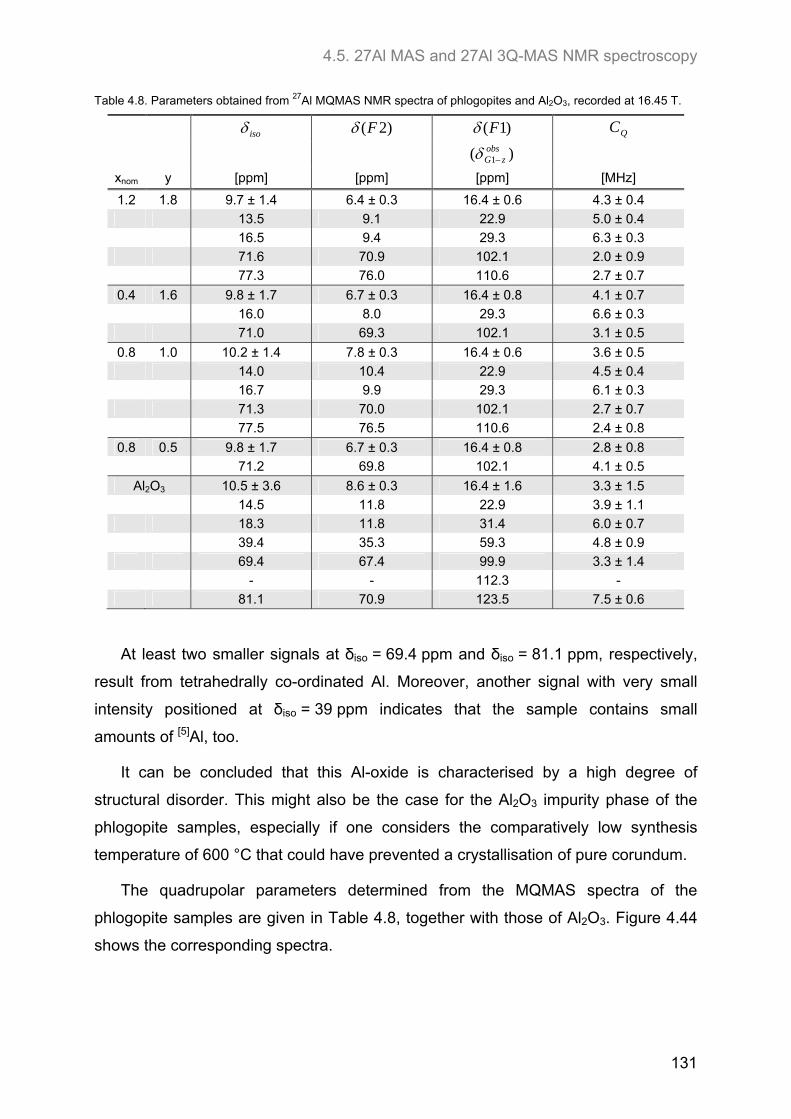
4.5. 27Al MAS and 27Al 3Q-MAS NMR spectroscopy
131
Table 4.8. Parameters obtained from 27Al MQMAS NMR spectra of phlogopites and Al2O3, recorded at 16.45 T.
iso )2(F )1(F QC
)( 1obs
zG
xnom y [ppm] [ppm] [ppm] [MHz]
1.2 1.8 9.7 ± 1.4 6.4 ± 0.3 16.4 ± 0.6 4.3 ± 0.4
13.5 9.1 22.9 5.0 ± 0.4
16.5 9.4 29.3 6.3 ± 0.3
71.6 70.9 102.1 2.0 ± 0.9
77.3 76.0 110.6 2.7 ± 0.7
0.4 1.6 9.8 ± 1.7 6.7 ± 0.3 16.4 ± 0.8 4.1 ± 0.7
16.0 8.0 29.3 6.6 ± 0.3
71.0 69.3 102.1 3.1 ± 0.5
0.8 1.0 10.2 ± 1.4 7.8 ± 0.3 16.4 ± 0.6 3.6 ± 0.5
14.0 10.4 22.9 4.5 ± 0.4
16.7 9.9 29.3 6.1 ± 0.3
71.3 70.0 102.1 2.7 ± 0.7
77.5 76.5 110.6 2.4 ± 0.8
0.8 0.5 9.8 ± 1.7 6.7 ± 0.3 16.4 ± 0.8 2.8 ± 0.8
71.2 69.8 102.1 4.1 ± 0.5
Al2O3 10.5 ± 3.6 8.6 ± 0.3 16.4 ± 1.6 3.3 ± 1.5
14.5 11.8 22.9 3.9 ± 1.1
18.3 11.8 31.4 6.0 ± 0.7
39.4 35.3 59.3 4.8 ± 0.9
69.4 67.4 99.9 3.3 ± 1.4
- - 112.3 -
81.1 70.9 123.5 7.5 ± 0.6
At least two smaller signals at δiso = 69.4 ppm and δiso = 81.1 ppm, respectively,
result from tetrahedrally co-ordinated Al. Moreover, another signal with very small
intensity positioned at δiso = 39 ppm indicates that the sample contains small
amounts of [5]Al, too.
It can be concluded that this Al-oxide is characterised by a high degree of
structural disorder. This might also be the case for the Al2O3 impurity phase of the
phlogopite samples, especially if one considers the comparatively low synthesis
temperature of 600 °C that could have prevented a crystallisation of pure corundum.
The quadrupolar parameters determined from the MQMAS spectra of the
phlogopite samples are given in Table 4.8, together with those of Al2O3. Figure 4.44
shows the corresponding spectra.
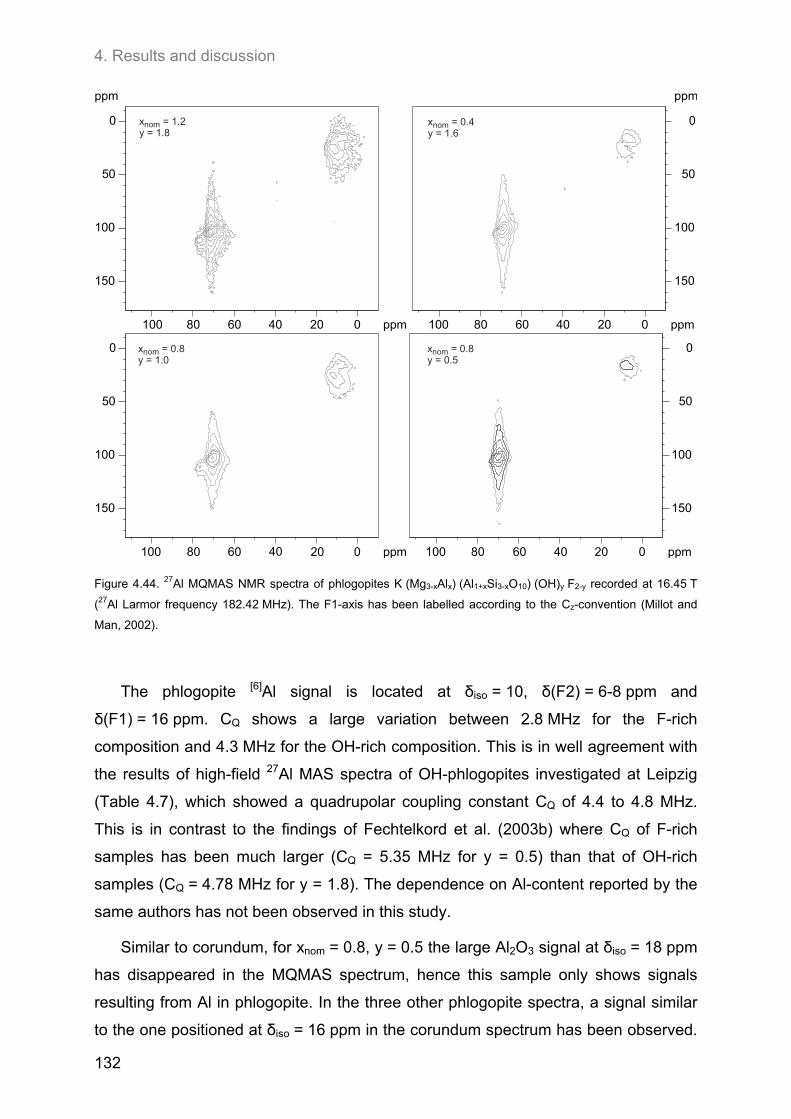
4. Results and discussion
132
ppm
100 80 60 40 20 0 ppm
150
100
50
0
ppm
100 80 60 40 20 0 ppm
150
100
50
0
100 80 60 40 20 0 ppm
150
100
50
0
100 80 60 40 20 0 ppm
150
100
50
0
x = 1.2y = 1.8
nom x = 0.4y = 1.6
nom
x = 0.8y = 0.5
nomx = 0.8y = 1.0
nom
Figure 4.44. 27Al MQMAS NMR spectra of phlogopites K (Mg3-xAlx) (Al1+xSi3-xO10) (OH)y F2-y recorded at 16.45 T
(27Al Larmor frequency 182.42 MHz). The F1-axis has been labelled according to the Cz-convention (Millot and
Man, 2002).
The phlogopite [6]Al signal is located at δiso = 10, δ(F2) = 6-8 ppm and
δ(F1) = 16 ppm. CQ shows a large variation between 2.8 MHz for the F-rich
composition and 4.3 MHz for the OH-rich composition. This is in well agreement with
the results of high-field 27Al MAS spectra of OH-phlogopites investigated at Leipzig
(Table 4.7), which showed a quadrupolar coupling constant CQ of 4.4 to 4.8 MHz.
This is in contrast to the findings of Fechtelkord et al. (2003b) where CQ of F-rich
samples has been much larger (CQ = 5.35 MHz for y = 0.5) than that of OH-rich
samples (CQ = 4.78 MHz for y = 1.8). The dependence on Al-content reported by the
same authors has not been observed in this study.
Similar to corundum, for xnom = 0.8, y = 0.5 the large Al2O3 signal at δiso = 18 ppm
has disappeared in the MQMAS spectrum, hence this sample only shows signals
resulting from Al in phlogopite. In the three other phlogopite spectra, a signal similar
to the one positioned at δiso = 16 ppm in the corundum spectrum has been observed.
4.5. 27Al MAS and 27Al 3Q-MAS NMR spectroscopy
133
δiso, δ(F2), δ(F1), and CQ are roughly in the same range and therefore, the Al
environment in both structures must be similar.
For high Al-samples with xnom = 0.8, y = 1.0 and xnom = 1.2, y = 1.8, respectively,
another signal at δiso = 14 ppm has been observed which is in well agreement with
another one of the Al2O3 signals indicating that this signal is also due to an Al2O3
environment. In agreement with the observations made for the spectra of the OH-
phlogopites described above, in two of these samples another phase containing
tetrahedral Al has been found, and the quadrupolar parameters of this phase could
be determined. However, these parameters are not in agreement with any of the
tetrahedral signals observed in the spectrum of corundum.
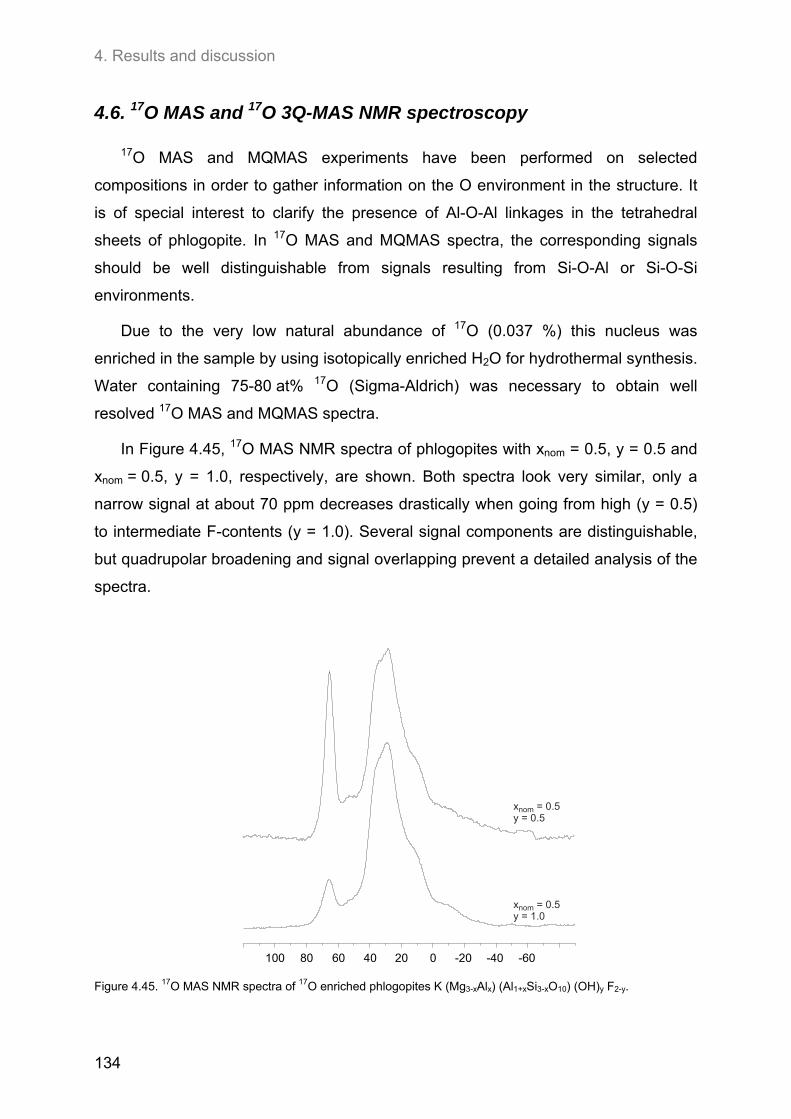
4. Results and discussion
134
4.6. 17O MAS and 17O 3Q-MAS NMR spectroscopy
17O MAS and MQMAS experiments have been performed on selected
compositions in order to gather information on the O environment in the structure. It
is of special interest to clarify the presence of Al-O-Al linkages in the tetrahedral
sheets of phlogopite. In 17O MAS and MQMAS spectra, the corresponding signals
should be well distinguishable from signals resulting from Si-O-Al or Si-O-Si
environments.
Due to the very low natural abundance of 17O (0.037 %) this nucleus was
enriched in the sample by using isotopically enriched H2O for hydrothermal synthesis.
Water containing 75-80 at% 17O (Sigma-Aldrich) was necessary to obtain well
resolved 17O MAS and MQMAS spectra.
In Figure 4.45, 17O MAS NMR spectra of phlogopites with xnom = 0.5, y = 0.5 and
xnom = 0.5, y = 1.0, respectively, are shown. Both spectra look very similar, only a
narrow signal at about 70 ppm decreases drastically when going from high (y = 0.5)
to intermediate F-contents (y = 1.0). Several signal components are distinguishable,
but quadrupolar broadening and signal overlapping prevent a detailed analysis of the
spectra.
x = 0.5y = 0.5
nom
x = 0.5y = 1.0
nom
-60-40-20100 80 60 40 20 0
Figure 4.45. 17O MAS NMR spectra of 17O enriched phlogopites K (Mg3-xAlx) (Al1+xSi3-xO10) (OH)y F2-y.
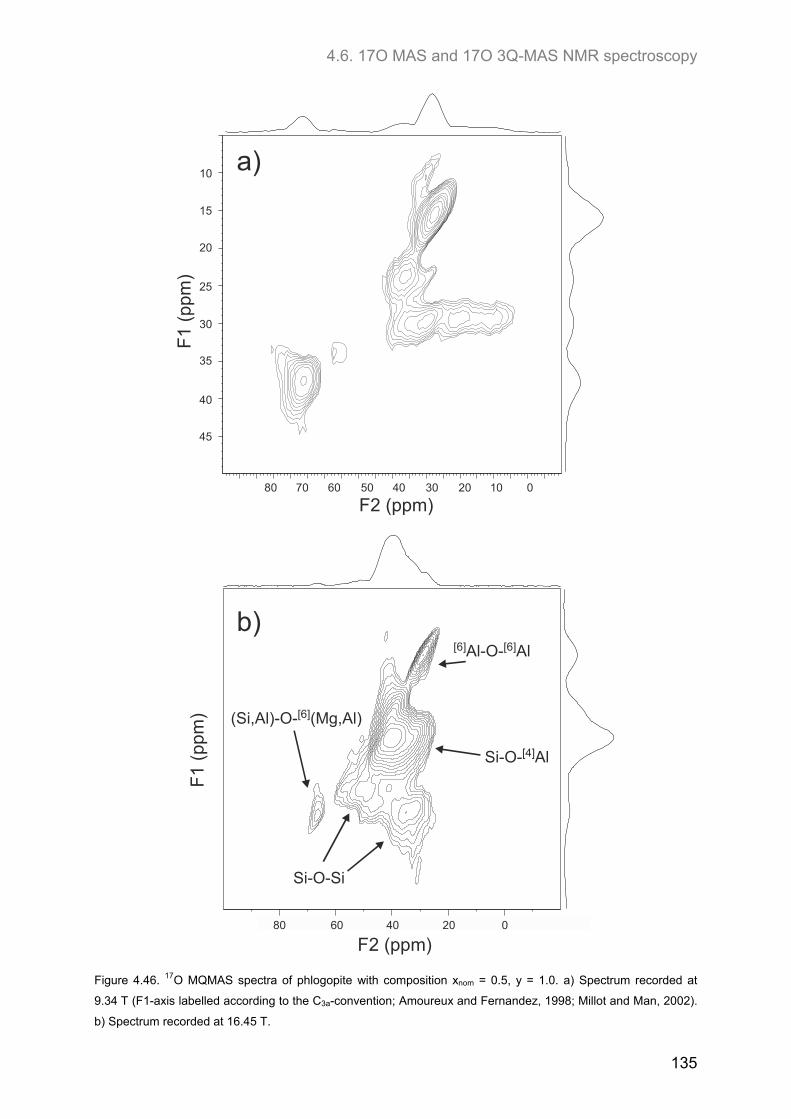
4.6. 17O MAS and 17O 3Q-MAS NMR spectroscopy
135
80 70 60 50 40 30 20 10 0
10
20
15
30
35
25
45
40
F2 (ppm)
F1
(ppm
)a)
80 60 40 20 0 ppm80 60 40 20 0
F2 (ppm)
F1
(ppm
)
b)[6] [6]Al-O- Al
Si-O- Al[4]
Si-O-Si
(Si,Al)-O- (Mg,Al)[6]
Figure 4.46. 17O MQMAS spectra of phlogopite with composition xnom = 0.5, y = 1.0. a) Spectrum recorded at
9.34 T (F1-axis labelled according to the C3a-convention; Amoureux and Fernandez, 1998; Millot and Man, 2002).
b) Spectrum recorded at 16.45 T.
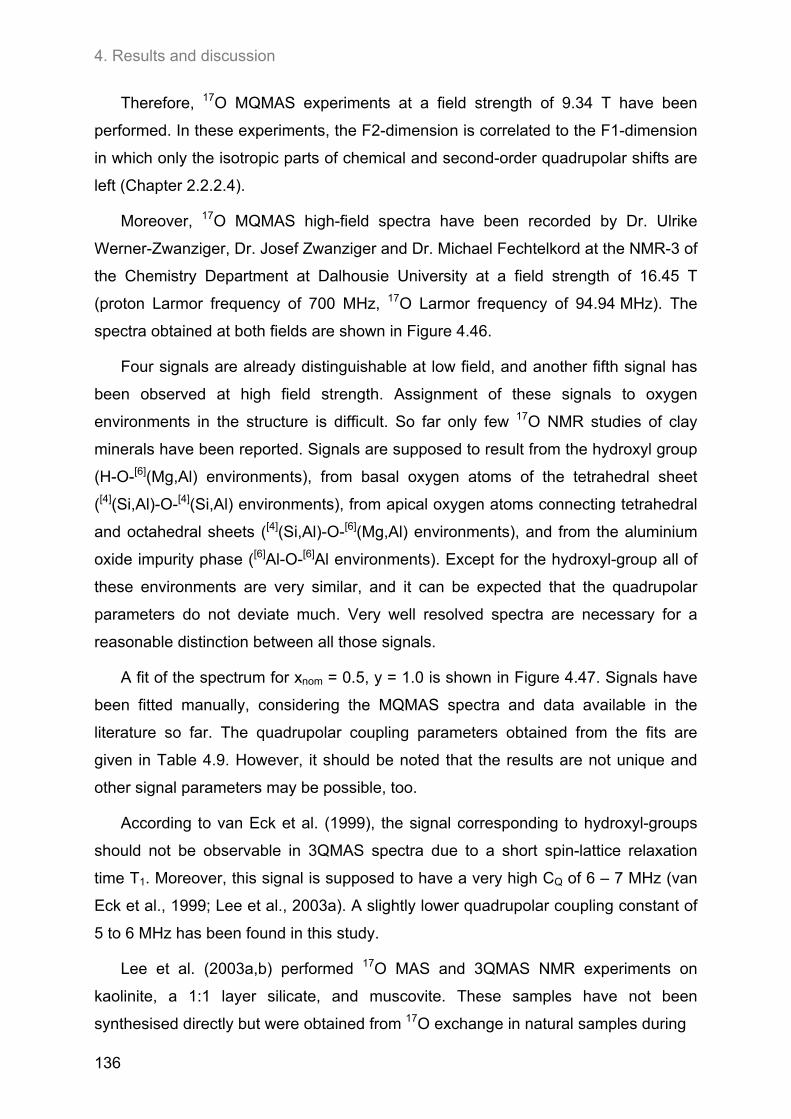
4. Results and discussion
136
Therefore, 17O MQMAS experiments at a field strength of 9.34 T have been
performed. In these experiments, the F2-dimension is correlated to the F1-dimension
in which only the isotropic parts of chemical and second-order quadrupolar shifts are
left (Chapter 2.2.2.4).
Moreover, 17O MQMAS high-field spectra have been recorded by Dr. Ulrike
Werner-Zwanziger, Dr. Josef Zwanziger and Dr. Michael Fechtelkord at the NMR-3 of
the Chemistry Department at Dalhousie University at a field strength of 16.45 T
(proton Larmor frequency of 700 MHz, 17O Larmor frequency of 94.94 MHz). The
spectra obtained at both fields are shown in Figure 4.46.
Four signals are already distinguishable at low field, and another fifth signal has
been observed at high field strength. Assignment of these signals to oxygen
environments in the structure is difficult. So far only few 17O NMR studies of clay
minerals have been reported. Signals are supposed to result from the hydroxyl group
(H-O-[6](Mg,Al) environments), from basal oxygen atoms of the tetrahedral sheet
([4](Si,Al)-O-[4](Si,Al) environments), from apical oxygen atoms connecting tetrahedral
and octahedral sheets ([4](Si,Al)-O-[6](Mg,Al) environments), and from the aluminium
oxide impurity phase ([6]Al-O-[6]Al environments). Except for the hydroxyl-group all of
these environments are very similar, and it can be expected that the quadrupolar
parameters do not deviate much. Very well resolved spectra are necessary for a
reasonable distinction between all those signals.
A fit of the spectrum for xnom = 0.5, y = 1.0 is shown in Figure 4.47. Signals have
been fitted manually, considering the MQMAS spectra and data available in the
literature so far. The quadrupolar coupling parameters obtained from the fits are
given in Table 4.9. However, it should be noted that the results are not unique and
other signal parameters may be possible, too.
According to van Eck et al. (1999), the signal corresponding to hydroxyl-groups
should not be observable in 3QMAS spectra due to a short spin-lattice relaxation
time T1. Moreover, this signal is supposed to have a very high CQ of 6 – 7 MHz (van
Eck et al., 1999; Lee et al., 2003a). A slightly lower quadrupolar coupling constant of
5 to 6 MHz has been found in this study.
Lee et al. (2003a,b) performed 17O MAS and 3QMAS NMR experiments on
kaolinite, a 1:1 layer silicate, and muscovite. These samples have not been
synthesised directly but were obtained from 17O exchange in natural samples during
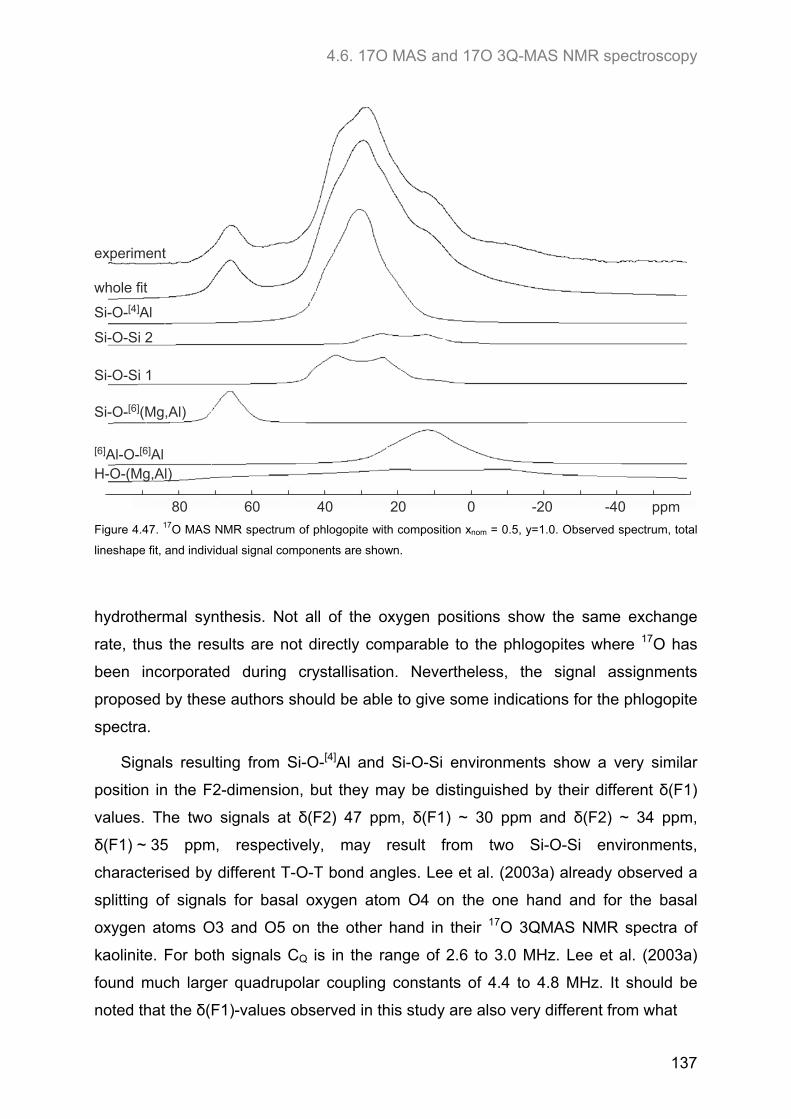
4.6. 17O MAS and 17O 3Q-MAS NMR spectroscopy
137
0 -20 -40 ppm20406080
H-O-(Mg,Al)
[6] [6]Al-O- Al
Si-O- (Mg,Al)[6]
Si-O-Si 1
Si-O-Si 2
Si-O- Al[4]
whole fit
experiment
Figure 4.47. 17O MAS NMR spectrum of phlogopite with composition xnom = 0.5, y=1.0. Observed spectrum, total
lineshape fit, and individual signal components are shown.
hydrothermal synthesis. Not all of the oxygen positions show the same exchange
rate, thus the results are not directly comparable to the phlogopites where 17O has
been incorporated during crystallisation. Nevertheless, the signal assignments
proposed by these authors should be able to give some indications for the phlogopite
spectra.
Signals resulting from Si-O-[4]Al and Si-O-Si environments show a very similar
position in the F2-dimension, but they may be distinguished by their different δ(F1)
values. The two signals at δ(F2) 47 ppm, δ(F1) ~ 30 ppm and δ(F2) ~ 34 ppm,
δ(F1) ~ 35 ppm, respectively, may result from two Si-O-Si environments,
characterised by different T-O-T bond angles. Lee et al. (2003a) already observed a
splitting of signals for basal oxygen atom O4 on the one hand and for the basal
oxygen atoms O3 and O5 on the other hand in their 17O 3QMAS NMR spectra of
kaolinite. For both signals CQ is in the range of 2.6 to 3.0 MHz. Lee et al. (2003a)
found much larger quadrupolar coupling constants of 4.4 to 4.8 MHz. It should be
noted that the δ(F1)-values observed in this study are also very different from what
4. Results and discussion
138
Table 4.9. Quadrupolar coupling parameters obtained from fits of 17O MAS and MQMAS NMR spectra obtained at
9.34 T. Error ranges have been estimated by changing the parameters manually observing χ2 until a disting
change of χ2 took place.
signal δ(F2) CQ η δ(F1) F
component [ppm] ± 0.5 [MHz] ± 0.1 [ppm] ± 3 [%] ± 3
H-O-[6](Mg,Al) 78.6 5.5 ± 0.5 0.6 - 20
Si-O-[6](Mg,Al) 71.1 1.5 ± 0.3 0.7 ~ 37 6
Si-O-Si 1 46.9 2.8 ± 0.2 0.3 ~ 30 13
Si-O-[4]Al 42.5 2.2 ± 0.2 0.7 ~ 25 40
Si-O-Si 2 33.8 2.7 ± 0.2 0.3 ~ 35 5
Al-O-Al 25.0 2.4 ± 0.2 0.7 ~ 17 16
these authors reported. However, this is due to different labelling conventions of the
isotropic F1-dimension.
The Si-O-[4]Al signal is positioned at δ(F2) = 43 ppm, δ(F1) ~ 25 ppm. In
agreement with the findings of Lee et al. (2003a), its quadrupolar coupling constant
of 2.0 – 2.4 MHz is slightly smaller than that of the Si-O-Si signals due to differences
in the bond angles.
The position of the [4](Si,Al)-O-[6]Mg,Al) signal is expected to be shifted to less
shielded values compared to the Si-O-Si and Si-O-Al signals. The narrow signal at
δ(F2) = 71 ppm, δ(F1) ~ 37 ppm might result from this type of environment. The
quadrupolar coupling constant CQ of 1.5 MHz is again much smaller than that
observed by Lee et al. (2003a) who reported a CQ of about 3.5 MHz for apical oxygen
atoms.
The fifth signal observed in the 17O MQMAS NMR spectra has a position of
δ(F2) = 25 ppm, δ(F1) ~ 17 ppm. This is close to the position where a [4]Al-O-[4]Al
signal could be expected (Stebbins et al., 1999), and indeed its quadrupolar coupling
constant is similar to that of the Si-O-[4]Al signal (CQ = 2.4 ± 0.2 MHz). However, this
signal shows a strong electric field gradient distribution resulting from a variation of
the oxygen environment in the structure. Therefore it is more likely that the signal
results from [6]Al-O-[6]Al environments in the structure of aluminium oxide also present
in the sample, but the presence of [4]Al-O-[4]Al linkages in the phlogopite structure
cannot be ruled out completely.
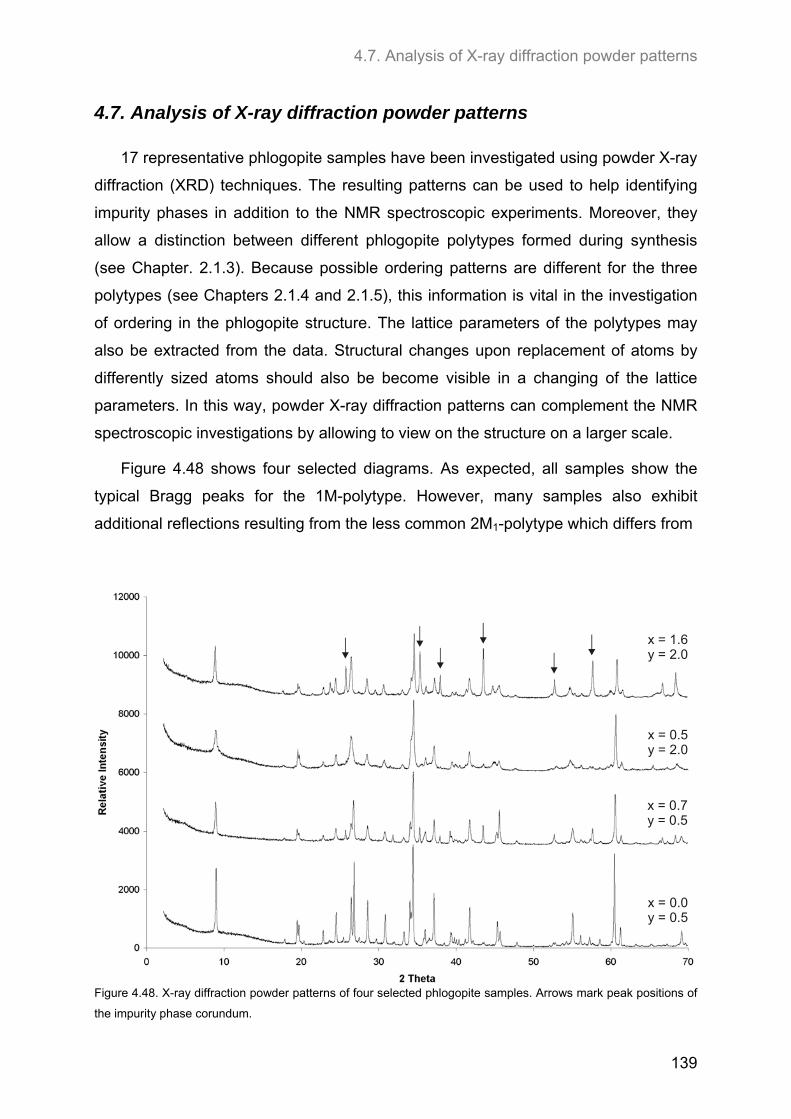
4.7. Analysis of X-ray diffraction powder patterns
139
4.7. Analysis of X-ray diffraction powder patterns
17 representative phlogopite samples have been investigated using powder X-ray
diffraction (XRD) techniques. The resulting patterns can be used to help identifying
impurity phases in addition to the NMR spectroscopic experiments. Moreover, they
allow a distinction between different phlogopite polytypes formed during synthesis
(see Chapter. 2.1.3). Because possible ordering patterns are different for the three
polytypes (see Chapters 2.1.4 and 2.1.5), this information is vital in the investigation
of ordering in the phlogopite structure. The lattice parameters of the polytypes may
also be extracted from the data. Structural changes upon replacement of atoms by
differently sized atoms should also be become visible in a changing of the lattice
parameters. In this way, powder X-ray diffraction patterns can complement the NMR
spectroscopic investigations by allowing to view on the structure on a larger scale.
Figure 4.48 shows four selected diagrams. As expected, all samples show the
typical Bragg peaks for the 1M-polytype. However, many samples also exhibit
additional reflections resulting from the less common 2M1-polytype which differs from
x = 0.0y = 0.5
x = 0.7y = 0.5
x = 0.5y = 2.0
x = 1.6y = 2.0
Figure 4.48. X-ray diffraction powder patterns of four selected phlogopite samples. Arrows mark peak positions of
the impurity phase corundum.
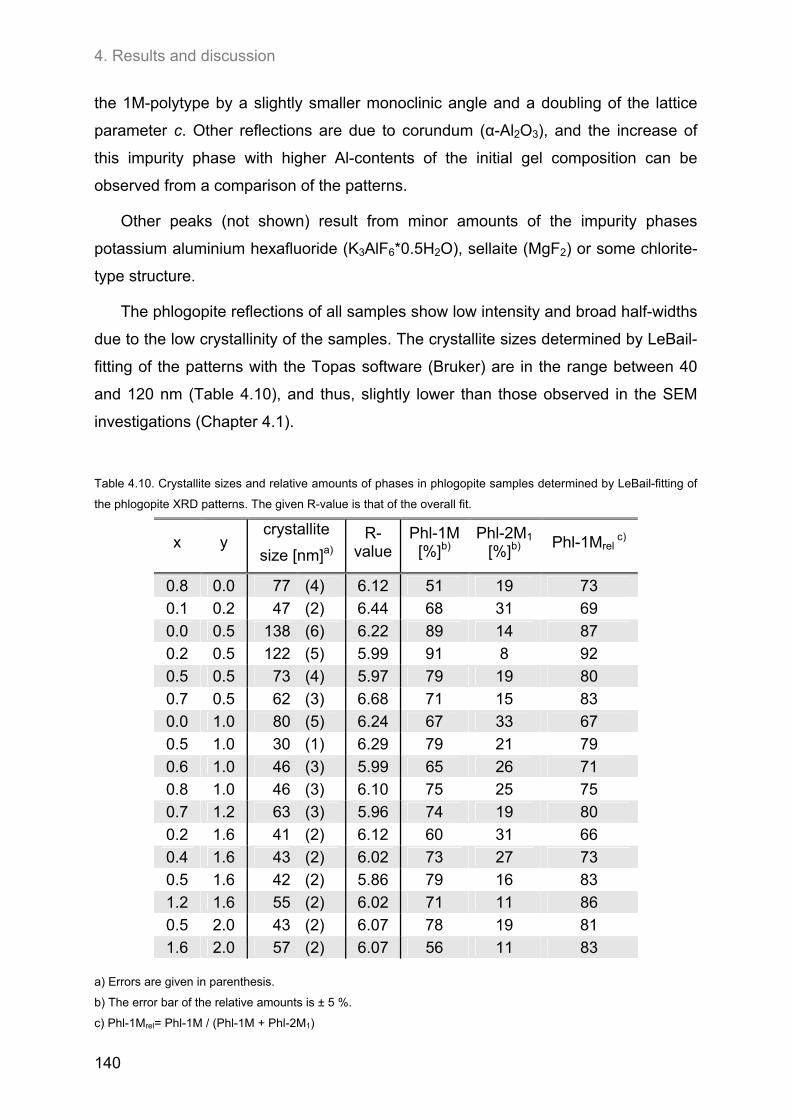
4. Results and discussion
140
the 1M-polytype by a slightly smaller monoclinic angle and a doubling of the lattice
parameter c. Other reflections are due to corundum (α-Al2O3), and the increase of
this impurity phase with higher Al-contents of the initial gel composition can be
observed from a comparison of the patterns.
Other peaks (not shown) result from minor amounts of the impurity phases
potassium aluminium hexafluoride (K3AlF6*0.5H2O), sellaite (MgF2) or some chlorite-
type structure.
The phlogopite reflections of all samples show low intensity and broad half-widths
due to the low crystallinity of the samples. The crystallite sizes determined by LeBail-
fitting of the patterns with the Topas software (Bruker) are in the range between 40
and 120 nm (Table 4.10), and thus, slightly lower than those observed in the SEM
investigations (Chapter 4.1).
Table 4.10. Crystallite sizes and relative amounts of phases in phlogopite samples determined by LeBail-fitting of
the phlogopite XRD patterns. The given R-value is that of the overall fit.
x y crystallite
size [nm]a)
R-value
Phl-1M [%]b)
Phl-2M1 [%]b) Phl-1Mrel
c)
0.8 0.0 77 (4) 6.12 51 19 73
0.1 0.2 47 (2) 6.44 68 31 69
0.0 0.5 138 (6) 6.22 89 14 87
0.2 0.5 122 (5) 5.99 91 8 92
0.5 0.5 73 (4) 5.97 79 19 80
0.7 0.5 62 (3) 6.68 71 15 83
0.0 1.0 80 (5) 6.24 67 33 67
0.5 1.0 30 (1) 6.29 79 21 79
0.6 1.0 46 (3) 5.99 65 26 71
0.8 1.0 46 (3) 6.10 75 25 75
0.7 1.2 63 (3) 5.96 74 19 80
0.2 1.6 41 (2) 6.12 60 31 66
0.4 1.6 43 (2) 6.02 73 27 73
0.5 1.6 42 (2) 5.86 79 16 83
1.2 1.6 55 (2) 6.02 71 11 86
0.5 2.0 43 (2) 6.07 78 19 81
1.6 2.0 57 (2) 6.07 56 11 83
a) Errors are given in parenthesis.
b) The error bar of the relative amounts is ± 5 %.
c) Phl-1Mrel= Phl-1M / (Phl-1M + Phl-2M1)
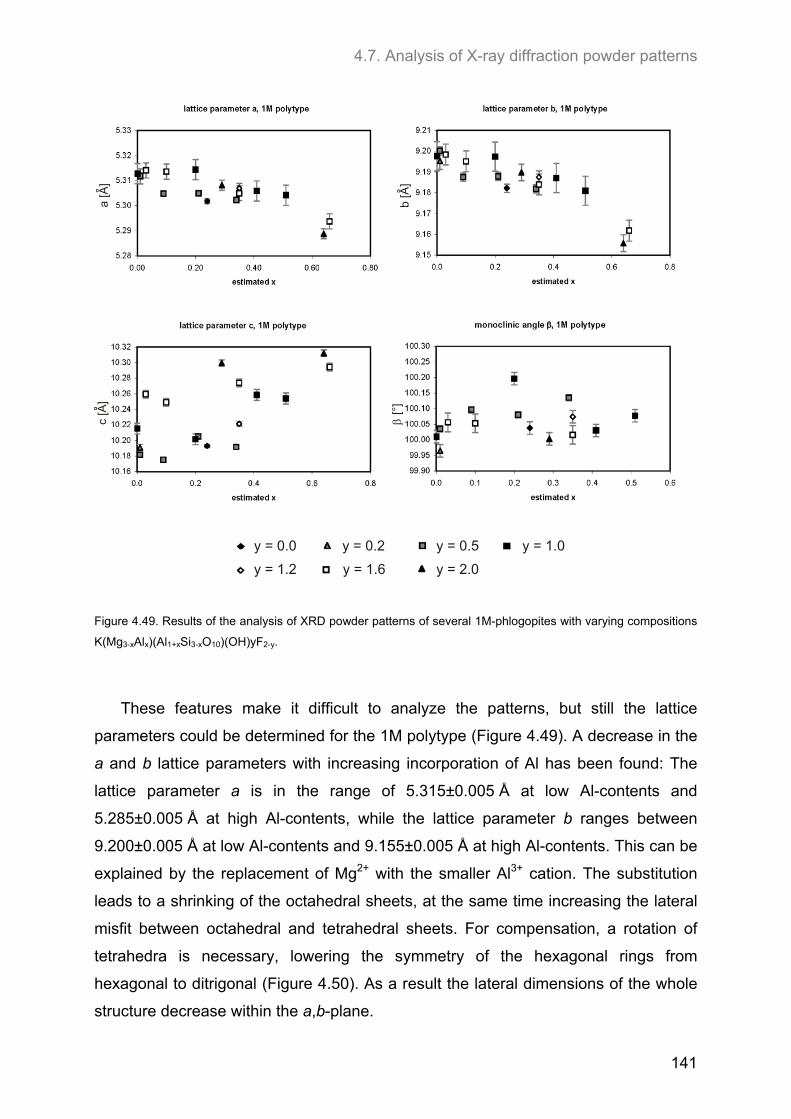
4.7. Analysis of X-ray diffraction powder patterns
141
a [A
]
b [A
]
c [A
]
[°
]
y = 0.0 y = 0.2 y = 0.5 y = 1.0
y = 1.2 y = 1.6 y = 2.0 Figure 4.49. Results of the analysis of XRD powder patterns of several 1M-phlogopites with varying compositions
K(Mg3-xAlx)(Al1+xSi3-xO10)(OH)yF2-y.
These features make it difficult to analyze the patterns, but still the lattice
parameters could be determined for the 1M polytype (Figure 4.49). A decrease in the
a and b lattice parameters with increasing incorporation of Al has been found: The
lattice parameter a is in the range of 5.315±0.005 Å at low Al-contents and
5.285±0.005 Å at high Al-contents, while the lattice parameter b ranges between
9.200±0.005 Å at low Al-contents and 9.155±0.005 Å at high Al-contents. This can be
explained by the replacement of Mg2+ with the smaller Al3+ cation. The substitution
leads to a shrinking of the octahedral sheets, at the same time increasing the lateral
misfit between octahedral and tetrahedral sheets. For compensation, a rotation of
tetrahedra is necessary, lowering the symmetry of the hexagonal rings from
hexagonal to ditrigonal (Figure 4.50). As a result the lateral dimensions of the whole
structure decrease within the a,b-plane.
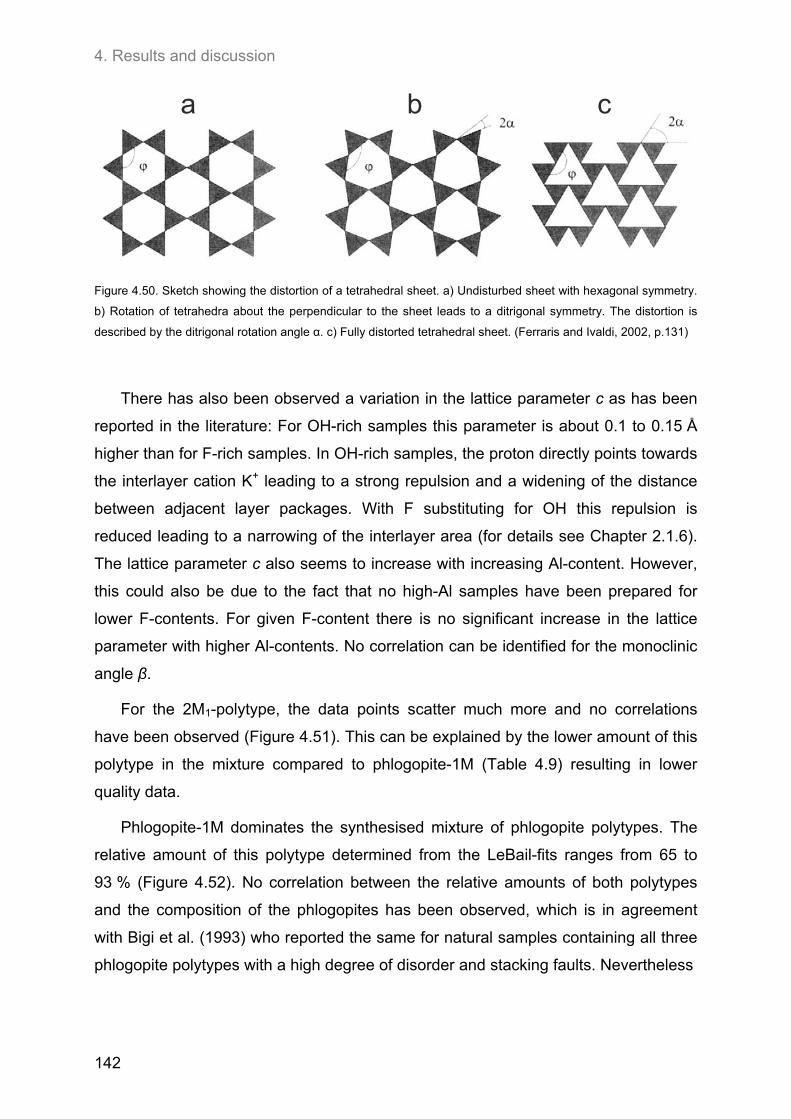
4. Results and discussion
142
a b c
Figure 4.50. Sketch showing the distortion of a tetrahedral sheet. a) Undisturbed sheet with hexagonal symmetry.
b) Rotation of tetrahedra about the perpendicular to the sheet leads to a ditrigonal symmetry. The distortion is
described by the ditrigonal rotation angle α. c) Fully distorted tetrahedral sheet. (Ferraris and Ivaldi, 2002, p.131)
There has also been observed a variation in the lattice parameter c as has been
reported in the literature: For OH-rich samples this parameter is about 0.1 to 0.15 Å
higher than for F-rich samples. In OH-rich samples, the proton directly points towards
the interlayer cation K+ leading to a strong repulsion and a widening of the distance
between adjacent layer packages. With F substituting for OH this repulsion is
reduced leading to a narrowing of the interlayer area (for details see Chapter 2.1.6).
The lattice parameter c also seems to increase with increasing Al-content. However,
this could also be due to the fact that no high-Al samples have been prepared for
lower F-contents. For given F-content there is no significant increase in the lattice
parameter with higher Al-contents. No correlation can be identified for the monoclinic
angle β.
For the 2M1-polytype, the data points scatter much more and no correlations
have been observed (Figure 4.51). This can be explained by the lower amount of this
polytype in the mixture compared to phlogopite-1M (Table 4.9) resulting in lower
quality data.
Phlogopite-1M dominates the synthesised mixture of phlogopite polytypes. The
relative amount of this polytype determined from the LeBail-fits ranges from 65 to
93 % (Figure 4.52). No correlation between the relative amounts of both polytypes
and the composition of the phlogopites has been observed, which is in agreement
with Bigi et al. (1993) who reported the same for natural samples containing all three
phlogopite polytypes with a high degree of disorder and stacking faults. Nevertheless
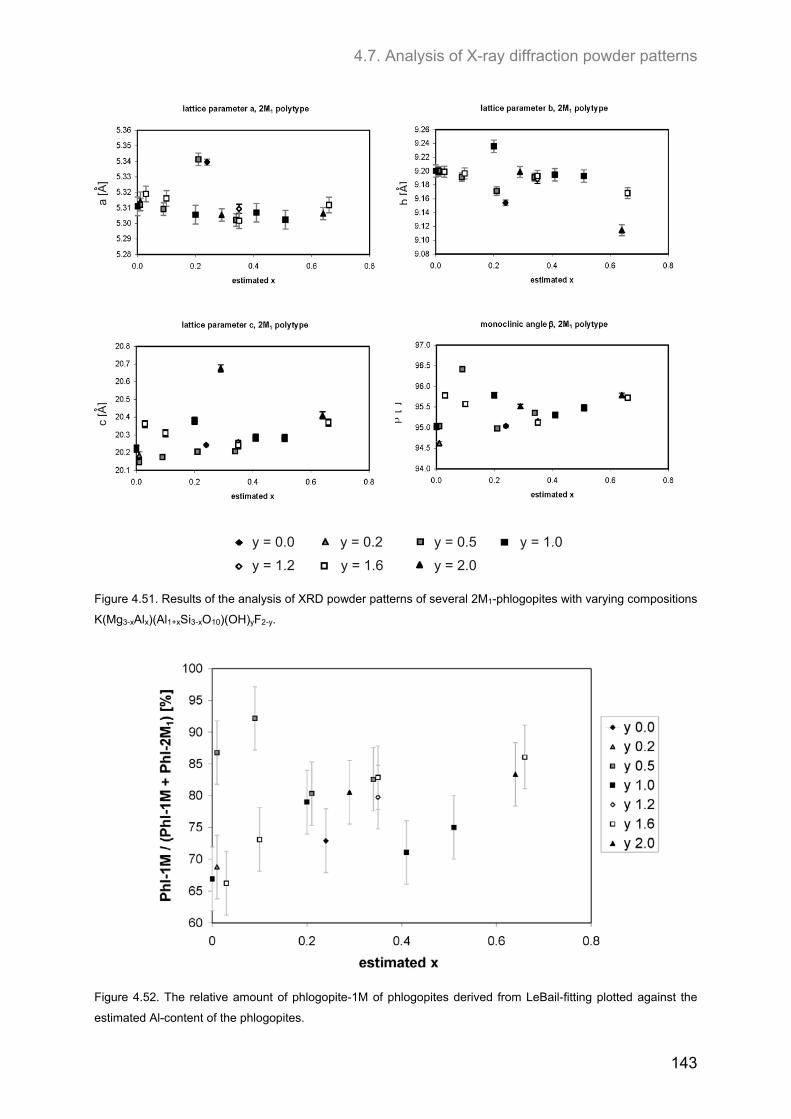
4.7. Analysis of X-ray diffraction powder patterns
143
c [A
]
b [A
]
a [A
]
[°
]
y = 0.0 y = 0.2 y = 0.5 y = 1.0
y = 1.2 y = 1.6 y = 2.0 Figure 4.51. Results of the analysis of XRD powder patterns of several 2M1-phlogopites with varying compositions
K(Mg3-xAlx)(Al1+xSi3-xO10)(OH)yF2-y.
Figure 4.52. The relative amount of phlogopite-1M of phlogopites derived from LeBail-fitting plotted against the
estimated Al-content of the phlogopites.
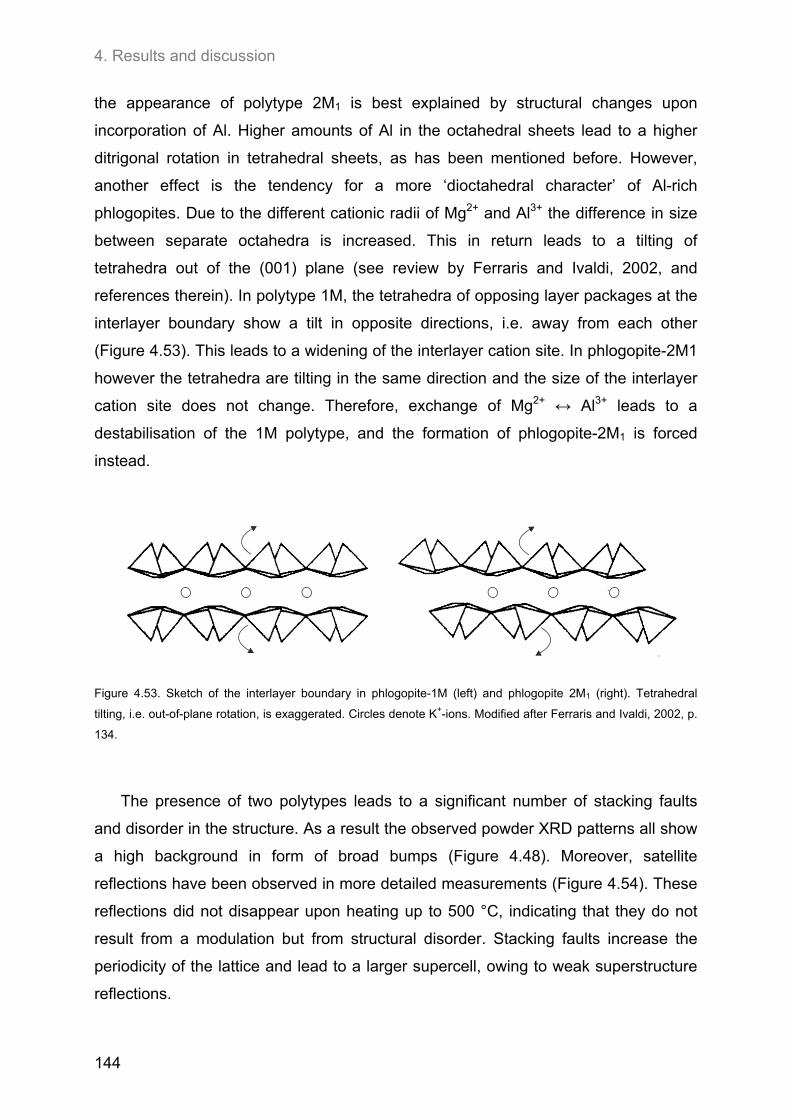
4. Results and discussion
144
the appearance of polytype 2M1 is best explained by structural changes upon
incorporation of Al. Higher amounts of Al in the octahedral sheets lead to a higher
ditrigonal rotation in tetrahedral sheets, as has been mentioned before. However,
another effect is the tendency for a more ‘dioctahedral character’ of Al-rich
phlogopites. Due to the different cationic radii of Mg2+ and Al3+ the difference in size
between separate octahedra is increased. This in return leads to a tilting of
tetrahedra out of the (001) plane (see review by Ferraris and Ivaldi, 2002, and
references therein). In polytype 1M, the tetrahedra of opposing layer packages at the
interlayer boundary show a tilt in opposite directions, i.e. away from each other
(Figure 4.53). This leads to a widening of the interlayer cation site. In phlogopite-2M1
however the tetrahedra are tilting in the same direction and the size of the interlayer
cation site does not change. Therefore, exchange of Mg2+ ↔ Al3+ leads to a
destabilisation of the 1M polytype, and the formation of phlogopite-2M1 is forced
instead.
Figure 4.53. Sketch of the interlayer boundary in phlogopite-1M (left) and phlogopite 2M1 (right). Tetrahedral
tilting, i.e. out-of-plane rotation, is exaggerated. Circles denote K+-ions. Modified after Ferraris and Ivaldi, 2002, p.
134.
The presence of two polytypes leads to a significant number of stacking faults
and disorder in the structure. As a result the observed powder XRD patterns all show
a high background in form of broad bumps (Figure 4.48). Moreover, satellite
reflections have been observed in more detailed measurements (Figure 4.54). These
reflections did not disappear upon heating up to 500 °C, indicating that they do not
result from a modulation but from structural disorder. Stacking faults increase the
periodicity of the lattice and lead to a larger supercell, owing to weak superstructure
reflections.
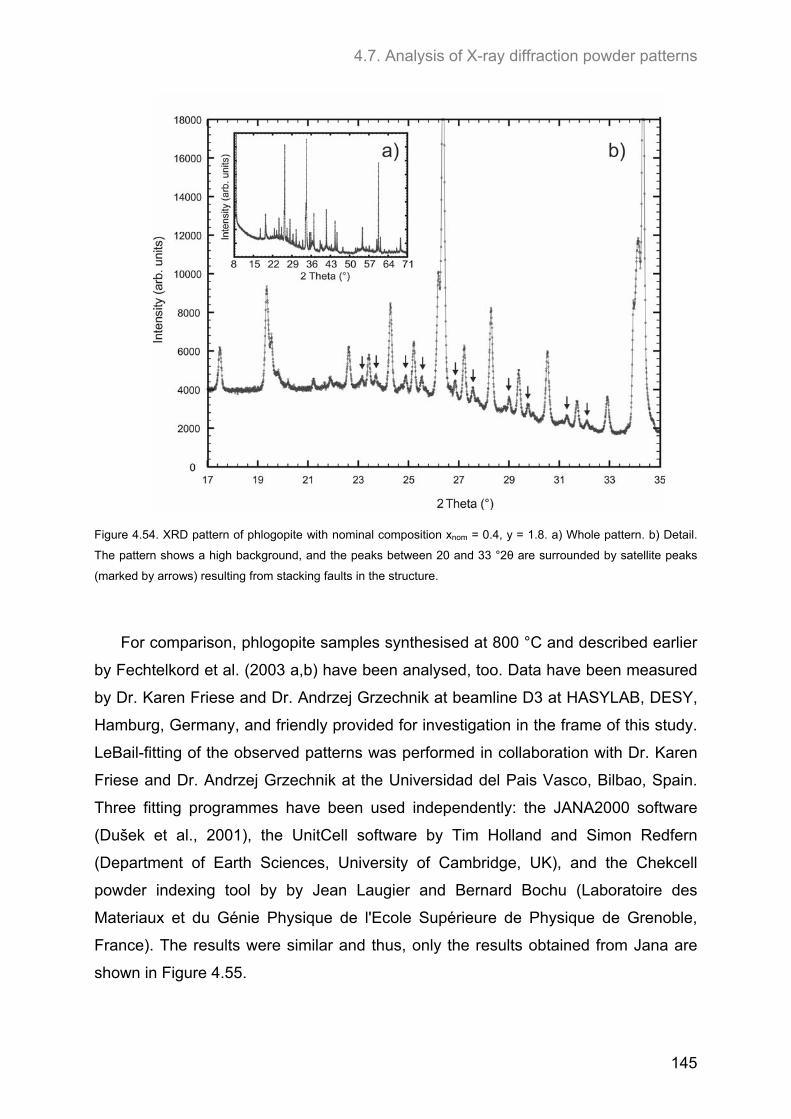
4.7. Analysis of X-ray diffraction powder patterns
145
Figure 4.54. XRD pattern of phlogopite with nominal composition xnom = 0.4, y = 1.8. a) Whole pattern. b) Detail.
The pattern shows a high background, and the peaks between 20 and 33 °2θ are surrounded by satellite peaks
(marked by arrows) resulting from stacking faults in the structure.
For comparison, phlogopite samples synthesised at 800 °C and described earlier
by Fechtelkord et al. (2003 a,b) have been analysed, too. Data have been measured
by Dr. Karen Friese and Dr. Andrzej Grzechnik at beamline D3 at HASYLAB, DESY,
Hamburg, Germany, and friendly provided for investigation in the frame of this study.
LeBail-fitting of the observed patterns was performed in collaboration with Dr. Karen
Friese and Dr. Andrzej Grzechnik at the Universidad del Pais Vasco, Bilbao, Spain.
Three fitting programmes have been used independently: the JANA2000 software
(Dušek et al., 2001), the UnitCell software by Tim Holland and Simon Redfern
(Department of Earth Sciences, University of Cambridge, UK), and the Chekcell
powder indexing tool by by Jean Laugier and Bernard Bochu (Laboratoire des
Materiaux et du Génie Physique de l'Ecole Supérieure de Physique de Grenoble,
France). The results were similar and thus, only the results obtained from Jana are
shown in Figure 4.55.
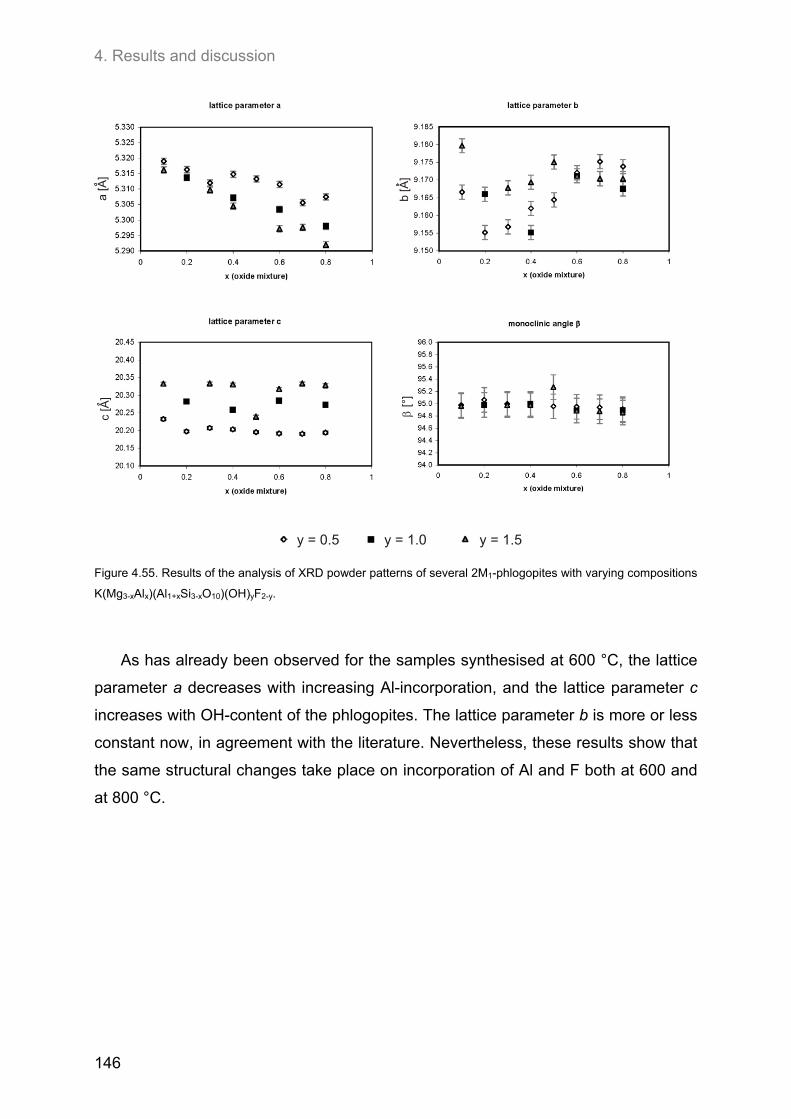
4. Results and discussion
146
a [A
]
b [A
]
c [A
]
[°
]
y = 1.0 y = 1.5y = 0.5 Figure 4.55. Results of the analysis of XRD powder patterns of several 2M1-phlogopites with varying compositions
K(Mg3-xAlx)(Al1+xSi3-xO10)(OH)yF2-y.
As has already been observed for the samples synthesised at 600 °C, the lattice
parameter a decreases with increasing Al-incorporation, and the lattice parameter c
increases with OH-content of the phlogopites. The lattice parameter b is more or less
constant now, in agreement with the literature. Nevertheless, these results show that
the same structural changes take place on incorporation of Al and F both at 600 and
at 800 °C.
5. Conclusions and outlook
147
5. Conclusions and outlook
All of the experimental and computational results have shown that incorporation
of Al into the phlogopite structure is energetically unfavourable. For all samples of
significant Al-contents the amount of Al in the phlogopite structure has been found to
be lower than that of the initial gel composition, and Al-rich impurity phases – mostly
Al2O3 – have been formed.
The results indicate that the ability to incorporate Al does not differ much for
phlogopites of varying F-contents. However, large differences have been observed
for extreme conditions, i.e. F-free and OH-free oxide mixtures. While hydroxyl-
phlogopites always showed a higher Al-contents than F-containing compositions, the
amount of Al incorporated into the water-free phlogopite was much lower.
A saturation effect has been found: The highest Al-content of pure hydroxyl-
phlogopites has been reached at xest = 0.82, corresponding to a composition of
K (Mg2.17Al0.82) (Al1.82Si2.17O10) (OH)2, and further addition of Al to the initial oxide
mixture did not yield more Al-rich phlogopites. A comparison between samples
synthesised at 600 and at 800 °C did not show significant differences, although a
positive effect on the incorporation of Al could have been expected for lower
temperatures.
Even if the amount of F in the initial oxide mixture did not change the Al-content
of the synthesised phlogopites, it had a strong influence on the amount of impurity
phases formed during synthesis. It has been found that high amounts of F prevented
extensive formation of Al-rich phlogopites and vice versa, resulting in a formation of
K3AlF6*0.5H2O instead of phlogopite (in addition to Al2O3). This effect has not only
been observed for F-rich samples and higher Al-contents, but also for extremely Al-
rich compositions even if the amount of F was very low.
For hydroxyl-phlogopites the Al-content of the octahedral sheet could be
determined and compared to that of the tetrahedral sheet. For Al-rich phlogopites
both values agreed well, but for Al-poor phlogopites the amount of Al estimated for
the octahedral sheet was higher than that of the tetrahedral sheet. This could result
from other substitution mechanism than Tschermak’s substitution taking place at low
Al-contents. Another possible explanation is the presence of Al-O-Al linkages in the
tetrahedral sheets resulting in an underestimation of the real amount of [4]Al.
5. Conclusions and outlook
148
The disfavour of phlogopite to incorporate additional Al into its structure is also
visible on the atomic level. The 29Si MAS NMR spectra indicate complete solid-
solution between phlogopite and ‘eastonite’, but this is only true on the macroscopic
level. Further NMR spectroscopic experiments as well as Monte Carlo simulations of
cation ordering in hydroxyl-phlogopites showed that in fact, the ‘eastonite’ component
is incorporated into the phlogopite structure in form of clusters affecting all sheets of
a single layer package. At x = 0.0 only K Mg3 (AlSi3O10) (OH)2 is present. As soon as
additional Al is brought into the structure, small clusters of composition
K (Mg2Al) (Al2Si2O10) (OH)2 appear. On further increase of the Al-content, these
clusters are enlarged, until – hypothetically – at x = 1.0 all areas of phlogopite
composition have disappeared.
The strain imposed on the structure on replacement of Mg/Si by [6]Al/[4]Al leads to
the formation of disordered phlogopites, composed of two different polytypes. Most of
the mixture is made up by polytype 1M which is typical for trioctahedral micas.
However, structural changes due to the substitution of Mg by the smaller Al lead to
the formation of phlogopite-2M1 which has a more dioctahedral character with
differently sized octahedra. A high background in the XRD patterns and satellite
reflections indicate a high degree of disorder, resulting from intergrowth of both
polytypes.
The observed ordering pattern can be traced back to three different interactions
controlling the distribution of ions in the phlogopite structure. In tetrahedral sheets,
ordering is dominated by the avoidance of Al-atoms as next-nearest-neighbours,
according to Loewenstein’s rule. This induces perfect ordering in the Al-rich clusters,
where Si and [4]Al strictly occupy tetrahedral sites alternately. The same is true for the
octahedral sheet, where Al is always surrounded by six Mg-ions. Again, placing Al-
atoms on directly neighboured sites is highly unfavourable. In contrast, there is a
strong preference for Al to occupy adjacent octahedral and tetrahedral sites, leading
to the cluster formation mentioned before. This means, Al-O-Al linkages are indeed
favourable in the phlogopite structure, if two different types of polyhedra are involved.
The strong preference of OH and F to be co-ordinated by Al-rich and Mg-rich
environments, respectively, suggests enrichment of OH in the ‘eastonite’ clusters. In
NMR spectroscopic experiments, a grouping of H and F in the octahedral sheet has
been observed. Moreover, it has been shown that the Al-content of the tetrahedral
5. Conclusions and outlook
149
sheet close to F is slightly lower than the overall Al-content. This indicates that a
separation into K Mg3 (AlSi3O10) F2 and K (Mg2Al) (Al2Si2O10) (OH)2 clusters is
favoured. However, this is not always possible depending on the F- and OH-contents
of the phlogopites. 1H and 19F MAS NMR spectra clearly show a variation in the
Al/Mg contents of OH/F environments with increasing amounts of Al in the structure.
It has been shown that the combination of NMR spectroscopy and MC
simulations is a useful tool for the investigation of ordering mechanisms in
phlogopite. A relationship between the ordering of ions in both sheets has been
clearly identified, and it has been demonstrated that the observed clustering has
important crystal chemical consequences influencing the overall phlogopite structure
and composition.
However, further investigations are still necessary. OH/F ordering has not been
considered in the simulations yet, but additional information is necessary to clarify the
observed relationship between ‘eastonite’ clustering and OH/F distribution.
Further investigation is also necessary from the experimental point of view.
Additional synthesis runs at T = 400 °C are necessary to improve our understanding
of the influence of temperature on Al-incorporation. Moreover, the chemical
composition of the investigated phlogopites has been very limited. The results
obtained in this study form a valuable basis, but compositions closer to natural
phlogopites/biotites need to be studied, too. Addition of small amounts of iron to the
starting mixture might be possible without resulting in too much broadening of NMR
lineshapes.
The methods used here may also be transferred to other mica structures.
Computational studies are already available for the dioctahedral muscovite/phengite
series (Palin and Dove, 2004) showing a Mg/[4]Al preference that is contradictory to
what was found for phlogopite in this study. NMR spectroscopic investigations are
necessary to obtain further information on cation ordering in phengite and to clarify
the fundamental differences between ordering mechanism in both types of structure.
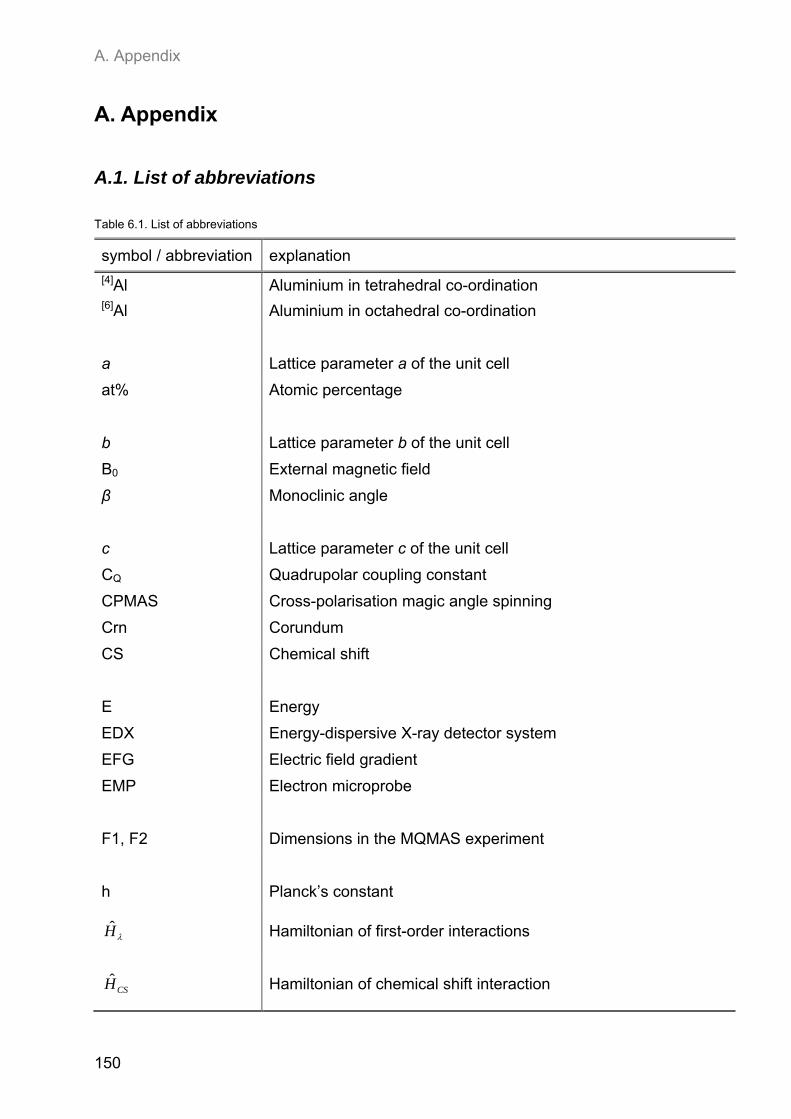
A. Appendix
150
A. Appendix
A.1. List of abbreviations
Table 6.1. List of abbreviations
symbol / abbreviation explanation
[4]Al Aluminium in tetrahedral co-ordination [6]Al Aluminium in octahedral co-ordination
a Lattice parameter a of the unit cell
at% Atomic percentage
b Lattice parameter b of the unit cell
B0 External magnetic field
β Monoclinic angle
c Lattice parameter c of the unit cell
CQ Quadrupolar coupling constant
CPMAS Cross-polarisation magic angle spinning
Crn Corundum
CS Chemical shift
E Energy
EDX Energy-dispersive X-ray detector system
EFG Electric field gradient
EMP Electron microprobe
F1, F2 Dimensions in the MQMAS experiment
h Planck’s constant
H Hamiltonian of first-order interactions
CSH Hamiltonian of chemical shift interaction
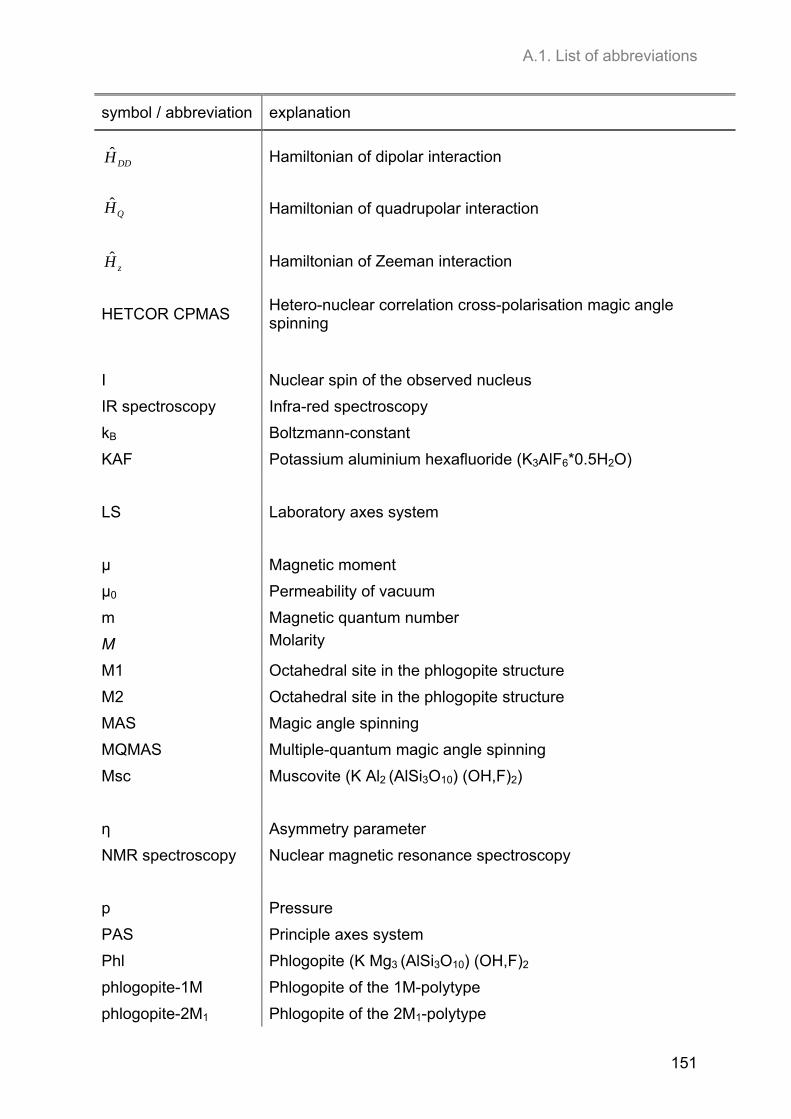
A.1. List of abbreviations
151
symbol / abbreviation explanation
DDH Hamiltonian of dipolar interaction
QH Hamiltonian of quadrupolar interaction
zH Hamiltonian of Zeeman interaction
HETCOR CPMAS Hetero-nuclear correlation cross-polarisation magic angle spinning
I Nuclear spin of the observed nucleus
IR spectroscopy Infra-red spectroscopy
kB Boltzmann-constant
KAF Potassium aluminium hexafluoride (K3AlF6*0.5H2O)
LS Laboratory axes system
µ Magnetic moment
µ0 Permeability of vacuum
m Magnetic quantum number
M Molarity
M1 Octahedral site in the phlogopite structure
M2 Octahedral site in the phlogopite structure
MAS Magic angle spinning
MQMAS Multiple-quantum magic angle spinning
Msc Muscovite (K Al2 (AlSi3O10) (OH,F)2)
η Asymmetry parameter
NMR spectroscopy Nuclear magnetic resonance spectroscopy
p Pressure
PAS Principle axes system
Phl Phlogopite (K Mg3 (AlSi3O10) (OH,F)2
phlogopite-1M Phlogopite of the 1M-polytype
phlogopite-2M1 Phlogopite of the 2M1-polytype
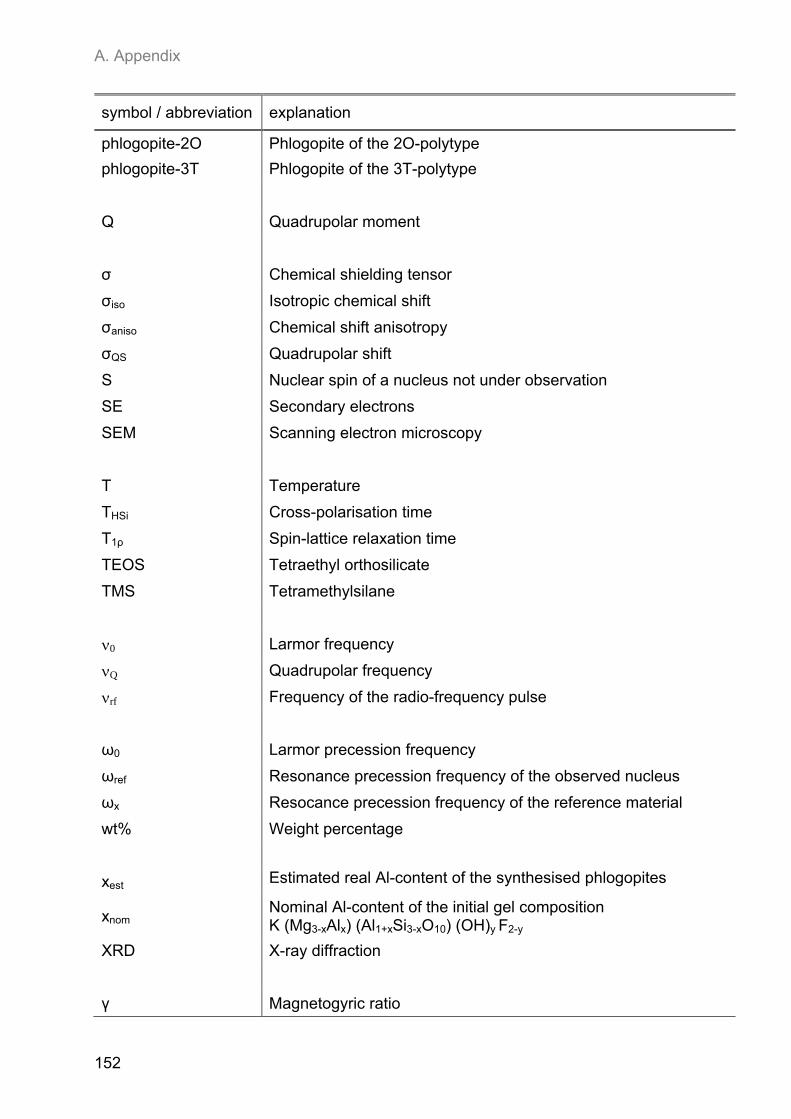
A. Appendix
152
symbol / abbreviation explanation
phlogopite-2O Phlogopite of the 2O-polytype
phlogopite-3T Phlogopite of the 3T-polytype
Q Quadrupolar moment
σ Chemical shielding tensor
σiso Isotropic chemical shift
σaniso Chemical shift anisotropy
σQS Quadrupolar shift
S Nuclear spin of a nucleus not under observation
SE Secondary electrons
SEM Scanning electron microscopy
T Temperature
THSi Cross-polarisation time
T1ρ Spin-lattice relaxation time
TEOS Tetraethyl orthosilicate
TMS Tetramethylsilane
0 Larmor frequency
Q Quadrupolar frequency
rf Frequency of the radio-frequency pulse
ω0 Larmor precession frequency
ωref Resonance precession frequency of the observed nucleus
ωx Resocance precession frequency of the reference material
wt% Weight percentage
xest Estimated real Al-content of the synthesised phlogopites
xnom Nominal Al-content of the initial gel composition K (Mg3-xAlx) (Al1+xSi3-xO10) (OH)y F2-y
XRD X-ray diffraction
γ Magnetogyric ratio
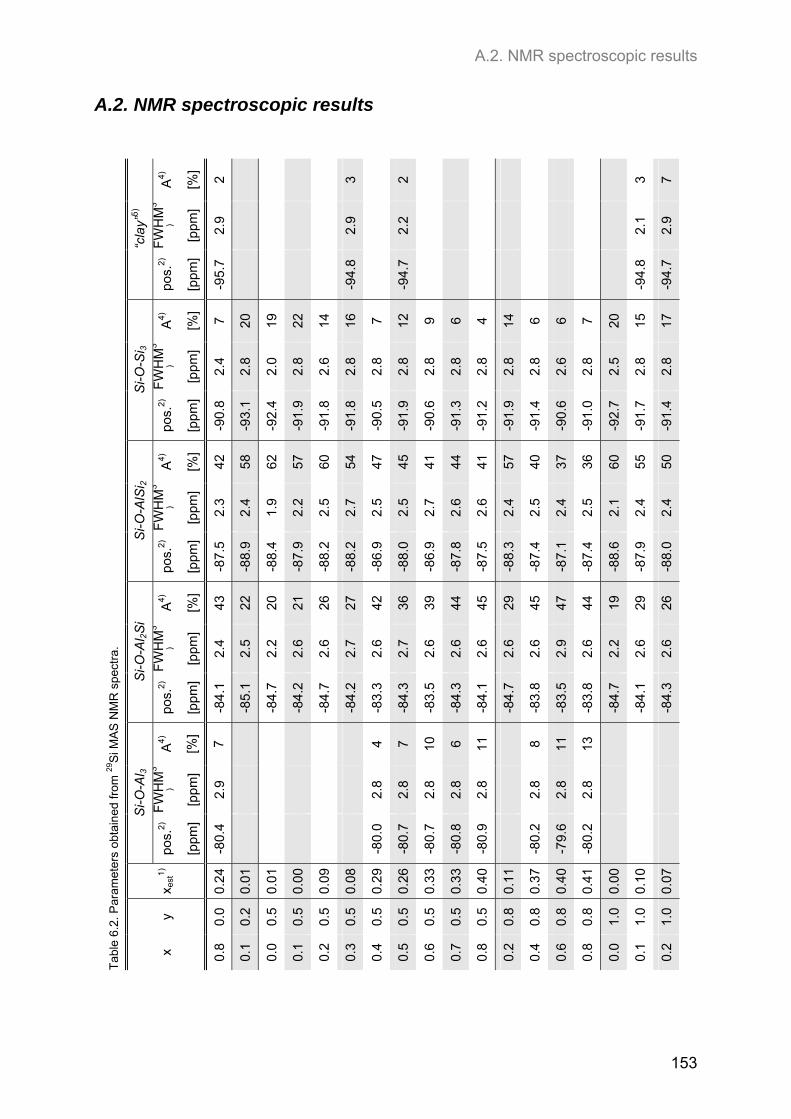
A.2. NMR spectroscopic results
153
A.2. NMR spectroscopic results
Tab
le 6
.2. P
aram
eter
s ob
tain
ed fr
om 2
9S
i MA
S N
MR
spe
ctra
.
“cla
y”5)
A4)
[%]
2 3 2 3 7
FW
HM
3
) [p
pm]
2.9
2.9
2.2
2.1
2.9
pos.
2)
[ppm
]
-95.
7
-94.
8
-94.
7
-94.
8
-94.
7
Si-O
-Si 3
A4)
[%]
7 20
19
22
14
16
7 12
9 6 4 14
6 6 7 20
15
17
FW
HM
3
) [p
pm]
2.4
2.8
2.0
2.8
2.6
2.8
2.8
2.8
2.8
2.8
2.8
2.8
2.8
2.6
2.8
2.5
2.8
2.8
pos.
2)
[ppm
]
-90.
8
-93.
1
-92.
4
-91.
9
-91.
8
-91.
8
-90.
5
-91.
9
-90.
6
-91.
3
-91.
2
-91.
9
-91.
4
-90.
6
-91.
0
-92.
7
-91.
7
-91.
4
Si-O
-AlS
i 2
A4)
[%]
42
58
62
57
60
54
47
45
41
44
41
57
40
37
36
60
55
50
FW
HM
3
) [p
pm]
2.3
2.4
1.9
2.2
2.5
2.7
2.5
2.5
2.7
2.6
2.6
2.4
2.5
2.4
2.5
2.1
2.4
2.4
pos.
2)
[ppm
]
-87.
5
-88.
9
-88.
4
-87.
9
-88.
2
-88.
2
-86.
9
-88.
0
-86.
9
-87.
8
-87.
5
-88.
3
-87.
4
-87.
1
-87.
4
-88.
6
-87.
9
-88.
0
Si-O
-Al 2
Si
A4)
[%]
43
22
20
21
26
27
42
36
39
44
45
29
45
47
44
19
29
26
FW
HM
3
) [p
pm]
2.4
2.5
2.2
2.6
2.6
2.7
2.6
2.7
2.6
2.6
2.6
2.6
2.6
2.9
2.6
2.2
2.6
2.6
pos.
2)
[ppm
]
-84.
1
-85.
1
-84.
7
-84.
2
-84.
7
-84.
2
-83.
3
-84.
3
-83.
5
-84.
3
-84.
1
-84.
7
-83.
8
-83.
5
-83.
8
-84.
7
-84.
1
-84.
3
Si-O
-Al 3
A4)
[%]
7 4 7 10
6 11 8 11
13
FW
HM
3
) [p
pm]
2.9
2.8
2.8
2.8
2.8
2.8
2.8
2.8
2.8
pos.
2)
[ppm
]
-80.
4
-80.
0
-80.
7
-80.
7
-80.
8
-80.
9
-80.
2
-79.
6
-80.
2
x est
1)
0.24
0.01
0.01
0.00
0.09
0.08
0.29
0.26
0.33
0.33
0.40
0.11
0.37
0.40
0.41
0.00
0.10
0.07
y
0.0
0.2
0.5
0.5
0.5
0.5
0.5
0.5
0.5
0.5
0.5
0.8
0.8
0.8
0.8
1.0
1.0
1.0
x
0.8
0.1
0.0
0.1
0.2
0.3
0.4
0.5
0.6
0.7
0.8
0.2
0.4
0.6
0.8
0.0
0.1
0.2
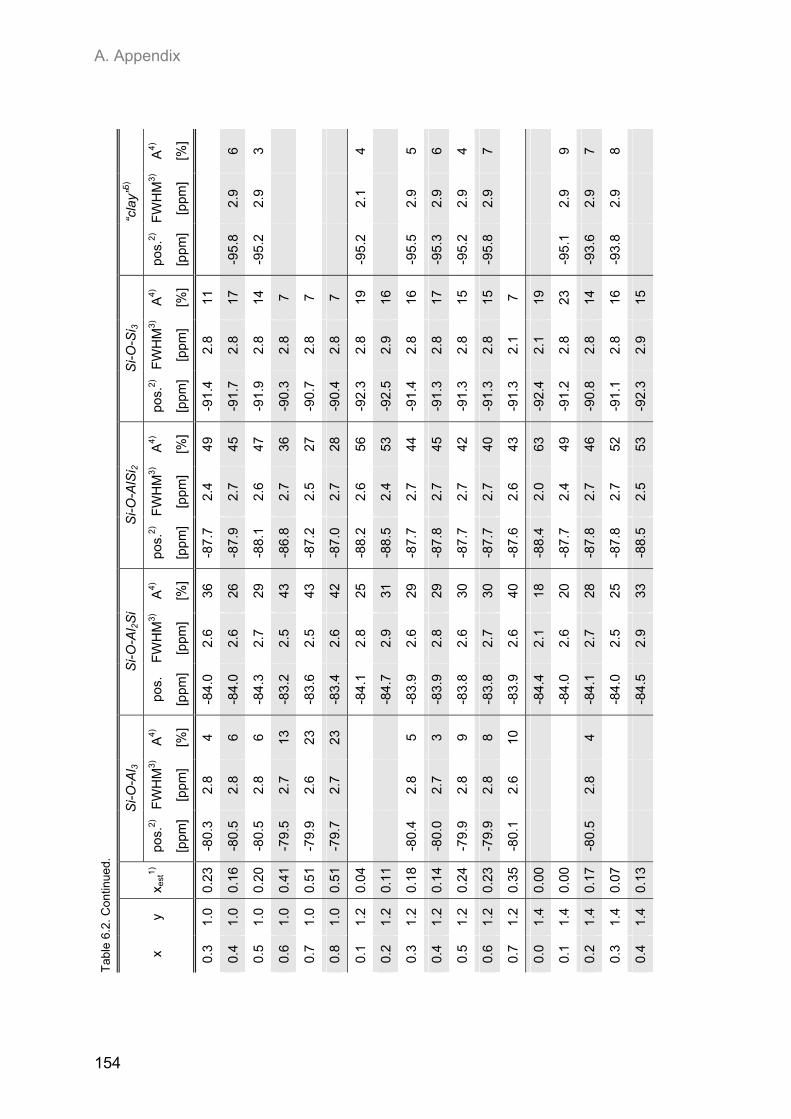
A. Appendix
154
T
able
6.2
. Co
ntin
ued.
“cla
y”5)
A4)
[%] 6 3 4 5 6 4 7 9 7 8
FW
HM
3)
[ppm
]
2.9
2.9
2.1
2.9
2.9
2.9
2.9
2.9
2.9
2.9
pos.
2)
[ppm
]
-95.
8
-95.
2
-95.
2
-95.
5
-95.
3
-95.
2
-95.
8
-95.
1
-93.
6
-93.
8
Si-O
-Si 3
A4)
[%]
11
17
14
7 7 7 19
16
16
17
15
15
7 19
23
14
16
15
FW
HM
3)
[ppm
]
2.8
2.8
2.8
2.8
2.8
2.8
2.8
2.9
2.8
2.8
2.8
2.8
2.1
2.1
2.8
2.8
2.8
2.9
pos.
2)
[ppm
]
-91.
4
-91.
7
-91.
9
-90.
3
-90.
7
-90.
4
-92.
3
-92.
5
-91.
4
-91.
3
-91.
3
-91.
3
-91.
3
-92.
4
-91.
2
-90.
8
-91.
1
-92.
3
Si-O
-AlS
i 2
A4)
[%]
49
45
47
36
27
28
56
53
44
45
42
40
43
63
49
46
52
53
FW
HM
3)
[ppm
]
2.4
2.7
2.6
2.7
2.5
2.7
2.6
2.4
2.7
2.7
2.7
2.7
2.6
2.0
2.4
2.7
2.7
2.5
pos.
2)
[ppm
]
-87.
7
-87.
9
-88.
1
-86.
8
-87.
2
-87.
0
-88.
2
-88.
5
-87.
7
-87.
8
-87.
7
-87.
7
-87.
6
-88.
4
-87.
7
-87.
8
-87.
8
-88.
5
Si-O
-Al 2
Si
A4)
[%]
36
26
29
43
43
42
25
31
29
29
30
30
40
18
20
28
25
33
FW
HM
3)
[ppm
]
2.6
2.6
2.7
2.5
2.5
2.6
2.8
2.9
2.6
2.8
2.6
2.7
2.6
2.1
2.6
2.7
2.5
2.9
pos.
[ppm
]
-84.
0
-84.
0
-84.
3
-83.
2
-83.
6
-83.
4
-84.
1
-84.
7
-83.
9
-83.
9
-83.
8
-83.
8
-83.
9
-84.
4
-84.
0
-84.
1
-84.
0
-84.
5
Si-O
-Al 3
A4)
[%]
4 6 6 13
23
23 5 3 9 8 10 4
FW
HM
3)
[ppm
]
2.8
2.8
2.8
2.7
2.6
2.7
2.8
2.7
2.8
2.8
2.6
2.8
pos.
2)
[ppm
]
-80.
3
-80.
5
-80.
5
-79.
5
-79.
9
-79.
7
-80.
4
-80.
0
-79.
9
-79.
9
-80.
1
-80.
5
x est
1)
0.23
0.16
0.20
0.41
0.51
0.51
0.04
0.11
0.18
0.14
0.24
0.23
0.35
0.00
0.00
0.17
0.07
0.13
y
1.0
1.0
1.0
1.0
1.0
1.0
1.2
1.2
1.2
1.2
1.2
1.2
1.2
1.4
1.4
1.4
1.4
1.4
x
0.3
0.4
0.5
0.6
0.7
0.8
0.1
0.2
0.3
0.4
0.5
0.6
0.7
0.0
0.1
0.2
0.3
0.4
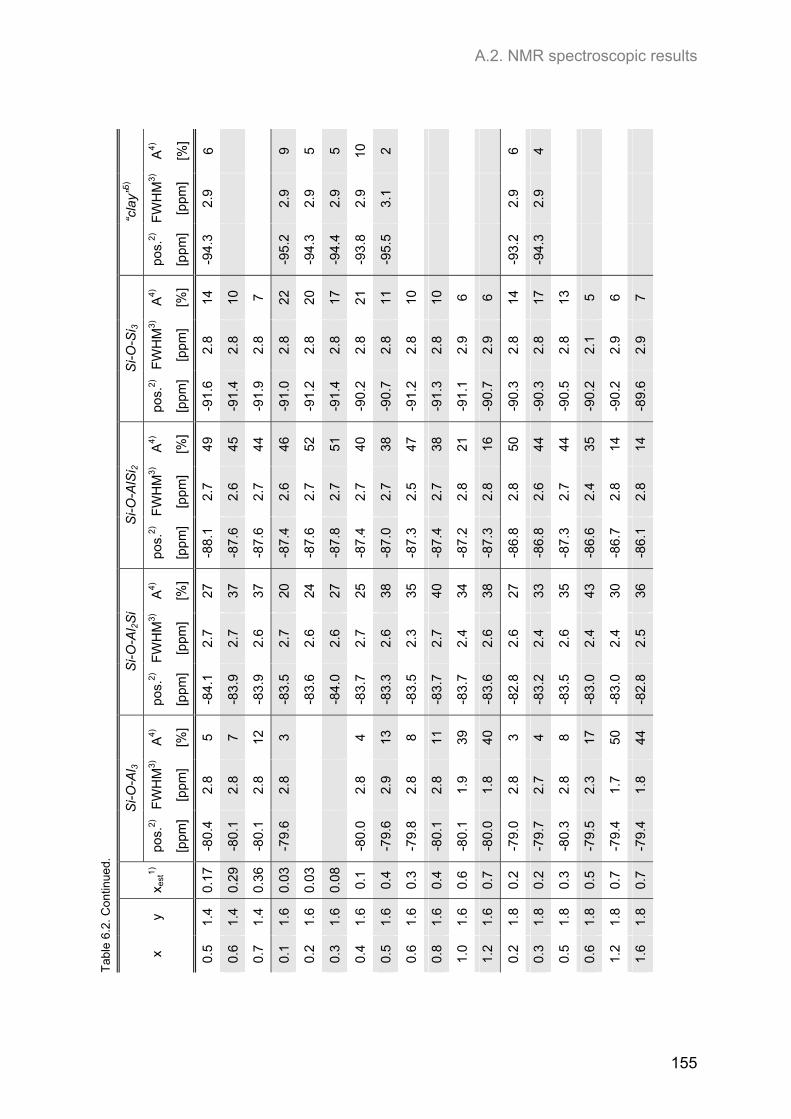
A.2. NMR spectroscopic results
155
T
able
6.2
. Co
ntin
ued.
“cla
y”5)
A4)
[%]
6 9 5 5 10
2 6 4
FW
HM
3)
[ppm
]
2.9
2.9
2.9
2.9
2.9
3.1
2.9
2.9
pos.
2)
[ppm
]
-94.
3
-95.
2
-94.
3
-94.
4
-93.
8
-95.
5
-93.
2
-94.
3
Si-O
-Si 3
A4)
[%]
14
10
7 22
20
17
21
11
10
10
6 6 14
17
13
5 6 7
FW
HM
3)
[ppm
]
2.8
2.8
2.8
2.8
2.8
2.8
2.8
2.8
2.8
2.8
2.9
2.9
2.8
2.8
2.8
2.1
2.9
2.9
pos.
2)
[ppm
]
-91.
6
-91.
4
-91.
9
-91.
0
-91.
2
-91.
4
-90.
2
-90.
7
-91.
2
-91.
3
-91.
1
-90.
7
-90.
3
-90.
3
-90.
5
-90.
2
-90.
2
-89.
6
Si-O
-AlS
i 2
A4)
[%]
49
45
44
46
52
51
40
38
47
38
21
16
50
44
44
35
14
14
FW
HM
3)
[ppm
]
2.7
2.6
2.7
2.6
2.7
2.7
2.7
2.7
2.5
2.7
2.8
2.8
2.8
2.6
2.7
2.4
2.8
2.8
pos.
2)
[ppm
]
-88.
1
-87.
6
-87.
6
-87.
4
-87.
6
-87.
8
-87.
4
-87.
0
-87.
3
-87.
4
-87.
2
-87.
3
-86.
8
-86.
8
-87.
3
-86.
6
-86.
7
-86.
1
Si-O
-Al 2
Si
A4)
[%]
27
37
37
20
24
27
25
38
35
40
34
38
27
33
35
43
30
36
FW
HM
3)
[ppm
]
2.7
2.7
2.6
2.7
2.6
2.6
2.7
2.6
2.3
2.7
2.4
2.6
2.6
2.4
2.6
2.4
2.4
2.5
pos.
2)
[ppm
]
-84.
1
-83.
9
-83.
9
-83.
5
-83.
6
-84.
0
-83.
7
-83.
3
-83.
5
-83.
7
-83.
7
-83.
6
-82.
8
-83.
2
-83.
5
-83.
0
-83.
0
-82.
8
Si-O
-Al 3
A4)
[%]
5 7 12
3 4 13
8 11
39
40
3 4 8 17
50
44
FW
HM
3)
[ppm
]
2.8
2.8
2.8
2.8
2.8
2.9
2.8
2.8
1.9
1.8
2.8
2.7
2.8
2.3
1.7
1.8
pos.
2)
[ppm
]
-80.
4
-80.
1
-80.
1
-79.
6
-80.
0
-79.
6
-79.
8
-80.
1
-80.
1
-80.
0
-79.
0
-79.
7
-80.
3
-79.
5
-79.
4
-79.
4
x est
1)
0.17
0.29
0.36
0.03
0.03
0.08
0.1
0.4
0.3
0.4
0.6
0.7
0.2
0.2
0.3
0.5
0.7
0.7
y
1.4
1.4
1.4
1.6
1.6
1.6
1.6
1.6
1.6
1.6
1.6
1.6
1.8
1.8
1.8
1.8
1.8
1.8
x
0.5
0.6
0.7
0.1
0.2
0.3
0.4
0.5
0.6
0.8
1.0
1.2
0.2
0.3
0.5
0.6
1.2
1.6
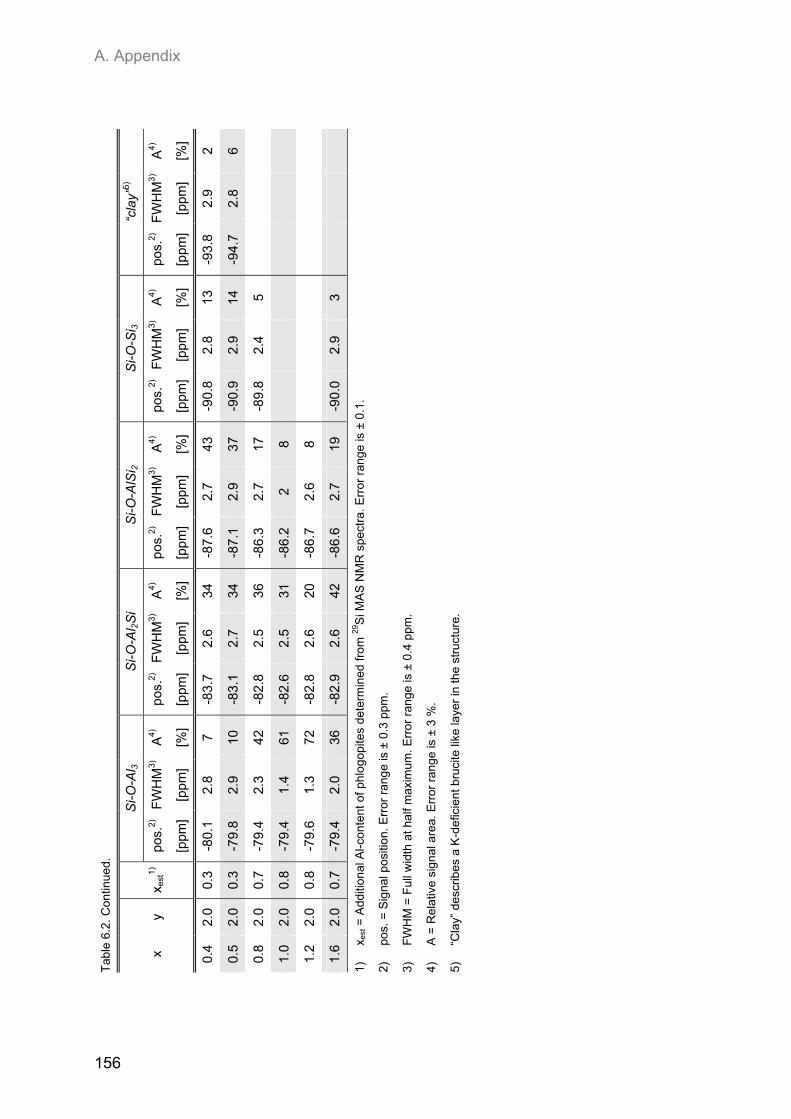
A. Appendix
156
T
able
6.2
. Co
ntin
ued.
“cla
y”5)
A4)
[%]
2 6
1)
x
est =
Add
ition
al A
l-con
tent
of p
hlo
gop
ites
dete
rmin
ed f
rom
29S
i MA
S N
MR
spe
ctra
. Err
or r
ang
e is
± 0
.1.
2)
p
os. =
Sig
nal p
ositi
on.
Err
or r
ang
e is
± 0
.3 p
pm.
3)
F
WH
M =
Ful
l wid
th a
t ha
lf m
axim
um. E
rror
ran
ge
is ±
0.4
ppm
.
4)
A
= R
elat
ive
sign
al a
rea.
Err
or r
ang
e is
± 3
%.
5)
“C
lay”
des
crib
es a
K-d
efic
ient
bru
cite
like
laye
r in
the
stru
ctur
e.
FW
HM
3)
[ppm
]
2.9
2.8
pos.
2)
[ppm
]
-93.
8
-94.
7
Si-O
-Si 3
A4)
[%]
13
14
5 3
FW
HM
3)
[ppm
]
2.8
2.9
2.4
2.9
pos.
2)
[ppm
]
-90.
8
-90.
9
-89.
8
-90.
0
Si-O
-AlS
i 2
A4)
[%]
43
37
17
8 8 19
FW
HM
3)
[ppm
]
2.7
2.9
2.7 2 2.6
2.7
pos.
2)
[ppm
]
-87.
6
-87.
1
-86.
3
-86.
2
-86.
7
-86.
6
Si-O
-Al 2
Si
A4)
[%]
34
34
36
31
20
42
FW
HM
3)
[ppm
]
2.6
2.7
2.5
2.5
2.6
2.6
pos.
2)
[ppm
]
-83.
7
-83.
1
-82.
8
-82.
6
-82.
8
-82.
9
Si-O
-Al 3
A4)
[%]
7 10
42
61
72
36
FW
HM
3)
[ppm
]
2.8
2.9
2.3
1.4
1.3
2.0
pos.
2)
[ppm
]
-80.
1
-79.
8
-79.
4
-79.
4
-79.
6
-79.
4
x est
1)
0.3
0.3
0.7
0.8
0.8
0.7
y
2.0
2.0
2.0
2.0
2.0
2.0
x
0.4
0.5
0.8
1.0
1.2
1.6
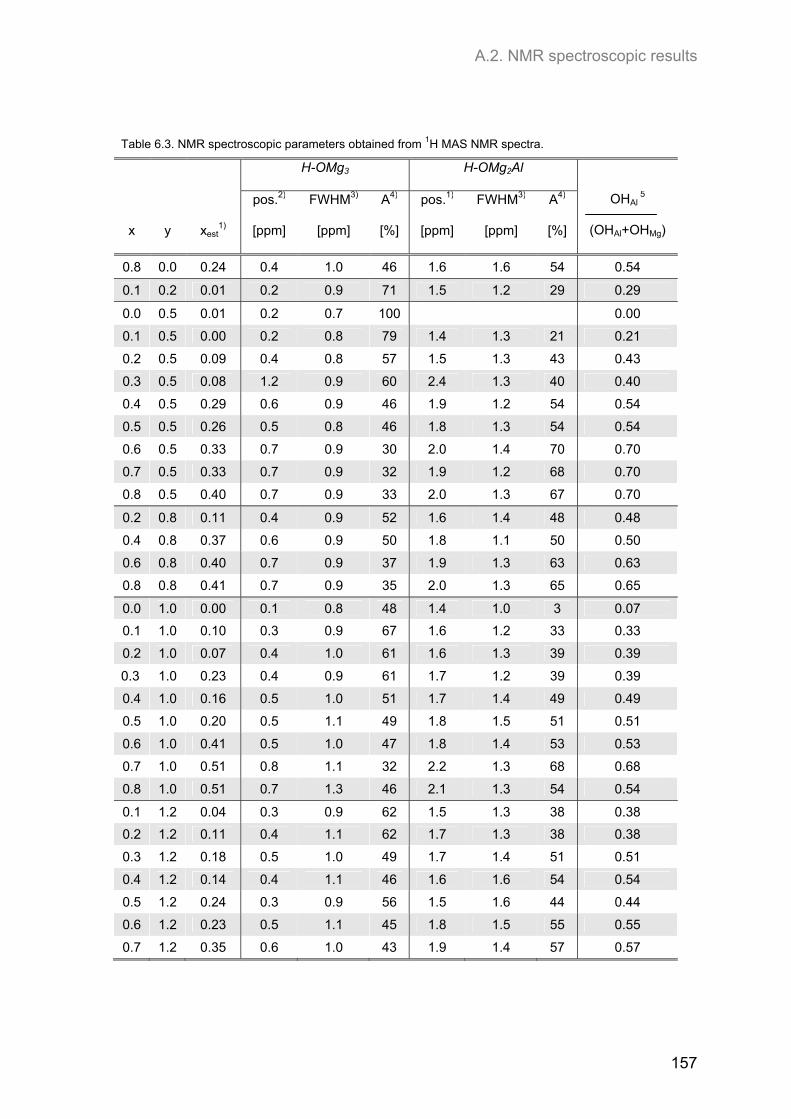
A.2. NMR spectroscopic results
157
Table 6.3. NMR spectroscopic parameters obtained from 1H MAS NMR spectra.
H-OMg3 H-OMg2Al
x y xest1)
pos.2)
[ppm]
FWHM3)
[ppm]
A4)
[%]
pos.1)
[ppm]
FWHM3)
[ppm]
A4)
[%]
OHAl 5
(OHAl+OHMg)
0.8 0.0 0.24 0.4 1.0 46 1.6 1.6 54 0.54
0.1 0.2 0.01 0.2 0.9 71 1.5 1.2 29 0.29
0.0 0.5 0.01 0.2 0.7 100 0.00
0.1 0.5 0.00 0.2 0.8 79 1.4 1.3 21 0.21
0.2 0.5 0.09 0.4 0.8 57 1.5 1.3 43 0.43
0.3 0.5 0.08 1.2 0.9 60 2.4 1.3 40 0.40
0.4 0.5 0.29 0.6 0.9 46 1.9 1.2 54 0.54
0.5 0.5 0.26 0.5 0.8 46 1.8 1.3 54 0.54
0.6 0.5 0.33 0.7 0.9 30 2.0 1.4 70 0.70
0.7 0.5 0.33 0.7 0.9 32 1.9 1.2 68 0.70
0.8 0.5 0.40 0.7 0.9 33 2.0 1.3 67 0.70
0.2 0.8 0.11 0.4 0.9 52 1.6 1.4 48 0.48
0.4 0.8 0.37 0.6 0.9 50 1.8 1.1 50 0.50
0.6 0.8 0.40 0.7 0.9 37 1.9 1.3 63 0.63
0.8 0.8 0.41 0.7 0.9 35 2.0 1.3 65 0.65
0.0 1.0 0.00 0.1 0.8 48 1.4 1.0 3 0.07
0.1 1.0 0.10 0.3 0.9 67 1.6 1.2 33 0.33
0.2 1.0 0.07 0.4 1.0 61 1.6 1.3 39 0.39
0.3 1.0 0.23 0.4 0.9 61 1.7 1.2 39 0.39
0.4 1.0 0.16 0.5 1.0 51 1.7 1.4 49 0.49
0.5 1.0 0.20 0.5 1.1 49 1.8 1.5 51 0.51
0.6 1.0 0.41 0.5 1.0 47 1.8 1.4 53 0.53
0.7 1.0 0.51 0.8 1.1 32 2.2 1.3 68 0.68
0.8 1.0 0.51 0.7 1.3 46 2.1 1.3 54 0.54
0.1 1.2 0.04 0.3 0.9 62 1.5 1.3 38 0.38
0.2 1.2 0.11 0.4 1.1 62 1.7 1.3 38 0.38
0.3 1.2 0.18 0.5 1.0 49 1.7 1.4 51 0.51
0.4 1.2 0.14 0.4 1.1 46 1.6 1.6 54 0.54
0.5 1.2 0.24 0.3 0.9 56 1.5 1.6 44 0.44
0.6 1.2 0.23 0.5 1.1 45 1.8 1.5 55 0.55
0.7 1.2 0.35 0.6 1.0 43 1.9 1.4 57 0.57
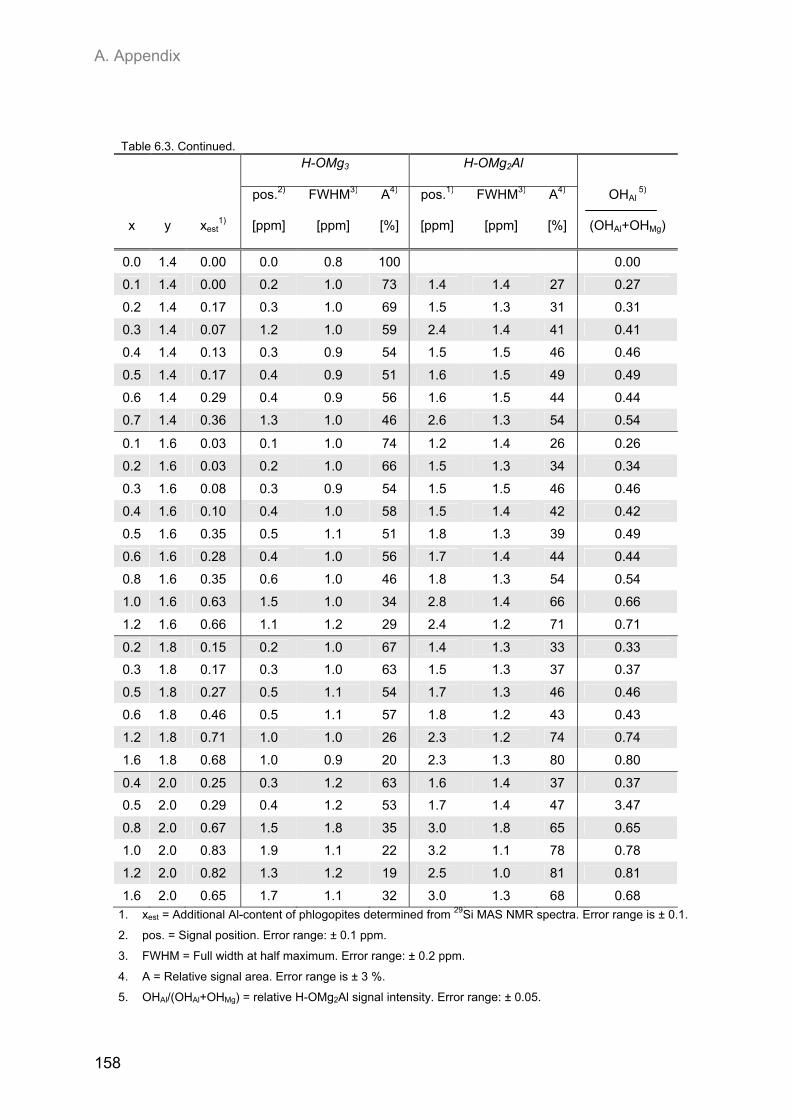
A. Appendix
158
Table 6.3. Continued.
H-OMg3 H-OMg2Al
x y xest1)
pos.2)
[ppm]
FWHM3)
[ppm]
A4)
[%]
pos.1)
[ppm]
FWHM3)
[ppm]
A4)
[%]
OHAl 5)
(OHAl+OHMg)
0.0 1.4 0.00 0.0 0.8 100 0.00
0.1 1.4 0.00 0.2 1.0 73 1.4 1.4 27 0.27
0.2 1.4 0.17 0.3 1.0 69 1.5 1.3 31 0.31
0.3 1.4 0.07 1.2 1.0 59 2.4 1.4 41 0.41
0.4 1.4 0.13 0.3 0.9 54 1.5 1.5 46 0.46
0.5 1.4 0.17 0.4 0.9 51 1.6 1.5 49 0.49
0.6 1.4 0.29 0.4 0.9 56 1.6 1.5 44 0.44
0.7 1.4 0.36 1.3 1.0 46 2.6 1.3 54 0.54
0.1 1.6 0.03 0.1 1.0 74 1.2 1.4 26 0.26
0.2 1.6 0.03 0.2 1.0 66 1.5 1.3 34 0.34
0.3 1.6 0.08 0.3 0.9 54 1.5 1.5 46 0.46
0.4 1.6 0.10 0.4 1.0 58 1.5 1.4 42 0.42
0.5 1.6 0.35 0.5 1.1 51 1.8 1.3 39 0.49
0.6 1.6 0.28 0.4 1.0 56 1.7 1.4 44 0.44
0.8 1.6 0.35 0.6 1.0 46 1.8 1.3 54 0.54
1.0 1.6 0.63 1.5 1.0 34 2.8 1.4 66 0.66
1.2 1.6 0.66 1.1 1.2 29 2.4 1.2 71 0.71
0.2 1.8 0.15 0.2 1.0 67 1.4 1.3 33 0.33
0.3 1.8 0.17 0.3 1.0 63 1.5 1.3 37 0.37
0.5 1.8 0.27 0.5 1.1 54 1.7 1.3 46 0.46
0.6 1.8 0.46 0.5 1.1 57 1.8 1.2 43 0.43
1.2 1.8 0.71 1.0 1.0 26 2.3 1.2 74 0.74
1.6 1.8 0.68 1.0 0.9 20 2.3 1.3 80 0.80
0.4 2.0 0.25 0.3 1.2 63 1.6 1.4 37 0.37
0.5 2.0 0.29 0.4 1.2 53 1.7 1.4 47 3.47
0.8 2.0 0.67 1.5 1.8 35 3.0 1.8 65 0.65
1.0 2.0 0.83 1.9 1.1 22 3.2 1.1 78 0.78
1.2 2.0 0.82 1.3 1.2 19 2.5 1.0 81 0.81
1.6 2.0 0.65 1.7 1.1 32 3.0 1.3 68 0.68 1. xest = Additional Al-content of phlogopites determined from 29Si MAS NMR spectra. Error range is ± 0.1.
2. pos. = Signal position. Error range: ± 0.1 ppm.
3. FWHM = Full width at half maximum. Error range: ± 0.2 ppm.
4. A = Relative signal area. Error range is ± 3 %.
5. OHAl/(OHAl+OHMg) = relative H-OMg2Al signal intensity. Error range: ± 0.05.
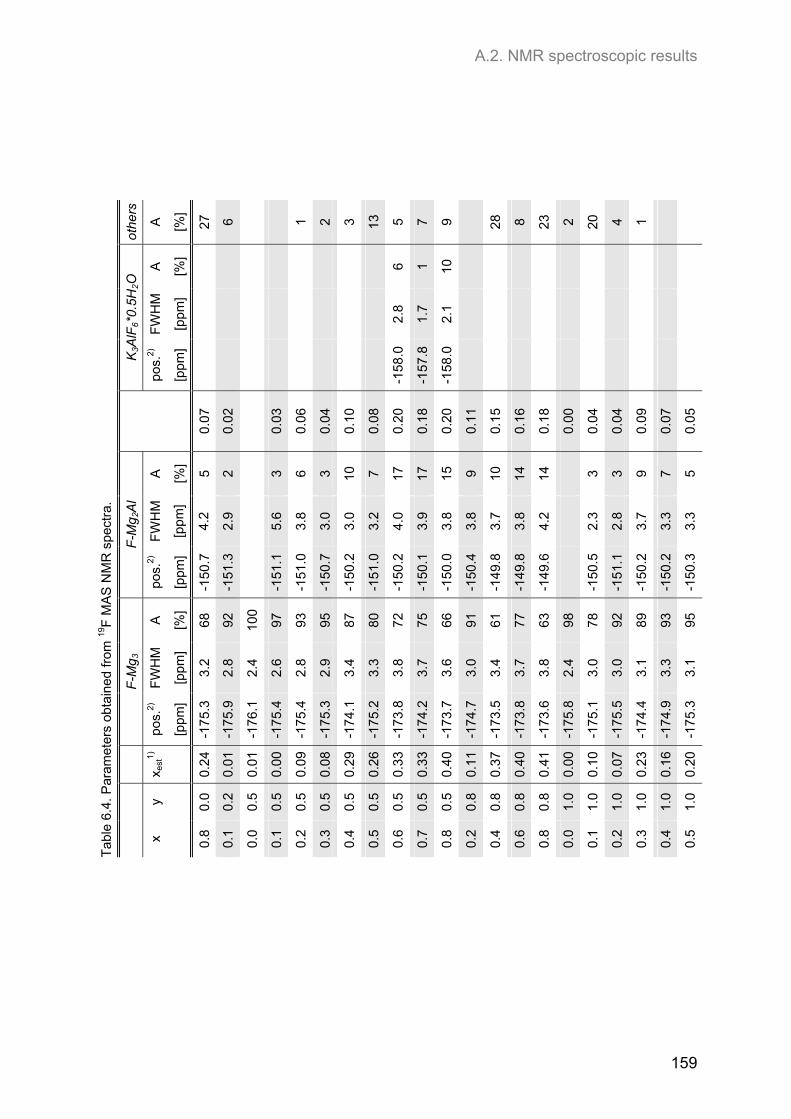
A.2. NMR spectroscopic results
159
Tab
le 6
.4. P
aram
eter
s ob
tain
ed fr
om 19
F M
AS
NM
R s
pect
ra.
othe
rs
A
[%]
27
6 1 2 3 13
5 7 9 28
8 23
2 20
4 1
K3A
lF6*
0.5H
2O A
[%] 6 1 10
FW
HM
[ppm
]
2.8
1.7
2.1
pos.
2)
[ppm
]
-158
.0
-157
.8
-158
.0
0.07
0.02
0.03
0.06
0.04
0.10
0.08
0.20
0.18
0.20
0.11
0.15
0.16
0.18
0.00
0.04
0.04
0.09
0.07
0.05
F-M
g 2A
l
A
[%]
5 2 3 6 3 10
7 17
17
15
9 10
14
14 3 3 9 7 5
FW
HM
[ppm
]
4.2
2.9
5.6
3.8
3.0
3.0
3.2
4.0
3.9
3.8
3.8
3.7
3.8
4.2
2.3
2.8
3.7
3.3
3.3
pos.
2)
[ppm
]
-150
.7
-151
.3
-151
.1
-151
.0
-150
.7
-150
.2
-151
.0
-150
.2
-150
.1
-150
.0
-150
.4
-149
.8
-149
.8
-149
.6
-150
.5
-151
.1
-150
.2
-150
.2
-150
.3
F-M
g 3
A
[%]
68
92
100
97
93
95
87
80
72
75
66
91
61
77
63
98
78
92
89
93
95
FW
HM
[ppm
]
3.2
2.8
2.4
2.6
2.8
2.9
3.4
3.3
3.8
3.7
3.6
3.0
3.4
3.7
3.8
2.4
3.0
3.0
3.1
3.3
3.1
pos.
2)
[ppm
]
-175
.3
-175
.9
-176
.1
-175
.4
-175
.4
-175
.3
-174
.1
-175
.2
-173
.8
-174
.2
-173
.7
-174
.7
-173
.5
-173
.8
-173
.6
-175
.8
-175
.1
-175
.5
-174
.4
-174
.9
-175
.3
x est
1)
0.24
0.01
0.01
0.00
0.09
0.08
0.29
0.26
0.33
0.33
0.40
0.11
0.37
0.40
0.41
0.00
0.10
0.07
0.23
0.16
0.20
y
0.0
0.2
0.5
0.5
0.5
0.5
0.5
0.5
0.5
0.5
0.5
0.8
0.8
0.8
0.8
1.0
1.0
1.0
1.0
1.0
1.0
x
0.8
0.1
0.0
0.1
0.2
0.3
0.4
0.5
0.6
0.7
0.8
0.2
0.4
0.6
0.8
0.0
0.1
0.2
0.3
0.4
0.5
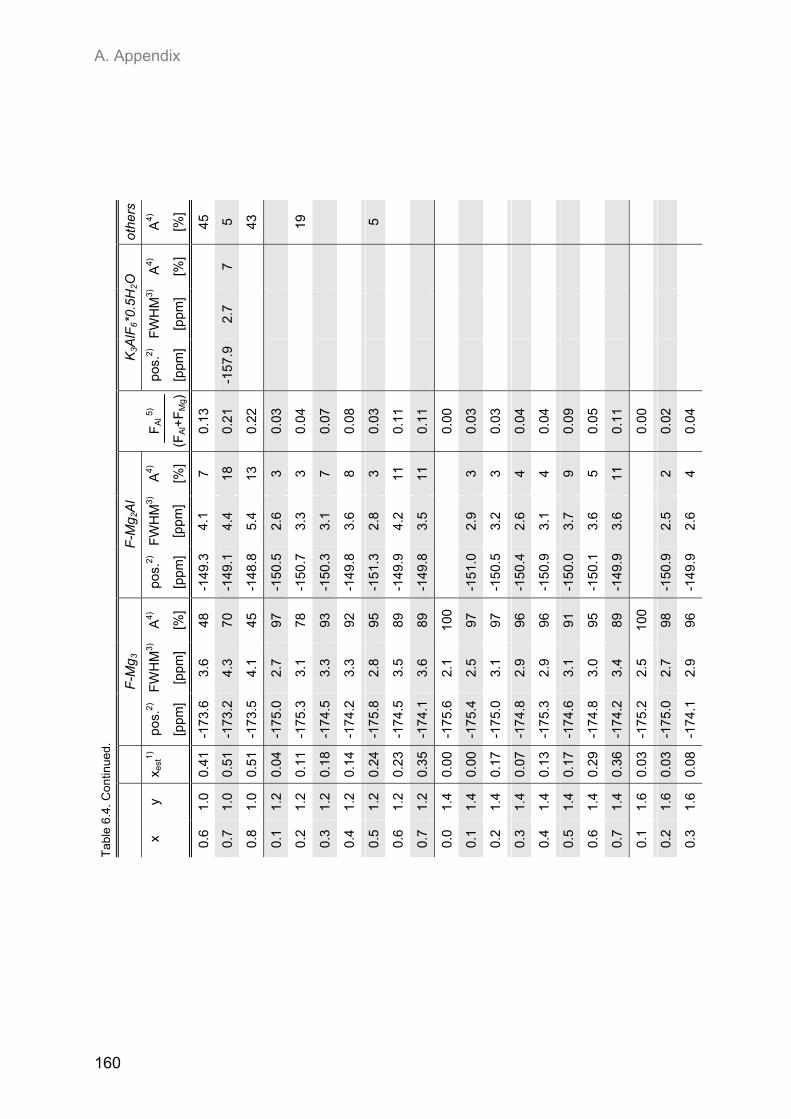
A. Appendix
160
Tab
le 6
.4. C
on
tinue
d.
othe
rs
A4)
[%]
45
5 43
19
5
K3A
lF6*
0.5H
2O A
4)
[%]
7
FW
HM
3)
[ppm
]
2.7
pos.
2)
[ppm
]
-157
.9
FA
l 5)
(FA
l+F
Mg)
0.13
0.21
0.22
0.03
0.04
0.07
0.08
0.03
0.11
0.11
0.00
0.03
0.03
0.04
0.04
0.09
0.05
0.11
0.00
0.02
0.04
F-M
g 2A
l
A4)
[%]
7 18
13
3 3 7 8 3 11
11 3 3 4 4 9 5 11 2 4
FW
HM
3)
[ppm
]
4.1
4.4
5.4
2.6
3.3
3.1
3.6
2.8
4.2
3.5
2.9
3.2
2.6
3.1
3.7
3.6
3.6
2.5
2.6
pos.
2)
[ppm
]
-149
.3
-149
.1
-148
.8
-150
.5
-150
.7
-150
.3
-149
.8
-151
.3
-149
.9
-149
.8
-151
.0
-150
.5
-150
.4
-150
.9
-150
.0
-150
.1
-149
.9
-150
.9
-149
.9
F-M
g 3
A4)
[%]
48
70
45
97
78
93
92
95
89
89
100
97
97
96
96
91
95
89
100
98
96
FW
HM
3)
[ppm
]
3.6
4.3
4.1
2.7
3.1
3.3
3.3
2.8
3.5
3.6
2.1
2.5
3.1
2.9
2.9
3.1
3.0
3.4
2.5
2.7
2.9
pos.
2)
[ppm
]
-173
.6
-173
.2
-173
.5
-175
.0
-175
.3
-174
.5
-174
.2
-175
.8
-174
.5
-174
.1
-175
.6
-175
.4
-175
.0
-174
.8
-175
.3
-174
.6
-174
.8
-174
.2
-175
.2
-175
.0
-174
.1
x est
1)
0.41
0.51
0.51
0.04
0.11
0.18
0.14
0.24
0.23
0.35
0.00
0.00
0.17
0.07
0.13
0.17
0.29
0.36
0.03
0.03
0.08
y
1.0
1.0
1.0
1.2
1.2
1.2
1.2
1.2
1.2
1.2
1.4
1.4
1.4
1.4
1.4
1.4
1.4
1.4
1.6
1.6
1.6
x
0.6
0.7
0.8
0.1
0.2
0.3
0.4
0.5
0.6
0.7
0.0
0.1
0.2
0.3
0.4
0.5
0.6
0.7
0.1
0.2
0.3
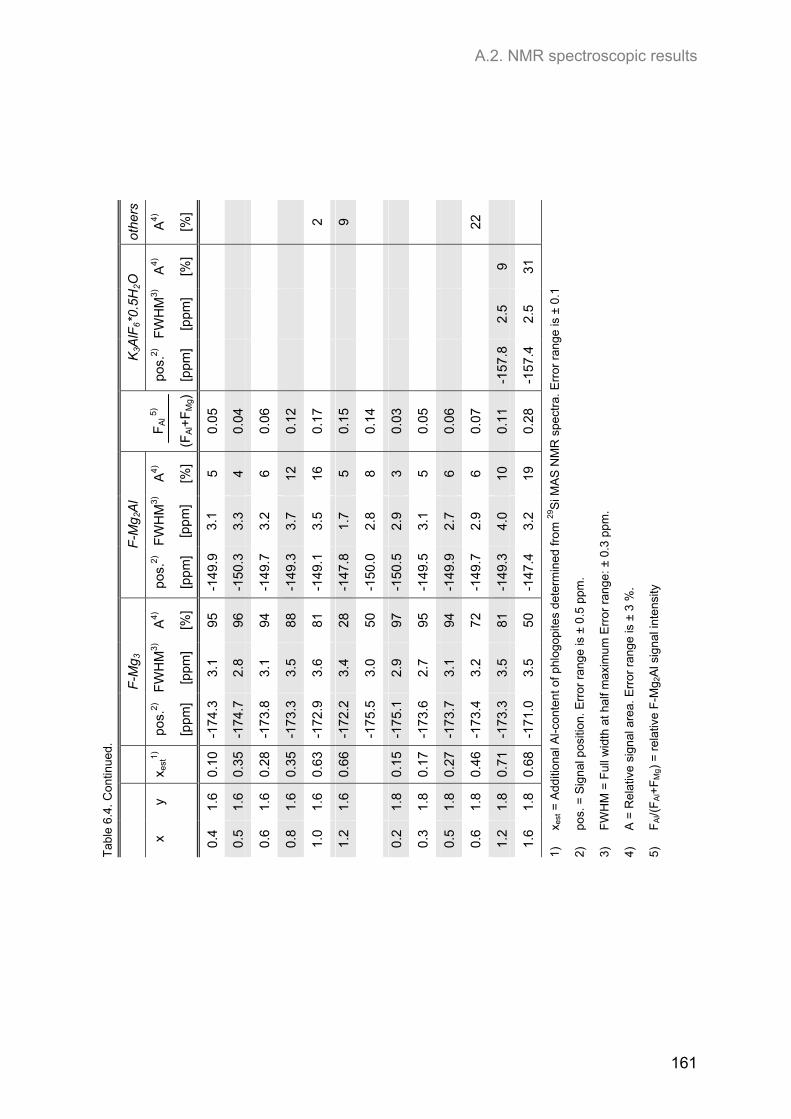
A.2. NMR spectroscopic results
161
Tab
le 6
.4. C
on
tinue
d.
othe
rs
A4)
[%] 2 9 22
1)
x
est =
Add
ition
al A
l-con
tent
of p
hlo
gop
ites
dete
rmin
ed f
rom
29S
i MA
S N
MR
spe
ctra
. Err
or r
ang
e is
± 0
.1
2)
p
os. =
Sig
nal p
ositi
on.
Err
or r
ang
e is
± 0
.5 p
pm.
3)
F
WH
M =
Ful
l wid
th a
t ha
lf m
axim
um E
rror
ran
ge:
± 0
.3 p
pm.
4)
A
= R
elat
ive
sign
al a
rea.
Err
or r
ang
e is
± 3
%.
5)
F
Al/(
FA
l+F
Mg)
= r
elat
ive
F-M
g 2A
l sig
nal
inte
nsity
K3A
lF6*
0.5H
2O A
4)
[%] 9 31
FW
HM
3)
[ppm
]
2.5
2.5
pos.
2)
[ppm
]
-157
.8
-157
.4
FA
l 5)
(FA
l+F
Mg)
0.05
0.04
0.06
0.12
0.17
0.15
0.14
0.03
0.05
0.06
0.07
0.11
0.28
F-M
g 2A
l
A4)
[%]
5 4 6 12
16
5 8 3 5 6 6 10
19
FW
HM
3)
[ppm
]
3.1
3.3
3.2
3.7
3.5
1.7
2.8
2.9
3.1
2.7
2.9
4.0
3.2
pos.
2)
[ppm
]
-149
.9
-150
.3
-149
.7
-149
.3
-149
.1
-147
.8
-150
.0
-150
.5
-149
.5
-149
.9
-149
.7
-149
.3
-147
.4
F-M
g 3
A4)
[%]
95
96
94
88
81
28
50
97
95
94
72
81
50
FW
HM
3)
[ppm
]
3.1
2.8
3.1
3.5
3.6
3.4
3.0
2.9
2.7
3.1
3.2
3.5
3.5
pos.
2)
[ppm
]
-174
.3
-174
.7
-173
.8
-173
.3
-172
.9
-172
.2
-175
.5
-175
.1
-173
.6
-173
.7
-173
.4
-173
.3
-171
.0
x est
1)
0.10
0.35
0.28
0.35
0.63
0.66
0.15
0.17
0.27
0.46
0.71
0.68
y
1.6
1.6
1.6
1.6
1.6
1.6
1.8
1.8
1.8
1.8
1.8
1.8
x
0.4
0.5
0.6
0.8
1.0
1.2
0.2
0.3
0.5
0.6
1.2
1.6
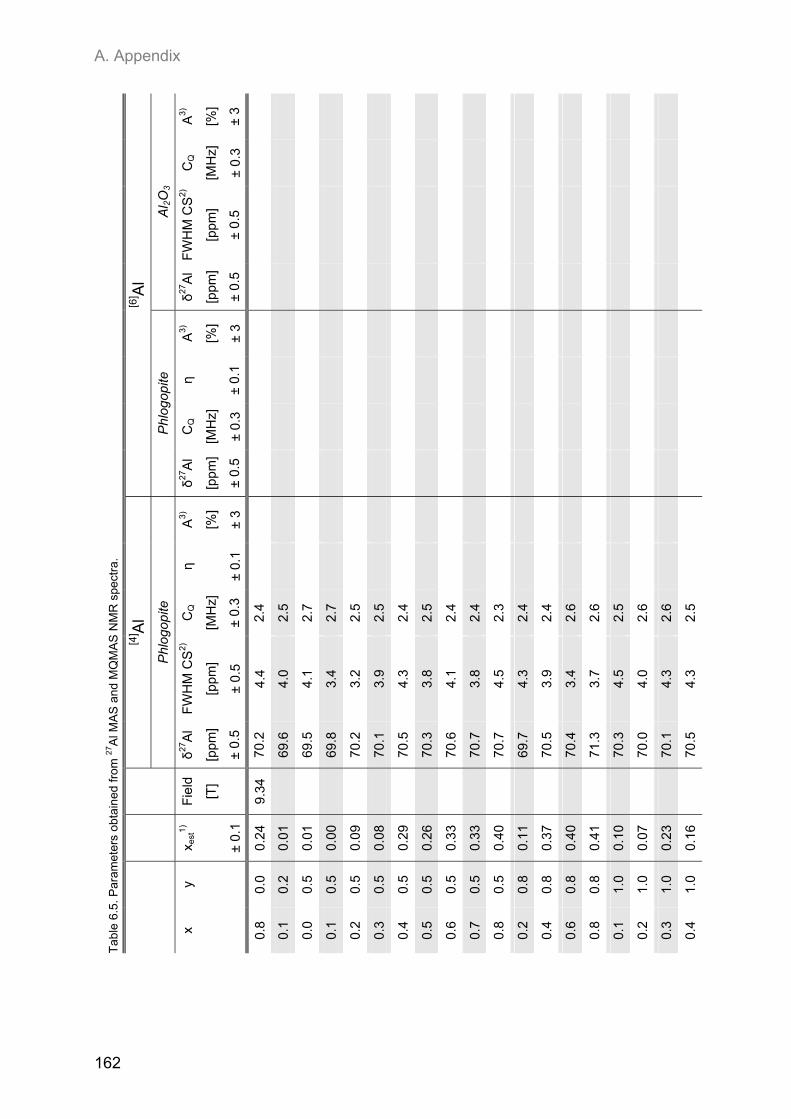
A. Appendix
162
Tab
le 6
.5. P
aram
eter
s ob
tain
ed fr
om 2
7A
l MA
S a
nd M
QM
AS
NM
R s
pect
ra.
[6] A
l
Al 2
O3
A3)
[%]
± 3
CQ
[MH
z]
± 0.
3
FW
HM
CS
2)
[ppm
]
± 0.
5
δ27A
l
[ppm
]
± 0.
5
Phl
ogop
ite
A3)
[%]
± 3
η
± 0.
1
CQ
[MH
z]
± 0.
3
δ27A
l
[ppm
]
± 0.
5
[4] A
l
Phl
ogop
ite
A3)
[%]
± 3
η
± 0.
1
CQ
[MH
z]
± 0.
3
2.4
2.5
2.7
2.7
2.5
2.5
2.4
2.5
2.4
2.4
2.3
2.4
2.4
2.6
2.6
2.5
2.6
2.6
2.5
FW
HM
CS
2)
[ppm
]
± 0.
5
4.4
4.0
4.1
3.4
3.2
3.9
4.3
3.8
4.1
3.8
4.5
4.3
3.9
3.4
3.7
4.5
4.0
4.3
4.3
δ27A
l
[ppm
]
± 0.
5
70.2
69.6
69.5
69.8
70.2
70.1
70.5
70.3
70.6
70.7
70.7
69.7
70.5
70.4
71.3
70.3
70.0
70.1
70.5
Fie
ld
[T]
9.34
x est
1)
± 0.
1
0.24
0.01
0.01
0.00
0.09
0.08
0.29
0.26
0.33
0.33
0.40
0.11
0.37
0.40
0.41
0.10
0.07
0.23
0.16
y
0.0
0.2
0.5
0.5
0.5
0.5
0.5
0.5
0.5
0.5
0.5
0.8
0.8
0.8
0.8
1.0
1.0
1.0
1.0
x
0.8
0.1
0.0
0.1
0.2
0.3
0.4
0.5
0.6
0.7
0.8
0.2
0.4
0.6
0.8
0.1
0.2
0.3
0.4
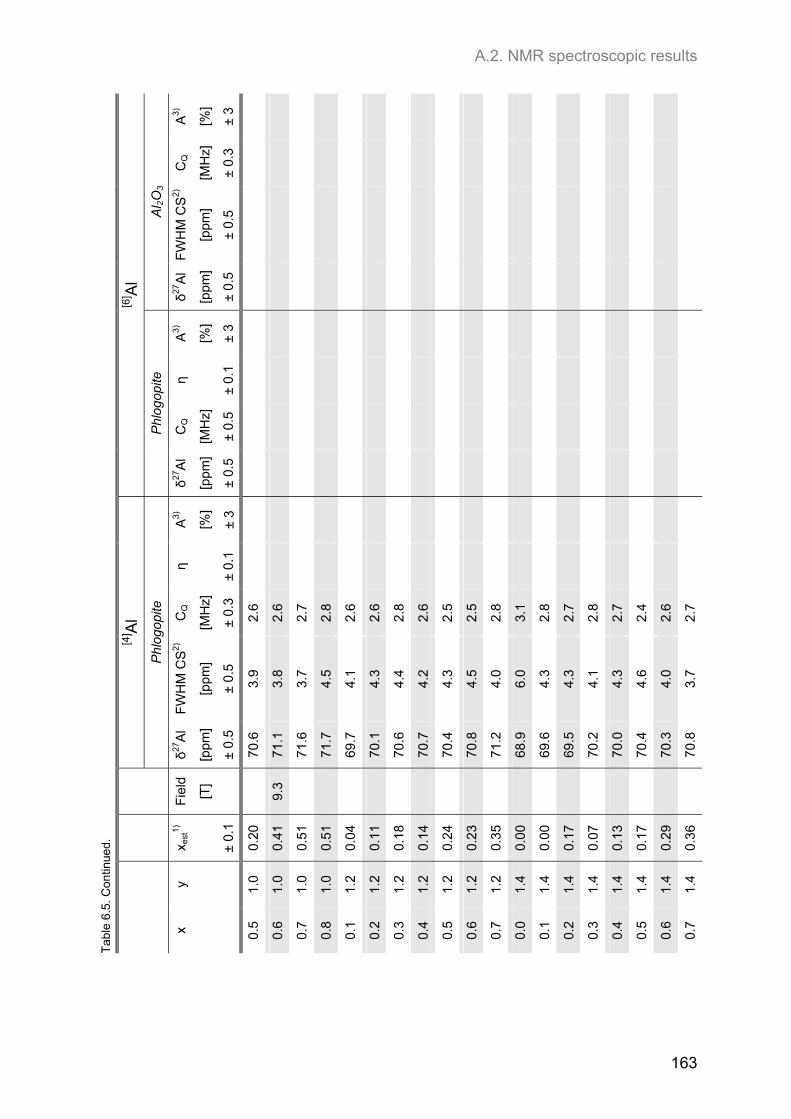
A.2. NMR spectroscopic results
163
Tab
le 6
.5. C
on
tinue
d.
[6] A
l
Al 2
O3
A3)
[%]
± 3
CQ
[MH
z]
± 0.
3
FW
HM
CS
2)
[ppm
]
± 0.
5
δ27A
l
[ppm
]
± 0.
5
Phl
ogop
ite
A3)
[%]
± 3
η
± 0.
1
CQ
[MH
z]
± 0.
5
δ27A
l
[ppm
]
± 0.
5
[4] A
l
Phl
ogop
ite
A3)
[%]
± 3
η
± 0.
1
CQ
[MH
z]
± 0.
3
2.6
2.6
2.7
2.8
2.6
2.6
2.8
2.6
2.5
2.5
2.8
3.1
2.8
2.7
2.8
2.7
2.4
2.6
2.7
FW
HM
CS
2)
[ppm
]
± 0.
5
3.9
3.8
3.7
4.5
4.1
4.3
4.4
4.2
4.3
4.5
4.0
6.0
4.3
4.3
4.1
4.3
4.6
4.0
3.7
δ27A
l
[ppm
]
± 0.
5
70.6
71.1
71.6
71.7
69.7
70.1
70.6
70.7
70.4
70.8
71.2
68.9
69.6
69.5
70.2
70.0
70.4
70.3
70.8
Fie
ld
[T]
9.3
x est
1)
± 0.
1
0.20
0.41
0.51
0.51
0.04
0.11
0.18
0.14
0.24
0.23
0.35
0.00
0.00
0.17
0.07
0.13
0.17
0.29
0.36
y
1.0
1.0
1.0
1.0
1.2
1.2
1.2
1.2
1.2
1.2
1.2
1.4
1.4
1.4
1.4
1.4
1.4
1.4
1.4
x
0.5
0.6
0.7
0.8
0.1
0.2
0.3
0.4
0.5
0.6
0.7
0.0
0.1
0.2
0.3
0.4
0.5
0.6
0.7
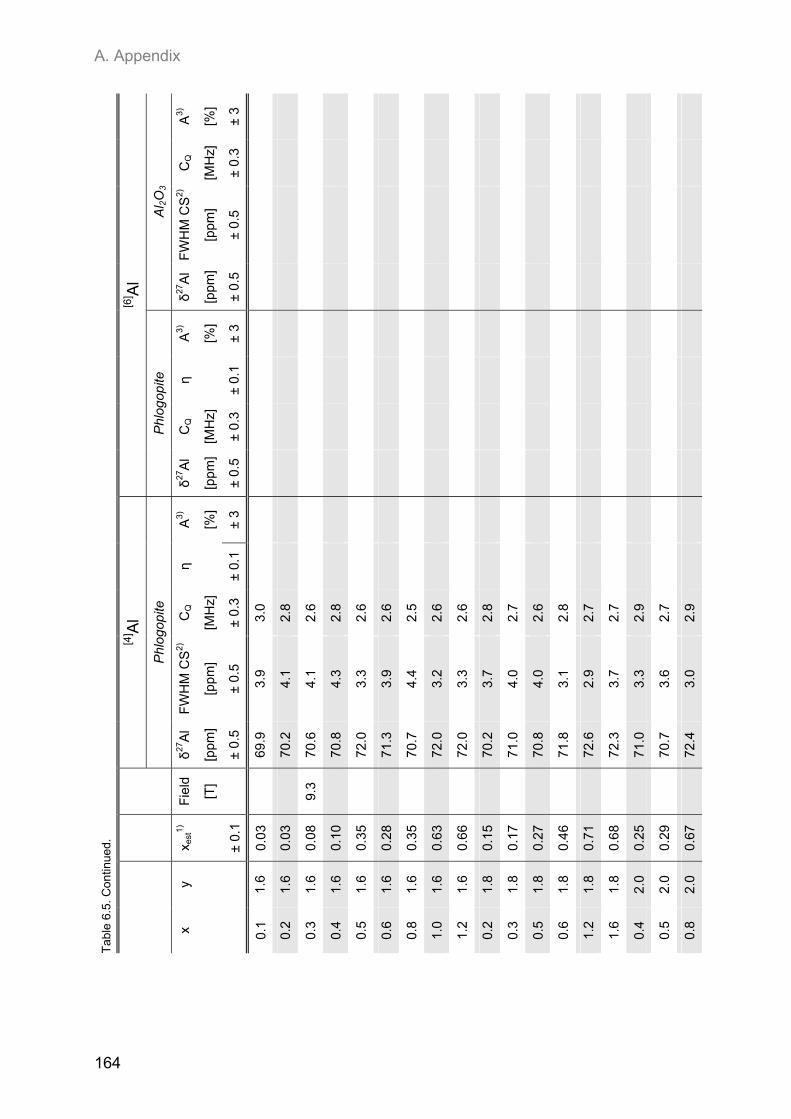
A. Appendix
164
Tab
le 6
.5. C
on
tinue
d.
[6] A
l
Al 2
O3
A3)
[%]
± 3
CQ
[MH
z]
± 0.
3
FW
HM
CS
2)
[ppm
]
± 0.
5
δ27A
l
[ppm
]
± 0.
5
Phl
ogop
ite
A3)
[%]
± 3
η
± 0.
1
CQ
[MH
z]
± 0.
3
δ27A
l
[ppm
]
± 0.
5
[4] A
l
Phl
ogop
ite
A3)
[%]
± 3
η
± 0.
1
CQ
[MH
z]
± 0.
3
3.0
2.8
2.6
2.8
2.6
2.6
2.5
2.6
2.6
2.8
2.7
2.6
2.8
2.7
2.7
2.9
2.7
2.9
FW
HM
CS
2)
[ppm
]
± 0.
5
3.9
4.1
4.1
4.3
3.3
3.9
4.4
3.2
3.3
3.7
4.0
4.0
3.1
2.9
3.7
3.3
3.6
3.0
δ27A
l
[ppm
]
± 0.
5
69.9
70.2
70.6
70.8
72.0
71.3
70.7
72.0
72.0
70.2
71.0
70.8
71.8
72.6
72.3
71.0
70.7
72.4
Fie
ld
[T]
9.3
x est
1)
± 0.
1
0.03
0.03
0.08
0.10
0.35
0.28
0.35
0.63
0.66
0.15
0.17
0.27
0.46
0.71
0.68
0.25
0.29
0.67
y
1.6
1.6
1.6
1.6
1.6
1.6
1.6
1.6
1.6
1.8
1.8
1.8
1.8
1.8
1.8
2.0
2.0
2.0
x
0.1
0.2
0.3
0.4
0.5
0.6
0.8
1.0
1.2
0.2
0.3
0.5
0.6
1.2
1.6
0.4
0.5
0.8
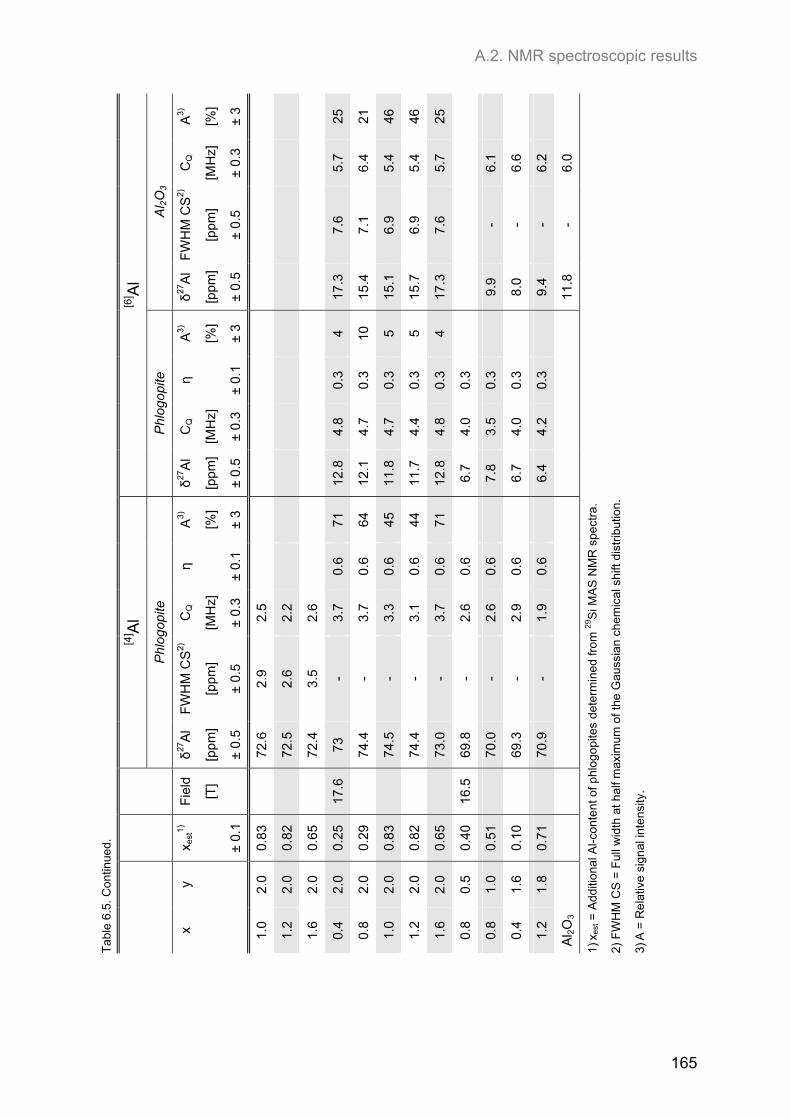
A.2. NMR spectroscopic results
165
Tab
le 6
.5. C
on
tinue
d.
[6] A
l
Al 2
O3
A3)
[%]
± 3 25
21
46
46
25
1) x
est =
Add
ition
al A
l-con
tent
of p
hlo
gopi
tes
dete
rmin
ed fr
om
29S
i MA
S N
MR
spe
ctra
.
2) F
WH
M C
S =
Ful
l wid
th a
t hal
f max
imum
of t
he G
auss
ian
chem
ical
shi
ft di
strib
utio
n.
3) A
= R
elat
ive
sign
al in
tens
ity.
CQ
[MH
z]
± 0.
3
5.7
6.4
5.4
5.4
5.7
6.1
6.6
6.2
6.0
FW
HM
CS
2)
[ppm
]
± 0.
5
7.6
7.1
6.9
6.9
7.6 - - - -
δ27A
l
[ppm
]
± 0.
5
17.3
15.4
15.1
15.7
17.3
9.9
8.0
9.4
11.8
Phl
ogop
ite
A3)
[%]
± 3 4 10
5 5 4
η
± 0.
1
0.3
0.3
0.3
0.3
0.3
0.3
0.3
0.3
0.3
CQ
[MH
z]
± 0.
3
4.8
4.7
4.7
4.4
4.8
4.0
3.5
4.0
4.2
δ27A
l
[ppm
]
± 0.
5
12.8
12.1
11.8
11.7
12.8
6.7
7.8
6.7
6.4
[4] A
l
Phl
ogop
ite
A3)
[%]
± 3 71
64
45
44
71
η
± 0.
1
0.6
0.6
0.6
0.6
0.6
0.6
0.6
0.6
0.6
CQ
[MH
z]
± 0.
3
2.5
2.2
2.6
3.7
3.7
3.3
3.1
3.7
2.6
2.6
2.9
1.9
FW
HM
CS
2)
[ppm
]
± 0.
5
2.9
2.6
3.5 - - - - - - - - -
δ27A
l
[ppm
]
± 0.
5
72.6
72.5
72.4
73
74.4
74.5
74.4
73.0
69.8
70.0
69.3
70.9
Fie
ld
[T]
17.6
16.5
x est
1)
± 0.
1
0.83
0.82
0.65
0.25
0.29
0.83
0.82
0.65
0.40
0.51
0.10
0.71
y
2.0
2.0
2.0
2.0
2.0
2.0
2.0
2.0
0.5
1.0
1.6
1.8
x
1.0
1.2
1.6
0.4
0.8
1.0
1.2
1.6
0.8
0.8
0.4
1.2
Al 2
O3
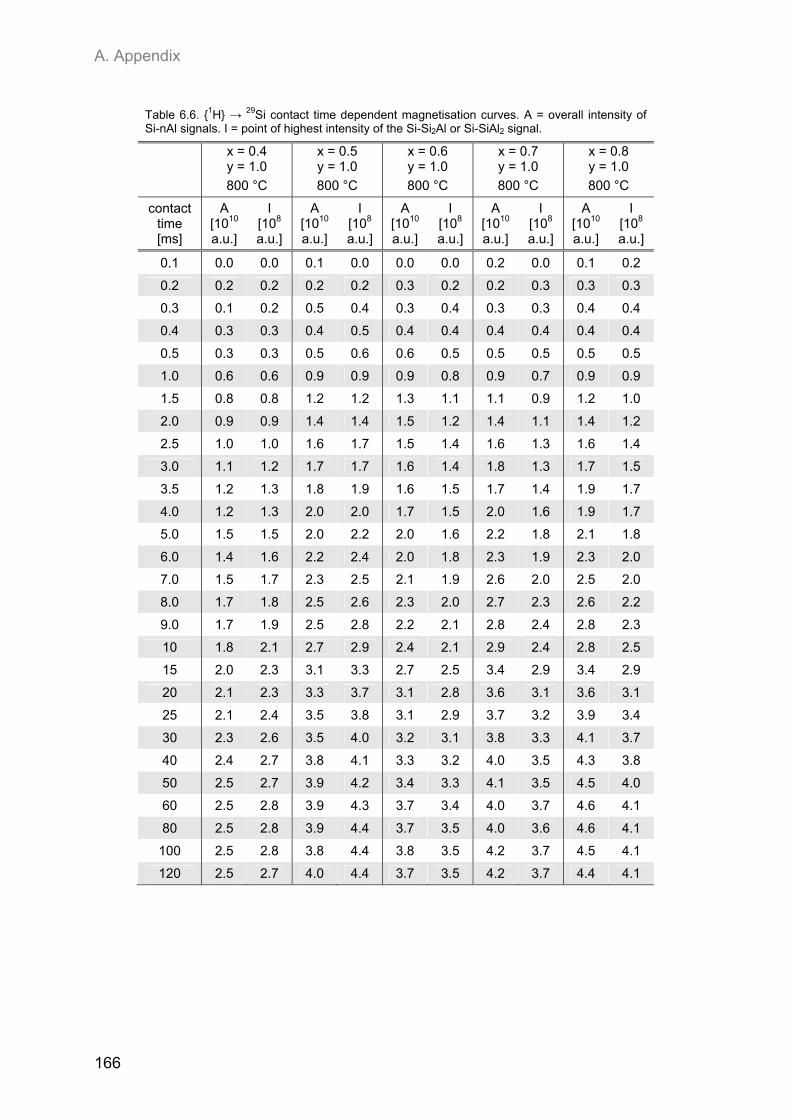
A. Appendix
166
Table 6.6. {1H} → 29Si contact time dependent magnetisation curves. A = overall intensity of Si-nAl signals. I = point of highest intensity of the Si-Si2Al or Si-SiAl2 signal.
x = 0.4 y = 1.0
x = 0.5 y = 1.0
x = 0.6 y = 1.0
x = 0.7 y = 1.0
x = 0.8 y = 1.0
800 °C 800 °C 800 °C 800 °C 800 °C
contact time [ms]
A [1010 a.u.]
I [108 a.u.]
A [1010 a.u.]
I [108 a.u.]
A [1010 a.u.]
I [108 a.u.]
A [1010 a.u.]
I [108 a.u.]
A [1010 a.u.]
I [108 a.u.]
0.1 0.0 0.0 0.1 0.0 0.0 0.0 0.2 0.0 0.1 0.2
0.2 0.2 0.2 0.2 0.2 0.3 0.2 0.2 0.3 0.3 0.3
0.3 0.1 0.2 0.5 0.4 0.3 0.4 0.3 0.3 0.4 0.4
0.4 0.3 0.3 0.4 0.5 0.4 0.4 0.4 0.4 0.4 0.4
0.5 0.3 0.3 0.5 0.6 0.6 0.5 0.5 0.5 0.5 0.5
1.0 0.6 0.6 0.9 0.9 0.9 0.8 0.9 0.7 0.9 0.9
1.5 0.8 0.8 1.2 1.2 1.3 1.1 1.1 0.9 1.2 1.0
2.0 0.9 0.9 1.4 1.4 1.5 1.2 1.4 1.1 1.4 1.2
2.5 1.0 1.0 1.6 1.7 1.5 1.4 1.6 1.3 1.6 1.4
3.0 1.1 1.2 1.7 1.7 1.6 1.4 1.8 1.3 1.7 1.5
3.5 1.2 1.3 1.8 1.9 1.6 1.5 1.7 1.4 1.9 1.7
4.0 1.2 1.3 2.0 2.0 1.7 1.5 2.0 1.6 1.9 1.7
5.0 1.5 1.5 2.0 2.2 2.0 1.6 2.2 1.8 2.1 1.8
6.0 1.4 1.6 2.2 2.4 2.0 1.8 2.3 1.9 2.3 2.0
7.0 1.5 1.7 2.3 2.5 2.1 1.9 2.6 2.0 2.5 2.0
8.0 1.7 1.8 2.5 2.6 2.3 2.0 2.7 2.3 2.6 2.2
9.0 1.7 1.9 2.5 2.8 2.2 2.1 2.8 2.4 2.8 2.3
10 1.8 2.1 2.7 2.9 2.4 2.1 2.9 2.4 2.8 2.5
15 2.0 2.3 3.1 3.3 2.7 2.5 3.4 2.9 3.4 2.9
20 2.1 2.3 3.3 3.7 3.1 2.8 3.6 3.1 3.6 3.1
25 2.1 2.4 3.5 3.8 3.1 2.9 3.7 3.2 3.9 3.4
30 2.3 2.6 3.5 4.0 3.2 3.1 3.8 3.3 4.1 3.7
40 2.4 2.7 3.8 4.1 3.3 3.2 4.0 3.5 4.3 3.8
50 2.5 2.7 3.9 4.2 3.4 3.3 4.1 3.5 4.5 4.0
60 2.5 2.8 3.9 4.3 3.7 3.4 4.0 3.7 4.6 4.1
80 2.5 2.8 3.9 4.4 3.7 3.5 4.0 3.6 4.6 4.1
100 2.5 2.8 3.8 4.4 3.8 3.5 4.2 3.7 4.5 4.1
120 2.5 2.7 4.0 4.4 3.7 3.5 4.2 3.7 4.4 4.1
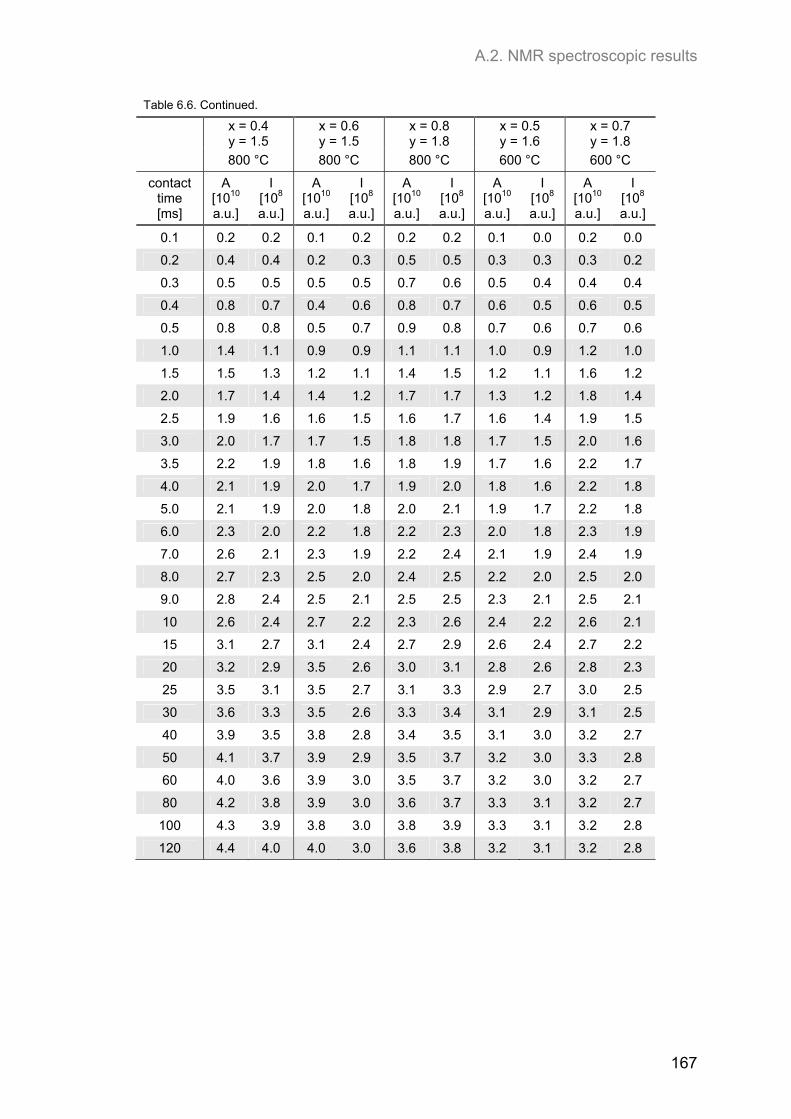
A.2. NMR spectroscopic results
167
Table 6.6. Continued.
x = 0.4 y = 1.5
x = 0.6 y = 1.5
x = 0.8 y = 1.8
x = 0.5 y = 1.6
x = 0.7 y = 1.8
800 °C 800 °C 800 °C 600 °C 600 °C
contact time [ms]
A [1010 a.u.]
I [108 a.u.]
A [1010 a.u.]
I [108 a.u.]
A [1010 a.u.]
I [108 a.u.]
A [1010 a.u.]
I [108 a.u.]
A [1010 a.u.]
I [108 a.u.]
0.1 0.2 0.2 0.1 0.2 0.2 0.2 0.1 0.0 0.2 0.0
0.2 0.4 0.4 0.2 0.3 0.5 0.5 0.3 0.3 0.3 0.2
0.3 0.5 0.5 0.5 0.5 0.7 0.6 0.5 0.4 0.4 0.4
0.4 0.8 0.7 0.4 0.6 0.8 0.7 0.6 0.5 0.6 0.5
0.5 0.8 0.8 0.5 0.7 0.9 0.8 0.7 0.6 0.7 0.6
1.0 1.4 1.1 0.9 0.9 1.1 1.1 1.0 0.9 1.2 1.0
1.5 1.5 1.3 1.2 1.1 1.4 1.5 1.2 1.1 1.6 1.2
2.0 1.7 1.4 1.4 1.2 1.7 1.7 1.3 1.2 1.8 1.4
2.5 1.9 1.6 1.6 1.5 1.6 1.7 1.6 1.4 1.9 1.5
3.0 2.0 1.7 1.7 1.5 1.8 1.8 1.7 1.5 2.0 1.6
3.5 2.2 1.9 1.8 1.6 1.8 1.9 1.7 1.6 2.2 1.7
4.0 2.1 1.9 2.0 1.7 1.9 2.0 1.8 1.6 2.2 1.8
5.0 2.1 1.9 2.0 1.8 2.0 2.1 1.9 1.7 2.2 1.8
6.0 2.3 2.0 2.2 1.8 2.2 2.3 2.0 1.8 2.3 1.9
7.0 2.6 2.1 2.3 1.9 2.2 2.4 2.1 1.9 2.4 1.9
8.0 2.7 2.3 2.5 2.0 2.4 2.5 2.2 2.0 2.5 2.0
9.0 2.8 2.4 2.5 2.1 2.5 2.5 2.3 2.1 2.5 2.1
10 2.6 2.4 2.7 2.2 2.3 2.6 2.4 2.2 2.6 2.1
15 3.1 2.7 3.1 2.4 2.7 2.9 2.6 2.4 2.7 2.2
20 3.2 2.9 3.5 2.6 3.0 3.1 2.8 2.6 2.8 2.3
25 3.5 3.1 3.5 2.7 3.1 3.3 2.9 2.7 3.0 2.5
30 3.6 3.3 3.5 2.6 3.3 3.4 3.1 2.9 3.1 2.5
40 3.9 3.5 3.8 2.8 3.4 3.5 3.1 3.0 3.2 2.7
50 4.1 3.7 3.9 2.9 3.5 3.7 3.2 3.0 3.3 2.8
60 4.0 3.6 3.9 3.0 3.5 3.7 3.2 3.0 3.2 2.7
80 4.2 3.8 3.9 3.0 3.6 3.7 3.3 3.1 3.2 2.7
100 4.3 3.9 3.8 3.0 3.8 3.9 3.3 3.1 3.2 2.8
120 4.4 4.0 4.0 3.0 3.6 3.8 3.2 3.1 3.2 2.8
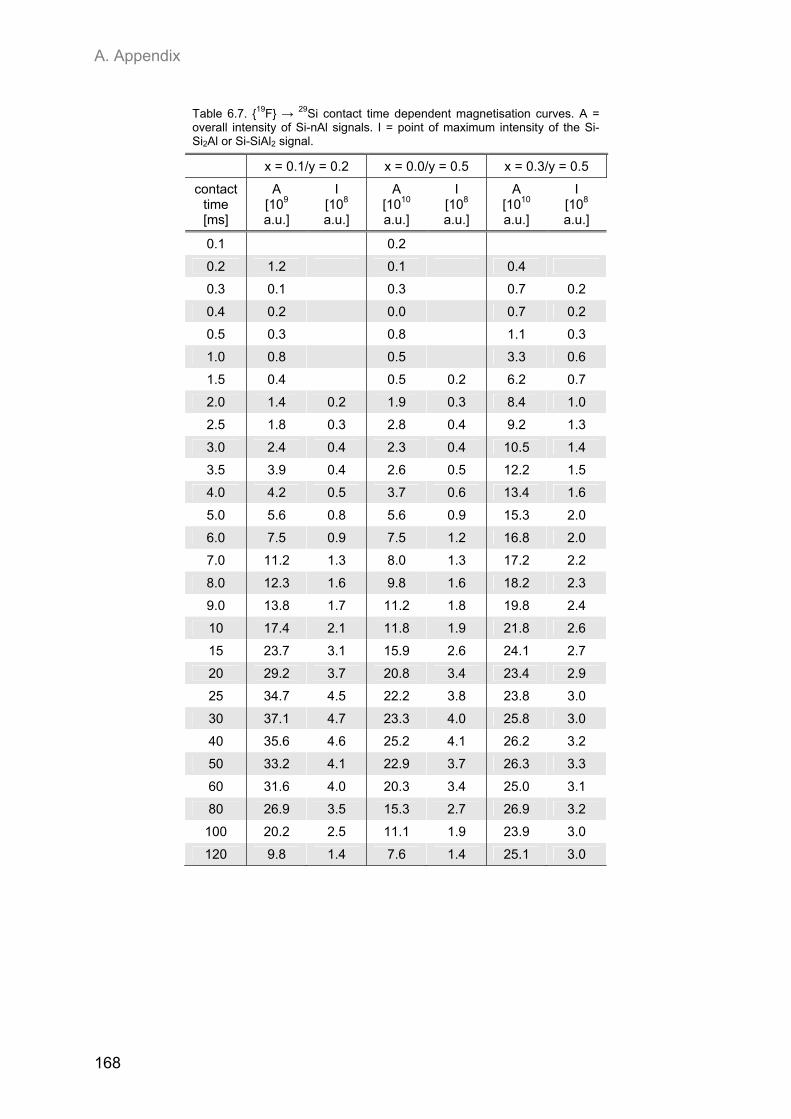
A. Appendix
168
Table 6.7. {19F} → 29Si contact time dependent magnetisation curves. A = overall intensity of Si-nAl signals. I = point of maximum intensity of the Si-Si2Al or Si-SiAl2 signal.
x = 0.1/y = 0.2 x = 0.0/y = 0.5 x = 0.3/y = 0.5
contact time [ms]
A [109 a.u.]
I [108 a.u.]
A [1010 a.u.]
I [108 a.u.]
A [1010 a.u.]
I [108 a.u.]
0.1 0.2
0.2 1.2 0.1 0.4
0.3 0.1 0.3 0.7 0.2
0.4 0.2 0.0 0.7 0.2
0.5 0.3 0.8 1.1 0.3
1.0 0.8 0.5 3.3 0.6
1.5 0.4 0.5 0.2 6.2 0.7
2.0 1.4 0.2 1.9 0.3 8.4 1.0
2.5 1.8 0.3 2.8 0.4 9.2 1.3
3.0 2.4 0.4 2.3 0.4 10.5 1.4
3.5 3.9 0.4 2.6 0.5 12.2 1.5
4.0 4.2 0.5 3.7 0.6 13.4 1.6
5.0 5.6 0.8 5.6 0.9 15.3 2.0
6.0 7.5 0.9 7.5 1.2 16.8 2.0
7.0 11.2 1.3 8.0 1.3 17.2 2.2
8.0 12.3 1.6 9.8 1.6 18.2 2.3
9.0 13.8 1.7 11.2 1.8 19.8 2.4
10 17.4 2.1 11.8 1.9 21.8 2.6
15 23.7 3.1 15.9 2.6 24.1 2.7
20 29.2 3.7 20.8 3.4 23.4 2.9
25 34.7 4.5 22.2 3.8 23.8 3.0
30 37.1 4.7 23.3 4.0 25.8 3.0
40 35.6 4.6 25.2 4.1 26.2 3.2
50 33.2 4.1 22.9 3.7 26.3 3.3
60 31.6 4.0 20.3 3.4 25.0 3.1
80 26.9 3.5 15.3 2.7 26.9 3.2
100 20.2 2.5 11.1 1.9 23.9 3.0
120 9.8 1.4 7.6 1.4 25.1 3.0
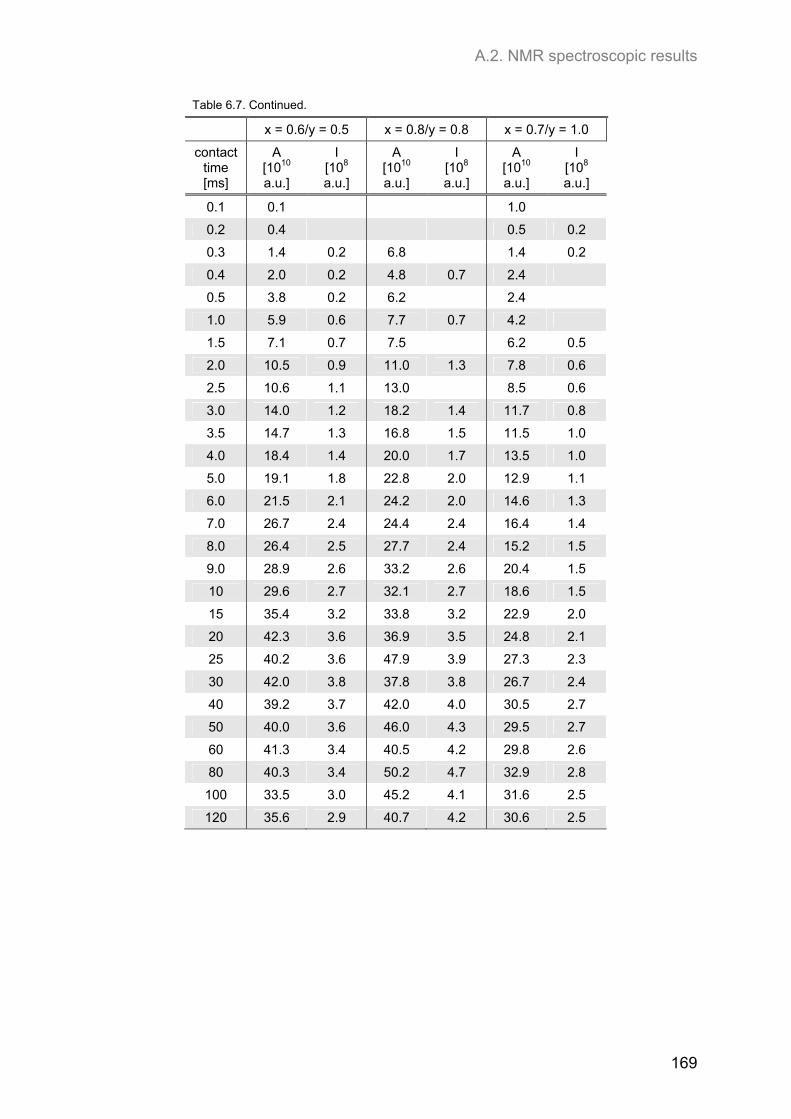
A.2. NMR spectroscopic results
169
Table 6.7. Continued.
x = 0.6/y = 0.5 x = 0.8/y = 0.8 x = 0.7/y = 1.0
contact time [ms]
A [1010 a.u.]
I [108 a.u.]
A [1010 a.u.]
I [108 a.u.]
A [1010 a.u.]
I [108 a.u.]
0.1 0.1 1.0
0.2 0.4 0.5 0.2
0.3 1.4 0.2 6.8 1.4 0.2
0.4 2.0 0.2 4.8 0.7 2.4
0.5 3.8 0.2 6.2 2.4
1.0 5.9 0.6 7.7 0.7 4.2
1.5 7.1 0.7 7.5 6.2 0.5
2.0 10.5 0.9 11.0 1.3 7.8 0.6
2.5 10.6 1.1 13.0 8.5 0.6
3.0 14.0 1.2 18.2 1.4 11.7 0.8
3.5 14.7 1.3 16.8 1.5 11.5 1.0
4.0 18.4 1.4 20.0 1.7 13.5 1.0
5.0 19.1 1.8 22.8 2.0 12.9 1.1
6.0 21.5 2.1 24.2 2.0 14.6 1.3
7.0 26.7 2.4 24.4 2.4 16.4 1.4
8.0 26.4 2.5 27.7 2.4 15.2 1.5
9.0 28.9 2.6 33.2 2.6 20.4 1.5
10 29.6 2.7 32.1 2.7 18.6 1.5
15 35.4 3.2 33.8 3.2 22.9 2.0
20 42.3 3.6 36.9 3.5 24.8 2.1
25 40.2 3.6 47.9 3.9 27.3 2.3
30 42.0 3.8 37.8 3.8 26.7 2.4
40 39.2 3.7 42.0 4.0 30.5 2.7
50 40.0 3.6 46.0 4.3 29.5 2.7
60 41.3 3.4 40.5 4.2 29.8 2.6
80 40.3 3.4 50.2 4.7 32.9 2.8
100 33.5 3.0 45.2 4.1 31.6 2.5
120 35.6 2.9 40.7 4.2 30.6 2.5

B. References
171
B. References
ABRAGAM, A. (2007) Principles of nuclear magnetism. Oxford University Press, Oxford.
ALIETTI, E., Brigatti, M.F., Poppi, L. (1995) The crystal-structure and chemistry of high-aluminum phlogopite. Mineralogical Magazine, 59, 149-157.
AMOUREUX, J.-P., Fernandez, C. Triple, quintuple and higher order multiple quantum MAS NMR of quadrupolar nuclei. Solid State Nuclear Magnetic Resonance, 10, 211-223.
ARTACHO, E., Sánchez-Portal, D., Ordejón, P., García, A., Soler, J.M. (1999) Linear-scaling ab-initio calculations for large and complex systems. Physica Status Solidi (b), 215, 809-817.
BAILEY, S.W. (1975) Cation ordering and pseudo-symmetry in layer silicates. American Mineralogist, 60, 175-187.
BAILEY, S.W. (1984a) Review of cation ordering in micas. Clays and clay minerals, 32, 81-92.
BAILEY, S.W. (1984b) Micas. Reviews in Mineralogy and Geochemistry, 13, Mineralogical Society of America, Washington, D.C.
BAKER, D.R., Bossànyi, H. (1994) The combined effect of F and H2O on interdiffusion between peralkaline dacitic and rhyolitic melts. Contributions to Mineralogy and Petrology, 117, 203-214.
BAKER, D.R., Vaillancourt, J. (1995) The low viscosities of F + H2O-bearing granitic melts and implications for melt extraction and transport. Earth and Planetary Science Letters, 132, 199-211.
BIGI, S., Brigatti, M.F., Mazzucchelli, M., Rivalenti, G. (1993) Crystal chemical variations in Ba-rich biotites from gabbroic rocks of lower crust (Ivrea zone, NW Italy). Contributions to Mineralogy and Petrology, 113, 87-99.
BIGI, S., Brigatti, M.F. (1994) Crystal-chemistry and microstructures of plutonic biotite. American Mineralogist, 79, 63-72.
BOSENICK, A., Dove, M.T., Myers, E.R., Palin, E.J., Sainz-Diaz, C.I., Guiton, B.S., Warren, M.C., Craig, M.S., Redfern, S.A.T. (2001) Computational methods for the study of energies of cation distributions: applications to cation-ordering phase transitions and solid solutions. Mineralogical Magazine, 65, 193-219.
BOUKILI, B., Robert, J.-L., Beny, J.-M., Holtz, F. (2001) Structural effects of OH – F substitution in trioctahedral micas of the system: K2O-FeO-Fe2O3-Al2O3-SiO2-H2O-HF. Schweizerische Mineralogische und Petrographische Mitteilungen, 81, 55-67.
BRIGATTI, M.F., Frigieri, P., Ghezzo, C., Poppi, L. (2000) Crystal chemistry of Al-rich biotites coexisting with muscovites in peraluminous granites. American Mineralogist, 85, 436-448.
B. References
172
BRIGATTI, M.F., Guggenheim, S. (2002) Mica crystal chemistry and the influence of pressure, temperature, and solid solution on atomistic models. In: Mottana, A., Sassi, F.P., Thompson Jr., J.B., Guggenheim, S. (Eds.), Micas: Crystal chemical and metamorphic petrology, Reviews in Mineralogy and Geochemistry, 46, 1-97. Mineralogical Society of America, Washington, D.C.
CARROLL, M.R., Webster, J.D. (1994) Solubilities of sulphur, noble-gases, nitrogen, chlorine, and fluorine in magmas. In: Carroll, M.R., Holloway, J.R. (Eds.), Volatiles in Magmas, Reviews in Mineralogy and Geochemistry, 30, 231-279. Mineralogical Society of America, Washington, D.C.
CHRISTIANSEN, E.H., Burt, D.M., Sheridan, M.F., Wilson, R.T. (1983) The petrogenesis of topaz rhyolites from the Western United States. Contributions to Mineralogy and Petrology, 83, 16-30.
CIRCONE, S., Navrotsky, A., Kirkpatrick, R.J., Graham, C.M. (1991) Substitution of [6,4]Al in phlogopite: Mica characterization, unit-cell variation, 27Al and 29Si MAS-NMR spectroscopy, and Al-Si distribution in the tetrahedral sheet. American Mineralogist, 76, 1485-1501.
CIRCONE, S., Navrotsky, A. (1992) Substitution of [6,4]Al in phlogopite: High-temperature solution calorimetry, heat capacities, and thermodynamic properties of the phlogopite-eastonite join. American Mineralogist, 77, 1191-1205.
CRUCIANI, G., Zanazzi, P.F. (1994) Cation partitioning and substitution mechanisms in 1M phlogopite – a crystal-chemical study. American Mineralogist, 79, 289-301.
DINGWELL, D.B., Scarfe, C.M., Cronin, D.J. (1985) The effect of fluorine on viscosities in the system Na2O-Al2O3-SiO2: implications for phonolites, trachytes and rhyolites. American Mineralogist, 70, 80-87.
DINGWELL, D.B., Knoche, R., Webb, S.L. (1993) The effect of F on the density of haplogranite melt. American Mineralogist, 78, 325-330.
DUER, M.J. (2002) The basics of solid-state NMR. In: Duer, M.J. (Ed.), Solid-state NMR spectroscopy – principles and applications, Blackwell Science, Oxford, 3-72.
ĎUROVIČ, S. (1994) Classification of phillosilicates according to the symmetry of their octahedral sheets. Ceramics-Silikáty, 38, 81-84.
DUŠEK, M., Petříček, V., Wunschel, M., Dinnebier, R.E., van Smaalen, S. (2001) Refinement of modulated structures against X-ray powder diffraction data with JANA2000. Journal of Applied Crystallography, 34, 398-404.
ENDO, Y. (1968) Growth spirals and polytypism of fluor-phlogopite. Journal of the Mineralogical Society of Japan, 8, Spec. Issue 2, 39-41.
B. References
173
ERNST, R.R., Bodenhausen, G., Wokaun, A. (1994) Principles of nuclear magnetic resonance in one and two dimensions. Oxford University Press, Oxford.
FECHTELKORD, M., Behrens, H., Holtz, F., Fyfe, C.A., Groat, L.A., Raudsepp, M. (2003a) Influence of F content on the composition of Al-rich synthetic phlogopite: Part I. New information on structure and phase-formation from 29Si, 1H, and 19F MAS NMR spectroscopies. American Mineralogist, 88, 47-53.
FECHTELKORD, M., Behrens, H., Holtz, F., Bretherton, J.L., Fyfe, C.A., Groat, L.A. Raudsepp, M. (2003b) Influence of F content on the composition of Al-rich synthetic phlogopite: Part II. Probing the structural arrangement of aluminum in tetrahedral and octahedral layers by 27Al MQMAS and 1H/19F-27Al HETCOR and REDOR experiments. American Mineralogist, 88, 1046-1057.
FERRARIS, G., Gula, A., Ivaldi, G., Nespolo, M., Sokolova, E., Uvarova, Y., Khomyakov, A.P. (2001) First structure determination of an MDO-2O mica polytype associated with a 1M polytype. European Journal of Mineralogy, 13, 1013-1023.
FERRARIS, G., Ivaldi, G. (2002) Structural features of micas. In: Mottana, A., Sassi, F.P., Thompson Jr., J.B., Guggenheim, S. (Eds.), Micas: Crystal chemical and metamorphic petrology, Reviews in Mineralogy and Geochemistry, 46, 117-153. Mineralogical Society of America, Washington, D.C.
FOSTER, M.D. (1960) Interpretation of the composition of lithium micas. Geological Survey Professional Paper, 354-E, 115-147.
FREGOLA, R.A., Capitani, G., Scandale, E., Ottolini, L. (2009) Chemical control of 3T stacking order in a Li-poor biotite mica. American Mineralogist, 94, 334-344.
FRYDMAN, L., Harwood, J.S. (1995) Isotropic spectra of half-integer quadrupolar spins from bidimensional magic-angle spinning NMR. Journal of the American Chemical Society, 117, 5367-5368.
GALE, J.D. (1997) GULP: A computer program for the symmetry-adapted simulation of solids. Journal of the Chemical Society: Faraday Transactions, 93, 629-637.
GIORDANO, D., Romano, C., Dingwell, D.B., Poe, B., Behrens, H. (2004) The combined effects of water and fluorine on the viscosity of silicic magmas. Geochimica et Cosmochimica Acta, 68, 5159-5168.
GREEN, T.H. (1981) Synthetic high-pressure micas compositionally intermediate between the dioctahedral and trioctahedral mica series. Contributions to Mineralogy and Petrology, 78, 452-458.
HAMILTON, D.L., Henderson, C.M.B. (1968) The preparation of silicate compositions by a gelling method. Mineralogical Magazine, 36, 832-838.
HARRIS, R.K., Jackson, P. (1991) High-resolution F-19 magnetic-resonance of solids. Chemical Reviews, 91, 1427-1440.
B. References
174
HARTMANN, S.R., Hahn, E.L. (1962) Nuclear double resonance in the rotating frame. Physical Review, 128, 2042-2053.
HAYASHI, S., Akiba, E. (1994) Interatomic distances in layered silicates and their intercalation compounds as studied by cross polarization NMR. Chemical Physics Letters, 226, 495-500.
HENDRICKS, B.S., Jefferson, M.E. (1939) Polymorphism of the micas. American Mineralogist, 24, 729-771.
HERRERO, C.P., Sanz, J., Serratosa, J.M. (1985a) Si, Al distribution in micas: Analysis by high-resolution 29Si NMR spectroscopy. Journal of Physics C: Solid State Physics, 19, 4169-4181.
HERRERO, C.P., Sanz, J., Serratosa, J.M. (1985b) Tetrahedral cation ordering in layer silicates by 29Si NMR spectroscopy. Solid State Communications, 53, 151-154.
HERRERO, C.P., Gregorkiewitz, M., Sanz, J., Serratosa, J.M. (1987) 29Si MAS-NMR spectroscopy of mica-type silicates: Observed and predicted distribution of tetrahedral Al-Si. Physics and Chemistry of Minerals, 15, 84-90.
HEWITT, D.A., Wones, D.R. (1975) Physical properties of some synthetic Fe-Mg-Al trioctahedral biotites. American Mineralogist, 60, 854-862.
HUVE, L., Delmotte, L., Martin, P., Le Dred, R., Baron, J., Saehr, D. (1992a) 19F MAS-NMR study of structural fluorine in some natural and synthetic 2:1 layer silicates. Clays and Clay Minerals, 40, 186-191.
HUVE, L., Saehr, D., Delmotte, L., Baron, J., Le Dred, R. (1992b) Spectrométrie de Résonance Magnétique Nucléaire du fluor-19 de phyllosilicates et phyllogermanates fluorés. Comptes rendus de l’Académie des Sciences Paris, 315, Série II, 545-549.
KNOCHE, R., Dingwell, D.B., Webb, S.L. (1995) Melt densities for leucogranites and granitic pegmatites: partial molar volumes for SiO2, Al2O3, Na2O, K2O, Li2O, Rb2O, Cs2O, MgO, CaO, SrO, BaO, B2O3, P2O5, F2O-1, TiO2, Nb2O5, Ta2O5, and WO3. Geochimica et Cosmochimica Acta, 59, 4645-4652.
LANGER, K., Chatterjee, N.D., Abraham, K. (1981) Infrared studies of some synthetic and natural 2M1 dioctahedral micas. Neues Jahrbuch für Mineralogie - Abhandlungen, 142, 91-110.
LEE, S.K., Stebbins, J.F. (2003a) O atom sites in natural kaolinite and muscovite: 17O MAS and 3QMAS NMR study. American Mineralogist, 88, 493-500.
LEE, S.K., Stebbins, J.F. (2003b) 17O and 27Al MAS and 3QMAS NMR study of synthetic and natural layer silicates. Chemistry of Materials, 15, 2605-2613.
LIPSICAS, M., Raythatha, R.H., Pinnavaia, T.J., Johnson, I.D., Giese, R.F., jr., Costanzo, P.M., Robert, J.L. (1984) Silicon and aluminium site distributions in 2:1 layered silicate clays. Nature, 309, 604-607.
B. References
175
LOEWENSTEIN, W. (1954) The distribution of aluminum in the tetrahedra of silicates and aluminates. American Mineralogist, 39, 92-96.
LONDON, D. (1987) Internal differentiation of rare-element pegmatites – effects of boron, phosphorus, and fluorine. Geochimica et Cosmochimica Acta, 51, 403-420.
LUTH, W.C., Tuttle, O.F. (1963) Externally heated cold-seal pressure vessels for use to 10,000 bars and 750 degrees C. American Mineralogist, 48, 1401-1403.
MANNING, D.A.C. (1981) The effect of fluorine on liquidus phase relationships in the system Qz-Ab-Or with excess water at 1 kb. Contributions to Mineralogy and Petrology, 76, 206-215.
MARICQ, M.M., Waugh, J.S. (1979) NMR in rotating solids. Journal of Chemical Physics, 70, 3300-3316.
MASSIOT, D., Touzo, B., Trumeau, D., Coutures, J.P., Virlet, J., Florian, P., Grandinetti, P.J. (1996) Two-dimensional magic-angle spinning isotropic reconstruction sequences for quadrupolar nuclei. Solid State Nuclear Magnetic Resonance, 6, 73-83.
MASSIOT, D., Fayon, F., Capron, M., King, I., Le Calvé, S., Alonso, B., Durand, J.-O., Bujoli, B., Gan, Z., Hoatson, G. (2002) Modelling one- and two-dimensional solid-state NMR spectra. Magnetic Resonance in Chemistry, 40, 70-76.
MCCAULEY, J.W., Newnham, R.E., Gibbs, G.V. (1973) Crystal-structure analysis of synthetic fluorophlogopite. American Mineralogist, 58, 249-254.
MEDEK, A., Harwood, J.S., Frydman, L. (1995) Multiple-quantum magic-angle spinning NMR: A new method for the study of quadrupolar nuclei in solids. Journal of the American Chemical Society, 117, 12779-12787.
MEDEK, A., Marinelli, L., Frydman, L. (1998) Multiple-quantum magic-angle spinning NMR of half-integer quadrupolar nuclei. In: Fitzgerald, J.J. (Ed.), Solid-state NMR spectroscopy of inorganic materials, 136-155. American Chemical Society Symposium Series, American Chemical Society, Washington, D.C.
MERCIER, P.H.J., Rancourt, D.G., Robert, J.-L., Berman, R.G., Redhammer, G.J. (2005) Fundamental difference between synthetic powder and natural or synthetic single-crystal 1M micas: Geometric homo-octahedral vs. geometric meso-octahedral sheets. American Mineralogist, 90, 399-410.
MILLOT, Y., Man, P.P. (2002) Procedures for labeling the high-resolution axis of two-dimensional MQ-MAS NMR spectra of half-integer quadrupole spins. Solid State Nuclear Magnetic Resonance, 21, 21-43.
MOTTANA, A., Sassi, F.P., Thompson, J.B., jr., Guggenheim, S. (2002) Micas: Crystal chemistry and metamorphic petrology. Reviews in Mineralogy and Geochemistry, 46, Mineralogical Society of America, Washington, D.C.
MÜLLER, R.F. (1972) Stability of biotite: A discussion. American Mineralogist, 57, 300-316.
B. References
176
MÜLLER, D., Hoebbel, D., Gessner, W. (1981) 27Al NMR studies of aluminosilicate solutions. Influences of the second coordination sphere on the shielding of aluminium. Chemical Physics Letters, 84, 25-27.
MUELLER, K.T., Sun, B.Q., Chingas, G.C., Zwanziger, J.W., Terao, T., Pines, A. (1990) Dynamic-angle spinning of quadrupolar nuclei. Journal of Magnetic Resonance, 86, 470-487.
NESPOLO, M., Ďurovič, S. (2002) Crystallographic basis of polytypism and twinning in micas. In: Mottana, A., Sassi, F.P., Thompson Jr., J.B., Guggenheim, S. (Eds.), Micas: Crystal chemical and metamorphic petrology, Reviews in Mineralogy and Geochemistry, 46, 155-279. Mineralogical Society of America, Washington, D.C.
ORDEJÓN, P., Artacho, E., Soler, J.M. (1996) Self-consistent order-N density-functional calculations for very large systems. Physical Reviews B, 15, 10441-10444.
PALIN, E.J., Dove, M.T., Redfern, S.A.T., Bosenick, A., Sainz-Díaz, C.I., Warren, M.C. (2001) Computational study of tetrahedral Al-Si ordering of muscovite. Physics and Chemistry of Minerals, 28, 534-544.
PALIN, E.J., Dove, M.T., Redfern, S.A.T., Sainz-Díaz, C.I., Lee, W.T. (2003) Computational study of tetrahedral Al-Si and octahedral Al-Mg ordering in phengite. Physics and Chemistry of Minerals, 30, 293-304.
PALIN, E.J., Dove, M.T. (2004) Investigation of Al/Si ordering in tetrahedral phyllosilicate sheets by Monte Carlo simulation. American Mineralogist, 89, 176-184.
PALIN, E.J., Harrison, R.J. (2007) A computational investigation of cation ordering phenomena in the binary spinel system MgAl2O4-FeAl2O4. Mineralogical Magazine, 71, 611-624.
PAPIN, A., Sergent, J., Robert, J.-L. (1997) Intersite OH-F distribution in an Al-rich synthetic phlogopite. European Journal of Mineralogy, 9, 501-509.
PAULING, L. (1960) The nature of the chemical bond. Cornell University Press, Ithaca, New York.
PICHAVANT, M., Manning, D.A.C. (1984) Petrogenesis of tourmaline granites and topaz granites – the contribution of experimental data. Physics of the Earth and Planetary Interiors, 35, 31-50.
PINES, A., Gibby, M.G., Waugh, J.S. (1972) Proton-enhanced nuclear induction spectroscopy. A method for high resolution NMR of dilute spins in solids. Journal of Chemical Physics, 56, 1776-1777.
PINES, A., Gibby, M.G., Waugh, J.S. (1973) Proton-enhanced NMR of dilute spins in solids. Journal of Chemical Physics, 59, 569-590.
PINI, S., Affronte, M., Brigatti, M.F. (2008) Magnetic behaviour of trioctahedral mica-2M1 occurring in a magnetic anomaly zone. Mineralogical Magazine, 72, 1035-1042.
B. References
177
RAMSDELL, L.S. (1947) Studies on silicon carbide. American Mineralogist, 32, 64-82.
RAO, N.V.C., Srivastava, R.K. (2009) Petrology and geochemistry of diamondiferous Mesoproterozoic kimberlites from Wajrakarur kimberlite field, Eastern Dhwarwar craton, southern India: genesis and constraints on mantle source regions. Contributions to Mineralogy and Petrology, 157, 245-265.
RICKWOOD, P.C. (1981) The largest crystals. American Mineralogist, 66, 885-907.
RIEDER, M., Cavazzini, G., D’Yakonov, Y.S., Frank-Kamenetskii, V.A., Gottardi, G., Guggenheim, S., Koval, P.V., Müller, G., Neiva, A.M.R., Radoslovich, E.W., Robert, J.-L., Sassi, F.P., Takeda, H., Weiss, Z., Wones, D.R. (1998) Nomenclature of the micas. The Canadian Mineralogist, 36, 905-912.
ROBERT, J.-L. (1976) Phlogopite solid solutions in the system K2O-MgO-Al2O3-SiO2-H2O. Chemical Geology, 17, 195-212.
ROBERT, J.-L., Kodama, H. (1988) Generalization of the correlations between hydroxyl-stretching wavenumbers and composition of micas in the system K2O-MgO-Al2O3-SiO2-H2O: A single model for trioctahedral and dioctahedral micas. American Journal of Science, 288-A, 196-212.
ROBERT, J.-L., Beny, J.-M., Della Ventura, G., Hardy, M. (1993) Fluorine in micas: crystal-chemical control of the OH-F distribution between trioctahedral and dioctahedral sites. European Journal of Mineralogy, 5, 7-18.
RUTHERFORD, M.J. (1973) The phase relations of aluminous iron biotites in the system KAlSi3O8-KAlSiO4-Al2O3-Fe-O-H. Journal of Petrology, 14, 159-180.
SAINZ-DÍAZ, C.I., Palin, E.J., Hernández-Laguna, A., Dove, M.T. (2003a) Octahedral cation ordering of illite and smectite. Theoretical exchange potential determination and Monte Carlo simulations. Physics and Chemistry of Minerals, 30, 382-392.
SAINZ-DÍAZ, C.I., Palin, E.J., Dove, M.T., Hernández-Laguna, A. (2003b) Monte Carlo simulations of ordering of Al, Fe, and Mg cations in the octahedral sheet of smectites and illites. American Mineralogist, 88, 1033-1045.
SAMOSON, A., Lippmaa, E., Pines, A. (1988) High resolution solid-state N.M.R. Averaging of second-order effects by means of a double-rotor. Molecular Physics, 65, 1013-1018.
SANZ, J., Serratosa, J.M. (1984) 29Si and 27Al high-resolution MAS-NMR spectra of phyllosilicates. Journal of the American Chemical Society, 106, 4790-4793.
SCHINGARO, E., Scordari, F., Ventruti, G. (2001) Trioctahedral micas-1M from Mt. Vulture (Italy): Structural disorder and crystal chemistry. European Journal of Mineralogy, 13, 1057-1069.
SCHREYER, W., Abraham, K., Kulke, H. (1980) Natural sodium phlogopite coexisting with potassium phlogopite and sodium aluminium talc in a metamorphic evaporite sequence from Derrag, Tell Atlas, Algeria. Contributions to Mineralogy and Petrology, 74, 223-233.
B. References
178
SHANNON, R.D. (1976) Revised effective ionic radii and systematic studies of interatomic distances in halides and chalcogenides. Acta Crystallographica A, 32, 751-767.
SHELL, H.R., Ivey, K.H. (1969) Fluorine micas. U.S. Department of the Interior, Bureau of Mines, 647, 291 p.
SLICHTER, C.P. (1996) Principles of magnetic resonance. Springer, Berlin.
SOLER, J.M., Artacho, E., Gale, J.D., García, A., Junquera, J., Ordejón, P., Sánchez-Portal, D. (2002) The SIESTA method for ab initio order-N materials simulation. Journal of Physics: Condensed Matter, 14, 2745-2779.
STEBBINS, J.F., Zhao, P., Lee, S.K., Cheng, X. (1999) Reactive Al-O-Al stes in a natural zeolite: Triple-quantum oxygen-17 nuclear magnetic reasonance. American Mineralogist, 84, 1680-1684.
SUNAGAWA, I., Endo, J., Daimon, N., Tate, I. (1968) Nucleation, growth and polytypism of fluor-phlogopite from the vapour phase. Journal of Crystal Growth, 3-4, 751.
TAKEDA, H., Morosin, B. (1975) Comparison of observed and predicted structural parameters of mica at high-temperature. Acta Crystallographica B, 31, 2444-2452.
TATEYAMA, H., Shimoda, S., Sudo, T. (1974) The crystal structure of synthetic Mg(IV)mica. Zeitschrift für Kristallographie, Kristallgeometrie, Kristallphysik, Kristallchemie, 139, 196-206.
TISCHENDORF, G., Förster, H.-J., Gottesmann, B., Rieder, M. (2007) True and brittle micas: composition and solid-solution series. Mineralogical Magazine, 71, 285-320.
TORAYA, H. (1981) Distortions of octahedra and octahedral sheets in 1M micas and the relation to their stability. Zeitschrift für Kristallographie, 157, 173-190.
TUTTLE, O.F. (1949) Two pressure vessels for silicate-water studies. Bulletin of the Geological Society of America, 60, 1727-1729.
VAN ECK, E.R.H., Smith, M.E., Kohn, S.C. (1999) Observation of hydroxyl groups by 17O solid-state multiple quantum MAS NMR in sol-gel-produced silica. Solid State Nuclear Magnetic Resonance, 15, 181-188.
VAN VALKENBURG, A., Pike, R.G. (1952) Synthesis of mica. Journal of Research of the National Bureau of Standards, 48, 360-369.
VAN VLECK, J.H. (1948) The dipolar broadening of magnetic resonance lines in crystals. Physical Review, 74, 1168-1183.
VIRGO, D, Popp, R.K. (2000) Hydrogen deficiency in mantle-derived phlogopites. American Mineralogist, 85, 753-759.
B. References
179
WALTHER, K.L., Wokaun, A., Baiker, A. (1990) Characterization of porous silica gels prepared via the sol-gel process by 29Si CP/MAS solid-state NMR spectroscopy. Molecular Physics, 71, 769-780.
WARREN, M.C., Dove, M.T., Myers, E.R., Bosenick, A., Palin, E.J., Sainz-Diaz, C.I., Guiton, B.S., Redfern, S.A.T. (2001) Monte Carlo methods for the study of cation ordering in minerals. Mineralogical Magazine, 65, 221-248.
WEBSTER, J.D., Holloway, J.R., Hervig, R.L. (1987) Phase equilibria of a Be, U and F-enriched vitrophyre from Spor Mountain, Utah. Geochimica et Cosmochimica Acta, 51, 389-402.
WEIDNER, J.R., Martin, R.F. (1987) Phase equilibria of a F-rich leucogranite from the St. Austell pluton, Cornwall. Geochimica et Cosmochimica Acta, 51, 1591-1597.
WEISS, C.A., Jr., Altaner, S.P., Kirkpatrick, R.J. (1987) High-resolution 29Si NMR spectroscopy of 2:1 layer silicates: Correlations among chemical shift, structural distortions, and chemical variations. American Mineralogist, 72, 935-942.
WEISS, Z., Rieder, M., Chmielovà, M. (1992) Deformation of coordination polyhedra and their sheets in phillosilicates. European Journal of Mineralogy, 4, 665-682.
WHALEN, J.B., Currie, K.L., Chappell, B.W. (1987) A-type granites: geochemical characteristics, discrimination, and petrogenesis. Contributions to Mineralogy and Petrology, 95, 407-419.
WOESSNER, D.E. (1989) Characterization of clay minerals by 27Al nuclear magnetic resonance spectroscopy. American Mineralogist, 74, 203-215.
WONES, D.R., Eugster, H.P. (1965) Stability of biotite: Experiment, theory, and application. American Mineralogist, 50, 1228-1272.
WONES, D.R. (1967) A low pressure investigation of the stability of phlogopite. Geochimica et Cosmochimica Acta, 31, 2248-2253.
WONES, D.R. (1972) Stability of biotite: A reply. American Mineralogist, 57, 316-317.
ZUREVINSKI, S.E., Heaman, L.M., Creaser, R.A., Strand, P. (2008) The Churchill kimberlite field, Nunavut, Canada: petrography, mineral chemistry, and geochronology. Canadian Journal of Earth Sciences, 45, 1039-1059.

List of Tables
181
List of Tables
Table 2.1. Definition of the 16 J -parameters for phlogopite and their values in eV averaged over runs
for the two compositions x = 0.0 and x = 1.0. The approximate error bar is 0.05 eV. .................. 44
Table 4.1. Crystallite sizes and relative amounts of phases in phlogopite samples determined by
LeBail-fitting of the phlogopite XRD patterns. ............................................................................... 61
Table 4.2. Comparison of relative numbers of Si environments in the tetrahedral sheets of phlogopite.
...................................................................................................................................................... 79
Table 4.3. Comparison of relative numbers of H-OMg3 and H-OMg2Al environments determined from
MC simulations and from 1H MAS NMR spectroscopy. .............................................................. 104
Table 4.4. Initial magnetisation M0, cross-polarisation time THSi, spin-lattice relaxation time in the
rotating frame T1ρ, and mean H-Si distance dH-Si obtained from fits of {1H} → 29Si magnetisation
curves of Al-rich phlogopites K (Mg3-xAlx) (Al1+xSi3-xO10) (OH)y (F)2-y. The error range of THSi is ±
1.0 s, that of dH-Si ± 0.1 Å. ........................................................................................................... 116
Table 4.5. Initial magnetisation M0, cross-polarisation time TFSi, spin-lattice relaxation time in the
rotating frame T1ρ, and mean F-Si distance dF-Si obtained from fits of {19F} → 29Si magnetisation
curves for F-rich phlogopites K (Mg3-xAlx) (Al1+xSi3-xO10) (OH)y (F)2-y. The error range of THSi is ±
1.0 s, that of dH-Si ± 0.1 Å. ........................................................................................................... 118
Table 4.6. Fit parameters obtained from 1D {19F} → 29Si CPMAS NMR spectra of phlogopites K (Mg3-
xAlx) (Al1+xSi3-xO10) (OH)y F2-y recorded with different contact times. For comparison fit parameters
for 29Si MAS NMR spectra are also given. Pos. = position, FWHM = full width at half maximum,
F = relative signal area. The approximate error range for the signal area is ± 2 %. .................. 120
Table 4.7. NMR parameters obtained from 27Al MAS NMR spectra of phlogopite samples
K (Mg3-xAlx) (Al1+xSi3-xO10) (OH)2 recorded at 17.6 T (27Al Larmor frequency = 195.28 MHz). ... 126
Table 4.8. Parameters obtained from 27Al MQMAS NMR spectra of phlogopites and Al2O3, recorded at
16.45 T. ....................................................................................................................................... 131
Table 4.9. Quadrupolar coupling parameters obtained from fits of 17O MAS and MQMAS NMR spectra
obtained at 9.34 T. Error ranges have been estimated by changing the parameters manually
observing χ2 until a disting change of χ2 took place. .................................................................. 138
Table 4.10. Crystallite sizes and relative amounts of phases in phlogopite samples determined by
LeBail-fitting of the phlogopite XRD patterns. The given R-value is that of the overall fit. ......... 140
Table 6.1. List of abbreviations ........................................................................................................... 150
Table 6.2. Parameters obtained from 29Si MAS NMR spectra. ........................................................... 153
Table 6.3. NMR spectroscopic parameters obtained from 1H MAS NMR spectra. ............................. 157
Table 6.5. Parameters obtained from 27Al MAS and MQMAS NMR spectra. ..................................... 162
Table 6.6. {1H} → 29Si contact time dependent magnetisation curves. A = overall intensity of Si-nAl
signals. I = point of highest intensity of the Si-Si2Al or Si-SiAl2 signal. ....................................... 166
Table 6.7. {19F} → 29Si contact time dependent magnetisation curves. A = overall intensity of Si-nAl
signals. I = point of maximum intensity of the Si-Si2Al or Si-SiAl2 signal. ................................... 168

List of Figures
183
List of Figures
Figure 2.1. View on the stacking sequence of phlogopite-2M1. The unit cell is outlined. After Hendricks
and Jefferson (1939). ...................................................................................................................... 9
Figure 2.2. View on the octahedral sheet of phlogopite-2M1 (after Hendricks and Jefferson, 1939). ... 10
Figure 2.3. View on the tetrahedral sheet of phlogopite-2M1 (after Hendricks and Jefferson, 1939). In
the right half of the picture the K+-ions were omitted to show the position of the OH/F site. ....... 11
Figure 2.4. Schematic illustration of different ways of stacking in micas leading to a different position of
the OH-groups. ............................................................................................................................. 12
Figure 2.5. Crystal structures of the five naturally occurring polytypes in micas (Ferraris and Ivaldi,
2002). ............................................................................................................................................ 13
Figure 2.6. Sketch of two rings of tetrahedra belonging to adjacent layer packages. In between, the
interlayer cation K+ is shown. In dioctahedral micas the proton of the OH-group is pointing into
the vacancy, minimizing the repulsion between like-charged proton and K+. (Brigatti and
Guggenheim, 2002) ...................................................................................................................... 17
Figure 2.7. The dipolar interaction between two spins i and j. .............................................................. 24
Figure 2.8. Schematic illustration of the changes of the differences between the energy levels for
Zeeman, first-order and second-order quadrupolar interaction for a spin 3/2 nucleus (after Medek
et al., 1998). .................................................................................................................................. 27
Figure 2.9. Sketch of the energy levels of 1H (‘cold spin revervoir’, left) and 29Si (‘hot spin reservoir’,
right). A transfer of energy from the hot system to the cold one is only possible if the Hartmann-
Hahn-condition is fulfilled (middle). ............................................................................................... 29
Figure 2.10. Pulse sequence schemes for {1H} → 29Si CPMAS (a) and 2D {1H} → 29Si HETCOR (b)
NMR experiments. ........................................................................................................................ 31
Figure 2.11. Example of a magnetisation function for the case of a large proton spin reservoir. The
curve has been calculated according to equation (2.33) using the following parameters: M0 =
4*1010 a.u., T1ρ = 45 ms, and THSi = 9 ms. .................................................................................... 32
Figure 2.12. Example of a magnetisation function for the case of an isolated spin system. The curve
has been calculated according to equation (2.34) using the following parameters: M0 = 4*1010
a.u., T1ρ = 12 s, THSi = 6 ms, THH = 50 ms, a = 0, and b = 500. .................................................... 33
Figure 2.13. Top: Pulse scheme for the 27Al 3QMAS NMR experiment. Bottom: Corresponding
coherence path scheme. .............................................................................................................. 37
Figure 2.14. Assignment of J -parameters within one tetrahedral sheet. ............................................. 41
Figure 2.15 Assignment of octahedral J -parameters. ......................................................................... 42
Figure 2.16. Examples of tetrahedral intralayer (green), tetrahedral interlayer (blue), and octahedral-
tetrahedral (red) J -parameters. ................................................................................................... 43
Figure 4.1. Scanning electron microscope (SEM) images of typical run products. The samples consist
of several µm large crystals of impurity phases (a) with much smaller phlogopite crystals sticking
to them (b). The phlogopite platelets exhibit a diameter of less than 1 µm and often show a more
or less hexagonal shape (c). ......................................................................................................... 60
List of Figures
184
Figure 4.2. Comparison of 29Si MAS NMR spectra of phlogopites K (Mg3-xAlx) (Al1+xSi3-xO10) (OH)y F2-y
with different Al- and F-contents. Below the spectra, the Al-content of the tetrahedral sheets
calculated from the relative signal intensities, xest, is given. ......................................................... 65
Figure 4.3. a) The Si/[4]Al-ratio calculated from the relative signal intensities in the 29Si MAS NMR
spectra plotted against the nominal Al-content of the initial oxide mixture. The solid black curve
indicates the phlogopite composition if all starting material had reacted to phlogopite. b) Plot of
the experimentally derived (additional) Al-content of the tetrahedral sheets of the phlogopites
against the Al-content of the initial gel mixture. The black line indicates a complete reaction of the
starting material to phlogopite. ...................................................................................................... 67
Figure 4.4. Comparison of 29Si MAS NMR spectra of phlogopites K (Mg3-xAlx) (Al1+xSi3-xO10) (OH)y F2-y
with high Al- and low F-contents. Below the spectra, the Al-content of the tetrahedral sheets
calculated from the relative signal intensities, xest, is given. ......................................................... 69
Figure 4.5. a) The Si/[4]Al-ratio calculated from the relative signal intensities in the 29Si MAS NMR
spectra plotted against the nominal Al-content of the initial oxide mixture. The solid black curve
indicates the phlogopite composition if all starting material had reacted to phlogopite. b) Plot of
the experimentally derived (additional) Al-content of tetrahedral sheets of the phlogopites against
the Al-content of the initial gel mixture. The black line indicates a complete reaction of the
starting material to phlogopite. ...................................................................................................... 70
Figure 4.6. Comparison of 29Si MAS NMR spectra of phlogopites K (Mg3-xAlx) (Al1+xSi3-xO10) (OH)y F2-y
with different Al- and F-contents. .................................................................................................. 71
Figure 4.7. Comparison of 29Si MAS NMR spectra of F-rich phlogopites with nominal composition
K (Mg3-xAlx) (Al1+xSi3-xO10) (OH)y F2-y. ............................................................................................ 73
Figure 4.8. Comparison of the tetrahedral intrasheet J-parameters. The error range of the values is ±
0.05 eV. ......................................................................................................................................... 75
Figure 4.9. Configuration of lowest energy for ordering of cations in a single tetrahedral sheet of
phlogopite with x = 1.0 (‘eastonite’ composition, K (Mg2Al) (Al2Si2O10) (OH)2). Al-atoms are
shown in red, Si-atoms in yellow. Grey bars indicate Al-Si-neighbour pairs. Only a part of the
supercell is shown. Note the defects characterised by Al-Al neighbour pairs. ............................. 75
Figure 4.10.Configurations of lowest energies for cation ordering in a single tetrahedral sheet of
phlogopite with a) x = 0.5 (composition K (Mg2.5Al0.5) (Al1.5Si2.5O10) (OH)2) and b) x = 0.25
(composition K (Mg2.25Al07.5) (Al1.75Si2.25O10) (OH)2). Al-atoms are shown in red, Si-atoms in
yellow. Grey bars indicate Al-Si-neighbour pairs. Only a part of the supercell is shown. ............ 76
Figure 4.11. Configurations of lowest energy for cation ordering in a single tetrahedral sheet of
phlogopite with x = 0.0 (composition K Mg3 (AlSi3O10) (OH)2). Al-atoms are shown in red, Si-
atoms in yellow. Every Al-atom has three Si-atoms as next-nearest-neighbours, while every Si-
atom is surrounded by two Si-atoms and one Al-atom in the neighbouring tetrahedra. a) Grey
lines indicate Si-Al neighbour pairs. b) The J3-interactions connecting Al-atoms are marked by
grey lines. ...................................................................................................................................... 78
Figure 4.12. Comparison of experimental 29Si MAS NMR spectra (right) and theoretical ones derived
from the Monte-Carlo simulation results (left) for phlogopites K (Mg3-xAlx) (Al1+xSi3-xO10) (OH)2.
List of Figures
185
For x = 0.0, the 29Si MAS NMR spectrum of a F-bearing phlogopite is shown as no F-free
samples have been available for analysis. ................................................................................... 80
Figure 4.13. 1H MAS NMR spectra of phlogopites K (Mg3-xAlx) (Al1+xSi3-xO10) (OH)y F2-y with different
OH- and Al-contents. Below the spectra the ratio I[H-OMg2Al]/(I[H-OMg2Al] + I[H-OMg3]) is given,
abbreviated as ‘Al/(Mg+Al)’. .......................................................................................................... 83
Figure 4.14. Plot of the relative signal intensity of the H-OMg2Al signal against the Al-content x
estimated from 29Si MAS NMR spectra. The solid line represents a statistical distribution of ions
in the octahedral sheet. a) Data of this study only, b) comparison of the 600 °C data (black
symbols) to the 800 °C data of Fechtelkord et al. (2003a, grey symbols). ................................... 84
Figure 4.15. Comparison of 19F MAS NMR spectra of phlogopites K (Mg3-xAlx) (Al1+xSi3-xO10) (OH)y F2-y
with different Al- and F-contents. Below the spectra the ratio I[F-Mg2Al]/(I[F-Mg2Al] + I[F-Mg3]) is
given, abbreviated as ‘Al/(Mg+Al)’. Spinning sidebands are marked by asterisks. ...................... 87
Figure 4.16. Plot of the relative intensity of the F-OMg2Al signal against the Al-content x estimated
from 29Si MAS NMR spectra. The solid line represents a statistical distribution of ions in the
octahedral sheet. .......................................................................................................................... 88
Figure 4.17. Comparison of 1H MAS NMR spectra of OH- and Al-rich phlogopites
K (Mg3-xAlx) (Al1+xSi3-xO10) (OH)y F2-y. Below the spectra the ratio
I[H-OMg2Al]/(I[H-OMg2Al] + I[H-OMg3]) is given, abbreviated as ‘Al/(Mg+Al)’. ............................ 90
Figure 4.18. Plot of the relative signal intensity of the H-OMg2Al signal against the Al-content xest
estimated from 29Si MAS NMR spectra. The solid line represents a statistical distribution of ions
in the octahedral sheet. ................................................................................................................ 92
Figure 4.19. Plot of the H-OMg2Al (a) and the H-OMg3 (b) signal position as a function of the Al-
content of the estimated Al-content of the phlogopites. Tolerances have been estimated by
changing parameters manually observing χ2 until a distinct change of χ2 took place. ................. 92
Figure 4.20. Comparison of 19F MAS NMR spectra of OH- and Al-rich phlogopites
K (Mg3-xAlx) (Al1+xSi3-xO10) (OH)y F2-y. Below the spectra the ratio I[F-Mg2Al]/(I[F-Mg2Al] + I[F-Mg3])
is given, abbreviated as ‘Al/(Mg+Al)’. Spinning sidebands are marked by asterisks. .................. 94
Figure 4.21. Position and full width at half maximum (FWHM) of 19F MAS NMR signals versus
estimated Al-content of phlogopites K (Mg3-xAlx) (Al1+xSi3-xO10) (OH)y F2-y. a)+c) F-Mg3 signal.
b)+d) F-Mg2Al signal. Tolerances have been estimated by changing parameters manually
observing χ2 until a distinct change of χ2 took place. .................................................................... 95
Figure 4.22. 19F MAS NMR spectrum of sample with nominal composition of xnom = 1.2 and y = 1.6
showing a splitting of the F-Mg3 signal at -175 ppm into two separate signals. Spinning
sidebands are marked by asterisks. ............................................................................................. 96
Figure 4.23. Comparison of 1H MAS NMR spectra of phlogopites K (Mg3-xAlx) (Al1+xSi3-xO10) (OH)y F2-y.
Below the spectra the ratio I[H-OMg2Al]/(I[H-OMg2Al] + I[H-OMg3]) is given, abbreviated as
‘Al/(Mg+Al)’.................................................................................................................................... 98
Figure 4.24. Comparison of 19F MAS NMR spectra of F-rich phlogopites
K (Mg3-xAlx) (Al1+xSi3-xO10) (OH)y F2-y. Below the spectra the ratio I[F-Mg2Al]/(I[F-Mg2Al] + I[F-Mg3])
is given, abbreviated as ‘Al/(Mg+Al)’. Spinning sidebands are marked by asterisks. .................. 99
List of Figures
186
Figure 4.25. Comparison of 19F MAS NMR spectra of phlogopites of composition xnom = 0.8, y = 0.5
synthesised at 600 (a) and at 800 °C. ........................................................................................ 100
Figure 4.26. Comparison of the octahedral intrasheet J-parameters. The error range of the values is ±
0.05 eV. ....................................................................................................................................... 101
Figure 4.27. Configuration of lowest energy derived by Monte-Carlo simulations for a single octahedral
sheet of phlogopites with composition a) x = 0.25, y = 2.0 (K (Mg2.75Al0.25) (Al1.25Si2.75O10) (OH)2)
and b) x = 0.75, y = 2.0 (K (Mg2.25Al0.75) (Al1.75Si2.25O10) (OH)2). Mg-ions are shown in green, Al-
atoms in red. Grey bars indicate Mg-Al neighbour pairs. Only a part of the supercell is shown. 102
Figure 4.28. Configuration of lowest energy derived by Monte-Carlo simulations for a single octahedral
sheet of phlogopite with composition x = 1.0, y = 2.0 (K (Mg2Al) (Al2Si2O10) (OH)2). Mg-ions are
shown in green, Al-atoms in red. Grey bars indicate Mg-Mg neighbour pairs. Only a part of the
supercell is shown. ...................................................................................................................... 103
Figure 4.29. 2D {1H} → 29Si HETCOR CPMAS NMR spectrum of phlogopite with nominal composition
K(Mg2.2Al1.8)(Al1.8Si2.2O10)(OH)2 (xnom = 0.5)................................................................................ 107
Figure 4.30. View on the tetrahedral sheets of phlogopite. Every OH-position is co-ordinated by three
octahedral cations which may be either Mg or Al (white arrows). The information on a single OH
environment is passed on to six neighbouring tetrahedra if these are occupied by 29Si (black
arrows). Each tetrahedral site has three next-nearest-neighbours which may be either Si or Al. In
this way, the number of Al co-ordinating OH may be correlated to the amount of Al in the 29Si
environment in the tetrahedral sheet. ......................................................................................... 107
Figure 4.31. Values of the tetrahedral intralayer, tetrahedral interlayer, and the octahedral –
tetrahedral interaction parameters obtained from GULP. ........................................................... 109
Figure 4.32. Details of the configuration of lowest energy obtained from MC simulations for x = 1.0.
Only one 2:1 layer package is given. Si, [4]Al, Mg, and [6]Al-atoms are shown in yellow, red, blue,
and green, respectively. In the lower picture, Mg has been omitted for clarity. Grey bars connect
pairs of directly neighboured Si- and Al-atoms. Domains can be distinguished by the different
orientation of [4]Al in the lower tetrahedral sheet to [4]Al in the upper tetrahedral sheet. Two such
configurations are marked by white ellipsoids. Some of the domain boundaries are highlighted by
white lines. They are characterised by Si-O-Si and Al-O-Al linkages. ........................................ 110
Figure 4.33. Details of the configuration of lowest energy obtained from MC simulations for x = 0.5.
Only one 2:1 layer package is given. Si, [4]Al, Mg, and [6]Al-atoms are shown in blue, red, green,
and yellow, respectively. In the lower picture, Mg has been omitted for clarity. Grey bars indicate
Al-O-Si linkages in the tetrahedral sheet. ................................................................................... 112
Figure 4.34. Comparison of site connectivies obtained from MC simulations for a composition of x =
0.68 (left) to the 2D {1H} → 29Si CPMAS HETCOR NMR spectrum of a phlogopite with the same
estimated Al-content. .................................................................................................................. 113
Figure 4.35. Experimental magnetisation curves for signal area (top, all Si-nAl signals) and highest
signal intensity (bottom, Si-Si2Al or Si-SiAl2 signal). ................................................................... 115
Figure 4.36. Magnetisation curve derived from the highest intensities of the Si-Si2Al signal for
phlogopite of nominal composion xnom = 0.7, y = 1.0 (synthesis temperature T = 800 °C). The
solid line represents a fit to the data according to equation (2.33). ............................................ 116
List of Figures
187
Figure 4.37. Experimental magnetisation curves of F-rich phlogopites
K (Mg3-xAlx) (Al1+xSi3-xO10) (OH)y F2-y derived from the signal area of all Si-nAl signals. Top: Whole
contact time range. Bottom: Detail of low contact times. ............................................................ 117
Figure 4.38. Comparison of 27Al MAS NMR spectra of phlogopites of different compositions
K (Mg3-xAlx) (Al1+xSi3-xO10) (OH)y F2-y. Spinning sidebands are marked by asterisks. ................. 123
Figure 4.39. Plot of the phlogopite [4]Al signal position against the estimated Al-content xest of
phlogopites with different F-contents y. ...................................................................................... 124
Figure 4.40. 27Al MQMAS NMR spectra of phlogopites K (Mg3-xAlx) (Al1+xSi3-xO10) (OH)y F2-y. Spinning
sidebands are marked by asterisks. The F1-axis has been labelled according to the C3a-
convention (Amoureux and Fernandez, 1998; Millot and Man, 2002) ........................................ 125
Figure 4.41. Comparison of 27Al MAS NMR spectra of phlogopite samples with nominal composition
K (Mg3-xAlx) (Al1+xSi3-xO10) (OH)y F2-y recorded at 17.6 T. ........................................................... 127
Figure 4.42. Comparison of 27Al MAS NMR spectra of phlogopites K (Mg3-xAlx) (Al1+xSi3-xO10) (OH)2 F2
and an Al-oxide sample recorded at a field strength of 16.45 T (27Al Larmor frequency
182.47 MHz). .............................................................................................................................. 129
Figure 4.43. 27Al MAS and MQMAS spectra of Al2O3. The 27Al MAS NMR spectrum is shown on top of
the F2-projection of the 27Al MQMAS spectrum. In the left part slices parallel to the F2-axis of the
MQMAS spectrum are shown, and the F1-shifts at which they were taken are given. Labelling of
the F1-axis has been done following the Cz-convention (Millot and Man, 2002) The diagonal line
in the MQMAS spectrum indicates positions resulting from Al environments of high symmetry. In
these, no electric field gradient influences the nucleus and thus the signal shift is only made up
by the chemical shift. .................................................................................................................. 130
Figure 4.44. 27Al MQMAS NMR spectra of phlogopites K (Mg3-xAlx) (Al1+xSi3-xO10) (OH)y F2-y recorded
at 16.45 T (27Al Larmor frequency 182.42 MHz). The F1-axis has been labelled according to the
Cz-convention (Millot and Man, 2002). ........................................................................................ 132
Figure 4.45. 17O MAS NMR spectra of 17O enriched phlogopites K (Mg3-xAlx) (Al1+xSi3-xO10) (OH)y F2-y.
.................................................................................................................................................... 134
Figure 4.46. 17O MQMAS spectra of phlogopite with composition xnom = 0.5, y = 1.0. a) Spectrum
recorded at 9.34 T (F1-axis labelled according to the C3a-convention; Amoureux and Fernandez,
1998; Millot and Man, 2002). b) Spectrum recorded at 16.45 T. ................................................ 135
Figure 4.47. 17O MAS NMR spectrum of phlogopite with composition xnom = 0.5, y=1.0. Observed
spectrum, total lineshape fit, and individual signal components are shown. .............................. 137
Figure 4.48. X-ray diffraction powder patterns of four selected phlogopite samples. Arrows mark peak
positions of the impurity phase corundum. ................................................................................. 139
Figure 4.49. Results of the analysis of XRD powder patterns of several 1M-phlogopites with varying
compositions K(Mg3-xAlx)(Al1+xSi3-xO10)(OH)yF2-y. ....................................................................... 141
Figure 4.50. Sketch showing the distortion of a tetrahedral sheet. a) Undisturbed sheet with hexagonal
symmetry. b) Rotation of tetrahedra about the perpendicular to the sheet leads to a ditrigonal
symmetry. The distortion is described by the ditrigonal rotation angle α. c) Fully distorted
tetrahedral sheet. (Ferraris and Ivaldi, 2002) ............................................................................. 142

List of Figures
188
Figure 4.51. Results of the analysis of XRD powder patterns of several 2M1-phlogopites with varying
compositions K(Mg3-xAlx)(Al1+xSi3-xO10)(OH)yF2-y......................................................................... 143
Figure 4.52. The relative amount of phlogopite-1M of phlogopites derived from LeBail-fitting plotted
against the estimated Al-content of the phlogopites. .................................................................. 143
Figure 4.53. Sketch of the interlayer boundary in phlogopite-1M (left) and phlogopite 2M1 (right).
Tetrahedral tilting, i.e. out-of-plane rotation, is exaggerated. Circles denote K+-ions. Modified
after Ferraris and Ivaldi, 2002. .................................................................................................... 144
Figure 4.54. XRD pattern of phlogopite with nominal composition xnom = 0.4, y = 1.8. a) Whole pattern.
b) Detail. The pattern shows a high background, and the peaks between 20 and 33 °2θ are
surrounded by satellite peaks (marked by arrows) resulting from stacking faults in the structure.
.................................................................................................................................................... 145
Figure 4.55. Results of the analysis of XRD powder patterns of several 2M1-phlogopites with varying
compositions K(Mg3-xAlx)(Al1+xSi3-xO10)(OH)yF2-y......................................................................... 146
Danksagung
189
Danksagung
Zunächst einmal möchte ich all den vielen Leuten danken, die mir in all den Jahren geholfen
haben und ohne die die vorliegende Arbeit nicht möglich gewesen wäre.
Mein ganz besonderer Dank gilt meinem Betreuer Michael Fechtelkord, der mir die Möglichkeit
gab, in einem internationalen Projekt an einem interessanten Thema zu arbeiten. Er stand mir stets
hilfreich zur Seite, war geduldig mit mir und hatte Zeit für zahlreiche Diskussionen, wenn ich mal nicht
weiterkam. Bedanken möchte ich mich auch für die viele Mühe und die Zeit, die er investierte, um mir
ein optimales Arbeitsumfeld zu bieten, beispielsweise durch das stundenlange Werkeln an der
Technik, wenn Hannelore mal wieder streikte, oder die Computeradministration.
Weiterhin danke ich Alberto García Arribas für die Durchführung der Simulationen und für die
Organisation des Projekts „ORION“ sowie der Projekttreffen. In langen, angeregten Diskussionen
gelang es ihm ein ums andere Mal, mir einen anderen Blickwinkel auf das Thema zu eröffnen, Fehler
zu erkennen und noch mehr aus den Daten herauszuholen. Außerdem danke ich ihm auch für die
Übernahme der Zweitkorrektur.
Auch alle anderen Mitglieder des „ORION“-Projektes unterstützten mich stets und trugen durch
Tipps und Anregungen ihren Teil zum Gelingen dieser Arbeit bei.
Predrag Vulić und Volker Kahlenberg synthetisierten einige der in dieser Arbeit untersuchten
Phlogopit-Proben. Tonči Balić-Žunić, Helene Almind und Emil Makovicky halfen bei der Aufnahme und
der Auswertung von Pulverdiffraktogrammen an der Universität Kopenhagen. Karen Friese und
Andrzej Grzechnik untersuchten einige der Proben am DESY und unterstützten mich in Bilbao bei der
Auswertung der Daten. Javier Lopéz-Solano und Lars Olsen litten mit mir bei Vorträgen und
Posterpräsentationen und halfen mir, mich in Bilbao bzw. Kopenhagen zurechtzufinden. Louise
Nielsen danke ich für ihre Bemühungen, möglichst eisenfreie natürliche Phlogopite zu finden.
Besonders möchte ich auch den Mitgliedern des Bereichs Mineralogie-Kristallographie sowie des
Bereichs Mineralogie-Petrologie des Instituts für Geologie, Mineralogie und Geophysik der Ruhr-
Universität Bochum danken.
Antje Grünewald-Lüke sorgte dafür, dass ich nicht ganz so allein war in unserem Büro und sorgte
dafür, dass neben all der Arbeit auch der Spaß nicht zu kurz kam. Zusammen mit Kirsten Keppler,
Tomasz Goral, Sandra Grabowski und Ute Gundert unterstützte sie mich bei den Arbeiten im Labor.
Dank auch an Bernd Marler, der Röntgenmessungen an meinen Proben – in Bochum und am
DESY – vornahm und auch viel Zeit damit zubrachte mir bei der Auswertung der Diffraktogramme zu
helfen, sowie an Thomas Fockenberg für seine Einweisung und Hilfe im Hydrothermallabor.
Weiterhin danke ich Wilfried Schrimpf ganz herzlich für den Einsatz, den er beim schnellen
Reparieren der Probenköpfe und anderem zeigte. Auch Hans-Jochen Hauswald investierte viel Zeit
Danksagung
190
und Mühe bei kleineren und größeren Reparaturen an Hannelore. Benjamin Kellert war stets zur
Stelle, wenn es Probleme im Hydrothermallabor gab. Rolf Neuser nahm mit mir die
elektronenmikroskopischen Bilder auf, und Frank Bettenstedt stand mir beim Schweißen der Kapseln
mit Rat und Tat zur Seite.
Dank gebührt auch den Mitarbeitern der Bruker Biospin GmbH, und hier vor allem Walter Knöller,
die uns an ihrer umfänglichen Erfahrung teilhaben ließen, und es uns durch schnelle und
unkomplizierte Bereitstellung von Leihteilen ermöglichten, zügig Schäden in Hannelores System
ausfindig zu machen und zu reparieren.
Malte Seipenbusch, Lena Lingner, Mareike Wolf, Melanie Lhys-Aliu und Nathalie Lübke möchte
ich dafür danken, dass sie mir als studentische Hilfskräfte einiges an Arbeit abgenommen haben.
Anna Weiner war mir gerade in den letzten Monaten des Zusammenschreibens eine angenehme
Zimmergenossin und half z.B. durch Tipps zum Layout.
Bei Ulrike Werner-Zwanziger und Josef W. Zwanziger bedanke ich mich für die Aufnahme von
Hochfeld-NMR-Spektren in Halifax. Ebenso danke ich der Arbeitsgruppe um Jürgen Haase für weitere
Hochfeld-Messungen in Leipzig.
Last but not least möchte ich mich natürlich besonders bei all jenen bedanken, die mich immer
unterstützten, zu mir hielten und es mir nicht übel nahmen, wenn die Arbeit das ein oder andere Mal
vorging, die mich immer wieder „zwangen“ auch das Leben neben der Arbeit nicht zu kurz kommen zu
lassen, die mich aber andererseits auch immer wieder anspornten und neu motivierten: mein Freund
Jan, meine Familie - Mutsch, Wolfgang, Chris und Max -, Bianca, Eva, Martin und Sonja.
Diese Arbeit wurde mit Mitteln der European Science Foundation (ESF) und der Deutschen
Forschungsgemeinschaft (DFG) gefördert.
Lebenslauf
191
Lebenslauf
Persönliche Daten:
Name Ramona Langner
Geburtsdatum 10.02.1982
Geburtsort Rochlitz
Familienstand ledig
Staatsangehörigkeit deutsch
Schulausbildung
1988 – 1992 Diesterweg-Grundschule Geringswalde
1992 – 1995 Martin-Luther-Gymnasium Hartha
1995 – 2001 Gymnasium Neckargemünd
06 / 2001 Abschluss mit Abitur
Studium
10 / 2001 – 03 / 2002 Grundstudium der Chemie an der Ruprecht-Karls-
Universität Heidelberg
04 / 2002 – 09 / 2003 Grundstudium der Mineralogie an der Ruprecht-
Karls-Universität Heidelberg
01 / 2004 Diplomvorprüfung Mineralogie
10 / 2003 – 01 / 2007 Hauptstudium der Mineralogie an der Ruprecht-
Karls-Universität Heidelberg
Schwerpunkt Kristallographie
Lebenslauf
192
26.01.2007 Diplomprüfung Mineralogie
Thema der Diplomarbeit:
Wachstumstexturen in synthetischen
Eisentitanoxidproben
Betreuer:
Prof. Dr. D. Lattard
seit 04 / 2007 Promotionsstudium an der Ruhr-Universität
Bochum
Tätigkeiten
08 / 2003 – 12 / 2006 Wissenschaftliche Hilfskraft am Institut für
Mineralogie der Ruprecht-Karls-Universität
Heidelberg
02 / 2007 – 01 / 2010 Wissenschaftliche Angestellte am Institut für
Geologie, Mineralogie und Geophysik der
Ruhr-Universität Bochum
Erklärung
193
Erklärung
Hiermit versichere ich an Eides statt, dass ich die vorgelegte Dissertation selbst
verfasst und mich keiner anderen als der von mir ausdrücklich bezeichneten Quellen
und Hilfen bedient habe.
Ich erkläre hiermit, dass ich an keiner anderen Stelle ein Prüfungsverfahren
beantragt bzw. die Dissertation in dieser oder anderer Form bereits anderweitig als
Prüfungsarbeit verwendet oder einer anderen Fakultät als Dissertation vorgelegt
habe.
Bochum, den 14. Juli 2010
Ramona Langner


![DELTAtec 90P Feed - Boehlerit · 7 DELTAtec 90P Feed Systemgröße 10 System size 10 Abmessungen [mm] Dimensions [mm] Bestellbezeichnung Ordering code Ident.-Nr. Ident.-No. Verfügbarkeit](https://img.pdfslide.org/doc/110x75/604631b2c64a7264c42d08d5/deltatec-90p-feed-boehlerit-7-deltatec-90p-feed-systemgre-10-system-size-10.jpg)