Embed Size (px)
Citation preview
Fakultät für Medizin
Institut für Medizinische Mikrobiologie, Immunologie und Hygiene
Characterization of cell alterations caused
by fluorescence activated cell sorting and
development of new technical sorting
approaches
Immanuel Anton Andrä
Vollständiger Abdruck der von der Fakultät für Medizin der Technischen Universität München zur Erlangung des akademischen Grades eines
Doktors der Naturwissenschaften (Dr. rer. nat.)
genehmigten Dissertation.
Prof. Dr. Marc Schmidt-Supprian Vorsitzender:
Prüfer der Dissertation: 1. Prof. Dr. Dirk H. Busch2. Prof. Angelika Schnieke, Ph.D.
Die Dissertation wurde am 06.05.2019 bei der Technischen Universität München eingereicht und durch die Fakultät für Medizin am 11.02.2020 angenommen.
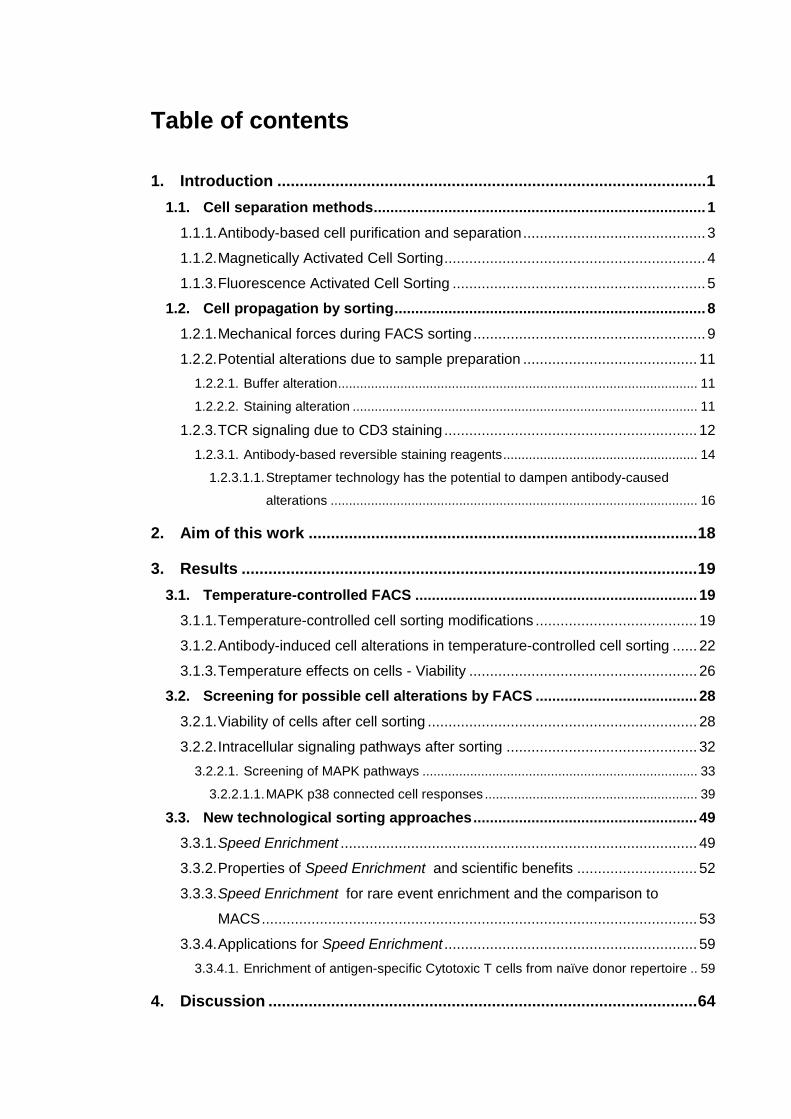
Table of contents
1. Introduction ................................................................................................ 1
1.1. Cell separation methods ................................................................................ 1
1.1.1. Antibody-based cell purification and separation ............................................ 3
1.1.2. Magnetically Activated Cell Sorting ............................................................... 4
1.1.3. Fluorescence Activated Cell Sorting ............................................................. 5
1.2. Cell propagation by sorting ........................................................................... 8
1.2.1. Mechanical forces during FACS sorting ........................................................ 9
1.2.2. Potential alterations due to sample preparation .......................................... 11
1.2.2.1. Buffer alteration .................................................................................................. 11
1.2.2.2. Staining alteration .............................................................................................. 11
1.2.3. TCR signaling due to CD3 staining ............................................................. 12
1.2.3.1. Antibody-based reversible staining reagents ..................................................... 14
1.2.3.1.1. Streptamer technology has the potential to dampen antibody-caused
alterations .................................................................................................... 16
2. Aim of this work ....................................................................................... 18
3. Results ...................................................................................................... 19
3.1. Temperature-controlled FACS .................................................................... 19
3.1.1. Temperature-controlled cell sorting modifications ....................................... 19
3.1.2. Antibody-induced cell alterations in temperature-controlled cell sorting ...... 22
3.1.3. Temperature effects on cells - Viability ....................................................... 26
3.2. Screening for possible cell alterations by FACS ....................................... 28
3.2.1. Viability of cells after cell sorting ................................................................. 28
3.2.2. Intracellular signaling pathways after sorting .............................................. 32
3.2.2.1. Screening of MAPK pathways ........................................................................... 33
3.2.2.1.1. MAPK p38 connected cell responses .......................................................... 39
3.3. New technological sorting approaches ...................................................... 49
3.3.1. Speed Enrichment ...................................................................................... 49
3.3.2. Properties of Speed Enrichment and scientific benefits ............................. 52
3.3.3. Speed Enrichment for rare event enrichment and the comparison to
MACS ......................................................................................................... 53
3.3.4. Applications for Speed Enrichment ............................................................. 59
3.3.4.1. Enrichment of antigen-specific Cytotoxic T cells from naïve donor repertoire .. 59
4. Discussion ................................................................................................ 64
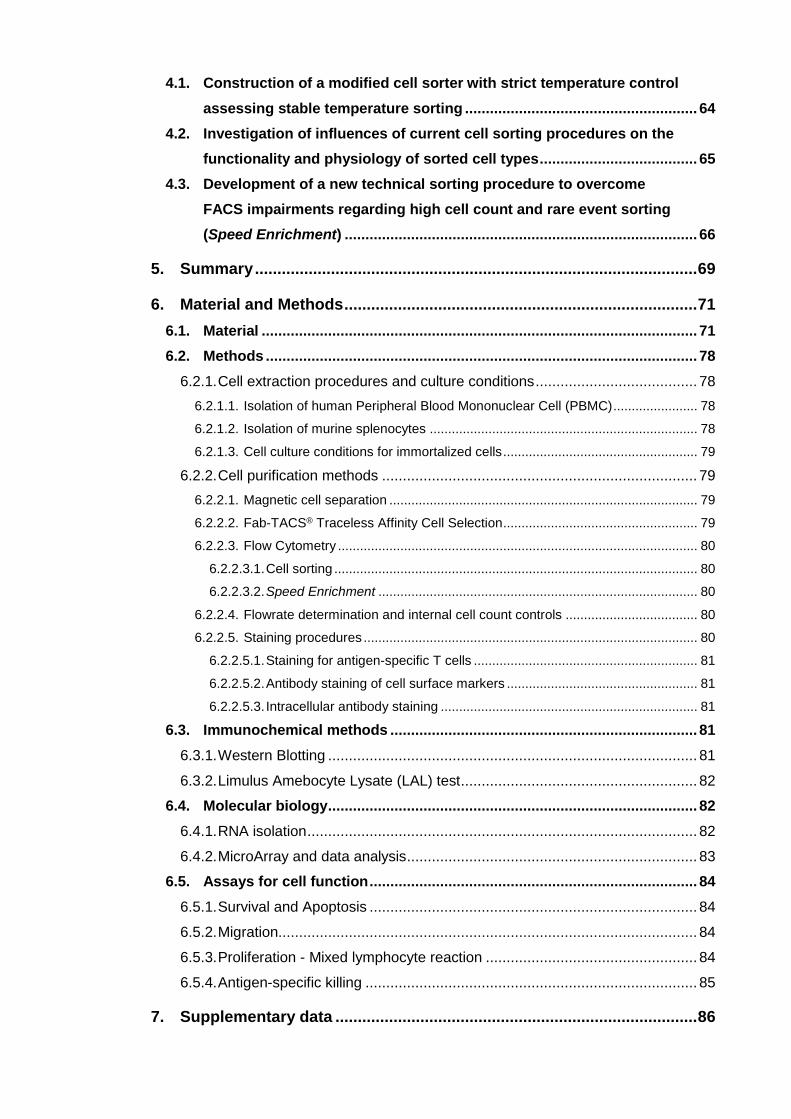
4.1. Construction of a modified cell sorter with strict temperature control
assessing stable temperature sorting ........................................................ 64
4.2. Investigation of influences of current cell sorting procedures on the
functionality and physiology of sorted cell types ...................................... 65
4.3. Development of a new technical sorting procedure to overcome
FACS impairments regarding high cell count and rare event sorting
(Speed Enrichment) ..................................................................................... 66
5. Summary ................................................................................................... 69
6. Material and Methods ............................................................................... 71
6.1. Material ......................................................................................................... 71
6.2. Methods ........................................................................................................ 78
6.2.1. Cell extraction procedures and culture conditions ....................................... 78
6.2.1.1. Isolation of human Peripheral Blood Mononuclear Cell (PBMC) ....................... 78
6.2.1.2. Isolation of murine splenocytes ......................................................................... 78
6.2.1.3. Cell culture conditions for immortalized cells ..................................................... 79
6.2.2. Cell purification methods ............................................................................ 79
6.2.2.1. Magnetic cell separation .................................................................................... 79
6.2.2.2. Fab-TACS® Traceless Affinity Cell Selection ..................................................... 79
6.2.2.3. Flow Cytometry .................................................................................................. 80
6.2.2.3.1. Cell sorting ................................................................................................... 80
6.2.2.3.2. Speed Enrichment ....................................................................................... 80
6.2.2.4. Flowrate determination and internal cell count controls .................................... 80
6.2.2.5. Staining procedures ........................................................................................... 80
6.2.2.5.1. Staining for antigen-specific T cells ............................................................. 81
6.2.2.5.2. Antibody staining of cell surface markers .................................................... 81
6.2.2.5.3. Intracellular antibody staining ...................................................................... 81
6.3. Immunochemical methods .......................................................................... 81
6.3.1. Western Blotting ......................................................................................... 81
6.3.2. Limulus Amebocyte Lysate (LAL) test ......................................................... 82
6.4. Molecular biology ......................................................................................... 82
6.4.1. RNA isolation .............................................................................................. 82
6.4.2. MicroArray and data analysis ...................................................................... 83
6.5. Assays for cell function ............................................................................... 84
6.5.1. Survival and Apoptosis ............................................................................... 84
6.5.2. Migration..................................................................................................... 84
6.5.3. Proliferation - Mixed lymphocyte reaction ................................................... 84
6.5.4. Antigen-specific killing ................................................................................ 85
7. Supplementary data ................................................................................. 86
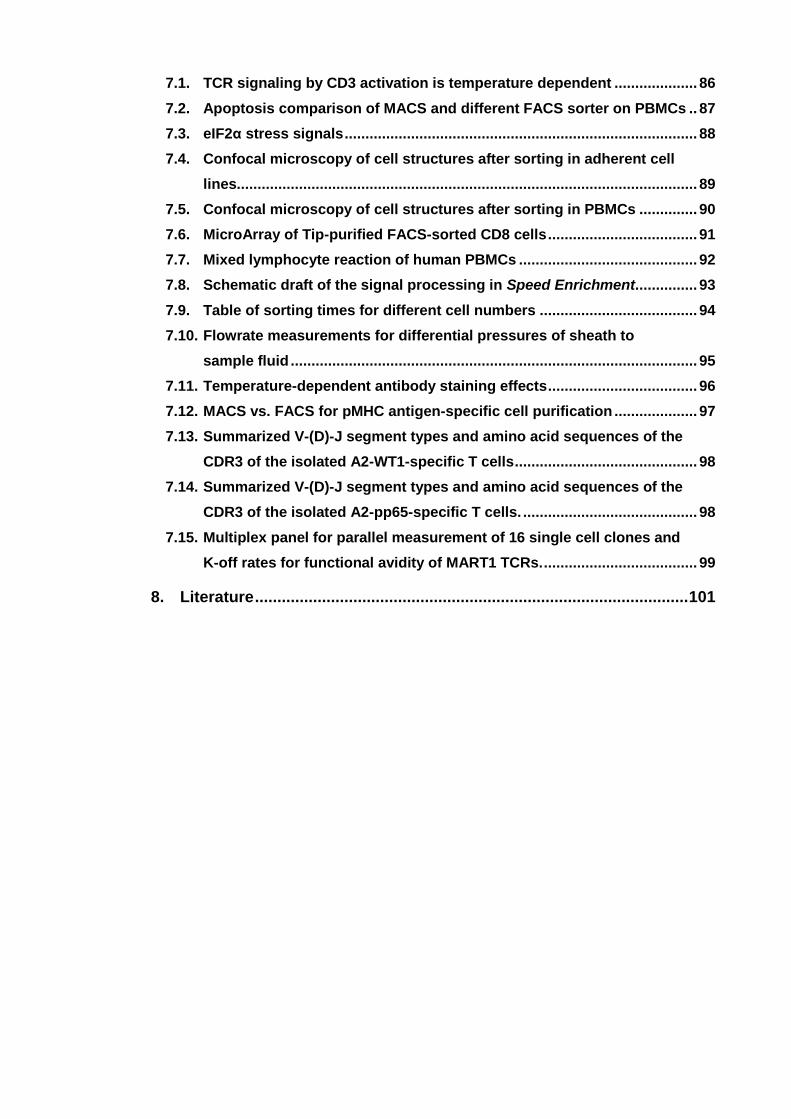
7.1. TCR signaling by CD3 activation is temperature dependent .................... 86
7.2. Apoptosis comparison of MACS and different FACS sorter on PBMCs .. 87
7.3. eIF2α stress signals ..................................................................................... 88
7.4. Confocal microscopy of cell structures after sorting in adherent cell
lines............................................................................................................... 89
7.5. Confocal microscopy of cell structures after sorting in PBMCs .............. 90
7.6. MicroArray of Tip-purified FACS-sorted CD8 cells .................................... 91
7.7. Mixed lymphocyte reaction of human PBMCs ........................................... 92
7.8. Schematic draft of the signal processing in Speed Enrichment............... 93
7.9. Table of sorting times for different cell numbers ...................................... 94
7.10. Flowrate measurements for differential pressures of sheath to
sample fluid .................................................................................................. 95
7.11. Temperature-dependent antibody staining effects .................................... 96
7.12. MACS vs. FACS for pMHC antigen-specific cell purification .................... 97
7.13. Summarized V-(D)-J segment types and amino acid sequences of the
CDR3 of the isolated A2-WT1-specific T cells ............................................ 98
7.14. Summarized V-(D)-J segment types and amino acid sequences of the
CDR3 of the isolated A2-pp65-specific T cells. .......................................... 98
7.15. Multiplex panel for parallel measurement of 16 single cell clones and
K-off rates for functional avidity of MART1 TCRs. ..................................... 99
8. Literature ................................................................................................. 101
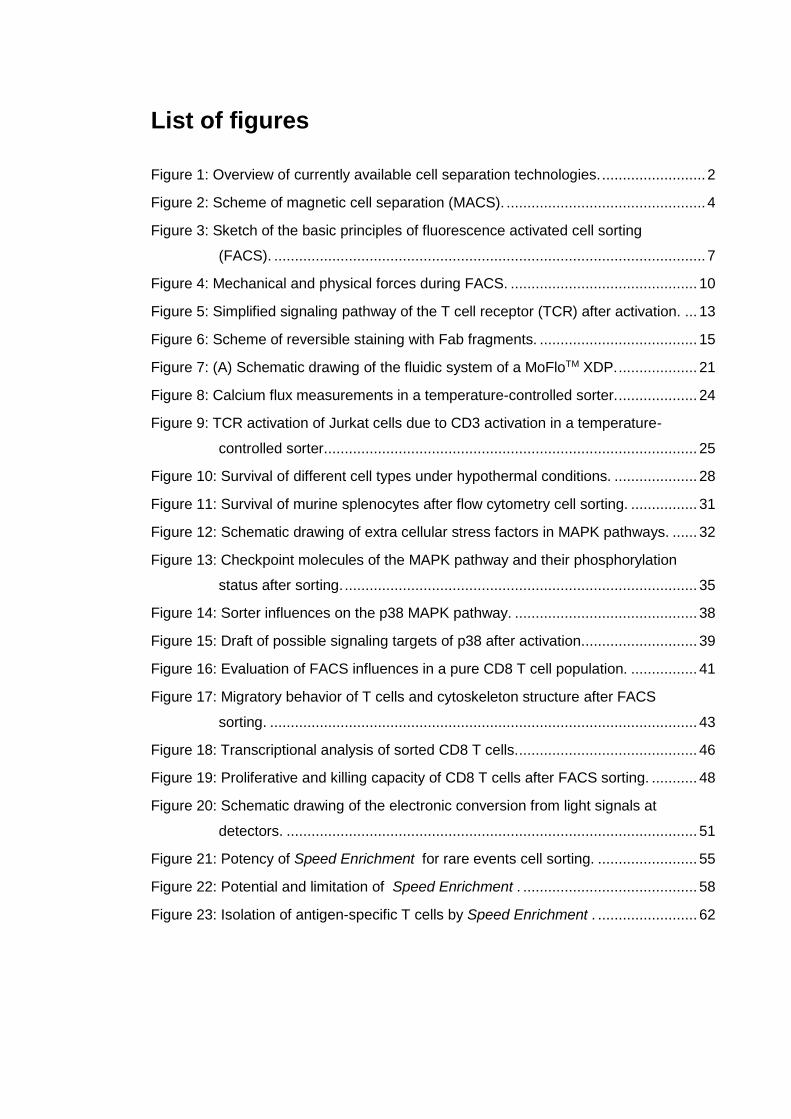
List of figures
Figure 1: Overview of currently available cell separation technologies. ......................... 2
Figure 2: Scheme of magnetic cell separation (MACS). ................................................ 4
Figure 3: Sketch of the basic principles of fluorescence activated cell sorting
(FACS). ........................................................................................................ 7
Figure 4: Mechanical and physical forces during FACS. ............................................. 10
Figure 5: Simplified signaling pathway of the T cell receptor (TCR) after activation. ... 13
Figure 6: Scheme of reversible staining with Fab fragments. ...................................... 15
Figure 7: (A) Schematic drawing of the fluidic system of a MoFloTM XDP. ................... 21
Figure 8: Calcium flux measurements in a temperature-controlled sorter. ................... 24
Figure 9: TCR activation of Jurkat cells due to CD3 activation in a temperature-
controlled sorter. ......................................................................................... 25
Figure 10: Survival of different cell types under hypothermal conditions. .................... 28
Figure 11: Survival of murine splenocytes after flow cytometry cell sorting. ................ 31
Figure 12: Schematic drawing of extra cellular stress factors in MAPK pathways. ...... 32
Figure 13: Checkpoint molecules of the MAPK pathway and their phosphorylation
status after sorting. ..................................................................................... 35
Figure 14: Sorter influences on the p38 MAPK pathway. ............................................ 38
Figure 15: Draft of possible signaling targets of p38 after activation............................ 39
Figure 16: Evaluation of FACS influences in a pure CD8 T cell population. ................ 41
Figure 17: Migratory behavior of T cells and cytoskeleton structure after FACS
sorting. ....................................................................................................... 43
Figure 18: Transcriptional analysis of sorted CD8 T cells. ........................................... 46
Figure 19: Proliferative and killing capacity of CD8 T cells after FACS sorting. ........... 48
Figure 20: Schematic drawing of the electronic conversion from light signals at
detectors. ................................................................................................... 51
Figure 21: Potency of Speed Enrichment for rare events cell sorting. ........................ 55
Figure 22: Potential and limitation of Speed Enrichment . .......................................... 58
Figure 23: Isolation of antigen-specific T cells by Speed Enrichment . ........................ 62
Supplementary Figure 1: Immunoblot of intracellular phospho-signaling after TCR
stimulation. ...................................................................... 86
Supplementary Figure 2: Two day apoptotic marker time course with MACS and
FACS sorted PBMCs. ...................................................... 87
Supplementary Figure 3: FACS and temperature influence on eIF2α. ...................... 88
Supplementary Figure 4: Confocal microscopy of cell structure proteins of
adherent cell lines. ........................................................... 89
Supplementary Figure 5: Confocal microscopy of cell structure proteins of human
PBMCs. ........................................................................... 90
Supplementary Figure 6: Heatmap of mRNA from Fab-TACS®-purified human
CD8 cells unsorted and “mock” sorted. ............................ 91
Supplementary Figure 7: Proliferation of human PBMCs a mixed lymphocyte
reaction (MLR). ................................................................ 92
Supplementary Figure 8: Schematic draft of event detection for fluorescence
triggering and Speed Enrichment sorting. ....................... 93
Supplementary Figure 9: Table of calculated sort time for human PBMCs. ............... 94
Supplementary Figure 10: Graph for evaluated sample flowrates in a MoFlo XDP. .... 95
Supplementary Figure 11: Temperature influence for antibody staining (in
collaboration with Barbara Teufelhardt and Hanna
Ulrich). ............................................................................. 96
Supplementary Figure 12: Speed Enrichment and MACS comparison for the
enrichment of antigen-specific T cells (in collaboration
with Laia Pascual Ponce). ............................................... 97
Table of abbreviations
CAR Chimeric antigen receptor
MSC Mesenchymal Stem Cell
CD Cluster of Differentiation
RQI RNA Quality Indicator
DNase Desoxiribonuclease
ECL Enhanced Chemiluminescence
HRP Horseradish Peroxidase
BSA Bovine Serum Albumin
o.N. Over night
PenStrep Penicillin and Streptomycin
SDS-PAGE Sodium Dodecyl Sulfate PolyacrylAmide Gel Electrophoresis
GvHD Graft versus Host Disease
CCR7 C-C chemokine receptor 7
INF Interferon
IL Interleukin
E:T ratio Effector to Target ratio
SEM structural equation modeling
Hz Herz
EPS Events per Second
MHC I Major Histocompatibility Complex I
TC-beads TrueCount-beads
WT1 Wilms Tumor antigen 1
HLA Human Leucocyte Antigen
FluMP Flu Membrane Protein
MLR Mixed Lymphocyte Reaction
Th 1/17 T helper cell Typ 1/17
CMV Cytomegalovirus
MART1 Melanoma antigen recognized by T cells 1
pp65 phosphoprotein molecular weight 65
GMP Good Manufacturing Practice
MACS Magnetically cell sorting
FACS Fluorescence activated cell sorting
PMT Photomultiplier Tube
DNA deoxyribonucleic acid
GFP Green fluorescence protein
PI Propidium Iodide
e.g. Lat.: Exempli gratia “for example”
POI Point of interrogation
TCR T cell receptor
FSC Forward scatter
SSC Sideward scatter
kHz Kilo Herz
RPMI-1640 Roswell Park Memorial Institute-1640 (medium)
mRNA Messenger ribonucleic acid
snRNA Small nuclear ribonucleic acid
D-Biotin Desthiobiotin
Fc Fragment crystallizable
Fab Fragment antigen binding
ITAMs Immunoreceptor tyrosine-based activation motif
EDTA Ethylenediaminetetraacetic acid
PBS Phosphate Buffered Saline
MAPK mitogen-activated protein kinase
psi Pound force per square inch
mW milli Watt
UV UltraViolet
hPBMCs Human peripheral blood mononuclear cell
ACT Tris-Buffered Ammonium Chloride
FCS Fetal calf serum
JNK (SAPK) C-Jun-N-terminal kinase (stress activated protein kinase)
FITC Fluorescein isothiocyanate
PE Phycoerythrin
PETxR Phycoerythrin TexasRed
PECy5/7 Phycoerythrin cyanin 5/7
BV421/650 Brilliant Violet 421/650
PB Pacific Blue
eF450 eFluor
APC Allophycocyanin
Erk extracellular signal-regulated kinases
EGFR Epidermal Growth Factor Receptor
PD-1 Programmed cell death protein 1
CTLA-4 cytotoxic T-lymphocyte-associated Protein 4
FasR first apoptosis signal receptor
ZAP-70 Zeta-chain-associated protein kinase 70
LAT Linker of Activated T cells
7AAD Aminoactinomycin D
PS Phosphatidyserine
EMA Ethidium Monoazide
SE Speed Enrichment
CREM cAMP Responsive Element Modulator
TNFAIP3 TNF Alpha-Induced Protein 3
CML X-C Motif Chemokine Ligand 1
AP-1 Activator protein 1
NF-AT nuclear factor of activated T cells
Okt3 Muromonab- CD3 Orthoclone
NT5C3 5´-Nucleotidase, Cytosolic IIIA
C2 Complement component 2
RNVU1-3 RNA Variant U1 Small Nuclear 1, 2 and 3
cAMP Cyclic adenosine monophosphate
TNF Tumor necrosis factor
LPS lipopolysacchrides

List of tables
Table 1: Temperature screening of the sheath fluid in a fully controlled system. ......... 22
Abstract
Cells evolved a signaling machinery constantly sensing their environment intra- and
extracellular to react to certain stimuli and changes. Flow cytometry cell sorting relies on
mechanical and physical forces to separate cells and needs in many cases elaborate
sample prearrangements. In this thesis we evaluate cellular behavior to certain forces
occurring in the course of flow cytometry cell sorting and highlight caveats in sample
preparation processes. Further on we show opportunities to minimize potential cell
alterations by new technological developments with reversible reagents. We developed
a cell sorter under complete temperature control to assure constant cell hibernation
during sorting when using reversible reagents.
From our results we conclude that primary cells like mononucleated cells from peripheral
blood can be processed and FACS sorted minimally affected. More sensitive cell culture
cells need short preparation times or higher temperature not to be damaged by cold
stress responses. However cell stress signaling molecules like mitogen activated protein
kinases (MAPK) sense flow cytometry cell sorting by phosphorylation, even at low
temperatures. Especially the p38 MAPK pathway showed mechanical or physical FACS
force susceptibility. We therefore evaluated the different forces one after the other to
identify responsible inducers. The p38 activation was early on activated, not by pressure,
but by shear stress and/or acceleration, as these forces are not discernable. Other forces
did not stack appreciable.
We therefore surveyed p38 associated cell functions in PBMCs and CD8 positive T-cells
after sorting. We found only little changes in mRNA, survival, proliferation, migration and
organization of the cytoskeleton. The data indicate, that FACS sorting is sensed by the
cellular machinery but the stimulus seem insufficient in promoting cellular stress
responses.
These findings in mind we propagated a method to overcome time issues and cell
number based drawbacks by flow cytometry cell sorting, to further improve this superior
purification method. By triggering on fluorescence channels, which identify certain target
populations, we adjusted threshold detection levels above intrinsic fluorescence to
process only information of the target cell population calling this method “Speed
Enrichment”. This enabled us in enriching very small cell populations (1:106) by flow
cytometry and processing incredibly high sample numbers (>109) with high flowrates
(>106 eps) in short time (1 hour). We used this method to enrich naïve antigen specific T
cells, NK cells, plasmacitoidic dentritic cells (pDCs) and haematopoietic stem cells.
Kurzzusammenfassung
Zellen entwickelten evolutionär komplexe Signalkaskaden, welche stetig die Umwelt
überprüfen auf sowohl intra- wie auch extrazelluläre Änderungen, um schnell und
angemessen reagieren zu können. Die Durchflusszytometrische Zellsortierung benötigt
aufwendige Probenvorbereitungen und ist abhängig von mechanischen und
physikalischen Kräften um Zellen aufreinigen zu können. Deshalb wenden wir uns in
dieser Arbeit der Frage zu ob sich Zellen aufgrund dieser Kräfte verändern und ob durch
Vorsichtsmassnahmen in der Probenvorbereitung und Zellsortierung Veränderungen
abgewendet werden können, sowie neue alternative Technologien, wie die reversiblen
Reagenzien, die Zellveränderungen minimieren können. Da niedrige Temperaturen die
Zellen in eine Art Winterschlaf versetzen können sind so minimalveränderte Färbungen
mit reversiblen Reagenzien beispielsweise möglich. Dies animierte uns auch ein
temperaturkonstantes Zellsortiergerät zu entwickeln, welches diesen Winterschlaf
während des gesamten Sortierprozesses aufrecht erhält. Wir fanden, dass eine
Sortierung primärer einkerniger Zellen aus dem pripheren Blut (PBMC) minimal
Zellveränderungen auslöste, jedoch sensitive Zellkulturlinien Kältestressreaktionen
zeigten, wenn die Verarbeitungszeit zu lange war oder die Arbeitstemperaturen zu
niedrig gewählt wurden. Ungeachtet unserer Temperatureinflüsse zeigten MAP Kinase
Wege eine Aktivierung durch Zellsortierung allein. Speziell die p38 MAPK zeigte eine
Phosphorylierung durch mechanische und physikalische Zellsortierungskräfte. Um die
verantwortlichen Kräfte zu identifizieren, nahmen wir eine Kraft nach der anderen aus
der Gleichung. Am Ende konnten Scherkräfte und die Beschleunigung als erste Kräfte
dieser Aktivierung ausgemacht werden, welche jedoch für die Zellsortierung unerlässlich
und unvermeidbar sind. Einflüsse anderer Kräfte konnten die p38 Aktivierung nicht
maßgeblich verstärken. Als wir herausfinden wollten ob Zellen durch diese Aktivierung
verändert werden nutzen wir reine CD8+ Zellen oder PBMC Proben, da diese mit
Methoden angereichert wurden die die Zellen initial nicht veränderten für die
nachfolgenden Untersuchungen. In diesen Proben fanden wir nur geringe
Veränderungen im Migrationsverhalten, Zellüberleben, Proliferation, Organisation des
Zytoskeletts oder Ihrer mRNA Expression. Was darauf hindeutete, dass Zellen die
Sortierung zwar durch die zellulären Signalkaskaden bemerken, der Stimulus jedoch
nicht stark genug scheint um Zellveränderungen dauerhaft auszulösen. Mit diesem
Befund, dass Durchflusszytometrische Zellsortierung eine sehr valide und schonende
Methode der Zellaufreinigung ist, versuchten wir beständige Probleme in der FACS
basierten Zellaufreinigung wie Probenmenge und zeitraubende langzeit Analysen zu
addressieren. Dies erreichten wir indem die Signalerkennung in den Geräten auf einen
Fluoreszenzkanal gelegt wurde, welcher die Zielpopulation genau definierte, und durch

Adjustierung eines Grenzwertes in der Signalerkennung der überhalb der intrinsischen
Zellfluoreszenz lag konnten unmarkierte Zellen ausgeblendet werden. Diese Methode
wurde “Speed Enrichment” genannt und ermöglichte es uns sehr seltene (1:106) und
kleine Zellpopulationen, aus sehr grossem Ausgangsmaterial (109) mit hohen Flussraten
(>106 eps), anzureichern. Damit wurden unterschiedliche Zellpopulationen wie naïve T
Zellen, NK Zellen, Plasmacytiode dentitische Zellen und Hämatopetische Zellen
angreichert für nachfolgende Anwendungen und Experimente.
1
1. Introduction
1.1. Cell separation methods
Cell separation for life science applications is a common tool in basic research (e.g.
single cell or rare event analysis), as well as a fundamental pillar in clinical cell-based
therapies (e.g. stem cell transplantations, cell-based cancer therapies, infectious or
autoimmune diseases). The separation of heterogeneous samples into defined
subpopulations helps to evaluate the function of individual cell types in in vitro and in in
vivo studies 1-3. For clinical applications, cell purification entails the potential for more
predictable therapeutic efficacy, as well as the reduction or elimination of side effects of
treatment 4. Nowadays, different options and technologies to purify homogeneous cell
material for users’ exist. These technologies can be best distinguished by different
methodological principles: adherence, density, microfluidics and/or antibody binding 5.
2
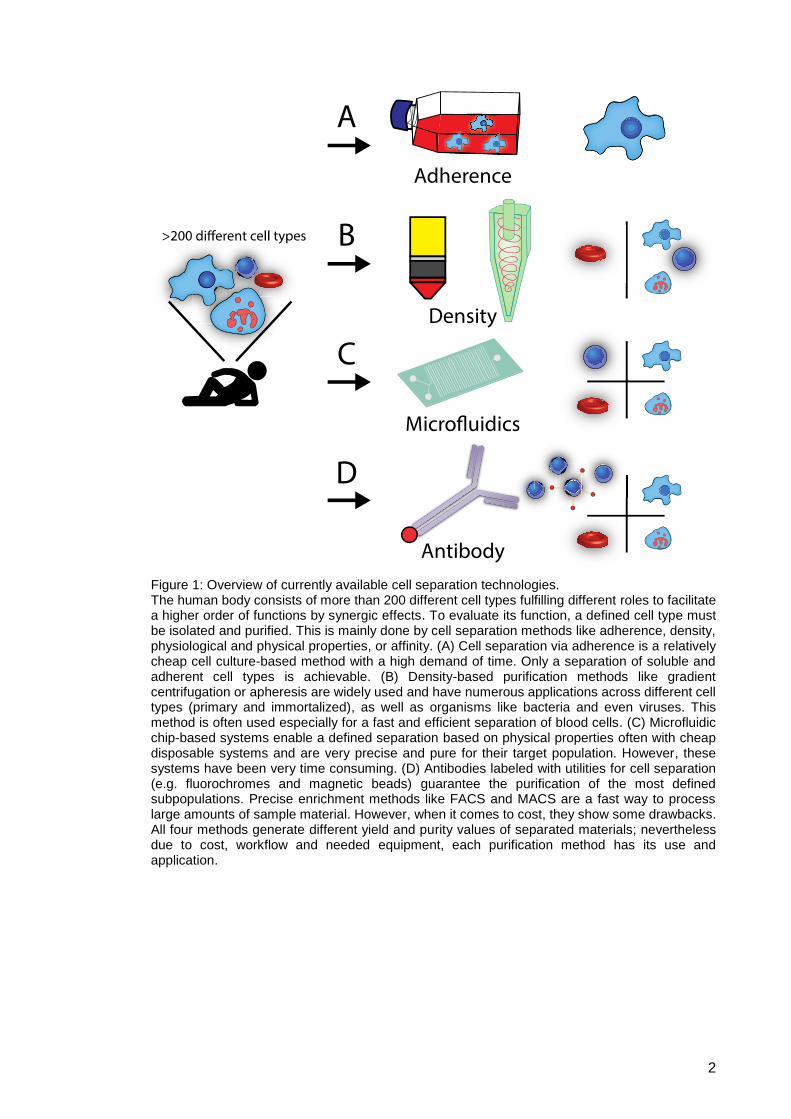
Figure 1: Overview of currently available cell separation technologies. The human body consists of more than 200 different cell types fulfilling different roles to facilitate a higher order of functions by synergic effects. To evaluate its function, a defined cell type must be isolated and purified. This is mainly done by cell separation methods like adherence, density, physiological and physical properties, or affinity. (A) Cell separation via adherence is a relatively cheap cell culture-based method with a high demand of time. Only a separation of soluble and adherent cell types is achievable. (B) Density-based purification methods like gradient centrifugation or apheresis are widely used and have numerous applications across different cell types (primary and immortalized), as well as organisms like bacteria and even viruses. This method is often used especially for a fast and efficient separation of blood cells. (C) Microfluidic chip-based systems enable a defined separation based on physical properties often with cheap disposable systems and are very precise and pure for their target population. However, these systems have been very time consuming. (D) Antibodies labeled with utilities for cell separation (e.g. fluorochromes and magnetic beads) guarantee the purification of the most defined subpopulations. Precise enrichment methods like FACS and MACS are a fast way to process large amounts of sample material. However, when it comes to cost, they show some drawbacks. All four methods generate different yield and purity values of separated materials; nevertheless due to cost, workflow and needed equipment, each purification method has its use and application.
3
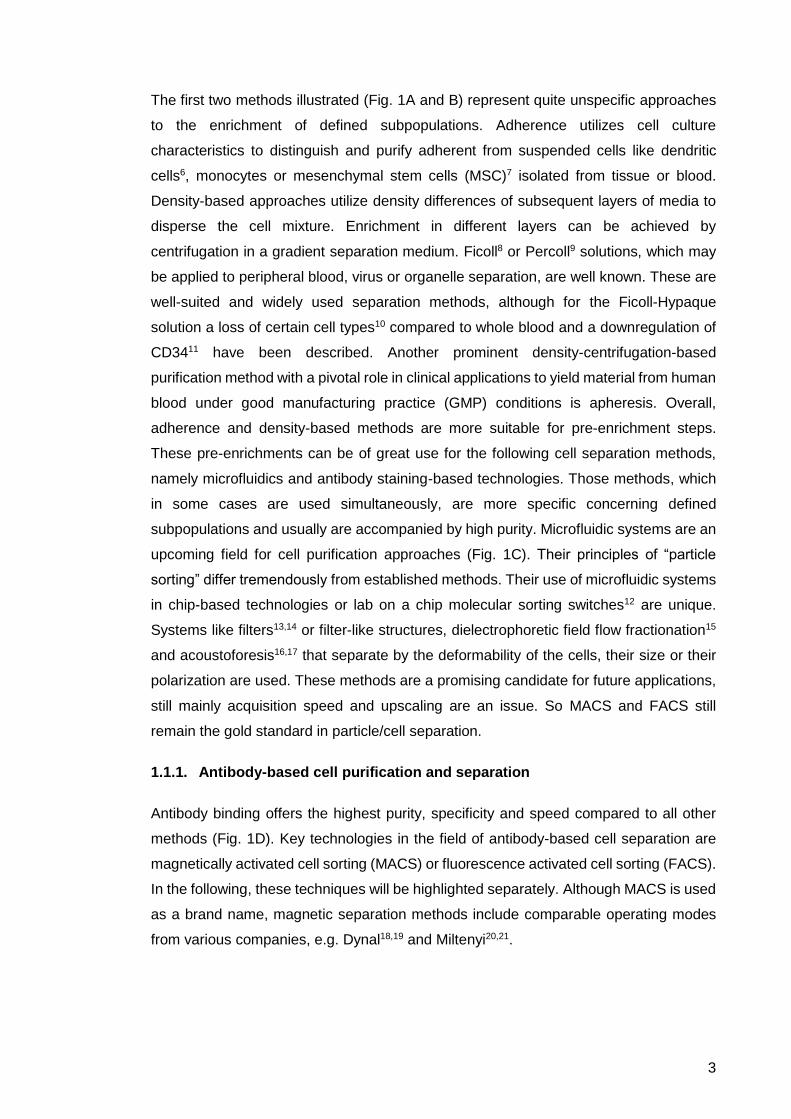
The first two methods illustrated (Fig. 1A and B) represent quite unspecific approaches
to the enrichment of defined subpopulations. Adherence utilizes cell culture
characteristics to distinguish and purify adherent from suspended cells like dendritic
cells6, monocytes or mesenchymal stem cells (MSC)7 isolated from tissue or blood.
Density-based approaches utilize density differences of subsequent layers of media to
disperse the cell mixture. Enrichment in different layers can be achieved by
centrifugation in a gradient separation medium. Ficoll8 or Percoll9 solutions, which may
be applied to peripheral blood, virus or organelle separation, are well known. These are
well-suited and widely used separation methods, although for the Ficoll-Hypaque
solution a loss of certain cell types10 compared to whole blood and a downregulation of
CD3411 have been described. Another prominent density-centrifugation-based
purification method with a pivotal role in clinical applications to yield material from human
blood under good manufacturing practice (GMP) conditions is apheresis. Overall,
adherence and density-based methods are more suitable for pre-enrichment steps.
These pre-enrichments can be of great use for the following cell separation methods,
namely microfluidics and antibody staining-based technologies. Those methods, which
in some cases are used simultaneously, are more specific concerning defined
subpopulations and usually are accompanied by high purity. Microfluidic systems are an
upcoming field for cell purification approaches (Fig. 1C). Their principles of “particle
sorting” differ tremendously from established methods. Their use of microfluidic systems
in chip-based technologies or lab on a chip molecular sorting switches12 are unique.
Systems like filters13,14 or filter-like structures, dielectrophoretic field flow fractionation15
and acoustoforesis16,17 that separate by the deformability of the cells, their size or their
polarization are used. These methods are a promising candidate for future applications,
still mainly acquisition speed and upscaling are an issue. So MACS and FACS still
remain the gold standard in particle/cell separation.
1.1.1. Antibody-based cell purification and separation
Antibody binding offers the highest purity, specificity and speed compared to all other
methods (Fig. 1D). Key technologies in the field of antibody-based cell separation are
magnetically activated cell sorting (MACS) or fluorescence activated cell sorting (FACS).
In the following, these techniques will be highlighted separately. Although MACS is used
as a brand name, magnetic separation methods include comparable operating modes
from various companies, e.g. Dynal18,19 and Miltenyi20,21.
4
1.1.2. Magnetically Activated Cell Sorting
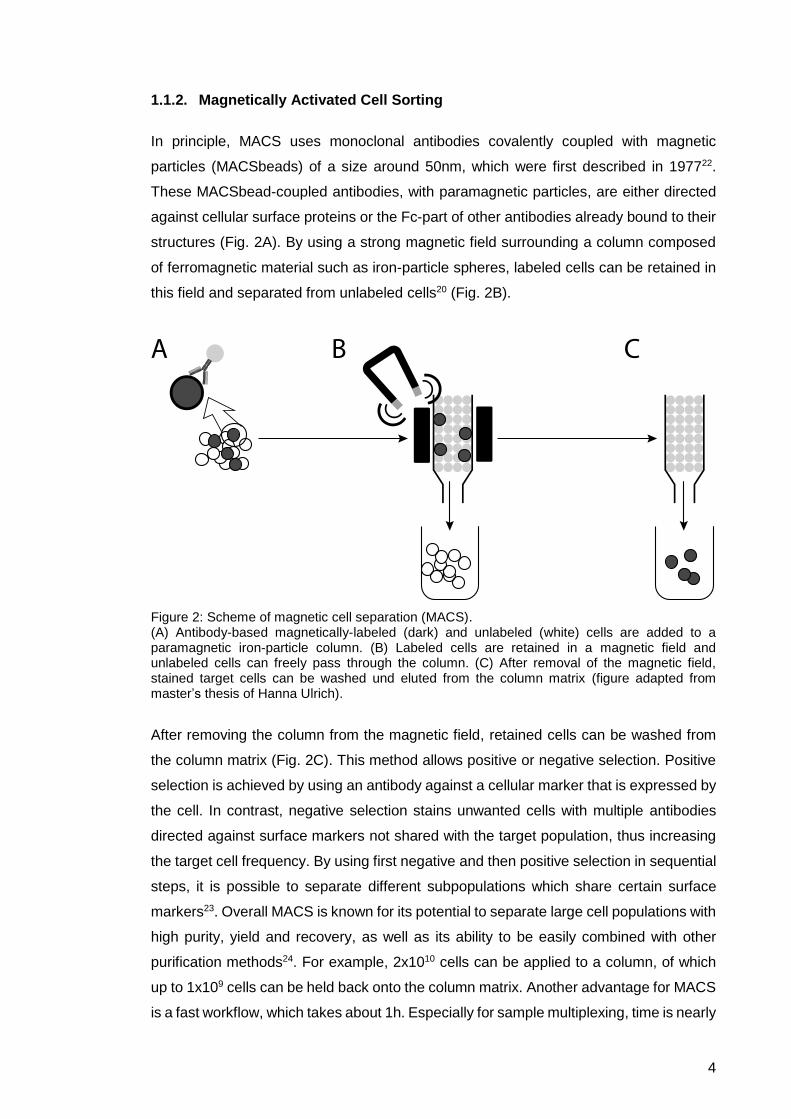
In principle, MACS uses monoclonal antibodies covalently coupled with magnetic
particles (MACSbeads) of a size around 50nm, which were first described in 197722.
These MACSbead-coupled antibodies, with paramagnetic particles, are either directed
against cellular surface proteins or the Fc-part of other antibodies already bound to their
structures (Fig. 2A). By using a strong magnetic field surrounding a column composed
of ferromagnetic material such as iron-particle spheres, labeled cells can be retained in
this field and separated from unlabeled cells20 (Fig. 2B).
Figure 2: Scheme of magnetic cell separation (MACS). (A) Antibody-based magnetically-labeled (dark) and unlabeled (white) cells are added to a paramagnetic iron-particle column. (B) Labeled cells are retained in a magnetic field and unlabeled cells can freely pass through the column. (C) After removal of the magnetic field, stained target cells can be washed und eluted from the column matrix (figure adapted from master’s thesis of Hanna Ulrich).
After removing the column from the magnetic field, retained cells can be washed from
the column matrix (Fig. 2C). This method allows positive or negative selection. Positive
selection is achieved by using an antibody against a cellular marker that is expressed by
the cell. In contrast, negative selection stains unwanted cells with multiple antibodies
directed against surface markers not shared with the target population, thus increasing
the target cell frequency. By using first negative and then positive selection in sequential
steps, it is possible to separate different subpopulations which share certain surface
markers23. Overall MACS is known for its potential to separate large cell populations with
high purity, yield and recovery, as well as its ability to be easily combined with other
purification methods24. For example, 2x10¹⁰ cells can be applied to a column, of which
up to 1x10⁹ cells can be held back onto the column matrix. Another advantage for MACS
is a fast workflow, which takes about 1h. Especially for sample multiplexing, time is nearly
5
constant whether 1 or 10 samples have to be processed. MACS and other magnetic
bead-based purification methods have already been used for various clinical
applications25-27. Although mostly used for the depletion of certain cell types by negative
selection approaches, positive selection is also possible even under GMP conditions with
the CliniMACS system. However, MACS has some drawbacks when isolating cell
populations defined by multiple surface markers. Here another technology offers multi-
parameter single cell resolution and purification.
1.1.3. Fluorescence Activated Cell Sorting
The commonly used abbreviation FACS for fluorescence activated cell sorting, generally
accepted in the field to describe a separation of cells by a deflected fluid stream, is a
trademark of one specific company. The term FACS is used hereafter independently of
a specific company, although it is worth mentioning that the correct nomenclature is flow
cytometry cell sorting.
FACS evolved from the technology of ink-printing, the deflection of a charged fluid stream
developed at Stanford University28, and the Coulter counter29, which counted single
aligned cells in a fluid stream generating electronic signals by their size. The
development of fluorescence-based microscopy and particle counting30 also had some
influence. Various people helped develop this technology, directing it to life science
purposes. In 1969, a group of immunologists at Stanford University under the leadership
of Leonard Herzenberg started to combine the counting of cells and deflection of droplets
in an electromagnetic field (Coulter Counter) with a mercury lamp as light source to gain
additional cell information for discrimination via photomultiplier tube (PMT) detectors31-
33. In the following decades there was a continued evolution of FACS instruments, so
that by the 1990s the basic methods of fluidic systems and optical layout remained
largely unchanged, while the electronic and software was steadily improved, which led
to faster and higher cell acquisition rates. Nowadays instruments continue to advance,
changing and improving the traditional systems of fluidics as well as optics. Examples
are the AttuneTM, with its acoustic focusing and the spectral analyzer SP680034, which
uses a novel optical approach. These upcoming technologies are still under
development. Today it is still necessary to use hydrodynamic focusing and up to 7 laser
offsets, in different stages with up to 6 PMTs per laser to attain signals of up to 18
different fluorophores in modern multicolor panels35. FACS allows the determination and
characterization of cells by their size, granularity, surface proteins and intracellular
components like DNA or cytoplasmic proteins36. In most cases, this determination is
based on fluorescent dyes which can be expressed by the cell itself in the form of
fluorescent proteins37 (e.g. GFP by transduction with viral vectors), covalently bound or
6
integrated into cellular structures38-40 (e.g. DNA binding dyes Hoechst and propidium
iodide), or dyes covalently bound to monoclonal or polyclonal antibodies41 which then
recognize specific antigen targets. FACS can be used for sorting bacteria, cells and
cellular compartments (e.g. mitochondria), even particles or viruses42 – limited only to
the solubility in aqueous buffers, their size and the physical detectability by laser light
(fluorescence or scattering). As a rule of thumb, 20% of the nozzle size diameter is
achievable in FACS sorting, which limits particles to a size of around max. 80 µm using
a 400 µm nozzle. This type of cell separation is based on the following basic principles:
I. Hydrodynamic focusing
II. Gathering the particle’s information at the “Point of Interrogation” (POI) by
light, optics and electronics
III. Droplet generation and deflection
Hydrodynamic focusing is the alignment and focusing of cells in the center of a fluidic
stream generated by an outer laminar flow of sheath fluid43. The cells are stably
transported in the stream and stay aligned in the center when the Reynolds number is
below 2300; above that, a transition from laminar to turbulent flow is generated. The
Reynolds number is defined by the density () of the fluid, the velocity () and diameter
(d) of the stream in respect to the viscosity () of the fluid.
𝑅𝑒 =𝜌 ∗ 𝜐 ∗ 𝑑
𝜂
For FACS, density and viscosity are mainly unchanged, while diameter and velocity
change dependent on the nozzle. This way, when the Reynolds number is kept within
laminar limits, cells pass one after another down the POI like pearls on a string (Fig. 3A).
7
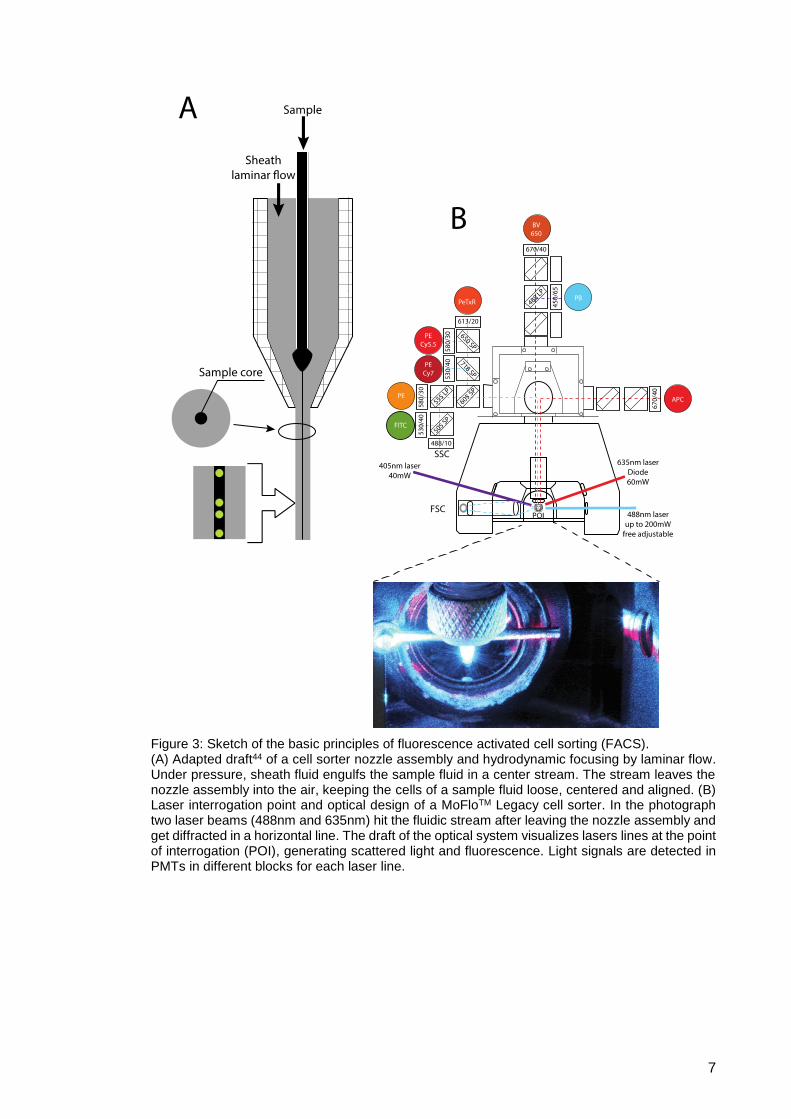
Figure 3: Sketch of the basic principles of fluorescence activated cell sorting (FACS). (A) Adapted draft44 of a cell sorter nozzle assembly and hydrodynamic focusing by laminar flow. Under pressure, sheath fluid engulfs the sample fluid in a center stream. The stream leaves the nozzle assembly into the air, keeping the cells of a sample fluid loose, centered and aligned. (B) Laser interrogation point and optical design of a MoFloTM Legacy cell sorter. In the photograph two laser beams (488nm and 635nm) hit the fluidic stream after leaving the nozzle assembly and get diffracted in a horizontal line. The draft of the optical system visualizes lasers lines at the point of interrogation (POI), generating scattered light and fluorescence. Light signals are detected in PMTs in different blocks for each laser line.
8
At the POI, laser light hits the center of the stream and is diffracted horizontally by the
fluid (Fig. 3B, photograph). This diffraction ring is blocked by bars and is neither detected
as scattered light nor as fluorescence, as it would increase background signals strongly.
Only light scattered or emitted in a certain angle is detected. For forward scatter (FSC),
light is detected in a straight line to the laser with an angle of roughly 4 to 9%, as a
measurement of cell size (Fig. 3B, Graphics). Fluorescence and side scattered (SSC)
light are collected by a lens in a 90° angle to the laser beam, which is seen as the round
object behind the nozzle and stream in the photograph (Fig. 3B). To enable separation
of signals from each laser specifically in their optical blocks, the beams of different lasers
are slightly offset, which can be seen by the different height of diffraction rings of the
488 nm (blue) laser and the 635 nm (red) laser (Fig. 3B, photography). In the optical
block, spectra from different dyes segregate by dichroic filters to specific channels with
bandpass filters, which provide a dye-specific wavelength window (Fig. 3B, graphic). In
these channels, the transformation and amplification of the light signal into electronic
information takes place via photomultiplier tubes (PMT) by photoelectric effect. The
electronic information of the particle is processed, temporarily saved in the cache, and
visually displayed in a software program while the particle continues its way downstream
for sorting. While the sheath fluid stream vibrates constantly at a frequency of about
100 kHz through a piezo element, this leads to droplet formation of the stream with 1x10⁵
drops/sec equal to the adjusted frequency of the piezo element. At a specific time point,
which is kept constant by adjusting the amplitude of the frequency, the droplet
disconnects from the stream; this is generally called “drop delay”. When a particle of
interest is enclosed in that last attached droplet the whole stream is charged. A charged
droplet disconnects from the stream, keeping its charge, while instantly after that the
stream itself is de-charged. The charged, particle-containing droplet is deflected in an
electro-magnetic field between two electrical plates45. Depending on its charge, the
droplet is deflected right or left and collected in a vessel. Overall, cells are separated and
purified at single cell resolution by physical and mechanical effects and forces.
1.2. Cell propagation by sorting
Some of the forces underlying FACS sorting, as well as the sample preparation prior to
sorting, may affect cell phenotypes and cell functionality. The biological status of cells,
their viability, vitality and functionality after a sort are crucial for the value and outcome
of subsequent experiments. So far, few attempts have been made to systematically
evaluate sorting parameters and their influences on the quality of sorted cells46-48.

9
1.2.1. Mechanical forces during FACS sorting
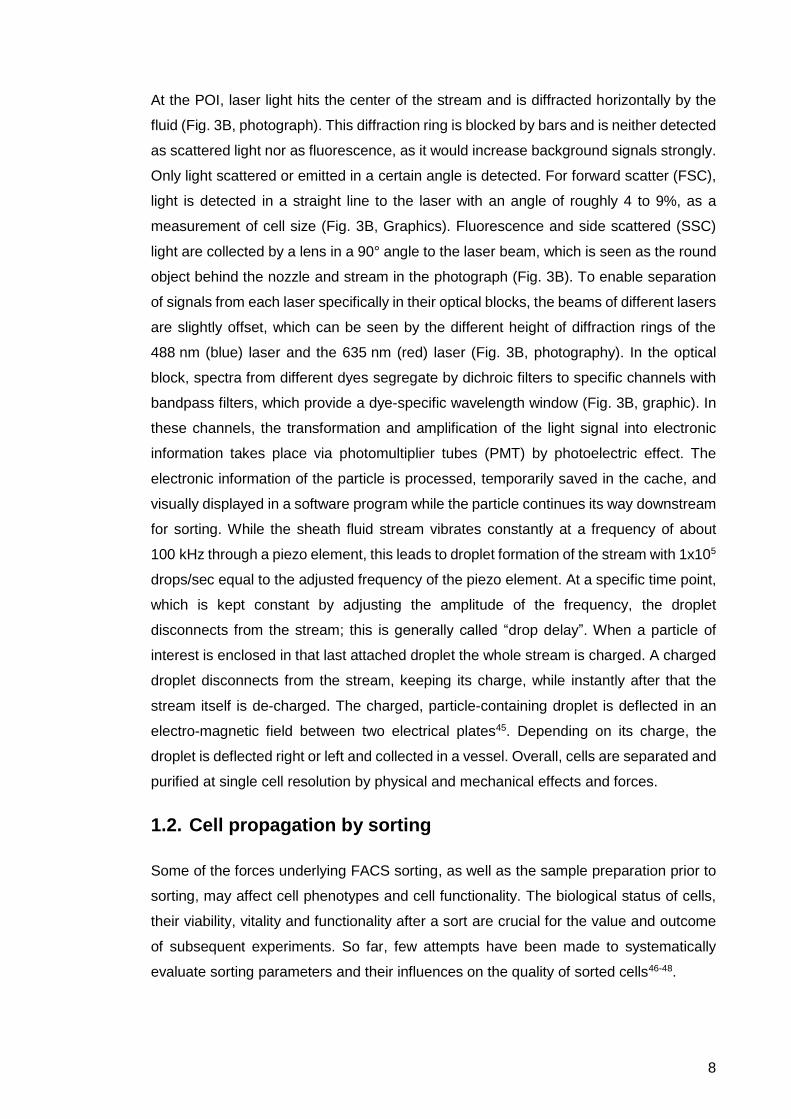
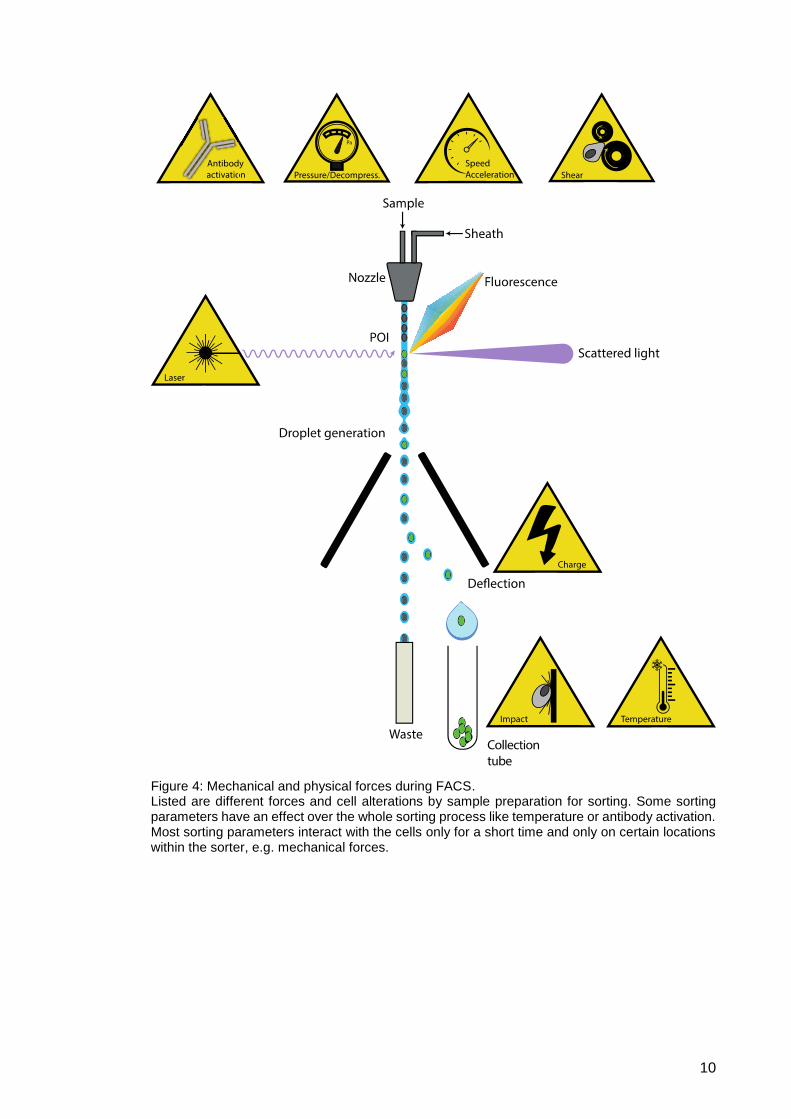
Mechanical, physical and chemical forces (Fig. 4) are needed for FACS. In fact, one
force often brings about another, as for example the pressurized sorting system
generates decompression, shearing and acceleration. The pressurized system is
needed to produce the sheath fluid stream and laminar flow, with pressures ranging from
10 to 100 pounds force per square inch (psi), depending on the nozzle size, which equals
0,7 to 6,9 bar. A 70 µm nozzle with a pressure of 60 psi (4,1 bar) is mainly used,
especially for sorting primary cells isolated from blood. Due to this pressure, sorted
particles accelerate and leave the tip of the nozzle at around 90 km/h, where they are
instantaneously depressurized to atmospheric pressure. In the sample line, particles flow
through narrow tubing with a diameter of 150 µm, potentially generating shearing forces.
In line with this, other groups reported a cellular hyperpolarization of pressure-dependent
ion channels in the inner cells of blood vessels (vascular endothelial cells) due to shear
stress49.
Also crucial for FACS sorting is laser light. High energy laser light is known to harm and
potentially kill cells50, but laser powers in the range of 200 mW which only last split-
seconds during sorting are unlikely to have such effects. UV laser light has already been
in the scientific focus for potential DNA strand ruptures due to sorting, but no damage51
or little alterations46 have been observed. As UV laser light has the greatest potential to
cell damage due to its high energy, this effect seems negligible.
Further down the sorting process, cells of interest are charged, which potentially leads
to activation of voltage-gated ion channels, expressed by all cell types, or a
depolarization of the cell membrane52.
Finally, after the sorting process, the cell in the droplet ends up colliding into a vessel at
90 km/h. Buffer added to the collection tubes before sorting dampens this impact,
providing a cushion. This precaution minimizes the effects of the impact, but involves
potential cell alterations by buffers hereafter explained.
10
Figure 4: Mechanical and physical forces during FACS. Listed are different forces and cell alterations by sample preparation for sorting. Some sorting parameters have an effect over the whole sorting process like temperature or antibody activation. Most sorting parameters interact with the cells only for a short time and only on certain locations within the sorter, e.g. mechanical forces.
11
1.2.2. Potential alterations due to sample preparation
Three main causes can alter cells in the course of cell preparation. First, as already
mentioned, there are potential buffer alterations due to osmosis53-55, pH or mitogens56.
Second, staining with antibodies is known to alter cell physiology and function57, although
this can be minimized by low temperatures. In line with that the temperature is of
importance during preparation, as it can change protein synthesis58 via eIF2α and induce
cell stress signaling59 via MAPK. A temperature influence concerning membrane fluidity
is also described60. Finally, the process of sample preparation bears pitfalls for cell
alteration due to e.g. homogenization61 of donor material or collagenase digestion48 and
anticoagulants like heparin62.
1.2.2.1. Buffer alteration
Phosphate-buffered saline (PBS) solutions, which are also the basis for sheath fluid, are
most commonly used for FACS sorting. This solution is nontoxic for cells, isotonic and
buffered in a pH range comparable to physiological conditions.
Ethylenediaminetetraacetic acid (EDTA) is often added to FACS buffers to prevent cells
from clumping and as a metallic ion catcher (chelating agent). Often 0.5% (m/v) bovine
serum albumin (BSA) is added, reducing cell attachment to surrounding surfaces and
improving viability63. This buffer lacks all sorts of nutrition needed for primary cells of
animal origin, potentially starving cells over longer sort times, which are known to
downregulate and abort protein synthesis64 via the phosphorylation of eIF2α in response
to this stress type65,66. Therefore, fetal calf serum (FCS), the cell-free blood serum of
unborn calves, is often added to apply “optimal” buffer conditions. However, FCS can
induce side effects in cells due to its high content of growth factors. Cells react to these
mitogens especially in their cytokine responses and intracellular MAPK pathways67, e.g.
Erk1/268.
1.2.2.2. Staining alteration
The usage of antibodies presents an especially potent factor for cell alteration in three
different ways. First, the “immunological sensing” of antibodies via Fc-receptors on cell
surfaces can lead to immune responses in cells69. Second, some surface receptors can
be blocked for their ligand via antibody binding like CD2570,71 (clinically relevant with
Daclizumab) or EGFR72. Third, surface molecules can be activated by crosslinking due
to antibody binding, e.g. CD3, CD28, 4-1BB73. Cells may also become exhausted or
driven into cell death. For example surface molecules PD-174, CTLA-4, 4-1BB or FasR
are known to induce those outcomes by crosslinking. Hereafter examples of antibody-
induced alteration and an alternative to minimize these are discussed.
12
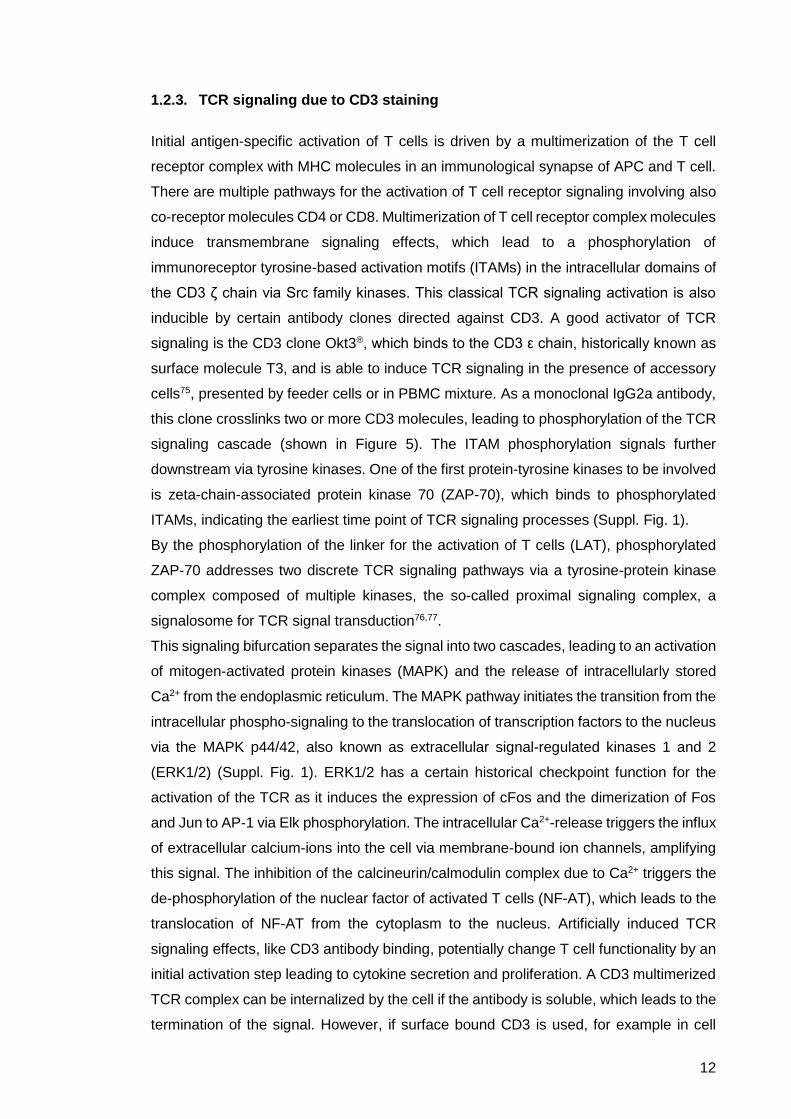
1.2.3. TCR signaling due to CD3 staining
Initial antigen-specific activation of T cells is driven by a multimerization of the T cell
receptor complex with MHC molecules in an immunological synapse of APC and T cell.
There are multiple pathways for the activation of T cell receptor signaling involving also
co-receptor molecules CD4 or CD8. Multimerization of T cell receptor complex molecules
induce transmembrane signaling effects, which lead to a phosphorylation of
immunoreceptor tyrosine-based activation motifs (ITAMs) in the intracellular domains of
the CD3 ζ chain via Src family kinases. This classical TCR signaling activation is also
inducible by certain antibody clones directed against CD3. A good activator of TCR
signaling is the CD3 clone Okt3®, which binds to the CD3 ε chain, historically known as
surface molecule T3, and is able to induce TCR signaling in the presence of accessory
cells75, presented by feeder cells or in PBMC mixture. As a monoclonal IgG2a antibody,
this clone crosslinks two or more CD3 molecules, leading to phosphorylation of the TCR
signaling cascade (shown in Figure 5). The ITAM phosphorylation signals further
downstream via tyrosine kinases. One of the first protein-tyrosine kinases to be involved
is zeta-chain-associated protein kinase 70 (ZAP-70), which binds to phosphorylated
ITAMs, indicating the earliest time point of TCR signaling processes (Suppl. Fig. 1).
By the phosphorylation of the linker for the activation of T cells (LAT), phosphorylated
ZAP-70 addresses two discrete TCR signaling pathways via a tyrosine-protein kinase
complex composed of multiple kinases, the so-called proximal signaling complex, a
signalosome for TCR signal transduction76,77.
This signaling bifurcation separates the signal into two cascades, leading to an activation
of mitogen-activated protein kinases (MAPK) and the release of intracellularly stored
Ca2+ from the endoplasmic reticulum. The MAPK pathway initiates the transition from the
intracellular phospho-signaling to the translocation of transcription factors to the nucleus
via the MAPK p44/42, also known as extracellular signal-regulated kinases 1 and 2
(ERK1/2) (Suppl. Fig. 1). ERK1/2 has a certain historical checkpoint function for the
activation of the TCR as it induces the expression of cFos and the dimerization of Fos
and Jun to AP-1 via Elk phosphorylation. The intracellular Ca2+-release triggers the influx
of extracellular calcium-ions into the cell via membrane-bound ion channels, amplifying
this signal. The inhibition of the calcineurin/calmodulin complex due to Ca2+ triggers the
de-phosphorylation of the nuclear factor of activated T cells (NF-AT), which leads to the
translocation of NF-AT from the cytoplasm to the nucleus. Artificially induced TCR
signaling effects, like CD3 antibody binding, potentially change T cell functionality by an
initial activation step leading to cytokine secretion and proliferation. A CD3 multimerized
TCR complex can be internalized by the cell if the antibody is soluble, which leads to the
termination of the signal. However, if surface bound CD3 is used, for example in cell
13
culture plates, a lasting and sustained TCR signal is induced, leading ultimately to T cell
anergy and cell death. Especially the clinical relevance of Okt3® as the clinical antibody
Muromonab relies on T cell toxic properties.
In many cases, with antibody based purification methods, a CD3 marker staining is
crucial for population differentiation. Nevertheless, after purification, TCR signaling
should preferably be avoided for subsequent experiments.
Figure 5: Simplified signaling pathway of the T cell receptor (TCR) after activation. Certain checkpoints are highlighted, which in the following thesis were measured with different assays, or play a pivotal role in signaling procession and signal bifurcation.
14
There are first efforts to avoid these changes by using reversible antibodies78, but
changes induced by crosslinking can only be avoided by handling cells at low
temperatures around 4°C. This is shown to work properly in the example of multimer
staining79 as the origin of Fab technology. But unpublished data also show a complete
removal of surface Fabs at 4 °C (Fig. 6E) and no downstream TCR signaling at low
temperatures.
1.2.3.1. Antibody-based reversible staining reagents
For a better understanding of the reversible reagent technology, it is important to
elucidate the antibody structure first. Antibody structure can be divided into two major
parts. When antibodies are digested with the enzyme papain, certain fragments remain
(Fig. 6A). The cleavage of papain takes place in the hinge region of the antibody,
generating two antigen-binding fragments (Fab) and one fragment crystallizable region
(Fc). The Fab fragment has a light and heavy chain, each consisting of a domain of their
variable and constant region. Fab fragments have the property to bind their antigen
specifically at their antigen binding site, a 15 to 22 amino acid long sequence composed
of both heavy and light variable chains. A certain binding strength to their antigen is
necessary. The binding strength of an antibody, also referred to as binding affinity (KD),
is increased by the linking of two Fab fragments via the Fc part. Without the Fc part,
Fabs as monomers have a different affinity, potentially enabling dissociation from their
antigen.
15
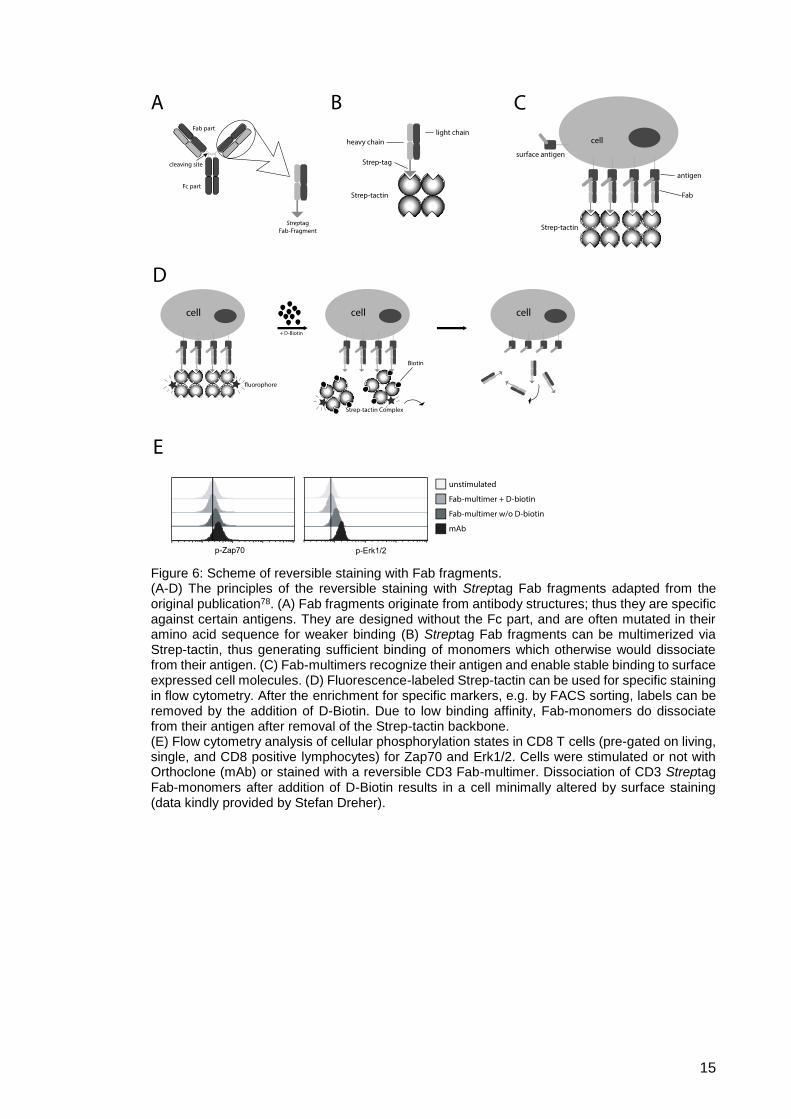
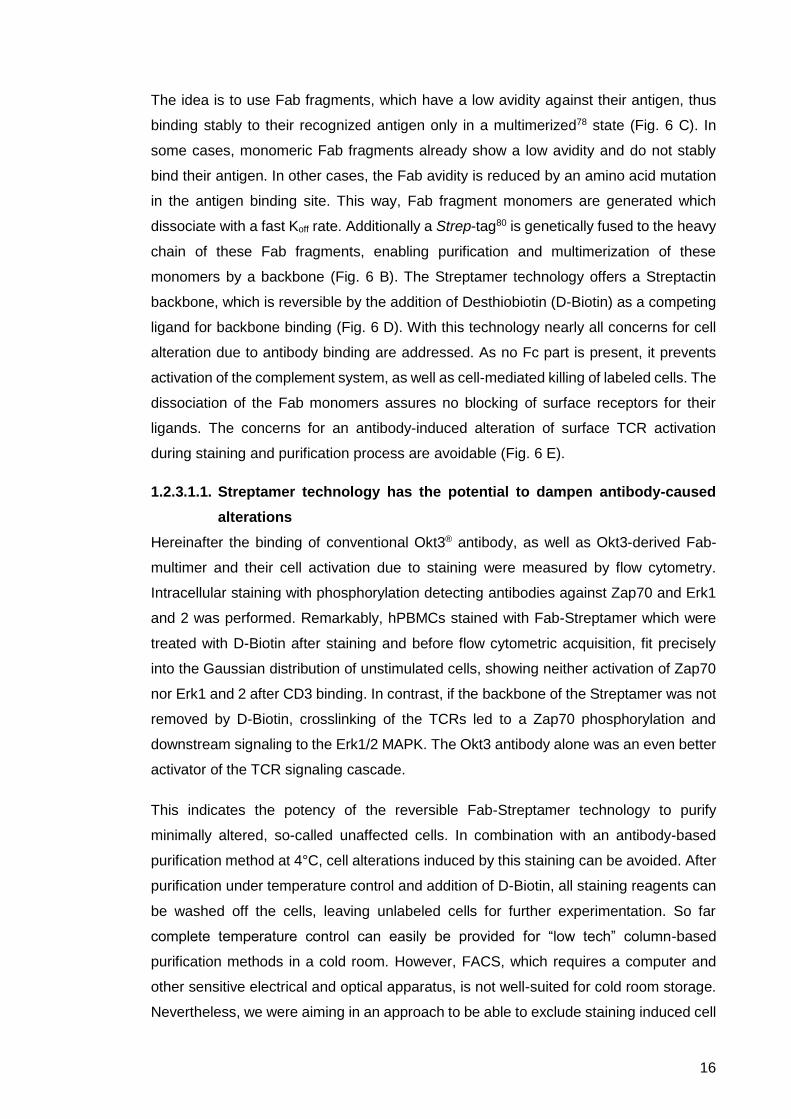
Figure 6: Scheme of reversible staining with Fab fragments. (A-D) The principles of the reversible staining with Streptag Fab fragments adapted from the original publication78. (A) Fab fragments originate from antibody structures; thus they are specific against certain antigens. They are designed without the Fc part, and are often mutated in their amino acid sequence for weaker binding (B) Streptag Fab fragments can be multimerized via Strep-tactin, thus generating sufficient binding of monomers which otherwise would dissociate from their antigen. (C) Fab-multimers recognize their antigen and enable stable binding to surface expressed cell molecules. (D) Fluorescence-labeled Strep-tactin can be used for specific staining in flow cytometry. After the enrichment for specific markers, e.g. by FACS sorting, labels can be removed by the addition of D-Biotin. Due to low binding affinity, Fab-monomers do dissociate from their antigen after removal of the Strep-tactin backbone. (E) Flow cytometry analysis of cellular phosphorylation states in CD8 T cells (pre-gated on living, single, and CD8 positive lymphocytes) for Zap70 and Erk1/2. Cells were stimulated or not with Orthoclone (mAb) or stained with a reversible CD3 Fab-multimer. Dissociation of CD3 Streptag Fab-monomers after addition of D-Biotin results in a cell minimally altered by surface staining (data kindly provided by Stefan Dreher).
16
The idea is to use Fab fragments, which have a low avidity against their antigen, thus
binding stably to their recognized antigen only in a multimerized78 state (Fig. 6 C). In
some cases, monomeric Fab fragments already show a low avidity and do not stably
bind their antigen. In other cases, the Fab avidity is reduced by an amino acid mutation
in the antigen binding site. This way, Fab fragment monomers are generated which
dissociate with a fast Koff rate. Additionally a Strep-tag80 is genetically fused to the heavy
chain of these Fab fragments, enabling purification and multimerization of these
monomers by a backbone (Fig. 6 B). The Streptamer technology offers a Streptactin
backbone, which is reversible by the addition of Desthiobiotin (D-Biotin) as a competing
ligand for backbone binding (Fig. 6 D). With this technology nearly all concerns for cell
alteration due to antibody binding are addressed. As no Fc part is present, it prevents
activation of the complement system, as well as cell-mediated killing of labeled cells. The
dissociation of the Fab monomers assures no blocking of surface receptors for their
ligands. The concerns for an antibody-induced alteration of surface TCR activation
during staining and purification process are avoidable (Fig. 6 E).
1.2.3.1.1. Streptamer technology has the potential to dampen antibody-caused
alterations
Hereinafter the binding of conventional Okt3® antibody, as well as Okt3-derived Fab-
multimer and their cell activation due to staining were measured by flow cytometry.
Intracellular staining with phosphorylation detecting antibodies against Zap70 and Erk1
and 2 was performed. Remarkably, hPBMCs stained with Fab-Streptamer which were
treated with D-Biotin after staining and before flow cytometric acquisition, fit precisely
into the Gaussian distribution of unstimulated cells, showing neither activation of Zap70
nor Erk1 and 2 after CD3 binding. In contrast, if the backbone of the Streptamer was not
removed by D-Biotin, crosslinking of the TCRs led to a Zap70 phosphorylation and
downstream signaling to the Erk1/2 MAPK. The Okt3 antibody alone was an even better
activator of the TCR signaling cascade.
This indicates the potency of the reversible Fab-Streptamer technology to purify
minimally altered, so-called unaffected cells. In combination with an antibody-based
purification method at 4°C, cell alterations induced by this staining can be avoided. After
purification under temperature control and addition of D-Biotin, all staining reagents can
be washed off the cells, leaving unlabeled cells for further experimentation. So far
complete temperature control can easily be provided for “low tech” column-based
purification methods in a cold room. However, FACS, which requires a computer and
other sensitive electrical and optical apparatus, is not well-suited for cold room storage.
Nevertheless, we were aiming in an approach to be able to exclude staining induced cell

17
alteration by fully temperature-controlled FACS sorting, so far to our knowledge
unreported.
18
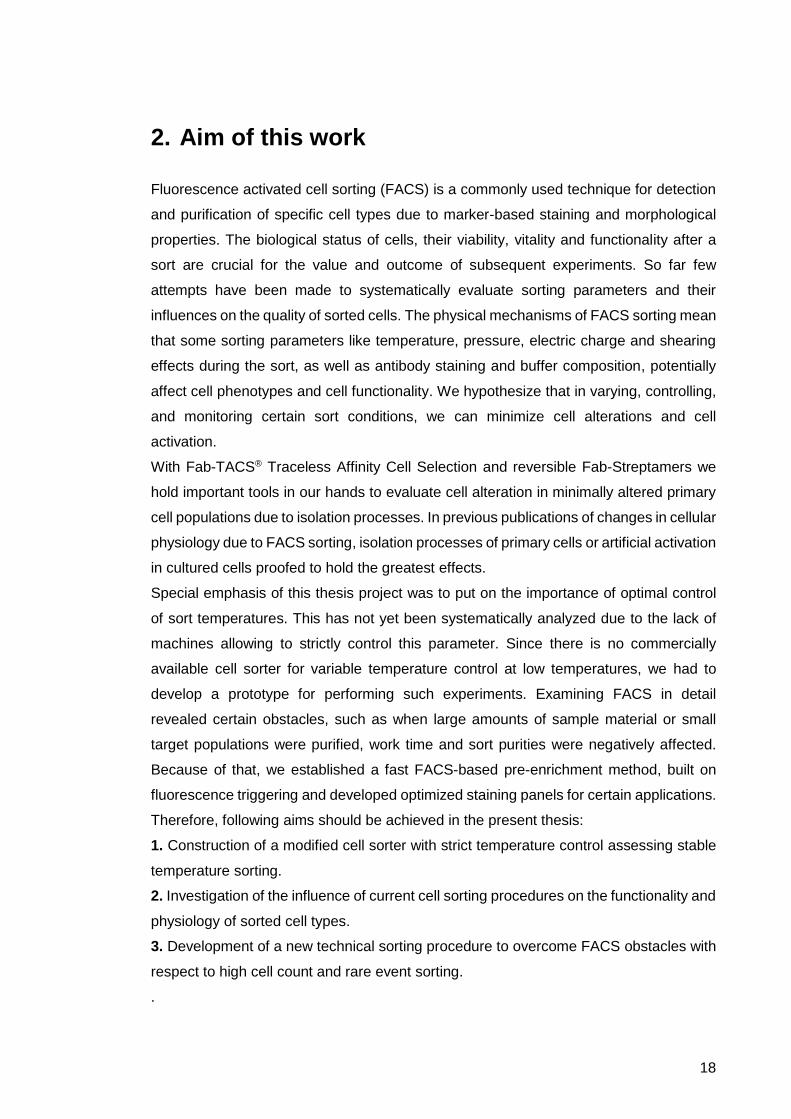
2. Aim of this work
Fluorescence activated cell sorting (FACS) is a commonly used technique for detection
and purification of specific cell types due to marker-based staining and morphological
properties. The biological status of cells, their viability, vitality and functionality after a
sort are crucial for the value and outcome of subsequent experiments. So far few
attempts have been made to systematically evaluate sorting parameters and their
influences on the quality of sorted cells. The physical mechanisms of FACS sorting mean
that some sorting parameters like temperature, pressure, electric charge and shearing
effects during the sort, as well as antibody staining and buffer composition, potentially
affect cell phenotypes and cell functionality. We hypothesize that in varying, controlling,
and monitoring certain sort conditions, we can minimize cell alterations and cell
activation.
With Fab-TACS® Traceless Affinity Cell Selection and reversible Fab-Streptamers we
hold important tools in our hands to evaluate cell alteration in minimally altered primary
cell populations due to isolation processes. In previous publications of changes in cellular
physiology due to FACS sorting, isolation processes of primary cells or artificial activation
in cultured cells proofed to hold the greatest effects.
Special emphasis of this thesis project was to put on the importance of optimal control
of sort temperatures. This has not yet been systematically analyzed due to the lack of
machines allowing to strictly control this parameter. Since there is no commercially
available cell sorter for variable temperature control at low temperatures, we had to
develop a prototype for performing such experiments. Examining FACS in detail
revealed certain obstacles, such as when large amounts of sample material or small
target populations were purified, work time and sort purities were negatively affected.
Because of that, we established a fast FACS-based pre-enrichment method, built on
fluorescence triggering and developed optimized staining panels for certain applications.
Therefore, following aims should be achieved in the present thesis:
1. Construction of a modified cell sorter with strict temperature control assessing stable
temperature sorting.
2. Investigation of the influence of current cell sorting procedures on the functionality and
physiology of sorted cell types.
3. Development of a new technical sorting procedure to overcome FACS obstacles with
respect to high cell count and rare event sorting.
.
19
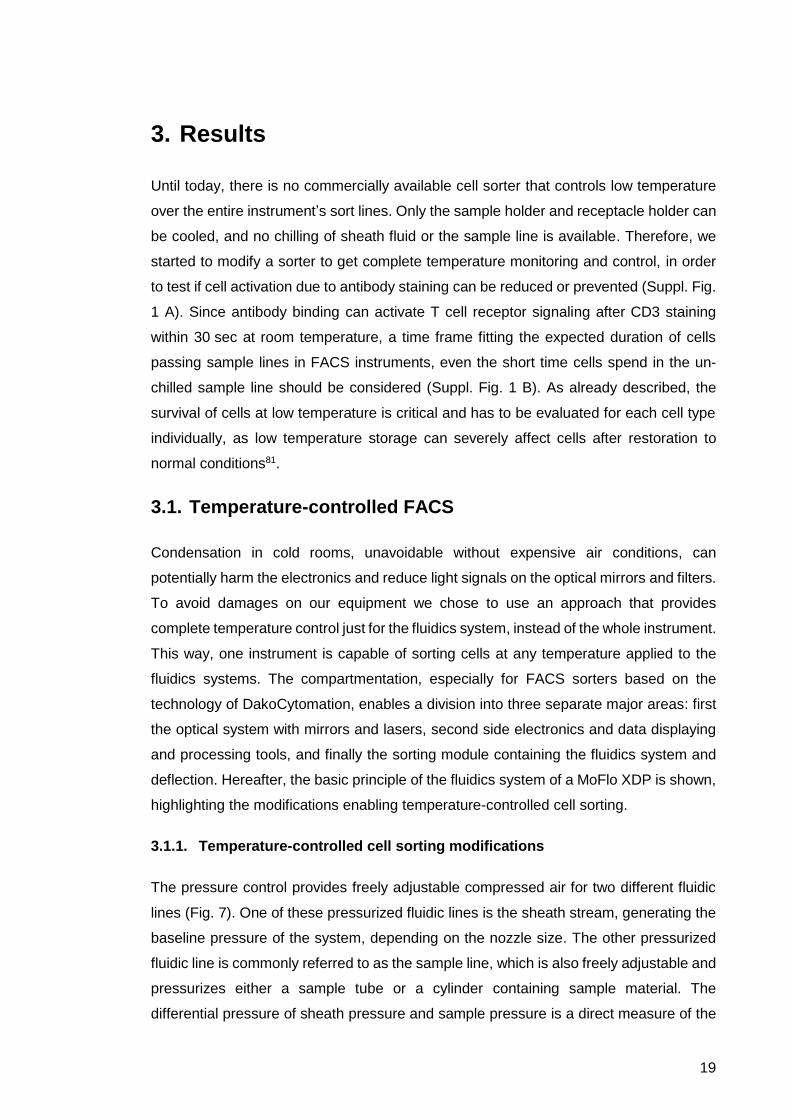
3. Results
Until today, there is no commercially available cell sorter that controls low temperature
over the entire instrument’s sort lines. Only the sample holder and receptacle holder can
be cooled, and no chilling of sheath fluid or the sample line is available. Therefore, we
started to modify a sorter to get complete temperature monitoring and control, in order
to test if cell activation due to antibody staining can be reduced or prevented (Suppl. Fig.
1 A). Since antibody binding can activate T cell receptor signaling after CD3 staining
within 30 sec at room temperature, a time frame fitting the expected duration of cells
passing sample lines in FACS instruments, even the short time cells spend in the un-
chilled sample line should be considered (Suppl. Fig. 1 B). As already described, the
survival of cells at low temperature is critical and has to be evaluated for each cell type
individually, as low temperature storage can severely affect cells after restoration to
normal conditions81.
3.1. Temperature-controlled FACS
Condensation in cold rooms, unavoidable without expensive air conditions, can
potentially harm the electronics and reduce light signals on the optical mirrors and filters.
To avoid damages on our equipment we chose to use an approach that provides
complete temperature control just for the fluidics system, instead of the whole instrument.
This way, one instrument is capable of sorting cells at any temperature applied to the
fluidics systems. The compartmentation, especially for FACS sorters based on the
technology of DakoCytomation, enables a division into three separate major areas: first
the optical system with mirrors and lasers, second side electronics and data displaying
and processing tools, and finally the sorting module containing the fluidics system and
deflection. Hereafter, the basic principle of the fluidics system of a MoFlo XDP is shown,
highlighting the modifications enabling temperature-controlled cell sorting.
3.1.1. Temperature-controlled cell sorting modifications
The pressure control provides freely adjustable compressed air for two different fluidic
lines (Fig. 7). One of these pressurized fluidic lines is the sheath stream, generating the
baseline pressure of the system, depending on the nozzle size. The other pressurized
fluidic line is commonly referred to as the sample line, which is also freely adjustable and
pressurizes either a sample tube or a cylinder containing sample material. The
differential pressure of sheath pressure and sample pressure is a direct measure of the
20
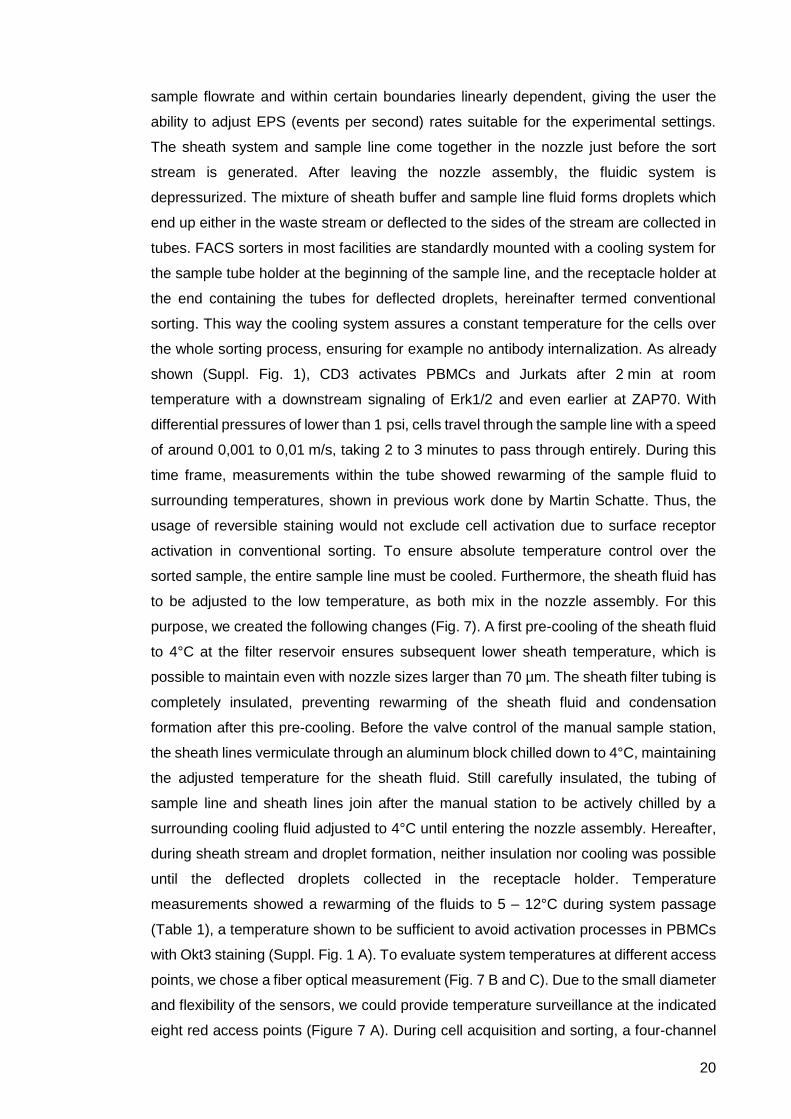
sample flowrate and within certain boundaries linearly dependent, giving the user the
ability to adjust EPS (events per second) rates suitable for the experimental settings.
The sheath system and sample line come together in the nozzle just before the sort
stream is generated. After leaving the nozzle assembly, the fluidic system is
depressurized. The mixture of sheath buffer and sample line fluid forms droplets which
end up either in the waste stream or deflected to the sides of the stream are collected in
tubes. FACS sorters in most facilities are standardly mounted with a cooling system for
the sample tube holder at the beginning of the sample line, and the receptacle holder at
the end containing the tubes for deflected droplets, hereinafter termed conventional
sorting. This way the cooling system assures a constant temperature for the cells over
the whole sorting process, ensuring for example no antibody internalization. As already
shown (Suppl. Fig. 1), CD3 activates PBMCs and Jurkats after 2 min at room
temperature with a downstream signaling of Erk1/2 and even earlier at ZAP70. With
differential pressures of lower than 1 psi, cells travel through the sample line with a speed
of around 0,001 to 0,01 m/s, taking 2 to 3 minutes to pass through entirely. During this
time frame, measurements within the tube showed rewarming of the sample fluid to
surrounding temperatures, shown in previous work done by Martin Schatte. Thus, the
usage of reversible staining would not exclude cell activation due to surface receptor
activation in conventional sorting. To ensure absolute temperature control over the
sorted sample, the entire sample line must be cooled. Furthermore, the sheath fluid has
to be adjusted to the low temperature, as both mix in the nozzle assembly. For this
purpose, we created the following changes (Fig. 7). A first pre-cooling of the sheath fluid
to 4°C at the filter reservoir ensures subsequent lower sheath temperature, which is
possible to maintain even with nozzle sizes larger than 70 µm. The sheath filter tubing is
completely insulated, preventing rewarming of the sheath fluid and condensation
formation after this pre-cooling. Before the valve control of the manual sample station,
the sheath lines vermiculate through an aluminum block chilled down to 4°C, maintaining
the adjusted temperature for the sheath fluid. Still carefully insulated, the tubing of
sample line and sheath lines join after the manual station to be actively chilled by a
surrounding cooling fluid adjusted to 4°C until entering the nozzle assembly. Hereafter,
during sheath stream and droplet formation, neither insulation nor cooling was possible
until the deflected droplets collected in the receptacle holder. Temperature
measurements showed a rewarming of the fluids to 5 – 12°C during system passage
(Table 1), a temperature shown to be sufficient to avoid activation processes in PBMCs
with Okt3 staining (Suppl. Fig. 1 A). To evaluate system temperatures at different access
points, we chose a fiber optical measurement (Fig. 7 B and C). Due to the small diameter
and flexibility of the sensors, we could provide temperature surveillance at the indicated
eight red access points (Figure 7 A). During cell acquisition and sorting, a four-channel
21
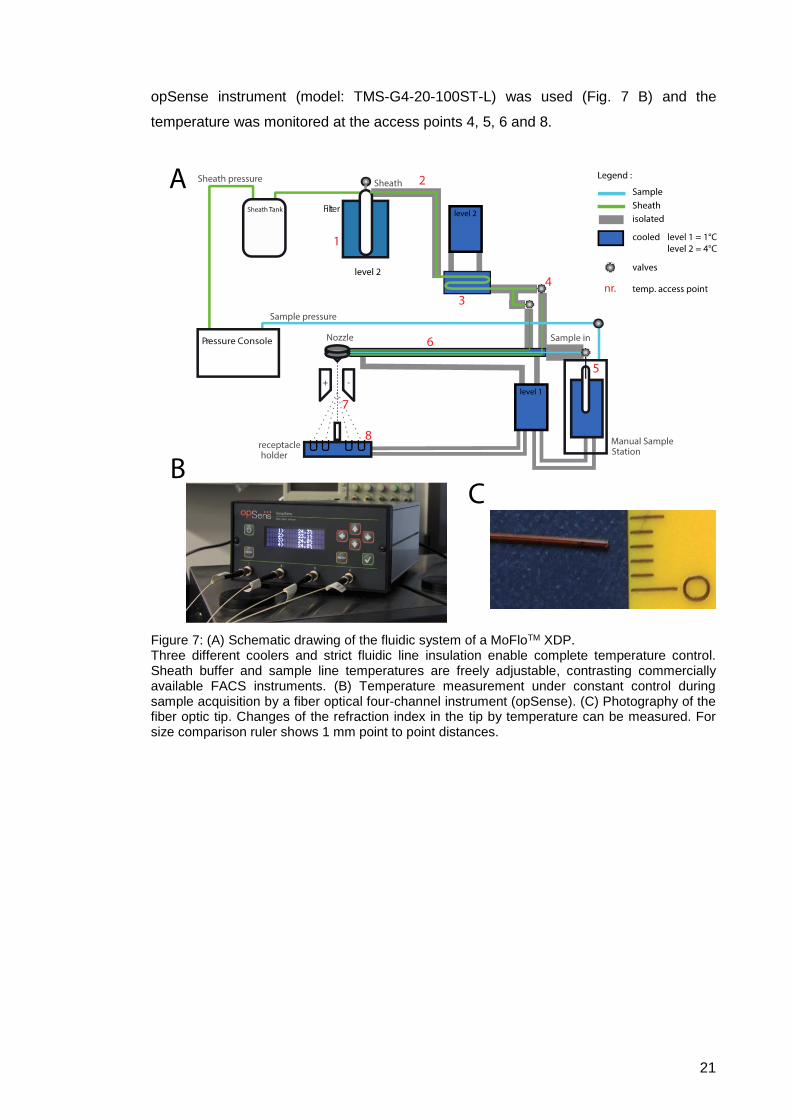
opSense instrument (model: TMS-G4-20-100ST-L) was used (Fig. 7 B) and the
temperature was monitored at the access points 4, 5, 6 and 8.
Figure 7: (A) Schematic drawing of the fluidic system of a MoFloTM XDP. Three different coolers and strict fluidic line insulation enable complete temperature control. Sheath buffer and sample line temperatures are freely adjustable, contrasting commercially available FACS instruments. (B) Temperature measurement under constant control during sample acquisition by a fiber optical four-channel instrument (opSense). (C) Photography of the fiber optic tip. Changes of the refraction index in the tip by temperature can be measured. For size comparison ruler shows 1 mm point to point distances.
22
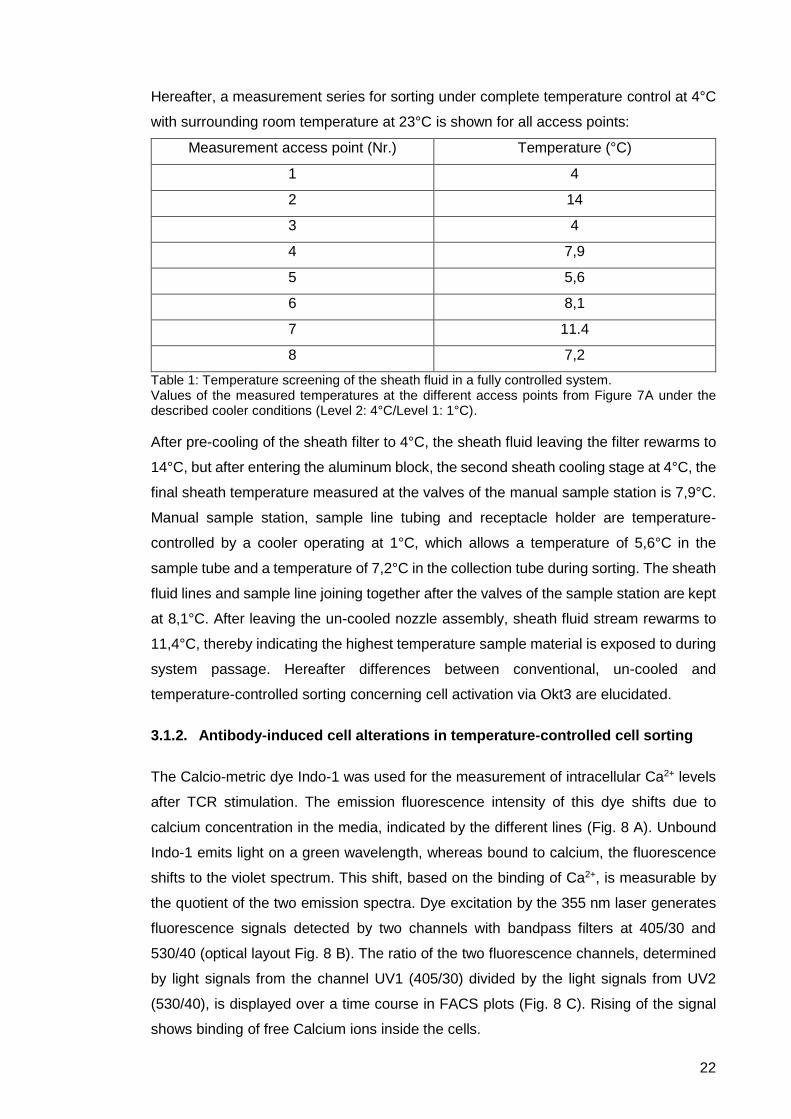
Hereafter, a measurement series for sorting under complete temperature control at 4°C
with surrounding room temperature at 23°C is shown for all access points:
Measurement access point (Nr.) Temperature (°C)
1 4
2 14
3 4
4 7,9
5 5,6
6 8,1
7 11.4
8 7,2
Table 1: Temperature screening of the sheath fluid in a fully controlled system. Values of the measured temperatures at the different access points from Figure 7A under the described cooler conditions (Level 2: 4°C/Level 1: 1°C).
After pre-cooling of the sheath filter to 4°C, the sheath fluid leaving the filter rewarms to
14°C, but after entering the aluminum block, the second sheath cooling stage at 4°C, the
final sheath temperature measured at the valves of the manual sample station is 7,9°C.
Manual sample station, sample line tubing and receptacle holder are temperature-
controlled by a cooler operating at 1°C, which allows a temperature of 5,6°C in the
sample tube and a temperature of 7,2°C in the collection tube during sorting. The sheath
fluid lines and sample line joining together after the valves of the sample station are kept
at 8,1°C. After leaving the un-cooled nozzle assembly, sheath fluid stream rewarms to
11,4°C, thereby indicating the highest temperature sample material is exposed to during
system passage. Hereafter differences between conventional, un-cooled and
temperature-controlled sorting concerning cell activation via Okt3 are elucidated.
3.1.2. Antibody-induced cell alterations in temperature-controlled cell sorting
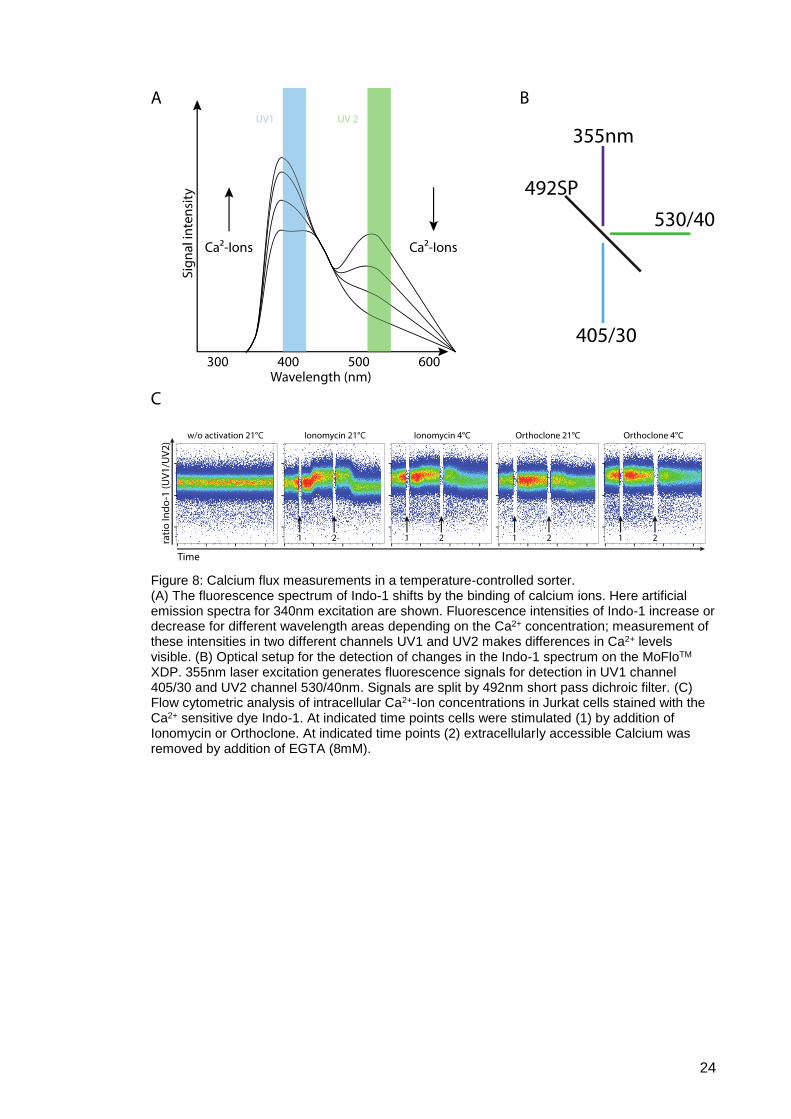
The Calcio-metric dye Indo-1 was used for the measurement of intracellular Ca2+ levels
after TCR stimulation. The emission fluorescence intensity of this dye shifts due to
calcium concentration in the media, indicated by the different lines (Fig. 8 A). Unbound
Indo-1 emits light on a green wavelength, whereas bound to calcium, the fluorescence
shifts to the violet spectrum. This shift, based on the binding of Ca2+, is measurable by
the quotient of the two emission spectra. Dye excitation by the 355 nm laser generates
fluorescence signals detected by two channels with bandpass filters at 405/30 and
530/40 (optical layout Fig. 8 B). The ratio of the two fluorescence channels, determined
by light signals from the channel UV1 (405/30) divided by the light signals from UV2
(530/40), is displayed over a time course in FACS plots (Fig. 8 C). Rising of the signal
shows binding of free Calcium ions inside the cells.
23
For measurements, the CD3 crosslinking clone Okt3 (trade name Orthoclone) was
added in real-time to Jurkat cells during acquisition. At indicated time points, marked with
an arrow (Nr. 1), TCR stimulating agent was added to the Jurkat cells. At the second
indicated time point, accessible Ca2+ was removed by complex formation from the
storage buffer by the addition of EGTA (8mM). With the change of the Indo-1
fluorescence spectrum, a direct measurement of the intracellular calcium level by the
activation of the TCR was measured, indicated by the increased fluorescence signal from
the UV1/UV2 ratio (Fig. 8 C).
By cooling the entire instrument, even the un-physiologically strong stimulus of
ionomycin causes less TCR stimulation, as compared to conventional sorting.
While a CD3 stimulus is sufficient to activate Jurkat cells at sheath temperatures of 21°C,
but chilled sample holders (conventional sorting), activation does not occur at completely
controlled 4°C conditions (Fig. 8 C). Completely temperature-controlled cell sorting
started at a higher fluorescence baseline ratio, as alignment issues caused this effect.
Completely cooled sheath fluid required a realignment of the laser to sheath fluid for
optimal alignment. For Orthoclone stimulation of Jurkat cells, only small differences
between fully cooled and conventional were observable, as the calcium flux to this
stimulation was significant smaller. Hence completely temperature-controlled sorting
showed lower activation compared to an un-cooled sample line. To evaluate this, we
tested for intracellular MAPK phosphorylation after TCR stimulation.
24
Figure 8: Calcium flux measurements in a temperature-controlled sorter. (A) The fluorescence spectrum of Indo-1 shifts by the binding of calcium ions. Here artificial emission spectra for 340nm excitation are shown. Fluorescence intensities of Indo-1 increase or decrease for different wavelength areas depending on the Ca2+ concentration; measurement of these intensities in two different channels UV1 and UV2 makes differences in Ca2+ levels visible. (B) Optical setup for the detection of changes in the Indo-1 spectrum on the MoFloTM XDP. 355nm laser excitation generates fluorescence signals for detection in UV1 channel 405/30 and UV2 channel 530/40nm. Signals are split by 492nm short pass dichroic filter. (C) Flow cytometric analysis of intracellular Ca2+-Ion concentrations in Jurkat cells stained with the Ca2+ sensitive dye Indo-1. At indicated time points cells were stimulated (1) by addition of Ionomycin or Orthoclone. At indicated time points (2) extracellularly accessible Calcium was removed by addition of EGTA (8mM).
25
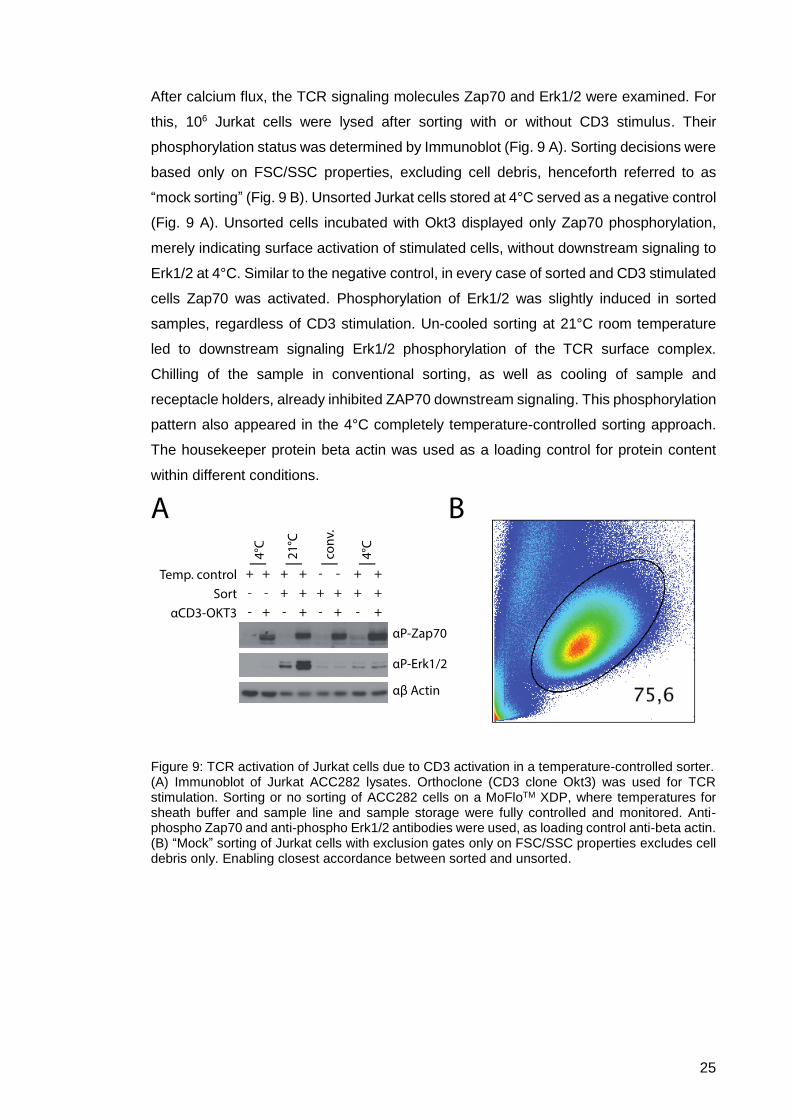
After calcium flux, the TCR signaling molecules Zap70 and Erk1/2 were examined. For
this, 106 Jurkat cells were lysed after sorting with or without CD3 stimulus. Their
phosphorylation status was determined by Immunoblot (Fig. 9 A). Sorting decisions were
based only on FSC/SSC properties, excluding cell debris, henceforth referred to as
“mock sorting” (Fig. 9 B). Unsorted Jurkat cells stored at 4°C served as a negative control
(Fig. 9 A). Unsorted cells incubated with Okt3 displayed only Zap70 phosphorylation,
merely indicating surface activation of stimulated cells, without downstream signaling to
Erk1/2 at 4°C. Similar to the negative control, in every case of sorted and CD3 stimulated
cells Zap70 was activated. Phosphorylation of Erk1/2 was slightly induced in sorted
samples, regardless of CD3 stimulation. Un-cooled sorting at 21°C room temperature
led to downstream signaling Erk1/2 phosphorylation of the TCR surface complex.
Chilling of the sample in conventional sorting, as well as cooling of sample and
receptacle holders, already inhibited ZAP70 downstream signaling. This phosphorylation
pattern also appeared in the 4°C completely temperature-controlled sorting approach.
The housekeeper protein beta actin was used as a loading control for protein content
within different conditions.
Figure 9: TCR activation of Jurkat cells due to CD3 activation in a temperature-controlled sorter. (A) Immunoblot of Jurkat ACC282 lysates. Orthoclone (CD3 clone Okt3) was used for TCR stimulation. Sorting or no sorting of ACC282 cells on a MoFloTM XDP, where temperatures for sheath buffer and sample line and sample storage were fully controlled and monitored. Anti-phospho Zap70 and anti-phospho Erk1/2 antibodies were used, as loading control anti-beta actin. (B) “Mock” sorting of Jurkat cells with exclusion gates only on FSC/SSC properties excludes cell debris only. Enabling closest accordance between sorted and unsorted.
26
Overall, in the case of Ca2+-flux, temperature-controlled cell sorting did slightly exceed
conventional sorting approaches, while for MAPK signaling both approaches seem
sufficient to avoid activation compared to uncontrolled temperature conditions. The
rewarming of cell material in the sample line itself in conventional sorting is not capable
of triggering downstream signaling to MAPK Erk1/2. However, the activation of ZAP70
under 4°C chilled sample storage conditions still allows for downstream signaling after
rewarming. We cannot exclude that we missed the TCR signal between ZAP70 and
Erk1/2 in conventional sorting approaches at the time point we checked. Our
temperature-controlled system supports, by excluding any possible cell alteration during
reversible staining protocols and sorting, minimally altered cell phenotypes post-
purification.
However, despite the benefits the danger of hypothermic conditions in all chilled sorting
approaches of induced cell death is commonly agreed upon58,60,81,82. Therefore we
evaluated cell survival under storage conditions of different cell types and temperatures.
3.1.3. Temperature effects on cells - Viability
We used optimal buffer conditions (cell culture medium RPMI, 10% FCS; murine culture
medium was supplemented with β-mercaptoethanol) for different cell types. Two primary
cell types, human PBMCs and murine splenocytes, were used. PBMCs were generated
from buffy coat material via Ficoll gradient centrifugation. Splenocytes were generated
from sacrificed C57BL/6 donor mice. Spleens were homogenized with a 100 µm cell
strainer and subsequently red blood cells were depleted by Tris-buffered ammonium
chloride (ACT) lysis. For immortalized cell cultures, either K562 cells, a human derived
lymphoblast suspension cell line, or Jurkat cells ACC282 were used. Survival under
three different temperature conditions for each cell line was evaluated by PI staining over
a time frame of 3 h (Fig. 10 A). Cells were kept under indicated temperature conditions,
harvested at certain time points (0, 60, 180 min), and after live/dead staining analyzed
by flow cytometry. Human PBMCs did not show any effect concerning their viability even
after 3 h storage at 4°C, proving resistance against temperature-induced apoptosis for a
time frame reasonable in FACS sorting. Murine splenocytes did not differ from human
primary cells during long term ice storage, as no additional apoptosis occurred after 60
minutes. The main factor for cell death for this cell type was the homogenization and
lysis process, since post-isolation this cell type already displays the lowest survival
counts of all cell types. The cultured cells K562 did not show any effect at physiological
or room temperature storage conditions. Yet at 4°C, survival drastically drops when
stored for longer than 1 h. Since cultured cells are often used for cell sorting approaches
in basic research, we evaluated whether hypothermic stress can be avoided while still
27
minimizing potential antibody alterations at low temperatures. For this we applied
different hypothermic conditions 4°C, 8°C and 12°C as well as 21°C and evaluated
induced cell death by Caspase 1 activity (Fig. 10 B). The dye Flica, which is sensitive for
cleaved Caspase 1, indicates early apoptotic processes mediated by a mitochondrial
pathway.
After storage for the indicated time (0, 60, 120 and 360 minutes), Jurkat cells were
harvested, stained and analyzed by flow cytometry. Similar to the K562 cells, Jurkats did
not survive well at 4°C conditions for longer storage times, whereas a warmer storage
condition of 8°C already drastically increased cell survival even after 6h of incubation.
Surprisingly, 12°C conditions were already sufficient for Jurkat cells to survive as well as
under room temperature conditions. A temperature adjustment to 12°C for longer FACS
sorting times with cultured cells in cooled systems would be preferable.
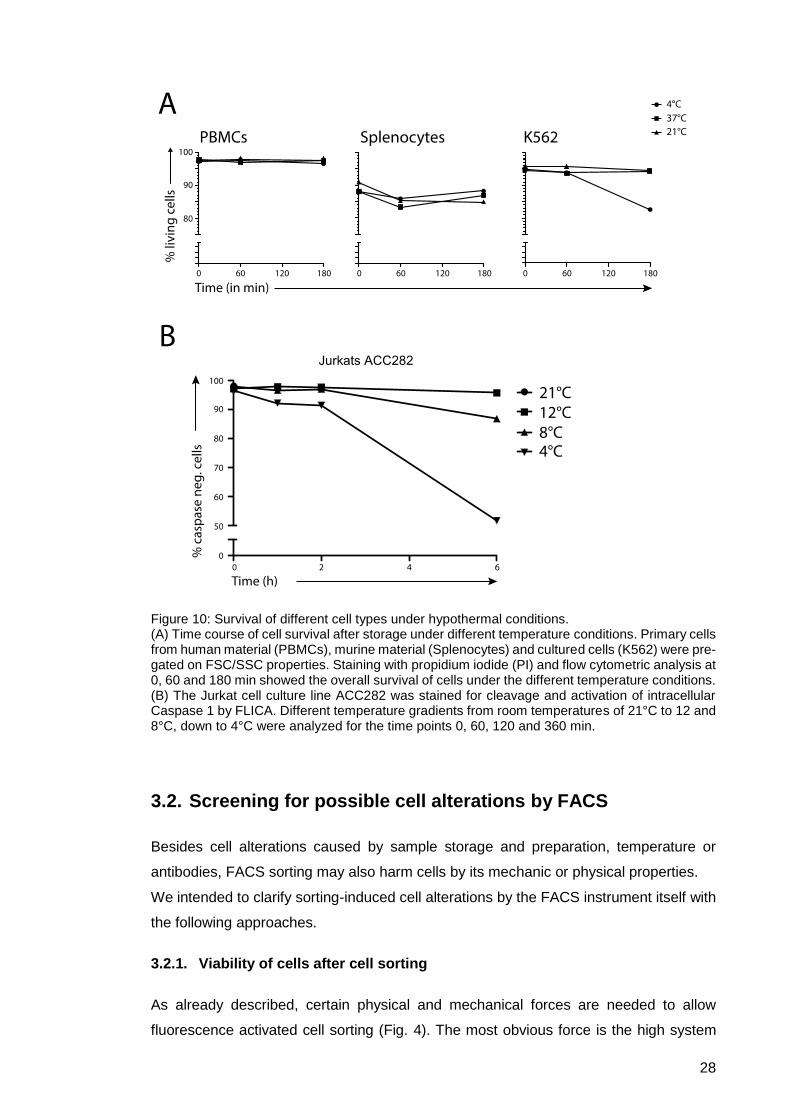
28
Figure 10: Survival of different cell types under hypothermal conditions. (A) Time course of cell survival after storage under different temperature conditions. Primary cells from human material (PBMCs), murine material (Splenocytes) and cultured cells (K562) were pre-gated on FSC/SSC properties. Staining with propidium iodide (PI) and flow cytometric analysis at 0, 60 and 180 min showed the overall survival of cells under the different temperature conditions. (B) The Jurkat cell culture line ACC282 was stained for cleavage and activation of intracellular Caspase 1 by FLICA. Different temperature gradients from room temperatures of 21°C to 12 and 8°C, down to 4°C were analyzed for the time points 0, 60, 120 and 360 min.
3.2. Screening for possible cell alterations by FACS
Besides cell alterations caused by sample storage and preparation, temperature or
antibodies, FACS sorting may also harm cells by its mechanic or physical properties.
We intended to clarify sorting-induced cell alterations by the FACS instrument itself with
the following approaches.
3.2.1. Viability of cells after cell sorting
As already described, certain physical and mechanical forces are needed to allow
fluorescence activated cell sorting (Fig. 4). The most obvious force is the high system

29
pressure defined by the nozzle size. Although most instruments, especially the more
sophisticated cell sorters, allow freely adjustable nozzle sizes, some do not. In our facility
we are fortunate to have three different cell sorting instruments in one room, which gives
us the opportunity to use them simultaneously with the same sample material operated
by the same person. The sorters were operated with comparable system pressures by
consistently using a 100 µm nozzle. Some sorters generate a stream, which is hit by the
laser in the air, commonly referred to as the “Jet in Air” system. Others acquire light
signals first in a cuvette and generate the stream for droplet generation and sorting after
data acquisition. Hereafter we compared two “Jet in Air” systems, a MoFlo Legacy
(Beckman Coulter) and an Avalon cell sorter (PropelLabs), as well as one cuvette-based
system, the Aria III (Becton Dickinson). As with the experimental setting for temperature
influences, the evaluation of induced cell death and apoptosis was in focus. For this,
three different early and late apoptotic markers were applied. 7-Aminoactinomycin D
(7AAD) intercalates in the DNA between cytosine and guanine, entering the cell when
membrane integrity is lost, thus indicating a late stage in the apoptotic process. Earlier
markers of programmed cell death are the activation of caspase 1 and the accumulation
of phosphatidylserine (PS)-based phospholipids at the outer membrane layer. Except for
erythrocytes, cells actively keep PS located at the cytoplasmic side of their cell
membrane by an enzyme called Flippase. In contrast, the enzyme scramblase is
responsible for an active transport of PS to the outer membrane, activated by high
intracellular Ca2+ levels. AnnexinV, the third marker used for apoptotic processes in this
panel, can bind surface-exposed PS. Both early apoptotic markers, Flica and AnnexinV,
can potentially be activated by pathways not related to programmed cell death, like the
inflammasome, which can activate caspase 1 and cellular responses like cell activation
by Wnt signaling or IP3, which release Ca2+ from intracellular endoplasmic storage. Yet
the combination of both markers can be used to visualize early apoptotic processes in
the cell. A staining of murine splenocytes after ACT lysis, FACS-sorted on three different
instruments in parallel, with these three apoptotic markers was carried out (Fig. 11 A).
Splenocytes were sorted for living single lymphocytes by PI staining and scatter
properties for the exclusion of dead cells after cell preparation. Nevertheless, after
sorting and re-staining, still 8 to 11% of splenocytes were dead cells according to 7AAD
exclusion, even though analyzed sorting purities were PI negative. This indicates
occurring cell death after sorting. The Aria III and Avalon performed similarly, while the
MoFlo had the lowest 7AAD numbers, with overall 92,4% living cells. The 7AAD negative
population was further gated for Flica and AnnexinV staining. The double positive
population for those two early apoptotic markers was below 1% for all instruments, with
the highest proportion of 0,87% resulting from the Avalon. This indicates that, despite
the 8 to 11% of 7AAD dead cells, a low number of cells undergo an apoptotic process
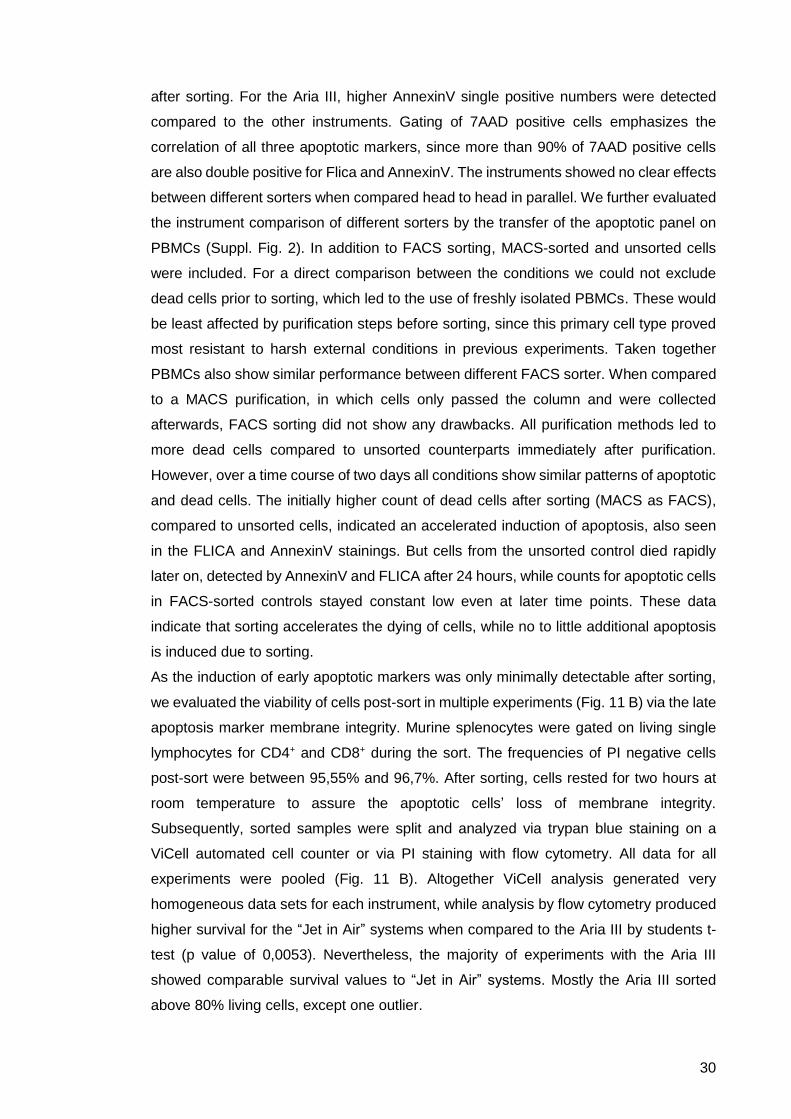
30
after sorting. For the Aria III, higher AnnexinV single positive numbers were detected
compared to the other instruments. Gating of 7AAD positive cells emphasizes the
correlation of all three apoptotic markers, since more than 90% of 7AAD positive cells
are also double positive for Flica and AnnexinV. The instruments showed no clear effects
between different sorters when compared head to head in parallel. We further evaluated
the instrument comparison of different sorters by the transfer of the apoptotic panel on
PBMCs (Suppl. Fig. 2). In addition to FACS sorting, MACS-sorted and unsorted cells
were included. For a direct comparison between the conditions we could not exclude
dead cells prior to sorting, which led to the use of freshly isolated PBMCs. These would
be least affected by purification steps before sorting, since this primary cell type proved
most resistant to harsh external conditions in previous experiments. Taken together
PBMCs also show similar performance between different FACS sorter. When compared
to a MACS purification, in which cells only passed the column and were collected
afterwards, FACS sorting did not show any drawbacks. All purification methods led to
more dead cells compared to unsorted counterparts immediately after purification.
However, over a time course of two days all conditions show similar patterns of apoptotic
and dead cells. The initially higher count of dead cells after sorting (MACS as FACS),
compared to unsorted cells, indicated an accelerated induction of apoptosis, also seen
in the FLICA and AnnexinV stainings. But cells from the unsorted control died rapidly
later on, detected by AnnexinV and FLICA after 24 hours, while counts for apoptotic cells
in FACS-sorted controls stayed constant low even at later time points. These data
indicate that sorting accelerates the dying of cells, while no to little additional apoptosis
is induced due to sorting.
As the induction of early apoptotic markers was only minimally detectable after sorting,
we evaluated the viability of cells post-sort in multiple experiments (Fig. 11 B) via the late
apoptosis marker membrane integrity. Murine splenocytes were gated on living single
lymphocytes for CD4+ and CD8+ during the sort. The frequencies of PI negative cells
post-sort were between 95,55% and 96,7%. After sorting, cells rested for two hours at
room temperature to assure the apoptotic cells’ loss of membrane integrity.
Subsequently, sorted samples were split and analyzed via trypan blue staining on a
ViCell automated cell counter or via PI staining with flow cytometry. All data for all
experiments were pooled (Fig. 11 B). Altogether ViCell analysis generated very
homogeneous data sets for each instrument, while analysis by flow cytometry produced
higher survival for the “Jet in Air” systems when compared to the Aria III by students t-
test (p value of 0,0053). Nevertheless, the majority of experiments with the Aria III
showed comparable survival values to “Jet in Air” systems. Mostly the Aria III sorted
above 80% living cells, except one outlier.
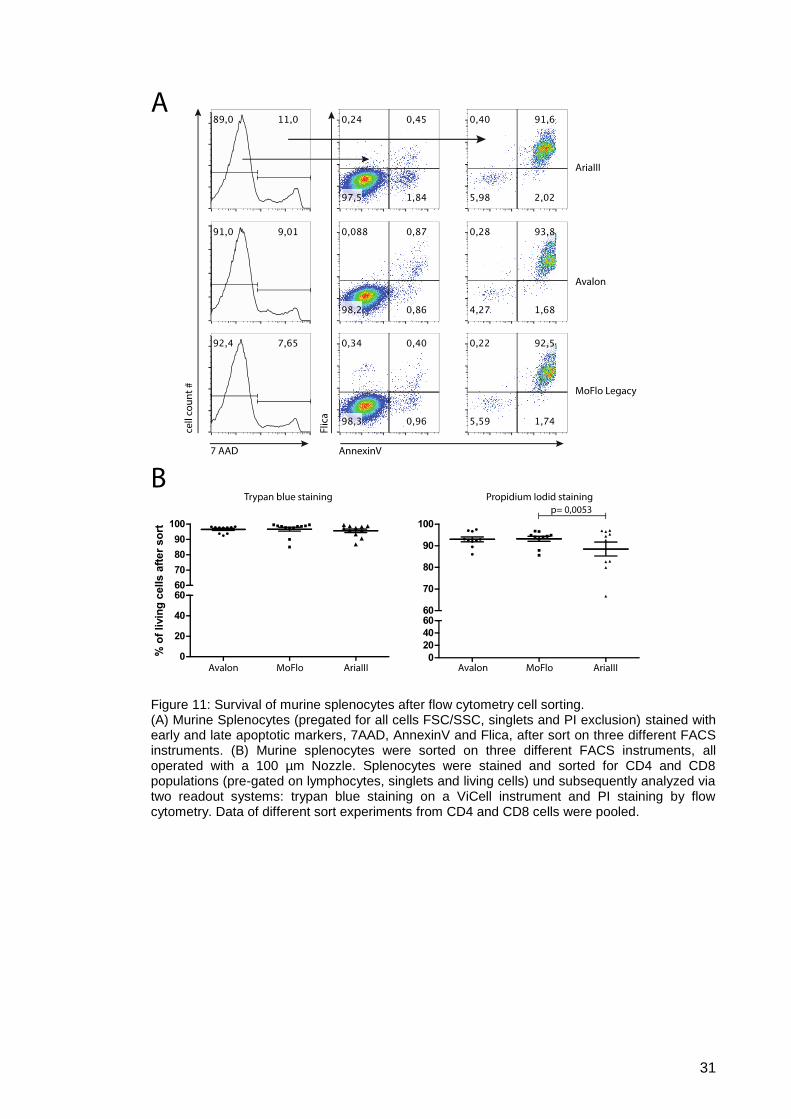
31
Figure 11: Survival of murine splenocytes after flow cytometry cell sorting. (A) Murine Splenocytes (pregated for all cells FSC/SSC, singlets and PI exclusion) stained with early and late apoptotic markers, 7AAD, AnnexinV and Flica, after sort on three different FACS instruments. (B) Murine splenocytes were sorted on three different FACS instruments, all operated with a 100 µm Nozzle. Splenocytes were stained and sorted for CD4 and CD8 populations (pre-gated on lymphocytes, singlets and living cells) und subsequently analyzed via two readout systems: trypan blue staining on a ViCell instrument and PI staining by flow cytometry. Data of different sort experiments from CD4 and CD8 cells were pooled.
32
Overall, data indicated good performance of the cell sorters in keeping primary cells
viable after sorting.
Since we found AnnexinV single positive cells within the 7AAD negative population, we
went deeper into cellular signaling pathways to evaluate cell activation due to sorting.
3.2.2. Intracellular signaling pathways after sorting
Increased activation of cells by external factors is a conserved mechanism of many
different species as plants, fungi and mammals, and is mostly mediated by the mitogen-
activated protein kinase (MAPK) pathways83. Four major MAPK nodes are described
which can be activated separately from each other depending on the stimuli (Fig. 12).
First, Erk1 and 2 have already been described as part of this machinery, where they
react very sensitively to extracellular stimulus. Second, extracellular-signaling-regulated
kinase 5 (Erk5) is known for being activated by stress signals like oxidative stress,
hyperosmolarity or mitogens84. Third, there is the c-Jun-amino-terminal kinase (JNK),
also known as stress-activated phospho-kinase (SNPK). One of its main functions is a
reaction to osmotic shock, ultraviolet irradiation or heat shock. Finally, the p38 family
which in mammals activates in response to environmental factors and inflammation; it
consists of four different members α, β, γ and δ, with the α-p38 ubiquitously expressed
in nearly all tissues.
Figure 12: Schematic drawing of extra cellular stress factors in MAPK pathways. Most species evolved a complex cellular machinery for sensing extracellular stress signaling by the MAPK pathway. In mammalian cells multiple different signaling pathways mediated by a broad spectrum of stimuli coalesce at four molecular signaling nodes Erk1/2, p38, JNK and Erk5. An activation of these MAPKs by phosphorylation to these stimuli mediates gene regulation via transcription factors and cellular responses.
33
3.2.2.1. Screening of MAPK pathways
For the purpose of cell activation screening, we dispensed with the use of antibodies and
performed sorting based on scatter properties only. This type of mock sorting requires a
pre-purification method to determine responses in a specific primary cell population,
which ensures the greatest possible comparison between unsorted and sorted
populations and well-defined cell type dependent responses. Two purification methods
of choice were used on human blood-derived material, as certain cell types can be easily
purified from it: either PBMC samples from buffy coat after Ficoll gradient density
centrifugation, or CD8 positive cells enriched by the Fab-TACS® method. Fab-TACS®
relies on reversible reagents and is explained later on in detail. Cells isolated with both
purification methods were rested in starving medium overnight to reduce artifacts
generated by the pre-purification method and to synchronize the cells. hPBMCs were
either rested or mock-sorted on a MoFlo XDP using a 488 nm 200 mW and a 355 nm
100 mW laser, and then processed immediately and after 30 min with a subsequent
staining. Samples were live/dead discriminated with ethidium monoazide (EMA),
permeabilized and stained with phospho-specific antibodies directed against JNK,
Erk1/2 and p38. Afterwards, flow cytometric analysis for living single lymphocytes
displayed the following phosphorylation pattern (Fig. 13 A). No activation of JNK could
be detected, although 355nm laser light was used during sorting, which hints that UV
irradiation is not strong enough or lasts too briefly to activate this pathway. In
comparison, a high number of cells were phosphorylated for the MAPK Erk1/2 and p38
after mock sorting conditions. During a sort, cells come in contact with various buffers
and fluids, indicating a potential activation of MAPK by osmolality changes or mitogens
like FCS. To differentiate whether sorting buffers or the FACS instrument induced the
occurring phosphorylation, hPBMCs were stored in buffers composed similarly to the
ones used for mock sorting. Cells of the same origin as used for mock sorting were stored
in cell culture medium, sheath fluid or high amounts of FCS, to examine the p38 and
Erk1/2 phosphorylation (Fig. 13 B) by mimicking different sorting fluids and buffer. The
ratio of phosphorylated and endogenous p38 after storage in these media was calculated
with ImageJ, where p38 did not show a buffer dependent phosphorylation pattern. The
numbers of this ratio made clear that different sorting buffers do not explain the strong
activation after sort.
In contrast, buffers induced an activation of Erk1/2. A high content of FCS, 20% FCS in
FACS buffer (FF), drastically increased the overall amount of phosphorylated p44/42
over the time course of up to 30 minutes (Fig. 13 B). No other buffer condition induced
activation that strongly, hinting at a potential activation by mitogens from the FCS.
Finally, the activation of the fourth MAPK pathway Erk5 by mock sorting was evaluated
by Immunoblot, as no commercial flow cytometric antibodies for detecting this
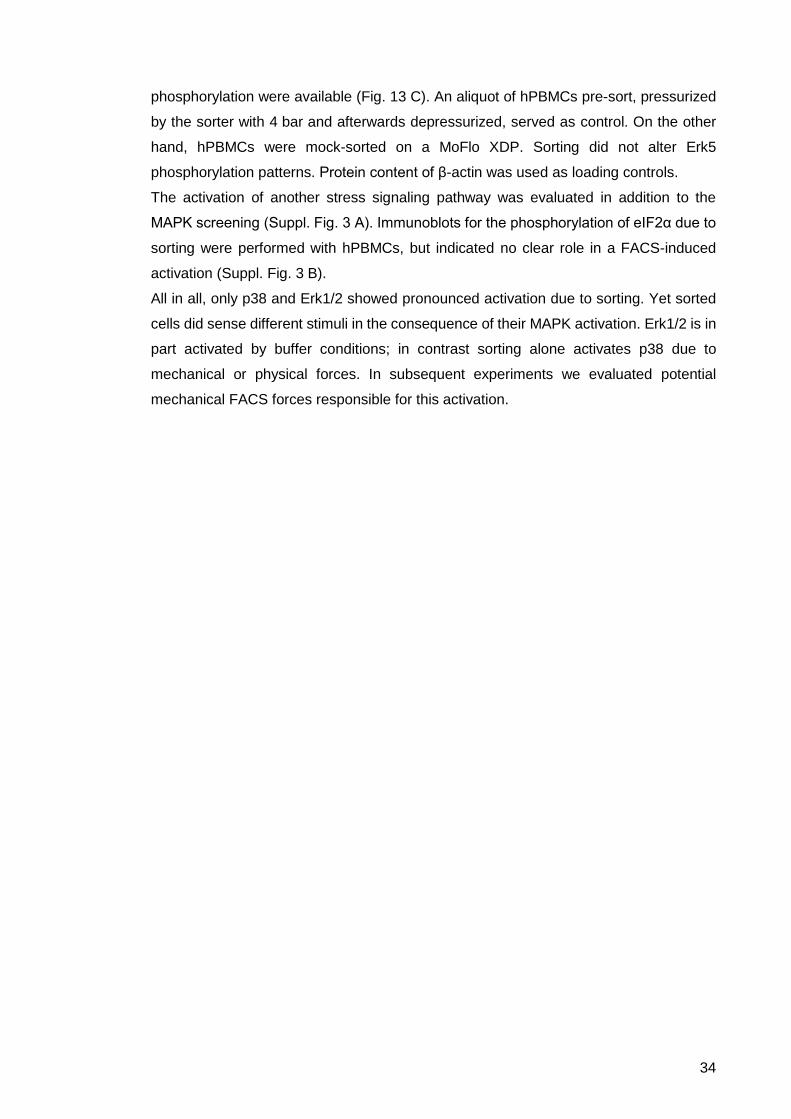
34
phosphorylation were available (Fig. 13 C). An aliquot of hPBMCs pre-sort, pressurized
by the sorter with 4 bar and afterwards depressurized, served as control. On the other
hand, hPBMCs were mock-sorted on a MoFlo XDP. Sorting did not alter Erk5
phosphorylation patterns. Protein content of β-actin was used as loading controls.
The activation of another stress signaling pathway was evaluated in addition to the
MAPK screening (Suppl. Fig. 3 A). Immunoblots for the phosphorylation of eIF2α due to
sorting were performed with hPBMCs, but indicated no clear role in a FACS-induced
activation (Suppl. Fig. 3 B).
All in all, only p38 and Erk1/2 showed pronounced activation due to sorting. Yet sorted
cells did sense different stimuli in the consequence of their MAPK activation. Erk1/2 is in
part activated by buffer conditions; in contrast sorting alone activates p38 due to
mechanical or physical forces. In subsequent experiments we evaluated potential
mechanical FACS forces responsible for this activation.
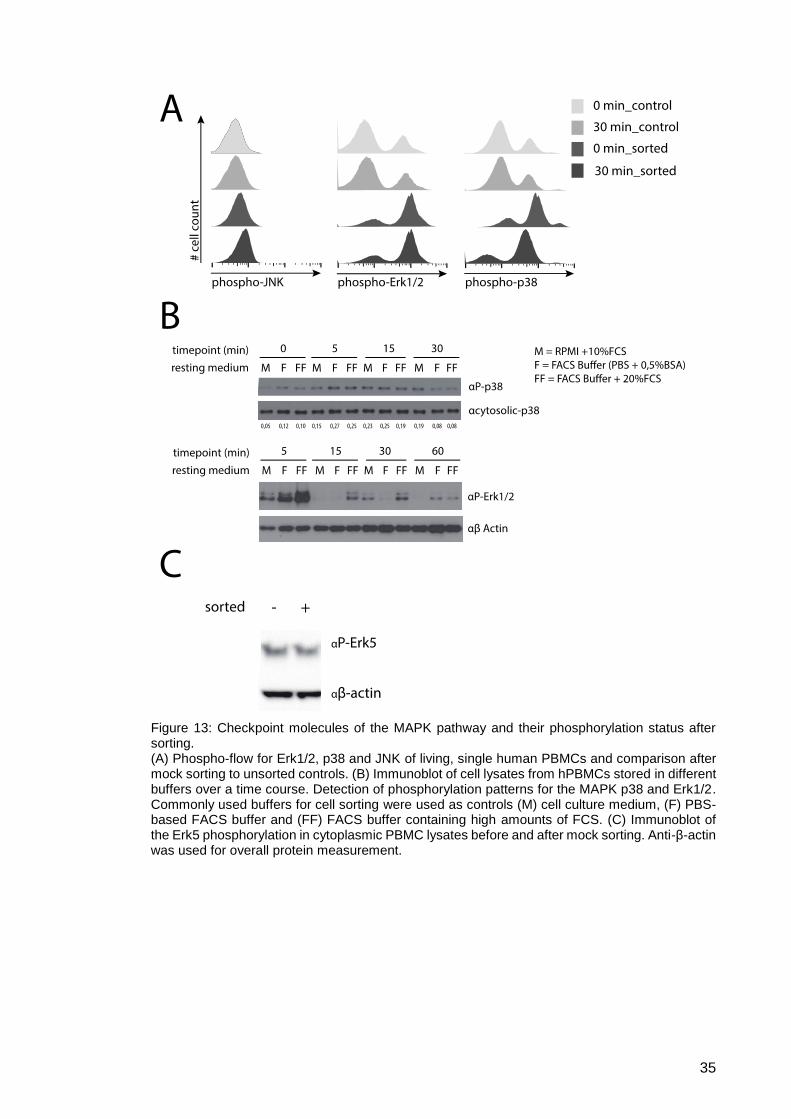
35
Figure 13: Checkpoint molecules of the MAPK pathway and their phosphorylation status after sorting. (A) Phospho-flow for Erk1/2, p38 and JNK of living, single human PBMCs and comparison after mock sorting to unsorted controls. (B) Immunoblot of cell lysates from hPBMCs stored in different buffers over a time course. Detection of phosphorylation patterns for the MAPK p38 and Erk1/2. Commonly used buffers for cell sorting were used as controls (M) cell culture medium, (F) PBS-based FACS buffer and (FF) FACS buffer containing high amounts of FCS. (C) Immunoblot of the Erk5 phosphorylation in cytoplasmic PBMC lysates before and after mock sorting. Anti-β-actin was used for overall protein measurement.
36
The FACS-induced p38 phosphorylation was measured considering both endogenous
and cytoplasmic p38. Human PBMCs after Ficoll and cultivation in RPMI medium
containing 10% FCS (Fig. 14 A) were minimally activated by cell culture conditions. A
comparable activation status was seen after pressurizing and depressurizing with 4 bar.
In contrast, PBMCs sorted by FACS did show an increased phosphorylation status of
their p38 levels, quantified by ImageJ with a ratio of phosphorylated to endogenous p38
(Fig. 14 A). We demonstrated no specific p38 activation by the preparation processes
for cell sorting, e.g. Ficoll and buffer conditions, and PBMCs were even unaffected by
the overall pressure conditions of FACS instruments. We assumed that a force other
than pressure triggers the activation of p38 during FACS sorting.
To find out if the FACS-induced p38 activation can be avoided by cell hibernation during
sorting, the fully temperature-controlled sorting approach was tested (Fig. 14 B). PBMCs
stored in culture medium were pressurized or not and sorted under different temperature
conditions to check which combined condition led to p38 activation. In summary, FACS
sorting at any given temperature condition induces and increases p38 phosphorylation
patterns. Constant hibernation of PBMCs before and during sorting enhances the
tendency for increased phosphorylation, with an unphysiologically rapid loss of signal
after rewarming. We tested the phosphorylation activation for 4°C conditions, with
PBMCs stored and sorted with or without deflection and charging (Fig. 14 C). However,
the Immunoblot shows that 4°C alone did not induce the p38 signal. Although collected
cells sorted at 4°C were not deflected by the plates nor charged in the stream, the
phosphorylation status of p38 was visible. Endogenous p38 levels showed comparable
amounts of protein within the samples. In summary, cell hibernation during sorting at 4°C
in a completely temperature-controlled system did not prevent p38 activation.
While potential alterations by preparation or buffers were excluded, another approach
was chosen to unravel a specific FACS force responsible for the phosphorylation. We
started to switch on one force after another during FACS sorting to evaluate different
FACS forces, either mechanical or physical. By the basic principle of FACS, pressurizing
and depressurizing occur first, which do not induce p38 phosphorylation (Fig. 14 D).
However, passing cells through the narrow tubing of a cell sorter fluidic system does
activate PBMCs by shear forces in a strong manner, so that subsequent FACS forces
do not stack to the overall p38 phosphorylation. Droplet generation, charging and
deflection in the electromagnetic field did not show any additional effect on the activation
of p38 by FACS. All cell lysates were generated by mock sorting, gating on the scatter
parameter only, enabling direct comparison of sorted to unsorted. No antibody labeling
was used. Buffer conditions were ruled out by using sheath buffer only. As we were
testing the sheath fluid of the sorters by adding it to the negative controls for MAPK
signaling, we already ruled out the activation of p38 after sorting by LPS contaminations.
37
Nevertheless we verified that endotoxins were not responsible for p38 activation in
separate test.
Endotoxins like Lipopolysacchrides (LPS) from gramnegative bacteria are known to
phosphorylate p38 MAPK. A contamination of sorters is often described, so we tested
for this effect by LAL (limulus amebocyte lysate) test. We found two of the MoFloTM sorter
contaminated with LPS (ranging from 2.3 to 2.7 EU/ml), and the FACSAria III system
nearly free (0,25 EU/ml) of endotoxins (Fig. 14 E). Endotoxin levels were measured in
EU (endotoxin units) to keep the proteolytic activity of different types of endotoxins
comparable. U.S. food and drug administration (FDA) requirements for medical products
are less than 0.5 EU/ml, which equals roughly a concentration of 1ng/ml LPS. We
compared the p38 signal between the MoFlo XDP system and the FACSAria III after
sorting in PBMCs (Fig. 14 F) with anti CD3 as loading control. Here despite the
differences within sorters concerning endotoxin levels disparities in the activation of p38
were not detectable. Which limits an impact of endotoxins at this low concentration levels
to a non-detectable influence on p38, so that the FACS forces alone account for the
phosphorylation.
Shearing and impact of the sort stream are forces, which cannot be evaluated in the
system individually and are additionally indispensable for sorting, leading to the
conclusion that an activation of the p38 MAPK by FACS sorting is inevitable.

38
Figure 14: Sorter influences on the p38 MAPK pathway. (A) Immunoblot of cell lysates of hPBMCs unsorted and mock-sorted. Phosphorylation and endogenous levels of p38 are detected. The ratio of phosphorylated to cytosolic p38 was determined with ImageJ. (B) For three different sorting temperatures (21°C, 4°C and conventional, sample and receptacle holder only chilled) FACS-induced activation of MAPK p38 was verified. Phosphorylated and endogenous p38 levels were determined. (C) PBMC lysates stored or sorted at 4°C. Sorting was done with or without deflection and charging. Phosphorylation status of cells was detected for p38 and compared to endogenous levels. (D) Evaluation of different mechanical and physical FACS parameters on the phosphorylation of p38 during sorting. (E) Endotoxin (LAL) test for the sheath fluid of different cell sorter (FACSAria III, and MoFloTM Legacy and MoFloTM XDP). (F) Immunoblot of unsorted and “mock” sorted human PBMCs on different sorter (FACSAria III and MoFlo XDP). Signal detection of phosphorylated p38 for the different conditions and endogenous CD3 of the T cells within the sample as loading control.
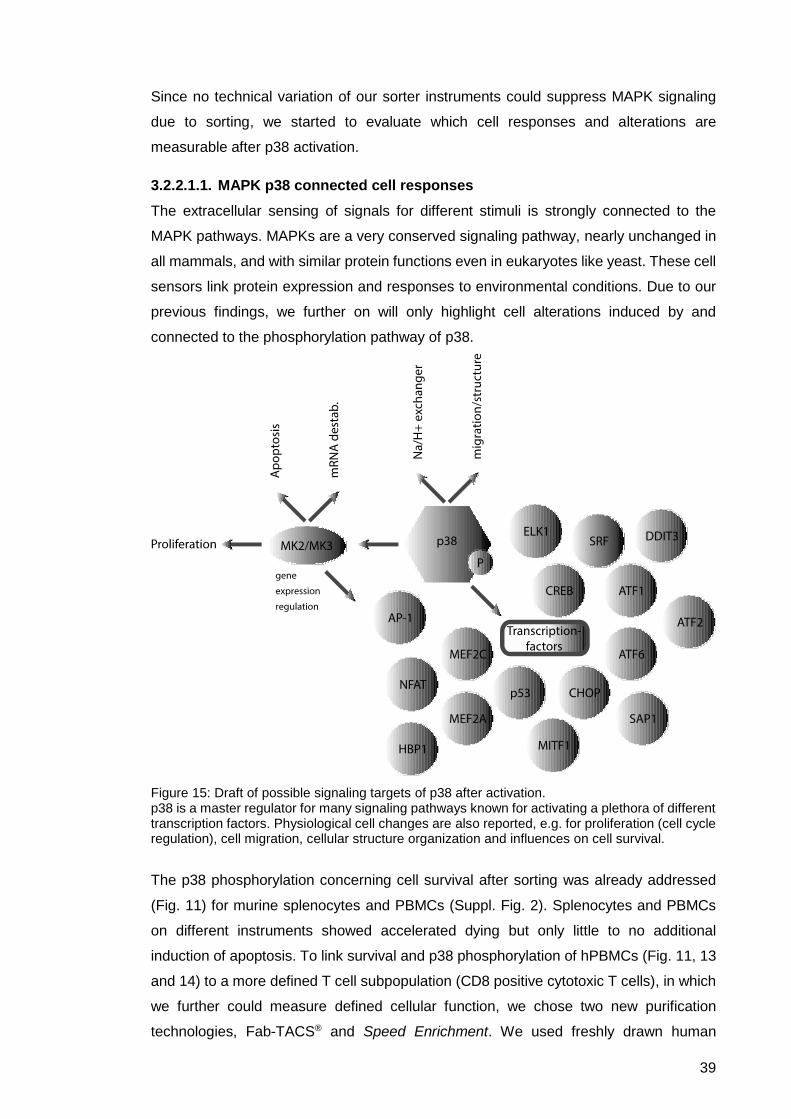
39
Since no technical variation of our sorter instruments could suppress MAPK signaling
due to sorting, we started to evaluate which cell responses and alterations are
measurable after p38 activation.
3.2.2.1.1. MAPK p38 connected cell responses
The extracellular sensing of signals for different stimuli is strongly connected to the
MAPK pathways. MAPKs are a very conserved signaling pathway, nearly unchanged in
all mammals, and with similar protein functions even in eukaryotes like yeast. These cell
sensors link protein expression and responses to environmental conditions. Due to our
previous findings, we further on will only highlight cell alterations induced by and
connected to the phosphorylation pathway of p38.
Figure 15: Draft of possible signaling targets of p38 after activation. p38 is a master regulator for many signaling pathways known for activating a plethora of different transcription factors. Physiological cell changes are also reported, e.g. for proliferation (cell cycle regulation), cell migration, cellular structure organization and influences on cell survival.
The p38 phosphorylation concerning cell survival after sorting was already addressed
(Fig. 11) for murine splenocytes and PBMCs (Suppl. Fig. 2). Splenocytes and PBMCs
on different instruments showed accelerated dying but only little to no additional
induction of apoptosis. To link survival and p38 phosphorylation of hPBMCs (Fig. 11, 13
and 14) to a more defined T cell subpopulation (CD8 positive cytotoxic T cells), in which
we further could measure defined cellular function, we chose two new purification
technologies, Fab-TACS® and Speed Enrichment. We used freshly drawn human
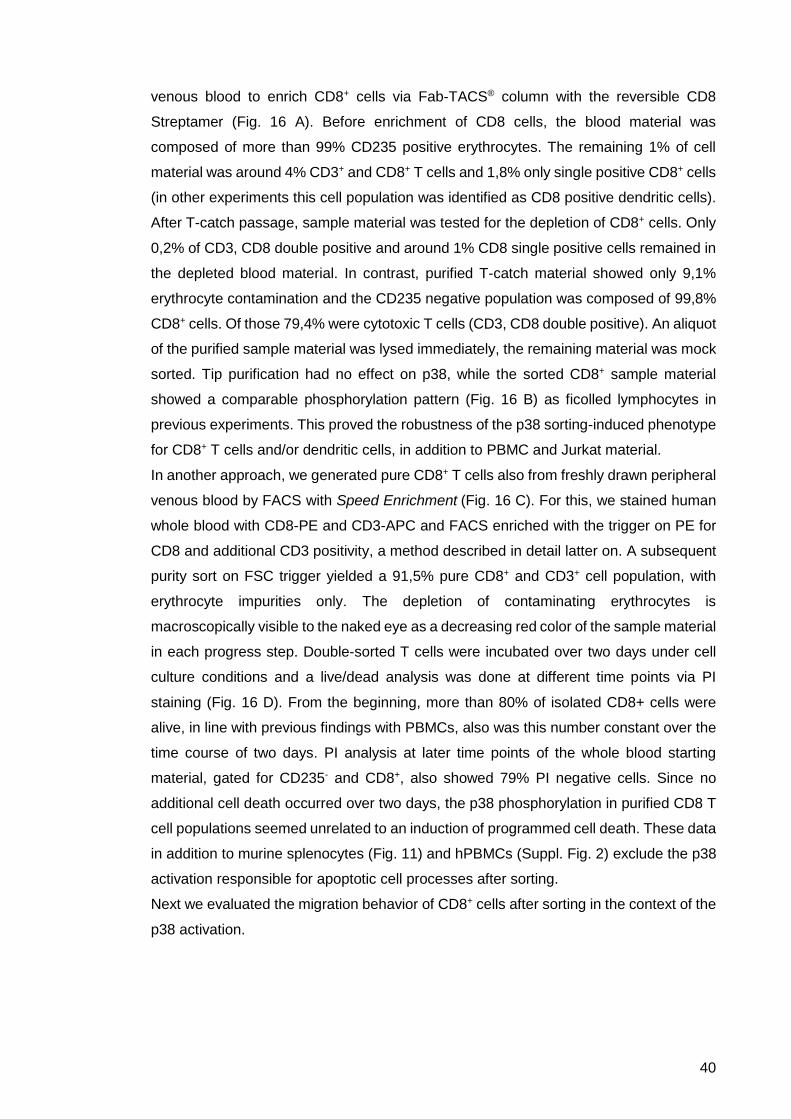
40
venous blood to enrich CD8+ cells via Fab-TACS® column with the reversible CD8
Streptamer (Fig. 16 A). Before enrichment of CD8 cells, the blood material was
composed of more than 99% CD235 positive erythrocytes. The remaining 1% of cell
material was around 4% CD3+ and CD8+ T cells and 1,8% only single positive CD8+ cells
(in other experiments this cell population was identified as CD8 positive dendritic cells).
After T-catch passage, sample material was tested for the depletion of CD8+ cells. Only
0,2% of CD3, CD8 double positive and around 1% CD8 single positive cells remained in
the depleted blood material. In contrast, purified T-catch material showed only 9,1%
erythrocyte contamination and the CD235 negative population was composed of 99,8%
CD8+ cells. Of those 79,4% were cytotoxic T cells (CD3, CD8 double positive). An aliquot
of the purified sample material was lysed immediately, the remaining material was mock
sorted. Tip purification had no effect on p38, while the sorted CD8+ sample material
showed a comparable phosphorylation pattern (Fig. 16 B) as ficolled lymphocytes in
previous experiments. This proved the robustness of the p38 sorting-induced phenotype
for CD8+ T cells and/or dendritic cells, in addition to PBMC and Jurkat material.
In another approach, we generated pure CD8+ T cells also from freshly drawn peripheral
venous blood by FACS with Speed Enrichment (Fig. 16 C). For this, we stained human
whole blood with CD8-PE and CD3-APC and FACS enriched with the trigger on PE for
CD8 and additional CD3 positivity, a method described in detail latter on. A subsequent
purity sort on FSC trigger yielded a 91,5% pure CD8+ and CD3+ cell population, with
erythrocyte impurities only. The depletion of contaminating erythrocytes is
macroscopically visible to the naked eye as a decreasing red color of the sample material
in each progress step. Double-sorted T cells were incubated over two days under cell
culture conditions and a live/dead analysis was done at different time points via PI
staining (Fig. 16 D). From the beginning, more than 80% of isolated CD8+ cells were
alive, in line with previous findings with PBMCs, also was this number constant over the
time course of two days. PI analysis at later time points of the whole blood starting
material, gated for CD235- and CD8+, also showed 79% PI negative cells. Since no
additional cell death occurred over two days, the p38 phosphorylation in purified CD8 T
cell populations seemed unrelated to an induction of programmed cell death. These data
in addition to murine splenocytes (Fig. 11) and hPBMCs (Suppl. Fig. 2) exclude the p38
activation responsible for apoptotic cell processes after sorting.
Next we evaluated the migration behavior of CD8+ cells after sorting in the context of the
p38 activation.
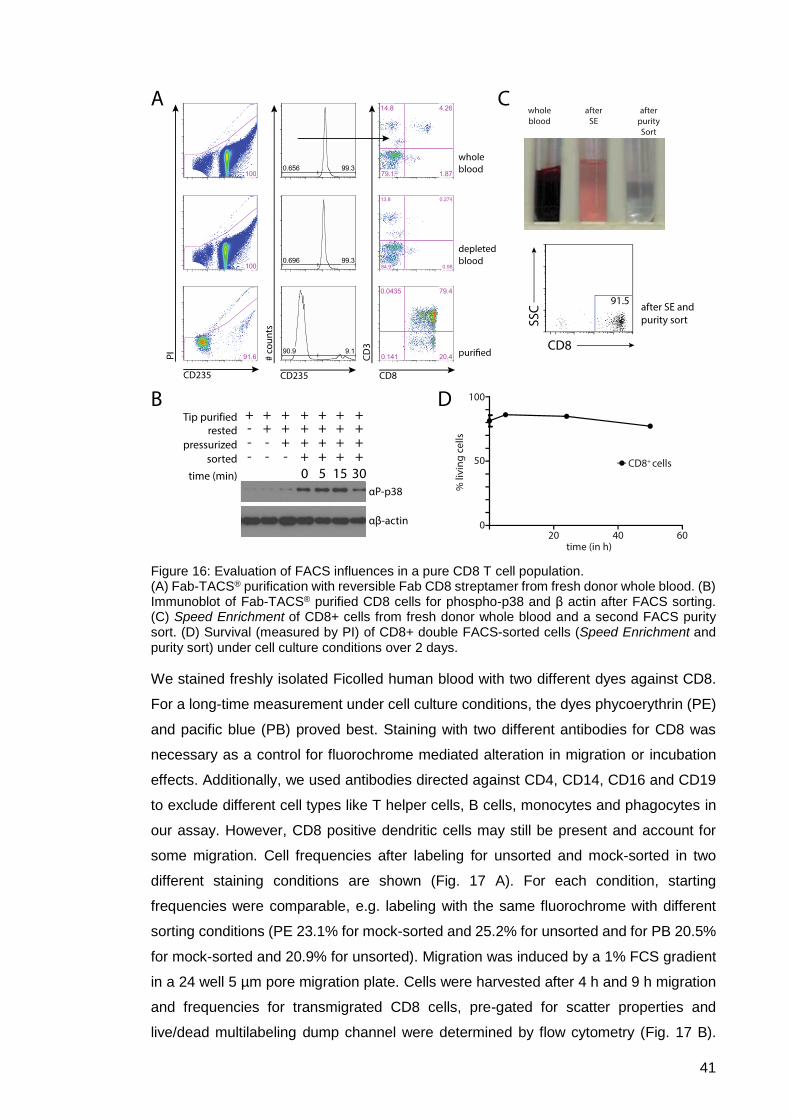
41
Figure 16: Evaluation of FACS influences in a pure CD8 T cell population. (A) Fab-TACS® purification with reversible Fab CD8 streptamer from fresh donor whole blood. (B) Immunoblot of Fab-TACS® purified CD8 cells for phospho-p38 and β actin after FACS sorting. (C) Speed Enrichment of CD8+ cells from fresh donor whole blood and a second FACS purity sort. (D) Survival (measured by PI) of CD8+ double FACS-sorted cells (Speed Enrichment and purity sort) under cell culture conditions over 2 days.
We stained freshly isolated Ficolled human blood with two different dyes against CD8.
For a long-time measurement under cell culture conditions, the dyes phycoerythrin (PE)
and pacific blue (PB) proved best. Staining with two different antibodies for CD8 was
necessary as a control for fluorochrome mediated alteration in migration or incubation
effects. Additionally, we used antibodies directed against CD4, CD14, CD16 and CD19
to exclude different cell types like T helper cells, B cells, monocytes and phagocytes in
our assay. However, CD8 positive dendritic cells may still be present and account for
some migration. Cell frequencies after labeling for unsorted and mock-sorted in two
different staining conditions are shown (Fig. 17 A). For each condition, starting
frequencies were comparable, e.g. labeling with the same fluorochrome with different
sorting conditions (PE 23.1% for mock-sorted and 25.2% for unsorted and for PB 20.5%
for mock-sorted and 20.9% for unsorted). Migration was induced by a 1% FCS gradient
in a 24 well 5 µm pore migration plate. Cells were harvested after 4 h and 9 h migration
and frequencies for transmigrated CD8 cells, pre-gated for scatter properties and
live/dead multilabeling dump channel were determined by flow cytometry (Fig. 17 B).
42
Results of the transmigration assay differed between wells and staining properties.
Nevertheless, consistent data were achieved by measuring the migration in six different
wells under different labeling conditions of PB and PE vice versa. After 9 h of incubation,
higher frequencies of cells labeled with PE in comparison to PB, unrelated to sample
preparation conditions, indicated a better detectability of this dye after incubation under
cell culture conditions (Fig. 17 C). Later time points were not measurable with this
method since tested dyes like PB (9 h) or APC (4 h) were no longer detectable. The
signal for ECD dump staining also weakened drastically after 20 h.
Therefore, migration with this setup was measured up to 9h after establishment of the
FCS gradient. Analyzed data over all time points and staining conditions did not show
any impairment in the migratory behavior of CD8 cells due to sorting. Two-way ANOVA
comparison of sorted and unsorted conditions gave a p value of 0.2714, for observing
sorting effects. Mainly labeling color and time affected the percentage of migrated CD8
cells with a p value of <0.0001. These data indicate no measurable influence of the p38
phosphorylation on cells in their migratory behavior after sorting.
Also actin and cytoskeleton rearrangements are involved in cell migration, so that
structural disruption, perturbance or reorganization of actin filaments after sorting would
indicate impairment. To further emphasize the lack of migratory alteration due to p38
activation, cell structure proteins tubulin and actin were stained with confocal microscopy
in the human bladder non-malignant epithelial cell line HCV-2985 (Suppl. Fig. 4), as
cytoskeleton analysis of primary PBMCs (Suppl. Fig. 5) or cultured Jurkat cells did not
work to our satisfaction. Despite slight differences concerning tubulin and actin, no
deformation or structure rupture was visible. Out of many image sections, four are shown
(Fig. 16 D). Two single cell format sections (cropped from a 40 times magnification) and
two complete sections are displayed. Despite slight differences between some pictures
(beakoning of cells), which were not unique for one or the other condition, observers
were not able to identify sorted versus unsorted samples reliably. A blind study with 6
people viewing 9 sections for each condition produced no reliable discernment between
sorted and unsorted pictures.
Our conclusion was made that no differences in migration or cell structure can be
visualized between FACS-sorted and unsorted cells. Thus, an influence of p38
concerning these cell functions is negligible.
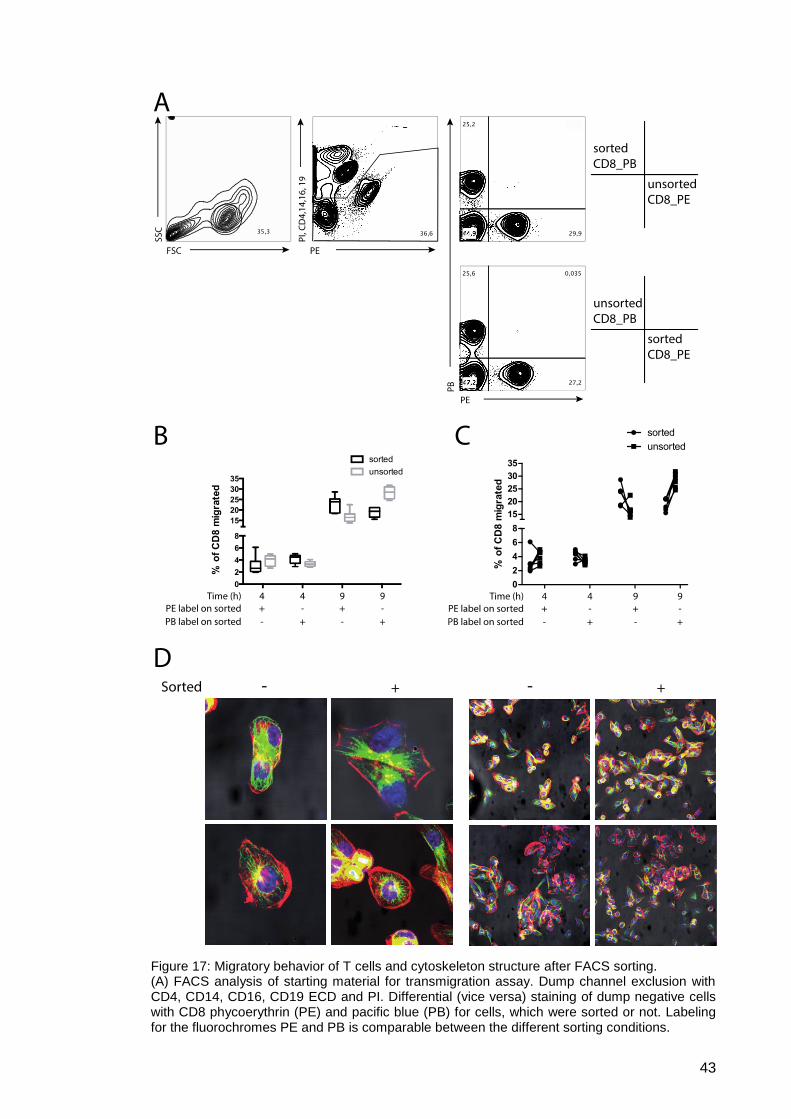
43
Figure 17: Migratory behavior of T cells and cytoskeleton structure after FACS sorting. (A) FACS analysis of starting material for transmigration assay. Dump channel exclusion with CD4, CD14, CD16, CD19 ECD and PI. Differential (vice versa) staining of dump negative cells with CD8 phycoerythrin (PE) and pacific blue (PB) for cells, which were sorted or not. Labeling for the fluorochromes PE and PB is comparable between the different sorting conditions.
44
(B) Transmigration of CD8+ T cells through a 5nm pore membrane against a 1% FCS gradient after 4h in cell culture. (C) Percentage of transmigrated CD8+ cells on a per well comparison. (D) Confocal microscopy of cell structure proteins tubulin (green) and actin (red) and the cell nucleus (blue) of mock-sorted and unsorted HCV-29 cells in an overlay. Single stains were measured for each channel also individually (Suppl. Fig. 4).
We also wanted to identify via MicroArray analysis if certain modulations of gene clusters
are related with sorting induced p38 activation. Since phosphorylated p38 activates a
plethora of transcription factors, this screening method appeared most promising to
identify possible gene clusters. In addition to transcription factors, a translation stop of
mRNA to protein is also supposed to increase overall mRNA levels. Especially mRNA
with a long half-life before cytoplasmic degradation is supposed to accumulate. In this
way the MicroArray also would addressed a possible effect of an eIF2α phosphorylation
(Suppl. Fig. 3 A).
We tested whether sorting altered mRNA profiles with two MicroArrays performed with
CD8+ cells purified with Fab-TACS® technology (Fig. 18 A). These cells were isolated
from fresh human donor blood, yielding more than 96% living cells with very good purities
above 99% CD8+. CD8+ cells were rested overnight in starving medium for
synchronization and at the next day mock-sorted or not, and then mRNA isolated for
MicroArrays immediately or after 4 h at cell culture conditions. A cluster dendrogram
analysis of the overall mRNA profiles within these conditions graphically displays the
differences through a hierarchical tree (Fig. 18 B). The incubation time accounted for the
biggest differences in mRNA profiles. Followed by the two assays, either by donor or
isolation processes. Of all conditions, the fewest differences in mRNA changes were
observed for sorted or not. The differences in the mRNA expression between mock-
sorted CD8+ cells and unsorted controls after 4 h incubation are visualized in a heatmap
(Fig. 18 C). The threshold for significantly differentially expressed mRNA changes was
set for more than 2-fold in the different groups. Out of 18.710 mRNA datasets, after
normalization two mRNA profiles remained differentially expressed. In sorted cells,
complement component 2 (C2) was overexpressed and 5´-Nucleotidase, Cytosolic IIIA
(NT5C3) was downregulated. Both C2 and NT5C3 are described in literature as protein
coding mRNA with specific function. Interestingly, C2 was also differentially expressed
when comparing sorted and mock-sorted cells at time point zero (Suppl. Fig. 5 A). Here
C2 in contrast was downregulated in mock-sorted cells, indicating a drastic increase of
this mRNA in sorted cells after the resting phase. However, C2 functions as a part of the
classical and lectin pathway in complement activation86 and is essential to activate C3,
the main opsonin in the complement pathway87. As a plasma protein physiologically
produced in the liver, it is not likely to be specifically regulated by the p38 activation of
cytotoxic T cells by sorting. More likely, the enrichment of also CD8 positive DCs after
Tip purification is the cause for this finding. Previous work already showed increased
45
mRNA levels of C2 for different macrophages under stress and inflammatory
conditions88.
For a downregulation of NT5C3 after 4 h incubation we account another cell impurity in
the samples. NT5C3 is a 5´nucleotidase and active especially in erythrocytes during their
maturation. Erythrocytes still account for 5-10% impurity after Fab-TACS® purification.
A mock sorting approach with certain FSC threshold settings may have led to a loss of
this small cell type in sorted samples, accounting for the downregulation of this mRNA.
We therefore did not see specific clusters of p38 signaling activated between sorted and
unsorted samples.
After small differences comparing mock and unsorted after 4h, we compared changes in
mRNA levels between incubation time effects. Heatmaps show data of all differentially
expressed genes between the resting phase in both unsorted and mock-sorted samples
(Suppl. Fig. 5 B and C). To exclude changes induced by the resting period, we generated
an artificial heatmap adjusted for differentially expressed genes compared to the
unsorted group (Fig. 18 D). This showed 8 differentially expressed mRNAs, of which 6
were upregulated and 2 downregulated. Seven of these regulated mRNAs were protein-
coding, with the exception for the RNA Variant U1 Small Nuclear 1, 2 and 3 (RNVU1-3),
which code for snRNA. The regulation of these protein coding genes is not closely related
to the p38 activation, however some genes can be involved die this MAPK pathway. The
X-C Motif Chemokine Ligand 1 (CML), TNF Alpha-Induced Protein 3 (TNFAIP3) and the
S100 Calcium Binding Protein A8 can be regulated by transcription factors associated
with p38 signaling. One gene could also be related an affected by a eIF2α
phosphorylation like CAMP Responsive Element Modulator (CREM), however
Immunoblots not clearly proofed an activation of this pathway (Suppl. Fig. 3 B). To
summarize, seven differentially expressed genes were too small to identify enrichments,
i.e. to identify sets of related genes, which are overrepresented and would identify a
functional network. By that, a specific p38 MAPK signaling pathway was not identified.
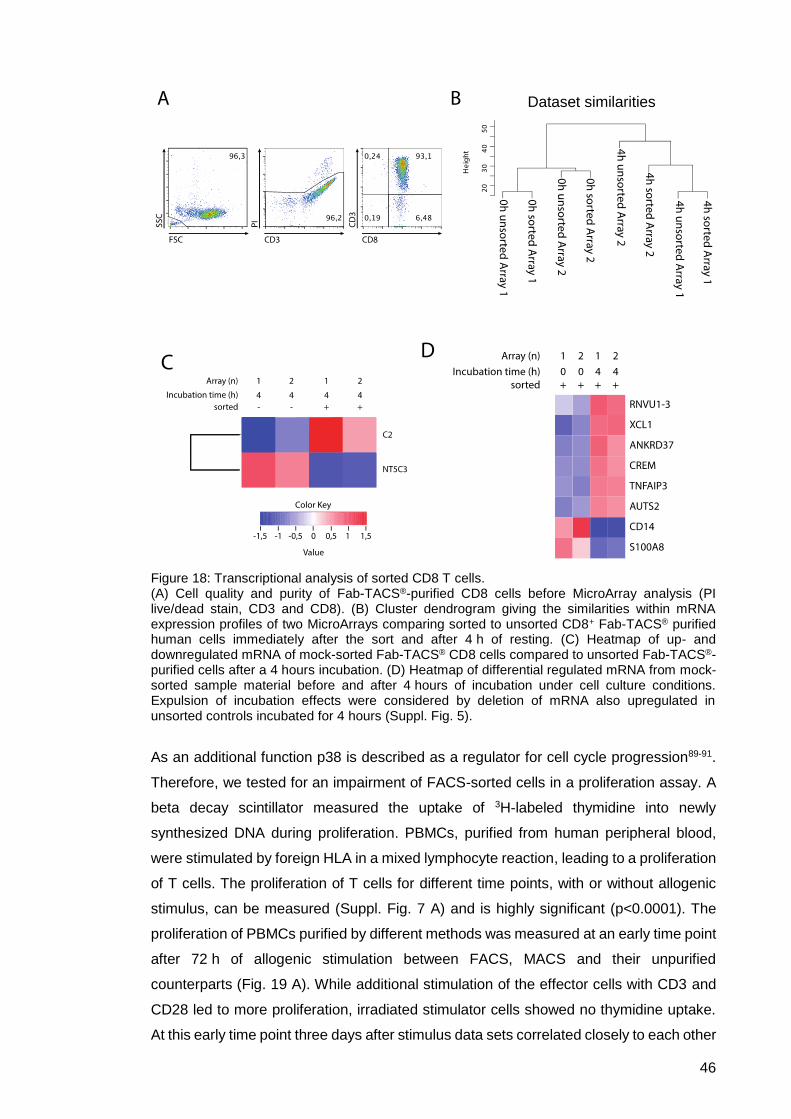
46
Figure 18: Transcriptional analysis of sorted CD8 T cells. (A) Cell quality and purity of Fab-TACS®-purified CD8 cells before MicroArray analysis (PI live/dead stain, CD3 and CD8). (B) Cluster dendrogram giving the similarities within mRNA expression profiles of two MicroArrays comparing sorted to unsorted CD8+ Fab-TACS® purified human cells immediately after the sort and after 4 h of resting. (C) Heatmap of up- and downregulated mRNA of mock-sorted Fab-TACS® CD8 cells compared to unsorted Fab-TACS®-purified cells after a 4 hours incubation. (D) Heatmap of differential regulated mRNA from mock-sorted sample material before and after 4 hours of incubation under cell culture conditions. Expulsion of incubation effects were considered by deletion of mRNA also upregulated in unsorted controls incubated for 4 hours (Suppl. Fig. 5).
As an additional function p38 is described as a regulator for cell cycle progression89-91.
Therefore, we tested for an impairment of FACS-sorted cells in a proliferation assay. A
beta decay scintillator measured the uptake of 3H-labeled thymidine into newly
synthesized DNA during proliferation. PBMCs, purified from human peripheral blood,
were stimulated by foreign HLA in a mixed lymphocyte reaction, leading to a proliferation
of T cells. The proliferation of T cells for different time points, with or without allogenic
stimulus, can be measured (Suppl. Fig. 7 A) and is highly significant (p<0.0001). The
proliferation of PBMCs purified by different methods was measured at an early time point
after 72 h of allogenic stimulation between FACS, MACS and their unpurified
counterparts (Fig. 19 A). While additional stimulation of the effector cells with CD3 and
CD28 led to more proliferation, irradiated stimulator cells showed no thymidine uptake.
At this early time point three days after stimulus data sets correlated closely to each other
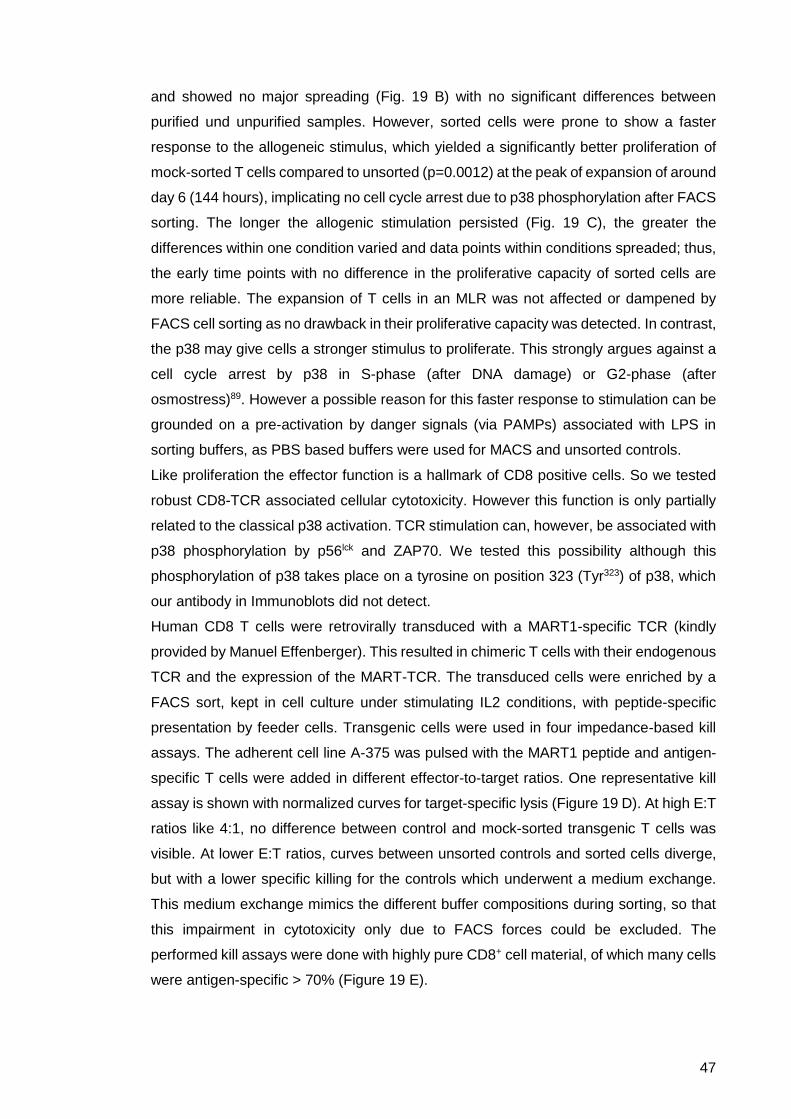
47
and showed no major spreading (Fig. 19 B) with no significant differences between
purified und unpurified samples. However, sorted cells were prone to show a faster
response to the allogeneic stimulus, which yielded a significantly better proliferation of
mock-sorted T cells compared to unsorted (p=0.0012) at the peak of expansion of around
day 6 (144 hours), implicating no cell cycle arrest due to p38 phosphorylation after FACS
sorting. The longer the allogenic stimulation persisted (Fig. 19 C), the greater the
differences within one condition varied and data points within conditions spreaded; thus,
the early time points with no difference in the proliferative capacity of sorted cells are
more reliable. The expansion of T cells in an MLR was not affected or dampened by
FACS cell sorting as no drawback in their proliferative capacity was detected. In contrast,
the p38 may give cells a stronger stimulus to proliferate. This strongly argues against a
cell cycle arrest by p38 in S-phase (after DNA damage) or G2-phase (after
osmostress)89. However a possible reason for this faster response to stimulation can be
grounded on a pre-activation by danger signals (via PAMPs) associated with LPS in
sorting buffers, as PBS based buffers were used for MACS and unsorted controls.
Like proliferation the effector function is a hallmark of CD8 positive cells. So we tested
robust CD8-TCR associated cellular cytotoxicity. However this function is only partially
related to the classical p38 activation. TCR stimulation can, however, be associated with
p38 phosphorylation by p56lck and ZAP70. We tested this possibility although this
phosphorylation of p38 takes place on a tyrosine on position 323 (Tyr323) of p38, which
our antibody in Immunoblots did not detect.
Human CD8 T cells were retrovirally transduced with a MART1-specific TCR (kindly
provided by Manuel Effenberger). This resulted in chimeric T cells with their endogenous
TCR and the expression of the MART-TCR. The transduced cells were enriched by a
FACS sort, kept in cell culture under stimulating IL2 conditions, with peptide-specific
presentation by feeder cells. Transgenic cells were used in four impedance-based kill
assays. The adherent cell line A-375 was pulsed with the MART1 peptide and antigen-
specific T cells were added in different effector-to-target ratios. One representative kill
assay is shown with normalized curves for target-specific lysis (Figure 19 D). At high E:T
ratios like 4:1, no difference between control and mock-sorted transgenic T cells was
visible. At lower E:T ratios, curves between unsorted controls and sorted cells diverge,
but with a lower specific killing for the controls which underwent a medium exchange.
This medium exchange mimics the different buffer compositions during sorting, so that
this impairment in cytotoxicity only due to FACS forces could be excluded. The
performed kill assays were done with highly pure CD8+ cell material, of which many cells
were antigen-specific > 70% (Figure 19 E).
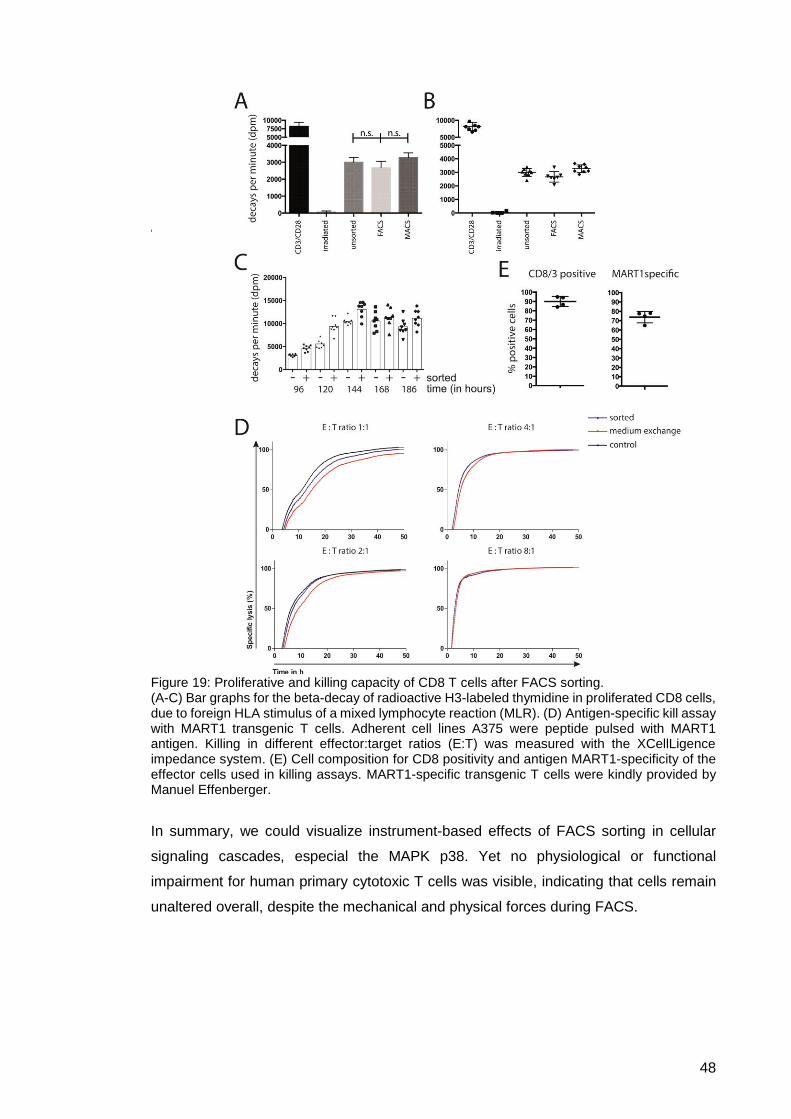
48
Figure 19: Proliferative and killing capacity of CD8 T cells after FACS sorting. (A-C) Bar graphs for the beta-decay of radioactive H3-labeled thymidine in proliferated CD8 cells, due to foreign HLA stimulus of a mixed lymphocyte reaction (MLR). (D) Antigen-specific kill assay with MART1 transgenic T cells. Adherent cell lines A375 were peptide pulsed with MART1 antigen. Killing in different effector:target ratios (E:T) was measured with the XCellLigence impedance system. (E) Cell composition for CD8 positivity and antigen MART1-specificity of the effector cells used in killing assays. MART1-specific transgenic T cells were kindly provided by Manuel Effenberger.
In summary, we could visualize instrument-based effects of FACS sorting in cellular
signaling cascades, especial the MAPK p38. Yet no physiological or functional
impairment for human primary cytotoxic T cells was visible, indicating that cells remain
unaltered overall, despite the mechanical and physical forces during FACS.
49
3.3. New technological sorting approaches
As already mentioned, FACS can only be used for applications fitting to its technical
requirements. With a 70 µm nozzle, the frequency for droplet generation is around
100.000 Hz, generating the same number of droplets (105) per second, which is the
upper limitation of events per second (eps) that potentially can be sorted. Another
limitation in sorting concerning electronics and hardware is the digital pulse the
instrument is able to process. The best sorters on the market work with a 32-bit system,
which enables processing of up to 200.000 eps. Another limit is the time the sorter needs
to discriminate between events, this is given by the passage time of a particle through
the laser beam. Normally the laser beam is focused to a diameter of around 100µm when
hitting the cells. While this time is also dependent on the cell size, normally a passage
of a blood cell takes 1-4 µsec, which limits the single cell resolution of a FACS instrument
also to around 1.000.000 - 250.000 eps (instrument dependent). Above this value so
called swarm effects occur and single cell resolution is lost.
Under perfect conditions FACS is suitable to sort purities of above 99%, with sample
flow rates at 1/5th of the frequency used for droplet generation (approx. 20.000 EPS with
100.000 Hz). Yet this purity is influenced by the sorting mode, where purity and yield
function like a pair of scales. These two “physical quantities” of sorting are counterparts,
as one impedes the other. Three different types of sorting modes exist: “single”, “purify”
and “enrich”. With “single” mode the scale leans towards high purity, yet reducing the
yield. The “purify” mode keeps the scale pans in balance, with a light discount for both
scales. The last mode, “enrich”, finally bends the scale towards yield, indicating that this
mode is best suited to prevent the loss of events. Even though this sorting mode is not
focusing on high purities, it is still limited on one hand by the upper limits of droplet
generation, and on the other by data processing speed and single cell resolution.
For this reason due to time concerns, FACS is by far not the best method of choice to
purify out of large cell numbers. Because of this, we started to improve a method already
published92. This method of fluorescence triggering so far had few applications in the
fields of cytometry; however, we show some promising new applications. So far, trigger
on a fluorescence channel has already been used for the detection of small particles,
such as bacteria or extracellular vesicles93,94, as they are difficult to characterize by
scatter properties as reported 95.
3.3.1. Speed Enrichment
For rare event sorting with frequencies lower than 1:10.000 out of a high cell count
sample, conventional sorting reaches its limits, considering the capacity of sorters but
50
also personnel in facilities. For example, when sorting 1x10⁹ cells, a cell number easily
reached in Ficoll-purified buffy coats, it takes around 9 h with conventional sorter settings
to process. To overcome all these time and instrument limitations in one step, we first
apply a sorting in form of a pre-enrichment. To achieve this, the event detection by the
instrument is altered. The event detection, which is an electrical pulse in a PMT, can be
adjusted to any channel on modern FACS instruments. Further on, the so-called “trigger”
determines in which channel the initial signal is measured. By default and historically
evolved, the trigger is on forward scatter (Fig. 20 A), a measurement for cell size. We in
contrast set the signal detection on a fluorescence parameter (Fig. 20 C). The same way
as with FSC triggering, additional information for other channels can be measured to the
initial signal. PMTs are constantly generating signals, either by electronic noise or light
pollution; therefore a certain signal strength threshold is set, for signal generation. This
threshold barrier is freely adjustable. For conventional cell sorting this threshold is used
for FSC signals, to exclude noise or protein aggregates, cell debris or other small
structures (Fig 20 A, red and dotted lines).
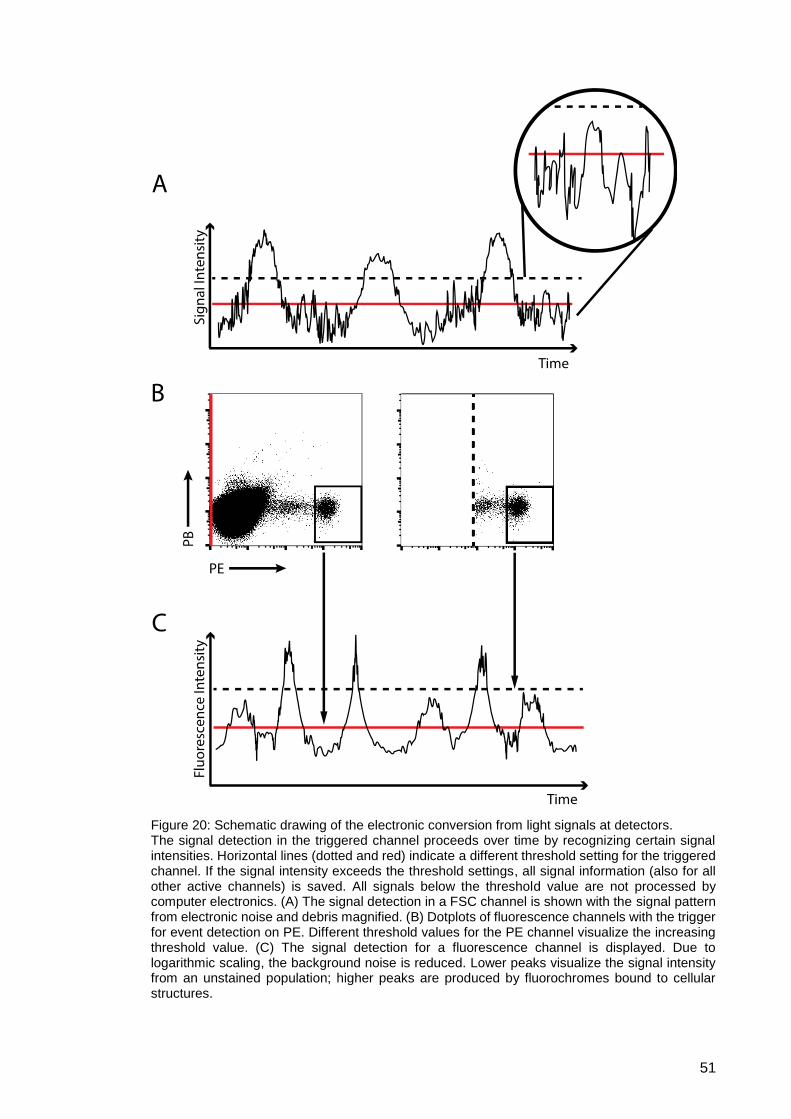
51
Figure 20: Schematic drawing of the electronic conversion from light signals at detectors. The signal detection in the triggered channel proceeds over time by recognizing certain signal intensities. Horizontal lines (dotted and red) indicate a different threshold setting for the triggered channel. If the signal intensity exceeds the threshold settings, all signal information (also for all other active channels) is saved. All signals below the threshold value are not processed by computer electronics. (A) The signal detection in a FSC channel is shown with the signal pattern from electronic noise and debris magnified. (B) Dotplots of fluorescence channels with the trigger for event detection on PE. Different threshold values for the PE channel visualize the increasing threshold value. (C) The signal detection for a fluorescence channel is displayed. Due to logarithmic scaling, the background noise is reduced. Lower peaks visualize the signal intensity from an unstained population; higher peaks are produced by fluorochromes bound to cellular structures.
52
In contrast, when the trigger is set to a fluorescence channel, particles are detected due
to their intrinsic fluorescence and no longer by their size. Additionally added antibodies,
which are conjugated to fluorochromes detected in this channel, can be used to
discriminate target populations from intrinsic fluorescence (Fig. 20 B). By increasing the
threshold for the triggered fluorescence channel (Fig. 20 B second plot), the instrument
recognizes, processes and displays only the events stained for a specific marker. As
indicated in the last graphic (Fig. 20 C), fluorescence triggering also generates noise
signals of interfering laser light and electronics when the threshold value is to low (noise
below red line). By using a fluorescently stained marker, thus obtaining information about
cell properties, the threshold can be set to eliminate unlabeled intrinsic fluorescence
events (increasing threshold from red to dotted line). That allows FACS to purify one
specific marker, similar to MACS positive enrichment. But in contrast with the exception
that additional phenotype marker staining can be added but only to the initial target cell
population. This way sorting criteria for other fluorescence channels or size and
granularity can be added in a gating strategy und single cell resolution is still possible for
the target population.
3.3.2. Properties of Speed Enrichment and scientific benefits
In conventional cell sorting, with the trigger on forward scatter (FSC), every particle is
detected by a morphological parameter as an event. Thus the total number of processed
cells directly correlates with the duration of the enrichment process, which proves difficult
during high throughput analysis and sorting. For detection and isolation of rare particles
or cell populations with frequencies lower than 1:104, large amounts of material are
required to obtain sufficient numbers of target cells for further experimentation. In
contrast by fluorescence triggering, the event rate can drop drastically, especially when
it is applied on a small population size or rare events and the overall sample flow rate
can be increased. For most applications during Speed Enrichment a pressure difference
between sheath and sample pressure of 2 psi, which equals a 3 µl/sec or 10.8 ml/h
sample flow rate, was adjusted. Flow rates of 106 particles per second were determined
when sorting out of whole blood, while the majority of these particles were not detected.
Thereby 10 particles were confined in a droplet generated at the end of the sheath
stream (Supp. Fig. 8). Due to the impurities in the droplets, this method is a pre-
enrichment only. The benefit of increased sample flow rate is best seen by comparing
sorting times in relation to the sample cell number (Suppl. Fig. 9). In order to obtain the
high purities normally expected from FACS sorting, a second sort on FSC triggering is
53
needed, but subsequent purity sorts are drastically shorter due to the previous
enrichment.
So far, the method of fluorescence triggered sorting is rarely applied in the field of flow
cytometry, therefore we tested this method and its limitations and we directly compared
MACS and SE as enrichment methods for rare event analysis.
3.3.3. Speed Enrichment for rare event enrichment and the comparison to MACS
First we evaluated Speed Enrichment and its limitations by spiking PE-stained CD8 cells
into unstained PBMCs with different low starting frequencies, comparable to the
demands of rare event analysis. For this 10.000 to 1.000 PE positive cells were sorted
into 1ml sample material containing 1x10⁸ to 1x10⁹ PBMCs (Fig. 21 A). This way target
cell frequencies of 1:104, 105 and 106 were generated. These samples were enriched
with a PE-trigger and gated in pseudocolor plots (Fig. 21 A). Subsequent FACS analysis
(Fig. 21 A) yielded enrichments of 10.8% from a starting frequency of 0.01%, increasing
the target cell population a 1.000-fold. Enrichment for lower cell frequencies even yielded
better enrichment factors of 6.000-fold (1:105), and 3.000-fold (1:106). The lowest starting
frequency of one cell in a million (0.0001%) resulted in a purity of 0.37%, which was then
sufficient for conventional single cell sorting afterwards. This sample had a lower
enrichment factor, as well as a drop in purity. Because of a denser starting material (109
compared to 108 cells in 1 ml starting sample).
To address the concerns for a loss of target cells during these two sorting processes, we
tested the SE method compared to the gold standard in cell enrichment MACS, in a
parallel experimental setup. Here a total of 200 CD8-PE positive cells additionally also
labeled with anti-PE_MicroBeads were spiked into freshly isolated PBMCs. This resulted
in a target cell frequency of 0.000275% for the starting samples (Fig. 21 B). The
experimental design was in favor of MACS, as PE_MicroBead-labeled cells were already
used for spiking. Four samples each were prepared equally and enriched either by
MACS (in parallel) or SE (subsequently). Both enrichments took around 1h. Scaling up
this experiment with respect to sample numbers would increase the processing time for
SE, yet only slightly for MACS. The re-analyzed FACS plots showed similar purities with
both methods for enriched material (Fig. 21 B). Keeping in mind that multiple events will
be confined in one drop, SE is expected to be only a pre-enrichment, while positive
enrichment by MACS, like in this case, is meant to be a cell purification step already.
The recovery rate of 200 spiked-in cells, graphically displayed in percent, showed a p-
value between both enrichment methods of p=0.045 (Fig. 21 C) in favor for SE. Overall
numbers calculated with SEM yielded a recovery rate for MACS with 117± 5,00 cells and

54
for SE with 137±13,01 cells. The starting frequency of 2.75x10⁻⁴ could be enriched in
both methods comparable by an average factor of a thousand-fold, which is sufficient for
subsequent purity sorting. MACS and FACS performed comparably concerning the final
purity after enrichment with p=0.2261 (Fig. 21 D).
Overall the SE method showed no drawbacks in yield and purity in comparison to the
gold standard MACS. With a 68% recovery rate after SE, this method is well-suited for
low target cell counts. However, this accounts only when no staining or washing is
needed after the FACS enrichment for the subsequent purity sort.
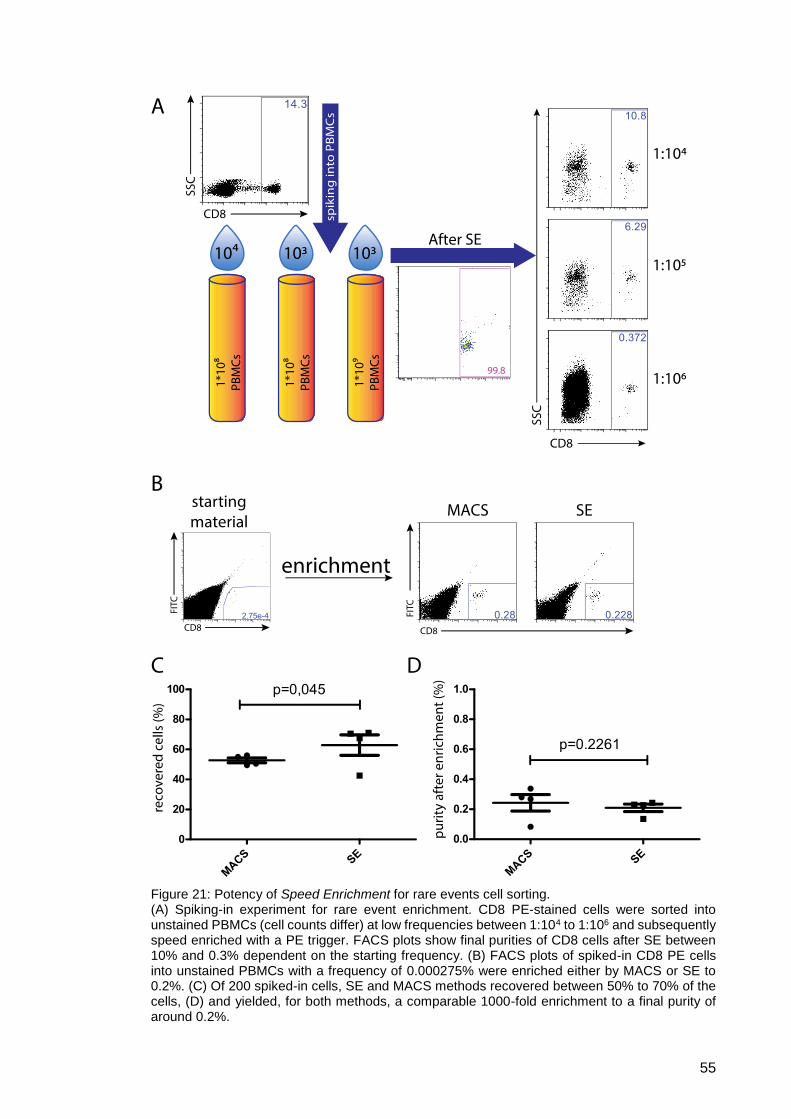
55
Figure 21: Potency of Speed Enrichment for rare events cell sorting. (A) Spiking-in experiment for rare event enrichment. CD8 PE-stained cells were sorted into unstained PBMCs (cell counts differ) at low frequencies between 1:104 to 1:106 and subsequently speed enriched with a PE trigger. FACS plots show final purities of CD8 cells after SE between 10% and 0.3% dependent on the starting frequency. (B) FACS plots of spiked-in CD8 PE cells into unstained PBMCs with a frequency of 0.000275% were enriched either by MACS or SE to 0.2%. (C) Of 200 spiked-in cells, SE and MACS methods recovered between 50% to 70% of the cells, (D) and yielded, for both methods, a comparable 1000-fold enrichment to a final purity of around 0.2%.
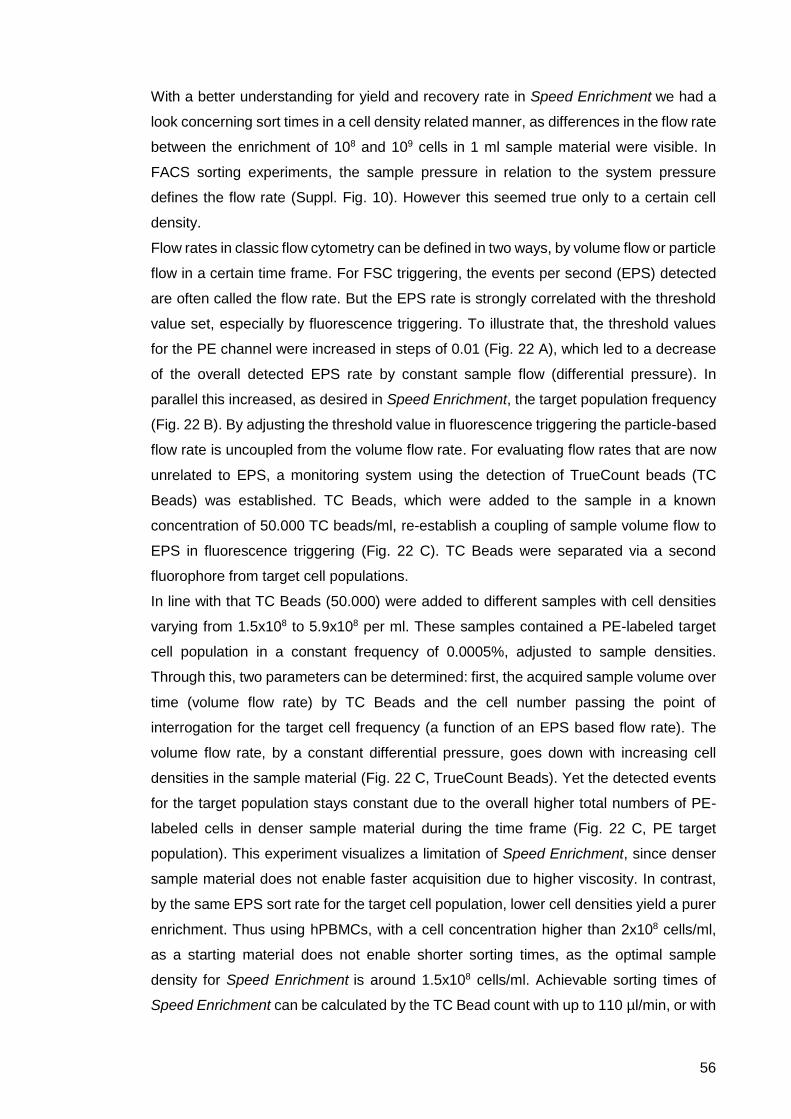
56
With a better understanding for yield and recovery rate in Speed Enrichment we had a
look concerning sort times in a cell density related manner, as differences in the flow rate
between the enrichment of 108 and 109 cells in 1 ml sample material were visible. In
FACS sorting experiments, the sample pressure in relation to the system pressure
defines the flow rate (Suppl. Fig. 10). However this seemed true only to a certain cell
density.
Flow rates in classic flow cytometry can be defined in two ways, by volume flow or particle
flow in a certain time frame. For FSC triggering, the events per second (EPS) detected
are often called the flow rate. But the EPS rate is strongly correlated with the threshold
value set, especially by fluorescence triggering. To illustrate that, the threshold values
for the PE channel were increased in steps of 0.01 (Fig. 22 A), which led to a decrease
of the overall detected EPS rate by constant sample flow (differential pressure). In
parallel this increased, as desired in Speed Enrichment, the target population frequency
(Fig. 22 B). By adjusting the threshold value in fluorescence triggering the particle-based
flow rate is uncoupled from the volume flow rate. For evaluating flow rates that are now
unrelated to EPS, a monitoring system using the detection of TrueCount beads (TC
Beads) was established. TC Beads, which were added to the sample in a known
concentration of 50.000 TC beads/ml, re-establish a coupling of sample volume flow to
EPS in fluorescence triggering (Fig. 22 C). TC Beads were separated via a second
fluorophore from target cell populations.
In line with that TC Beads (50.000) were added to different samples with cell densities
varying from 1.5x10⁸ to 5.9x10⁸ per ml. These samples contained a PE-labeled target
cell population in a constant frequency of 0.0005%, adjusted to sample densities.
Through this, two parameters can be determined: first, the acquired sample volume over
time (volume flow rate) by TC Beads and the cell number passing the point of
interrogation for the target cell frequency (a function of an EPS based flow rate). The
volume flow rate, by a constant differential pressure, goes down with increasing cell
densities in the sample material (Fig. 22 C, TrueCount Beads). Yet the detected events
for the target population stays constant due to the overall higher total numbers of PE-
labeled cells in denser sample material during the time frame (Fig. 22 C, PE target
population). This experiment visualizes a limitation of Speed Enrichment, since denser
sample material does not enable faster acquisition due to higher viscosity. In contrast,
by the same EPS sort rate for the target cell population, lower cell densities yield a purer
enrichment. Thus using hPBMCs, with a cell concentration higher than 2x10⁸ cells/ml,
as a starting material does not enable shorter sorting times, as the optimal sample
density for Speed Enrichment is around 1.5x10⁸ cells/ml. Achievable sorting times of
Speed Enrichment can be calculated by the TC Bead count with up to 110 µl/min, or with

57
approximately 2x10⁸ cells/min, which lead to the calculation of sorting times compared
to conventional cell sorting (Suppl. Fig. 8).
In another case of enrichment out of whole blood we measured event rates of up to 6x10⁷
events per minute. These high event rates were possible as blood is of low viscosity in
relation to its particle compounds. Dependent on the sample material, Speed Enrichment
can be used to enrich target cell populations at 300.000 – 1.000.000 EPS, with flow rates
of about 100 to 300 µl/min.
58
Figure 22: Potential and limitation of Speed Enrichment. (A) Dotplots for conventional triggering (FSC) and fluorescence triggering on PE with increasing thresholds for the PE channel. (B) Increase of detected target cell percentage in relation to intrinsic fluorescence by increasing threshold values. (C) Volume and EPS flow rates in Speed Enrichment are dependent of the viscosity of the starting material. TC Beads measure acquired sample volume in a one-minute time frame. PE-labeled target cell count with a constant concentration (0.0005%) correlates directly with acquired sample particles at the point of interrogation.
59
After proof of concept for the enrichment of rare populations by fluorescence triggered
Speed Enrichment and the evaluation for best sample density conditions, practical
applications for this method, which previously were not achievable with conventional
FACS sorting, were evaluated.
3.3.4. Applications for Speed Enrichment
Speed Enrichment has advantages over conventional sorting only for target cell
population counts lower than 1%, as otherwise the enrichment factor is not high enough
to decrease sorting times accordingly. Previous experiments showed best enrichment
factors for frequencies of 1:104 up to 1:106. We used Speed Enrichment therefore as an
application for the enrichment of pDCs (plasmacytoid dendritic cells) and NK cells
(natural killer cells) in murine settings in which target cell numbers were low and efficient
recovery was necessary. Cell populations like pDCs and NK cells already count as rare
event sorting in classical FACS. But we have been facing problems in which much lower
frequencies had to be enriched. Hereafter we highlight an application in a human setting,
where high recovery rates of very low sample frequencies combined with the need of
large sample amount throughput were needed. This application of Speed Enrichment for
antigen specific T cells was needed as MACS is not working properly for multimer stained
cells, especially compared to a flow cytometric approach (Suppl. Fig 12).
3.3.4.1. Enrichment of antigen-specific Cytotoxic T cells from naïve donor
repertoire
Cytotoxic T cells are crucial in adaptive immune responses against virus and intracellular
bacterial infections, as well as guardians against abnormal cells in transition to early
stages of cancer. Those CD8 positive cytotoxic T cells recognize peptide antigens
presented by surface-expressed major histocompatibility complex I (MHC I) molecules
via their T cell receptor (TCR). T cell specificity is generated randomly, but by transition
through the thymus, reactivity to autologous proteins is prevented. This way T cell
reactivity is mainly directed against viral proteins and autologous proteins altered in their
primary structure due to mutagenesis. Specific killing can be induced in these cytotoxic
T cells with the aid of certain co-stimulatory signals when antigen presented by MHC I
on other cells is recognized. Due to these properties, cytotoxic T cells hold a great
potential for adoptive T cell therapy, especially in immunocompromised or cancer
patients. The number of antigen-specific T cells can be very high in individuals who have
already encountered a specific pathogen due to clonal expansion, but in the naïve
compartment, these frequencies are relatively low. The somatic TCR recombination
theoretically allows 1012 to 1015 different clonotypes. After thymic depletion and due to
60
limited niche resources an estimated 1:106 to 107 TCR clonotypes exist in about 4x10¹⁰
total CD8 T cells96, which gives an adult human on the order of 4.000 to 40.000 CD8 T
cells per clone. However, it is already known that these numbers drastically vary
depending on the antigen peptide, with a frequency for many antigens of lower than
1:106. Isolating those cells from the naïve repertoire using conventional FACS is time
consuming work and hardly practicable.
To establish the Speed Enrichment method for cytotoxic T cell specificity, we used the
membrane protein of the influenza virus (FluMP), a well-established antigen, which
nearly every human encounters in life, making it ubiquitous on a population level. In
detail, the epitope of choice was FluMP58-66, a 9 amino acid long peptide of the influenza
matrix protein sequence from amino acid 58 to 66. As most adults either already had
influenza or were vaccinated, cells against this epitope are relatively frequent, as shown
by a double multimer stain with HLA-A2 FluMP peptide-pulsed BV421 and APC pMHC
(Fig. 23 A). 1x10⁸ Ficolled cells from fresh donor blood were stained, showing a target
FluMP frequency of 0,079% of multimer double positive CD8+, CD19- living lymphocytes.
A total of 4x10⁴ target cells were sorted using Speed Enrichment with the trigger on
APC. Analyzed with the same gating hierarchy, an enrichment of this multimer double
positive population to 33,7% was achieved. This enrichment factor of around 420-fold
proved the feasibility of this method at least for a relatively frequent antigen.
In line with these data we evaluated an enrichment of two antigens with different
frequencies in the periphery: the Wilms tumors gene 1 (WT1), an overexpressed tumor
antigen often involved in different cancer developments and the viral phosphoprotein
pp65 cytomegalovirus (CMV infection) antigen.
To analyze WT1 specific T cells, pMHC multimers with specificity to HLA-A2 molecules
loaded with the WT1126-134 peptide were used. For Speed Enrichment, 4x10⁸ cells were
stained first with pMHC multimer conjugated to APC. Even though the frequencies of T
cells recognizing the tumor antigen WT1 is very low in healthy donors, still a CD19 PE-
A610 and PI positive exclusion were possible, while the trigger was set to APC during
Speed Enrichment. After the pre-enrichment, a total number of about 1.3x10⁴ sorted APC
positive cells were subsequently stained with the second pMHC multimer conjugated to
BV421. Following purity sort with the trigger on FSC was performed on a MoFlo™
Legacy and gates were set for lymphocytes, singlets, CD19- negative, living cells, CD3+,
CD8+ and double multimer positive (Fig. 23 B). The cells double positive for the pMHC
multimer were then gated against CD45RA and CCR7 to determine T cell subsets (Fig.
23 C). Out of the initial 4x10⁸ starting cells 44 naïve T cells specific for A2-WT1126-134
could be identified and sorted as single cells for TCR extraction (Suppl. Fig. 13
collaboration with Hanna Ulrich). Starting donor material for the tumor antigen WT1 was
low, with a frequency of multimer-specific cells of 0.004 %.
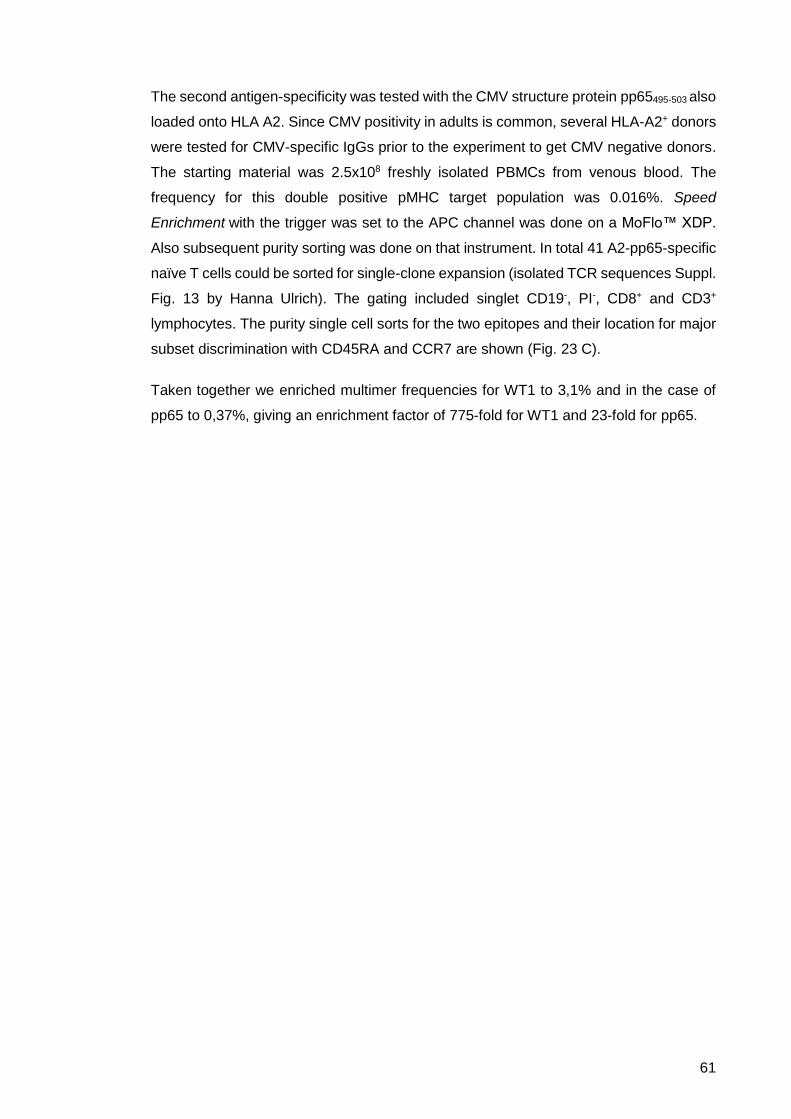
61
The second antigen-specificity was tested with the CMV structure protein pp65495-503 also
loaded onto HLA A2. Since CMV positivity in adults is common, several HLA-A2+ donors
were tested for CMV-specific IgGs prior to the experiment to get CMV negative donors.
The starting material was 2.5x10⁸ freshly isolated PBMCs from venous blood. The
frequency for this double positive pMHC target population was 0.016%. Speed
Enrichment with the trigger was set to the APC channel was done on a MoFlo™ XDP.
Also subsequent purity sorting was done on that instrument. In total 41 A2-pp65-specific
naïve T cells could be sorted for single-clone expansion (isolated TCR sequences Suppl.
Fig. 13 by Hanna Ulrich). The gating included singlet CD19-, PI-, CD8+ and CD3+
lymphocytes. The purity single cell sorts for the two epitopes and their location for major
subset discrimination with CD45RA and CCR7 are shown (Fig. 23 C).
Taken together we enriched multimer frequencies for WT1 to 3,1% and in the case of
pp65 to 0,37%, giving an enrichment factor of 775-fold for WT1 and 23-fold for pp65.
62
Figure 23: Isolation of antigen-specific T cells by Speed Enrichment. (A) Overall double multimer staining for FluMP58-66 of human PBMCs. Frequencies for the FluMP antigen in adult donors are relatively high due to infection and vaccination, indicated by a 0.07% frequency in starting material. Sample after Speed Enrichment with APC-triggered fluorescence achieved enrichment to 33.7%. (B) Gating strategy for single cell sort from naïve antigen WT-1-specific T cells of an already speed enriched sample. (C) FACS data from two different antigen specificities. Human PBMC samples post SE enrichment on APC for either WT-1126-134 or pp65495-
503. Pre-gated on CD19-, CD3+, CD8+ single living lymphocytes, all double multimer positive naïve T cells were single cell sorted.
We showed the feasibility of this method for 3 epitopes, two of which were from naïve
donors. Although TCR sequences were obtained from clonally expanded antigen
positive cells, we had no data on their functionality. We therefore designed an experiment
to show functional avidity of the TCRs by a multimer staining following single cell clonal
expansion of antigen-specific cells. For this the MART1 antigen was chosen from which
a functional TCR was already isolated for positive control. In collaboration (Manuel
Effenberger and Maria Gerget) we performed Speed Enrichment of 1*108 PBMCs from
buffy coat material. A total of 231 single cell clones were sorted in a following purity sort
on living CD19-, CD3+, CD8+, CCR7+, CD45RA+ and APC and BV421 multimer double
positive lymphocytes. After 11 days of clonal expansion with Expamer (antigen-
unspecific CD3 conditions) stimulation, all clones were analyzed in a multiplexed staining
approach (Suppl. Fig. 14 A) developed by Manuel Effenberger. Of 128 analyzed single
cell progenies, 110 showed re-stainability and a functional avidity of two TCRs by the
FACS-based off-rate assay79 (Suppl. Fig. 14 B by Maria Gerget and Manuel
Effenberger).

63
Speed Enrichment was not alone needed for the enrichment of antigen-specific T cells.
We performed Speed Enrichment for rare sub populations in collaboration with different
groups targeting different cell types of murine and human origin and demonstrated in
these experiments the feasibility of Speed Enrichment as a cost and time saving FACS-
approach for pre-enrichment.
64
4. Discussion
4.1. Construction of a modified cell sorter with strict temperature
control assessing stable temperature sorting
To untangle the long list of sorting parameters that potentially alter cells, we made some
modifications to our cell sorter. Some sorting parameters can easily be changed or
controlled during sorting like pressure effects, charging, deflection and laser light
irradiation, yet for one parameter especially, we had to make elaborate changes.
Temperature is a crucial key parameter in cell sorting. By our modifications of the fluidics
system of a MoFloTM XDP, we constructed an adjustable temperature-monitored sheath
stream at stable conditions. The resultant development enabled total temperature control
of the sample material throughout the sort, compared to conventional sorting, which only
accounts for temperature control in the sample station or the receptacle holder. We
already stated that sorting in temperature-controlled rooms is not an acceptable
approach due to the fact that condensation occurs starting at 15°C, with the above-
mentioned consequences for optics and electronics.
Our sorter reconstruction with complete temperature control from 4°C to 32°C proved
feasible, including the implementation of a temperature monitoring system. Sorting with
a fluidic system cooled down to 4°C was tested and did not show signs of a drawback in
the expected counts for yield, purity and recovery. We did notice that the differences in
the sheath temperature between chilled conventional sorting and a fully controlled
system at 4°C needed a realignment of the sheath stream to the lasers. We hypothesize
that differences of the fluids characteristics under these conditions were responsible,
most likely due to viscosity.
At our institute, we generally stain cells at 4°C to avoid possible cell activation (especially
for primary human cell material), as at higher temperatures activation and internalization
of the dye has been reported97. The major issue is a balance between reduced cell
alteration due to antibody activation and avoiding cell damage due to low temperature
exposure. For primary cells, physiological temperature sensitivity was not detected for
more than four hours, while some more sensitive cell types showed best survival and
low activation for temperatures between 8°C to 12°C. All together temperature
dependent activation and apoptosis varied for each cell type. With complete temperature
control we could avoid cell activation processes (Ca2+-Flux) induced by CD3 crosslinking
compared to conventional sorting, however benefits for activation in intracellular TCR
signal pathways were negligible.
65
We advise to validate staining intensities of antibodies for flow cytometry when working
under hypothermal conditions, despite a previous titration (Suppl. Fig. 11) as MFIs can
be severely affected. This effect is in line with the binding kinetics of antibodies, yet not
all antibodies are affected, as shown by the example of a CD4-eF450 staining. Thus,
temperature controlled but also conventional cytometry cell sorting present a balancing
act between staining properties, cell fitness and activation processes cell type
dependent.
Our temperature-controlled cell sorting approach could become a guideline for good
manufacturing practice (GMP) as a practical use and in the future of FACS cell sorting
for cell therapy, especially in combination with reversible dyes78. As FACS offers a
benefit over other purification methods by single cell resolution and characterization with
multiple marker definition; in combination with reversible dyes, the technology can also
provide minimally altered and well-defined cell products. Personalized cell therapy is a
growing field with different methods, like allogenic stem cell transplantation, tumor or cell
therapy with antigen-specific cells, either allo- or autologous, in immunocompromised
patients, which all rely on very well defined purified sample material. For this potential
clinical use in particular, it was mandatory to rule out a sorter-induced influence on cell
function and physiology.
4.2. Investigation of influences of current cell sorting
procedures on the functionality and physiology of sorted
cell types
The potential for cell alteration during cell isolation and propagation is well known.
Previous work highlighted antibodies57, temperature58, homogenization61 and cell
preparation62, buffer composition53-55 and mitogens56 as pitfalls for cell alteration. In
contrast, little is known about cell alteration caused by FACS instruments46 or the
process itself. Other recent work setting out to evaluate the influence on mRNA
expression due to FACS sorting48 only proved the difficulty of analyzing sorter influences
exclusively, without the effects of sample preparation. This project demonstrates the
importance of using cells, which are minimally manipulated prior to sorting in order to
detect any potential FACS-based influences. We addressed these problems in different
ways. First, newly developed technologies were available to generate highly defined,
pure, minimally manipulated cell populations by reversible staining and isolation out of
fresh whole blood via Fab-TACS®, as previously shown98. Second, by using preferentially
human primary blood cells, we reduced artifacts generated by immortalized cells or from
murine organ-derived cell material. Third, with the potential to control certain sort
66
parameters like temperature, pressure, buffers, laser light or stream charging and
deflection independently, we could evaluate these effects. Testing for these parameter,
we found a FACS-induced phosphorylation of a MAPK pathway. MAPK p38
phosphorylation was affected by sorting independently of buffer composition, pressure,
laser light, temperature or charging and stream deflection. Parameters like acceleration
and shearing of cells are impossible to avoid, due to the concept of sorting in a
pressurized fluid stream, and cannot be removed from the equation of sorting
parameters. But these unavoidable FACS parameters were inducing the p38 activation
in the first place. However, an evaluation of CD8 purified T cells with reversible reagents
and the Fab-TACS® technology revealed no functional changes of these cells between
sorted and their FACS-unsorted counterparts. FACS-sorted T cells were unaffected in
their cytoskeleton coordination, migratory potential and proliferative capacity and
showed nearly no changes in mRNA expression profiles, viability and effector killing
function. These findings indicate that FACS-sorted cells sense some sorting parameters
by their molecular signaling machinery, yet these stimuli seem insufficient to change the
cellular behavior, physiology or function at least for primary human T cells isolated from
blood. These findings indicate that previously performed experiments, which used the
FACS technology were not biased by this method. Especially for susceptible read out
systems like RNA-seq, MicroArrays or quantitative PCR following FACS sorting our data
support the hypothesis of unaltered mRNA expression profiles for at least human CD8 T
cells and support the hypothesis of largely unaffected single cell in vivo transfer
experiments in animal models, at least concerning cell viability and proliferative capacity
which were tested also for murine splenocytes. These data provide the basis for further
evaluation and improvements of FACS-based sorting approaches, like the possibility of
Speed Enrichment which we will discuss further on.
4.3. Development of a new technical sorting procedure to
overcome FACS impairments regarding high cell count and
rare event sorting (Speed Enrichment)
The technique of Speed Enrichment is a real asset for the enrichment of rare particles,
e.g. cell populations, which are otherwise barely detectable. In the conventional setup,
during cell isolation and propagation an event rate of only about 30,000 EPS is
recommended, and even taking a lower purity of the sorted sample into account, the
maximum event rate achievable is at about 200,000 EPS due to data processing, signal
detection and single cell resolution. This makes sorting of high particle numbers time
consuming and technically complex99 or even impossible. With the Speed Enrichment
setup, on the other hand, only those particles are detected which are labeled with a
67
certain fluorochrome and thereby have distinct fluorescence intensity. To visualize this
relation, we showed that Speed Enrichment was capable of detecting only one cell out
of a million, thus overcoming data processing issues. Hence, this method proves suitable
for isolating target cells that occur in low frequencies. We showed by using this method,
that cell numbers of 2x10⁸ were processed in less than 10 minutes. With the subsequent
purity sort requiring much less time. Flowrates for Speed Enrichment are linear with
increased differential pressure for fluid samples with no differences in viscosity due to
high particle numbers (Suppl. Fig. 10), like blood, but with dense sample material
containing more than 2x10⁸ cells/ml, Volume-flowrates decreased. Nevertheless, by
processing large cell numbers, this FACS-based method can compete with the gold
standard MACS, but furthermore enables a multi-colour purification. However, an
advantage of MACS is the possibility to automate the process and run multiple samples
at the same time (multiplexing). Experiments proved comparable yield and purity values
for both technologies in rare event enrichments, despite the fact that the experimental
design favored the MACS purification method.
Together with Laia Pascual Ponce, in her bachelor’s thesis, pMHC-labeled antigen-
specific T cells were enriched using also MACS and FACS (Suppl. Fig. 12). However
these types of experiments, in the early stages of Speed Enrichment, differed concerning
the yield and the experimental design. This was due because an older version of a cell
sorter, a MoFloTM Legacy was used. Changes in panel design and the switch to a newer
version of the instrument solved these problems. We highlight that in different types of
applications, a pre-enrichment step is known and beneficial e.g. for multimer-specific T
cells96,100,101 but also other cell types101. In the end our data showed an experimental
advantage of Speed Enrichment over MACS concerning antigen-specific T cells isolation
approaches.
With the established workflow, Speed Enrichment of antigen-specific T cells was tested
for the Wilms tumor protein 1 (WT1) and the cytomegalovirus (CMV) structure protein
pp65 from seronegative donors guaranteeing a naïve donor repertoire. The enrichment
factor for pMHC-stained cells from PBMCs was around 200 to 300-fold, yielding in
the case of WT1 200 and pp65 41 antigen-specific naïve T cells. These numbers
are in line with previously reported data for this antigen in CMV seronegative donors96,
and fit with estimated frequencies in murine systems with 20 to 200 naïve T cells for one
specific epitope102,103.
When sorting those expected low cell numbers, one important aspect is cell loss during
the FACS process. Experiments showed a recovery rate of approx. 70% for rare cell
populations of a few hundred cells.

68
Our work on a temperature controlled FACS instruments, Speed Enrichment and
definition of cell alterations by the sorter provides FACS technology and a foundation for
approval of future FACS based individualized cell therapies.
69
5. Summary
The aim of this work was to investigate influences of flow cytometry cell sorting
procedures on the functionality and physiology of cells. In order to accomplish this, a cell
sorter with strict temperature control enabling analysis of different sorting parameters
was developed. Furthermore, Speed Enrichment, was refined as a technical sorting
procedure for the fast processing of rare event cell sorting out of high cell count sample
material.
Evaluating FACS sorting induced cell alterations, we found a phosphorylation of different
MAPK pathways. The sorting process alone, independent of buffer composition or
sample pre-arrangements, affected mainly p38 phosphorylation. Individual effects like
pressure, laser light, temperature, charging and stream deflection were not responsible
for this activation. In contrast sorting associated forces like acceleration, collection tube
impact and shearing were the source of this activation but were impossible to avoid and
cannot be eliminated as sorting parameter due to instrument design. The pronounced
p38 phosphorylation was also independent of potential endotoxin (like LPS)
contaminations in the sorting systems, as controls with sorting buffer perambulated
through the system were performed. Endotoxin levels were measured and sorter with
and without detectable endotoxin contamination were tested for p38 phosphorylation in
“mock” sorted cells. In both cases the sorter induced a pronounced p38 phosphorylation.
The evaluation of p38 activation with pure human CD8+ T cells isolated by reversible
staining via Fab-TACS® technology revealed no functional changes of these cells
between sorted and their FACS-unsorted counterparts. FACS-sorted T cells were not or
minimally affected in their viability, cytoskeleton structure, migratory potential, effector
killing function, and proliferative capacity and showed only minor – if at all - changes in
mRNA expression profiles.
Our data verify FACS as method for sensitive mRNA readout systems and single cell
experiments, so that FACS, in retrospect, was also a good method of choice for in vivo
generated animal data in cell transfer experiments, as unchanged cellular behavior of
migration, proliferation, killing function and survival is indicated by experiments of users
of our FACS facility. These data provide the basis for further evaluation of FACS-based
sorting approaches for clinical applications, especially for cell therapy. These therapy
approaches seem very promising in the context of minimally affected cells by reversible
staining.
With our modifications of the fluidics system of a MoFloTM XDP, we achieved an
adjustable temperature-monitored sheath stream at stable conditions, allowing complete
temperature control throughout the sort. In general, cells are stained at 4°C to avoid cell
70
activation. Therefore, the balance between reduced cell activation due to antibody
activation and the occurrence of cell damage at low temperatures is a major issue.
Temperature sensitivity was not detected in primary cells, while some more sensitive cell
types showed better survival and low activation for temperatures between 8°C to 12°C.
We show that cytometry-based cell sorting has to balance between staining properties,
cell fitness and activation processes dependent on the working temperature and cell
type. Our temperature-controlled cell sorting approach could become a guideline in the
future for good manufacturing practice (GMP) as a practical use of FACS cell sorting in
cell therapy, especially in combination with reversible reagents. However, for this type of
application a major downside of FACS is the need to process large amounts of sample
material.
For this we established the pre-enrichment method Speed Enrichment for rare event
sorting with frequencies as low as 1:1.000.000 out of a high sample cell amount. Since
sorting 1x10⁹ cells takes about 9h with conventional sorter settings, we first applied a
FACS pre-enrichment to overcome these acquisition and data processing limitations by
triggering on fluorescence. Additional sorting criteria for other fluorescence channels, as
well as size and granularity, can be added in gating strategy. By fluorescence triggering,
the event rate drops drastically, especially when applied on small population size or rare
events. Due to the impurities in the deflected droplets, accepted and grounded by the
high sample flowrate, this method is only a pre-enrichment.
With the establishment of a workflow for rare event sorting, Speed Enrichment of T cells
specific for the epitope WT1126-134 and the CMV epitope pp65495-503 (both presented on
HLA-A2) from seronegative donors, where the frequencies of antigen-specific T cells are
extremely rare, had been performed. For both epitopes, in a subsequent FACS sort, antigen-
specific T cells were single cell sorted and clonally expanded for generation of TCR
sequences, demonstrating the feasibility of this sorting approach.
For MART1-specific T cells we verified the method of Speed Enrichment by re-staining
expanded single cell clones and measuring functional avidity by K-off rate. Speed
Enrichment reached approximately 70% recovery rate for rare cell populations of a few
hundred target cells.
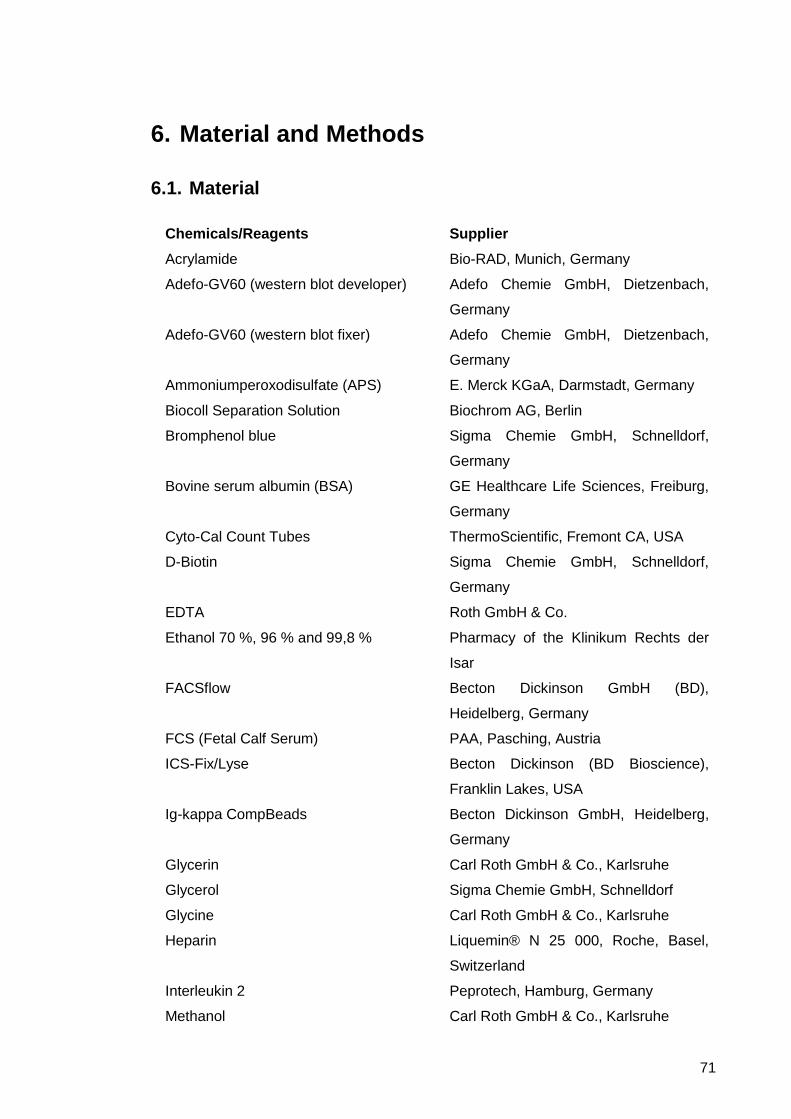
71
6. Material and Methods
6.1. Material
Chemicals/Reagents Supplier
Acrylamide Bio-RAD, Munich, Germany
Adefo-GV60 (western blot developer) Adefo Chemie GmbH, Dietzenbach,
Germany
Adefo-GV60 (western blot fixer) Adefo Chemie GmbH, Dietzenbach,
Germany
Ammoniumperoxodisulfate (APS) E. Merck KGaA, Darmstadt, Germany
Biocoll Separation Solution Biochrom AG, Berlin
Bromphenol blue Sigma Chemie GmbH, Schnelldorf,
Germany
Bovine serum albumin (BSA) GE Healthcare Life Sciences, Freiburg,
Germany
Cyto-Cal Count Tubes ThermoScientific, Fremont CA, USA
D-Biotin Sigma Chemie GmbH, Schnelldorf,
Germany
EDTA Roth GmbH & Co.
Ethanol 70 %, 96 % and 99,8 % Pharmacy of the Klinikum Rechts der
Isar
FACSflow Becton Dickinson GmbH (BD),
Heidelberg, Germany
FCS (Fetal Calf Serum) PAA, Pasching, Austria
ICS-Fix/Lyse Becton Dickinson (BD Bioscience),
Franklin Lakes, USA
Ig-kappa CompBeads Becton Dickinson GmbH, Heidelberg,
Germany
Glycerin Carl Roth GmbH & Co., Karlsruhe
Glycerol Sigma Chemie GmbH, Schnelldorf
Glycine Carl Roth GmbH & Co., Karlsruhe
Heparin Liquemin® N 25 000, Roche, Basel,
Switzerland
Interleukin 2 Peprotech, Hamburg, Germany
Methanol Carl Roth GmbH & Co., Karlsruhe
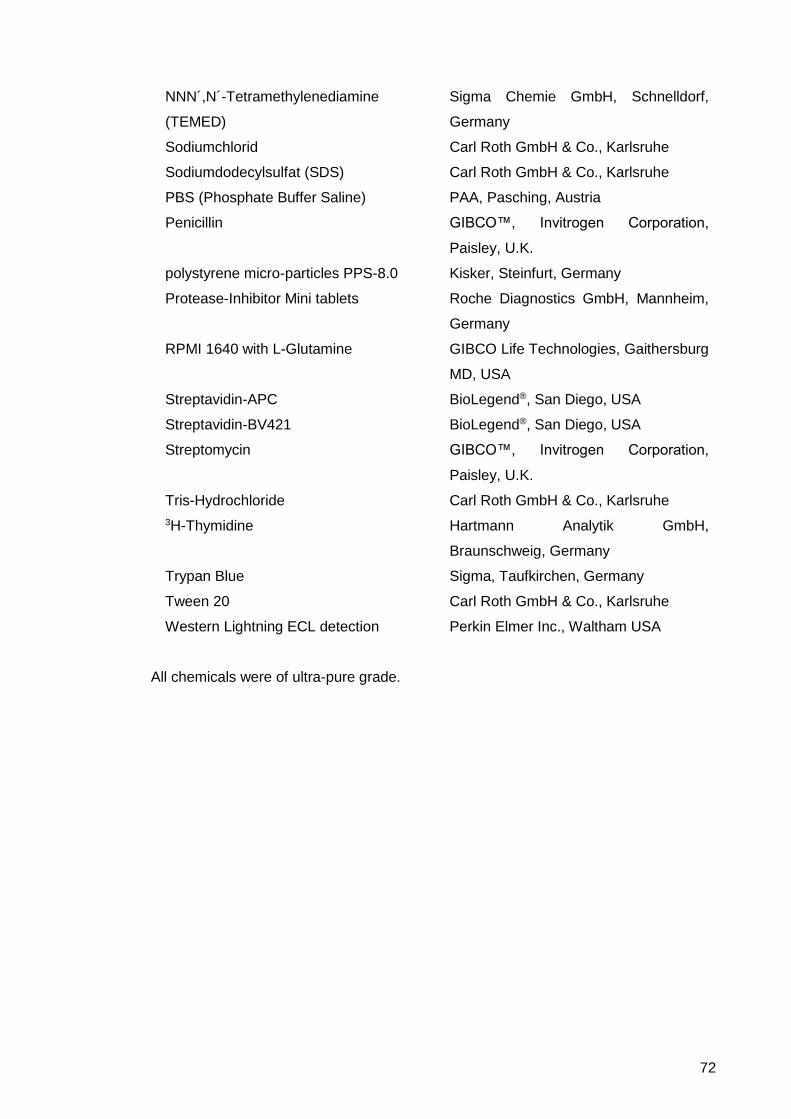
72
NNN´,N´-Tetramethylenediamine
(TEMED)
Sigma Chemie GmbH, Schnelldorf,
Germany
Sodiumchlorid Carl Roth GmbH & Co., Karlsruhe
Sodiumdodecylsulfat (SDS) Carl Roth GmbH & Co., Karlsruhe
PBS (Phosphate Buffer Saline) PAA, Pasching, Austria
Penicillin GIBCO™, Invitrogen Corporation,
Paisley, U.K.
polystyrene micro-particles PPS-8.0 Kisker, Steinfurt, Germany
Protease-Inhibitor Mini tablets Roche Diagnostics GmbH, Mannheim,
Germany
RPMI 1640 with L-Glutamine GIBCO Life Technologies, Gaithersburg
MD, USA
Streptavidin-APC BioLegend®, San Diego, USA
Streptavidin-BV421 BioLegend®, San Diego, USA
Streptomycin GIBCO™, Invitrogen Corporation,
Paisley, U.K.
Tris-Hydrochloride Carl Roth GmbH & Co., Karlsruhe
3H-Thymidine Hartmann Analytik GmbH,
Braunschweig, Germany
Trypan Blue Sigma, Taufkirchen, Germany
Tween 20 Carl Roth GmbH & Co., Karlsruhe
Western Lightning ECL detection Perkin Elmer Inc., Waltham USA
All chemicals were of ultra-pure grade.
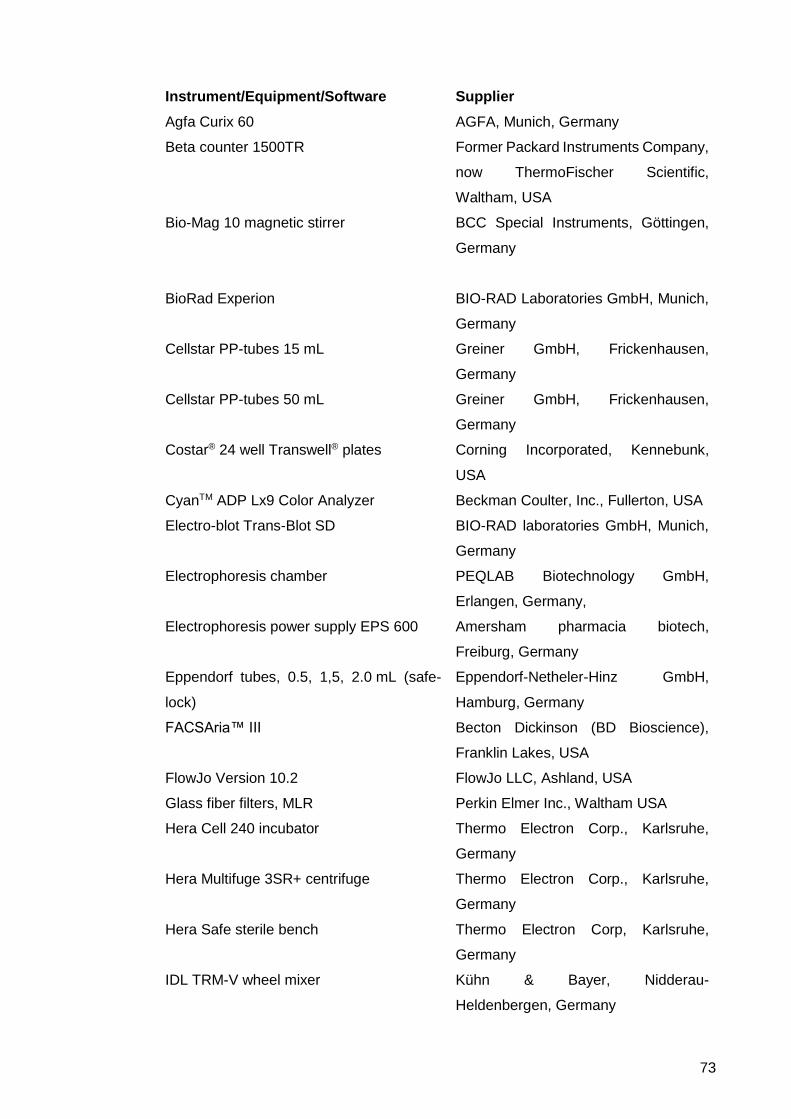
73
Instrument/Equipment/Software Supplier
Agfa Curix 60 AGFA, Munich, Germany
Beta counter 1500TR Former Packard Instruments Company,
now ThermoFischer Scientific,
Waltham, USA
Bio-Mag 10 magnetic stirrer BCC Special Instruments, Göttingen,
Germany
BioRad Experion BIO-RAD Laboratories GmbH, Munich,
Germany
Cellstar PP-tubes 15 mL Greiner GmbH, Frickenhausen,
Germany
Cellstar PP-tubes 50 mL Greiner GmbH, Frickenhausen,
Germany
Costar® 24 well Transwell® plates Corning Incorporated, Kennebunk,
USA
CyanTM ADP Lx9 Color Analyzer Beckman Coulter, Inc., Fullerton, USA
Electro-blot Trans-Blot SD BIO-RAD laboratories GmbH, Munich,
Germany
Electrophoresis chamber PEQLAB Biotechnology GmbH,
Erlangen, Germany,
Electrophoresis power supply EPS 600 Amersham pharmacia biotech,
Freiburg, Germany
Eppendorf tubes, 0.5, 1,5, 2.0 mL (safe-
lock)
Eppendorf-Netheler-Hinz GmbH,
Hamburg, Germany
FACSAria™ III Becton Dickinson (BD Bioscience),
Franklin Lakes, USA
FlowJo Version 10.2 FlowJo LLC, Ashland, USA
Glass fiber filters, MLR Perkin Elmer Inc., Waltham USA
Hera Cell 240 incubator Thermo Electron Corp., Karlsruhe,
Germany
Hera Multifuge 3SR+ centrifuge Thermo Electron Corp., Karlsruhe,
Germany
Hera Safe sterile bench Thermo Electron Corp, Karlsruhe,
Germany
IDL TRM-V wheel mixer Kühn & Bayer, Nidderau-
Heldenbergen, Germany
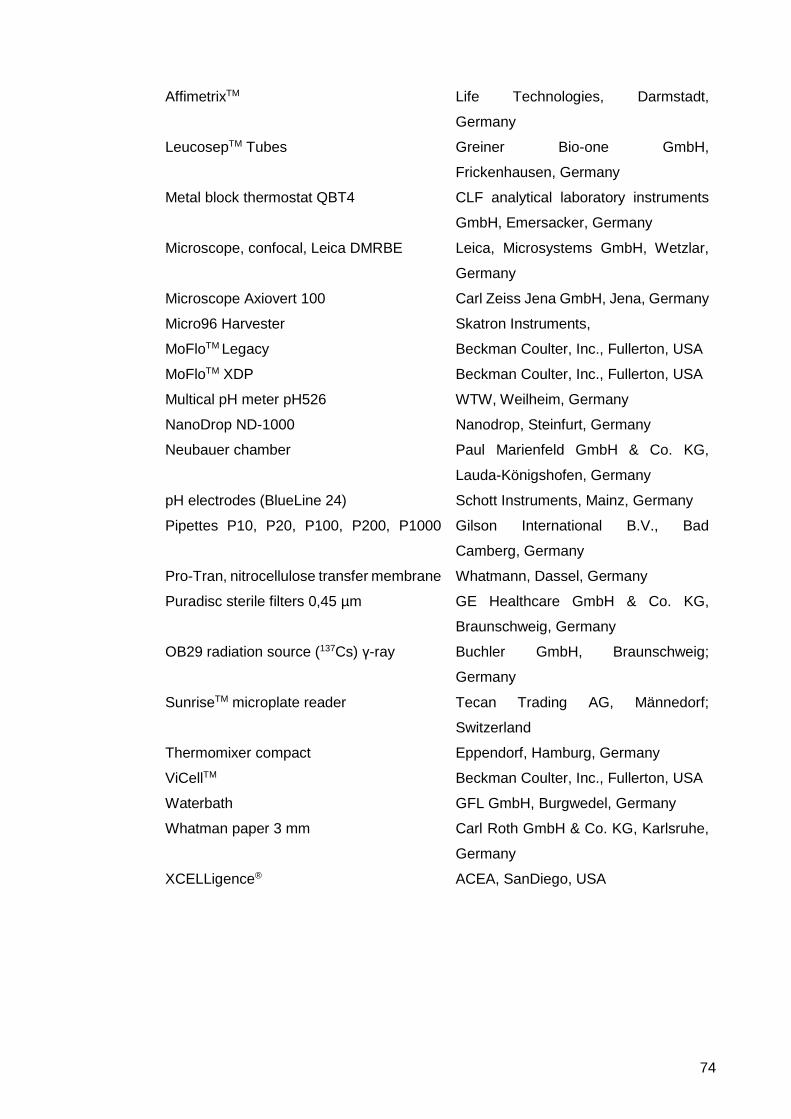
74
AffimetrixTM Life Technologies, Darmstadt,
Germany
LeucosepTM Tubes Greiner Bio-one GmbH,
Frickenhausen, Germany
Metal block thermostat QBT4 CLF analytical laboratory instruments
GmbH, Emersacker, Germany
Microscope, confocal, Leica DMRBE Leica, Microsystems GmbH, Wetzlar,
Germany
Microscope Axiovert 100 Carl Zeiss Jena GmbH, Jena, Germany
Micro96 Harvester Skatron Instruments,
MoFloTM Legacy Beckman Coulter, Inc., Fullerton, USA
MoFloTM XDP Beckman Coulter, Inc., Fullerton, USA
Multical pH meter pH526 WTW, Weilheim, Germany
NanoDrop ND-1000 Nanodrop, Steinfurt, Germany
Neubauer chamber Paul Marienfeld GmbH & Co. KG,
Lauda-Königshofen, Germany
pH electrodes (BlueLine 24) Schott Instruments, Mainz, Germany
Pipettes P10, P20, P100, P200, P1000
Gilson International B.V., Bad
Camberg, Germany
Pro-Tran, nitrocellulose transfer membrane Whatmann, Dassel, Germany
Puradisc sterile filters 0,45 µm GE Healthcare GmbH & Co. KG,
Braunschweig, Germany
OB29 radiation source (137Cs) γ-ray Buchler GmbH, Braunschweig;
Germany
SunriseTM microplate reader Tecan Trading AG, Männedorf;
Switzerland
Thermomixer compact Eppendorf, Hamburg, Germany
ViCellTM Beckman Coulter, Inc., Fullerton, USA
Waterbath GFL GmbH, Burgwedel, Germany
Whatman paper 3 mm Carl Roth GmbH & Co. KG, Karlsruhe,
Germany
XCELLigence® ACEA, SanDiego, USA

75
Kits Supplier
Annexin V Molecular probes, Eugene, Oregon, USA
Flica, Cell Event Green Molecular probes, Eugene, Oregon, USA
RNeasy Quiagen GmbH, Hilden, Germany
Fab-TACS® Traceless Affinity Cell
Selection
IBA Lifesciences, Göttingen, Germany
Pierce™ LAL Chromogenic Endotoxin
Quantitation Kit
ThermoScientific, Fremont CA, USA
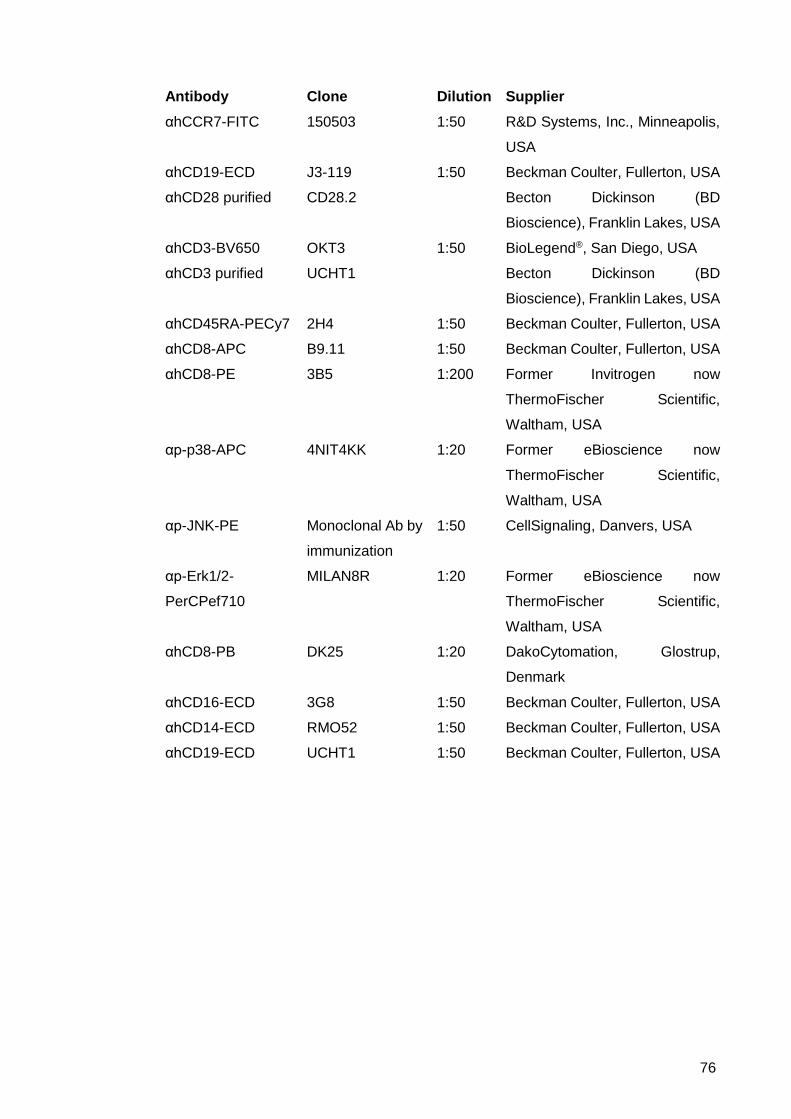
76
Antibody Clone Dilution Supplier
αhCCR7-FITC 150503 1:50 R&D Systems, Inc., Minneapolis,
USA
αhCD19-ECD J3-119 1:50 Beckman Coulter, Fullerton, USA
αhCD28 purified CD28.2 Becton Dickinson (BD
Bioscience), Franklin Lakes, USA
αhCD3-BV650 OKT3 1:50 BioLegend®, San Diego, USA
αhCD3 purified UCHT1 Becton Dickinson (BD
Bioscience), Franklin Lakes, USA
αhCD45RA-PECy7 2H4 1:50 Beckman Coulter, Fullerton, USA
αhCD8-APC B9.11 1:50 Beckman Coulter, Fullerton, USA
αhCD8-PE 3B5 1:200 Former Invitrogen now
ThermoFischer Scientific,
Waltham, USA
αp-p38-APC 4NIT4KK 1:20 Former eBioscience now
ThermoFischer Scientific,
Waltham, USA
αp-JNK-PE Monoclonal Ab by
immunization
1:50 CellSignaling, Danvers, USA
αp-Erk1/2-
PerCPef710
MILAN8R 1:20 Former eBioscience now
ThermoFischer Scientific,
Waltham, USA
αhCD8-PB DK25 1:20 DakoCytomation, Glostrup,
Denmark
αhCD16-ECD 3G8 1:50 Beckman Coulter, Fullerton, USA
αhCD14-ECD RMO52 1:50 Beckman Coulter, Fullerton, USA
αhCD19-ECD UCHT1 1:50 Beckman Coulter, Fullerton, USA
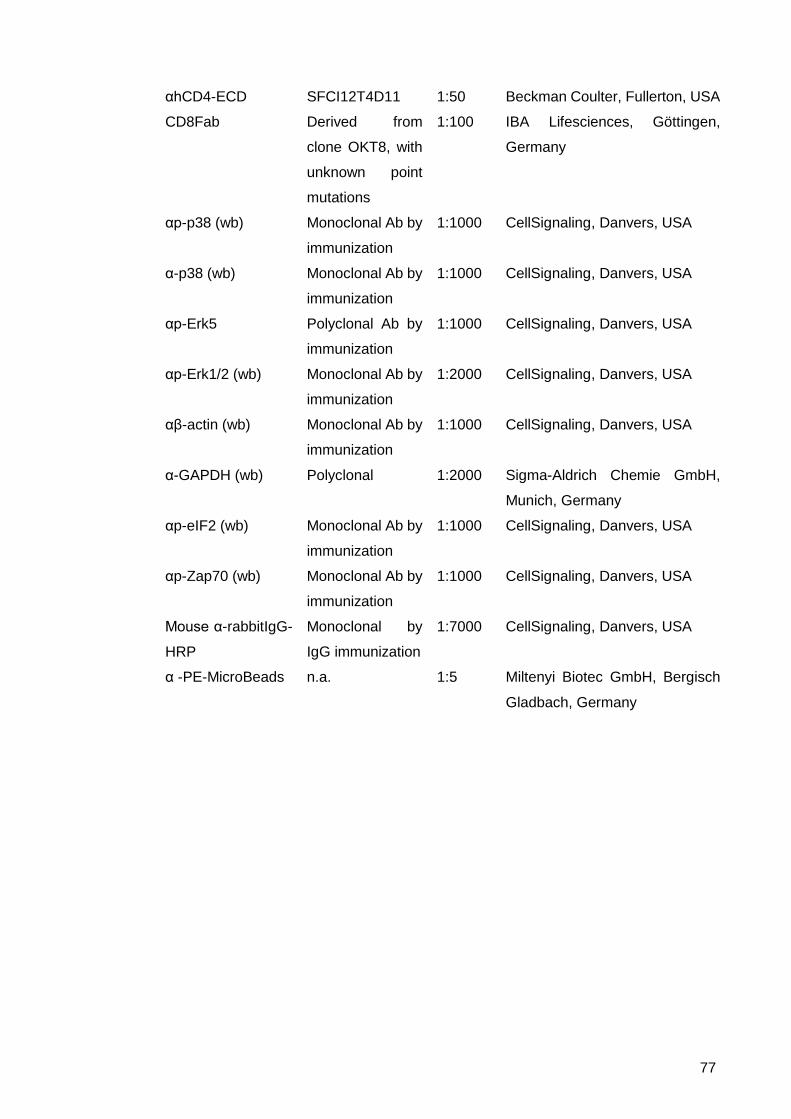
77
αhCD4-ECD SFCI12T4D11 1:50 Beckman Coulter, Fullerton, USA
CD8Fab Derived from
clone OKT8, with
unknown point
mutations
1:100 IBA Lifesciences, Göttingen,
Germany
αp-p38 (wb) Monoclonal Ab by
immunization
1:1000 CellSignaling, Danvers, USA
α-p38 (wb) Monoclonal Ab by
immunization
1:1000 CellSignaling, Danvers, USA
αp-Erk5 Polyclonal Ab by
immunization
1:1000 CellSignaling, Danvers, USA
αp-Erk1/2 (wb) Monoclonal Ab by
immunization
1:2000 CellSignaling, Danvers, USA
αβ-actin (wb) Monoclonal Ab by
immunization
1:1000 CellSignaling, Danvers, USA
α-GAPDH (wb) Polyclonal 1:2000 Sigma-Aldrich Chemie GmbH,
Munich, Germany
αp-eIF2 (wb) Monoclonal Ab by
immunization
1:1000 CellSignaling, Danvers, USA
αp-Zap70 (wb) Monoclonal Ab by
immunization
1:1000 CellSignaling, Danvers, USA
Mouse α-rabbitIgG-
HRP
Monoclonal by
IgG immunization
1:7000 CellSignaling, Danvers, USA
α -PE-MicroBeads n.a. 1:5 Miltenyi Biotec GmbH, Bergisch
Gladbach, Germany
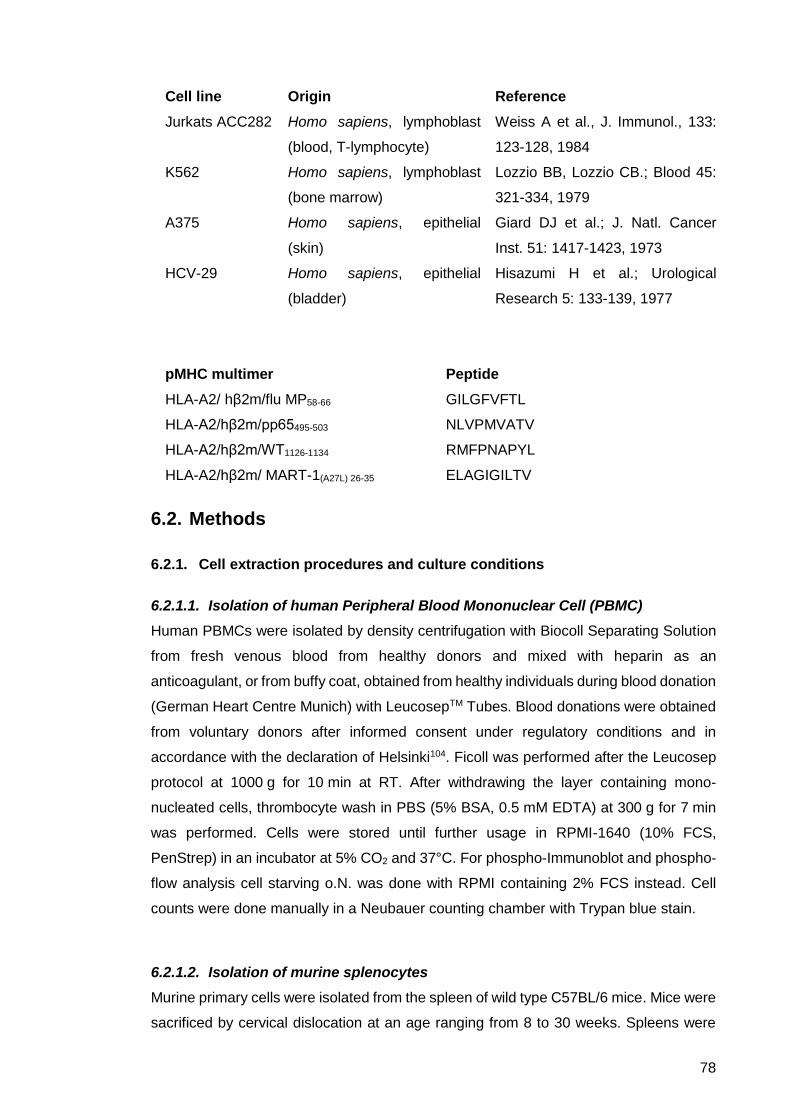
78
Cell line Origin Reference
Jurkats ACC282 Homo sapiens, lymphoblast
(blood, T-lymphocyte)
Weiss A et al., J. Immunol., 133:
123-128, 1984
K562 Homo sapiens, lymphoblast
(bone marrow)
Lozzio BB, Lozzio CB.; Blood 45:
321-334, 1979
A375 Homo sapiens, epithelial
(skin)
Giard DJ et al.; J. Natl. Cancer
Inst. 51: 1417-1423, 1973
HCV-29 Homo sapiens, epithelial
(bladder)
Hisazumi H et al.; Urological
Research 5: 133-139, 1977
pMHC multimer Peptide
HLA-A2/ hβ2m/flu MP58-66 GILGFVFTL
HLA-A2/hβ2m/pp65495-503 NLVPMVATV
HLA-A2/hβ2m/WT1126-1134 RMFPNAPYL
HLA-A2/hβ2m/ MART-1(A27L) 26-35 ELAGIGILTV
6.2. Methods
6.2.1. Cell extraction procedures and culture conditions
6.2.1.1. Isolation of human Peripheral Blood Mononuclear Cell (PBMC)
Human PBMCs were isolated by density centrifugation with Biocoll Separating Solution
from fresh venous blood from healthy donors and mixed with heparin as an
anticoagulant, or from buffy coat, obtained from healthy individuals during blood donation
(German Heart Centre Munich) with LeucosepTM Tubes. Blood donations were obtained
from voluntary donors after informed consent under regulatory conditions and in
accordance with the declaration of Helsinki104. Ficoll was performed after the Leucosep
protocol at 1000 g for 10 min at RT. After withdrawing the layer containing mono-
nucleated cells, thrombocyte wash in PBS (5% BSA, 0.5 mM EDTA) at 300 g for 7 min
was performed. Cells were stored until further usage in RPMI-1640 (10% FCS,
PenStrep) in an incubator at 5% CO2 and 37°C. For phospho-Immunoblot and phospho-
flow analysis cell starving o.N. was done with RPMI containing 2% FCS instead. Cell
counts were done manually in a Neubauer counting chamber with Trypan blue stain.
6.2.1.2. Isolation of murine splenocytes
Murine primary cells were isolated from the spleen of wild type C57BL/6 mice. Mice were
sacrificed by cervical dislocation at an age ranging from 8 to 30 weeks. Spleens were
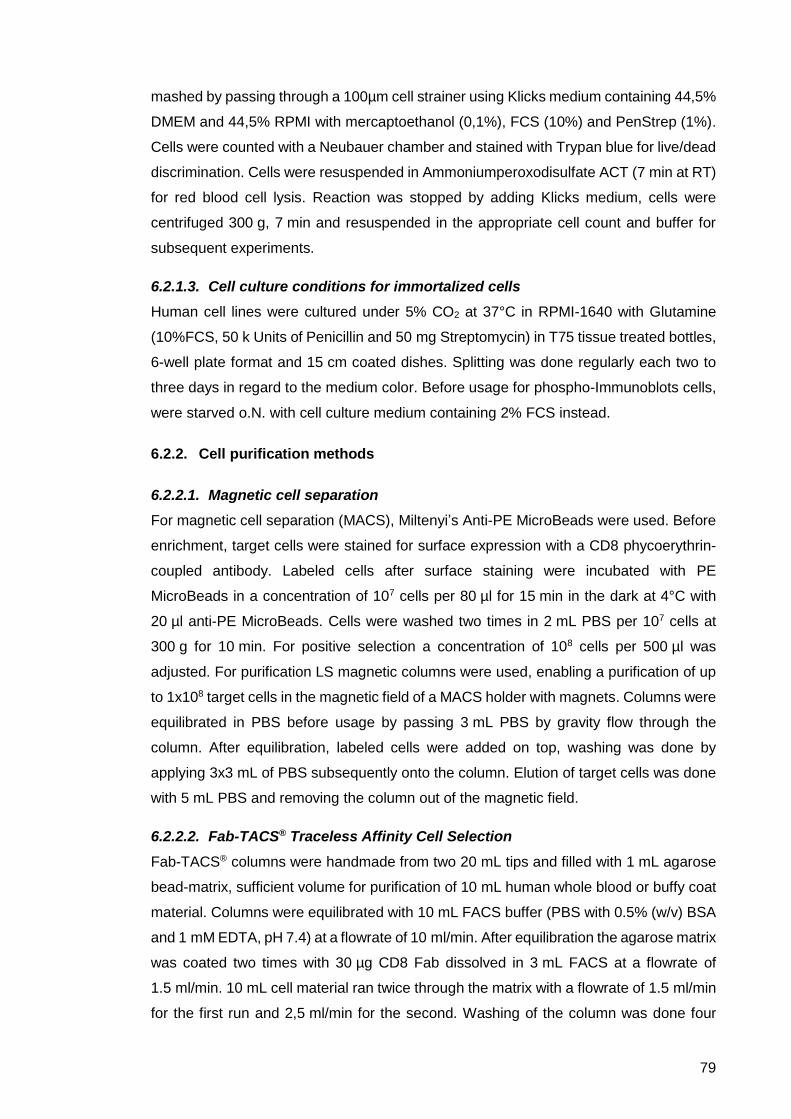
79
mashed by passing through a 100µm cell strainer using Klicks medium containing 44,5%
DMEM and 44,5% RPMI with mercaptoethanol (0,1%), FCS (10%) and PenStrep (1%).
Cells were counted with a Neubauer chamber and stained with Trypan blue for live/dead
discrimination. Cells were resuspended in Ammoniumperoxodisulfate ACT (7 min at RT)
for red blood cell lysis. Reaction was stopped by adding Klicks medium, cells were
centrifuged 300 g, 7 min and resuspended in the appropriate cell count and buffer for
subsequent experiments.
6.2.1.3. Cell culture conditions for immortalized cells
Human cell lines were cultured under 5% CO2 at 37°C in RPMI-1640 with Glutamine
(10%FCS, 50 k Units of Penicillin and 50 mg Streptomycin) in T75 tissue treated bottles,
6-well plate format and 15 cm coated dishes. Splitting was done regularly each two to
three days in regard to the medium color. Before usage for phospho-Immunoblots cells,
were starved o.N. with cell culture medium containing 2% FCS instead.
6.2.2. Cell purification methods
6.2.2.1. Magnetic cell separation
For magnetic cell separation (MACS), Miltenyi’s Anti-PE MicroBeads were used. Before
enrichment, target cells were stained for surface expression with a CD8 phycoerythrin-
coupled antibody. Labeled cells after surface staining were incubated with PE
MicroBeads in a concentration of 107 cells per 80 µl for 15 min in the dark at 4°C with
20 µl anti-PE MicroBeads. Cells were washed two times in 2 mL PBS per 107 cells at
300 g for 10 min. For positive selection a concentration of 108 cells per 500 µl was
adjusted. For purification LS magnetic columns were used, enabling a purification of up
to 1x10⁸ target cells in the magnetic field of a MACS holder with magnets. Columns were
equilibrated in PBS before usage by passing 3 mL PBS by gravity flow through the
column. After equilibration, labeled cells were added on top, washing was done by
applying 3x3 mL of PBS subsequently onto the column. Elution of target cells was done
with 5 mL PBS and removing the column out of the magnetic field.
6.2.2.2. Fab-TACS® Traceless Affinity Cell Selection
Fab-TACS® columns were handmade from two 20 mL tips and filled with 1 mL agarose
bead-matrix, sufficient volume for purification of 10 mL human whole blood or buffy coat
material. Columns were equilibrated with 10 mL FACS buffer (PBS with 0.5% (w/v) BSA
and 1 mM EDTA, pH 7.4) at a flowrate of 10 ml/min. After equilibration the agarose matrix
was coated two times with 30 µg CD8 Fab dissolved in 3 mL FACS at a flowrate of
1.5 ml/min. 10 mL cell material ran twice through the matrix with a flowrate of 1.5 ml/min
for the first run and 2,5 ml/min for the second. Washing of the column was done four
80
times with 15 mL FACS buffer at a flowrate of 10 ml/min. Cells attached to the agarose
matrix were dissolved by running 5 mL of FACS buffer containing 100 mM D-Biotin. The
eluted fraction was subsequently washed in 50 mL FACS buffer at 300 g for 7 min.
Purity, depletion and viability of sample material and purified cells were determined by
CD8, CD3, CD235 and PI staining with FACS analysis.
6.2.2.3. Flow Cytometry
6.2.2.3.1. Cell sorting
For the cell sorting, the MoFloTM legacy, MoFloTM XDP or FACSAria III were used with
a 70 µm nozzle. Samples were filtered (30 µm) with a concentration of about
1x10⁷ cells/ml. If gating strategy included live/dead discrimination, propidium iodide
(Invitrogen, Darmstadt, Germany) 1 µg/ml was added right before the sort. The cells
were sorted with a sample pressure of a maximum event rate of 20.000 events per
second (EPS).
6.2.2.3.2. Speed Enrichment
For isolating cell populations with a very small frequency in human PBMCs, like antigen-
specific T cells, a pre-enrichment using Speed Enrichment (SE) was performed on the
MoFloTM XDP with a 70 µm nozzle. The samples were filtered (30 µm) and taken up in a
concentration of about 2x10⁸ cells/ml. If the gating strategy included live/dead
discrimination, PI was added right before the sort. Dependent on the fluorochrome
defining the cell population, the trigger was set to the respective fluorescence channel.
Threshold settings were increased above the negative population displayed in FSC
triggering for this fluorescence channel. Pressure difference between sheath- and
sample pressure was ∆2 psi.
For the establishment of Speed Enrichment, polystyrene micro-particles PPS-8.0 beads
and anti-rat and anti-hamster Ig-kappa CompBeads were used.
6.2.2.4. Flowrate determination and internal cell count controls
For internal controls of flowrate, Cyto-Cal Count Tubes were used, where each tube
contained 50.000 beads adjusted in a dissolvable gel matrix. Beads had a diameter of
around 7 µm and were distinguishable from cells by FSC/SSC gating and a high
fluorescence at 488, 405 and 640 nm excitation.
6.2.2.5. Staining procedures
FACS Buffer contained PBS (with 0.5% BSA (w/v) and 1mM EDTA) sterilely filtered
through 0,22 µm. All used chemicals were of ultrapure grade.
81
6.2.2.5.1. Staining for antigen-specific T cells
For the enrichment of multimer-specific T cells, HLA-A2 Molecules were refolded with
peptide GILGFVFTL (hβ2m/flu MP58-66), NLVPMVATV (hβ2m/pp65495-503) and
RMFPNAPYL (WT1126-134) and multimerized via Streptavidin-PE, Streptavidin-BV421 or
Streptavidin-APC. Multimerization was done for 45 min at 4°C in the dark with 40 µg/ml
HLA molecules and 25 µg/ml Streptavidin. Finally, up to 2,5x10⁸ cells were stained in
600 µl for 30 min at 4°C. After staining, cells were washed in 10 mL FACS buffer two
times at 300 g, 7 min at 4°C.
6.2.2.5.2. Antibody staining of cell surface markers
For optimal staining results antibody conjugates were titrated. Antibodies used are listed
under materials with the titrated dilution. Staining was performed in 96-well format in
200 µl (max. 5x10⁷ cells/ml). Samples were stained in the dark for 20 min at 4°C, or as
mentioned otherwise, and washed two times in 200 µl FACS buffer at 300 g, 4°C.
6.2.2.5.3. Intracellular antibody staining
When stained for intracellular phospho-proteins, first EMA staining (1:1000) was done
on ice with light exposure for 20 min with FACS buffer containing NaN3 0,06% (v/v). After
washing, cell surface staining was done before fixation. Cells were then fixed by adding
2% final concentration PFA for 20 min at RT. Cells were then centrifuged and re-
suspended in 20 µl FACS (NaN3). After addition of 250 µl Methanol (99%) at 4°C and
20 min incubation, two washing steps at 300 g for 5 min 4°C were performed before
intracellular staining. After an additional two washing steps cells were analyzed.
6.3. Immunochemical methods
6.3.1. Western Blotting
For cytoplasmic lysates cells were sedimented at 14.000 g for 1 min at 4°C. Lysis of cells
was done by re-suspending in 50 µl of NP-40 buffer (containing 50 mM HEPES, 40 mM
NaCl, 1 mM DTT, 1 mM Na2EDTA, 1 mM EGTA, 0,5% (v/v) Nonident P-40, 10% (v/v)
Glycerol, 20 mM β-Glycerolphosphat, 1 mM Na3VO4, 0,4 mM PMSF, 1 mM NaF, 1 tablett
protease inhibitor adjusted to pH 7,6) at 4°C. Incubation on ice for 15 min followed by
10 min centrifugation of cell debris at 14.000 g at 4°C. Supernatant was stored at -20°C
until usage.
Before protein electrophoresis cytoplasmic lysates were cooked at 95°C with 12 µl
4xLämmli buffer (62,5 mM Tris, 2% SDS, 50% Glycerol, 2 mM EDTA, 1%
Bromphenolblue, 100 mM DTT) for 5 min. 10% SDS-Polyacrylamidgels were used for
gelelectrophoresis running at 120 V for 100 min with running buffer (25 mM Tris, 3,5 mM
82
SDS, 200 mM Glycine) together with a protein size-ladder 10-170 kDA (10 bands) from
Peqlab. After protein separation SDS gels were plotted semi-dry onto nitrocellulose at
130 mA for 100 min with transfer buffer (25 mM Tris, 15 mM Glycine, 20%(v/v) Methanol,
0,35% SDS). Membrane was blocked in PBS-T (PBS with 0,1% Tween20) containing
5% (w/v) dissolved milk powder at RT for 30 min. Membranes were subsequently
washed with PBS-T and cut in size and incubated with appropriate antibodies in PBS-T
with 5% BSA over night at 4°C on a shaker. After incubation membranes were washed
three times in PBS-T for 10 min and incubated with a mouse-α-rabbit IgG coupled to
HRP in PBS-T containing 5% milk. Detection of signals was done with WesternLightning
ECL substrate.
6.3.2. Limulus Amebocyte Lysate (LAL) test
Detection of endotoxins in the sheath fluid of cell sorter systems was done by LAL test
Pierce™ LAL Chromogenic Endotoxin Quantitation Kit from Thermo ScientificTM (Thermo
Fisher Scientific, Waltham, MA USA) following the instructions of the distributers
protocol. The concentration of the reaction product p-Nitroaniline was measured by
405nm absorbance in a SunriseTM microplate reader (Tecan Trading AG, Switzerland)
using Magellan 7 software (Tecan Trading AG, Switzerland). Absorbance values for the
different samples were plotted against a standard curve generated by endotoxin levels
of a known concentration (E. coli) and analyzed using Prism graph pad.
6.4. Molecular biology
6.4.1. RNA isolation
For isolation of RNA cells were Fab-TACS® purified with reversible CD8 Fab one day
prior to the experiment. CD8 cells were rested o.N. at a density of 3x10⁶ cells/ml in RPMI
with Glutamine (10%FCS) at 5% CO2 and 37°C. The next day cell were resuspended in
fresh pre-warmed RPMI-1640 and either mock-sorted or unsorted on a MoFloTM XDP,
and splitted for immediate (0 min) and late (240 min) time points (under cell culture
conditions). At indicated time points cells were harvested by centrifugation at 14.000 g,
1 min at 4°C and RNA extracted with the RNeasy Micro Kit. For lysis cell pellets were
resuspended in 350 µl Buffer RLT. 400 µl 70% ethanol was added and mixed by
pipetting. Whole volume was added to a RNeasy MinElute spin column and centrifuged
at 8000 g for 15 sec. Followed by washing of the spin column with 350 µl buffer RW1 at
the same speed and time. DNA bound to the column matrix was digested by adding 80 µl
buffer RDD (containing 10 µl DNase I) for 15 min at RT. DNase was removed by washing
83
the columns with 350 µl buffer RW1. Subsequent 500 µl of buffer RPE was added and
spinned at 8000 g for 15 sec. Finally 500 µl of 80% ethanol was added and centrifuged
for 2 min, after which the column was dried by 14.000 g for 5 min. After drying columns
were immediately stored at -80°C until all time points were acquired. For eluting the
mRNA columns were rewarmed to RT and centrifuged with 14 µl RNase free H2O and
stored at -80°C until MicroArray analysis. Except 1 µl of samples, which was used to
determine mRNA yield via Nanodrop measurement with the absorbance from 220 to
350 nm with a peak at around 260 nm.
6.4.2. MicroArray and data analysis
At -80°C stored mRNA samples were thawed on ice. mRNA quality was determined with
the friendly help of Julia Ritter with the BioRad Experion using Experion RNA Chips. RNA
concentration ranged from 85 ng/µl to124 ng/µl with a ration of 28S/18S for the ribosomal
RNA ranging from 1.06 to 2.58. The RQI was measured for RNA degradation. For all
samples it ranged from 8.2 to 9.1 indicating good RNA quality. After quality assessment
for the MicroArray, RNA were translated into DNA, fragmented and labeled and
MicroArray analysis was done with the AffimetrixTM system using the Gene ChipTM
Human Gene 1.0 ST. In total, 18710 MicroArray data values were gained, normalized
and checked for an at least 2-fold up- or downregulation between the different conditions.
Data were RMA normalized which included a log2 transformation. mRNA upregulation
was determined by:
𝐴 − 𝐵 > 1 →2𝐴
2𝐵> 2
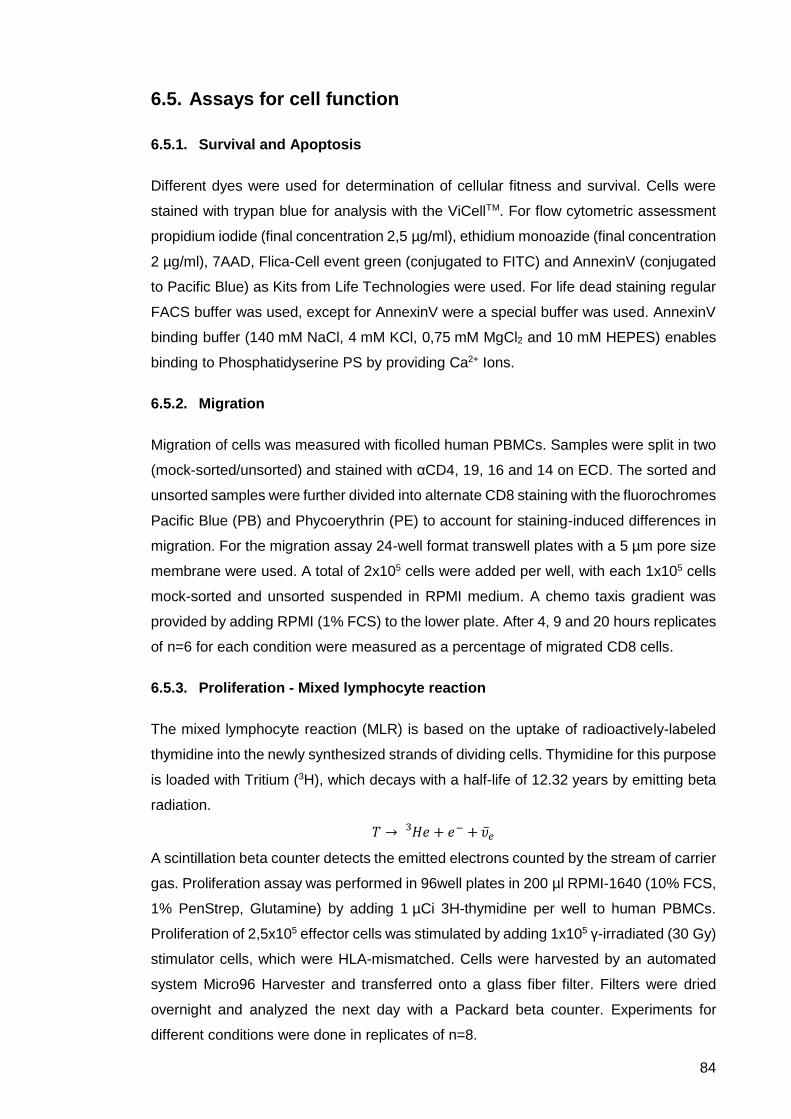
84
6.5. Assays for cell function
6.5.1. Survival and Apoptosis
Different dyes were used for determination of cellular fitness and survival. Cells were
stained with trypan blue for analysis with the ViCellTM. For flow cytometric assessment
propidium iodide (final concentration 2,5 µg/ml), ethidium monoazide (final concentration
2 µg/ml), 7AAD, Flica-Cell event green (conjugated to FITC) and AnnexinV (conjugated
to Pacific Blue) as Kits from Life Technologies were used. For life dead staining regular
FACS buffer was used, except for AnnexinV were a special buffer was used. AnnexinV
binding buffer (140 mM NaCl, 4 mM KCl, 0,75 mM MgCl2 and 10 mM HEPES) enables
binding to Phosphatidyserine PS by providing Ca2+ Ions.
6.5.2. Migration
Migration of cells was measured with ficolled human PBMCs. Samples were split in two
(mock-sorted/unsorted) and stained with αCD4, 19, 16 and 14 on ECD. The sorted and
unsorted samples were further divided into alternate CD8 staining with the fluorochromes
Pacific Blue (PB) and Phycoerythrin (PE) to account for staining-induced differences in
migration. For the migration assay 24-well format transwell plates with a 5 µm pore size
membrane were used. A total of 2x10⁵ cells were added per well, with each 1x10⁵ cells
mock-sorted and unsorted suspended in RPMI medium. A chemo taxis gradient was
provided by adding RPMI (1% FCS) to the lower plate. After 4, 9 and 20 hours replicates
of n=6 for each condition were measured as a percentage of migrated CD8 cells.
6.5.3. Proliferation - Mixed lymphocyte reaction
The mixed lymphocyte reaction (MLR) is based on the uptake of radioactively-labeled
thymidine into the newly synthesized strands of dividing cells. Thymidine for this purpose
is loaded with Tritium (3H), which decays with a half-life of 12.32 years by emitting beta
radiation.
𝑇 → 𝐻𝑒3 + 𝑒− + �̅�𝑒
A scintillation beta counter detects the emitted electrons counted by the stream of carrier
gas. Proliferation assay was performed in 96well plates in 200 µl RPMI-1640 (10% FCS,
1% PenStrep, Glutamine) by adding 1 µCi 3H-thymidine per well to human PBMCs.
Proliferation of 2,5x10⁵ effector cells was stimulated by adding 1x10⁵ γ-irradiated (30 Gy)
stimulator cells, which were HLA-mismatched. Cells were harvested by an automated
system Micro96 Harvester and transferred onto a glass fiber filter. Filters were dried
overnight and analyzed the next day with a Packard beta counter. Experiments for
different conditions were done in replicates of n=8.
85
6.5.4. Antigen-specific killing
For antigen-specific killing, TCR transgenic T cells recognizing the MART-1(A27L) 26-35
epitope were kindly provided by Manuel Effenberger. TCR transgenic CD8 T cells were
FACS purified based on CD8 and pMHC positivity and subsequently expanded using
αCD3 αCD28 antibodies (1.0 µg/ml Okt3; 0.5 µg/ml CD28) and 50 U/ml Il2. Before the
cytotoxicity assay 5x10⁴ MART-1-specific T cell clones were seeded into a 24 well CD3
and CD28 coated plate and stimulated for two days followed by a three-day resting
phase. One day before the cytotoxicity assay 5x10³ A375 melanoma cells105 grew
confluent in 100 µl DMEM growth medium (10% FCS, 1% PenStrep, 1% sodium
pyruvate) within a 96well E-plate at 37°C and 5% CO2. The baseline growth was
monitored within the xCELLigence system. For A375 cells pulsing medium was removed
after 24 hours und replaced by 100 µl growth medium containing 10-7M MART-1 peptide
for 60 min. Subsequent, culture medium was removed and replaced with 100 µl RPMI
(10% FCS, 1% PenStrep, 1% sodium pyruvate) containing MART-1 effector T cells
(either mock-sorted or sort-medium exchanged) ranging in numbers from 1:1 to 8:1 E:T
ratio (related to the initially seeded A375 cells). All conditions were done in duplicates in
a total of n=4 experiments; while monitored impedance measurements were done for
48 hours every 15 min. Specific cell lysis was calculated from cell indices (CI):
𝑠𝑝𝑒𝑐𝑖𝑓𝑖𝑐 𝑙𝑦𝑠𝑖𝑠 =𝑛𝐶𝐼(𝐴375𝑜𝑛𝑙𝑦) − 𝑛𝐶𝐼(𝐴375𝑠𝑎𝑚𝑝𝑙𝑒)
𝑛𝐶𝐼(𝐴375𝑜𝑛𝑙𝑦)
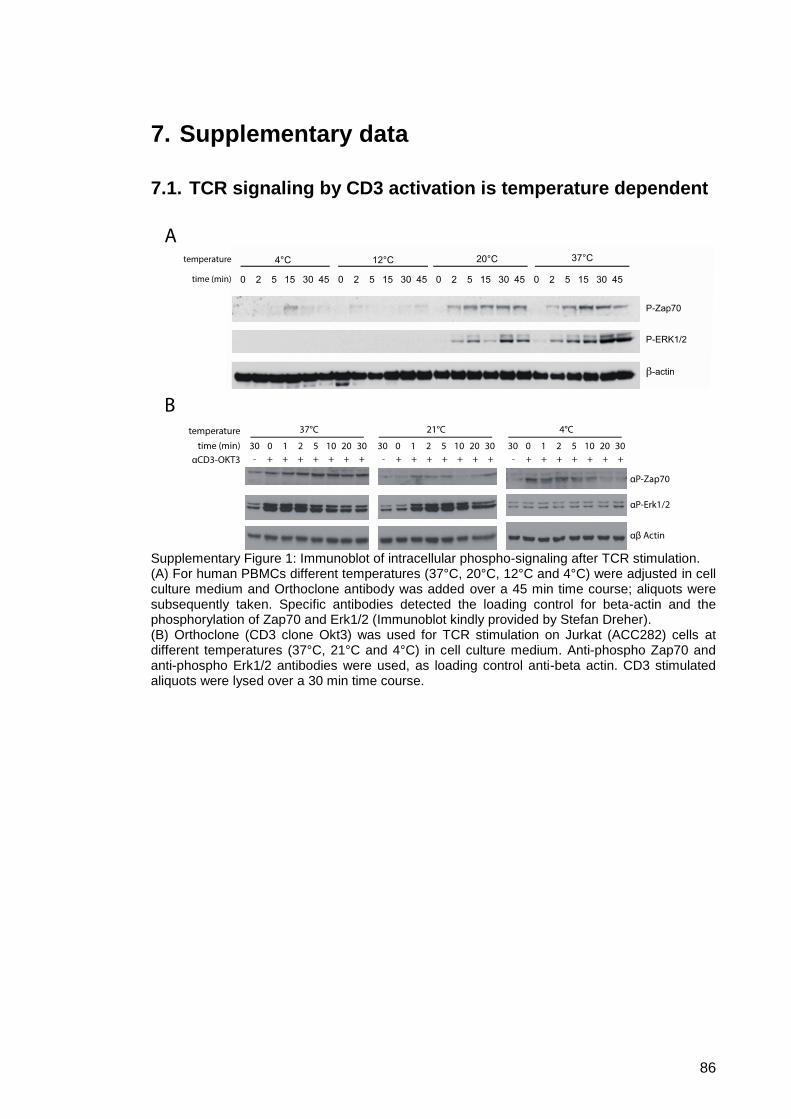
86
7. Supplementary data
7.1. TCR signaling by CD3 activation is temperature dependent
Supplementary Figure 1: Immunoblot of intracellular phospho-signaling after TCR stimulation. (A) For human PBMCs different temperatures (37°C, 20°C, 12°C and 4°C) were adjusted in cell culture medium and Orthoclone antibody was added over a 45 min time course; aliquots were subsequently taken. Specific antibodies detected the loading control for beta-actin and the phosphorylation of Zap70 and Erk1/2 (Immunoblot kindly provided by Stefan Dreher). (B) Orthoclone (CD3 clone Okt3) was used for TCR stimulation on Jurkat (ACC282) cells at different temperatures (37°C, 21°C and 4°C) in cell culture medium. Anti-phospho Zap70 and anti-phospho Erk1/2 antibodies were used, as loading control anti-beta actin. CD3 stimulated aliquots were lysed over a 30 min time course.
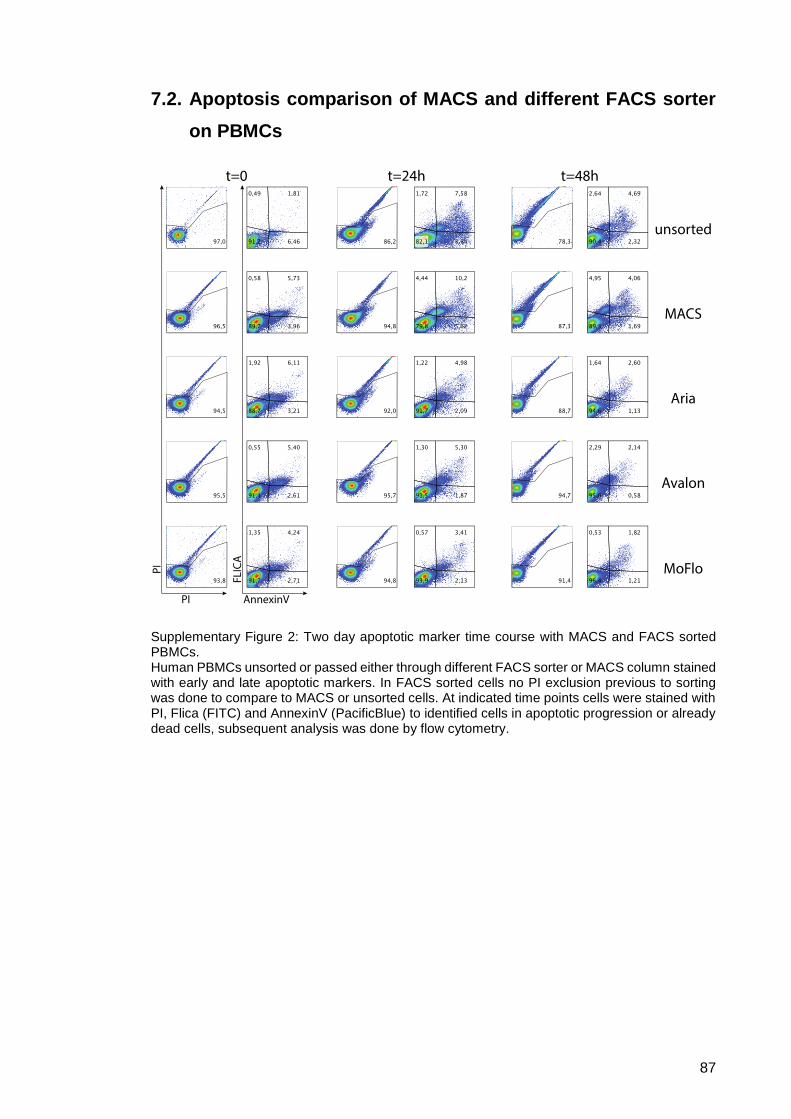
87
7.2. Apoptosis comparison of MACS and different FACS sorter
on PBMCs
Supplementary Figure 2: Two day apoptotic marker time course with MACS and FACS sorted PBMCs. Human PBMCs unsorted or passed either through different FACS sorter or MACS column stained with early and late apoptotic markers. In FACS sorted cells no PI exclusion previous to sorting was done to compare to MACS or unsorted cells. At indicated time points cells were stained with PI, Flica (FITC) and AnnexinV (PacificBlue) to identified cells in apoptotic progression or already dead cells, subsequent analysis was done by flow cytometry.
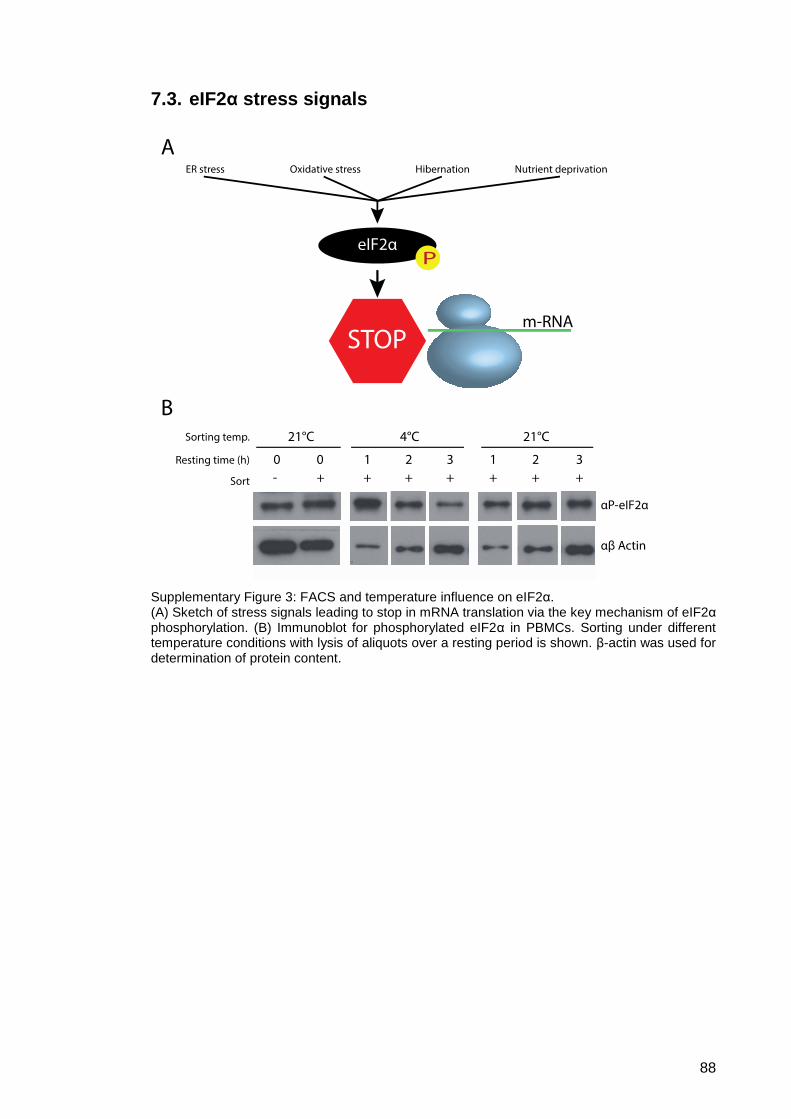
88
7.3. eIF2α stress signals
Supplementary Figure 3: FACS and temperature influence on eIF2α. (A) Sketch of stress signals leading to stop in mRNA translation via the key mechanism of eIF2α phosphorylation. (B) Immunoblot for phosphorylated eIF2α in PBMCs. Sorting under different temperature conditions with lysis of aliquots over a resting period is shown. β-actin was used for determination of protein content.
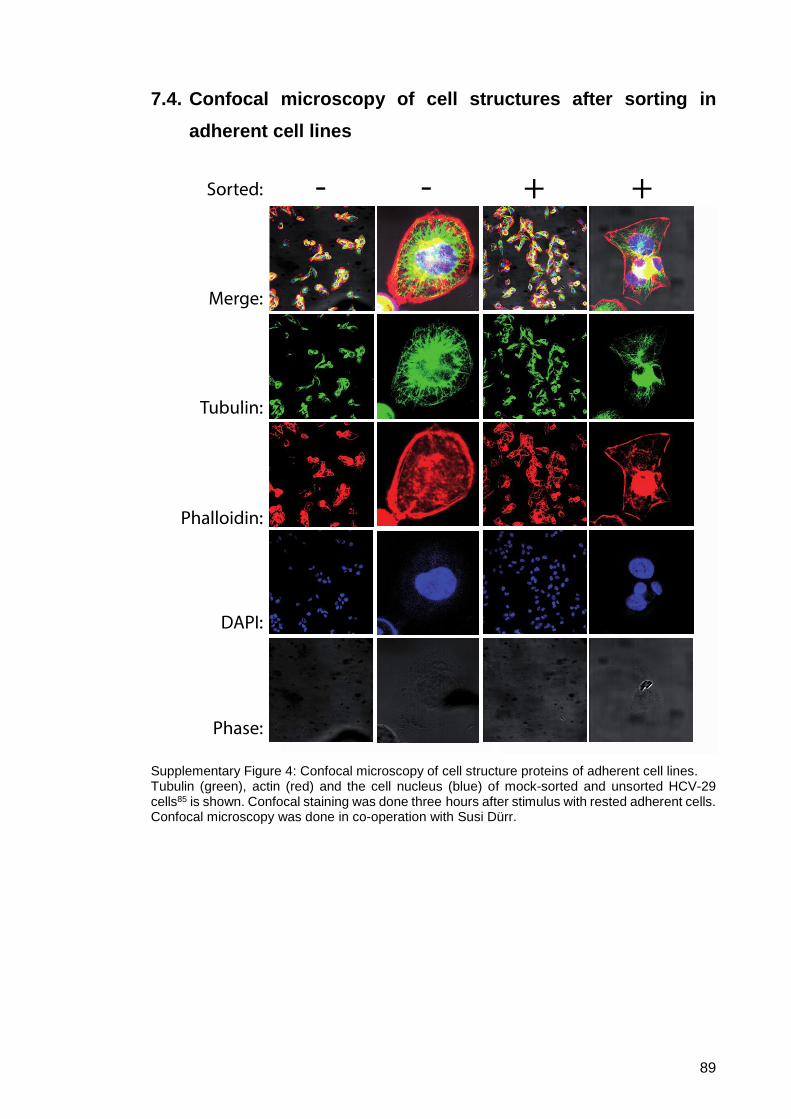
89
7.4. Confocal microscopy of cell structures after sorting in
adherent cell lines
Supplementary Figure 4: Confocal microscopy of cell structure proteins of adherent cell lines. Tubulin (green), actin (red) and the cell nucleus (blue) of mock-sorted and unsorted HCV-29 cells85 is shown. Confocal staining was done three hours after stimulus with rested adherent cells. Confocal microscopy was done in co-operation with Susi Dürr.
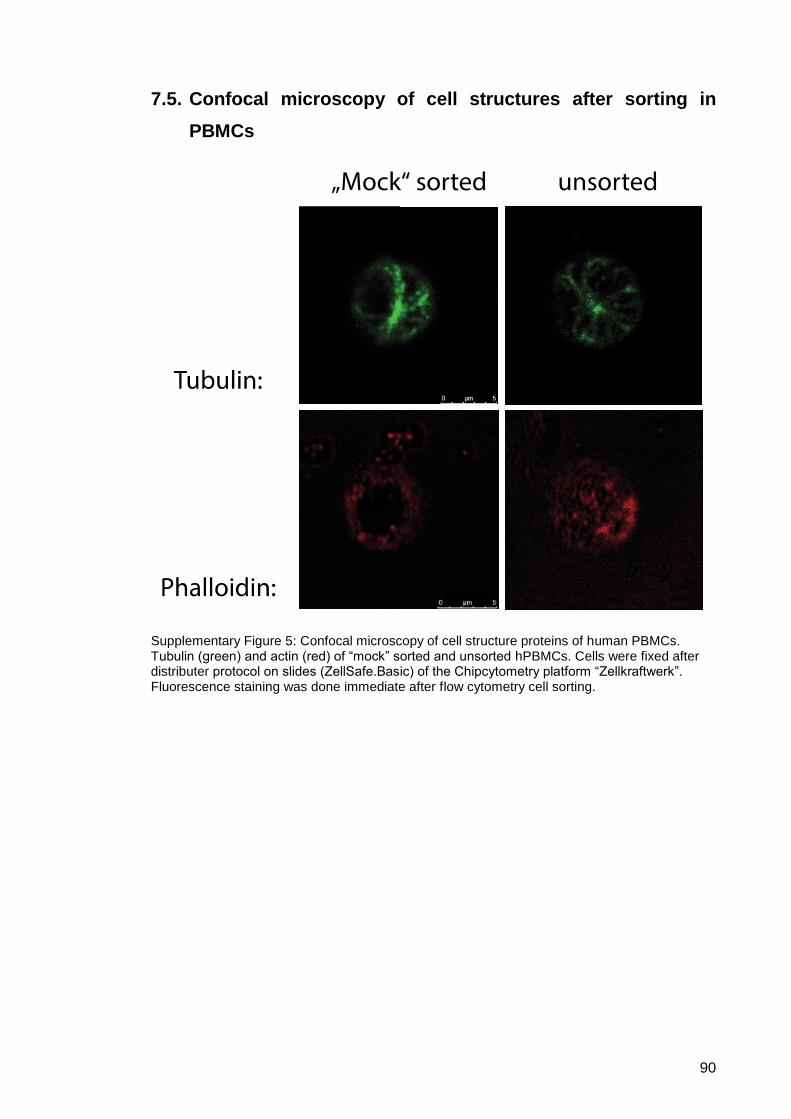
90
7.5. Confocal microscopy of cell structures after sorting in
PBMCs
Supplementary Figure 5: Confocal microscopy of cell structure proteins of human PBMCs. Tubulin (green) and actin (red) of “mock” sorted and unsorted hPBMCs. Cells were fixed after distributer protocol on slides (ZellSafe.Basic) of the Chipcytometry platform “Zellkraftwerk”. Fluorescence staining was done immediate after flow cytometry cell sorting.
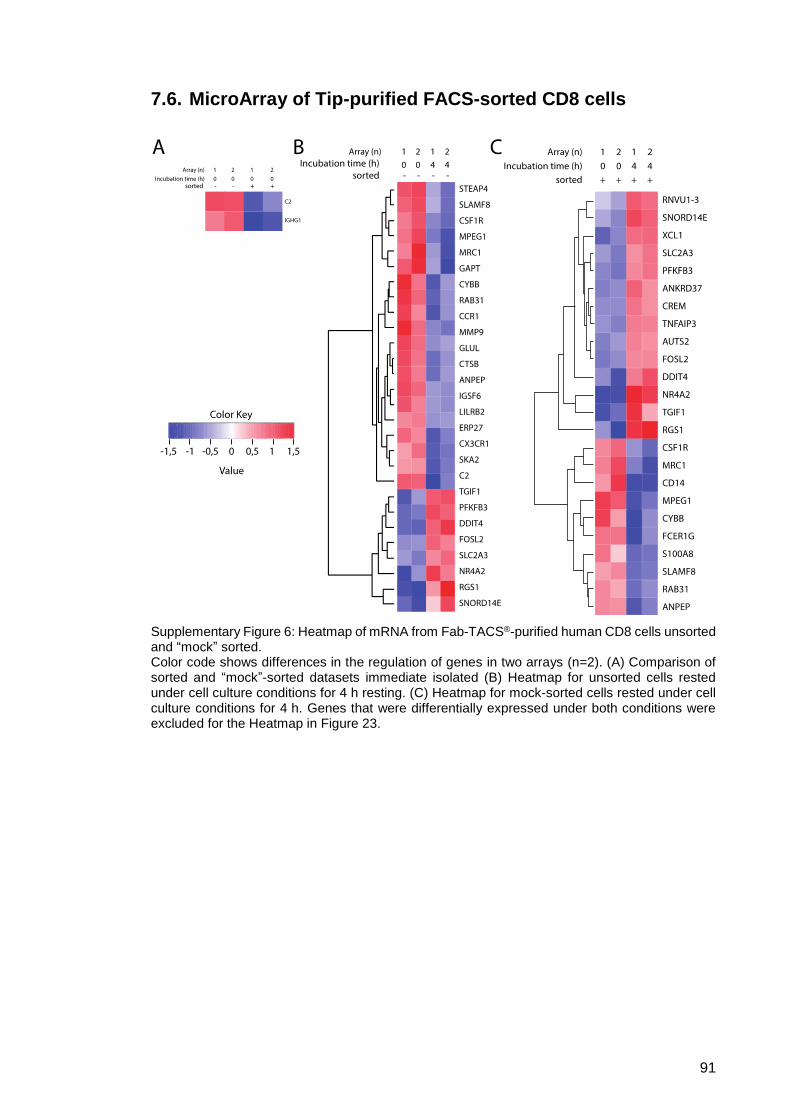
91
7.6. MicroArray of Tip-purified FACS-sorted CD8 cells
Supplementary Figure 6: Heatmap of mRNA from Fab-TACS®-purified human CD8 cells unsorted and “mock” sorted. Color code shows differences in the regulation of genes in two arrays (n=2). (A) Comparison of sorted and “mock”-sorted datasets immediate isolated (B) Heatmap for unsorted cells rested under cell culture conditions for 4 h resting. (C) Heatmap for mock-sorted cells rested under cell culture conditions for 4 h. Genes that were differentially expressed under both conditions were excluded for the Heatmap in Figure 23.
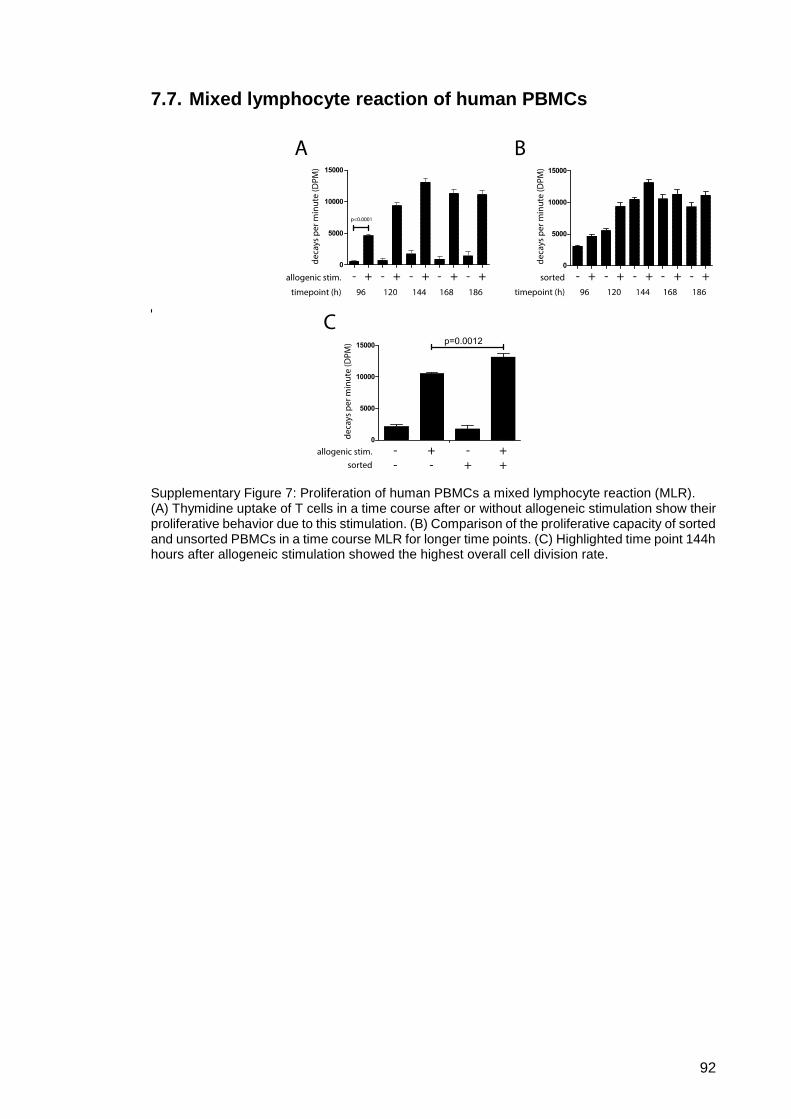
92
7.7. Mixed lymphocyte reaction of human PBMCs
Supplementary Figure 7: Proliferation of human PBMCs a mixed lymphocyte reaction (MLR). (A) Thymidine uptake of T cells in a time course after or without allogeneic stimulation show their proliferative behavior due to this stimulation. (B) Comparison of the proliferative capacity of sorted and unsorted PBMCs in a time course MLR for longer time points. (C) Highlighted time point 144h hours after allogeneic stimulation showed the highest overall cell division rate.
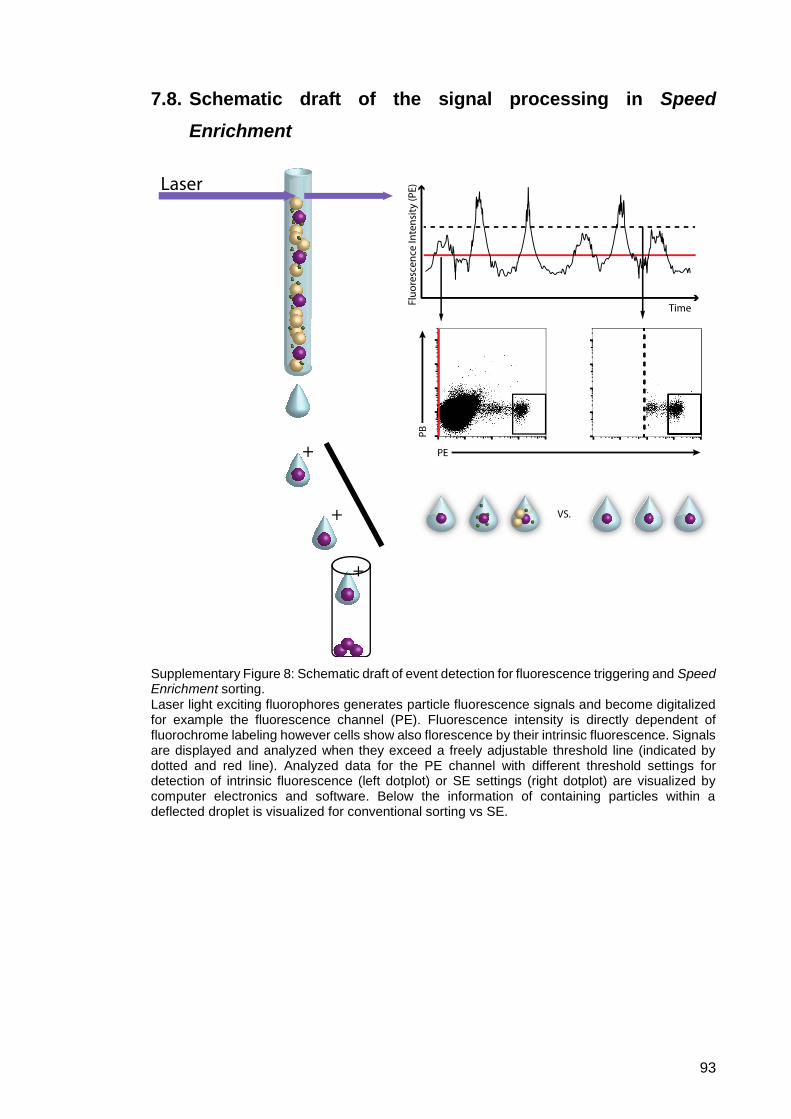
93
7.8. Schematic draft of the signal processing in Speed
Enrichment
Supplementary Figure 8: Schematic draft of event detection for fluorescence triggering and Speed Enrichment sorting. Laser light exciting fluorophores generates particle fluorescence signals and become digitalized for example the fluorescence channel (PE). Fluorescence intensity is directly dependent of fluorochrome labeling however cells show also florescence by their intrinsic fluorescence. Signals are displayed and analyzed when they exceed a freely adjustable threshold line (indicated by dotted and red line). Analyzed data for the PE channel with different threshold settings for detection of intrinsic fluorescence (left dotplot) or SE settings (right dotplot) are visualized by computer electronics and software. Below the information of containing particles within a deflected droplet is visualized for conventional sorting vs SE.
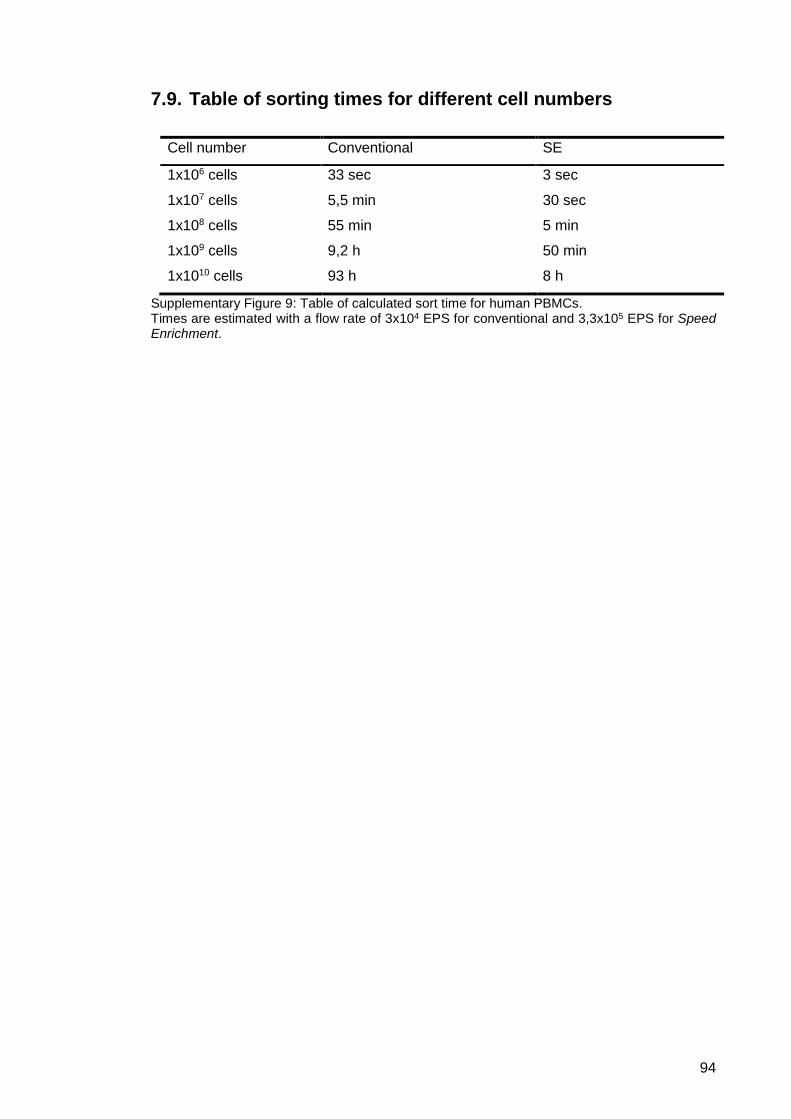
94
7.9. Table of sorting times for different cell numbers
Cell number Conventional SE
1x10⁶ cells 33 sec 3 sec
1x10⁷ cells 5,5 min 30 sec
1x10⁸ cells 55 min 5 min
1x10⁹ cells 9,2 h 50 min
1x10¹⁰ cells 93 h 8 h
Supplementary Figure 9: Table of calculated sort time for human PBMCs. Times are estimated with a flow rate of 3x10⁴ EPS for conventional and 3,3x10⁵ EPS for Speed Enrichment.
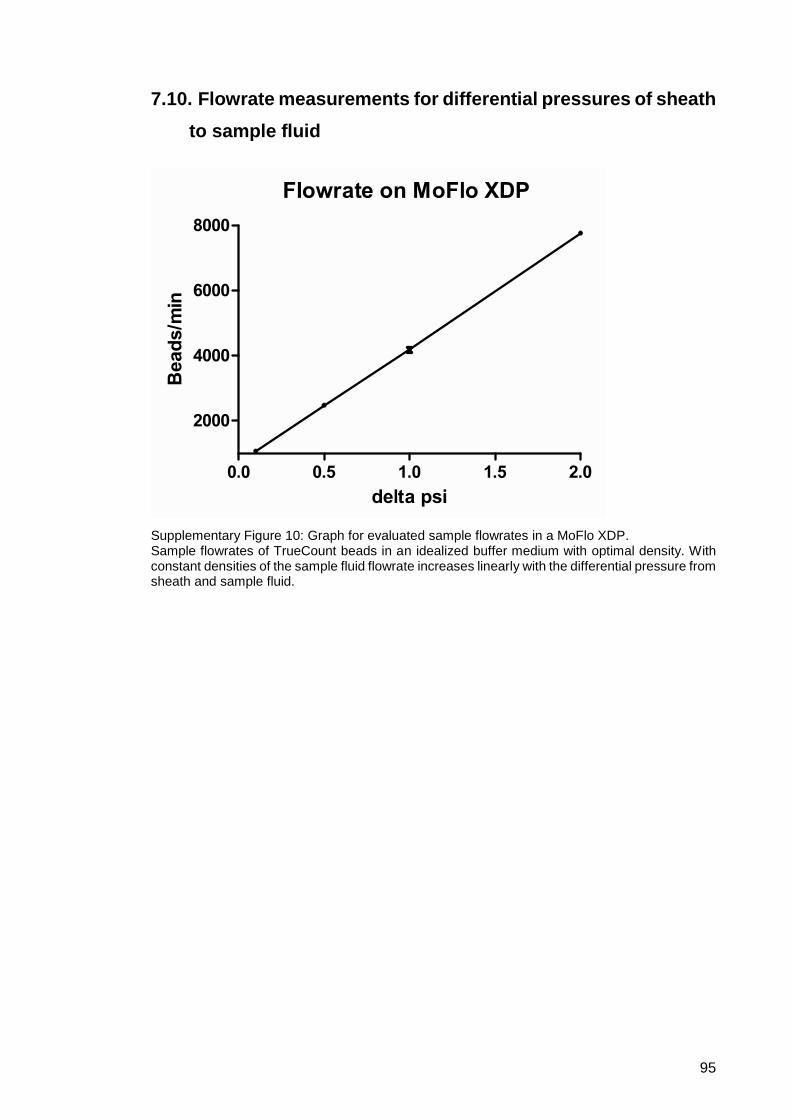
95
7.10. Flowrate measurements for differential pressures of sheath
to sample fluid
Supplementary Figure 10: Graph for evaluated sample flowrates in a MoFlo XDP. Sample flowrates of TrueCount beads in an idealized buffer medium with optimal density. With constant densities of the sample fluid flowrate increases linearly with the differential pressure from sheath and sample fluid.
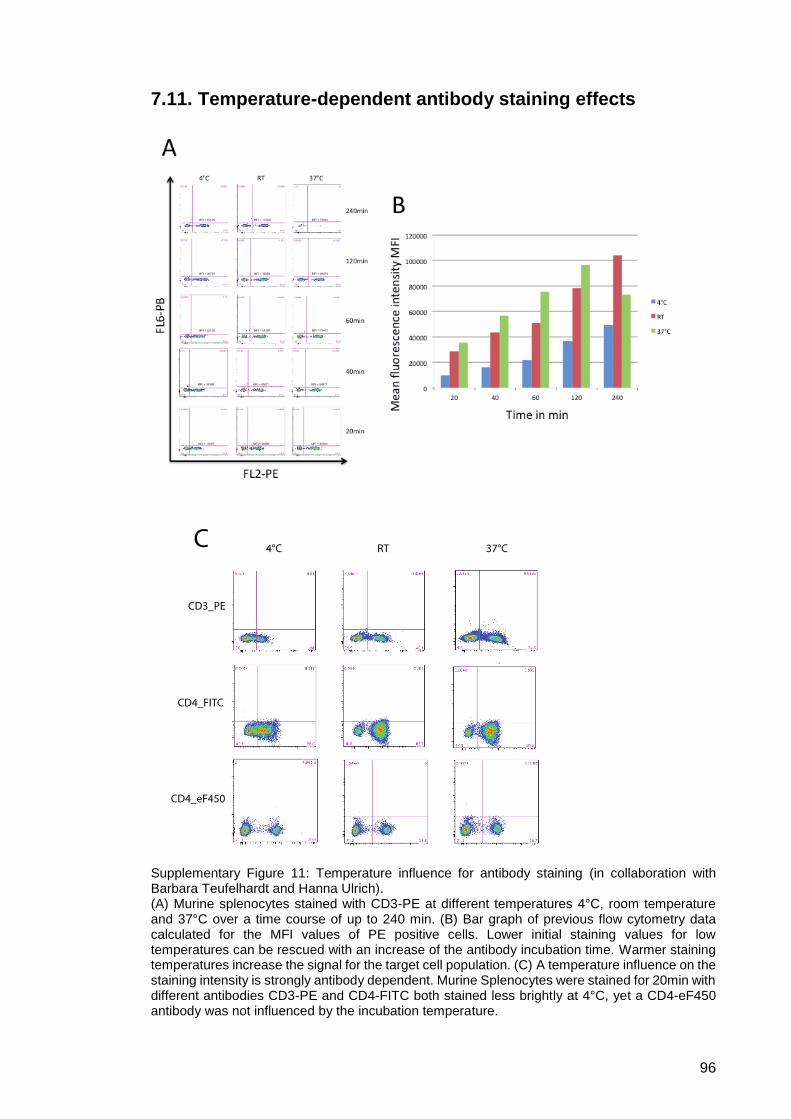
96
7.11. Temperature-dependent antibody staining effects
Supplementary Figure 11: Temperature influence for antibody staining (in collaboration with Barbara Teufelhardt and Hanna Ulrich). (A) Murine splenocytes stained with CD3-PE at different temperatures 4°C, room temperature and 37°C over a time course of up to 240 min. (B) Bar graph of previous flow cytometry data calculated for the MFI values of PE positive cells. Lower initial staining values for low temperatures can be rescued with an increase of the antibody incubation time. Warmer staining temperatures increase the signal for the target cell population. (C) A temperature influence on the staining intensity is strongly antibody dependent. Murine Splenocytes were stained for 20min with different antibodies CD3-PE and CD4-FITC both stained less brightly at 4°C, yet a CD4-eF450 antibody was not influenced by the incubation temperature.
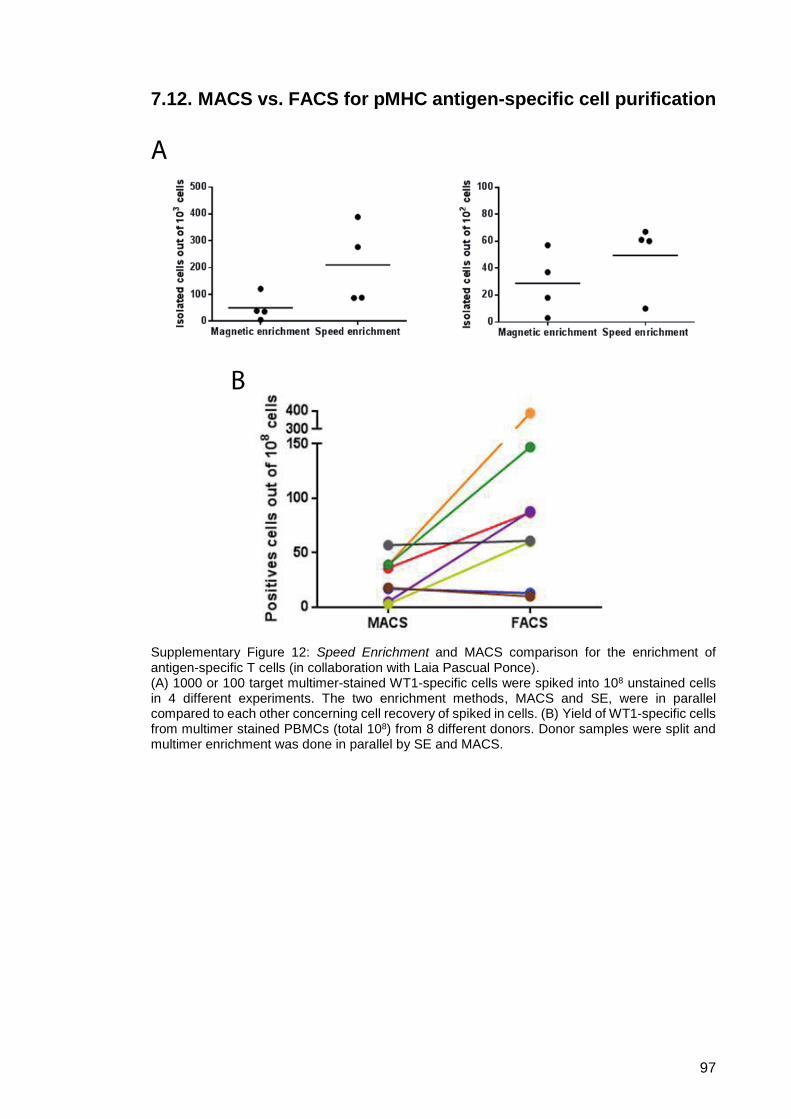
97
7.12. MACS vs. FACS for pMHC antigen-specific cell purification
Supplementary Figure 12: Speed Enrichment and MACS comparison for the enrichment of antigen-specific T cells (in collaboration with Laia Pascual Ponce). (A) 1000 or 100 target multimer-stained WT1-specific cells were spiked into 108 unstained cells in 4 different experiments. The two enrichment methods, MACS and SE, were in parallel compared to each other concerning cell recovery of spiked in cells. (B) Yield of WT1-specific cells from multimer stained PBMCs (total 108) from 8 different donors. Donor samples were split and multimer enrichment was done in parallel by SE and MACS.
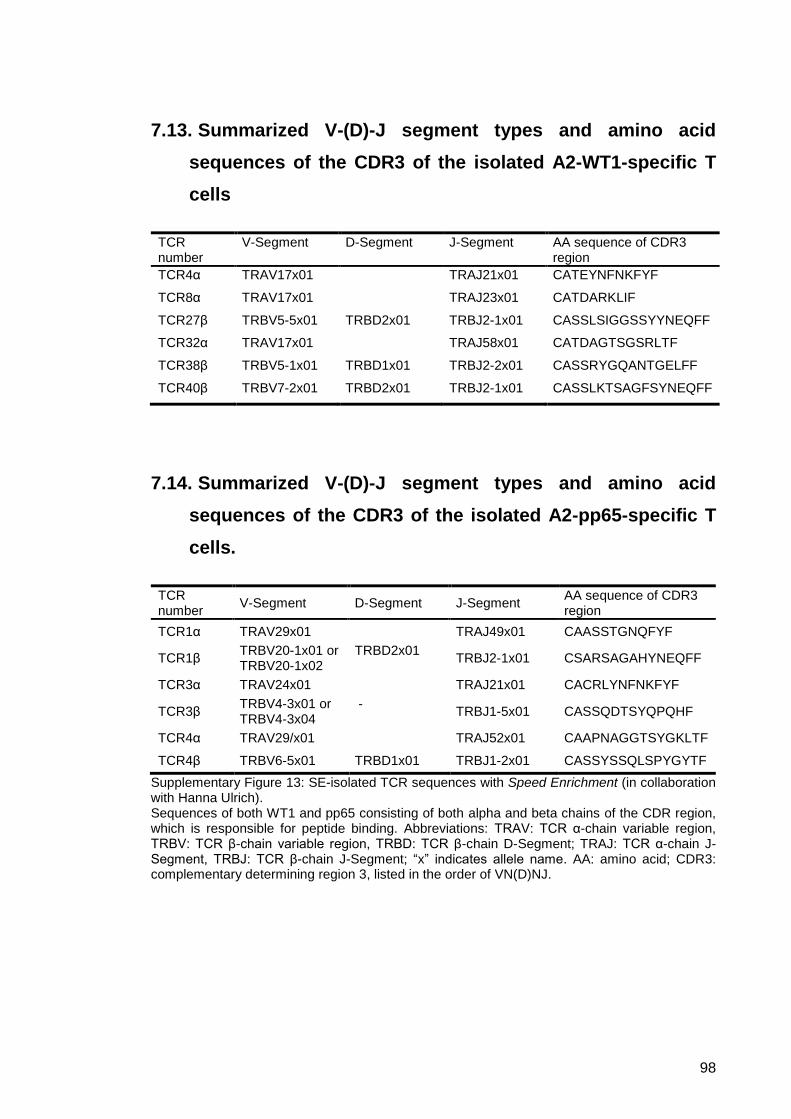
98
7.13. Summarized V-(D)-J segment types and amino acid
sequences of the CDR3 of the isolated A2-WT1-specific T
cells
TCR number
V-Segment D-Segment J-Segment AA sequence of CDR3 region
TCR4α TRAV17x01 TRAJ21x01 CATEYNFNKFYF
TCR8α TRAV17x01 TRAJ23x01 CATDARKLIF
TCR27β TRBV5-5x01 TRBD2x01 TRBJ2-1x01 CASSLSIGGSSYYNEQFF
TCR32α TRAV17x01 TRAJ58x01 CATDAGTSGSRLTF
TCR38β TRBV5-1x01 TRBD1x01 TRBJ2-2x01 CASSRYGQANTGELFF
TCR40β TRBV7-2x01 TRBD2x01 TRBJ2-1x01 CASSLKTSAGFSYNEQFF
7.14. Summarized V-(D)-J segment types and amino acid
sequences of the CDR3 of the isolated A2-pp65-specific T
cells.
TCR number
V-Segment D-Segment J-Segment AA sequence of CDR3 region
TCR1α TRAV29x01 TRAJ49x01 CAASSTGNQFYF
TCR1β TRBV20-1x01 or TRBV20-1x02
TRBD2x01 TRBJ2-1x01 CSARSAGAHYNEQFF
TCR3α TRAV24x01 TRAJ21x01 CACRLYNFNKFYF
TCR3β TRBV4-3x01 or TRBV4-3x04
- TRBJ1-5x01 CASSQDTSYQPQHF
TCR4α TRAV29/x01 TRAJ52x01 CAAPNAGGTSYGKLTF
TCR4β TRBV6-5x01 TRBD1x01 TRBJ1-2x01 CASSYSSQLSPYGYTF
Supplementary Figure 13: SE-isolated TCR sequences with Speed Enrichment (in collaboration with Hanna Ulrich). Sequences of both WT1 and pp65 consisting of both alpha and beta chains of the CDR region, which is responsible for peptide binding. Abbreviations: TRAV: TCR α-chain variable region, TRBV: TCR β-chain variable region, TRBD: TCR β-chain D-Segment; TRAJ: TCR α-chain J-Segment, TRBJ: TCR β-chain J-Segment; “x” indicates allele name. AA: amino acid; CDR3: complementary determining region 3, listed in the order of VN(D)NJ.
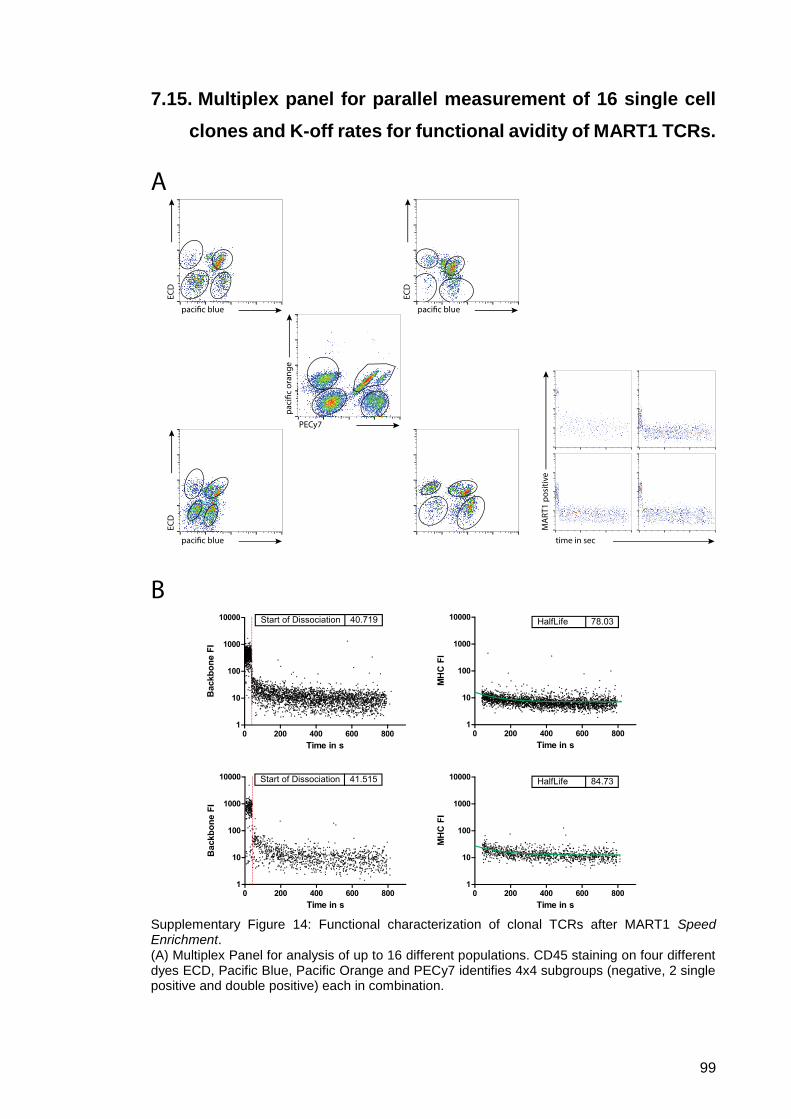
99
7.15. Multiplex panel for parallel measurement of 16 single cell
clones and K-off rates for functional avidity of MART1 TCRs.
Supplementary Figure 14: Functional characterization of clonal TCRs after MART1 Speed Enrichment. (A) Multiplex Panel for analysis of up to 16 different populations. CD45 staining on four different dyes ECD, Pacific Blue, Pacific Orange and PECy7 identifies 4x4 subgroups (negative, 2 single positive and double positive) each in combination.

100
Samples are pre-gated on living lymphocytes. APC multimer staining for MART1 proofed re-stainability and backbone dissociation after D-Biotin addition (A method established by Manuel Effenberger). (B) Measurement of flow based K-off rates of two MART1 clones. MART1 positive clones were speed enriched and expanded and proofed after clonal expansion functional avidity in the K-off rate assay by gradual dissociation of monomerized MHC complexes. After addition of D-Biotin the APC-labeled backbone dissociates with a drop in fluorescence at the first seconds of measurement. FITC-labeled MHC-MART1 complexes remain TCR surface bound and dissociate over time, depended on their functional avidity (measurements by Maria Gerget and Manuel Effenberger).
101
8. Literature
1 Stemberger, C. et al. A single naive CD8+ T cell precursor can develop into diverse effector and memory subsets. Immunity 27, 985-997, doi:10.1016/j.immuni.2007.10.012 (2007).
2 Graef, P. et al. Serial transfer of single-cell-derived immunocompetence reveals stemness of CD8(+) central memory T cells. Immunity 41, 116-126, doi:10.1016/j.immuni.2014.05.018 (2014).
3 Stemberger, C., Neuenhahn, M., Buchholz, V. R. & Busch, D. H. Origin of CD8+ effector and memory T cell subsets. Cellular & molecular immunology 4, 399-405 (2007).
4 Busch, D. H., Frassle, S. P., Sommermeyer, D., Buchholz, V. R. & Riddell, S. R. Role of memory T cell subsets for adoptive immunotherapy. Seminars in immunology 28, 28-34, doi:10.1016/j.smim.2016.02.001 (2016).
5 Tomlinson, M. J., Tomlinson, S., Yang, X. B. & Kirkham, J. Cell separation: Terminology and practical considerations. Journal of tissue engineering 4, 2041731412472690, doi:10.1177/2041731412472690 (2013).
6 Van Voorhis, W. C., Hair, L. S., Steinman, R. M. & Kaplan, G. Human dendritic cells. Enrichment and characterization from peripheral blood. The Journal of experimental medicine 155, 1172-1187 (1982).
7 Soleimani, M. & Nadri, S. A protocol for isolation and culture of mesenchymal stem cells from mouse bone marrow. Nature protocols 4, 102-106, doi:10.1038/nprot.2008.221 (2009).
8 Noble, P. B. & Cutts, J. H. Separation of blood leukocytes by Ficoll gradient. The Canadian veterinary journal = La revue veterinaire canadienne 8, 110-111 (1967).
9 Pertoft, H., Rubin, K., Kjellen, L., Laurent, T. C. & Klingeborn, B. The viability of cells grown or centrifuged in a new density gradient medium, Percoll(TM). Experimental cell research 110, 449-457 (1977).
10 De Paoli, P., Villalta, D., Battistin, S., Gasparollo, A. & Santini, G. Selective loss of OKT8 lymphocytes on density gradient centrifugation separation of blood mononuclear cells. Journal of immunological methods 61, 259-260 (1983).
11 Tamul, K. R., Schmitz, J. L., Kane, K. & Folds, J. D. Comparison of the effects of Ficoll-Hypaque separation and whole blood lysis on results of immunophenotypic analysis of blood and bone marrow samples from patients with hematologic malignancies. Clinical and diagnostic laboratory immunology 2, 337-342 (1995).
12 Collins, D. J., Neild, A. & Ai, Y. Highly focused high-frequency travelling surface acoustic waves (SAW) for rapid single-particle sorting. Lab on a chip 16, 471-479, doi:10.1039/c5lc01335f (2016).
13 Ji, H. M. et al. Silicon-based microfilters for whole blood cell separation. Biomedical microdevices 10, 251-257, doi:10.1007/s10544-007-9131-x (2008).
102
14 Shin, D. S. et al. Photodegradable hydrogels for capture, detection, and release of live cells. Angew Chem Int Ed Engl 53, 8221-8224, doi:10.1002/anie.201404323 (2014).
15 Vykoukal, J., Vykoukal, D. M., Freyberg, S., Alt, E. U. & Gascoyne, P. R. Enrichment of putative stem cells from adipose tissue using dielectrophoretic field-flow fractionation. Lab on a chip 8, 1386-1393, doi:10.1039/b717043b (2008).
16 Petersson, F., Aberg, L., Sward-Nilsson, A. M. & Laurell, T. Free flow acoustophoresis: microfluidic-based mode of particle and cell separation. Analytical chemistry 79, 5117-5123, doi:10.1021/ac070444e (2007).
17 Hu, X. et al. Marker-specific sorting of rare cells using dielectrophoresis. Proceedings of the National Academy of Sciences of the United States of America 102, 15757-15761, doi:10.1073/pnas.0507719102 (2005).
18 Jackson, C. J., Garbett, P. K., Nissen, B. & Schrieber, L. Binding of human endothelium to Ulex europaeus I-coated Dynabeads: application to the isolation of microvascular endothelium. Journal of cell science 96 ( Pt 2), 257-262 (1990).
19 Hewett, P. W. & Murray, J. C. Immunomagnetic purification of human microvessel endothelial cells using Dynabeads coated with monoclonal antibodies to PECAM-1. European journal of cell biology 62, 451-454 (1993).
20 Miltenyi, S., Muller, W., Weichel, W. & Radbruch, A. High gradient magnetic cell separation with MACS. Cytometry 11, 231-238, doi:10.1002/cyto.990110203 (1990).
21 Radbruch, A., Mechtold, B., Thiel, A., Miltenyi, S. & Pfluger, E. High-gradient magnetic cell sorting. Methods in cell biology 42 Pt B, 387-403 (1994).
22 Molday, R. S., Yen, S. P. & Rembaum, A. Application of magnetic microspheres in labelling and separation of cells. Nature 268, 437-438 (1977).
23 Manyonda, I. T., Soltys, A. J. & Hay, F. C. A critical evaluation of the magnetic cell sorter and its use in the positive and negative selection of CD45RO+ cells. Journal of immunological methods 149, 1-10 (1992).
24 Stanciu, L. A., Shute, J., Holgate, S. T. & Djukanovic, R. Production of IL-8 and IL-4 by positively and negatively selected CD4+ and CD8+ human T cells following a four-step cell separation method including magnetic cell sorting (MACS). Journal of immunological methods 189, 107-115 (1996).
25 Sao, H. et al. A new marrow T cell depletion method using anti-CD6 monoclonal antibody-conjugated magnetic beads and its clinical application for prevention of acute graft-vs.-host disease in allogeneic bone marrow transplantation: results of a phase I-II trial. International journal of hematology 69, 27-35 (1999).
26 Watanabe, N. et al. Expansion of human CMV-specific cytotoxic T lymphocytes to a clinical scale: a simple culture system using tetrameric HLA-peptide complexes. Cytotherapy 6, 514-522, doi:10.1080/14653240410005005 (2004).
27 Hoffmann, P. et al. Isolation of CD4+CD25+ regulatory T cells for clinical trials. Biology of blood and marrow transplantation : journal of the American Society for Blood and Marrow Transplantation 12, 267-274, doi:10.1016/j.bbmt.2006.01.005 (2006).
28 Sweet, R. G. High Frequency Recording with Electrostatically Deflected Ink Jets. Rev Sci Instrum 36, 131-&, doi:Doi 10.1063/1.1719502 (1965).
103
29 Fulwyler, M. J. Electronic separation of biological cells by volume. Science 150, 910-911 (1965).
30 Wolfgang, D. D. & Wolfgang, G. D. (Google Patents, 1971). 31 Hulett, H. R., Bonner, W. A., Barrett, J. & Herzenberg, L. A. Cell sorting:
automated separation of mammalian cells as a function of intracellular fluorescence. Science 166, 747-749 (1969).
32 Bonner, W. A., Hulett, H. R., Sweet, R. G. & Herzenberg, L. A. Fluorescence activated cell sorting. Rev Sci Instrum 43, 404-409 (1972).
33 Hulett, H. R., Bonner, W. A., Sweet, R. G. & Herzenberg, L. A. Development and application of a rapid cell sorter. Clinical chemistry 19, 813-816 (1973).
34 Futamura, K. et al. Novel full-spectral flow cytometry with multiple spectrally-adjacent fluorescent proteins and fluorochromes and visualization of in vivo cellular movement. Cytometry. Part A : the journal of the International Society for Analytical Cytology 87, 830-842, doi:10.1002/cyto.a.22725 (2015).
35 Bendall, S. C., Nolan, G. P., Roederer, M. & Chattopadhyay, P. K. A deep profiler's guide to cytometry. Trends in immunology 33, 323-332, doi:10.1016/j.it.2012.02.010 (2012).
36 Sack, U. et al. Diagnostic value of blood inflammatory markers for detection of acute appendicitis in children. BMC surgery 6, 15, doi:10.1186/1471-2482-6-15 (2006).
37 Tsien, R. Y. The green fluorescent protein. Annual review of biochemistry 67, 509-544, doi:10.1146/annurev.biochem.67.1.509 (1998).
38 Latt, S. A. Microfluorometric detection of deoxyribonucleic acid replication in human metaphase chromosomes. Proceedings of the National Academy of Sciences of the United States of America 70, 3395-3399 (1973).
39 Fried, J., Perez, A. G. & Clarkson, B. D. Flow cytofluorometric analysis of cell cycle distributions using propidium iodide. Properties of the method and mathematical analysis of the data. The Journal of cell biology 71, 172-181 (1976).
40 Krishan, A. Rapid Flow Cytofluorometric Analysis of Mammalian-Cell Cycle by Propidium Iodide Staining. Journal of Cell Biology 66, 188-193, doi:Doi 10.1083/Jcb.66.1.188 (1975).
41 Oi, V. T., Glazer, A. N. & Stryer, L. Fluorescent phycobiliprotein conjugates for analyses of cells and molecules. The Journal of cell biology 93, 981-986 (1982).
42 Gaudin, R. & Barteneva, N. S. Sorting of small infectious virus particles by flow virometry reveals distinct infectivity profiles. Nature communications 6, 6022, doi:10.1038/ncomms7022 (2015).
43 Crosland-Taylor, P. J. A device for counting small particles suspended in a fluid through a tube. Nature 171, 37-38 (1953).
44 Cossarizza, A. et al. Guidelines for the use of flow cytometry and cell sorting in immunological studies. European journal of immunology 47, 1584-1797, doi:10.1002/eji.201646632 (2017).
45 Shapiro, H. M. Practical flow cytometry. 4th edn, (Wiley-Liss, 2003). 46 Varma, S., Fendyur, A., Box, A. & Voldman, J. Multiplexed Cell-Based
Sensors for Assessing the Impact of Engineered Systems and Methods on Cell Health. Analytical chemistry 89, 4663-4670, doi:10.1021/acs.analchem.7b00256 (2017).
104
47 Llufrio, E. M., Wang, L., Naser, F. J. & Patti, G. J. Sorting cells alters their redox state and cellular metabolome. Redox biology 16, 381-387, doi:10.1016/j.redox.2018.03.004 (2018).
48 Richardson, G. M., Lannigan, J. & Macara, I. G. Does FACS perturb gene expression? Cytometry. Part A : the journal of the International Society for Analytical Cytology 87, 166-175, doi:10.1002/cyto.a.22608 (2015).
49 Olesen, S. P., Clapham, D. E. & Davies, P. F. Haemodynamic shear stress activates a K+ current in vascular endothelial cells. Nature 331, 168-170, doi:10.1038/331168a0 (1988).
50 Ge, J. et al. Standard fluorescent imaging of live cells is highly genotoxic. Cytometry. Part A : the journal of the International Society for Analytical Cytology 83, 552-560, doi:10.1002/cyto.a.22291 (2013).
51 Catt, S. L. et al. Hoechst staining and exposure to UV laser during flow cytometric sorting does not affect the frequency of detected endogenous DNA nicks in abnormal and normal human spermatozoa. Molecular human reproduction 3, 821-825 (1997).
52 Seidl, J., Knuechel, R. & Kunz-Schughart, L. A. Evaluation of membrane physiology following fluorescence activated or magnetic cell separation. Cytometry 36, 102-111 (1999).
53 Zhou, X., Naguro, I., Ichijo, H. & Watanabe, K. Mitogen-activated protein kinases as key players in osmotic stress signaling. Biochimica et biophysica acta 1860, 2037-2052, doi:10.1016/j.bbagen.2016.05.032 (2016).
54 Pasantes-Morales, H., Lezama, R. A., Ramos-Mandujano, G. & Tuz, K. L. Mechanisms of cell volume regulation in hypo-osmolality. The American journal of medicine 119, S4-11, doi:10.1016/j.amjmed.2006.05.002 (2006).
55 Burg, M. B., Ferraris, J. D. & Dmitrieva, N. I. Cellular response to hyperosmotic stresses. Physiological reviews 87, 1441-1474, doi:10.1152/physrev.00056.2006 (2007).
56 Wang, L., Wormstone, I. M., Reddan, J. R. & Duncan, G. Growth factor receptor signalling in human lens cells: role of the calcium store. Experimental eye research 80, 885-895, doi:10.1016/j.exer.2005.01.002 (2005).
57 Goding, J. W. Biological effects of antibodies to lymphocyte surface receptors. Springer seminars in immunopathology 5, 463-475 (1982).
58 Knight, J. R. et al. Eukaryotic elongation factor 2 kinase regulates the cold stress response by slowing translation elongation. The Biochemical journal 465, 227-238, doi:10.1042/BJ20141014 (2015).
59 Roberts, J. R., Rowe, P. A. & Demaine, A. G. Activation of NF-kappaB and MAP kinase cascades by hypothermic stress in endothelial cells. Cryobiology 44, 161-169 (2002).
60 Eisinger, J. & Scarlata, S. F. The lateral fluidity of erythrocyte membranes. Temperature and pressure dependence. Biophysical chemistry 28, 273-281 (1987).
61 Nicolini, C., Baserga, R. & Kendall, F. DNA structure in sheared and unsheared chromatin. Science 192, 796-798 (1976).
62 Kazi, M. et al. Inhibition of rat smooth muscle cell adhesion and proliferation by non-anticoagulant heparins. Journal of cellular physiology 193, 365-372, doi:10.1002/jcp.10184 (2002).
63 Maxwell, W. M., Welch, G. R. & Johnson, L. A. Viability and membrane integrity of spermatozoa after dilution and flow cytometric sorting in the
105
presence or absence of seminal plasma. Reproduction, fertility, and development 8, 1165-1178 (1996).
64 Donnelly, N., Gorman, A. M., Gupta, S. & Samali, A. The eIF2alpha kinases: their structures and functions. Cellular and molecular life sciences : CMLS 70, 3493-3511, doi:10.1007/s00018-012-1252-6 (2013).
65 Ye, J. et al. The GCN2-ATF4 pathway is critical for tumour cell survival and proliferation in response to nutrient deprivation. The EMBO journal 29, 2082-2096, doi:10.1038/emboj.2010.81 (2010).
66 Deval, C. et al. Amino acid limitation regulates the expression of genes involved in several specific biological processes through GCN2-dependent and GCN2-independent pathways. The FEBS journal 276, 707-718, doi:10.1111/j.1742-4658.2008.06818.x (2009).
67 Giehl, K., Skripczynski, B., Mansard, A., Menke, A. & Gierschik, P. Growth factor-dependent activation of the Ras-Raf-MEK-MAPK pathway in the human pancreatic carcinoma cell line PANC-1 carrying activated K-ras: implications for cell proliferation and cell migration. Oncogene 19, 2930-2942, doi:10.1038/sj.onc.1203612 (2000).
68 Cohen-Saidon, C., Cohen, A. A., Sigal, A., Liron, Y. & Alon, U. Dynamics and variability of ERK2 response to EGF in individual living cells. Molecular cell 36, 885-893, doi:10.1016/j.molcel.2009.11.025 (2009).
69 Brandsma, A. M., Jacobino, S. R., Meyer, S., ten Broeke, T. & Leusen, J. H. Fc receptor inside-out signaling and possible impact on antibody therapy. Immunological reviews 268, 74-87, doi:10.1111/imr.12332 (2015).
70 Waldmann, T. A. Anti-Tac (daclizumab, Zenapax) in the treatment of leukemia, autoimmune diseases, and in the prevention of allograft rejection: a 25-year personal odyssey. Journal of clinical immunology 27, 1-18, doi:10.1007/s10875-006-9060-0 (2007).
71 Moreau, J. L. et al. Monoclonal antibodies identify three epitope clusters on the mouse p55 subunit of the interleukin 2 receptor: relationship to the interleukin 2-binding site. European journal of immunology 17, 929-935, doi:10.1002/eji.1830170706 (1987).
72 Bradbury, A. R., Sidhu, S., Dubel, S. & McCafferty, J. Beyond natural antibodies: the power of in vitro display technologies. Nature biotechnology 29, 245-254, doi:10.1038/nbt.1791 (2011).
73 Melero, I. et al. Monoclonal antibodies against the 4-1BB T-cell activation molecule eradicate established tumors. Nature medicine 3, 682-685 (1997).
74 Dyavar Shetty, R. et al. PD-1 blockade during chronic SIV infection reduces hyperimmune activation and microbial translocation in rhesus macaques. The Journal of clinical investigation 122, 1712-1716, doi:10.1172/JCI60612 (2012).
75 Schwab, R., Crow, M. K., Russo, C. & Weksler, M. E. Requirements for T cell activation by OKT3 monoclonal antibody: role of modulation of T3 molecules and interleukin 1. J Immunol 135, 1714-1718 (1985).
76 Werlen, G., Hausmann, B. & Palmer, E. A motif in the alphabeta T-cell receptor controls positive selection by modulating ERK activity. Nature 406, 422-426, doi:10.1038/35019094 (2000).
77 Werlen, G. & Palmer, E. The T-cell receptor signalosome: a dynamic structure with expanding complexity. Current opinion in immunology 14, 299-305 (2002).
106
78 Stemberger, C. et al. Novel serial positive enrichment technology enables clinical multiparameter cell sorting. PloS one 7, e35798, doi:10.1371/journal.pone.0035798 (2012).
79 Nauerth, M. et al. Flow cytometry-based TCR-ligand Koff -rate assay for fast avidity screening of even very small antigen-specific T cell populations ex vivo. Cytometry. Part A : the journal of the International Society for Analytical Cytology 89, 816-825, doi:10.1002/cyto.a.22933 (2016).
80 Schmidt, T. G. & Skerra, A. The Strep-tag system for one-step purification and high-affinity detection or capturing of proteins. Nature protocols 2, 1528-1535, doi:10.1038/nprot.2007.209 (2007).
81 Roobol, A., Carden, M. J., Newsam, R. J. & Smales, C. M. Biochemical insights into the mechanisms central to the response of mammalian cells to cold stress and subsequent rewarming. The FEBS journal 276, 286-302, doi:10.1111/j.1742-4658.2008.06781.x (2009).
82 Corwin, W. L., Baust, J. M., Baust, J. G. & Van Buskirk, R. G. Characterization and modulation of human mesenchymal stem cell stress pathway response following hypothermic storage. Cryobiology 68, 215-226, doi:10.1016/j.cryobiol.2014.01.014 (2014).
83 Saba-El-Leil, M. K., Fremin, C. & Meloche, S. Redundancy in the World of MAP Kinases: All for One. Frontiers in cell and developmental biology 4, 67, doi:10.3389/fcell.2016.00067 (2016).
84 Nishimoto, S. & Nishida, E. MAPK signalling: ERK5 versus ERK1/2. EMBO reports 7, 782-786, doi:10.1038/sj.embor.7400755 (2006).
85 Hisazumi, H., Andersson, L. & Collins, V. P. Fibrinolytic activity of in vitro cultivated human bladder cell lines. Urological research 5, 133-139 (1977).
86 Matsushita, M., Endo, Y. & Fujita, T. Structural and functional overview of the lectin complement pathway: its molecular basis and physiological implication. Archivum immunologiae et therapiae experimentalis 61, 273-283, doi:10.1007/s00005-013-0229-y (2013).
87 Sim, R. B. & Tsiftsoglou, S. A. Proteases of the complement system. Biochemical Society transactions 32, 21-27, doi:10.1042/ (2004).
88 Luo, C., Chen, M., Madden, A. & Xu, H. Expression of complement components and regulators by different subtypes of bone marrow-derived macrophages. Inflammation 35, 1448-1461, doi:10.1007/s10753-012-9458-1 (2012).
89 Duch, A., de Nadal, E. & Posas, F. The p38 and Hog1 SAPKs control cell cycle progression in response to environmental stresses. FEBS letters 586, 2925-2931, doi:10.1016/j.febslet.2012.07.034 (2012).
90 Thornton, T. M. & Rincon, M. Non-classical p38 map kinase functions: cell cycle checkpoints and survival. International journal of biological sciences 5, 44-51 (2009).
91 Coulthard, L. R., White, D. E., Jones, D. L., McDermott, M. F. & Burchill, S. A. p38(MAPK): stress responses from molecular mechanisms to therapeutics. Trends in molecular medicine 15, 369-379, doi:10.1016/j.molmed.2009.06.005 (2009).
92 McCoy, J. P., Jr., Chambers, W. H., Lakomy, R., Campbell, J. A. & Stewart, C. C. Sorting minor subpopulations of cells: use of fluorescence as the triggering signal. Cytometry 12, 268-274, doi:10.1002/cyto.990120310 (1991).
93 Arraud, N., Gounou, C., Turpin, D. & Brisson, A. R. Fluorescence triggering: A general strategy for enumerating and phenotyping extracellular vesicles by flow cytometry. Cytometry. Part A : the journal of
107
the International Society for Analytical Cytology 89, 184-195, doi:10.1002/cyto.a.22669 (2016).
94 Nolan, J. P. & Duggan, E. Analysis of Individual Extracellular Vesicles by Flow Cytometry. Methods Mol Biol 1678, 79-92, doi:10.1007/978-1-4939-7346-0_5 (2018).
95 Arraud, N., Gounou, C., Linares, R. & Brisson, A. R. A simple flow cytometry method improves the detection of phosphatidylserine-exposing extracellular vesicles. Journal of thrombosis and haemostasis : JTH 13, 237-247, doi:10.1111/jth.12767 (2015).
96 Alanio, C., Lemaitre, F., Law, H. K., Hasan, M. & Albert, M. L. Enumeration of human antigen-specific naive CD8+ T cells reveals conserved precursor frequencies. Blood 115, 3718-3725, doi:10.1182/blood-2009-10-251124 (2010).
97 Knabel, M. et al. Reversible MHC multimer staining for functional isolation of T-cell populations and effective adoptive transfer. Nature medicine 8, 631-637, doi:10.1038/nm0602-631 (2002).
98 Pelak, O. et al. Lymphocyte enrichment using CD81-targeted immunoaffinity matrix. Cytometry. Part A : the journal of the International Society for Analytical Cytology 91, 62-72, doi:10.1002/cyto.a.22918 (2017).
99 Piyasena, M. E. et al. Multinode acoustic focusing for parallel flow cytometry. Analytical chemistry 84, 1831-1839, doi:10.1021/ac200963n (2012).
100 Bodinier, M. et al. Efficient detection and immunomagnetic sorting of specific T cells using multimers of MHC class I and peptide with reduced CD8 binding. Nature medicine 6, 707-710, doi:10.1038/76292 (2000).
101 Kodituwakku, A. P., Jessup, C., Zola, H. & Roberton, D. M. Isolation of antigen-specific B cells. Immunology and cell biology 81, 163-170, doi:10.1046/j.1440-1711.2003.01152.x (2003).
102 Schober, K., Buchholz, V. R. & Busch, D. H. TCR repertoire evolution during maintenance of CMV-specific T-cell populations. Immunological reviews 283, 113-128, doi:10.1111/imr.12654 (2018).
103 Blattman, J. N. et al. Estimating the precursor frequency of naive antigen-specific CD8 T cells. The Journal of experimental medicine 195, 657-664 (2002).
104 World Medical Association Declaration of Helsinki: ethical principles for medical research involving human subjects. Jama 310, 2191-2194, doi:10.1001/jama.2013.281053 (2013).
105 Giard, D. J. et al. In vitro cultivation of human tumors: establishment of cell lines derived from a series of solid tumors. Journal of the National Cancer Institute 51, 1417-1423 (1973).


![Synthesis and Characterization of [n]Cumulenes](https://img.pdfslide.org/doc/110x75/58a181de1a28abb24d8c126c/synthesis-and-characterization-of-ncumulenes-.jpg)