Embed Size (px)
Citation preview

-Institut für Geodäsie und Geoinformation-
Conceptualizing the concept of disaster resilience: a hybrid
approach in the context of earthquake hazard
case study of Tehran City, Iran
Dissertation
zur
Erlangung des Grades
Doktor der Ingenieurwissenschaften (Dr.-Ing.)
der Landwirtschaftlichen Fakultät
der Rheinischen Friedrich-Wilhelms-Universität Bonn
von
Asad Asadzadeh
aus
Ahar, Iran
Bonn 2017

Referent: Prof. Dr.‐Ing. Theo Kötter
Korreferent: Prof. Dr.-Ing. Jörn Birkmann
Korreferent: Prof. Dr. Wolf-Dieter Schuh
Tag der mündlichen Prüfung: 16. 12. 2016
Angefertigt mit Genehmigung der Landwirtschaftlichen Fakultät der Universität Bonn
Abstract
From the natural perspective, disaster resilience is defined as the ability of a system or community to
resist, mitigate, respond, and recover from the effects of hazards in efficient and timely manner. How
urban communities recover subsequent a disaster event is often conceptualized in terms of their
disaster resilience level. While numerous studies have been carried out on the importance of disaster
resilience measurement, a few of them suggest how and by which mechanism the concept can be
quantified. Thus, the primary purpose of this thesis is to advance our understanding of the
multifaceted nature of disaster resilience and answer to the general question of how the concept of
disaster resilience can be operationalized in the context of earthquake hazard.
The starting point for conceptualizing the concept of disaster resilience is performed through the
development of measurement and benchmarking tools for better understanding of factors that
contribute to resilience and the effectiveness of interventions to sustain it. Since constructing
composite indicators has often been addressed to perform this task in literature, this research has
proposed the new hybrid approach to develop a sound set of composite indicators in the context of
earthquake hazard.
The methodology has specially scrutinized data reduction and factor retention, and indicators
weighting steps using a hybrid factor analysis and analytic network process (F’ANP). It replaces the
hierarchical and deductive methods in the literature with an inductive method of factor analysis. The
methodology also applies an unequal weighting method instead of an equal weighting in which the
inter-dependencies and feedbacks among all indicators are considered.
The 368 urban neighborhoods (within 22 urban regions and 116 sub-regions) of Tehran City were
utilized as a case study and validation tool for developing a new set of composite indicators in this
dissertation. The ability to measure disaster resilience and the issue of resilience building is important
for a community such as Tehran in view of the fact that the urban areas within the city tend to be
inherently vulnerable, partially because of the high population and building density, and partially due
to their exposure to earthquake hazard.
Visualization of the results (using Arc-GIS) provided a better understanding of resilience and its
variation level at the scale of urban regions, sub-regions and urban neighborhoods. The results
showed that the northern areas are relatively more disaster resilient while the regions located in the
south or center of the city reflect lower level of disaster resilience. The reliability and validity of the
proposed approach were assessed through comparing its results with the results of DROP and JICA
studies using a scatter plot and Pearson’s correlation coefficient. The findings indicated that there is a
strong positive relationship between the results of this study and the results of other two models.

Zusammenfassung
Wie sich Städte entwickeln, nachdem sie von einer Naturkatastrophe getroffen wurden ist abhängig
von ihrem Grad der Resilienz gegenüber Katastrophen. Resilienz gegenüber Naturkatastrophen aber
keine fest definierte Größe sondern fasst eine Reihe von Eigenschaften eines System, in dieser Arbeit
einer Stadt zusammen, die negative Folgen solcher Ereignisse reduzieren und sich von dem Ereignis
wieder zu erholen. Die Fähigkeit außer den Risiken und der Vulnerabilität auch die Resilienz von
Städten zu messen, wird zunehmend als ein grundlegendes Ziel der Risikominderung und des
Risikomanagements betrachtet. Zahlreiche Studien beschreiben das Konzept der Resilienz und heben
die Bedeutung für die urbane Entwicklung heraus. Es wurden jedoch nur in wenigen Arbeiten
tragfähige Ansätze entwickelt, wie und mit welcher Methodik die Resilienz gegenüber Katastrophen
gemessen werden können. Das primäre Ziel dieser Dissertation ist, unser Verständnis der Resilienz zu
erweitern und eine Operationalisierung des Begriffs zu entwickeln. Der Fokus der Arbeit ist dabei auf
die Anwendung des Konzeptes der Resilienz im Zusammenhang mit Erdbebenrisiken gerichtet.
Ausgehend von der Idee der Resilienzmessung über einen kompositen Index wird in dieser Arbeit ein
neues Indikatorenset aufgebaut, welches die Resilienz gegenüber Erdbebenrisiken effektiv messen
kann. Die Vorgehensweise, mit der die Relevanz der Indikatoren und Ihre Reliabilität innerhalb eines
kompositen Index sichergestellt wird, ist entscheidend für die Güte des Messverfahrens. Die
vorgeschlagene Methodik ermöglicht eine Reduktion der Indikatoren und deren Gewichtung unter
Verwendung einer hybriden Faktoren-Analyse und des Analytischen Netzwerkprozesses (F'ANP). Dies
ersetzt die aus der Literatur bekannte hierarchisch-deduktive Methode durch eine induktive Methode
der Faktorenanalyse. Die Methodik verwendet an Stelle einer Gleichgewichtung der Indikatoren eine
ungleiche Gewichtung, in dem die Wechselbeziehungen und das Feedback zwischen allen Indikatoren
berücksichtigt werden.
Anhand der Fallstudie Teheran wird der Ansatz validiert und der neu entwickelte Satz von
Sammelindikatoren für 368 Wohnviertel in 22 städtischen Regionen im Stadtgebiet von Teheran
angewendet. Die Möglichkeit der Beurteilung der Resilienz einer Stadt ist insbesondere für Teheran in
Anbetracht der hohen Erdbebenrisikos, der hohen Bevölkerungs- und Bebauungsdichte von hoher
Bedeutung.
Die Ergebnisse werden mit Arc-GIS visualisiert und liefern ein besseres Verständnis der Resilienz und
der Variationen innerhalb der Stadt. Die Ergebnisse zeigen, dass die nördlichen Regionen
verhältnismäßig resilient gegenüber Erdbeben sind. Die Regionen im Süden und im Zentrum der Stadt
weisen hingegen eine geringe Resilienz gegenüber Erdbeben auf. Die Zuverlässigkeit und die Validität
des vorgeschlagenen Ansatzes wurden durch einen Vergleich mit den Ergebnissen bereits
vorliegender Studien (DROP, JICA) beurteilt. Die Ergebnisse zeigen, dass es eine starke positive
Korrelation zwischen des neu entwickelten Ansatzes und den vorliegenden Ansätzen gibt.

Acknowledgements
In many ways, many people helped me to successfully accomplish this work. First of all, I would like to
thank my promoter - “doctor father” Prof. Dr.-Ing. Theo Kötter who gave me the chance to be involved
in his UPLM (Urban Planning and Land Management) research group. I really thank you for guiding me
throughout the time of conducting this research. Our dialog and discussions were always very open
and this research would not have been completed without your guidance, supports, and
encouragements.
I am thankful to my second supervisor Prof. Dr-Ing. Jörn Birkmann (University of Stuttgart) for his
scientific advices and recommendations during the development of this study. I’d also like to thank
Prof. Dr. Wolf-Dieter Schuh (University of Bonn) for his precise reviews and high quality
recommendations in improving the scientific writing of this thesis as well as the technical parts. My
deep gratitude goes to Prof. Dr. Esfandiar Zebardast (University of Tehran, Iran) for introducing the
methodology and supporting in the data acquisition process. I would also like to thank Prof. Sven
Lautenbach (University of Bonn) for being always interested in discussing my research and its
methodology. Without the constructive comments of all above mentioned people, this study could
not be performed in this manner.
I would also like to extend my gratitude to my colleagues and friends whose honest help caused to
perform this research in efficient way. In particular, I thank Sebastian Kropp, Dr. Dominik Weiß, and
Christina Pils for providing the German summary of this thesis, and Sujit Kumar Sikder for our friendly
discussions. Lastly but not the least, I would like thank my family particularly my wife Sahar for her
support and understanding during the time of performing this dissertation. I hope she would accept
this work being dedicated to her.
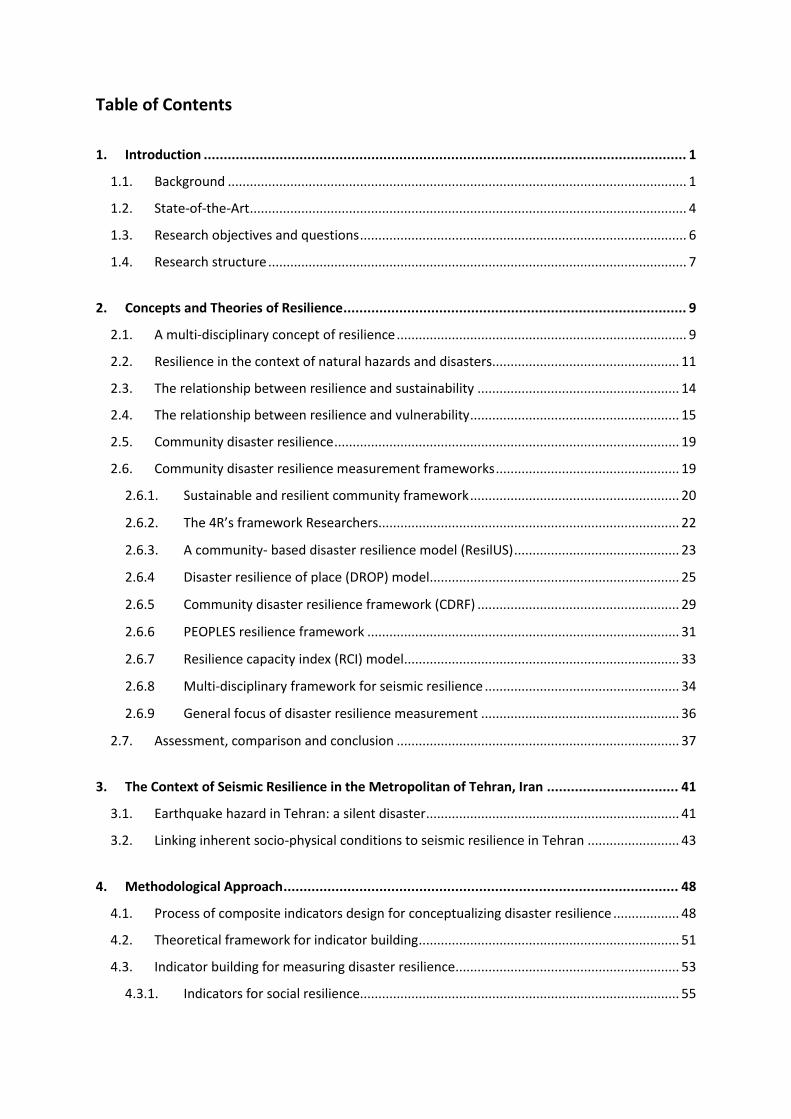
Table of Contents
1. Introduction ......................................................................................................................... 1
1.1. Background ............................................................................................................................. 1
1.2. State-of-the-Art ....................................................................................................................... 4
1.3. Research objectives and questions ......................................................................................... 6
1.4. Research structure .................................................................................................................. 7
2. Concepts and Theories of Resilience ...................................................................................... 9
2.1. A multi-disciplinary concept of resilience ............................................................................... 9
2.2. Resilience in the context of natural hazards and disasters................................................... 11
2.3. The relationship between resilience and sustainability ....................................................... 14
2.4. The relationship between resilience and vulnerability ......................................................... 15
2.5. Community disaster resilience .............................................................................................. 19
2.6. Community disaster resilience measurement frameworks .................................................. 19
2.6.1. Sustainable and resilient community framework ......................................................... 20
2.6.2. The 4R’s framework Researchers.................................................................................. 22
2.6.3. A community- based disaster resilience model (ResilUS) ............................................. 23
2.6.4 Disaster resilience of place (DROP) model .................................................................... 25
2.6.5 Community disaster resilience framework (CDRF) ....................................................... 29
2.6.6 PEOPLES resilience framework ..................................................................................... 31
2.6.7 Resilience capacity index (RCI) model ........................................................................... 33
2.6.8 Multi-disciplinary framework for seismic resilience ..................................................... 34
2.6.9 General focus of disaster resilience measurement ...................................................... 36
2.7. Assessment, comparison and conclusion ............................................................................. 37
3. The Context of Seismic Resilience in the Metropolitan of Tehran, Iran ................................. 41
3.1. Earthquake hazard in Tehran: a silent disaster ..................................................................... 41
3.2. Linking inherent socio-physical conditions to seismic resilience in Tehran ......................... 43
4. Methodological Approach ................................................................................................... 48
4.1. Process of composite indicators design for conceptualizing disaster resilience .................. 48
4.2. Theoretical framework for indicator building ....................................................................... 51
4.3. Indicator building for measuring disaster resilience ............................................................. 53
4.3.1. Indicators for social resilience....................................................................................... 55

4.3.2. Indicators for economic resilience ................................................................................ 56
4.3.3. Indicators for Institutional resilience ............................................................................ 57
4.3.4. Indicators for housing and infrastructural resilience .................................................... 57
4.3.5. Indicators for community capital resilience .................................................................. 59
4.3.6. Selected set of indicators for measuring disaster resilience ........................................ 60
4.4. Data standardization and overcoming incommensurability ................................................. 62
4.5. Components of disaster resilience (data reduction and identifying latent dimensions) ..... 63
4.5.1. Data suitability .............................................................................................................. 64
4.5.2. Type of factors extraction ............................................................................................. 64
4.5.3. Number of extracted factors (component)................................................................... 65
4.5.4. Type of rotational method ............................................................................................ 65
4.5.5. Perform the Principal Component Analysis (PCA) ........................................................ 66
4.5.5.1. Communalities checking ....................................................................................... 66
4.5.5.2. Testing appropriateness of the data ..................................................................... 67
4.5.5.3. Total variance explained and the number extracted components ....................... 67
4.5.5.4. Rotated component matrix and factor loadings ................................................... 69
4.5.5.5. Labelling extracted components ........................................................................... 71
4.6. Weighting and aggregation of indicators .............................................................................. 73
4.6.1. Model construction and problem structuring .............................................................. 74
4.6.2. Formation of the primary super matrix ........................................................................ 76
4.6.2.1. Interactions between the goal and DR dimensions or vector [w21 ] ................... 76
4.6.2.2. Interaction between DR dimensions and their indicators or matrix [w32 ] ......... 77
4.6.2.3. Interactions between variables in each DR or matrix [w33 ] ............................... 78
4.6.2.4. Final relative weight of disaster resilience indicators ........................................... 79
4.6.3. Disaster resilience index (DRI) score (aggregation) ...................................................... 84
4.7. Summary ............................................................................................................................... 86
5. Multi-dimensional and Multi-scale Patterns of Disaster Resilience in Tehran, Iran ................ 88
5.1. Spatial distribution of disaster resilience in Tehran City ...................................................... 88
5.2. Multi-faceted and multi-scale characteristics of disaster resilience in Tehran .................... 95
5.2.1 Built environment & social dynamic ............................................................................. 95
5.2.2 Urban land use & dependent population ..................................................................... 96
5.2.3 Socio-cultural capacity .................................................................................................. 98
5.2.4 Life quality ..................................................................................................................... 99
5.2.5 Open space .................................................................................................................. 101
5.2.6 Social capital................................................................................................................ 102
5.2.7 Emergency infrastructure ........................................................................................... 104
5.2.8 Economic structure ..................................................................................................... 105
5.3. Quality characteristics of disaster resilience in Tehran ...................................................... 107
5.3.1. Absorptive capacity ............................................................................................................. 107
5.3.2. Adaptive capacity ................................................................................................................ 108
5.4. Summary ............................................................................................................................. 109
6. Discussion ........................................................................................................................ 111
6.1. Divergent conceptualizing frameworks of disaster resilience ............................................ 111
6.2. A new methodological approach for conceptualizing disaster resilience .......................... 113
6.3. Visualization of the composite disaster resilience indicators ............................................. 116
6.4. Validity and reliability of the results ................................................................................... 117
6.5. Methodological comprehensiveness for urban resilience assessment .............................. 122
6.6. Incorporating disaster resilience into urban planning ........................................................ 123
7. Conclusion and Further Work ............................................................................................ 125
7.1. Conclusion ........................................................................................................................... 125
7.2. Research contribution ......................................................................................................... 126
7.3. Further work ....................................................................................................................... 127
References .......................................................................................................................................... 129
Appendixes .......................................................................................................................................... 139
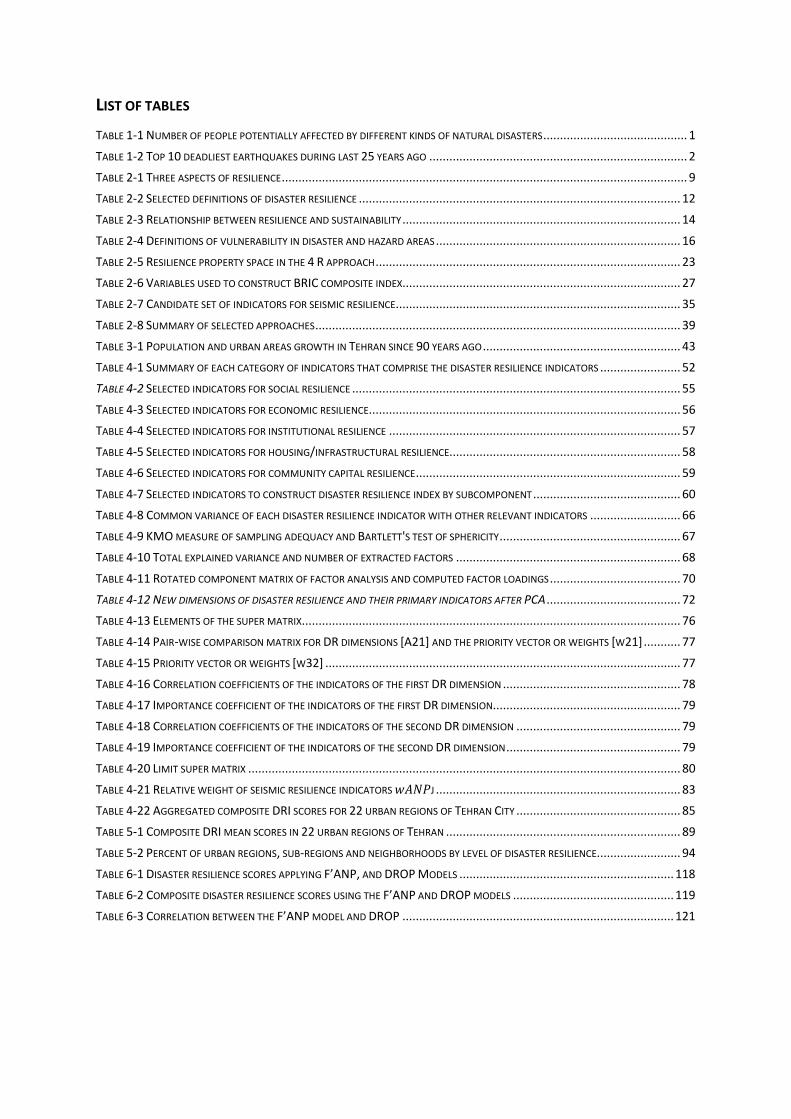
LIST OF TABLES
TABLE 1-1 NUMBER OF PEOPLE POTENTIALLY AFFECTED BY DIFFERENT KINDS OF NATURAL DISASTERS ........................................... 1
TABLE 1-2 TOP 10 DEADLIEST EARTHQUAKES DURING LAST 25 YEARS AGO ............................................................................. 2
TABLE 2-1 THREE ASPECTS OF RESILIENCE ......................................................................................................................... 9
TABLE 2-2 SELECTED DEFINITIONS OF DISASTER RESILIENCE ................................................................................................ 12
TABLE 2-3 RELATIONSHIP BETWEEN RESILIENCE AND SUSTAINABILITY ................................................................................... 14
TABLE 2-4 DEFINITIONS OF VULNERABILITY IN DISASTER AND HAZARD AREAS ......................................................................... 16
TABLE 2-5 RESILIENCE PROPERTY SPACE IN THE 4 R APPROACH ........................................................................................... 23
TABLE 2-6 VARIABLES USED TO CONSTRUCT BRIC COMPOSITE INDEX................................................................................... 27
TABLE 2-7 CANDIDATE SET OF INDICATORS FOR SEISMIC RESILIENCE ..................................................................................... 35
TABLE 2-8 SUMMARY OF SELECTED APPROACHES ............................................................................................................. 39
TABLE 3-1 POPULATION AND URBAN AREAS GROWTH IN TEHRAN SINCE 90 YEARS AGO ........................................................... 43
TABLE 4-1 SUMMARY OF EACH CATEGORY OF INDICATORS THAT COMPRISE THE DISASTER RESILIENCE INDICATORS ........................ 52
TABLE 4-2 SELECTED INDICATORS FOR SOCIAL RESILIENCE .................................................................................................. 55
TABLE 4-3 SELECTED INDICATORS FOR ECONOMIC RESILIENCE ............................................................................................. 56
TABLE 4-4 SELECTED INDICATORS FOR INSTITUTIONAL RESILIENCE ....................................................................................... 57
TABLE 4-5 SELECTED INDICATORS FOR HOUSING/INFRASTRUCTURAL RESILIENCE..................................................................... 58
TABLE 4-6 SELECTED INDICATORS FOR COMMUNITY CAPITAL RESILIENCE ............................................................................... 59
TABLE 4-7 SELECTED INDICATORS TO CONSTRUCT DISASTER RESILIENCE INDEX BY SUBCOMPONENT ............................................ 60
TABLE 4-8 COMMON VARIANCE OF EACH DISASTER RESILIENCE INDICATOR WITH OTHER RELEVANT INDICATORS ........................... 66
TABLE 4-9 KMO MEASURE OF SAMPLING ADEQUACY AND BARTLETT'S TEST OF SPHERICITY ...................................................... 67
TABLE 4-10 TOTAL EXPLAINED VARIANCE AND NUMBER OF EXTRACTED FACTORS ................................................................... 68
TABLE 4-11 ROTATED COMPONENT MATRIX OF FACTOR ANALYSIS AND COMPUTED FACTOR LOADINGS ....................................... 70
TABLE 4-12 NEW DIMENSIONS OF DISASTER RESILIENCE AND THEIR PRIMARY INDICATORS AFTER PCA ........................................ 72
TABLE 4-13 ELEMENTS OF THE SUPER MATRIX ................................................................................................................. 76
TABLE 4-14 PAIR-WISE COMPARISON MATRIX FOR DR DIMENSIONS [A21] AND THE PRIORITY VECTOR OR WEIGHTS [W21] ........... 77
TABLE 4-15 PRIORITY VECTOR OR WEIGHTS [W32] .......................................................................................................... 77
TABLE 4-16 CORRELATION COEFFICIENTS OF THE INDICATORS OF THE FIRST DR DIMENSION ..................................................... 78
TABLE 4-17 IMPORTANCE COEFFICIENT OF THE INDICATORS OF THE FIRST DR DIMENSION ........................................................ 79
TABLE 4-18 CORRELATION COEFFICIENTS OF THE INDICATORS OF THE SECOND DR DIMENSION ................................................. 79
TABLE 4-19 IMPORTANCE COEFFICIENT OF THE INDICATORS OF THE SECOND DR DIMENSION .................................................... 79
TABLE 4-20 LIMIT SUPER MATRIX ................................................................................................................................. 80
TABLE 4-21 RELATIVE WEIGHT OF SEISMIC RESILIENCE INDICATORS 𝑤𝐴𝑁𝑃J ......................................................................... 83
TABLE 4-22 AGGREGATED COMPOSITE DRI SCORES FOR 22 URBAN REGIONS OF TEHRAN CITY ................................................. 85
TABLE 5-1 COMPOSITE DRI MEAN SCORES IN 22 URBAN REGIONS OF TEHRAN ...................................................................... 89
TABLE 5-2 PERCENT OF URBAN REGIONS, SUB-REGIONS AND NEIGHBORHOODS BY LEVEL OF DISASTER RESILIENCE......................... 94
TABLE 6-1 DISASTER RESILIENCE SCORES APPLYING F’ANP, AND DROP MODELS ................................................................ 118
TABLE 6-2 COMPOSITE DISASTER RESILIENCE SCORES USING THE F’ANP AND DROP MODELS ................................................ 119
TABLE 6-3 CORRELATION BETWEEN THE F’ANP MODEL AND DROP ................................................................................. 121

List of Figures
FIGURE 1-1 THE MOST DANGEROUS METROPOLITANS TO SEISMIC HAZARD .............................................................................. 2
FIGURE 1-2 LOGICAL FLOW CHART OF THE DISSERTATION .................................................................................................... 8
FIGURE 2-1 CONCEPTUAL LINKAGE BETWEEN VULNERABILITY, RESILIENCE, AND ADAPTIVE CAPACITY .......................................... 18
FIGURE 2-2 SUSTAINABLE AND RESILIENT COMMUNITY FRAMEWORK ................................................................................... 21
FIGURE 2-3 RECOVERY OF DAMAGED LOW AND HIGH-INCOME HOUSEHOLDS ......................................................................... 24
FIGURE 2-4 SEISMIC SHAKING AND RECOVERY TIME FOR RESILIENCE .................................................................................... 25
FIGURE 2-5 DISASTER RESILIENCE OF PLACE (DROP) MODEL ............................................................................................. 26
FIGURE 2-6 BRIC FEMA REGION IV DISASTER RESILEINCE AGAINST HURRICAN ..................................................................... 29
FIGURE 2-7 COMMUNITY DISASTER RESILEINCE FRAMEWORK (DDRF) ................................................................................. 30
FIGURE 2-8 SPATIAL DISTRIBUTION OF PATTERNS OF CDRI SCORES ..................................................................................... 31
FIGURE 2-9 FUNCTIONALITY CURVE AND RESILEINCE ......................................................................................................... 31
FIGURE 2-10 PEOPLE RESILEINCE FRAMEWORK AND ASSOCIATED GEOGRAPHIC SCALES .......................................................... 32
FIGURE 2-11 RESILIENCE CAPACITY INDEX (RCI) FRAMEWORK ............................................................................................ 33
FIGURE 2-12 RCI SPATIAL MAPPING OF DISASTER RESILIENCE LEVEL ..................................................................................... 34
FIGURE 2-13 FRAMEWORK DEFINING TOPICAL MACRO-AREAS AND RESILIENCE DESCRIPTORS .................................................... 35
FIGURE 2-14 THREE CHARACTERISTICS OF DISASTER RESILIENCE PROGRAMMING .................................................................... 37
FIGURE 3-1 THE 22 URBAN REGIONS OF TEHRAN CITY AND POSITION OF IST MAJOR FAULTS ..................................................... 42
FIGURE 3-2 SOME OF DESTRUCTIVE OCCURED EARTHQUAKES IN THE CASE STUDY ................................................................... 43
FIGURE 3-3 DEVELOPMENT STAGES OF THE CITY OF TEHRAN OVER THE PAST CENTURY ............................................................ 44
FIGURE 3-4 EARTHQUAKE RISK ASSESSMENT OF TEHRAN’S URBAN REGIONS ......................................................................... 45
FIGURE 3-5 THE MOST VULNERABLE MEGACITIES BASED ON PEOPLE POTENTIALLY AFFECTED BY EARTHQUAKES............................. 46
FIGURE 4-1 PROCESS DIAGRAM OF THE PROPOSED APPROACH TO CONSTRUCT COMPOSITE INDICATORS ...................................... 50
FIGURE 4-2 SUBCOMPONENTS OF DISASTER RESILIENCE .................................................................................................... 53
FIGURE 4-3 ANALYTIC NETWORK PROCESS (ANP) OF THE MODEL TO CONSTRUCT DISASTER RESILIENCE INDICATORS ..................... 75
FIGURE 4-4 CONTRIBUTION OF THE EIGHT DIMENSIONS TO DISASTER RESILIENCE LEVEL IN TEHRAN ............................................ 86
FIGURE 5-1 SPATIAL DISTRIBUTION OF DISASTER RESILIENCE FOR THE 22 URBAN REGIONS OF TEHRAN ........................................ 91
FIGURE 5-2 SPATIAL DISTRIBUTION OF DISASTER RESILIENCE FOR 116 URBAN SUB-REGIONS ..................................................... 92
FIGURE 5-3 SPATIAL DISTRIBUTION OF DISASTER RESILIENCE FOR 368 URBAN NEIGHBORHOODS ................................................ 93
FIGURE 5-4 BUILT ENVIRONMENT & SOCIAL DYNAMIC DIMENSION OF DISASTER RESILEINCE IN URBAN REGIONS ........................... 95
FIGURE 5-5 BUILT ENVIRONMENT & SOCIAL DYNAMIC DIMENSION OF DISASTER RESILEINCE IN URBAN SUB-REGIONS ..................... 96
FIGURE 5-6 URBAN LAND USE AND DEPENDENT POPULATION DIMENSION OF DISASTER RESILIENCE IN URBAN REGIONS .................. 97
FIGURE 5-7 URBAN LAND USE AND DEPENDENT POPULATION DIMENSION OF DISASTER RESILIENCE IN URBAN SUB-REGIONS ............ 97
FIGURE 5-8 SOCIO-CULTURAL CAPACITY DIMENSION OF DISASTER RESILIENCE IN URBAN REGIONS .............................................. 98
FIGURE 5-9 SOCIO-CULTURAL CAPACITY DIMENSION OF DISASTER RESILIENCE IN URBAN SUB-REGIONS........................................ 99
FIGURE 5-10 LIFE QUALITY DIMENSION OF DISASTER RESILIENCE IN URBAN REGIONS ............................................................. 100
FIGURE 5-11 LIFE QUALITY DIMENSION OF DISASTER RESILIENCE IN URBAN SUB-REGIONS ....................................................... 100
FIGURE 5-12 OPEN SPACE DIMENSION OF DISASTER RESILIENCE IN URBAN REGIONS .............................................................. 101
FIGURE 5-13 OPEN SPACE DIMENSION OF DISASTER RESILIENCE IN URBAN SUB-REGIONS ....................................................... 102
FIGURE 5-14 SOCIAL CAPITAL DIMENSION OF DISASTER RESILIENCE IN URBAN REGIONS.......................................................... 103
FIGURE 5-15 SOCIAL CAPITAL DIMENSION OF DISASTER RESILIENCE IN URBAN-SUB-REGIONS ................................................... 103
FIGURE 5-16 EMERGENCY INFRASTRUCTURE DIMENSION OF DISASTER RESILIENCE IN URBAN REGIONS ...................................... 104
FIGURE 5-17 EMERGENCY INFRASTRUCTURE DIMENSION OF RESILIENCE IN URBAN SUB-REGIONS ............................................ 105
FIGURE 5-18 ECONOMIC DIMENSION OF DISASTER RESILIENCE IN URBAN REGIONS ............................................................... 106
FIGURE 5-19 ECONOMIC STRUCTURE OF DISASTER RESILIENCE IN URBAN SUB-REGIONS ......................................................... 106
FIGURE 5-20 ABSORPTIVE CAPACITY OF DISASTER RESILIENCE IN TEHRAN ........................................................................... 108
FIGURE 5-21 ADAPTIVE CAPACITY OF DISASTER RESILIENCE IN TEHRAN ............................................................................... 109
FIGURE 6-1 THE SCATTER-PLOT BETWEEN THE PROPOSED F’ANP AND DROP ..................................................................... 119
1
1. Introduction
1.1. Background
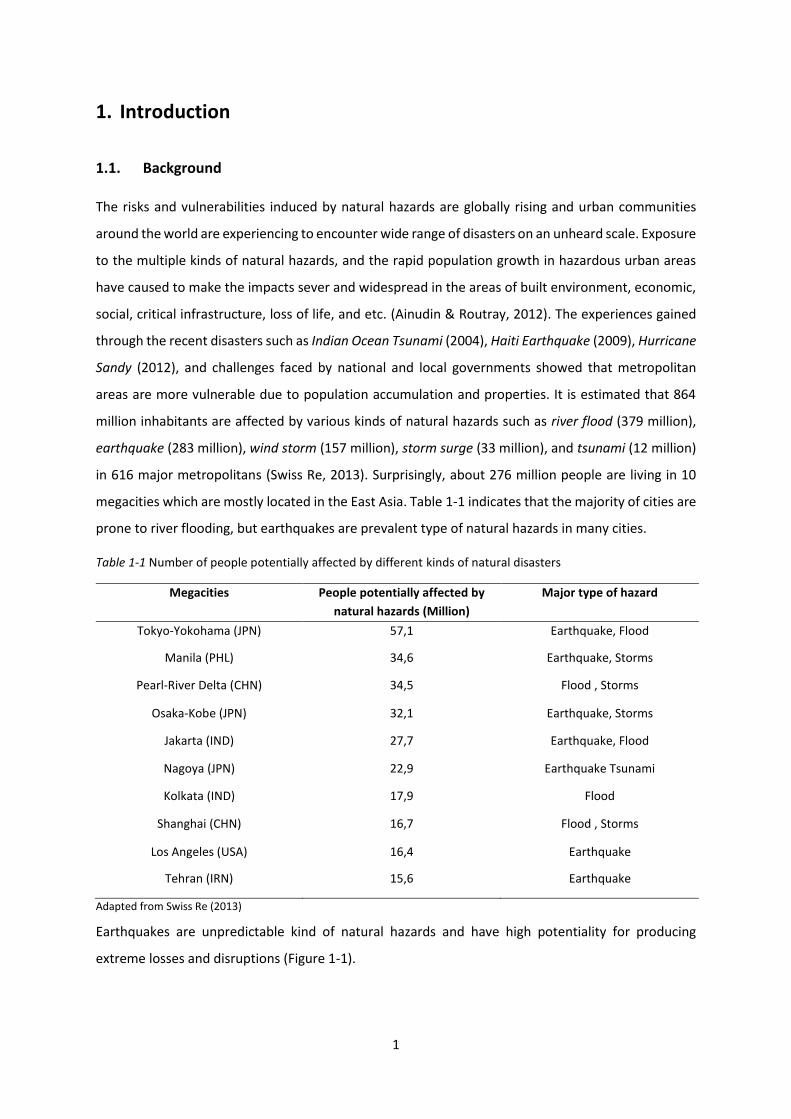
The risks and vulnerabilities induced by natural hazards are globally rising and urban communities
around the world are experiencing to encounter wide range of disasters on an unheard scale. Exposure
to the multiple kinds of natural hazards, and the rapid population growth in hazardous urban areas
have caused to make the impacts sever and widespread in the areas of built environment, economic,
social, critical infrastructure, loss of life, and etc. (Ainudin & Routray, 2012). The experiences gained
through the recent disasters such as Indian Ocean Tsunami (2004), Haiti Earthquake (2009), Hurricane
Sandy (2012), and challenges faced by national and local governments showed that metropolitan
areas are more vulnerable due to population accumulation and properties. It is estimated that 864
million inhabitants are affected by various kinds of natural hazards such as river flood (379 million),
earthquake (283 million), wind storm (157 million), storm surge (33 million), and tsunami (12 million)
in 616 major metropolitans (Swiss Re, 2013). Surprisingly, about 276 million people are living in 10
megacities which are mostly located in the East Asia. Table 1-1 indicates that the majority of cities are
prone to river flooding, but earthquakes are prevalent type of natural hazards in many cities.
Table 1-1 Number of people potentially affected by different kinds of natural disasters
Megacities People potentially affected by
natural hazards (Million)
Major type of hazard
Tokyo-Yokohama (JPN) 57,1 Earthquake, Flood
Manila (PHL) 34,6 Earthquake, Storms
Pearl-River Delta (CHN) 34,5 Flood , Storms
Osaka-Kobe (JPN) 32,1 Earthquake, Storms
Jakarta (IND) 27,7 Earthquake, Flood
Nagoya (JPN) 22,9 Earthquake Tsunami
Kolkata (IND) 17,9 Flood
Shanghai (CHN) 16,7 Flood , Storms
Los Angeles (USA) 16,4 Earthquake
Tehran (IRN) 15,6 Earthquake
Adapted from Swiss Re (2013)
Earthquakes are unpredictable kind of natural hazards and have high potentiality for producing
extreme losses and disruptions (Figure 1-1).

2
The Earthquake and Tsunami of Japan in 2011 imposed about 210 billion dollars economic loss and
15,880 fatalities (Nanto, et al., 2011). According to Munich RE (2015), during last 25 years, the 10
destructive earthquakes have imposed about 365 billion economic damages and 753,000 casualties
(Table 1-2). Earthquakes have very high capability for causing human causalities and physical
disruptions and therefore, they are ranked as high priority in disaster risk reduction and management
(Bruneau, et al., 2003); (Ainudin & Routray, 2012); (Renschler, et al., 2010).
Table 1-2 Top 10 deadliest earthquakes during last 25 years ago
Date
Event Affected country(s) Overall losses in
US$ m
Fatalities
11.03.2011 Earthquake,
Tsunami
Japan 210,000 15,880
12.01.2010 Earthquake Haiti 8,000 222,570
12.05.2008 Earthquake China 85,000 84,000
08.10.2005 Earthquake Pakistan, India, Afghanistan 5,200 88,000
26.12.2004 Earthquake,
Tsunami
Sri Lanka, Indonesia, Thailand, India,
Bangladesh, Myanmar, Maldives, Malaysia
10,000 220,000
26.12.2003 Earthquake Iran, Bam 500 26,200
26.01.2001 Earthquake India 4,600 14,970
17.08.1999 Earthquake Turkey 12,000 17,118
20.06.1990 Earthquake Iran, Manjil 7,100 40,000
07.12.1988 Earthquake Armenia 14,000 25,000
Total 356,400 753,738
Adopted from Munich Re (2015)
Figure 1-1 The most dangerous metropolitans to seismic hazard Adapted from http://igeogers.weebly.com/

3
For many years, hazard scholars had just focused on understanding the geophysical and biophysical
attributes of natural disasters and the prevailing attitude has been focusing on post disaster relief
approach (Mayunga, 2009). According to Alexander (2012), despite of delay and inaction for many
years, attitudes began to change in the 2000s when after the Decade for Natural Disaster Reduction
(1990-2000), the emphasis slowly began to shift from “reaction” (relief) to “pre-emptive”
(preparedness) action. Then a new paradigm emerged called disaster risk reduction (DRR) and
resilience. Mielti (1999) for instance pointed out that natural hazards are not only natural events,
rather they are the result of three systems 1) the physical environment, which associates with the
hazardous events, 2) the social-cultural attributes of the communities that tolerate the hazard events,
and 3) the built environment system, which includes infrastructures including: buildings, roads,
bridges, and other components of built environments (Mileti, 1999).
The increase in hazard vulnerability and induced disaster losses predisposed way to shift from
vulnerability assessment on understanding how communities can be more disaster resilient. The
Hyogo World Conference on Disaster Reduction (held in 2005, Kobe, Japan) is mentioned as the
milestone in endeavouring for necessity and methods to establish disaster resilient communities
(Birkmann, 2006); (Manyena, 2006); (Mayunga, 2007); (Cutter, et al., 2008); (Ainudin & Routray,
2012). There is nowadays “an explosion of consultations and initiatives on resilience, happening at
global, national, and local levels, with a multitude of interpretations on what resilience is, that is
largely uncoordinated” (Mitchell, 2013, p. 1). Despite local and national governments, stakeholders,
and hazard researchers emphasize on enhancing disaster resilient communities, developing standards
and metrics for measuring the level of disaster resilience remains a big challenge and there isn’t any
agreement upon a standard mechanisms among scholars (Cutter, et al., 2010); (Graugaard, 2012);
(Burton, 2012); (Peterson, et al., 2014).
Therefore, this research seeks to improve the current state of knowledge on the conceptualization of
disaster resilience with respect to the specific hazard context and hazard planning. The research result
of this study is significant in two different ways: (1) it addresses the current ongoing need in disaster
resilience literature of developing a robust methodology to operationalize the concept of disaster
resilience at various contexts and scales. Because the concept of disaster resilience has shown a great
potential for hazard prone communities but to the best of our knowledge and clearly indicated in the
literature, there is no agreement on how this phenomena could be operationalized (Bruneau, et al.,
2003); (Mayunga, 2009); (Cutter, et al., 2014); (Burton, 2012), and (2) the results are aimed to be
applied as an approach for further research on disaster resilience conceptualization. This process leads
to identify the advantages and strengths of urban resilience level as well as its disadvantages and
weakness.

4
1.2. State-of-the-Art
The debate on the various conceptual frameworks and theories of resilience since its formation and
progress in ecology and socio-ecological systems (Holling, 1973); (Walker, et al., 2004); (Folke, et al.,
2003); (Adger, 2000); (Resilience Alliance, 2007) until subsequent developments in other disciplines
such as sustainability (Mileti, 1999); (Tobin, 1999); (Carpenter, et al., 2001); (Millenium Ecosystem
Assessment, 2003); (Pinho, 2010), mitigation and adoption (Godschalk, 2003); (Satterthwaite, et al.,
2007), and most recently, disaster management (Bruneau, et al., 2003); (Mayunga, 2007); (Cutter, et
al., 2008); (Norris, et al., 2008); (Renschler, et al., 2010) is controversially ongoing. Disaster resilience
in the context of natural hazards is collectively characterized as “the ability of a system, community
or society to resist, mitigate, respond and recover from the effects of a hazard/sock in efficient and
timely manner” (Timmerman, 1981); (Mileti, 1999); (Bruneau, et al., 2003); (UNISDR, 2005); (Cutter,
et al., 2008); (Renschler, et al., 2010). Within this perspective, disaster resilience includes “those
inherent characteristics that permit a system to absorb the impacts and cope with an evet, as well as
post-event, adaptive processes that facilitate the ability of the system to re-organize, change, and
learn in response to a threat” (Cutter, et al., 2008, p. 599).
It is an agreement that the level of vulnerability in high resilient urban areas is less than those that are
comparatively less resilient. To validation and verification of this assumption, there is a vital need to
develop our understanding of how resilience is identified, quantified, improved, and maintained
(Klein, et al., 2003); (Cutter, et al., 2008). To what extend an urban area will be influenced by a major
hazard event can be operationalized w.r.t. to disaster resilience level (Burton, 2012). Resilience as a
multifaceted concept includes different factors which make it difficult to understand what leads a
community to become resilient or which kind of indicators should be utilized to conceptualize the
term. Several theoretical frameworks, however, have been carried out on the importance of disaster
resilience measurement and conceptualization of the concept (Bruneau, et al., 2003); (Mayunga,
2009); (Cutter, et al., 2010); (Renschler, et al., 2010).
More recently, hazard researchers emphasize on quantitative conceptualization and methodology
rather than qualitative. So that, the ability to assess and quantify risks and threats induced by natural
hazards is increasingly considered as the key step to promote disaster resilience of hazard prone areas
(Bruneau, et al., 2003); (Mayunga, 2009); (Cutter, et al., 2010); (Asadzadeh, et al., 2015). This
assessment can be led to the identification of the capacity performance of a community in time of a
disturbance such as an earthquake. A major milestone in conceptualizing and achieving disaster
resilience is the development of special tools that can be utilized for quantifying and benchmarking of
the concept. This process leads to identifying the components that contribute to resilience and
interactions that are planned to establish and enhance it (Mayunga, 2009); (Cutter, et al., 2010);

5
(Burton, 2012). Constructing composite indicators is addressed as an efficient way to accurately assess
the levels of disaster resilience. “A composite index/indicator aggregates multiple individual indicators
to provide a synthetic measure of a complex, multidimensional, and meaningful phenomena”
(Bepetista, 2014, p. 1) such as disaster resilience.
There exist a limited number of procedures known for the disaster resilience community that present
specific steps for conceptualizing the term resilience through constructing robust, and reliable
composite indicators (Bruneau, et al., 2003); (Cutter, et al., 2014); (Renschler, et al., 2010); (Foster,
2012); (Verrucci, et al., 2012); (Burton, 2012). Cutter et al.’s (2010) Baseline Resilience Indicators for
Communities (BRIC) is one of the most well-known and also widespread example of composite
indicators. The approach presented a set of composite indicators for assessment of baseline attributes
that can be addressed to increase resilience within communities. Although its origin framework or
DROP has the six main components including: social, economic, institutional, infrastructure,
community capital and ecological, the BRIC has excluded ecological component due to “data
inconsistency” (Cutter, et al., 2010, p. 8). However, the model have been validated through some
empirical application in different areas such as Baseline Situation of Mississippi Gulf Coast (Burton,
2012), Seismic Resilience in Baluchistan (Ainudin & Routray, 2012), and Sunshine Coast in Australia
(Peterson, et al., 2014). Other quantitative frameworks for constructing composite indicators are
Community Disaster Resilience Framework (CDRF) (Mayunga, 2009), PEOPLE framework (Renschler,
et al., 2010), and Resilience Capacity Index (Foster, 2012).
Although these frameworks present a clear guidance for constructing a sound set of composite
indicators as well as adoption of a conceptual framework, there is still a number of debates both in
understanding of the term and required methodologies. For instance, indicator building and
identification of a standard set for measuring resilience both at different scales and contexts is still
ongoing challenge (Cutter, et al., 2008); (Ainudin & Routray, 2012); (Burton, 2012); (Graugaard, 2012).
The frameworks can also be distinguished w.r.t. the number of measurable dimensions, their name,
and the distribution of indicators between them. In most of existing literature, this process is
performed hierarchically and deductive methods (Asadzadeh, et al., 2015). Finally, the quantification
of interconnections among a set of indicators in most of existing approaches has been neglected.
As explained before, the term disaster resilience is a multidimensional concept that needs to be
expanded further from a purely quantitative method to a hybrid approach for better perception the
term and to analyse the relationship and feedback among resilience indexes and network structure
rather than hierarchical ones.

6
1.3. Research objectives and questions
This dissertation aims at understanding the multi-faceted and multi-scale characteristics of disaster
resilience by operationalizing its concept concerning an earthquake hazard. To this end, the study will
endeavour to construct a sound set of indicators and processes for conceptualizing disaster resilience
at a community level.
With this perspective, the following four specific research objectives and the four specific questions
are addressed in this study:
Objective 1:
To increase our understanding of multifaceted nature of disaster resilience by exploring definitions,
theoretical frameworks and conceptual approaches.
Specific question for objective 1:
What does the concept of disaster resilience mean and how can it be addressed in disaster risk
management in particular?
Objective 2:
To conceptualize and operationalize the concept of disaster resilience in the context of earthquake
hazard.
Specific question for objective 2:
How the concept of disaster resilience can be operationalized in the context of earthquake hazard?
Objective 3:
To provide an observatory of the most needed improvements in disaster resilience and baseline
indicators by mapping and visualization of the results.
Specific question for objective 3:
Is there any spatial pattern or cluster of disaster resilience in the study area?
Objective 4:
To assess the quality and applicability of the proposed approach in measurement of disaster resilience.
Specific question for objective 4:
How valid and reliable is the proposed model as a hybrid quantitative measure?

7
1.4. Research structure
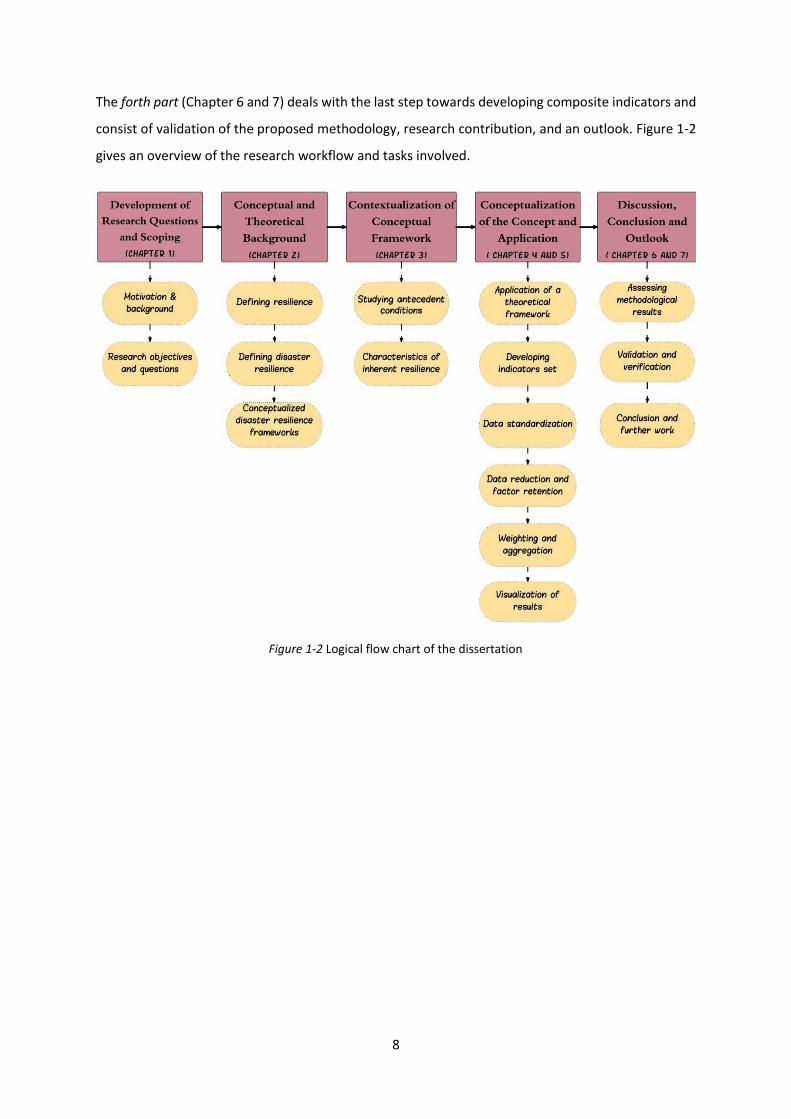
This research consists of four main parts: i) understanding conceptual and theoretical background of
the concept ii) contextualization of the conceptual framework, iii) operationalization of the concept
and application, and iv) validation and results. The first part is described in Chapter 2, where existing
concepts and theories of disaster resilience are reviewed. The goal is to extend our knowledge about
disaster resilience and construct a theoretical foundation for developing criteria for conceptualizing
disaster resilience. To this end, the attention was turned to review the most well-known and validated
theoretical frameworks which are applicable for constructing disaster resilience indicators in an
earthquake-prone area.
Since theoretical frameworks of disaster resilience are usually use case-specific, therefore, their
development and application are restricted into that specific area. Hence, the second part deals with
contextualization of the conceptual framework which is presented in Chapter 3. On the other hand,
this part is based on identifying antecedent conditions and inherent characteristics of the study area
that can be directly linked into the conceptual framework.
The third part describes in detail how the concept of disaster resilience can be operationalized in the
context earthquake hazard. This process is performed through developing a methodological approach
for composite indicators building (Chapter 4 and 5). To construct a sound set of composite indicators,
they should be identified based on “analytical soundness, measurability, coverage, and relevance”
(Burton, 2012, p. 139). Therefore, the methodology is started with selection of a sound theoretical
framework as basis for indicator building. Based on three equally criteria of relevancy, data
consistency, and availability, potential indicators are selected and collected for further statistical
analysis. After transformation of raw data into a standard scale or measurement unit, for data
reduction and uncovering latent structures of the selected indicators, a factorial analysis is carefully
performed using the principle component analysis (PCA).
For weighting extracted components and their indicators, a hybrid factor analysis (FA) and analytic
network process (ANP) called F’ANP model is applied in which, the results extracted from the factor
analysis (FA) are entered into the analytic network process (ANP) in order to calculate the relative
importance of each indicator and each dimension of disaster resilience. After aggregating indicators
using a linear additive method, the final disaster resilience score for each case study area is obtained.
The next step is to visualize the obtained results to have a quick comparative analysis of seismic
resilience in spatial distribution and also its different dimensions.
8
The forth part (Chapter 6 and 7) deals with the last step towards developing composite indicators and
consist of validation of the proposed methodology, research contribution, and an outlook. Figure 1-2
gives an overview of the research workflow and tasks involved.
Figure 1-2 Logical flow chart of the dissertation
9
2. Concepts and Theories of Resilience
2.1. A multi-disciplinary concept of resilience
The increase complexity and rapid changes in world dynamics brought to a growing global interest in
resilience as a concept for better perception, managing, and governing complex social-ecological
systems and operating the capacity to cope with, adapt to, and shape change (Birkmann, 2006);
(Schultz, 2009); (Burton, 2012). As a concept, although there is an agreement that the term resilience
was born in the skirts of engineering, ecology and psychology, it was first formulized in the field of
ecology and subsequently spread to outside of its original disciplinary (Manyena, 2006); (Mayunga,
2007); (Alexander, 2012); (CARRI, 2013). Holling (1973) is one of the pioneers of defining and applying
the term resilience in ecology. He defined resilience as “a measure of the persistence of systems and
of their ability to absorb change and disturbance and still maintain the same relationships between
populations or state variables” that control a system performance (Holling, 1973, p. 14). One of the
best definitions is “the ability of a system to absorb disturbance and still retain its basic function and
structure” (Walker & Salt, 2006, p. 1), and “the capacity to change in order to maintain the same
identity” (Folke, et al., 2010, p. 20)
Since then, resilience has become the central concept in the field of ecology. In the late 1980s, the
concept of resilience has been performed in ecological version in order to evaluate the interactions
between population and natural environment and the changes they bring (Maguire & Cartwright,
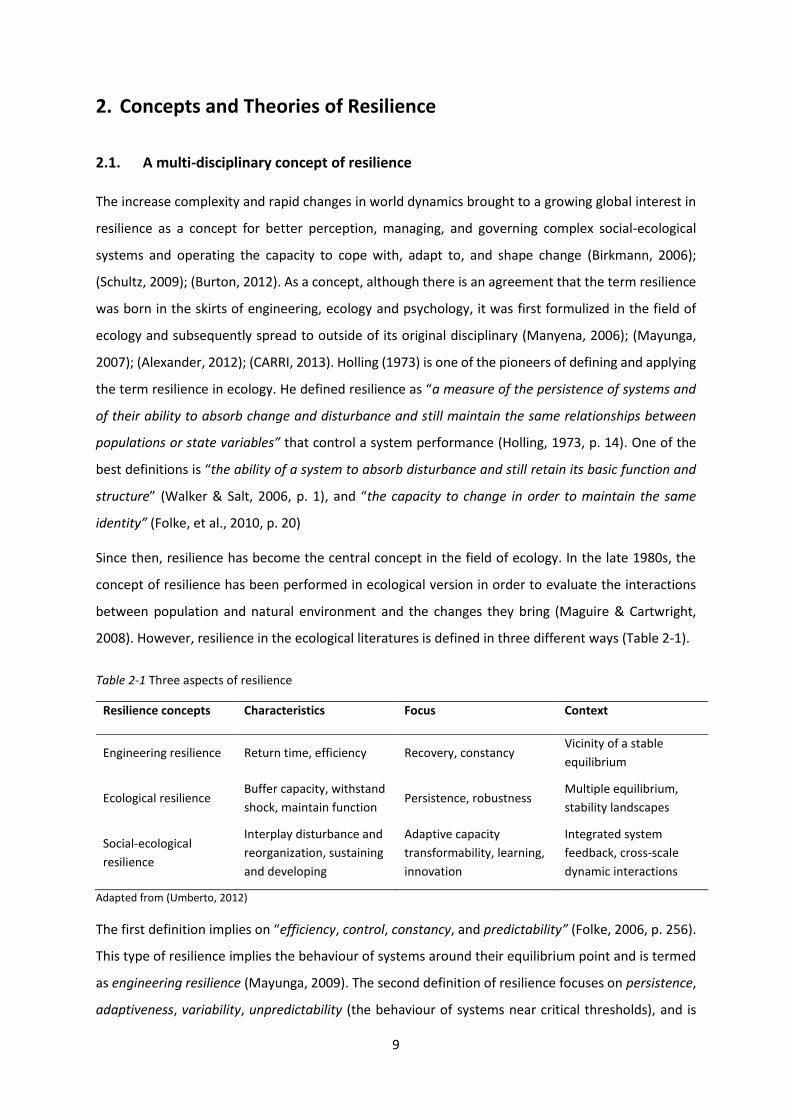
2008). However, resilience in the ecological literatures is defined in three different ways (Table 2-1).
Table 2-1 Three aspects of resilience
Resilience concepts Characteristics Focus Context
Engineering resilience Return time, efficiency Recovery, constancy Vicinity of a stable
equilibrium
Ecological resilience Buffer capacity, withstand
shock, maintain function Persistence, robustness
Multiple equilibrium,
stability landscapes
Social-ecological
resilience
Interplay disturbance and
reorganization, sustaining
and developing
Adaptive capacity
transformability, learning,
innovation
Integrated system
feedback, cross-scale
dynamic interactions
Adapted from (Umberto, 2012)
The first definition implies on “efficiency, control, constancy, and predictability” (Folke, 2006, p. 256).
This type of resilience implies the behaviour of systems around their equilibrium point and is termed
as engineering resilience (Mayunga, 2009). The second definition of resilience focuses on persistence,
adaptiveness, variability, unpredictability (the behaviour of systems near critical thresholds), and is

10
termed as ecological resilience (Folke, et al., 2003). The third or socio-ecological resilience is the most
conceptualized term of resilience within literature that describes resilience by three critical
characteristics: i) to what extent a community is able to absorb perturbation and can continue the
identical functionality ii) the degree of self-organization capacity, and iii) the degree of learnability to
establish and enhance the capability for innovation (Carpenter, et al., 2001); (Folke, 2006).
However, the theory behind resilience is still challenging and the term is an evolving concept. For
instance, the concept of adaptive capacity has been integrated with resilience by political and global
environmental change research (Cutter, et al., 2008). Adaptive capacity has been termed as “the
ability of a system to adjust to change, moderate the effects, and cope with a disturbance” (Burton,
2012, p. 2). However, the term adaptive capacity has not been incorporated into hazard perspective
yet and it is mostly located in the scope of global environmental change (Cutter, et al., 2008).
Alternatively, mitigation is a focal argument in hazard research which conveys a similar indication as
adaption and encompasses action to decrease or bypass from threats or consequences from disasters
(Mileti, 1999); (Godschalk, 2003). The logic behind this assumption is that the application of mitigation
tools as well as planning instruments can be led to increase resilience level within a community to
hazards or disasters (Bruneau, et al., 2003); (Cutter, et al., 2008).
Nevertheless, after passing more than four decades of valuable scientific works on topic resilience, it
is applied in many disciplines including hazards (Bruneau, et al., 2003); (Mayunga, 2009); (Renschler,
et al., 2010), ecology (Holling, 1973); (Adger, 2000); (Folke, et al., 2003); (Resilience Alliance, 2007),
Psychology (Snyder & McCullough, 2000); (Yatas, et al., 2004), and geography (Cutter, et al., 2008);
(Burton, 2012). Although the term has been described in variety of ways and in different disciplines,
finding consensus ground on its definition is still challenging (Cutter, et al., 2008). However, the
entrance of resilience into variety of disciplines including natural hazards and disasters has been
celebrated as a birth of a new paradigm for dealing with them (Manyena, 2006). Since the focus of
this study is understanding the characteristics of resilience in the field of natural hazards or disasters,
in the remainder of this chapter, we focus on the concept of disaster resilience as well as its definitions,
characteristics, and the existing methodologies to conceptualize it.
11
2.2. Resilience in the context of natural hazards and disasters
Over the decade 2005-2015, many scholars, organizations, and research institutions in the scope of
natural hazards have increasingly emphasized the significance of disaster resilience concept in hazard
management, mitigation and risk reduction programs. Timmerman (1981) is perhaps one of the first
studies that used resilience in the context of natural hazards and disasters. He defined resilience as
“the measure of a system's, or part of the system's capacity to absorb and recover from a hazardous
event” (Timmerman, 1981, p. 21). After his definition, many worth attempts have been emerged to
define the concept of disaster resilience during last three decades. However, the support for the
concept of disaster resilience has been increased by the hazard mitigation and adaptation (Mayunga,
2007). Godschalk et al., (1999) pointed out that a sustainable mitigation policy is led to develop
resilient communities. Mileti (1999) also suggests establishing a disaster resilient community as a new
framework to address natural hazards.
The Hyogo Framework for Action (HFA) is the milestone in the endeavouring for the requirements and
methods to establish disaster resilient communities (Manyena, 2006); (Manyena, 2009); (Cutter, et
al., 2008); (Ainudin & Routray, 2012). The HFA five priority areas for action are: 1) apply decision
making priorities in the national and local scope with a strong institutional basis for implementation,
2) provide early warning services by identifying and evaluating the hazards in advance, 3) establish a
resilience culture in at all levels by providing training and knowledge increasing, 4) identify and reduce
the underlying risk components, and 5) increase disaster readiness for efficient respond on all scales
(UNISDR, 2005). After the manifest of HFA, the objective of hazard planning and risk reduction
programs has rapidly been shifted on building disaster resilience community rather than simply
reducing vulnerability of communities (Mayunga, 2007). Terms such as “sustainable and resilient
communities, resilient livelihoods, and building community resilience” (Manyena, 2006, p. 434) have
been emerged from HFA which aim to advance an efficient integration of disaster risk into sustainable
development in both theory and practice (Ainudin & Routray, 2012).
Although the term disaster resilience has received many supports from many disciplines, research
institutions and hazard scholars, there is no agreement concerning its concept in the literature. Table
2-2 summarises the highlighted definitions of disaster resilience within literature over the past three
decades. The definitions mostly indicate how a prone-hazard area reacts after an adverse event.
However, finding an agreement on the definition of resilience in the scope of natural hazards and
disasters is challenging (Mayunga, 2007); (Cutter, et al., 2008); (Burton, 2012). Because hazard and
disaster research has been conducted by different disciplines with different background.

12
Table 2-2 Selected definitions of disaster resilience
First author,
year
Definition
Timmerman,
(1981)
The capacity of a system to absorb and recover from the occurrence of a hazardous event;
reflective of a society's ability to cope and to continue to cope in the future.
Mileti,
(1999)
(The ability to) withstand an extreme event without suffering devastating losses, damage,
diminished productivity, or quality of life without a large amount of assistance from outside
the community.
Adger,
2000 The ability of communities to withstand external shocks to their social infrastructure.
Paton,
2001
The capability to bounce back and to use physical and economic resources effectively to aid
recovery following exposure to hazards.
Klein,
2003
The ability of a system that has undergone stress to recover and return to its original state;
more precisely (i) the amount of disturbance a system can absorb and still remain within the
same state or domain of attraction and (ii) the degree to which the system is capable of self-
organization.
Bruneau,
2003
The ability of social units to mitigate hazards, contain the effects of disasters when they
occur, and carry out recovery activities in ways that minimize social disruption and mitigate
the effects of future earthquakes.
Godschalk,
2003
A sustainable network of physical systems and human communities, capable of managing
extreme events; during disaster, both must be able to survive and function under extreme
stress.
Anderies,
2004
The amount of change or disruption that is required to transform the maintenance of a
system from one set of mutually reinforcing processes and structures to a different set of
processes and structures.
Walker,
2004
The capacity of a system to absorb disturbance and reorganize while undergoing change so
as to still retain essentially the same function, structure, identity, and feedbacks.
Adger,
2005
The capacity of linked social-ecological systems to absorb recurrent disturbances ... so as to
retain essential structures, functions, and feedbacks.
Gunderson,
2005
The return or recovery time of a social-ecological system, determined by (1) that system's
capacity for renewal in a dynamic environment and (2) people's ability to learn and change
(which, in turn, is partially determined by the institutional context for knowledge sharing,
learning, and management, and partially by the social capital among people).
UN/ISDR,
2005
The capacity of a system, community or society potentially exposed to hazards to adapt, by
resisting or changing in order to reach and maintain an acceptable level of functioning and
structure.
Resilience
Alliance, 2005
The capacity of a system to absorb disturbance and reorganize while undergoing change so
as to still retain essentially the same function, structure and feedbacks—and therefore the
same identity.

13
As the list in Table 2-2 indicates, there are many various definitions of resilience relevant to human
communities. However, most of definitions use the terms capacity/ability of a system when defining
the concept. This shows that many researchers agree that disaster resilience is the capacity / ability
of a system, community, society or people to resist, mitigate, respond and recover from the effect of
an event. In general, a number of other key points can be extracted from the presented definitions.
The definitions can be categorized into result-oriented and process-oriented. Result-oriented
definitions describe resilience in terms of end and result, and see the resilience as an adjective of a
community or society (Mayunga, 2009). For example, many of authors use the term ability to and this
indicates the ability to being resilient by degree and time of recovery or extent of damage avoided
(Adger, 2000); (Bruneau, et al., 2003). According to Gilbert (2010) “process-oriented definitions have
been preferred by disaster researchers from the social sciences” (Gilbert, 2010, p. 10). From their
point of view, resilience is seen as a process or a capacity to increase resiliency level of a community
through the possible opportunities to adapt resources and skills after a hazard shock. (Manyena,
2006); (Norris, et al., 2008); (Cutter, et al., 2008).
Some scholars consider resilience as a long term outlook and define it as a durable improvement
process after an event (Tobin, 2002); (Klein, et al., 2003). Here, resilience is mostly defined as the
nation “bouncing back” that indicates its Latin root resiliere which means to “jump back” from an
unpredictable shock or hazard (Mayunga, 2007). The notion of resistance is another extracted
conclusion from the definitions. Most of the definitions indicate resilience as the extent to which a
community resist adversity to avoid changes or endure a shock without falling down encountering a
dramatic change (Anderies, et al., 2004); (Resilience Alliance, 2007). Furthermore, adaptation is used
Manyena,
2006
Disaster resilience is seen as the ‘shield’, ‘shock absorber’ or buffer that moderates the
outcome to ensure benign or small-scale negative consequences.
Mayunga,
2007
The capacity or ability of a community to anticipate, prepare for, respond to, and recover
quickly from impacts of disaster.
Norris,
2008
A process linking a set of adaptive capacities to a positive trajectory of functioning and
adaptation after a disturbance.
Cutter,
2010
The ability to anticipate risk, limit impact, and bounce back rapidly in the face of turbulent
change.
Renschler,
2010
Resilience may be defined as a function indicating the capability to sustain a level of
functionality or performance for a given building, bridge, lifeline network, or community,
over a period defined as the control time.

14
by some scholars while pointing to resilience as a process-oriented phenomena that focus on public
policies. (Manyena, 2006); (Mayunga, 2007).
Scholars also argue that the term resilience is related to the concept of sustainability and see resilience
as a new way of thinking about sustainability (Burton, 2012). Resilience and vulnerability are also
considered as contrary concepts (Mayunga, 2007); (Cutter, et al., 2008). This means a resilient
community is far from vulnerability and a vulnerable community doesn’t reflect resilience
characteristics. Several studies have argued that there is a noticeable interaction between the concept
of sustainability and vulnerability with disaster resilience (Paton, et al., 2001); (Millenium Ecosystem
Assessment, 2003); (Pickett, et al., 2004). Therefore, the next section discusses the relationship
between sustainability and vulnerability with community disaster resilience.
2.3. The relationship between resilience and sustainability
We understand the sustainable development as the Brundtland Commission defines it as
“development that meets the needs of the present without compromising the ability of future
generations to meet their own needs” (WCED, 1987, p. 45). Here, the notion of sustainability is
perceived as a normative concept to understand to what extend natural capitals should be conserved
to provide the need of future generations. (Derissen, et al., 2011). Sustainability meant in
environmental planning in 1980s and 1990s what resilience means in hazard planning now.
However, resilience and sustainability have frequently been referenced as the guiding principles for
effective hazard planning (Mileti, 1999); (Tobin, 1999). In some contributions, resilience is understood
as a mandatory precondition for sustainability. For example, Levin et al., (1998) claim resilience is an
ideal way to deal with sustainability in social science as well as natural systems. Hence, they basically
suggest an equivalent of resilience and sustainability. Similarly, Folke et al., (2003) argue that building
resilience can maintain socio-ecological systems while encounter with unpredictable shocks.
Therefore, it is closely related to concepts of sustainability and sustainability transition. In order to be
a sustainable community or society, being resilient over significant periods of time is inevitable
because they will be affected by unexpected influences and disturbances. Table 2-3 reveals the
relationships between resilience and sustainability in literature.
Table 2-3 Relationship between resilience and sustainability
First author, year
Definitions
Holling,
1973 A more laudable goal should be resilience rather than sustainability.

15
Carpenter,
2001
Resilience is often used to describe the characteristic features of a system that are
related to sustainability.
Folke,
2003
Resilience can sustain social-ecological systems in the face of surprise, unpredictability,
and complexity therefore is closely related to concepts of sustainability and
sustainability transition.
Klein,
2003
The concept of community disaster resilience is seen as a desirable attribute of both
social and physical systems in the face of disaster because it is a contributing factor to
community sustainability.
Walker,
2004
Resilience is the key to the sustainability.
Neumann,
2005
Sustainability draws from at least five intellectual traditions: capacity, fitness, resilience,
diversity, and balance.
Cutter,
2008
The resilience of a community is inextricably linked to the condition of the environment
and the treatment of its resources; therefore the concept of sustainability is central to
studies of resilience.
On contrary, some other scholars believe that sustainability is broader than resilience. Carpenter et
al., (2001) argue resilience is often applied to explain the particular characteristics of a community
that are related to sustainability. The Millennium Ecosystem Assessment (2003) also depicts
sustainability as a process and offers paying more attention to issues such as robustness, vulnerability,
resilience, risk and uncertainty, which conceptualize the capability of a community to adapt to and
take advantage from change. Cutter et al., (2008) argue that the concept of sustainability is the core
concept of resilience studies and a resilient community is surely interconnected to the functionality
performance of environmental resources. Some others see the concepts of resilience and
sustainability equivalent. For example, “a resilient socio-ecological system is synonymous with a
region that is ecologically, economically, and socially sustainable” (Holling & Walker, 2003, p. 1).
However, the relationship between resilience and sustainability is under criticism. Surely, the
resilience approach is not an approach only for hazard and disaster planning but also predisposes the
way for achieving the sustainable development. In this perspective, urban disaster resilient approach
should be accepted as a more comprehensive strategy for urban sustainability aiming to have low risk,
low vulnerability, and appropriate scale of planning (Tobin, 1999).
2.4. The relationship between resilience and vulnerability
The hazard literatures agree that the concept of hazard vulnerability has been in use since the late of
1970s (Manyena, 2006); (Birkmann, 2007); (Mayunga, 2007). According to Cutter et al. (1996), hazard
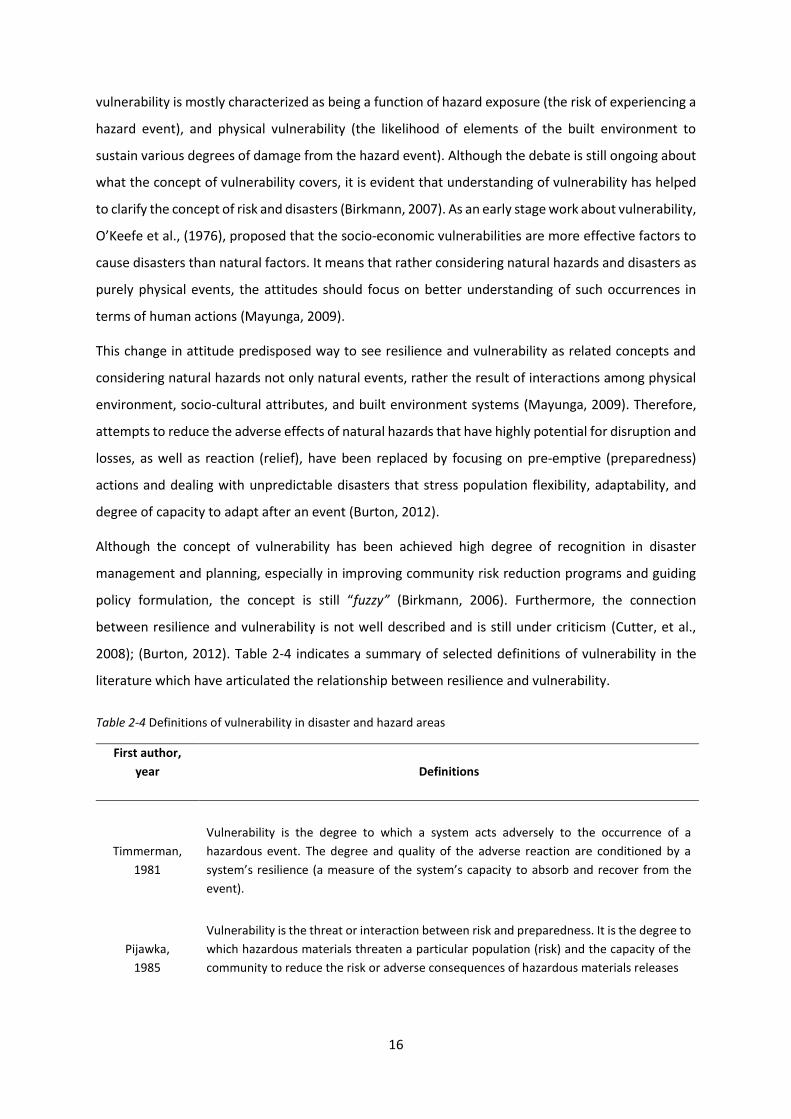
16
vulnerability is mostly characterized as being a function of hazard exposure (the risk of experiencing a
hazard event), and physical vulnerability (the likelihood of elements of the built environment to
sustain various degrees of damage from the hazard event). Although the debate is still ongoing about
what the concept of vulnerability covers, it is evident that understanding of vulnerability has helped
to clarify the concept of risk and disasters (Birkmann, 2007). As an early stage work about vulnerability,
O’Keefe et al., (1976), proposed that the socio-economic vulnerabilities are more effective factors to
cause disasters than natural factors. It means that rather considering natural hazards and disasters as
purely physical events, the attitudes should focus on better understanding of such occurrences in
terms of human actions (Mayunga, 2009).
This change in attitude predisposed way to see resilience and vulnerability as related concepts and
considering natural hazards not only natural events, rather the result of interactions among physical
environment, socio-cultural attributes, and built environment systems (Mayunga, 2009). Therefore,
attempts to reduce the adverse effects of natural hazards that have highly potential for disruption and
losses, as well as reaction (relief), have been replaced by focusing on pre-emptive (preparedness)
actions and dealing with unpredictable disasters that stress population flexibility, adaptability, and
degree of capacity to adapt after an event (Burton, 2012).
Although the concept of vulnerability has been achieved high degree of recognition in disaster
management and planning, especially in improving community risk reduction programs and guiding
policy formulation, the concept is still “fuzzy” (Birkmann, 2006). Furthermore, the connection
between resilience and vulnerability is not well described and is still under criticism (Cutter, et al.,
2008); (Burton, 2012). Table 2-4 indicates a summary of selected definitions of vulnerability in the
literature which have articulated the relationship between resilience and vulnerability.
Table 2-4 Definitions of vulnerability in disaster and hazard areas
First author,
year
Definitions
Timmerman,
1981
Vulnerability is the degree to which a system acts adversely to the occurrence of a
hazardous event. The degree and quality of the adverse reaction are conditioned by a
system’s resilience (a measure of the system’s capacity to absorb and recover from the
event).
Pijawka,
1985
Vulnerability is the threat or interaction between risk and preparedness. It is the degree to
which hazardous materials threaten a particular population (risk) and the capacity of the
community to reduce the risk or adverse consequences of hazardous materials releases

17
Downing,
1991
Vulnerability has three connotations: it refers to a consequence (e.g. famine) rather than
a cause (e.g. drought); it implies an adverse consequence (e.g., maize yields are sensitive
to drought; households are vulnerable to hunger); and it is a relative term that
differentiates among socioeconomic groups or regions, rather than an absolute measure
or deprivation.
Cutter,
1996
Vulnerability is the likelihood that an individual or group will be exposed to and adversely
affected by a hazard.
Cutter,
2003
The concept of social vulnerability refers to more than socio-economic impacts, since it can
also encompass features of potential physical damage in the built environment.
Wisner,
2004
The characteristics of a person or group and their situation that influence their capacity to
anticipate, cope with, resist, and recover from the impact of a natural hazard, and that
social vulnerability changes with time.
UN/ISDR,
2005
The conditions determined by physical, social, economic and environmental factors or
processes, which increase the susceptibility of a community to the impact of hazards.
Adger,
2005
Vulnerability could be viewed as a reflection of the intrinsic physical, economic, social and
political predisposition or susceptibility of a community to be affected by or suffer adverse
effects when impacted by a dangerous physical phenomenon of natural or anthropogenic
origin.
Mayunga,
2007
Vulnerability is the state of susceptibility to harm from exposure to stresses associated
with environmental and social change and from the absence of capacity to adapt.
Cutter,
2008
Vulnerability is the pre-event, inherent characteristics or qualities of social systems that
create the potential for harm.
Some definitions explain the concept of vulnerability in which represents the degree of a system, or
community to predict, adapt, and recover from an adverse event and concluded that vulnerability and
resilience are high related concepts (Timmerman, 1981); (Pijawka & Radwan, 1985); (Downing, 1991);
(Wisner, et al., 2004). This attitude mostly belongs to the early formulizing of vulnerability in hazard
literature and “emphasize ways of dealing with unexpected hazard events that stress flexibility,
adaptability and the capacity to cope when a disaster occurs” (Burton, 2012, p. 10). As stated before,
the existing relationship between vulnerability, resilience and adaptive capacity has not been fully
defined yet and there are serious discussions in different scientific disciplines (Figure 2-1).

18
According the Figure 2-1 a, resilience is completely located in adaptive capacity (Birkmann, 2006);
(Folke, 2006). While some others see adaptive capacity as a core factor of vulnerability (Figure 2-1 b),
or nested (Figure 2-1 c). In hazard fields, resilience is embedded within vulnerability (Figure 2-1 d) and
view resilience as a subset of vulnerability (Turner, et al., 2003). Manyena (2009) argues that “the
question of whether resilience and vulnerability are positive and negative poles on a continuum
depends on the definition of the two terms” (Manyena, 2009, p. 29). On the other hand, when one is
more on positive pole of the continuum, then one being more resilient than being vulnerable and the
opposite is the same (Manyena, 2006). In some other studies, adaptive capacities and mitigation are
often embedded within resilience (Figure 2-1 e) (Bruneau, et al., 2003); (Paton & Johnston, 2006).
Another attitude is to see resilience and vulnerability as the two independent concepts but often
complementary entities (Mayunga, 2007); (Cutter, et al., 2008); (Miller, et al., 2010). For example,
Cutter et al., (2008) see resilience and vulnerability as overlapping concepts, so that they are “not
totally mutually exclusive, nor totally mutually inclusive” (Cutter, et al., 2008, p. 602) (Figure 2-1 f). It
means that some characteristics influence either vulnerability or resilience, other influence both
(Bahadur, et al., 2010).
Although determining the relationship between resilience and vulnerability is still challenging, it can
be concluded that most of definitions contribute a joint concern in the concept of vulnerability and
see resilience and vulnerability as an opposite but related concepts. If resilience is perceived to be
“the capacity of a community to respond and recover, then resilience and vulnerability can be seen
like the opposite sides of a continuum” (Burton, 2012, p. 10). Otherwise, if vulnerability is purely
Figure 2-1 Conceptual linkage between vulnerability, resilience, and adaptive capacity Adapted from (Cutter, et al., 2008)

19
characterized as the circumstance that exposure population at risk, there is no interrelation between
them (Timmerman, 1981); (Wisner, et al., 2004).
2.5. Community disaster resilience
The concept of community disaster resilience is inclined to focus on a range of issues such as hazards
mitigation, learning, coping and adaptation rather than just focusing on vulnerability analysis
(Mayunga, 2009). The concept of disaster resilience broadly denotes the inherent conditions (social,
economic, infrastructure, etc.) of a system to resist, mitigate, respond in disaster phase, adapt to, and
recover in post-disaster phase that increase the extent to which a social system is able to jump back
from the shock and re-organize the changes. (Bruneau, et al., 2003); (Mayunga, 2007); (Maguire &
Cartwright, 2008); (Cutter, et al., 2008).
Community disaster resilience is a multifaceted concept that captures multidimensional aspects
within a community that are often underestimated in vulnerability assessment (Burton, 2012)
Although building disaster resilient community can arguably take many forms by many disciplines, as
a concept is growing and seems to be appealing to hazard researchers more than the concept of
vulnerability (Mayunga, 2009). Therefore, the disaster resilient community reflects the desire to
improve the capacity of both social and physical systems to respond and recover from disaster
(Bruneau, 2007).
The importance of measuring the involved factors in resilience as well as pre-disaster and post-disaster
factors has been mentioned as a fundamental step that cause to decrease losses from a hazardous
event (Maguire & Cartwright, 2008). Community disaster resilience is a broader concept which
encompasses a large part of the risk spectrum (Twigg, 2007). It emphasizes the community’s capacities
and how to strengthen them, and it places less emphasis on the factors which make the community
vulnerable (Manyena, 2009).
However, the community disaster resilience consists the interactions between hazards, humans, and
natural systems, but also focusses on the attributes of a system and their ability to 1) absorb, resist,
and mitigate disaster impacts, and 2) when hit, able to response and bounce back in efficient and
timely manner, as well as 3) learn from gained experience and improve its characteristics and
structures to adjust future threats (Mayunga, 2009).
2.6. Community disaster resilience measurement frameworks
There is an agreement among hazard scholars that enhancing community disaster resilience is
intrinsically linked to the ability to measure levels of disaster resilience (Cutter, et al., 2008); (Bruneau,

20
et al., 2003); (Mayunga, 2007); (Renschler, et al., 2010); (Peterson, et al., 2014). However, the
operationalization of disaster resilience is challenging due to multidimensional nature of resilience
and interactions of social, economic, physical and environmental dimensions. A number of theoretical
frameworks and models, however, have been formulized to evaluate the resilience of communities,
regions, and systems, but a standard mechanism by which this phenomena should be measured or
compared is still controversial (Bruneau, et al., 2003); (Mayunga, 2007); (Cutter, et al., 2014);
(Graugaard, 2012); (Peterson, et al., 2014). Nevertheless, more than a decade after emphasising on
the need for more quantitative conceptualization of disaster resilience, efforts are still challenging to
develop more appropriate disaster resilience measurement frameworks. This shift leads to either
better understanding of dimensions contributing to resilience or identification of the actual or
potential performance of any community in the case of sudden disturbance.
To better understanding current disaster resilience measurement frameworks, this section introduces
the eight well-known and most cited quantitative frameworks within the disaster resilience literature:
1) the sustainable and resilient community framework (Tobin, 1999), 2) the MEERC R4 resilience
framework (Bruneau, et al., 2003), 3) the ResiliUS framework (Miles & Chang, 2008), 4) the disaster
resilience of place (DROP) model (Cutter, et al., 2008), 5) the community disaster resilience framework
(CDRF) by (Mayunga, 2007), 6) the PEOPLE resilience framework (Renschler, et al., 2010), 7) the
resilience capacity index (RCI) model (Foster, 2012), and 8) the Multi-disciplinary framework for
Seismic Resilience (Verrucci, et al., 2012).
2.6.1. Sustainable and resilient community framework
Tobin (1999) developed a disaster resilience measurement model in which resilient and sustainable
communities can be evaluated. The model has proposed three distinct models that have been applied
in order to assessing volcano hazard to create resilient communities. These models are i) the
mitigation model, ii) the recovery model, and iii) the structural cognitive model (see Figure 2-2). These
separate models consist of significant factors that are integrated into disaster resilience assessment.
The model argued that resilient and sustainable communities are those have a comprehensive
planning approach that include mitigation programs to decrease risks and exposure to hazards.
In general, Tobin’s framework emphasizes mitigation, recovery, and cognitive factors as critical
elements in building sustainable and resilient communities. However, Tobin’s framework
underestimates the role of other disaster management phases’ activities such as disaster
preparedness and disaster response. The model also claims that efficient post disaster planning and
actions predispose way to promote short and long term recovery and this attribute makes the
community as a dynamic system. The structural and cognitive factors can be influenced effectively.

21
Emphasizing on critical components of disaster resilience such as mitigation, recovery and cognitive is
the positive aspect of the framework in building resilient and sustainable communities. But the
framework underestimates the role of other disaster planning elements such as disaster preparedness
and disaster response (Manyena, 2009). Effective preparedness and respond are two important
denotation of disaster resilience in literature review and an approach that only focuses on developing
comprehensive mitigation and recovery is not able to promote sustainability and resilience of
communities. Furthermore, the relationship between resilience and vulnerability has not been
articulated which is essential for achieving community disaster resilience. Constructing a standard set
of indicators is also critical step in disaster resilience measurement that was not explicitly elaborated
for each model.
Figure 2-2 Sustainable and resilient community framework Adapted from Tobin (1999)

22
2.6.2. The 4R’s framework Researchers
The different conceptualization of disaster resilience framework or 4R’s was developed by Bruneau et
al., (2003). The approach belongs to the engineering science with an emphasis on building critical
infrastructure of resilience. The framework was developed for quantifying and measuring disaster
resilience at a community scale. The model assumes that a community disaster resilience can be
obtained via developing and applying technologies and decisions tools in both pre and post extreme
event context (Winderl, 2014). Bruneau et al., (2003) and Tierney and Bruneau (2007) proposed the
4R framework which consists of the four basic concepts of resilient including robustness, rapidity,
redundancy, and resourcefulness. Robustness is the extent to which a system is capable to endure the
impacts after occurrence of a shock without important disruption. Redundancy indicates to what
extend a community is capable to continue its performance while an adverse shock or disaster occurs.
Resourcefulness is the capacity of study areas to recognize problems, establish preferences and
initiates solutions using all kind of existing resources. Rapidity involves degree of the capacity to
restore functionality of a community in a shortest time and efficiently manner.
Tierney and Bruneau (2007), has also conceptualized resilience as four components of resilience:
technical, organizational, social and economic (TOSE). The technical dimension explains the physical
attributes of systems. These attributes are the physical characteristics of a community that cause
robustness and highlight the capability to resist and mitigate in event of shock. The organizational
dimension refers to institutions and organization that control the physical dimensions of a system such
as organizational capacity, planning, training, performance and functions. In general, the technical and
organizational components determine the functionality of critical infrastructures within a hazard-
prone area (Miles & Chang, 2011).
The social dimension includes demographic attributes of communities that distinguish the level of
social vulnerability. Characteristics such as poverty, education level and access to resources. The
economic dimension includes both inherent properties of local economy and their capacity for
improvement and innovation in post-disasters. The social and economic dimensions may be linked to
identify the general performance of a community (Renschler, et al., 2010)(Table 2-5).
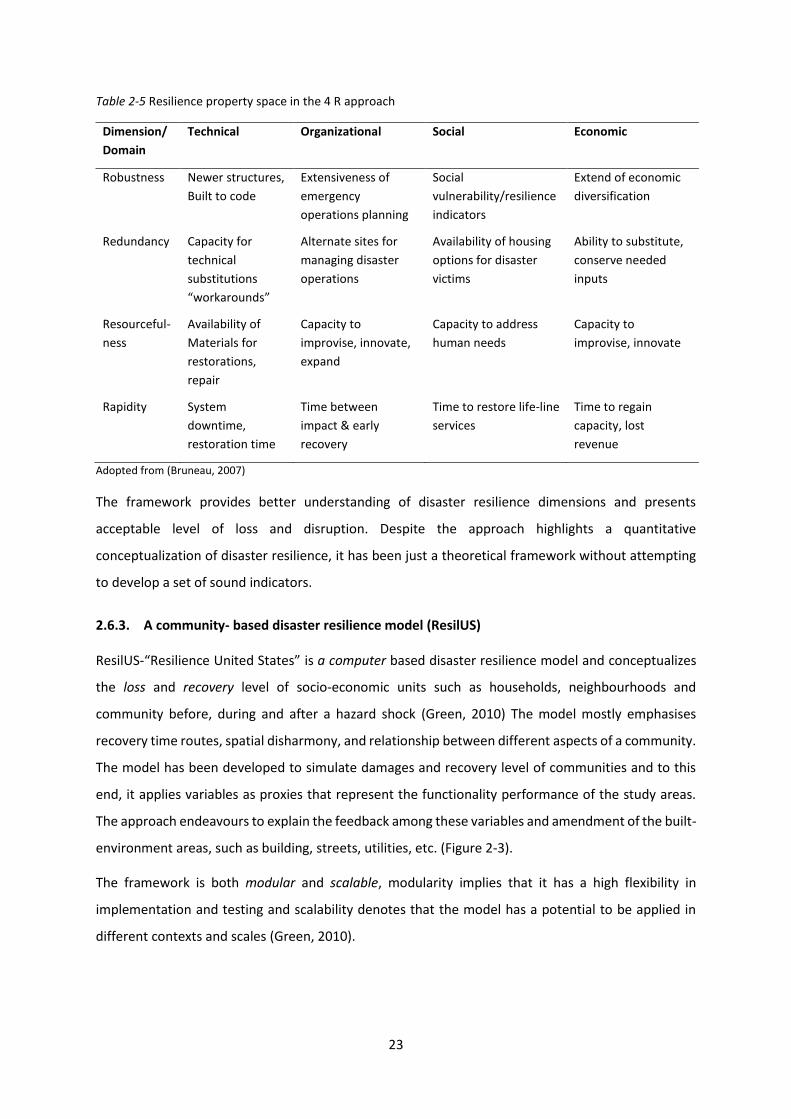
23
Table 2-5 Resilience property space in the 4 R approach
Dimension/
Domain
Technical Organizational Social Economic
Robustness Newer structures,
Built to code
Extensiveness of
emergency
operations planning
Social
vulnerability/resilience
indicators
Extend of economic
diversification
Redundancy Capacity for
technical
substitutions
“workarounds”
Alternate sites for
managing disaster
operations
Availability of housing
options for disaster
victims
Ability to substitute,
conserve needed
inputs
Resourceful-
ness
Availability of
Materials for
restorations,
repair
Capacity to
improvise, innovate,
expand
Capacity to address
human needs
Capacity to
improvise, innovate
Rapidity System
downtime,
restoration time
Time between
impact & early
recovery
Time to restore life-line
services
Time to regain
capacity, lost
revenue
Adopted from (Bruneau, 2007)
The framework provides better understanding of disaster resilience dimensions and presents
acceptable level of loss and disruption. Despite the approach highlights a quantitative
conceptualization of disaster resilience, it has been just a theoretical framework without attempting
to develop a set of sound indicators.
2.6.3. A community- based disaster resilience model (ResilUS)
ResilUS-“Resilience United States” is a computer based disaster resilience model and conceptualizes
the loss and recovery level of socio-economic units such as households, neighbourhoods and
community before, during and after a hazard shock (Green, 2010) The model mostly emphasises
recovery time routes, spatial disharmony, and relationship between different aspects of a community.
The model has been developed to simulate damages and recovery level of communities and to this
end, it applies variables as proxies that represent the functionality performance of the study areas.
The approach endeavours to explain the feedback among these variables and amendment of the built-
environment areas, such as building, streets, utilities, etc. (Figure 2-3).
The framework is both modular and scalable, modularity implies that it has a high flexibility in
implementation and testing and scalability denotes that the model has a potential to be applied in
different contexts and scales (Green, 2010).

24
ResilUS uses Markov chains to conceptualize recovery model with respect to time for quantifying
seismic resilience of community. In essence, this is based on analysing the interactions between the
recovery characteristics and recovery functions of critical infrastructures and considers losses at the
business level rather using the census data. The rational for indicator selection is also based on that
they need to be fully relevant to the three complemental aspects of resilience including: “reduced
failure probabilities, reduced consequences from failures, and reduced time to recovery” (Change &
Shinozuka, 2004, p. 741).
The model now demonstrates elements of social, economic, physical, and is being developed to
displays ecological dimension (Green, 2010). The model was first utilized in Japan (after Kobe
Earthquake), then was developed and updated, and also implemented for the case Los Angeles
Earthquake (Figure 2-4).
Figure 2-3 Recovery of damaged low and high-income households Adapted from Miles and Chang (2011)

25
Although the framework is a complex model for measuring disaster resilience, it is seen as multi-scale
approach that can be applied at different geographical scales and hazard contexts (Irajifar, et al.,
2013). Therefore, mentioned problems limitations make it more suitable for theoretical arena rather
than the real planning purposes (Miles & Chang, 2011).
2.6.4 Disaster resilience of place (DROP) model
DROP is a well-known model for conceptualizing disaster resilience which stands for disaster resilience
of place. It is also considered as “one of the advanced theoretical underpinnings of resilience concept”
(Burton, 2012, p. 22). The principle focus of the DROP approach is emphasising on the antecedent
conditions in socio-ecological systems. “Antecedent conditions are the product of processes that occur
within and between natural systems, the built environment and the social systems at specific places”
Figure 2-4 Seismic shaking and recovery time for resilience Adapted from Resilience institute (2015)

26
(Cutter, et al., 2010, p. 5). As the Figure 2-5 displays, antecedent conditions consist of two main
characteristics within communities that are called the inherent vulnerability and inherent resilience.
On the other hand, inherent vulnerability and resilience are the de-facto characterises of communities
that are also considered as a baseline condition for building and enhancing disaster resilience. The
DROP approach merges these antecedent conditions (inherent resilience and vulnerability) with
physical hazard characteristics and sees “the total hazard or disaster impact as a cumulative effect (or
sum) of the antecedent conditions and event characteristics associated with the coping capacity of a
community” (Cutter, et al., 2008, p. 602). The other point is the degree of absorptive capacity which
is mostly obtained through social learning and practice. Absorptive capacity is also known as a
threshold and defined as “the ability of the community to absorb event impacts using predetermined
coping responses” (Cutter, et al., 2008, p. 603). Therefore, the effects of natural hazards will be
moderated within communities which represent enough coping response.
In essence, the DROP model conceptualized the relationship between vulnerability and resilience in
such way that is “theoretically grounded and empirically tested”(Cutter, et al., 2010, p. 7)
Furthermore, the related antecedent conditions to inherent resilience is clearly depicted. The six
components of the model as well as ecological, social, economic, infrastructural, institutional, and
community component characterize the inherent resilience of the approach. Each component is also
defined through some individual indicators.
The operationalized version of the model called the Baseline Resilience Indicators for Communities
(BRIC) developed by Cutter et al., (2010), was the first trying of the model to pass from a theoretical
framework to an operationalized practice. The BRIC proposed a set of indicators and quantitative
Figure 2-5 Disaster resilience of place (DROP) model Adapted from Cutter et al. (2008)

27
methodology for measuring the above mentioned components of communities that enhance
resilience (Asadzadeh, et al., 2015). As stated before, the BRIC considers disaster resilience as a
multidimensional phenomenon (concept) which is associated by the six above mentioned components
(factors) and their descriptive variables (Table 2-6). Ecological resilience has been excluded “due to
data inconsistency and relevancy” (Cutter, et al., 2010, p. 8)
Table 2-6 Variables used to construct BRIC composite index
Category Variable Effect on
Resilience
Social Resilience
Educational equity
Ratio of the pct. population with college education to the pct.
population with no high school Negative
Age Percent non-elderly population Positive
Transportation access Percent population with a vehicle Positive
Language competency Percent population not speaking English as a second language Positive
Special needs Percent population without a sensory, physical, or mental
disability Positive
Health coverage Percent population with health insurance coverage Positive
Economic Resilience
Housing capital Percent of homeownership Positive
Employment Percent of population that is employed Positive
Income and equality GINI coefficient Positive
Single sector
employment
dependence
Percent population not employed in tourism, farming, fishing,
forestry, and extractive industries Positive
Employment Percent female labour force Positive
Business size Ratio of large to small businesses Positive
Health access Number of physicians per 10000 population Positive
Institutional Resilience
Mitigation Percent population covered by a recent hazard mitigation plan Positive
Flood coverage Percent housing units covered by NFIP policies Positive
Municipal services Percent municipal expenditures for fire, police, and EMS Positive
Mitigation Percent population participating in Community Rating System
for Flood (CRS) Positive
Political fragmentation Number of governments and special districts Negative
Pervious disaster
experience Number of paid disaster declarations Positive
Mitigation and social
connectivity Percent population covered by Citizen Corps programs Positive
Mitigation Percent population in Storm Ready communities Positive

28
Infrastructure Resilience
Housing type Percent housing units that are not mobile homes Positive
Shelter capacity Percent vacant rental units Positive
Medical capacity Number of hospital per Kilometer Positive
Access/evacuation
potential Principle arterial miles per square mile Positive
Housing age Percent housing units not built before 1970 and after 1994 Positive
Sheltering needs Number of hotels per kilometre Positive
Sheltering needs Number of schools per square kilometre Positive
Community csapital
Place attachment Net international migration Negative
Place attachment Percent population born in a state that still resides in that state Positive
Political engagement Percent voter participation in the 2004 election Positive
Social capital-religion Number of religious adherents per 10,000 population Positive
Social capital –civic
involvement Number of civic organizations per 10,000 population Positive
Social capital –advocacy Number of social advocacy organizations per 10,000 population Positive
Innovation Percent population employed in creative class occupations Positive
Adapted from (Cutter, et al., 2014)
Resilience is an abstract term and quantifying its level in absolute terms is hard. Therefore, the BRIC
and also other attempts use a comparative approach for conceptualizing it (Cutter, et al., 2010);
(Burton, 2012). The model was utilized to comparatively assess the disaster resilience level of 736
counties within the United States Federal Emergency Management Agency's (FEMA), which consists
of the South Eastern States of Alabama, Georgia, Kentucky, Mississippi, North Carolina, South Carolina
and Tennessee. Using the Min-Max, the model provided a set of indicators on a similar measurement
scale and allocated an equal importance (weight) to all selected variables. The Figure 2-6 represents
the visualization of the results in Arc-GIS maps using standard deviation from the mean.
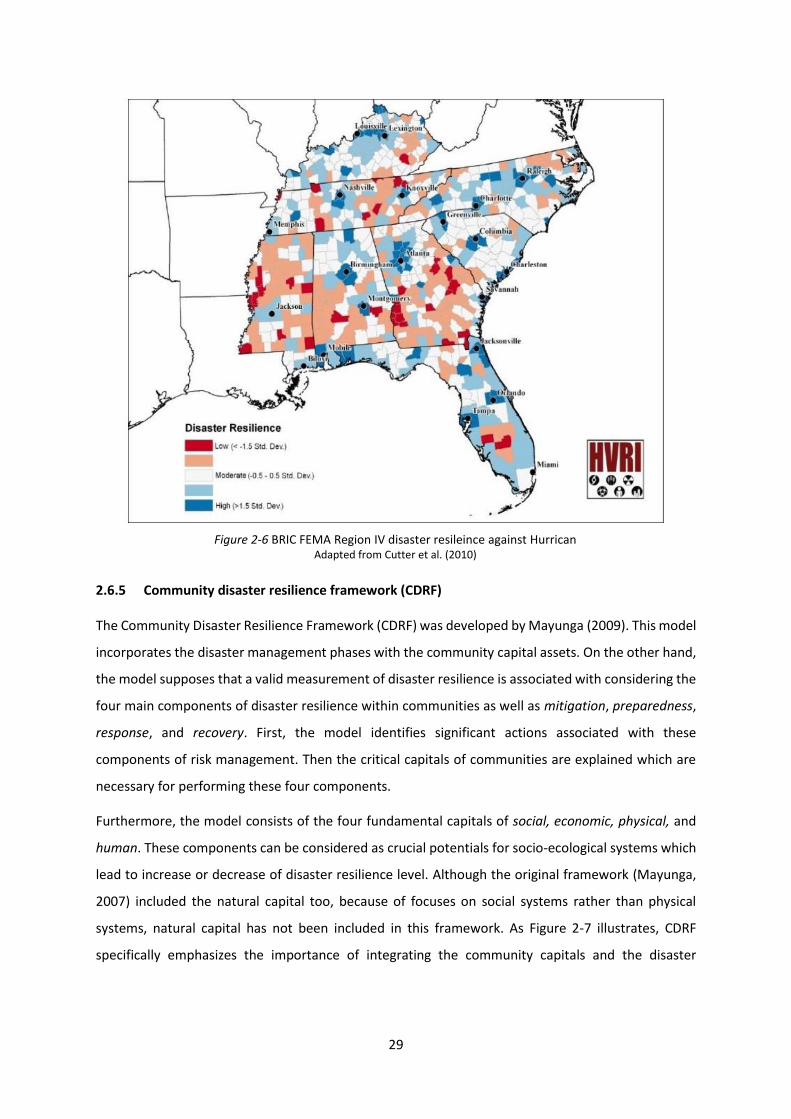
29
2.6.5 Community disaster resilience framework (CDRF)
The Community Disaster Resilience Framework (CDRF) was developed by Mayunga (2009). This model
incorporates the disaster management phases with the community capital assets. On the other hand,
the model supposes that a valid measurement of disaster resilience is associated with considering the
four main components of disaster resilience within communities as well as mitigation, preparedness,
response, and recovery. First, the model identifies significant actions associated with these
components of risk management. Then the critical capitals of communities are explained which are
necessary for performing these four components.
Furthermore, the model consists of the four fundamental capitals of social, economic, physical, and
human. These components can be considered as crucial potentials for socio-ecological systems which
lead to increase or decrease of disaster resilience level. Although the original framework (Mayunga,
2007) included the natural capital too, because of focuses on social systems rather than physical
systems, natural capital has not been included in this framework. As Figure 2-7 illustrates, CDRF
specifically emphasizes the importance of integrating the community capitals and the disaster
Figure 2-6 BRIC FEMA Region IV disaster resileince against Hurrican Adapted from Cutter et al. (2010)

30
management phase’s activities to create a platform on which disaster resilience indicators can be
developed.
As the figure illustrates, for each disaster phase, there are four different types of activities which also
include potential indicators. The framework proposes a clear process for composite indicator building
and applies an equal weighting to the set of indicators. The challenge for the scholars in this subject is
to collect required input data related to the defined resilience indicators in their model (Cutter, et al.,
2008). Therefore, based on the availability and accessibility of data, the 75 indicators have been
finalized for measuring disaster resilience in the Southeast Stats of USA (see Figure 2-8). Its results
show the degree of disaster resilience degree (community capacity) in the study area and
acknowledge that disaster resilience communities are i) able to minimize disaster impacts, ii) rapidly
recover from those impacts, and iii) ultimately improve resiliency capacity through the recovery
process (Peacock, 2010). However, among the disaster resilience measurement approaches, CDRF is
considered as a comprehensive measurement approach that also emphasizes preparedness and
response which are mostly neglected in other frameworks. It also shows that successful
implementation of activities of each disaster phases depends on the four community capitals (social,
economic, physical, and human).
Figure 2-7 Community disaster resileince framework (DDRF) Adapted from Mayunga (2009)

31
2.6.6 PEOPLES resilience framework
This framework has been built upon the MCEER R4 framework and also extends it. The model defines
resilience as “a function indicating the capability to sustain a level of functionality, performance for a
given building, bridge, lifeline network, or community over a period defined as the control time (TLC)”,
(Renschler, et al., 2010, p. 2), (Figure.2-9).
Figure 2-8 Spatial distribution of patterns of CDRI scores Adapted from Mayunga (2009)
Figure 2-9 Functionality curve and resileince Adapted from Renschler et al. (2010b)
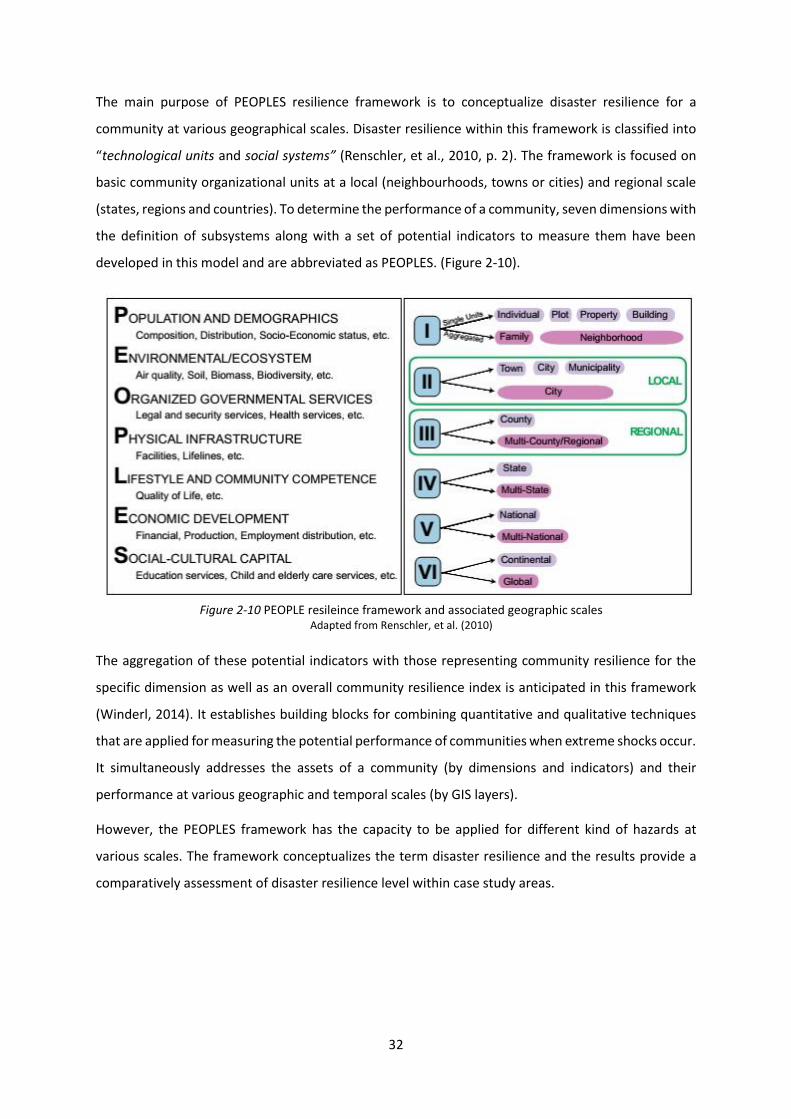
32
The main purpose of PEOPLES resilience framework is to conceptualize disaster resilience for a
community at various geographical scales. Disaster resilience within this framework is classified into
“technological units and social systems” (Renschler, et al., 2010, p. 2). The framework is focused on
basic community organizational units at a local (neighbourhoods, towns or cities) and regional scale
(states, regions and countries). To determine the performance of a community, seven dimensions with
the definition of subsystems along with a set of potential indicators to measure them have been
developed in this model and are abbreviated as PEOPLES. (Figure 2-10).
The aggregation of these potential indicators with those representing community resilience for the
specific dimension as well as an overall community resilience index is anticipated in this framework
(Winderl, 2014). It establishes building blocks for combining quantitative and qualitative techniques
that are applied for measuring the potential performance of communities when extreme shocks occur.
It simultaneously addresses the assets of a community (by dimensions and indicators) and their
performance at various geographic and temporal scales (by GIS layers).
However, the PEOPLES framework has the capacity to be applied for different kind of hazards at
various scales. The framework conceptualizes the term disaster resilience and the results provide a
comparatively assessment of disaster resilience level within case study areas.
Figure 2-10 PEOPLE resileince framework and associated geographic scales Adapted from Renschler, et al. (2010)
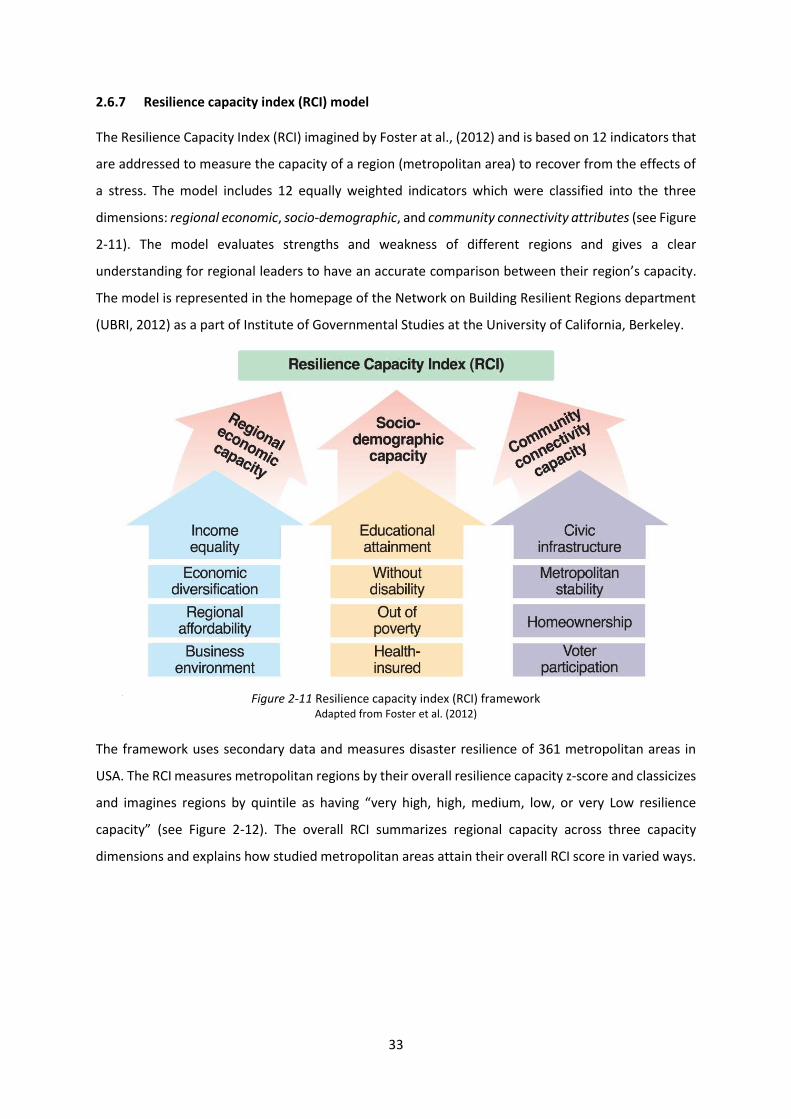
33
2.6.7 Resilience capacity index (RCI) model
The Resilience Capacity Index (RCI) imagined by Foster at al., (2012) and is based on 12 indicators that
are addressed to measure the capacity of a region (metropolitan area) to recover from the effects of
a stress. The model includes 12 equally weighted indicators which were classified into the three
dimensions: regional economic, socio-demographic, and community connectivity attributes (see Figure
2-11). The model evaluates strengths and weakness of different regions and gives a clear
understanding for regional leaders to have an accurate comparison between their region’s capacity.
The model is represented in the homepage of the Network on Building Resilient Regions department
(UBRI, 2012) as a part of Institute of Governmental Studies at the University of California, Berkeley.
The framework uses secondary data and measures disaster resilience of 361 metropolitan areas in
USA. The RCI measures metropolitan regions by their overall resilience capacity z-score and classicizes
and imagines regions by quintile as having “very high, high, medium, low, or very Low resilience
capacity” (see Figure 2-12). The overall RCI summarizes regional capacity across three capacity
dimensions and explains how studied metropolitan areas attain their overall RCI score in varied ways.
Figure 2-11 Resilience capacity index (RCI) framework Adapted from Foster et al. (2012)

34
The RCI predisposes the way for risk researchers to better understand what kind of components make
urban areas to timely resist, respond, and recover from an adverse event.
2.6.8 Multi-disciplinary framework for seismic resilience
The Multi-disciplinary Framework of Resilience (MDFR) was developed by Verrucci et al., (2012) for
evaluating community resilience to earthquake in urban areas. This framework highlights five topical
macro areas of seismic resilience including: planning, physical resistance, redundancy of
infrastructures, distribution of resources, and social cohesion.
The first component or built-in resilience, relates to attributes of resilience that can be shaped with
proper plan and amplification. The planning and land use relates to the geographers and ecological
points that indicate resilience is obtained via appropriate land use planning and location. The third
component derived from the engineering view of resilience which is based on the observation that
quality of critical infrastructures is important for the degree of response and recovery. The forth
component here represents that accessibility of resources is essential for response timely and recover
efficiently. Finally, the social cohesion demonstrates the impact of citizens as first responders of
disasters (Figure 2-13).
Figure 2-12 RCI spatial mapping of disaster resilience level Adapted from Foster et al. (2012)

35
Within this framework, the concept of resilience is defined as the extent to which a community with
potential capacities face a major disaster can adopt by gaining and maintaining an appropriate level
of functioning and structure. A selection of indicators that are aggregated to the relevant social unit
are considered by this model to be monitored over time. (Table 2-7).
Table 2-7 Candidate set of indicators for seismic resilience
Resilience description Candidate set of indicators
Planning and land use Low population density in high risk areas
Percent of population in high risk areas
Low building density in high risk areas
Percent of building in high risk area
Appropriate siting of old and new development
Percent of urbanized risk area
Appropriate siting of productive activities
Percent of commercial and manufacturing establishment sited in/ outside high risk area.
Appropriate siting of critical infrastructures
Percent of critical infrastructures sited in / outside high risk area
Design resistance BUILDING STOCK - Building age and corresponding building code Hazard-specific resistant features
BUILDING STOCK - Spatial extent of retrofitting programs BUILDING STOCK - % of retrofitted buildings
Low percentage of poorly performing building categories
BUILDING STOCK - % of buildings with poorly performing construction types
Figure 2-13 Framework defining topical macro-areas and resilience descriptors Adapted from Verrucci et al. (2012)

36
Built-in resilience Higher Physical resistance of Critical infrastructures (including hospitals and emergency facilities)
HOSPITALS-building age and correspondent building code SCHOOLS-building age and correspondent building code FIRE STATIONS-building age and correspondent building code POLICE STATIONS-building age and correspondent building code HOSPITALS-% of retrofitted hospitals SCHOOLS-% of retrofitted schools FIRE STATIONS-% of retrofitted fire stations POLICE STATIONS-% of retrofitted police stations LIFELINES - spatial extent of seismic risk reduction programs (for vulnerable components)
Continued function/redundancy
Continuity of operation of lifelines (including utilities and transportation network)
Level of system redundancy (based on analysis of alternative routes and service lines) Existence of mutual aid programs with neighboring utilities (QUALITATIVE) Total length of roads
Continuity of operation of Critical Infrastructures
Number and distribution of HOSPITALS per square kilometer N. and distribution of SCHOOLS per square kilometer N. and distribution of FIRE STATIONS per square kilometer N. and distribution of POLICE STATIONS per square kilometer
Resources Poverty Level Percent of population living below poverty level Employment Percent of employed Homeownership Percent of homeownership Wealth Per capita GDP Public space for shelters N. of SCHOOLS per square kilometer Shelter Facilities and Rehousing
N. of temporary shelters per 1000 population Percent of vacant rental units N. of HOTELS/MOTELS per square kilometers
Availability of Health Care Resources
N. of HOSPITAL BEDS for 1000 population N. of PHYSICIAN per 1000 population
Availability of Emergency Services Personnel
N. of FIRE STATIONS personnel per 1000 population N. of POLICE STATIONS personnel per 1000 population N. of social advocacy organizations per 1000 population
Insurance Percent of earthquake insured households Percent of earthquake insured businesses
Social capital Social Cohesion Crime Rate Social Networks N. of civil organizations per 1000 population
Adapted from Verrucci et al., (2012)
2.6.9 General focus of disaster resilience measurement
There is an agreement that disaster resilience implies the capability of a social system to deal with
shocks through fostering its inherent capacities as well as resistance, adapting, learning, and
innovating to reduce consequences of disasters in the future (Frankenberger & Nelson, 2013). These
capabilities depend mostly on inherent characteristics of communities and a set of hypothesis about

37
resilience. Therefore, enhancing disaster resilience is basically linked to measuring three critical
capacities: absorptive capacity, adaptive capacity, and transformative capacity (Béné , et al., 2012);
(Figure 2-14).
These characteristics are integrated into the concept of resilience and intend to give a better
understanding the potential functionalities that should be considered for measuring and enhancing
disaster resilience. Absorptive capacity can be seen as inherent or antecedent conditions of
communities which identify to what extent a system can spontaneously absorb or withstand the
effects of a shock and reduce induced consequences (OECD, 2014). On the other hand, the extent to
which a community is able to adjust in disturbances, to attenuate impacts, and to adapt with
consequences is defined adaptive capacity (Béné , et al., 2012). The transformative capacity deals with
“to create a fundamentally new system when ecological, economic or social structures make the
existing system untenable” (Walker, et al., 2004, p. 5).
As mentioned in Section 2.2, most of existing community disaster resilience frameworks entail the
quantification of disaster resilience capacities. Enhancing resilience would need interactions that are
led to strengthen these three critical attributes together at various scales. Currently, there is very little
evidence in the literature about how the ability of different communities vary to resist (cope), adapt,
and transform after an event (Béné , et al., 2012). Therefore, to have an accurate measurement of
disaster resilience, mentioned attributes should be considered as an integrated characteristic of
resilience, rather than as three independent features.
2.7. Assessment, comparison and conclusion
In this chapter, numerous studies have been reviewed in order to evaluate the current state of the
definition of resilience in the field of hazard as the focus of this study. The review also considered the
relationship of resilience with two other complementary but separate concepts of vulnerability and
sustainability. The various reviewed definitions and concepts provided a better understanding of the
term of resilience in general and how it could be conceptualized in hazards and disaster research in
Figure 2-14 Three characteristics of disaster resilience programming Adapted from Béné , et al., 2012

38
particular. Resilience is best defined as “the ability of a system to absorb disturbance and still retain
its basic function and structure” (Walker & Salt, 2006, p. 1). Although finding an agreement about the
term and definition of resilience is hard, it often defined as an ability/capacity of a system/community
to resist, mitigate, response and recover from the effect of a shock in efficient and timely manner. The
literature also indicates that resilience and sustainability are fundamental for contemporary
communities and a disaster resilience planning predisposes way to achieving sustainable
development. Furthermore, the literature review notes that the concept of disaster resilience has
more potential than the concept of vulnerability in hazard research area. The reactions and functions
of communities during and after disasters can be viewed integrated and disaster resilience is widely
addressed to understanding these interactions. There are a number of conceptual frameworks of
disaster resilience in literature, ranging from those that consider resilience as a set of cognitive models
to achieve sustainable and resilient cities (Tobin, 1999), to those that consider it as a set of engineering
functionality (Bruneau, et al., 2003); (Renschler, et al., 2010), community capital (Miles & Chang,
2008), community capacity (Mayunga, 2009); (Foster, 2012), attributes of multi-disciplines planning
(Verrucci, et al., 2012), or place-based conceptualization of resilience (Cutter, et al., 2008) ( Table 2-
8).
Although these frameworks prepare a better way to understanding disaster resilience concept,
understanding the term and developing a sound methodology for measuring it is still challenging. For
example, conceptualizations on linkages between sustainability, vulnerability, and resilience are still
missing and depend on whether viewed from socio-ecological systems, global changes, or
environmental hazard perspectives (Cutter, et al., 2008). From the methodology perspective,
conceptualizing and quantifying the concept of disaster resilience is a serious debate in the literature.
Despite the robust literature, there is still considerable disagreement about the standard mechanism
for developing a sound set of composite indicators. These indicators can meaningfully enhance our
knowledge about the different factors that are associated with resilience and interactions that are
needed to establish and enhance it. Some of these challenging issues are listed as:
1. Indicator building and identification of a standard set for measuring disaster resilience both in
different scales and different contexts is still ongoing debate. Although several quantitative
resilience indicators have been formulated, the endeavours are in their “infancy” (Cutter, et al.,
2010, p. 17), and it remains still unclear whether such indicators are able to obtain the outcomes
or processes of disaster resilience concept.
2. Mentioned frameworks could also be differentiated regarding to the number of measurable
dimensions, their names, and the distribution of variables between them. Each measurement
approach is developed on top of a theoretical framework and required dimensions that should be

39
incorporated in the measurement. Therefore, there are some overlaps in dimensions and
distribution of variables in literature.
3. The quantification of interconnections among a set of indicators in most of existing approaches
has been neglected. For instance, in BRIC the impact of percent of population with a vehicle is
same as the number of population living in urban deteriorated textures. Whereas, different
variables play different role in assessment of disaster resilience. Most of the reviewed approaches
allocate an equal importance across indicators. This leads to neglect the existing interactions
among the indicators and makes the obtained results inaccurate.
This dissertation, views disaster resilience as the concept that determines the extent to which a
community is able to have capability of preparedness and capacity to absorb, mitigate, respond to,
and recover from disasters to successfully adapt to actual or potential adverse shocks in a timely
manner and efficient way. The primary step for perception the diverse and process of disaster
resilience is performed via the development of benchmarking tools that can be reserved as baseline
conditions for assessing both the adverse impacts of hazards and components that ban efficient
reactions (Cutter, et al., 2008). With this background, the initial focus of this research work is to
enhance our knowledge about the multi-dimensional nature of disaster resilience and
operationalization of its concept in a specific context with an earthquake threat source. This process
will be performed through developing a methodological approach for construction a sound set of
composite indicators that addresses the above mentioned gaps in literature.
Table 2-8 Summary of selected approaches
Framework/ First developer
Main Focus/ Context
Benefits Limitations
Sustainable and Resilient Community
Framework (Tobin, 1999)
Mitigation, recovery, and cognitive factors of disaster
resilient and sustainable communities/Volcanic
Emphasising critical elements of disaster
resilience, operationalized and
validated model.
Lack of relationship between resilience and
vulnerability, broad variables and attributes.
System Diagram (R4 Resilience Framework)
(Bruneau et al, 2003)
Robustness, redundancy, resourcefulness, and
rapidity of community infrastructures/Earthquake
Focus on critical infrastructure systems,
scenario based assessment, multi hazard and scale.
A general measurement framework without
indicator set and validation.
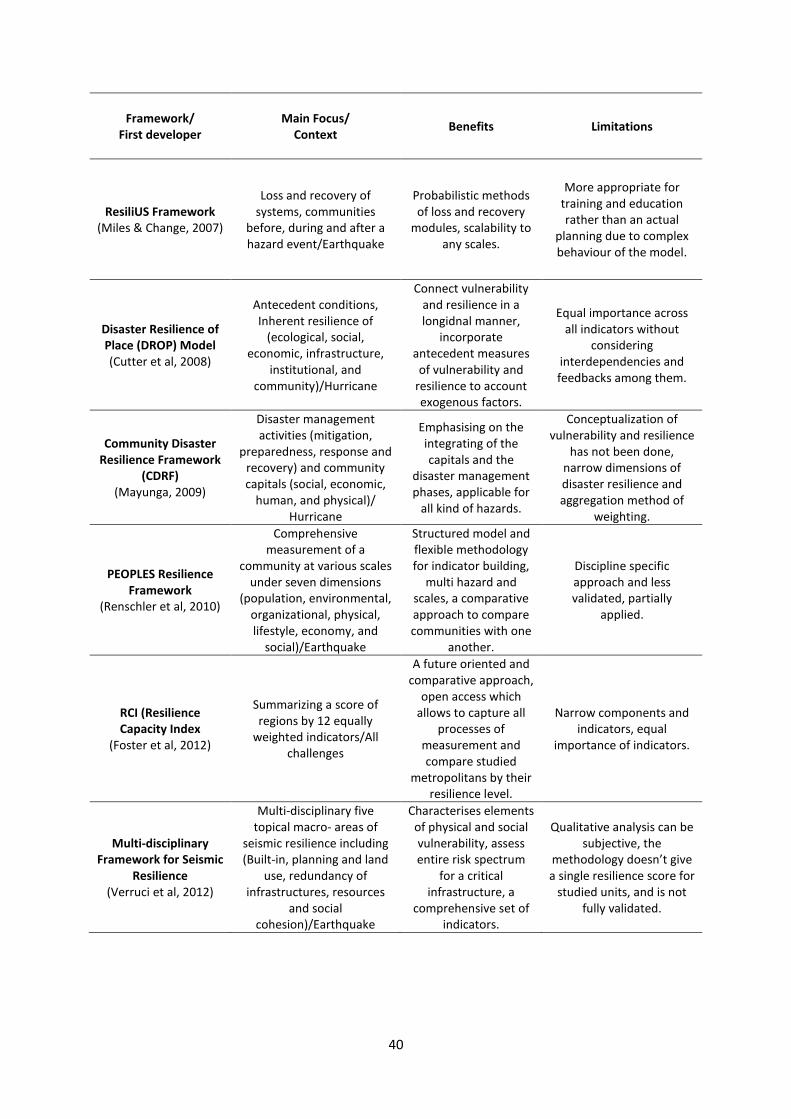
40
Framework/ First developer
Main Focus/ Context
Benefits Limitations
ResiliUS Framework (Miles & Change, 2007)
Loss and recovery of systems, communities
before, during and after a hazard event/Earthquake
Probabilistic methods of loss and recovery
modules, scalability to any scales.
More appropriate for training and education rather than an actual
planning due to complex behaviour of the model.
Disaster Resilience of Place (DROP) Model (Cutter et al, 2008)
Antecedent conditions, Inherent resilience of
(ecological, social, economic, infrastructure,
institutional, and community)/Hurricane
Connect vulnerability and resilience in a longidnal manner,
incorporate antecedent measures
of vulnerability and resilience to account exogenous factors.
Equal importance across all indicators without
considering interdependencies and feedbacks among them.
Community Disaster Resilience Framework
(CDRF) (Mayunga, 2009)
Disaster management activities (mitigation,
preparedness, response and recovery) and community capitals (social, economic,
human, and physical)/ Hurricane
Emphasising on the integrating of the capitals and the
disaster management phases, applicable for
all kind of hazards.
Conceptualization of vulnerability and resilience
has not been done, narrow dimensions of disaster resilience and aggregation method of
weighting.
PEOPLES Resilience Framework
(Renschler et al, 2010)
Comprehensive measurement of a
community at various scales under seven dimensions
(population, environmental, organizational, physical, lifestyle, economy, and
social)/Earthquake
Structured model and flexible methodology for indicator building,
multi hazard and scales, a comparative approach to compare communities with one
another.
Discipline specific approach and less validated, partially
applied.
RCI (Resilience Capacity Index
(Foster et al, 2012)
Summarizing a score of regions by 12 equally
weighted indicators/All challenges
A future oriented and comparative approach,
open access which allows to capture all
processes of measurement and compare studied
metropolitans by their resilience level.
Narrow components and indicators, equal
importance of indicators.
Multi-disciplinary Framework for Seismic
Resilience (Verruci et al, 2012)
Multi-disciplinary five topical macro- areas of
seismic resilience including (Built-in, planning and land
use, redundancy of infrastructures, resources
and social cohesion)/Earthquake
Characterises elements of physical and social vulnerability, assess entire risk spectrum
for a critical infrastructure, a
comprehensive set of indicators.
Qualitative analysis can be subjective, the
methodology doesn’t give a single resilience score for
studied units, and is not fully validated.

41
3. The Context of Seismic Resilience in the Metropolitan of Tehran,
Iran
The development and application of disaster resilience measurement frameworks is usually
performed within the context of a particular place. These kind of studies are comparative assessments
between communities of similar vulnerability, resourcing and capacities that could lead to identifying
the efficiency of related risk reduction programs and developing strategies for enhancing resilience
(Burton, 2012); (Peterson, et al., 2014). In this research, the study area is the Metropolitan of Tehran,
Iran. The dissertation explicitly focuses on 22 urban regions of the city in general and its 368
neighbourhoods in particular due to their antecedent conditions and characteristics of the hazard.
Antecedent conditions are the “product of a place-specific multiscalar processes that occur within and
between social, natural, and built environment systems” (Cutter, et al., 2008, p. 602). Therefore, the
degree of disaster resilience at the case study areas will be determined by focusing on its inherent
resilience and antecedent conditions.
3.1. Earthquake hazard in Tehran: a silent disaster
Tehran, the capital of Iran with 8, 3 million inhabitants located in northern center of the country at
the southern side of Alborz Mountains. This mountain contains a major fault range with several fault
lines that reaches the south part of the city of Tehran. The most important faults however, are the
Mosha (MF), North Tehran (NTF), North Ray (NRF), and South Ray (SRF) faults (Figure 3-1). Based on
the seism-tectonic studies, Tehran City has been surrounded by more than10 faults. The city has
experienced several historical destructive earthquakes in the past that could be majorly classified as
the consequence of the three active faults.
1) The Mosha-Fasham Fault (MFF) is famous as the basic earthquake of the Tehran city and is located
in the southern part of the Alborz Mountains (Rezaei & Panahi, 2015). MFF is presumed as the cause
of major historical earthquakes in 958 (Ms ∼ 7.7), 1665 (Ms ∼ 6.5) and 1830 (Ms ∼ 7.1) (Berberian &
Yetas, 2001).
2) The North Tehran Fault (NTF) is recorded as the most salient tectonic factor which it is composed
of faults starts from north (Alborz Mountains) and continues to the west (Toochal Mountains) of
Tehran (Rezaei & Panahi, 2015). Its length is estimated around 110 km. Historical earthquakes during
855 (Ms ∼ 7.1), 856 (Ms ∼ 7.3) and 1177 (Ms ∼ 7.3) are presumed to be occur because of the ruptures
of this fault (Ashtiani & Hosseini, 2005).
3) The North and South Rey Faults (NSRF) are recorded as the two salient faults of the Tehran city in
its southern plain which are on divaricate in the neighborhoods of the Rey subsidence. They are
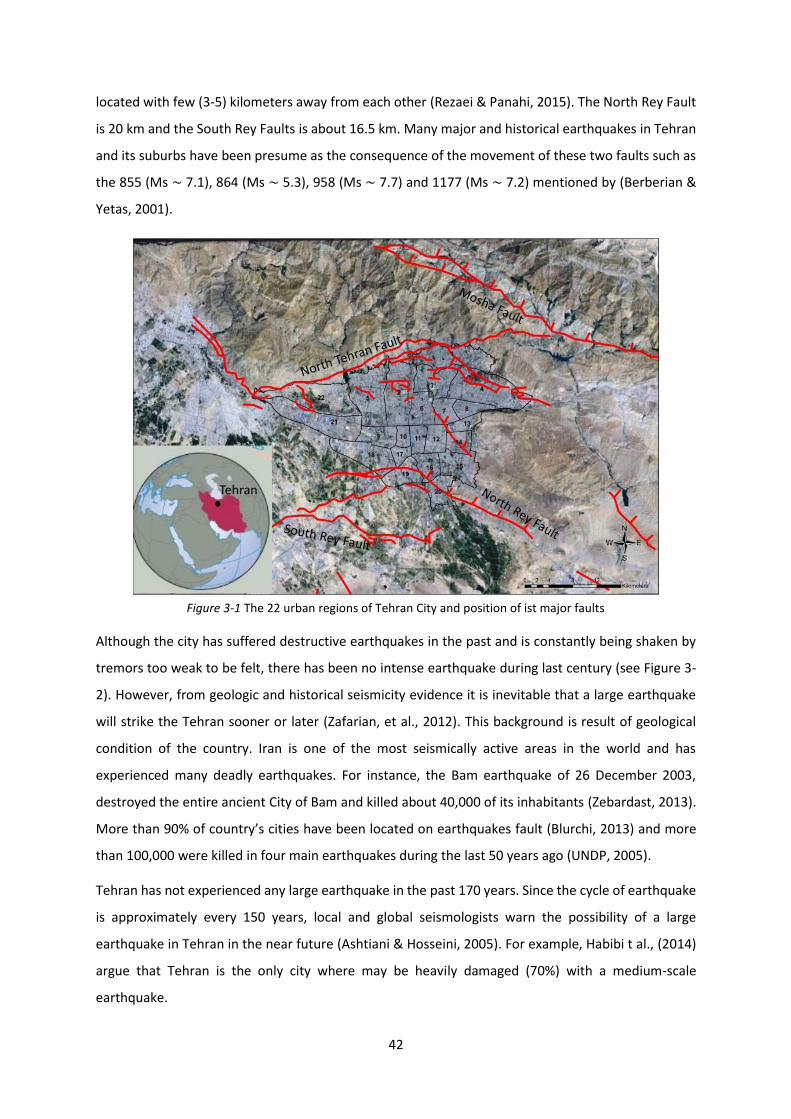
42
located with few (3-5) kilometers away from each other (Rezaei & Panahi, 2015). The North Rey Fault
is 20 km and the South Rey Faults is about 16.5 km. Many major and historical earthquakes in Tehran
and its suburbs have been presume as the consequence of the movement of these two faults such as
the 855 (Ms ∼ 7.1), 864 (Ms ∼ 5.3), 958 (Ms ∼ 7.7) and 1177 (Ms ∼ 7.2) mentioned by (Berberian &
Yetas, 2001).
Although the city has suffered destructive earthquakes in the past and is constantly being shaken by
tremors too weak to be felt, there has been no intense earthquake during last century (see Figure 3-
2). However, from geologic and historical seismicity evidence it is inevitable that a large earthquake
will strike the Tehran sooner or later (Zafarian, et al., 2012). This background is result of geological
condition of the country. Iran is one of the most seismically active areas in the world and has
experienced many deadly earthquakes. For instance, the Bam earthquake of 26 December 2003,
destroyed the entire ancient City of Bam and killed about 40,000 of its inhabitants (Zebardast, 2013).
More than 90% of country’s cities have been located on earthquakes fault (Blurchi, 2013) and more
than 100,000 were killed in four main earthquakes during the last 50 years ago (UNDP, 2005).
Tehran has not experienced any large earthquake in the past 170 years. Since the cycle of earthquake
is approximately every 150 years, local and global seismologists warn the possibility of a large
earthquake in Tehran in the near future (Ashtiani & Hosseini, 2005). For example, Habibi t al., (2014)
argue that Tehran is the only city where may be heavily damaged (70%) with a medium-scale
earthquake.
Figure 3-1 The 22 urban regions of Tehran City and position of ist major faults
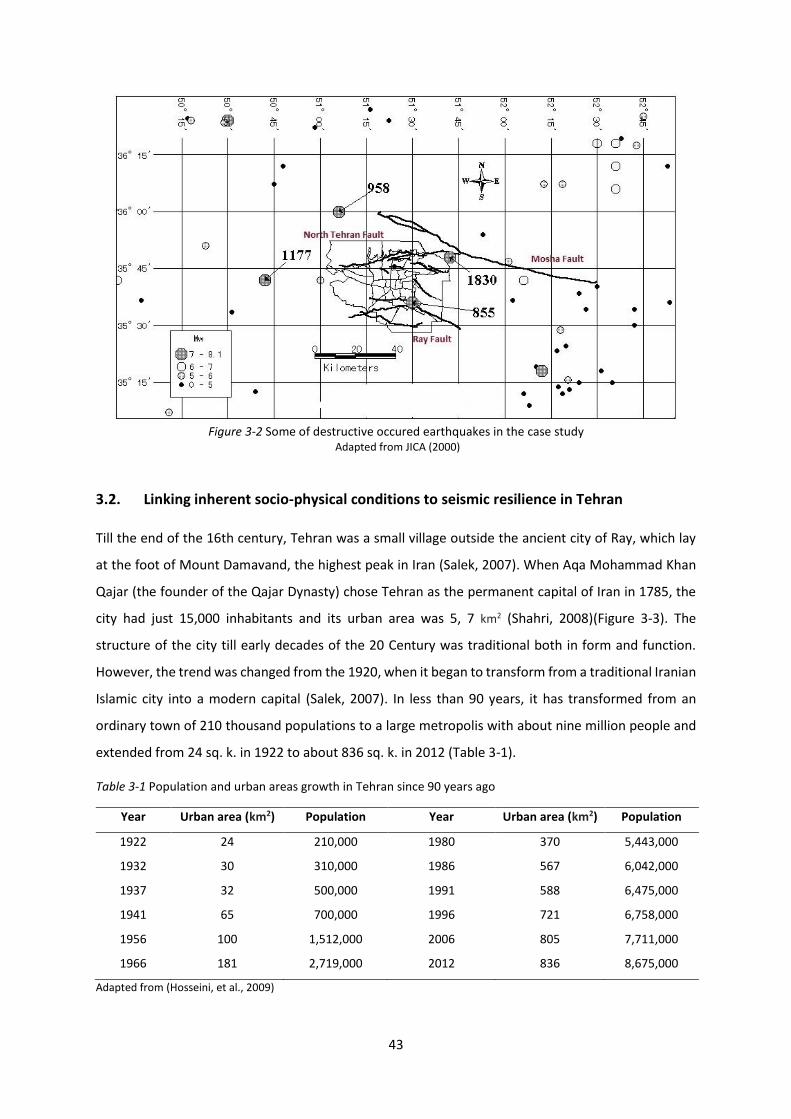
43
3.2. Linking inherent socio-physical conditions to seismic resilience in Tehran
Till the end of the 16th century, Tehran was a small village outside the ancient city of Ray, which lay
at the foot of Mount Damavand, the highest peak in Iran (Salek, 2007). When Aqa Mohammad Khan
Qajar (the founder of the Qajar Dynasty) chose Tehran as the permanent capital of Iran in 1785, the
city had just 15,000 inhabitants and its urban area was 5, 7 km2 (Shahri, 2008)(Figure 3-3). The
structure of the city till early decades of the 20 Century was traditional both in form and function.
However, the trend was changed from the 1920, when it began to transform from a traditional Iranian
Islamic city into a modern capital (Salek, 2007). In less than 90 years, it has transformed from an
ordinary town of 210 thousand populations to a large metropolis with about nine million people and
extended from 24 sq. k. in 1922 to about 836 sq. k. in 2012 (Table 3-1).
Table 3-1 Population and urban areas growth in Tehran since 90 years ago
Year Urban area (km2) Population Year Urban area (km2) Population
1922 24 210,000 1980 370 5,443,000
1932 30 310,000 1986 567 6,042,000
1937 32 500,000 1991 588 6,475,000
1941 65 700,000 1996 721 6,758,000
1956 100 1,512,000 2006 805 7,711,000
1966 181 2,719,000 2012 836 8,675,000
Adapted from (Hosseini, et al., 2009)
Figure 3-2 Some of destructive occured earthquakes in the case study Adapted from JICA (2000)

44
The dramatic change of the city both in structure and population refers to the revolution of 1979 and
subsequent war with Iraq (1980-1988) which completed the irregular and ugly physical expanding of
Tehran (Asadzadeh, et al., 2014). This process has been accompanied with rapid and haphazard urban
developments coupled with poor construction quality and lack of appropriate disaster prevention and
management plan which have made the city quite vulnerable to future earthquakes (Zebardast, 2005).
It is obvious that the city has been enlarged rapidly and irregularly during last century and the major
direction was towards the active faults and unstable slopes located in the North and West north.
(Amini Hosseini, et al., 2009). Because of high potential of earthquakes to cause enormous amount of
losses and community disruption, many local and international institutes have studied the
vulnerability of Tehran to potential earthquake (JICA, 2000); (Ashtiani & Hosseini, 2005); (Hosseini, et
al., 2009). The study of Japan International Cooperation Agency (JICA) in 2000, is frequently referenced
as the first study on urban vulnerability to earthquake in the City of Tehran (Hosseini, et al., 2009);
(Zebardast, 2005); (Zebardast, et al., 2013). The study has used the six main criteria for assessing and
ranking of urban regions of Tehran City including:
1) Intensity of seismic,
2) Ratio of building damages,
3) Ratio of losses,
4) Population density,
5) Open space, and
6) Ratio of narrow roads.
Figure 3-3 Development stages of the city of Tehran over the past century Adapted from Bayat (2010)

45
The study used the building data from 34,805 census blocks as provided by the Iranian Census Center
and concluded that the central and southern regions of the city are more vulnerable and will suffer
more damages and causalities (Figure 3-4).
The study of JICA predisposed way for considering the vulnerability of the urban structure to
earthquake and warned that Tehran is a vulnerable community to earthquake. According to Swiss Re
(2013), Tehran is highly exposed to earthquake risk and bout a million people could be killed if the city
is hit by an earthquake of the same magnitude to the one that Haiti in 2010. So that, local geologists
have even tried to get the Iranian Government to move the capital to other location. The report has
been done by focusing on two main criteria:
1) The size of the urban population that could be hit by one or more natural hazards (index of people
potentially affected), and
2) The impact of this hitting on the local and national economy (index of the value of working lost
days).
Regarding to the first criteria, Tehran is ranked as the sixth with 13. 6 million inhabitants after Tokyo
Yokohama (30 million), Jakarta (17.7 million), Manila (16.8 million), Los Angeles (14.7 million), and
Osaka-Kobe (14.6 million). The report also indicates that Tehran is one of the first 10 vulnerable
Megacities with regards to value of working lost days (Figure 3-5).
Figure 3-4 Earthquake risk assessment of Tehran’s Urban Regions Adapted from JICA (2000)
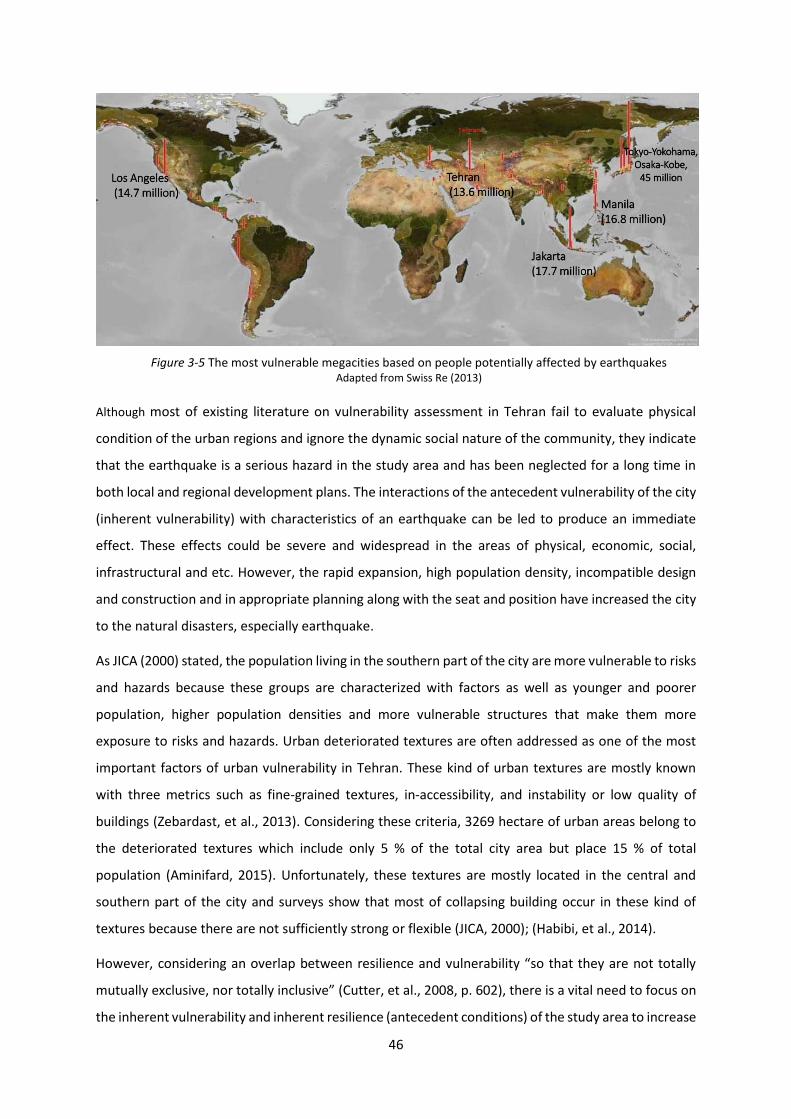
46
Although most of existing literature on vulnerability assessment in Tehran fail to evaluate physical
condition of the urban regions and ignore the dynamic social nature of the community, they indicate
that the earthquake is a serious hazard in the study area and has been neglected for a long time in
both local and regional development plans. The interactions of the antecedent vulnerability of the city
(inherent vulnerability) with characteristics of an earthquake can be led to produce an immediate
effect. These effects could be severe and widespread in the areas of physical, economic, social,
infrastructural and etc. However, the rapid expansion, high population density, incompatible design
and construction and in appropriate planning along with the seat and position have increased the city
to the natural disasters, especially earthquake.
As JICA (2000) stated, the population living in the southern part of the city are more vulnerable to risks
and hazards because these groups are characterized with factors as well as younger and poorer
population, higher population densities and more vulnerable structures that make them more
exposure to risks and hazards. Urban deteriorated textures are often addressed as one of the most
important factors of urban vulnerability in Tehran. These kind of urban textures are mostly known
with three metrics such as fine-grained textures, in-accessibility, and instability or low quality of
buildings (Zebardast, et al., 2013). Considering these criteria, 3269 hectare of urban areas belong to
the deteriorated textures which include only 5 % of the total city area but place 15 % of total
population (Aminifard, 2015). Unfortunately, these textures are mostly located in the central and
southern part of the city and surveys show that most of collapsing building occur in these kind of
textures because there are not sufficiently strong or flexible (JICA, 2000); (Habibi, et al., 2014).
However, considering an overlap between resilience and vulnerability “so that they are not totally
mutually exclusive, nor totally inclusive” (Cutter, et al., 2008, p. 602), there is a vital need to focus on
the inherent vulnerability and inherent resilience (antecedent conditions) of the study area to increase
Figure 3-5 The most vulnerable megacities based on people potentially affected by earthquakes Adapted from Swiss Re (2013)

47
our knowledge about their potential performance at the time of a probable shock. Because the “total
effects of hazard or disaster is a cumulative effect of the antecedent conditions, event characteristics,
and coping responses and it can be moderated by the absorptive capacity of the community” (Cutter,
et al., 2008, p. 603). We believe that an accurate assessment of the ability or capacity of the urban
areas to resist, mitigate, response, and recover from the effect of a shock will be led to distinguish the
potential or actual performance of them in time of an event. To better understand whether the study
areas are disaster resilient or not, the first step is to developing a tool or benchmarking for measuring
of their resiliency level. To perform this task, the study introduces a new methodology which will be
explained in the next section.

48
4. Methodological Approach
4.1. Process of composite indicators design for conceptualizing disaster resilience
There is an agreement that disaster resilience is a multi-dimensional concept that encompasses many
factors. Therefore, developing a comprehensive approach to measure disaster resilience, which
reflects a multifaceted outlook of the concept is undoubtedly challenging. The development of
measurement tools is often mentioned as a major milestone in achieving resilience at a significant
scale. This process is done to understand the inherent resilience and potentially performance of
communities that are often affected from a particular hazard risk such as a major earthquake. Since
these characteristics differ from one community to another, the measurement can be used not only
to improve the local resilience but also contributes to have a comparative assessment of resilience
level within communities or regions (Cutter, et al., 2014); (Burton, 2012).
Constructing composite indicators is mentioned as a useful tool to perform this process (Mayunga,
2009); (Cutter, et al., 2014); (Burton, 2012). Cutter et al., (2010) define the term composite indicator
“a manipulation of individual variables to produce an aggregate measure of disaster resilience”
(Cutter, et al., 2010, p. 2). A composite indicator “aggregates multiple individual indicators to provide
a synthetic measure of a complex, multidimensional, and meaningful phenomena such as disaster
resilience” (Bepetista, 2014, p. 1). They have capability to be applied for analysing and comparing units
of analysis within specific communities at any geographic areas. They can also provide the ranking of
study areas from lowest to highest level of disaster resilience (Balica, et al., 2009). Therefore,
constructing a sound set of composite indicators paves the way for better understanding of
multifaceted concepts such as disaster resilience and also prepares accurate and understandable
results for the involved sectors dealing with them.
However, building composite indicators is accompanied with some difficulties. Adger et al., (2004)
argue that the problem of individual indicators weighting is a major obstacle for building a composite
indicators for vulnerability and resilience analysis. Composite indicators may neglect to assess the
hidden interactions among indicators and fail to consider significant factors of a subject to be
measured or hide weakness of them (Bepetista, 2014); (Zhou & Ang, 2009). The method of aggregation
is another pressing problem in developing composite indicators. Although the measurement error of
each individual variable can be influenced positively or negatively by the aggregation process, it may
strengthen the influence of the errors themselves (Bepetista, 2014). Similarly, Cutter et al., (2014)
pointed out that an aggregated measurement of disaster resilience can be performed through a
composite indicator set. They also acknowledge that there is “no theoretical or practical justification

49
for the differential allocation of importance across indicators” (Cutter, et al., 2010, p. 12) and these
arguments show the difficulty in obtaining a single composite index for disaster resilience.
Literature review on composite indicators is wide and encompasses many methodological frameworks
for construction and validation. However, most of the related literatures emphasis that a sound set of
composite indicators should be accompanied with a number of specific steps (Birkmann, 2007):
(Cutter, et al., 2014); (Mayunga, 2009); (Burton, 2012); (Verrucci, et al., 2012); (Zebardast, 2013);
(Bepetista, 2014).
The methodological steps include:
1. Developing or application of a theoretical framework as a basis for indicator building
2. Identifying and selecting indicators that are sound, robust and related
3. Data standardizing and overcoming incommensurability
4. Data reduction and factor retention (identifying latent dimensions)
5. Weighting and aggregation
6. Visualization and validation
In order to fulfil the requirements of the stockholders or other end-users, composite indicators
provide not only a benchmarking tool and monitoring potential efficiency overtime, but also have
capacity to be modified during their building process (Booysen, 2002); (Bepetista, 2014). Composite
indicators have potential to be developed and adjusted over time. Thus, the process of composite
indicator design is used to construct the methodology of this study for understanding disaster
resilience level in the case study.
To construct a new set of composite indicators for measuring disaster resilience in the context of
earthquake hazard, this study introduces a new assessment model by developing a methodological
approach for composite indicators building that fulfil the above mentioned methodological steps by
applying new statistical methods as indicated in Figure 4-1.

50
Figure 4-1 Process diagram of the proposed approach to construct composite indicators
51
4.2. Theoretical framework for indicator building
The primary step of composite indicator building is started by doing a systematic literature review to
provide a comprehensive list of theoretical frameworks, as well as conceptualizing the term, and the
formulization of the multifaceted nature of analysis (Nardo, et al., 2005); (Cutter, et al., 2008);
(Mayunga, 2009); (Cutter, et al., 2014); (Kenny, et al., 2012); (Burton, 2012); (Bepetista,
2014).Composite indicators are usually applied to summarise a number of single variables where
indicators are quantitative or qualitative values taken from a series of observed facts and can be
addressed to identify the orientation of change (Europeian Commisssion, 2014).
Since it is sorely hard to integrate single variables that reflect all aspects of resilience, as a starting
point, selection of a sound theoretical frameworks is essential. A valid theoretical framework
predisposes way to enhance our perception of the subject (disaster resilience) to be measured and
aggregates underlying sub variables into a significance composite index (Burton, 2012). Resilience is
an inherently multifaceted concept and selected framework allows to identify indicators which “carry
relevant information about the core components and be based on a paradigm concerning the
behavior being analyzed” (Hincu, et al., 2010, p. 524).
This study focuses only on the inherent resilience (antecedent conditions) of the study area and
therefore, utilizes the Disaster Resilience of Place (DROP) model and its validated version called
Baseline Resilience Indicators for Communities (BRIC) as the theoretical basis of the study (see section
2.6.4). As stated before, one of the positive points of the DROP model is that it concentrates on a
community’s antecedent conditions. These attributes are “the product of processes within
communities that are place specific and multiscalar, and that occur within and between natural
systems, social systems, and the constructed environment” (Burton, 2012, p. 36).
Since the BRIC was formulized to conceptualize a community's disaster resilience level, it follows the
DROP model as the theoretical framework for indicator building. The BRIC approach uses the premise
about resilience as a “multifaceted concept” classifying the factors involved in the resilience of a
community which include social, economic, institutional, infrastructural, ecological, and community
elements. Although the origin framework of BRIC or DROP has six main components including: social,
economic, institutional, infrastructure, community capital and ecological, the BRIC has excluded
ecological component due to “data inconsistency” Cutter et al., (2010, p. 8).
The BRIC therefore consists of indicators that represent the categories of economic, infrastructure,
social, community and institutional resilience following support in the literature to suggest that a
capitals framework, originating in the community development sector, is well placed to frame
community resilience (Bukistra, et al., 2010). Despite this omission, the BRIC does include proxies for
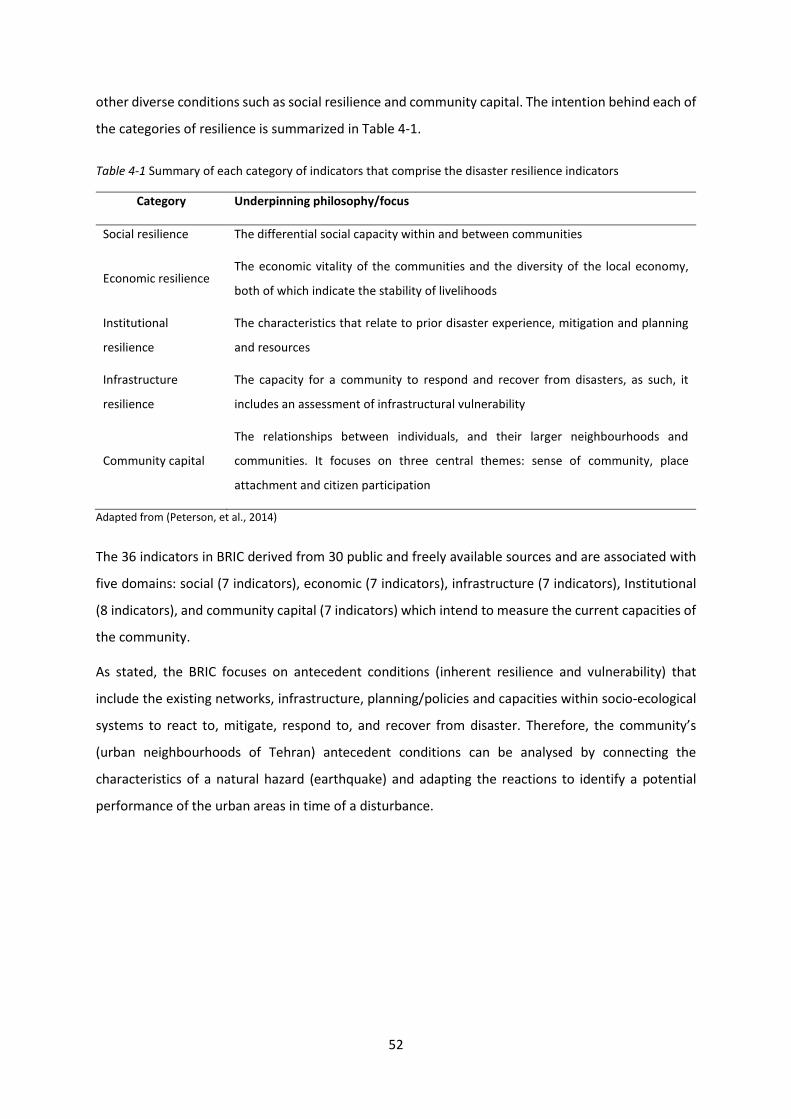
52
other diverse conditions such as social resilience and community capital. The intention behind each of
the categories of resilience is summarized in Table 4-1.
Table 4-1 Summary of each category of indicators that comprise the disaster resilience indicators
Category Underpinning philosophy/focus
Social resilience The differential social capacity within and between communities
Economic resilience The economic vitality of the communities and the diversity of the local economy,
both of which indicate the stability of livelihoods
Institutional
resilience
The characteristics that relate to prior disaster experience, mitigation and planning
and resources
Infrastructure
resilience
The capacity for a community to respond and recover from disasters, as such, it
includes an assessment of infrastructural vulnerability
Community capital
The relationships between individuals, and their larger neighbourhoods and
communities. It focuses on three central themes: sense of community, place
attachment and citizen participation
Adapted from (Peterson, et al., 2014)
The 36 indicators in BRIC derived from 30 public and freely available sources and are associated with
five domains: social (7 indicators), economic (7 indicators), infrastructure (7 indicators), Institutional
(8 indicators), and community capital (7 indicators) which intend to measure the current capacities of
the community.
As stated, the BRIC focuses on antecedent conditions (inherent resilience and vulnerability) that
include the existing networks, infrastructure, planning/policies and capacities within socio-ecological
systems to react to, mitigate, respond to, and recover from disaster. Therefore, the community’s
(urban neighbourhoods of Tehran) antecedent conditions can be analysed by connecting the
characteristics of a natural hazard (earthquake) and adapting the reactions to identify a potential
performance of the urban areas in time of a disturbance.

53
4.3. Indicator building for measuring disaster resilience
The second crucial step towards construction of composite indicators is identification of relevant and
robust variables (indicators). The development of a composite indicator can be done for two purposes:
measurement of a concept or providing description of a system. The latter can be done having only
one indicator but when measurement of a multifaceted concept such as resilience is the main purpose,
developing a set of composite indicators is required. The intention of indicator building is to convince
that the selected indicators are relevant, measurable, and most importantly reflect the concept being
operationalized (Nardo, et al., 2005); (Mayunga, 2009). Due to the similarity of the approaches for
building composite indicators to the mathematical and computational models, their justification is
done based on the suitability to be applied on the targeted area and acceptance of the identical
indicators (Burton, 2012).
Although the literature about the composite indicators in disaster resilience is relatively vast, finding
a standard set of indicators at different scale and different context of hazards is still ongoing debate.
This is because that resilience is an inherently multifaceted and comprehensive concept and by
constructing indicator set of measurement, an approach explicitly defines what or which aspects of
resilience could or should be measured (Oddsdóttir, et al., 2013). However, within the hazard
community there is an agreement that resilience is a comprehensive term and are mostly
characterized with social, economic, institutional, infrastructural, community, and ecological
components (Bruneau, et al., 2003); (Neumann, 2005); (Cutter, et al., 2014); (Burton, 2012) (Figure 4-
2).
Figure 4-2 Subcomponents of disaster resilience Adapted from (Burton, 2012)
54
With this background, the Baseline Resilience Indicators for Communities (BRIC) was developed by
Cutter et al., (2010); (2014) as a benchmarking tool to quantify the concept of disaster resilience
formulized in DROP. Although the model has omitted the ecology subcomponent from further analysis
due to “data inconsistency”(Cutter, et al., 2010, p. 8) in first application, it is known as one of the most
applied and validated frameworks within the literature (Ainudin & Routray, 2012); (Burton, 2012);
(Peterson, et al., 2014). Since this research focuses on the inherent resilience in the specific context
(earthquake hazard in Tehran), it utilizes the BRIC as the theoretical basis for primary indicator
building. Therefore, the desired indicators for this research will be subsumed in one of the
aforementioned categories. Each of these categories has an intention behind that focuses on
multifaceted concept of resilience (Table 4-1). The wish list of BRIC model was more than 50 indicators.
Nevertheless, 36 indicators were finalized out of 50 primary indicators based on excluding all highly
correlated indicators (Pearson’s R>0.70) and considering their internal consistency level (Cronbach’s
Alpha = 0.70) (Cutter, et al., 2010).
Since achieving an absolute measurement of disaster resilience is a hard mission, (Cutter, et al., 2008);
(Burton, 2012), indicators are collected as proxies for resilience and transition from conceptual
frameworks to empirical assessment (Cutter, et al., 2014). Appendix A.1, represents a set of 36 primary
indicators that have been considered for measuring resilience in this dissertation. However,
constructing a primary set of indicators is accompanied with some difficulties. As Fitzgibbon (2014)
pointed out, endeavouring to define factors or indicators that are not part of a specific issue is much
harder than articulating list of factors that are part of it. Therefore, theoretical strength and weakness
of each indicator should be discussed.
Indicators should face the below four requirements to be filtered whether they should be included or
excluded from the final list (Cutter, et al., 2010); (Burton, 2012); (Bepetista, 2014).
1) Justification: each indicator should be justified before including in the final list. This can be done
by looking into the existing related literature and applying a comparative method to find out their
relevance to resilience.
2) Availability: data availability for each indicator should be proven.
3) Scalability: each indicator should be scalable and objectively measurable at varying scales.
4) Consistent quality: it should be possible for each indicator to follow a data collection method with
consistent quality from local, regional or national data sources.
Considering the four above mentioned metrics, out of 36 indicators, 30 of them were selected
appropriate to conceptualize (measurement) disaster resilience in the Tehran City. The assessment
has been performed at 368 urban neighbourhoods scale, as defined by the Municipality of Tehran. In
total, Tehran has 368 urban neighbourhoods which are placed at 116 urban sub-regions and 22

55
regions. Another reason is a precondition of the methodology (ratio of cases to variables) which will
be explained in the next section. Regardless of the scale of the study, justification for the selected
indicators and their sub-categorizations (based on the theoretical framework) are discussed in the
sections below.
4.3.1. Indicators for social resilience
The seven indicators in social resilience category (Table 4-2), are aimed to obtain demographic
attributes of the case study’s inhabitants that “tend to associate with physical and mental wellness
leading to increased comprehension, communication, and mobility” (Cutter, et al., 2014, p. 68). Social
capacities are interpreted as context-related capabilities of different population groups within urban
neighbourhoods that can successfully respond in an adverse status such as an earthquake (UNISDR,
2009).
Table 4-2 Selected indicators for social resilience
Indicator Justification Effect on
Resilience
Social
Population exposure
Percent population living in hazardous areas (PD)
(Adger, et al., 2004); (Cutter, et al., 2010)
Negative
Preretirement age
Percent population that is not elderly (+65) (NEP)
(Cutter, et al., 2014); (Burton, 2012)
Positive
Gender Ratio of men to women (RMW) (Kundak, 2005); (Zebardast, 2013) Positive
Special needs Percent population without a disability (PWD)
(Cutter, et al., 2010); (Burton, 2012)
Positive
Educational equality
Percent of population with high education (PHE)
(Cutter, et al., 2010); (Burton, 2012)
Positive
Communication capacity
Percent of the population with telephone access (PWT)
(Cutter, et al., 2010); (Burton, 2012)
Positive
Health insurance Percent population with health insurance (PWH)
(Cutter, et al., 2010); (Burton, 2012)
Positive
This interactions are expected to minimize the adverse impacts of a natural event, and to utilize the
required potential skills to recover from that event (Burton, 2012). By connecting the demographic
characteristics of urban areas to the social potentials, it may concluded that urban areas with lower
level of population density in hazardous area, less elderly, and less people with disabilities represent
better level of resilience than those without these characteristics (Cutter, et al., 2010). These are
effective characteristics as well as being prepared for a shock, accurately respond when occurred, and
efficiently recover from adverse impacts of it (Cutter, et al., 2014). Likewise, having more access to
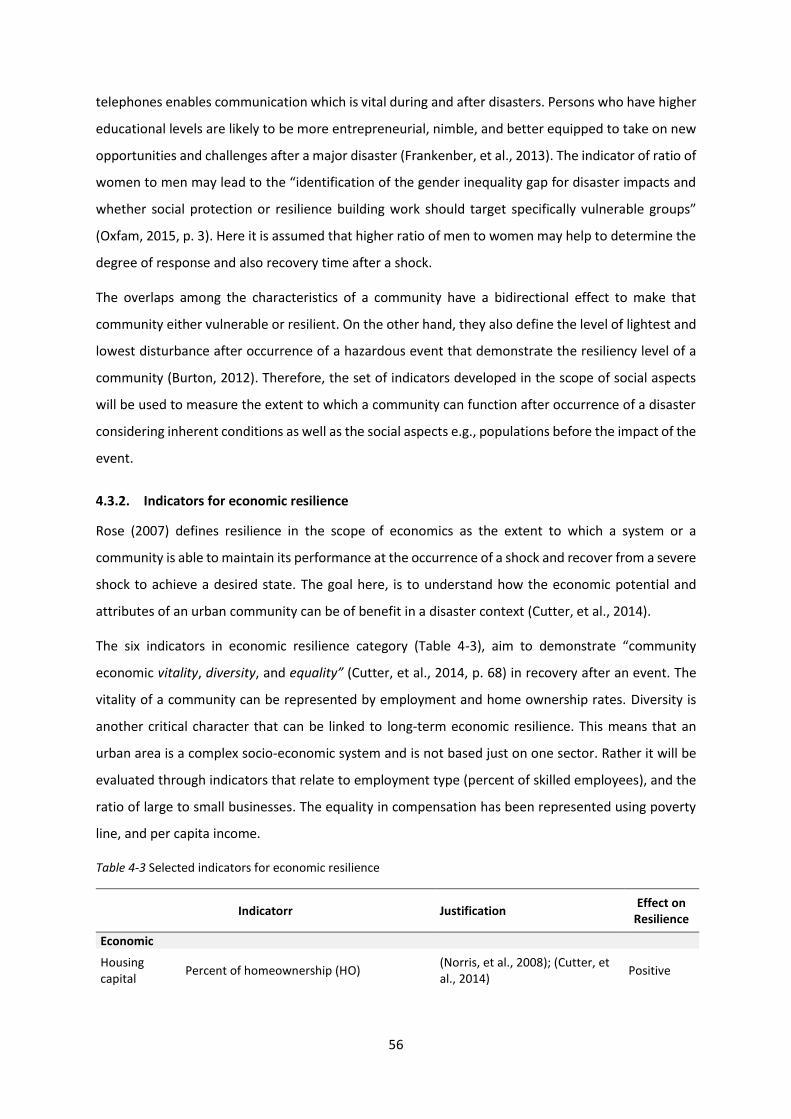
56
telephones enables communication which is vital during and after disasters. Persons who have higher
educational levels are likely to be more entrepreneurial, nimble, and better equipped to take on new
opportunities and challenges after a major disaster (Frankenber, et al., 2013). The indicator of ratio of
women to men may lead to the “identification of the gender inequality gap for disaster impacts and
whether social protection or resilience building work should target specifically vulnerable groups”
(Oxfam, 2015, p. 3). Here it is assumed that higher ratio of men to women may help to determine the
degree of response and also recovery time after a shock.
The overlaps among the characteristics of a community have a bidirectional effect to make that
community either vulnerable or resilient. On the other hand, they also define the level of lightest and
lowest disturbance after occurrence of a hazardous event that demonstrate the resiliency level of a
community (Burton, 2012). Therefore, the set of indicators developed in the scope of social aspects
will be used to measure the extent to which a community can function after occurrence of a disaster
considering inherent conditions as well as the social aspects e.g., populations before the impact of the
event.
4.3.2. Indicators for economic resilience
Rose (2007) defines resilience in the scope of economics as the extent to which a system or a
community is able to maintain its performance at the occurrence of a shock and recover from a severe
shock to achieve a desired state. The goal here, is to understand how the economic potential and
attributes of an urban community can be of benefit in a disaster context (Cutter, et al., 2014).
The six indicators in economic resilience category (Table 4-3), aim to demonstrate “community
economic vitality, diversity, and equality” (Cutter, et al., 2014, p. 68) in recovery after an event. The
vitality of a community can be represented by employment and home ownership rates. Diversity is
another critical character that can be linked to long-term economic resilience. This means that an
urban area is a complex socio-economic system and is not based just on one sector. Rather it will be
evaluated through indicators that relate to employment type (percent of skilled employees), and the
ratio of large to small businesses. The equality in compensation has been represented using poverty
line, and per capita income.
Table 4-3 Selected indicators for economic resilience
Indicatorr Justification Effect on
Resilience
Economic
Housing capital
Percent of homeownership (HO) (Norris, et al., 2008); (Cutter, et al., 2014)
Positive

57
Employment rate
Percent of population that is employed (PE) (Norris, et al., 2008); (Burton, 2012)
Positive
Income equality
Percent of population above poverty line (APL)
(Cutter, et al., 2010); (Verrucci, et al., 2012)
Positive
Social capacity
Per capita household income (HI) (Cutter, et al., 2014); (Burton, 2012)
Positive
Business size Ratio of large to small businesses (LSB) (Cutter, et al., 2014); (Burton, 2012)
Positive
Economic capacity
Percent of skilled employees (SE) (Cutter, et al., 2014); (Burton, 2012)
Positive
4.3.3. Indicators for Institutional resilience
The institutional resilience category (Table 4-4), are used to understand attributes associated with
strategies, plans, and governing of disaster resilience. Due to speedy nature and complexity of the
natural disasters, the ability of communities to respond well to a hazardous event still remain
challenging (Burton, 2012). Communities tend to prevent the amount of unexpected and previously
unexpected impacts as much as possible since in most of the cases the amount of impact remains
unknown or unpredictable after the facing a shock (Holling, 1973). These are also applicable for the
recovery time after a shock to identify and prioritize the required actions (Burton, 2012).
The two indicator associated with the institutional resilience cover mitigation, preparedness, and
planning. These indicators intend to determine the capacity of urban neighborhoods for preparing i)
tactical and operational basics for facilitation and acceleration of mitigation, preparedness, and
emergency response plan in time of earthquake, ii) emergency response plan for the 1st 72 hours
following an earthquake (Salehi, 2014).
Table 4-4 Selected indicators for institutional resilience
Indicator Justification Effect on
Resilience
Institutional
Preparedness Number of disaster management bases (DMB) (Cutter, et al., 2014); (Burton, 2012)
Positive
Emergency planning
Emergency response plane for the 1st 72 hours (ERP)
(Cutter, et al., 2014) Positive
4.3.4. Indicators for housing and infrastructural resilience
When resilience is applied in the context of an earthquake hazard, some fields such as engineering,
and land use planning likely play more important role (Alexander, 2012). Seismic resilience is therefore
to integrate the findings from these fields that are acceptable (Cimellaro, et al., 2006). The nine

58
indicators in housing/infrastructural resilience category (Table 4-5), are intended to capture the
quality of built-in and functionality of critical infrastructures associated with “physical wellness”
concluding to increasing resist, mitigate, and recovery from an event in efficient way and timely
manner (Cutter, et al., 2014).
Table 4-5 Selected indicators for housing/infrastructural resilience
Indicator Justification Effect on
Resilience
Hausing/Infrastructural
Quality of buildings
Percent of urban deteriorated textures (UDT)
(Mileti, 1999); (Verrucci, et al., 2012)
Negative
Housing characteristics
Average number of rooms per dwelling (NRD)
(Zebardast, 2013) Positive
Housing density Percent of Building density (BD) (JICA, 2000); (Verrucci, et al., 2012)
Negative
Planning and land sue
Number of resistant critical infrastructures (CIS)
(Norris, et al., 2008); (Verrucci, et al., 2012)
Positive
Temporary sheltering
Number of schools (NS) (Tierney & Bruneau, 2007); (Cutter, et al., 2014)
Positive
Evacuation potential
Percent of non-built up areas (NBA) (Kundak, 2005); (Verrucci, et al., 2012)
Positive
First aid availability
Access to the hospitals (AH) (Cutter, et al., 2014); (Verrucci, et al., 2012)
Positive
Emergency response
Access to the fire stations (AFS) (Verrucci, et al., 2012); (Burton, 2012)
Positive
Security capacity Access to the police stations (APS) (Verrucci, et al., 2012); (Burton, 2012)
Positive
As the table indicates, this resilience category shows the resistance level of community, its capability
to response, and its ability to recover fast. Community resistance capacity is determined by proxy
indicators such as quality of critical infrastructures, housing type, and quality of buildings. The latter,
is a challenging issue in urban areas such as Tehran City and is determined in terms of three physical
features such as in durability, no penetrability, and fine granularity (Hakim & Majedi, 2014). The
capacity of an urban area to respond is basically identified by looking into the following indicators:
number of hospitals, fire stations, number of police stations, and number of temporarily existent
shelters. Furthermore, it involves the percent of non-built-up areas within the study areas. This
indicator includes all areas within the study are that have not been built up (e.g. parks, green spaces,
and highways). These areas have an important role in post-disaster recovery beside provide
evacuation possibility. Furthermore, schools can provide response and recovery capacity because they
can be served as shelters, and temporary housing (Burton, 2012). Finally, the indicator of building

59
density refers to planning and land use and suggest that communities with higher building density in
hazardous area, exhibit less resilience level (Verrucci, et al., 2012).
4.3.5. Indicators for community capital resilience
Our six community capital indicators (Table 4-6) theoretically indicate the degree of the urban
neighborhoods’ “engagement and involvement in local organizations” (Cutter, et al., 2014, p. 68). The
relationship between individuals and their larger neighborhoods, and community can be depicted by
community capitals which also indicate the demographic qualities or social capital of a community
(Norris, et al., 2008); (Burton, 2012). Social capitals represent actual or potential skills of an urban area
that can be applied to increase and maintain the community health (Norris, et al., 2008); (Burton,
2012). Linking community capital into demographic qualities can be misleading. This is because that
estimating the tendency of a community’s citizens to assist their neighbors in emergency conditions,
has been considered separated from the social resilience (Mayunga, 2009); (Peterson, et al., 2014).
On the other hand, an urban area that would seem demographically resilient, may not be necessarily
dutiful and contributory to one another in time of disturbance (Cutter, et al., 2014).
Table 4-6 Selected indicators for community capital resilience
These interactions lead to identify the potential local relations and social networks that can be
addressed for survival and recovery during disasters (Mayunga, 2009); (Cutter, et al., 2014). One of
the fundamental factors of community capital is social participation which includes public areas and
interactions that are happened between inhabitants there. These interactions are measures in this
study using number of religious/cultural organizations, ratio of entertainment/recreation land uses,
social trust, and satisfaction level from local council.
Indicator Justification Effect on
Resilience
Community capital
Social capital Percent of social trust (ST) (Cutter, et al., 2014); (Burton, 2012)
Positive
Satisfaction Satisfaction level of neighbourhood relation (LNR)
(Cutter, et al., 2014) Positive
Place attachment Percent population have belonging sense to the neighbourhood (BSN)
(Cutter, et al., 2014); (Burton, 2012)
Positive
Social capital Religious and cultural organizations (RCO)
(Cutter, et al., 2014); (Burton, 2012)
Positive
Participation Satisfaction from local councils participation SLC)
(Cutter, et al., 2014); (Burton, 2012)
Positive
Social capital Ratio of entertainment and recreation land uses (REI)
(Burton, 2012) Positive

60
The sense of place or belonging sense to a particular place is the second factor of community capital.
This attribute is estimated via the durability of inhabiting within a neighborhood and is measured here
through satisfaction level of relationship within the neighborhoods and percent of inhabitants that
were born in a neighborhood and still living within there. The logic behind this argument is that living
for a long period of time in a particular neighborhood increases the possibility of having a community
that is responsible for both engaging and investing to enhance its level of well-being (Cutter, et al.,
2014).
4.3.6. Selected set of indicators for measuring disaster resilience
To construct a sound set of composite indicators, variables should be identified considering criteria
such as robustness, scalability, availability, and relevance (Mayunga, 2009); (Burton, 2012). The
developed indicators for this study have been originated from the conceptual definition of resilience
and considered the three equally important criteria of relevancy, data reliability, and availability (Table
4-7).
During this process, some arguments were also performed in order to develop more representative
indicators that are theoretical grounded and based on the social and physical realities of the study
area (e.g. the sessions in the Tehran Disaster Mitigation and Management Organization (TDMMO)),
and University of Tehran). After finalizing the candidate indicators, and also gathering all data, the
next step is to standardize the selected indicators that is discussed in the next section.
Table 4-7 Selected indicators to construct disaster resilience index by subcomponent
Indicator Justification Data Source Effect on Resilience
Social
Percent population living in hazardous areas (PD)
(Adger, et al., 2004); (Cutter, et al., 2010)
Iran Census 2011 Negative
Percent population that is not elderly (+65) (NEP)
(Cutter, et al., 2014); (Burton, 2012) Iran Census 2011 Positive
Ratio of men to women (RMW) (Kundak, 2005); (Zebardast, 2013) Iran Census 2011 Positive
Percent population without a disability (PWD)
(Cutter, et al., 2010); (Burton, 2012) Iran Census 2011 Positive
Percent of population with high education (PHE)
(Cutter, et al., 2010); (Burton, 2012) Iran Census 2011 Positive
Percent of the population with telephone access (PWT)
(Cutter, et al., 2010); (Burton, 2012) Tehran Urban HEART Study 2013
Positive
Percent population with health insurance (PWH)
(Cutter, et al., 2010); (Burton, 2012) Tehran Urban HEART Study 2013
Positive
Economic
Percent of homeownership (HO) (Norris, et al., 2008); (Cutter, et al., 2014)
Iran Census 2011 Positive

61
Percent of population that is employed (PE)
(Norris, et al., 2008); (Burton, 2012) Iran Census 2011 Positive
Percent of population above poverty line (APL)
(Cutter, et al., 2010); (Verrucci, et al., 2012)
Tehran Urban HEART Study 2013
Positive
Per capita household income (HI) (Cutter, et al., 2014); (Burton, 2012) Quality of life study in Tehran 2006
Positive
Ratio of large to small businesses (LSB) (Cutter, et al., 2014); (Burton, 2012) Iran Census 2011 Positive
Percent of skilled employees (SE) (Cutter, et al., 2014); (Burton, 2012) Iran Census 2011 Positive
Institutional
Number of disaster management bases (DMB)
(Cutter, et al., 2014); (Burton, 2012) TDMMO, Teharn 2014 Positive
Emergency response plane for the 1st 72 hours (ERP)
(Cutter, et al., 2014) TDMMO, Teharn 2014 Positive
Hausing/Infrastructural
Percent of urban deteriorated textures (UDT)
(Mileti, 1999); (Verrucci, et al., 2012) Urban Renewal Organization of Tehran 2014
Negative
Average number of rooms per dwelling (NRD)
(Zebardast, 2013) Iran Census 2011 Positive
Percent of Building density (BD) (JICA, 2000); (Verrucci, et al., 2012) Tehran Master Plan 2006 Negative
Number of resistant critical infrastructures (CIS)
(Norris, et al., 2008); (Verrucci, et al., 2012)
JICA 2000 Positive
Number of schools (NS) (Tierney & Bruneau, 2007); (Cutter, et al., 2014)
Organization for Development, Renovation & Equipping Schools of Iran 2014
Positive
Percent of non-built up areas (NBA) (Kundak, 2005); (Verrucci, et al., 2012) Tehran Master Plan 2006 Positive
Access to the hospitals (AH) (Cutter, et al., 2014); (Verrucci, et al., 2012)
Office of Physical Resources Development, Ministry of Health 2014
Positive
Access to the fire stations (AFS) (Verrucci, et al., 2012); (Burton, 2012) Tehran Municipality's Department of Planning and Architecture 2014
Positive
Access to the police stations (APS) (Verrucci, et al., 2012); (Burton, 2012) Islamic Republic of Iran Police Headquarter
Positive
Community capital
Percent of social trust (ST) (Cutter, et al., 2014); (Burton, 2012) Quality of life study in Tehran 2014
Positive
Satisfaction level of neighbourhood relation (LNR)
(Cutter, et al., 2014) Quality of life study in Tehran 2014
Positive
Percent population have belonging sense to the neighbourhood (BSN)
(Cutter, et al., 2014); (Burton, 2012) Quality of life study in Tehran 2014
Positive
Religious and cultural organizations (RCO)
(Cutter, et al., 2014); (Burton, 2012) Tehran Master Plan 2014 Positive
Satisfaction from local councils participation SLC)
(Cutter, et al., 2014); (Burton, 2012) Quality of life study in Tehran 2014
Positive
Ratio of entertainment and recreation land uses (REI) (Burton, 2012) Tehran Master Plan 2006 Positive
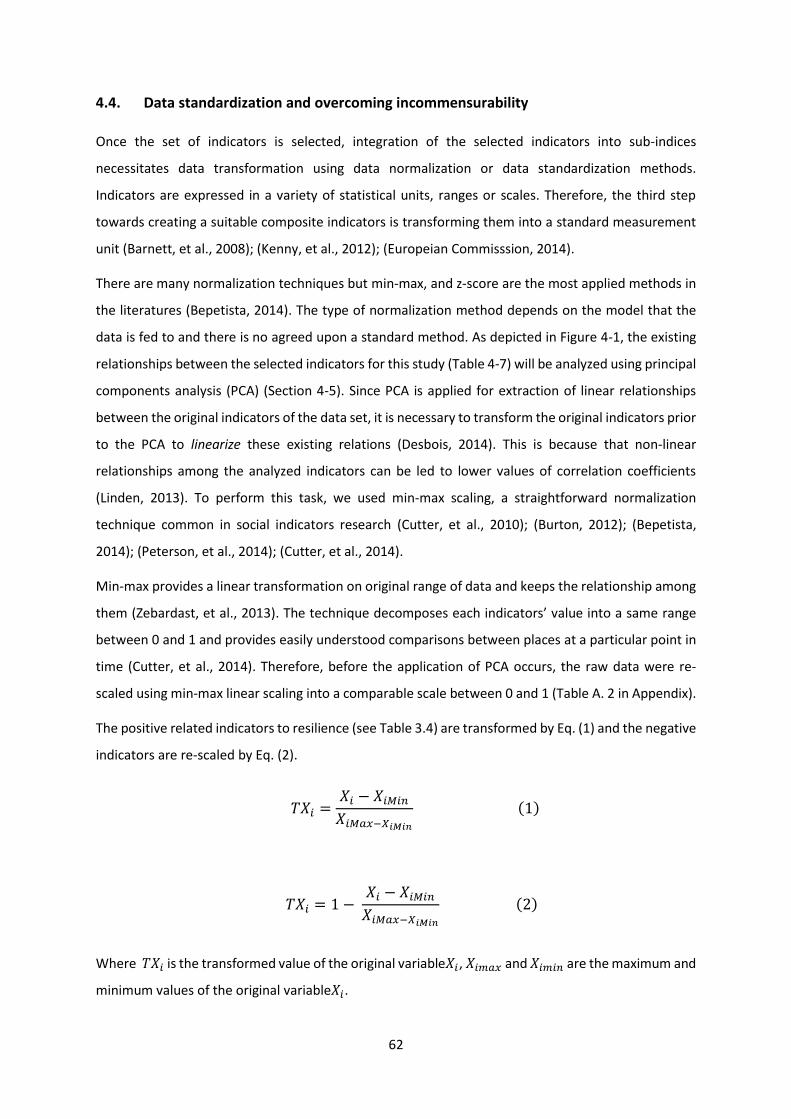
62
4.4. Data standardization and overcoming incommensurability
Once the set of indicators is selected, integration of the selected indicators into sub-indices
necessitates data transformation using data normalization or data standardization methods.
Indicators are expressed in a variety of statistical units, ranges or scales. Therefore, the third step
towards creating a suitable composite indicators is transforming them into a standard measurement
unit (Barnett, et al., 2008); (Kenny, et al., 2012); (Europeian Commisssion, 2014).
There are many normalization techniques but min-max, and z-score are the most applied methods in
the literatures (Bepetista, 2014). The type of normalization method depends on the model that the
data is fed to and there is no agreed upon a standard method. As depicted in Figure 4-1, the existing
relationships between the selected indicators for this study (Table 4-7) will be analyzed using principal
components analysis (PCA) (Section 4-5). Since PCA is applied for extraction of linear relationships
between the original indicators of the data set, it is necessary to transform the original indicators prior
to the PCA to linearize these existing relations (Desbois, 2014). This is because that non-linear
relationships among the analyzed indicators can be led to lower values of correlation coefficients
(Linden, 2013). To perform this task, we used min-max scaling, a straightforward normalization
technique common in social indicators research (Cutter, et al., 2010); (Burton, 2012); (Bepetista,
2014); (Peterson, et al., 2014); (Cutter, et al., 2014).
Min-max provides a linear transformation on original range of data and keeps the relationship among
them (Zebardast, et al., 2013). The technique decomposes each indicators’ value into a same range
between 0 and 1 and provides easily understood comparisons between places at a particular point in
time (Cutter, et al., 2014). Therefore, before the application of PCA occurs, the raw data were re-
scaled using min-max linear scaling into a comparable scale between 0 and 1 (Table A. 2 in Appendix).
The positive related indicators to resilience (see Table 3.4) are transformed by Eq. (1) and the negative
indicators are re-scaled by Eq. (2).
𝑇𝑋𝑖 =𝑋𝑖 − 𝑋𝑖𝑀𝑖𝑛
𝑋𝑖𝑀𝑎𝑥−𝑋𝑖𝑀𝑖𝑛
(1)
𝑇𝑋𝑖 = 1 − 𝑋𝑖 − 𝑋𝑖𝑀𝑖𝑛
𝑋𝑖𝑀𝑎𝑥−𝑋𝑖𝑀𝑖𝑛
(2)
Where 𝑇𝑋𝑖 is the transformed value of the original variable𝑋𝑖, 𝑋𝑖𝑚𝑎𝑥 and 𝑋𝑖𝑚𝑖𝑛 are the maximum and
minimum values of the original variable𝑋𝑖.

63
4.5. Components of disaster resilience (data reduction and identifying latent
dimensions)
After constructing the candidate indicators of disaster resilience, factor analysis (FA) is applied to
understand how these different indicators are associated to each other and how they change in
relation to each other (Europiean Commission, 2008); (Burton, 2012). Since there are different types
of indicators, there is a causal relationship between them. Some indicators are affected by some
others; some are more important than others. These links and feedbacks are hidden and without a
statistical method, it is very hard to understand this complex relationship. Factor analysis (FA) uses
correlations among many variables to sort correlated variables into a new set of clusters called factors
(Fabriger, et al., 1999). Its aim is to reduce the number of variables (indicators) and finding the
relationship between variables or classification of variables (Fekte, 2009); (Zebardast, 2013).
There exist two main type of factor analysis: exploratory factor analysis (EFA) and confirmatory factor
analysis (CFA). In EFA, the research has not idea about the number or nature of the indicators and as
the title shows, is exploratory in character. It allows a researcher to identify the latent component to
formulize a theory, or model from a relatively large set of latent constructs often represented by a set
of items (Williams, et al., 2012). While in CFA, the investigator just applies the model to examine a
developed theory or model and there is an expectation about the number of components, or which
component theories suit more fit (Williams, et al., 2012); (Zebardast, et al., 2013). Factor analysis is
used in this study as an exploratory tool to extract different dimensions of disaster resilience and to
identify the key indicators associated with these dimensions.
Exploratory factor analysis (EFA) is a widely utilized and broadly applied multivariate analytic
technique used to discover the hidden structure of a set of inter-correlated indicators (Wu & Zhang,
2006); (Costello & Osberne, 2005). It groups highly correlated variables that may be explaining the
same concept into primary components or factors. It is used to derive “a subset of uncorrelated
variables called factors that explain the variance observed in the original dataset” (Belkhiri, et al.,
2011, p. 539). In essence, EFA is used to data reduction and to extract different dimensions of
resilience that summarise disaster resilience characteristics. Furthermore, underlying (latent)
structures of indicators group can be considered to build a disaster resilience index at other spatial
scales (Cutter, et al., 2003).
However, EFA is a complex and multi-step process and some important assumptions need to be
considered before, during, and after its application. These are depicted and discussed in the following
chapter.
64
4.5.1. Data suitability
A number of issues need to be considered while attempting to apply a factor analysis. Sample size of
analysis is one of these issues but there is no consensus within literature (Hogarty, et al., 2005). There
are two classifications of general theories in terms of minimum sample size in factor analysis (Zaho,
2009). One category argues that the absolute number of cases (N) is important, while another says
that the subject-to-variable ratio (p) is important. However, most of literature argues that the sample
size must be greater than 200 and the ratio of cases to variables must be 5 to 1 or larger (Comrey,
1973); (Williams, et al., 2012); (Zebardast, et al., 2013). Regardless of the fact that there is no
agreement on the question of how many cases are necessary, the sample size of this study is the 368
urban neighborhoods of Tehran City which satisfied both the cases to variables ratio and the rule of
200 samples.
A factorability of the correlation matrix is another assumption needed for a factor analysis (Williams,
et al., 2012). Factorability is the assumption that there are at least some correlations among the
original indicators so that coherent factors can be extracted. Henson and Roberts (2006) argued that
a correlation matrix is the most preferred method among researchers. Therefore, for testing
factorability of the analysis, the anti-image correlation matrix diagonals (> 0.5) has been used in this
analysis (Field, 2000) (Table A.3 in Appendix).
Kaiser-Meyer-Olkin (KMO) Measure of Sampling Adequacy and Bartlett's Test of Sphericity have also
been performed to analyze the fitness of the relevant data for factor analysis. The KMO explains the
proportion of variance in the variables that might be caused by underlying factors. The KMO index
ranges from 0 to 1, with 0.50 considered suitable for factor analysis (Tabachnick & Fidell, 2007);
(Sharma, 1996). The Bartlett’s Test of Sphericity is used as a secondary test method to check the
relationship among variables and it examines whether the correlation between variables in the
population correlation matrix are uncorrelated or not. (Krishnan, 2010).
4.5.2. Type of factors extraction
The initial objective of EFA is to reach “at a more parsimonious conceptual understanding of a set of
measured variables by determining the number and nature of common factors needed to account for
the pattern of correlations among the measured variables” (Fabriger, et al., 1999, p. 274). This is
performed by identifying the number and character of common factors required to calculate the
pattern of correlations among the measured indicators. Therefore, extracting a set of uncorrelated
dimensions/factors is the second step that is done by multiple methods such as: principal components
analysis (PCA), principal axis factoring (PAF), image factoring, maximum likelihood, alpha factoring,
and canonical.

65
However, PCA is used most commonly in the published literature (Cutter, et al., 2003); (Fekte, 2009);
(Krishnan, 2010); (Zebardast, 2013); (Zhong, et al., 2014). PCA is mathematically defined as “as an
orthogonal linear transformation that transforms the data to a new coordinate system such that the
greatest variance by any projection of the data comes to lie on the first coordinate (called the first
principal component), the second greatest variance on the second coordinate, and so on” (Miciak,
2014, p. 497). Therefore, the goal of PCA is to explain correlations among measured variables and to
account the variance in the set of variables. These linear combination of variables are the new
dimensions of interested issue which are latent and have the primary variable set (Krishnan, 2010);
(Zebardast, et al., 2013)
4.5.3. Number of extracted factors (component)
The purpose of the data extraction is to reduce a large number of variables into specific factors (data
reduction). To determine the total number of factors/components to be extracted, several criteria are
available for researchers. Although there is no consensus by which criteria this process can be done,
scree test, cumulative percent of variance extracted, parallel analysis, and Kaiser’s criteria (eigenvalue
> 1 rule) are the four most famous criteria (Krishnan, 2010); (Bepetista, 2014). The latter is the most
considered criteria in the literature and represents the amount of variance of each extracted
component (Hummell, et al., 2016); (Zhong, et al., 2014); (Fekte, 2009); (Cutter, et al., 2003). In this
study, we used the Kaiser’s criteria to determine the total number of factors to be extracted. Based
on this rule, “only factors with eigenvalues greater than or equal to 1 are accepted as possible sources
of variance in the data, with the highest priority ascribed to the factor that has the highest eigenvector
sum” (Zebardast, et al., 2013, p. 1340).
4.5.4. Type of rotational method
While performing PCA, an indicator might tend to relate to more than a factor (component). The
solution for this problem is factor rotation. Rotation maximises high item loadings and minimises low
item loadings. Therefore it provides a more interpretable and simplified solution (Williams, et al.,
2012). There are two common rotation techniques: orthogonal rotation and oblique rotation. These
rotation methods are differentiated based on the type of extracted factors. While the extracted
components in orthogonal method are uncorrelated, oblique method allows them to be correlated.
There exist a number of methods for performing the both rotations. For instance, varimax and
quartimax for orthogonal rotation, and olbimin and promax for oblique rotation. The orthogonal
varimax rotation developed by Thompson (2004) is the most often used rotational technique in factor
analysis (Cutter, et al., 2003); (Zebardast, 2013); (Zhong, et al., 2014). The method “is a variance
maximizing strategy where the goal of rotation is to maximize the variance (variability) of the factor
(component), or put another way, to obtain a pattern of loadings on each factor that is as diverse as
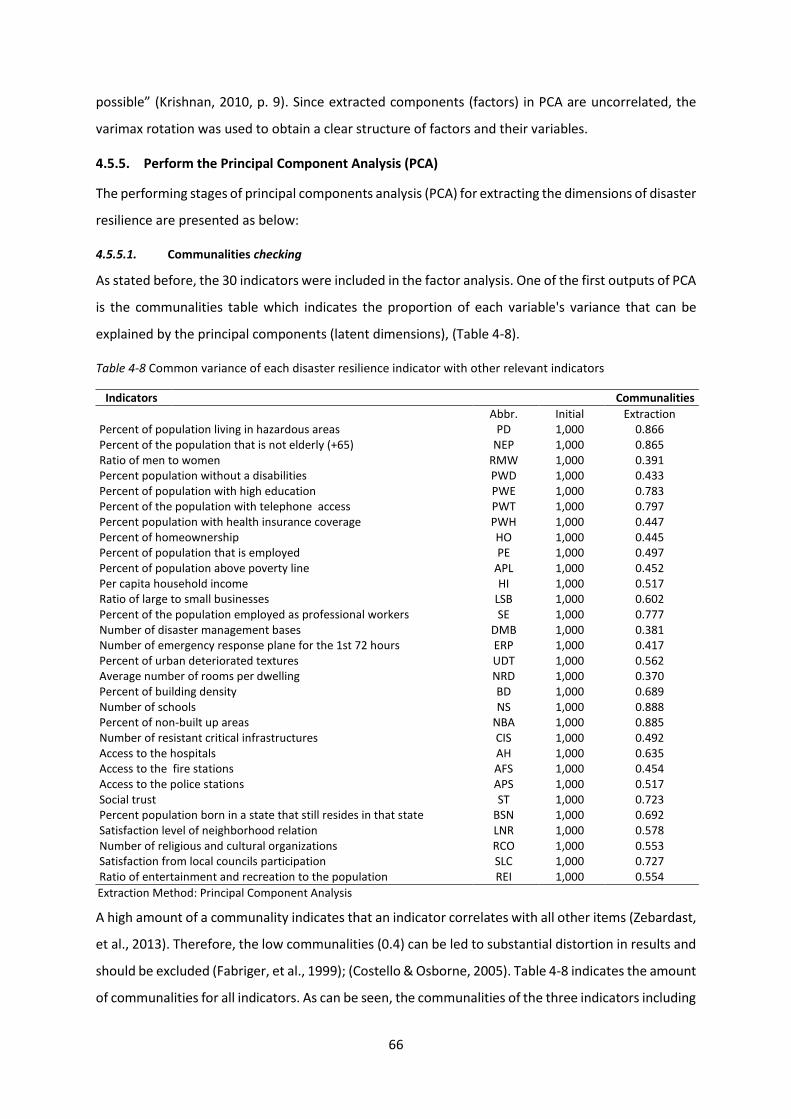
66
possible” (Krishnan, 2010, p. 9). Since extracted components (factors) in PCA are uncorrelated, the
varimax rotation was used to obtain a clear structure of factors and their variables.
4.5.5. Perform the Principal Component Analysis (PCA)
The performing stages of principal components analysis (PCA) for extracting the dimensions of disaster
resilience are presented as below:
4.5.5.1. Communalities checking
As stated before, the 30 indicators were included in the factor analysis. One of the first outputs of PCA
is the communalities table which indicates the proportion of each variable's variance that can be
explained by the principal components (latent dimensions), (Table 4-8).
Table 4-8 Common variance of each disaster resilience indicator with other relevant indicators
Indicators Communalities
Abbr. Initial Extraction Percent of population living in hazardous areas PD 1,000 0.866 Percent of the population that is not elderly (+65) NEP 1,000 0.865 Ratio of men to women RMW 1,000 0.391 Percent population without a disabilities PWD 1,000 0.433 Percent of population with high education PWE 1,000 0.783 Percent of the population with telephone access PWT 1,000 0.797 Percent population with health insurance coverage PWH 1,000 0.447 Percent of homeownership HO 1,000 0.445 Percent of population that is employed PE 1,000 0.497 Percent of population above poverty line APL 1,000 0.452 Per capita household income HI 1,000 0.517 Ratio of large to small businesses LSB 1,000 0.602 Percent of the population employed as professional workers SE 1,000 0.777 Number of disaster management bases DMB 1,000 0.381 Number of emergency response plane for the 1st 72 hours ERP 1,000 0.417 Percent of urban deteriorated textures UDT 1,000 0.562 Average number of rooms per dwelling NRD 1,000 0.370 Percent of building density BD 1,000 0.689 Number of schools NS 1,000 0.888 Percent of non-built up areas NBA 1,000 0.885 Number of resistant critical infrastructures CIS 1,000 0.492 Access to the hospitals AH 1,000 0.635 Access to the fire stations AFS 1,000 0.454 Access to the police stations APS 1,000 0.517 Social trust ST 1,000 0.723 Percent population born in a state that still resides in that state BSN 1,000 0.692 Satisfaction level of neighborhood relation LNR 1,000 0.578 Number of religious and cultural organizations RCO 1,000 0.553 Satisfaction from local councils participation SLC 1,000 0.727 Ratio of entertainment and recreation to the population REI 1,000 0.554
Extraction Method: Principal Component Analysis
A high amount of a communality indicates that an indicator correlates with all other items (Zebardast,
et al., 2013). Therefore, the low communalities (0.4) can be led to substantial distortion in results and
should be excluded (Fabriger, et al., 1999); (Costello & Osborne, 2005). Table 4-8 indicates the amount
of communalities for all indicators. As can be seen, the communalities of the three indicators including

67
the ratio of men to women, number of disaster management bases, and average number of rooms per
dwelling are less than 0.4 and they are excluded from the analysis.
4.5.5.2. Testing appropriateness of the data
The KMO index checks whether we can factorize the original indicators or not. The KMO values
changes between 0 and 1. “A value of 0 shows that the sum of partial correlations is large relative to
the sum of correlations, indicating diffusion in the pattern of correlations” (Field, 2005, p. 6) which
implies that conducted factor analysis is inappropriate. On contrary, a value close to 1 displays that
pattern of correlations is relatively well set and the analysis is reliable. The Kaiser-Meyer-Olkin
Measure of Sampling Adequacy (KMO) of 0.721 indicates that factor analysis is appropriate for the
data.
Bartlett’s measure tests the null hypothesis that the original correlation matrix is an identity matrix
(Field, 2000). If the correlation matrix was an identity matrix, then all correlations among indicators
tend to be zero and factor analysis cannot be applied for the dataset. The result of the Bartlett’s Test
of Sphericity tests showed a significance level of 0.00, a value that is small enough to reject the
hypothesis (the probability should be less than 0.05 to reject the null). Therefore, the obtained results
show that the degree of the relationship among indicators is strong or the correlation matrix is not an
identity matrix (Table 4-9).
Table 4-9 KMO measure of sampling adequacy and Bartlett's test of sphericity
KMO and Bartlett's Test
Kaiser-Meyer-Olkin Measure of Sampling Adequacy. 0.721
Bartlett's Test of Sphericity
Approx. Chi-Square 5545.042
df 351
Sig. 0.000
4.5.5.3. Total variance explained and the number extracted components
After testing the appropriateness of data for a factor analysis, the preliminary matrix is calculated
which contains the percent of variance accounted for by each principal component (Table 4-10). In
essence, the aim of PCA is to explain as much of the variance of observed indicators in the data set as
possible using few composite indicators. Since PCA summarises the information in a correlation
matrix, “the total amount of variance in the correlation matrix can be calculated by adding the values
on the diagonal: as each element on the diagonal has a value of 1, the total amount of variance also
corresponds to the number of observed variables” (Seva, 2013, p. 5). The total amount of variance in
the data set is 27 (the number of indicators). This total amount of variance can be divided into different
parts where each part demonstrates the variance of each component (Table 4-10). The presented
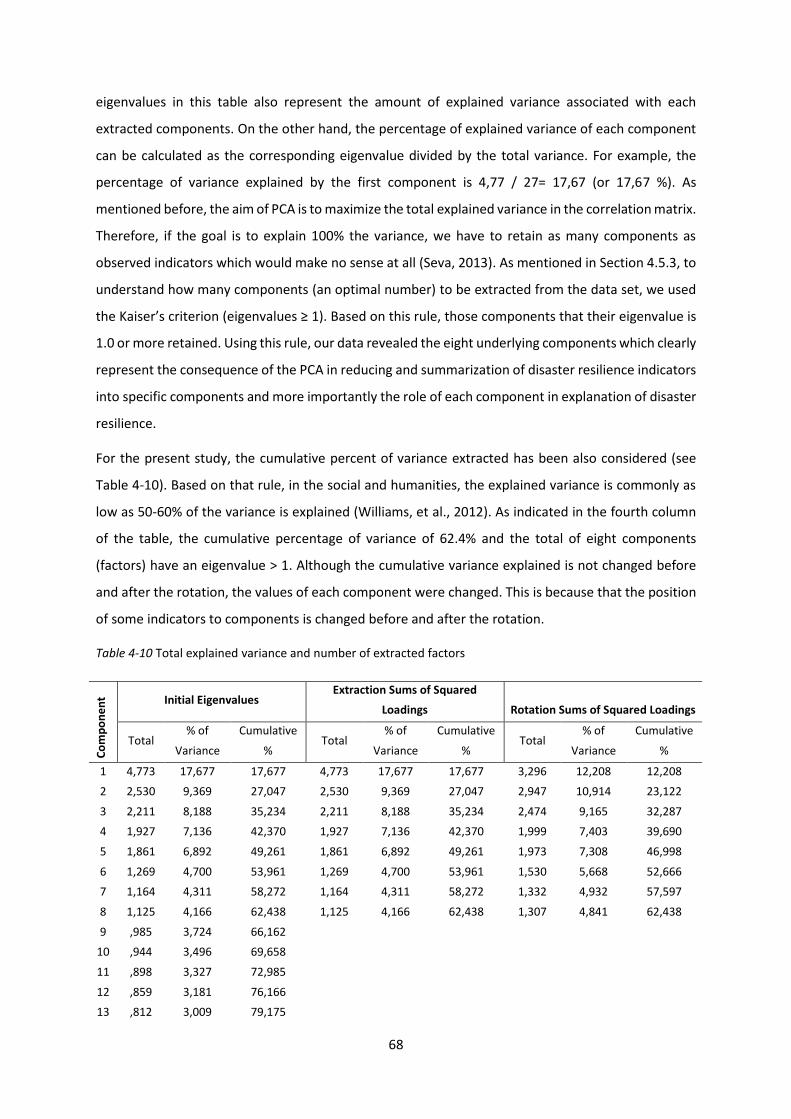
68
eigenvalues in this table also represent the amount of explained variance associated with each
extracted components. On the other hand, the percentage of explained variance of each component
can be calculated as the corresponding eigenvalue divided by the total variance. For example, the
percentage of variance explained by the first component is 4,77 / 27= 17,67 (or 17,67 %). As
mentioned before, the aim of PCA is to maximize the total explained variance in the correlation matrix.
Therefore, if the goal is to explain 100% the variance, we have to retain as many components as
observed indicators which would make no sense at all (Seva, 2013). As mentioned in Section 4.5.3, to
understand how many components (an optimal number) to be extracted from the data set, we used
the Kaiser’s criterion (eigenvalues ≥ 1). Based on this rule, those components that their eigenvalue is
1.0 or more retained. Using this rule, our data revealed the eight underlying components which clearly
represent the consequence of the PCA in reducing and summarization of disaster resilience indicators
into specific components and more importantly the role of each component in explanation of disaster
resilience.
For the present study, the cumulative percent of variance extracted has been also considered (see
Table 4-10). Based on that rule, in the social and humanities, the explained variance is commonly as
low as 50-60% of the variance is explained (Williams, et al., 2012). As indicated in the fourth column
of the table, the cumulative percentage of variance of 62.4% and the total of eight components
(factors) have an eigenvalue > 1. Although the cumulative variance explained is not changed before
and after the rotation, the values of each component were changed. This is because that the position
of some indicators to components is changed before and after the rotation.
Table 4-10 Total explained variance and number of extracted factors
Co
mp
on
en
t Initial Eigenvalues Extraction Sums of Squared
Loadings Rotation Sums of Squared Loadings
Total % of
Variance
Cumulative
% Total
% of
Variance
Cumulative
% Total
% of
Variance
Cumulative
%
1 4,773 17,677 17,677 4,773 17,677 17,677 3,296 12,208 12,208
2 2,530 9,369 27,047 2,530 9,369 27,047 2,947 10,914 23,122
3 2,211 8,188 35,234 2,211 8,188 35,234 2,474 9,165 32,287
4 1,927 7,136 42,370 1,927 7,136 42,370 1,999 7,403 39,690
5 1,861 6,892 49,261 1,861 6,892 49,261 1,973 7,308 46,998
6 1,269 4,700 53,961 1,269 4,700 53,961 1,530 5,668 52,666
7 1,164 4,311 58,272 1,164 4,311 58,272 1,332 4,932 57,597
8 1,125 4,166 62,438 1,125 4,166 62,438 1,307 4,841 62,438
9 ,985 3,724 66,162
10 ,944 3,496 69,658
11 ,898 3,327 72,985
12 ,859 3,181 76,166
13 ,812 3,009 79,175

69
Extraction method: Principal Component Analysis
4.5.5.4. Rotated component matrix and factor loadings
Another issues during factor extraction is the problem to interpret and name the components that are
usually performed based on their factor loadings. In PCA, the first component (factor) computes the
maximum part of the variance. (Krishnan, 2010). This means that “most variables have high loadings
on the most important factor, and small loadings on all other factors” (Field, 2000, p. 438). Therefore,
explanation of the extracted components may be very hard task. However, a solution for this difficulty
is factor rotation (Costello & Osberne, 2005); (Williams, et al., 2012); (Bepetista, 2014). Factor rotation
changes the pattern of the factor loadings and hence improves interpretation. As mentioned, there
are multiple rotation methods within SPSS but as Field (2000, p. 439) states, “the choice of rotation
depends on whether there is a good theoretical reason to suppose that the factors should be related
or independent, and also how the variables cluster on the factors before rotation”.
As explained before, extracted components in principle component analysis (PCA) are independent
(uncorrelated). Therefore, it is necessary to use an orthogonal rotation technique (see section 4.5.4).
By using varimax rotation, the rotated component matrix is obtained which is the key output of
principal components analysis. It contains estimates of the correlations between each of the variables
(factor loading) and the estimated components. These factor loadings are important for the
interpretation of the factors, especially the high ones. Because they represent how much a factor
explains a variable in factor analysis. In rotated component matrix, a variable is assigned to a specific
factor where it had the highest loading with that factor. Therefore, based on the results of FA, the
initial set of 27 disaster resilience variables were reduced to the eight underlying factors. The variables
in each factor provide a heuristic suggestion of a label signifying a different dimension of disaster
resilience. We have also deliberately removed variables that their factor loading is less than 0.4, this
is because to increase the pattern correlations of variables and components (Zebardast, et al., 2013).
14 ,738 2,734 81,909
15 ,635 2,350 84,260
16 ,612 2,265 86,525
17 ,581 2,150 88,675
18 ,520 1,927 90,602
19 ,473 1,751 92,353
20 ,453 1,678 94,031
21 ,399 1,477 95,508
22 ,378 1,398 96,907
23 ,339 1,254 98,161
24 ,240 ,889 99,050
25 ,150 ,556 99,605
26 ,106 ,393 99,998
27 ,001 ,002 100,000
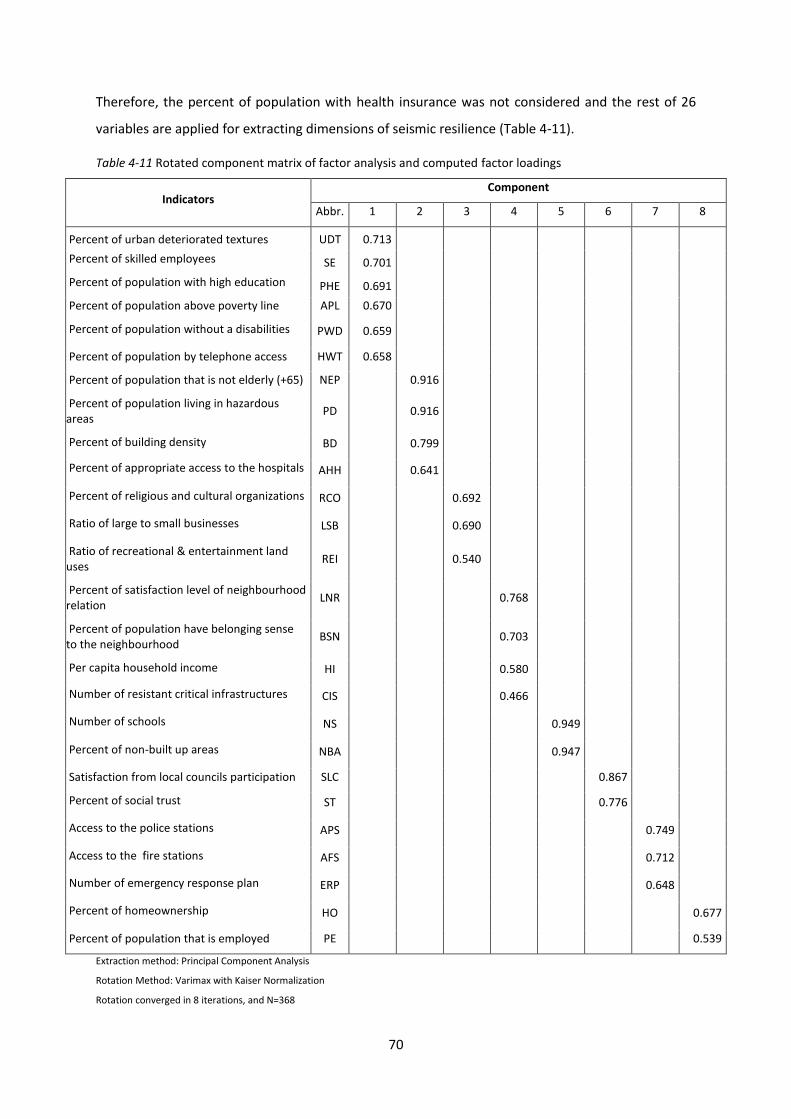
70
Therefore, the percent of population with health insurance was not considered and the rest of 26
variables are applied for extracting dimensions of seismic resilience (Table 4-11).
Table 4-11 Rotated component matrix of factor analysis and computed factor loadings
Indicators Component
Abbr. 1 2 3 4 5 6 7 8
Percent of urban deteriorated textures UDT 0.713
Percent of skilled employees SE 0.701
Percent of population with high education PHE 0.691
Percent of population above poverty line APL 0.670
Percent of population without a disabilities PWD 0.659
Percent of population by telephone access HWT 0.658
Percent of population that is not elderly (+65) NEP 0.916
Percent of population living in hazardous areas
PD 0.916
Percent of building density BD 0.799
Percent of appropriate access to the hospitals AHH 0.641
Percent of religious and cultural organizations RCO 0.692
Ratio of large to small businesses LSB 0.690
Ratio of recreational & entertainment land uses
REI 0.540
Percent of satisfaction level of neighbourhood relation
LNR 0.768
Percent of population have belonging sense to the neighbourhood
BSN 0.703
Per capita household income HI 0.580
Number of resistant critical infrastructures CIS 0.466
Number of schools NS 0.949
Percent of non-built up areas NBA 0.947
Satisfaction from local councils participation SLC 0.867
Percent of social trust ST 0.776
Access to the police stations APS 0.749
Access to the fire stations AFS 0.712
Number of emergency response plan ERP 0.648
Percent of homeownership HO 0.677
Percent of population that is employed PE 0.539
Extraction method: Principal Component Analysis
Rotation Method: Varimax with Kaiser Normalization
Rotation converged in 8 iterations, and N=368

71
4.5.5.5. Labelling extracted components
The main aim of the rotated component matrix is to transform correlated indicators into a new set of
uncorrelated components. These components (dimensions) are the best linear combination of
considered indicators which explains the most variance in the data set than other linear combinations
(Fabriger, et al., 1999). Therefore, the first component here, is the best linear combination among the
data and captures most of variance. The second component is the second best combination and
extracts the maximum variance from the residual variance. Similarly, other disaster resilience
components are extracted so that total variance of the data to be explained.
Based on the rotated component matrix (after eight rotation), the eight components/factors of
disaster resilience have been identified in the study area. On the other hand, the factor analysis of 27
variables uncovers the eight latent factors that describe relationships between all variables to 62.4%
of cumulative variance. The next step is to labelling of these components. The labelling of factors is a
subjective, theoretical, and inductive process (Williams, et al., 2012); (Zebardast, et al., 2013). Since
the reason of a systematic factor analysis is to find those factors that explain the majority of responses,
therefore, the title of the factors presented in the first column of Table 4-12 were given based on the
descriptive approach reflecting the nature of the items that belong to them. For instance, the first
extracted component (factor) is mostly linked with social dynamic capacities within and between the
urban neighborhoods and quality of the urban textures. This component suggests that neighborhoods
with high skilled employees, high education, above poverty line, and telephone assess presumably
display greater resilience than neighborhoods without these characteristics. Similarly, neighborhoods
that have low percentage of disabled people and deteriorated urban textures may also demonstrate
higher levels of disaster resilience. Therefore, based on the primary indicators of the component and
the purpose of the study, this component is entitled built environment and social dynamic.
The second component includes not elderly population, population density, building density, and an
appropriate access to health centers. These indicators provide a measure weather the local land use
planning and demographic characteristics enhance or diminish resilience of the neighborhoods. Thus,
this dimension was named urban land use and dependent population. The other components have
also been named mostly based on their primary indicators set and also the purpose of the study (see
Table 4-12).
However, factor analysis was performed in this study to achieve the pattern of correlation among the
selected indicators and to reduce many indicators to the specific underlying factors called disaster
resilience dimensions. These components are the latent dimensions of disaster resilience at the case
study scale and along with their primary indicator set will be utilized to measured and also visualize
the level of resilience at the study area.

72
Table 4-12 New dimensions of disaster resilience and their primary indicators after PCA
Disaster resilience dimensions (extracted components)
Total Variance (%)
Primary Variables Abbr.
1. Built environment & Social dynamics
12,204
Percent of urban deteriorated textures Percent of the skilled employees Percent of population with high education Percent of population above poverty line Percent of population without disabilities Percent of housing with telephone access
UDT SE
PHE APL
PWD HWT
2. Urban land use & Dependent Population
10,914
Percent of population that are not elderly Percent of population living in hazardous areas Percent of building density Appropriate siting of hospitals and health centres
NEP PD BD
AHH
3. Socio-cultural capacity 9,165
Number of religious and cultural land uses Ratio of large to small business Ratio of recreational and entertainment land uses
RCO LSB REI
4. Life quality 7,403
Percent Satisfaction level of neighbourhood relation Percent population have belonging sense to the neighbourhood Per capita household income Critical resistant infrastructure
LNR
BSN HI CIS
5. Open space
7,308 Number of schools Percent of non-built-up areas
NS NBA
6. Social capital 5,668 Percent of Satisfaction from local councils Percent of Social trust
SLC ST
7. Emergency Infrastructure 4,932
Access to the police stations Access to the fire station Number of emergency response plan
APS AFS ERP
8. Economic structure
4,841 Percent of homeownership Percent of population that are employed
HO PE
Cumulative variance 62,43 %

73
4.6. Weighting and aggregation of indicators
Although there exist a number of methods for weighting and aggregating components in the process
of composite indicator building, this step is a controversial issue and mostly referenced as a serious
problem in the disaster resilience measurement (Adger, et al., 2004); (Reygel, et al., 2006); (Cutter, et
al., 2014); (Zebardast, 2013). In general, the utilized methods in related studies are classified in two
types: equal weighting, and unequal weighting. When an investigator does not have a significant
knowledge about the interactions among the different indicators and the trade of between them are
not fully perceived, an equal weighting is usually applied (Cutter, et al., 2014); (Bepetista, 2014).
Whereas, the unequal or differential weighting can be utilized when there is considerable knowledge
about the relative importance of indicators or of the trade-offs between them (Zebardast, 2013);
(Tate, 2013). Resilience is a multifaceted concept and different criteria could affect a community in
different manner. Hence, an equal weighting of indicators cannot lead to a realistic result.
Furthermore, when “an index synthesizes multiple dimensions, assignment of equal weights to
individual indicators will lead to unequal weighting of index dimensions if the number of individual
indicators in each dimension differs” (Bepetista, 2014, p. 17).
Assigning differential weighting or unequal weighting can be performed by normative, data-driven,
and hybrid approaches (Decancq & Lugo, 2013). Normative methods include use a participatory
method such as expert argument, stakeholder decision, and public opinion survey (Booysen, 2002);
(Decancq & Lugo, 2013). Multi - criteria decision making (MCDM) methods such as analytic hierarchical
process (AHP) and analytic network process (ANP) belong to this category which use the pairwise
comparisons among many criteria using expert judgments. This is one of the most important
limitations of the MCDMs, because the judgement of experts may differ for a same issue, where the
inconsistency check should be done (Zebardast, 2013). The second method of unequal weighting is
data-driven methods. Data-driven is a differential weighting procedures which apply mostly statistical
methods such as principal component analysis (PCA). However, the use of a correlation-based PCA
may produce weights that are similar to equal weighting (Nguefack-Tsague, et al., 2011).
The third method of unequal weighting is the hybrid approaches which include both data-driven and
normative methods and covers difficulties associated with them. The hybrid factor analysis (FA) and
analytic network process (ANP) is the applied approach in this study to overcome one of the inherent
limitations of other statistical methods such as AHP, ANP, and FA. F’ANP was first introduced by
Zebardast (2013) to measure social vulnerability in Iran and uses factor analysis (FA) to extract the
underlying dimensions of the phenomenon (disaster resilience), and then these identified dimensions
and their primary variables are entered into a network model in analytic network process (ANP). The
ANP is used to calculate the relative importance (weight) of different indicators of the subject matter,
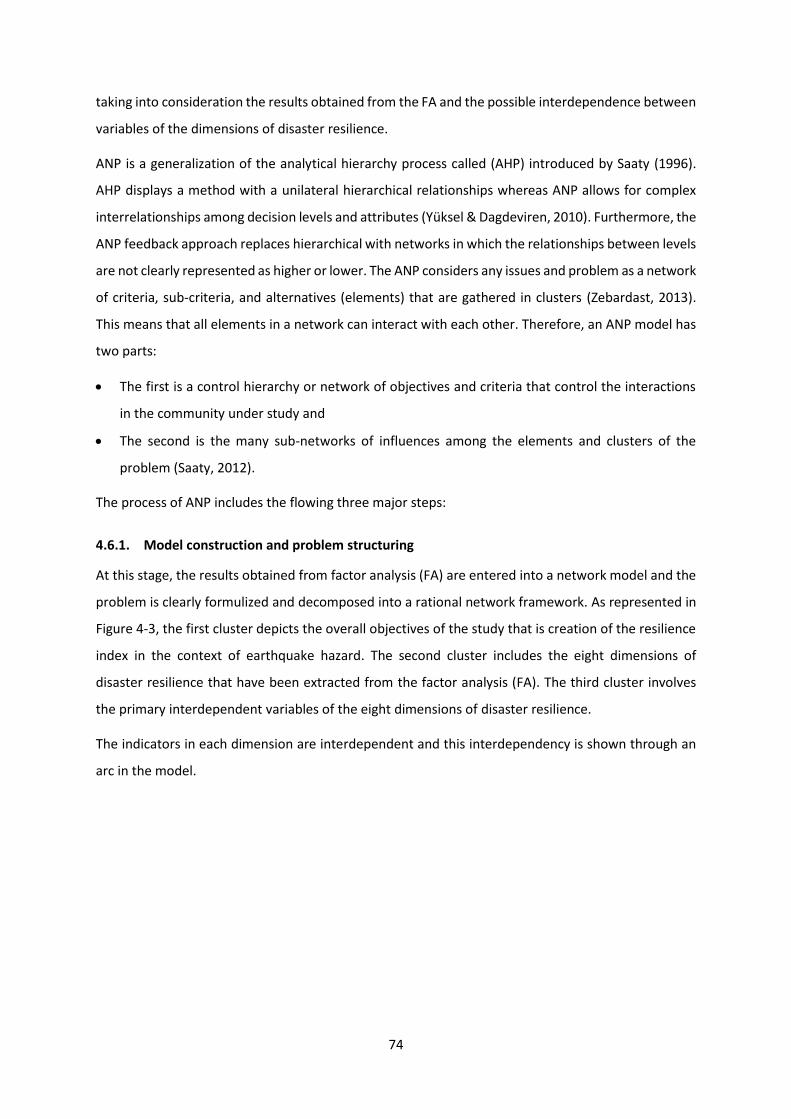
74
taking into consideration the results obtained from the FA and the possible interdependence between
variables of the dimensions of disaster resilience.
ANP is a generalization of the analytical hierarchy process called (AHP) introduced by Saaty (1996).
AHP displays a method with a unilateral hierarchical relationships whereas ANP allows for complex
interrelationships among decision levels and attributes (Yüksel & Dagdeviren, 2010). Furthermore, the
ANP feedback approach replaces hierarchical with networks in which the relationships between levels
are not clearly represented as higher or lower. The ANP considers any issues and problem as a network
of criteria, sub-criteria, and alternatives (elements) that are gathered in clusters (Zebardast, 2013).
This means that all elements in a network can interact with each other. Therefore, an ANP model has
two parts:
The first is a control hierarchy or network of objectives and criteria that control the interactions
in the community under study and
The second is the many sub-networks of influences among the elements and clusters of the
problem (Saaty, 2012).
The process of ANP includes the flowing three major steps:
4.6.1. Model construction and problem structuring
At this stage, the results obtained from factor analysis (FA) are entered into a network model and the
problem is clearly formulized and decomposed into a rational network framework. As represented in
Figure 4-3, the first cluster depicts the overall objectives of the study that is creation of the resilience
index in the context of earthquake hazard. The second cluster includes the eight dimensions of
disaster resilience that have been extracted from the factor analysis (FA). The third cluster involves
the primary interdependent variables of the eight dimensions of disaster resilience.
The indicators in each dimension are interdependent and this interdependency is shown through an
arc in the model.

75
Figure 4-3 Analytic network process (ANP) of the model to construct disaster resilience indicators
Dimensions
Variables of dimensions
Goal

76
4.6.2. Formation of the primary super matrix
The second step after constructing the network model is pair-wise comparison between the decision
making elements of the network to form super matrix. The concept of super matrix is similar to the
Markov chain process (Yazgun & Ustun, 2011). In essence, the formation of super matrix within ANP
is done for accurately understanding of the interdependencies and feedbacks that exist between the
elements of the system (Meade & Presley, 2002).
The initial super matrix for the proposed network (a 35 ×35) with three levels is as follows:
Table 4-13 Elements of the super matrix
Goal Dimensions Indicators
Goal 0 0 0
Dimensions [w21]8x1 0 0
Indicators 0 [w32]26×8 [w33]26×26
Where 𝒘𝟐𝟏 is a vector which represents the impact of the goal on disaster resilience (DR) dimensions.
𝒘𝟑𝟐 is a matrix that denotes the impact of DR dimensions on the indicators of DR, and 𝒘𝟑𝟑 is the
matrix shows the inner dependence (interdependence) among the indicators of DR (see Figure 4-3). It
should be noted that in usual ANP the rate of relative importance of each component is determined
by scale 1-9 which indicates equal preference to complete preferred. In this study, to carry out pair-
wise comparison between the decision elements of the network and to form the super matrix, instead
of expert judgments, absolute measurements obtained through the FA part of the model are used in
the following manner:
4.6.2.1. Interactions between the goal and DR dimensions or vector [w21 ]
The vector [w21] represents the impact of the goal on disaster resilience (DR) dimensions. Here, the
goal is constructing a composite disaster resilience indicator (Figure 4-3). As explained before, rather
expert’s judgements, it is made based on the amount of variance that each factor (DR dimension)
explains. Once this comparisons are completed, the corresponding local priority vector or [w21] is
computed as shown in the Table 4-13.
All the pair-wise comparisons and calculations are performed using the decision making software
(www.superdecisions.com) (Figure B.1 in Appendix). The calculation of weighting in ANP is based on
the evaluation of eigenvector (Zebardast, 2013). However, the coefficient importance of the eight
disaster resilience factors (dimensions), can be estimated by normalization of the total variance
explained (Table 4-13). For example, in the pair-wise matrix of [A21], the 𝒂𝟏𝟐 is calculated by dividing
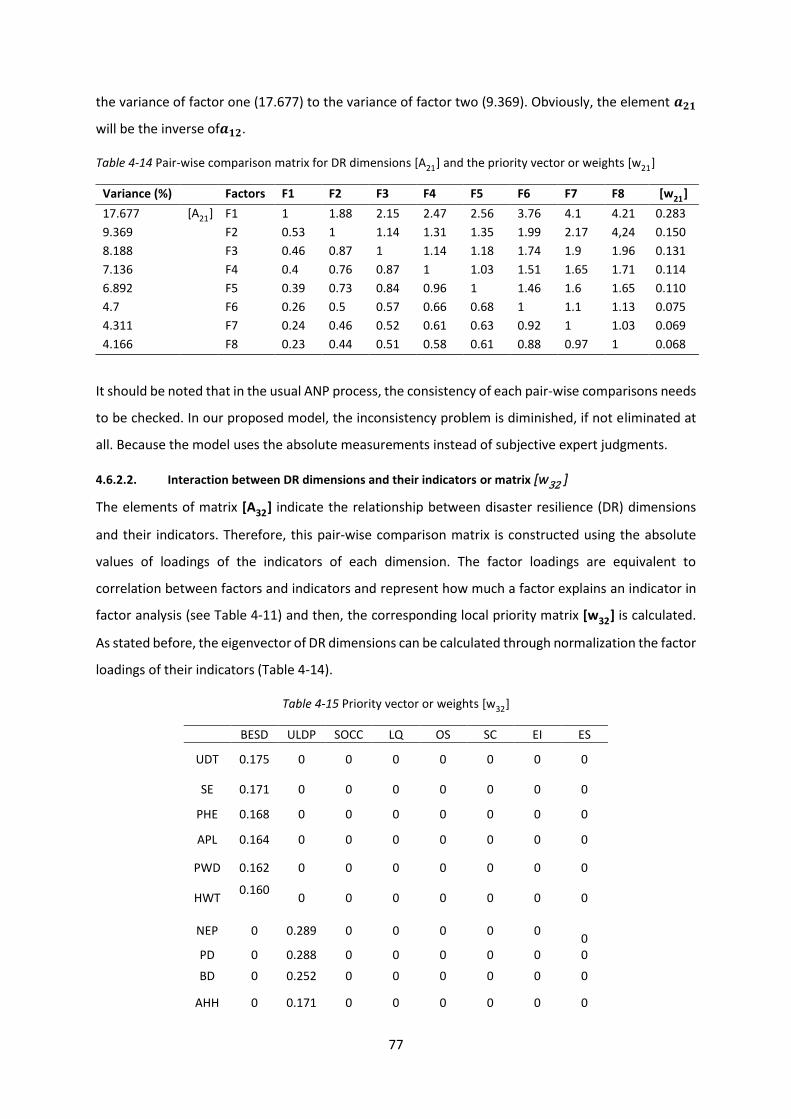
77
the variance of factor one (17.677) to the variance of factor two (9.369). Obviously, the element 𝒂𝟐𝟏
will be the inverse of𝒂𝟏𝟐.
Table 4-14 Pair-wise comparison matrix for DR dimensions [A21] and the priority vector or weights [w21]
Variance (%) Factors F1 F2 F3 F4 F5 F6 F7 F8 [w21]
17.677 [A21] F1 1 1.88 2.15 2.47 2.56 3.76 4.1 4.21 0.283
9.369 F2 0.53 1 1.14 1.31 1.35 1.99 2.17 4,24 0.150
8.188 F3 0.46 0.87 1 1.14 1.18 1.74 1.9 1.96 0.131
7.136 F4 0.4 0.76 0.87 1 1.03 1.51 1.65 1.71 0.114
6.892 F5 0.39 0.73 0.84 0.96 1 1.46 1.6 1.65 0.110
4.7 F6 0.26 0.5 0.57 0.66 0.68 1 1.1 1.13 0.075
4.311 F7 0.24 0.46 0.52 0.61 0.63 0.92 1 1.03 0.069
4.166 F8 0.23 0.44 0.51 0.58 0.61 0.88 0.97 1 0.068
It should be noted that in the usual ANP process, the consistency of each pair-wise comparisons needs
to be checked. In our proposed model, the inconsistency problem is diminished, if not eliminated at
all. Because the model uses the absolute measurements instead of subjective expert judgments.
4.6.2.2. Interaction between DR dimensions and their indicators or matrix [w32 ]
The elements of matrix [A32] indicate the relationship between disaster resilience (DR) dimensions
and their indicators. Therefore, this pair-wise comparison matrix is constructed using the absolute
values of loadings of the indicators of each dimension. The factor loadings are equivalent to
correlation between factors and indicators and represent how much a factor explains an indicator in
factor analysis (see Table 4-11) and then, the corresponding local priority matrix [w32] is calculated.
As stated before, the eigenvector of DR dimensions can be calculated through normalization the factor
loadings of their indicators (Table 4-14).
Table 4-15 Priority vector or weights [w32]
BESD ULDP SOCC LQ OS SC EI ES
UDT 0.175 0 0 0 0 0 0 0
SE 0.171 0 0 0 0 0 0 0
PHE 0.168 0 0 0 0 0 0 0
APL 0.164 0 0 0 0 0 0 0
PWD 0.162 0 0 0 0 0 0 0
HWT 0.160
0 0 0 0 0 0 0
NEP 0 0.289 0 0 0 0 0
0 PD 0 0.288 0 0 0 0 0 0
BD 0 0.252 0 0 0 0 0 0
AHH 0 0.171 0 0 0 0 0 0

78
RCO 0 0 0.360 0 0 0 0 0
LSB 0 0 0.359 0 0 0 0 0
REI 0 0 0.281 0 0 0 0 0
LNR 0 0 0 0.304 0 0 0 0
BSN 0 0 0 0.279 0 0 0 0
HI 0 0 0 0.231 0 0 0 0
CRI 0 0 0 0.186 0 0 0 0
NS 0 0 0 0 0.501 0 0 0
NBA 0 0 0 0 0.499 0 0 0
SLC 0 0 0 0 0 0.527 0 0
ST 0 0 0 0 0 0.473 0 0
APS 0 0 0 0 0 0 0.355 0
AFS 0 0 0 0 0 0 0.337 0
ERP 0 0 0 0 0 0 0.308 0
HO 0 0 0 0 0 0 0 0.556
PE 0 0 0 0 0 0 0 0.444
4.6.2.3. Interactions between variables in each DR or matrix [w33 ]
The elements of the matrix [A33] indicate the inner interdependencies of the indicators in each DR
dimension. For determining the interdependency between the indicators of each disaster resilience
dimension or factor, first a correlation analysis among the variables of each dimension is done
separately. Those indicators in each dimension that are significantly related to one other (p = 0.01),
are considered to be interdependent. Then the absolute values of coefficients of correlation for these
interdependent indicators are used as their degree of importance in constructing their respective pair-
wise comparison matrices. After completion of the pair-wise comparison matrices, its local priority
matrix [w33] is obtained. The Table 4-15 indicates the correlation of the indicators in first DR dimension
(built environment & social dynamic) and then their weights are presented in Table 4-16.
Table 4-16 Correlation coefficients of the indicators of the first DR dimension
UDT SE PHE APL PWD HWT
UDT 1 0.318 0.349 0.330 0.310 0.244
SE 0.318 1 0.614 0.308 0.394 0.853
PHE 0.349 0.614 1 0.321 0.462 0.670
APL 0.330 0.308 0.321 1 0.237 0.354
PWD 0.310 0.394 0.462 0.237 1 0.394
HWT 0.244 0.853 0.670 0.354 0.394 1

79
Table 4-17 Importance coefficient of the indicators of the first DR dimension
UDT SE PHE APL PWD HWT
UDT 0.392 0.091 0.102 0.129 0.110 0.069
SE 0.125 0.286 0.179 0.121 0.141 0.243
PHE 0.136 0.177 0.294 0.125 0.165 0.190
APL 0.129 0,089 0.093 0.393 0.085 0.101
PWD 0.122 0.113 0.136 0,093 0.357 0.113
HWT 0.096 0.244 0,196 0.139 0.141 0.284
Similarly, Table 4-17 indicates the correlation of the indicators in the second DR dimension (Urban
land use & dependent population) and then their weights are presented in Table 4-18.
Table 4-18 Correlation coefficients of the indicators of the second DR dimension
NEP PD BD AHH
NEP 1 0.999 0.272 0.467
PD 0.999 1 0.268 0.465
BD 0.272 0.268 1 0.098
AHH 0.467 0.465 0.98 1
Table 4-19 Importance coefficient of the indicators of the second DR dimension
NEP PD BD AHH
NEP 0.365 0.0363 0.164 0.228
PD 0.363 0.365 0.163 0.229
BD 0.118 0.102 0.606 0.054
AHH 0.169 0.170 0.067 0.489
The coefficients importance of other DR dimensions are calculated in same the way and then entered
into an unweighted-priority super matrix. The super matrix is actually a partitioned matrix, where each
matrix segment represents a relationship between two clusters or components in a system (Saaty,
1996) (see Table A.4 in Appendix).
4.6.2.4. Final relative weight of disaster resilience indicators
After constructing the super matrix, the limit super matrix is calculated by raising the weighted super
matrix to a power of an arbitrary large number. When the column of numbers is the same for every
column, the limit matrix has been reached and the matrix multiplication process is halted. The goal
column of this limit super matrix displays the absolute value of relative importance (weight) of
individual disaster resilience indicators (see the goal column in Table 4-19).
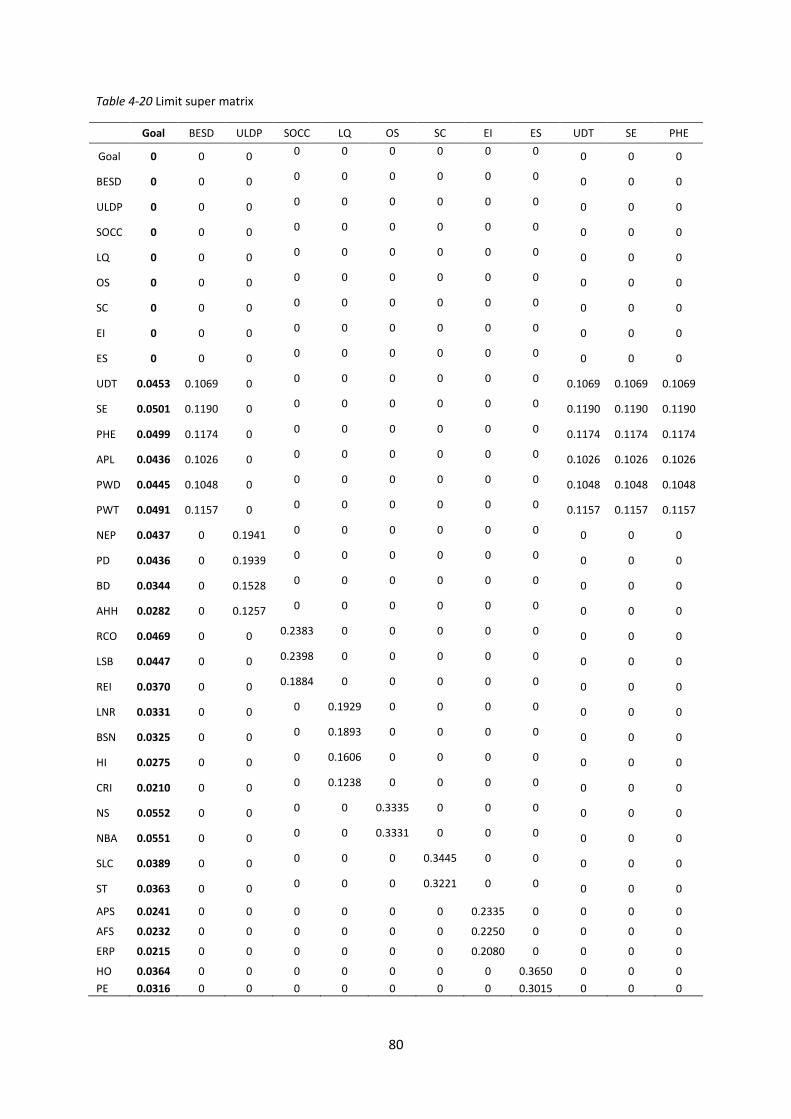
80
Table 4-20 Limit super matrix
Goal BESD ULDP SOCC LQ OS SC EI ES UDT SE PHE
Goal 0 0 0 0 0 0 0 0 0 0 0 0
BESD 0 0 0 0 0 0 0 0 0 0 0 0
ULDP 0 0 0 0 0 0 0 0 0 0 0 0
SOCC 0 0 0 0 0 0 0 0 0 0 0 0
LQ 0 0 0 0 0 0 0 0 0 0 0 0
OS 0 0 0 0 0 0 0 0 0 0 0 0
SC 0 0 0 0 0 0 0 0 0 0 0 0
EI 0 0 0 0 0 0 0 0 0 0 0 0
ES 0 0 0 0 0 0 0 0 0 0 0 0
UDT 0.0453 0.1069 0 0 0 0 0 0 0 0.1069 0.1069 0.1069
SE 0.0501 0.1190 0 0 0 0 0 0 0 0.1190 0.1190 0.1190
PHE 0.0499 0.1174 0 0 0 0 0 0 0 0.1174 0.1174 0.1174
APL 0.0436 0.1026 0 0 0 0 0 0 0 0.1026 0.1026 0.1026
PWD 0.0445 0.1048 0 0 0 0 0 0 0 0.1048 0.1048 0.1048
PWT 0.0491 0.1157 0 0 0 0 0 0 0 0.1157 0.1157 0.1157
NEP 0.0437 0 0.1941 0 0 0 0 0 0 0 0 0
PD 0.0436 0 0.1939 0 0 0 0 0 0 0 0 0
BD 0.0344 0 0.1528 0 0 0 0 0 0 0 0 0
AHH 0.0282 0 0.1257 0 0 0 0 0 0 0 0 0
RCO 0.0469 0 0 0.2383 0 0 0 0 0 0 0 0
LSB 0.0447 0 0 0.2398 0 0 0 0 0 0 0 0
REI 0.0370 0 0 0.1884 0 0 0 0 0 0 0 0
LNR 0.0331 0 0 0 0.1929 0 0 0 0 0 0 0
BSN 0.0325 0 0 0 0.1893 0 0 0 0 0 0 0
HI 0.0275 0 0 0 0.1606 0 0 0 0 0 0 0
CRI 0.0210 0 0 0 0.1238 0 0 0 0 0 0 0
NS 0.0552 0 0 0 0 0.3335 0 0 0 0 0 0
NBA 0.0551 0 0 0 0 0.3331 0 0 0 0 0 0
SLC 0.0389 0 0 0 0 0 0.3445 0 0 0 0 0
ST 0.0363 0 0 0 0 0 0.3221 0 0 0 0 0
APS 0.0241 0 0 0 0 0 0 0.2335 0 0 0 0
AFS 0.0232 0 0 0 0 0 0 0.2250 0 0 0 0
ERP 0.0215 0 0 0 0 0 0 0.2080 0 0 0 0
HO 0.0364 0 0 0 0 0 0 0 0.3650 0 0 0
PE 0.0316 0 0 0 0 0 0 0 0.3015 0 0 0
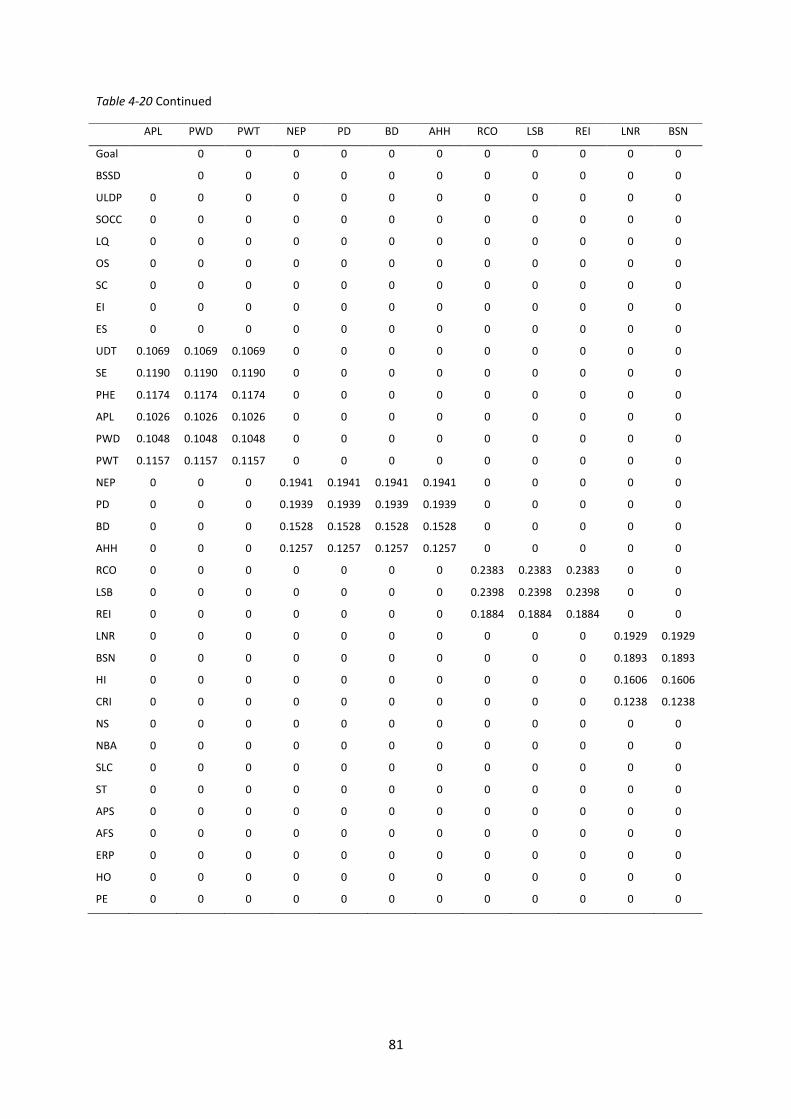
81
Table 4-20 Continued
APL PWD PWT NEP PD BD AHH RCO LSB REI LNR BSN
Goal 0 0 0 0 0 0 0 0 0 0 0
BSSD 0 0 0 0 0 0 0 0 0 0 0
ULDP 0 0 0 0 0 0 0 0 0 0 0 0
SOCC 0 0 0 0 0 0 0 0 0 0 0 0
LQ 0 0 0 0 0 0 0 0 0 0 0 0
OS 0 0 0 0 0 0 0 0 0 0 0 0
SC 0 0 0 0 0 0 0 0 0 0 0 0
EI 0 0 0 0 0 0 0 0 0 0 0 0
ES 0 0 0 0 0 0 0 0 0 0 0 0
UDT 0.1069 0.1069 0.1069 0 0 0 0 0 0 0 0 0
SE 0.1190 0.1190 0.1190 0 0 0 0 0 0 0 0 0
PHE 0.1174 0.1174 0.1174 0 0 0 0 0 0 0 0 0
APL 0.1026 0.1026 0.1026 0 0 0 0 0 0 0 0 0
PWD 0.1048 0.1048 0.1048 0 0 0 0 0 0 0 0 0
PWT 0.1157 0.1157 0.1157 0 0 0 0 0 0 0 0 0
NEP 0 0 0 0.1941 0.1941 0.1941 0.1941 0 0 0 0 0
PD 0 0 0 0.1939 0.1939 0.1939 0.1939 0 0 0 0 0
BD 0 0 0 0.1528 0.1528 0.1528 0.1528 0 0 0 0 0
AHH 0 0 0 0.1257 0.1257 0.1257 0.1257 0 0 0 0 0
RCO 0 0 0 0 0 0 0 0.2383 0.2383 0.2383 0 0
LSB 0 0 0 0 0 0 0 0.2398 0.2398 0.2398 0 0
REI 0 0 0 0 0 0 0 0.1884 0.1884 0.1884 0 0
LNR 0 0 0 0 0 0 0 0 0 0 0.1929 0.1929
BSN 0 0 0 0 0 0 0 0 0 0 0.1893 0.1893
HI 0 0 0 0 0 0 0 0 0 0 0.1606 0.1606
CRI 0 0 0 0 0 0 0 0 0 0 0.1238 0.1238
NS 0 0 0 0 0 0 0 0 0 0 0 0
NBA 0 0 0 0 0 0 0 0 0 0 0 0
SLC 0 0 0 0 0 0 0 0 0 0 0 0
ST 0 0 0 0 0 0 0 0 0 0 0 0
APS 0 0 0 0 0 0 0 0 0 0 0 0
AFS 0 0 0 0 0 0 0 0 0 0 0 0
ERP 0 0 0 0 0 0 0 0 0 0 0 0
HO 0 0 0 0 0 0 0 0 0 0 0 0
PE 0 0 0 0 0 0 0 0 0 0 0 0
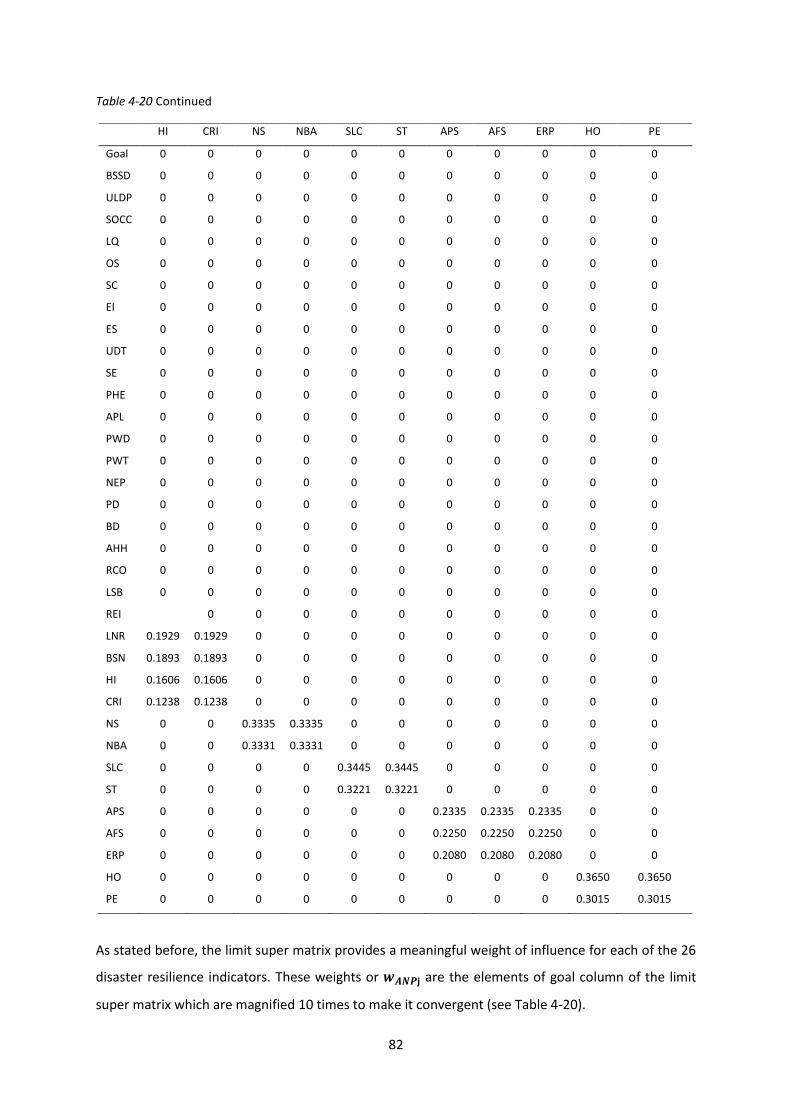
82
Table 4-20 Continued
As stated before, the limit super matrix provides a meaningful weight of influence for each of the 26
disaster resilience indicators. These weights or 𝒘𝑨𝑵𝑷j are the elements of goal column of the limit
super matrix which are magnified 10 times to make it convergent (see Table 4-20).
HI CRI NS NBA SLC ST APS AFS ERP HO PE
Goal 0 0 0 0 0 0 0 0 0 0 0
BSSD 0 0 0 0 0 0 0 0 0 0 0
ULDP 0 0 0 0 0 0 0 0 0 0 0
SOCC 0 0 0 0 0 0 0 0 0 0 0
LQ 0 0 0 0 0 0 0 0 0 0 0
OS 0 0 0 0 0 0 0 0 0 0 0
SC 0 0 0 0 0 0 0 0 0 0 0
EI 0 0 0 0 0 0 0 0 0 0 0
ES 0 0 0 0 0 0 0 0 0 0 0
UDT 0 0 0 0 0 0 0 0 0 0 0
SE 0 0 0 0 0 0 0 0 0 0 0
PHE 0 0 0 0 0 0 0 0 0 0 0
APL 0 0 0 0 0 0 0 0 0 0 0
PWD 0 0 0 0 0 0 0 0 0 0 0
PWT 0 0 0 0 0 0 0 0 0 0 0
NEP 0 0 0 0 0 0 0 0 0 0 0
PD 0 0 0 0 0 0 0 0 0 0 0
BD 0 0 0 0 0 0 0 0 0 0 0
AHH 0 0 0 0 0 0 0 0 0 0 0
RCO 0 0 0 0 0 0 0 0 0 0 0
LSB 0 0 0 0 0 0 0 0 0 0 0
REI 0 0 0 0 0 0 0 0 0 0
LNR 0.1929 0.1929 0 0 0 0 0 0 0 0 0
BSN 0.1893 0.1893 0 0 0 0 0 0 0 0 0
HI 0.1606 0.1606 0 0 0 0 0 0 0 0 0
CRI 0.1238 0.1238 0 0 0 0 0 0 0 0 0
NS 0 0 0.3335 0.3335 0 0 0 0 0 0 0
NBA 0 0 0.3331 0.3331 0 0 0 0 0 0 0
SLC 0 0 0 0 0.3445 0.3445 0 0 0 0 0
ST 0 0 0 0 0.3221 0.3221 0 0 0 0 0
APS 0 0 0 0 0 0 0.2335 0.2335 0.2335 0 0
AFS 0 0 0 0 0 0 0.2250 0.2250 0.2250 0 0
ERP 0 0 0 0 0 0 0.2080 0.2080 0.2080 0 0
HO 0 0 0 0 0 0 0 0 0 0.3650 0.3650
PE 0 0 0 0 0 0 0 0 0 0.3015 0.3015
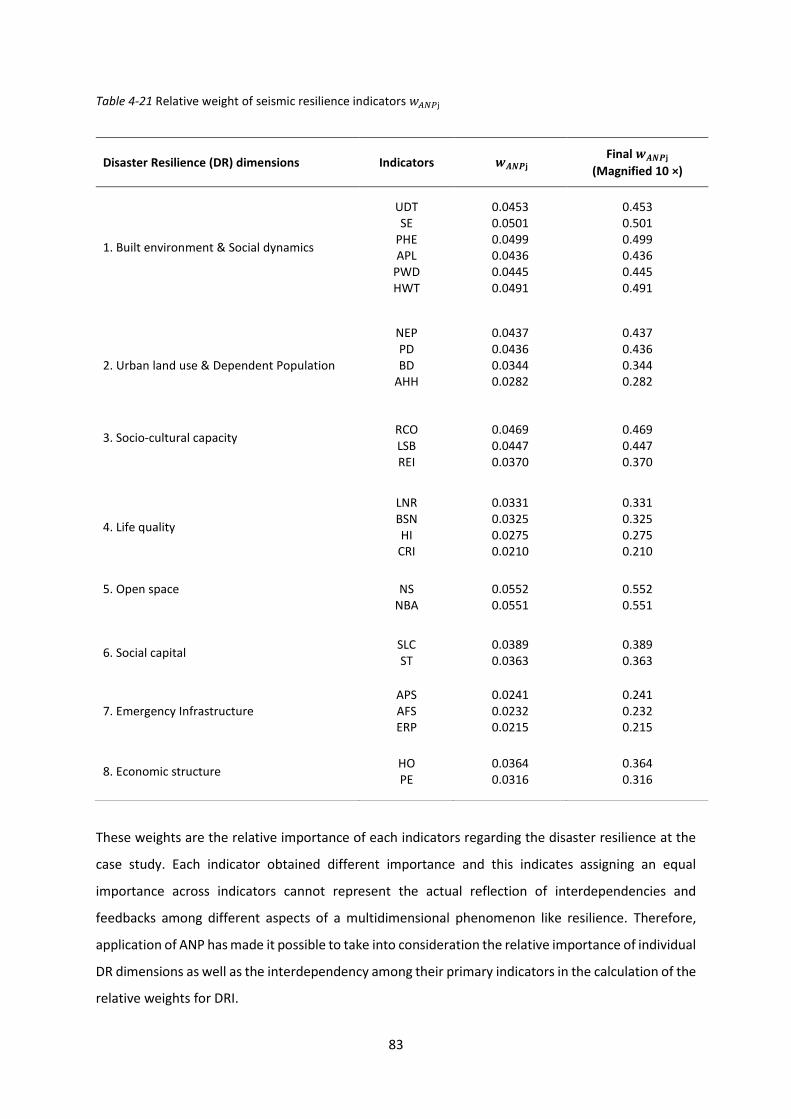
83
Table 4-21 Relative weight of seismic resilience indicators 𝑤𝐴𝑁𝑃j
These weights are the relative importance of each indicators regarding the disaster resilience at the
case study. Each indicator obtained different importance and this indicates assigning an equal
importance across indicators cannot represent the actual reflection of interdependencies and
feedbacks among different aspects of a multidimensional phenomenon like resilience. Therefore,
application of ANP has made it possible to take into consideration the relative importance of individual
DR dimensions as well as the interdependency among their primary indicators in the calculation of the
relative weights for DRI.
Disaster Resilience (DR) dimensions
Indicators
𝒘𝑨𝑵𝑷j Final 𝒘𝑨𝑵𝑷j
(Magnified 10 ×)
1. Built environment & Social dynamics
UDT SE
PHE APL
PWD HWT
0.0453 0.0501 0.0499 0.0436 0.0445 0.0491
0.453 0.501 0.499 0.436 0.445 0.491
2. Urban land use & Dependent Population
NEP PD BD
AHH
0.0437 0.0436 0.0344 0.0282
0.437 0.436 0.344 0.282
3. Socio-cultural capacity
RCO LSB REI
0.0469 0.0447 0.0370
0.469 0.447 0.370
4. Life quality
LNR BSN HI
CRI
0.0331 0.0325 0.0275 0.0210
0.331 0.325 0.275 0.210
5. Open space
NS NBA
0.0552 0.0551
0.552 0.551
6. Social capital SLC ST
0.0389 0.0363
0.389 0.363
7. Emergency Infrastructure APS AFS ERP
0.0241 0.0232 0.0215
0.241 0.232 0.215
8. Economic structure
HO PE
0.0364 0.0316
0.364 0.316

84
4.6.3. Disaster resilience index (DRI) score (aggregation)
Agaggregation is often mentioned as a controversial debate in process of composite
indicators building (Nardo, et al., 2005). The previous works related to composite indicators offer
several examples of aggregation techniques. In general, the three most applied methods of
aggregation in the literature are multiplication (geometric aggregation), multi-criteria analysis, and
summation (additive aggregation) (Bepetista, 2014). The latter, is aggregating (summation) of
transformed (standardized) values with the relative importance values (unequal weighting) into the
final index using the arithmetic mean (Booysen, 2002); (Tate, 2013) and is considered as the most used
method in vulnerability and resilience studies (Cutter, et al., 2003); (Mayunga, 2009); (Cutter, et al.,
2010); (Burton, 2012); (Zebardast, 2013). Munda & Nardo (2005) pointed out that the linear additive
aggregation gives more trustable result than multiplication method, because in this method those
indicators which have more significance, will have greater contribution in constructing composite
indicators. Moreover, this technique can be utilized when whole variables have the same
measurement unites and indicates that the calculated results necessarily have a compensatory logic
(Nardo, et al., 2008). It means that the poor scores in some variables can be compensated by high
scores of other variables.
Thus, in this study, a linear additive aggregation is used to compute the DRI scores as shown in Eq. (3):
𝐷𝑅𝐼𝑖= ∑ 𝑊𝐴𝑁𝑃𝑗 𝐷𝑅𝐼𝑖𝑗
𝐽
𝑗=1
(3)
Where, 𝐷𝑅𝐼𝑖 represents the disaster resilience score for neighborhood “𝑖". 𝑊𝐴𝑁𝑃𝑗 is the weights of
disaster resilience indicator “𝑗" obtained from the ANP (Table 4-20) and 𝐷𝑅𝐼𝑖𝑗 is the standardized
value of the disaster resilience indicator “𝑗" in neighborhood “𝑖" (See Table A.2 in Appendix).
Using the relative weights obtained for the DR indicators (final 𝑤𝐴𝑁𝑃j), the scores for the eight
extracted disaster resilience are also calculated in similar manner (additive aggregation), by
multiplying the corresponding relative weights of the primary indicators in each dimension (Table 4-
21) to their standardized values (Table A 2 in Appendix). As stated before, these scores were calculated
for the 368 urban neighborhoods, 116 urban sub-regions, and 22 urban regions of Tehran City. For
simplifying the results, the final scores are presented here in the scale of urban regions (Table 4-22).
However, for the purpose of visualizing, the results will also be presented based on the standard
deviation from the mean on three above mentioned scales.
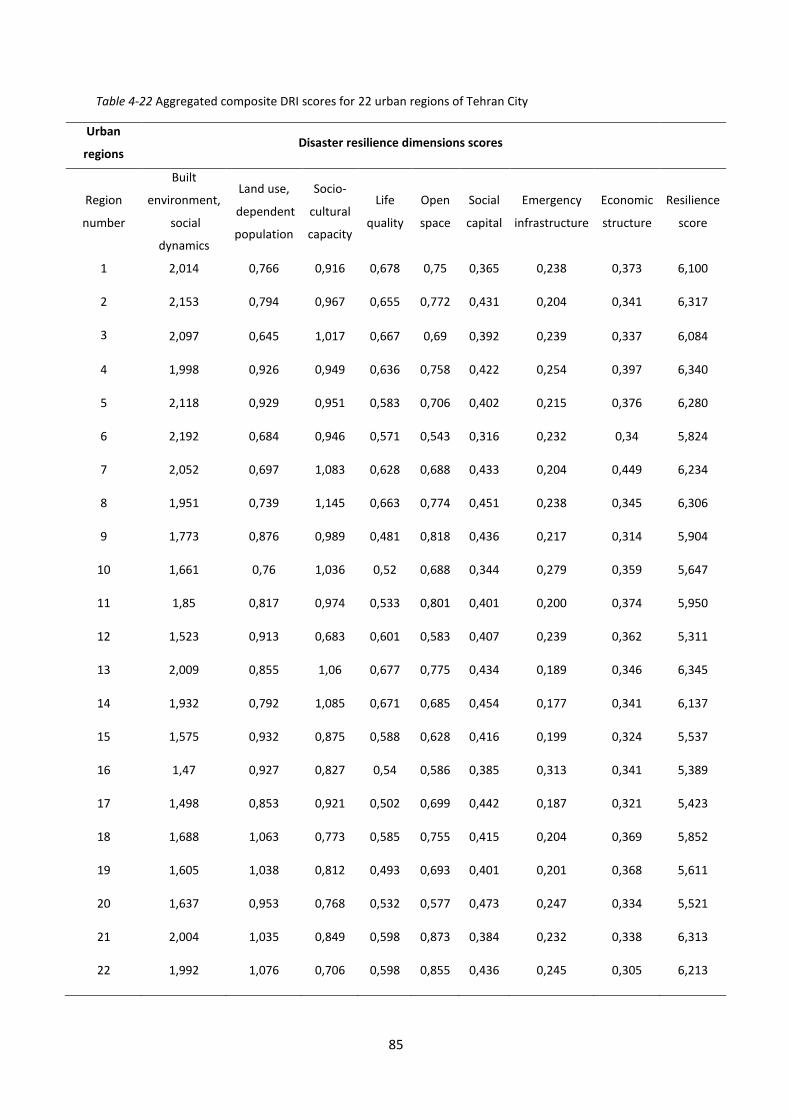
85
Table 4-22 Aggregated composite DRI scores for 22 urban regions of Tehran City
Urban
regions Disaster resilience dimensions scores
Region
number
Built
environment,
social
dynamics
Land use,
dependent
population
Socio-
cultural
capacity
Life
quality
Open
space
Social
capital
Emergency
infrastructure
Economic
structure
Resilience
score
1 2,014 0,766 0,916 0,678 0,75 0,365 0,238 0,373 6,100
2 2,153 0,794 0,967 0,655 0,772 0,431 0,204 0,341 6,317
3 2,097 0,645 1,017 0,667 0,69 0,392 0,239 0,337 6,084
4 1,998 0,926 0,949 0,636 0,758 0,422 0,254 0,397 6,340
5 2,118 0,929 0,951 0,583 0,706 0,402 0,215 0,376 6,280
6 2,192 0,684 0,946 0,571 0,543 0,316 0,232 0,34 5,824
7 2,052 0,697 1,083 0,628 0,688 0,433 0,204 0,449 6,234
8 1,951 0,739 1,145 0,663 0,774 0,451 0,238 0,345 6,306
9 1,773 0,876 0,989 0,481 0,818 0,436 0,217 0,314 5,904
10 1,661 0,76 1,036 0,52 0,688 0,344 0,279 0,359 5,647
11 1,85 0,817 0,974 0,533 0,801 0,401 0,200 0,374 5,950
12 1,523 0,913 0,683 0,601 0,583 0,407 0,239 0,362 5,311
13 2,009 0,855 1,06 0,677 0,775 0,434 0,189 0,346 6,345
14 1,932 0,792 1,085 0,671 0,685 0,454 0,177 0,341 6,137
15 1,575 0,932 0,875 0,588 0,628 0,416 0,199 0,324 5,537
16 1,47 0,927 0,827 0,54 0,586 0,385 0,313 0,341 5,389
17 1,498 0,853 0,921 0,502 0,699 0,442 0,187 0,321 5,423
18 1,688 1,063 0,773 0,585 0,755 0,415 0,204 0,369 5,852
19 1,605 1,038 0,812 0,493 0,693 0,401 0,201 0,368 5,611
20 1,637 0,953 0,768 0,532 0,577 0,473 0,247 0,334 5,521
21 2,004 1,035 0,849 0,598 0,873 0,384 0,232 0,338 6,313
22 1,992 1,076 0,706 0,598 0,855 0,436 0,245 0,305 6,213

86
As the table displays, each of the eight extracted dimensions has different contribution on disaster
resilience (Figure 4-4).
4.7. Summary
To construct a sound set of composite indicators, indicators should be identified based on analytical
robustness, scalability, availability, and relevance. A composite indicator is the aggregate of its parts
and therefore, the quality of underlying indicators has undeniable impact on the strength and
weakness of composite indicators. Constructing a primary set of indicator is performed based on a
theoretical framework. To perform this task, this study has selected the disaster resilience of place
(DROP) model and its applied version which is called baseline resilience indicators for community
(BRIC) as the primary theoretical framework. The BRIC consists of 36 indicators that represent the
following categories: economic, infrastructure, social, community and institutional resilience following
support in the literature for evaluating and enhancing disaster resilient communities. Out of 36
primary indicators, 30 of them were selected appropriate to conceptualize (measurement) disaster
resilience in the Tehran City.
As part of the data reduction process, and to uncover the latent structures of the selected indicators
set, a factorial analysis was carefully performed using the principal component analysis (PCA). Three
steps need to be cheeked for a factorial analysis as follows:
First: The normality of data was checked to determine outliers. Second: All data were standardized in
such a way that an increase of an indicator value would correspond to an increase in disaster
resilience. Third: To assess the suitability and adequacy of data, three additional tests were
Figure 4-4 Contribution of the eight dimensions to disaster resilience level in Tehran
87
performed. 1) The sample size of the analysis or the ratio of cases to indicators was selected in
accordance with the literature. 2) Factorability of the correlation matrix was checked using the anti-
image correlation matrix. This analysis showed that there are noticeable correlations amongst
indicators and coherent factors can be extracted, and 3) The Kaiser-Meyer-Olkin (KMO) measure of
sampling adequacy and Bartlett's test of sphericity have also been performed to evaluate the fitness
of the relevant data for factor analysis.
The aim of using factor analysis was to transform correlated indicators into a new set of uncorrelated
components which are the best linear combination of the indicators. After excluding the three
indicators (less communalities values), the rest of 27 indicators were reduced to the eight underlying
factors which are also the latent dimensions of disaster resilience at the case study, Tehran (Table 4-
12).
For weighting the extracted components/dimensions and their indicators, the study proposed the
hybrid factor analysis (FA) and analytic network process (ANP) called F’ANP model. The F’ANP uses
factor analysis (FA) to extract the underlying dimensions of the phenomenon (disaster resilience).
Then identified dimensions and their primary variables are entered into a network model in analytic
network process (ANP). The ANP is used to calculate the relative importance of different indicators of
the subject matter. However, unlike the usual ANP and AHP, the F’ANP uses the extracted absolute
values from the FA part of the study rather expert’s judgment. Because expert’s judgment may differ
for a same problem and therefore, different results may be obtained. Whereas, using the absolute
measurements has overcome this inherent limitations of the normative methods.
For aggregating indicators, the study applied linear additive aggregation method in which the final
disaster resilience score for each case study area is obtained. These results provide a comparative
assessment between the 22 urban regions, 116 sub-regions, and 368 urban neighborhoods of the
study area which will be discussed in the following chapter. Therefore, in the next chapter, the
obtained results are first visualized and then validated through an empirical application of the
constructed composite indicators.

88
5. Multi-dimensional and Multi-scale Patterns of Disaster
Resilience in Tehran, Iran
Up to now, the focus of this dissertation was to build a set of composite indicators that could be used
for measuring disaster resilience in the context of earthquake hazard. After constructing the
composite disaster resilience indicators and also computing the score for each of them, the objective
of this chapter is to employ the final disaster resilience indicators scores in order to better
understanding the level of urban resilience on three different scales of urban regions, sub-regions,
and neighborhoods in Tehran City. This exercise provides not only information about the relative
disaster resilience of the study area, but also additional confidence in the validity and utility of the
F’ANP scores as well as the eight dimensions associated with disaster resilience. These dimensions
include: built environment & social dynamics, urban land use & dependent populations, socio-cultural
capacity, life quality, open space, social capital, emergency infrastructure, and economic structure.
5.1. Spatial distribution of disaster resilience in Tehran City
The obtained results from the disaster resilience indicators (DRI) scores in last chapter, provided a
comparative assessment of resiliency level in the study area. This is because that measuring resilience
in absolute term is hard and the general expectation with respects to disaster resilience level across
the regions and sub-regions are missing. Therefore, a comparative assessment is needed to gain
additional insight in their functionality and to obtain additional understanding on how the different
dimensions are operating within the constructed composite indicators.
Therefore, the next step after computing the scores is to visualize the obtained results for
comparatively assessment of the community disaster resilience in both 22 urban regions, 116 urban
sub-regions, and 368 urban neighborhoods. The level of disaster resilience for these three urban scales
is calculated as the aggregated scores of composite indicators which lead to relatively analysis of them.
The goal is to facilitate the visualization of disaster resilience, and its contributing components in an
interactive way. The logic behind this argument is that the composite indicators should prepare the
way to provide an accurately and rapidly illustration to decision-makers and other end-users
There are a few ways to visualize and present composite indicators as well as simple tabular or more
complicated multi-dimensional graphical software. Here, the main concern should be how the
selected visualization method affects the interpretation of results and ease of understanding.
Although the representation of the results in tables is the simplest and straightforward style, possibly
it is not very attractive way of representation and mostly not a detailed one. Hence, using a graphic
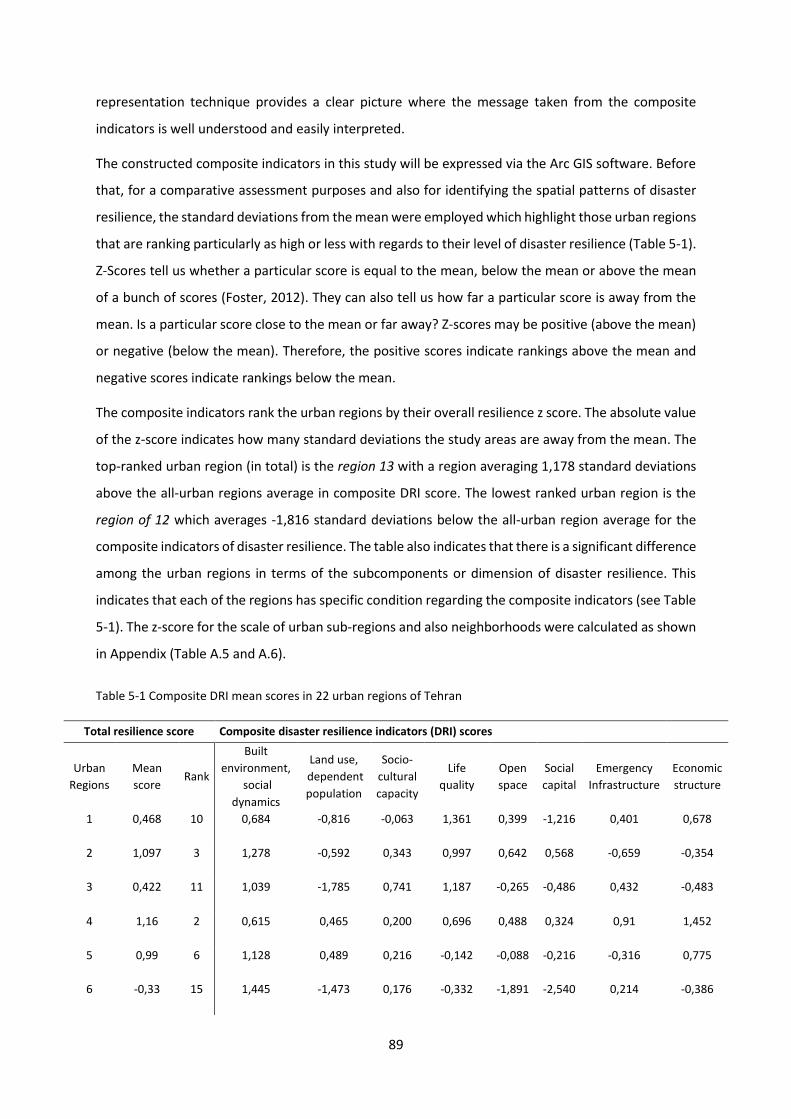
89
representation technique provides a clear picture where the message taken from the composite
indicators is well understood and easily interpreted.
The constructed composite indicators in this study will be expressed via the Arc GIS software. Before
that, for a comparative assessment purposes and also for identifying the spatial patterns of disaster
resilience, the standard deviations from the mean were employed which highlight those urban regions
that are ranking particularly as high or less with regards to their level of disaster resilience (Table 5-1).
Z-Scores tell us whether a particular score is equal to the mean, below the mean or above the mean
of a bunch of scores (Foster, 2012). They can also tell us how far a particular score is away from the
mean. Is a particular score close to the mean or far away? Z-scores may be positive (above the mean)
or negative (below the mean). Therefore, the positive scores indicate rankings above the mean and
negative scores indicate rankings below the mean.
The composite indicators rank the urban regions by their overall resilience z score. The absolute value
of the z-score indicates how many standard deviations the study areas are away from the mean. The
top-ranked urban region (in total) is the region 13 with a region averaging 1,178 standard deviations
above the all-urban regions average in composite DRI score. The lowest ranked urban region is the
region of 12 which averages -1,816 standard deviations below the all-urban region average for the
composite indicators of disaster resilience. The table also indicates that there is a significant difference
among the urban regions in terms of the subcomponents or dimension of disaster resilience. This
indicates that each of the regions has specific condition regarding the composite indicators (see Table
5-1). The z-score for the scale of urban sub-regions and also neighborhoods were calculated as shown
in Appendix (Table A.5 and A.6).
Table 5-1 Composite DRI mean scores in 22 urban regions of Tehran
Total resilience score Composite disaster resilience indicators (DRI) scores
Urban
Regions
Mean
score Rank
Built
environment,
social
dynamics
Land use,
dependent
population
Socio-
cultural
capacity
Life
quality
Open
space
Social
capital
Emergency
Infrastructure
Economic
structure
1 0,468
10 0,684
-0,816
-0,063
1,361
0,399
-1,216
0,401
0,678
2 1,097
3 1,278
-0,592
0,343
0,997
0,642
0,568
-0,659
-0,354
3 0,422
11 1,039
-1,785
0,741
1,187
-0,265
-0,486
0,432 -0,483
4 1,16
2 0,615
0,465
0,200
0,696
0,488
0,324
0,91
1,452
5 0,99
6 1,128
0,489
0,216
-0,142
-0,088
-0,216
-0,316
0,775
6 -0,33
15 1,445
-1,473
0,176
-0,332
-1,891
-2,540
0,214
-0,386
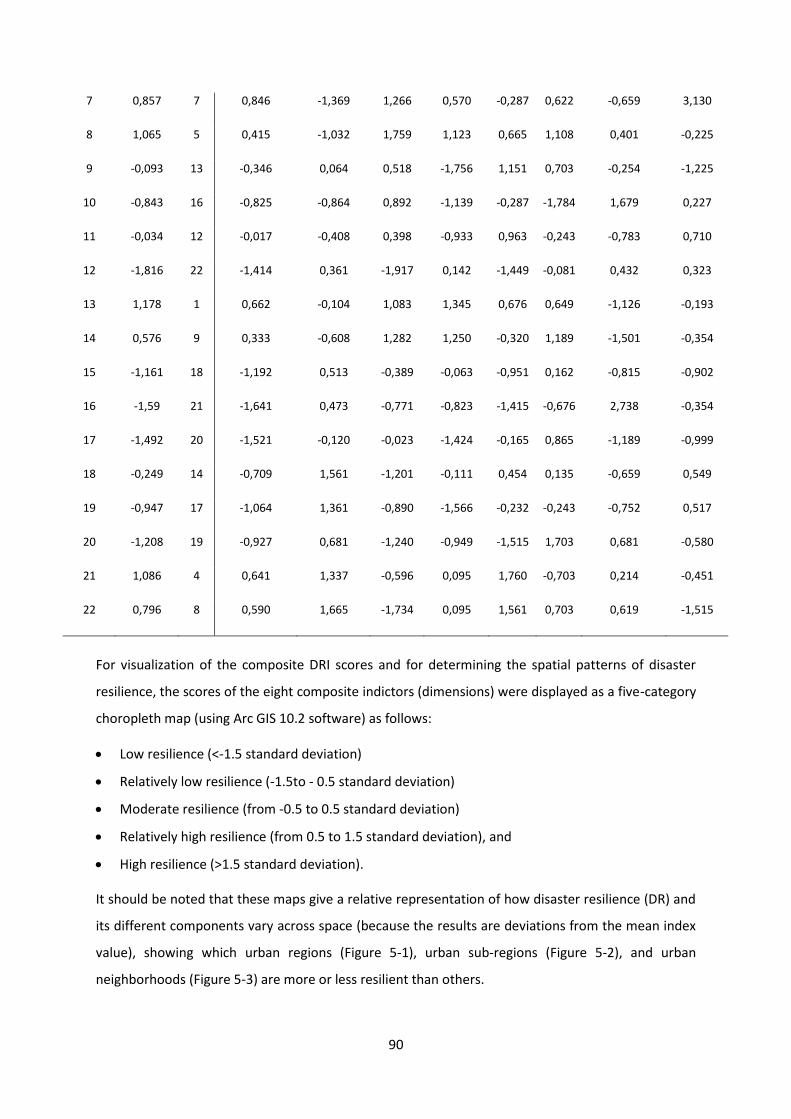
90
7 0,857
7 0,846
-1,369
1,266
0,570
-0,287
0,622
-0,659
3,130
8 1,065
5 0,415
-1,032
1,759
1,123
0,665
1,108
0,401
-0,225
9 -0,093
13 -0,346
0,064
0,518
-1,756
1,151
0,703
-0,254
-1,225
10 -0,843
16 -0,825
-0,864
0,892
-1,139
-0,287
-1,784
1,679
0,227
11 -0,034
12 -0,017
-0,408
0,398
-0,933
0,963
-0,243
-0,783
0,710
12 -1,816
22 -1,414
0,361
-1,917
0,142
-1,449
-0,081
0,432
0,323
13 1,178
1 0,662
-0,104
1,083
1,345
0,676
0,649
-1,126
-0,193
14 0,576
9 0,333
-0,608
1,282
1,250
-0,320
1,189
-1,501
-0,354
15 -1,161
18 -1,192
0,513
-0,389
-0,063
-0,951
0,162
-0,815
-0,902
16 -1,59
21 -1,641
0,473
-0,771
-0,823
-1,415
-0,676
2,738
-0,354
17 -1,492
20 -1,521
-0,120
-0,023
-1,424
-0,165
0,865
-1,189
-0,999
18 -0,249
14 -0,709
1,561
-1,201
-0,111
0,454
0,135
-0,659
0,549
19 -0,947
17 -1,064
1,361
-0,890
-1,566
-0,232
-0,243
-0,752
0,517
20 -1,208
19 -0,927
0,681
-1,240
-0,949
-1,515
1,703
0,681
-0,580
21 1,086
4 0,641
1,337
-0,596
0,095
1,760
-0,703
0,214
-0,451
22 0,796
8 0,590
1,665
-1,734
0,095
1,561
0,703
0,619
-1,515
For visualization of the composite DRI scores and for determining the spatial patterns of disaster
resilience, the scores of the eight composite indictors (dimensions) were displayed as a five-category
choropleth map (using Arc GIS 10.2 software) as follows:
Low resilience (<-1.5 standard deviation)
Relatively low resilience (-1.5to - 0.5 standard deviation)
Moderate resilience (from -0.5 to 0.5 standard deviation)
Relatively high resilience (from 0.5 to 1.5 standard deviation), and
High resilience (>1.5 standard deviation).
It should be noted that these maps give a relative representation of how disaster resilience (DR) and
its different components vary across space (because the results are deviations from the mean index
value), showing which urban regions (Figure 5-1), urban sub-regions (Figure 5-2), and urban
neighborhoods (Figure 5-3) are more or less resilient than others.

91
Figure 5-1 Spatial distribution of disaster resilience for the 22 urban regions of Tehran

92
Figure 5-2 Spatial distribution of disaster resilience for 116 urban sub-regions

93
Figure 5-3 Spatial distribution of disaster resilience for 368 urban neighborhoods

94
Visualization of the results represented a better understanding from variation of disaster resilience
level and will be useful to benchmark baseline conditions and tracking performance overtime, support
decision-making, and to promote strategies and policies for an integrated action. The spatial
distribution of disaster resilience illustrates that urban areas symbolized in dark blue are highly
resilient whereas those symbolized in red are the least resilient. Figures 5-1 to 5-3 show the level of
disaster resilience from a spatial representation point of view on three urban scales of the study area
that contains eight dimensions.
As stated in section 4.6.3, the 368 urban neighborhoods in Tehran are located in116 urban sub-regions
and 22 urban regions. The last two scales are the official and administrative boundaries (Salek, 2007).
However, the results for these three urban scales differ noticeably (Table 5-2). According to the Figure
5-1, there no exist high resilient urban regions in Tehran and most of them are classified as moderate
and relatively high disaster resilient. While Figure 5-2, and Figure 5-3 display the existence of high
resilient urban neighborhoods and sub-regions inside the regions. This is because of using arithmetic
mean for producing the average score of each urban region. The arithmetic mean represents the
central tendency, the number of peak points and bottom points can affect the overall average. Since
the ratio of high resilient urban neighborhoods in any the regions and sub-regions is relatively low, it
cannot considerably affect overall resilience scores of the regions. Thus, there is no region with high
level of resilience in Tehran.
Table 5-2 Percent of urban regions, sub-regions and neighborhoods by level of disaster resilience
Disaster resilience
(Level)
Urban regions
(%)
Urban sub-regions
(%)
Urban neighbourhoods
(%)
High 0 5.9 7.1
Relatively high 40.9 26.7 20.9
Moderate 27.3 39.6 41.3
Relatively low 22.7 15.5 24.5
low 9.1 12.1 6.2
Total 100 100 100
As Table 5-2 indicates, there is no high resilient urban region in the city and most of them were
classified as relatively high level of resilience (40,9 %). On contrary, most of urban sub-regions and
also neighborhoods were ranked as moderate resilience level. The least percent of resilience on the
scale of urban sub-regions belongs to the high level areas (5,9 %), whereas the least percent on the
scale of neighborhoods refers to the low resilience class (6,2 %). However, at first glance, the visualized
results clearly illustrate the difference between the north and south of the city. Urban areas in the
center and sought of city have the least inherent resilience, while areas located in the north,
northwest, northeast contain the most resilience.

95
5.2. Multi-faceted and multi-scale characteristics of disaster resilience in Tehran
Disaster resilience as a concept is a multifaceted phenomenon that encompasses many different
dimensions. The underlying dimensions of disaster resilience in the context of earthquake hazard in
Tehran that have been identified with an inductive principle component analysis (PCA) are built
environment & social dynamics, urban land use & dependent population, socio-cultural capacity, life
quality, open space, social capital, emergency infrastructure, and economic structure (Table 5-1).
Therefore, to better understanding the underlying dimensions of disaster resilience, each of the eight
dimensions has also been delineated at two different scales of urban regions and urban sub-regions.
There are several noteworthy spatial patterns.
5.2.1 Built environment & social dynamic
The first underlying factor that contributes to the disaster resilience is “built environment and social
dynamic”. As Figure 5-4 indicated, there is no high resilient region in the city regarding this composite
indicator. The regions 16 and 17 are the less resilient regions and the most other regions are relatively
high or moderate resilient areas.
Figure 5-5 also represents the level of this disaster resilience dimension on the scale of urban sub-
regions. Sub-regions in the sought of the city have the least inherent resilience, while sub-regions in
the north, and mid-west contain the most resilience.
Figure 5-4 Built environment & social dynamic dimension of disaster resileince in urban regions

96
This is because that the northern areas have appropriate conditions in terms of quality of buildings
and social conditions. But southern and central areas have many difficulties regarding these issues. As
stated in Chapter 3, most of urban deteriorated textures are located at the central and southern parts
of the city. These areas are known with three specific characteristics including fine - grained textures,
hard accessibility, and instable buildings that have made them high vulnerable and less resilient.
Equally, regarding the social dynamic conditions, northern areas are better than southern.
5.2.2 Urban land use & dependent population
The second dimension of disaster resilience within the study area is “urban land use and dependent
population”. On contrary to the first dimension, the northern regions are less resilient than southern
and western in terms of this composite indicator (Figure 5-6). The main reason for this perspective is
the environmental attractiveness and high demand for lands in these areas. During the last three
decades, the most of urban vertical developments and therefore, population increasing have been
happened in these areas. Obviously, these trends have caused to over population and high building
density which made them less resilient and high vulnerable against earthquake hazard. Figure 5-7 is
the representation of this dimension on the scale of urban sub-regions.
Figure 5-5 Built environment & social dynamic dimension of disaster resileince in urban sub-regions

97
Figure 5-6 Urban land use and dependent population dimension of disaster resilience in urban regions
Figure 5-7 Urban land use and dependent population dimension of disaster resilience in urban sub-regions

98
5.2.3 Socio-cultural capacity
The socio-cultural capacity dimension (Figure 5-8) shows the higher levels of resilience in the east and
the least level in the west regions. However, is tis obvious that the northern and also the eastern
regions have better conditions rather than western and southern regions.
The difference is mostly based on the distribution of the adaptive capacity indicators as well as
religious & cultural land use, the ratio of large to small businesses, and recreational & entertainment
land use. The results clearly depict a different pattern of disaster resilience within the study area and
demonstrate that socio-cultural capacities such as those considered in this dimension have undeniable
role in enhancing or decreasing of disaster resilience level within social communities.
Figure 5-9 also represents the level of this disaster resilience dimension on the scale of urban sub-
regions. Those sub-regions located in the northwest, southwest, and partially sought have the least
inherent resilience, while sub-regions in the north, east, and partially center contain the most
resilience.
Figure 5-8 Socio-cultural capacity dimension of disaster resilience in urban regions
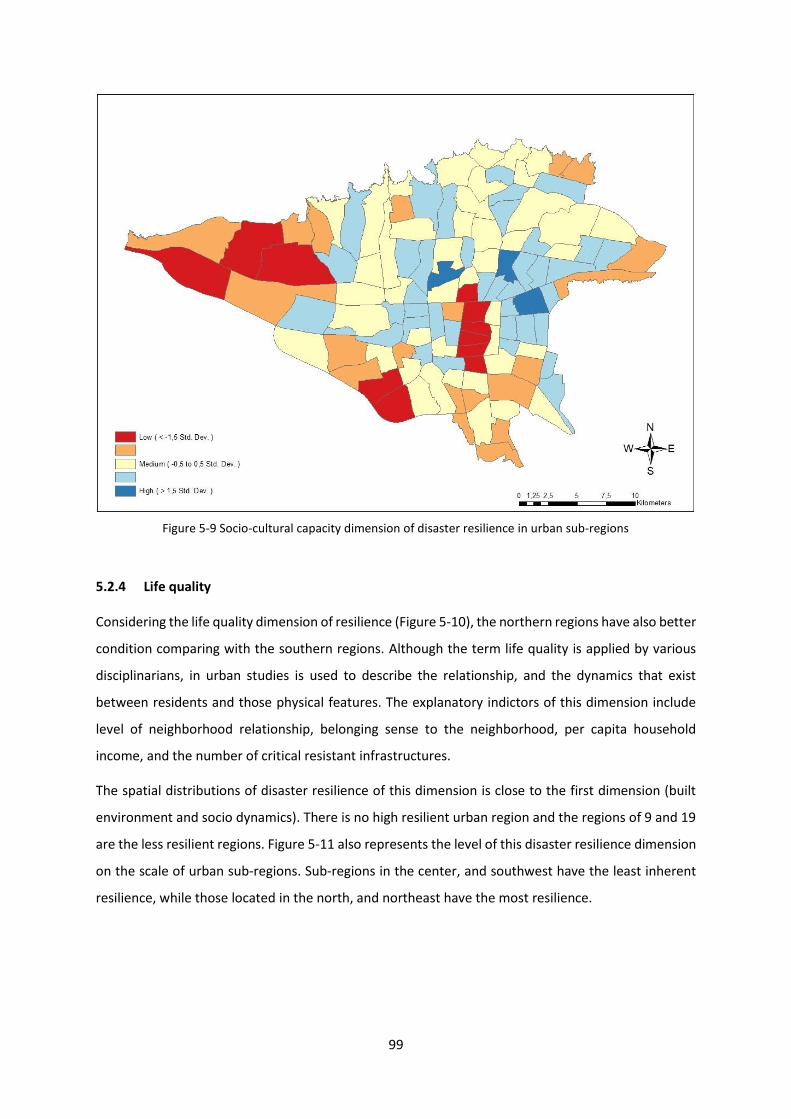
99
5.2.4 Life quality
Considering the life quality dimension of resilience (Figure 5-10), the northern regions have also better
condition comparing with the southern regions. Although the term life quality is applied by various
disciplinarians, in urban studies is used to describe the relationship, and the dynamics that exist
between residents and those physical features. The explanatory indictors of this dimension include
level of neighborhood relationship, belonging sense to the neighborhood, per capita household
income, and the number of critical resistant infrastructures.
The spatial distributions of disaster resilience of this dimension is close to the first dimension (built
environment and socio dynamics). There is no high resilient urban region and the regions of 9 and 19
are the less resilient regions. Figure 5-11 also represents the level of this disaster resilience dimension
on the scale of urban sub-regions. Sub-regions in the center, and southwest have the least inherent
resilience, while those located in the north, and northeast have the most resilience.
Figure 5-9 Socio-cultural capacity dimension of disaster resilience in urban sub-regions

100
Figure 5-10 Life quality dimension of disaster resilience in urban regions
Figure 5-11 Life quality dimension of disaster resilience in urban sub-regions
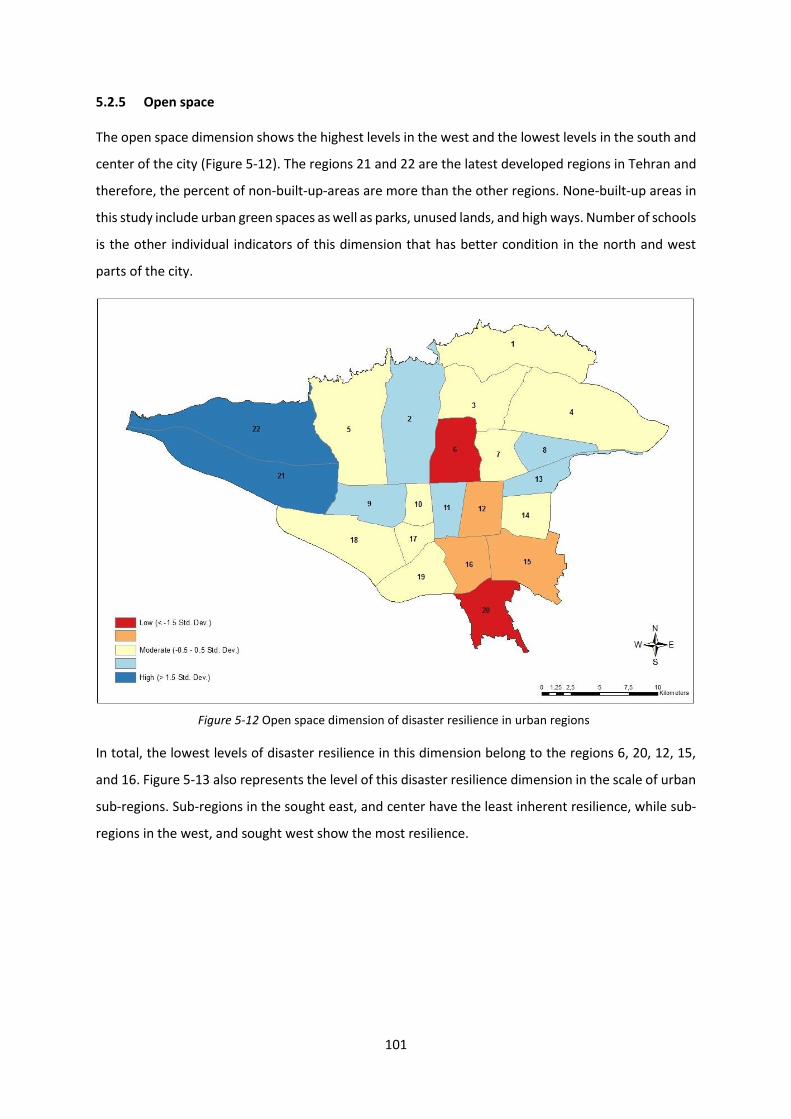
101
5.2.5 Open space
The open space dimension shows the highest levels in the west and the lowest levels in the south and
center of the city (Figure 5-12). The regions 21 and 22 are the latest developed regions in Tehran and
therefore, the percent of non-built-up-areas are more than the other regions. None-built-up areas in
this study include urban green spaces as well as parks, unused lands, and high ways. Number of schools
is the other individual indicators of this dimension that has better condition in the north and west
parts of the city.
In total, the lowest levels of disaster resilience in this dimension belong to the regions 6, 20, 12, 15,
and 16. Figure 5-13 also represents the level of this disaster resilience dimension in the scale of urban
sub-regions. Sub-regions in the sought east, and center have the least inherent resilience, while sub-
regions in the west, and sought west show the most resilience.
Figure 5-12 Open space dimension of disaster resilience in urban regions

102
5.2.6 Social capital
A different patterns of disaster resilience in Tehran comes from the social capital dimension. While
the southern regions show low level of resilience in the spatial distribution of disaster resilience and
also most of its underlying dimensions, they have reflected an unexpected pattern regarding this
dimension. The individual indicators of this dimension include satisfaction level of neighborhood’s
residents from local council, and the ratio of social trust. This is because that there is a negative and
inverse relationship between education level, social class, and social trust (Musai, et al., 2014). As
mentioned in Section 5.2.1, the social dynamic shows highest levels in the northern areas and the
difference between the northern and southern parts of the city is noticeable.
It is also discussed that that basic trust among young people is high than elders (Zebardast, et al.,
2013). The Figure 5-5 showed that the percent of elderly (+65) populations in the northern regions are
more than the southern, and therefore, the highest levels of this dimension is seen in the southern
region of the city. However, as the Figure 5-14 indicates, the regions 20 is the more resilient region
and the regions of 6 and 10 are the less resilient. Figure 5-15also represents the level of this disaster
resilience dimension in the scale of urban sub-regions. Urban areas in the north, and center show the
least inherent resilience, while sub-regions in the sought, and mid-west contain the most resilience.
Figure 5-13 Open space dimension of disaster resilience in urban sub-regions

103
Figure 5-14 Social capital dimension of disaster resilience in urban regions
Figure 5-15 Social capital dimension of disaster resilience in urban-sub-regions

104
5.2.7 Emergency infrastructure
The individual indicators of this dimension include accessibility to police stations, fire stations, and
existing emergency response plan. The results for the region scales show that there is just one low
resilient region in this dimension and most of the urban regions are classified as moderate and
relatively resilient areas (Figure 5-16).
Figure 5-17 also presents the level of disaster resilience in this dimension on the scale of sub-regions.
In total, sub-regions do not follow any special pattern. Those areas that are located in the east, north,
and southwest reflect the least inherent resilience, while sub-regions in the northeast, and mid-west
show the most resilience (Figure 5-17).
Figure 5-16 Emergency infrastructure dimension of disaster resilience in urban regions

105
5.2.8 Economic structure
In terms of the economic structure dimension of disaster resilience (Figure 5-18), nearly 50 % of
regions are moderate resilient and the northern regions have relatively better conditions. However,
the spatial distribution of this dimension does not follow a similar pattern as others. The lowest levels
of economic resilience are found in the region 22 and the highest levels in region 7.
Figure 5-19 is also the distribution pattern of this dimension on the sub-regions scale. The results
indicated that sub-regions in the northwest contain the least inherent resilience, while those located
in the center, mid-west, northeast show the most resilience.
Figure 5-17 Emergency infrastructure dimension of resilience in urban sub-regions
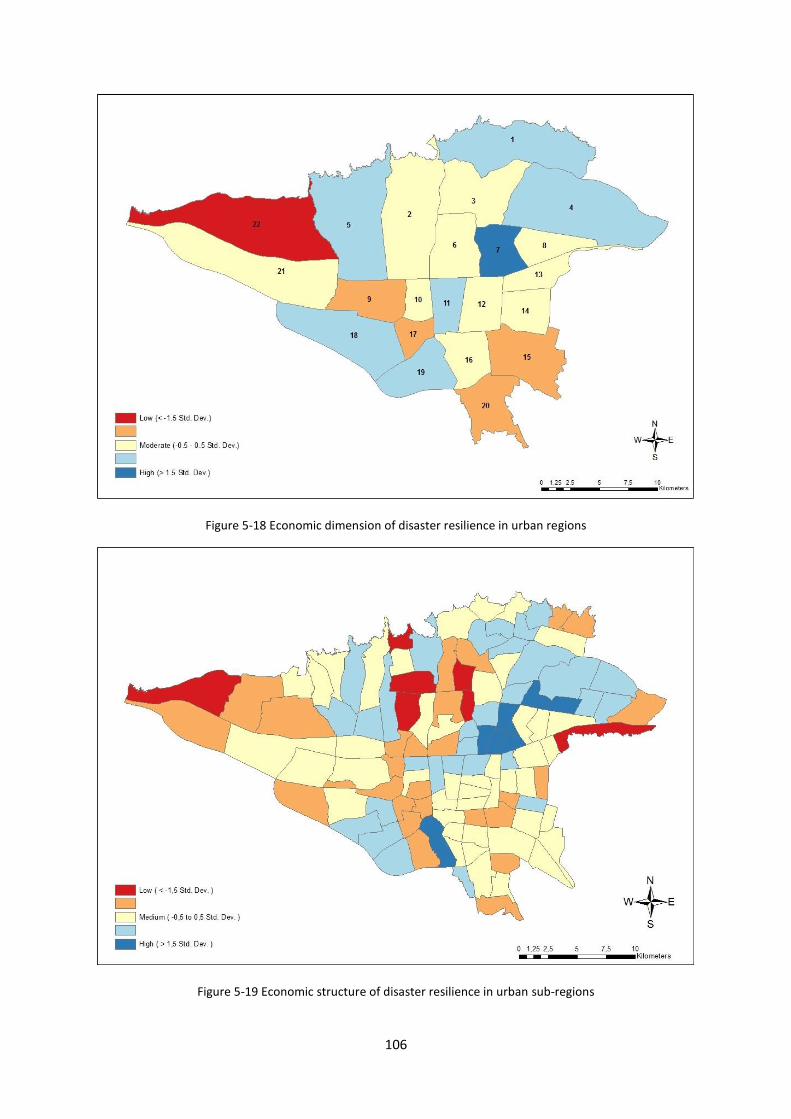
106
Figure 5-18 Economic dimension of disaster resilience in urban regions
Figure 5-19 Economic structure of disaster resilience in urban sub-regions
107
5.3. Quality characteristics of disaster resilience in Tehran
Increasing our understanding from the diverse processes of the disaster resilience level is the first
objective of this study. In hazard arena, most of disaster resilience models involve engineered systems
which encompass infrastructure-robustness, redundancy, resourcefulness, and rapidity (Bruneau, et
al., 2003); (Tierney & Bruneau, 2007). Although this study has been conducted in the context of
earthquake, it views the concept more beyond a merely engineering system. This is because that a
disaster resilient community/system is the product of many different factors as well as natural
systems, social systems, and built-environment systems. Resilience in this perspective is a product of
both an inherent or antecedent condition and a diverse process that emerges as the result of these
capacities: absorptive and adaptive capacities (Cutter, et al., 2008); (Béné, et al., 2012). Each of these
characteristics leading to different outcomes: persistence, and incremental adjustment to an event.
Therefore, to better understanding the concept of seismic resilience in Tehran City, we have
delineated the two general characteristics of a disaster resilient community as following:
5.3.1. Absorptive capacity
Absorptive capacity encompasses inherent or antecedent conditions of a socio-ecological unit and
determines the threshold level a system can automatically absorb or withstand the impacts of system
perturbations and minimize consequences with relatively low degrees of effort or energy (OECD,
2014). To produce immediate effect after a hazardous event, the antecedent conditions (inherent
resilience and vulnerability) interact with the characteristics (Cutter, et al., 2008). Several functions of
antecedent conditions as well as mitigation actions and coping responses have immediate effects on
decreasing or increasing of the community resilience in time of an extreme event. The absorptive
capacity of an urban area can therefore attenuate the impacts of an adverse event. The threshold of
the absorptive capacity is described as the extent to which a community is able to absorb event
impacts using some coping responses as well as predetermined ones (Cutter, et al., 2008).
In the case of earthquake, the absorptive capacity can be addressed by robustness of built-
environments, robustness and redundancy critical infrastructures, and land use planning for example.
These characteristics. The robustness of the built-environments plays undeniable role to tolerate
disaster impacts without noticeable disruption and also loss low causalities. As the Figure 5-10 depicts,
there is a significant difference between the urban regions. While the regions of 21, and 22 have the
highest levels of absorptive capacities, the lowest levels belong to the region 10 in the center of the
city. In general, the spatial patterns of this attribute is similar to the pattern of the built-environment
and social dynamic (Figure 5-2).

108
5.3.2. Adaptive capacity
The extent to which the individuals (as components of a system) and community (as a total system)
tends to adapt when a hazardous event occurs is called disaster resilience that seeks for possible
approaches for increasing adaptive capacities. A list of requirements and recommendations is
presented below for the community, and also individuals facing disasters and needs to be facilitated
from the societal aspects: Firstly, resources should be established for emergency planning as well as
measurements for increasing safely and balancing from the societal aspects of institutions,
community, and individuals. Secondly, increase the number of trained people among the population
or facilitate the resources which are already available and allocate them to the occurred extreme
events (Paton & Johnston, 2006). Next is to have a development plan to measure and increase the
resilience level of institutions, community, and individuals to certify the societal aspects at all levels.
Finally, relevant policies with the objective of the disaster risk reduction should be established for the
emergency cases (Mayunga, 2007). The whole process will support the development and maintenance
of the societal capacity to adapt in challenges of the three states of a disaster prone community: pre-
disaster, disaster and post-disaster phases.
The extent to which a system is able to self-organization and use non-standard operating practices to
overcome disruption impacts is called adaptive capacity. (Norris, et al., 2008); (Klein, et al., 2003).
Adaptive capacity is employed by individual within communities when the absorptive capacity is
Figure 5-20 Absorptive capacity of disaster resilience in Tehran
Figure 5-21 Adaptive capacity of disaster resilience in TehranFigure 5-22 Absorptive capacity of disaster resilience in Tehran
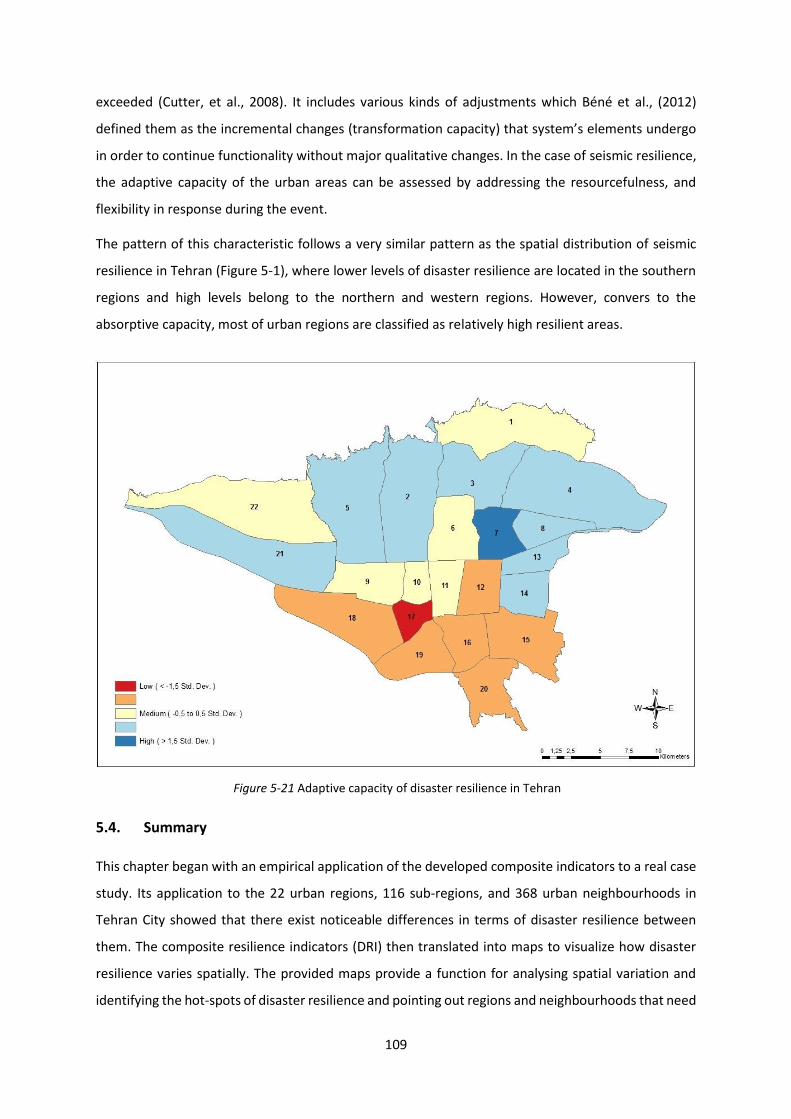
109
exceeded (Cutter, et al., 2008). It includes various kinds of adjustments which Béné et al., (2012)
defined them as the incremental changes (transformation capacity) that system’s elements undergo
in order to continue functionality without major qualitative changes. In the case of seismic resilience,
the adaptive capacity of the urban areas can be assessed by addressing the resourcefulness, and
flexibility in response during the event.
The pattern of this characteristic follows a very similar pattern as the spatial distribution of seismic
resilience in Tehran (Figure 5-1), where lower levels of disaster resilience are located in the southern
regions and high levels belong to the northern and western regions. However, convers to the
absorptive capacity, most of urban regions are classified as relatively high resilient areas.
5.4. Summary
This chapter began with an empirical application of the developed composite indicators to a real case
study. Its application to the 22 urban regions, 116 sub-regions, and 368 urban neighbourhoods in
Tehran City showed that there exist noticeable differences in terms of disaster resilience between
them. The composite resilience indicators (DRI) then translated into maps to visualize how disaster
resilience varies spatially. The provided maps provide a function for analysing spatial variation and
identifying the hot-spots of disaster resilience and pointing out regions and neighbourhoods that need
Figure 5-21 Adaptive capacity of disaster resilience in Tehran
Figure 5-23 the scatter-plot between the proposed F’ANP and DROPFigure 5-24 Adaptive capacity of disaster resilience in Tehran

110
more depth attention. They indicate that the most disaster resilient areas in the study area are located
in the north part of the city. On contrary, the less resilient scores belong to the areas that are located
in the south part of the city. To better understanding the underlying factors of disaster resilience in
the case study area, the eight extracted dimensions of resilience including built environment & social
dynamics, urban land use & dependent population, socio-cultural capacity, life quality, open space,
social capital, emergency infrastructure, and economic structure have also been delineated. The
results showed several noteworthy spatial patterns of disaster resilience. Although the spatial
patterns in some underlying dimensions are not similar to the total pattern of disaster resilience, in
general, they tend to follow the total pattern of disaster resilience (Figure 5-1). Furthermore,
classification of disaster resilience into absorptive and adaptive capacities also showed that the
northern and east parts of the city have better condition than the southern and central areas.
111
6. Discussion
The impacts of natural hazards and disasters such as earthquakes on urban communities broadly differ
and urban settlements are experiencing wide range of disasters and risks on an unheard scale. The
unpleasant consequences induced by natural hazards showed the necessity to shift from only
vulnerability assessment on better understanding how our communities can be more disaster
resilient. Therefore, the concept of disaster resilience is increasingly considered as a fundamental
objective in hazard and disaster research.
To what extend an urban area will be influenced by a major hazard event can be conceptualized w.r.t.
to disaster resilience level. Several theoretical frameworks, however, have been carried out on the
importance of disaster resilience measurement and conceptualization of the concept, and efforts are
still challenging to develop more appropriate assessment frameworks and methods for both different
contexts and scales. Although constructing a sound set of composite indicators is often mentioned as
a foundation for conceptualizing the term disaster resilience, there exist only a few number of
procedures in the state-of-the-art that present 1) building composite indicators concerning resilience
measurement, 2) quantification of the indicators for increasing our knowledge about the resilience
level of a community, and 3) comparative evaluation of study areas.
6.1. Divergent conceptualizing frameworks of disaster resilience
Increasing our understanding on the diverse processes of the disaster resilience level is the first
objective of this study. The rationale for this objective was to provide the theoretical foundation for
developing the index to measure and quantify the concept of disaster resilience. The literature
advocate that although the definition of the concept of disaster resilience is a “fuzzy” concept
(Mayunga, 2009, p. 187), from the natural point of view, it shows the extent to which a system,
community or society is able to resist, mitigate, respond, and recover from the effects of a hazard
shock in efficient way and timely manner.
The literature also indicated that resilience and sustainability are fundamental for contemporary
urban communities and a disaster resilience planning predisposes way to achieving sustainable
development. The literature reviews also showed that the concept of disaster resilience has more
potential than the concept of vulnerability in hazard research area. To understand whether our
community is a disaster resilient or not, the first step should be accurately assessment of disaster
resilience level. Because the reactions and functions of communities during and after disasters can be
viewed integrated and disaster resilience is widely addressed to understanding these interactions.
112
There exist a various models and frameworks developed in order to conceptualize the term of disaster
resilience at different hazard contexts but a standard model or mechanism is still controversial.
However, more than a decade after emphasizing on the need for more quantitative conceptualization
of disaster resilience, efforts are still challenging to develop more appropriate disaster resilience
measurement frameworks. To this end, the attention was turned to review the most well-known and
validated frameworks that can be used to identify disaster resilience indicators for earthquake-prone
areas. The selected eight quantitative frameworks include (1) the sustainable and resilient community
framework (Tobin, 1999), (2) the MEERC R4 resilience framework (Bruneau, et al., 2003), (3) the
ResiliUS framework (Miles & Chang, 2008), (4) the disaster resilience of place (DROP) model (Cutter,
et al., 2008), (5) the community disaster resilience framework (CDRF) by (Mayunga,2007), (6) the
PEOPLE resilience framework (Renschler, et al., 2010), (7) the resilience capacity index (RCI) model
(Foster, 2012), and (8) the Multi-disciplinary framework for seismic resilience (Verrucci, et al., 2012).
Although these frameworks prepare a better way to understanding disaster resilience concept,
understanding the term and developing a sound methodology for measuring it is still challenging.
Some of the most important gaps can be listed as:
1. Indicator building and identification of a standard set for measuring disaster resilience both in
different scale and different context of hazard is still ongoing debate. Since resilience is an
inherently multifaceted concept, by constructing indicator set of measurement, an approach
explicitly defines what or which aspects of resilience could or should be measured. Therefore,
selecting indicators which are relevant, robust, and representative is very vital.
2. The frameworks are also differentiated w.r.t. to the number of measurable dimensions, their
name, and the distribution of variables between them. Each measurement approach is developed
on top of a theoretical framework and required dimensions that should be incorporated in the
measurement. In most of existing literature, this process is done hierarchically and similar to
deductive methods. However, to avoid overlapping in building disaster resilience dimensions,
there is need to move beyond merely subjective manners to more systematically methods for
identifying number of dimensions and distribution of considered variables among them.
3. The quantification of interconnections among a set of indicators in most of existing approaches
have been neglected. For instance, in BRIC the impact of percent of population with a vehicle is
same as the number of population living in urban deteriorated textures. Whereas, different
variables play different role in assessment of disaster resilience. Most of the reviewed approaches
allocate an equal importance across indicators which makes the obtained results inaccurate.

113
6.2. A new methodological approach for conceptualizing disaster resilience
Conceptualizing the concept of resilience is started by establishing a measurement method and
developing benchmarking tools for better understanding the factors that contribute to resilience and
interactions that should be planned to build and enhance it. This process has been successfully
performed through developing a sound set of composite indicators in the literature. A composite
indicator aggregates numerous individual indicators to produce a synthesis measure of a
multidimensional, and multifaceted phenomena such as disaster resilience. Therefore, to answer the
research question of how the concept of disaster resilience can be operationalized in the context of
earthquake hazard, this study has proposed an augmented hybrid approach in order to construct a
sound set of composite indicators.
The case study of this research has been the three distinct urban scales of Tehran City, Iran. These
scales are 22 urban regions, 116 urban sub-regions, and 368 urban neighborhoods. For a community
such as Tehran with a prompt natural hazard like earthquake and having inherent vulnerability, the
capability to measure the resilience is a vital challenge. A robust set of composite indicators such as
those developed in this study can predispose way to accurately understand the multi-dimensional and
multi-scale patterns of disaster resilience with a particular hazard context and particular place. They
have also capacity to be applied as the current baseline conditions in the study areas in order to
monitor performance steadily, support decision- making, and promote strategies and polices for an
integrated action.
The specific steps included in this dissertation to construct a reliable composite indicator are listed as
follows:
1. Developing or application of a theoretical framework
The initial stage of a composite indicator constructing is started via developing or application of a
sound theoretical framework to provide a basis for indicator selection. As stated in Section 2.6, a
number of theoretical frameworks and models have been developed to evaluate the resilience of
communities, regions, and systems ranging from those that consider resilience as a set of engineering
functionality (Bruneau, et al., 2003); (Miles & Chang, 2008); (Renschler, et al., 2010), community
capitals (Mayunga, 2009), attributes of multi-disciplines planning (Verrucci, et al., 2012) or place-
based conceptualization of resilience (Cutter, et al., 2008).
Despite these noticeable frameworks, there is still considerable disagreement about the term disaster
resilience in general and a standard mechanism for constructing resilience metrics in order to
conceptualizing its concept in particular. It is often argued that resilience is a multi-faceted concept
that encompasses many factors (Cutter, et al., 2008); (Burton, 2012). Therefore, developing or
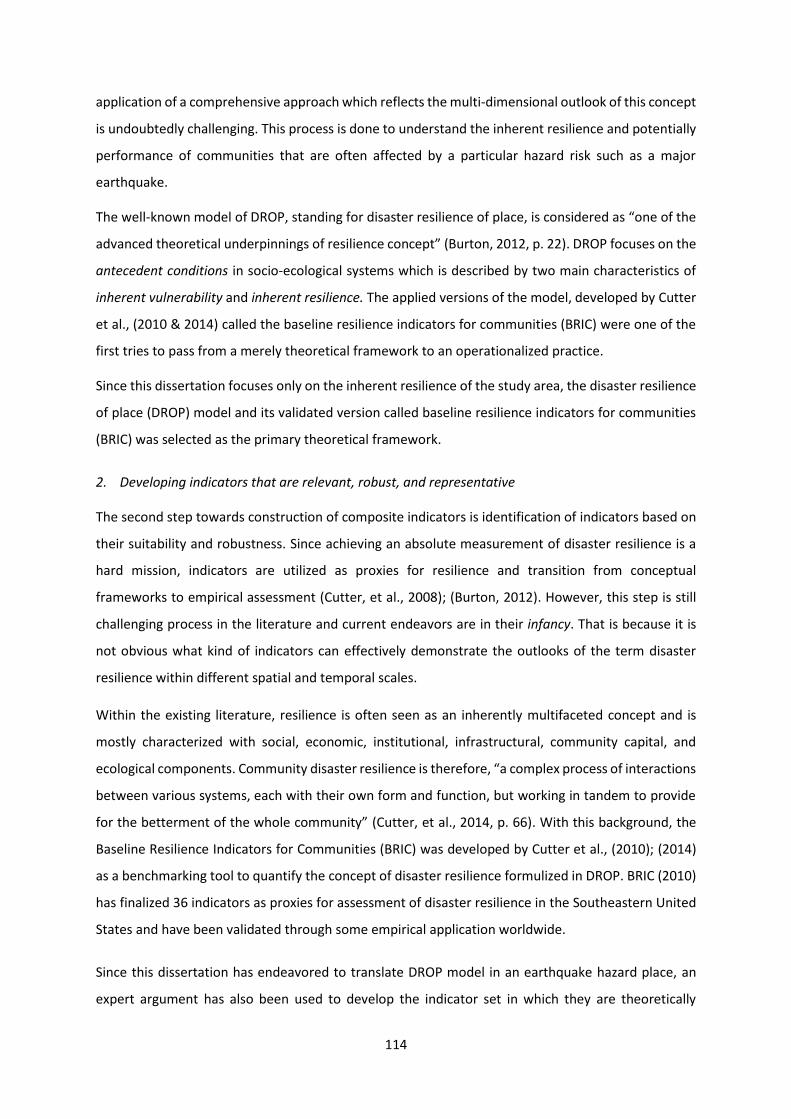
114
application of a comprehensive approach which reflects the multi-dimensional outlook of this concept
is undoubtedly challenging. This process is done to understand the inherent resilience and potentially
performance of communities that are often affected by a particular hazard risk such as a major
earthquake.
The well-known model of DROP, standing for disaster resilience of place, is considered as “one of the
advanced theoretical underpinnings of resilience concept” (Burton, 2012, p. 22). DROP focuses on the
antecedent conditions in socio-ecological systems which is described by two main characteristics of
inherent vulnerability and inherent resilience. The applied versions of the model, developed by Cutter
et al., (2010 & 2014) called the baseline resilience indicators for communities (BRIC) were one of the
first tries to pass from a merely theoretical framework to an operationalized practice.
Since this dissertation focuses only on the inherent resilience of the study area, the disaster resilience
of place (DROP) model and its validated version called baseline resilience indicators for communities
(BRIC) was selected as the primary theoretical framework.
2. Developing indicators that are relevant, robust, and representative
The second step towards construction of composite indicators is identification of indicators based on
their suitability and robustness. Since achieving an absolute measurement of disaster resilience is a
hard mission, indicators are utilized as proxies for resilience and transition from conceptual
frameworks to empirical assessment (Cutter, et al., 2008); (Burton, 2012). However, this step is still
challenging process in the literature and current endeavors are in their infancy. That is because it is
not obvious what kind of indicators can effectively demonstrate the outlooks of the term disaster
resilience within different spatial and temporal scales.
Within the existing literature, resilience is often seen as an inherently multifaceted concept and is
mostly characterized with social, economic, institutional, infrastructural, community capital, and
ecological components. Community disaster resilience is therefore, “a complex process of interactions
between various systems, each with their own form and function, but working in tandem to provide
for the betterment of the whole community” (Cutter, et al., 2014, p. 66). With this background, the
Baseline Resilience Indicators for Communities (BRIC) was developed by Cutter et al., (2010); (2014)
as a benchmarking tool to quantify the concept of disaster resilience formulized in DROP. BRIC (2010)
has finalized 36 indicators as proxies for assessment of disaster resilience in the Southeastern United
States and have been validated through some empirical application worldwide.
Since this dissertation has endeavored to translate DROP model in an earthquake hazard place, an
expert argument has also been used to develop the indicator set in which they are theoretically

115
grounded and based on the social and physical realities of the study area. Therefore, the 30 finalized
indicators in this study are not one by one translation from BRIC. This selection was based on a
comprehensive quality assessment of the metrics by considering the best fitted indicators with regards
to justification, data availability, scalability, and consistent quality (Table 4-7).
3. Data standardizing and overcoming incommensurability
Since indicators are expressed in a variety of statistical unites, ranges or scales, the third step towards
creating a suitable composite indicator set is transforming them into a common scale. Therefore, the
raw data were converted using Min-Max linear scaling into a comparable scale between 0-1 which will
illustrate corresponding variable value to each change in the resilience level.
4. Data reduction and identifying the latent components of disaster resilience
After constructing the candidate indicators of disaster resilience, a factor analysis is applied in the
fourth step to understand how these different indicators are associated to each other and how they
change in relation to each other. This process was done using the principal component analysis (PCA)
in order to data reduction and uncover latent structures of the selected indicators. To assess the
suitability and adequacy of data, three tests were performed. First, the sample size of analysis or the
ratio of cases to indicators was checked. Second, factorability of the correlation matrix was tested
using the anti-image correlation matrix which showed there are noticeable correlations amongst
indicators and coherent factors can be extracted, and Third, the Kaiser-Meyer-Olkin (KMO) measure
of sampling adequacy and Bartlett's test of sphericity have also been performed to assess the
suitability of the respondent data for factor analysis. The aim of using factor analysis was to transform
correlated indicators into a new set of uncorrelated components which are the best linear
combination of the indicators. After excluding the three indicators due to less communalities value,
the rest of 27 indicators were reduced to the eight underlying factors which are also the latent
dimensions of disaster resilience at the case study areas (Table 4-12). While the predominant
methodology for this step has been the deductive approach in the literature (e.g. BRIC 2010, 2014),
using an inductive methodology of principal component analysis (PCA), this study identified a place-
based pattern of disaster resilience that is both conceptually and theoretically sound and clearly
represents the eight latent dimensions (factors) associated with disaster resilience at the study areas.
5. Weighting and aggregating of indicators or groups of indicators
The step five is mostly referenced as a serious problem in developing composite indicators. Because
most of existing frameworks allocate an equal importance to each indicator whereas, resilience is a
multifaceted concept and different criteria could affect a community in different manner. For
weighting the extracted components/dimensions and their indicators, the study applied a hybrid

116
method. So that, the results extracted from the factor analysis (FA) are entered into the analytic
network process (ANP) in order to calculate the relative importance of each indicator and dimension
of disaster resilience. Since the AHP (hierarchical-oriented approach) only considers the hierarchies
between elements of subject, the relationships among them are not understood clearly. Whereas, the
ANP (network-oriented approach) can be used to clearly represent the higher or lower relationships
among the elements of decision-making problems. Nevertheless, to avoid inconsistency problem, the
F’ANP uses the absolute values extracted from the FA part of the study rather expert’s judgement.
Applying the ANP method caused to obtain the relative importance (weight) for each dimension and
indicator that are unequal (Table 4-20). For aggregating indicators, we used a linear additive
aggregation method in which the final disaster resilience score for each case study area was obtained.
The disaster resilience level of each urban area is therefore, the aggregated composite indicators
scores which provided a comparative assessment of community resilience for the three urban scales
of regions, sub-regions, and neighborhoods.
6.3. Visualization of the composite disaster resilience indicators
The third specific objective of this study was to provide a straightforward overview of the areas with
the potential need to improvements in their disaster resilience level and baseline indicators by
visualizing (mapping) the developed composite indicators. After computing the scores for the eight
extracted dimensions of disaster resilience and also the composite disaster resilience indicator, the
results were visualized using the Arc GIS software for better understanding of community resilience
at the study area. The logic behind this is that the composite indicators should prepare the way to
provide an accurately and rapidly illustration to decision-makers and stockholders. The three different
urban areas were ranked in the range of best and worst resilient areas using the standard deviations
from the mean value which help to better understanding the spatial patterns of disaster resilience
(Figures 5-1, 5-2, and 5-3). The results clearly illustrated the difference between the north and south
of the city. So that, the northern areas are relatively more resilient in comparison with those located
in the south or the central of city.
Furthermore, the eight dimensions associated with disaster resilience including: built environment &
social dynamics, urban land use & dependent population, socio-cultural capacity, life quality, open
space, social capital, emergency infrastructure, and economic structure have been delineated
separately at two formal scales of urban regions and sub-regions (Figures 5-3 to 5-19). There were
several significant spatial patterns. For example, while the northern areas of the city have appropriate
conditions in terms of quality of buildings and social dynamics, the southern parts have many
difficulties regarding them. On contrary, the northern parts have high population and building density

117
and therefore, there are less resilient than the southern and western parts. However, the spatial
variation among the eight dimensions of disaster resilience derived from this study proves the overall
multidimensional nature of the concept as well as the usage of visualized disaster resilience at its
subcomponents level.
6.4. Validity and reliability of the results
The last step towards constructing a composite indicator is the validation and verification of the
model. Validation is a set of methods for judging a model’s accuracy in making relevant predictions
(Eddy, et al., 2012). Model validation is usually applied in order to examine the reliability of theories
and underlying assumptions of a conceptual framework (Edward & Rykiel, 1996). Tacker et al., (2004)
defined validation as a statistical process that determines the degree to what extend the proposed
model is an accurate representation of the real world. Validation is applied in this study to examine
the validity of the proposed disaster resilience composite indicators and be assured that it provides a
suitable measure that captures the overall disaster resilience within 22 regions, 116 sub-regions, and
368 neighborhoods of Tehran City.
Although there are several techniques for model validation, the five main types of them are “face
validity, internal validity (verification), cross validity, external validity, and predictive validity” (Eddy,
et al., 2012, p. 846). Cross-validation (also called comparative modeling or model corroboration) is
one of the most applied of them which involves testing different models that address the same
underlying phenomena and comparing their findings (Kopec, et al., 2010); (Eddy, et al., 2012). Then
differences among the findings and their causes are evaluated. Confidence in a result is augmented if
similar findings are calculated by models using different methods (Kopec, et al., 2010). Because when
different items are criteria of the same measurement, their findings will be empirically related to each
other (Zebardast, 2013).
The DROP model developed by Cutter et al., (2008) and its later version called BRIC is known for being
one of the pioneers of developing a robust baseline for constructing indicators involved in the
measurement and monitoring of the disaster resilience. This baseline indicators such as social,
economic, institutional, infrastructure, community capital, and environmental system have been
applied first to countries within the South-eastern United States as a proof of its concept and then
have been applied and validated in different areas with distinct disasters such as Baseline Situation of
Mississippi Gulf Coast (Burton, 2012), and Sunshine Coast in Australia (Peterson, et al., 2014)
In this study, the findings of the applied model (F’ANP) are compared with the results obtained by
applying DROP. On the other hand, we first apply DROP model with its own structure to the same data
set and the results for the eight extracted dimensions of disaster resilience and also their indicators

118
are obtained. It should be noted that this calculation has been performed for the total 368 urban
neighbourhoods, but the results were transformed into the 22 urban regions (Table 6-1).
Table 6-1 Disaster resilience scores applying F’ANP, and DROP Models
For better understanding the relation between the two obtained results, we used a scatter plot which
indicates the relationship between two quantitative variables measured on the same individuals and
both relate to the same event. A scatter plot (also known a scatter diagram) may be positively related,
negatively related, or unrelated. Positively related variables indicate that when one variable increases,
the other variable tends to increase too and vice versa. On contrary, a negative related variable
indicates that when one variable increases or decreases, other variable tends to do the opposite. Un-
related variables indicate that no relationship is seen between the changes in the two variables.
Urban Regions F’ANP DROP
1 0,2281 0,5750
2 0,2345 0,5816
3 0,2257 0,5691
4 0,2391 0,5972
5 0,2327 0,5777
6 0,2089 0,5280
7 0,2359 0,5838
8 0,2402 0,5936
9 0,2275 0,5619
10 0,2163 0,5462
11 0,2281 0,5644
12 0,2019 0,5211
13 0,2389 0,5913
14 0,2311 0,5740
15 0,2105 0,5273
16 0,2059 0,5282
17 0,2110 0,5264
18 0,2235 0,5658
19 0,2148 0,5353
20 0,2093 0,5322
21 0,2375 0,5781
22 0,2331 0,5759
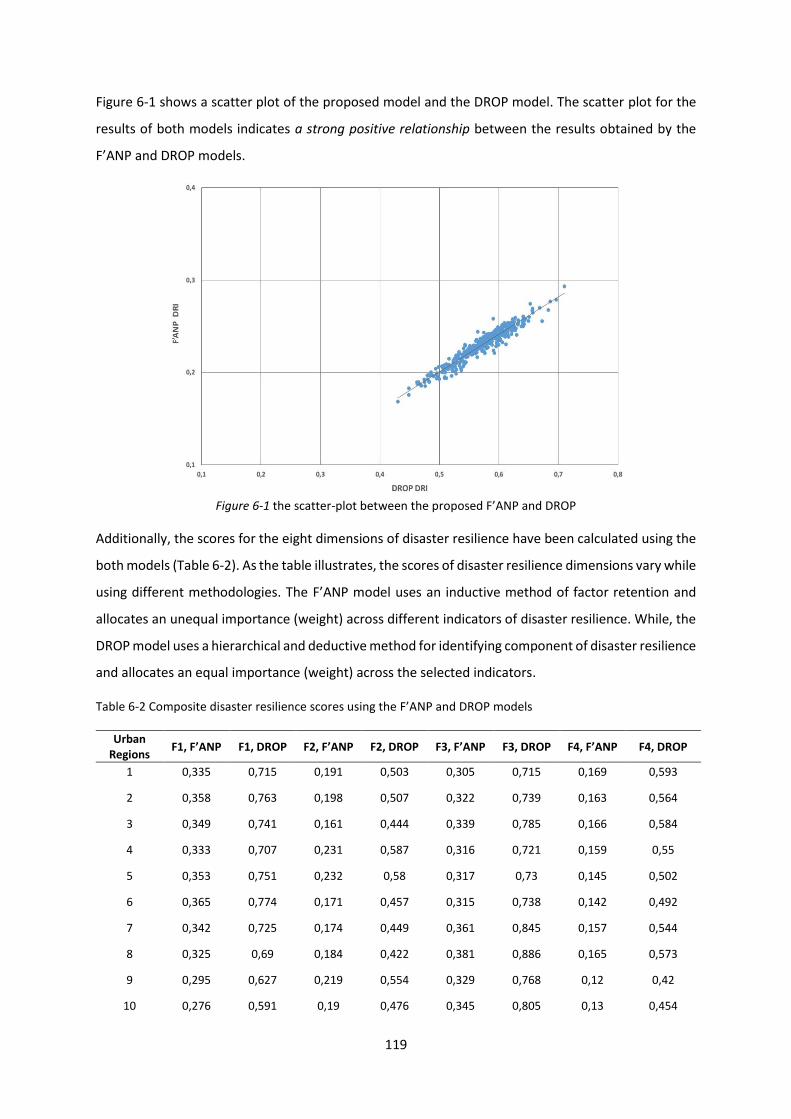
119
Figure 6-1 shows a scatter plot of the proposed model and the DROP model. The scatter plot for the
results of both models indicates a strong positive relationship between the results obtained by the
F’ANP and DROP models.
Additionally, the scores for the eight dimensions of disaster resilience have been calculated using the
both models (Table 6-2). As the table illustrates, the scores of disaster resilience dimensions vary while
using different methodologies. The F’ANP model uses an inductive method of factor retention and
allocates an unequal importance (weight) across different indicators of disaster resilience. While, the
DROP model uses a hierarchical and deductive method for identifying component of disaster resilience
and allocates an equal importance (weight) across the selected indicators.
Table 6-2 Composite disaster resilience scores using the F’ANP and DROP models
Urban Regions
F1, F’ANP F1, DROP F2, F’ANP F2, DROP F3, F’ANP F3, DROP F4, F’ANP F4, DROP
1 0,335 0,715 0,191 0,503 0,305 0,715 0,169 0,593
2 0,358 0,763 0,198 0,507 0,322 0,739 0,163 0,564
3 0,349 0,741 0,161 0,444 0,339 0,785 0,166 0,584
4 0,333 0,707 0,231 0,587 0,316 0,721 0,159 0,55
5 0,353 0,751 0,232 0,58 0,317 0,73 0,145 0,502
6 0,365 0,774 0,171 0,457 0,315 0,738 0,142 0,492
7 0,342 0,725 0,174 0,449 0,361 0,845 0,157 0,544
8 0,325 0,69 0,184 0,422 0,381 0,886 0,165 0,573
9 0,295 0,627 0,219 0,554 0,329 0,768 0,12 0,42
10 0,276 0,591 0,19 0,476 0,345 0,805 0,13 0,454
Figure 6-1 the scatter-plot between the proposed F’ANP and DROP
Figure 6-2 the scatter-plot between the proposed F’ANP and DROP

120
11 0,308 0,654 0,204 0,519 0,324 0,759 0,133 0,464
12 0,253 0,538 0,228 0,59 0,227 0,547 0,15 0,528
13 0,334 0,716 0,213 0,534 0,353 0,817 0,169 0,585
14 0,322 0,685 0,198 0,488 0,361 0,837 0,167 0,58
15 0,262 0,561 0,233 0,57 0,291 0,669 0,147 0,512
16 0,245 0,528 0,231 0,594 0,275 0,632 0,135 0,463
17 0,249 0,537 0,213 0,543 0,307 0,71 0,125 0,442
18 0,281 0,605 0,265 0,66 0,257 0,591 0,146 0,518
19 0,267 0,576 0,259 0,642 0,27 0,62 0,123 0,436
20 0,272 0,584 0,238 0,597 0,256 0,596 0,133 0,462
21 0,334 0,712 0,258 0,588 0,283 0,656 0,149 0,526
22 0,332 0,713 0,269 0,675 0,235 0,536 0,149 0,52
Urban Regions
F5, F’ANP F5, DROP F6, F’ANP F6, DROP F7, F’ANP F7, DROP F8, F’ANP F8, DROP
1 0,375 0,679 0,182 0,483 0,079 0,357 0,186 0,552
2 0,386 0,699 0,215 0,57 0,068 0,30 0,17 0,504
3 0,345 0,625 0,196 0,518 0,080 0,355 0,168 0,498
4 0,379 0,687 0,211 0,56 0,085 0,375 0,198 0,587
5 0,353 0,64 0,201 0,531 0,072 0,321 0,188 0,562
6 0,271 0,492 0,158 0,416 0,077 0,345 0,17 0,506
7 0,344 0,623 0,2165 0,571 0,068 0,349 0,224 0,662
8 0,387 0,702 0,225 0,597 0,079 0,355 0,172 0,519
9 0,409 0,741 0,218 0,576 0,072 0,328 0,157 0,477
10 0,344 0,623 0,172 0,454 0,093 0,425 0,179 0,539
11 0,4 0,726 0,2 0,529 0,067 0,297 0,187 0,563
12 0,291 0,528 0,203 0,54 0,080 0,352 0,181 0,542
13 0,387 0,702 0,217 0,576 0,063 0,28 0,173 0,517
14 0,342 0,62 0,227 0,602 0,059 0,265 0,17 0,511
15 0,314 0,569 0,208 0,553 0,066 0,29 0,162 0,485
16 0,293 0,531 0,192 0,508 0,104 0,46 0,17 0,506
17 0,349 0,642 0,221 0,58 0,062 0,274 0,16 0,481
18 0,377 0,725 0,207 0,552 0,068 0,326 0,184 0,545
19 0,346 0,628 0,2 0,531 0,067 0,305 0,184 0,54
20 0,288 0,523 0,236 0,628 0,082 0,37 0,167 0,494
21 0,436 0,791 0,192 0,509 0,077 0,343 0,169 0,495
22 0,427 0,775 0,218 0,575 0,082 0,352 0,152 0,457

121
For better understanding the relationship between the scores of disaster resilience dimensions in both
models, the Pearson’s correlation coefficients between the F’ANP model and the DROP model were
calculated (Table 6-3). A correlation coefficient of 0.976 (statistically significant at 0.01 level) between
the two mentioned models for disaster resilience index indicates that both methodologies address
the same underlying phenomena.
Table 6-3 Correlation between the F’ANP model and DROP
F’ANP Model Correlation DROP Model
Disaster resilience index (DRI) 0.976 BRIC
F’ANP FS1 – Built environment & social dynamics 0.973 FS1
F’ANP FS2 – Urban land use & dependent population 0.984 FS2
F’ANP FS3 – Socio-cultural capacity 0.956 FS3
F’ANP FS4 – Life quality 0.987 FS4
F’ANP FS5 – Open space 0.994 FS5
F’ANP FS6 – Social capital 0.980 FS6
F’ANP FS7 – Emergency infrastructure 0.965 FS7
F’ANP FS8 – Economic structure 0.952 FS8
These findings validate the results obtained by using F’ANP model. All the correlation coefficients for
the different dimensions of disaster resilience for both models are also highly correlated. This proves
the obtained results by the proposed model is trustable. It should be noted that the DROP assigns
equal weights for extracted dimensions of disaster resilience whereas in our developed model, the
indicators and dimensions are given an unequal weights using the ANP technique. Otherwise, the
results of both models would have been the same.
Furthermore, to assess reliability of the obtained results, they were compared with the result of JICA
(2000) study. The study has evaluated the vulnerability of the Tehran’s urban regions in case of a
potential earthquake. The six main criteria have been applied for assessing and ranking the 22 urban
regions of the city including: 1) intensity of seismic, 2) ratio of building damages, 3) ratio of losses, 4)
population density, 5) open space, and 6) ratio of narrow roads. The results concluded that the most
vulnerable urban regions are located in the southern areas and the least vulnerable of them are in the
northern parts of the city (see Figure 3.4). Here, we consider that there is an overlap between the
concept of resilience and vulnerability (Cutter, et al., 2008) which is in contrary with other
conceptualization of these concept that see them oppositional (Timmerman, 1981).
Similarly, the results obtained by our study indicated that the most disaster resilient regions are
located in the northern parts of the city and the less resilient regions belong to the southern parts of
the city. A correlation coefficient of 0.704 (statistically significant at 0.01 level) between the two

122
results proves that the proposed framework to construct a composite indicator for measuring disaster
resilience at the study area is trustable.
6.5. Methodological comprehensiveness for urban resilience assessment
Although the proposed methodology in this study has selected BRIC model as the theoretical
framework for indicator building, there are several areas in the methodology in which they differ. The
first difference refers to the second step of the methodology or indicator selection process (Section
4.3). Here an expert argument has been used to understand whether the original indicator set of BRIC
model can be applied in the context of earthquake hazard in Tehran. This argument caused to exclude
some indicators such as percent population with a vehicle and include some others that have not been
considered in the origin model (e.g. percent of urban deteriorated textures, building density, access
to fire station, etc.).
The second difference between the developed methodology and BRIC model is the method of
categorization or identifying component of disaster resilience. The predominant approach in the
literature is the deductive and similar to hierarchical approach (e.g. Cutter et al.,2010 & 2014;
Mayunga 2009, Renschler 2010). In BRIC for example, this process has been done deductively in which
the concept of disaster resilience is decomposed into the five main components of social, economic,
institutional, infrastructural, and community capital (Cutter, et al., 2010, p. 8). Whereas in our
methodology, an inductive method of principal components analysis (PCA) was applied to better
understanding of the interactions among the 30 selected indicators and extracting the latent patterns
of them as well as the eight associated dimensions (Table 4-12). An inductive approach has high
capacity for extracting the latent patterns of a complex, multidimensional, and meaningful
phenomena such as disaster resilience and can easily be adapted to different geographical units and
scales (Winderl, 2014).
The third characteristic of the developed methodology refers to the weighting process or the fifth step
of composite indicator building. Most of existing models as well as BRIC use equally weighting method
and argue that there is no “theoretical or practical justification for the differential allocation of
importance across indicators” (Cutter, et al., 2010, p. 12). Whereas disaster resilience is a multifaceted
concept and various variables may affect the term differently within a distinct spatial and temporal
scale. With this background and in order to differential allocation of importance (weighting) across
indicators, we have applied a hybrid factor analysis and analytic network process (F’ANP) model. In
this step, the extracted dimensions of disaster resilience and their primary variables along with their
absolute measurements are entered into a network model in analytic network process (ANP). The
logic of ANP predisposes to consider the interdependencies among the all indicators and provides a
123
different relative importance (unequal weight) for each of the selected indicators (Table 4-20). Most
of the multi-criteria decision making (MCDM) methods, including analytic network process (ANP), use
a subjective manner (expert opinions) for calculating the relative importance of the decision elements
of a subject matter. This is often considered as one of the important limitations of the MCDMs
(Zebardast, 2013). This is because the judgement of experts may differ for the same issue where
inconsistency in judgement should be checked (Asadzadeh, et al., 2015). Applying the hybrid F’ANP
model has diminished this inherent limitation of MCDMs by replacing subjective judgments with the
absolute measurements of the decision elements that have already been computed in factor analysis
(Table 4-10 and 4-11).
Finally, the methodology applied in this study provided not only the multi-dimensional nature of
disaster resilience in the context of earthquake hazard but also displayed the multi-scale patterns of
the concept at three different scales of urban regions, sub-regions, and neighbourhoods. This means
that the model has flexibility to conceptualize a complex and multi-dimensional phenomena such as
resilience, and can be translated into different hazard contexts and geographical scales.
6.6. Incorporating disaster resilience into urban planning
It is highly likely that an earthquake hazard will in near future occur in Tehran and its affects will be
much sever than other similar earthquakes in other parts of the country. “An emphasis on resilience,
rather than just disaster response and recovery has become a mainstream idea in disaster reduction”
(Collins, 2009, p. 103). Whiles disaster risk reduction persists to recognize and reduce vulnerabilities
and risks, resilience is rather defensive and also innovative in implying coping and adaptation (Van
Niekerk, 2013). Developing assessment methods and management plans to identify those
characteristics that prevent effective response and support analysis of the adverse impacts is one of
the primary steps of understanding disaster resilience besides determining the baseline statuses.
(Cutter, et al., 2008). This shift from merely conceptual underpinning (framework) to an actual
evaluation leads to identify the multi-component character of disaster resilience as well as those eight
dimensions that have been identified for the context of earthquake hazard in Tehran City.
Many aspects (dimensions) of disaster resilience are related to urban planning, and the
implementation of urban plans. Therefore, urban planning tools as well as land use planning have
often been addressed to build disaster resilience within urban communities (Mileti, 1999); (Godschalk,
2003); (Pinho, 2010); (UNISDR, 2012). The rational for this argument is based on that integrating
natural hazards mitigation into land-use planning can contribute to enhancing disaster resilient within
communities through the four fundamental attributes such as: “intelligence, problem solving,
advanced planning, and management strategies” (Burby, et al., 2000, p. 100).

124
Mitigation involves not only avoiding additional development in vulnerable areas of a community, but
also making existing developments in hazard-prone areas safer. To this end, the new constructions as
well as housings and infrastructures located in hazard-prone areas should be constructed more
damage-resistant and resilient. Urban land use planning has high potentials and tools to perform this
task including buildings code, design standards, and construction practices. Furthermore, renovation
and retrofitting of existing unsustainable textures and infrastructure should be considered using
persuasive and protection packages. Such a strategy in the case of Tehran is very vital, because about
15% of its population are living in 3269 hectares of urban deteriorated areas which are described with
three characteristics such as: fine grained residential textures, blocks with low accessibility, and
buildings with less durable materials.
There is a consensus to strengthen the legal planning frameworks and tools in urban areas to support
resilience. Local governments should develop a variety of regulatory and non-regulatory techniques
such as land-use, warnings, engineering and building codes, and insurance (Mileti, 1999); (Godschalk,
2003). However, land use planning in developing countries as well as Iran has so far a limited role in
reducing risks and induced vulnerabilities from natural disasters, and the concept of disaster resilience
has not been incorporated into the regular land use planning system.
Since urban land use plans state community goals, principles, and actions, their integrating into
disaster resilience principles and formulating through a participatory process can lead to make a plan
that serves several purposes (Burby, et al., 2000). First, this plan-making process could be a real way
to build an agreement (Godschalk, et al., 1999). For example, disaster resilience assessment informs
community about the type of disaster, its aspects, and level of existing potential performance within
urban districts. Second, the plan coordinates community agendas. Disaster resilience principles can
be incorporated with economic section, environment policy, housing, and infrastructure regulations
(Burby, et al., 2000). This leads avoiding uncoordinated and possibly conflicting policies and actions
and creating a logical relationship (coordination) between public interest and implementation
activities (Mileti, 1999). Finally, the plan articulates land-use policy, guiding public officials,
stakeholders, institutions, particularly planners, architects, engineers, disaster and risk reduction
management to address risk reduction and resilience in a comprehensive manner (UNISDR, 2012).
125
7. Conclusion and Further Work
7.1. Conclusion
There is currently a trend of attention on the concept of resilience and its influence on making
communities more secure against natural hazards and disasters which take places at global, national,
and local scales. Many attempts have been endeavoured by active scholars in this subject to build a
fundamental step towards disaster risk reduction through measuring resilience level and exploring its
cause and effect on a community. Although constructing a composite indicator has been addressed as
an efficient way for conceptualizing disaster resilience, there is no agreement upon a standard
procedure in the literature for quantifying the concept. Addressing this controversial debate in the
literature has been the main purpose of this dissertation.
This dissertation defined the concept of disaster resilience in the context of earthquake hazard and
conceptualized it to discover the latent context-specific components that are associated with the
concept of resilience. The conclusions of the main findings of this research can be summarized as
follows:
First, looking into the evidence accumulated from the procedure of composite indicators building in
this study, we achieved the primary goal that was to increase our knowledge about the multi-
dimensional and multi-scale characteristics of disaster resilience concept through developing a sound
and validated set of composite indicators. The findings of this study provided convincing empirical
evidence that the constructed composite indicators have potential to enhance our knowledge about
the multifaceted concept of disaster resilience.
Second, the methodology developed in this study which involves developing or implementation of a
theoretical framework, selection of a robust, relevant, and representative indicator set,
standardization, data reduction and identifying latent dimensions, weighting and aggregation, and
visualization and validation, appeared to be theoretically sound and practically useful.
Third, there is an ongoing need in disaster research to have a reliable, valid, and well-tested measure
to use in assessing and quantifying community disaster resilience. The composite disaster resilience
indicators developed in this study are based on those premises. This measurement was tested using a
combination of a hybrid factor analysis and analytic network process (F’ANP) model, and GIS
techniques to visualize the results. Based on the findings of this study, it is reasonable to conclude that
the conducted measurement is theoretically and empirically valid and reliable.

126
Finally, the achievements are potentially promising considering the initial objectives of this study that
can attract attention of the community to solve the existing problems. Furthermore, this can make
the governments and decision makers more aware of the realistic state of the community (urban
regions or sub-regions) and required functions on the factors affecting the resilience level.
7.2. Research contribution
From a theoretical perspective, the research has significant contributions to the disaster resilience
literature in the hazard and disaster research. First, it has generally contributed the current state of
the knowledge on the concept of disaster resilience. Second, although several theoretical frameworks
have been carried out on the importance of disaster resilience concept, only a few of suggest how the
concept can be operationalized.
This research has contributed this knowledge gap by developing a methodology-oriented approach
for composite indicator building that includes applying a sound theoretical framework, identifying a
set of relevant and representative indicator set, data standardization, data reduction and identifying
latent dimensions, weighting and aggregation, and visualization and validation.
More importantly, for data reduction and underlying latent dimensions of disaster resilience and also
weighting and aggregation of indicators, this study presented a hybrid factor analysis (FA) and analytic
network process (ANP) called F’ANP model. The F’ANP uses factor analysis (FA) to extract the
underlying dimensions of the phenomena and reduce the data by re-grouping correlated indicators
into uncorrelated clusters called factors. Then to calculate the relative importance of each component
and the variables in each component, they are entered into the analytic network process (ANP). This
methodology is significant in two distinct ways: 1) it replaces the hierarchically and similar to deductive
methods in the literature with the inductive method of factor analysis, and 2) it applies an unequal
weighting method instead of an equal weighting method where the inter-dependencies and feedbacks
among all indicators are considered.
In this dissertation, a systematic methodology for constructing a sound set of composite indicator is
followed in which can be applied by the scholars of other disciplines (e.g., urban planning, sustainable
development, risk-management, engineering, and social and economic studies) as a step-by-step
guideline. Through the constructing a robust and reliable composite indicator, the study also highlights
the hot-spots of disaster resilience at the three different scales (neighborhoods, sub-regions, and
regions) which can be addressed by those departments that are dealing with urban disaster risk
reduction and resilience. This research presents an innovative place-based quantitative hybrid
approach for conceptualizing disaster resilience that also considers the interactions of various

127
components and subcomponents of the disaster resilience concept. The trustable measurement of
urban regions and sub-regions resilience and visualization of their scores provided a straightforward
and comparative assessment of where strengthen and recovery in level of disaster resilience and the
baseline indicators are needed more.
Understanding whether the defined dimensions influence the resilience level of the case study
positively (enhance resilience) or negatively (inhibit resilience) can be led to prioritize the required
actions that could be reformed towards increasing the resilience level in general which are listed as:
1) reducing the destructive effects by focusing on absorptive capacity (persistence), 2) speeding up
the recovery time by enhancing adaptive capacity (incremental adjustment), and 3) establish the
required actions to increase the adaptation by accelerating transformative capacity (transformational
response). Therefore, it is highly expected that the results of this study can help in initiating further
research interests in hazard and risk-reduction research area.
7.3. Further work
The procedure of composite indicators building, introduced in this dissertation, has the potential to
be improved by several ways as well as flexibility and transparency in the procedures of composite
indicator building, utilization, and adjustment. First of all, there is a need to clearly understand what
the composite indicator is aimed to conceptualize and monitor. In this dissertation, the process of
composite indicators design was utilized to conceptualize the concept of disaster resilience in the
context of earthquake hazard in Tehran. However, in order to optimize the presented procedures and
to generalize it to other natural or man-made disasters, improving the process of composite indicators
building and an expansion to further additional case studies are aspired.
The composite indicator should be designed in a flexible manner. This means that each of its stage as
well as structure scheme, variable selection, weighting and aggregation techniques, visualization, and
validation methods can be easily modified over the process. A sound composite indicator should also
have high standard in both methodology and result.
Furthermore, composite indicators should be based on trustable, valid, and available data sources.
There is however, a common challenge in composite indicators construction related to data limitations
in particular when the study area is smaller. Although this research was based on combination of
primary and secondary data, more refined field survey data on adaptive capacity indicators as well as
disaster emergency response plan, recovery plan, and other social capital parameters, may improve
the results of further research.

128
As stated, disaster resilience is a multidimensional phenomenon, which includes many factors.
Validation of such a measure is often problematic. Thus, further research needs to focus on developing
more external criteria. This is a serious problem in communities such as Tehran because there is no
similar study to be addressed. Furthermore, it is expected that a disaster resilient city will need a
shorter time to recover while it will be a long-lasting process for the ones with less disaster resilience
level. However, this kind of data cannot be extracted from secondary data and it needs more
empirically results (data observed over time as well as space).

129
References
Adger, N. et al., 2005. Social- ecological resilience to coastal disasters. Journal of Science, 309(5737),
pp. 1036-1039.
Adger, W., 2000. Social and ecological resilience: Are they related?. Prograss in Human Geography,
24(3), pp. 347-364.
Adger, W. N. et al., 2004. New indicators of vulnerability and adaptive capacity, s.l.: Tyndall Centre
for Climate Change Research .
Ainudin, S. & Routray, J. K., 2012. Community resilience framework for an earthquake prone area in
Baluchistan. International Journal of Disaster Risk Reduction, 2(2012), pp. 25-36.
Alexander, D., 2012. What can we do about earthquakes ? Towards a systematic approach to seismic
risk mitigation. Davos, Switzerland, NZSEE Conference.
Amini Hosseini, K., Hosseini, M., Jafari, M. & Hosseinioon, S., 2009. Recognition of vulnerable urban
fabrics in earthquake zones: A case study of Tehran Metropolitan Area. Journal of Seismology and
Earthquake Engineering, 10(4), pp. 2-13.
Aminifard, H., 2015. The insolved problems of urba deteriorated textures of Tehran [Interview] (7
May 2015).
Anderies, J., Janssen, A. & Ostorm, E., 2004. A framework to analyze the robustness of social-
ecological systems from an institutional perspective. Ecology and Society, 9(1), pp. 9-18.
Asadzadeh, A., Kötter, T. & Zebardast, E., 2015. An augmented approach for measurement of
disaster resilience using connective factor analysis and analytic network process (F’ANP) model.
International Journal of Disaster Risk Reduction.
Asadzadeh, A., Kuamr, S., Mahmoudi, F. & Kötter, T., 2014. Assessing site selection of new towns
using TOPSIS method under entropy logic: A case study: New Towns of Tehran Metropolitan Region
(TMR). Environmental Mangement and Sustainable Development, 3(1), pp. 123-137.
Ashtiani, M. & Hosseini, K., 2005. Disaster risk management profile Tehran , Iran, Tehran, Iran:
International Institute of Earthquake Engineering and Seismology, IIEES.
Bahadur, A., Ibrahim, M. & Tanner, T., 2010. The resilience renaissance ? Unpacking of resilience for
tackling climate change and disasters, Brighton, UK: Strengthening Climate Resilienec Discussion
Paper 1.
Balica, S., Douben, N. & Wright, N., 2009. A network of knowledge on applying an indicator-based
methodology for minimizing flood vulnerability. Hydrological Processes, 23(20), pp. 2983-2986.
Barnett, J., Lambert, S. & Fry, I., 2008. The hazards of indicators: Insights from the Environmental
Vulnerability Index. Annals of the Association of American Geographers, 98(1), pp. 102-119.
Belkhiri, L., Boudoukha, A. & Mouni, L., 2011. A multivariate statistical analysis of groundwater
chemistry data. International Journal of Environmental Research (IJER), 5(2), pp. 537-544.
Béné, C., Godfrey, R., Newsham, A. & Davis, M., 2012. Resileince: New utopia or new tyranny?
reflection about the potentials and limits of the concept of resilience in relation to vulnerability
reduction programmes, Birighton, UK: Institute of Development Studies (IDS).

130
Bepetista, S., 2014. Design and use of composite indices in assessment of climate change
vulnerability and resilience , Arlington,USA: United States Agency International Development
(USAID).
Berberian, M. & Yetas, R., 2001. Contribution of archaeological data to studies of earthquake history
in the Iranian plateau. Journal of Structural Geology, 23(2), pp. 563-584.
Birkmann, J., 2006. Measuring vulnerability to natural hazards. Tokyo, new York, Paris: United
Nations University Press.
Birkmann, J., 2007. Risk and vulnerability indicators at different scales: applicability, usefulness and
policy implications. Environmental Hazards, 7(1), pp. 20-31.
Blurchi, M., 2013. Silent earthquake in Tehran. [Online]
Available at: http://www.entekhab.ir/fa/news/140733/
[Accessed 10 December 2013].
Booysen, F., 2002. An overview and evaluation of composite indices of development. Social
Indicators Research, 59(2), pp. 115-151.
Bruneau, M., 2007. The 4 R's of resilience and multi-hazard engineering. Ney York: MCEER.
Bruneau, M. et al., 2003. A framework to quantitatively assess and enhance the seismic resilience of
communities. Earthquake Spectra, 19(4), pp. 733-752.
Bukistra, E. et al., 2010. The components of resilience–perceptions of an Australian rural community.
Comm Psychol, 38(8), pp. 975-990.
Burby, R., Deyle, R., Godschalk, D. & Olshansky, R., 2000. Creating hazard resileint communities
through land-use planning. Natural Hazrads Review, 1(2), pp. 99-106.
Burton, C. G., 2012. The development of metrics for community resilience to natural diasaters,
Colombia: University of South Carolina.
Carpenter, S., Walker, B., Anderiea, J. M. & Abel, N., 2001. From metaphor to measurement:
Resilience of what to what?. Ecosystems, 4(8), pp. 765-781.
CARRI, 2013. Definitions of community resilience: An analysis, washington DC: Meridian Institute.
Change, S. & Shinozuka, M., 2004. Measuring and improving the disaster resilience of commuities.
Earthquake Spectra, 20(3), pp. 739-755.
Cimellaro, G., Reinhorn, A. M. & Bruneau, M., 2006. Quantification of seismic resilienec.
Sanfrancisco, 8th U.S. National Conference on Earthquake Engineering .
Collins, A., 2009. Disaster and development. First edition ed. New york: Routledge.
Comrey, A., 1973. A First Course in Factor Analysis. New York: Academic Press.
Costello, A. & Osberne, J., 2005. Best practices in exploratory factor analysis: Four recommendations
for getting the most from your analysis. Practical Assessment, Research & Evaluation, 10(7), pp. 1-9.
Cutter, S., Ash, K. D. & Emrich, C., 2014. The geographies of community disaster resilience. Global
Environmental Change, Volume 29, pp. 65-77.
Cutter, S. et al., 2008. A place-based model for understanding community resilience to natural
disasters. Global Environmental Change, 18(4), pp. 598-606.

131
Cutter, S., Boruff, B. & Shirley, W., 2003. Social vulnerability to environmental hazards. Social
Sciences Quarterly, 84(2), pp. 242-261.
Cutter, S., Burton, C. & Emrich, C., 2010. Disaster resilience indicators for benchmarking baseline
conditions disaster resilience indicators for benchmarking baseline conditions. Journal of Homeland
Security and Emergency Management, 7(1), pp. 1-22.
Cutter, S. L., Boruff, B. J. & Shirley, W. L., 1996. Social vulnerability to environmental hazards. Social
Science Quarterly, 84(2), pp. 242-261.
Decancq, K. & Lugo, M., 2013. Weights in multidimensional indices of wellbeing: An overview.
Econometric Reviews, 32(1), pp. 7-34.
Derissen, S., Quaas, M. & Baumgärtner, S., 2011. The relationship between resilience and
sustainability of ecological-economic systems. Ecological Economic, 70(6), pp. 1121-1128.
Desbois, D., 2014. researchgate.net. [Online]
Available at:
https://www.researchgate.net/post/How_important_is_transforming_the_data_before_PCA
[Accessed 11 July 2016].
Downing, T., 1991. Vulnerability to hunger in Africa : A climate change perspective. Global
Environmental Change, 1(5), pp. 365-380.
Eddy, M. et al., 2012. Model transparency and validation: A report of the ISPOR-SMDM modeling
good research practices task force-7. Value in Health, 15(2012), pp. 843-850.
Edward, J. & Rykiel, J., 1996. Testing ecological models: the meaning of validation. Ecological
modelling, 90(1996), pp. 229-244.
Europeian Commisssion, 2014. Composite indicators building: 10 step guide. [Online]
Available at: https://composite-indicators.jrc.ec.europa.eu/?q=content/about-us
[Accessed June 18 2015].
Europiean Commission, 2008. Handbook on constructing composite indicators: Methodology and
user guid. Paris: OECD Publications.
Fabriger, L., Duane, T., MacCallum, R. & Strahan, E., 1999. Evaluating the use of exploratory factor
analysis in psychological research. Phsycological Methods, 4(3), pp. 272-299.
Fekte, A., 2009. Validation of a social vulnerability index in context to river-floods in Germany.
Natural Hazards and Earth System Science, 9(2), pp. 393-403.
Field, A., 2000. Discovering statistics using SPSS for windows. London: Sage publications.
Field, A., 2005. Discovering statistics using SPSS. 2nd edition ed. London: Sage.
Fitzgibbon, C., 2014. Progress to date with measuring resilience in the Horn of Africa (Technical brief),
Bern: Federal Department of Foreign Affairs ( FDFA).
Folke, C., 2006. Resilience: The emergence of a perspective for social-ecological systems analysis.
Global Environmental Change, 16(3), pp. 253-2267.
Folke, C. et al., 2010. Resilience thinking: Integrating resilience, adaptability and transformability.
Ecology and Society, 15(4), p. 20.

132
Folke, C., Colding, J. & Berkes, F., 2003. Synthesis: Building resilience and adaptive capacity in social-
eclogical systems. Navigating Social–Ecological Systems, 14(3), pp. 352-387.
Foster, K., 2006. A case study approach to understanding regional resilience network. Buffalo:
University of Buffalo.
Foster, K. A., 2012. Resilience capacity index (RCI), Buffalo: Building Resilience Regions, University of
California Berkeley.
Frankenber, E. et al., 2013. Education, vulnerability, and resileince after a natural disaster. Ecology
and Society, 18(2), p. 16.
Frankenberger, T. & Nelson, S., 2013. Resilience measuremnet for food security. Tuscano, Arizona:
TANGO international.
Gilbert, S. W., 2010. Disaster resilience: A guide to the literature, Gaithersburg, Maryland: National
Institute of Standards and Technology.
Godschalk, D., Beately, T., Brower, D. & Kaiser, E., 1999. Natural hazard mitigation: Recasting
disaster policy and planning. Washington D.C: Island Press.
Godschalk, D. R., 2003. Urban hazard mitigation: Creating resilient cities. Natural Hazards Review,
4(3), pp. 136-143.
Graugaard, J. D., 2012. A tool for building community resilience? A case study of the Lewes Pound.
Local Environment: The International Journal of Justice and Sustainability, 17(2), pp. 243-260.
Green, R. P., 2010. ResilUS: Modeling community recovery from disasters. [Online]
Available at: https://huxley.wwu.edu/ri/resilus
[Accessed 13 08 2015].
Gunderson, L. & Folke, C., 2005. Resilience- Now more than ever. Ecology and Society, 10(2), pp. 1-
22.
Habibi, K. et al., 2014. Assessment the earthquake vulnerability of the Tehran core through the
application of factor analysis / linear regression model and its implementation in GIS environment.
Caspian Journal of Applied Sciences Research, 3(1), pp. 39-50.
Hakim, M. & Majedi, H., 2014. Selecting the appropriate approach to recognize the deteriorated
textures. Architecture and Urban Development, 4(2), pp. 66-76.
Henson, R. & Roberts, J., 2006. Use of exploratory factor analysis in published research: Common
errors and some comment on improved practice. Educational and Psychological Measurement,
66(3), pp. 393-416.
Hincu, D., Frajila, L. & Şova, R., 2010. The composite indicators usedin assessing innovation at
national level. Economic Management, 13(2), pp. 521-531.
Hogarty, K. et al., 2005. The quality of factor solutions in exploratory factor analysis: The influence of
sample size, communality, and overdetermination. Educational and Psychological Measurement,
65(2), pp. 202-226.
Holling, C., 1973. Resilience and stability of ecological systems. Annual Review of Ecology and
Systematics, 4(2), pp. 1-23.

133
Holling, C. S., 1996. Engineering resilience versus eological resileinec. In: e. P. Schulze, ed.
Engineering within ecological constraints. Engineering Within Ecological Constraints ed. Washington
D. C: National Academy Press, pp. 31-44.
Holling, C. & Walker, B., 2003. Resilience defined. [Online]
Available at: http://isecoeco.org/pdf/resilience.pdf
[Accessed 07 10 2015].
Hosseini, K., Hosseini, M., Jafari, M. & Hosseinioon, S., 2009. Recognition of vulnerable urban fabrics
in earthquake zones: A case study of the Tehran Metropolitan Area. Journal of Seismology and
Earthquake Engineering, 10(4), pp. 1-13.
Hummell, B. M. d. L., Cutter, S. L. & Emrich, C. T., 2016. Social vulnerability to natural hazards.
Disaster Risk Science, Volume 7, pp. 111-122.
Irajifar, L., Alizadeh, T. & Sipe, N., 2013. Disaster resiliency measurement frameworks: State of the
art. Queensland , Australia, Proceedings of the 19th CIB World Building Congress: Construction and
Society.
JICA, 2000. The study on microzoning of the Greater Tehran Area in Iran, final report, Tehran, Iran:
Centre for Earthquake and Environmental Studies of Tehran (CEST).
Jolliffe, I., 2002. Principle component analysis. 2 ed. New York: Springer.
Kenny, M., Chen, R., Maldonado, J. & Quattrochi, D., 2012. Climate change impacts and responses,
Washington: NCA Report Series.
Klein, R. J., Nicholls, R. J. & Thomalla, F., 2003. Resilience to natural hazards: How useful is this
concept?. Environmental Hazards, 5(1), pp. 35-45.
Kopec, J. et al., 2010. Validation of population-based disease simulation models: a review of
concepts and methods. BMC Public Health, 10(2), pp. 710-724.
Krishnan, V., 2010. Constructing an area-based socioeconomic status index: a principal components
analysis approach. Canberra, Australia, Early Childhood Intervention Australia (ECIA) Conference.
Kundak, S., 2005. Assessment of seismic risk in Istanbul. Amesterdam, Netherlands, 45th European
Congress of the European Regional Science Association, pp. 1-19.
Levin, S. et al., 1998. Resilience in natural and socioeconomic systems. Environmental and
Development Economics, 3(2), pp. 222-234.
Linden, A., 2013. researchgate.net. [Online]
Available at:
https://www.researchgate.net/post/What_is_the_best_way_to_scale_parameters_before_running_
a_Principal_Component_Analysis_PCA
[Accessed 11 July 2016].
Maguire, B. & Cartwright, S., 2008. Assessing a community,s capacity to manage change: A resilience
approach to social assessment. Canbera: Bureau of Rural Sciences.
Manyena, S., 2009. Disaster Resileince in Development and Humanitarian Interventions, PhD Thesis.
Newcastle: University of Northumbria.
134
Manyena, S. B., 2006. The concept of resilience revisited Siambabala. Journal compilation ©
Overseas Development Institute, 30(4), pp. 433-450.
Mayunga, J., 2007. Understanding and applying the concept of community disaster resilience : A
capital-based approach, Texas, USA: Landscape Architecture.
Mayunga, J., 2009. Measuring the measure: A multi-dimensional scale model to measure community
disaster resilience in the US Gulf Coast region. College Station, Texas, USA: Texas A&M University.
Meade, L. & Presley, A., 2002. R&D project selection using the analytic network process. IEEE
Transaction on Engineering Management, 49(1), pp. 59-66.
Miciak, M., 2014. Character recognition using radon transformation and principle component
analysis in postal application. [Online]
Available at:
https://www.researchgate.net/publication/224370582_Character_recognition_using_Radon_Transf
ormation_and_Principal_Component_Analysis_in_postal_applications
[Accessed 29 Dec 2015].
Miles, S. & Chang, S., 2008. ResilUS-, modelling community capital loss and recovery. Beijin, The 14th
World Conference on Earthquake Engineering.
Miles, S. & Chang, S., 2011. ResilUS: A community based disaster resilience. Cartography and
Geographic Information Science, 38(1), pp. 36-51.
Mileti, D. S., 1999. Disasters by design: A reassessment of natural hazards in the United States.
Natural Hazards and Disasters ed. Washington: Joseph Henry Press.
Millenium Ecosystem Assessment, 2003. Ecosystems and human well-being: a framework for
assessment. Washington D.C, USA: Island Press.
Miller, F. et al., 2010. Synthesis resilience and vulnerability: Complementary or conflicting concepts?.
Ecology and Society, 15(3), pp. 1-25.
Mitchell, A., 2013. Risk and resilience: from good idea to good practice, Paris, France: Organization
for Economic Co-operation and Development (OECD).
Munda, G. & Nardo, M., 2005. Constructing consistent composite indicators: The issue of weights,
Italy: Office for Official Publications of the European Communities.
Munich RE, 2015. Loss events worldwide 1980–2014: 10 deadliest earthquakes, Munich, Germany:
Munich Re.
Musai, M., Mehrara, M., Miri, S. & Sedaghati, F., 2014. Relationship of social trust and social
participation. International Journal of Management Science, 2(7), pp. 284-295.
Nanto, D., Cooper, W. H. & Donnelly, J., 2011. Japan’s 2011 earthquake and tsunami: Economic
effects and implications for the United States, Washnigton. D.C: Congressional Research Service
(CRS).
Nardo, M., Saisana, M., Saltelli, A. & Tarantola, S., 2008. Handbook on constructing composite
indicators: Methodology and user guide. Paris: OECD Publishing.
Nardo, M. et al., 2005. Handbook on Constructing, s.l.: Organisation for Economic Co-operation and
Development (OECD).

135
Nelson, D., Adger, W. & Brown, K., 2007. Adaptation to environmental change: Contributions of a
resilience framework. Environment and Resource, 32(1), pp. 395-419.
Neumann, M., 2005. The comact city fallacy. Journal of Planning Education and Research, 25(1), pp.
11-26.
Nguefack-Tsague, G., Klasen, S. & Zucchini, W., 2011. On weighting the components of the human
development index: A statistical justification. Journal of Human Development and Capabilities, 12(2),
pp. 183-202.
Norris, F. H. et al., 2008. Community resilience as a metaphor, theory, set of capacities,. Am J
Community Psychol, 41(1), pp. 127-150.
O’Keefe , P., Westgate, P. & Winser, B., 1976. 'Taking the naturalness out of natural disasters.
Nature, 260(1), pp. 566-7.
Oddsdóttir, F., Lucas, B. & Combaz, É., 2013. Measuring disaster resilience (GSDRC Helpdesk
Research Report 1045), Birmingham, UK: GSDRC, University of Birmingham.
OECD, 2014. Guidlines for resilience systems analysis, Paris, France: OECD Publishing.
Oxfam, 2015. Disaster targets and indicators for the post-2015 development framework. London:
Oxfam.
Paton, D. & Johnston, D., 2006. Disaster resilience: an integrated approach. Charles C Thomas ed.
Illinoi , USA: LTD. Springfield.
Paton, D., Millar, M. & Johnston, D., 2001. Community resilience to volacnic hauard consequences.
Natural Hazards, 27(2), pp. 157-169.
Peacock, W. G., 2010. Advancing the resilience of coastal localities: Developing, implementing and
sustaining the use of coastal resilience indicators, Texas, USA: Hazard Reduction and Recovery Center
(HRRC).
Peterson, L. S., Salmon, P., Goode, N. & Gallina, J., 2014. Translation and evaluation of the baseline
resilience indicators for communities on the Sunshine Coast, Queensland Australia. International
Journal of Disaster Risk Reduction, 10(2), pp. 116-126.
Pickett, S., Cadenasso, M. & Crove, J., 2004. Resilient cities: meaning, models, and metaphor for
integrating the ecological, socio-economic, and planning realms. Landscape and Urban Planning,
69(4), pp. 369-384.
Pijawka, K. & Radwan, A., 1985. The transportation of hazardous materials: risk assessment and
hazard management, s.l.: Dangerous Properties of Industrial Materials Report.
Pinho, P., 2010. Sustainable land use policies for resilient cities: Super cities. Porto: University of
Porto, portugal.
Renschler, C. et al., 2010. The ‘PEOPLES’ resilience framework for defining and measuring disaster
resilience at the community scale. Toronto, Proceedings of the 9th U.S. National and 10th Canadian
Conference on Earthquake Engineering, pp. 1-10.
Resilience Alliance , 2005. What is resilience?. [Online]
Available at: www.resalliance.org/ev_en.php
[Accessed 21 July 2015].

136
Resilience Alliance, 2007. Urban resilience: Research prospectus a resilience alliance for transmitting
urban system towards sustainable futures, Stockholm: Australia-Arizona State University, USA-
Stockholm University, Sweden.
Reygel, L., O’sullivan, D. & Yarnal, B., 2006. A Method for constructing a social vulnerability index: An
application to hurricane storm surges in a developed Country. Mitigation and Adaptation Strategies
for Global Change, 11(3), pp. 741-764.
Rezaei, F. & Panahi, M., 2015. GIS modeling of seismic vulnerability of residential fabrics considering
geotechnical, structural, social and physical distance indicators in Tehran using multi-criteria
decision-making techniques. Natural Hzards and Earth Systems Science, 15(3), pp. 461-474.
Rose, A., 2004. Defining and measuring economic resilience to disasters. Disasetr Preventation and
Management, 13(4), pp. 307-314.
Rose, A., 2007. Economic resilience to natural or man-made disasters: Multidisciplinary origins and
contextual dimensions. Environmental Hazards, 7(4), pp. 383-398.
Saaty, T., 2012. What is ANP?. [Online]
Available at: http://www.superdecisions.com/anp-theory/
[Accessed 23 02 2015].
Saaty, T. L., 1996. Decision making with dependence and feedback: the analytic network process.
Pittsburg: RWS Publications.
Saaty, T. L., 2001. Decision-making with dependence and feedback: the analytic network process, 2nd
edn. Pittsburgh: RWS Publications.
Salehi, F., 2014. Hazard mitigation strategies in Tehran [Interview] (12 November 2014).
Salek, A., 2007. Tehran:A history of the urban decentralization. Netherland: University of Utrecht.
Satterthwaite, D. et al., 2007. Adapting to climate change in urban areas: the possibilities and
constraints in low and middle income nations. Bellagio: International Institute for Environment and
Development (IIED) .
Schultz, L., 2009. Nurturing resilience in social-eclogical systems. Stockholm, Sweden: Dapartment of
Systems Ecology, University of Stockholm.
Seva, U. L., 2013. How to report the percentage of explained common variance in exploratory factor
analysis, Tarragona, Spain: Departemnt of Psycology, Universitata Rovira i Virgili.
Shahri, J., 2008. The history of Tehran. Tehran: Institute of Geography and Cartography.
Sharma, S., 1996. Applied multivariate techniques. New York: Wiley.
Snyder, C. & McCullough, M. E., 2000. A positive psychology field of dreams: “If you build it, they will
come. Social and Clinical Psychology, 19(1), pp. 151-160.
Swiss Re, 2013. Mind the risk: A global ranking of cities under threat from natural disasters, Zurich,
Switzerland: Swiss Re Language Services.
Tabachnick, B. & Fidell, L., 2007. Using multivariate statistics. Boston: Pearson Education.
Tachker, B. H. et al., 2004. Concepts of Model Verification and Validation. [Online]
Available at: http://www.ltas-
137
vis.ulg.ac.be/cmsms/uploads/File/LosAlamos_VerificationValidation.pdf
[Accessed 14 November 2015].
Tate, E., 2013. Uncertainty analysis for a social vulnerability index. Annals of the Association of
American Geographers, 103(3), pp. 526-543.
Thompson, B., 2004. Exploratory and confirmatory factor analysis: Understanding concepts and
applications. Washington, DC: American Psychological Association.
Tierney, K. & Bruneau, M., 2007. Conceptualizing and measuring resilience: a key to disaster loss
reduction, s.l.: TR News.
Timmerman, P., 1981. Vulnerability, resilience, and the collapse of society: A review of models and
possible climatic applications. Toronto: Institute of Environmental Studies, University of Toronto.
Tobin, G., 2002. Community resilience and volcano hazard: the eruption of Tunguarhua and
evacuation of the Faldas in Ecuador. Disasters, 26(1), pp. 28-48.
Tobin, G. A., 1999. Sustainability and community resilience: the holy grail of hazards planning?.
Environmental hazard, 1(2), pp. 13-25.
Turner, B. et al., 2003. A framework for vulnerability analysis in sustainability science. PNAS, 100(14).
Twigg, J., 2007. Characteristics of a disaster resilient community. [Online]
Available at:
www.proventionconsortium.org/themes/default/pdfs/characteristics/community_characteristics_
en_lowres.pdf
[Accessed 15 September 2014].
UBRI, (. a. B. R. I. S. U. o. N. Y., 2012. Resilience Capacity Index (RCI). [Online]
Available at: http://brr.berkeley.edu/rci/
[Accessed 15 11 2015].
Umberto, P., 2012. Resilience and sustainable development: Theory of resilience, systems thinking
and adaptive governance, Vienna, Austria: European Sustainable Development Network (ESDN).
UNDP, 2005. Disaster risk management profile Tehran , Iran, Tehran, Iran: Human Development
Report of the Islamic Republic of Iran.
UNISDR, 2005. Hyogo framework for action 2005-2015, Geneva.: United Nations International
Strategy.
UNISDR, 2009. UNISDR terminology on disaster risk reduction , Geneva, Switzerland: UNISDR.
UNISDR, 2012. Making cities resilient. Second edition ed. London,UK: s.n.
Van Niekerk, W., 2013. Translating disaster resilience into spatial planning practice in Sought
Africa:Challenges and chapmions. Journal of Disaster Risk Studies, 5(1), pp. 1-6.
Verrucci, E., Rosseto, T. & Twigg, J., 2012. Multi-disciplinary indicators for evaluating the seismic
resilience of urban areas. Lisbon, 15TH WORLD Conf. Earthq. Eng. ( 15 WCEE).
Walker, B., Holling, C., Carpenter, S. R. & Kinzig, A., 2004. Resilience, adaptability and
transformability in social–ecological systems. Ecology and Society, 9(2), p. 5.

138
Walker, B. & Salt, D., 2006. Resilience thinking: sustaining ecosystems and people in a changing
world. Washington: Island Press.
WCED, 1987. Our common future, Oxford: Oxford University Press.
Williams, B., Brown, T. & Onsman, A., 2012. Exploratory factor analysis : A five-step guide for
novices. Journal of Emergency Primary Health Care (JEPHC), 8(3), pp. 1-13.
Winderl, T., 2014. Disaster resilience measuremnet:Stockaing of ongoing efforts in developing
systems for measuring resilience, Geneva, Swiss: United Nations Development Programme (UNDP).
Wisner, B., Blaikie, P., Cannon, T. & Davis, I., 2004. At risk-natural hazards, people’s vulnerability and
disasters. (2nd ed) ed. New York: Routledge..
Wu, N. & Zhang, J., 2006. Factor analysis based anomaly detection and clustering. Decision Support
SYSTEMS, Volume 42, pp. 375-389.
Yatas, T. M., Masten, A., Linley, P. & Joseph, S., 2004. Fostering the future: Resileince theory and
practice of positive psychology. In: P. A. L. a. S. Joseph, ed. Positive psychology in practice. Hoboken,
New Jersey: John Wiley & Sons Inc, pp. 521-539.
Yazgun, E. & Ustun, A., 2011. Application of analytic network process : weighting of selection criteria
for civil pilots. Journal of Aeronautics and Space Technologies , 5(2), pp. 1-12.
Yüksel, I. & Dagdeviren, M., 2010. Using the fuzzy analytic network process (ANP) for Balanced
Scorecard (BSC): A case study for a manufacturing firm. Expert Systems with Applications, 37(2), pp.
1270-1278.
Zafarian, H., Ghorbani, A., Rahimian, M. & Noorzad, A., 2012. Seismic response analysis of Molad
Tower in Tehran, Iran under site-specific simulated ground motion. Beijing, China, 14th World
Conference on Earthquake Engineering.
Zaho, N., 2009. The minimum sample size in factor analysis. [Online]
Available at:
https://www.encorewiki.org/display/~nzhao/The+Minimum+Sample+Size+in+Factor+Analysis
[Accessed 17 January 2016].
Zebardast, E., 2005. Do plans matter? managing a metroplois with two directives for more than a
decade;the case of Tehran City. Gothenburg, International Conference for Intergrating Urban
Knowledge and Practice.
Zebardast, E., 2013. Constructing a social vulnerability index to earthquake hazards using a hybrid
factor analysis and analytic network process (F’ANP) model. Natural Hazards, 65(3), pp. 1331-1359.
Zebardast, E., Khalili , A. & Dehghani, M., 2013. Application of factor analysis in identifying urban
deteriorated textures. Honar-ha-ye-ziba, University of Tehran, 18(2), pp. 27-42.
Zhong, S. et al., 2014. Validation of a framework for measuring hospital disaster resilience using
factor analysis. International Journal of Environmental Research and Public Health, 11(6), pp. 6335-
6353.
Zhou, P. & Ang, B., 2009. Comparing MCDA aggregation methods in constructing composite
indicators using the Shannon-Spearman measure. Social Indicators Research, 94(1), pp. 83-96.

139
Appendixes

140
Table A.1: Primary wish list for indicator building
Category Variable Justification Effect on
Resilience
Social
Age Percent of the population that is not elderly (+65) and children(0-12)
Indian Ocean Tsunami Warning System Program 2007, Morrow. 2008, Cutter et al. 2010
Positive
Educational equity Percent of population with at least high school diploma
Cummin et al. 2005, Norris et al.2008, Cutter et al. 2010, Burton. 2012
Positive
Educational equity Percent of population with high education
Cutter et al. 2008, Burton. 2012 Positive
Communication capacity Percent of the population with telephone and internet access
Colten et al. 2008, Cutter et al. 2010, Burton. 2012
Positive
Social learning Adult education and skills-training program Indian Ocean Tsunami Warning System Program 2007, Burton. 2012
Positive
Special needs Percent population without a sensory, physical, or mental disability
Heinz Center. 2002, Cutter et al. 2010 Positive
Health coverage Percent population with health insurance coverage
Heinz Center .2002, Cutter et al. 2010 Positive
Population exposure Percent of population not living in hazardous areas (High hazard fault zones)
Adger et al. 2003; Berke and Campanella 2006; Cutter et al. 2008, Chang et al. 2006
Positive
Economic
Housing capital Percent of homeownership Norris et al. 2008, Cutter et al. 2010, Burton. 2012
Positive
Employment Percent of population that is employed
Norris et al. 2008, Cutter et al. 2010, Burton. 2012
Positive
Social capacity Per capita houshold income UNDESA. 2007, Cutter et al. 2010, Burton. 2012 Positive
Income and equality GINI coefficient Norris et al. 2008, Cutter et al. 2010 Positive
Economic development Number of physicians per 10000 population Greiving. 2006, Cutter et al. 2010, Burton. 2012 Positive
Economic development Ratio of large to small businesses Cutter et al. 2008; H. John Heinz III Center 2002, Burton. 2012
Positive
Economic diversity Percent of the population employed in secondary industries
Cutter et al. 2010, Burton. 2012 Positive
Institutional
Mitigation Percent population covered by a recent hazard mitigation plan
Burby et al. 2000, Godschalk 2007, Cutter. 2010, Burton: 2012
Positive
Preparedness Percent of population employed in emergency services
Cutter et al. 2008, Burton. 2012 Positive
Preparedness Percentage of population with citizen corps program participation
Cutter et al. 2010, Burton. 2012 Positive
Emergency capacity Percent of emergency response volunteers
Cutter et al. 2008 Positive
Preparedness Emergency response capabilities Tobin. 1999 Positive
Housing / infrastructure
Quality of buildings Percent of built -up- areas that are not deteriorated
Mileti 1999, Cutter et al. 2010, Verrucci et al. 2012
Positive
Planning and land use Percent of low Building density JICA. 2000, Verrucci et al. 2012 Negative
Sheltering needs Number of hotels per kilometre Tierney 2009, Cutter et al. 2010, Verrucci et al. 2012
Positive
Sheltering needs Number of schools per square kilometre Tierney. 2009, Cutter et al. 2010, Verrucci et al. 2012, Burton. 2012
Positive

141
Medical capacity Number of hospital per Kilometer Cutter et al. 2010, Verrucci et al. 2012 Positive
Recovery Number of fire station per kilometer Verrucci et al. 2012, Burton. 2012 Positive
Recovery Number of police stations Verrucci et al. 2012, Burton. 2012 Positive
Physical resistance/ Critical Infrastructure
Percent / number of critical infrastructure that are not destroyed
Verrucci et al. 2012 Positive
Access/evacuation potential
Percent of non-built up areas Kundak et al. 2005 Positive
Community capital
Innovation Percent of population that is employed in professional occupation(construction, civil engineering …)
Cumming et al. 2005, Burton. 2012 Positive
Social capital Religious organization per 1000 Indian Ocean Tsunami warning System. 2007, Cutter et al. 2010, Burton. 2012
Positive
Social capital Civic organization per 1000 Indian Ocean Tsunami wrning System. 2007, Cutter. 2010
Positive
Place atatchment Percent population born in a state that still resides in that state
Campanella. 2005, Cutter et al. 2010 Positive
Environmental
Hazard risk Percent of areas that tolerate less earthquake intensity (Mercalli intensity scale)
JICA. 2000, Kundak et al. 2005, Greiving. 2006
Positive
Land slide risk Percent of areas with a slope more than 30% JICA. 2005, Kundak et al. 2005 Negative
Protective resources Percent of land area that is developed as open spaces
Kundak et al. 2005, Verrucci et al. 2012 Positive
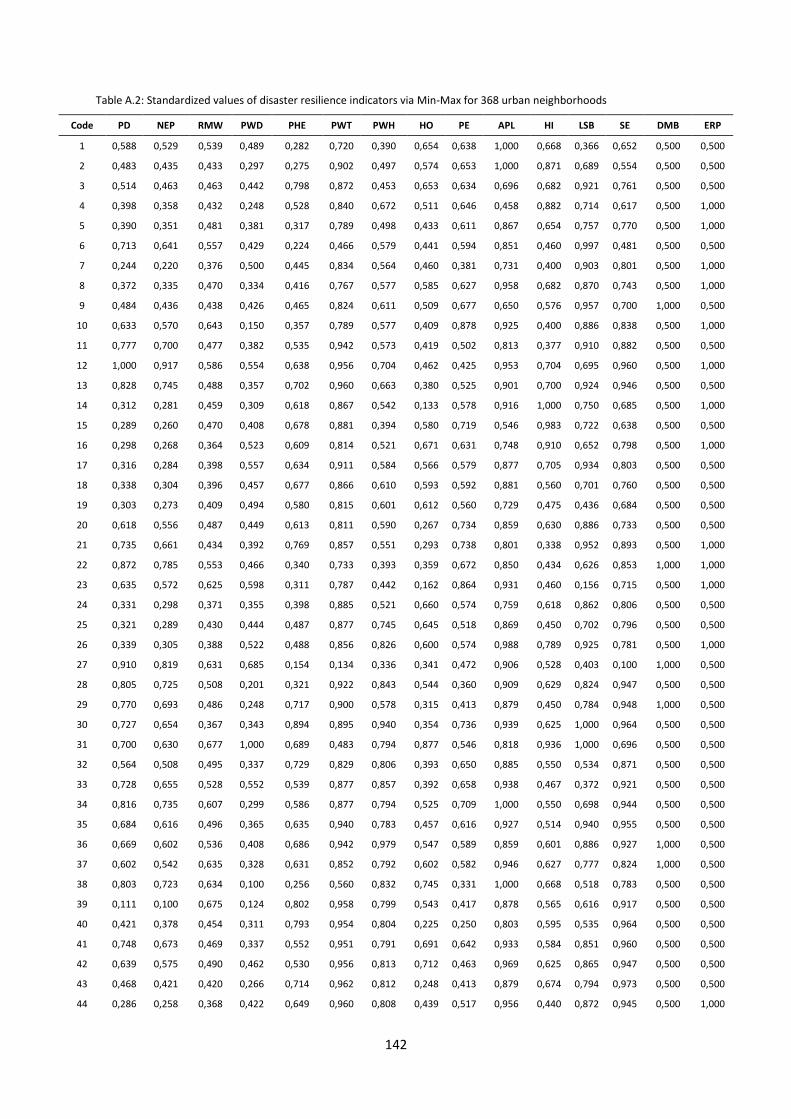
142
Table A.2: Standardized values of disaster resilience indicators via Min-Max for 368 urban neighborhoods
Code PD NEP RMW PWD PHE PWT PWH HO PE APL HI LSB SE DMB ERP
1 0,588 0,529 0,539 0,489 0,282 0,720 0,390 0,654 0,638 1,000 0,668 0,366 0,652 0,500 0,500
2 0,483 0,435 0,433 0,297 0,275 0,902 0,497 0,574 0,653 1,000 0,871 0,689 0,554 0,500 0,500
3 0,514 0,463 0,463 0,442 0,798 0,872 0,453 0,653 0,634 0,696 0,682 0,921 0,761 0,500 0,500
4 0,398 0,358 0,432 0,248 0,528 0,840 0,672 0,511 0,646 0,458 0,882 0,714 0,617 0,500 1,000
5 0,390 0,351 0,481 0,381 0,317 0,789 0,498 0,433 0,611 0,867 0,654 0,757 0,770 0,500 1,000
6 0,713 0,641 0,557 0,429 0,224 0,466 0,579 0,441 0,594 0,851 0,460 0,997 0,481 0,500 0,500
7 0,244 0,220 0,376 0,500 0,445 0,834 0,564 0,460 0,381 0,731 0,400 0,903 0,801 0,500 1,000
8 0,372 0,335 0,470 0,334 0,416 0,767 0,577 0,585 0,627 0,958 0,682 0,870 0,743 0,500 1,000
9 0,484 0,436 0,438 0,426 0,465 0,824 0,611 0,509 0,677 0,650 0,576 0,957 0,700 1,000 0,500
10 0,633 0,570 0,643 0,150 0,357 0,789 0,577 0,409 0,878 0,925 0,400 0,886 0,838 0,500 1,000
11 0,777 0,700 0,477 0,382 0,535 0,942 0,573 0,419 0,502 0,813 0,377 0,910 0,882 0,500 0,500
12 1,000 0,917 0,586 0,554 0,638 0,956 0,704 0,462 0,425 0,953 0,704 0,695 0,960 0,500 1,000
13 0,828 0,745 0,488 0,357 0,702 0,960 0,663 0,380 0,525 0,901 0,700 0,924 0,946 0,500 0,500
14 0,312 0,281 0,459 0,309 0,618 0,867 0,542 0,133 0,578 0,916 1,000 0,750 0,685 0,500 1,000
15 0,289 0,260 0,470 0,408 0,678 0,881 0,394 0,580 0,719 0,546 0,983 0,722 0,638 0,500 0,500
16 0,298 0,268 0,364 0,523 0,609 0,814 0,521 0,671 0,631 0,748 0,910 0,652 0,798 0,500 1,000
17 0,316 0,284 0,398 0,557 0,634 0,911 0,584 0,566 0,579 0,877 0,705 0,934 0,803 0,500 0,500
18 0,338 0,304 0,396 0,457 0,677 0,866 0,610 0,593 0,592 0,881 0,560 0,701 0,760 0,500 0,500
19 0,303 0,273 0,409 0,494 0,580 0,815 0,601 0,612 0,560 0,729 0,475 0,436 0,684 0,500 0,500
20 0,618 0,556 0,487 0,449 0,613 0,811 0,590 0,267 0,734 0,859 0,630 0,886 0,733 0,500 0,500
21 0,735 0,661 0,434 0,392 0,769 0,857 0,551 0,293 0,738 0,801 0,338 0,952 0,893 0,500 1,000
22 0,872 0,785 0,553 0,466 0,340 0,733 0,393 0,359 0,672 0,850 0,434 0,626 0,853 1,000 1,000
23 0,635 0,572 0,625 0,598 0,311 0,787 0,442 0,162 0,864 0,931 0,460 0,156 0,715 0,500 1,000
24 0,331 0,298 0,371 0,355 0,398 0,885 0,521 0,660 0,574 0,759 0,618 0,862 0,806 0,500 0,500
25 0,321 0,289 0,430 0,444 0,487 0,877 0,745 0,645 0,518 0,869 0,450 0,702 0,796 0,500 0,500
26 0,339 0,305 0,388 0,522 0,488 0,856 0,826 0,600 0,574 0,988 0,789 0,925 0,781 0,500 1,000
27 0,910 0,819 0,631 0,685 0,154 0,134 0,336 0,341 0,472 0,906 0,528 0,403 0,100 1,000 0,500
28 0,805 0,725 0,508 0,201 0,321 0,922 0,843 0,544 0,360 0,909 0,629 0,824 0,947 0,500 0,500
29 0,770 0,693 0,486 0,248 0,717 0,900 0,578 0,315 0,413 0,879 0,450 0,784 0,948 1,000 0,500
30 0,727 0,654 0,367 0,343 0,894 0,895 0,940 0,354 0,736 0,939 0,625 1,000 0,964 0,500 0,500
31 0,700 0,630 0,677 1,000 0,689 0,483 0,794 0,877 0,546 0,818 0,936 1,000 0,696 0,500 0,500
32 0,564 0,508 0,495 0,337 0,729 0,829 0,806 0,393 0,650 0,885 0,550 0,534 0,871 0,500 0,500
33 0,728 0,655 0,528 0,552 0,539 0,877 0,857 0,392 0,658 0,938 0,467 0,372 0,921 0,500 0,500
34 0,816 0,735 0,607 0,299 0,586 0,877 0,794 0,525 0,709 1,000 0,550 0,698 0,944 0,500 0,500
35 0,684 0,616 0,496 0,365 0,635 0,940 0,783 0,457 0,616 0,927 0,514 0,940 0,955 0,500 0,500
36 0,669 0,602 0,536 0,408 0,686 0,942 0,979 0,547 0,589 0,859 0,601 0,886 0,927 1,000 0,500
37 0,602 0,542 0,635 0,328 0,631 0,852 0,792 0,602 0,582 0,946 0,627 0,777 0,824 1,000 0,500
38 0,803 0,723 0,634 0,100 0,256 0,560 0,832 0,745 0,331 1,000 0,668 0,518 0,783 0,500 0,500
39 0,111 0,100 0,675 0,124 0,802 0,958 0,799 0,543 0,417 0,878 0,565 0,616 0,917 0,500 0,500
40 0,421 0,378 0,454 0,311 0,793 0,954 0,804 0,225 0,250 0,803 0,595 0,535 0,964 0,500 0,500
41 0,748 0,673 0,469 0,337 0,552 0,951 0,791 0,691 0,642 0,933 0,584 0,851 0,960 0,500 0,500
42 0,639 0,575 0,490 0,462 0,530 0,956 0,813 0,712 0,463 0,969 0,625 0,865 0,947 0,500 0,500
43 0,468 0,421 0,420 0,266 0,714 0,962 0,812 0,248 0,413 0,879 0,674 0,794 0,973 0,500 0,500
44 0,286 0,258 0,368 0,422 0,649 0,960 0,808 0,439 0,517 0,956 0,440 0,872 0,945 0,500 1,000

143
45 0,613 0,551 0,475 0,446 0,574 0,918 0,718 0,272 0,590 0,935 0,622 0,984 0,910 0,500 0,500
46 0,550 0,495 0,451 0,593 0,442 0,958 0,584 0,661 0,492 0,555 0,539 0,541 0,965 1,000 0,500
47 0,514 0,462 0,545 0,420 0,542 0,941 0,796 0,445 0,553 0,923 0,568 0,829 0,945 0,500 0,500
48 0,341 0,307 0,379 0,585 0,449 0,973 0,858 0,484 0,464 0,690 0,494 0,854 0,957 0,500 1,000
49 0,413 0,372 0,389 0,452 0,495 0,971 0,856 0,547 0,587 0,924 0,550 0,861 0,937 1,000 0,500
50 0,399 0,359 0,409 0,281 0,442 0,905 0,761 0,728 0,536 0,835 0,511 0,839 0,941 0,500 0,500
51 0,463 0,417 0,406 0,484 0,415 0,957 0,852 0,308 0,530 0,890 0,628 0,675 0,962 0,500 0,500
52 0,535 0,481 0,401 0,252 0,466 0,956 0,778 0,540 0,546 0,740 0,468 0,760 0,972 0,500 0,500
53 0,571 0,514 0,587 0,469 0,416 0,953 0,765 0,563 0,562 0,879 0,670 0,597 0,947 0,500 0,500
54 0,747 0,673 0,578 0,581 0,299 0,862 0,698 0,549 0,473 0,804 0,400 0,619 0,912 1,000 0,500
55 0,611 0,550 0,544 0,554 0,437 0,920 0,839 0,264 0,541 0,894 0,432 0,543 0,971 0,500 0,500
56 0,735 0,661 1,000 0,712 0,245 0,731 0,714 0,281 0,460 1,000 0,663 0,688 0,920 1,000 0,500
57 0,592 0,533 0,000 0,414 0,322 0,908 0,146 0,533 0,414 0,818 0,595 0,728 0,818 1,000 0,500
58 0,366 0,330 0,376 0,439 0,610 0,713 0,197 0,241 0,598 0,864 0,775 0,752 0,879 0,500 0,500
59 0,188 0,169 0,403 0,324 0,667 0,912 0,216 0,378 0,492 0,842 0,250 0,518 0,772 0,500 0,500
60 0,358 0,322 0,342 0,415 0,468 0,929 0,145 0,374 0,512 0,824 0,592 0,845 0,880 0,500 0,500
61 0,438 0,394 0,382 0,572 0,478 0,954 0,221 0,727 0,634 0,977 0,530 0,910 0,861 0,500 0,500
62 0,425 0,383 0,372 0,427 0,557 0,855 0,107 0,344 0,561 0,812 0,723 0,875 0,850 0,500 0,500
63 0,398 0,358 0,354 0,282 0,549 0,865 0,207 0,426 0,595 0,790 0,726 0,854 0,720 1,000 0,500
64 0,402 0,362 0,325 0,417 0,606 0,920 0,122 0,695 0,579 0,904 0,716 0,908 0,849 0,500 0,500
65 0,142 0,128 0,223 0,469 0,651 0,855 0,163 0,360 0,387 0,685 0,627 0,574 0,773 0,500 0,500
66 0,291 0,262 0,353 0,294 0,679 0,855 0,237 0,407 0,613 0,766 0,775 0,880 0,827 0,500 1,000
67 0,286 0,258 0,355 0,509 0,450 0,866 0,100 0,478 0,516 0,706 0,530 0,794 0,806 0,500 0,500
68 0,312 0,281 0,333 0,465 0,701 0,960 0,219 0,547 0,547 0,854 0,775 0,841 0,959 1,000 0,500
69 0,443 0,399 0,414 0,340 0,423 0,877 0,506 0,588 0,611 0,836 0,850 0,861 0,806 0,500 0,500
70 0,654 0,589 0,455 0,491 0,381 0,856 0,671 0,438 0,640 0,900 0,694 0,832 0,860 1,000 1,000
71 0,846 0,762 0,618 0,534 0,325 0,844 0,410 0,500 0,664 0,685 0,640 0,885 0,890 0,500 0,500
72 0,863 0,777 0,548 0,373 0,283 0,787 0,815 0,485 0,678 0,934 0,463 0,706 0,842 0,500 0,500
73 0,580 0,522 0,452 0,490 0,390 0,956 0,742 0,474 0,471 0,965 0,610 0,966 0,907 0,500 0,500
74 0,809 0,728 0,516 0,525 0,381 0,910 0,382 0,631 0,499 0,859 0,520 0,948 0,907 1,000 0,500
75 0,924 0,832 0,578 0,418 0,277 0,520 0,794 0,554 0,610 0,818 0,261 0,965 0,814 0,500 0,500
76 0,840 0,756 0,602 0,485 0,316 0,785 0,872 0,452 0,470 0,924 0,620 0,283 0,875 1,000 1,000
77 0,974 0,876 0,664 0,568 0,197 0,199 0,422 0,506 0,707 0,717 0,418 0,786 0,675 0,500 0,500
78 0,899 0,809 0,535 0,551 0,294 0,757 0,672 0,528 0,688 0,864 0,347 0,929 0,850 1,000 0,500
79 0,682 0,614 0,438 0,487 0,408 0,927 0,569 0,574 0,654 0,497 0,432 0,923 0,910 0,500 0,500
80 0,824 0,741 0,548 0,579 0,285 0,854 0,635 0,690 0,716 0,634 0,345 0,776 0,839 0,500 1,000
81 0,834 0,750 0,591 0,540 0,221 0,449 0,647 0,547 0,638 0,791 0,660 0,696 0,682 0,500 1,000
82 0,662 0,595 0,442 0,511 0,351 0,916 0,669 0,593 0,693 0,847 0,761 0,871 0,899 1,000 0,500
83 0,630 0,567 0,484 0,642 0,312 0,856 0,631 0,586 0,711 0,710 0,685 0,622 0,871 0,500 0,500
84 0,404 0,364 0,384 0,499 0,445 0,895 0,735 0,520 0,462 0,731 0,471 0,614 0,920 0,500 0,500
85 0,638 0,575 0,372 0,475 0,318 0,866 0,757 0,701 0,694 0,847 0,550 0,891 0,926 0,500 0,500
86 0,691 0,622 0,363 0,605 0,316 0,878 0,748 0,620 0,650 0,884 0,445 0,779 0,894 1,000 0,500
87 0,578 0,520 0,325 0,470 0,328 0,910 0,558 0,502 0,641 0,893 0,540 0,825 0,917 0,500 0,500
88 0,913 0,822 0,461 0,477 0,247 0,421 0,646 0,471 0,638 0,760 0,543 0,758 0,729 0,500 0,500
89 0,754 0,679 0,460 0,526 0,462 0,845 0,890 0,486 0,273 0,806 0,550 0,423 0,827 0,500 0,500
90 0,727 0,654 0,441 0,445 0,453 0,932 0,785 0,586 0,703 0,936 0,668 0,482 0,925 0,500 1,000

144
91 0,905 0,814 0,708 0,197 0,225 0,341 0,587 0,552 0,570 0,879 0,400 0,498 0,505 0,500 0,500
92 0,836 0,753 0,581 0,245 0,361 0,787 0,213 0,309 0,459 1,000 0,475 0,103 0,832 0,500 1,000
93 0,907 0,816 0,488 0,295 0,531 0,680 0,573 0,386 0,833 0,813 0,454 0,448 0,818 0,500 0,500
94 0,858 0,772 0,550 0,352 0,410 0,962 0,737 0,370 0,675 0,931 0,595 0,983 0,892 0,500 0,500
95 0,902 0,812 0,490 0,424 0,499 0,940 0,732 0,393 0,727 0,438 0,483 0,970 0,951 1,000 0,500
96 0,844 0,760 0,527 0,428 0,315 0,850 0,726 0,670 0,615 0,982 0,460 0,851 0,919 0,500 0,500
97 0,752 0,677 0,555 0,655 0,202 0,524 0,675 0,441 0,463 0,928 0,612 0,293 0,648 0,500 0,500
98 0,790 0,711 0,448 0,591 0,407 0,936 0,651 0,534 0,674 0,775 0,390 0,936 0,948 1,000 0,500
99 0,779 0,701 0,481 0,443 0,377 0,975 0,746 0,465 0,624 0,975 0,444 0,974 0,941 0,500 1,000
100 0,812 0,731 0,473 0,425 0,425 0,890 0,617 0,564 0,741 0,707 0,333 0,965 0,932 1,000 0,500
101 0,815 0,733 0,469 0,391 0,457 0,936 0,806 0,289 0,775 0,964 0,423 0,685 0,867 0,500 0,500
102 0,827 0,745 0,471 0,350 0,507 0,920 0,948 0,312 0,847 0,894 0,677 0,791 0,931 0,500 1,000
103 0,823 0,741 0,450 0,379 0,504 0,918 0,850 0,492 0,731 0,762 0,516 0,807 0,934 0,500 1,000
104 0,766 0,689 0,564 0,430 0,430 0,955 0,711 0,564 0,626 0,895 0,392 0,883 0,959 1,000 0,500
105 0,493 0,444 0,581 0,849 0,290 0,935 0,875 0,475 0,341 1,000 0,529 0,862 0,898 0,500 1,000
106 0,797 0,717 0,473 0,402 0,349 0,916 0,752 0,591 0,666 0,903 0,400 0,493 0,891 1,000 1,000
107 0,723 0,651 0,477 0,471 0,476 0,954 0,798 0,578 0,608 0,905 0,441 0,814 0,943 0,500 0,500
108 0,737 0,664 0,429 0,422 0,407 0,952 0,783 0,692 0,620 0,906 0,645 0,956 0,917 0,500 0,500
109 0,897 0,807 0,449 0,361 0,617 0,921 0,851 0,408 0,731 0,980 0,490 0,604 0,922 0,500 0,500
110 0,872 0,785 0,449 0,356 0,614 0,922 0,715 0,334 0,840 0,894 0,592 0,829 0,912 1,000 1,000
111 0,827 0,744 0,458 0,299 0,523 0,958 0,731 0,571 0,679 0,827 0,457 0,973 0,957 0,500 0,500
112 0,764 0,687 0,514 0,412 0,497 0,931 0,735 0,545 0,628 0,731 0,635 0,921 0,959 0,500 0,500
113 0,750 0,675 0,476 0,427 0,438 0,889 0,652 0,493 0,682 0,804 0,518 0,789 0,927 0,500 0,500
114 0,723 0,651 0,442 0,509 0,442 0,910 0,768 0,561 0,618 0,906 0,716 0,832 0,922 1,000 1,000
115 0,751 0,676 0,626 0,343 0,706 0,965 0,899 0,569 0,597 0,780 0,498 0,710 1,000 0,500 0,500
116 0,722 0,650 0,436 0,454 0,517 0,944 0,681 0,505 0,637 1,000 0,389 0,332 0,949 0,500 0,500
117 0,421 0,379 0,409 0,370 0,652 0,972 0,816 0,493 0,431 0,808 0,590 0,521 0,994 1,000 0,500
118 0,660 0,594 0,257 0,451 0,482 0,900 1,000 0,570 0,372 1,000 0,601 0,942 0,885 0,500 0,500
119 0,313 0,282 0,371 0,485 0,931 0,932 0,785 0,181 0,782 0,883 0,658 0,600 0,914 0,500 0,500
120 0,183 0,165 0,252 0,341 1,000 0,842 0,755 0,186 0,488 0,931 0,775 0,582 0,851 0,500 0,500
121 0,179 0,161 0,444 0,375 0,410 0,671 0,797 0,213 0,757 0,967 0,582 0,715 0,458 0,500 0,500
122 0,349 0,314 0,333 0,387 0,636 0,942 0,835 0,399 0,589 0,853 0,507 0,917 0,897 0,500 1,000
123 0,274 0,247 0,384 0,403 0,577 0,811 0,801 0,435 0,608 0,721 0,518 0,965 0,943 0,500 0,500
124 0,610 0,549 0,476 0,372 0,551 0,974 0,834 0,117 0,428 0,881 0,670 0,938 0,975 0,500 0,500
125 0,423 0,380 0,335 0,485 0,644 0,950 0,801 0,425 0,709 0,877 0,614 0,964 0,946 0,500 0,500
126 0,414 0,373 0,246 0,382 0,589 0,947 0,756 0,695 0,661 0,811 0,610 0,814 0,912 0,500 0,500
127 0,194 0,175 0,444 0,579 0,689 0,827 0,660 0,342 0,672 0,919 0,421 0,489 0,699 0,500 0,500
128 0,206 0,185 0,387 0,529 0,640 0,931 0,881 0,657 0,743 0,939 0,611 0,707 0,916 0,500 0,500
129 0,278 0,250 0,259 0,478 0,563 0,945 0,827 0,626 0,722 0,913 0,348 0,712 0,897 0,500 0,500
130 0,502 0,451 0,496 0,507 0,521 0,937 0,833 0,163 0,523 0,725 0,425 0,740 0,895 1,000 0,500
131 0,398 0,358 0,455 0,538 0,551 0,963 0,627 0,266 0,711 0,683 0,229 0,857 0,918 0,500 0,500
132 0,579 0,521 0,432 0,570 0,495 0,940 0,828 0,434 0,820 0,743 0,550 0,800 0,917 0,500 0,500
133 0,639 0,575 0,819 0,604 0,338 0,771 0,804 0,283 0,384 0,621 0,377 0,506 0,814 1,000 0,500
134 0,692 0,622 0,551 0,451 0,378 0,790 0,770 0,724 0,402 0,833 0,521 0,411 0,778 1,000 0,500
135 0,564 0,508 0,630 0,676 0,525 0,817 0,809 0,549 0,613 0,955 0,455 0,413 0,840 0,500 1,000
136 0,242 0,218 0,406 0,415 0,641 0,946 0,795 0,553 0,560 0,806 0,737 0,780 0,905 0,500 1,000
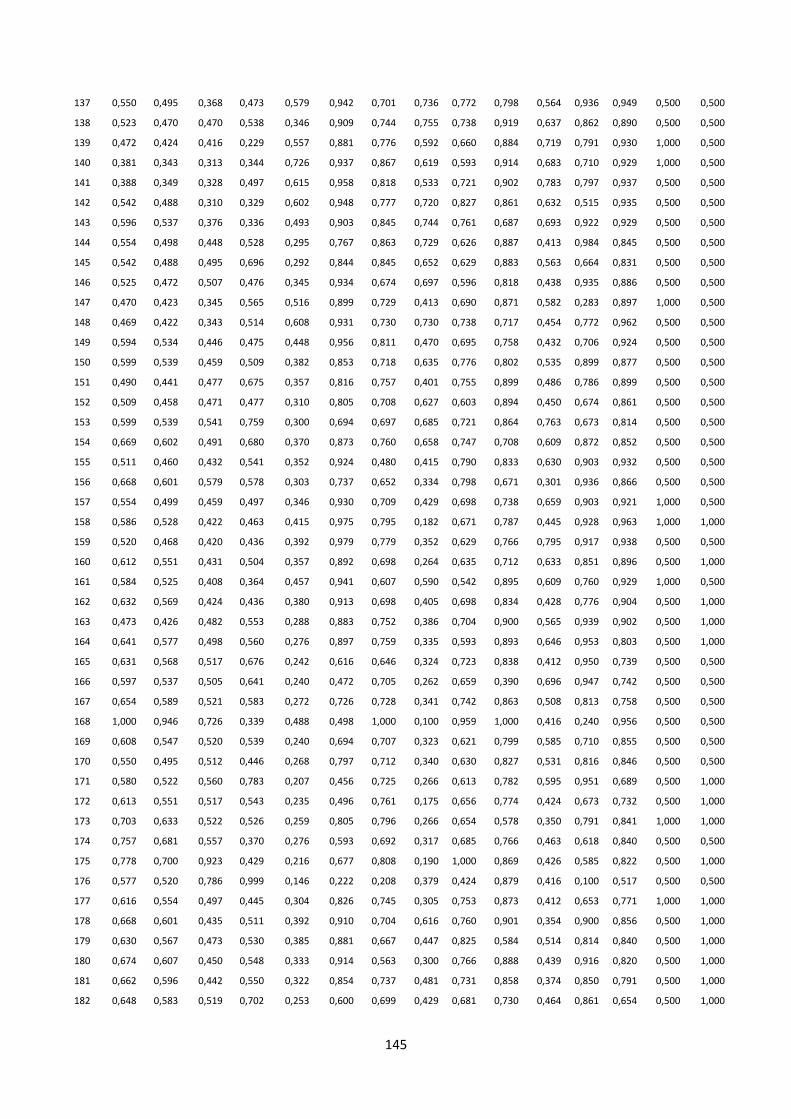
145
137 0,550 0,495 0,368 0,473 0,579 0,942 0,701 0,736 0,772 0,798 0,564 0,936 0,949 0,500 0,500
138 0,523 0,470 0,470 0,538 0,346 0,909 0,744 0,755 0,738 0,919 0,637 0,862 0,890 0,500 0,500
139 0,472 0,424 0,416 0,229 0,557 0,881 0,776 0,592 0,660 0,884 0,719 0,791 0,930 1,000 0,500
140 0,381 0,343 0,313 0,344 0,726 0,937 0,867 0,619 0,593 0,914 0,683 0,710 0,929 1,000 0,500
141 0,388 0,349 0,328 0,497 0,615 0,958 0,818 0,533 0,721 0,902 0,783 0,797 0,937 0,500 0,500
142 0,542 0,488 0,310 0,329 0,602 0,948 0,777 0,720 0,827 0,861 0,632 0,515 0,935 0,500 0,500
143 0,596 0,537 0,376 0,336 0,493 0,903 0,845 0,744 0,761 0,687 0,693 0,922 0,929 0,500 0,500
144 0,554 0,498 0,448 0,528 0,295 0,767 0,863 0,729 0,626 0,887 0,413 0,984 0,845 0,500 0,500
145 0,542 0,488 0,495 0,696 0,292 0,844 0,845 0,652 0,629 0,883 0,563 0,664 0,831 0,500 0,500
146 0,525 0,472 0,507 0,476 0,345 0,934 0,674 0,697 0,596 0,818 0,438 0,935 0,886 0,500 0,500
147 0,470 0,423 0,345 0,565 0,516 0,899 0,729 0,413 0,690 0,871 0,582 0,283 0,897 1,000 0,500
148 0,469 0,422 0,343 0,514 0,608 0,931 0,730 0,730 0,738 0,717 0,454 0,772 0,962 0,500 0,500
149 0,594 0,534 0,446 0,475 0,448 0,956 0,811 0,470 0,695 0,758 0,432 0,706 0,924 0,500 0,500
150 0,599 0,539 0,459 0,509 0,382 0,853 0,718 0,635 0,776 0,802 0,535 0,899 0,877 0,500 0,500
151 0,490 0,441 0,477 0,675 0,357 0,816 0,757 0,401 0,755 0,899 0,486 0,786 0,899 0,500 0,500
152 0,509 0,458 0,471 0,477 0,310 0,805 0,708 0,627 0,603 0,894 0,450 0,674 0,861 0,500 0,500
153 0,599 0,539 0,541 0,759 0,300 0,694 0,697 0,685 0,721 0,864 0,763 0,673 0,814 0,500 0,500
154 0,669 0,602 0,491 0,680 0,370 0,873 0,760 0,658 0,747 0,708 0,609 0,872 0,852 0,500 0,500
155 0,511 0,460 0,432 0,541 0,352 0,924 0,480 0,415 0,790 0,833 0,630 0,903 0,932 0,500 0,500
156 0,668 0,601 0,579 0,578 0,303 0,737 0,652 0,334 0,798 0,671 0,301 0,936 0,866 0,500 0,500
157 0,554 0,499 0,459 0,497 0,346 0,930 0,709 0,429 0,698 0,738 0,659 0,903 0,921 1,000 0,500
158 0,586 0,528 0,422 0,463 0,415 0,975 0,795 0,182 0,671 0,787 0,445 0,928 0,963 1,000 1,000
159 0,520 0,468 0,420 0,436 0,392 0,979 0,779 0,352 0,629 0,766 0,795 0,917 0,938 0,500 0,500
160 0,612 0,551 0,431 0,504 0,357 0,892 0,698 0,264 0,635 0,712 0,633 0,851 0,896 0,500 1,000
161 0,584 0,525 0,408 0,364 0,457 0,941 0,607 0,590 0,542 0,895 0,609 0,760 0,929 1,000 0,500
162 0,632 0,569 0,424 0,436 0,380 0,913 0,698 0,405 0,698 0,834 0,428 0,776 0,904 0,500 1,000
163 0,473 0,426 0,482 0,553 0,288 0,883 0,752 0,386 0,704 0,900 0,565 0,939 0,902 0,500 1,000
164 0,641 0,577 0,498 0,560 0,276 0,897 0,759 0,335 0,593 0,893 0,646 0,953 0,803 0,500 1,000
165 0,631 0,568 0,517 0,676 0,242 0,616 0,646 0,324 0,723 0,838 0,412 0,950 0,739 0,500 0,500
166 0,597 0,537 0,505 0,641 0,240 0,472 0,705 0,262 0,659 0,390 0,696 0,947 0,742 0,500 0,500
167 0,654 0,589 0,521 0,583 0,272 0,726 0,728 0,341 0,742 0,863 0,508 0,813 0,758 0,500 0,500
168 1,000 0,946 0,726 0,339 0,488 0,498 1,000 0,100 0,959 1,000 0,416 0,240 0,956 0,500 0,500
169 0,608 0,547 0,520 0,539 0,240 0,694 0,707 0,323 0,621 0,799 0,585 0,710 0,855 0,500 0,500
170 0,550 0,495 0,512 0,446 0,268 0,797 0,712 0,340 0,630 0,827 0,531 0,816 0,846 0,500 0,500
171 0,580 0,522 0,560 0,783 0,207 0,456 0,725 0,266 0,613 0,782 0,595 0,951 0,689 0,500 1,000
172 0,613 0,551 0,517 0,543 0,235 0,496 0,761 0,175 0,656 0,774 0,424 0,673 0,732 0,500 1,000
173 0,703 0,633 0,522 0,526 0,259 0,805 0,796 0,266 0,654 0,578 0,350 0,791 0,841 1,000 1,000
174 0,757 0,681 0,557 0,370 0,276 0,593 0,692 0,317 0,685 0,766 0,463 0,618 0,840 0,500 0,500
175 0,778 0,700 0,923 0,429 0,216 0,677 0,808 0,190 1,000 0,869 0,426 0,585 0,822 0,500 1,000
176 0,577 0,520 0,786 0,999 0,146 0,222 0,208 0,379 0,424 0,879 0,416 0,100 0,517 0,500 0,500
177 0,616 0,554 0,497 0,445 0,304 0,826 0,745 0,305 0,753 0,873 0,412 0,653 0,771 1,000 1,000
178 0,668 0,601 0,435 0,511 0,392 0,910 0,704 0,616 0,760 0,901 0,354 0,900 0,856 0,500 1,000
179 0,630 0,567 0,473 0,530 0,385 0,881 0,667 0,447 0,825 0,584 0,514 0,814 0,840 0,500 1,000
180 0,674 0,607 0,450 0,548 0,333 0,914 0,563 0,300 0,766 0,888 0,439 0,916 0,820 0,500 1,000
181 0,662 0,596 0,442 0,550 0,322 0,854 0,737 0,481 0,731 0,858 0,374 0,850 0,791 0,500 1,000
182 0,648 0,583 0,519 0,702 0,253 0,600 0,699 0,429 0,681 0,730 0,464 0,861 0,654 0,500 1,000

146
183 0,532 0,479 0,480 0,484 0,246 0,664 0,733 0,258 0,632 0,764 0,350 0,576 0,785 0,500 1,000
184 0,711 0,640 0,517 0,670 0,272 0,770 0,759 0,255 0,610 0,622 0,430 0,642 0,724 1,000 1,000
185 0,641 0,577 0,516 0,582 0,278 0,666 0,978 0,409 0,573 0,305 0,418 0,757 0,781 1,000 1,000
186 0,623 0,561 0,541 0,497 0,319 0,815 0,791 0,403 0,545 0,640 0,438 0,705 0,756 0,500 1,000
187 0,594 0,535 0,465 0,632 0,453 0,975 0,866 0,225 0,859 0,545 0,471 0,651 0,911 0,500 1,000
188 0,573 0,516 0,440 0,506 0,460 0,929 0,785 0,311 0,795 0,854 0,573 0,598 0,910 0,500 0,500
189 0,443 0,399 0,436 0,690 0,403 0,872 0,766 0,355 0,755 0,827 0,325 0,159 0,819 0,500 0,500
190 0,560 0,504 0,429 0,669 0,368 0,914 0,677 0,623 0,669 0,720 0,433 0,172 0,878 1,000 0,500
191 0,546 0,491 0,428 0,793 0,340 0,905 1,000 0,539 0,680 1,000 0,379 0,989 0,876 0,500 0,500
192 0,549 0,494 0,453 0,564 0,307 0,869 0,928 0,410 0,731 0,757 0,425 0,577 0,832 0,500 0,500
193 0,708 0,638 0,500 0,313 0,413 0,953 0,860 0,402 0,823 0,721 0,427 0,692 0,922 0,500 0,500
194 0,630 0,567 0,427 0,541 0,384 0,914 0,723 0,406 0,854 0,870 0,585 0,824 0,883 0,500 0,500
195 0,714 0,643 0,538 0,383 0,317 0,791 0,755 0,424 0,779 0,827 0,509 0,741 0,781 0,500 0,500
196 0,751 0,676 0,544 0,644 0,372 0,838 0,733 0,250 0,853 0,580 0,438 0,365 0,845 0,500 0,500
197 0,633 0,570 0,466 0,429 0,350 0,937 0,600 0,316 0,722 0,548 0,663 0,757 0,877 1,000 0,500
198 0,631 0,568 0,450 0,754 0,322 0,723 0,759 0,360 0,704 0,811 0,535 0,793 0,795 0,500 0,500
199 0,612 0,551 0,461 0,613 0,342 0,834 0,788 0,251 0,739 0,784 0,518 0,527 0,819 0,500 0,500
200 0,706 0,635 0,560 0,582 0,231 0,702 0,514 0,198 0,679 0,806 0,412 0,478 0,679 0,500 0,500
201 0,713 0,642 0,536 0,498 0,178 0,466 0,665 0,468 0,514 0,641 0,417 0,824 0,514 0,500 0,500
202 0,719 0,647 0,488 0,746 0,203 0,539 0,685 0,501 0,664 0,545 0,500 0,352 0,615 0,500 0,500
203 0,691 0,622 0,506 0,453 0,291 0,779 0,782 0,526 0,699 0,901 0,407 0,798 0,751 0,500 0,500
204 0,653 0,588 0,589 0,688 0,257 0,686 0,819 0,462 0,740 0,699 0,575 0,455 0,722 0,500 0,500
205 0,600 0,540 0,554 0,666 0,351 0,763 0,709 0,430 0,822 0,645 0,636 0,102 0,826 0,500 0,500
206 0,589 0,530 0,503 0,481 0,334 0,813 0,670 0,436 0,731 0,790 0,670 0,139 0,816 0,500 0,500
207 0,669 0,602 0,525 0,479 0,398 0,860 0,599 0,360 0,742 0,757 0,713 0,609 0,875 0,500 0,500
208 0,660 0,594 0,475 0,441 0,482 0,905 0,671 0,429 0,567 0,622 0,693 0,680 0,908 0,500 0,500
209 0,708 0,637 0,499 0,520 0,326 0,805 0,598 0,564 0,540 0,714 0,743 0,755 0,772 0,500 0,500
210 0,728 0,655 0,679 0,634 0,159 0,364 0,537 0,329 0,621 0,736 0,606 0,419 0,531 0,500 0,500
211 0,653 0,588 0,858 0,442 0,138 0,260 0,386 0,307 0,829 0,554 0,730 0,100 0,196 1,000 1,000
212 0,614 0,553 0,549 0,639 0,291 0,713 0,626 0,450 0,584 0,780 0,500 0,342 0,701 0,500 0,500
213 0,675 0,607 0,931 0,741 0,151 0,218 0,632 0,231 0,839 0,616 0,430 0,100 0,340 0,500 0,500
214 0,683 0,615 0,519 0,614 0,309 0,894 0,602 0,529 0,617 0,728 0,812 0,728 0,800 0,500 0,500
215 0,708 0,637 0,541 0,719 0,250 0,734 0,619 0,411 0,597 0,765 0,619 0,662 0,694 0,500 0,500
216 0,726 0,653 0,700 0,746 0,132 0,168 0,497 0,444 0,647 0,100 0,432 0,259 0,218 1,000 0,500
217 0,746 0,672 0,587 0,651 0,238 0,602 0,713 0,449 0,589 0,809 0,745 0,584 0,464 1,000 0,500
218 0,682 0,614 0,578 0,635 0,244 0,581 0,722 0,254 0,711 0,627 0,415 0,637 0,797 0,500 0,500
219 0,599 0,539 0,464 0,568 0,386 0,937 0,815 0,335 0,626 0,734 0,658 0,655 0,941 0,500 0,500
220 0,626 0,563 0,442 0,536 0,441 0,934 0,799 0,354 0,659 0,844 0,521 0,766 0,928 0,500 0,500
221 0,675 0,607 0,489 0,396 0,463 0,919 0,789 0,198 0,696 0,835 0,285 0,935 0,929 0,500 0,500
222 0,635 0,571 0,466 0,426 0,473 0,935 0,738 0,425 0,516 0,820 0,694 0,831 0,934 0,500 0,500
223 0,925 0,833 0,555 0,784 0,548 0,684 0,805 0,144 0,504 0,861 0,694 0,100 0,886 1,000 0,500
224 1,000 1,000 0,548 0,239 0,714 0,751 1,000 0,233 0,568 0,770 0,517 0,777 0,989 0,500 0,500
225 0,699 0,629 0,471 0,342 0,426 0,964 0,659 0,595 0,623 0,549 0,744 0,964 0,926 0,500 1,000
226 0,656 0,591 0,519 0,597 0,384 0,959 0,712 0,379 0,687 0,869 0,660 0,981 0,933 1,000 0,500
227 0,724 0,651 0,533 0,613 0,345 0,821 0,665 0,674 0,683 0,752 0,455 0,873 0,840 1,000 0,500
228 0,669 0,602 0,506 0,667 0,290 0,790 0,809 0,354 0,784 0,846 0,517 0,909 0,808 0,500 0,500

147
229 0,575 0,517 0,423 0,346 0,349 0,933 0,757 0,864 0,625 0,899 0,563 0,966 0,884 0,500 0,500
230 0,589 0,530 0,462 0,483 0,451 0,955 0,813 0,470 0,484 0,545 0,693 0,886 0,919 1,000 0,500
231 0,638 0,574 0,420 0,512 0,438 0,952 0,793 0,207 0,610 0,879 0,325 0,679 0,844 0,500 0,500
232 0,648 0,583 0,339 0,430 0,381 0,938 0,634 0,111 0,715 0,826 0,775 0,880 0,873 0,500 0,500
233 0,625 0,562 0,499 0,575 0,339 0,889 0,724 0,311 0,674 0,821 0,509 0,922 0,832 0,500 0,500
234 0,654 0,589 0,582 0,612 0,418 0,942 0,866 0,380 0,617 0,719 0,550 0,948 0,847 0,500 0,500
235 0,656 0,590 0,489 0,529 0,404 0,933 0,728 0,332 0,601 0,806 0,522 0,826 0,897 0,500 0,500
236 0,678 0,610 0,508 0,534 0,416 0,948 0,809 0,122 0,605 0,858 0,634 0,926 0,946 0,500 0,500
237 0,633 0,570 0,488 0,440 0,323 0,898 0,845 0,151 0,640 0,871 0,477 0,972 0,835 0,500 0,500
238 0,687 0,618 0,510 0,669 0,321 0,683 0,771 0,490 0,583 0,649 0,407 0,825 0,768 0,500 0,500
239 0,721 0,649 0,523 0,601 0,327 0,815 0,782 0,284 0,768 0,875 0,532 0,890 0,744 0,500 0,500
240 0,704 0,634 0,430 0,681 0,383 0,912 0,863 0,137 0,698 0,677 0,100 0,868 0,884 0,500 0,500
241 0,651 0,586 0,491 0,562 0,353 0,828 0,765 0,187 0,687 0,836 0,587 0,868 0,773 0,500 0,500
242 0,633 0,570 0,506 0,673 0,301 0,834 0,680 0,594 0,645 0,875 0,502 0,970 0,815 0,500 0,500
243 0,683 0,615 0,559 0,431 0,272 0,772 0,590 0,661 0,681 0,838 0,591 0,966 0,747 0,500 0,500
244 0,678 0,610 0,549 0,472 0,260 0,685 0,670 0,612 0,608 0,732 0,484 0,811 0,755 0,500 0,500
245 0,641 0,577 0,488 0,530 0,304 0,789 0,751 0,437 0,634 0,752 0,673 0,974 0,826 1,000 0,500
246 0,675 0,607 0,506 0,464 0,319 0,863 0,652 0,276 0,614 0,804 0,591 0,940 0,869 0,500 0,500
247 0,872 0,785 0,573 0,574 0,320 0,954 0,659 0,187 0,742 0,729 0,877 0,937 0,826 1,000 1,000
248 0,829 0,746 0,584 0,602 0,306 0,854 0,602 0,678 0,626 0,728 0,550 0,991 0,875 0,500 0,500
249 0,696 0,626 0,530 0,570 0,247 0,692 0,710 0,605 0,594 0,809 0,523 0,428 0,729 0,500 0,500
250 0,533 0,480 0,508 0,633 0,241 0,680 0,617 0,609 0,572 0,707 0,580 0,935 0,755 0,500 0,500
251 0,652 0,587 0,514 0,319 0,280 0,815 0,493 0,541 0,650 0,753 0,700 0,917 0,788 1,000 0,500
252 0,695 0,626 0,501 0,795 0,264 0,706 0,791 0,289 0,622 0,821 0,486 0,643 0,762 0,500 0,500
253 0,713 0,641 0,550 0,632 0,248 0,543 0,651 0,199 0,626 0,671 0,750 0,867 0,750 1,000 1,000
254 0,821 0,739 0,557 0,585 0,254 0,611 0,797 0,476 0,645 0,725 0,544 0,840 0,800 0,500 0,500
255 0,877 0,789 0,554 0,502 0,357 0,929 0,734 0,625 0,609 0,685 0,544 0,911 0,892 1,000 0,500
256 0,643 0,579 0,514 0,725 0,181 0,281 0,498 0,437 0,575 0,726 0,756 0,606 0,496 0,500 0,500
257 0,642 0,578 0,513 0,772 0,191 0,355 0,655 0,267 0,585 0,728 0,640 0,727 0,502 0,500 0,500
258 0,665 0,598 0,559 0,677 0,171 0,246 0,609 0,278 0,593 0,757 0,530 0,714 0,468 1,000 0,500
259 0,900 0,810 0,557 0,561 0,294 0,788 0,652 0,416 0,667 0,804 0,467 0,900 0,816 1,000 0,500
260 0,789 0,710 0,545 0,564 0,272 0,707 0,641 0,469 0,613 0,756 0,501 0,930 0,770 0,500 0,500
261 0,869 0,782 0,591 0,462 0,264 0,667 0,699 0,312 0,679 0,646 0,494 0,767 0,789 1,000 0,500
262 0,829 0,746 0,591 0,614 0,197 0,336 0,516 0,403 0,652 0,628 0,473 0,691 0,623 0,500 0,500
263 0,668 0,601 0,581 0,730 0,156 0,199 0,546 0,325 0,599 0,773 0,385 0,595 0,535 0,500 0,500
264 0,662 0,596 0,600 0,747 0,157 0,250 0,589 0,119 0,570 0,347 0,714 0,724 0,417 0,500 1,000
265 0,619 0,557 0,592 0,756 0,158 0,212 0,438 0,248 0,542 0,567 0,565 0,441 0,406 0,500 0,500
266 0,756 0,681 0,565 0,599 0,193 0,368 0,602 0,299 0,648 0,550 0,705 0,315 0,565 1,000 0,500
267 0,908 0,817 0,640 0,432 0,193 0,460 0,733 0,385 0,654 0,722 0,343 0,526 0,656 0,500 0,500
268 1,000 0,906 0,569 0,504 0,387 0,870 1,000 0,517 0,421 0,770 0,550 0,516 0,887 0,500 0,500
269 0,843 0,758 0,591 0,531 0,226 0,463 0,579 0,402 0,636 0,919 0,497 0,963 0,723 0,500 0,500
270 0,921 0,829 0,606 0,528 0,220 0,475 0,641 0,480 0,612 0,837 0,410 0,691 0,674 1,000 0,500
271 0,959 0,863 0,597 0,556 0,232 0,485 0,713 0,431 0,655 0,606 0,538 0,712 0,672 1,000 0,500
272 0,900 0,810 0,585 0,538 0,189 0,433 0,540 0,471 0,570 0,896 0,524 0,582 0,554 1,000 0,500
273 0,978 0,880 0,653 0,594 0,189 0,167 0,624 0,339 0,594 0,709 0,535 0,746 0,572 0,500 0,500
274 0,660 0,594 0,521 0,575 0,210 0,588 0,646 0,491 0,536 0,760 0,618 0,872 0,648 0,500 0,500
148
275 0,659 0,593 0,592 0,750 0,139 0,255 0,537 0,393 0,534 0,855 0,302 0,113 0,126 1,000 0,500
276 0,887 0,798 0,621 0,485 0,206 0,294 0,575 0,484 0,671 0,604 0,206 0,216 0,597 1,000 1,000
277 0,654 0,589 0,518 0,694 0,183 0,250 0,637 0,334 0,566 0,751 0,267 0,828 0,581 0,500 0,500
278 0,606 0,545 0,489 0,484 0,222 0,478 0,568 0,464 0,578 0,686 0,221 0,899 0,680 0,500 1,000
279 0,621 0,559 0,485 0,530 0,249 0,729 0,674 0,501 0,551 0,602 0,550 0,705 0,788 1,000 1,000
280 0,712 0,641 0,548 0,630 0,210 0,641 0,658 0,431 0,560 0,696 0,487 0,526 0,700 1,000 0,500
281 0,737 0,664 0,526 0,695 0,227 0,553 0,713 0,379 0,598 0,809 0,483 0,774 0,689 1,000 1,000
282 0,855 0,770 0,585 0,381 0,209 0,428 0,856 0,380 0,666 0,563 0,608 0,570 0,648 1,000 0,500
283 0,753 0,677 0,556 0,550 0,222 0,413 0,680 0,632 0,643 0,453 0,362 0,420 0,673 0,500 0,500
284 0,700 0,630 0,558 0,684 0,197 0,429 0,647 0,450 0,603 0,361 0,293 0,353 0,597 0,500 1,000
285 0,662 0,596 0,542 0,509 0,221 0,651 0,663 0,555 0,561 0,192 0,460 0,829 0,752 0,500 0,500
286 0,591 0,532 0,540 0,532 0,189 0,515 0,687 0,405 0,518 0,603 0,483 0,635 0,677 0,500 0,500
287 0,692 0,623 0,564 0,711 0,184 0,408 0,369 0,318 0,521 0,562 0,432 0,945 0,503 1,000 0,500
288 0,641 0,577 0,539 0,608 0,180 0,340 0,597 0,254 0,533 0,762 0,455 0,977 0,562 0,500 0,500
289 0,623 0,561 0,517 0,703 0,189 0,361 0,638 0,196 0,548 0,640 0,218 0,839 0,619 0,500 1,000
290 0,763 0,687 0,530 0,667 0,194 0,426 0,653 0,332 0,502 0,392 0,432 0,211 0,672 0,500 0,500
291 0,776 0,699 0,531 0,408 0,208 0,516 0,660 0,522 0,562 0,674 0,425 0,924 0,751 0,500 0,500
292 0,621 0,559 0,561 0,583 0,182 0,437 0,626 0,256 0,462 0,779 0,278 0,979 0,608 0,500 0,500
293 0,835 0,751 0,544 0,633 0,178 0,364 0,430 0,341 0,559 0,379 0,432 0,587 0,699 0,500 1,000
294 0,714 0,643 0,563 0,710 0,185 0,327 0,621 0,399 0,520 0,892 0,377 0,975 0,655 0,500 0,500
295 0,857 0,772 0,621 0,465 0,197 0,265 0,453 0,608 0,593 0,287 0,384 0,544 0,584 1,000 0,500
296 0,824 0,741 0,537 0,499 0,179 0,239 0,236 0,462 0,516 0,509 0,257 0,469 0,657 1,000 0,500
297 0,983 0,885 0,603 0,548 0,205 0,521 0,600 0,547 0,516 0,881 0,435 0,368 0,536 0,500 0,500
298 0,854 0,768 0,638 0,649 0,228 0,556 0,698 0,406 0,589 0,772 0,513 0,142 0,665 0,500 0,500
299 0,915 0,823 0,586 0,623 0,220 0,493 0,691 0,579 0,596 0,610 0,340 0,107 0,647 0,500 0,500
300 0,858 0,772 0,571 0,582 0,236 0,501 0,775 0,561 0,609 0,840 0,668 0,573 0,643 1,000 1,000
301 0,845 0,760 0,528 0,604 0,265 0,689 0,687 0,586 0,650 0,747 0,442 0,424 0,724 0,500 0,500
302 0,881 0,793 0,556 0,546 0,255 0,832 0,638 0,543 0,631 0,709 0,497 0,779 0,800 0,500 1,000
303 0,937 0,843 0,612 0,675 0,198 0,339 0,606 0,599 0,703 0,705 0,325 0,228 0,621 1,000 1,000
304 0,931 0,838 0,597 0,627 0,192 0,412 0,648 0,412 0,496 0,757 0,213 0,339 0,563 0,500 0,500
305 0,844 0,760 0,589 0,619 0,162 0,606 0,703 0,393 0,469 0,888 0,494 0,120 0,546 0,500 0,500
306 0,951 0,856 0,633 0,706 0,100 0,100 0,670 0,391 0,459 0,712 0,361 0,884 0,325 0,500 0,500
307 0,864 0,777 0,602 0,735 0,183 0,468 0,541 0,474 0,631 0,869 0,293 0,704 0,539 1,000 0,500
308 0,938 0,844 0,639 0,667 0,181 0,288 0,754 0,594 0,619 0,655 0,359 0,688 0,551 1,000 0,500
309 0,875 0,788 0,579 0,522 0,238 0,671 0,713 0,407 0,615 0,648 0,703 0,539 0,750 1,000 1,000
310 0,884 0,795 0,570 0,699 0,226 0,486 0,678 0,513 0,625 0,873 0,630 0,542 0,657 0,500 1,000
311 0,780 0,702 0,532 0,525 0,191 0,216 0,584 0,599 0,518 0,555 0,775 0,161 0,485 0,500 1,000
312 0,887 0,799 0,608 0,704 0,184 0,187 0,627 0,512 0,595 0,841 0,643 0,207 0,596 0,500 0,500
313 0,835 0,751 0,543 0,491 0,207 0,493 0,657 0,362 0,573 0,602 0,409 0,822 0,666 1,000 0,500
314 0,890 0,801 0,554 0,531 0,242 0,631 0,742 0,426 0,584 0,875 0,370 0,765 0,752 0,500 0,500
315 0,809 0,728 0,536 0,501 0,236 0,659 0,710 0,540 0,652 0,745 0,642 0,881 0,808 0,500 0,500
316 0,857 0,771 0,371 0,371 0,183 0,677 0,712 0,775 0,463 0,792 0,525 0,993 0,767 0,500 0,500
317 0,837 0,753 0,543 0,549 0,222 0,736 0,769 0,625 0,515 0,867 0,648 0,965 0,761 0,500 1,000
318 0,892 0,803 0,599 0,559 0,203 0,412 0,542 0,391 0,586 0,627 0,337 0,938 0,562 1,000 1,000
319 0,876 0,789 0,633 0,604 0,175 0,293 0,696 0,299 0,541 0,750 0,265 0,531 0,585 1,000 0,500
320 0,872 0,785 0,641 0,489 0,165 0,195 0,706 0,832 0,522 0,673 0,406 0,505 0,505 0,500 0,500

149
321 0,811 0,730 0,598 0,608 0,163 0,247 0,537 0,534 0,474 0,792 0,358 0,101 0,527 1,000 0,500
322 0,950 0,855 0,656 0,574 0,172 0,285 0,561 0,589 0,470 0,866 0,284 0,203 0,456 0,500 0,500
323 0,998 0,898 0,657 0,584 0,173 0,117 0,619 0,749 0,559 0,886 0,550 0,104 0,310 1,000 1,000
324 0,932 0,839 0,657 0,522 0,184 0,412 0,583 0,345 0,577 0,638 0,434 0,373 0,583 0,500 1,000
325 0,791 0,712 0,591 0,547 0,200 0,439 0,809 0,635 0,565 0,858 0,541 0,646 0,626 1,000 1,000
326 0,895 0,805 0,527 0,577 0,196 0,312 0,634 0,538 0,529 0,543 0,286 0,154 0,613 1,000 0,500
327 0,808 0,727 0,516 0,569 0,220 0,685 0,687 0,354 0,534 0,607 0,427 0,428 0,764 1,000 0,500
328 0,826 0,744 0,556 0,640 0,204 0,381 0,658 0,310 0,560 0,799 0,479 0,752 0,627 1,000 0,500
329 0,695 0,625 0,520 0,521 0,203 0,415 0,838 0,205 0,568 0,576 0,325 0,202 0,674 0,500 0,500
330 0,738 0,664 0,552 0,627 0,222 0,474 0,743 0,346 0,591 0,892 0,438 0,442 0,739 1,000 1,000
331 0,871 0,784 0,522 0,653 0,223 0,604 0,799 0,530 0,632 0,891 0,531 0,755 0,677 1,000 1,000
332 0,764 0,688 0,519 0,486 0,226 0,628 0,788 0,436 0,531 0,688 0,600 0,954 0,779 0,500 1,000
333 0,833 0,750 0,494 0,662 0,263 0,659 0,742 0,705 0,569 0,811 0,264 0,680 0,793 0,500 0,500
334 0,815 0,734 0,519 0,422 0,256 0,679 0,777 0,548 0,545 0,604 0,388 0,512 0,737 1,000 0,500
335 0,671 0,604 0,522 0,506 0,248 0,769 0,797 0,566 0,542 0,841 0,502 0,889 0,782 0,500 1,000
336 0,645 0,580 0,461 0,568 0,233 0,753 0,694 0,456 0,547 0,804 0,769 0,824 0,772 0,500 1,000
337 0,533 0,480 0,430 0,332 0,263 0,787 0,849 0,589 0,469 0,757 0,357 0,401 0,866 0,500 0,500
338 0,674 0,607 0,508 0,496 0,239 0,693 0,591 0,494 0,518 0,588 0,280 0,888 0,826 0,500 1,000
339 0,770 0,693 0,534 0,271 0,212 0,384 0,724 0,202 0,557 0,588 0,393 0,534 0,719 1,000 1,000
340 0,803 0,722 0,518 0,620 0,234 0,721 0,646 0,439 0,519 0,681 0,393 0,578 0,795 0,500 0,500
341 1,000 0,927 0,493 0,100 0,343 0,394 0,562 0,144 0,661 0,894 0,412 0,100 0,721 1,000 1,000
342 0,947 0,853 0,556 0,600 0,192 0,232 0,744 0,345 0,538 0,735 0,450 0,243 0,647 1,000 0,500
343 0,663 0,597 0,589 0,318 0,213 0,388 0,630 0,513 0,452 0,793 0,433 0,208 0,736 1,000 0,500
344 0,808 0,728 0,542 0,673 0,448 1,000 0,816 0,734 0,350 0,919 0,719 0,215 0,935 0,500 0,500
345 0,515 0,463 0,527 0,412 0,273 0,902 0,550 0,121 0,100 0,922 0,550 0,336 0,912 0,500 0,500
346 0,410 0,369 0,553 0,313 0,298 0,947 0,792 0,769 0,308 0,949 0,300 0,883 0,919 0,500 0,500
347 0,674 0,607 0,568 0,660 0,229 0,332 0,711 0,613 0,369 0,894 0,428 0,454 0,619 0,500 0,500
348 0,734 0,661 0,489 0,681 0,404 0,974 0,754 1,000 0,597 0,755 0,389 0,796 0,918 0,500 0,500
349 0,927 0,835 0,613 0,584 0,251 0,502 0,640 0,135 0,554 0,646 0,513 0,104 0,778 0,500 0,500
350 0,816 0,735 0,559 0,625 0,282 0,874 0,533 0,555 0,472 0,654 0,510 0,214 0,874 0,500 0,500
351 0,718 0,646 0,500 0,651 0,398 0,900 0,776 0,686 0,435 0,730 0,421 0,976 0,961 0,500 0,500
352 0,881 0,793 0,558 0,601 0,297 0,870 0,718 0,534 0,479 0,666 0,526 0,636 0,894 0,500 0,500
353 0,836 0,752 0,533 0,529 0,288 0,933 0,803 0,543 0,497 0,740 0,530 0,717 0,845 1,000 1,000
354 0,911 0,820 0,528 0,405 0,387 0,929 0,819 0,616 0,720 0,913 0,681 0,913 0,804 0,500 1,000
355 0,894 0,804 0,452 0,548 0,381 0,903 0,722 0,481 0,700 0,771 0,466 0,987 0,857 0,500 1,000
356 0,918 0,826 0,597 0,620 0,287 0,882 0,807 0,426 0,488 0,828 0,475 0,864 0,835 0,500 0,500
357 0,836 0,752 0,601 0,524 0,253 0,764 0,545 0,189 0,538 0,924 0,381 0,876 0,823 1,000 0,500
358 0,852 0,767 0,571 0,178 0,299 0,921 0,735 0,277 0,574 0,729 0,460 0,983 0,831 0,500 0,500
359 0,864 0,777 0,481 0,407 0,296 0,798 0,686 0,530 0,499 0,958 0,428 0,100 0,695 0,500 1,000
360 0,761 0,685 0,786 0,469 0,315 0,435 0,801 0,107 0,409 0,971 0,582 0,102 0,543 1,000 0,500
361 0,998 0,899 0,556 0,446 0,566 0,849 1,000 0,225 0,685 1,000 0,510 0,863 0,909 1,000 0,500
362 0,928 0,835 0,580 0,526 0,410 0,636 0,799 0,377 0,693 0,816 0,500 0,204 0,904 1,000 0,500
363 0,734 0,661 0,518 0,417 0,285 0,891 0,630 0,436 0,529 0,894 0,424 0,888 0,845 0,500 0,500
364 0,845 0,761 0,574 0,433 0,303 0,887 0,650 0,517 0,633 0,909 0,606 0,796 0,869 0,500 1,000
365 0,899 0,809 0,527 0,450 0,384 0,806 0,684 0,351 0,600 0,939 0,443 0,818 0,893 1,000 1,000
366 0,962 0,865 0,613 0,563 0,255 0,765 0,706 0,196 0,563 0,952 0,510 0,885 0,625 1,000 1,000

150
367 0,937 0,843 0,645 0,368 0,363 0,640 1,000 0,336 0,610 1,000 0,628 0,546 0,869 1,000 0,500
368 0,931 0,838 0,530 0,280 0,355 0,752 0,708 0,341 0,629 0,868 0,559 0,281 0,876 1,000 0,500
Table A.2: (continued)
Code UDT BD NRD NS NBA CIS AH AFS APS ST BSN LNR RCO SLC REI
1 0,932 0,914 0,482 0,864 0,922 0,841 0,179 0,380 0,000 0,526 0,714 0,689 0,729 0,753 0,848
2 0,945 0,930 0,542 0,100 0,100 0,720 0,355 0,065 0,000 0,178 0,794 0,729 0,233 0,759 0,893
3 1,000 0,775 0,815 0,466 0,500 0,302 0,692 0,000 0,472 0,397 0,751 0,446 0,934 0,507 0,472
4 0,883 0,816 0,832 0,578 0,716 0,563 0,110 0,000 0,142 0,549 0,646 0,576 0,225 0,677 0,901
5 0,638 0,907 0,622 0,681 0,797 0,683 0,276 0,260 0,653 0,811 0,595 0,663 0,100 0,841 0,680
6 0,809 0,858 0,370 0,937 0,965 0,742 0,021 0,000 0,271 0,463 0,577 0,317 0,852 0,538 0,769
7 0,905 0,844 0,737 0,770 0,852 0,572 0,162 0,000 0,339 0,902 0,551 0,228 0,322 0,632 0,942
8 1,000 0,876 0,688 0,600 0,689 0,698 0,341 0,000 0,232 0,629 0,617 0,387 0,744 0,838 0,824
9 1,000 0,865 0,768 0,830 0,811 0,453 0,344 0,000 0,012 0,555 0,654 0,399 0,115 0,691 0,834
10 1,000 0,930 0,526 0,774 0,867 0,628 0,372 0,000 0,000 0,352 0,371 0,479 0,850 0,538 0,729
11 1,000 0,783 0,607 0,754 0,351 0,522 0,550 0,004 0,000 0,416 0,559 0,437 0,880 0,700 0,597
12 1,000 0,704 0,686 0,545 0,688 0,475 0,100 0,154 0,480 0,100 0,614 0,517 0,126 0,100 0,634
13 0,888 0,953 0,678 0,844 0,899 0,299 0,123 0,002 0,511 0,100 0,684 0,714 0,432 0,100 0,335
14 1,000 0,731 0,807 0,683 0,769 0,617 0,107 0,000 0,351 0,326 0,809 0,786 0,898 0,385 0,997
15 1,000 0,764 0,928 0,477 0,638 0,724 0,276 0,000 0,019 0,407 0,844 0,727 0,574 0,280 0,914
16 0,888 0,802 0,867 0,670 0,710 0,499 0,516 0,249 0,000 0,339 0,867 0,733 0,421 0,306 0,832
17 0,969 0,735 0,827 0,688 0,755 0,755 0,162 0,341 0,558 0,290 0,620 0,484 0,739 0,538 0,873
18 1,000 0,761 0,854 0,554 0,686 0,647 0,196 0,658 0,586 0,372 0,722 0,574 0,458 0,573 0,858
19 1,000 0,806 0,855 0,670 0,772 0,467 0,241 0,000 0,287 0,252 0,721 0,434 0,930 0,499 0,590
20 1,000 0,768 0,834 0,593 0,706 0,441 0,025 0,000 0,000 0,429 0,545 0,321 0,987 0,655 0,370
21 1,000 0,853 0,656 0,891 0,460 0,588 0,000 0,362 0,000 0,414 0,557 0,612 0,892 0,632 0,742
22 0,929 0,962 0,581 0,852 0,878 0,633 0,000 0,228 0,429 0,394 0,615 0,562 0,957 0,557 0,774
23 1,000 0,883 0,492 0,749 0,851 0,322 0,251 0,362 0,000 0,331 0,425 0,427 0,745 0,787 0,416
24 0,920 0,669 0,671 0,511 0,665 0,638 0,116 0,341 0,000 0,505 0,642 0,471 0,869 0,611 0,956
25 0,925 0,692 0,705 0,440 0,606 0,599 0,340 0,000 0,060 0,538 0,573 0,223 0,757 0,416 0,960
26 1,000 0,682 0,735 0,511 0,642 0,411 0,256 0,095 0,000 0,313 0,833 0,632 0,876 0,317 0,496
27 0,762 0,901 0,220 0,949 0,939 0,682 0,000 0,054 0,000 0,349 0,478 0,365 0,908 0,699 0,701
28 0,977 0,786 0,616 0,740 0,837 0,628 0,000 0,321 0,000 0,290 0,721 0,645 0,524 0,492 0,715
29 1,000 0,684 0,609 0,876 0,921 0,278 0,039 0,140 0,000 0,352 0,679 0,429 1,000 0,538 0,387
30 1,000 0,650 0,589 1,000 1,000 0,237 0,120 0,000 0,000 0,424 0,565 0,720 1,000 0,632 0,988
31 0,978 0,990 0,644 1,000 1,000 0,756 0,000 0,171 0,000 0,455 0,728 0,653 1,000 0,854 1,000
32 0,912 0,730 0,733 0,824 0,803 0,623 0,000 0,272 0,000 0,549 0,722 0,705 0,829 0,651 0,745
33 1,000 0,793 0,615 0,896 0,938 0,305 0,000 0,288 0,000 0,371 0,559 0,366 0,727 0,584 0,359
34 1,000 0,858 0,537 0,410 0,571 0,657 0,000 0,095 0,006 0,301 0,455 0,364 0,919 0,726 0,567
35 1,000 0,650 0,676 0,588 0,699 0,272 0,208 0,232 0,000 0,585 0,595 0,387 0,703 0,712 0,482
36 1,000 0,614 0,692 0,557 0,698 0,357 0,186 0,238 0,028 0,463 0,731 0,605 1,000 0,783 0,582
37 0,975 0,765 0,730 0,160 0,274 0,631 0,326 0,450 0,022 0,790 0,824 0,760 0,928 0,823 0,733
38 0,869 0,948 0,370 0,980 0,989 0,771 0,100 0,442 0,054 0,526 0,714 0,689 0,596 0,753 0,211
39 1,000 0,765 0,864 0,444 0,608 0,357 0,455 0,151 0,941 0,573 0,611 0,622 1,000 0,717 0,341
40 1,000 0,756 0,794 0,710 0,696 0,479 0,560 0,000 0,026 0,352 0,486 0,633 0,836 0,572 0,680
151
41 1,000 0,711 0,588 0,309 0,489 0,326 0,182 0,168 0,331 0,559 0,578 0,485 0,939 0,732 0,464
42 1,000 0,541 0,675 0,864 0,918 0,555 0,010 0,000 0,306 0,402 0,534 0,786 1,000 0,538 0,174
43 1,000 0,894 0,585 0,881 0,928 0,310 0,376 0,008 0,463 0,379 0,543 0,687 0,998 0,565 0,141
44 1,000 0,739 0,652 0,830 0,351 0,321 0,513 0,040 0,613 0,575 0,792 0,681 0,977 0,590 0,216
45 1,000 0,719 0,590 0,347 0,497 0,360 0,000 0,301 0,633 0,320 0,830 0,738 0,989 0,701 0,514
46 1,000 0,572 0,605 0,610 0,726 0,446 0,213 0,000 0,060 0,451 0,669 0,756 0,816 0,191 0,512
47 1,000 0,704 0,574 0,382 0,560 0,291 0,041 0,230 0,456 0,492 0,655 0,464 0,935 0,784 0,617
48 1,000 0,423 0,637 0,778 0,870 0,532 0,189 0,299 0,313 0,452 0,602 0,469 0,957 0,776 0,741
49 1,000 0,615 0,630 0,531 0,682 0,484 0,467 0,213 0,478 0,433 0,833 0,687 0,679 0,787 0,735
50 1,000 0,625 0,511 0,593 0,683 0,477 0,250 0,000 0,398 0,343 0,539 0,554 0,876 0,470 1,000
51 1,000 0,577 0,557 0,842 0,893 0,440 0,421 0,266 0,473 0,646 0,543 0,554 1,000 0,526 0,780
52 1,000 0,548 0,565 0,728 0,792 0,561 0,141 0,000 0,393 0,482 0,724 0,687 0,943 0,710 0,713
53 1,000 0,732 0,570 0,859 0,919 0,322 0,141 0,095 0,029 0,611 0,470 0,530 0,992 0,730 0,664
54 0,848 0,780 0,509 0,736 0,833 0,324 0,135 0,025 0,361 0,398 0,603 0,649 0,835 0,675 0,789
55 1,000 0,800 0,481 0,125 0,193 0,593 0,045 0,213 0,008 0,392 0,582 0,507 0,961 0,648 0,663
56 0,891 0,824 0,399 0,478 0,644 0,577 0,055 0,196 0,000 1,000 0,757 0,288 0,778 0,940 0,682
57 0,704 0,832 0,616 0,919 0,355 0,315 0,312 0,348 0,363 0,514 0,567 0,493 0,854 0,663 0,608
58 1,000 0,000 0,743 0,927 0,942 0,627 0,536 0,710 0,767 0,559 0,750 0,554 0,978 0,440 0,843
59 0,831 0,869 0,767 0,738 0,522 0,541 0,581 0,000 0,140 0,169 0,410 0,745 0,550 0,505 0,524
60 0,826 0,604 0,571 0,738 0,708 0,667 0,498 0,042 0,000 0,581 0,757 0,711 0,861 0,811 0,773
61 0,933 0,701 0,612 0,610 0,740 0,715 0,189 0,000 0,000 0,244 0,576 0,433 0,906 0,385 0,885
62 0,962 0,615 0,690 0,515 0,642 0,577 0,538 0,000 0,000 0,455 0,711 0,498 0,900 0,611 0,907
63 0,990 0,662 0,841 0,527 0,652 0,592 0,301 0,372 0,722 0,245 0,633 0,406 0,807 0,554 0,981
64 0,975 0,636 0,708 0,430 0,545 0,602 0,301 0,029 0,108 0,424 0,652 0,492 0,904 0,759 0,863
65 1,000 0,906 0,718 0,365 0,479 0,670 1,000 0,283 0,953 0,478 0,553 0,485 0,809 0,729 0,614
66 1,000 0,669 0,773 0,511 0,587 0,433 0,736 0,111 0,479 0,602 0,549 0,314 0,934 0,793 0,785
67 1,000 0,656 0,770 0,520 0,657 0,547 0,288 0,094 0,421 0,323 0,722 0,595 0,786 0,336 0,683
68 1,000 0,696 0,643 0,632 0,741 0,288 0,210 0,000 0,362 0,655 0,744 0,505 0,848 0,598 0,209
69 0,993 0,853 0,782 0,624 0,694 0,623 0,556 0,024 0,652 0,811 0,819 0,587 0,783 0,456 0,962
70 0,990 0,751 0,657 0,659 0,756 0,379 0,220 0,448 0,000 0,470 0,626 0,479 0,888 0,608 0,306
71 0,973 0,904 0,480 0,265 0,438 0,685 0,453 0,387 0,000 0,663 0,795 0,720 0,914 0,907 0,130
72 1,000 0,926 0,345 0,997 0,886 0,532 0,000 0,450 0,000 0,540 0,691 0,998 0,867 0,272 0,114
73 1,000 0,880 0,574 0,853 0,910 0,742 0,000 0,125 0,000 0,513 0,728 0,812 0,955 0,474 0,127
74 1,000 0,898 0,484 0,748 0,850 0,467 0,000 0,107 0,000 0,764 0,681 0,955 0,890 0,524 0,148
75 1,000 0,946 0,329 0,646 0,773 0,282 0,000 0,000 0,000 0,477 0,443 0,432 0,966 0,490 0,172
76 1,000 0,948 0,452 0,668 0,777 0,269 0,000 0,000 0,172 0,531 0,573 0,698 0,912 0,588 0,573
77 0,975 0,647 0,107 0,898 0,900 0,568 0,000 0,000 0,464 0,353 0,473 0,507 0,762 0,740 0,785
78 0,977 0,613 0,274 0,857 0,508 0,393 0,347 0,000 0,376 0,285 0,426 0,353 0,923 0,503 0,792
79 0,971 0,560 0,502 0,475 0,599 0,530 0,829 0,419 0,557 0,344 0,491 0,406 0,814 0,478 0,876
80 1,000 0,663 0,236 0,326 0,496 0,374 0,095 0,083 0,012 0,409 0,565 0,436 0,650 0,547 0,762
81 0,987 0,756 0,103 0,910 0,937 0,415 0,303 0,514 0,231 0,601 0,665 1,000 0,918 0,538 0,115
82 1,000 0,642 0,439 0,691 0,796 0,431 0,002 0,192 0,843 0,580 0,695 0,542 0,950 0,777 0,548
83 0,976 0,673 0,368 0,655 0,776 0,381 0,080 0,249 0,197 0,607 0,395 0,309 0,876 0,744 0,586
84 1,000 0,713 0,554 0,636 0,750 0,695 0,417 0,463 0,713 0,314 0,536 0,505 0,927 0,691 0,767
85 1,000 0,882 0,416 0,497 0,661 0,472 0,092 0,394 0,257 0,739 0,715 0,618 0,871 0,940 0,512
86 1,000 0,750 0,357 0,599 0,708 0,398 0,321 0,442 0,874 0,381 0,466 0,355 0,901 0,538 0,275

152
87 1,000 0,565 0,358 0,504 0,618 0,510 0,079 0,002 0,500 0,334 0,706 0,469 0,857 0,672 0,861
88 0,984 0,719 0,205 0,593 0,544 0,437 0,021 0,000 0,408 0,501 0,521 0,376 0,870 0,719 0,484
89 1,000 0,951 0,562 0,882 0,911 0,482 0,000 0,000 0,536 0,402 0,595 0,330 0,813 0,670 0,494
90 1,000 0,874 0,587 0,924 0,931 0,348 0,000 0,000 0,764 0,748 0,514 0,279 0,787 0,739 0,498
91 1,000 0,947 0,345 0,116 0,166 0,308 0,000 0,000 0,000 0,469 0,694 0,159 0,521 0,730 0,975
92 1,000 0,956 0,463 0,140 0,233 0,275 0,000 0,000 0,000 0,698 0,553 0,587 0,191 0,854 0,653
93 0,987 0,817 0,500 1,000 0,982 0,545 0,000 0,000 0,000 0,339 0,495 0,387 1,000 0,136 0,454
94 1,000 0,648 0,465 0,929 0,899 0,612 0,000 0,000 0,000 0,443 0,565 0,476 1,000 0,465 0,862
95 1,000 0,652 0,463 0,541 0,599 0,500 0,000 0,261 0,048 0,687 0,838 0,526 0,900 0,875 0,712
96 1,000 0,630 0,509 0,430 0,609 0,333 0,000 0,000 0,349 0,390 0,533 0,592 0,965 0,452 0,659
97 1,000 0,871 0,292 0,845 0,899 0,506 0,000 0,000 0,000 0,525 0,557 0,541 0,517 0,477 0,622
98 1,000 0,594 0,505 0,519 0,686 0,569 0,000 0,000 0,000 0,290 0,551 0,439 0,900 0,561 0,718
99 1,000 0,658 0,598 0,430 0,599 0,445 0,000 0,000 0,252 0,375 0,540 0,464 0,968 0,645 0,545
100 1,000 0,739 0,436 0,536 0,641 0,563 0,000 0,172 0,437 0,532 1,000 0,698 0,942 0,806 0,570
101 1,000 0,754 0,561 0,468 0,635 0,349 0,000 0,343 0,197 0,372 0,565 0,503 0,761 0,465 0,475
102 1,000 0,728 0,526 0,566 0,712 0,507 0,000 0,654 0,185 0,597 0,862 0,756 1,000 0,598 0,789
103 1,000 0,715 0,507 0,400 0,583 0,394 0,132 0,235 0,877 0,413 0,752 0,599 0,688 0,652 0,604
104 1,000 0,655 0,566 0,549 0,696 0,242 0,000 0,325 0,000 0,390 0,698 0,610 0,948 0,691 0,693
105 0,658 0,853 0,514 0,297 0,476 0,597 0,000 0,523 0,000 0,482 0,533 0,359 1,000 0,654 0,290
106 1,000 0,938 0,466 0,962 0,972 0,448 0,159 0,000 0,020 0,493 0,384 0,369 0,935 0,632 0,385
107 1,000 0,659 0,613 0,320 0,500 0,210 0,000 0,000 0,342 0,566 0,516 0,411 0,795 0,510 0,768
108 1,000 0,540 0,655 0,430 0,608 0,496 0,235 0,456 0,081 0,433 0,665 0,541 0,994 0,519 0,674
109 1,000 0,870 0,431 0,792 0,878 0,320 0,000 0,000 0,718 0,452 0,571 0,375 1,000 0,558 0,208
110 1,000 0,824 0,469 0,546 0,708 0,382 0,005 0,000 0,115 0,430 0,518 0,537 0,953 0,691 0,469
111 1,000 0,587 0,566 0,701 0,801 0,353 0,071 0,000 0,000 0,380 0,643 0,400 1,000 0,611 0,693
112 1,000 0,604 0,597 0,685 0,793 0,519 0,276 0,000 0,074 0,402 0,754 0,471 0,862 0,683 0,544
113 1,000 0,663 0,663 0,453 0,439 0,508 0,340 0,000 0,119 0,350 0,553 0,372 0,839 0,719 0,442
114 1,000 0,712 0,603 0,493 0,636 0,251 0,546 0,103 0,007 0,458 0,655 0,460 0,932 0,605 0,604
115 1,000 0,757 0,590 0,804 0,886 0,194 0,293 0,128 0,680 0,418 0,696 0,495 1,000 0,611 1,000
116 1,000 0,769 0,414 0,718 0,769 0,530 0,061 0,000 0,000 0,178 0,595 0,387 0,850 0,617 0,516
117 1,000 0,816 0,766 0,722 0,692 0,135 0,562 0,000 0,000 0,345 0,642 0,469 0,976 0,570 0,909
118 1,000 0,878 0,723 0,132 0,211 0,386 0,535 0,385 0,180 0,439 0,608 0,467 0,760 0,530 0,684
119 1,000 0,643 0,718 0,801 0,759 0,417 0,240 0,061 0,238 0,455 0,565 0,648 0,929 0,724 0,515
120 1,000 0,890 0,578 0,878 0,866 0,473 0,239 0,494 0,128 0,158 0,757 0,587 1,000 0,598 0,762
121 1,000 0,913 0,699 0,572 0,633 0,391 0,404 0,066 0,405 0,290 0,611 0,361 0,565 0,665 0,244
122 1,000 0,565 0,676 0,567 0,614 0,337 0,543 0,000 0,555 0,309 0,595 0,455 0,862 0,641 0,750
123 1,000 0,646 0,634 0,539 0,699 0,349 0,196 0,880 0,021 0,317 0,520 0,387 0,928 0,538 0,745
124 1,000 0,906 0,645 0,125 0,162 0,333 0,343 0,000 0,003 0,402 0,629 0,334 0,828 0,406 0,958
125 1,000 0,542 0,599 0,526 0,672 0,391 0,243 0,000 0,000 0,640 0,675 0,679 0,978 0,632 0,886
126 1,000 0,599 0,666 0,642 0,718 0,332 0,207 0,000 0,462 0,231 0,565 0,473 0,927 0,499 0,996
127 1,000 0,791 0,670 0,497 0,583 0,562 0,141 0,000 0,227 0,343 0,595 0,672 0,884 0,317 0,960
128 1,000 0,663 0,655 0,557 0,602 0,569 0,250 0,218 0,407 0,309 0,717 0,539 0,915 0,677 0,911
129 1,000 0,709 0,633 0,385 0,534 0,295 0,202 0,163 0,346 0,352 0,550 0,681 0,529 0,759 0,688
130 1,000 0,825 0,683 0,540 0,586 0,240 0,223 0,208 0,139 0,228 0,476 0,476 0,139 0,253 0,309
131 0,981 0,760 0,610 0,613 0,135 0,269 0,206 0,061 0,102 0,100 0,296 0,174 0,805 0,158 1,000
132 0,951 0,638 0,514 0,344 0,498 0,591 0,196 0,494 0,184 0,309 0,514 0,343 0,767 0,357 0,992

153
133 1,000 0,865 0,607 0,112 0,146 0,416 0,349 0,575 0,508 0,463 0,576 0,421 0,269 0,465 1,000
134 1,000 0,865 0,492 0,131 0,191 0,428 0,423 0,461 0,346 0,343 0,450 0,480 0,472 0,444 0,936
135 1,000 0,826 0,521 0,526 0,643 0,374 0,284 0,220 0,118 0,218 0,534 0,408 0,313 0,434 0,602
136 1,000 0,755 0,643 0,680 0,766 0,386 0,607 0,000 0,472 0,663 0,688 0,568 0,100 0,798 0,723
137 0,958 0,829 0,372 0,821 0,866 0,366 0,447 0,156 0,372 0,458 0,626 0,624 0,921 0,769 0,873
138 0,848 0,610 0,329 0,358 0,526 0,314 0,000 0,093 0,048 0,477 0,585 0,531 0,952 0,759 0,768
139 0,929 0,890 0,390 0,144 0,240 0,460 0,008 0,021 0,054 0,336 0,669 0,444 0,903 0,538 0,951
140 0,947 0,738 0,588 0,809 0,799 0,371 0,398 0,220 0,096 0,540 0,715 0,563 0,978 0,900 0,910
141 0,925 0,619 0,548 0,596 0,654 0,465 0,263 0,149 0,050 0,495 0,699 0,731 0,972 0,538 0,907
142 0,874 0,797 0,363 0,896 0,116 0,685 0,176 0,123 0,204 0,494 0,586 0,647 0,809 0,701 0,974
143 0,720 0,493 0,242 0,908 0,865 0,572 0,043 0,056 0,142 0,290 0,578 0,514 0,987 0,499 0,982
144 0,584 0,525 0,248 0,806 0,811 0,541 0,000 0,222 0,168 0,402 0,412 0,170 0,931 0,496 1,000
145 0,432 0,607 0,292 0,762 0,813 0,449 0,219 0,083 0,096 0,551 0,555 0,587 0,894 0,875 0,925
146 0,784 0,514 0,246 0,954 0,912 0,640 0,000 0,137 0,123 0,336 0,495 0,555 0,977 0,586 0,983
147 0,898 0,794 0,553 0,274 0,444 0,467 0,202 0,000 0,018 0,597 0,719 0,627 0,758 0,872 0,655
148 0,855 0,580 0,494 0,533 0,527 0,385 0,223 0,000 0,000 0,316 0,520 0,501 0,913 0,629 0,940
149 0,839 0,618 0,373 0,724 0,722 0,459 0,156 0,127 0,000 0,505 0,605 0,450 0,887 0,624 0,993
150 0,488 0,549 0,272 0,859 0,891 0,427 0,087 0,005 0,171 0,337 0,472 0,387 0,963 0,603 0,883
151 0,837 0,610 0,339 0,379 0,516 0,394 0,049 0,145 0,131 0,347 0,542 0,520 0,785 0,538 0,987
152 0,659 0,597 0,268 0,463 0,632 0,541 0,101 0,000 0,091 0,668 0,598 0,520 0,907 0,792 0,947
153 0,469 0,728 0,265 0,297 0,233 0,453 0,152 0,106 0,079 0,720 0,477 0,567 0,847 0,746 0,844
154 0,665 0,576 0,242 0,482 0,626 0,636 0,120 0,125 0,112 0,405 0,541 0,603 0,885 0,516 0,990
155 0,614 0,467 0,358 0,706 0,767 0,637 0,037 0,061 0,256 0,540 0,844 0,900 0,973 0,787 0,884
156 0,700 0,609 0,289 0,731 0,780 0,423 0,000 0,163 0,009 0,326 0,555 0,307 0,918 0,556 0,485
157 0,847 0,573 0,362 0,718 0,802 0,304 0,000 0,109 0,000 0,519 0,609 0,550 0,795 0,632 0,661
158 0,945 0,488 0,462 0,619 0,709 0,637 0,000 0,034 0,398 0,424 0,735 0,636 0,986 0,556 0,992
159 0,948 0,480 0,446 0,690 0,790 0,576 0,000 0,000 0,383 0,669 0,798 0,547 0,965 0,921 0,993
160 0,962 0,692 0,375 0,699 0,802 0,174 0,000 0,208 0,524 0,431 0,602 0,447 0,928 0,507 0,829
161 0,953 0,603 0,648 0,297 0,473 0,477 0,000 0,745 0,815 0,326 0,600 0,506 0,985 0,351 0,849
162 0,770 0,583 0,331 0,509 0,651 0,640 0,000 0,459 0,221 0,489 0,717 0,709 0,957 0,790 0,873
163 0,738 0,565 0,293 0,774 0,804 0,633 0,019 0,029 0,171 0,742 0,596 0,558 0,897 0,970 0,932
164 0,851 0,568 0,231 0,490 0,636 0,341 0,024 0,070 0,000 0,851 0,620 0,653 0,836 0,963 0,714
165 0,866 0,502 0,282 0,912 0,916 0,548 0,000 0,000 0,000 0,246 0,704 0,754 0,960 0,426 0,974
166 0,596 0,501 0,282 0,951 0,819 0,432 0,000 0,000 0,000 0,690 0,629 0,430 0,945 0,695 0,843
167 0,600 0,545 0,252 0,532 0,688 0,640 0,177 0,215 0,006 0,523 0,365 0,664 0,905 0,610 0,937
168 0,971 0,995 0,490 1,000 1,000 0,100 0,378 0,496 0,000 0,550 0,504 0,364 1,000 0,640 1,000
169 0,897 0,685 0,367 0,724 0,784 0,480 0,002 0,017 0,173 0,306 0,361 0,371 0,893 0,332 0,368
170 0,590 0,592 0,402 0,444 0,598 0,407 0,264 0,029 0,000 0,448 0,408 0,428 0,894 0,706 0,869
171 0,541 0,572 0,372 0,695 0,641 0,531 0,031 0,051 0,002 0,616 0,473 0,284 0,865 0,814 0,541
172 0,798 0,847 0,367 0,857 0,882 0,290 0,000 0,000 0,130 0,597 0,439 0,221 0,815 0,706 0,963
173 0,705 0,836 0,320 0,490 0,655 0,410 0,123 0,000 0,364 0,473 0,395 0,411 0,887 0,554 0,755
174 0,663 0,742 0,295 0,489 0,640 0,379 0,026 0,503 0,318 0,668 0,675 0,437 0,948 0,626 0,841
175 0,856 0,800 0,295 0,663 0,792 0,445 0,243 0,000 0,283 0,477 0,508 0,387 0,813 0,668 0,824
176 0,968 1,000 0,231 1,000 1,000 0,349 0,063 0,000 0,000 0,550 0,504 0,364 1,000 0,640 0,997
177 0,492 0,646 0,368 0,630 0,751 0,332 0,237 0,041 0,000 0,458 0,558 0,432 0,371 0,414 0,800
178 0,498 0,510 0,330 0,832 0,752 0,574 0,168 0,616 0,000 0,261 0,486 0,576 0,966 0,418 0,860

154
179 0,323 0,531 0,327 0,465 0,571 0,406 0,272 0,318 0,325 0,382 0,602 0,583 0,886 0,686 0,936
180 0,368 0,465 0,280 0,563 0,638 0,443 0,141 0,017 0,000 0,325 0,464 0,402 0,889 0,309 0,991
181 0,441 0,515 0,275 0,612 0,706 0,430 0,066 0,318 0,000 0,254 0,459 0,358 0,844 0,538 1,000
182 0,099 0,545 0,354 0,572 0,719 0,587 0,077 0,178 0,000 0,452 0,427 0,504 0,889 0,600 0,892
183 0,954 0,668 0,396 0,775 0,805 0,317 0,000 0,000 0,092 0,459 0,639 0,554 0,840 0,538 0,945
184 0,442 0,579 0,247 0,426 0,580 0,405 0,011 0,390 0,306 0,402 0,448 0,311 0,857 0,571 0,793
185 0,255 0,621 0,317 0,351 0,534 0,587 0,039 0,014 0,000 0,449 0,445 0,410 0,893 0,556 0,410
186 0,138 0,602 0,238 0,514 0,672 0,441 0,199 0,095 0,042 0,443 0,406 0,395 0,900 0,583 0,527
187 0,849 0,572 0,314 0,554 0,709 0,448 0,125 0,388 0,150 0,268 0,475 0,537 0,943 0,538 0,844
188 0,859 0,585 0,355 0,733 0,704 0,448 0,156 0,010 0,025 0,450 0,478 0,447 0,940 0,691 1,000
189 0,961 0,774 0,504 0,817 0,754 0,479 0,191 0,151 0,312 0,412 0,420 0,541 0,381 0,787 1,000
190 0,953 0,747 0,485 0,555 0,672 0,451 0,318 0,194 0,516 0,418 0,431 0,476 0,650 0,347 0,750
191 0,954 0,776 0,479 0,716 0,573 0,524 0,000 0,452 0,000 0,415 0,425 0,508 0,630 0,591 0,748
192 0,629 0,708 0,446 0,706 0,707 0,521 0,255 0,619 0,415 0,347 0,399 0,305 0,882 0,293 0,993
193 0,942 0,869 0,371 0,835 0,901 0,372 0,249 0,085 0,000 0,290 0,512 0,442 0,984 0,396 1,000
194 0,587 0,461 0,268 0,859 0,919 0,515 0,137 0,206 0,006 0,387 0,423 0,415 1,000 0,570 0,688
195 0,701 0,674 0,259 0,875 0,923 0,346 0,134 0,093 0,147 0,290 0,545 0,641 0,940 0,787 0,675
196 0,625 0,741 0,242 0,476 0,647 0,470 0,171 0,237 0,211 0,469 0,452 0,301 0,948 0,798 1,000
197 0,229 0,587 0,421 0,641 0,756 0,501 0,232 0,087 0,381 0,434 0,618 0,421 0,766 0,598 0,975
198 0,324 0,562 0,327 0,560 0,704 0,487 0,156 0,449 0,118 0,529 0,607 0,291 0,941 0,769 0,997
199 0,608 0,662 0,312 0,562 0,704 0,518 0,113 0,000 0,184 0,583 0,595 0,501 0,958 0,878 1,000
200 0,585 0,900 0,325 0,944 0,280 0,472 0,220 0,000 0,358 0,505 0,656 0,351 0,976 0,708 0,223
201 0,415 0,698 0,393 0,698 0,752 0,497 0,145 0,165 0,157 0,451 0,456 0,372 0,833 0,706 0,494
202 0,422 0,815 0,379 0,817 0,892 0,191 0,179 0,246 0,182 0,361 0,475 0,411 0,830 0,624 0,621
203 0,436 0,639 0,263 0,839 0,907 0,603 0,129 0,000 0,040 0,382 0,434 0,369 0,953 0,655 0,971
204 0,677 0,949 0,278 0,666 0,786 0,390 0,100 0,000 0,002 0,677 0,458 0,437 0,969 0,646 0,747
205 0,750 0,909 0,433 0,465 0,541 0,388 0,580 0,271 0,449 0,203 0,645 0,368 0,101 0,154 0,985
206 0,216 0,797 0,393 0,430 0,551 0,515 0,415 0,126 0,632 0,505 0,483 0,311 0,265 0,706 0,955
207 0,236 0,636 0,401 0,271 0,407 0,526 0,000 0,138 0,000 0,694 0,638 0,498 0,816 0,617 0,991
208 0,764 0,720 0,524 0,405 0,506 0,509 0,313 0,316 0,344 0,465 0,662 0,561 0,372 0,662 0,977
209 0,496 0,672 0,334 0,499 0,474 0,514 0,213 0,153 0,000 0,748 0,711 0,550 0,774 0,592 0,711
210 0,758 0,756 0,367 0,437 0,602 0,474 0,190 0,417 0,031 0,520 0,443 0,305 0,336 0,727 0,889
211 0,514 0,929 0,519 0,628 0,711 0,445 0,334 0,184 0,079 0,677 0,356 0,347 0,100 0,538 0,734
212 0,842 0,804 0,322 0,617 0,593 0,496 0,449 0,089 0,353 0,417 0,646 0,520 0,428 0,668 0,363
213 0,497 0,931 0,450 0,753 0,834 0,498 0,430 0,382 0,493 0,202 0,100 0,228 0,109 0,253 1,000
214 0,355 0,670 0,408 0,454 0,526 0,577 0,191 0,659 0,061 0,751 0,771 0,613 0,564 0,414 0,968
215 0,339 0,661 0,297 0,548 0,654 0,509 0,160 0,436 0,099 0,496 0,575 0,505 0,724 0,787 0,718
216 0,000 0,863 0,433 0,337 0,440 0,423 0,484 0,046 0,737 0,548 0,444 0,482 0,508 0,487 0,356
217 0,014 0,741 0,260 0,476 0,581 0,408 0,238 0,239 0,012 0,695 0,579 0,534 0,680 0,538 0,450
218 0,613 0,655 0,246 0,334 0,223 0,418 0,152 0,044 0,000 0,543 0,471 0,346 0,822 0,708 0,963
219 0,871 0,911 0,356 0,466 0,623 0,547 0,106 0,137 0,000 0,569 0,495 0,515 0,782 0,624 0,846
220 0,886 0,531 0,352 0,595 0,701 0,535 0,000 0,203 0,303 0,212 0,821 0,633 0,971 0,136 0,990
221 0,906 0,454 0,366 0,621 0,764 0,642 0,000 0,000 0,269 0,399 0,728 0,657 0,951 0,628 0,988
222 0,855 0,645 0,471 0,501 0,668 0,274 0,000 0,936 0,081 0,552 0,737 0,673 0,916 0,369 0,531
223 0,938 0,987 0,275 1,000 1,000 0,669 0,000 0,310 0,450 0,552 0,737 0,673 1,000 0,369 0,113
224 0,919 0,989 0,485 1,000 1,000 0,457 0,000 0,098 0,026 0,400 0,713 0,626 1,000 0,447 0,100
155
225 0,902 0,626 0,396 0,614 0,754 0,662 0,000 0,000 0,077 0,692 0,591 0,587 0,932 0,513 0,326
226 0,889 0,887 0,485 0,880 0,924 0,702 0,243 0,104 0,310 0,639 0,712 0,740 0,959 0,670 0,988
227 0,596 0,727 0,129 0,747 0,840 0,247 0,143 0,014 0,245 0,419 0,339 0,387 0,922 0,685 0,843
228 0,713 0,916 0,251 0,623 0,761 0,549 0,073 0,000 0,180 0,758 0,602 0,565 0,888 0,902 0,958
229 0,924 0,908 0,173 0,773 0,815 0,615 0,000 0,146 0,000 0,705 0,710 0,763 0,958 0,750 0,991
230 0,899 0,518 0,505 0,440 0,608 0,525 0,000 0,000 0,000 0,843 0,733 0,659 0,897 0,902 0,978
231 0,852 0,656 0,344 0,334 0,504 0,513 0,077 0,215 0,142 0,522 0,890 0,733 0,822 0,655 0,610
232 0,852 0,581 0,380 0,258 0,418 0,548 0,102 0,000 0,137 0,554 0,891 0,729 0,826 0,632 0,832
233 0,677 0,623 0,291 0,588 0,703 0,432 0,015 0,000 0,130 0,554 0,635 0,605 0,861 0,691 0,866
234 0,932 0,568 0,284 0,851 0,873 0,670 0,000 0,000 0,000 0,406 0,568 0,587 0,883 0,299 1,000
235 0,883 0,560 0,450 0,577 0,705 0,609 0,000 0,000 0,000 0,811 0,797 0,706 0,943 0,357 0,882
236 0,941 0,518 0,314 0,704 0,790 0,563 0,000 0,000 0,147 0,767 0,618 0,645 0,976 0,670 0,964
237 0,888 0,517 0,311 0,555 0,713 0,608 0,000 0,000 0,120 0,604 0,645 0,542 0,877 0,730 1,000
238 0,701 0,549 0,211 0,380 0,530 0,460 0,049 0,000 0,090 0,660 0,346 0,577 0,843 0,617 0,989
239 0,626 0,518 0,235 0,512 0,657 0,462 0,117 0,000 0,191 0,448 0,817 0,771 0,948 0,715 0,964
240 0,839 0,509 0,283 0,482 0,612 0,648 0,091 0,006 0,147 0,765 0,844 0,680 0,860 0,538 1,000
241 0,743 0,543 0,257 0,820 0,823 0,575 0,109 0,557 0,070 0,340 0,495 0,100 0,945 0,660 0,888
242 0,709 0,569 0,292 0,737 0,713 0,426 0,139 0,550 0,189 0,563 0,760 0,672 0,942 0,767 0,784
243 0,831 0,558 0,161 0,522 0,677 0,543 0,057 0,000 0,026 0,646 0,611 0,641 0,950 0,940 0,671
244 0,634 0,566 0,203 0,892 0,783 0,533 0,046 0,000 0,188 0,473 0,454 0,561 0,825 0,691 0,838
245 0,937 0,671 0,205 0,786 0,874 0,575 0,000 0,362 0,145 0,463 0,466 0,460 0,979 0,582 1,000
246 0,953 0,504 0,271 0,590 0,731 0,582 0,000 0,092 0,307 0,606 0,679 0,649 0,912 0,630 0,936
247 0,881 0,726 0,333 0,302 0,481 0,314 0,000 0,006 0,125 0,856 0,713 0,836 0,939 0,636 0,240
248 0,943 0,668 0,288 0,685 0,641 0,351 0,000 0,000 0,000 0,331 0,460 0,667 0,869 0,452 0,331
249 0,857 0,703 0,259 0,462 0,629 0,395 0,044 0,000 0,214 0,946 0,400 0,750 0,697 0,883 0,518
250 0,891 0,614 0,322 1,000 0,955 0,514 0,071 0,000 0,122 0,485 0,472 0,520 0,939 0,299 0,691
251 0,857 0,626 0,307 0,338 0,519 0,549 0,079 0,397 0,245 0,529 0,713 0,665 0,842 0,737 0,958
252 0,606 0,618 0,223 0,577 0,693 0,572 0,037 0,270 0,266 0,525 0,603 0,542 0,806 0,538 0,807
253 0,596 0,582 0,226 0,520 0,622 0,393 0,000 0,000 0,287 0,735 0,676 0,786 0,862 0,804 0,756
254 0,935 0,808 0,216 0,592 0,485 0,499 0,000 0,000 0,000 0,447 0,604 0,542 0,876 0,567 0,164
255 0,957 0,603 0,498 0,334 0,510 0,600 0,000 0,170 0,519 0,447 0,604 0,542 0,832 0,567 0,347
256 0,507 0,695 0,335 0,413 0,575 0,549 0,001 0,032 0,002 0,463 0,568 0,579 0,754 0,708 0,950
257 0,387 0,670 0,329 0,393 0,526 0,494 0,010 0,040 0,173 0,778 0,662 0,670 0,793 0,499 0,673
258 0,354 0,666 0,284 0,551 0,691 0,539 0,000 0,000 0,006 0,767 0,556 0,600 0,804 0,397 0,737
259 0,966 0,748 0,298 0,339 0,518 0,301 0,000 0,007 0,000 0,443 0,513 0,449 0,260 0,580 0,333
260 0,975 0,557 0,178 0,615 0,717 0,530 0,000 0,075 0,224 0,355 0,405 0,529 0,921 0,597 0,942
261 0,969 0,631 0,154 0,496 0,628 0,548 0,000 0,014 0,368 0,371 0,547 0,426 0,932 0,538 0,569
262 0,968 0,704 0,124 0,301 0,469 0,546 0,000 0,330 0,333 0,329 0,477 0,358 0,834 0,620 0,451
263 0,608 0,719 0,316 0,413 0,585 0,320 0,000 0,000 0,003 0,300 0,452 0,427 0,677 0,380 0,710
264 0,507 0,730 0,414 0,711 0,794 0,542 0,000 0,000 0,003 0,774 0,590 0,774 0,830 0,275 0,267
265 0,500 0,739 0,386 0,712 0,443 0,628 0,006 0,012 0,001 0,534 0,437 0,480 0,682 0,632 0,824
266 0,727 0,814 0,255 0,350 0,509 0,356 0,000 0,803 0,008 0,682 0,563 0,414 0,795 0,642 0,382
267 0,968 0,839 0,262 0,314 0,487 0,375 0,000 0,680 0,380 0,568 0,446 0,435 0,828 0,574 0,382
268 0,967 0,746 0,490 1,000 1,000 0,455 0,000 0,507 0,251 0,366 0,495 0,307 1,000 0,538 0,217
269 0,970 0,791 0,101 0,201 0,347 0,530 0,000 0,003 0,596 0,566 0,576 0,692 0,888 0,730 0,492
270 0,961 0,720 0,103 0,479 0,629 0,515 0,000 0,319 0,000 0,513 0,492 0,532 0,929 0,613 0,626
156
271 0,976 0,880 0,149 0,463 0,633 0,441 0,000 0,281 0,277 0,598 0,542 0,619 0,886 0,741 0,155
272 0,976 0,915 0,190 0,837 0,903 0,343 0,000 0,853 0,000 0,590 0,485 0,565 0,721 0,745 0,187
273 0,976 0,814 0,100 0,674 0,771 0,618 0,000 0,002 0,000 0,590 0,489 0,498 0,894 0,512 0,672
274 0,000 0,864 0,297 0,604 0,737 0,136 0,328 0,231 0,903 0,774 0,591 0,608 0,825 0,953 0,902
275 0,609 0,951 0,451 0,517 0,643 0,270 0,562 0,421 0,811 0,402 0,296 0,570 0,645 0,684 0,288
276 0,641 0,928 0,194 0,762 0,848 0,229 0,162 0,515 0,411 0,339 0,557 0,411 0,866 0,306 0,303
277 0,449 0,654 0,332 0,483 0,575 0,511 0,379 0,018 0,555 0,385 0,596 0,433 0,732 0,538 0,716
278 0,379 0,626 0,306 0,188 0,322 0,539 0,178 0,360 0,311 0,404 0,623 0,543 0,871 0,324 1,000
279 0,618 0,783 0,292 0,373 0,527 0,545 0,434 0,000 0,716 0,100 0,626 0,468 0,846 0,100 0,420
280 0,922 0,767 0,211 0,237 0,344 0,329 0,228 0,000 0,524 0,450 0,449 0,508 0,844 0,742 0,444
281 0,978 0,844 0,223 0,520 0,676 0,560 0,009 0,000 0,162 0,618 0,495 0,487 0,601 0,752 0,175
282 0,840 0,545 0,310 0,560 0,647 0,507 0,019 0,000 0,000 0,512 0,604 0,473 0,825 0,772 0,269
283 0,981 0,787 0,256 0,978 0,984 0,516 0,018 0,192 0,195 0,739 0,551 0,437 0,889 0,613 0,737
284 0,850 0,794 0,303 0,477 0,599 0,390 0,098 0,006 0,252 0,455 0,545 0,311 0,854 0,538 0,763
285 0,957 0,669 0,263 0,319 0,449 0,578 0,074 0,005 0,132 0,581 0,582 0,567 0,499 0,719 0,930
286 0,747 0,719 0,347 0,790 0,846 0,460 0,187 0,002 0,038 0,597 0,543 0,520 0,657 0,759 0,611
287 0,632 0,665 0,275 0,462 0,639 0,305 0,000 0,001 0,000 0,663 0,445 0,460 0,772 0,691 0,827
288 0,781 0,531 0,362 0,890 0,918 0,575 0,082 0,345 0,116 0,471 0,475 0,412 0,786 0,665 0,953
289 0,969 0,685 0,342 0,460 0,614 0,373 0,120 0,130 0,195 0,473 0,275 0,282 0,328 0,538 0,604
290 0,949 0,769 0,279 0,427 0,596 0,561 0,128 0,001 0,407 0,518 0,379 0,288 0,702 0,644 0,765
291 0,950 0,564 0,297 0,478 0,525 0,570 0,157 0,184 0,224 0,394 0,430 0,364 0,901 0,726 0,725
292 0,970 0,597 0,364 0,583 0,693 0,620 0,091 0,074 0,057 0,483 0,486 0,377 0,933 0,628 0,886
293 0,929 0,756 0,219 0,401 0,579 0,483 0,000 0,148 0,373 0,534 0,568 0,618 0,717 0,787 0,433
294 0,651 0,536 0,267 0,779 0,852 0,628 0,079 0,041 0,041 0,618 0,521 0,609 0,873 0,465 0,977
295 0,625 0,722 0,156 0,588 0,693 0,568 0,029 0,000 0,117 0,505 0,413 0,321 0,856 0,596 0,243
296 0,980 0,814 0,163 0,502 0,608 0,411 0,020 0,000 0,005 0,411 0,416 0,283 0,754 0,592 0,388
297 0,978 0,929 0,230 0,910 0,627 0,470 0,000 0,061 0,000 0,511 0,445 0,405 0,801 0,489 0,764
298 0,984 0,946 0,245 0,714 0,753 0,320 0,000 0,000 0,000 0,444 0,452 0,428 0,887 0,562 0,670
299 0,979 0,817 0,207 1,000 1,000 0,371 0,000 0,000 0,159 0,559 0,356 0,414 0,876 0,578 0,770
300 0,976 0,745 0,245 0,136 0,223 0,304 0,000 0,000 0,004 0,498 0,572 0,644 0,828 0,800 0,505
301 0,986 0,802 0,307 0,788 0,818 0,701 0,133 0,360 0,014 0,559 0,669 0,770 0,949 0,784 0,641
302 0,981 0,928 0,238 0,266 0,439 0,590 0,304 0,207 0,186 0,497 0,615 0,638 0,922 0,722 0,460
303 1,000 0,851 0,136 0,794 0,879 0,617 0,200 0,000 0,380 0,420 0,220 0,513 0,828 0,595 0,211
304 1,000 0,928 0,182 0,698 0,807 0,554 0,013 0,000 0,162 0,184 0,408 0,487 0,839 0,100 0,375
305 1,000 0,872 0,257 0,916 0,947 0,719 0,003 0,000 0,100 0,653 0,556 0,188 0,719 0,677 0,364
306 1,000 0,795 0,108 0,807 0,886 0,621 0,000 0,316 0,000 0,424 0,379 0,525 0,868 0,598 0,733
307 0,975 0,663 0,189 0,800 0,882 0,353 0,257 0,000 0,373 0,609 0,389 0,399 0,908 0,583 0,397
308 1,000 0,805 0,212 0,725 0,756 0,694 0,399 0,000 0,244 0,505 0,401 0,475 0,858 0,699 0,578
309 0,968 0,936 0,229 0,697 0,804 0,537 0,254 0,780 0,416 0,710 0,690 0,761 0,821 0,847 0,512
310 1,000 0,879 0,178 0,404 0,583 0,596 0,000 0,000 0,468 0,517 0,558 0,587 0,314 0,734 0,292
311 1,000 0,952 0,153 0,664 0,783 0,642 0,000 0,000 0,000 0,237 0,786 0,587 0,758 0,136 0,936
312 1,000 0,945 0,144 0,870 0,924 0,633 0,031 0,000 0,027 0,635 0,529 0,632 0,855 0,720 0,495
313 0,980 0,938 0,146 0,290 0,393 0,375 0,000 0,591 0,022 0,505 0,332 0,462 0,873 0,661 0,468
314 0,964 0,873 0,184 0,285 0,452 0,382 0,027 0,038 0,000 0,463 0,569 0,387 0,837 0,477 0,299
315 1,000 0,781 0,192 0,817 0,860 0,322 0,204 0,034 0,000 0,491 0,587 0,418 0,909 0,655 0,611
316 1,000 0,753 0,253 0,105 0,123 0,316 0,142 0,253 0,002 0,402 0,639 0,476 0,826 0,573 0,480
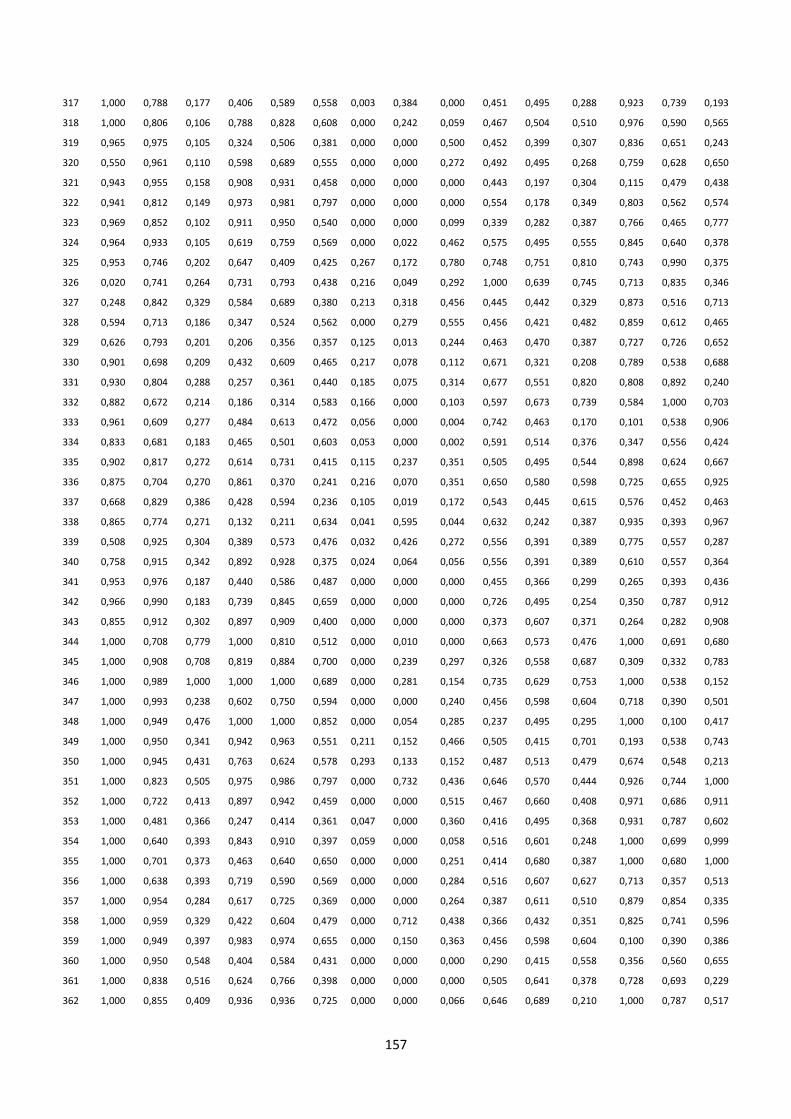
157
317 1,000 0,788 0,177 0,406 0,589 0,558 0,003 0,384 0,000 0,451 0,495 0,288 0,923 0,739 0,193
318 1,000 0,806 0,106 0,788 0,828 0,608 0,000 0,242 0,059 0,467 0,504 0,510 0,976 0,590 0,565
319 0,965 0,975 0,105 0,324 0,506 0,381 0,000 0,000 0,500 0,452 0,399 0,307 0,836 0,651 0,243
320 0,550 0,961 0,110 0,598 0,689 0,555 0,000 0,000 0,272 0,492 0,495 0,268 0,759 0,628 0,650
321 0,943 0,955 0,158 0,908 0,931 0,458 0,000 0,000 0,000 0,443 0,197 0,304 0,115 0,479 0,438
322 0,941 0,812 0,149 0,973 0,981 0,797 0,000 0,000 0,000 0,554 0,178 0,349 0,803 0,562 0,574
323 0,969 0,852 0,102 0,911 0,950 0,540 0,000 0,000 0,099 0,339 0,282 0,387 0,766 0,465 0,777
324 0,964 0,933 0,105 0,619 0,759 0,569 0,000 0,022 0,462 0,575 0,495 0,555 0,845 0,640 0,378
325 0,953 0,746 0,202 0,647 0,409 0,425 0,267 0,172 0,780 0,748 0,751 0,810 0,743 0,990 0,375
326 0,020 0,741 0,264 0,731 0,793 0,438 0,216 0,049 0,292 1,000 0,639 0,745 0,713 0,835 0,346
327 0,248 0,842 0,329 0,584 0,689 0,380 0,213 0,318 0,456 0,445 0,442 0,329 0,873 0,516 0,713
328 0,594 0,713 0,186 0,347 0,524 0,562 0,000 0,279 0,555 0,456 0,421 0,482 0,859 0,612 0,465
329 0,626 0,793 0,201 0,206 0,356 0,357 0,125 0,013 0,244 0,463 0,470 0,387 0,727 0,726 0,652
330 0,901 0,698 0,209 0,432 0,609 0,465 0,217 0,078 0,112 0,671 0,321 0,208 0,789 0,538 0,688
331 0,930 0,804 0,288 0,257 0,361 0,440 0,185 0,075 0,314 0,677 0,551 0,820 0,808 0,892 0,240
332 0,882 0,672 0,214 0,186 0,314 0,583 0,166 0,000 0,103 0,597 0,673 0,739 0,584 1,000 0,703
333 0,961 0,609 0,277 0,484 0,613 0,472 0,056 0,000 0,004 0,742 0,463 0,170 0,101 0,538 0,906
334 0,833 0,681 0,183 0,465 0,501 0,603 0,053 0,000 0,002 0,591 0,514 0,376 0,347 0,556 0,424
335 0,902 0,817 0,272 0,614 0,731 0,415 0,115 0,237 0,351 0,505 0,495 0,544 0,898 0,624 0,667
336 0,875 0,704 0,270 0,861 0,370 0,241 0,216 0,070 0,351 0,650 0,580 0,598 0,725 0,655 0,925
337 0,668 0,829 0,386 0,428 0,594 0,236 0,105 0,019 0,172 0,543 0,445 0,615 0,576 0,452 0,463
338 0,865 0,774 0,271 0,132 0,211 0,634 0,041 0,595 0,044 0,632 0,242 0,387 0,935 0,393 0,967
339 0,508 0,925 0,304 0,389 0,573 0,476 0,032 0,426 0,272 0,556 0,391 0,389 0,775 0,557 0,287
340 0,758 0,915 0,342 0,892 0,928 0,375 0,024 0,064 0,056 0,556 0,391 0,389 0,610 0,557 0,364
341 0,953 0,976 0,187 0,440 0,586 0,487 0,000 0,000 0,000 0,455 0,366 0,299 0,265 0,393 0,436
342 0,966 0,990 0,183 0,739 0,845 0,659 0,000 0,000 0,000 0,726 0,495 0,254 0,350 0,787 0,912
343 0,855 0,912 0,302 0,897 0,909 0,400 0,000 0,000 0,000 0,373 0,607 0,371 0,264 0,282 0,908
344 1,000 0,708 0,779 1,000 0,810 0,512 0,000 0,010 0,000 0,663 0,573 0,476 1,000 0,691 0,680
345 1,000 0,908 0,708 0,819 0,884 0,700 0,000 0,239 0,297 0,326 0,558 0,687 0,309 0,332 0,783
346 1,000 0,989 1,000 1,000 1,000 0,689 0,000 0,281 0,154 0,735 0,629 0,753 1,000 0,538 0,152
347 1,000 0,993 0,238 0,602 0,750 0,594 0,000 0,000 0,240 0,456 0,598 0,604 0,718 0,390 0,501
348 1,000 0,949 0,476 1,000 1,000 0,852 0,000 0,054 0,285 0,237 0,495 0,295 1,000 0,100 0,417
349 1,000 0,950 0,341 0,942 0,963 0,551 0,211 0,152 0,466 0,505 0,415 0,701 0,193 0,538 0,743
350 1,000 0,945 0,431 0,763 0,624 0,578 0,293 0,133 0,152 0,487 0,513 0,479 0,674 0,548 0,213
351 1,000 0,823 0,505 0,975 0,986 0,797 0,000 0,732 0,436 0,646 0,570 0,444 0,926 0,744 1,000
352 1,000 0,722 0,413 0,897 0,942 0,459 0,000 0,000 0,515 0,467 0,660 0,408 0,971 0,686 0,911
353 1,000 0,481 0,366 0,247 0,414 0,361 0,047 0,000 0,360 0,416 0,495 0,368 0,931 0,787 0,602
354 1,000 0,640 0,393 0,843 0,910 0,397 0,059 0,000 0,058 0,516 0,601 0,248 1,000 0,699 0,999
355 1,000 0,701 0,373 0,463 0,640 0,650 0,000 0,000 0,251 0,414 0,680 0,387 1,000 0,680 1,000
356 1,000 0,638 0,393 0,719 0,590 0,569 0,000 0,000 0,284 0,516 0,607 0,627 0,713 0,357 0,513
357 1,000 0,954 0,284 0,617 0,725 0,369 0,000 0,000 0,264 0,387 0,611 0,510 0,879 0,854 0,335
358 1,000 0,959 0,329 0,422 0,604 0,479 0,000 0,712 0,438 0,366 0,432 0,351 0,825 0,741 0,596
359 1,000 0,949 0,397 0,983 0,974 0,655 0,000 0,150 0,363 0,456 0,598 0,604 0,100 0,390 0,386
360 1,000 0,950 0,548 0,404 0,584 0,431 0,000 0,000 0,000 0,290 0,415 0,558 0,356 0,560 0,655
361 1,000 0,838 0,516 0,624 0,766 0,398 0,000 0,000 0,000 0,505 0,641 0,378 0,728 0,693 0,229
362 1,000 0,855 0,409 0,936 0,936 0,725 0,000 0,000 0,066 0,646 0,689 0,210 1,000 0,787 0,517
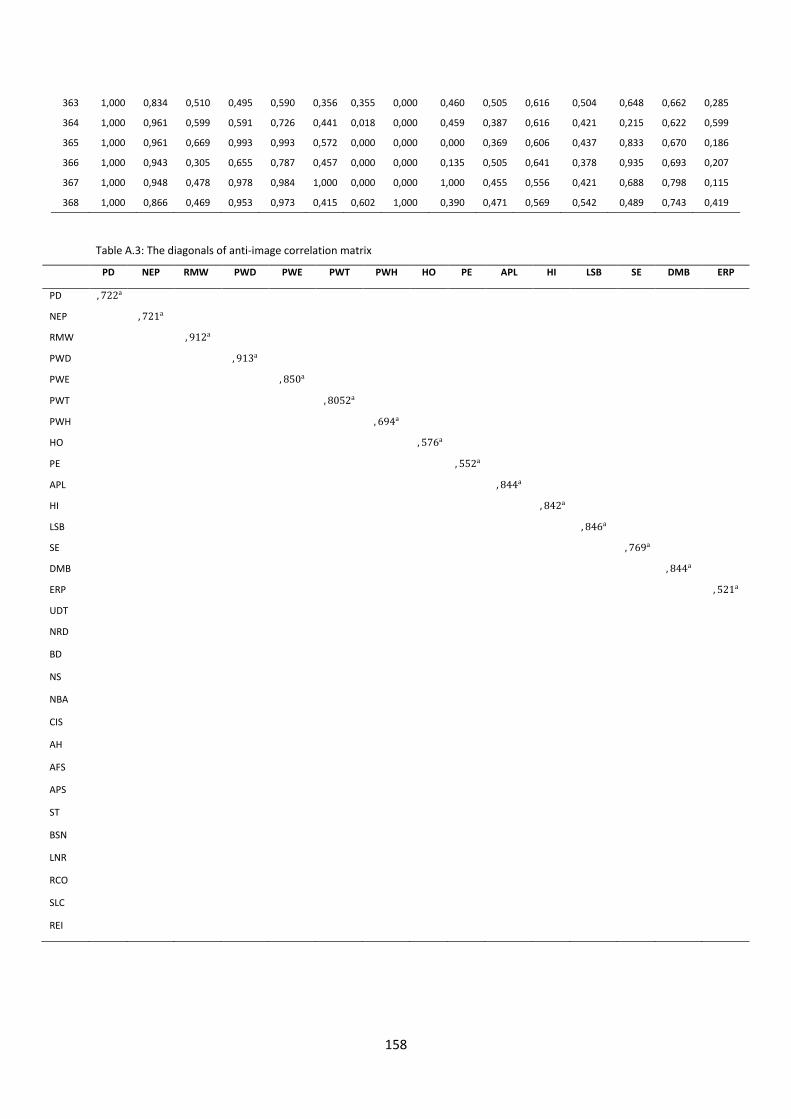
158
363 1,000 0,834 0,510 0,495 0,590 0,356 0,355 0,000 0,460 0,505 0,616 0,504 0,648 0,662 0,285
364 1,000 0,961 0,599 0,591 0,726 0,441 0,018 0,000 0,459 0,387 0,616 0,421 0,215 0,622 0,599
365 1,000 0,961 0,669 0,993 0,993 0,572 0,000 0,000 0,000 0,369 0,606 0,437 0,833 0,670 0,186
366 1,000 0,943 0,305 0,655 0,787 0,457 0,000 0,000 0,135 0,505 0,641 0,378 0,935 0,693 0,207
367 1,000 0,948 0,478 0,978 0,984 1,000 0,000 0,000 1,000 0,455 0,556 0,421 0,688 0,798 0,115
368 1,000 0,866 0,469 0,953 0,973 0,415 0,602 1,000 0,390 0,471 0,569 0,542 0,489 0,743 0,419
Table A.3: The diagonals of anti-image correlation matrix
PD NEP RMW PWD PWE PWT PWH HO PE APL HI LSB SE DMB ERP
PD , 722а
NEP , 721а
RMW , 912а
PWD , 913а
PWE
, 850а
PWT , 8052а
PWH , 694а
HO
, 576а
PE , 552а
APL , 844а
HI , 842а
LSB , 846а
SE , 769а
DMB , 844а
ERP , 521а
UDT
NRD
BD
NS
NBA
CIS
AH
AFS
APS
ST
BSN
LNR
RCO
SLC
REI

159
Table A.3: (continued)
UDT NRD BD NS NBA CIS AH AFS APS ST BSN LNR RCO SLC REI
PD
NEP
RMW
PWD
PWE
PWT
PWH
HO
PE
APL
HI
LSB
SE
DMB
ERP
UDT , 767а
NRD
, 773а
BD , 824а
NS , 525а
NBA , 529а
CIS , 650а
AH , 825а
AFS , 512а
APS , 640а
ST , 586а
BSN , 832а
LNR , 698а
RCO , 731а
SLC , 513а
REI , 773а
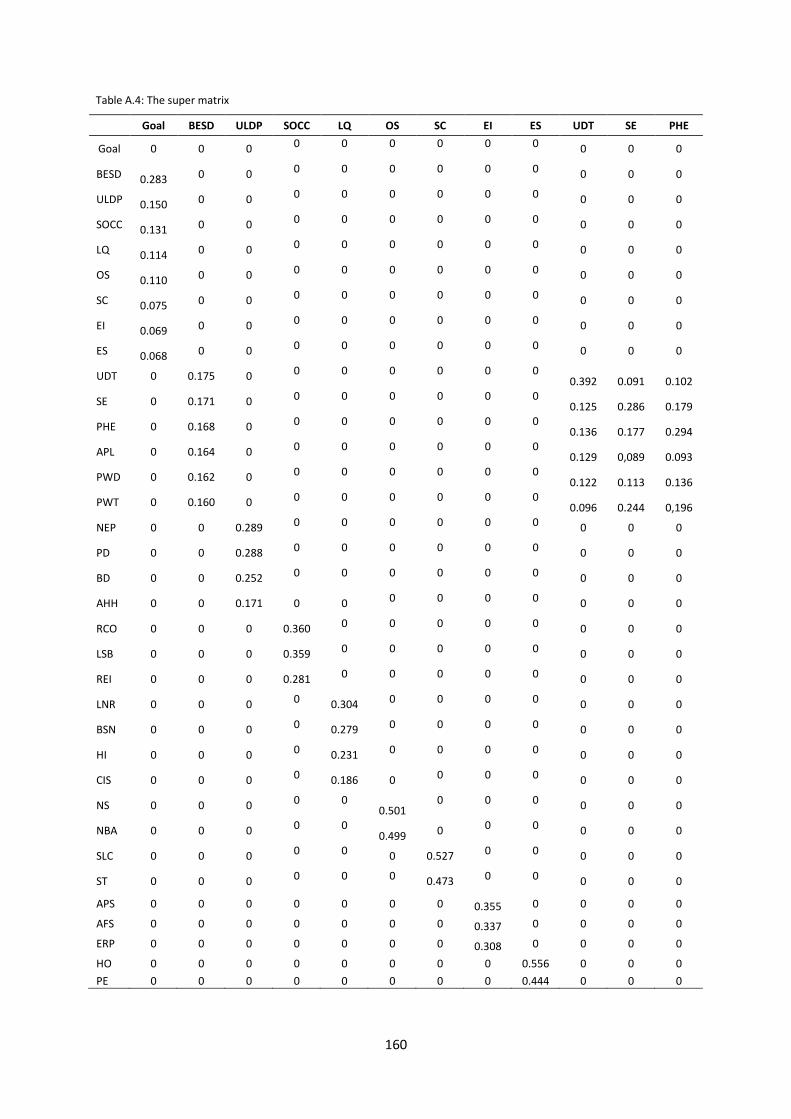
160
Table A.4: The super matrix
Goal BESD ULDP SOCC LQ OS SC EI ES UDT SE PHE
Goal 0 0 0 0 0 0 0 0 0 0 0 0
BESD 0.283 0 0 0 0 0 0 0 0 0 0 0
ULDP 0.150 0 0 0 0 0 0 0 0 0 0 0
SOCC 0.131 0 0 0 0 0 0 0 0 0 0 0
LQ 0.114 0 0 0 0 0 0 0 0 0 0 0
OS 0.110 0 0 0 0 0 0 0 0 0 0 0
SC 0.075 0 0 0 0 0 0 0 0 0 0 0
EI 0.069 0 0 0 0 0 0 0 0 0 0 0
ES 0.068 0 0 0 0 0 0 0 0 0 0 0
UDT 0 0.175 0 0 0 0 0 0 0 0.392 0.091 0.102
SE 0 0.171 0 0 0 0 0 0 0 0.125 0.286 0.179
PHE 0 0.168 0 0 0 0 0 0 0 0.136 0.177 0.294
APL 0 0.164 0 0 0 0 0 0 0 0.129 0,089 0.093
PWD 0 0.162 0 0 0 0 0 0 0 0.122 0.113 0.136
PWT 0 0.160 0 0 0 0 0 0 0 0.096 0.244 0,196
NEP 0 0 0.289 0 0 0 0 0 0 0 0 0
PD 0 0 0.288 0 0 0 0 0 0 0 0 0
BD 0 0 0.252 0 0 0 0 0 0 0 0 0
AHH 0 0 0.171 0 0 0 0 0 0 0 0 0
RCO 0 0 0 0.360 0 0 0 0 0 0 0 0
LSB 0 0 0 0.359 0 0 0 0 0 0 0 0
REI 0 0 0 0.281 0 0 0 0 0 0 0 0
LNR 0 0 0 0 0.304 0 0 0 0 0 0 0
BSN 0 0 0 0 0.279 0 0 0 0 0 0 0
HI 0 0 0 0 0.231 0 0 0 0 0 0 0
CIS 0 0 0 0 0.186 0 0 0 0 0 0 0
NS 0 0 0 0 0 0.501
0 0 0 0 0 0
NBA 0 0 0 0 0 0.499 0 0 0 0 0 0
SLC 0 0 0 0 0 0 0.527 0 0 0 0 0
ST 0 0 0 0 0 0 0.473 0 0 0 0 0
APS 0 0 0 0 0 0 0 0.355 0 0 0 0
AFS 0 0 0 0 0 0 0 0.337 0 0 0 0
ERP 0 0 0 0 0 0 0 0.308 0 0 0 0
HO 0 0 0 0 0 0 0 0 0.556 0 0 0
PE 0 0 0 0 0 0 0 0 0.444 0 0 0

161
Table A.4: Continued
APL PWD PWT NEP PD BD AHH RCO LSB REI LNR BSN
Goal 0 0 0 0 0 0 0 0 0 0 0
BSSD 0 0 0 0 0 0 0 0 0 0 0
ULDP 0 0 0 0 0 0 0 0 0 0 0 0
SOCC 0 0 0 0 0 0 0 0 0 0 0 0
LQ 0 0 0 0 0 0 0 0 0 0 0 0
OS 0 0 0 0 0 0 0 0 0 0 0 0
SC 0 0 0 0 0 0 0 0 0 0 0 0
EI 0 0 0 0 0 0 0 0 0 0 0 0
ES 0 0 0 0 0 0 0 0 0 0 0 0
UDT 0.129 0.110 0.069 0 0 0 0 0 0 0 0 0
SE 0.121 0.141 0.243 0 0 0 0 0 0 0 0 0
PHE 0.125 0.165 0.190 0 0 0 0 0 0 0 0 0
APL 0.393 0.085 0.101 0 0 0 0 0 0 0 0 0
PWD 0,093 0.357 0.113 0 0 0 0 0 0 0 0 0
PWT 0.139 0.141 0.284 0 0 0 0 0 0 0 0 0
NEP 0 0 0 0.365 0.0363 0.164 0.228 0 0 0 0 0
PD 0 0 0 0.363 0.365 0.163 0.229 0 0 0 0 0
BD 0 0 0 0.118 0.102 0.606 0.054 0 0 0 0 0
AHH 0 0 0 0.169 0.170 0.067 0.489 0 0 0 0 0
RCO 0 0 0 0 0 0 0 0.668 0.254 0.088 0 0
LSB 0 0 0 0 0 0 0 0.261 0.649 0.119 0 0
REI 0 0 0 0 0 0 0 0.071 0.097 0.793 0 0
LNR 0 0 0 0 0 0 0 0 0 0 0.507 0.250
BSN 0 0 0 0 0 0 0 0 0 0 0.269 0.472
HI 0 0 0 0 0 0 0 0 0 0 0.158 0.219
CIS 0 0 0 0 0 0 0 0 0 0 0.066 0.059
NS 0 0 0 0 0 0 0 0 0 0 0 0
NBA 0 0 0 0 0 0 0 0 0 0 0 0
SLC 0 0 0 0 0 0 0 0 0 0 0 0
ST 0 0 0 0 0 0 0 0 0 0 0 0
APS 0 0 0 0 0 0 0 0 0 0 0 0
AFS 0 0 0 0 0 0 0 0 0 0 0 0
ERP 0 0 0 0 0 0 0 0 0 0 0 0
HO 0 0 0 0 0 0 0 0 0 0 0 0
PE 0 0 0 0 0 0 0 0 0 0 0 0

162
Table A.4: Continued
HI CIS NS NBA SLC ST APS AFS ERP HO PE
Goal 0 0 0 0 0 0 0 0 0 0 0
BSSD 0 0 0 0 0 0 0 0 0 0 0
ULDP 0 0 0 0 0 0 0 0 0 0 0
SOCC 0 0 0 0 0 0 0 0 0 0 0
LQ 0 0 0 0 0 0 0 0 0 0 0
OS 0 0 0 0 0 0 0 0 0 0 0
SC 0 0 0 0 0 0 0 0 0 0 0
EI 0 0 0 0 0 0 0 0 0 0 0
ES 0 0 0 0 0 0 0 0 0 0 0
UDT 0 0 0 0 0 0 0 0 0 0 0
SE 0 0 0 0 0 0 0 0 0 0 0
PHE 0 0 0 0 0 0 0 0 0 0 0
APL 0 0 0 0 0 0 0 0 0 0 0
PWD 0 0 0 0 0 0 0 0 0 0 0
PWT 0 0 0 0 0 0 0 0 0 0 0
NEP 0 0 0 0 0 0 0 0 0 0 0
PD 0 0 0 0 0 0 0 0 0 0 0
BD 0 0 0 0 0 0 0 0 0 0 0
AHH 0 0 0 0 0 0 0 0 0 0 0
RCO 0 0 0 0 0 0 0 0 0 0 0
LSB 0 0 0 0 0 0 0 0 0 0 0
REI 0 0 0 0 0 0 0 0 0 0
LNR 0.164 0.094 0 0 0 0 0 0 0 0 0
BSN 0.246 0.091 0 0 0 0 0 0 0 0 0
HI 0.529 0.083 0 0 0 0 0 0 0 0 0
CIS 0.061 0.732 0 0 0 0 0 0 0 0 0
NS 0 0 0.545 0.455 0 0 0 0 0 0 0
NBA 0 0 0.455 0.545 0 0 0 0 0 0 0
SLC 0 0 0 0 0.673 0.327 0 0 0 0 0
ST 0 0 0 0 0.327 0.673 0 0 0 0 0
APS 0 0 0 0 0 0 0.805 0.106 0.087 0 0
AFS 0 0 0 0 0 0 0.107 0.807 0.089 0 0
ERP 0 0 0 0 0 0 0.088 0.087 0. 824 0 0
HO 0 0 0 0 0 0 0 0 0 0.904 0.096
PE 0 0 0 0 0 0 0 0 0 0.096 0.904

163
Table A.5: Composite DRI mean score in 116 urban sub-regions
Sub-Region F 1 F 2 F 3 F 4 F 5 F 6 F 7 F 8 F 9
1 0,658 -1,133 0,059 -0,231 0,302 -1,053 0,760 0,953 0,030
2 0,326 -0,918 0,006 2,328 -1,141 -0,617 -0,399 0,284 -0,646
3 -0,139 -0,923 0,234 0,859 1,173 0,341 1,039 0,160 0,953
4 0,442 -1,634 0,107 0,249 0,351 1,030 1,236 0,256 0,576
5 -0,032 0,071 0,087 -0,437 1,297 -0,068 -1,004 1,194 0,750
6 0,822 0,811 -0,650 -1,032 0,237 0,183 -0,432 -0,689 0,052
7 0,590 -1,646 -0,007 3,195 -0,265 -1,970 -0,382 1,492 -0,321
8 0,341 -1,932 1,052 -0,108 -0,655 -0,242 -1,123 1,141 -0,484
9 0,637 0,766 0,938 0,230 0,927 -0,377 1,404 -0,273 1,518
10 1,547 1,421 -1,473 1,016 0,735 -4,011 0,896 -1,062 -0,414
11 0,994 0,023 0,729 1,835 0,952 0,914 -0,868 0,813 1,827
12 1,202 -0,297 0,112 0,347 0,172 -0,165 -1,052 1,153 0,501
13 1,406 -1,104 0,546 0,844 0,218 0,557 1,400 -0,233 1,059
14 1,401 -0,767 0,545 0,762 -0,332 0,005 0,549 -1,522 0,236
15 0,817 -0,426 0,419 0,385 -0,561 0,098 -0,666 -0,545 -0,127
16 0,916 -0,790 0,817 0,272 0,328 0,988 -0,299 -0,707 0,799
17 1,198 -1,560 -0,223 0,393 -0,218 0,109 0,098 -2,264 -0,586
18 1,383 0,007 -0,788 -1,022 1,000 0,195 -0,935 0,018 0,439
19 -0,378 0,662 -0,067 0,249 1,711 -0,783 -1,220 -1,610 0,298
20 0,430 -1,331 0,709 0,853 1,041 -0,001 1,843 -1,112 0,947
21 0,596 -1,517 -0,230 0,842 0,237 -0,207 -1,473 -1,222 -0,635
22 1,088 -1,153 1,472 0,816 -0,127 -1,065 -1,777 0,593 0,158
23 1,013 -1,605 0,450 0,403 -0,192 1,071 0,572 0,041 0,482
24 0,692 -1,672 1,037 0,972 -0,654 -0,906 0,162 0,356 -0,230
25 0,897 -0,991 -0,306 0,617 -1,636 0,572 2,353 -2,088 -0,744
26 0,696 -0,822 0,221 -0,456 0,442 0,441 0,910 0,660 0,707
27 0,579 -0,314 0,636 1,099 0,127 1,968 2,149 2,059 2,077
28 0,584 0,516 0,291 1,794 -0,526 0,978 0,385 0,657 0,997
29 0,915 -0,350 0,132 -0,461 -0,272 -0,531 1,258 2,017 0,469
30 0,238 0,857 1,256 -0,836 -0,787 -1,187 1,460 1,126 0,364
31 -0,440 1,115 0,666 -1,017 0,535 -0,205 -0,375 0,862 0,630
32 0,365 0,567 -0,371 1,535 1,068 -0,528 0,129 0,881 1,048
33 0,487 1,055 -0,898 0,513 0,576 0,143 0,306 -0,858 0,465
34 0,392 1,142 0,055 -0,004 0,809 0,155 -0,123 0,741 1,139
35 0,901 -0,265 0,200 -0,526 -0,039 0,336 0,649 0,404 0,507
36 0,547 0,698 -1,184 -0,579 1,967 -0,082 -0,651 -0,474 0,705
37 0,574 0,720 0,026 0,399 -0,175 -0,008 0,188 0,116 0,443
38 1,169 0,446 0,692 -0,460 -0,117 -0,246 -0,333 1,093 0,744
39 1,004 0,609 0,447 0,211 -0,449 -0,033 -0,941 0,870 0,466
40 1,411 0,106 0,371 -0,500 0,889 -0,749 -0,874 0,221 0,741
41 0,600 0,451 0,746 -0,171 -1,229 0,070 -0,454 1,048 0,043
42 0,826 0,324 -1,591 -0,822 -1,997 -1,644 0,860 0,771 -1,846
43 0,893 -0,586 -0,312 -1,596 -2,004 -2,276 0,096 -1,196 -2,410
44 1,432 -2,443 0,311 0,430 -0,867 -0,728 -0,265 1,390 -0,562
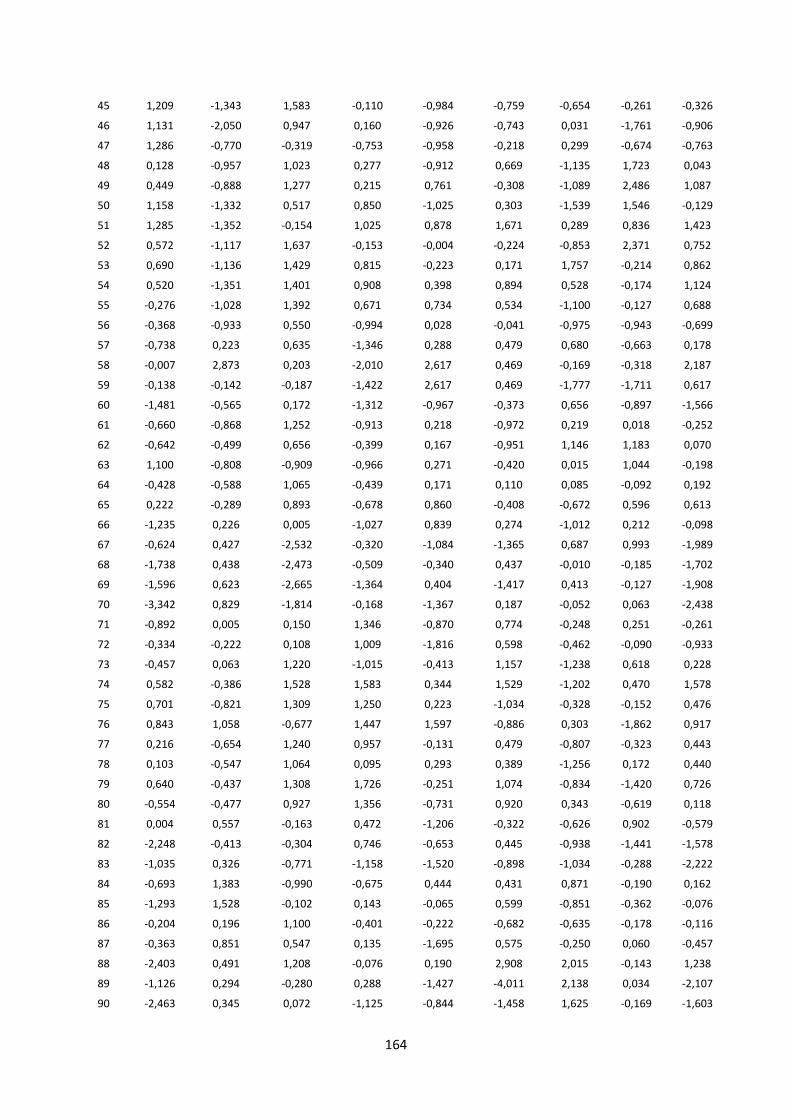
164
45 1,209 -1,343 1,583 -0,110 -0,984 -0,759 -0,654 -0,261 -0,326
46 1,131 -2,050 0,947 0,160 -0,926 -0,743 0,031 -1,761 -0,906
47 1,286 -0,770 -0,319 -0,753 -0,958 -0,218 0,299 -0,674 -0,763
48 0,128 -0,957 1,023 0,277 -0,912 0,669 -1,135 1,723 0,043
49 0,449 -0,888 1,277 0,215 0,761 -0,308 -1,089 2,486 1,087
50 1,158 -1,332 0,517 0,850 -1,025 0,303 -1,539 1,546 -0,129
51 1,285 -1,352 -0,154 1,025 0,878 1,671 0,289 0,836 1,423
52 0,572 -1,117 1,637 -0,153 -0,004 -0,224 -0,853 2,371 0,752
53 0,690 -1,136 1,429 0,815 -0,223 0,171 1,757 -0,214 0,862
54 0,520 -1,351 1,401 0,908 0,398 0,894 0,528 -0,174 1,124
55 -0,276 -1,028 1,392 0,671 0,734 0,534 -1,100 -0,127 0,688
56 -0,368 -0,933 0,550 -0,994 0,028 -0,041 -0,975 -0,943 -0,699
57 -0,738 0,223 0,635 -1,346 0,288 0,479 0,680 -0,663 0,178
58 -0,007 2,873 0,203 -2,010 2,617 0,469 -0,169 -0,318 2,187
59 -0,138 -0,142 -0,187 -1,422 2,617 0,469 -1,777 -1,711 0,617
60 -1,481 -0,565 0,172 -1,312 -0,967 -0,373 0,656 -0,897 -1,566
61 -0,660 -0,868 1,252 -0,913 0,218 -0,972 0,219 0,018 -0,252
62 -0,642 -0,499 0,656 -0,399 0,167 -0,951 1,146 1,183 0,070
63 1,100 -0,808 -0,909 -0,966 0,271 -0,420 0,015 1,044 -0,198
64 -0,428 -0,588 1,065 -0,439 0,171 0,110 0,085 -0,092 0,192
65 0,222 -0,289 0,893 -0,678 0,860 -0,408 -0,672 0,596 0,613
66 -1,235 0,226 0,005 -1,027 0,839 0,274 -1,012 0,212 -0,098
67 -0,624 0,427 -2,532 -0,320 -1,084 -1,365 0,687 0,993 -1,989
68 -1,738 0,438 -2,473 -0,509 -0,340 0,437 -0,010 -0,185 -1,702
69 -1,596 0,623 -2,665 -1,364 0,404 -1,417 0,413 -0,127 -1,908
70 -3,342 0,829 -1,814 -0,168 -1,367 0,187 -0,052 0,063 -2,438
71 -0,892 0,005 0,150 1,346 -0,870 0,774 -0,248 0,251 -0,261
72 -0,334 -0,222 0,108 1,009 -1,816 0,598 -0,462 -0,090 -0,933
73 -0,457 0,063 1,220 -1,015 -0,413 1,157 -1,238 0,618 0,228
74 0,582 -0,386 1,528 1,583 0,344 1,529 -1,202 0,470 1,578
75 0,701 -0,821 1,309 1,250 0,223 -1,034 -0,328 -0,152 0,476
76 0,843 1,058 -0,677 1,447 1,597 -0,886 0,303 -1,862 0,917
77 0,216 -0,654 1,240 0,957 -0,131 0,479 -0,807 -0,323 0,443
78 0,103 -0,547 1,064 0,095 0,293 0,389 -1,256 0,172 0,440
79 0,640 -0,437 1,308 1,726 -0,251 1,074 -0,834 -1,420 0,726
80 -0,554 -0,477 0,927 1,356 -0,731 0,920 0,343 -0,619 0,118
81 0,004 0,557 -0,163 0,472 -1,206 -0,322 -0,626 0,902 -0,579
82 -2,248 -0,413 -0,304 0,746 -0,653 0,445 -0,938 -1,441 -1,578
83 -1,035 0,326 -0,771 -1,158 -1,520 -0,898 -1,034 -0,288 -2,222
84 -0,693 1,383 -0,990 -0,675 0,444 0,431 0,871 -0,190 0,162
85 -1,293 1,528 -0,102 0,143 -0,065 0,599 -0,851 -0,362 -0,076
86 -0,204 0,196 1,100 -0,401 -0,222 -0,682 -0,635 -0,178 -0,116
87 -0,363 0,851 0,547 0,135 -1,695 0,575 -0,250 0,060 -0,457
88 -2,403 0,491 1,208 -0,076 0,190 2,908 2,015 -0,143 1,238
89 -1,126 0,294 -0,280 0,288 -1,427 -4,011 2,138 0,034 -2,107
90 -2,463 0,345 0,072 -1,125 -0,844 -1,458 1,625 -0,169 -1,603
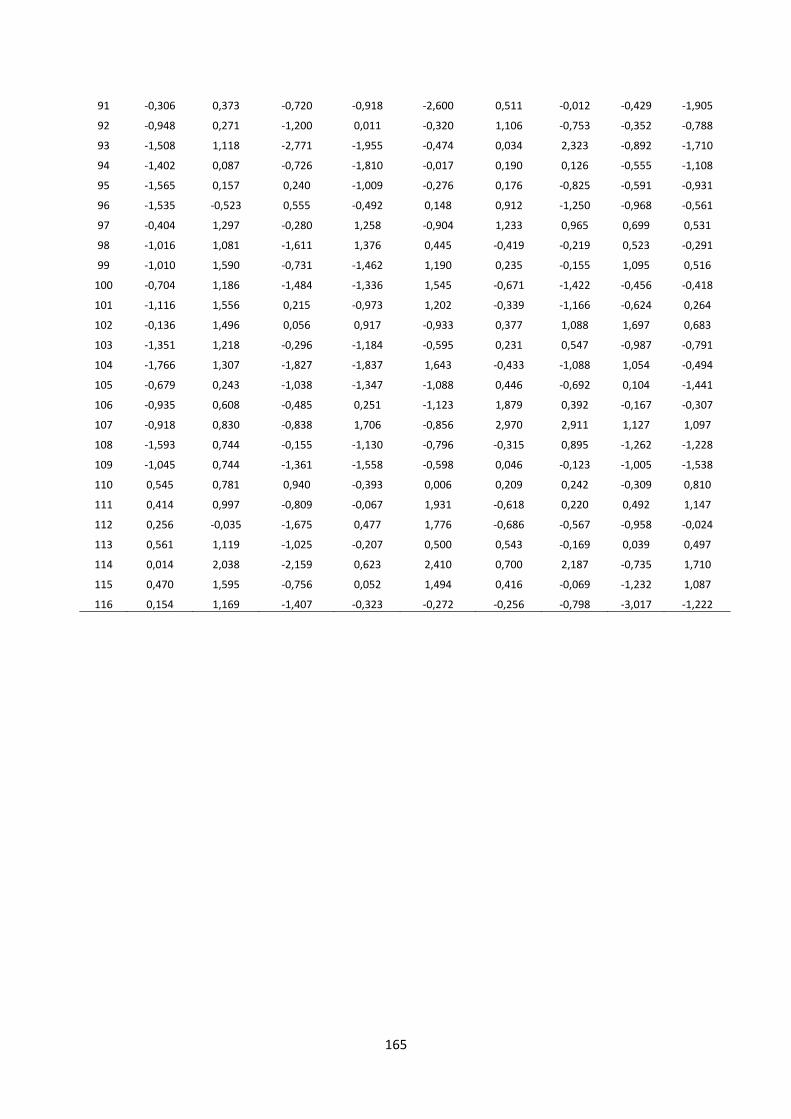
165
91 -0,306 0,373 -0,720 -0,918 -2,600 0,511 -0,012 -0,429 -1,905
92 -0,948 0,271 -1,200 0,011 -0,320 1,106 -0,753 -0,352 -0,788
93 -1,508 1,118 -2,771 -1,955 -0,474 0,034 2,323 -0,892 -1,710
94 -1,402 0,087 -0,726 -1,810 -0,017 0,190 0,126 -0,555 -1,108
95 -1,565 0,157 0,240 -1,009 -0,276 0,176 -0,825 -0,591 -0,931
96 -1,535 -0,523 0,555 -0,492 0,148 0,912 -1,250 -0,968 -0,561
97 -0,404 1,297 -0,280 1,258 -0,904 1,233 0,965 0,699 0,531
98 -1,016 1,081 -1,611 1,376 0,445 -0,419 -0,219 0,523 -0,291
99 -1,010 1,590 -0,731 -1,462 1,190 0,235 -0,155 1,095 0,516
100 -0,704 1,186 -1,484 -1,336 1,545 -0,671 -1,422 -0,456 -0,418
101 -1,116 1,556 0,215 -0,973 1,202 -0,339 -1,166 -0,624 0,264
102 -0,136 1,496 0,056 0,917 -0,933 0,377 1,088 1,697 0,683
103 -1,351 1,218 -0,296 -1,184 -0,595 0,231 0,547 -0,987 -0,791
104 -1,766 1,307 -1,827 -1,837 1,643 -0,433 -1,088 1,054 -0,494
105 -0,679 0,243 -1,038 -1,347 -1,088 0,446 -0,692 0,104 -1,441
106 -0,935 0,608 -0,485 0,251 -1,123 1,879 0,392 -0,167 -0,307
107 -0,918 0,830 -0,838 1,706 -0,856 2,970 2,911 1,127 1,097
108 -1,593 0,744 -0,155 -1,130 -0,796 -0,315 0,895 -1,262 -1,228
109 -1,045 0,744 -1,361 -1,558 -0,598 0,046 -0,123 -1,005 -1,538
110 0,545 0,781 0,940 -0,393 0,006 0,209 0,242 -0,309 0,810
111 0,414 0,997 -0,809 -0,067 1,931 -0,618 0,220 0,492 1,147
112 0,256 -0,035 -1,675 0,477 1,776 -0,686 -0,567 -0,958 -0,024
113 0,561 1,119 -1,025 -0,207 0,500 0,543 -0,169 0,039 0,497
114 0,014 2,038 -2,159 0,623 2,410 0,700 2,187 -0,735 1,710
115 0,470 1,595 -0,756 0,052 1,494 0,416 -0,069 -1,232 1,087
116 0,154 1,169 -1,407 -0,323 -0,272 -0,256 -0,798 -3,017 -1,222
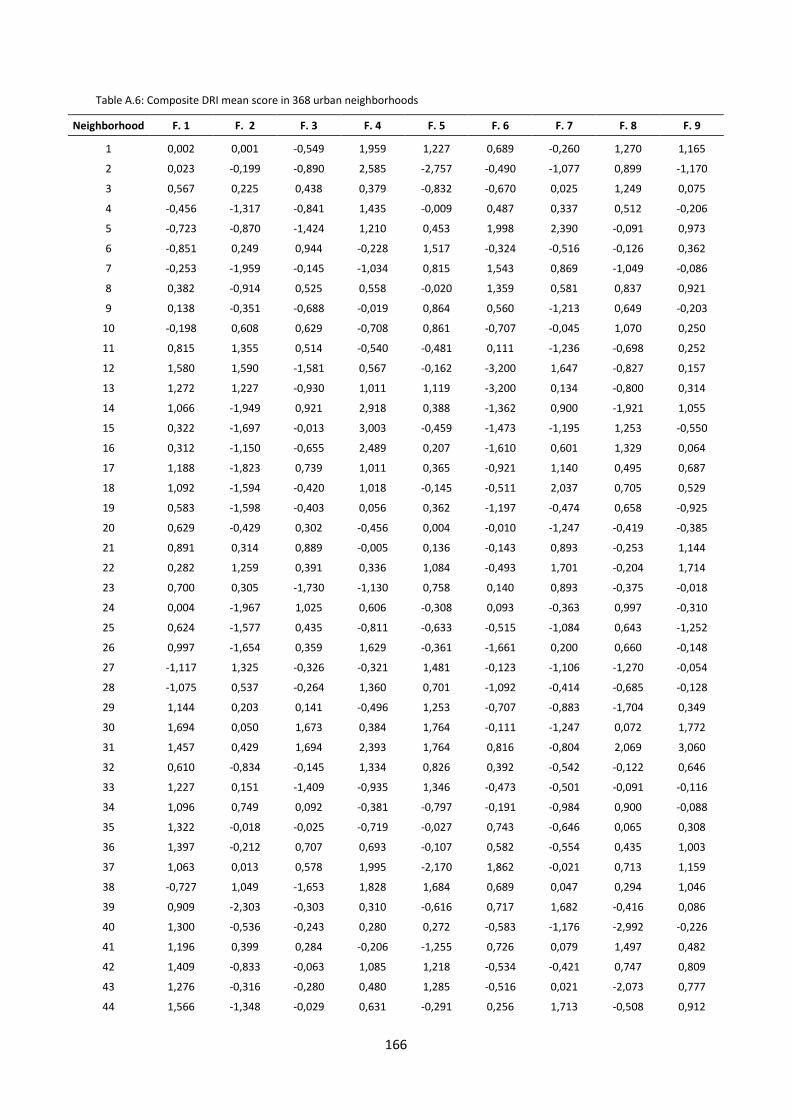
166
Table A.6: Composite DRI mean score in 368 urban neighborhoods
Neighborhood F. 1 F. 2 F. 3 F. 4 F. 5 F. 6 F. 7 F. 8 F. 9
1 0,002 0,001 -0,549 1,959 1,227 0,689 -0,260 1,270 1,165
2 0,023 -0,199 -0,890 2,585 -2,757 -0,490 -1,077 0,899 -1,170
3 0,567 0,225 0,438 0,379 -0,832 -0,670 0,025 1,249 0,075
4 -0,456 -1,317 -0,841 1,435 -0,009 0,487 0,337 0,512 -0,206
5 -0,723 -0,870 -1,424 1,210 0,453 1,998 2,390 -0,091 0,973
6 -0,851 0,249 0,944 -0,228 1,517 -0,324 -0,516 -0,126 0,362
7 -0,253 -1,959 -0,145 -1,034 0,815 1,543 0,869 -1,049 -0,086
8 0,382 -0,914 0,525 0,558 -0,020 1,359 0,581 0,837 0,921
9 0,138 -0,351 -0,688 -0,019 0,864 0,560 -1,213 0,649 -0,203
10 -0,198 0,608 0,629 -0,708 0,861 -0,707 -0,045 1,070 0,250
11 0,815 1,355 0,514 -0,540 -0,481 0,111 -1,236 -0,698 0,252
12 1,580 1,590 -1,581 0,567 -0,162 -3,200 1,647 -0,827 0,157
13 1,272 1,227 -0,930 1,011 1,119 -3,200 0,134 -0,800 0,314
14 1,066 -1,949 0,921 2,918 0,388 -1,362 0,900 -1,921 1,055
15 0,322 -1,697 -0,013 3,003 -0,459 -1,473 -1,195 1,253 -0,550
16 0,312 -1,150 -0,655 2,489 0,207 -1,610 0,601 1,329 0,064
17 1,188 -1,823 0,739 1,011 0,365 -0,921 1,140 0,495 0,687
18 1,092 -1,594 -0,420 1,018 -0,145 -0,511 2,037 0,705 0,529
19 0,583 -1,598 -0,403 0,056 0,362 -1,197 -0,474 0,658 -0,925
20 0,629 -0,429 0,302 -0,456 0,004 -0,010 -1,247 -0,419 -0,385
21 0,891 0,314 0,889 -0,005 0,136 -0,143 0,893 -0,253 1,144
22 0,282 1,259 0,391 0,336 1,084 -0,493 1,701 -0,204 1,714
23 0,700 0,305 -1,730 -1,130 0,758 0,140 0,893 -0,375 -0,018
24 0,004 -1,967 1,025 0,606 -0,308 0,093 -0,363 0,997 -0,310
25 0,624 -1,577 0,435 -0,811 -0,633 -0,515 -1,084 0,643 -1,252
26 0,997 -1,654 0,359 1,629 -0,361 -1,661 0,200 0,660 -0,148
27 -1,117 1,325 -0,326 -0,321 1,481 -0,123 -1,106 -1,270 -0,054
28 -1,075 0,537 -0,264 1,360 0,701 -1,092 -0,414 -0,685 -0,128
29 1,144 0,203 0,141 -0,496 1,253 -0,707 -0,883 -1,704 0,349
30 1,694 0,050 1,673 0,384 1,764 -0,111 -1,247 0,072 1,772
31 1,457 0,429 1,694 2,393 1,764 0,816 -0,804 2,069 3,060
32 0,610 -0,834 -0,145 1,334 0,826 0,392 -0,542 -0,122 0,646
33 1,227 0,151 -1,409 -0,935 1,346 -0,473 -0,501 -0,091 -0,116
34 1,096 0,749 0,092 -0,381 -0,797 -0,191 -0,984 0,900 -0,088
35 1,322 -0,018 -0,025 -0,719 -0,027 0,743 -0,646 0,065 0,308
36 1,397 -0,212 0,707 0,693 -0,107 0,582 -0,554 0,435 1,003
37 1,063 0,013 0,578 1,995 -2,170 1,862 -0,021 0,713 1,159
38 -0,727 1,049 -1,653 1,828 1,684 0,689 0,047 0,294 1,046
39 0,909 -2,303 -0,303 0,310 -0,616 0,717 1,682 -0,416 0,086
40 1,300 -0,536 -0,243 0,280 0,272 -0,583 -1,176 -2,992 -0,226
41 1,196 0,399 0,284 -0,206 -1,255 0,726 0,079 1,497 0,482
42 1,409 -0,833 -0,063 1,085 1,218 -0,534 -0,421 0,747 0,809
43 1,276 -0,316 -0,280 0,480 1,285 -0,516 0,021 -2,073 0,777
44 1,566 -1,348 -0,029 0,631 -0,291 0,256 1,713 -0,508 0,912

167
45 1,320 -0,607 0,771 1,430 -1,139 -0,215 1,239 -1,087 0,991
46 0,740 -0,873 -0,571 0,975 0,098 -1,652 -1,085 0,603 -0,817
47 1,279 -1,078 0,502 -0,149 -0,895 0,683 0,579 -0,302 0,344
48 1,034 -2,317 0,824 -0,017 0,880 0,517 1,575 -0,512 0,969
49 1,286 -1,040 0,202 1,343 -0,212 0,493 0,593 0,425 1,002
50 0,638 -1,471 1,070 -0,014 -0,054 -0,993 -0,173 1,191 -0,280
51 1,089 -0,944 0,604 0,219 1,098 0,265 0,717 -1,178 1,187
52 0,619 -1,128 0,540 0,969 0,560 0,378 -0,189 0,191 0,697
53 1,100 -0,547 0,213 -0,182 1,208 0,901 -0,922 0,399 0,779
54 0,508 0,460 0,130 -0,103 0,682 -0,042 -0,211 -0,112 0,586
55 1,131 -0,362 0,026 -0,002 -2,461 -0,160 -0,675 -1,368 -0,992
56 0,804 0,349 -0,040 0,393 -0,441 3,018 -0,739 -1,663 1,196
57 0,111 0,079 0,085 -0,206 -0,059 0,315 0,632 -0,481 0,334
58 0,681 -2,482 0,835 1,526 1,435 -0,355 2,663 -1,220 1,590
59 0,750 -1,462 -1,200 -0,339 -0,093 -1,461 -0,871 -0,967 -1,714
60 0,347 -1,294 0,643 1,641 0,371 1,094 -1,137 -0,896 0,629
61 1,251 -1,215 1,086 0,230 0,132 -1,645 -1,247 1,654 -0,360
62 0,753 -0,851 1,034 1,030 -0,352 -0,083 -1,247 -0,826 0,144
63 0,518 -1,309 0,913 0,568 -0,297 -1,017 1,662 -0,203 0,374
64 0,847 -1,343 1,037 0,871 -0,810 0,359 -0,882 1,215 0,082
65 0,827 -0,880 -0,338 0,472 -1,141 0,434 2,055 -1,574 0,414
66 0,592 -1,083 0,907 -0,126 -0,499 1,098 1,534 -0,224 0,872
67 0,547 -1,924 0,205 0,823 -0,302 -1,556 0,131 -0,297 -0,761
68 1,274 -1,841 -0,395 0,731 0,191 0,562 -0,271 0,234 0,134
69 0,676 -0,215 0,838 2,004 0,051 0,575 0,573 0,770 1,681
70 0,627 0,065 -0,152 0,287 0,294 -0,043 1,116 0,076 0,818
71 0,311 1,800 -0,291 1,928 -1,492 1,735 -0,243 0,538 1,298
72 0,366 1,135 -0,812 1,727 1,472 -1,042 -0,079 0,526 1,078
73 0,994 -0,429 -0,031 2,036 1,170 -0,387 -0,923 -0,536 0,970
74 0,905 0,793 -0,178 1,587 0,755 0,662 -0,969 0,468 1,380
75 -0,183 1,495 0,069 -1,627 0,304 -0,456 -1,247 0,580 -0,526
76 0,448 1,061 -0,803 0,390 0,370 0,094 0,418 -0,662 0,717
77 -0,896 1,109 0,316 -0,396 1,257 0,045 0,004 0,781 0,580
78 0,090 1,258 0,997 -1,489 0,171 -1,068 -0,234 0,809 -0,003
79 0,219 0,874 0,890 -0,679 -0,561 -0,961 1,341 0,902 0,435
80 0,380 0,534 0,001 -0,884 -1,194 -0,477 0,203 1,848 -0,512
81 -0,398 1,153 -0,714 1,921 1,379 0,152 1,909 0,672 1,959
82 0,425 -0,514 0,501 0,932 0,477 0,966 1,522 1,199 1,608
83 0,592 -0,474 -0,133 -0,901 0,335 0,934 -0,071 1,249 0,171
84 0,689 -0,965 0,287 0,145 0,222 -0,274 1,874 -0,322 0,727
85 0,642 0,041 0,303 0,777 -0,349 2,115 0,467 1,803 1,488
86 0,933 0,433 -0,291 -1,119 0,024 -0,607 2,253 1,136 0,632
87 0,753 -0,977 0,750 0,356 -0,441 -0,274 0,106 0,441 0,135
88 -0,413 0,986 -0,034 -0,585 -0,402 0,476 -0,149 0,250 -0,065
89 0,541 0,626 -0,867 -0,404 1,242 -0,044 0,199 -1,428 0,506
90 0,920 0,319 -0,789 -0,749 1,400 1,405 2,014 1,204 1,726

168
91 -0,807 1,395 -0,506 -1,314 -2,553 0,408 -1,247 0,378 -1,809
92 -0,275 1,062 -2,670 -0,338 -2,323 1,657 -0,045 -1,516 -1,304
93 0,188 1,127 -0,462 -0,644 1,719 -2,240 -1,247 0,722 -0,428
94 0,727 0,511 1,412 0,294 1,332 -0,665 -1,247 -0,132 1,028
95 0,331 0,751 0,893 0,748 -0,396 1,695 -0,440 0,249 1,332
96 0,800 0,402 0,690 -0,310 -0,649 -0,895 -0,307 1,251 -0,027
97 0,251 0,444 -1,584 0,306 1,120 -0,337 -1,247 -0,760 -0,357
98 0,511 0,042 0,831 -0,438 -0,232 -0,835 -1,247 0,777 -0,411
99 1,132 0,125 0,757 -0,496 -0,675 -0,232 0,634 0,150 0,500
100 0,619 0,468 0,724 1,473 -0,303 0,907 0,379 1,269 1,595
101 1,079 0,516 -0,453 -0,540 -0,490 -0,912 0,171 -0,102 -0,205
102 0,852 0,525 0,870 1,985 -0,047 0,359 2,151 0,379 2,456
103 0,800 0,710 -0,129 0,595 -0,791 -0,075 2,927 0,820 1,433
104 1,022 0,050 0,780 -0,115 -0,132 -0,010 -0,405 0,711 0,524
105 1,058 -0,936 0,136 -0,334 -1,317 0,171 1,312 -1,160 -0,026
106 0,718 1,098 -0,634 -1,331 1,600 0,128 0,009 1,056 0,713
107 1,104 -0,164 0,422 -1,169 -1,200 -0,073 -0,325 0,705 -0,471
108 0,999 0,070 1,006 0,680 -0,654 -0,498 0,156 1,393 0,711
109 1,286 1,191 -0,563 -0,791 0,937 -0,291 0,688 0,354 0,999
110 1,151 0,975 0,278 -0,099 -0,111 0,128 0,266 0,468 1,015
111 0,844 0,346 1,091 -0,528 0,513 -0,341 -1,247 1,002 0,400
112 0,858 0,415 0,402 0,754 0,453 0,004 -1,048 0,614 0,771
113 0,822 0,587 -0,114 -0,431 -1,019 -0,047 -0,927 0,588 -0,387
114 1,095 0,913 0,475 0,129 -0,424 -0,094 0,240 0,655 0,913
115 1,190 0,711 1,072 -0,290 0,986 -0,209 0,918 0,599 1,739
116 1,472 0,175 -0,940 -0,539 0,474 -1,015 -1,247 0,441 -0,483
117 1,241 -0,402 0,449 -0,409 0,293 -0,616 -1,247 -0,625 -0,149
118 1,319 0,926 0,467 -0,017 -2,397 -0,437 0,237 -0,477 -0,005
119 1,846 -1,899 -0,187 0,590 0,659 0,335 -0,447 -0,664 0,413
120 1,711 -2,040 0,373 1,357 1,121 -1,157 0,381 -2,056 0,712
121 0,374 -1,726 -1,243 -0,358 -0,232 -0,452 0,017 -0,608 -1,371
122 0,390 -1,349 0,761 -0,412 -0,294 -0,475 1,450 -0,387 0,018
123 0,657 -2,172 1,006 -0,780 -0,151 -0,830 1,093 -0,093 -0,398
124 1,173 0,389 1,098 -0,278 -2,539 -1,024 -1,238 -2,729 -0,933
125 1,522 -1,542 1,363 0,845 -0,249 0,638 -1,247 0,337 0,593
126 1,106 -1,527 1,122 -0,203 0,158 -1,268 -0,003 1,608 -0,098
127 1,489 -2,370 0,264 0,439 -0,548 -1,559 -0,636 -0,299 -1,019
128 1,159 -2,393 0,716 0,880 -0,348 -0,344 0,415 1,795 0,096
129 1,311 -2,007 -0,539 -0,345 -0,951 0,112 0,107 1,519 -0,825
130 0,945 -0,562 -2,030 -1,078 -0,432 -2,192 -0,332 -2,018 -2,124
131 0,994 -1,269 0,948 -2,917 -1,379 -2,984 -0,813 -0,537 -2,649
132 0,989 -0,611 0,725 -0,395 -1,145 -1,526 0,532 0,926 -0,488
133 0,364 0,462 -1,013 -0,741 -2,612 -0,596 1,615 -2,021 -1,112
134 0,371 0,861 -0,874 -0,552 -2,452 -1,090 0,881 0,523 -1,153
135 1,151 -0,125 -1,822 -0,785 -0,321 -1,556 0,843 0,570 -0,958
136 1,053 -1,380 -1,300 0,844 0,373 1,330 1,228 0,331 0,768

169
137 1,063 0,092 1,154 0,370 0,977 0,512 0,162 2,373 1,751
138 0,784 -1,305 0,877 0,059 -1,039 0,542 -0,877 2,315 -0,285
139 0,596 -0,953 0,940 0,522 -2,295 -0,764 -1,046 1,034 -1,113
140 1,316 -1,063 0,863 0,748 0,780 1,281 -0,417 0,858 1,407
141 1,339 -1,523 1,029 1,622 -0,118 -0,212 -0,724 0,999 0,611
142 0,908 -0,494 0,177 1,088 -0,716 0,385 -0,378 2,549 0,409
143 0,132 -1,099 1,465 0,611 1,195 -1,065 -0,719 2,364 0,351
144 -0,072 -1,327 1,504 -1,634 0,802 -0,690 -0,220 1,628 -0,465
145 -0,079 -0,827 0,602 0,207 0,698 1,227 -0,772 1,218 0,456
146 0,262 -1,502 1,472 -0,009 1,427 -0,585 -0,560 1,310 0,340
147 1,004 -0,828 -1,002 0,882 -1,454 1,371 -1,199 0,184 -0,499
148 0,857 -1,256 0,901 -0,534 -0,597 -0,497 -1,247 2,181 -0,758
149 0,708 -0,645 0,797 -0,354 0,371 0,140 -0,918 0,525 0,138
150 -0,094 -0,891 1,186 -0,731 1,138 -0,516 -0,772 1,832 -0,106
151 0,685 -1,387 0,729 -0,320 -1,013 -0,725 -0,516 0,430 -0,905
152 0,018 -1,224 0,690 0,031 -0,507 1,323 -1,000 0,949 -0,226
153 -0,166 -0,388 0,371 0,420 -1,929 1,333 -0,757 1,843 -0,460
154 0,130 -0,411 1,142 0,676 -0,477 -0,606 -0,621 1,820 0,000
155 0,148 -1,611 1,218 2,487 0,441 0,862 -0,400 0,675 1,190
156 -0,175 -0,553 0,457 -1,307 0,536 -0,732 -0,801 0,261 -0,874
157 0,330 -1,222 0,422 0,218 0,559 0,218 -0,965 0,306 -0,094
158 0,806 -1,239 1,493 0,938 0,077 -0,395 1,116 -1,199 1,047
159 0,777 -1,599 1,426 1,600 0,458 1,805 -0,216 -0,450 1,608
160 0,565 -0,667 0,909 -0,411 0,511 -0,550 1,906 -0,915 0,855
161 0,799 -1,005 0,877 0,264 -1,327 -1,489 2,882 0,451 0,324
162 0,401 -0,797 0,892 1,064 -0,345 0,698 1,742 0,176 1,314
163 0,378 -1,626 1,210 0,592 0,705 2,237 0,492 0,099 1,505
164 0,557 -0,740 0,716 0,594 -0,433 2,589 0,137 -0,723 1,232
165 -0,041 -0,975 1,450 0,949 1,333 -1,489 -1,247 -0,153 0,110
166 -1,584 -1,157 1,175 0,256 1,187 1,042 -1,247 -0,809 -0,113
167 -0,437 -0,451 0,966 0,110 -0,196 0,149 -0,674 0,031 -0,187
168 -0,007 2,785 0,062 -1,610 1,764 0,352 0,039 -0,261 1,350
169 0,134 -0,699 -0,292 -0,880 0,530 -1,628 -0,736 -0,649 -1,265
170 -0,410 -0,740 0,829 -0,843 -0,641 0,246 -1,172 -0,515 -1,007
171 -0,744 -1,035 0,468 -0,690 0,098 1,227 0,093 -1,010 -0,259
172 -0,880 -0,330 0,510 -1,845 1,107 0,757 0,305 -1,310 -0,129
173 -0,703 0,331 0,555 -1,369 -0,384 -0,228 0,937 -0,814 -0,363
174 -0,870 0,236 0,474 -0,262 -0,422 0,709 0,913 -0,382 0,213
175 -0,272 0,849 0,068 -0,860 0,394 0,204 0,718 0,436 0,420
176 -0,128 -0,074 -0,244 -1,144 1,764 0,352 -1,247 -1,294 -0,187
177 -0,981 -0,327 -0,823 -0,828 0,210 -0,801 0,062 -0,116 -1,327
178 -0,073 -0,471 1,155 -0,304 0,719 -1,464 1,553 1,650 0,488
179 -0,724 -0,439 0,923 0,133 -0,656 -0,056 1,655 1,020 0,255
180 -0,220 -0,585 1,246 -0,917 -0,243 -1,648 -0,002 -0,081 -0,832
181 -0,305 -0,671 1,020 -1,243 0,053 -1,046 0,779 0,761 -0,479
182 -1,422 -0,664 0,955 -0,390 -0,015 -0,131 0,418 0,231 -0,497

170
183 -0,489 -1,132 0,326 -0,414 0,709 -0,337 0,203 -0,960 -0,418
184 -0,774 -0,377 0,235 -1,327 -0,734 -0,411 1,792 -1,087 -0,686
185 -1,976 -0,597 -0,118 -0,730 -1,036 -0,308 -0,008 -0,409 -1,891
186 -1,351 -0,451 -0,005 -1,113 -0,280 -0,227 0,313 -0,575 -1,220
187 0,321 -0,797 0,538 -0,401 -0,087 -0,998 1,366 -0,045 -0,014
188 0,820 -0,823 0,695 -0,406 0,350 0,195 -1,152 0,118 -0,019
189 1,031 -1,031 -1,506 -0,845 0,686 0,422 -0,016 0,171 -0,422
190 0,673 -0,257 -1,318 -0,794 -0,177 -1,187 0,646 1,244 -0,870
191 1,338 -0,829 0,388 -0,710 -0,022 -0,293 -0,073 0,830 0,024
192 -0,040 -0,510 0,507 -1,279 0,292 -1,631 1,478 0,362 -0,403
193 0,265 0,651 0,997 -0,823 1,100 -1,446 -1,026 0,763 0,049
194 0,327 -0,828 0,761 -0,506 1,206 -0,468 -0,696 0,934 0,056
195 -0,208 0,059 0,425 0,015 1,255 0,001 -0,611 0,670 0,429
196 -0,298 0,457 0,214 -1,206 -0,439 0,659 -0,061 0,058 -0,259
197 -1,073 -0,373 0,602 0,240 0,250 -0,204 0,004 -0,204 -0,231
198 -0,371 -0,574 1,111 -0,512 -0,085 0,757 0,236 -0,050 0,210
199 -0,098 -0,532 0,585 0,090 -0,080 1,348 -0,752 -0,486 0,205
200 -0,529 0,653 -0,860 -0,524 -0,184 0,451 -0,283 -1,070 -0,535
201 -1,937 0,126 0,040 -0,978 0,382 0,254 -0,395 -0,367 -0,978
202 -1,805 0,466 -0,752 -1,181 1,033 -0,359 -0,120 0,549 -1,020
203 -0,945 -0,144 1,104 -0,878 1,128 -0,173 -1,138 0,853 -0,291
204 -0,484 0,275 0,003 -0,595 0,388 0,816 -1,242 0,691 -0,270
205 -0,237 0,761 -2,286 -0,113 -0,733 -2,645 0,664 0,916 -1,762
206 -0,915 0,170 -1,889 -0,428 -0,794 0,441 0,782 0,506 -1,101
207 -0,761 -0,492 0,424 0,696 -1,557 0,766 -0,888 0,139 -0,755
208 0,144 0,192 -0,449 0,872 -0,970 0,143 0,497 -0,324 0,079
209 -0,407 0,162 0,144 1,115 -0,815 0,859 -0,850 0,294 0,027
210 -1,075 0,407 -1,248 -0,794 -0,650 0,569 -0,081 -0,620 -1,171
211 -2,689 0,646 -2,738 -0,674 0,105 0,415 0,644 0,259 -1,771
212 -1,045 0,376 -2,140 0,208 -0,222 -0,003 -0,065 -0,128 -1,183
213 -1,900 0,928 -2,245 -2,404 0,727 -2,283 1,072 -0,112 -2,327
214 -1,345 -0,010 0,071 1,763 -0,798 0,211 0,627 0,470 0,067
215 -0,717 0,045 -0,153 0,273 -0,238 0,712 0,149 -0,283 -0,040
216 -3,614 1,141 -2,150 -0,791 -1,308 -0,219 0,859 0,149 -2,514
217 -2,551 0,553 -0,896 0,491 -0,605 0,476 -0,594 -0,106 -1,315
218 -1,491 -0,115 0,449 -1,166 -1,858 0,582 -1,133 -0,602 -1,855
219 0,434 -0,075 0,188 0,239 -0,526 0,362 -0,891 -0,564 -0,097
220 0,924 -0,941 1,106 1,173 -0,006 -2,680 0,096 -0,301 -0,053
221 0,714 -0,853 1,422 0,595 0,220 -0,213 -0,523 -0,987 0,564
222 0,703 -0,652 0,308 0,985 -0,325 -0,644 1,398 -0,594 0,625
223 1,166 1,590 -1,815 1,725 1,764 -0,644 0,772 -2,216 1,682
224 0,463 2,253 -0,383 0,682 1,764 -0,879 -0,921 -1,409 1,182
225 0,300 -0,361 0,267 1,155 0,175 0,374 0,162 0,873 0,784
226 0,981 0,410 1,540 1,825 1,272 0,773 -0,140 -0,026 2,565
227 0,061 0,240 0,966 -1,652 0,726 0,067 -0,550 1,596 0,078
228 0,163 0,238 1,170 0,353 0,217 2,043 -0,763 0,304 1,308

171
229 0,373 -0,396 1,509 1,490 0,728 1,295 -0,869 2,377 1,642
230 0,355 -1,162 1,178 1,399 -0,626 2,339 -1,247 -0,497 0,814
231 0,872 -0,473 -0,089 1,147 -1,155 0,313 -0,307 -1,352 0,057
232 0,404 -0,538 0,746 2,309 -1,563 0,338 -0,877 -1,381 0,223
233 0,237 -0,721 0,977 0,327 -0,017 0,554 -0,897 -0,466 0,203
234 0,706 -0,714 1,319 0,629 1,070 -1,406 -1,247 -0,354 0,267
235 0,615 -0,724 0,982 1,462 -0,040 0,208 -1,247 -0,699 0,502
236 0,932 -0,702 1,416 0,953 0,494 1,217 -0,851 -1,848 1,329
237 0,558 -0,934 1,357 0,421 -0,074 0,876 -0,922 -1,522 0,502
238 -0,296 -0,501 0,944 -0,789 -0,974 0,650 -1,004 0,092 -0,728
239 -0,054 -0,270 1,275 1,459 -0,325 0,278 -0,732 -0,161 0,606
240 0,329 -0,422 1,094 0,557 -0,514 0,717 -0,835 -1,315 0,338
241 0,285 -0,593 1,090 -1,106 0,867 -0,299 0,386 -1,093 0,299
242 0,187 -0,578 1,117 0,860 0,382 0,868 0,689 0,968 1,336
243 -0,139 -0,485 0,922 0,776 -0,246 1,796 -1,178 1,515 0,567
244 -0,845 -0,514 0,605 -0,198 0,948 0,274 -0,739 0,893 -0,119
245 0,033 -0,560 1,591 0,081 0,910 -0,161 0,084 0,043 0,811
246 0,316 -0,745 1,256 1,071 0,060 0,508 -0,181 -0,947 0,854
247 0,496 0,755 0,070 1,920 -1,292 1,396 0,308 -0,821 1,250
248 0,362 0,405 0,188 -0,046 0,071 -1,102 -1,247 1,344 -0,413
249 0,000 -0,132 -1,072 0,041 -0,519 2,622 -0,670 0,785 0,051
250 -0,292 -1,119 0,867 -0,067 1,651 -1,132 -0,917 0,699 -0,247
251 -0,420 -0,464 1,085 1,419 -1,105 0,640 0,442 0,700 0,527
252 -0,128 -0,330 0,146 0,256 -0,070 -0,110 0,173 -0,836 -0,052
253 -0,987 -0,381 0,664 1,500 -0,393 1,598 0,730 -1,318 0,883
254 -0,329 0,664 -0,415 0,263 -0,553 -0,275 -1,247 0,315 -0,713
255 0,335 0,514 -0,036 0,452 -1,140 -0,275 0,594 0,971 0,132
256 -1,244 -0,499 0,207 0,883 -0,780 0,306 -1,157 -0,242 -0,923
257 -1,909 -0,540 0,060 1,036 -0,952 0,618 -0,677 -1,139 -1,026
258 -2,279 -0,449 0,171 0,336 -0,142 0,206 -1,230 -1,040 -1,353
259 -0,316 0,944 -1,374 -0,835 -1,106 -0,238 -1,228 0,083 -1,584
260 0,063 -0,040 1,261 -0,396 0,088 -0,477 -0,449 0,120 0,082
261 -0,439 0,533 0,274 -0,273 -0,437 -0,643 -0,219 -0,435 -0,467
262 -0,889 0,483 -0,319 -0,731 -1,326 -0,484 0,507 -0,056 -1,117
263 -1,661 -0,318 -0,418 -1,240 -0,752 -1,472 -1,238 -0,746 -2,690
264 -2,517 -0,325 -0,584 1,407 0,519 -0,225 -0,036 -2,034 -0,813
265 -2,447 -0,518 -0,536 -0,107 -0,358 0,272 -1,211 -1,452 -1,952
266 -2,047 0,342 -1,338 -0,105 -1,102 0,819 0,857 -0,658 -1,161
267 -1,218 1,178 -0,809 -1,233 -1,248 0,174 1,542 -0,152 -0,740
268 0,179 1,476 -0,735 -0,810 1,764 -0,661 0,746 -0,544 0,783
269 -0,122 0,740 0,460 0,568 -1,883 0,745 0,368 -0,141 0,224
270 -0,549 0,995 0,206 -0,388 -0,478 0,127 -0,420 0,179 -0,205
271 -0,883 1,531 -0,684 0,190 -0,506 0,894 0,229 0,108 0,195
272 -0,635 1,304 -1,275 -0,355 1,111 0,882 0,965 -0,078 0,700
273 -1,504 1,489 0,328 0,004 0,371 0,016 -1,243 -0,696 -0,222
274 -2,216 0,526 0,852 -0,077 0,107 2,286 1,785 -0,131 1,072

172
275 -1,391 1,121 -2,276 -1,567 -0,347 0,007 2,031 -0,687 -1,062
276 -2,879 1,551 -1,528 -1,595 0,783 -1,610 2,398 0,487 -1,192
277 -1,918 0,140 0,217 -0,736 -0,603 -0,594 0,295 -0,860 -1,290
278 -2,020 -0,529 1,188 -0,395 -1,979 -1,322 1,726 -0,079 -1,392
279 -1,039 0,339 -0,317 0,212 -0,998 -3,200 1,884 -0,001 -1,259
280 -0,283 0,414 -0,663 -0,744 -1,799 0,386 0,164 -0,344 -1,041
281 -0,195 0,325 -1,157 -0,248 -0,255 1,003 0,391 -0,454 -0,124
282 -1,555 0,311 -0,924 0,231 -0,229 0,712 -1,247 -0,120 -1,084
283 -1,308 0,298 -0,268 -0,613 1,668 0,906 -0,222 1,173 0,208
284 -1,420 0,181 -0,446 -1,408 -0,555 -0,352 0,649 -0,033 -1,323
285 -1,495 -0,326 0,075 0,219 -1,328 0,753 -0,879 0,346 -1,207
286 -1,181 -0,388 -0,554 -0,198 0,852 0,955 -1,139 -0,694 -0,636
287 -1,472 -0,312 0,756 -1,077 -0,492 0,933 -1,245 -1,163 -1,128
288 -1,517 -0,717 1,078 -0,570 1,282 0,173 -0,038 -1,461 -0,120
289 -1,100 -0,415 -0,870 -2,490 -0,561 -0,289 0,818 -1,714 -1,918
290 -1,347 0,508 -1,090 -1,296 -0,691 0,258 -0,147 -1,176 -1,523
291 -1,046 0,184 0,819 -0,925 -0,741 0,131 -0,167 0,169 -0,678
292 -0,620 -0,662 1,294 -0,991 -0,054 0,079 -0,901 -1,797 -0,683
293 -1,609 0,625 -0,837 0,081 -0,799 0,844 1,345 -0,853 -0,311
294 -1,035 -0,334 1,314 0,054 0,836 -0,060 -1,028 -0,717 -0,060
295 -2,556 0,718 -0,955 -1,206 -0,041 0,034 -0,931 0,797 -1,902
296 -1,795 0,727 -1,088 -1,914 -0,471 -0,307 -1,234 -0,384 -2,318
297 -0,486 1,764 -0,530 -0,919 0,604 -0,339 -1,089 0,081 -0,329
298 -0,597 1,130 -0,990 -0,925 0,424 -0,298 -1,247 -0,349 -0,917
299 -0,790 1,171 -0,910 -1,573 1,764 0,156 -0,819 0,651 -0,295
300 -0,496 0,722 -0,490 0,410 -2,357 0,769 -0,034 0,614 -0,680
301 -0,220 1,008 -0,298 1,257 0,774 0,915 -0,277 0,950 1,181
302 -0,005 1,768 0,084 0,634 -1,491 0,474 0,992 0,619 0,825
303 -0,597 1,711 -1,753 -1,249 0,943 -0,265 0,980 1,277 -0,086
304 -0,789 1,515 -1,197 -1,175 0,520 -2,911 -0,810 -0,762 -1,778
305 -0,423 0,926 -1,960 -0,632 1,421 0,846 -0,976 -0,995 -0,299
306 -1,573 1,308 0,674 -0,657 0,992 -0,238 -0,427 -1,057 0,026
307 -0,932 1,027 -0,219 -1,669 0,967 0,347 -0,241 0,236 -0,235
308 -1,267 1,966 -0,044 -0,610 0,459 0,417 -0,588 0,845 0,128
309 -0,771 1,666 -0,567 1,623 0,511 1,672 3,099 -0,213 2,532
310 -0,086 1,141 -2,093 0,658 -0,781 0,590 1,215 0,424 0,113
311 -1,540 0,761 -0,766 1,758 0,375 -2,591 -0,045 0,390 -0,817
312 -1,186 1,356 -1,232 0,807 1,248 0,945 -1,174 0,273 0,264
313 -1,156 1,016 0,080 -1,320 -1,544 0,274 0,346 -0,667 -0,965
314 -0,274 1,207 -0,426 -0,940 -1,409 -0,551 -1,147 -0,256 -1,347
315 -0,273 0,906 0,543 -0,241 0,954 0,204 -1,159 0,701 0,432
316 -0,368 0,982 0,361 -0,218 -2,686 -0,406 -0,586 1,100 -1,154
317 0,125 0,710 0,013 -0,438 -0,761 0,378 0,951 0,517 0,329
318 -0,833 1,030 0,734 -0,423 0,800 -0,120 0,741 -0,442 0,716
319 -1,235 1,310 -1,026 -1,927 -1,177 0,059 0,101 -1,175 -1,562
320 -2,344 1,256 -0,534 -1,090 -0,026 0,106 -0,514 1,703 -1,213

173
321 -1,401 0,926 -3,229 -2,152 1,359 -0,611 -1,247 -0,192 -2,368
322 -1,224 1,342 -1,218 -1,617 1,647 0,079 -1,247 0,096 -0,783
323 -1,549 1,676 -1,154 -1,033 1,416 -1,025 0,222 1,418 -0,516
324 -1,761 1,506 -1,107 -0,152 0,202 0,442 1,257 -0,746 0,004
325 -0,847 0,848 -0,756 1,336 -0,608 2,335 2,502 0,810 1,610
326 -2,922 1,283 -1,934 0,220 0,567 2,632 -0,332 0,100 -0,351
327 -1,805 1,044 -0,332 -1,340 -0,061 -0,466 0,808 -0,901 -0,892
328 -1,134 0,489 -0,106 -0,485 -1,072 -0,073 0,971 -1,022 -0,651
329 -1,800 0,199 -1,251 -1,382 -1,848 0,370 -0,556 -1,565 -2,506
330 -0,490 0,382 -0,535 -1,868 -0,646 0,392 0,460 -0,668 -0,911
331 -0,060 1,243 -0,616 0,789 -1,706 1,724 0,996 0,556 0,745
332 -0,778 0,370 0,129 1,342 -2,003 1,847 0,232 -0,458 0,250
333 0,116 0,400 -1,187 -1,979 -0,502 0,640 -1,235 1,221 -1,354
334 -0,737 0,455 -1,850 -0,673 -0,834 0,185 -1,242 0,233 -1,809
335 -0,088 0,111 0,634 -0,306 0,119 0,140 1,516 0,316 0,780
336 -0,065 -0,092 0,563 0,429 -0,165 0,755 1,083 -0,276 0,887
337 -0,745 -0,595 -1,503 -0,930 -0,692 -0,368 -0,734 0,095 -2,122
338 -0,472 -0,096 1,248 -1,637 -2,398 -0,278 1,618 -0,200 -0,845
339 -2,047 0,710 -1,079 -1,218 -0,845 0,066 1,791 -1,634 -1,174
340 -0,526 0,842 -1,222 -1,407 1,311 0,066 -0,930 -0,497 -0,653
341 -0,941 2,026 -2,896 -1,491 -0,683 -0,890 -0,045 -1,455 -1,954
342 -1,058 1,711 -1,552 -0,831 0,719 1,504 -1,247 -0,933 -0,324
343 -1,414 0,071 -1,829 -0,690 1,277 -1,582 -1,247 -0,413 -2,007
344 1,202 0,384 -0,561 0,432 1,287 0,933 -1,220 0,328 1,018
345 0,670 -0,708 -1,673 0,951 1,017 -1,559 0,175 -4,295 -0,480
346 0,638 -1,073 -0,065 0,718 1,764 0,614 -0,103 0,319 1,010
347 -0,079 0,302 -1,000 0,322 0,136 -0,895 -0,601 -0,261 -0,681
348 0,633 0,519 0,221 -0,498 1,764 -2,725 -0,337 2,998 0,059
349 -0,247 1,891 -2,507 0,204 1,526 -0,179 0,401 -2,026 0,344
350 0,280 1,451 -2,126 -0,119 0,225 -0,204 -0,493 -0,083 -0,382
351 0,859 0,163 1,478 0,135 1,668 1,070 1,827 0,467 2,763
352 0,605 0,790 0,690 -0,088 1,360 0,236 0,142 -0,164 1,477
353 0,581 0,122 0,224 -0,858 -1,599 0,434 0,924 -0,026 -0,113
354 0,732 0,875 1,506 -0,463 1,142 0,456 0,112 1,457 1,763
355 0,609 0,812 1,666 0,118 -0,490 0,032 0,631 0,608 1,296
356 0,704 0,801 -0,111 0,484 0,027 -0,809 -0,483 -0,720 0,254
357 0,397 1,057 -0,028 -0,450 0,112 0,581 -0,536 -1,800 0,419
358 -0,114 1,150 0,544 -1,042 -0,683 0,091 1,780 -1,137 0,573
359 0,395 1,189 -3,357 0,436 1,657 -0,895 1,321 -0,093 0,249
360 -0,325 0,657 -2,299 -0,270 -0,779 -0,839 -1,247 -2,883 -2,008
361 0,576 1,648 -0,584 -0,386 0,231 0,394 -1,247 -0,887 0,269
362 0,420 1,319 -0,872 -0,154 1,443 1,230 -1,068 -0,008 0,929
363 0,581 0,897 -0,612 -0,374 -0,535 0,280 -0,007 -0,469 0,068
364 0,549 1,151 -1,227 -0,014 0,047 -0,278 1,191 0,485 0,507
365 0,668 1,399 -0,519 -0,151 1,730 -0,159 -0,045 -0,599 1,165
366 0,608 1,682 -0,108 -0,275 0,361 0,394 0,319 -1,642 1,104

174
367 -0,123 1,565 -1,556 0,911 1,667 0,611 1,448 -0,631 1,633
368 0,148 2,421 -2,033 0,043 1,579 0,460 2,398 -0,510 1,810
Figure B.1: Pair-wise comparision of the system elemnts in ANP


![E[M]CONOMY moves! - ilg-sulzberger.de Die EMCO Group ist ein Verbund von Topanbietern aus der Werkzeugmaschinenbranche. ... CONCEPT MILL 55 CONCEPT MILL 105 CONCEPT MILL 250 CONCEPT](https://img.pdfslide.org/doc/110x75/5b02e7647f8b9a3c378b639e/emconomy-moves-ilg-emco-group-ist-ein-verbund-von-topanbietern-aus-der-werkzeugmaschinenbranche.jpg)