Embed Size (px)
Citation preview
econstor www.econstor.eu
Der Open-Access-Publikationsserver der ZBW – Leibniz-Informationszentrum WirtschaftThe Open Access Publication Server of the ZBW – Leibniz Information Centre for Economics
Nutzungsbedingungen:Die ZBW räumt Ihnen als Nutzerin/Nutzer das unentgeltliche,räumlich unbeschränkte und zeitlich auf die Dauer des Schutzrechtsbeschränkte einfache Recht ein, das ausgewählte Werk im Rahmender unter→ http://www.econstor.eu/dspace/Nutzungsbedingungennachzulesenden vollständigen Nutzungsbedingungen zuvervielfältigen, mit denen die Nutzerin/der Nutzer sich durch dieerste Nutzung einverstanden erklärt.
Terms of use:The ZBW grants you, the user, the non-exclusive right to usethe selected work free of charge, territorially unrestricted andwithin the time limit of the term of the property rights accordingto the terms specified at→ http://www.econstor.eu/dspace/NutzungsbedingungenBy the first use of the selected work the user agrees anddeclares to comply with these terms of use.
zbw Leibniz-Informationszentrum WirtschaftLeibniz Information Centre for Economics
Junginger-Dittel, Klaus-Otto; Mayer, Thomas
Working Paper
Producer income instability and farmers' riskresponse: The case of major Kenyan export crops
Kiel Working Papers, No. 101
Provided in cooperation with:Institut für Weltwirtschaft (IfW)
Suggested citation: Junginger-Dittel, Klaus-Otto; Mayer, Thomas (1980) : Producer incomeinstability and farmers' risk response: The case of major Kenyan export crops, Kiel WorkingPapers, No. 101, http://hdl.handle.net/10419/46848
Kieler ArbeitspapiereKiel Working Papers
Working Paper No. 101
Producer Income Instability and Farmers1
Risk Response;The Case of Major Kenyan Export Crops
by
K.-O.ijunginger-DittelT. Mayer
Institut fur Weltwirtschaft an der Universitat Kiel
Kiel Institute of World Economics
Department IV
2300 Kiel, Dusternbrooker Weg 120
Working Paper No. 101
Producer Income Instability and Farmers'Risk Response;
The Case of Major Kenyan Export Crops
by
K.-O. jjJunginger-DittelT. Mayer
A/
March 1980
Kiel Working Papers are preliminary papers written by staff
members of the Kiel Institute of World Economics. Responsi-
bility for contents and distribution rests with the author.
Critical comments and suggestions for improvement are
welcome. Quotations should be cleared with the author.
Producer Income Instability and Farmers' Risk Response;
The Case of Major Kenyan Export Crops*
I. Introduction
The instability of export earnings in LDCs and its presumably
harmful economic effects have been broadly discussed in the
economic literature and among policy makers in international
meetings. In analyzing these effects, the destabilization of
producer incomes and farmers' risk response play a prominent
role. Producer incomes may be destabilized by either domestic
factors on the supply side (yield instability due to weather,
crop diseases, etc.), or by fluctuating producer prices reflec-
ting the instability of international primary commodity markets,
If unstable producer incomes induce risk aversion among
farmers, the sectoral factor input will be reduced and will be
suboptimal from a welfare point of view, thus possibly ham-
pering economic growth.
The purpose of this paper is to quantify the effects of pro-
ducer income instability on farmers' planting and long-run
supply decisions in the coffee, tea, and sisal production of
the Kenyan large farm sector. Coffee, tea, and sisal are the
* This paper reports research undertaken in the "Sonderfor-schungsbereich 86" (Hamburg-Kiel) "Teilprojekt 3" (Die Wir-kungen internationaler Rohstoffmarktregulierungen aufWachstum und Allokation in Entwicklungslandern) with finan-cial support provided by the "Deutsche Forschungsgemein-schaf t". Vie are grateful to U. Hiemenz and several othercolleagues for helpful comments on an earlier draft.
For a survey, see: D. Lim, "Export Instability and EconomicGrowth; A Return to Fundamentals", Oxford Bulletin ofEconomics and Statistics, Vol. 38 (1976), pp. 311-322; or:L. Stein, "Export Instability and Development, A Review ofSome Recent Findings", Banca Nazionale del Lavoro, No. 122(1977), p. 279 sqq".
- 2 -
leading Kenyan export crops, the domestic consumption of
which is negligible. About half of the Kenyan coffee and
tea, and all the sisal are grov.m in the large farm sector,
and nearly always on plantations. Coffee, tea, and sisal
are permanent crops the planting of which requires long-run
decisions. It is the long-run we shall focus on in this
paper; hence the influence of income instability on short-
term production planning will be neglected.
The analysis will be based on a time series approach covering
the period 1951-197 5. In the following section we shall
develop the methodological framework of how to measure the
risk response of farmers. IJext the estimation equations will
be specified, and the estimation techniques will be demon-
strated. Subsequently, the regression results are presented
and interpreted. Some tentative conclusions are drawn in
the final section.
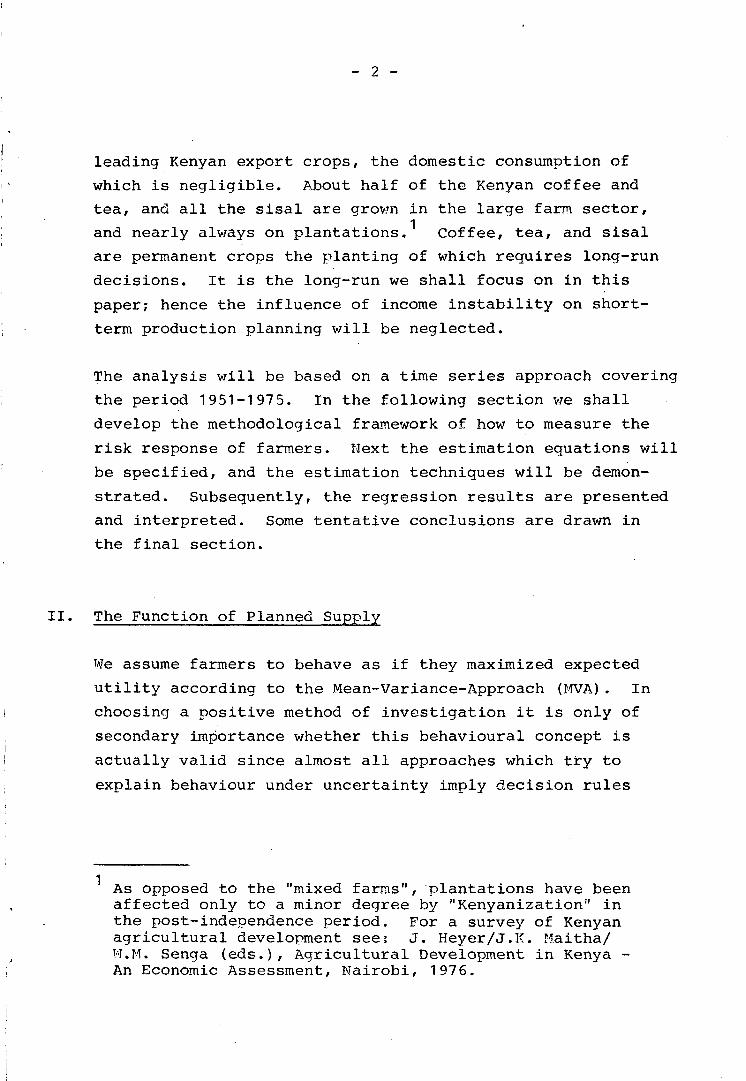
II. The Function of Planned Supply
We assume farmers to behave as if they maximized expected
utility according to the Mean-Variance-Approach (MVA). In
choosing a positive method of investigation it is only of
secondary importance whether this behavioural concept is
actually valid since almost all approaches which try to
explain behaviour under uncertainty imply decision rules
As opposed to the "mixed farms", plantations have beenaffected only to a minor degree by "Kenyanization" inthe post-independence period. For a survey of Kenyanagricultural development see; J. Heyer/J.K. Maitha/W.M. Senga (eds.), Agricultural Development in Kenya -An Economic Assessment, Nairobi, 1976.
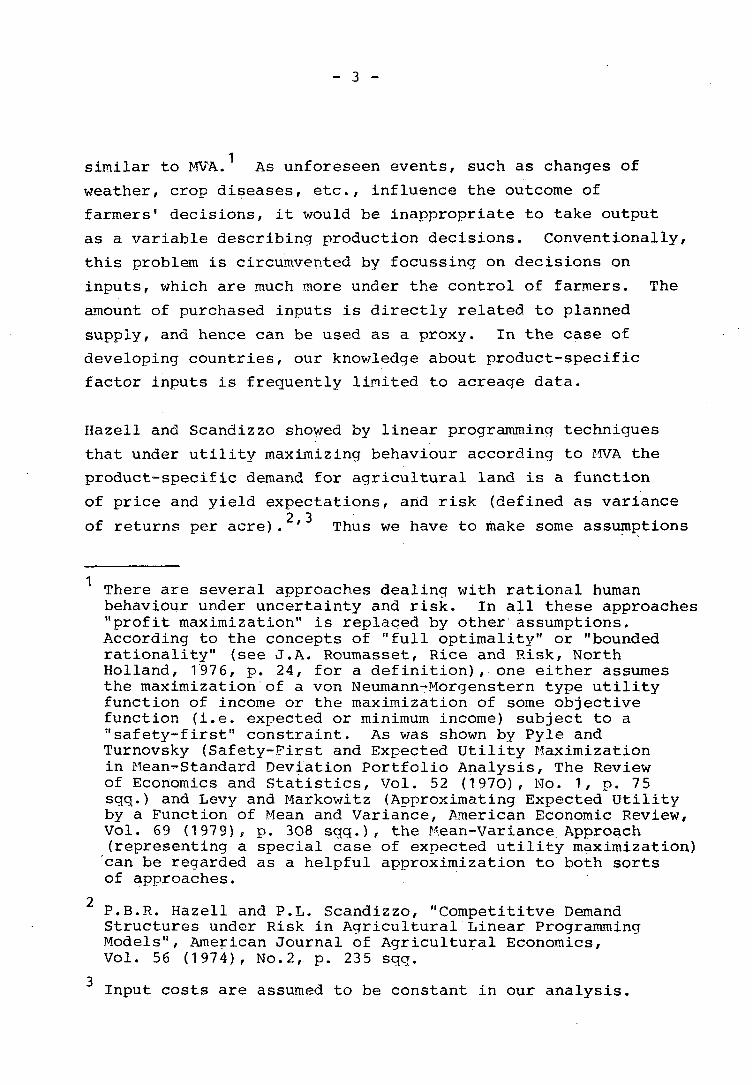
similar to MVA. As unforeseen events, such as changes of
weather, crop diseases, etc., influence the outcome of
farmers' decisions, it would be inappropriate to take output
as a variable describing production decisions. Conventionally,
this problem is circumvented by focussing on decisions on
inputs, which are much more under the control of farmers. The
amount of purchased inputs is directly related to planned
supply, and hence can be used as a proxy. In the case of
developing countries, our knowledge about product-specific
factor inputs is frequently limited to acreage data.
Hazell and Scandizzo showed by linear programming techniques
that under utility maximizing behaviour according to MVA the
product-specific demand for agricultural land is a function
of price and yield expectations, and risk (defined as variance2 3of returns per acre). ' Thus we have to make some assumptions
There are several approaches dealing with rational humanbehaviour under uncertainty and risk. In all these approaches"profit maximization" is replaced by other assumptions.According to the concepts of "full optimality" or "boundedrationality" (see J.A. Roumasset, Rice and Risk, NorthHolland, 1976, p. 24, for a definition), one either assumesthe maximization of a von Neumann-Morgenstern type utilityfunction of income or the maximization of some objectivefunction (i.e. expected or minimum income) subject to a"safety-first" constraint. As was shown by Pyle andTurnovsky (Safety-First and Expected Utility Maximizationin Mean^-Standard Deviation Portfolio Analysis, The Reviewof Economics and Statistics, Vol. 52 (1970), No. 1, p. 75sqq.) and Levy and Markowitz (Approximating Expected Utilityby a Function of Mean and Variance, American Economic Review,Vol. 69 (1979), p. 308 sqq.), the Mean-Variance Approach(representing a special case of expected utility maximization)can be regarded as a helpful approximization to both sortsof approaches.
2P.B.R. Hazell and P.L. Scandizzo, "Competititve DemandStructures under Risk in Agricultural Linear ProgrammingModels", American Journal of Agricultural Economics,Vol. 56 (1974), No.2, p. 235 sqq.
Input costs are assumed to be constant in our analysis.
- 4 -
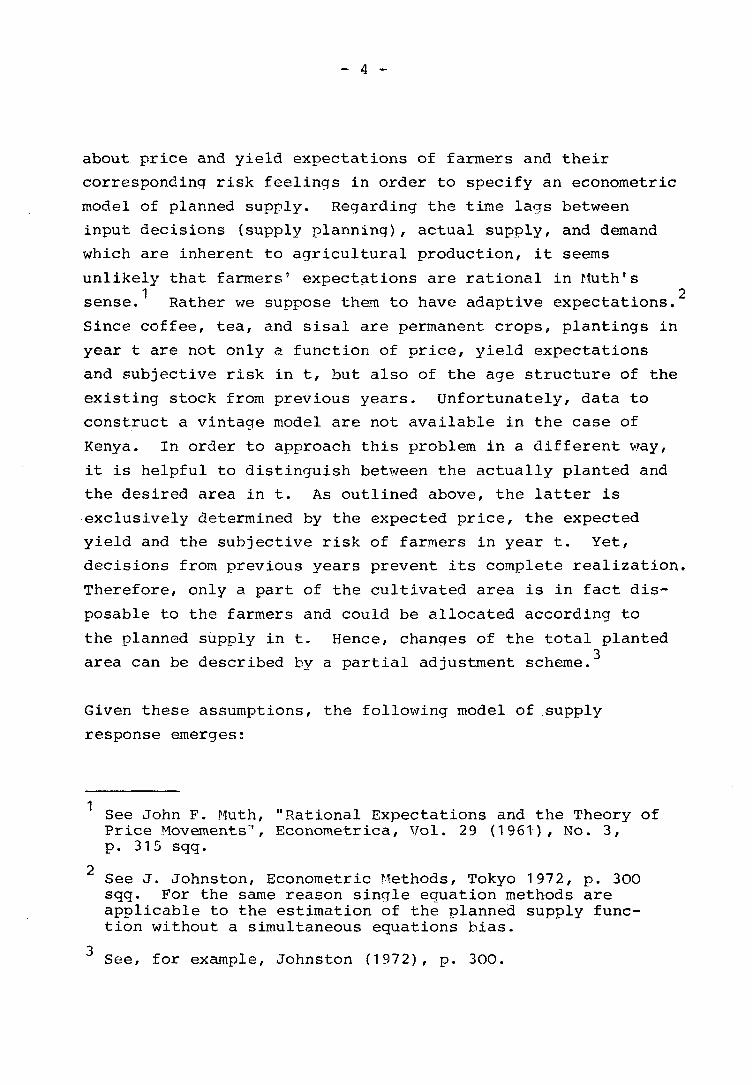
about price and yield expectations of farmers and their
corresponding risk feelings in order to specify an econometric
model of planned supply. Regarding the time lags between
input decisions (supply planning), actual supply, and demand
which are inherent to agricultural production, it seems
unlikely that farmers' expectations are rational in Muth's1 2
sense. Rather we suppose them to have adaptive expectations.
Since coffee, tea, and sisal are permanent crops, plantings in
year t are not only a function of price, yield expectations
and subjective risk in t, but also of the age structure of the
existing stock from previous years. Unfortunately, data to
construct a vintage model are not available in the case of
Kenya. In order to approach this problem in a different way,
it is helpful to distinguish between the actually planted and
the desired area in t. As outlined above, the latter is
exclusively determined by the expected price, the expected
yield and the subjective risk of farmers in year t. Yet,
decisions from previous years prevent its complete realization.
Therefore, only a part of the cultivated area is in fact dis-
posable to the farmers and could be allocated according to
the planned supply in t. Hence, changes of the total planted
area can be described by a partial adjustment scheme.
Given these assumptions, the following model of supply
response emerges:
See John F. Muth, "Rational Expectations and the Theory ofPrice Movements", Econometrica, Vol. 29 (1961), No. 3,p. 315 sqq.
2See J. Johnston, Econometric Methods, Tokyo 1972, p. 300sgg. For the same reason single equation methods areapplicable to the estimation of the planned supply func-tion without a simultaneous equations bias.
See, for example, Johnston (1972), p. 300.
- 5 -
(1)
(2) Yt = Yt_j + Y ( Y J - Yt_,) + ufc 0
00
k(3) X* = I aK (1-a) X 0 < a < 1* k=0 t k~'
00
V(X) = y b k (1-b) (X . . - X* , ) 2 0 < b < 1t k = Q t-k-1 t-k-1
with
Y = desired area
Y = planted area
X* = expected return per acre
X = realized return per acre
V(X) = subjective risk
u = stochastic disturbance term
t = time subscript
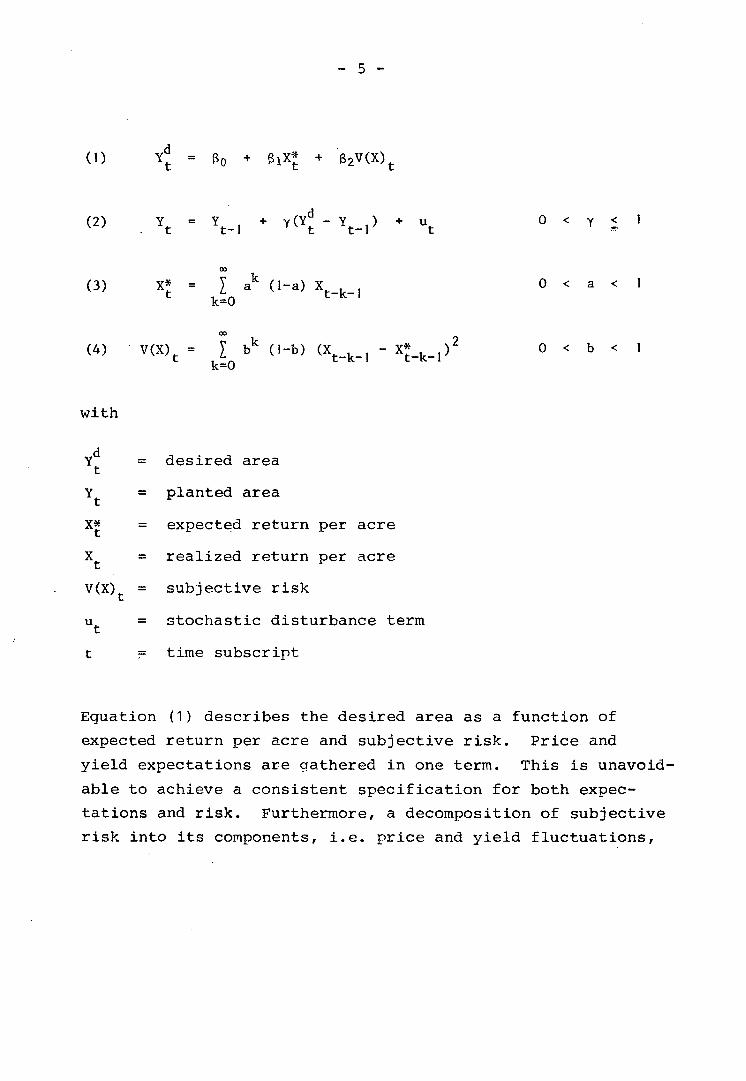
Equation (1) describes the desired area as a function of
expected return per acre and subjective risk. Price and
yield expectations are gathered in one terra. This is unavoid-
able to achieve a consistent specification for both expec-
tations and risk. Furthermore, a decomposition of subjective
risk into its components, i.e. price and yield fluctuations,
- 6 -
leads to a non-linear function, the estimation of which
poses serious problems. Equation (2) specifies the partial-
adjustment scheme for the area planted. According to the
concept of adaptive expectations, equation (3) describes
expected return per acre as a weighted moving average of
previous returns with geometrically declining weights. In
equation (4), the same adaptive expectation approach was2used with respect to risk.
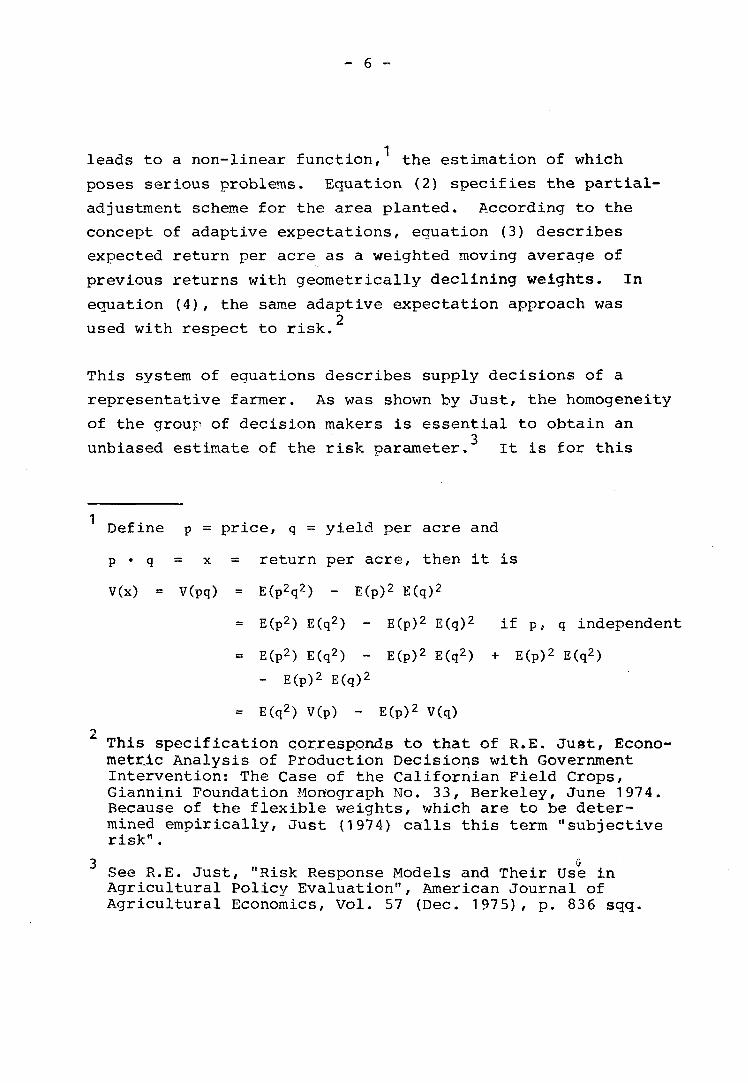
This system of equations describes supply decisions of a
representative farmer. As was shown by Just, the homogeneity
of the group of decision makers is essential to obtain an
unbiased estimate of the risk parameter. It is for this
Define p = price, q = yield per acre and
p • q = x = return per acre, then it is
V(x) = V(pq) = E(p2q2) - E(p)2 E(q)2
= E(p2) E(q2) - E(p)2 E(q)2 if p, q independent
= E(p2) E(q2) - E(p)2 E(q2) + E(p)2 E(q2)
- E(p)2 E(q)2
= E(q2) V(p) - E(p)2 V(q)
This specification corresponds to that of R.E. Just, Econo-metr.ic Analysis of Production Decisions with GovernmentIntervention: The Case of the Californian Field Crops,Giannini Foundation Monograph No. 33, Berkeley, June 1974.Because of the flexible weights, which are to be deter-mined empirically, Just (1974) calls this term "subjectiverisk".
oSee R.E. Just, "Risk Response Models and Their Use inAgricultural Policy Evaluation", American Journal ofAgricultural Economics, Vol. 57 (Dec. 1975), p. 836 sqq.
- 7 -
purpose that we have chosen the relatively homogeneous group
of large farms. Furthermore, our specification neglects the
possibility of product diversification as a means of risk
aversion. This can be justified, however, in the case of
the Kenyan large farm sector which predominantly consists
of plantations specializing in one product. Therefore, the
potential of diversification is small, and planned supply of
one product is assumed to be independent of the price,
yield, and risk performance of other products.
III. Estimation Technique
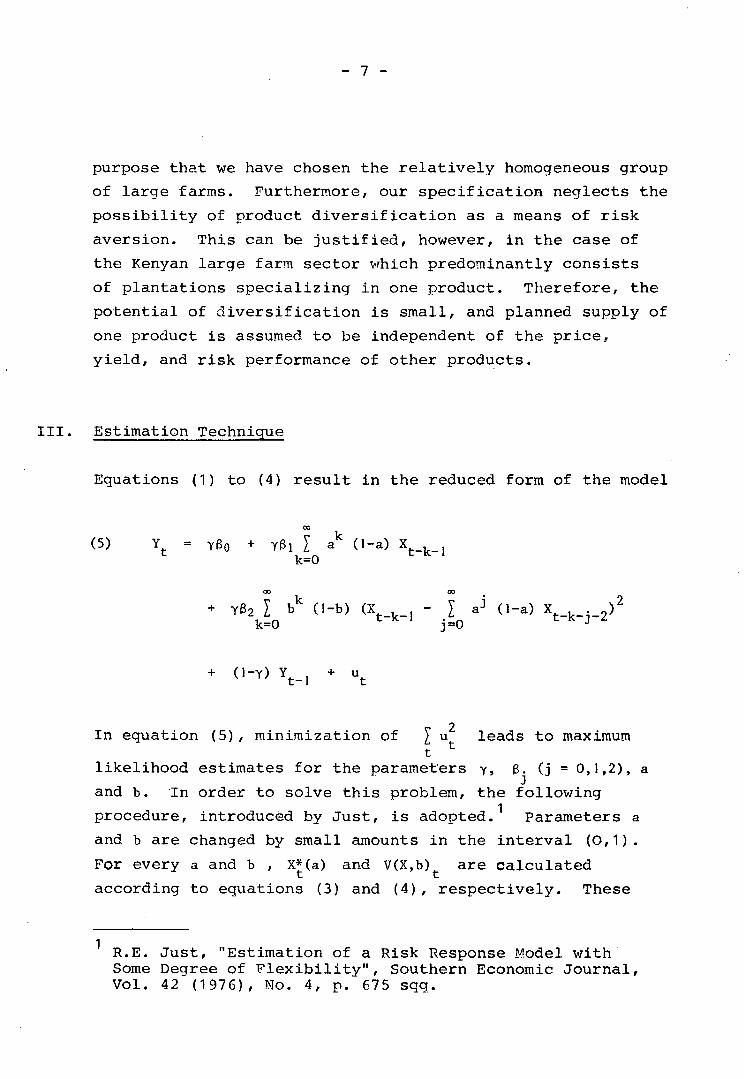
Equations (1) to (4) result in the reduced form of the model
(5) Yt = Y60 + Y6i I a (1-a) Xt_k_jk=0
Yg2J. bk (1-b) (X^., - I J d-a) X 2 )
2
k=0 i=0 J
In equation (5), minimization of \ u leads to maximum
likelihood estimates for the parameters y, g. (j =0,1,2), a
and b. In order to solve this problem, the following
procedure, introduced by Just, is adopted. Parameters a
and b are changed by small amounts in the interval (O,1).
For every a and b , X*(a) and V(X,b) are calculated
according to equations (3) and (4), respectively. These
R.E. Just, "Estimation of a Risk Response Model withSome Degree of Flexibility", Southern Economic Journal,Vol. 42 (1976), No. 4, p. 675 sqq.
- 8 -
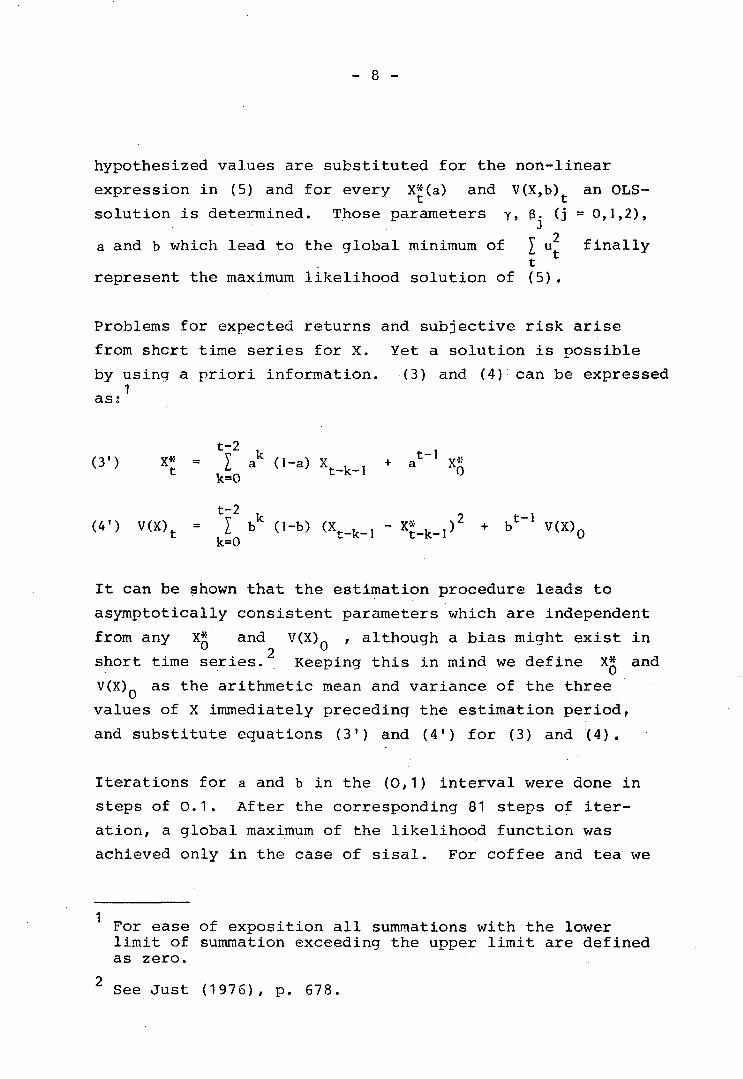
hypothesized values are substituted for the non-linear
expression in (5) and for every X*(a) and V(X,b) an OLS-
solution is determined. Those parameters y, g. (j =0,1,2),
a and b which lead to the global minimum of \ u finally
represent the maximum likelihood solution of (5).
Problems for expected returns and subjective risk arise
from short time series for X. Yet a solution is possible
(3) and (4) can be expressedby
as:
:3')
usina a1
X t
v(x)t
priori
fcY2 *= L a
k=0
t-2
k=0
information.
(1-a) Xt_k_j X*
V(X)Q
It can be shown that the estimation procedure leads to
asymptotically consistent parameters which are independent
from any X* and V(X) , although a bias might exist in
short time series. Keeping this in mind we define X* and
V(X) as the arithmetic mean and variance of the three
values of X immediately preceding the estimation period,
and substitute equations (3') and (49) for (3) and (4).
Iterations for a and b in the (0,1) interval were done in
steps of 0.1. After the corresponding 81 steps of iter-
ation, a global maximum of the likelihood function was
achieved only in the case of sisal. For coffee and tea we
For ease of exposition all summations with the lowerlimit of summation exceeding the upper limit are definedas zero.
2 See Just (1976), p. 678.
— Q —
obtained solutions at the limits of the iteration interval.
Therefore, for these products a new iteration procedure was
set up in the space determined by the first run with steps
of 0.01. After a further 81 steps of iteration an unequi-
vocal maximum of the likelihood function was obtained in
each case.
IV. Results
For coffee, tea, and sisal, the following hypotheses are
tested;
H1 : Planned supply is solely determined by expected
return per acre.
H2 : Planned supply is determined by both expected
return per acre and subjective risk.
H1 corresponds to the well-known TSFerlove model, i.e.
equation (5) is estimated under the restriction f?2 = ° •
This constraint is cancelled in H2, and the risk parameter
is determined unrestrictedly. According to the above
theoretical considerations, y is expected to be smaller
than 1, Bj to be positive, g2 t o ke negative, and H2 to be
superior to H1. Parameters a and b are defined in (0,1).
Values of a and b at the lower limit of the interval mean
that farmers' expectations are based mainly upon recent
experiences. If these values approach the upper limit of
See M. Nerlove, Distributed Lags and Estimation of Long-Run Supply and Demand Elasticities: Theoretical Con-siderations, Journal of Farm Economics, Vol. 40 (1958),pp. 301-311; and M. Nerlove and W. A.ddison, StatisticalEstimation of Long-Run Elasticities of Supply and Demand,Journal of Farm Economics, Vol. 40 (1958), pp. 861-880.
- 10 -
the interval, on the other hand, expectations are based to
a large extent on experiences in the past.
Since, in the period 1964-1972, new coffee plantings were
banned under the International Coffee Agreement, we addi-
tionally tested:
H3 : Planned coffee supply is held constant during the
time of the planting restriction.
In order to test H3, the lagged endogeneous variable (Y ,)t-i
is multiplied with a dummy which takes 1 in the period
1964-1972, and 0 in the other years. If the ban on new
plantings had been effective, the coefficients of the dummy
and of the lagged endogeneous variable should add up to
unity. This would imply that y was 0 during the phase of
restriction.
Data on acreage, output, and producer prices for 1951 to
21975 were taken from official sources. Prices were
deflated by the Kenyan consumer price index (1970 = 100).
Returns per acre were calculated, and estimation was
carried out for the period 19 55 to 1975.
Republic of Kenya, Annual Statistical Abstract, Nairobi,various issues.
2International Monetary Fund, International FinancialStatistics, Annual Supplement, Vol. 29, Washington, D.G.,1976.
Observations from 1951 to 1953 served as a priori infor-mation, the observations in 1954 were dropped due to thelagged endogenous variable.
- 11 -
Regression results for coffee are shown in Table 1. 81 in
H1 and H2, and 32 in H2 show the expected sign and are
significant at least at the 10 per cent level, so that H2
cannot be rejected. In other words, subjective risk in
fact reduces the planned supply of Kenyan coffee. Since
the dummy variable shows the wrong sign and is insignifi-
cant we reject K3. Obviously, the Kenyan Government was
not successful in enforcing the ban on new coffee plantings.
As the parameter a nearly reaches the value of 1, return
expectations per acre are formed over a long time horizon,
whilst subjective risk is influenced by more recent events,
as is indicated by the relatively low values of b.
Regression results for tea are presented in Table 2. They
are subject to collinearity between expected returns and
the lagged endogenous variable. Calculations excluding
Y show, however, that the order of magnitude of the
estimated cofficients is likely to be correct, while their
standard deviation may be overestimated, and hence t-values
tend to be too low. As in the case of coffee, the expected
return per acre and subjective risk parameters show the
expected signs and are statistically significant. Again H2
cannot be rejected, i.e. the planned supply of tea is
influenced by risk aversion. The expectations about returns
per acre are determined by a long period of observations,
while subjective risk is based on more recent experiences.
In the case of sisal (see Table 3), the influence of risk
on planned supply is confirmed again. In contrast to
coffee and tea, the value of a in H2 is rather low
The Durbin-Watson coefficients are biased due to thelagged endogenous variable, thus providing only a littleinformation. The small sample design does not allow forthe application of other tests (Durbin's h-test, forexample), therefore the serial correlation of the errorterm remains unknown. This also holds for sisal and tea.
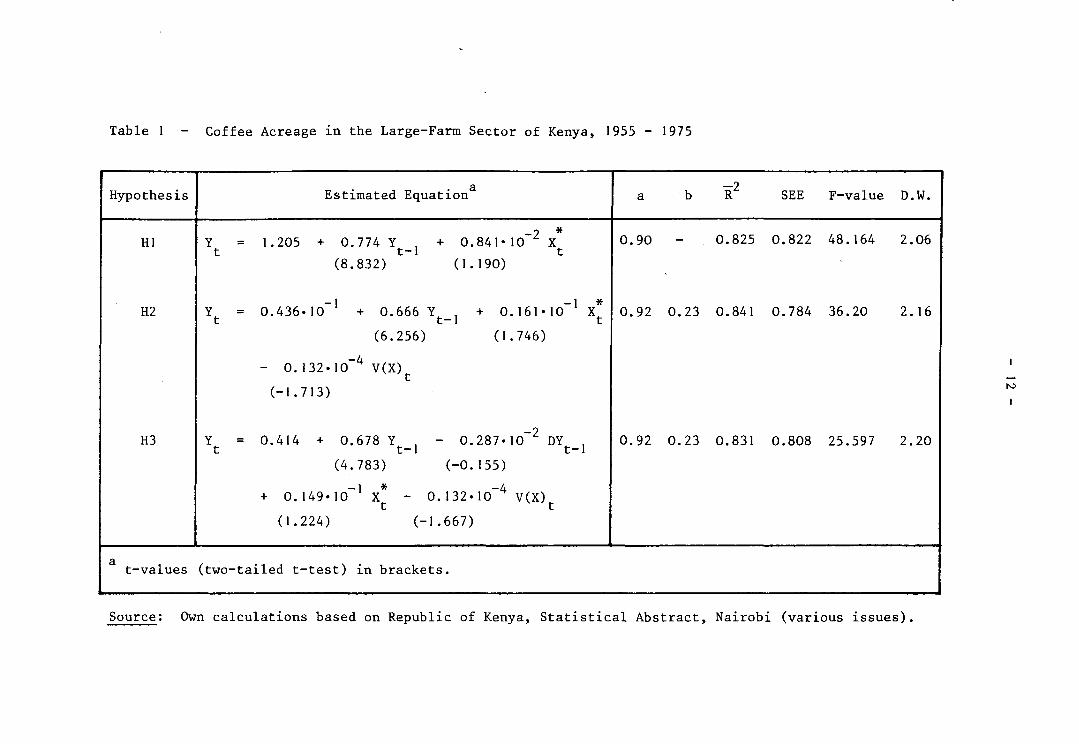
Table 1 - Coffee Acreage in the Large-Farm Sector of Kenya, 1955 - 1975
Hypothesis
HI
H2
H3
t-values
Yt
= 1
Y = 0.
Y
<
= 0.
+
Estimated Equation
205 + 0.774 Y + 0.841-
(8.832) (1.190)
436-10"1 + 0.666 Y + 0
(6.256) (1
0.132-10~4 V(X)
414 + 0.678 Y - 0.287-
(4.783) (-0.155)
0.149-1O"1 X* - 0.132-10~4
(1.224) (-1.667)
(two-tailed t-test) in brackets.
10"2
-161-
.746)
lo"2
V(X)
*X
-1 *10 X
DYt-l
t
0.
0.
0.
a
90
92
92
b
-
0.23
0.23
R2
0.825
0.841
0.831
0
0
0
SEE
.822
.784
.808
F-value
48
36
25
164
20
597
D.
2.
2.
2.
W.
06
16
20
Source: Own calculations based on Republic of Kenya, Statistical Abstract, Nairobi (various issues).
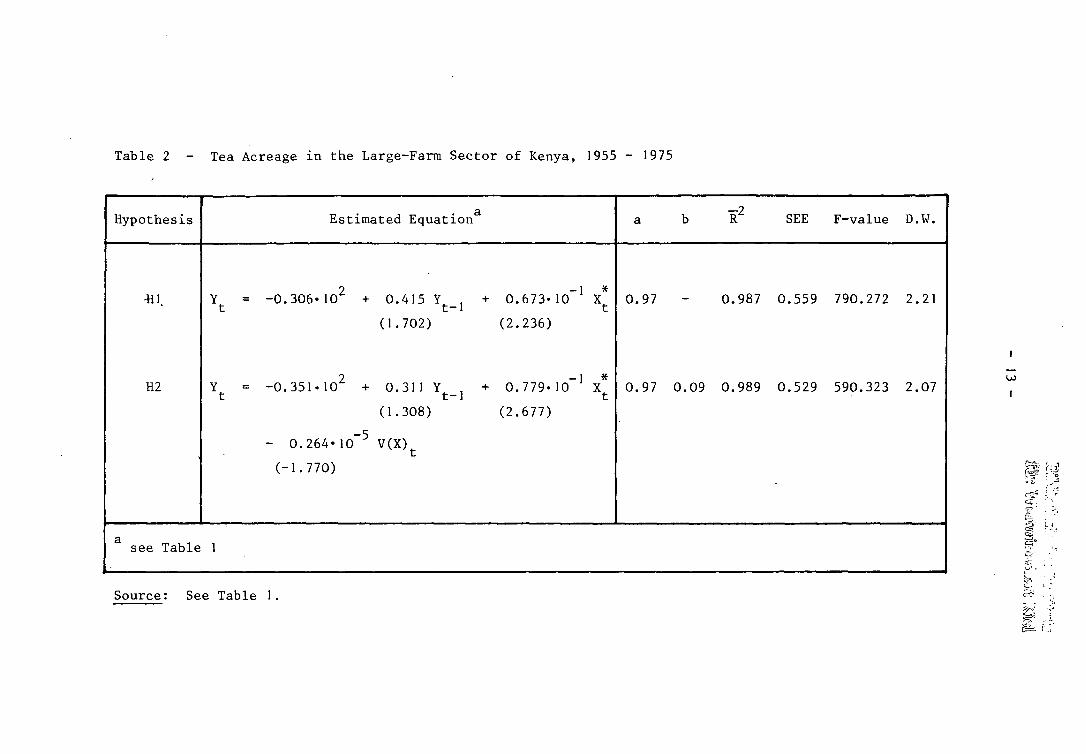
Table 2 - Tea Acreage in the Large-Farm Sector of Kenya, 1955 - 1975
Hypothesis
-HI.
H2
see Table
Yr
Y
1
Estimated
= -0.306*102 +
= -0.3!
- 0
(-1
5N1O2 +
264-10~5
770)
0.
(1.
0.
(1.
V(X
Equation
4 1 5 Yt-l H
702)
311 Yt_, <
308)
- 0.
(2.
- 0.
•CM
673-
236)
779*
677)
10
10
"' X*
-1 *
a
0.
0.
97
97
b R2
0.987
0.09 0.989
0
0
SEE
.559
.529
F-value
790.
590.
272
323
D
2
csi
.w.
.21
.07
w
I
Source: See Table 1.
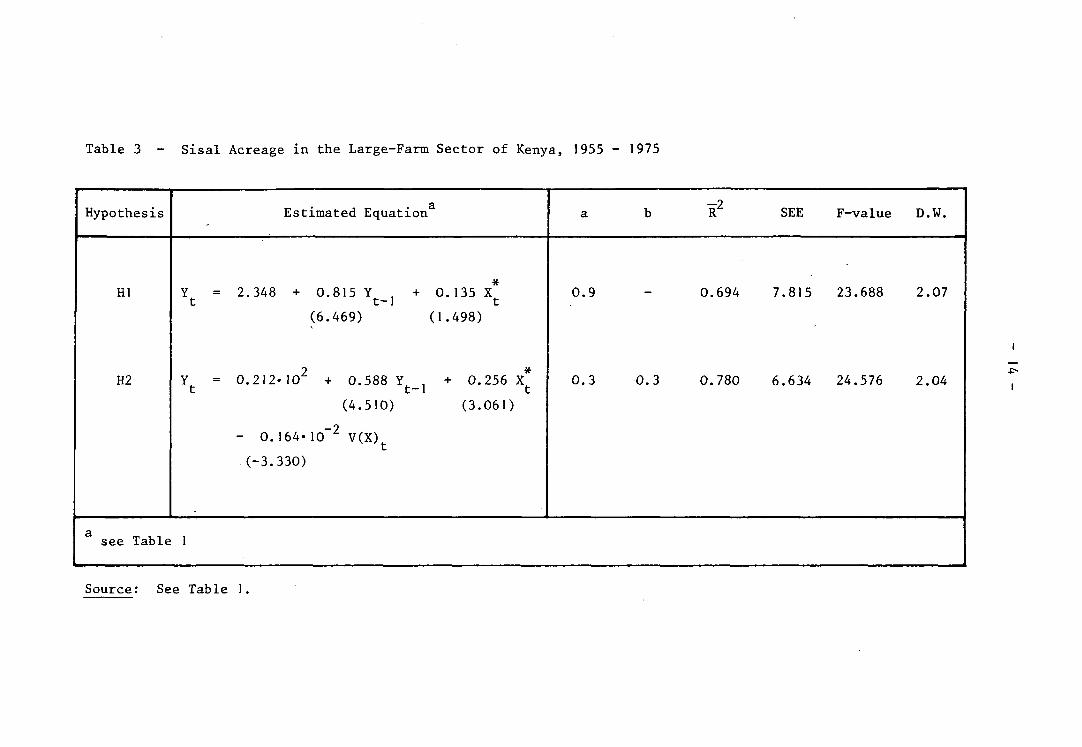
Table 3 - Sisal Acreage in the Large-Farm Sector of Kenya, 1955 - 1975
Hypothesis
HI
H2
asee Table
Y
Y -
1
2.348
0.212
- 0.
(-3.
Estimated Equation
+ 0.815 Y +
(6.469)
•102 + 0.588 Y
(4.510)
164*10"2 V(X)
330)
a
0.
(1.
+
135
498)
0.
(3.
*Xt
*256 X
061)
0
0
a b
.9
.3 0.3
R2
0.694
0.780
7
6
SEE
.815
.634
F-value
23
24
.688
576
D.
2.
2.
W.
07
04
Source: See Table 1
- 15
indicating that sisal producers' expectations are governed
by a relatively short time horizon. This, however, is not
the only difference in the behaviour of coffee and tea
producers on the one hand and sisal growers on the other.
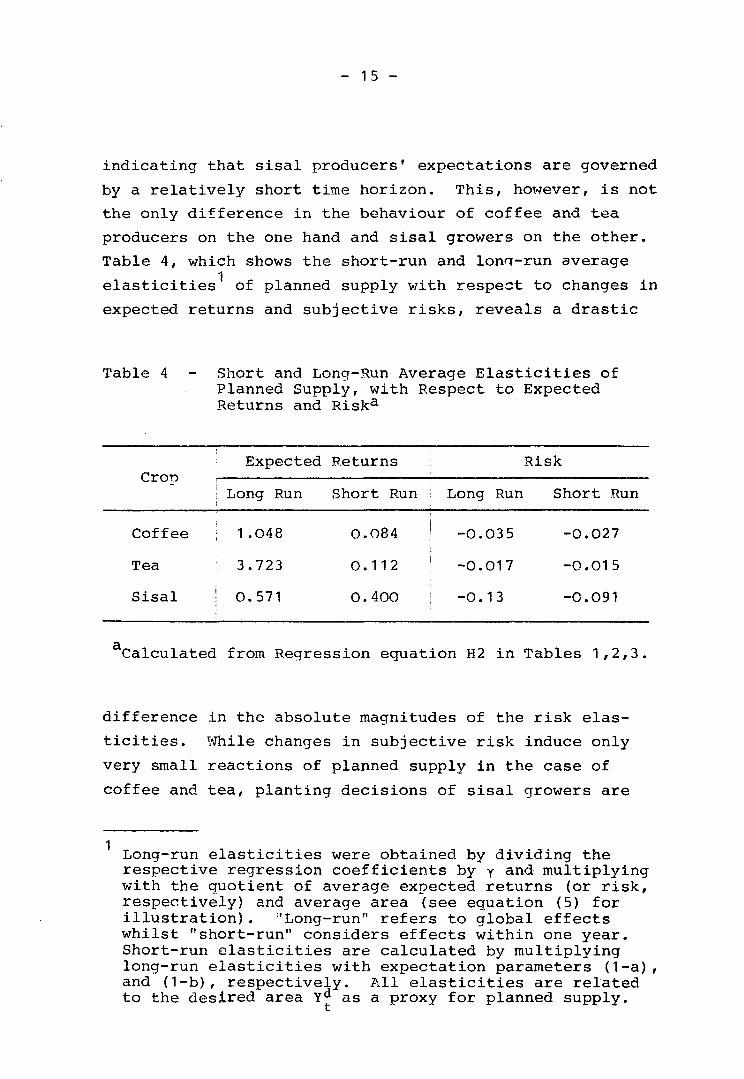
Table 4, which shows the short-run and lona-run average
elasticities of planned supply with respect to changes in
expected returns and subjective risks, reveals a drastic
Table 4 Short and Long-Run Average Elasticities ofPlanned Supply, with Respect to ExpectedReturns and Riska
CropExpected Returns Risk
Long Run Short Run > Long Run Short Run
Coffee
Tea
Sisal
1 .
3.
0.
048
723
571
0
0
0
.084
.112
.400
! -0
! -o
i ~ °
.035
.017
.13
-0
-0
-0
.027
.015
.091
Calculated from Regression equation H2 in Tables 1,2,3
difference in the absolute magnitudes of the risk elas-
ticities. While changes in subjective risk induce only
very small reactions of planned supply in the case of
coffee and tea, planting decisions of sisal growers are
Long-run elasticities were obtained by dividing therespective regression coefficients by y and multiplyingwith the quotient of average expected returns (or risk,respectively) and average area (see equation (5) forillustration). "Long-run" refers to global effectswhilst "short-run" considers effects within one year.Short-run elasticities are calculated by multiplyinglong-run elasticities with expectation parameters (1-a),and (1-b), respectively. All elasticities are relatedto the desired area Yd as a proxy for planned supply.
- 16 -
influenced by risk -to a considerable degree. Furthermore,
coffee and tea producers seem to respond to changed return
expectations mainly in the long run; sisal growers, however,
react mainly in the short run, as is indicated by the only
slightly differing long-run and short-run average supply
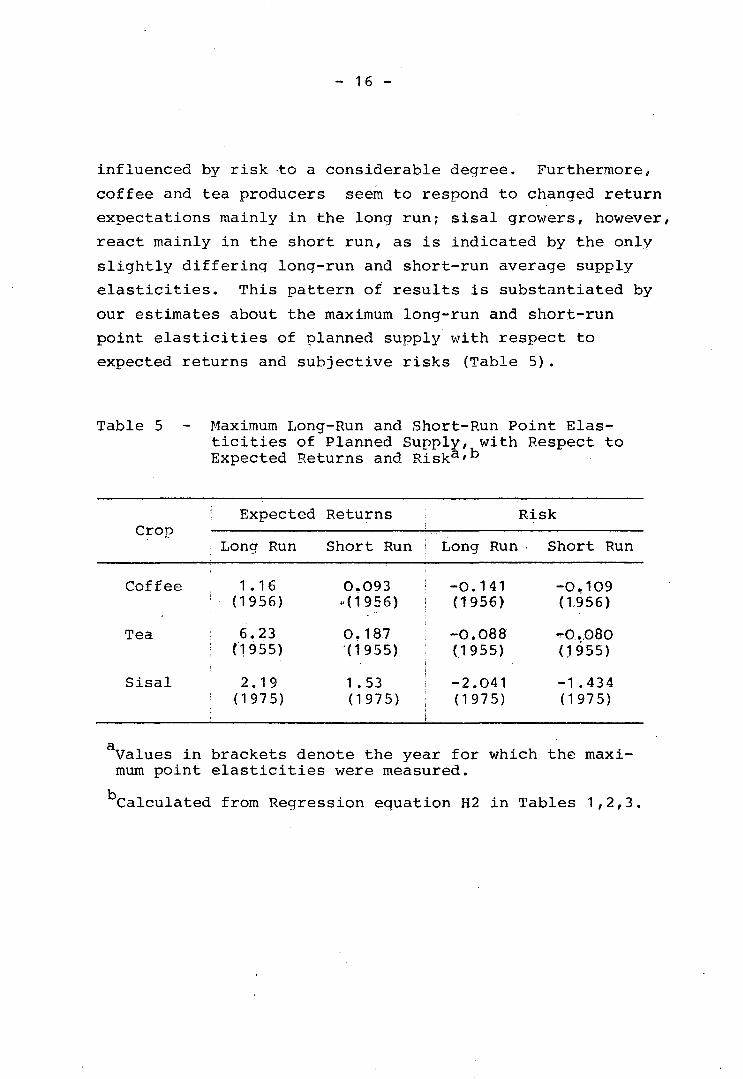
elasticities. This pattern of results is substantiated by
our estimates about the maximum long-run and short-run
point elasticities of planned supply with respect to
expected returns and subjective risks (Table 5)•
Table 5 - Maximum Long-Run and Short-Run Point Elas-ticities of Planned Supply, with Respect toExpected Returns and Risk3'"
Crop
Coffee
Tea
Sisal
j Expected
Long Run
1 .161 (1956)
6.23; (1955)
2.19! (1975)
Returns
Short Run
0.093-(1956)
0.187(1955)
1 .53(1975)
Long Run
-0.141(1956)
-0.088(1955)
-2.041(1975)
Risk
Short Run
-0.109(1956)
-rO.080(1955)
-1.434(1975)
Values in brackets denote the year for which the maxi-mum point elasticities were measured.
Calculated from Regression equation H2 in Tables 1,2,3,
- 17 -
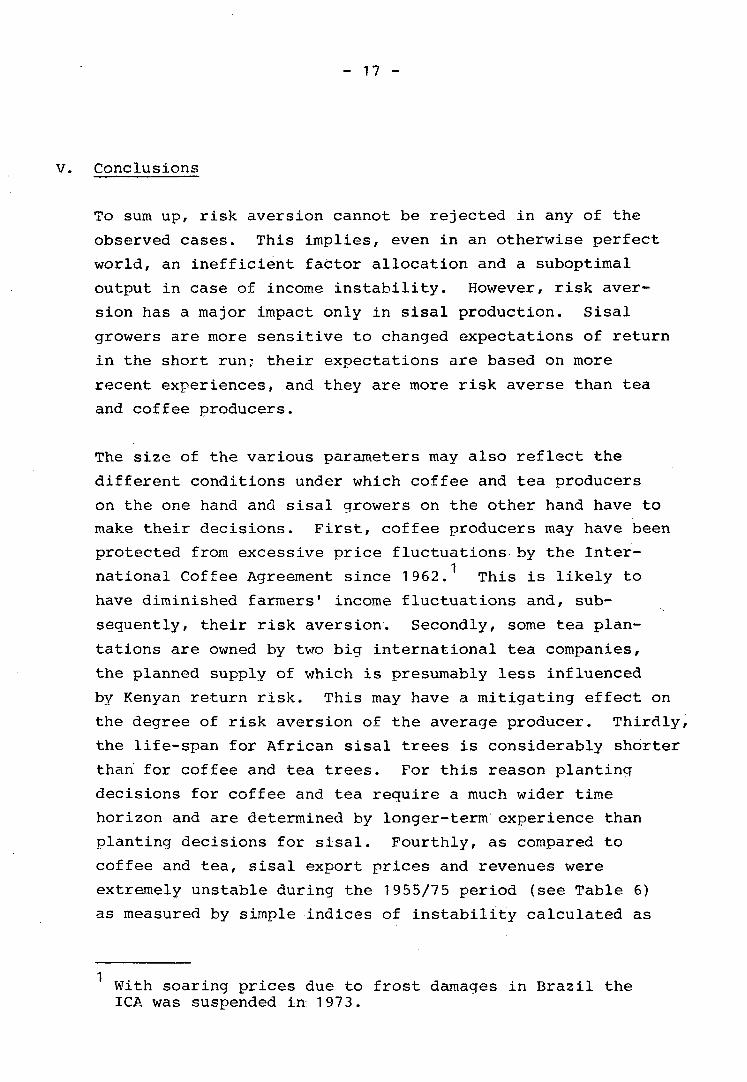
V. Conclusions
To sum up, risk aversion cannot be rejected in any of the
observed cases. This implies, even in an otherwise perfect
world, an inefficient factor allocation and a suboptimal
output in case of income instability. However, risk aver-
sion has a major impact only in sisal production. Sisal
growers are more sensitive to changed expectations of return
in the short run; their expectations are based on more
recent experiences, and they are more risk averse than tea
and coffee producers.
The size of the various parameters may also reflect the
different conditions under which coffee and tea producers
on the one hand and sisal growers on the other hand have to
make their decisions. First, coffee producers may have been
protected from excessive price fluctuations by the Inter-
national Coffee Agreement since 1962. This is likely to
have diminished farmers' income fluctuations and, sub-
sequently, their risk aversion. Secondly, some tea plan-
tations are owned by two big international tea companies,
the planned supply of which is presumably less influenced
by Kenyan return risk. This may have a mitigating effect on
the degree of risk aversion of the average producer. Thirdly,
the life-span for African sisal trees is considerably shorter
than for coffee and tea trees. For this reason planting
decisions for coffee and tea require a much wider time
horizon and are determined by longer-term experience than
planting decisions for sisal. Fourthly, as compared to
coffee and tea, sisal export prices and revenues were
extremely unstable during the 1955/75 period (see Table 6)
as measured by simple indices of instability calculated as
With soaring prices due to frost damages in Brazil theICA was suspended in 1973.
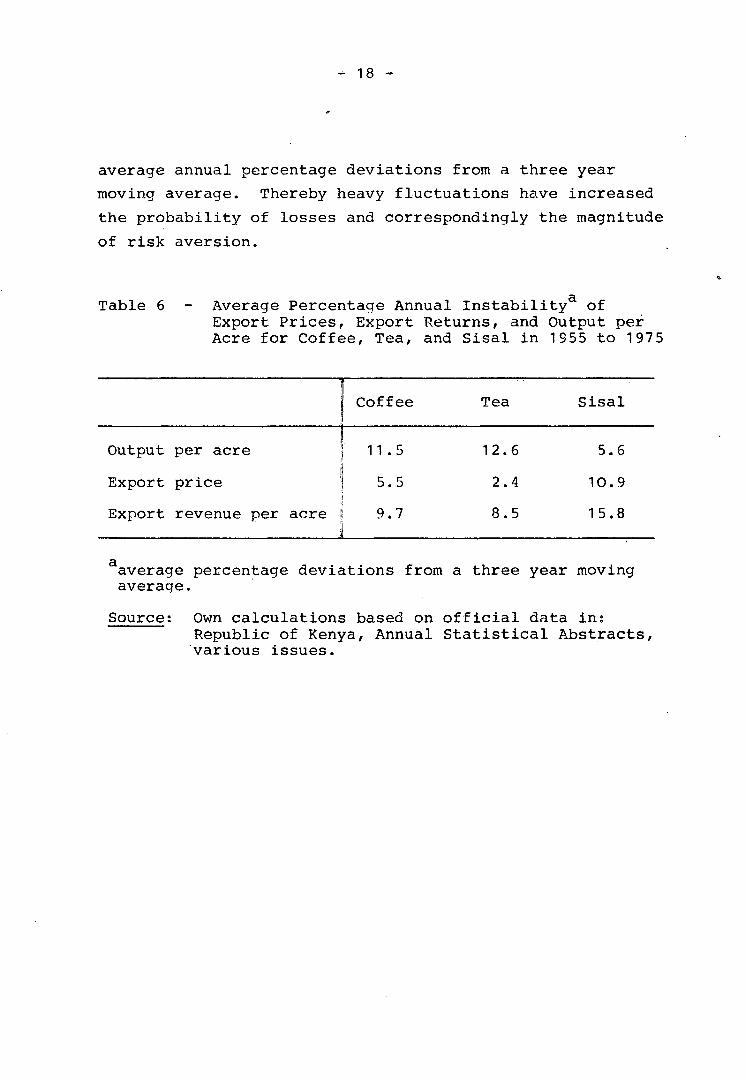
- 18 -
average annual percentage deviations from a three year
moving average. Thereby heavy fluctuations have increased
the probability of losses and correspondingly the magnitude
of risk aversion.
Table 6 - Average Percentage Annual Instability ofExport Prices, Export Returns, and Output perAcre for Coffee, Tea, and Sisal in 1955 to 1975
Output
Export
Export
Iper acre
iprice
revenue per acre 'i
Coffee
11 .
5.
9.
5
5
7
Tea
12.
2.
8.
6
4
5
Sisal
5
10
15
6
9
.8
average percentage deviations from a three year movingaverage.
Source; Own calculations based on official data in;Republic of Kenya, Annual Statistical Abstracts,various issues.
- 19 -
R e f e r e n c e s
HAZELL, P.B.R. and SCANDIZZO, P.L., "Competitive DemandStructures under Risk in Agricultural LinearProgramming Models". American Journal of Agricul-tural Economics, Vol. 56 (1974), No. 2, p. 235 sqg,
HEYER, J., MAITHA, J.K. and SENGA, W.M. (eds.), AgriculturalDevelopment in Kenya - An Economic Assessment.Nairobi, 1976.
IMF (International Monetary Fund), International FinancialStatistics, Annual Supplement, Vol. 29 (1976),Washington, D.C.
JOHNSTON, J., Econometric Methods. Tokyo, 1972.
JUST, R.E., "Econometric Analysis of Production Decisionswith Government Intervention: The Case of theCalifornian Field Crops". Giannini FoundationMonograph, No. 33, Berkeley, June 1974.
, "Risk Response Models and Their Use in Agricul-tural Policy Evaluation". American Journal ofAgricultural Economics, Vol. 57 (Dec. 1975),p. 836 sqq.
, "Estimation of a Risk Response Model with SomeDegree of Flexibility". Southern Economic Journal,Vol. 42 (1976), No. 4, p. 675 sqq.
LEVY, H. and MARKOWITZ, H.M., "Approximating ExpectedUtility by a Function of Mean and Variance".American Economic Review, Vol. 69 (June, 1979),p. 308 sqq.
LIM, D., "Export Instability and Economic Growth: A Returnto Fundamentals". Oxford Bulletin of Economicsand Statistics, Vol. 38 (1976), p. 311 sqq.
- 20 -
MUTH, J.F., "Rational Expectations and the Theory of PriceMovements". Econometrica, Vol. 29 (1961), No. 3,p. 315 sqq.
NEPLOVE, M., "Distributed Lags and Estimation of Long-RunSupply and Demand Elasticities: Theoretical Con-siderations". Journal of Farm Economics, Vol. 40(1958), p. 301 sqq.
and ADDISON, W., "Statistical Estimation of Long-Run Elasticities of Supply and Demand". Journalof Farm Economics, Vol. 40 (1958), p. 861 sqq.
PYLE, D.H. and TURNOVSKY, S.J., "Safety-First and ExpectedUtility Maximization in Mean-Standard DeviationPortfolio Analysis". The Review of Economics andStatistics, Vol. 52 (1970), No. 1, p. 75 sqq.
REPUBLIC OF KENYA, Annual Statistical Abstract. Nairobi,various issues.
ROUMASSET, I.A., Rice and Risk. North Holland, 1976.
STEIN, L., "Export Instability and Development. A Reviewof Some Recent Findings". Banca Nazionale delLavoro, No. 122 (1977), p. 279 sqq.