Embed Size (px)
Citation preview
BU
ND
ES
INS
TIT
UT
FÜ
R R
ISIK
OB
EW
ER
TU
NG
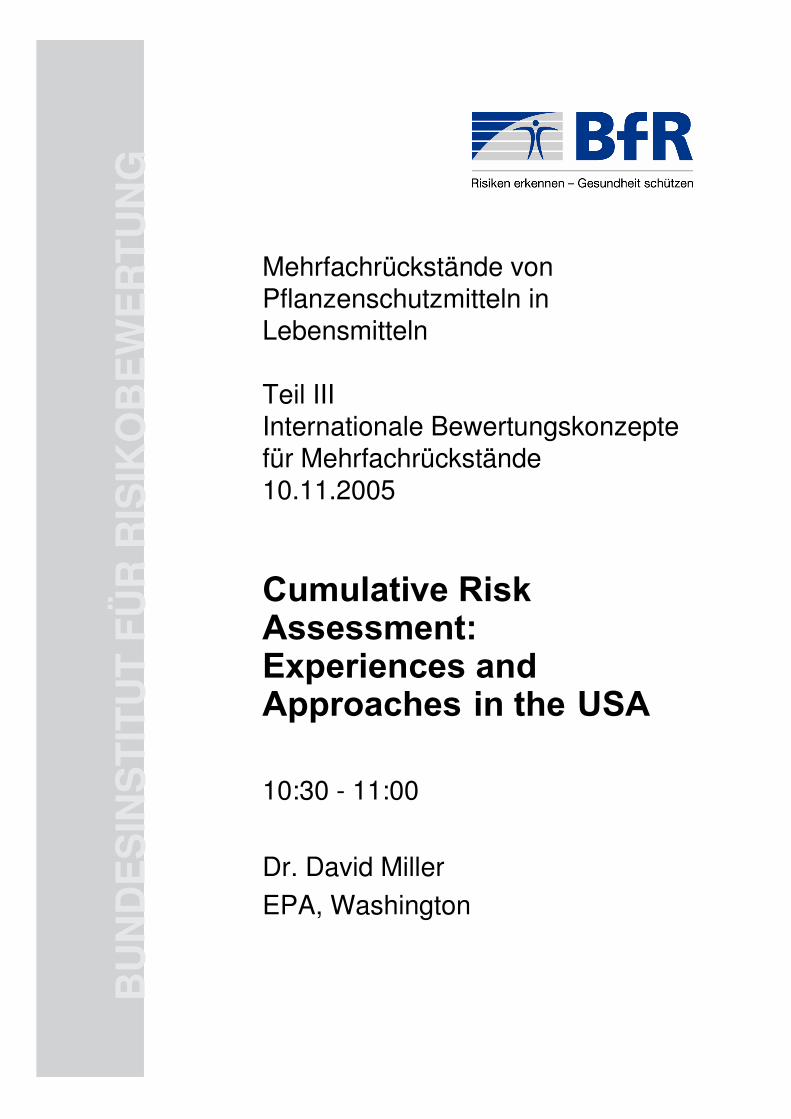
Mehrfachrückstände von Pflanzenschutzmitteln in Lebensmitteln
Teil IIIInternationale Bewertungskonzepte für Mehrfachrückstände 10.11.2005
10:30 - 11:00
Dr. David Miller
EPA, Washington
Cumulative Risk Assessment: Experiences and Approaches in the USA
Cumulative Risk Assessment:Experiences and Approaches in the
USA
David J. MillerU.S. Environmental Protection Agency
Office of Pesticide Programs
Presented to:
2nd BfR Forum For Consumer Protection
“Multiple Residues in Foods”November 9-10, 2005Berlin, GERMANY
Slide 1 of 45
Slide 2 of 45
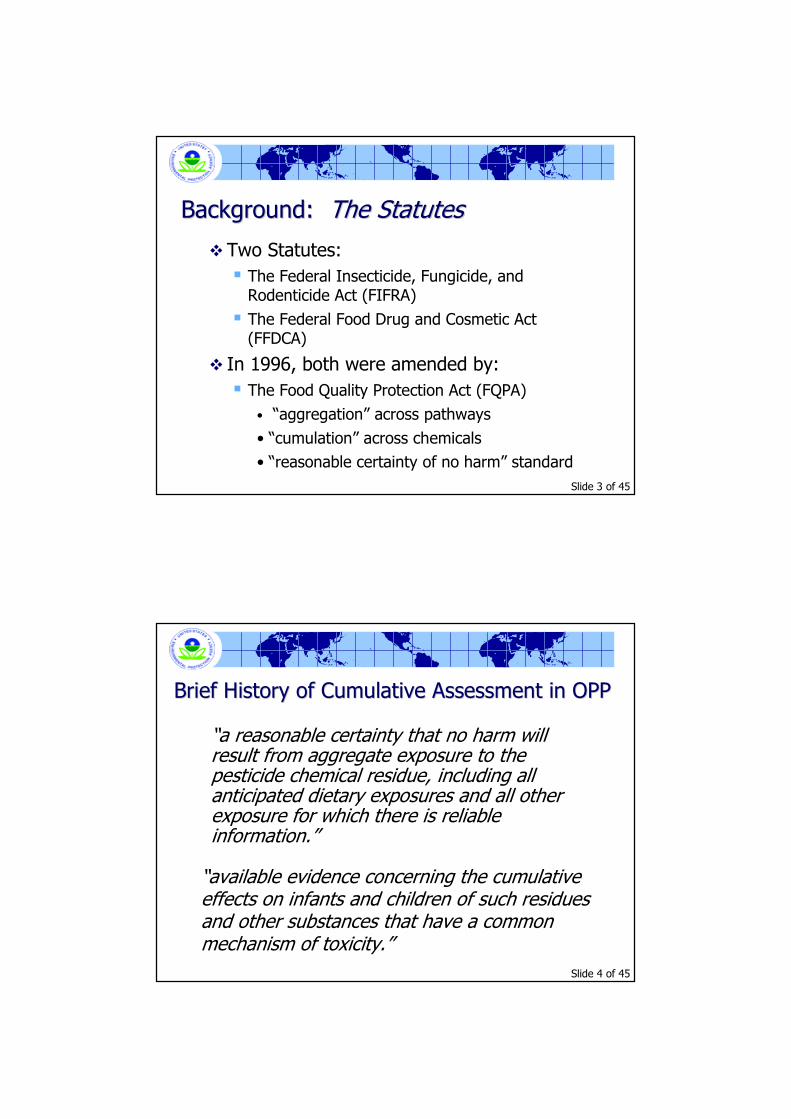
Overview of PresentationOverview of Presentation� History/General Background of CRA in U.S.
� Steps in Cumulative Risk Assessment
� Key Data inputs into CRA
� Consumption
� Residue
� Relative Potency Factors
� Overall Experiences/Lessons Learned
� Future Directions
� Information Sources
Slide 3 of 45
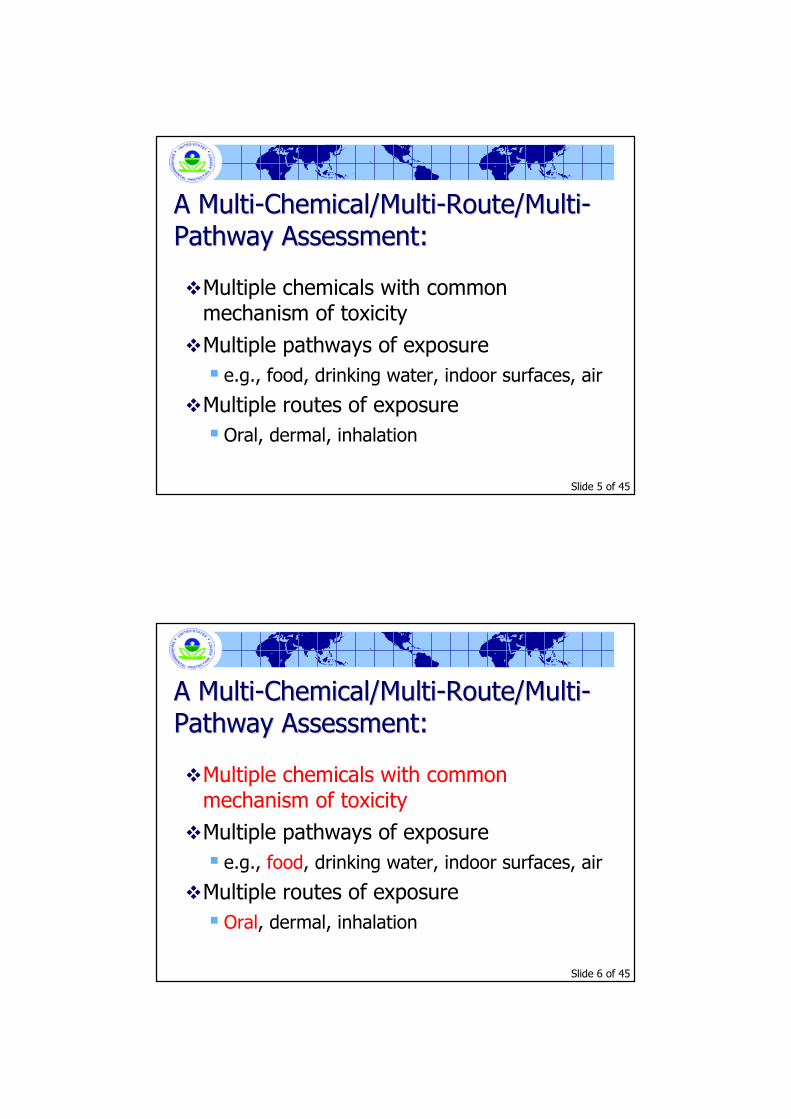
Background: Background: The StatutesThe Statutes
�Two Statutes:
� The Federal Insecticide, Fungicide, and Rodenticide Act (FIFRA)
� The Federal Food Drug and Cosmetic Act (FFDCA)
� In 1996, both were amended by:
� The Food Quality Protection Act (FQPA)
• “aggregation” across pathways
• “cumulation” across chemicals
• “reasonable certainty of no harm” standard
Slide 4 of 45
Brief History of Cumulative Assessment in OPPBrief History of Cumulative Assessment in OPP
“a reasonable certainty that no harm will result from aggregate exposure to the pesticide chemical residue, including all anticipated dietary exposures and all other exposure for which there is reliable information.”
“available evidence concerning the cumulative effects on infants and children of such residues and other substances that have a common mechanism of toxicity.”
Slide 5 of 45
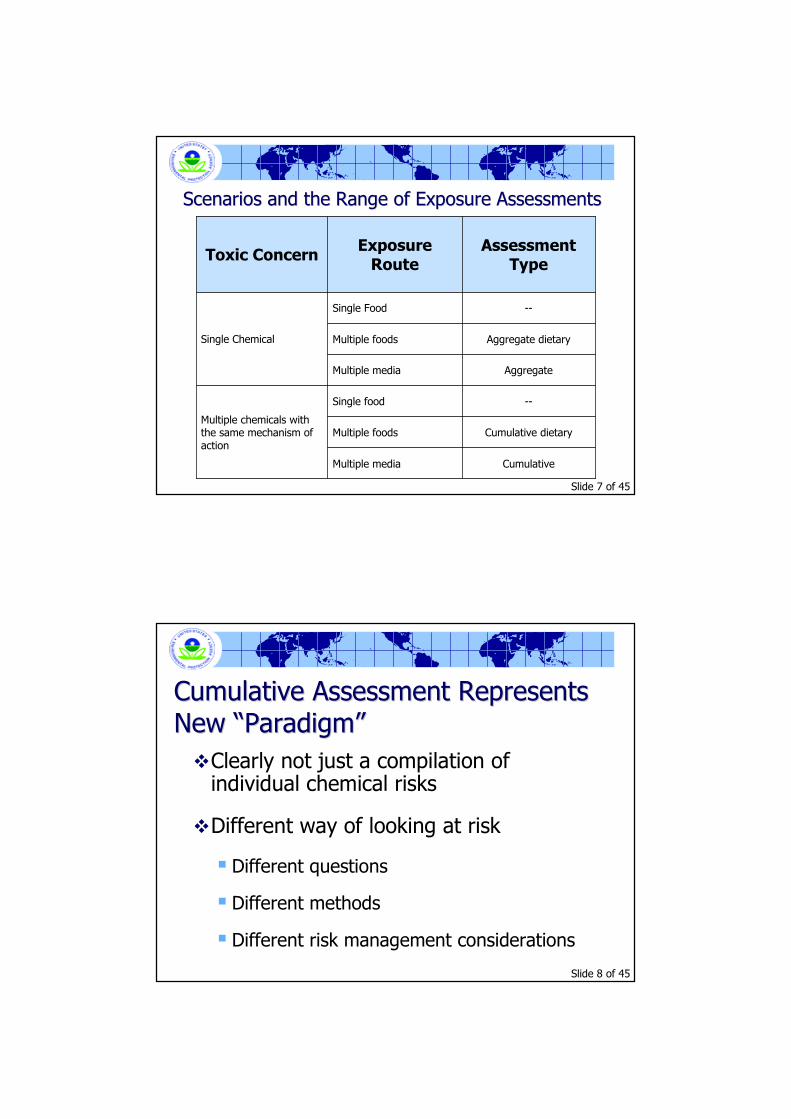
A MultiA Multi--Chemical/MultiChemical/Multi--Route/MultiRoute/Multi--
Pathway Assessment:Pathway Assessment:
�Multiple chemicals with common mechanism of toxicity
�Multiple pathways of exposure
� e.g., food, drinking water, indoor surfaces, air
�Multiple routes of exposure
� Oral, dermal, inhalation
Slide 6 of 45
A MultiA Multi--Chemical/MultiChemical/Multi--Route/MultiRoute/Multi--
Pathway Assessment:Pathway Assessment:
�Multiple chemicals with common mechanism of toxicity
�Multiple pathways of exposure
� e.g., food, drinking water, indoor surfaces, air
�Multiple routes of exposure
� Oral, dermal, inhalation
Slide 7 of 45
Scenarios and the Range of Exposure AssessmentsScenarios and the Range of Exposure Assessments
--Single food
Aggregate dietaryMultiple foods
Cumulative dietaryMultiple foods
--Single Food
CumulativeMultiple media
Multiple chemicals with the same mechanism of action
AggregateMultiple media
Single Chemical
Assessment Type
Exposure Route
Toxic Concern
Slide 8 of 45
Cumulative Assessment Represents Cumulative Assessment Represents
New “Paradigm”New “Paradigm”
�Clearly not just a compilation of individual chemical risks
�Different way of looking at risk
� Different questions
� Different methods
� Different risk management considerations
Slide 9 of 45
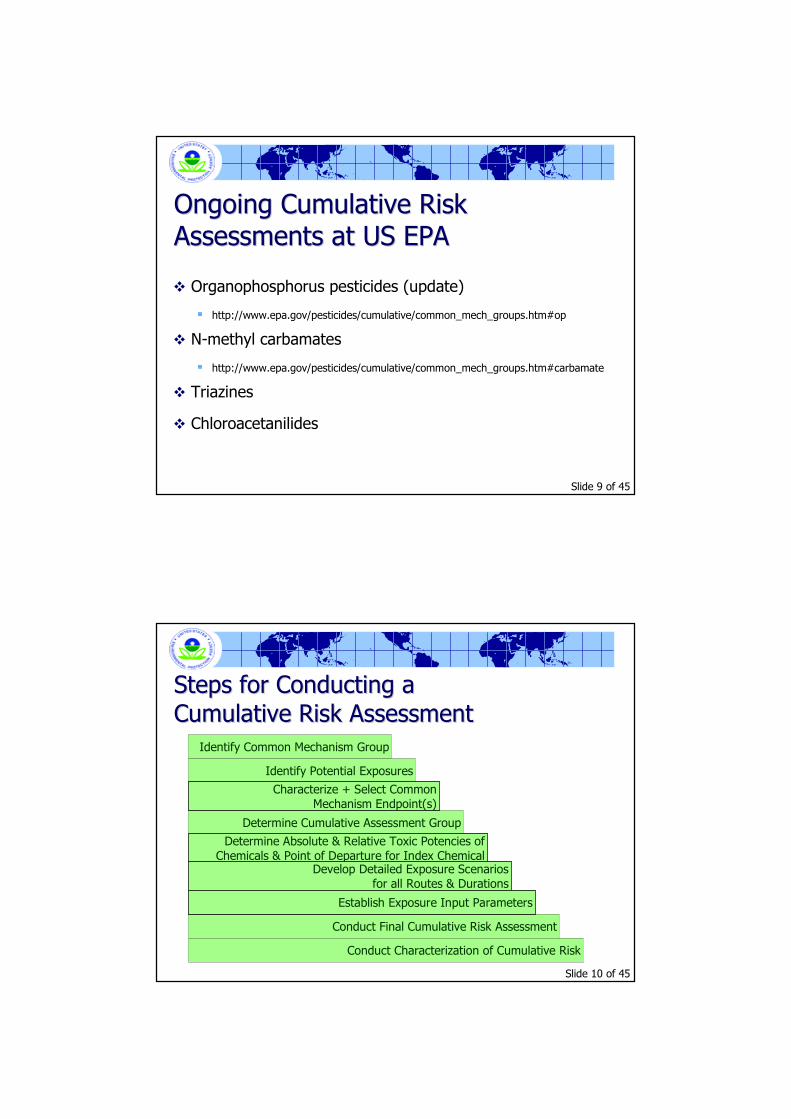
Ongoing Cumulative Risk Ongoing Cumulative Risk
Assessments at US EPAAssessments at US EPA
� Organophosphorus pesticides (update)
� http://www.epa.gov/pesticides/cumulative/common_mech_groups.htm#op
� N-methyl carbamates
� http://www.epa.gov/pesticides/cumulative/common_mech_groups.htm#carbamate
� Triazines
� Chloroacetanilides
Slide 10 of 45
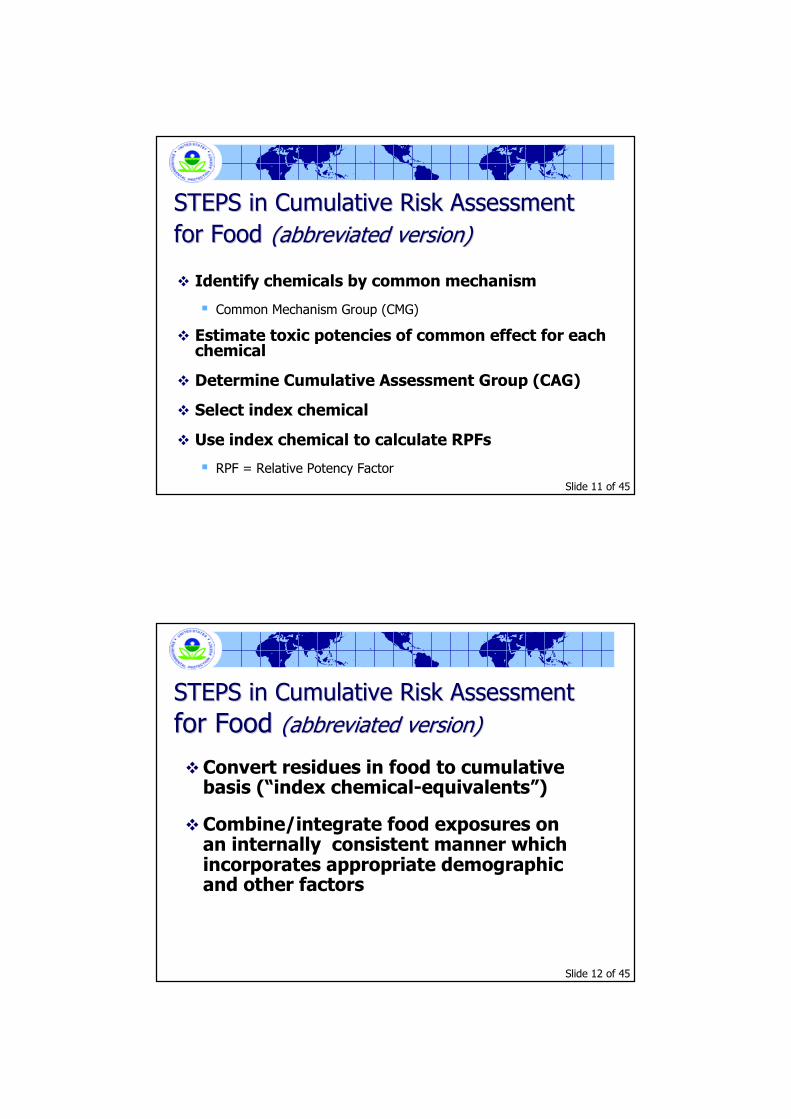
Steps for Conducting a Steps for Conducting a
Cumulative Risk AssessmentCumulative Risk Assessment
Identify Common Mechanism Group
Identify Potential Exposures
Determine Cumulative Assessment Group
Conduct Final Cumulative Risk Assessment
Conduct Characterization of Cumulative Risk
Characterize + Select Common
Mechanism Endpoint(s)
Determine Absolute & Relative Toxic Potencies of
Chemicals & Point of Departure for Index ChemicalDevelop Detailed Exposure Scenarios
for all Routes & Durations
Establish Exposure Input Parameters
Slide 11 of 45
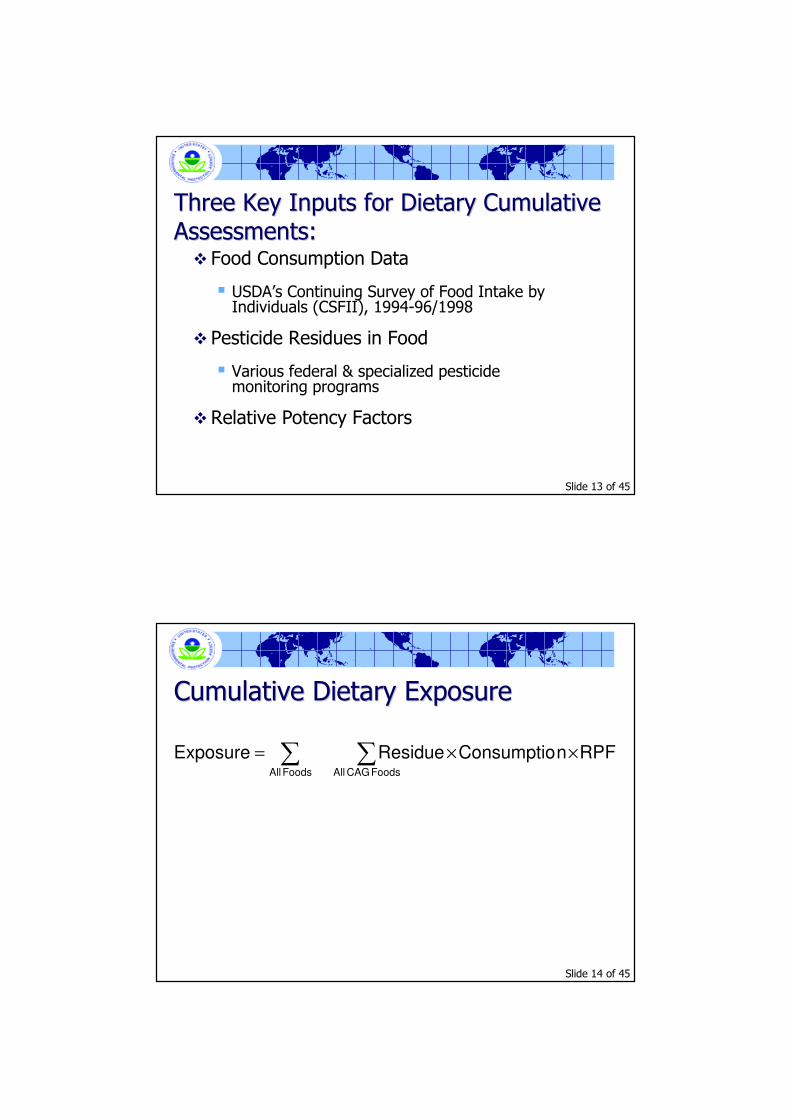
STEPS in Cumulative Risk Assessment STEPS in Cumulative Risk Assessment
for Foodfor Food (abbreviated version)(abbreviated version)
� Identify chemicals by common mechanism
� Common Mechanism Group (CMG)
� Estimate toxic potencies of common effect for each chemical
� Determine Cumulative Assessment Group (CAG)
� Select index chemical
� Use index chemical to calculate RPFs
� RPF = Relative Potency Factor
Slide 12 of 45
STEPS in Cumulative Risk AssessmentSTEPS in Cumulative Risk Assessment
for Food for Food (abbreviated version)(abbreviated version)
�Convert residues in food to cumulative basis (“index chemical-equivalents”)
�Combine/integrate food exposures on an internally consistent manner which incorporates appropriate demographic and other factors
Slide 13 of 45
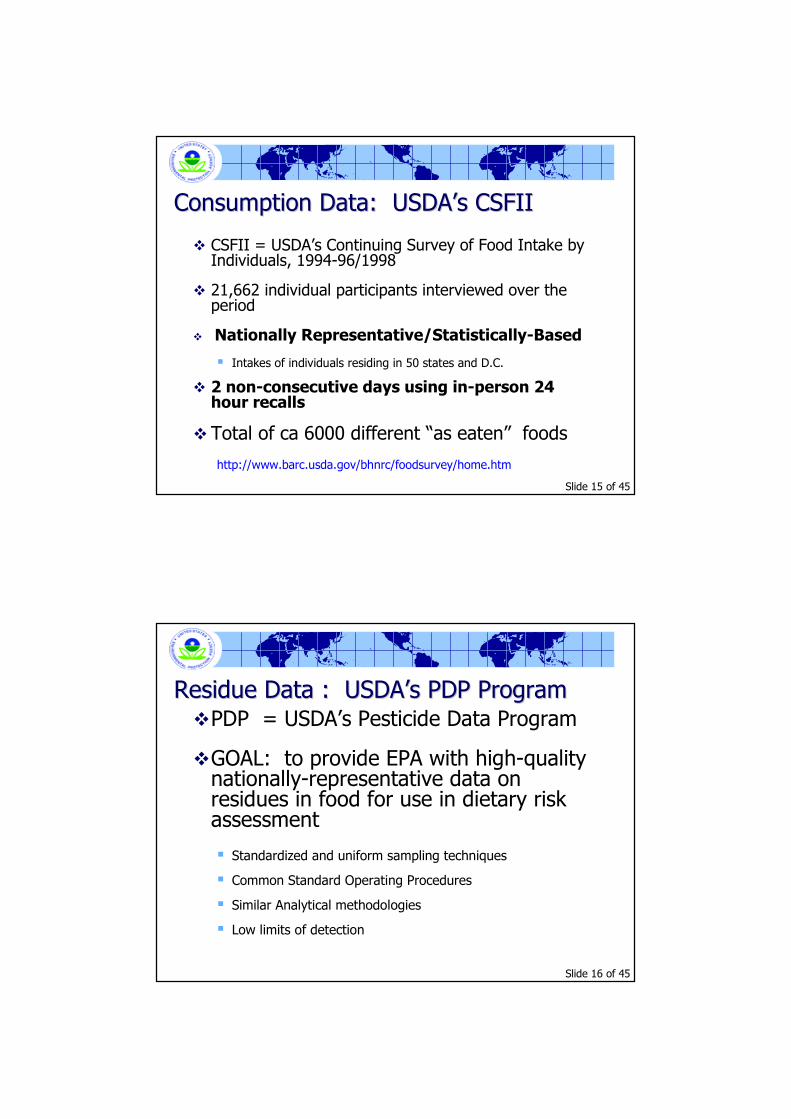
Three Key Inputs for Dietary Cumulative Three Key Inputs for Dietary Cumulative
Assessments: Assessments: � Food Consumption Data
� USDA’s Continuing Survey of Food Intake by Individuals (CSFII), 1994-96/1998
� Pesticide Residues in Food
� Various federal & specialized pesticide monitoring programs
�Relative Potency Factors
Slide 14 of 45
Cumulative Dietary ExposureCumulative Dietary Exposure
∑ ∑ ××=
Foods All FoodsCAGAll
RPFnConsumptioResidueExposure
Slide 15 of 45
Consumption Data: USDA’s CSFIIConsumption Data: USDA’s CSFII
� CSFII = USDA’s Continuing Survey of Food Intake by Individuals, 1994-96/1998
� 21,662 individual participants interviewed over the period
� Nationally Representative/Statistically-Based
� Intakes of individuals residing in 50 states and D.C.
� 2 non-consecutive days using in-person 24 hour recalls
�Total of ca 6000 different “as eaten” foods
http://www.barc.usda.gov/bhnrc/foodsurvey/home.htm
Slide 16 of 45
Residue Data : USDA’s PDP Program Residue Data : USDA’s PDP Program �PDP = USDA’s Pesticide Data Program
�GOAL: to provide EPA with high-quality nationally-representative data on residues in food for use in dietary risk assessment
� Standardized and uniform sampling techniques
� Common Standard Operating Procedures
� Similar Analytical methodologies
� Low limits of detection
Slide 17 of 45
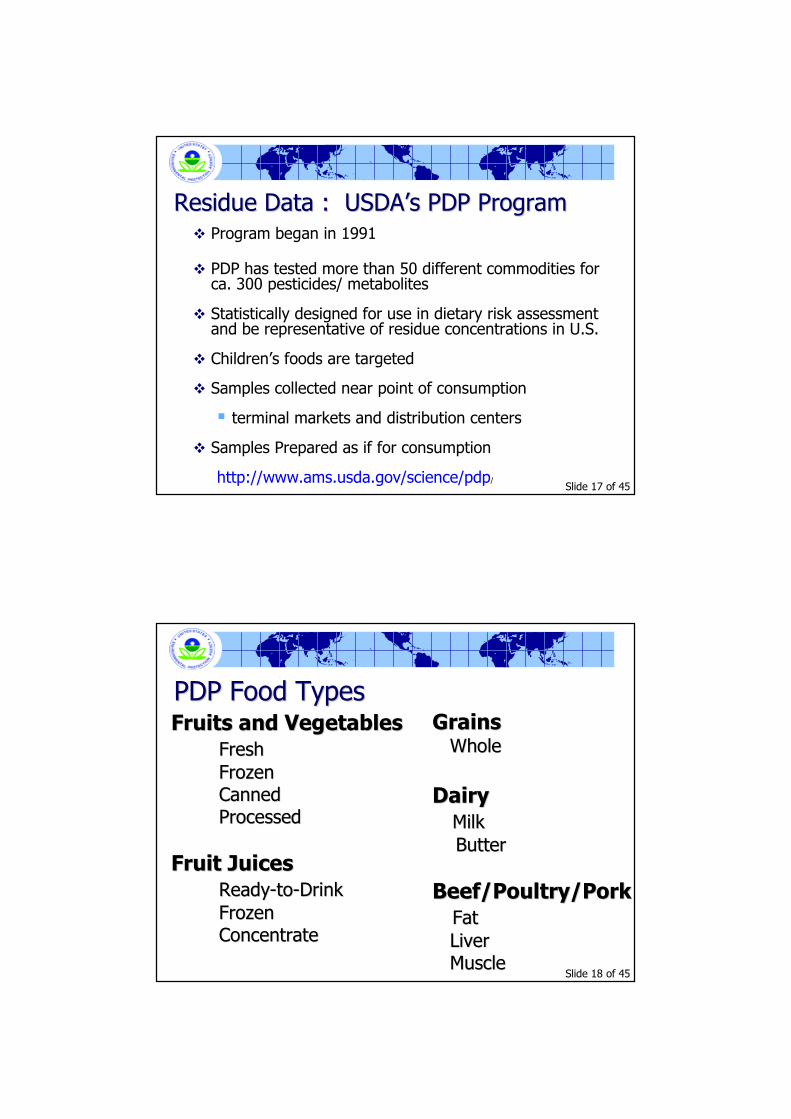
Residue Data : USDA’s PDP Program Residue Data : USDA’s PDP Program � Program began in 1991
� PDP has tested more than 50 different commodities for ca. 300 pesticides/ metabolites
� Statistically designed for use in dietary risk assessment and be representative of residue concentrations in U.S.
� Children’s foods are targeted
� Samples collected near point of consumption
� terminal markets and distribution centers
� Samples Prepared as if for consumption
http://www.ams.usda.gov/science/pdp/
Slide 18 of 45
PDP Food TypesPDP Food TypesFruits and VegetablesFruits and Vegetables
FreshFresh
FrozenFrozen
CannedCanned
ProcessedProcessed
Fruit JuicesFruit Juices
ReadyReady--toto--DrinkDrink
FrozenFrozen
ConcentrateConcentrate
GrainsGrainsWholeWhole
DairyDairy
MilkMilk
ButterButter
Beef/Poultry/PorkBeef/Poultry/Pork
FatFat
LiverLiver
MuscleMuscle
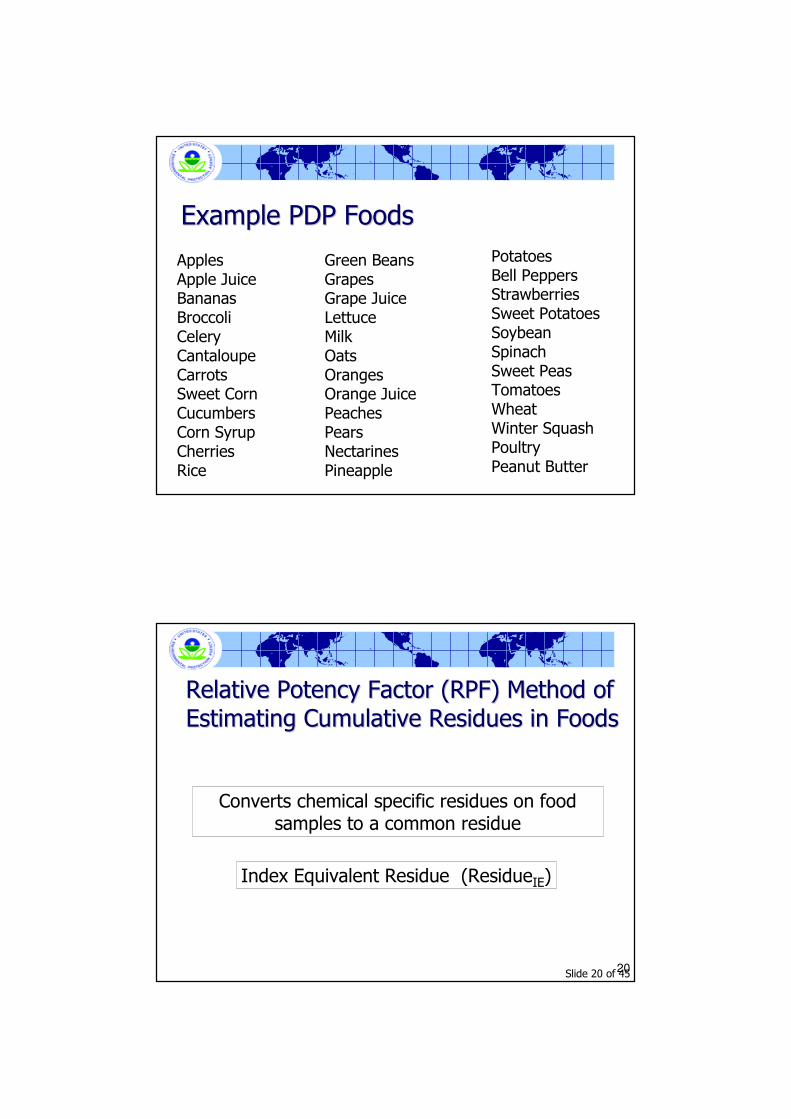
Example PDP FoodsExample PDP Foods
Apples Apple JuiceBananasBroccoliCeleryCantaloupeCarrotsSweet CornCucumbersCorn Syrup CherriesRice
Green BeansGrapesGrape JuiceLettuceMilkOatsOrangesOrange JuicePeachesPearsNectarinesPineapple
PotatoesBell PeppersStrawberriesSweet PotatoesSoybeanSpinachSweet PeasTomatoesWheatWinter SquashPoultryPeanut Butter
Slide 20 of 45
Relative Potency Factor (RPF) Method of Relative Potency Factor (RPF) Method of
Estimating Cumulative Residues in FoodsEstimating Cumulative Residues in Foods
Converts chemical specific residues on food samples to a common residue
Index Equivalent Residue (ResidueIE)
20
Slide 21 of 45
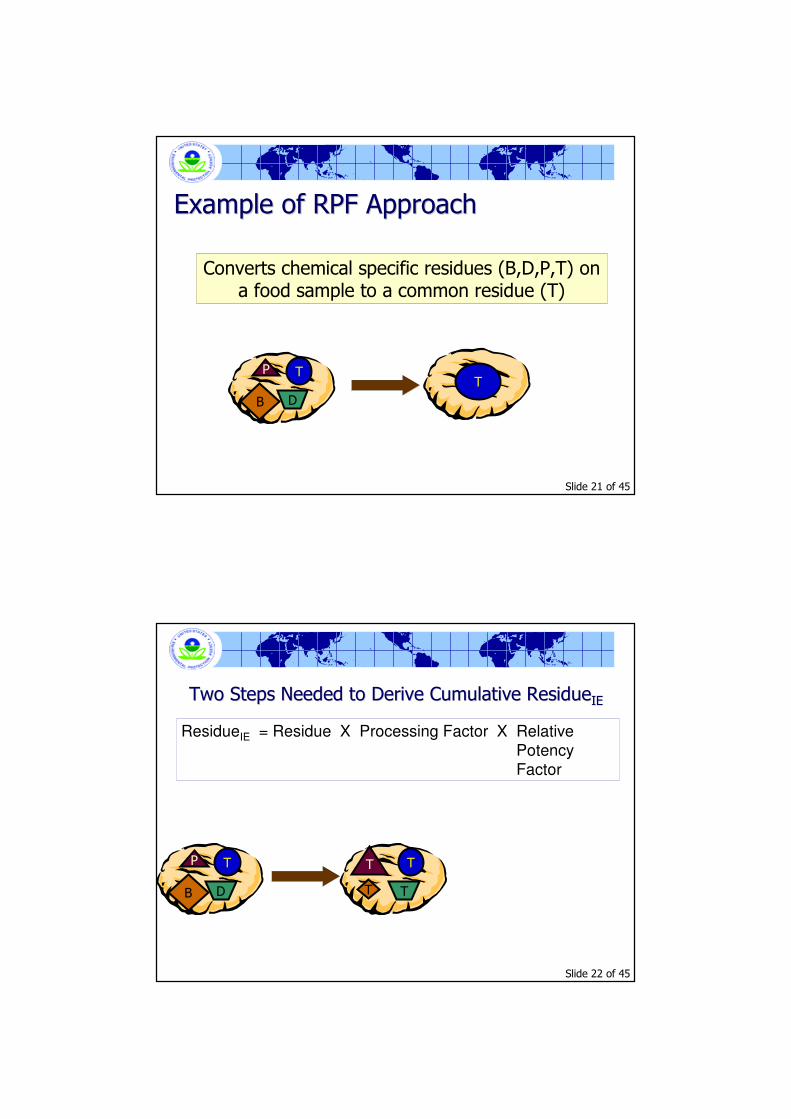
Example of RPF ApproachExample of RPF Approach
Converts chemical specific residues (B,D,P,T) on a food sample to a common residue (T)
T
B D
P T
Slide 22 of 45
Two Steps Needed to Derive Cumulative Two Steps Needed to Derive Cumulative ResidueResidueIEIE
T T
T T
B D
P T
ResidueIE = Residue X Processing Factor X Relative
Potency
Factor
Slide 23 of 45
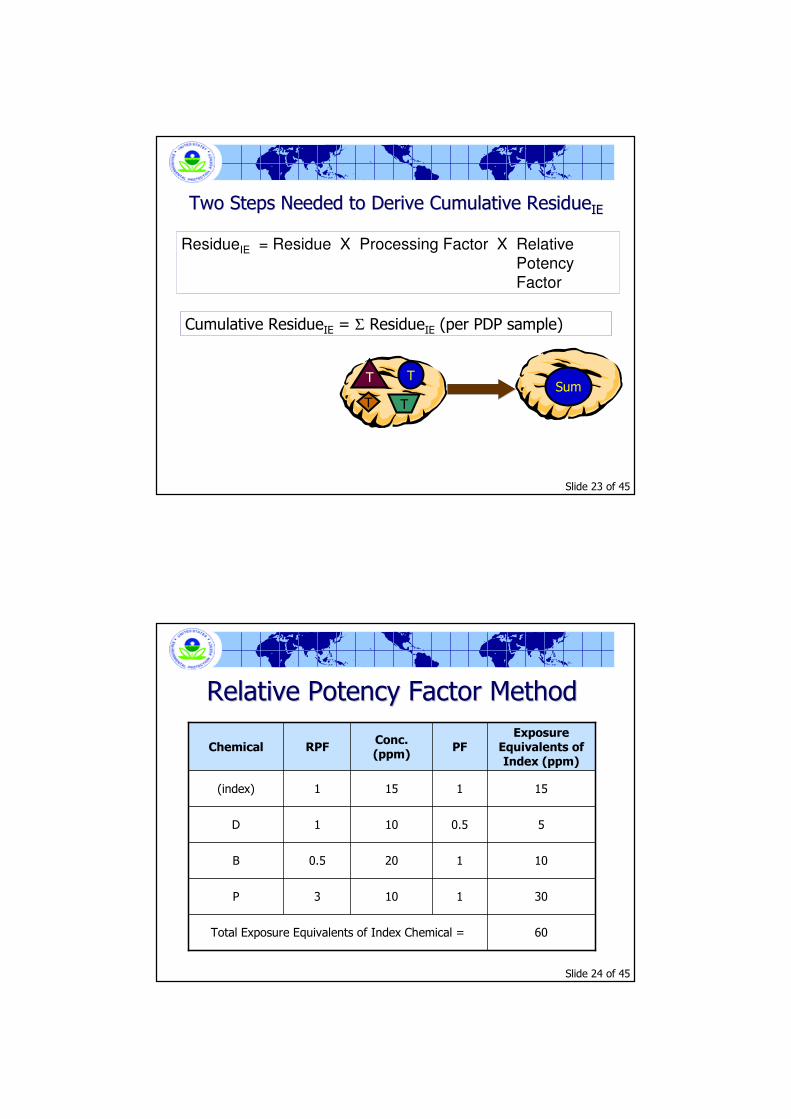
Two Steps Needed to Derive Cumulative Two Steps Needed to Derive Cumulative ResidueResidueIEIE
T T
T T
ResidueIE = Residue X Processing Factor X Relative
Potency
Factor
Sum
Cumulative ResidueIE = Σ ResidueIE (per PDP sample)
Slide 24 of 45
Relative Potency Factor MethodRelative Potency Factor Method
60Total Exposure Equivalents of Index Chemical =
301103P
101200.5B
50.5101D
151151(index)
Exposure Equivalents of Index (ppm)
PFConc. (ppm)
RPFChemical

Slide 25 of 45
Lesson Learned:Lesson Learned:
Need for Involving Public and Stakeholders in the Decision Process
Slide 26 of 45
Public ParticipationPublic Participation�CARAT/PPDC Workgroups
�Technical Briefings
� Scientific Advisory Panel Presentations
� Consultations
� Case Studies
� Preliminary CRA
� Revised CRA
�Web sites
�Other Federal Agencies
Slide 27 of 45
Lesson Learned:Lesson Learned:
Need for Representative Data
Slide 28 of 45
Representative DataRepresentative Data�Consumption Data
� USDA’s Continuing Survey of Food Intakes by Individuals (CSFII)• http://www.barc.usda.gov/bhnrc/foodsurvey/
�Residue Data
� USDA Pesticide Data Program (PDP)• http://www.ams.usda.gov/science/pdp
� FDA Center for Food Safety & Applied Nutrition• Pesticide Residue Monitoring Program
• Total Diet Study (TDS)
• http://www.cfsan.fda.gov/~lrd/pestadd.html
� Co-occurrence of Residues
Slide 29 of 45
Lesson Learned:Lesson Learned:
Need for Probabilistic Methods
(and to avoid compounding conservatisms)
Slide 30 of 45
Need for Probabilistic MethodsNeed for Probabilistic Methods
�Traditional Methods
� Produce high-end or bounding estimates at the extremes of exposure
� Probabilistic (Monte Carlo) methods
� Permit the use of the entire distribution of residue levels in crops to be combined with the distribution
of food consumption
� …and allow us to more accurately estimate the complete distribution of exposures and assess their associated probabilities
Slide 31 of 45
Lesson Learned: Lesson Learned:
Ability to “Trackback” Sources of Exposures
Slide 32 of 45
““TrackbackTrackback” ”
�Ability to identify major contributors to exposure at high-end exposure tails
� Pesticide
� Crop
� Pesticide/Crop Combination
Slide 33 of 45
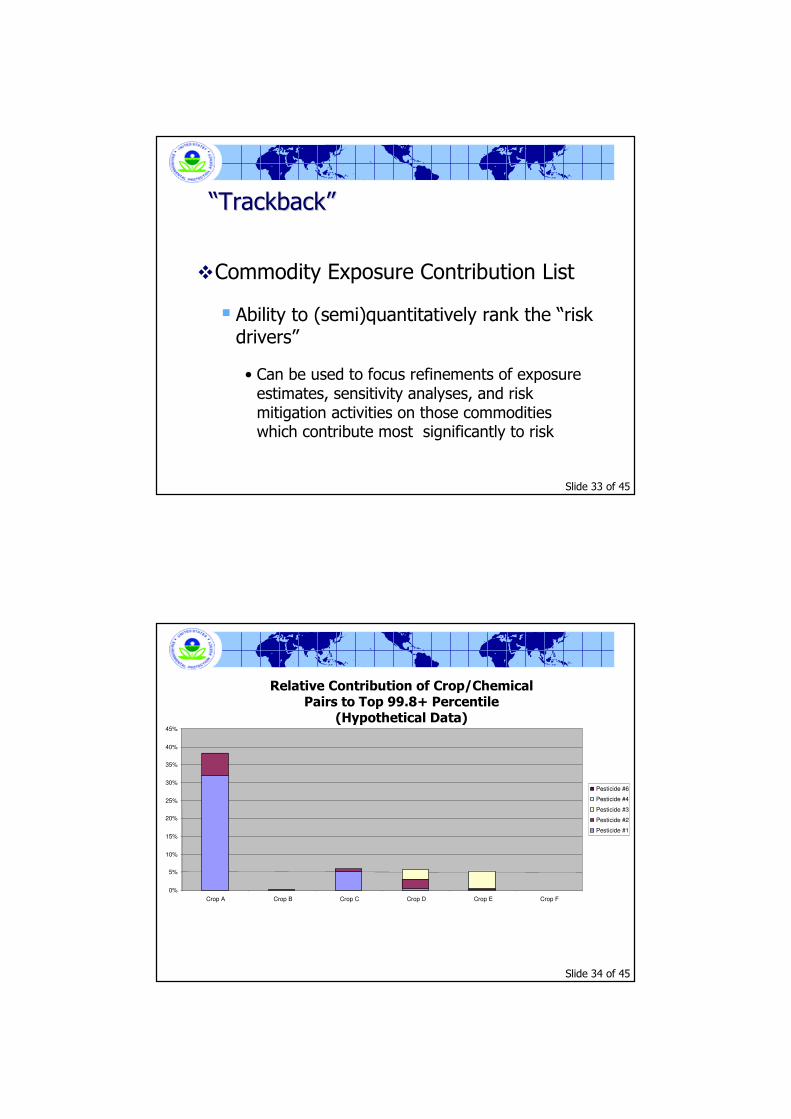
““TrackbackTrackback””
�Commodity Exposure Contribution List
� Ability to (semi)quantitatively rank the “risk drivers”
• Can be used to focus refinements of exposure estimates, sensitivity analyses, and risk mitigation activities on those commodities which contribute most significantly to risk
Slide 34 of 45
0%
5%
10%
15%
20%
25%
30%
35%
40%
45%
Crop A Crop B Crop C Crop D Crop E Crop F
Pesticide #6
Pesticide #4
Pesticide #3
Pesticide #2
Pesticide #1
Relative Contribution of Crop/Chemical Pairs to Top 99.8+ Percentile
(Hypothetical Data)
Slide 35 of 45
““TrackbackTrackback” ”
� Sensitivity analyses
� Subtract out specific pesticides, specific crops, and specific pesticide/crop combinations
� Examine impact of removal of a given pesticide from all forms of each of these foods from the cumulative assessment
� Examine impact of removal of given pesticide from certain foods/food forms
Slide 36 of 45
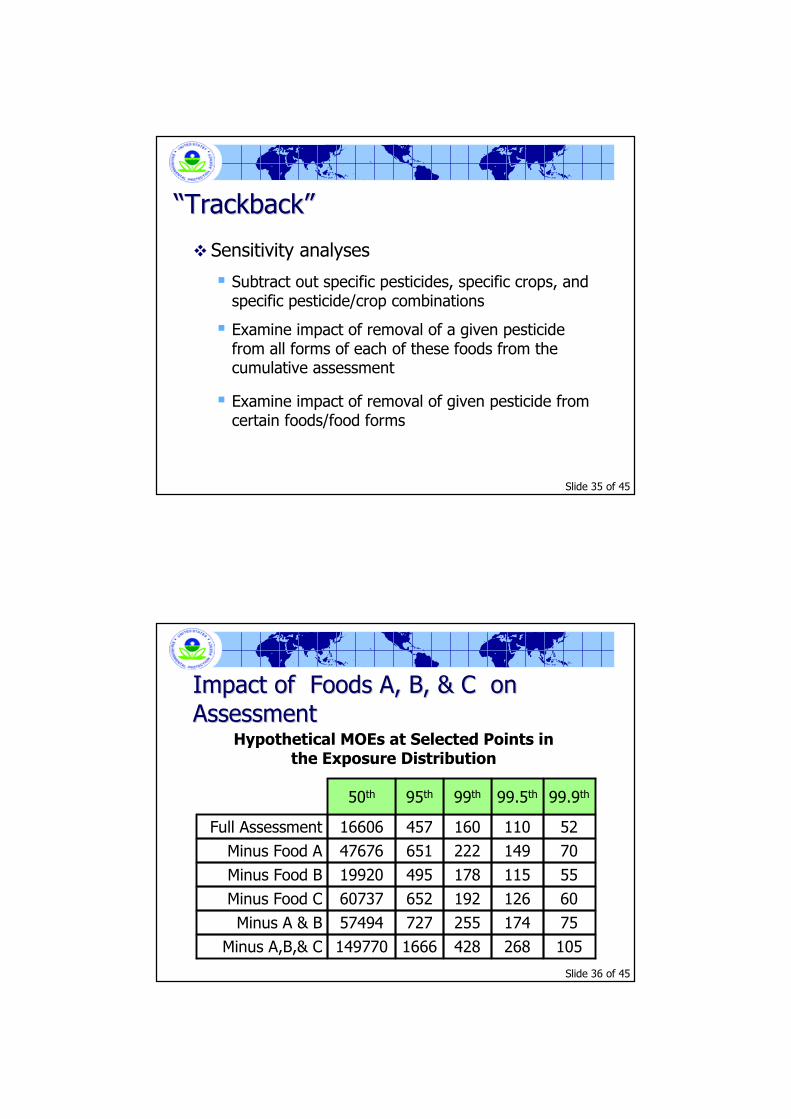
Impact of Foods A, B, & C on Impact of Foods A, B, & C on
AssessmentAssessmentHypothetical MOEs at Selected Points in
the Exposure Distribution
1052684281666149770Minus A,B,& C
7517425572757494Minus A & B
6012619265260737Minus Food C
5511517849519920Minus Food B
7014922265147676Minus Food A
5211016045716606Full Assessment
99.9th99.5th99th95th50th
Slide 37 of 45
Lesson Learned: Lesson Learned:
Need for Characterization of Exposure and Risk Estimates
Slide 38 of 45
Characterization of Exposure and Risk Characterization of Exposure and Risk
EstimatesEstimates� Kinds and quality of data available
� Key assumptions and their potential impact on the outcome of the assessment
� Strengths, limitations, and uncertainties inherent in data and analysis
� Magnitude and direction of likely bias and the impact on the final assessment
� Identification of risk contributors
� Sensitivity analyses
Slide 39 of 45
Future DirectionsFuture Directions
Slide 40 of 45
Additional Additional
Information/ReferencesInformation/References
Slide 41 of 45
Slide 42 of 45
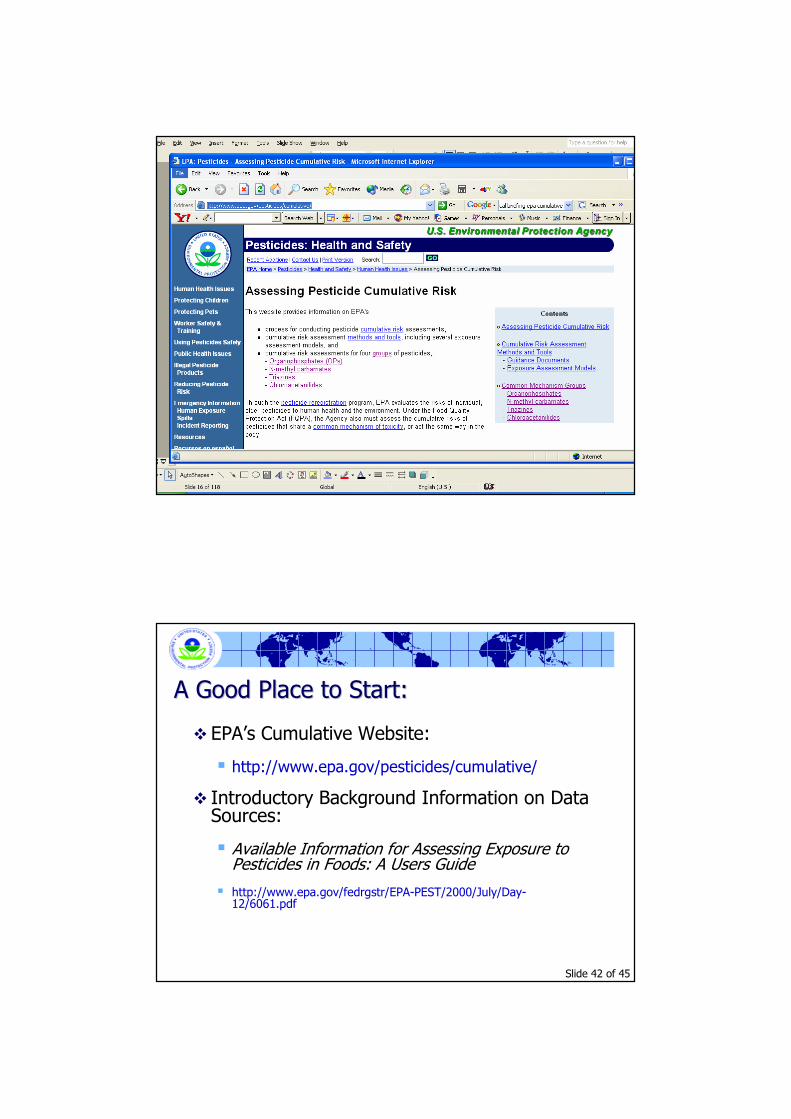
A Good Place to Start: A Good Place to Start:
� EPA’s Cumulative Website:
� http://www.epa.gov/pesticides/cumulative/
� Introductory Background Information on Data Sources:
� Available Information for Assessing Exposure to Pesticides in Foods: A Users Guide
� http://www.epa.gov/fedrgstr/EPA-PEST/2000/July/Day-12/6061.pdf
Slide 43 of 45
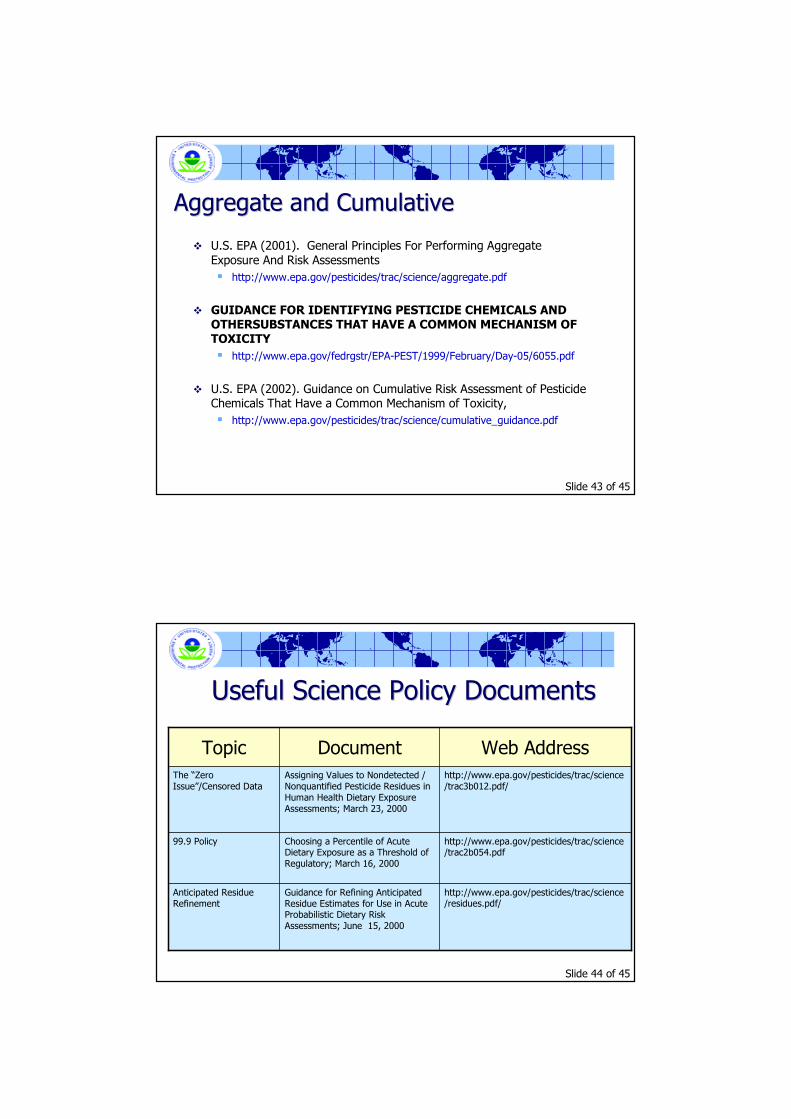
Aggregate and Cumulative Aggregate and Cumulative
� U.S. EPA (2001). General Principles For Performing Aggregate
Exposure And Risk Assessments
� http://www.epa.gov/pesticides/trac/science/aggregate.pdf
� GUIDANCE FOR IDENTIFYING PESTICIDE CHEMICALS AND OTHERSUBSTANCES THAT HAVE A COMMON MECHANISM OF TOXICITY
� http://www.epa.gov/fedrgstr/EPA-PEST/1999/February/Day-05/6055.pdf
� U.S. EPA (2002). Guidance on Cumulative Risk Assessment of Pesticide Chemicals That Have a Common Mechanism of Toxicity,
� http://www.epa.gov/pesticides/trac/science/cumulative_guidance.pdf
Slide 44 of 45
Useful Science Policy DocumentsUseful Science Policy Documents
Anticipated Residue Refinement
99.9 Policy
The “Zero Issue”/Censored Data
Topic
http://www.epa.gov/pesticides/trac/science/residues.pdf/
Guidance for Refining Anticipated Residue Estimates for Use in Acute Probabilistic Dietary Risk Assessments; June 15, 2000
http://www.epa.gov/pesticides/trac/science/trac2b054.pdf
Choosing a Percentile of Acute Dietary Exposure as a Threshold of Regulatory; March 16, 2000
http://www.epa.gov/pesticides/trac/science/trac3b012.pdf/
Assigning Values to Nondetected / Nonquantified Pesticide Residues in Human Health Dietary Exposure Assessments; March 23, 2000
Web AddressDocument
Slide 45 of 45
Or Contact…
David J. MillerChief, Chemistry & Exposure Branch
Health Effects DivisionOffice of Pesticide Programs
U.S. Environmental Protection Agency