Embed Size (px)
Citation preview
平成27年3月1日~平成28年2月29日
1st Mar. 2015 ~ 29th Feb. 2016
DATABOOK
RYOHIN KEIKAKU CO.,LTD.
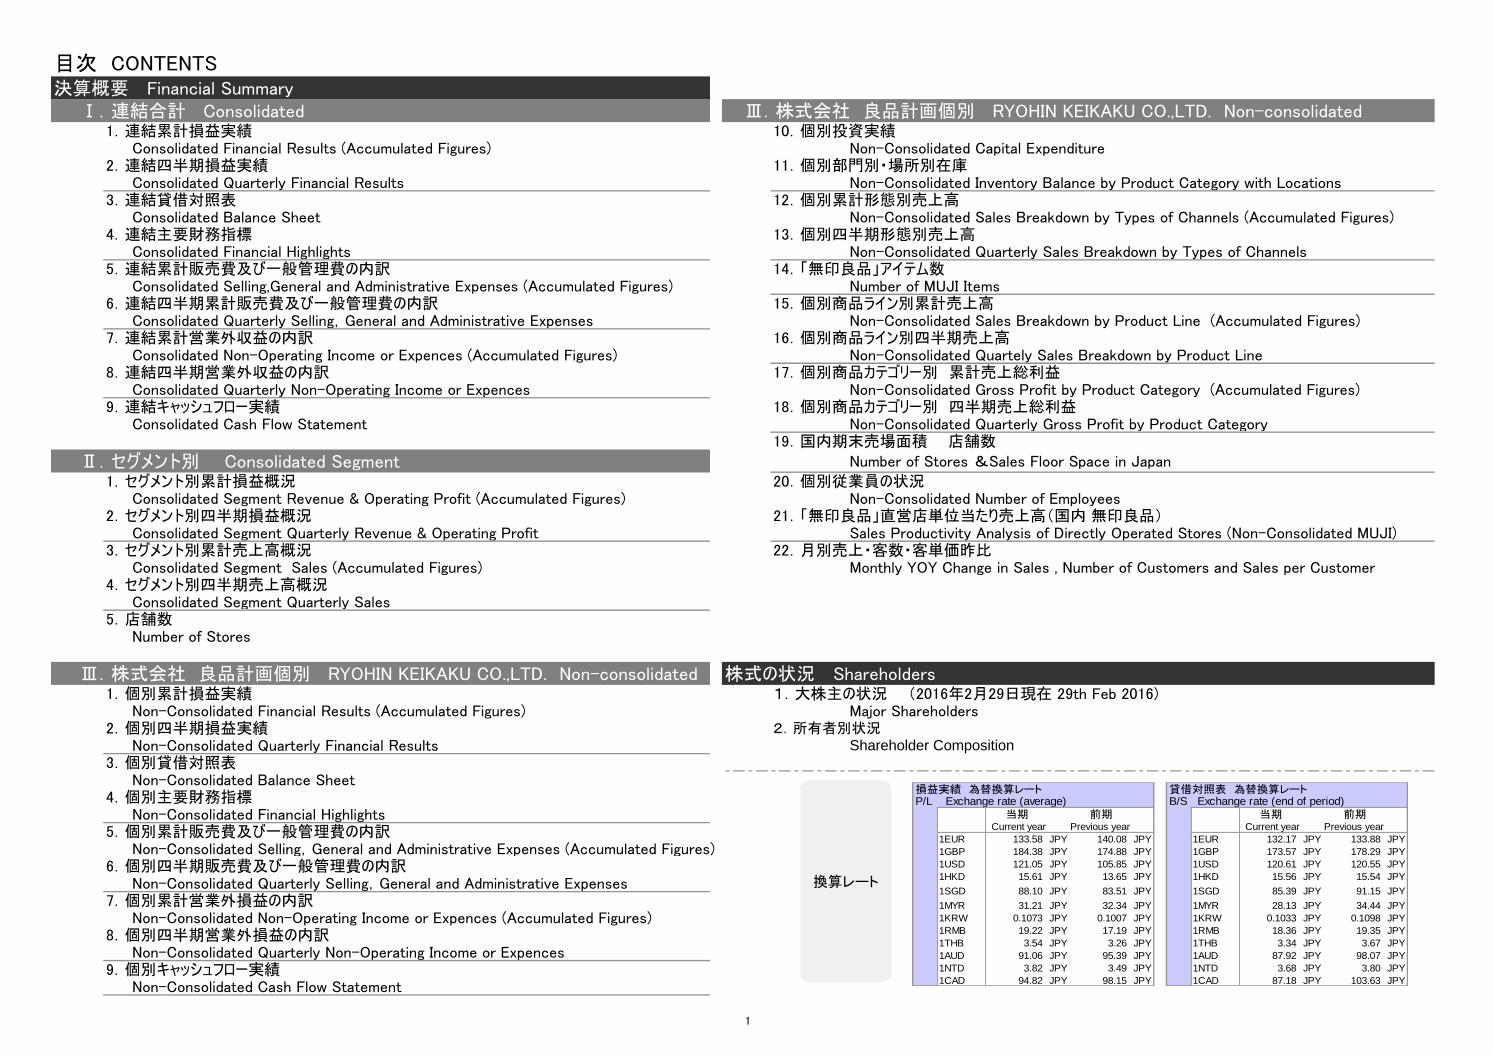
目次 CONTENTS決算概要 Financial Summary
Ⅰ.連結合計 Consolidated Ⅲ.株式会社 良品計画個別 RYOHIN KEIKAKU CO.,LTD. Non-consolidated 1.連結累計損益実績 10.個別投資実績
Consolidated Financial Results (Accumulated Figures) Non-Consolidated Capital Expenditure2.連結四半期損益実績 11.個別部門別・場所別在庫
Consolidated Quarterly Financial Results Non-Consolidated Inventory Balance by Product Category with Locations 3.連結貸借対照表 12.個別累計形態別売上高
Consolidated Balance Sheet Non-Consolidated Sales Breakdown by Types of Channels (Accumulated Figures) 4.連結主要財務指標 13.個別四半期形態別売上高
Consolidated Financial Highlights Non-Consolidated Quarterly Sales Breakdown by Types of Channels5.連結累計販売費及び一般管理費の内訳 14.「無印良品」アイテム数
Consolidated Selling,General and Administrative Expenses (Accumulated Figures) Number of MUJI Items6.連結四半期累計販売費及び一般管理費の内訳 15.個別商品ライン別累計売上高
Consolidated Quarterly Selling,General and Administrative Expenses Non-Consolidated Sales Breakdown by Product Line (Accumulated Figures) 7.連結累計営業外収益の内訳 16.個別商品ライン別四半期売上高
Consolidated Non-Operating Income or Expences (Accumulated Figures) Non-Consolidated Quartely Sales Breakdown by Product Line8.連結四半期営業外収益の内訳 17.個別商品カテゴリー別 累計売上総利益
Consolidated Quarterly Non-Operating Income or Expences Non-Consolidated Gross Profit by Product Category (Accumulated Figures) 9.連結キャッシュフロー実績 18.個別商品カテゴリー別 四半期売上総利益
Consolidated Cash Flow Statement Non-Consolidated Quarterly Gross Profit by Product Category 19.国内期末売場面積 店舗数
Ⅱ.セグメント別 Consolidated Segment Number of Stores &Sales Floor Space in Japan
1.セグメント別累計損益概況 20.個別従業員の状況Consolidated Segment Revenue & Operating Profit (Accumulated Figures) Non-Consolidated Number of Employees
2.セグメント別四半期損益概況 21.「無印良品」直営店単位当たり売上高'国内 無印良品(Consolidated Segment Quarterly Revenue & Operating Profit Sales Productivity Analysis of Directly Operated Stores (Non-Consolidated MUJI)
3.セグメント別累計売上高概況 22.月別売上・客数・客単価昨比Consolidated Segment Sales (Accumulated Figures) Monthly YOY Change in Sales , Number of Customers and Sales per Customer
4.セグメント別四半期売上高概況 Consolidated Segment Quarterly Sales
5.店舗数Number of Stores
Ⅲ.株式会社 良品計画個別 RYOHIN KEIKAKU CO.,LTD. Non-consolidated 株式の状況 Shareholders1.個別累計損益実績 1.大株主の状況 '2016年2月29日現在 29th Feb 2016)
Non-Consolidated Financial Results (Accumulated Figures) Major Shareholders2.個別四半期損益実績 2.所有者別状況
Non-Consolidated Quarterly Financial Results Shareholder Composition
3.個別貸借対照表Non-Consolidated Balance Sheet
4.個別主要財務指標Non-Consolidated Financial Highlights
5.個別累計販売費及び一般管理費の内訳 Non-Consolidated Selling,General and Administrative Expenses (Accumulated Figures)
6.個別四半期販売費及び一般管理費の内訳Non-Consolidated Quarterly Selling,General and Administrative Expenses
7.個別累計営業外損益の内訳 Non-Consolidated Non-Operating Income or Expences (Accumulated Figures)
8.個別四半期営業外損益の内訳Non-Consolidated Quarterly Non-Operating Income or Expences
9.個別キャッシュフロー実績 Non-Consolidated Cash Flow Statement
損益実績 為替換算レート 貸借対照表 為替換算レートP/L Exchange rate (average) B/S Exchange rate (end of period)
当期 前期 当期 前期Current year Previous year Current year Previous year
1EUR 133.58 JPY 140.08 JPY 1EUR 132.17 JPY 133.88 JPY
1GBP 184.38 JPY 174.88 JPY 1GBP 173.57 JPY 178.29 JPY
1USD 121.05 JPY 105.85 JPY 1USD 120.61 JPY 120.55 JPY
1HKD 15.61 JPY 13.65 JPY 1HKD 15.56 JPY 15.54 JPY
1SGD 88.10 JPY 83.51 JPY 1SGD 85.39 JPY 91.15 JPY
1MYR 31.21 JPY 32.34 JPY 1MYR 28.13 JPY 34.44 JPY
1KRW 0.1073 JPY 0.1007 JPY 1KRW 0.1033 JPY 0.1098 JPY
1RMB 19.22 JPY 17.19 JPY 1RMB 18.36 JPY 19.35 JPY
1THB 3.54 JPY 3.26 JPY 1THB 3.34 JPY 3.67 JPY
1AUD 91.06 JPY 95.39 JPY 1AUD 87.92 JPY 98.07 JPY
1NTD 3.82 JPY 3.49 JPY 1NTD 3.68 JPY 3.80 JPY
1CAD 94.82 JPY 98.15 JPY 1CAD 87.18 JPY 103.63 JPY
換算レート
1
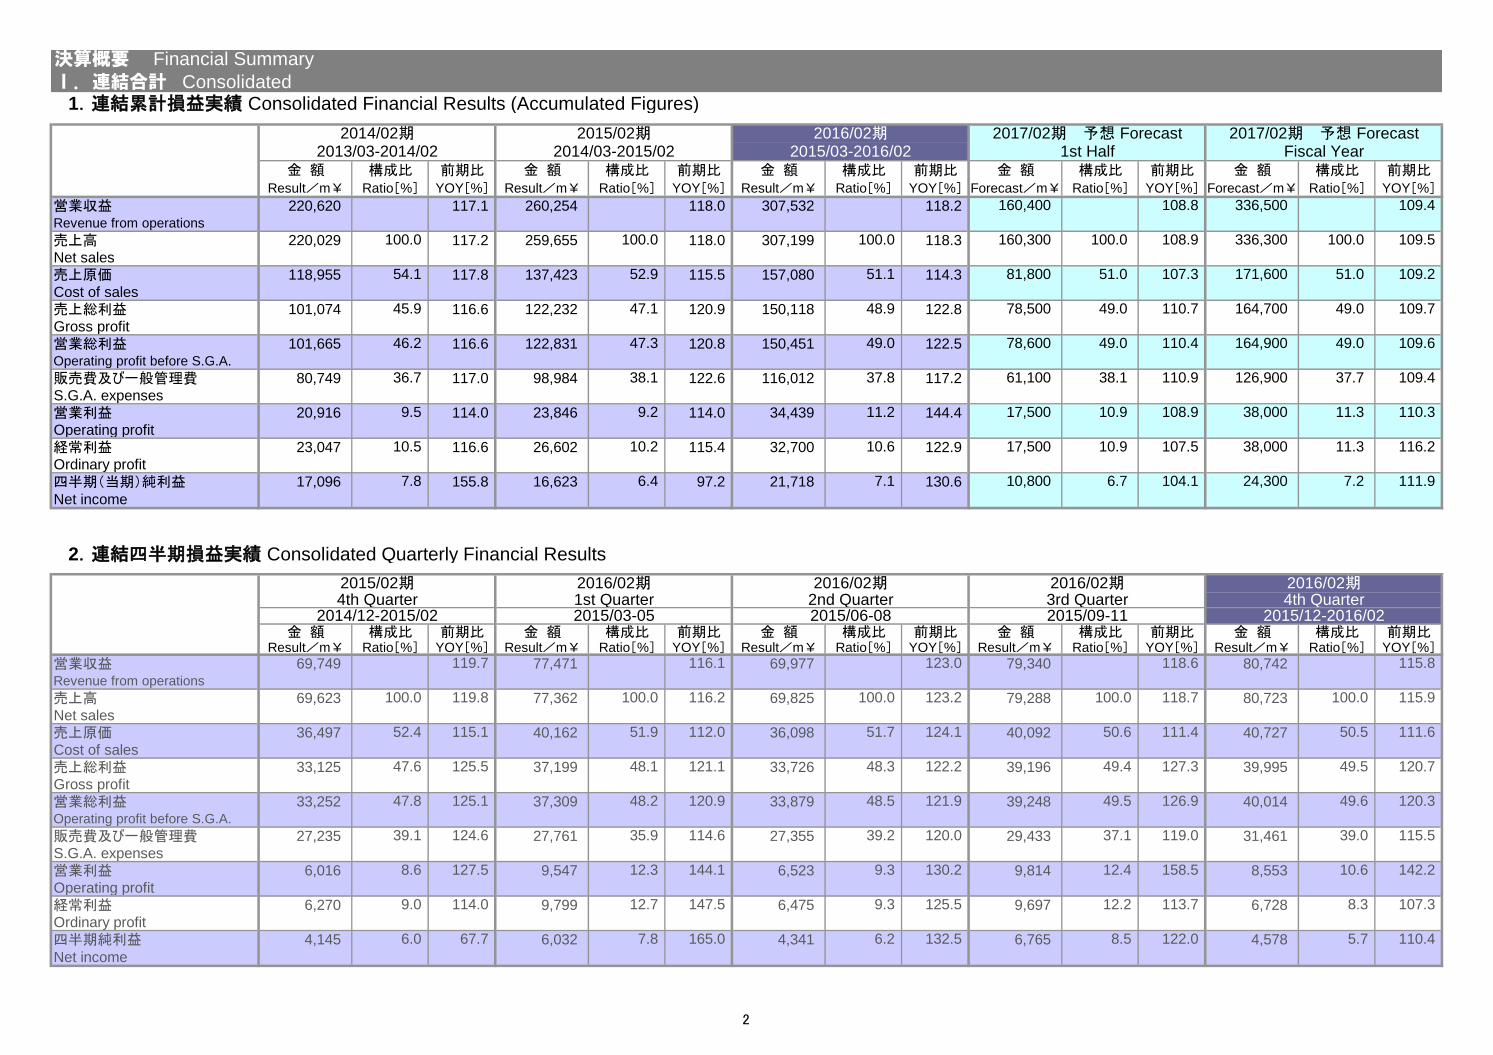
1.連結累計損益実績 Consolidated Financial Results (Accumulated Figures)
金 額 構成比 前期比 金 額 構成比 前期比 金 額 構成比 前期比 金 額 構成比 前期比 金 額 構成比 前期比Result/m¥ Ratio[%] YOY[%] Result/m¥ Ratio[%] YOY[%] Result/m¥ Ratio[%] YOY[%] Forecast/m¥ Ratio[%] YOY[%] Forecast/m¥ Ratio[%] YOY[%]
営業収益 220,620 117.1 260,254 118.0 307,532 118.2 160,400 108.8 336,500 109.4
Revenue from operations
売上高 220,029 100.0 117.2 259,655 100.0 118.0 307,199 100.0 118.3 160,300 100.0 108.9 336,300 100.0 109.5
Net sales
売上原価 118,955 54.1 117.8 137,423 52.9 115.5 157,080 51.1 114.3 81,800 51.0 107.3 171,600 51.0 109.2
Cost of sales
売上総利益 101,074 45.9 116.6 122,232 47.1 120.9 150,118 48.9 122.8 78,500 49.0 110.7 164,700 49.0 109.7
Gross profit
営業総利益 101,665 46.2 116.6 122,831 47.3 120.8 150,451 49.0 122.5 78,600 49.0 110.4 164,900 49.0 109.6
Operating profit before S.G.A.
販売費及び一般管理費 80,749 36.7 117.0 98,984 38.1 122.6 116,012 37.8 117.2 61,100 38.1 110.9 126,900 37.7 109.4
S.G.A. expenses
営業利益 20,916 9.5 114.0 23,846 9.2 114.0 34,439 11.2 144.4 17,500 10.9 108.9 38,000 11.3 110.3
Operating profit
経常利益 23,047 10.5 116.6 26,602 10.2 115.4 32,700 10.6 122.9 17,500 10.9 107.5 38,000 11.3 116.2
Ordinary profit
四半期'当期(純利益 17,096 7.8 155.8 16,623 6.4 97.2 21,718 7.1 130.6 10,800 6.7 104.1 24,300 7.2 111.9
Net income
2.連結四半期損益実績 Consolidated Quarterly Financial Results
金 額 構成比 前期比 金 額 構成比 前期比 金 額 構成比 前期比 金 額 構成比 前期比 金 額 構成比 前期比Result/m¥ Ratio[%] YOY[%] Result/m¥ Ratio[%] YOY[%] Result/m¥ Ratio[%] YOY[%] Result/m¥ Ratio[%] YOY[%] Result/m¥ Ratio[%] YOY[%]
営業収益 69,749 119.7 77,471 116.1 69,977 123.0 79,340 118.6 80,742 115.8
Revenue from operations
売上高 69,623 100.0 119.8 77,362 100.0 116.2 69,825 100.0 123.2 79,288 100.0 118.7 80,723 100.0 115.9
Net sales
売上原価 36,497 52.4 115.1 40,162 51.9 112.0 36,098 51.7 124.1 40,092 50.6 111.4 40,727 50.5 111.6
Cost of sales
売上総利益 33,125 47.6 125.5 37,199 48.1 121.1 33,726 48.3 122.2 39,196 49.4 127.3 39,995 49.5 120.7
Gross profit
営業総利益 33,252 47.8 125.1 37,309 48.2 120.9 33,879 48.5 121.9 39,248 49.5 126.9 40,014 49.6 120.3
Operating profit before S.G.A.
販売費及び一般管理費 27,235 39.1 124.6 27,761 35.9 114.6 27,355 39.2 120.0 29,433 37.1 119.0 31,461 39.0 115.5
S.G.A. expenses
営業利益 6,016 8.6 127.5 9,547 12.3 144.1 6,523 9.3 130.2 9,814 12.4 158.5 8,553 10.6 142.2
Operating profit
経常利益 6,270 9.0 114.0 9,799 12.7 147.5 6,475 9.3 125.5 9,697 12.2 113.7 6,728 8.3 107.3
Ordinary profit
四半期純利益 4,145 6.0 67.7 6,032 7.8 165.0 4,341 6.2 132.5 6,765 8.5 122.0 4,578 5.7 110.4
Net income
4th Quarter2014/12-2015/02 2015/12-2016/02
4th Quarter3rd Quarter
決算概要 Financial Summary
Ⅰ.連結合計 Consolidated
2017/02期 予想 Forecast1st Half
2017/02期 予想 ForecastFiscal Year
1st Quarter 2nd Quarter2015/06-082015/03-05 2015/09-11
2014/02期2013/03-2014/02
2015/02期 2016/02期2016/02期2016/02期
2016/02期2015/03-2016/02
2015/02期2014/03-2015/02
2016/02期
2
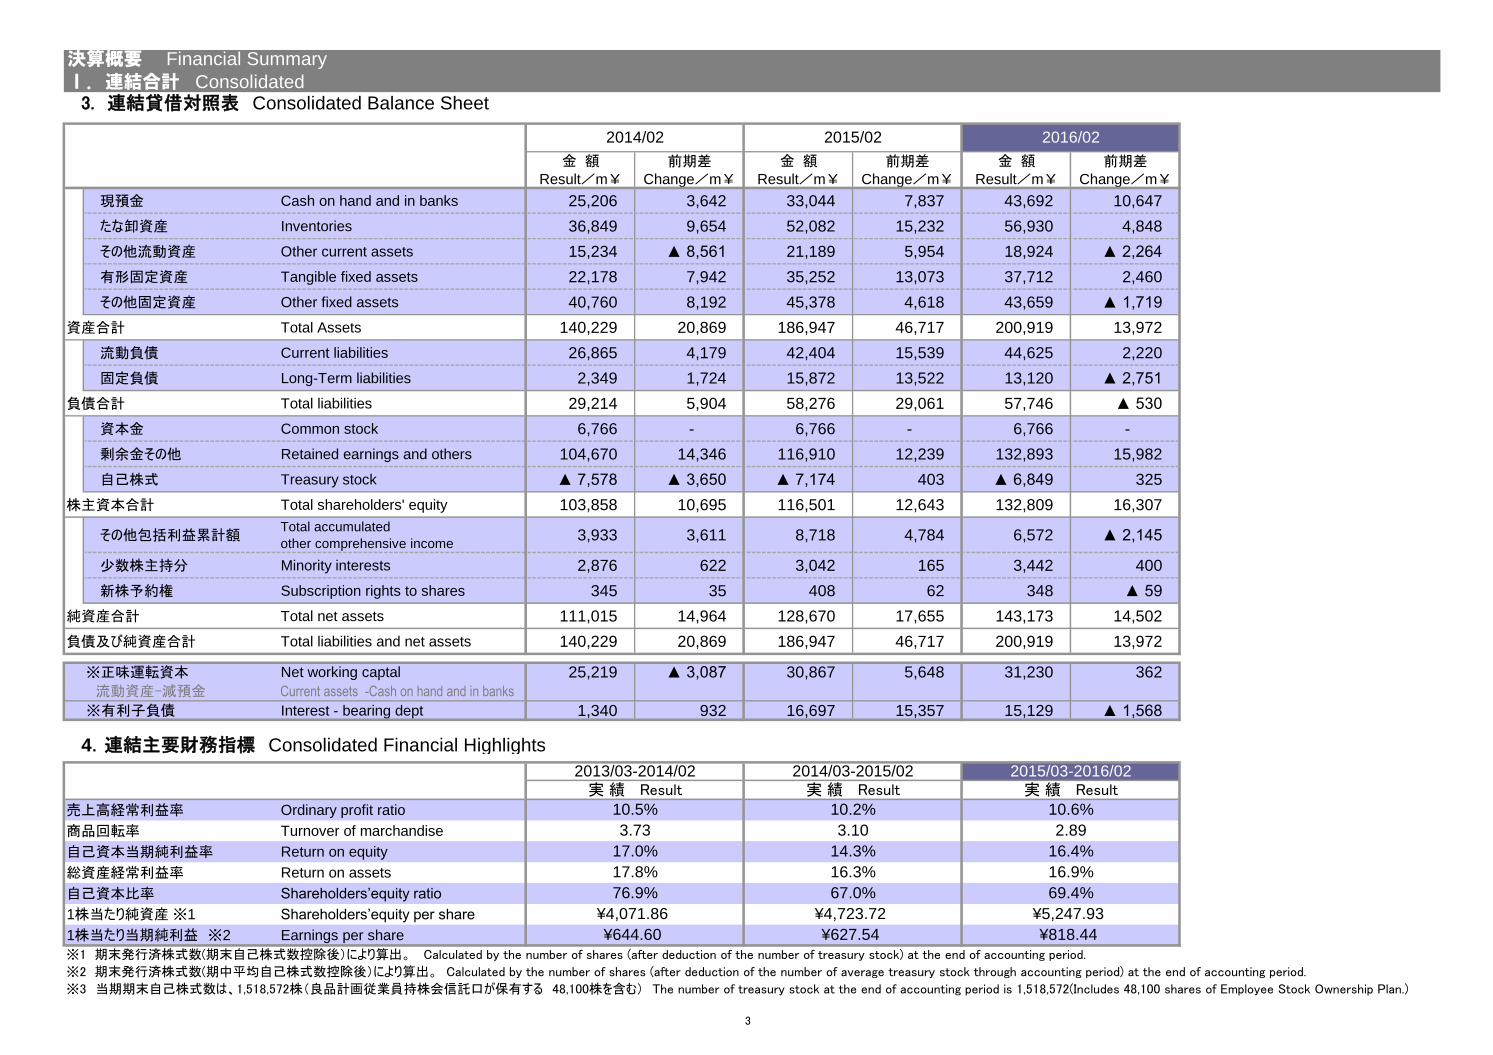
3. 連結貸借対照表 Consolidated Balance Sheet
金 額 前期差 金 額 前期差 金 額 前期差Result/m¥ Change/m¥ Result/m¥ Change/m¥ Result/m¥ Change/m¥
現預金 Cash on hand and in banks 25,206 3,642 33,044 7,837 43,692 10,647
たな卸資産 Inventories 36,849 9,654 52,082 15,232 56,930 4,848
その他流動資産 Other current assets 15,234 ▲ 8,561 21,189 5,954 18,924 ▲ 2,264
有形固定資産 Tangible fixed assets 22,178 7,942 35,252 13,073 37,712 2,460
その他固定資産 Other fixed assets 40,760 8,192 45,378 4,618 43,659 ▲ 1,719
資産合計 Total Assets 140,229 20,869 186,947 46,717 200,919 13,972
流動負債 Current liabilities 26,865 4,179 42,404 15,539 44,625 2,220
固定負債 Long-Term liabilities 2,349 1,724 15,872 13,522 13,120 ▲ 2,751
負債合計 Total liabilities 29,214 5,904 58,276 29,061 57,746 ▲ 530
資本金 Common stock 6,766 - 6,766 - 6,766 -
剰余金その他 Retained earnings and others 104,670 14,346 116,910 12,239 132,893 15,982
自己株式 Treasury stock ▲ 7,578 ▲ 3,650 ▲ 7,174 403 ▲ 6,849 325
株主資本合計 Total shareholders' equity 103,858 10,695 116,501 12,643 132,809 16,307
その他包括利益累計額Total accumulated
other comprehensive income3,933 3,611 8,718 4,784 6,572 ▲ 2,145
少数株主持分 Minority interests 2,876 622 3,042 165 3,442 400
新株予約権 Subscription rights to shares 345 35 408 62 348 ▲ 59
純資産合計 Total net assets 111,015 14,964 128,670 17,655 143,173 14,502
負債及び純資産合計 Total liabilities and net assets 140,229 20,869 186,947 46,717 200,919 13,972
※正味運転資本 Net working captal 25,219 ▲ 3,087 30,867 5,648 31,230 362
流動資産-減預金 Current assets -Cash on hand and in banks
※有利子負債 Interest - bearing dept 1,340 932 16,697 15,357 15,129 ▲ 1,568
4.連結主要財務指標 Consolidated Financial Highlights
売上高経常利益率 Ordinary profit ratio
商品回転率 Turnover of marchandise
自己資本当期純利益率 Return on equity
総資産経常利益率 Return on assets
自己資本比率 Shareholders’equity ratio
1株当たり純資産 ※1 Shareholders’equity per share
1株当たり当期純利益 ※2 Earnings per share
※1 期末発行済株式数(期末自己株式数控除後(により算出。 Calculated by the number of shares (after deduction of the number of treasury stock) at the end of accounting period.
※2 期末発行済株式数(期中平均自己株式数控除後(により算出。 Calculated by the number of shares (after deduction of the number of average treasury stock through accounting period) at the end of accounting period.
※3 当期期末自己株式数は、1,518,572株'良品計画従業員持株会信託口が保有する 48,100株を含む( The number of treasury stock at the end of accounting period is 1,518,572(Includes 48,100 shares of Employee Stock Ownership Plan.)
決算概要 Financial Summary
Ⅰ.連結合計 Consolidated
2015/03-2016/022013/03-2014/02 2014/03-2015/02
76.9%
10.5% 10.2%
¥627.54
¥4,723.72
17.0%
3.73 3.10
¥4,071.86
¥644.60
10.6%
実 績 Result
69.4%
¥5,247.93
¥818.44
16.9%
67.0%
16.3%
14.3%
実 績 Result
2.89
16.4%
2014/02 2015/02 2016/02
17.8%
実 績 Result
3
金 額 構成比 前期比 金 額 構成比 前期比 金 額 構成比 前期比 金 額 構成比 前期比Result/m¥ Ratio[%] YOY[%] Result/m¥ Ratio[%] YOY[%] Result/m¥ Ratio[%] YOY[%] Result/m¥ Ratio[%] YOY[%]
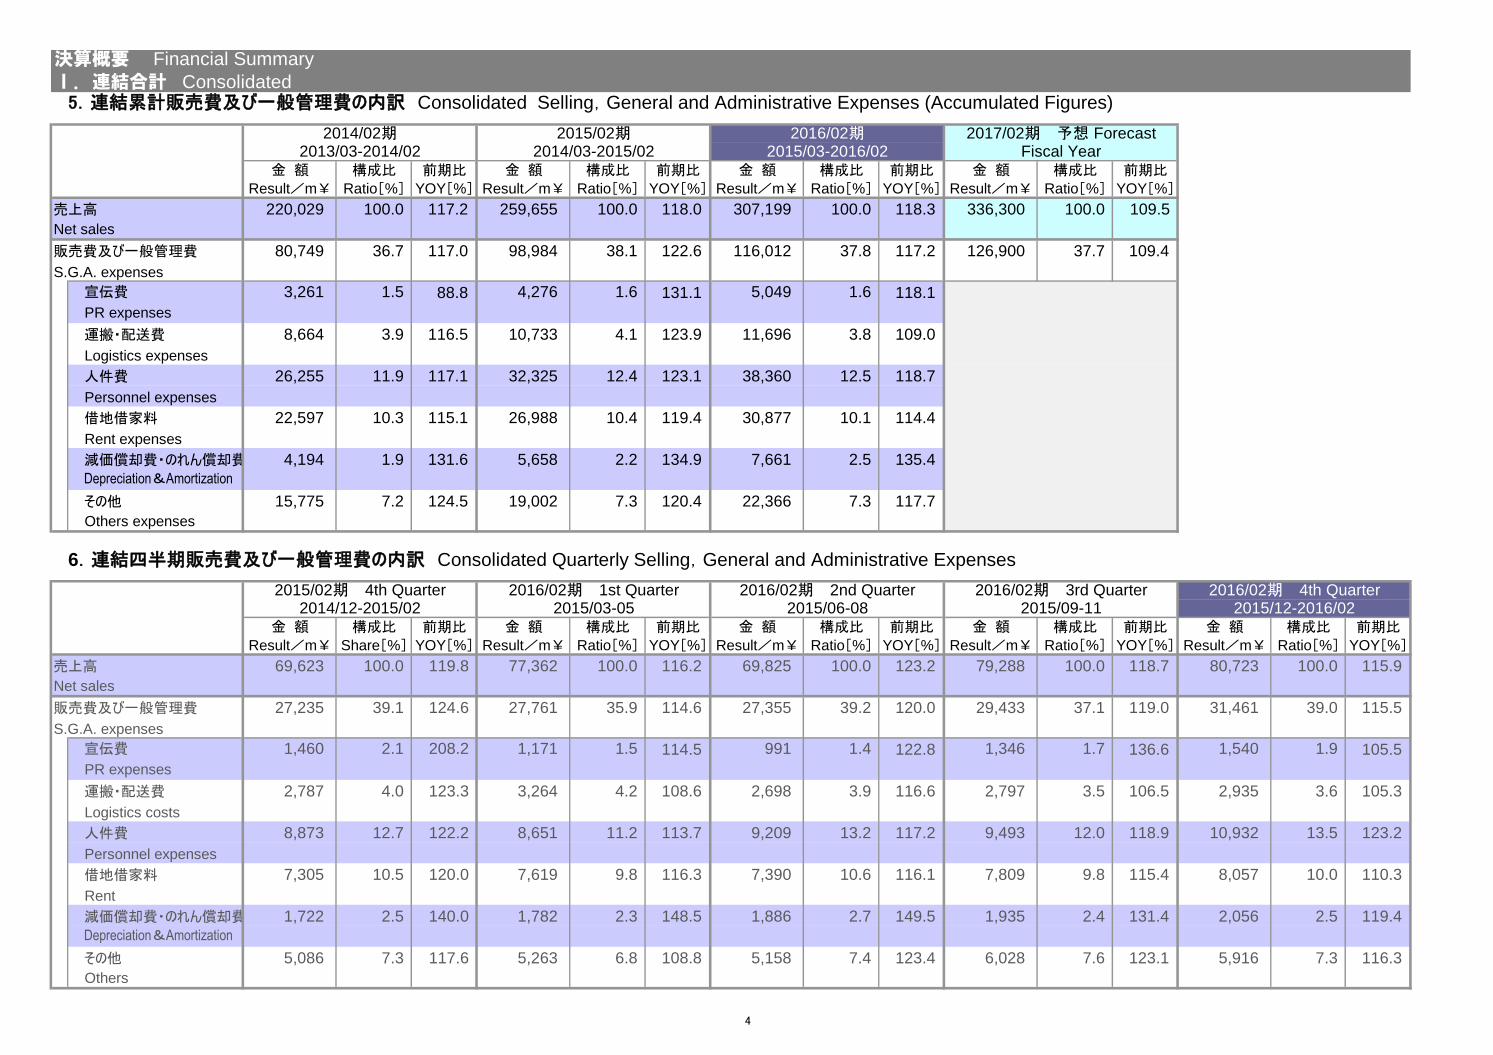
売上高 220,029 100.0 117.2 259,655 100.0 118.0 307,199 100.0 118.3 336,300 100.0 109.5
Net sales
販売費及び一般管理費 80,749 36.7 117.0 98,984 38.1 122.6 116,012 37.8 117.2 126,900 37.7 109.4
S.G.A. expenses
宣伝費 3,261 1.5 88.8 4,276 1.6 131.1 5,049 1.6 118.1
PR expenses
運搬・配送費 8,664 3.9 116.5 10,733 4.1 123.9 11,696 3.8 109.0
Logistics expenses
人件費 26,255 11.9 117.1 32,325 12.4 123.1 38,360 12.5 118.7
Personnel expenses
借地借家料 22,597 10.3 115.1 26,988 10.4 119.4 30,877 10.1 114.4
Rent expenses
減価償却費・のれん償却費 4,194 1.9 131.6 5,658 2.2 134.9 7,661 2.5 135.4Depreciation&Amortization
その他 15,775 7.2 124.5 19,002 7.3 120.4 22,366 7.3 117.7
Others expenses
金 額 構成比 前期比 金 額 構成比 前期比 金 額 構成比 前期比 金 額 構成比 前期比 金 額 構成比 前期比Result/m¥ Share[%] YOY[%] Result/m¥ Ratio[%] YOY[%] Result/m¥ Ratio[%] YOY[%] Result/m¥ Ratio[%] YOY[%] Result/m¥ Ratio[%] YOY[%]
売上高 69,623 100.0 119.8 77,362 100.0 116.2 69,825 100.0 123.2 79,288 100.0 118.7 80,723 100.0 115.9
Net sales
販売費及び一般管理費 27,235 39.1 124.6 27,761 35.9 114.6 27,355 39.2 120.0 29,433 37.1 119.0 31,461 39.0 115.5
S.G.A. expenses
宣伝費 1,460 2.1 208.2 1,171 1.5 114.5 991 1.4 122.8 1,346 1.7 136.6 1,540 1.9 105.5
PR expenses
運搬・配送費 2,787 4.0 123.3 3,264 4.2 108.6 2,698 3.9 116.6 2,797 3.5 106.5 2,935 3.6 105.3
Logistics costs
人件費 8,873 12.7 122.2 8,651 11.2 113.7 9,209 13.2 117.2 9,493 12.0 118.9 10,932 13.5 123.2
Personnel expenses
借地借家料 7,305 10.5 120.0 7,619 9.8 116.3 7,390 10.6 116.1 7,809 9.8 115.4 8,057 10.0 110.3
Rent
減価償却費・のれん償却費 1,722 2.5 140.0 1,782 2.3 148.5 1,886 2.7 149.5 1,935 2.4 131.4 2,056 2.5 119.4Depreciation&Amortization
その他 5,086 7.3 117.6 5,263 6.8 108.8 5,158 7.4 123.4 6,028 7.6 123.1 5,916 7.3 116.3
Others
6.連結四半期販売費及び一般管理費の内訳 Consolidated Quarterly Selling,General and Administrative Expenses
2017/02期 予想 ForecastFiscal Year
2016/02期 4th Quarter2015/12-2016/022015/06-08 2015/09-112015/03-05
2016/02期 3rd Quarter2014/12-2015/02
2015/02期 4th Quarter 2016/02期 1st Quarter 2016/02期 2nd Quarter
決算概要 Financial Summary
Ⅰ.連結合計 Consolidated
2016/02期2015/02期
5.連結累計販売費及び一般管理費の内訳 Consolidated Selling,General and Administrative Expenses (Accumulated Figures)
2015/03-2016/022013/03-2014/02 2014/03-2015/022014/02期
4
金 額 前期差 金 額 前期差 金 額 前期差 金 額 前期差Result/m¥ Change/m¥ Result/m¥ Change/m¥ Result/m¥ Change/m¥ Result/m¥ Change/m¥
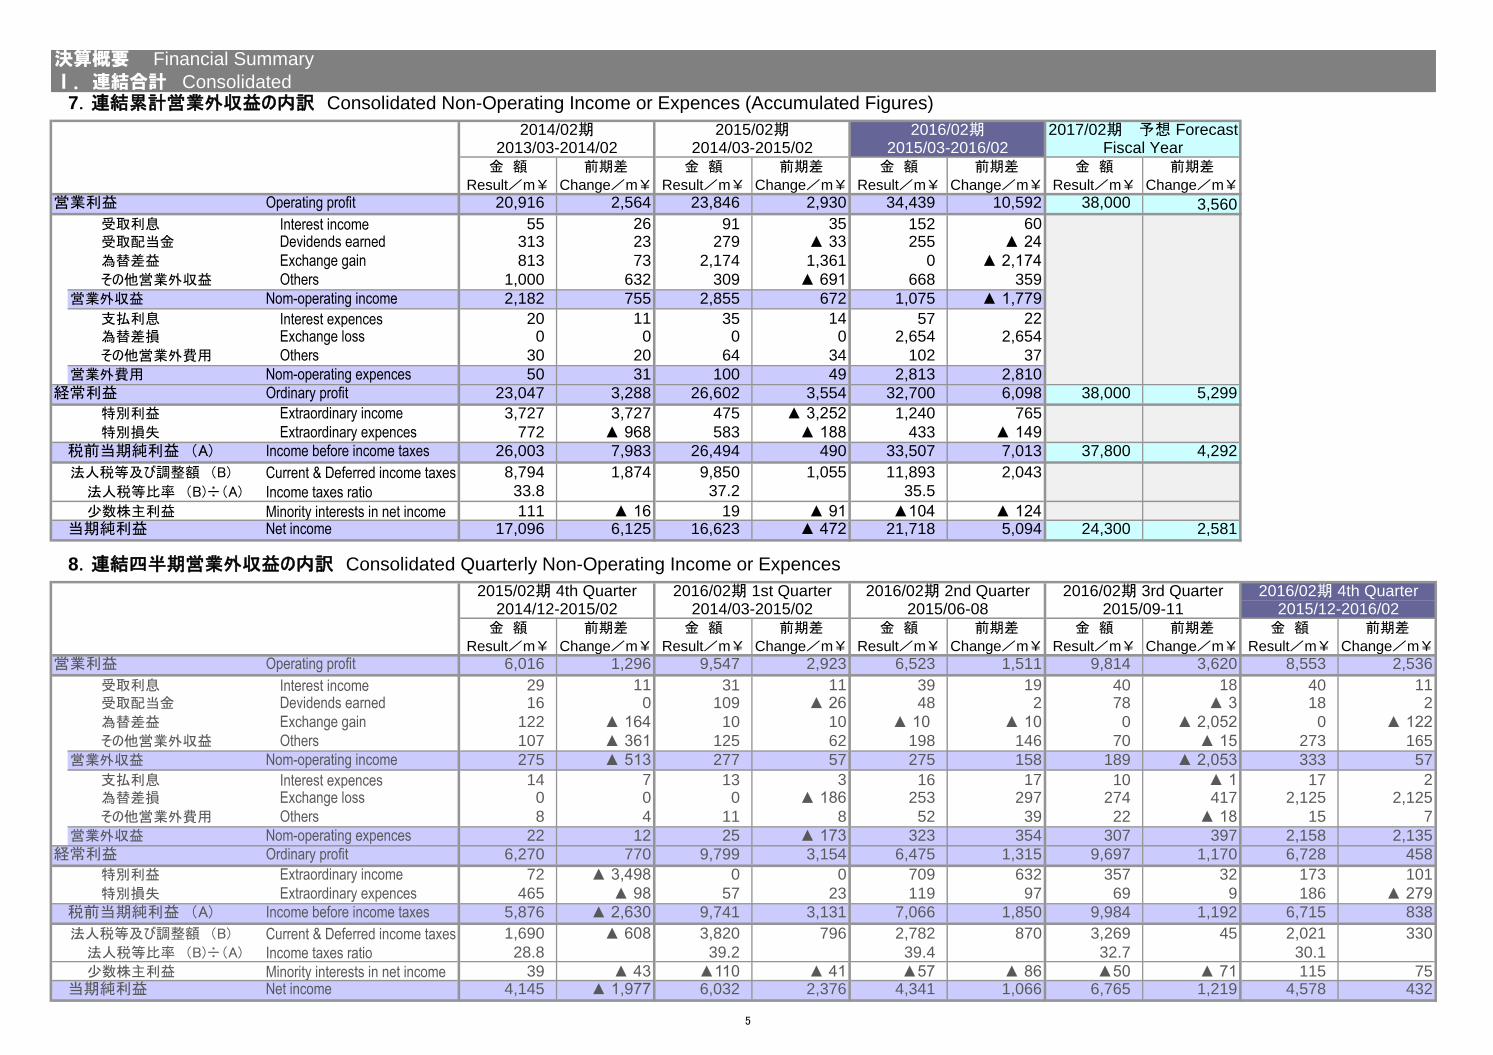
営業利益 Operating profit 20,916 2,564 23,846 2,930 34,439 10,592 38,000 3,560
受取利息 Interest income 55 26 91 35 152 60受取配当金 Devidends earned 313 23 279 ▲ 33 255 ▲ 24
為替差益 Exchange gain 813 73 2,174 1,361 0 ▲ 2,174
その他営業外収益 Others 1,000 632 309 ▲ 691 668 359
営業外収益 Nom-operating income 2,182 755 2,855 672 1,075 ▲ 1,779
支払利息 Interest expences 20 11 35 14 57 22為替差損 Exchange loss 0 0 0 0 2,654 2,654
その他営業外費用 Others 30 20 64 34 102 37
営業外費用 Nom-operating expences 50 31 100 49 2,813 2,810
経常利益 Ordinary profit 23,047 3,288 26,602 3,554 32,700 6,098 38,000 5,299
特別利益 Extraordinary income 3,727 3,727 475 ▲ 3,252 1,240 765
特別損失 Extraordinary expences 772 ▲ 968 583 ▲ 188 433 ▲ 149
税前当期純利益 'A) Income before income taxes 26,003 7,983 26,494 490 33,507 7,013 37,800 4,292
法人税等及び調整額 'B) Current & Deferred income taxes 8,794 1,874 9,850 1,055 11,893 2,043
法人税等比率 'B)÷'A) Income taxes ratio 33.8 37.2 35.5
少数株主利益 Minority interests in net income 111 ▲ 16 19 ▲ 91 ▲104 ▲ 124当期純利益 Net income 17,096 6,125 16,623 ▲ 472 21,718 5,094 24,300 2,581
金 額 前期差 金 額 前期差 金 額 前期差 金 額 前期差 金 額 前期差Result/m¥ Change/m¥ Result/m¥ Change/m¥ Result/m¥ Change/m¥ Result/m¥ Change/m¥ Result/m¥ Change/m¥
営業利益 Operating profit 6,016 1,296 9,547 2,923 6,523 1,511 9,814 3,620 8,553 2,536
受取利息 Interest income 29 11 31 11 39 19 40 18 40 11受取配当金 Devidends earned 16 0 109 ▲ 26 48 2 78 ▲ 3 18 2
為替差益 Exchange gain 122 ▲ 164 10 10 ▲ 10 ▲ 10 0 ▲ 2,052 0 ▲ 122
その他営業外収益 Others 107 ▲ 361 125 62 198 146 70 ▲ 15 273 165
営業外収益 Nom-operating income 275 ▲ 513 277 57 275 158 189 ▲ 2,053 333 57
支払利息 Interest expences 14 7 13 3 16 17 10 ▲ 1 17 2為替差損 Exchange loss 0 0 0 ▲ 186 253 297 274 417 2,125 2,125
その他営業外費用 Others 8 4 11 8 52 39 22 ▲ 18 15 7
営業外収益 Nom-operating expences 22 12 25 ▲ 173 323 354 307 397 2,158 2,135
経常利益 Ordinary profit 6,270 770 9,799 3,154 6,475 1,315 9,697 1,170 6,728 458
特別利益 Extraordinary income 72 ▲ 3,498 0 0 709 632 357 32 173 101
特別損失 Extraordinary expences 465 ▲ 98 57 23 119 97 69 9 186 ▲ 279
税前当期純利益 'A) Income before income taxes 5,876 ▲ 2,630 9,741 3,131 7,066 1,850 9,984 1,192 6,715 838
法人税等及び調整額 'B) Current & Deferred income taxes 1,690 ▲ 608 3,820 796 2,782 870 3,269 45 2,021 330
法人税等比率 'B)÷'A) Income taxes ratio 28.8 39.2 39.4 32.7 30.1
少数株主利益 Minority interests in net income 39 ▲ 43 ▲110 ▲ 41 ▲57 ▲ 86 ▲50 ▲ 71 115 75当期純利益 Net income 4,145 ▲ 1,977 6,032 2,376 4,341 1,066 6,765 1,219 4,578 432
2014/12-2015/02 2014/03-2015/02 2015/06-08 2015/12-2016/022016/02期 3rd Quarter
2015/09-11
8.連結四半期営業外収益の内訳 Consolidated Quarterly Non-Operating Income or Expences
2015/02期 4th Quarter 2016/02期 1st Quarter 2016/02期 2nd Quarter 2016/02期 4th Quarter
2013/03-2014/02 2014/03-2015/02 2015/03-2016/02 Fiscal Year
決算概要 Financial Summary
Ⅰ.連結合計 Consolidated
2014/02期 2015/02期 2016/02期 2017/02期 予想 Forecast
7.連結累計営業外収益の内訳 Consolidated Non-Operating Income or Expences (Accumulated Figures)
5
金 額 前期差 金 額 前期差 金 額 前期差 金 額 前期差Result/m¥ change/m¥ Result/m¥ change/m¥ Result/m¥ change/m¥ Result/m¥ change/m¥
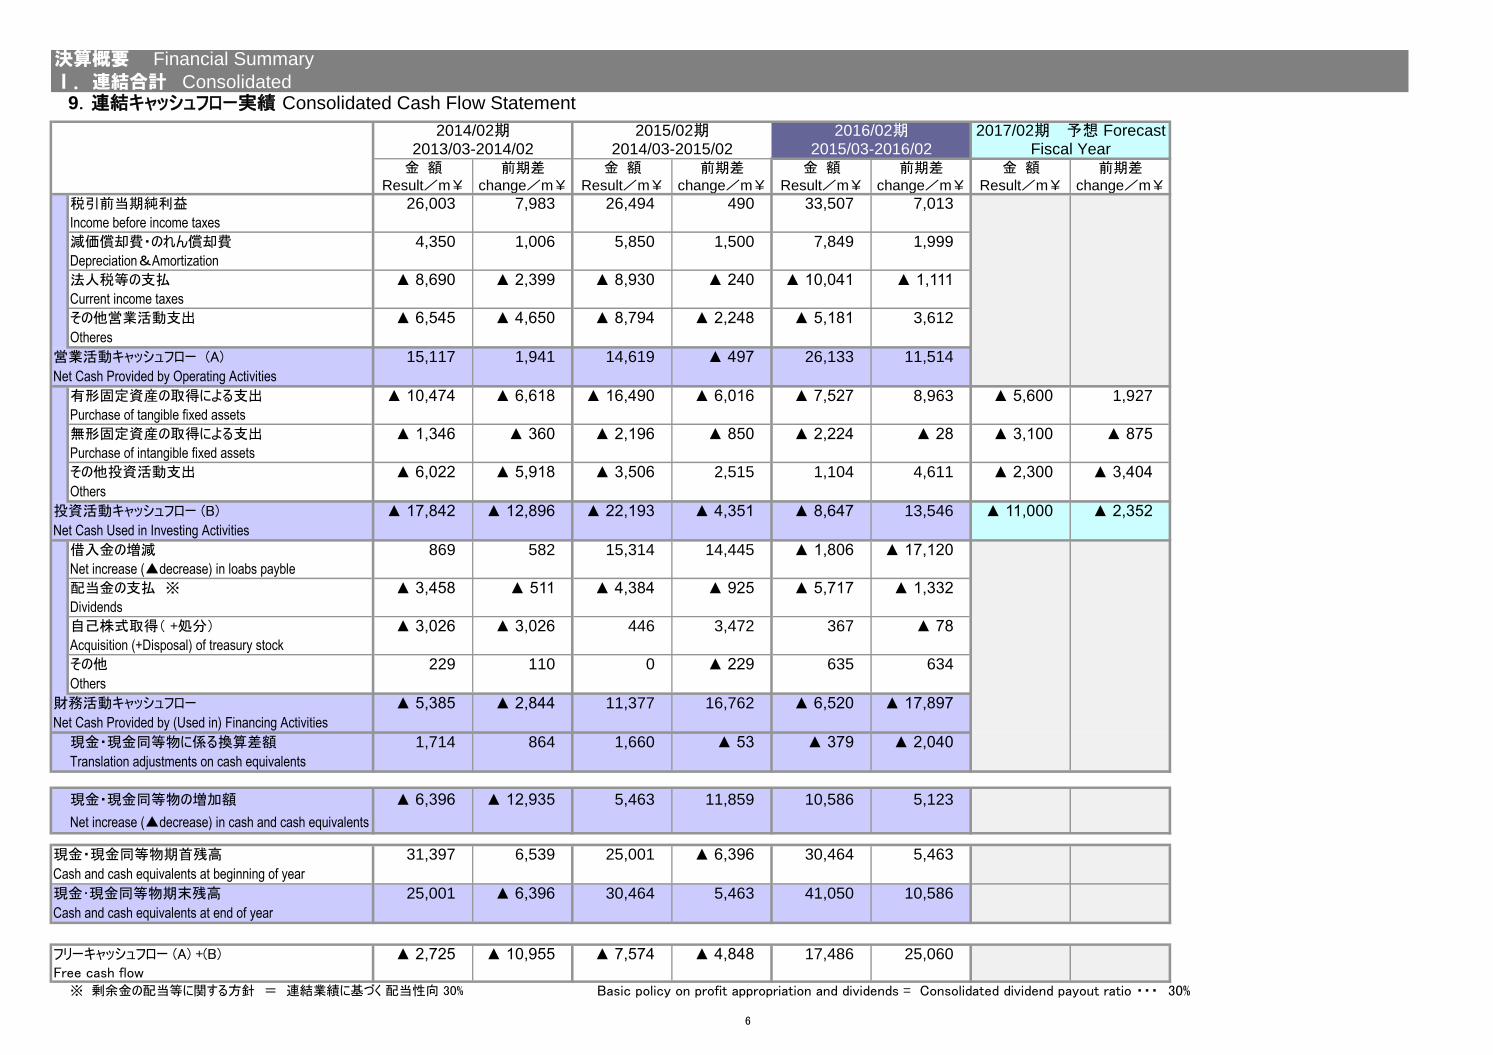
税引前当期純利益 26,003 7,983 26,494 490 33,507 7,013
Income before income taxes
減価償却費・のれん償却費 4,350 1,006 5,850 1,500 7,849 1,999
Depreciation&Amortization
法人税等の支払 ▲ 8,690 ▲ 2,399 ▲ 8,930 ▲ 240 ▲ 10,041 ▲ 1,111
Current income taxes
その他営業活動支出 ▲ 6,545 ▲ 4,650 ▲ 8,794 ▲ 2,248 ▲ 5,181 3,612
Otheres
営業活動キャッシュフロー (A) 15,117 1,941 14,619 ▲ 497 26,133 11,514
Net Cash Provided by Operating Activities
有形固定資産の取得による支出 ▲ 10,474 ▲ 6,618 ▲ 16,490 ▲ 6,016 ▲ 7,527 8,963 ▲ 5,600 1,927
Purchase of tangible fixed assets
無形固定資産の取得による支出 ▲ 1,346 ▲ 360 ▲ 2,196 ▲ 850 ▲ 2,224 ▲ 28 ▲ 3,100 ▲ 875
Purchase of intangible fixed assets
その他投資活動支出 ▲ 6,022 ▲ 5,918 ▲ 3,506 2,515 1,104 4,611 ▲ 2,300 ▲ 3,404
Others
投資活動キャッシュフロー (B) ▲ 17,842 ▲ 12,896 ▲ 22,193 ▲ 4,351 ▲ 8,647 13,546 ▲ 11,000 ▲ 2,352
Net Cash Used in Investing Activities
借入金の増減 869 582 15,314 14,445 ▲ 1,806 ▲ 17,120
Net increase (▲decrease) in loabs payble
配当金の支払 ※ ▲ 3,458 ▲ 511 ▲ 4,384 ▲ 925 ▲ 5,717 ▲ 1,332
Dividends
自己株式取得' +処分( ▲ 3,026 ▲ 3,026 446 3,472 367 ▲ 78
Acquisition (+Disposal) of treasury stock
その他 229 110 0 ▲ 229 635 634
Others
財務活動キャッシュフロー ▲ 5,385 ▲ 2,844 11,377 16,762 ▲ 6,520 ▲ 17,897
Net Cash Provided by (Used in) Financing Activities
現金・現金同等物に係る換算差額 1,714 864 1,660 ▲ 53 ▲ 379 ▲ 2,040
Translation adjustments on cash equivalents
現金・現金同等物の増加額 ▲ 6,396 ▲ 12,935 5,463 11,859 10,586 5,123
Net increase (▲decrease) in cash and cash equivalents
現金・現金同等物期首残高 31,397 6,539 25,001 ▲ 6,396 30,464 5,463
Cash and cash equivalents at beginning of year
現金・現金同等物期末残高 25,001 ▲ 6,396 30,464 5,463 41,050 10,586
Cash and cash equivalents at end of year
フリーキャッシュフロー (A) +(B) ▲ 2,725 ▲ 10,955 ▲ 7,574 ▲ 4,848 17,486 25,060Free cash flow
※ 剰余金の配当等に関する方針 = 連結業績に基づく 配当性向 30% Basic policy on profit appropriation and dividends = Consolidated dividend payout ratio ・・・ 30%
2015/03-2016/022017/02期 予想 Forecast
Fiscal Year
決算概要 Financial Summary
Ⅰ.連結合計 Consolidated
2013/03-2014/02 2014/03-2015/02
9.連結キャッシュフロー実績 Consolidated Cash Flow Statement
2014/02期 2015/02期 2016/02期
6
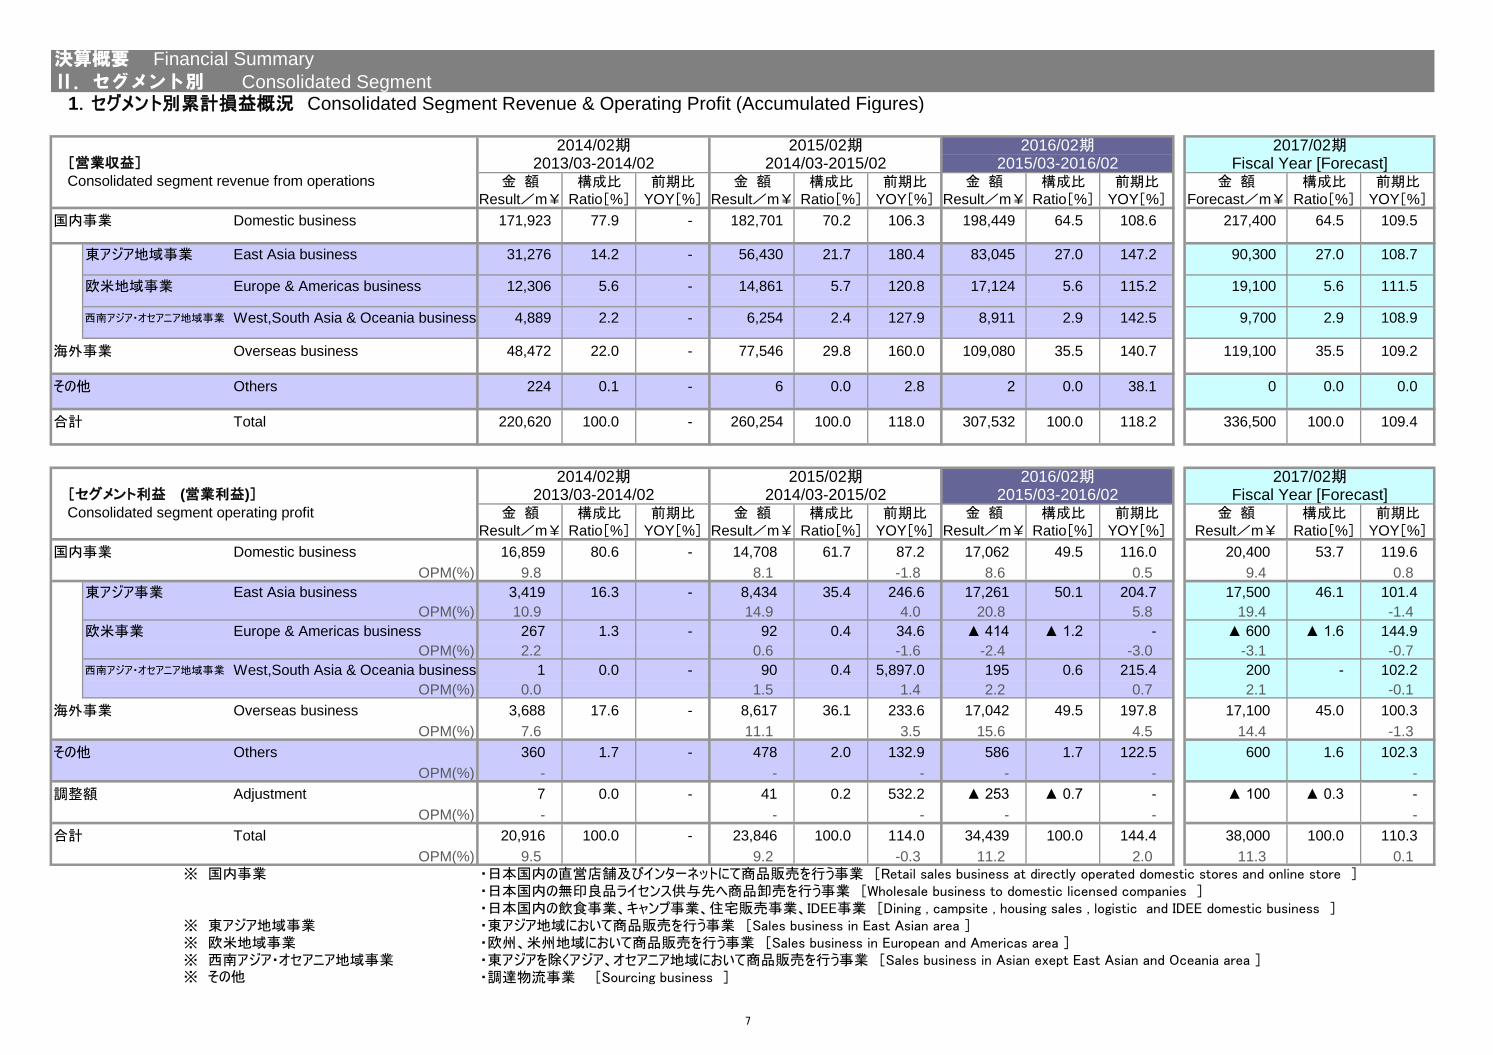
1.セグメント別累計損益概況 Consolidated Segment Revenue & Operating Profit (Accumulated Figures)
金 額 構成比 前期比 金 額 構成比 前期比 金 額 構成比 前期比 金 額 構成比 前期比Result/m¥ Ratio[%] YOY[%] Result/m¥ Ratio[%] YOY[%] Result/m¥ Ratio[%] YOY[%] Forecast/m¥ Ratio[%] YOY[%]
国内事業 Domestic business 171,923 77.9 - 182,701 70.2 106.3 198,449 64.5 108.6 217,400 64.5 109.5
東アジア地域事業 East Asia business 31,276 14.2 - 56,430 21.7 180.4 83,045 27.0 147.2 90,300 27.0 108.7
欧米地域事業 Europe & Americas business 12,306 5.6 - 14,861 5.7 120.8 17,124 5.6 115.2 19,100 5.6 111.5
西南アジア・オセアニア地域事業 West,South Asia & Oceania business 4,889 2.2 - 6,254 2.4 127.9 8,911 2.9 142.5 9,700 2.9 108.9
海外事業 Overseas business 48,472 22.0 - 77,546 29.8 160.0 109,080 35.5 140.7 119,100 35.5 109.2
その他 Others 224 0.1 - 6 0.0 2.8 2 0.0 38.1 0 0.0 0.0
合計 Total 220,620 100.0 - 260,254 100.0 118.0 307,532 100.0 118.2 336,500 100.0 109.4
金 額 構成比 前期比 金 額 構成比 前期比 金 額 構成比 前期比 金 額 構成比 前期比Result/m¥ Ratio[%] YOY[%] Result/m¥ Ratio[%] YOY[%] Result/m¥ Ratio[%] YOY[%] Result/m¥ Ratio[%] YOY[%]
国内事業 Domestic business 16,859 80.6 - 14,708 61.7 87.2 17,062 49.5 116.0 20,400 53.7 119.6
OPM(%) 9.8 8.1 -1.8 8.6 0.5 9.4 0.8
東アジア事業 East Asia business 3,419 16.3 - 8,434 35.4 246.6 17,261 50.1 204.7 17,500 46.1 101.4
OPM(%) 10.9 14.9 4.0 20.8 5.8 19.4 -1.4
欧米事業 Europe & Americas business 267 1.3 - 92 0.4 34.6 ▲ 414 ▲ 1.2 - ▲ 600 ▲ 1.6 144.9
OPM(%) 2.2 0.6 -1.6 -2.4 -3.0 -3.1 -0.7
西南アジア・オセアニア地域事業 West,South Asia & Oceania business 1 0.0 - 90 0.4 5,897.0 195 0.6 215.4 200 - 102.2
OPM(%) 0.0 1.5 1.4 2.2 0.7 2.1 -0.1
海外事業 Overseas business 3,688 17.6 - 8,617 36.1 233.6 17,042 49.5 197.8 17,100 45.0 100.3
OPM(%) 7.6 11.1 3.5 15.6 4.5 14.4 -1.3
その他 Others 360 1.7 - 478 2.0 132.9 586 1.7 122.5 600 1.6 102.3
OPM(%) - - - - - -
調整額 Adjustment 7 0.0 - 41 0.2 532.2 ▲ 253 ▲ 0.7 - ▲ 100 ▲ 0.3 -
OPM(%) - - - - - -
合計 Total 20,916 100.0 - 23,846 100.0 114.0 34,439 100.0 144.4 38,000 100.0 110.3
OPM(%) 9.5 9.2 -0.3 11.2 2.0 11.3 0.1
※ 国内事業 ・日本国内の直営店舗及びインターネットにて商品販売を行う事業 [Retail sales business at directly operated domestic stores and online store ]・日本国内の無印良品ライセンス供与先へ商品卸売を行う事業 [Wholesale business to domestic licensed companies ]・日本国内の飲食事業、キャンプ事業、住宅販売事業、IDEE事業 [Dining , campsite , housing sales , logistic and IDEE domestic business ]
※ 東アジア地域事業 ・東アジア地域において商品販売を行う事業 [Sales business in East Asian area ]※ 欧米地域事業 ・欧州、米州地域において商品販売を行う事業 [Sales business in European and Americas area ]※ 西南アジア・オセアニア地域事業 ・東アジアを除くアジア、オセアニア地域において商品販売を行う事業 [Sales business in Asian exept East Asian and Oceania area ]※ その他 ・調達物流事業 [Sourcing business ]
決算概要 Financial Summary
Ⅱ.セグメント別 Consolidated Segment
2014/02期 2015/02期 2016/02期 2017/02期[営業収益]Consolidated segment revenue from operations
2014/03-2015/02 2015/03-2016/02 Fiscal Year [Forecast]
Fiscal Year [Forecast]
2014/02期 2015/02期
2013/03-2014/02 2014/03-2015/02 2015/03-2016/02
[セグメント利益 (営業利益)]Consolidated segment operating profit
2016/02期 2017/02期2013/03-2014/02
7
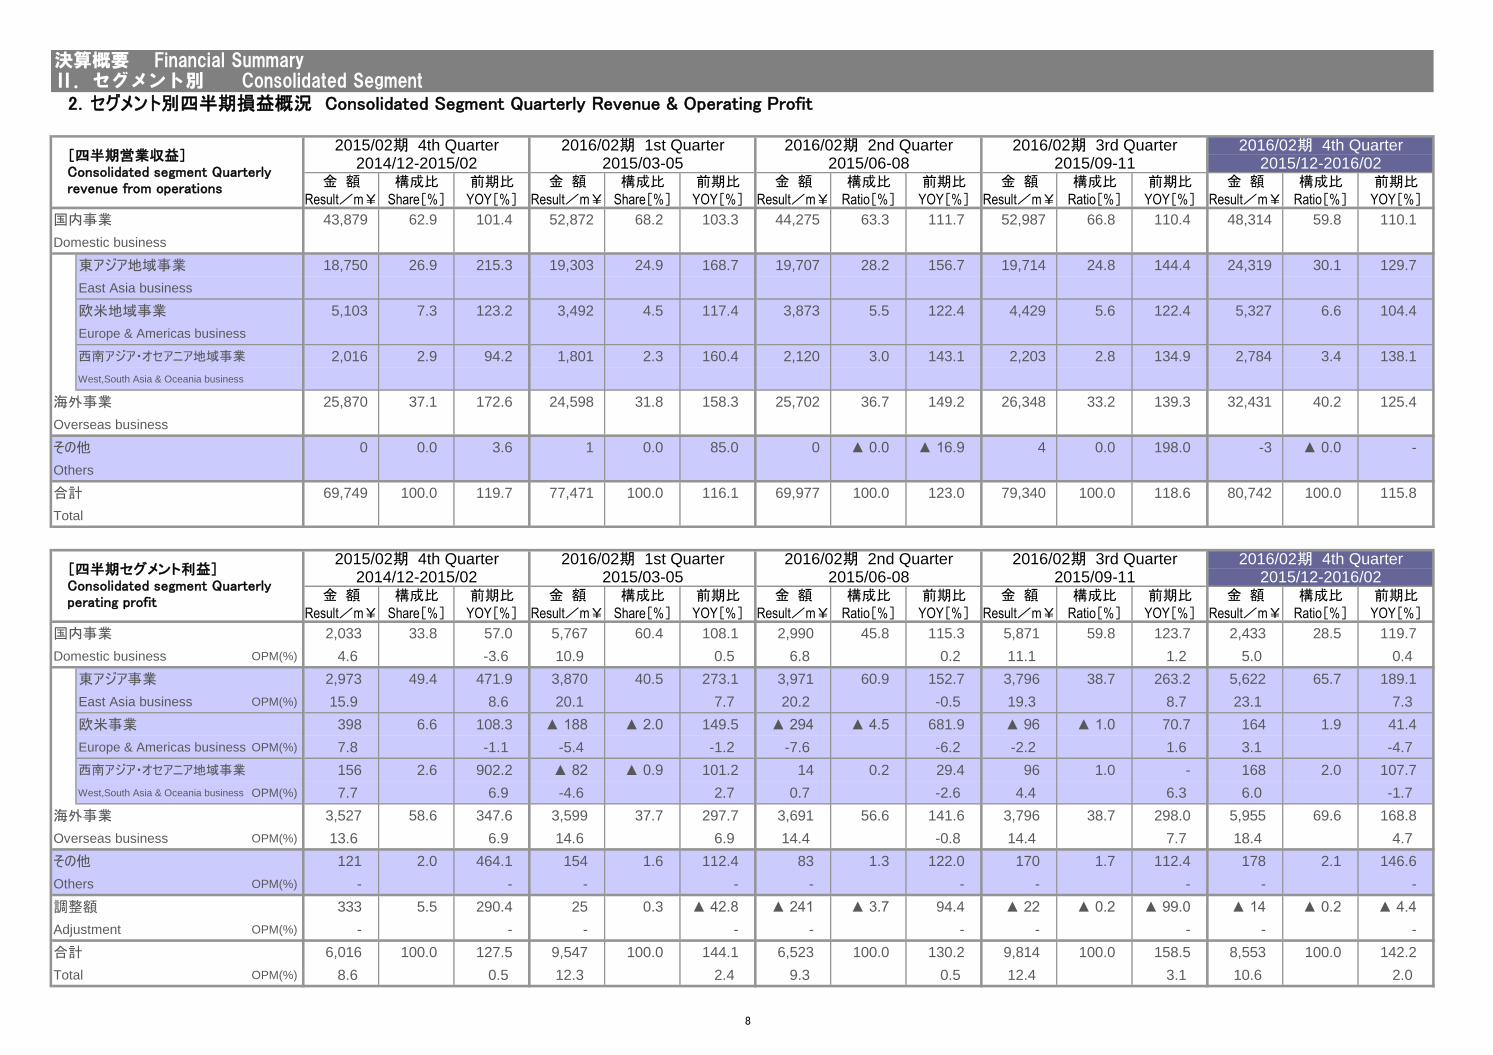
2.セグメント別四半期損益概況 Consolidated Segment Quarterly Revenue & Operating Profit
金 額 構成比 前期比 金 額 構成比 前期比 金 額 構成比 前期比 金 額 構成比 前期比 金 額 構成比 前期比Result/m¥ Share[%] YOY[%] Result/m¥ Share[%] YOY[%] Result/m¥ Ratio[%] YOY[%] Result/m¥ Ratio[%] YOY[%] Result/m¥ Ratio[%] YOY[%]
国内事業 43,879 62.9 101.4 52,872 68.2 103.3 44,275 63.3 111.7 52,987 66.8 110.4 48,314 59.8 110.1
Domestic business
東アジア地域事業 18,750 26.9 215.3 19,303 24.9 168.7 19,707 28.2 156.7 19,714 24.8 144.4 24,319 30.1 129.7
East Asia business
欧米地域事業 5,103 7.3 123.2 3,492 4.5 117.4 3,873 5.5 122.4 4,429 5.6 122.4 5,327 6.6 104.4
Europe & Americas business
西南アジア・オセアニア地域事業 2,016 2.9 94.2 1,801 2.3 160.4 2,120 3.0 143.1 2,203 2.8 134.9 2,784 3.4 138.1
West,South Asia & Oceania business
海外事業 25,870 37.1 172.6 24,598 31.8 158.3 25,702 36.7 149.2 26,348 33.2 139.3 32,431 40.2 125.4
Overseas business
その他 0 0.0 3.6 1 0.0 85.0 0 ▲ 0.0 ▲ 16.9 4 0.0 198.0 -3 ▲ 0.0 -
Others
合計 69,749 100.0 119.7 77,471 100.0 116.1 69,977 100.0 123.0 79,340 100.0 118.6 80,742 100.0 115.8
Total
金 額 構成比 前期比 金 額 構成比 前期比 金 額 構成比 前期比 金 額 構成比 前期比 金 額 構成比 前期比Result/m¥ Share[%] YOY[%] Result/m¥ Share[%] YOY[%] Result/m¥ Ratio[%] YOY[%] Result/m¥ Ratio[%] YOY[%] Result/m¥ Ratio[%] YOY[%]
国内事業 2,033 33.8 57.0 5,767 60.4 108.1 2,990 45.8 115.3 5,871 59.8 123.7 2,433 28.5 119.7
Domestic business OPM(%) 4.6 -3.6 10.9 0.5 6.8 0.2 11.1 1.2 5.0 0.4
東アジア事業 2,973 49.4 471.9 3,870 40.5 273.1 3,971 60.9 152.7 3,796 38.7 263.2 5,622 65.7 189.1
East Asia business OPM(%) 15.9 8.6 20.1 7.7 20.2 -0.5 19.3 8.7 23.1 7.3
欧米事業 398 6.6 108.3 ▲ 188 ▲ 2.0 149.5 ▲ 294 ▲ 4.5 681.9 ▲ 96 ▲ 1.0 70.7 164 1.9 41.4
Europe & Americas business OPM(%) 7.8 -1.1 -5.4 -1.2 -7.6 -6.2 -2.2 1.6 3.1 -4.7
西南アジア・オセアニア地域事業 156 2.6 902.2 ▲ 82 ▲ 0.9 101.2 14 0.2 29.4 96 1.0 - 168 2.0 107.7
West,South Asia & Oceania business OPM(%) 7.7 6.9 -4.6 2.7 0.7 -2.6 4.4 6.3 6.0 -1.7
海外事業 3,527 58.6 347.6 3,599 37.7 297.7 3,691 56.6 141.6 3,796 38.7 298.0 5,955 69.6 168.8
Overseas business OPM(%) 13.6 6.9 14.6 6.9 14.4 -0.8 14.4 7.7 18.4 4.7
その他 121 2.0 464.1 154 1.6 112.4 83 1.3 122.0 170 1.7 112.4 178 2.1 146.6
Others OPM(%) - - - - - - - - - -
調整額 333 5.5 290.4 25 0.3 ▲ 42.8 ▲ 241 ▲ 3.7 94.4 ▲ 22 ▲ 0.2 ▲ 99.0 ▲ 14 ▲ 0.2 ▲ 4.4
Adjustment OPM(%) - - - - - - - - - -
合計 6,016 100.0 127.5 9,547 100.0 144.1 6,523 100.0 130.2 9,814 100.0 158.5 8,553 100.0 142.2
Total OPM(%) 8.6 0.5 12.3 2.4 9.3 0.5 12.4 3.1 10.6 2.0
2015/03-05 2015/06-08 2015/09-11 2015/12-2016/02
2016/02期 4th Quarter
決算概要 Financial SummaryⅡ.セグメント別 Consolidated Segment
2016/02期 1st Quarter 2016/02期 2nd Quarter 2016/02期 3rd Quarter 2016/02期 4th Quarter2015/02期 4th Quarter2014/12-2015/02
[四半期営業収益]Consolidated segment Quarterlyrevenue from operations
2016/02期 1st Quarter 2016/02期 2nd Quarter 2016/02期 3rd Quarter2015/02期 4th Quarter2014/12-2015/02
[四半期セグメント利益]Consolidated segment Quarterlyperating profit
2015/03-05 2015/06-08 2015/09-11 2015/12-2016/02
8
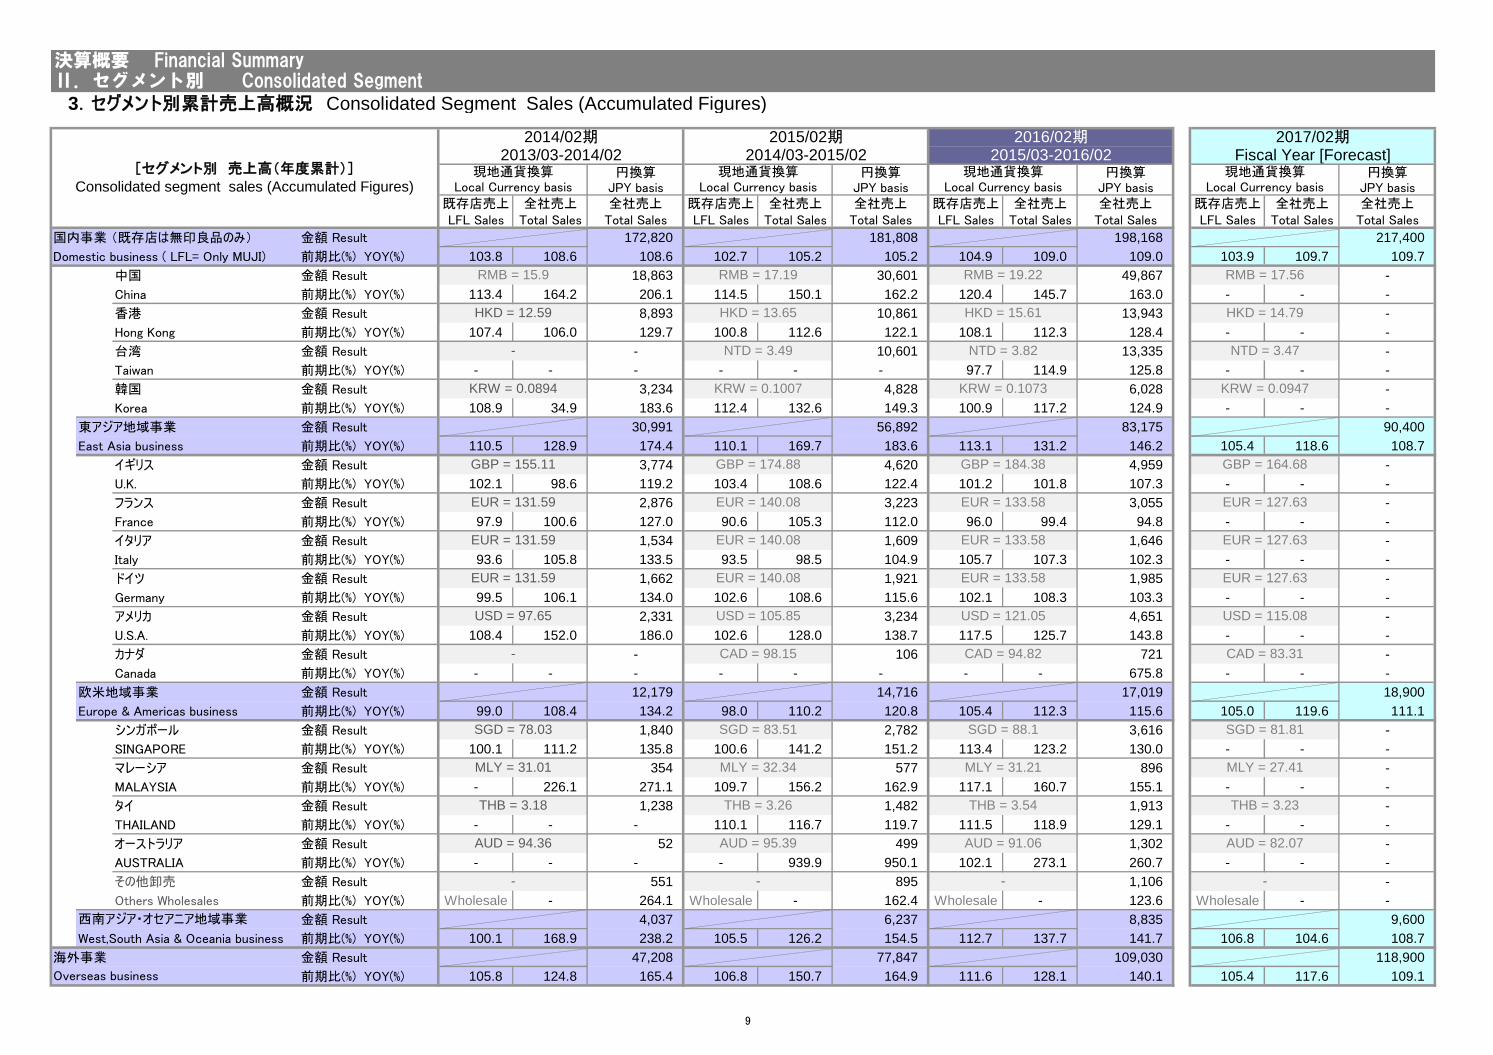
3.セグメント別累計売上高概況 Consolidated Segment Sales (Accumulated Figures)
円換算 円換算 円換算 円換算JPY basis JPY basis JPY basis JPY basis
既存店売上 全社売上 全社売上 既存店売上 全社売上 全社売上 既存店売上 全社売上 全社売上 既存店売上 全社売上 全社売上LFL Sales Total Sales Total Sales LFL Sales Total Sales Total Sales LFL Sales Total Sales Total Sales LFL Sales Total Sales Total Sales
国内事業 '既存店は無印良品のみ( 金額 Result 172,820 181,808 198,168 217,400
Domestic business ( LFL= Only MUJI) 前期比(%) YOY(%) 103.8 108.6 108.6 102.7 105.2 105.2 104.9 109.0 109.0 103.9 109.7 109.7
中国 金額 Result 18,863 30,601 49,867 -
China 前期比(%) YOY(%) 113.4 164.2 206.1 114.5 150.1 162.2 120.4 145.7 163.0 - - -
香港 金額 Result 8,893 10,861 13,943 -
Hong Kong 前期比(%) YOY(%) 107.4 106.0 129.7 100.8 112.6 122.1 108.1 112.3 128.4 - - -
台湾 金額 Result - 10,601 13,335 -
Taiwan 前期比(%) YOY(%) - - - - - - 97.7 114.9 125.8 - - -
韓国 金額 Result 3,234 4,828 6,028 -
Korea 前期比(%) YOY(%) 108.9 34.9 183.6 112.4 132.6 149.3 100.9 117.2 124.9 - - -
東アジア地域事業 金額 Result 30,991 56,892 83,175 90,400
East Asia business 前期比(%) YOY(%) 110.5 128.9 174.4 110.1 169.7 183.6 113.1 131.2 146.2 105.4 118.6 108.7
イギリス 金額 Result 3,774 4,620 4,959 -
U.K. 前期比(%) YOY(%) 102.1 98.6 119.2 103.4 108.6 122.4 101.2 101.8 107.3 - - -
フランス 金額 Result 2,876 3,223 3,055 -
France 前期比(%) YOY(%) 97.9 100.6 127.0 90.6 105.3 112.0 96.0 99.4 94.8 - - -
イタリア 金額 Result 1,534 1,609 1,646 -
Italy 前期比(%) YOY(%) 93.6 105.8 133.5 93.5 98.5 104.9 105.7 107.3 102.3 - - -
ドイツ 金額 Result 1,662 1,921 1,985 -
Germany 前期比(%) YOY(%) 99.5 106.1 134.0 102.6 108.6 115.6 102.1 108.3 103.3 - - -
アメリカ 金額 Result 2,331 3,234 4,651 -
U.S.A. 前期比(%) YOY(%) 108.4 152.0 186.0 102.6 128.0 138.7 117.5 125.7 143.8 - - -
カナダ 金額 Result - 106 721 -
Canada 前期比(%) YOY(%) - - - - - - - - 675.8 - - -
欧米地域事業 金額 Result 12,179 14,716 17,019 18,900
Europe & Americas business 前期比(%) YOY(%) 99.0 108.4 134.2 98.0 110.2 120.8 105.4 112.3 115.6 105.0 119.6 111.1
シンガポール 金額 Result 1,840 2,782 3,616 -
SINGAPORE 前期比(%) YOY(%) 100.1 111.2 135.8 100.6 141.2 151.2 113.4 123.2 130.0 - - -
マレーシア 金額 Result 354 577 896 -
MALAYSIA 前期比(%) YOY(%) - 226.1 271.1 109.7 156.2 162.9 117.1 160.7 155.1 - - -
タイ 金額 Result 1,238 1,482 1,913 -
THAILAND 前期比(%) YOY(%) - - - 110.1 116.7 119.7 111.5 118.9 129.1 - - -
オーストラリア 金額 Result 52 499 1,302 -
AUSTRALIA 前期比(%) YOY(%) - - - - 939.9 950.1 102.1 273.1 260.7 - - -
その他卸売 金額 Result 551 895 1,106 -
Others Wholesales 前期比(%) YOY(%) Wholesale - 264.1 Wholesale - 162.4 Wholesale - 123.6 Wholesale - -
金額 Result 4,037 6,237 8,835 9,600
West,South Asia & Oceania business 前期比(%) YOY(%) 100.1 168.9 238.2 105.5 126.2 154.5 112.7 137.7 141.7 106.8 104.6 108.7
海外事業 金額 Result 47,208 77,847 109,030 118,900
前期比(%) YOY(%) 105.8 124.8 165.4 106.8 150.7 164.9 111.6 128.1 140.1 105.4 117.6 109.1
2017/02期Fiscal Year [Forecast]
西南アジア・オセアニア地域事業
Overseas business
[セグメント別 売上高'年度累計(]Consolidated segment sales (Accumulated Figures)
EUR = 140.08
EUR = 140.08
EUR = 140.08
USD = 105.85
CAD = 98.15
SGD = 83.51
MLY = 32.34
THB = 3.26
- - - -
CAD = 83.31
SGD = 81.81
MLY = 27.41
THB = 3.23
決算概要 Financial SummaryⅡ.セグメント別 Consolidated Segment
2014/02期 2015/02期 2016/02期2013/03-2014/02 2014/03-2015/02 2015/03-2016/02
RMB = 17.19
HKD = 13.65
NTD = 3.49
KRW = 0.1007
GBP = 174.88
AUD = 95.39
RMB = 15.9
Local Currency basis現地通貨換算 現地通貨換算
Local Currency basis
SGD = 78.03
現地通貨換算現地通貨換算
EUR = 131.59
EUR = 131.59
EUR = 131.59
USD = 97.65
-
EUR = 127.63
USD = 115.08
KRW = 0.0947
GBP = 164.68
Local Currency basis Local Currency basis
MLY = 31.01
THB = 3.18
AUD = 94.36 AUD = 91.06
KRW = 0.0894
GBP = 155.11
HKD = 12.59
-
RMB = 19.22
HKD = 15.61
NTD = 3.82
KRW = 0.1073
GBP = 184.38
EUR = 133.58
EUR = 133.58
EUR = 133.58
USD = 121.05
CAD = 94.82
SGD = 88.1
MLY = 31.21
THB = 3.54
EUR = 127.63
EUR = 127.63
AUD = 82.07
RMB = 17.56
HKD = 14.79
NTD = 3.47
9
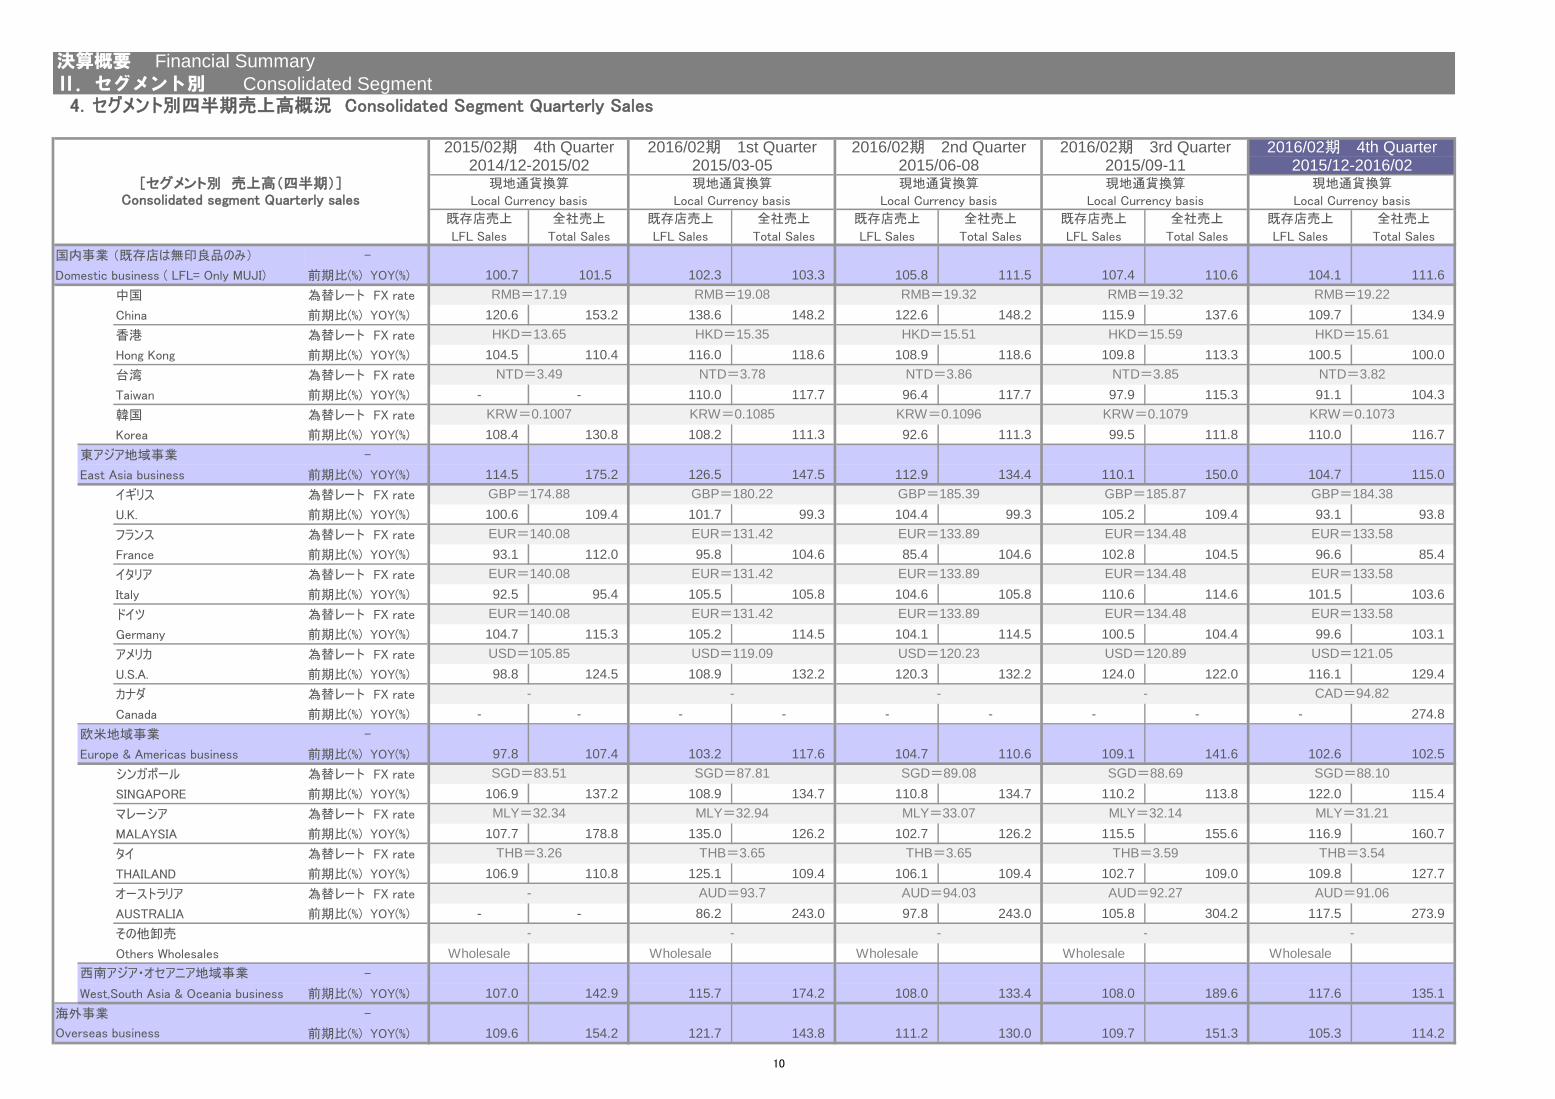
4.セグメント別四半期売上高概況 Consolidated Segment Quarterly Sales
既存店売上 全社売上 既存店売上 全社売上 既存店売上 全社売上 既存店売上 全社売上 既存店売上 全社売上
LFL Sales Total Sales LFL Sales Total Sales LFL Sales Total Sales LFL Sales Total Sales LFL Sales Total Sales
国内事業 '既存店は無印良品のみ( -
Domestic business ( LFL= Only MUJI) 前期比(%) YOY(%) 100.7 101.5 102.3 103.3 105.8 111.5 107.4 110.6 104.1 111.6
中国 為替レート FX rate
China 前期比(%) YOY(%) 120.6 153.2 138.6 148.2 122.6 148.2 115.9 137.6 109.7 134.9
香港 為替レート FX rate
Hong Kong 前期比(%) YOY(%) 104.5 110.4 116.0 118.6 108.9 118.6 109.8 113.3 100.5 100.0
台湾 為替レート FX rate
Taiwan 前期比(%) YOY(%) - - 110.0 117.7 96.4 117.7 97.9 115.3 91.1 104.3
韓国 為替レート FX rate
Korea 前期比(%) YOY(%) 108.4 130.8 108.2 111.3 92.6 111.3 99.5 111.8 110.0 116.7
東アジア地域事業 -
East Asia business 前期比(%) YOY(%) 114.5 175.2 126.5 147.5 112.9 134.4 110.1 150.0 104.7 115.0
イギリス 為替レート FX rate
U.K. 前期比(%) YOY(%) 100.6 109.4 101.7 99.3 104.4 99.3 105.2 109.4 93.1 93.8
フランス 為替レート FX rate
France 前期比(%) YOY(%) 93.1 112.0 95.8 104.6 85.4 104.6 102.8 104.5 96.6 85.4
イタリア 為替レート FX rate
Italy 前期比(%) YOY(%) 92.5 95.4 105.5 105.8 104.6 105.8 110.6 114.6 101.5 103.6
ドイツ 為替レート FX rate
Germany 前期比(%) YOY(%) 104.7 115.3 105.2 114.5 104.1 114.5 100.5 104.4 99.6 103.1
アメリカ 為替レート FX rate
U.S.A. 前期比(%) YOY(%) 98.8 124.5 108.9 132.2 120.3 132.2 124.0 122.0 116.1 129.4
カナダ 為替レート FX rate
Canada 前期比(%) YOY(%) - - - - - - - - - 274.8
欧米地域事業 -
Europe & Americas business 前期比(%) YOY(%) 97.8 107.4 103.2 117.6 104.7 110.6 109.1 141.6 102.6 102.5
シンガポール 為替レート FX rate
SINGAPORE 前期比(%) YOY(%) 106.9 137.2 108.9 134.7 110.8 134.7 110.2 113.8 122.0 115.4
マレーシア 為替レート FX rate
MALAYSIA 前期比(%) YOY(%) 107.7 178.8 135.0 126.2 102.7 126.2 115.5 155.6 116.9 160.7
タイ 為替レート FX rate
THAILAND 前期比(%) YOY(%) 106.9 110.8 125.1 109.4 106.1 109.4 102.7 109.0 109.8 127.7
オーストラリア 為替レート FX rate
AUSTRALIA 前期比(%) YOY(%) - - 86.2 243.0 97.8 243.0 105.8 304.2 117.5 273.9
その他卸売
Others Wholesales Wholesale Wholesale Wholesale Wholesale Wholesale
-
West,South Asia & Oceania business 前期比(%) YOY(%) 107.0 142.9 115.7 174.2 108.0 133.4 108.0 189.6 117.6 135.1
海外事業 -
前期比(%) YOY(%) 109.6 154.2 121.7 143.8 111.2 130.0 109.7 151.3 105.3 114.2
- CAD=94.82
- - - - -
西南アジア・オセアニア地域事業
Overseas business
THB=3.65 THB=3.59 THB=3.54
HKD=13.65 HKD=15.35
USD=105.85 USD=119.09 USD=120.23 USD=120.89 USD=121.05
EUR=140.08 EUR=131.42 EUR=133.89 EUR=134.48 EUR=133.58
SGD=83.51 SGD=87.81 SGD=89.08
THB=3.26 THB=3.65
2016/02期 4th Quarter2014/12-2015/02 2015/03-05 2015/06-08 2015/09-11 2015/12-2016/02
RMB=19.22RMB=19.32RMB=19.32RMB=19.08RMB=17.19
決算概要 Financial Summary
Ⅱ.セグメント別 Consolidated Segment
[セグメント別 売上高'四半期(]Consolidated segment Quarterly sales
2015/02期 4th Quarter 2016/02期 1st Quarter 2016/02期 2nd Quarter 2016/02期 3rd Quarter
現地通貨換算
Local Currency basis
現地通貨換算
Local Currency basis
現地通貨換算
Local Currency basis
現地通貨換算
Local Currency basis
現地通貨換算
Local Currency basis
GBP=185.87 GBP=184.38
KRW=0.1007 KRW=0.1085 KRW=0.1096 KRW=0.1079 KRW=0.1073
HKD=15.51 HKD=15.59 HKD=15.61
NTD=3.49 NTD=3.78 NTD=3.86 NTD=3.85 NTD=3.82
GBP=174.88 GBP=180.22 GBP=185.39
- AUD=93.7 AUD=94.03 AUD=92.27 AUD=91.06
MLY=32.34 MLY=32.94 MLY=33.07 MLY=32.14 MLY=31.21
SGD=88.69 SGD=88.10
- - -
EUR=140.08 EUR=131.42 EUR=133.89 EUR=134.48 EUR=133.58
EUR=140.08 EUR=131.42 EUR=133.89 EUR=134.48 EUR=133.58
10
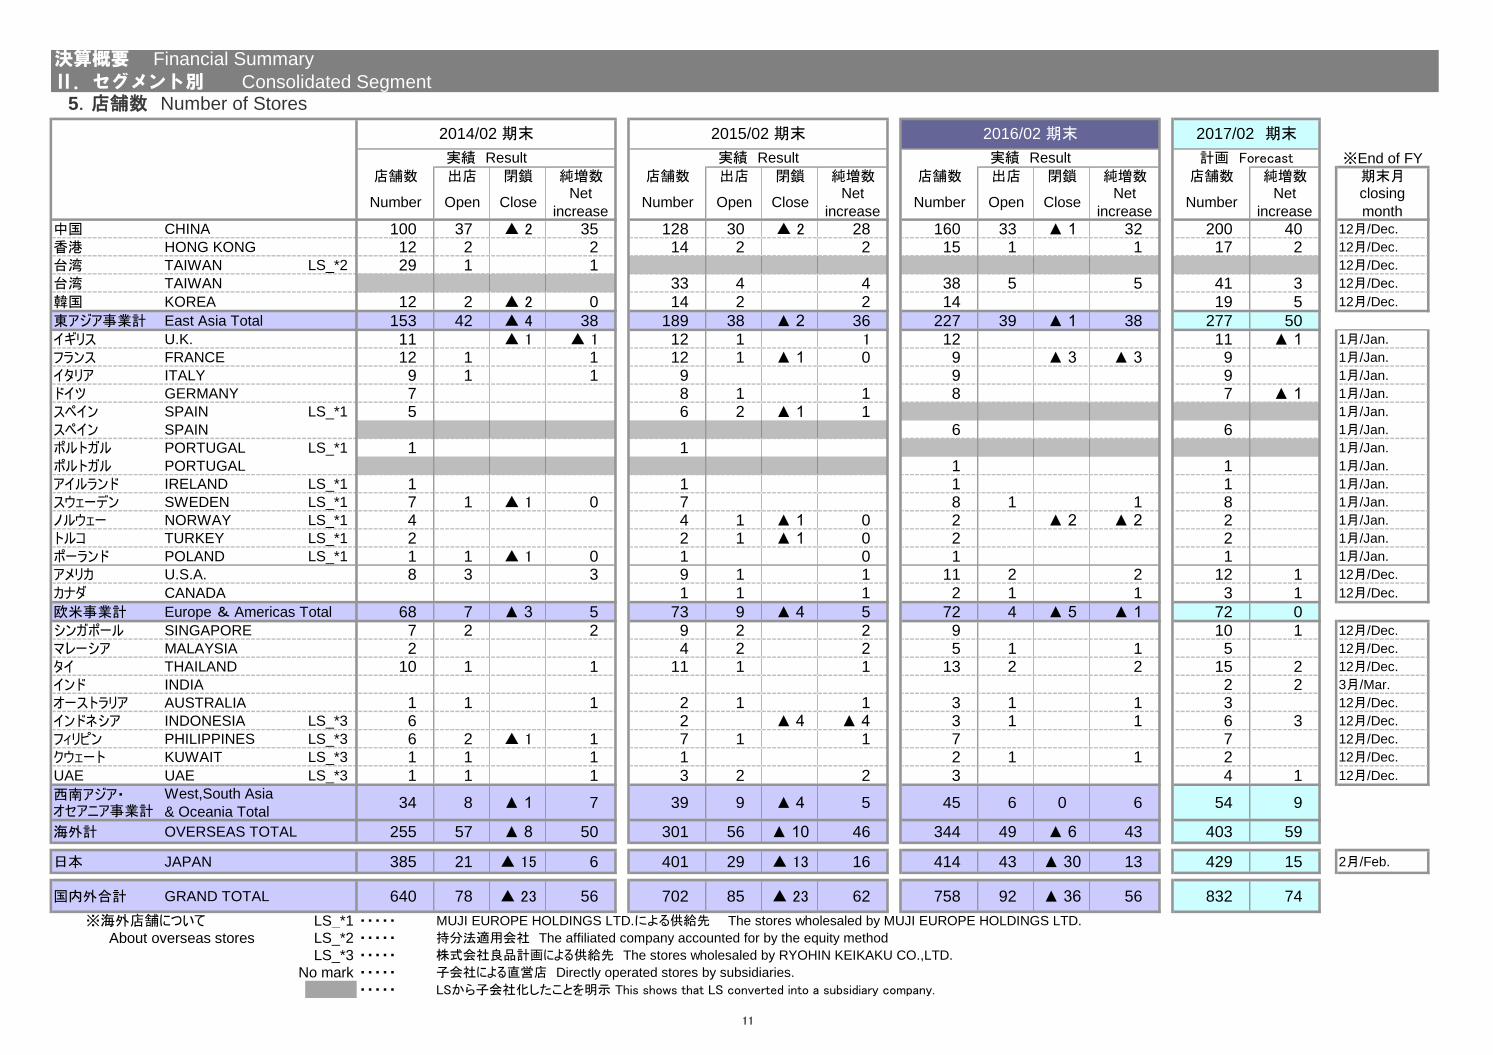
5.店舗数 Number of Stores
※End of FY
店舗数 出店 閉鎖 純増数 店舗数 出店 閉鎖 純増数 店舗数 出店 閉鎖 純増数 店舗数 純増数 期末月
Number Open CloseNet
increaseNumber Open Close
Net
increaseNumber Open Close
Net
increaseNumber
Net
increase
closing
month
中国 CHINA 100 37 ▲ 2 35 128 30 ▲ 2 28 160 33 ▲ 1 32 200 40 12月/Dec.
香港 HONG KONG 12 2 0 2 14 2 0 2 15 1 0 1 17 2 12月/Dec.
台湾 TAIWAN LS_*2 29 1 0 1 12月/Dec.
台湾 TAIWAN 33 4 0 4 38 5 0 5 41 3 12月/Dec.
韓国 KOREA 12 2 ▲ 2 0 14 2 0 2 14 0 0 19 5 12月/Dec.
東アジア事業計 East Asia Total 153 42 ▲ 4 38 189 38 ▲ 2 36 227 39 ▲ 1 38 277 50イギリス U.K. 11 0 ▲ 1 ▲ 1 12 1 0 1 12 0 0 11 ▲ 1 1月/Jan.
フランス FRANCE 12 1 0 1 12 1 ▲ 1 0 9 ▲ 3 ▲ 3 9 0 1月/Jan.
イタリア ITALY 9 1 0 1 9 0 0 0 9 0 0 0 9 0 1月/Jan.
ドイツ GERMANY 7 0 0 8 1 0 1 8 0 0 7 ▲ 1 1月/Jan.
スペイン SPAIN LS_*1 5 0 0 6 2 ▲ 1 1 1月/Jan.
スペイン SPAIN 6 0 6 0 1月/Jan.
ポルトガル PORTUGAL LS_*1 1 0 0 0 1 0 0 0 1月/Jan.
ポルトガル PORTUGAL 1 0 0 0 1 0 1月/Jan.
アイルランド IRELAND LS_*1 1 0 0 0 1 0 0 0 1 0 0 0 1 0 1月/Jan.
スウェーデン SWEDEN LS_*1 7 1 ▲ 1 0 7 0 0 0 8 1 0 1 8 0 1月/Jan.
ノルウェー NORWAY LS_*1 4 0 0 4 1 ▲ 1 0 2 ▲ 2 ▲ 2 2 0 1月/Jan.
トルコ TURKEY LS_*1 2 0 0 0 2 1 ▲ 1 0 2 0 2 0 1月/Jan.
ポーランド POLAND LS_*1 1 1 ▲ 1 0 1 0 0 0 1 0 0 0 1 0 1月/Jan.
アメリカ U.S.A. 8 3 3 9 1 0 1 11 2 0 2 12 1 12月/Dec.
カナダ CANADA 1 1 0 1 2 1 0 1 3 1 12月/Dec.
欧米事業計 Europe & Americas Total 68 7 ▲ 3 5 73 9 ▲ 4 5 72 4 ▲ 5 ▲ 1 72 0シンガポール SINGAPORE 7 2 0 2 9 2 0 2 9 0 0 10 1 12月/Dec.
マレーシア MALAYSIA 2 0 0 4 2 0 2 5 1 0 1 5 0 12月/Dec.
タイ THAILAND 10 1 1 11 1 0 1 13 2 0 2 15 2 12月/Dec.
インド INDIA 2 2 3月/Mar.
オーストラリア AUSTRALIA 1 1 1 2 1 0 1 3 1 0 1 3 0 12月/Dec.
インドネシア INDONESIA LS_*3 6 0 0 2 0 ▲ 4 ▲ 4 3 1 1 6 3 12月/Dec.
フィリピン PHILIPPINES LS_*3 6 2 ▲ 1 1 7 1 0 1 7 0 0 7 0 12月/Dec.
クウェート KUWAIT LS_*3 1 1 1 1 0 0 0 2 1 0 1 2 0 12月/Dec.
UAE UAE LS_*3 1 1 1 3 2 0 2 3 0 0 4 1 12月/Dec.
西南アジア・オセアニア事業計
West,South Asia
& Oceania Total34 8 ▲ 1 7 39 9 ▲ 4 5 45 6 0 6 54 9
海外計 OVERSEAS TOTAL 255 57 ▲ 8 50 301 56 ▲ 10 46 344 49 ▲ 6 43 403 59
日本 JAPAN 385 21 ▲ 15 6 401 29 ▲ 13 16 414 43 ▲ 30 13 429 15 2月/Feb.
国内外合計 GRAND TOTAL 640 78 ▲ 23 56 702 85 ▲ 23 62 758 92 ▲ 36 56 832 74
※海外店舗について LS_*1 ・・・・・ MUJI EUROPE HOLDINGS LTD.による供給先 The stores wholesaled by MUJI EUROPE HOLDINGS LTD.
LS_*2 ・・・・・ 持分法適用会社 The affiliated company accounted for by the equity method
LS_*3 ・・・・・ 株式会社良品計画による供給先 The stores wholesaled by RYOHIN KEIKAKU CO.,LTD.
No mark ・・・・・ 子会社による直営店 Directly operated stores by subsidiaries.
・・・・・ LSから子会社化したことを明示 This shows that LS converted into a subsidiary company.
決算概要 Financial Summary
Ⅱ.セグメント別 Consolidated Segment
実績 Result 実績 Result 実績 Result 計画 Forecast
2014/02 期末 2015/02 期末 2016/02 期末 2017/02 期末
About overseas stores
11
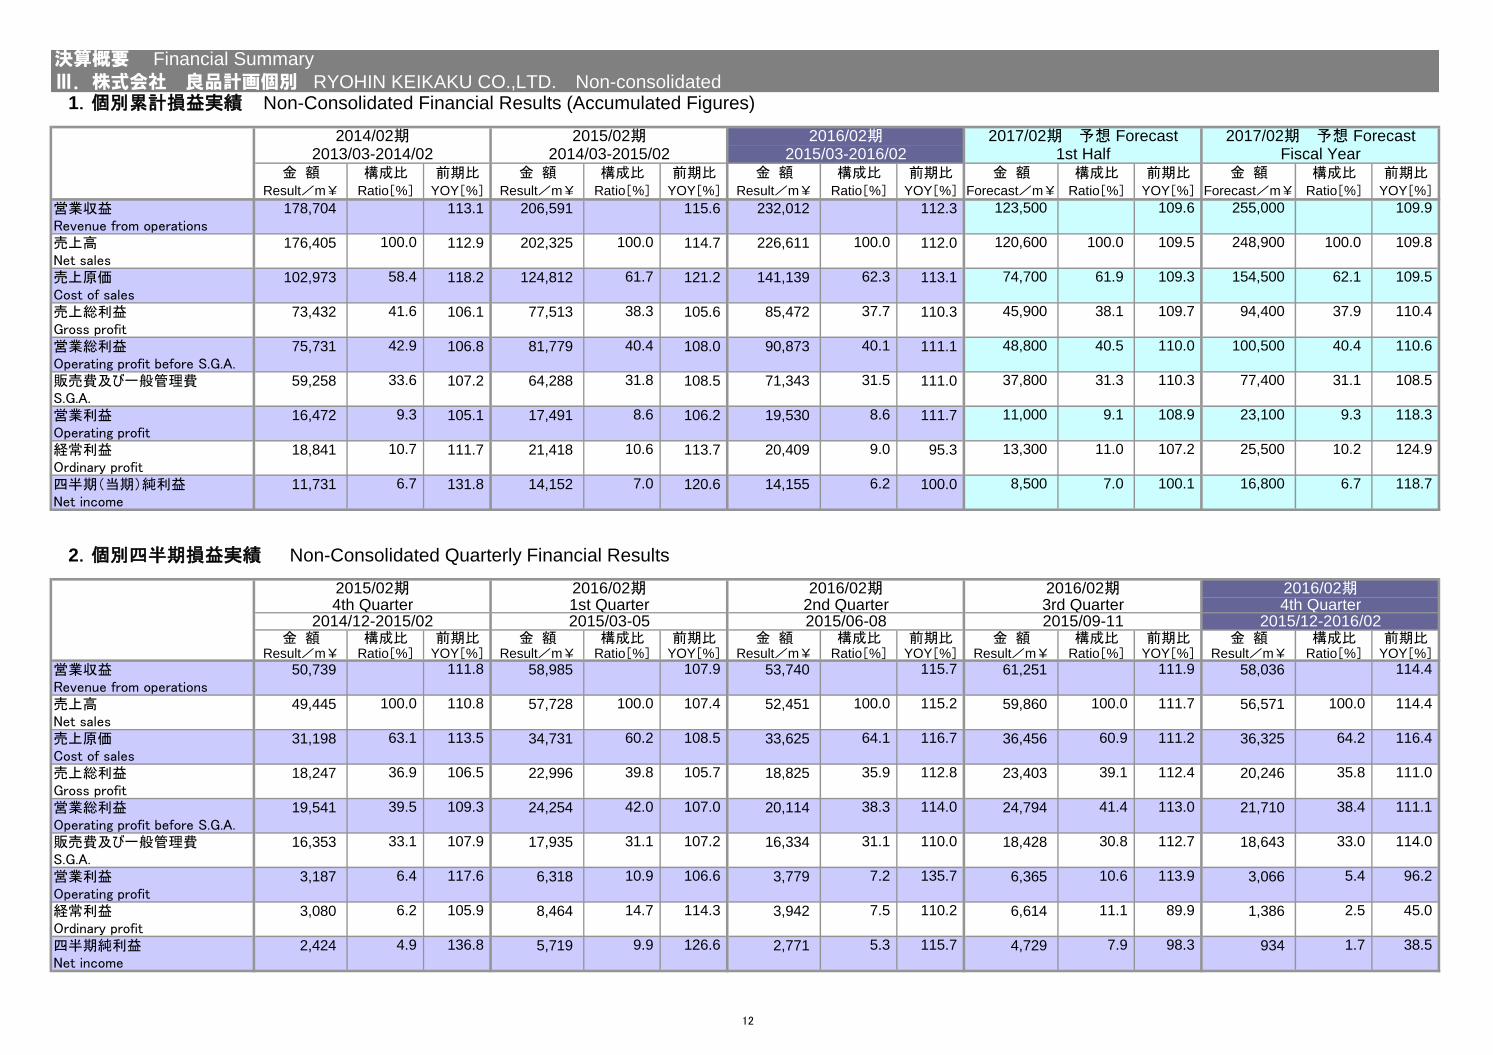
金 額 構成比 前期比 金 額 構成比 前期比 金 額 構成比 前期比 金 額 構成比 前期比 金 額 構成比 前期比Result/m¥ Ratio[%] YOY[%] Result/m¥ Ratio[%] YOY[%] Result/m¥ Ratio[%] YOY[%] Forecast/m¥ Ratio[%] YOY[%] Forecast/m¥ Ratio[%] YOY[%]
営業収益 178,704 113.1 206,591 115.6 232,012 112.3 123,500 109.6 255,000 109.9
Revenue from operations売上高 176,405 100.0 112.9 202,325 100.0 114.7 226,611 100.0 112.0 120,600 100.0 109.5 248,900 100.0 109.8
Net sales売上原価 102,973 58.4 118.2 124,812 61.7 121.2 141,139 62.3 113.1 74,700 61.9 109.3 154,500 62.1 109.5
Cost of sales売上総利益 73,432 41.6 106.1 77,513 38.3 105.6 85,472 37.7 110.3 45,900 38.1 109.7 94,400 37.9 110.4
Gross profit営業総利益 75,731 42.9 106.8 81,779 40.4 108.0 90,873 40.1 111.1 48,800 40.5 110.0 100,500 40.4 110.6
Operating profit before S.G.A.販売費及び一般管理費 59,258 33.6 107.2 64,288 31.8 108.5 71,343 31.5 111.0 37,800 31.3 110.3 77,400 31.1 108.5
S.G.A.営業利益 16,472 9.3 105.1 17,491 8.6 106.2 19,530 8.6 111.7 11,000 9.1 108.9 23,100 9.3 118.3
Operating profit 経常利益 18,841 10.7 111.7 21,418 10.6 113.7 20,409 9.0 95.3 13,300 11.0 107.2 25,500 10.2 124.9
Ordinary profit四半期'当期(純利益 11,731 6.7 131.8 14,152 7.0 120.6 14,155 6.2 100.0 8,500 7.0 100.1 16,800 6.7 118.7
Net income
金 額 構成比 前期比 金 額 構成比 前期比 金 額 構成比 前期比 金 額 構成比 前期比 金 額 構成比 前期比Result/m¥ Ratio[%] YOY[%] Result/m¥ Ratio[%] YOY[%] Result/m¥ Ratio[%] YOY[%] Result/m¥ Ratio[%] YOY[%] Result/m¥ Ratio[%] YOY[%]
営業収益 50,739 111.8 58,985 107.9 53,740 115.7 61,251 111.9 58,036 114.4
Revenue from operations売上高 49,445 100.0 110.8 57,728 100.0 107.4 52,451 100.0 115.2 59,860 100.0 111.7 56,571 100.0 114.4
Net sales売上原価 31,198 63.1 113.5 34,731 60.2 108.5 33,625 64.1 116.7 36,456 60.9 111.2 36,325 64.2 116.4
Cost of sales売上総利益 18,247 36.9 106.5 22,996 39.8 105.7 18,825 35.9 112.8 23,403 39.1 112.4 20,246 35.8 111.0
Gross profit営業総利益 19,541 39.5 109.3 24,254 42.0 107.0 20,114 38.3 114.0 24,794 41.4 113.0 21,710 38.4 111.1
Operating profit before S.G.A.販売費及び一般管理費 16,353 33.1 107.9 17,935 31.1 107.2 16,334 31.1 110.0 18,428 30.8 112.7 18,643 33.0 114.0
S.G.A.営業利益 3,187 6.4 117.6 6,318 10.9 106.6 3,779 7.2 135.7 6,365 10.6 113.9 3,066 5.4 96.2
Operating profit 経常利益 3,080 6.2 105.9 8,464 14.7 114.3 3,942 7.5 110.2 6,614 11.1 89.9 1,386 2.5 45.0
Ordinary profit四半期純利益 2,424 4.9 136.8 5,719 9.9 126.6 2,771 5.3 115.7 4,729 7.9 98.3 934 1.7 38.5
Net income
2015/06-08 2015/09-11
2016/02期2015/03-2016/02
2014/02期2013/03-2014/02
2015/02期2014/03-2015/02
決算概要 Financial Summary
Ⅲ.株式会社 良品計画個別 RYOHIN KEIKAKU CO.,LTD. Non-consolidated1.個別累計損益実績 Non-Consolidated Financial Results (Accumulated Figures)
2.個別四半期損益実績 Non-Consolidated Quarterly Financial Results
2017/02期 予想 Forecast1st Half
2017/02期 予想 ForecastFiscal Year
2015/12-2016/022014/12-2015/02 2015/03-054th Quarter3rd Quarter4th Quarter 1st Quarter 2nd Quarter2016/02期2015/02期 2016/02期 2016/02期 2016/02期
12
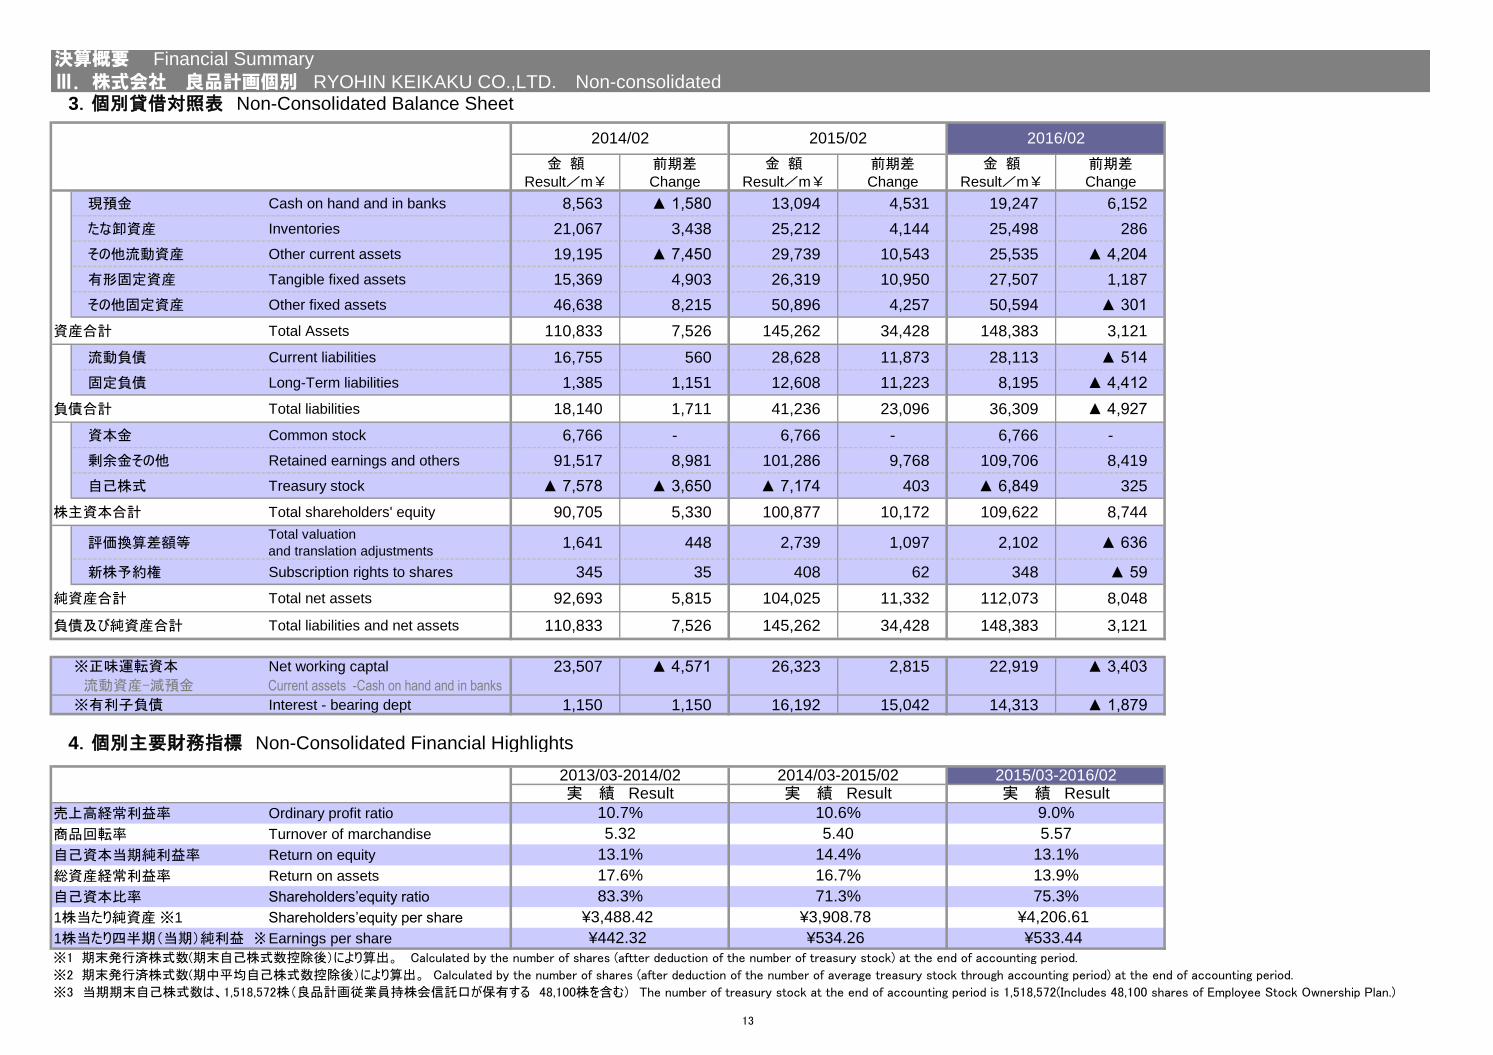
3.個別貸借対照表 Non-Consolidated Balance Sheet
金 額 前期差 金 額 前期差 金 額 前期差Result/m¥ Change Result/m¥ Change Result/m¥ Change
現預金 Cash on hand and in banks 8,563 ▲ 1,580 13,094 4,531 19,247 6,152
たな卸資産 Inventories 21,067 3,438 25,212 4,144 25,498 286
その他流動資産 Other current assets 19,195 ▲ 7,450 29,739 10,543 25,535 ▲ 4,204
有形固定資産 Tangible fixed assets 15,369 4,903 26,319 10,950 27,507 1,187
その他固定資産 Other fixed assets 46,638 8,215 50,896 4,257 50,594 ▲ 301
資産合計 Total Assets 110,833 7,526 145,262 34,428 148,383 3,121
流動負債 Current liabilities 16,755 560 28,628 11,873 28,113 ▲ 514
固定負債 Long-Term liabilities 1,385 1,151 12,608 11,223 8,195 ▲ 4,412
負債合計 Total liabilities 18,140 1,711 41,236 23,096 36,309 ▲ 4,927
資本金 Common stock 6,766 - 6,766 - 6,766 -
剰余金その他 Retained earnings and others 91,517 8,981 101,286 9,768 109,706 8,419
自己株式 Treasury stock ▲ 7,578 ▲ 3,650 ▲ 7,174 403 ▲ 6,849 325
株主資本合計 Total shareholders' equity 90,705 5,330 100,877 10,172 109,622 8,744
評価換算差額等Total valuation
and translation adjustments1,641 448 2,739 1,097 2,102 ▲ 636
新株予約権 Subscription rights to shares 345 35 408 62 348 ▲ 59
純資産合計 Total net assets 92,693 5,815 104,025 11,332 112,073 8,048
負債及び純資産合計 Total liabilities and net assets 110,833 7,526 145,262 34,428 148,383 3,121
※正味運転資本 Net working captal 23,507 ▲ 4,571 26,323 2,815 22,919 ▲ 3,403
流動資産-減預金 Current assets -Cash on hand and in banks
※有利子負債 Interest - bearing dept 1,150 1,150 16,192 15,042 14,313 ▲ 1,879
4.個別主要財務指標 Non-Consolidated Financial Highlights
売上高経常利益率 Ordinary profit ratio
商品回転率 Turnover of marchandise
自己資本当期純利益率 Return on equity
総資産経常利益率 Return on assets
自己資本比率 Shareholders’equity ratio
1株当たり純資産 ※1 Shareholders’equity per share
1株当たり四半期'当期(純利益 ※2Earnings per share
※1 期末発行済株式数(期末自己株式数控除後(により算出。 Calculated by the number of shares (aftter deduction of the number of treasury stock) at the end of accounting period.
※2 期末発行済株式数(期中平均自己株式数控除後(により算出。 Calculated by the number of shares (after deduction of the number of average treasury stock through accounting period) at the end of accounting period.
※3 当期期末自己株式数は、1,518,572株'良品計画従業員持株会信託口が保有する 48,100株を含む( The number of treasury stock at the end of accounting period is 1,518,572(Includes 48,100 shares of Employee Stock Ownership Plan.)
決算概要 Financial Summary
Ⅲ.株式会社 良品計画個別 RYOHIN KEIKAKU CO.,LTD. Non-consolidated
2014/02 2015/02 2016/02
実 績 Result 実 績 Result2015/03-2016/022013/03-2014/02 2014/03-2015/02
17.6%
実 績 Result
13.1%
16.7% 13.9%
9.0%
13.1%
10.7%
14.4%
10.6%
5.32 5.40 5.57
¥4,206.61
¥534.26
¥3,908.78
71.3% 75.3%
¥533.44¥442.32
¥3,488.42
83.3%
13
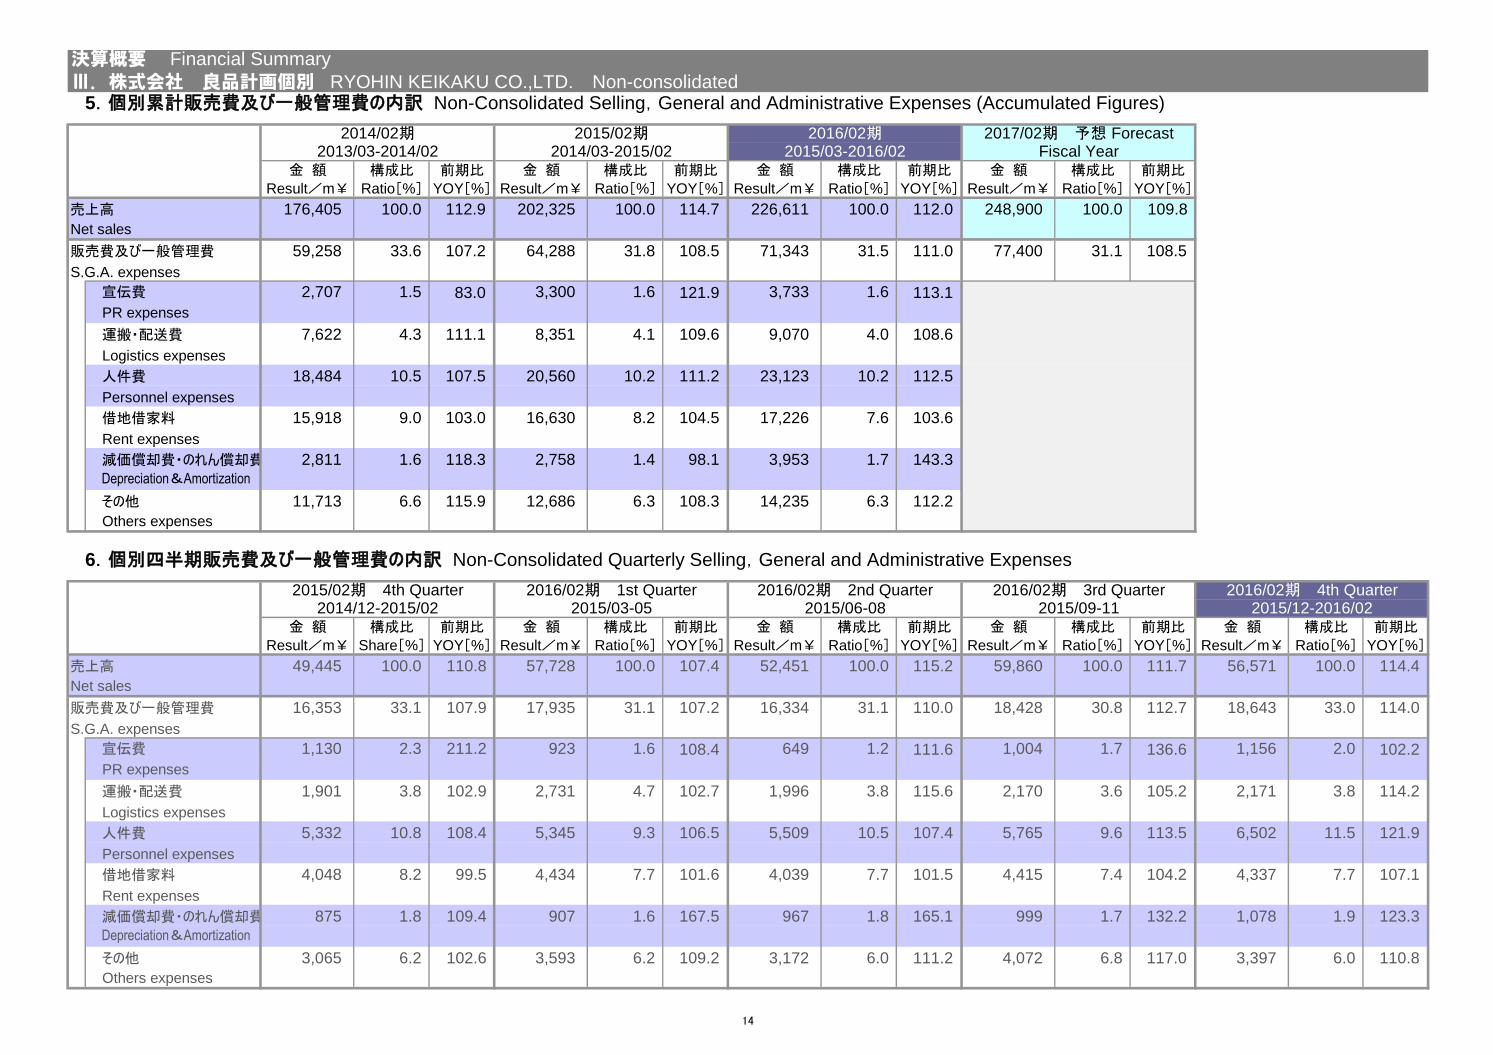
金 額 構成比 前期比 金 額 構成比 前期比 金 額 構成比 前期比 金 額 構成比 前期比Result/m¥ Ratio[%] YOY[%] Result/m¥ Ratio[%] YOY[%] Result/m¥ Ratio[%] YOY[%] Result/m¥ Ratio[%] YOY[%]
売上高 176,405 100.0 112.9 202,325 100.0 114.7 226,611 100.0 112.0 248,900 100.0 109.8
Net sales
販売費及び一般管理費 59,258 33.6 107.2 64,288 31.8 108.5 71,343 31.5 111.0 77,400 31.1 108.5
S.G.A. expenses
宣伝費 2,707 1.5 83.0 3,300 1.6 121.9 3,733 1.6 113.1
PR expenses
運搬・配送費 7,622 4.3 111.1 8,351 4.1 109.6 9,070 4.0 108.6
Logistics expenses
人件費 18,484 10.5 107.5 20,560 10.2 111.2 23,123 10.2 112.5
Personnel expenses
借地借家料 15,918 9.0 103.0 16,630 8.2 104.5 17,226 7.6 103.6
Rent expenses
減価償却費・のれん償却費 2,811 1.6 118.3 2,758 1.4 98.1 3,953 1.7 143.3Depreciation&Amortization
その他 11,713 6.6 115.9 12,686 6.3 108.3 14,235 6.3 112.2
Others expenses
金 額 構成比 前期比 金 額 構成比 前期比 金 額 構成比 前期比 金 額 構成比 前期比 金 額 構成比 前期比Result/m¥ Share[%] YOY[%] Result/m¥ Ratio[%] YOY[%] Result/m¥ Ratio[%] YOY[%] Result/m¥ Ratio[%] YOY[%] Result/m¥ Ratio[%] YOY[%]
売上高 49,445 100.0 110.8 57,728 100.0 107.4 52,451 100.0 115.2 59,860 100.0 111.7 56,571 100.0 114.4
Net sales
販売費及び一般管理費 16,353 33.1 107.9 17,935 31.1 107.2 16,334 31.1 110.0 18,428 30.8 112.7 18,643 33.0 114.0
S.G.A. expenses
宣伝費 1,130 2.3 211.2 923 1.6 108.4 649 1.2 111.6 1,004 1.7 136.6 1,156 2.0 102.2
PR expenses
運搬・配送費 1,901 3.8 102.9 2,731 4.7 102.7 1,996 3.8 115.6 2,170 3.6 105.2 2,171 3.8 114.2
Logistics expenses
人件費 5,332 10.8 108.4 5,345 9.3 106.5 5,509 10.5 107.4 5,765 9.6 113.5 6,502 11.5 121.9
Personnel expenses
借地借家料 4,048 8.2 99.5 4,434 7.7 101.6 4,039 7.7 101.5 4,415 7.4 104.2 4,337 7.7 107.1
Rent expenses
減価償却費・のれん償却費 875 1.8 109.4 907 1.6 167.5 967 1.8 165.1 999 1.7 132.2 1,078 1.9 123.3Depreciation&Amortization
その他 3,065 6.2 102.6 3,593 6.2 109.2 3,172 6.0 111.2 4,072 6.8 117.0 3,397 6.0 110.8
Others expenses
2016/02期 4th Quarter2015/12-2016/02
5.個別累計販売費及び一般管理費の内訳 Non-Consolidated Selling,General and Administrative Expenses (Accumulated Figures)
Fiscal Year2017/02期 予想 Forecast
2013/03-2014/02 2014/03-2015/02 2015/03-2016/022015/02期 2016/02期2014/02期
決算概要 Financial Summary
Ⅲ.株式会社 良品計画個別 RYOHIN KEIKAKU CO.,LTD. Non-consolidated
2015/02期 4th Quarter 2016/02期 1st Quarter2015/03-05 2015/06-08 2015/09-112014/12-2015/02
2016/02期 2nd Quarter 2016/02期 3rd Quarter
6.個別四半期販売費及び一般管理費の内訳 Non-Consolidated Quarterly Selling,General and Administrative Expenses
14
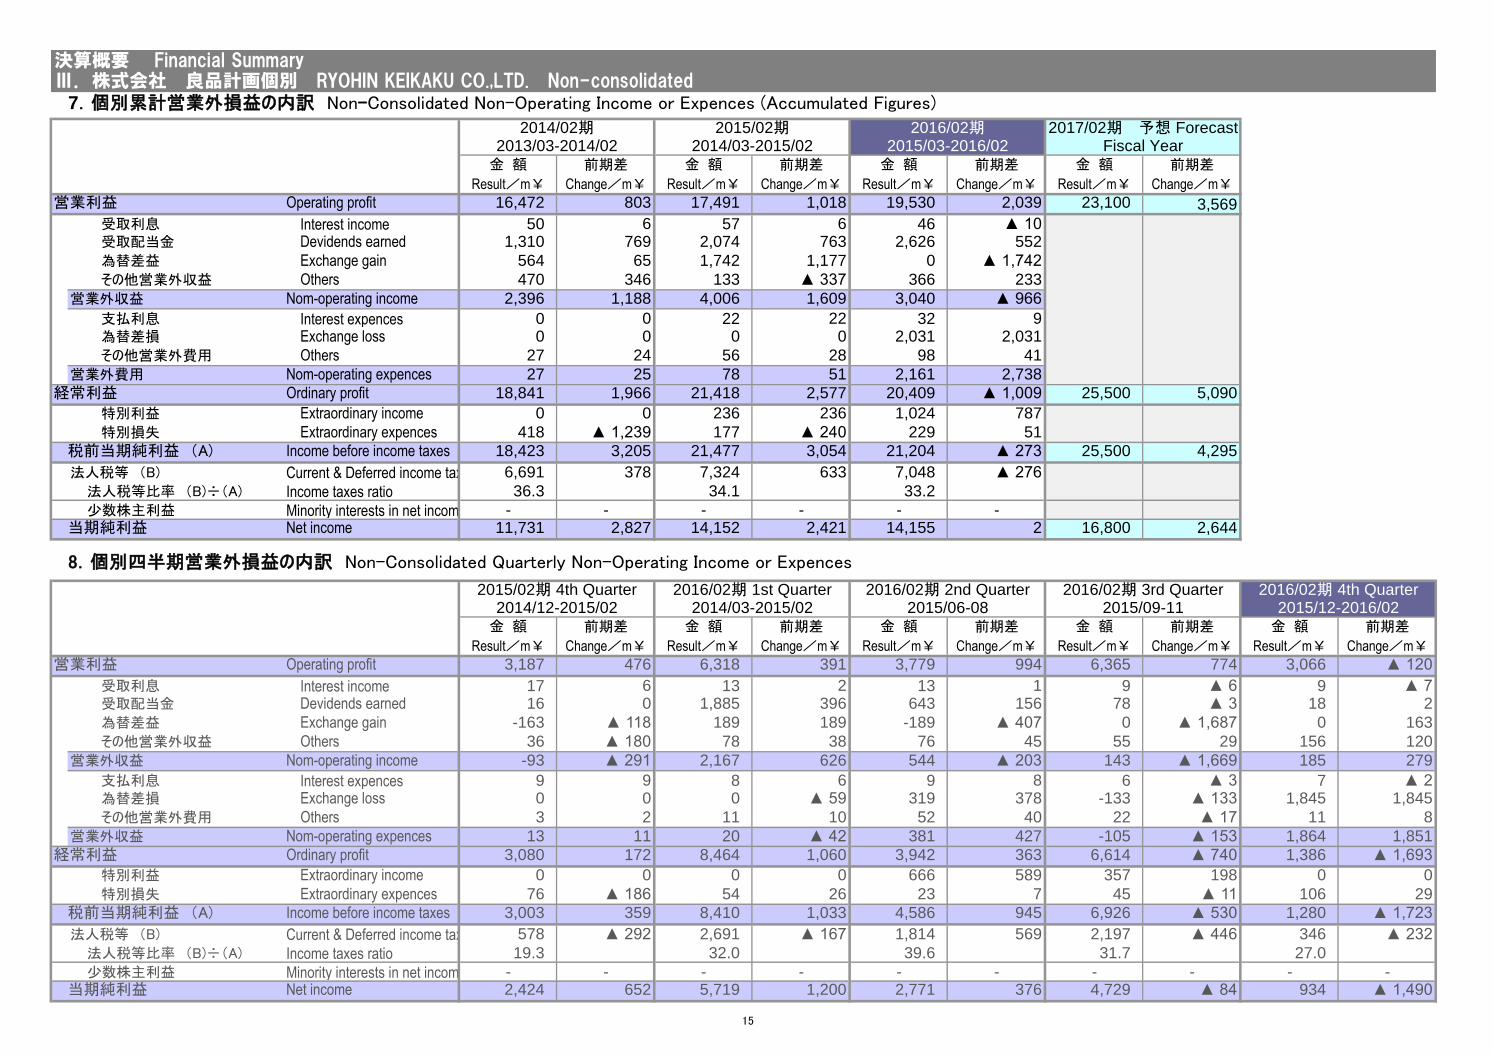
金 額 前期差 金 額 前期差 金 額 前期差 金 額 前期差
Result/m¥ Change/m¥ Result/m¥ Change/m¥ Result/m¥ Change/m¥ Result/m¥ Change/m¥
営業利益 Operating profit 16,472 803 17,491 1,018 19,530 2,039 23,100 3,569
受取利息 Interest income 50 6 57 6 46 ▲ 10受取配当金 Devidends earned 1,310 769 2,074 763 2,626 552
為替差益 Exchange gain 564 65 1,742 1,177 0 ▲ 1,742
その他営業外収益 Others 470 346 133 ▲ 337 366 233
営業外収益 Nom-operating income 2,396 1,188 4,006 1,609 3,040 ▲ 966
支払利息 Interest expences 0 0 22 22 32 9為替差損 Exchange loss 0 0 0 0 2,031 2,031
その他営業外費用 Others 27 24 56 28 98 41
営業外費用 Nom-operating expences 27 25 78 51 2,161 2,738
経常利益 Ordinary profit 18,841 1,966 21,418 2,577 20,409 ▲ 1,009 25,500 5,090
特別利益 Extraordinary income 0 0 236 236 1,024 787
特別損失 Extraordinary expences 418 ▲ 1,239 177 ▲ 240 229 51
税前当期純利益 'A) Income before income taxes 18,423 3,205 21,477 3,054 21,204 ▲ 273 25,500 4,295
法人税等 'B) Current & Deferred income taxes 6,691 378 7,324 633 7,048 ▲ 276
法人税等比率 'B)÷'A) Income taxes ratio 36.3 34.1 33.2
少数株主利益 Minority interests in net income - - - - - -当期純利益 Net income 11,731 2,827 14,152 2,421 14,155 2 16,800 2,644
金 額 前期差 金 額 前期差 金 額 前期差 金 額 前期差 金 額 前期差
Result/m¥ Change/m¥ Result/m¥ Change/m¥ Result/m¥ Change/m¥ Result/m¥ Change/m¥ Result/m¥ Change/m¥
営業利益 Operating profit 3,187 476 6,318 391 3,779 994 6,365 774 3,066 ▲ 120
受取利息 Interest income 17 6 13 2 13 1 9 ▲ 6 9 ▲ 7受取配当金 Devidends earned 16 0 1,885 396 643 156 78 ▲ 3 18 2
為替差益 Exchange gain -163 ▲ 118 189 189 -189 ▲ 407 0 ▲ 1,687 0 163
その他営業外収益 Others 36 ▲ 180 78 38 76 45 55 29 156 120
営業外収益 Nom-operating income -93 ▲ 291 2,167 626 544 ▲ 203 143 ▲ 1,669 185 279
支払利息 Interest expences 9 9 8 6 9 8 6 ▲ 3 7 ▲ 2為替差損 Exchange loss 0 0 0 ▲ 59 319 378 -133 ▲ 133 1,845 1,845
その他営業外費用 Others 3 2 11 10 52 40 22 ▲ 17 11 8
営業外収益 Nom-operating expences 13 11 20 ▲ 42 381 427 -105 ▲ 153 1,864 1,851
経常利益 Ordinary profit 3,080 172 8,464 1,060 3,942 363 6,614 ▲ 740 1,386 ▲ 1,693
特別利益 Extraordinary income 0 0 0 0 666 589 357 198 0 0
特別損失 Extraordinary expences 76 ▲ 186 54 26 23 7 45 ▲ 11 106 29
税前当期純利益 'A) Income before income taxes 3,003 359 8,410 1,033 4,586 945 6,926 ▲ 530 1,280 ▲ 1,723
法人税等 'B) Current & Deferred income taxes 578 ▲ 292 2,691 ▲ 167 1,814 569 2,197 ▲ 446 346 ▲ 232
法人税等比率 'B)÷'A) Income taxes ratio 19.3 32.0 39.6 31.7 27.0
少数株主利益 Minority interests in net income - - - - - - - - - -当期純利益 Net income 2,424 652 5,719 1,200 2,771 376 4,729 ▲ 84 934 ▲ 1,490
2014/12-2015/02 2014/03-2015/02 2015/06-08 2015/09-11 2015/12-2016/02
8.個別四半期営業外損益の内訳 Non-Consolidated Quarterly Non-Operating Income or Expences
2015/02期 4th Quarter 2016/02期 1st Quarter 2016/02期 2nd Quarter 2016/02期 3rd Quarter 2016/02期 4th Quarter
2013/03-2014/02 2014/03-2015/02 2015/03-2016/02 Fiscal Year
決算概要 Financial SummaryⅢ.株式会社 良品計画個別 RYOHIN KEIKAKU CO.,LTD. Non-consolidated
7.個別累計営業外損益の内訳 Non-Consolidated Non-Operating Income or Expences (Accumulated Figures)
2014/02期 2015/02期 2016/02期 2017/02期 予想 Forecast
15
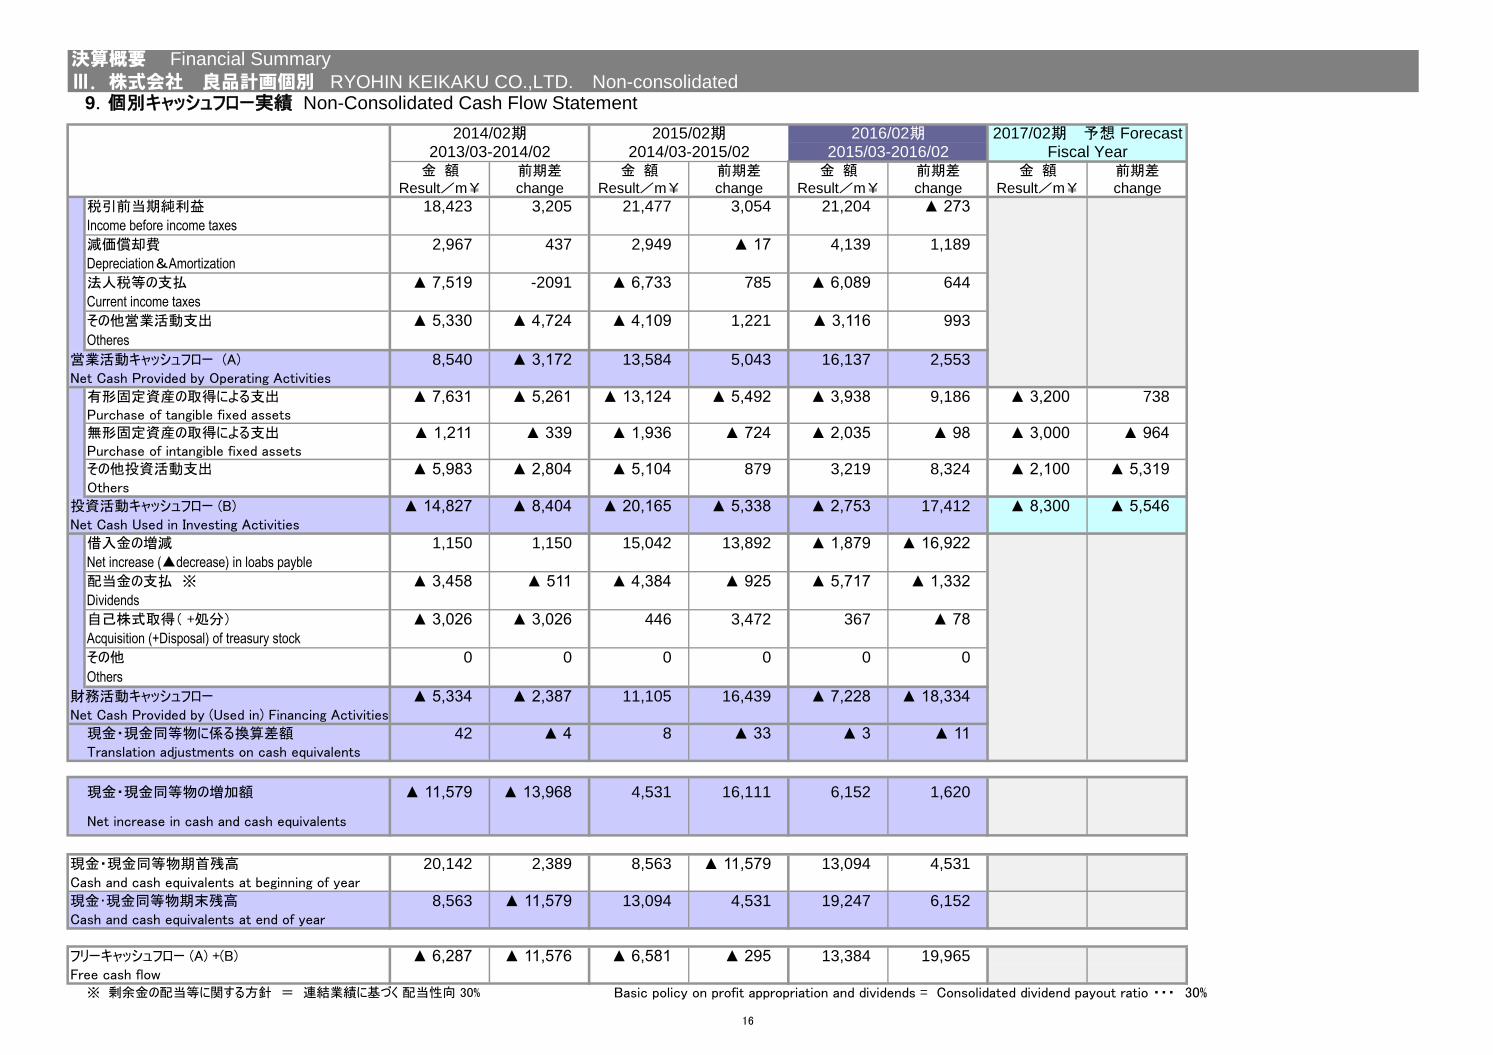
金 額 前期差 金 額 前期差 金 額 前期差 金 額 前期差Result/m¥ change Result/m¥ change Result/m¥ change Result/m¥ change
税引前当期純利益 18,423 3,205 21,477 3,054 21,204 ▲ 273
Income before income taxes
減価償却費 2,967 437 2,949 ▲ 17 4,139 1,189
Depreciation&Amortization
法人税等の支払 ▲ 7,519 -2091 ▲ 6,733 785 ▲ 6,089 644
Current income taxes
その他営業活動支出 ▲ 5,330 ▲ 4,724 ▲ 4,109 1,221 ▲ 3,116 993
Otheres
営業活動キャッシュフロー (A) 8,540 ▲ 3,172 13,584 5,043 16,137 2,553Net Cash Provided by Operating Activities
有形固定資産の取得による支出 ▲ 7,631 ▲ 5,261 ▲ 13,124 ▲ 5,492 ▲ 3,938 9,186 ▲ 3,200 738Purchase of tangible fixed assets無形固定資産の取得による支出 ▲ 1,211 ▲ 339 ▲ 1,936 ▲ 724 ▲ 2,035 ▲ 98 ▲ 3,000 ▲ 964Purchase of intangible fixed assetsその他投資活動支出 ▲ 5,983 ▲ 2,804 ▲ 5,104 879 3,219 8,324 ▲ 2,100 ▲ 5,319Others
投資活動キャッシュフロー (B) ▲ 14,827 ▲ 8,404 ▲ 20,165 ▲ 5,338 ▲ 2,753 17,412 ▲ 8,300 ▲ 5,546Net Cash Used in Investing Activities
借入金の増減 1,150 1,150 15,042 13,892 ▲ 1,879 ▲ 16,922
Net increase (▲decrease) in loabs payble
配当金の支払 ※ ▲ 3,458 ▲ 511 ▲ 4,384 ▲ 925 ▲ 5,717 ▲ 1,332
Dividends
自己株式取得' +処分( ▲ 3,026 ▲ 3,026 446 3,472 367 ▲ 78
Acquisition (+Disposal) of treasury stock
その他 0 0 0 0 0 0
Others
財務活動キャッシュフロー ▲ 5,334 ▲ 2,387 11,105 16,439 ▲ 7,228 ▲ 18,334Net Cash Provided by (Used in) Financing Activities
現金・現金同等物に係る換算差額 42 ▲ 4 8 ▲ 33 ▲ 3 ▲ 11Translation adjustments on cash equivalents
現金・現金同等物の増加額 ▲ 11,579 ▲ 13,968 4,531 16,111 6,152 1,620
Net increase in cash and cash equivalents
現金・現金同等物期首残高 20,142 2,389 8,563 ▲ 11,579 13,094 4,531Cash and cash equivalents at beginning of year
現金・現金同等物期末残高 8,563 ▲ 11,579 13,094 4,531 19,247 6,152Cash and cash equivalents at end of year
フリーキャッシュフロー (A) +(B) ▲ 6,287 ▲ 11,576 ▲ 6,581 ▲ 295 13,384 19,965Free cash flow
※ 剰余金の配当等に関する方針 = 連結業績に基づく 配当性向 30% Basic policy on profit appropriation and dividends = Consolidated dividend payout ratio ・・・ 30%
決算概要 Financial Summary
Ⅲ.株式会社 良品計画個別 RYOHIN KEIKAKU CO.,LTD. Non-consolidated9.個別キャッシュフロー実績 Non-Consolidated Cash Flow Statement
2014/02期 2015/02期 2016/02期 2017/02期 予想 Forecast2013/03-2014/02 2014/03-2015/02 2015/03-2016/02 Fiscal Year
16
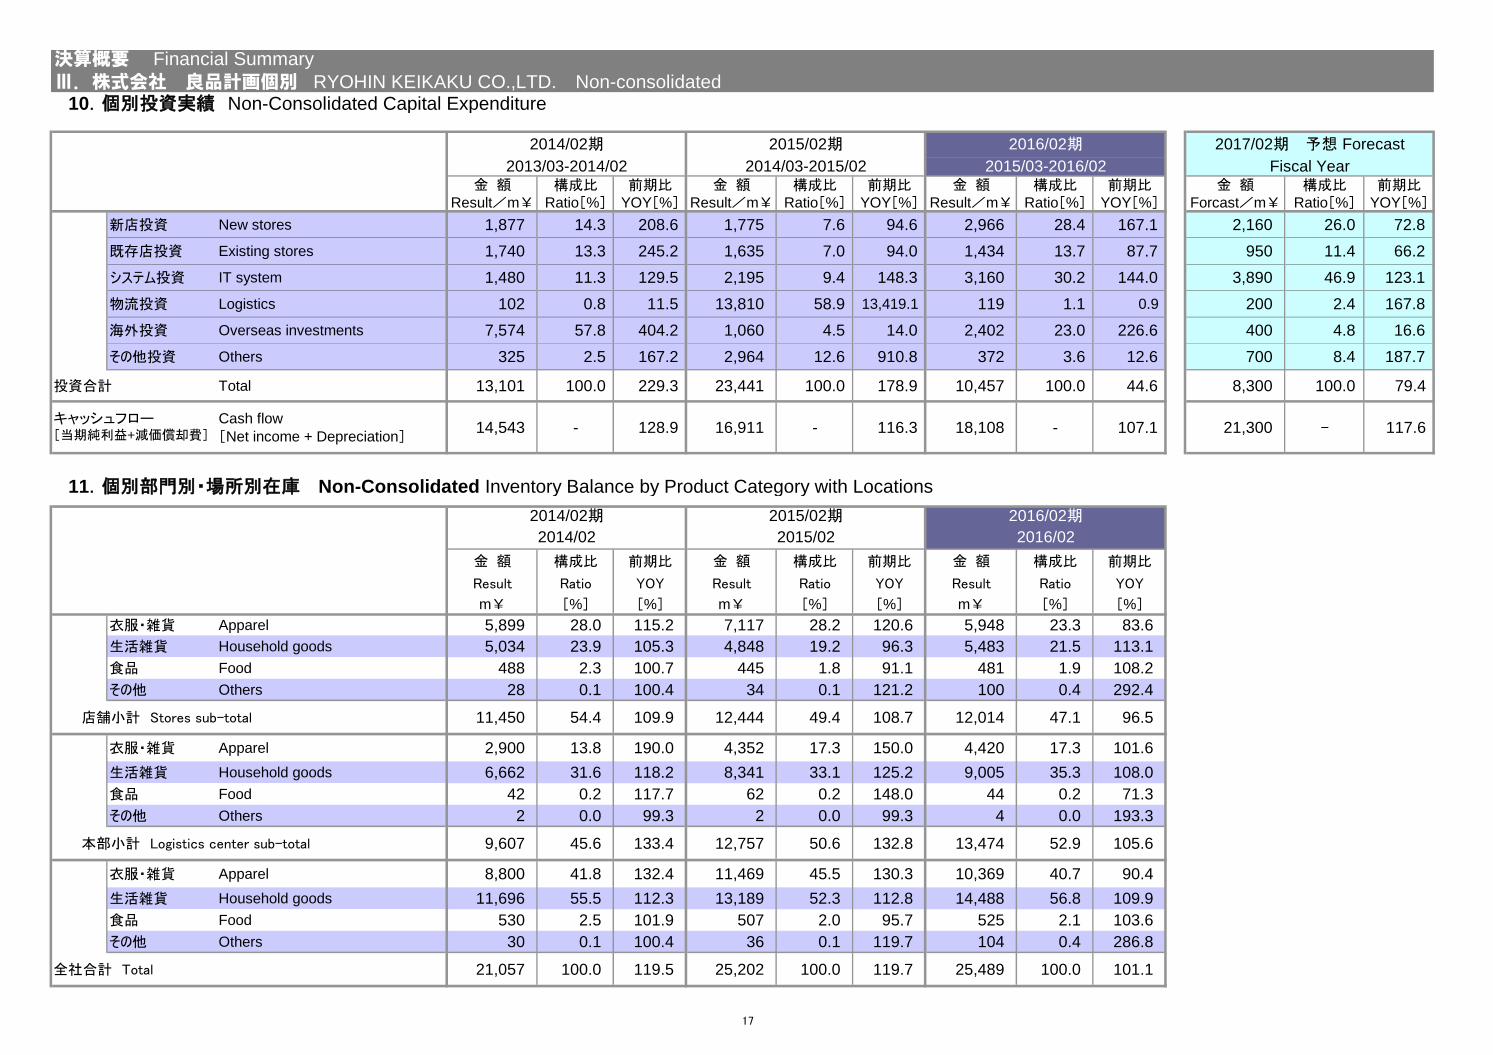
10.個別投資実績 Non-Consolidated Capital Expenditure
金 額 構成比 前期比 金 額 構成比 前期比 金 額 構成比 前期比 金 額 構成比 前期比Result/m¥ Ratio[%] YOY[%] Result/m¥ Ratio[%] YOY[%] Result/m¥ Ratio[%] YOY[%] Forcast/m¥ Ratio[%] YOY[%]
新店投資 New stores 1,877 14.3 208.6 1,775 7.6 94.6 2,966 28.4 167.1 2,160 26.0 72.8
既存店投資 Existing stores 1,740 13.3 245.2 1,635 7.0 94.0 1,434 13.7 87.7 950 11.4 66.2
システム投資 IT system 1,480 11.3 129.5 2,195 9.4 148.3 3,160 30.2 144.0 3,890 46.9 123.1
物流投資 Logistics 102 0.8 11.5 13,810 58.9 13,419.1 119 1.1 0.9 200 2.4 167.8
海外投資 Overseas investments 7,574 57.8 404.2 1,060 4.5 14.0 2,402 23.0 226.6 400 4.8 16.6
その他投資 Others 325 2.5 167.2 2,964 12.6 910.8 372 3.6 12.6 700 8.4 187.7
投資合計 Total 13,101 100.0 229.3 23,441 100.0 178.9 10,457 100.0 44.6 8,300 100.0 79.4
Cash flow
[Net income + Depreciation]14,543 - 128.9 16,911 - 116.3 18,108 - 107.1 21,300 - 117.6
11.個別部門別・場所別在庫 Non-Consolidated Inventory Balance by Product Category with Locations
金 額 構成比 前期比 金 額 構成比 前期比 金 額 構成比 前期比
Result Ratio YOY Result Ratio YOY Result Ratio YOY
m¥ [%] [%] m¥ [%] [%] m¥ [%] [%]
衣服・雑貨 Apparel 5,899 28.0 115.2 7,117 28.2 120.6 5,948 23.3 83.6
生活雑貨 Household goods 5,034 23.9 105.3 4,848 19.2 96.3 5,483 21.5 113.1
食品 Food 488 2.3 100.7 445 1.8 91.1 481 1.9 108.2
その他 Others 28 0.1 100.4 34 0.1 121.2 100 0.4 292.4
店舗小計 Stores sub-total 11,450 54.4 109.9 12,444 49.4 108.7 12,014 47.1 96.5
衣服・雑貨 Apparel 2,900 13.8 190.0 4,352 17.3 150.0 4,420 17.3 101.6
生活雑貨 Household goods 6,662 31.6 118.2 8,341 33.1 125.2 9,005 35.3 108.0
食品 Food 42 0.2 117.7 62 0.2 148.0 44 0.2 71.3
その他 Others 2 0.0 99.3 2 0.0 99.3 4 0.0 193.3
本部小計 Logistics center sub-total 9,607 45.6 133.4 12,757 50.6 132.8 13,474 52.9 105.6
衣服・雑貨 Apparel 8,800 41.8 132.4 11,469 45.5 130.3 10,369 40.7 90.4
生活雑貨 Household goods 11,696 55.5 112.3 13,189 52.3 112.8 14,488 56.8 109.9
食品 Food 530 2.5 101.9 507 2.0 95.7 525 2.1 103.6
その他 Others 30 0.1 100.4 36 0.1 119.7 104 0.4 286.8
全社合計 Total 21,057 100.0 119.5 25,202 100.0 119.7 25,489 100.0 101.1
決算概要 Financial Summary
Ⅲ.株式会社 良品計画個別 RYOHIN KEIKAKU CO.,LTD. Non-consolidated
2014/02期 2015/02期 2016/02期 2017/02期 予想 Forecast
キャッシュフロー[当期純利益+減価償却費]
2013/03-2014/02 2014/03-2015/02 2015/03-2016/02
2014/02 2015/02 2016/02
2014/02期 2015/02期 2016/02期
Fiscal Year
17
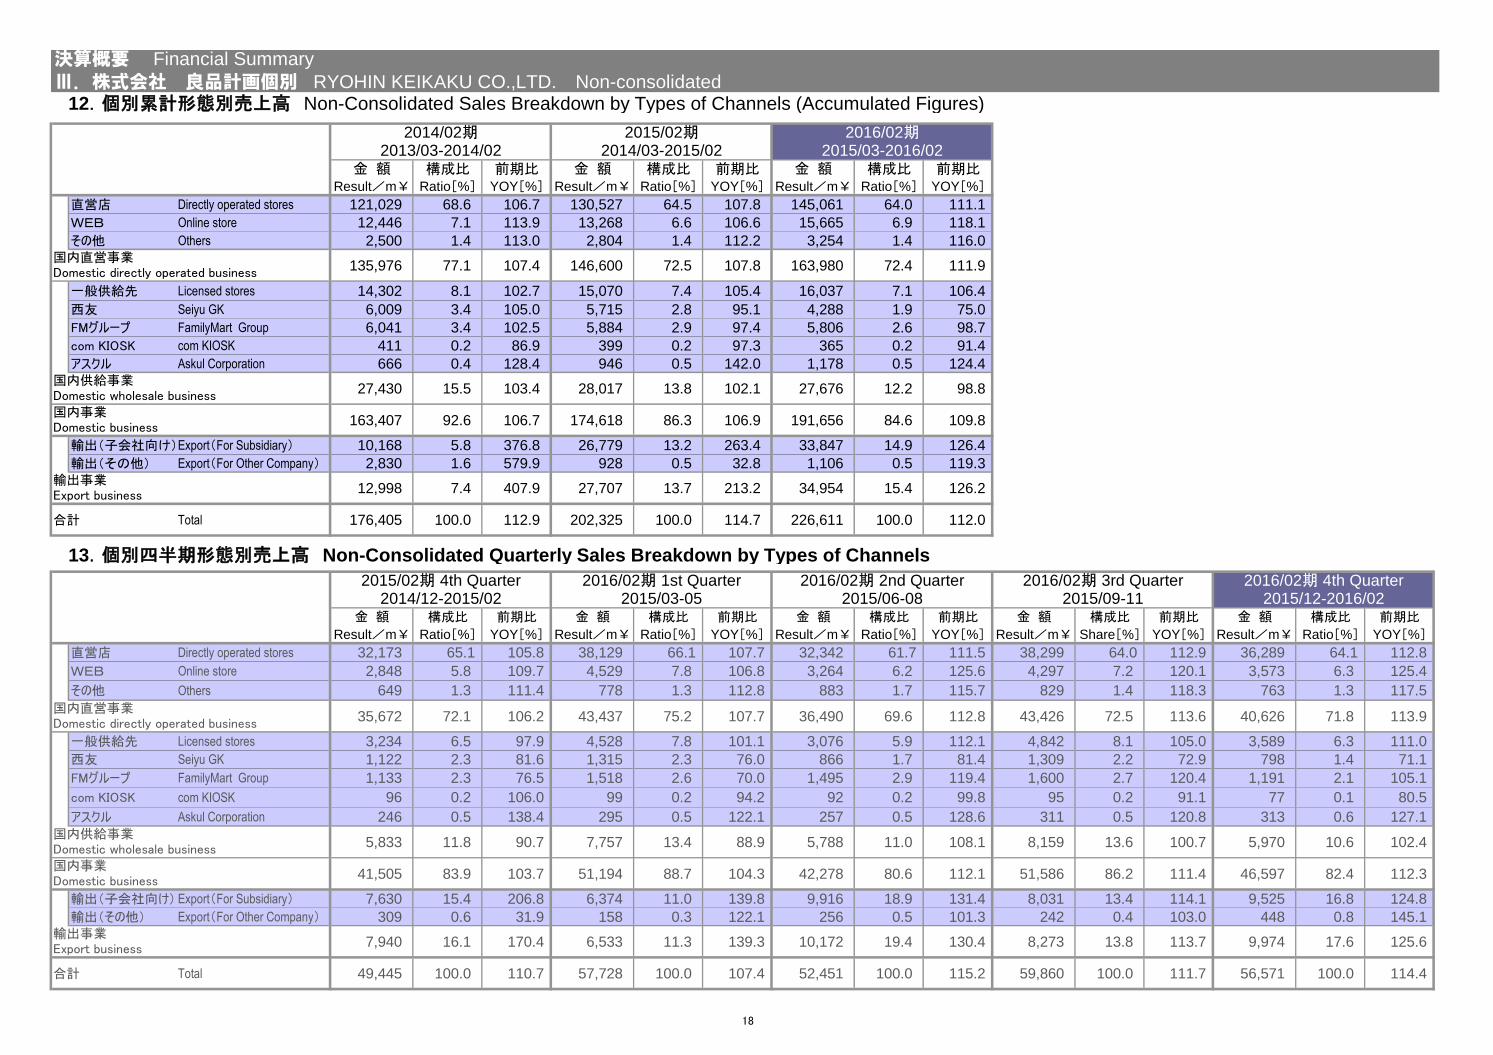
12.個別累計形態別売上高 Non-Consolidated Sales Breakdown by Types of Channels (Accumulated Figures)
金 額 構成比 前期比 金 額 構成比 前期比 金 額 構成比 前期比Result/m¥ Ratio[%] YOY[%] Result/m¥ Ratio[%] YOY[%] Result/m¥ Ratio[%] YOY[%]
直営店 Directly operated stores 121,029 68.6 106.7 130,527 64.5 107.8 145,061 64.0 111.1
WEB Online store 12,446 7.1 113.9 13,268 6.6 106.6 15,665 6.9 118.1
その他 Others 2,500 1.4 113.0 2,804 1.4 112.2 3,254 1.4 116.0
135,976 77.1 107.4 146,600 72.5 107.8 163,980 72.4 111.9
一般供給先 Licensed stores 14,302 8.1 102.7 15,070 7.4 105.4 16,037 7.1 106.4
西友 Seiyu GK 6,009 3.4 105.0 5,715 2.8 95.1 4,288 1.9 75.0
FMグループ FamilyMart Group 6,041 3.4 102.5 5,884 2.9 97.4 5,806 2.6 98.7
com KIOSK com KIOSK 411 0.2 86.9 399 0.2 97.3 365 0.2 91.4
アスクル Askul Corporation 666 0.4 128.4 946 0.5 142.0 1,178 0.5 124.4
27,430 15.5 103.4 28,017 13.8 102.1 27,676 12.2 98.8
163,407 92.6 106.7 174,618 86.3 106.9 191,656 84.6 109.8
輸出'子会社向け(Export'For Subsidiary( 10,168 5.8 376.8 26,779 13.2 263.4 33,847 14.9 126.4
輸出'その他( Export'For Other Company( 2,830 1.6 579.9 928 0.5 32.8 1,106 0.5 119.3
12,998 7.4 407.9 27,707 13.7 213.2 34,954 15.4 126.2
合計 Total 176,405 100.0 112.9 202,325 100.0 114.7 226,611 100.0 112.0
13.個別四半期形態別売上高 Non-Consolidated Quarterly Sales Breakdown by Types of Channels
金 額 構成比 前期比 金 額 構成比 前期比 金 額 構成比 前期比 金 額 構成比 前期比 金 額 構成比 前期比
Result/m¥ Ratio[%] YOY[%] Result/m¥ Ratio[%] YOY[%] Result/m¥ Ratio[%] YOY[%] Result/m¥ Share[%] YOY[%] Result/m¥ Ratio[%] YOY[%]
直営店 Directly operated stores 32,173 65.1 105.8 38,129 66.1 107.7 32,342 61.7 111.5 38,299 64.0 112.9 36,289 64.1 112.8
WEB Online store 2,848 5.8 109.7 4,529 7.8 106.8 3,264 6.2 125.6 4,297 7.2 120.1 3,573 6.3 125.4
その他 Others 649 1.3 111.4 778 1.3 112.8 883 1.7 115.7 829 1.4 118.3 763 1.3 117.5
35,672 72.1 106.2 43,437 75.2 107.7 36,490 69.6 112.8 43,426 72.5 113.6 40,626 71.8 113.9
一般供給先 Licensed stores 3,234 6.5 97.9 4,528 7.8 101.1 3,076 5.9 112.1 4,842 8.1 105.0 3,589 6.3 111.0
西友 Seiyu GK 1,122 2.3 81.6 1,315 2.3 76.0 866 1.7 81.4 1,309 2.2 72.9 798 1.4 71.1
FMグループ FamilyMart Group 1,133 2.3 76.5 1,518 2.6 70.0 1,495 2.9 119.4 1,600 2.7 120.4 1,191 2.1 105.1
com KIOSK com KIOSK 96 0.2 106.0 99 0.2 94.2 92 0.2 99.8 95 0.2 91.1 77 0.1 80.5
アスクル Askul Corporation 246 0.5 138.4 295 0.5 122.1 257 0.5 128.6 311 0.5 120.8 313 0.6 127.1
5,833 11.8 90.7 7,757 13.4 88.9 5,788 11.0 108.1 8,159 13.6 100.7 5,970 10.6 102.4
41,505 83.9 103.7 51,194 88.7 104.3 42,278 80.6 112.1 51,586 86.2 111.4 46,597 82.4 112.3
輸出'子会社向け( Export'For Subsidiary( 7,630 15.4 206.8 6,374 11.0 139.8 9,916 18.9 131.4 8,031 13.4 114.1 9,525 16.8 124.8
輸出'その他( Export'For Other Company( 309 0.6 31.9 158 0.3 122.1 256 0.5 101.3 242 0.4 103.0 448 0.8 145.1
7,940 16.1 170.4 6,533 11.3 139.3 10,172 19.4 130.4 8,273 13.8 113.7 9,974 17.6 125.6
合計 Total 49,445 100.0 110.7 57,728 100.0 107.4 52,451 100.0 115.2 59,860 100.0 111.7 56,571 100.0 114.4
国内直営事業Domestic directly operated business
国内供給事業Domestic wholesale business国内事業Domestic business
輸出事業Export business
2016/02期 1st Quarter 2016/02期 2nd Quarter 2016/02期 3rd Quarter2014/12-2015/02 2015/03-05 2015/06-08 2015/09-11
2015/02期 4th Quarter 2016/02期 4th Quarter2015/12-2016/02
国内直営事業Domestic directly operated business
国内供給事業Domestic wholesale business国内事業Domestic business
輸出事業Export business
決算概要 Financial Summary
Ⅲ.株式会社 良品計画個別 RYOHIN KEIKAKU CO.,LTD. Non-consolidated
2013/03-2014/02 2014/03-2015/02 2015/03-2016/022014/02期 2015/02期 2016/02期
18
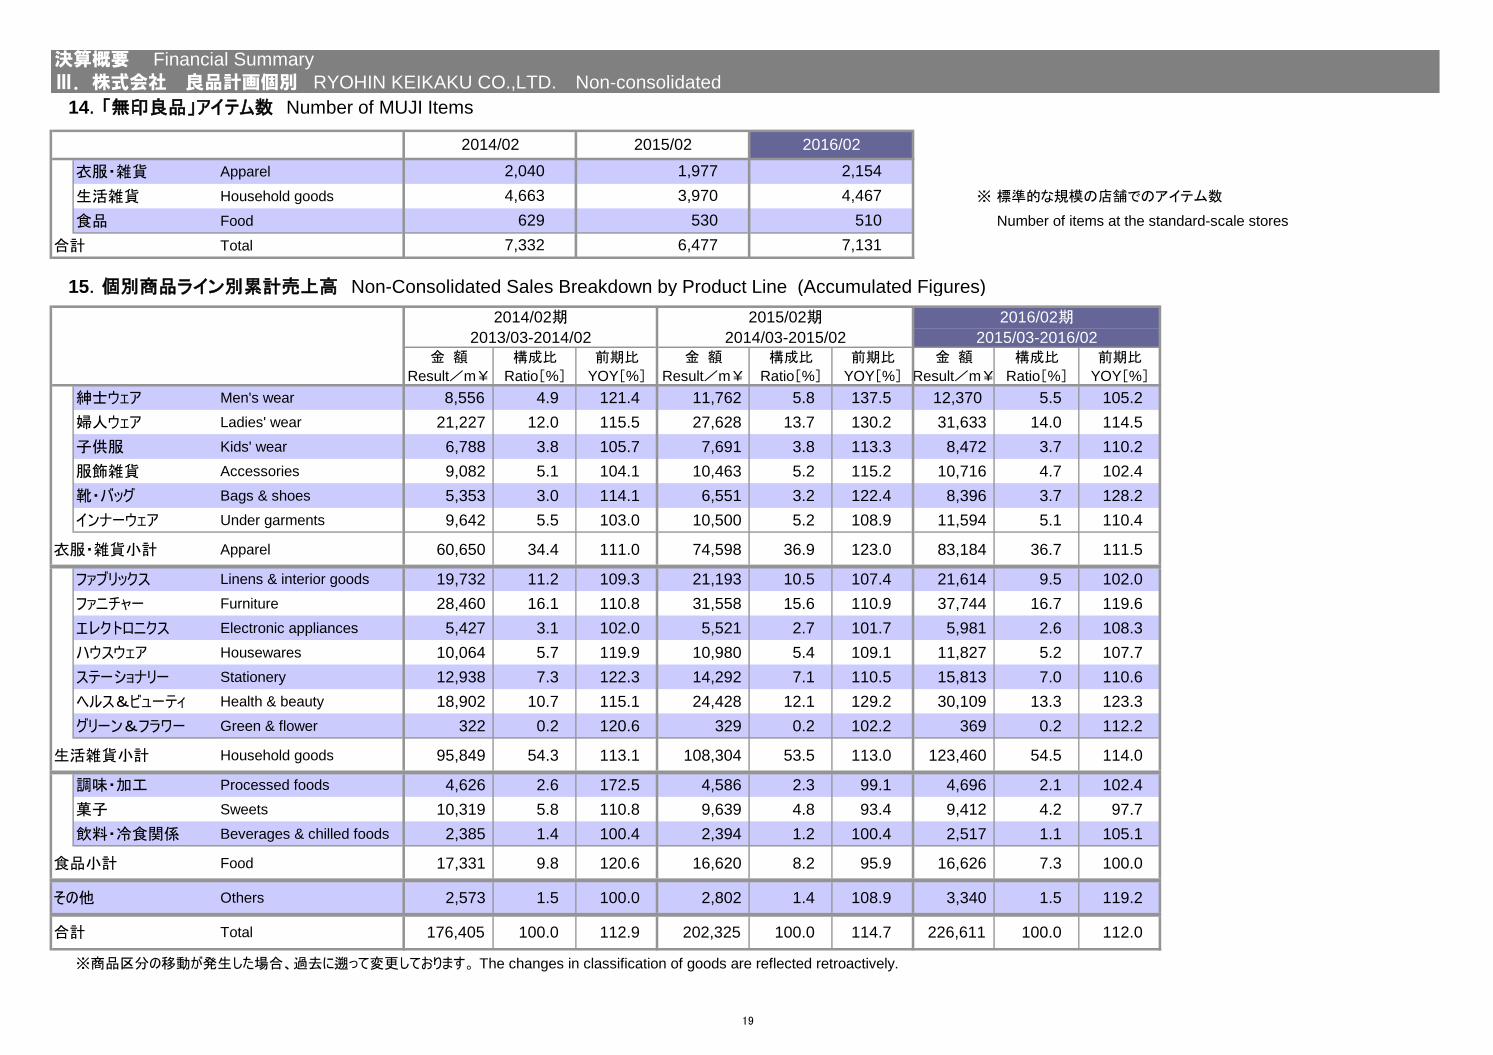
14.「無印良品」アイテム数 Number of MUJI Items
衣服・雑貨 Apparel
生活雑貨 Household goods ※ 標準的な規模の店舗でのアイテム数
食品 Food Number of items at the standard-scale stores
合計 Total
15.個別商品ライン別累計売上高 Non-Consolidated Sales Breakdown by Product Line (Accumulated Figures)
金 額 構成比 前期比 金 額 構成比 前期比 金 額 構成比 前期比
Result/m¥ Ratio[%] YOY[%] Result/m¥ Ratio[%] YOY[%] Result/m¥ Ratio[%] YOY[%]
紳士ウェア Men's wear 8,556 4.9 121.4 11,762 5.8 137.5 12,370 5.5 105.2
婦人ウェア Ladies' wear 21,227 12.0 115.5 27,628 13.7 130.2 31,633 14.0 114.5
子供服 Kids' wear 6,788 3.8 105.7 7,691 3.8 113.3 8,472 3.7 110.2
服飾雑貨 Accessories 9,082 5.1 104.1 10,463 5.2 115.2 10,716 4.7 102.4
靴・バッグ Bags & shoes 5,353 3.0 114.1 6,551 3.2 122.4 8,396 3.7 128.2
インナーウェア Under garments 9,642 5.5 103.0 10,500 5.2 108.9 11,594 5.1 110.4
衣服・雑貨小計 Apparel 60,650 34.4 111.0 74,598 36.9 123.0 83,184 36.7 111.5
ファブリックス Linens & interior goods 19,732 11.2 109.3 21,193 10.5 107.4 21,614 9.5 102.0
ファニチャー Furniture 28,460 16.1 110.8 31,558 15.6 110.9 37,744 16.7 119.6
エレクトロニクス Electronic appliances 5,427 3.1 102.0 5,521 2.7 101.7 5,981 2.6 108.3
ハウスウェア Housewares 10,064 5.7 119.9 10,980 5.4 109.1 11,827 5.2 107.7
ステーショナリー Stationery 12,938 7.3 122.3 14,292 7.1 110.5 15,813 7.0 110.6
ヘルス&ビューティ Health & beauty 18,902 10.7 115.1 24,428 12.1 129.2 30,109 13.3 123.3
グリーン&フラワー Green & flower 322 0.2 120.6 329 0.2 102.2 369 0.2 112.2
生活雑貨小計 Household goods 95,849 54.3 113.1 108,304 53.5 113.0 123,460 54.5 114.0
調味・加工 Processed foods 4,626 2.6 172.5 4,586 2.3 99.1 4,696 2.1 102.4
菓子 Sweets 10,319 5.8 110.8 9,639 4.8 93.4 9,412 4.2 97.7
飲料・冷食関係 Beverages & chilled foods 2,385 1.4 100.4 2,394 1.2 100.4 2,517 1.1 105.1
食品小計 Food 17,331 9.8 120.6 16,620 8.2 95.9 16,626 7.3 100.0
その他 Others 2,573 1.5 100.0 2,802 1.4 108.9 3,340 1.5 119.2
合計 Total 176,405 100.0 112.9 202,325 100.0 114.7 226,611 100.0 112.0
※商品区分の移動が発生した場合、過去に遡って変更しております。 The changes in classification of goods are reflected retroactively.
決算概要 Financial Summary
Ⅲ.株式会社 良品計画個別 RYOHIN KEIKAKU CO.,LTD. Non-consolidated
3,970
2013/03-2014/02
2015/02期
2014/03-2015/02
2014/02期
7,1317,332 6,477
2016/02期
2015/03-2016/02
2014/02 2015/02 2016/02
510
2,154
4,467
2,040
4,663
629 530
1,977
19
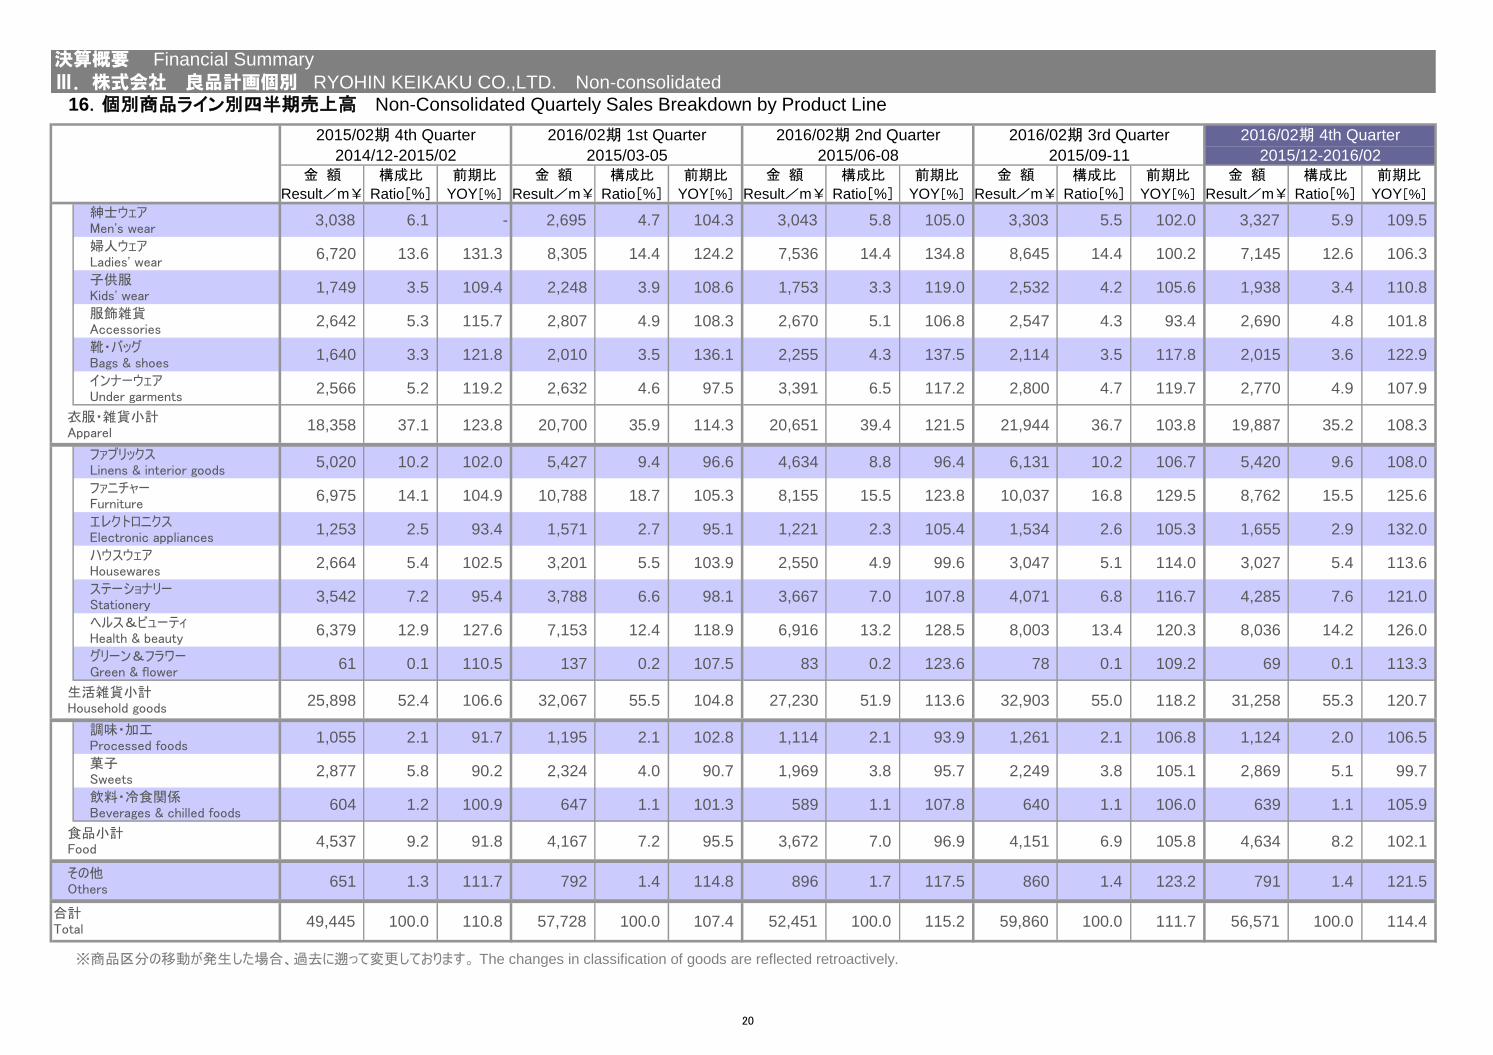
16.個別商品ライン別四半期売上高 Non-Consolidated Quartely Sales Breakdown by Product Line
金 額 構成比 前期比 金 額 構成比 前期比 金 額 構成比 前期比 金 額 構成比 前期比 金 額 構成比 前期比
Result/m¥ Ratio[%] YOY[%] Result/m¥ Ratio[%] YOY[%] Result/m¥ Ratio[%] YOY[%] Result/m¥ Ratio[%] YOY[%] Result/m¥ Ratio[%] YOY[%]
紳士ウェアMen's wear
3,038 6.1 - 2,695 4.7 104.3 3,043 5.8 105.0 3,303 5.5 102.0 3,327 5.9 109.5
婦人ウェアLadies' wear
6,720 13.6 131.3 8,305 14.4 124.2 7,536 14.4 134.8 8,645 14.4 100.2 7,145 12.6 106.3
子供服Kids' wear
1,749 3.5 109.4 2,248 3.9 108.6 1,753 3.3 119.0 2,532 4.2 105.6 1,938 3.4 110.8
服飾雑貨Accessories
2,642 5.3 115.7 2,807 4.9 108.3 2,670 5.1 106.8 2,547 4.3 93.4 2,690 4.8 101.8
靴・バッグBags & shoes
1,640 3.3 121.8 2,010 3.5 136.1 2,255 4.3 137.5 2,114 3.5 117.8 2,015 3.6 122.9
インナーウェアUnder garments
2,566 5.2 119.2 2,632 4.6 97.5 3,391 6.5 117.2 2,800 4.7 119.7 2,770 4.9 107.9
18,358 37.1 123.8 20,700 35.9 114.3 20,651 39.4 121.5 21,944 36.7 103.8 19,887 35.2 108.3
ファブリックスLinens & interior goods
5,020 10.2 102.0 5,427 9.4 96.6 4,634 8.8 96.4 6,131 10.2 106.7 5,420 9.6 108.0
ファニチャーFurniture
6,975 14.1 104.9 10,788 18.7 105.3 8,155 15.5 123.8 10,037 16.8 129.5 8,762 15.5 125.6
エレクトロニクスElectronic appliances
1,253 2.5 93.4 1,571 2.7 95.1 1,221 2.3 105.4 1,534 2.6 105.3 1,655 2.9 132.0
ハウスウェアHousewares
2,664 5.4 102.5 3,201 5.5 103.9 2,550 4.9 99.6 3,047 5.1 114.0 3,027 5.4 113.6
ステーショナリーStationery
3,542 7.2 95.4 3,788 6.6 98.1 3,667 7.0 107.8 4,071 6.8 116.7 4,285 7.6 121.0
ヘルス&ビューティHealth & beauty
6,379 12.9 127.6 7,153 12.4 118.9 6,916 13.2 128.5 8,003 13.4 120.3 8,036 14.2 126.0
グリーン&フラワーGreen & flower
61 0.1 110.5 137 0.2 107.5 83 0.2 123.6 78 0.1 109.2 69 0.1 113.3
25,898 52.4 106.6 32,067 55.5 104.8 27,230 51.9 113.6 32,903 55.0 118.2 31,258 55.3 120.7
調味・加工Processed foods
1,055 2.1 91.7 1,195 2.1 102.8 1,114 2.1 93.9 1,261 2.1 106.8 1,124 2.0 106.5
菓子Sweets
2,877 5.8 90.2 2,324 4.0 90.7 1,969 3.8 95.7 2,249 3.8 105.1 2,869 5.1 99.7
飲料・冷食関係Beverages & chilled foods
604 1.2 100.9 647 1.1 101.3 589 1.1 107.8 640 1.1 106.0 639 1.1 105.9
4,537 9.2 91.8 4,167 7.2 95.5 3,672 7.0 96.9 4,151 6.9 105.8 4,634 8.2 102.1
651 1.3 111.7 792 1.4 114.8 896 1.7 117.5 860 1.4 123.2 791 1.4 121.5
49,445 100.0 110.8 57,728 100.0 107.4 52,451 100.0 115.2 59,860 100.0 111.7 56,571 100.0 114.4
※商品区分の移動が発生した場合、過去に遡って変更しております。 The changes in classification of goods are reflected retroactively.
合計Total
衣服・雑貨小計Apparel
生活雑貨小計Household goods
食品小計Food
その他Others
2015/02期 4th Quarter
2014/12-2015/02
決算概要 Financial Summary
Ⅲ.株式会社 良品計画個別 RYOHIN KEIKAKU CO.,LTD. Non-consolidated
2016/02期 4th Quarter
2015/03-05 2015/06-08 2015/09-11 2015/12-2016/02
2016/02期 1st Quarter 2016/02期 2nd Quarter 2016/02期 3rd Quarter
20
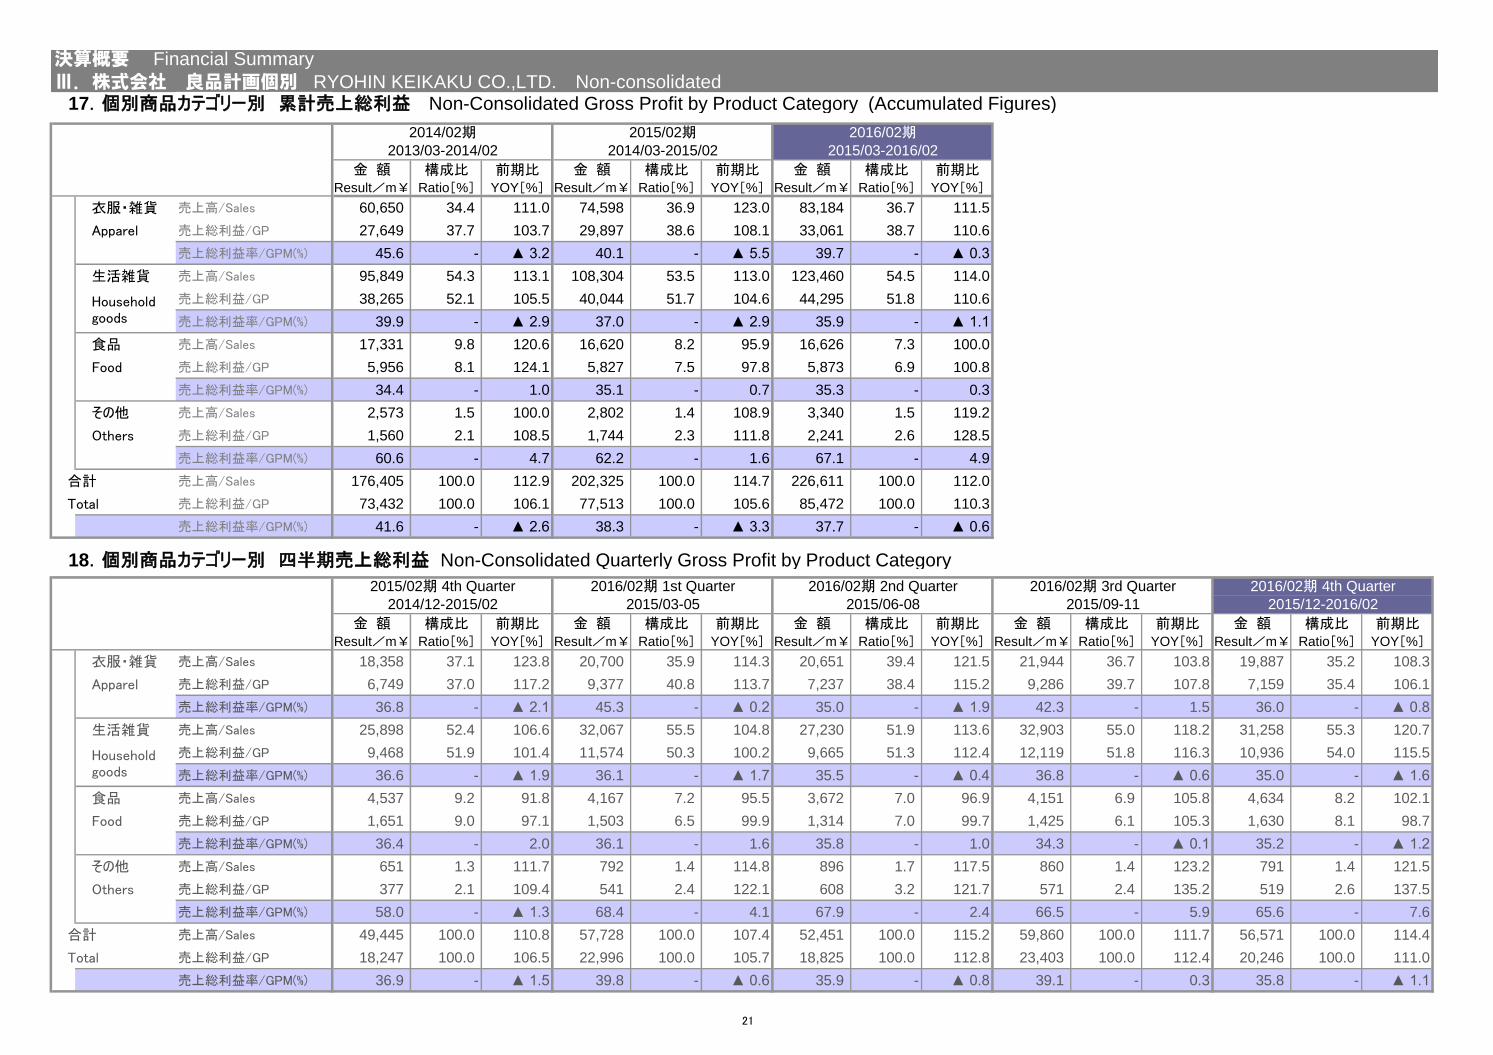
17.個別商品カテゴリー別 累計売上総利益 Non-Consolidated Gross Profit by Product Category (Accumulated Figures)
金 額 構成比 前期比 金 額 構成比 前期比 金 額 構成比 前期比Result/m¥ Ratio[%] YOY[%] Result/m¥ Ratio[%] YOY[%] Result/m¥ Ratio[%] YOY[%]
衣服・雑貨 売上高/Sales 60,650 34.4 111.0 74,598 36.9 123.0 83,184 36.7 111.5
Apparel 売上総利益/GP 27,649 37.7 103.7 29,897 38.6 108.1 33,061 38.7 110.6
売上総利益率/GPM(%) 45.6 - ▲ 3.2 40.1 - ▲ 5.5 39.7 - ▲ 0.3
生活雑貨 売上高/Sales 95,849 54.3 113.1 108,304 53.5 113.0 123,460 54.5 114.0
売上総利益/GP 38,265 52.1 105.5 40,044 51.7 104.6 44,295 51.8 110.6
売上総利益率/GPM(%) 39.9 - ▲ 2.9 37.0 - ▲ 2.9 35.9 - ▲ 1.1
食品 売上高/Sales 17,331 9.8 120.6 16,620 8.2 95.9 16,626 7.3 100.0
Food 売上総利益/GP 5,956 8.1 124.1 5,827 7.5 97.8 5,873 6.9 100.8
売上総利益率/GPM(%) 34.4 - 1.0 35.1 - 0.7 35.3 - 0.3
その他 売上高/Sales 2,573 1.5 100.0 2,802 1.4 108.9 3,340 1.5 119.2
Others 売上総利益/GP 1,560 2.1 108.5 1,744 2.3 111.8 2,241 2.6 128.5
売上総利益率/GPM(%) 60.6 - 4.7 62.2 - 1.6 67.1 - 4.9
合計 売上高/Sales 176,405 100.0 112.9 202,325 100.0 114.7 226,611 100.0 112.0
Total 売上総利益/GP 73,432 100.0 106.1 77,513 100.0 105.6 85,472 100.0 110.3
売上総利益率/GPM(%) 41.6 - ▲ 2.6 38.3 - ▲ 3.3 37.7 - ▲ 0.6
18.個別商品カテゴリー別 四半期売上総利益 Non-Consolidated Quarterly Gross Profit by Product Category
金 額 構成比 前期比 金 額 構成比 前期比 金 額 構成比 前期比 金 額 構成比 前期比 金 額 構成比 前期比Result/m¥ Ratio[%] YOY[%] Result/m¥ Ratio[%] YOY[%] Result/m¥ Ratio[%] YOY[%] Result/m¥ Ratio[%] YOY[%] Result/m¥ Ratio[%] YOY[%]
衣服・雑貨 売上高/Sales 18,358 37.1 123.8 20,700 35.9 114.3 20,651 39.4 121.5 21,944 36.7 103.8 19,887 35.2 108.3
Apparel 売上総利益/GP 6,749 37.0 117.2 9,377 40.8 113.7 7,237 38.4 115.2 9,286 39.7 107.8 7,159 35.4 106.1
売上総利益率/GPM(%) 36.8 - ▲ 2.1 45.3 - ▲ 0.2 35.0 - ▲ 1.9 42.3 - 1.5 36.0 - ▲ 0.8
生活雑貨 売上高/Sales 25,898 52.4 106.6 32,067 55.5 104.8 27,230 51.9 113.6 32,903 55.0 118.2 31,258 55.3 120.7
売上総利益/GP 9,468 51.9 101.4 11,574 50.3 100.2 9,665 51.3 112.4 12,119 51.8 116.3 10,936 54.0 115.5
売上総利益率/GPM(%) 36.6 - ▲ 1.9 36.1 - ▲ 1.7 35.5 - ▲ 0.4 36.8 - ▲ 0.6 35.0 - ▲ 1.6
食品 売上高/Sales 4,537 9.2 91.8 4,167 7.2 95.5 3,672 7.0 96.9 4,151 6.9 105.8 4,634 8.2 102.1
Food 売上総利益/GP 1,651 9.0 97.1 1,503 6.5 99.9 1,314 7.0 99.7 1,425 6.1 105.3 1,630 8.1 98.7
売上総利益率/GPM(%) 36.4 - 2.0 36.1 - 1.6 35.8 - 1.0 34.3 - ▲ 0.1 35.2 - ▲ 1.2
その他 売上高/Sales 651 1.3 111.7 792 1.4 114.8 896 1.7 117.5 860 1.4 123.2 791 1.4 121.5
Others 売上総利益/GP 377 2.1 109.4 541 2.4 122.1 608 3.2 121.7 571 2.4 135.2 519 2.6 137.5
売上総利益率/GPM(%) 58.0 - ▲ 1.3 68.4 - 4.1 67.9 - 2.4 66.5 - 5.9 65.6 - 7.6
合計 売上高/Sales 49,445 100.0 110.8 57,728 100.0 107.4 52,451 100.0 115.2 59,860 100.0 111.7 56,571 100.0 114.4
Total 売上総利益/GP 18,247 100.0 106.5 22,996 100.0 105.7 18,825 100.0 112.8 23,403 100.0 112.4 20,246 100.0 111.0
売上総利益率/GPM(%) 36.9 - ▲ 1.5 39.8 - ▲ 0.6 35.9 - ▲ 0.8 39.1 - 0.3 35.8 - ▲ 1.1
2015/02期 4th Quarter 2016/02期 1st Quarter
2014/12-2015/02 2015/03-05 2015/06-08 2015/09-11
2016/02期 4th Quarter
2015/12-2016/02
Householdgoods
Householdgoods
決算概要 Financial Summary
Ⅲ.株式会社 良品計画個別 RYOHIN KEIKAKU CO.,LTD. Non-consolidated
2016/02期2014/02期 2015/02期2014/03-2015/022013/03-2014/02 2015/03-2016/02
2016/02期 2nd Quarter 2016/02期 3rd Quarter
21
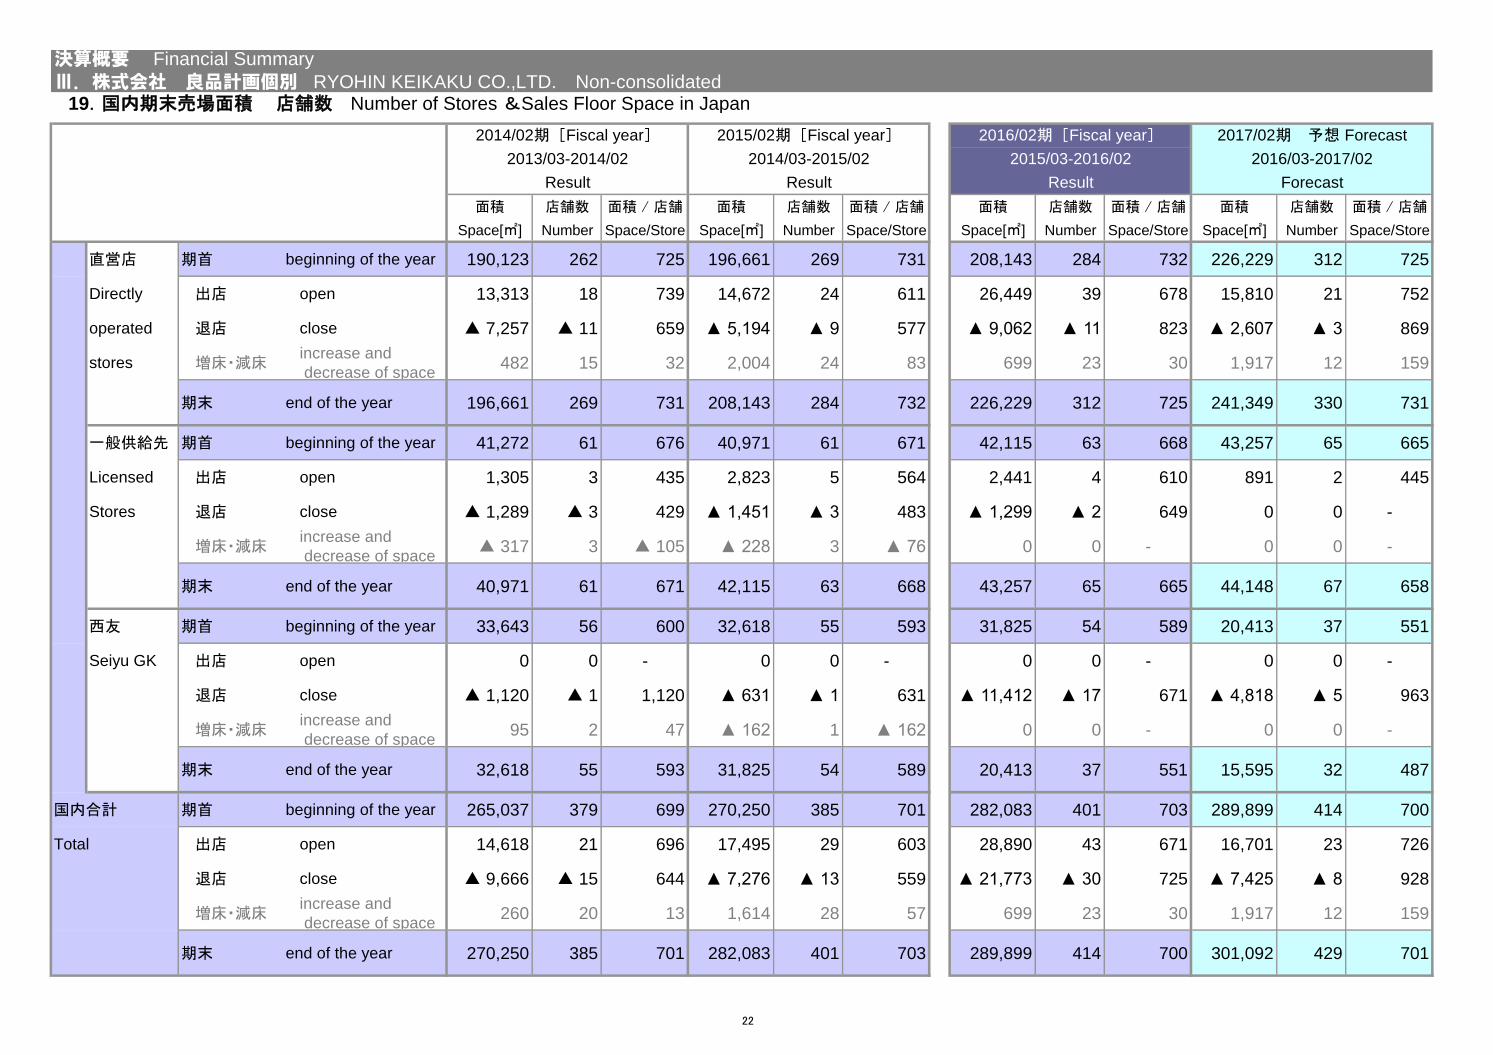
19.国内期末売場面積 店舗数 Number of Stores &Sales Floor Space in Japan
面積 店舗数 面積 / 店舗 面積 店舗数 面積 / 店舗 面積 店舗数 面積 / 店舗 面積 店舗数 面積 / 店舗
Space[㎡] Number Space/Store Space[㎡] Number Space/Store Space[㎡] Number Space/Store Space[㎡] Number Space/Store
直営店 期首 beginning of the year 190,123 262 725 196,661 269 731 208,143 284 732 226,229 312 725
Directly 出店 open 13,313 18 739 14,672 24 611 26,449 39 678 15,810 21 752
operated 退店 close ▲ 7,257 ▲ 11 659 ▲ 5,194 ▲ 9 577 ▲ 9,062 ▲ 11 823 ▲ 2,607 ▲ 3 869
stores 増床・減床increase and
decrease of space482 15 32 2,004 24 83 699 23 30 1,917 12 159
期末 end of the year 196,661 269 731 208,143 284 732 226,229 312 725 241,349 330 731
一般供給先 期首 beginning of the year 41,272 61 676 40,971 61 671 42,115 63 668 43,257 65 665
Licensed 出店 open 1,305 3 435 2,823 5 564 2,441 4 610 891 2 445
Stores 退店 close ▲ 1,289 ▲ 3 429 ▲ 1,451 ▲ 3 483 ▲ 1,299 ▲ 2 649 0 0 -
増床・減床increase and
decrease of space▲ 317 3 ▲ 105 ▲ 228 3 ▲ 76 0 0 - 0 0 -
期末 end of the year 40,971 61 671 42,115 63 668 43,257 65 665 44,148 67 658
西友 期首 beginning of the year 33,643 56 600 32,618 55 593 31,825 54 589 20,413 37 551
Seiyu GK 出店 open 0 0 - 0 0 - 0 0 - 0 0 -
退店 close ▲ 1,120 ▲ 1 1,120 ▲ 631 ▲ 1 631 ▲ 11,412 ▲ 17 671 ▲ 4,818 ▲ 5 963
増床・減床increase and
decrease of space95 2 47 ▲ 162 1 ▲ 162 0 0 - 0 0 -
期末 end of the year 32,618 55 593 31,825 54 589 20,413 37 551 15,595 32 487
国内合計 期首 beginning of the year 265,037 379 699 270,250 385 701 282,083 401 703 289,899 414 700
Total 出店 open 14,618 21 696 17,495 29 603 28,890 43 671 16,701 23 726
退店 close ▲ 9,666 ▲ 15 644 ▲ 7,276 ▲ 13 559 ▲ 21,773 ▲ 30 725 ▲ 7,425 ▲ 8 928
増床・減床increase and
decrease of space260 20 13 1,614 28 57 699 23 30 1,917 12 159
期末 end of the year 270,250 385 701 282,083 401 703 289,899 414 700 301,092 429 701
Result Result Result Forecast
決算概要 Financial Summary
Ⅲ.株式会社 良品計画個別 RYOHIN KEIKAKU CO.,LTD. Non-consolidated
2014/02期[Fiscal year] 2015/02期[Fiscal year] 2016/02期[Fiscal year] 2017/02期 予想 Forecast
2013/03-2014/02 2014/03-2015/02 2015/03-2016/02 2016/03-2017/02
22
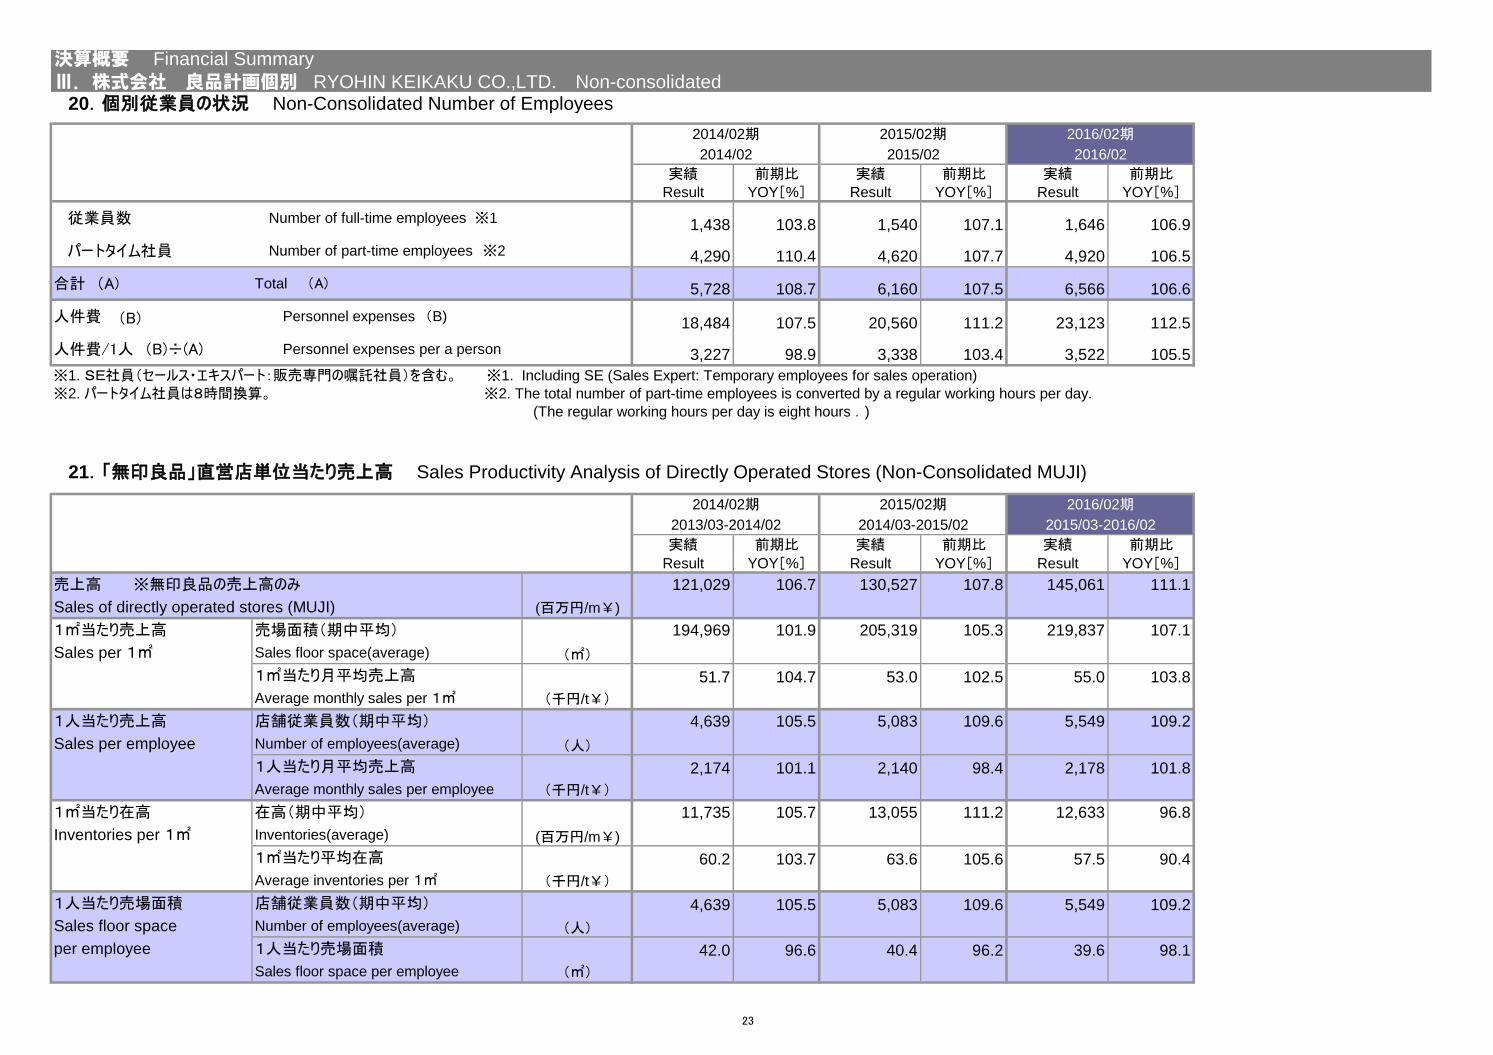
20.個別従業員の状況 Non-Consolidated Number of Employees
実績 前期比 実績 前期比 実績 前期比 実績 前期比Result YOY[%] Result YOY[%] Result YOY[%] Result YOY[%]
従業員数 Number of full-time employees ※1 1,438 103.8 1,540 107.1 1,646 106.9 1,540 107.1
パートタイム社員 Number of part-time employees ※2 4,290 110.4 4,620 107.7 4,920 106.5 4,620 107.7
合計 'A) Total 'A) 5,728 108.7 6,160 107.5 6,566 106.6 6,160 107.5
人件費 Personnel expenses 'B) 18,484 107.5 20,560 111.2 23,123 112.5
人件費/1人 'B)÷(A) Personnel expenses per a person 3,227 98.9 3,338 103.4 3,522 105.5
21.「無印良品」直営店単位当たり売上高 Sales Productivity Analysis of Directly Operated Stores (Non-Consolidated MUJI)
実績 前期比 実績 前期比 実績 前期比 実績 前期比
Result YOY[%] Result YOY[%] Result YOY[%] Result YOY[%]
売上高 ※無印良品の売上高のみ 121,029 106.7 130,527 107.8 145,061 111.1 130,527 107.8
Sales of directly operated stores (MUJI) (百万円/m¥)
1㎡当たり売上高 売場面積'期中平均( 194,969 101.9 205,319 105.3 219,837 107.1 205,319 105.3
Sales per 1㎡ Sales floor space(average) '㎡(
1㎡当たり月平均売上高 51.7 104.7 53.0 102.5 55.0 103.8 53.0 102.5
Average monthly sales per 1㎡ '千円/t¥(
1人当たり売上高 店舗従業員数'期中平均( 4,639 105.5 5,083 109.6 5,549 109.2 5,083 109.6
Sales per employee Number of employees(average) '人(
1人当たり月平均売上高 2,174 101.1 2,140 98.4 2,178 101.8 2,140 98.4
Average monthly sales per employee '千円/t¥(
1㎡当たり在高 在高'期中平均( 11,735 105.7 13,055 111.2 12,633 96.8 13,055 111.2
Inventories per 1㎡ Inventories(average) (百万円/m¥)
1㎡当たり平均在高 60.2 103.7 63.6 105.6 57.5 90.4 63.6 105.6
Average inventories per 1㎡ '千円/t¥(
1人当たり売場面積 店舗従業員数'期中平均( 4,639 105.5 5,083 109.6 5,549 109.2 5,083 109.6
Sales floor space Number of employees(average) '人(
per employee 1人当たり売場面積 42.0 96.6 40.4 96.2 39.6 98.1 40.4 96.2
Sales floor space per employee '㎡(
2015/03-2016/022015/03-2016/02
※1. SE社員'セールス・エキスパート:販売専門の嘱託社員(を含む。 ※1. Including SE (Sales Expert: Temporary employees for sales operation)
※2. パートタイム社員は8時間換算。 ※2. The total number of part-time employees is converted by a regular working hours per day.
(The regular working hours per day is eight hours .)
2014/02期
2013/03-2014/02 2014/03-2015/02
決算概要 Financial Summary
Ⅲ.株式会社 良品計画個別 RYOHIN KEIKAKU CO.,LTD. Non-consolidated
2016/02期
2014/02期
2014/02
2015/02期
2016/02期[Fiscal year]
2015/02
2016/02期期末[End of year]
2015/08
2015/02期
2016/02期
2016/02
'B)
23

22.月別売上・客数・客単価昨比 Monthly YOY Change in Sales , Number of Customers and Sales per Customer
3月 4月 5月 第1Q 6月 7月 8月 第2Q 上期 9月 10月 11月 第3Q 9ヶ月 12月 1月 2月 第4Q 下期 年間
Mar. Apr. MayThe 1st
quarterJun. Jul. Aug.
The
2nd
quarter
The 1st
halfSep. Oct. Nov.
The 3rd
quarter
9
monthsDec. Jan. Feb.
The 4thquarter
The
2nd
half
Fiscal
year
衣服 Apparel 97.2 113.1 108.2 106.2 98.6 106.5 114.1 105.5 105.9 108.0 101.9 90.8 99.0 103.2 94.9 102.3 99.3 97.7 98.5 102.1
生活 Household goods 85.9 117.4 110.9 100.8 104.4 109.1 110.3 107.8 103.9 111.5 120.7 112.2 114.8 107.2 110.4 112.2 106.4 109.6 112.4 108.1
食品 Food 92.4 95.8 95.4 94.4 95.4 90.5 98.6 94.6 94.5 105.2 101.9 100.7 102.3 96.8 100.3 99.4 94.7 97.9 100.0 97.3
89.7 113.8 108.5 102.3 101.3 106.4 110.6 105.8 103.9 109.8 111.5 102.3 107.4 104.9 103.2 107.4 102.6 104.1 106.0 104.9
93.2 120.6 114.6 107.6 107.2 111.6 116.7 111.5 109.4 116.1 115.4 108.0 112.9 110.6 110.8 116.0 111.8 112.8 112.8 111.1
85.3 109.5 105.5 98.4 98.6 103.4 111.2 103.8 100.9 107.4 109.7 99.5 105.3 102.7 102.6 105.5 102.9 104.0 104.4 102.9
87.1 111.8 106.5 100.1 101.4 104.9 112.4 105.8 102.6 114.6 113.8 97.8 107.7 104.3 101.1 101.2 95.7 99.6 103.8 103.2
88.9 112.9 107.9 101.6 100.8 105.8 110.7 105.4 103.4 109.3 111.2 101.7 107.0 104.4 103.1 107.1 102.7 104.0 105.7 104.6
92.0 118.9 113.1 106.2 106.1 110.4 115.9 110.5 108.1 115.8 115.1 106.1 111.9 109.4 109.0 113.4 108.9 110.4 111.2 109.7
97.5 110.8 114.1 107.4 117.7 110.4 115.2 115.2 111.0 112.1 116.4 105.6 111.7 111.2 115.9 112.0 111.6 114.4 113.0 112.0
93.4 112.5 94.6 104.3 108.9 110.8 117.6 112.1 107.7 114.3 115.3 105.5 111.4 109.0 113.3 112.3 109.7 112.3 111.8 109.8
直営既存店 Existing directly operated stores(MUJI)
93.0 98.8 99.2 96.9 94.9 95.8 100.5 97.0 97.0 99.8 101.5 95.3 98.6 97.3 96.5 98.1 97.2 97.0 97.9 97.4
96.5 115.2 109.3 105.6 106.7 111.1 110.1 109.1 107.2 110.0 109.9 107.3 108.9 107.8 107.0 109.5 105.6 107.3 108.3 107.7
- - - 102.1 - - - 102.5 102.3 - - - 103.9 102.8 - - - 105.9 104.9 103.6
前期比 YOY [%]
- - - 105.4 - - - 108.9 106.9 - - - 108.6 107.6 - - - 106.5 107.6 107.3
前期比 YOY [%]
- - - 106.2 - - - 105.8 106.0 - - - 108.5 106.8 - - - 109.2 108.9 107.4
前期比 YOY [%]
- - - 101.3 - - - 105.4 103.2 - - - 104.0 103.5 - - - 103.3 103.6 103.5
前期比 YOY [%]
決算概要 Financial Summary
Ⅲ.株式会社 良品計画個別 RYOHIN KEIKAKU CO.,LTD. Non-consolidated
客単価 Sales per customer
販売数量 Total number of items sold
平均単価 Average sales per item
客数 Number of Customers
客数Number of Customers
客単価Sales per customer
ショップ既存店Existing stores
ショップ合計Store total
全社Directly operated stores(MUJI) and wholesale
直営合計Directly operated stores(MUJI(
直営既存店Existing directly operated stores(MUJI)
直営合計Directly operated stores total(MUJI)
LS西友既存店Existing licensed stores & Seiyu GK
LS西友合計Licensed stores & Seiyu GK total
全社'海外供給除く(Net sales excluding Overseas whole sale
24
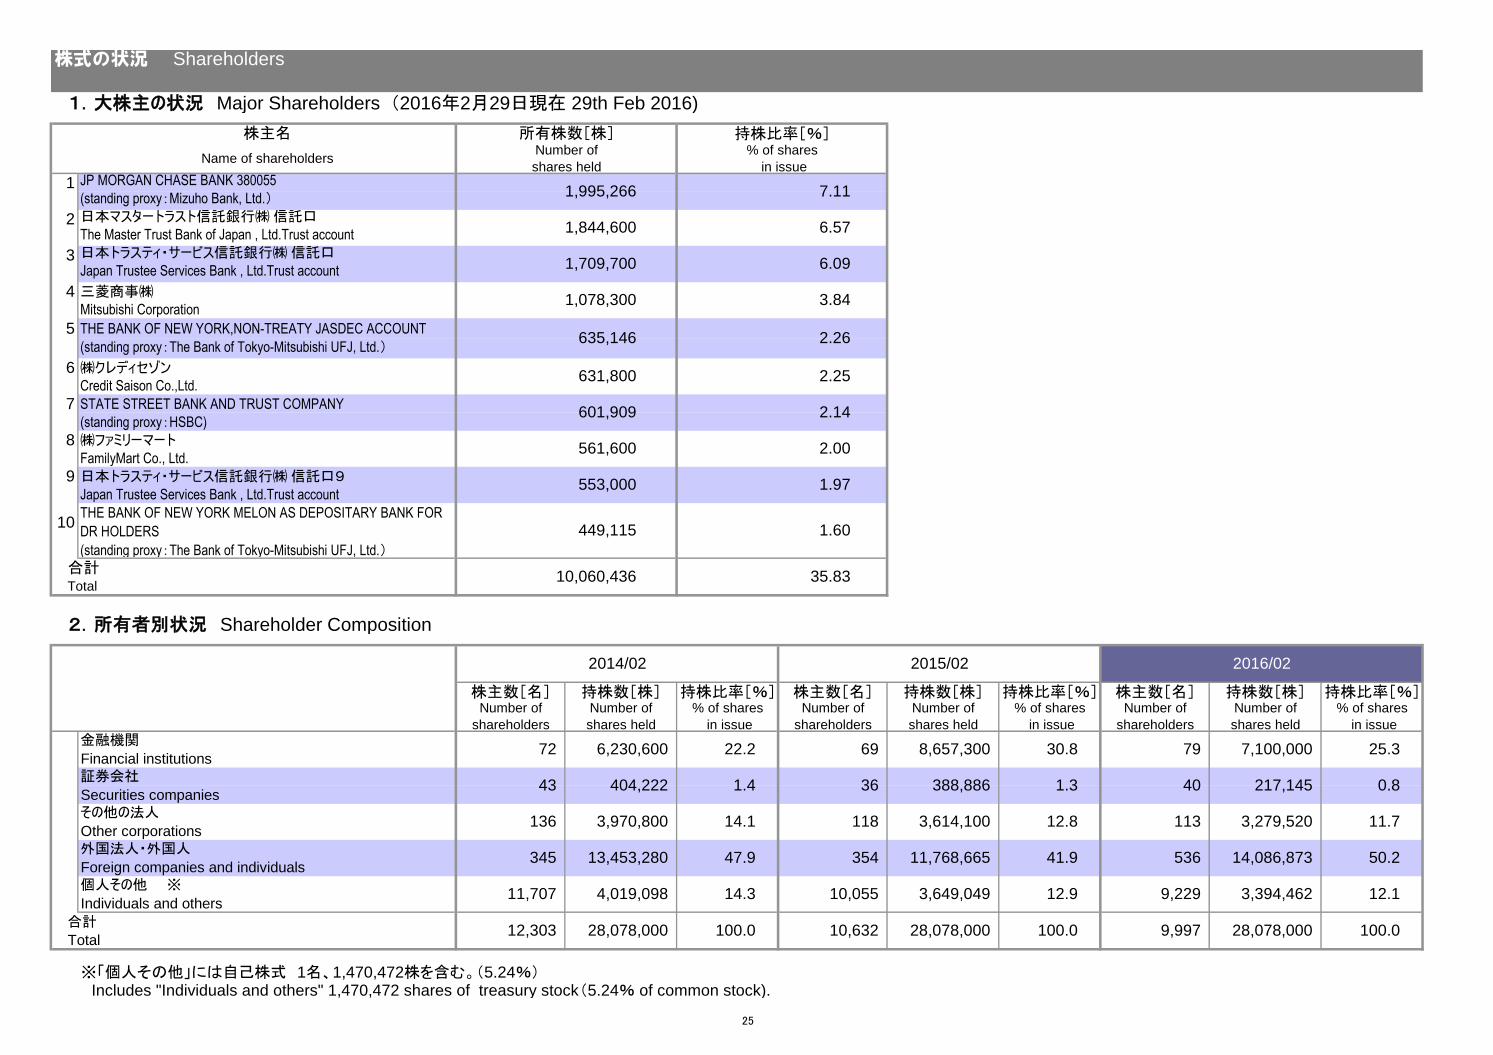
1.大株主の状況 Major Shareholders '2016年2月29日現在 29th Feb 2016)
株主名 所有株数[株] 持株比率[%]
Name of shareholdersNumber of
shares held
% of shares
in issue
1 JP MORGAN CHASE BANK 380055
(standing proxy:Mizuho Bank, Ltd.(
2 日本マスタートラスト信託銀行㈱ 信託口The Master Trust Bank of Japan , Ltd.Trust account
3 日本トラスティ・サービス信託銀行㈱ 信託口Japan Trustee Services Bank , Ltd.Trust account
4 三菱商事㈱Mitsubishi Corporation
5 THE BANK OF NEW YORK,NON-TREATY JASDEC ACCOUNT
(standing proxy:The Bank of Tokyo-Mitsubishi UFJ, Ltd.(
6 ㈱クレディセゾンCredit Saison Co.,Ltd.
7 STATE STREET BANK AND TRUST COMPANY
(standing proxy:HSBC)
8 ㈱ファミリーマートFamilyMart Co., Ltd.
9 日本トラスティ・サービス信託銀行㈱ 信託口9Japan Trustee Services Bank , Ltd.Trust account
10THE BANK OF NEW YORK MELON AS DEPOSITARY BANK FOR
DR HOLDERS
(standing proxy:The Bank of Tokyo-Mitsubishi UFJ, Ltd.(合計Total
2.所有者別状況 Shareholder Composition
株主数[名] 持株数[株] 持株比率[%] 株主数[名] 持株数[株] 持株比率[%] 株主数[名] 持株数[株] 持株比率[%]Number of
shareholders
Number of
shares held
% of shares
in issue
Number of
shareholders
Number of
shares held
% of shares
in issue
Number of
shareholders
Number of
shares held
% of shares
in issue
金融機関
Financial institutions
証券会社
Securities companies
その他の法人
Other corporations
外国法人・外国人
Foreign companies and individuals
個人その他 ※
Individuals and others
合計Total
※「個人その他」には自己株式 1名、1,470,472株を含む。'5.24%( Includes "Individuals and others" 1,470,472 shares of treasury stock'5.24% of common stock).
28,078,000
12.8
100.012,303 28,078,000
14.1136
11,707
345 41.9
12.9
47.9
14.3
3,970,800
4,019,098
13,453,280
9,997 28,078,000 100.0100.0
69 8,657,300
36 388,886
118 3,614,100
354 11,768,665
10,055
30.8
1.3
10,632
536 14,086,873 50.2
9,229 3,394,462 12.1
22.2
113 3,279,520 11.7
72 6,230,600
1.443 404,222
79 7,100,000 25.3
40 217,145 0.8
1,709,700
1.97
1.60
553,000
449,115
1,078,300
635,146
6.09
3.84
601,909
561,600
3,649,049
株式の状況 Shareholders
2016/022015/022014/02
35.8310,060,436
2.00
2.26
2.25
2.14
7.11
6.57
631,800
1,995,266
1,844,600
25
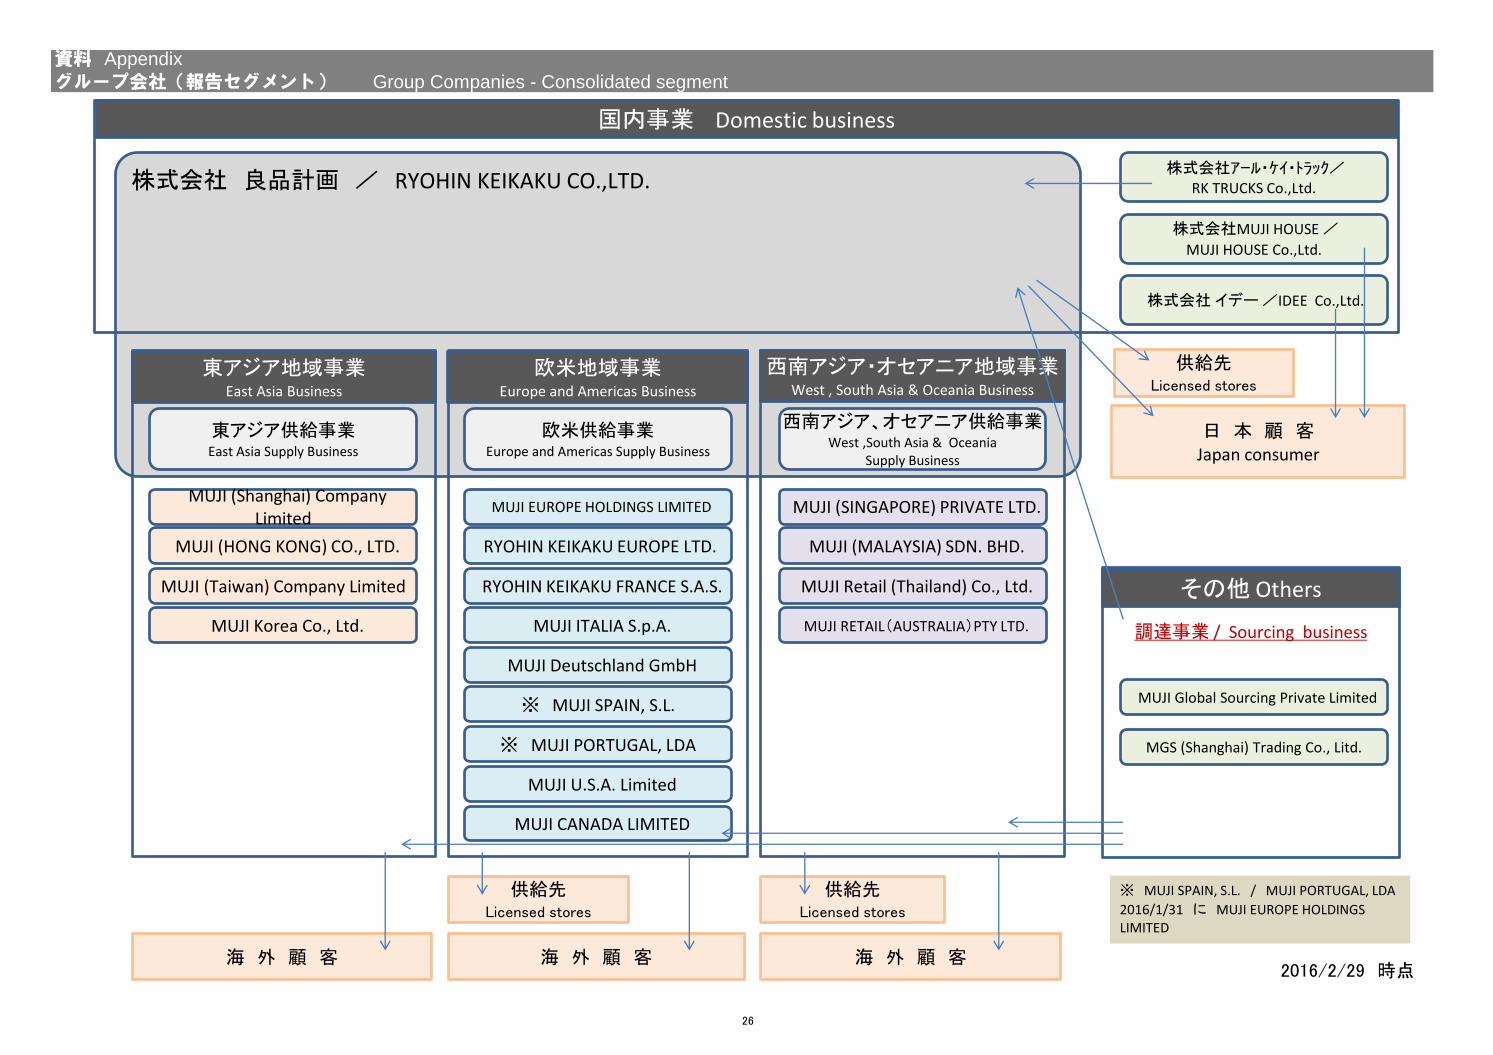
国内事業
2016/2/29 時点
資料 Appendix
グループ会社(報告セグメント) Group Companies - Consolidated segment
株式会社 良品計画 / RYOHIN KEIKAKU CO.,LTD.
MUJI (Shanghai) Company Limited
MUJI EUROPE HOLDINGS LIMITED MUJI (SINGAPORE) PRIVATE LTD.
MUJI Global Sourcing Private Limited
RYOHIN KEIKAKU EUROPE LTD.
RYOHIN KEIKAKU FRANCE S.A.S.
MUJI ITALIA S.p.A.
MUJI Deutschland GmbH
※ MUJI SPAIN, S.L.
MUJI CANADA LIMITED
MUJI (HONG KONG) CO., LTD.
MUJI (Taiwan) Company Limited
MUJI Korea Co., Ltd.
MUJI (MALAYSIA) SDN. BHD.
MUJI Retail (Thailand) Co., Ltd.
MUJI RETAIL'AUSTRALIA(PTY LTD.
MGS (Shanghai) Trading Co., Litd.
東アジア供給事業 East Asia Supply Business
欧米供給事業 Europe and Americas Supply Business
西南アジア、オセアニア供給事業 West ,South Asia & Oceania
Supply Business
株式会社アール・ケイ・トラック/ RK TRUCKS Co.,Ltd.
株式会社MUJI HOUSE /
MUJI HOUSE Co.,Ltd.
株式会社 イデー /IDEE Co.,Ltd.
東アジア地域事業 East Asia Business
欧米地域事業 Europe and Americas Business
西南アジア・オセアニア地域事業 West , South Asia & Oceania Business
国内事業 Domestic business
その他 Others
調達事業 / Sourcing business
海 外 顧 客 海 外 顧 客 海 外 顧 客
日 本 顧 客 Japan consumer
供給先 Licensed stores
供給先 Licensed stores
供給先 Licensed stores
※ MUJI PORTUGAL, LDA
MUJI U.S.A. Limited
※ MUJI SPAIN, S.L. / MUJI PORTUGAL, LDA
2016/1/31 に MUJI EUROPE HOLDINGS LIMITED
26