Embed Size (px)
Citation preview
Entwicklung und Anwendung neuer analytischer
Methoden zur schnellen Bestimmung von kurzlebigen
Radiumisotopen und Radon im grundwasser-
beeinflussten Milieu der Ostsee
Dissertation
zur Erlangung des Doktorgrades
der Mathematisch-Naturwissenschaftlichen Fakultät
der Christian-Albrechts-Universität
zu Kiel
vorgelegt von
Stefan Purkl
Kiel 2002

Referent: _________________________________
Korreferent: ______________________________
Tag der mündlichen Prüfung: ________________________
Zum Druck genehmigt: Kiel, den __________________
Der Dekan

Hiermit erkläre ich an Eides statt, dass die vorliegende Abhandlung, abgesehen der Beratung
durch meine akademischen Lehrer, nach Inhalt und Form meine eigene Arbeit darstellt.
________________________
Stefan Purkl
Inhaltsverzeichnis i
Inhaltsverzeichnis
Einleitung und Zielsetzung...........................................................................1EINLEITUNG........................................................................................................................1ZIELSETZUNG UND KONZEPTION...............................................................................4LITERATUR...........................................................................................................................5
Kapitel I: Neue analytische Methoden Teil 1 ................................................ 8Solid-Phase Extraction Using EmporeTM Radium Rad Disks to SeparateRadium from ThoriumABSTRACT............................................................................................................................9INTRODUCTION.................................................................................................................9EXPERIMENTAL SETUP..................................................................................................11
Instrumentation......................................................................................................................................................11Tracers and Reference Materials .......................................................................................................................12Chemical Separation Procedures ......................................................................................................................13Spectrometry ..........................................................................................................................................................15
RESULTS AND DISCUSSION...........................................................................................20Separation of Ra from Th...................................................................................................................................20Intercomparison of Ra Measurements ............................................................................................................22
SUMMARY AND CONCLUSIONS....................................................................................23REFERENCES ....................................................................................................................24
Kapitel II. Neue analytische Methoden Teil 2 .............................................25A Rapid Method for α -Spectrometric Analysis of Radium Isotopes inNatural Waters Using Ion-Selective Membrane TechnologyABSTRACT..........................................................................................................................26INTRODUCTION...............................................................................................................26CHEMICAL PROCEDURES ..............................................................................................27
Flow Diagram for Sample Preparation...........................................................................................................27Procedure for Ion-Selective Extraction of Ra via Membrane Technology...........................................27Low Pressure Column-Chromatography........................................................................................................28Electrodeposition from Ethanolic Solution...................................................................................................29α-Spectrometric Analysis ....................................................................................................................................30
RESULTS AND DISCUSSION...........................................................................................33Ra Determination Using a 229Th/225Ra Standard Solution........................................................................33Ra Stripping Using Adapted EDTA-Mixtures..............................................................................................35Separation of Disturbing Matrix Composition Using Low Pressure Column-Chromatography....36Production of Homogenous α-Sources in Presence of Ba .......................................................................36High Rn Retention in Thin Deposits...............................................................................................................38
SUMMARY ..........................................................................................................................43REFERENCES ....................................................................................................................44
Inhaltsverzeichnis ii
Kapitel III. Radium und Radon als natürliche Tracer .................................46Determination of Radium Isotopes and 222Rn in a Groundwater Affected
Coastal Area of the Baltic Sea and the Underlying Sub-Sea Floor AquiferABSTRACT..........................................................................................................................47INTRODUCTION...............................................................................................................47LOCATION AND SAMPLING..........................................................................................50SIMULTANEOUS DETERMINATION OF Ra ISOTOPES.............................................52222Rn MEASUREMENT USING A PORTABLE LS-COUNTER ......................................53
Principle....................................................................................................................................................................53Analytical Procedure.............................................................................................................................................54
RESULTS.............................................................................................................................55ANALYSIS OF SMALL-SCALE COASTAL MIXING PROCESSES ................................58
Modelling of Vertical Dispersive Mixing........................................................................................................58Modelling of Horizontal Dispersive Mixing ..................................................................................................61Simple Two-Box Model for Groundwater Discharge................................................................................63
SUMMARY AND CONCLUSION......................................................................................65REFERENCES ....................................................................................................................66
Kapitel IV. Neuanmeldung zum Gebrauchsmuster.....................................68Vorrichtung zur Extraktion von Stoffen von einer Membran
Zusammenfassung ......................................................................................77
Anhang........................................................................................................78α-SPEKTROMETRIE................................................................................................................78BERECHNUNG VON MITTELWERTEN UND UNSICHERHEITEN ................................................85URKUNDE ÜBER DIE EINTRAGUNG DES GEBRAUCHSMUSTERS...............................................88LITERATUR ............................................................................................................................89
Einleitung und Zielsetzung 1
Einleitung und Zielsetzung
1.1. Einleitung
Weltweit sind in verschiedenen Küstenregionen (Nordamerika [1], Mittelamerika [2] Australien
[3], Indien [4], Europa [5]) submarine Grundwasseraustritte beobachtet worden. Im
Zusammenhang mit Karstsystemen kennt man gut charakterisierte submarinen Quellen [6],
während an den Küsten von Nord- und Ostsee teilweise fokussierte [7], aber auch diffuse
Austritte beobachtet werden. Trotz geringer Flussraten kann auch dieser diffuse Austritt,
integriert über die Fläche, Auswirkungen auf das küstennahe Milieu haben. Große Mengen an
Nährstoffen, Metallen, organischen Verbindungen und anorganischem Kohlenstoff können so
in die Küstenzone eingetragen werden [8]. Kalkulationen, dass der direkte submarine Eintrag
40 % [9] des Flusswassereintrags in den Ozean beträgt, sind möglicherweise zu hoch [10, 11].
Autoren wie Zektser and Loaiciga [12] berichten von Einträgen in der Größenordnung von
weniger als 10 %. Auch wenn der Einfluss auf den Wasserhaushalt nicht die herausragende
Gewichtung besitzen sollte, so werden in stark besiedelten Küstenregionen etwaige Schadstoffe
über sehr kurze Transportwege eingetragen und führen damit unmittelbar zur Beeinträchtigung
der Küstenzone.
Bollinger und Moore [13] und Cable et al. [14] haben gezeigt, dass Radiumisotope (223Ra, 224Ra,226Ra, 228Ra) und Radon (222Rn) aufgrund ihrer Anreicherung im Grundwasser grundsätzlich als
natürliche Tracer geeignet sind und zur Identifizierung und Quantifizierung von Fluidaustritten
herangezogen werden können. Der bisherige Mangel an schnellen und sensitiven
Analyseverfahren bedingt aber, dass Parameter, die Mobilität und Transport der verwendeten
Radionuklide bestimmen und damit eine präzisere Quantifizierung erlauben, nicht ausreichend
verstanden sind. Um küstennahe Mischungsprozesse von Grund- und Meerwasser im Bereich
von 100 von 103 m zu untersuchen benötigt man möglichst kurzlebige Nuklide mit
Halbwertszeiten (T1/2) in der Größenordnung von Tagen [15].
Einleitung und Zielsetzung 2
Die Analyse dieser Prozesse mit Radiumisotopen und 222Rn als Tracer, stellt vor allem im Falle
der kurzlebigen Radiumisotope 223Ra (T1/2 = 11,43 d) und 224Ra (T1/2 = 3,66 d) hohe
Anforderungen an die verwendete Analytik. Für die Radiumbestimmung muss der Analyt
zunächst aufkonzentriert werden. Das etablierte Anreicherungsverfahren über
Mangandioxidfilter wird seit den 70er Jahren verwendet [16], ist aber sehr unspezifisch für
Radium. Neben Radium wird unter anderem auch Thorium an die sorptive Oberfläche
gebunden und führt, je länger der Zeitraum zwischen Probennahme und Messung ist, durch die
Nachbildung kurzlebiger Zerfallsprodukte zu großen Messunsicherheiten. Die Bestimmung der
Radiumisotope erfolgte dann zumeist γ-spektrometrisch [17]. Aufgrund der geringen
Empfindlichkeit, (hoher Nulleffekt durch terrestrische und kosmische Strahlung) musste der
Analyt allerdings vorher aus großen Probevolumina angereichert werden. So wurden bei den
ersten Messungen von 224Ra in den Buchten von Delaware und Winyah [18] Mengen von ca.
500 l verwendet.
Die Bestimmung von kurzlebigen Radiumisotopen mittels Emanationtechnik [19], über die
gasförmigen Zerfallsprodukte 219Rn und 220Rn stellt eine wesentliche messtechnische
Verbesserung dar. Der Einbau elektronischer Komponenten [20] in das System berücksichtigt
die Zerfallscharakteristik von 220Rn und 219Rn und ermöglicht so eine Unterscheidung der
Mutternuklide 224Ra und 223Ra. Auch die Nulleffektzählraten der verwendeten α-
Szintillationszelle von 10 -2 bis 10 -3 Ereignisse pro Sekunde reduzieren sich, die Nachweisgrenzen
sinken dadurch entsprechend. Das System muss allerdings durch Standardmessungen immer
wieder kalibriert und die Messbedingungen für jede Messung gleichgehalten werden. Da
während der Bestimmung Helium als Trägergas durch den Manganfilter zirkuliert und eine
Änderungen im Feuchtigkeitsgehalt [21] bewirkt, ist die Einstellung dieser Standardbedingungen
jedoch schwierig. Um die Gesamteffektivität der Methode (Anreicherung und Messung) zu
bestimmen, müssen an einer Probe Mehrfachmessungen der langlebigen Radiumisotope
durchgeführt werden. Der zeitliche Aufwand erhöht sich. Die Verwendung eines internen
Standards ist nicht möglich.
Es gibt methodische Ansätze alle vier Radiumisotope simultan über energieaufgelöste
α-Spektrometrie zu bestimmen [22, 23]. Durch die Verwendung eines internen Standards, hier225Ra, entfallen Mehrfachmessungen und Unsicherheiten bei der Kalibrierung des Messsystems.
Außerdem stellt die α-Spektrometrie aufgrund des geringen Untergrunds (7*10-5 Ereignisse pro
Sekunde im Energiebereich 3-8 MeV) eine besonders empfindliche Messmethode dar und
erlaubt bei Messzeiten von 5000 min ein Detektionslimit von 0,2 mBq [24]. Aufwendige
nasschemische Anreicherungsverfahren und die Vielzahl der benötigten Aufarbeitungsschritte
Einleitung und Zielsetzung 3
führen allerdings dazu, dass diese Methode für die Bestimmung der kurzlebigen Radiumisotope
in küstennahem Meerwasser bis jetzt kaum Anwendung findet.
Entwicklungen der 90er Jahre auf dem Gebiet der Molekülerkennungstechnologie eröffnen nun
neue Wege, Radium, trotz hoher Salzfracht, einfach, effizient und sehr spezifisch anzureichern
[25]. Mittels ionenselektiver Membrane kann der Analyt durch enorm schnelle
Extraktionskinetik mit 400 bis 4000 höheren Durchflußraten [26] aus salpetersaurer Lösung
extrahiert werden. Diese neuentwickelten Membrane bestehen aus einer Teflonmatrix, auf der
Kronen-Ether kovalent gebunden aufgebracht sind [27]. Kronen-Ether sind 20-25 Atome
enthaltende Makrozyklen, die durch Käfiggröße und Substituenden auf Ra2+ als Analyten
abgestimmt sind.
Die weitere Analytik kann so ausgerichtet werden, dass eine Messung des Analyten über
energieaufgelöste α-Spektrometrie schnell und einfach durchführbar sein sollte. Durch die
Kombination der radiumselektiven Membrantechnik mit der Sensitivität der α-Spektrometrie
wird das Probevolumen minimiert und der apparative und zeitliche Aufwand reduziert. Neben
den geochemischen Vorteilen von Radium als Tracer für submarine Grundwasseraustritte, ergibt
sich so die geforderte einfache, schnelle und präzise Messbarkeit der Radiumisotope.
Einleitung und Zielsetzung 4
1.2. Zielsetzung und Konzeption
Der Schwerpunkt dieser Arbeit liegt in der Entwicklung eines neuen α-spektrometrischen
Verfahrens zur simultanen, sensitiven und schnellen Bestimmung von Radiumisotopen.Zusammen mit einer optimierten Technik zur Messung von 222Rn soll in Anwendung derAnalyseverfahren in einem vom submarinen Grundwassereintrag beeinflussten Küstengebietderen Leistungsfähigkeit aufgezeigt werden. Durch die Etablierung einer praktikablen Methodik
soll diese Arbeit einen Beitrag zum Verständnis über den Transport der verwendeten natürlichenTracer leisten.
Kapitel I: Neue analytische Methoden Teil 1
Im Rahmen dieser Arbeit sollen die Untersuchungen zeigen, ob ionenselektive Membrane eineeffektive Anreicherung von Radium aus wässrigen Medien ermöglichen und die gleichzeitige
Abtrennung störender Matrixkomponenten erlauben. Die Bestimmung von Trennungsfaktorenfür Thorium gestattet eine Einschätzung, ob sich die Verwendung dieser Extraktionstechnik für
die α-spektrometrische Bestimmung von Radium eignet.
Kapitel II: Neue analytische Methoden Teil 2
Für die α-spektrometrische Bestimmung von kurzlebigen Radiumisotopen müssen die
entsprechenden Analyseschritte so optimiert werden, dass die Aufbereitung der wässrigenProben innerhalb weniger Stunden erfolgen kann. Vor allem für die Radiumbestimmung inProben mit hoher Salzfracht ist die Verwendung eines internen Standards zu fordern. Für dieRadiumextraktion über ionenselektive Membrane wird daher erstmals mit 225Ra als internerStandard gearbeitet und führt durch Reduktion zeitaufwendiger Separationsmethoden und das
Wegfallen von externen Kalibrierungen zu dem geforderten hohen Probendurchsatz.
Kapitel III: Radium und Radon als natürliche Tracer
Konzentrationsbestimmungen der Tracer 223Ra, 224Ra,226Ra, 228Ra und 222Rn in der Wassersäuleder Eckernförder Bucht (Westliche Ostsee) und in dem einflussnehmenden Grundwasserleitersollen Aufschluss über das Verhalten und die Bewegung der Tracer geben. Über einfache
Ansätze zur Modellierung der Felddaten kann so ein besseres Verständnis für die Parametergewonnen werden, die den Transport der Tracer steuern.
Kapitel IV: Neuanmeldung zum Gebrauchsmuster
Die Anmeldung zum Gebrauchsmuster sollen die technischen Anforderungen, Eigenschaftenund Ausführung der verwendeten Apparatur zur Extraktion von Radium aus wässrigen Medien
dokumentieren. Die gewerbliche Verfügbarkeit ist Voraussetzung für die Etablierung einerneuen Methodik.
Einleitung und Zielsetzung 5
Literatur
[1] J. M. Krest, W. S. Moore, Rama; 226Ra and 228Ra in the mixing zones of the Mississippi
and Atchafalaya rivers: indicators of groundwater input; Marine Chemistry;
64 (1999) 129-152.
[2] J. E. Cable, W. C. Burnett, J. P. Chanton, G. L. Weatherly; Estimating groundwater
discharge into the northeastern Gulf of Mexico using radon-222; Earth and Planetary
Science Letters; 144 (1996), 591-604.
[3] R. E. Johannes, C. J. Hearn; The effect of submarine groundwater discharge on nutrient
and salinity regimes in a coastal lagoon off Perth, Western Australia; Estuarine, Coastal
and Shelf Science; 21 (1985) 789-800.
[4] W. S. Moore; High fluxes of radium and barium from the mouth of the Ganges-
Brahmaputra River during low river discharge suggest a large groundwater source; Earth
and Planetary Science Letters; 150 (1997) 141-150.
[5] I. Bussmann, E. Suess; Groundwater seepage in Eckernforde Bay (Western Baltic Sea):
effect on methane and salinity distribution of the water column; Continental Shelf
Research; 18 (1998) 1795-1806.
[6] F. A. Kohout, G. W. Leve, F.T. Manheim; Red Snapper Sink and ground water flow off
Shore of southeastern Florida; In Proceedings of the 12th International Congress: Karst
Hydrology; International Association of Geohydrological Memoirs; 12 (1977) 193.
[7] A. Kandriche, F. Werner; Freshwater-induced pockmarks in Bay of Eckernförde,
Western Baltic; Proceedings of the Third Marine Geological Conference “The Baltic”;
(1995) 155-164.
[8] T. M. Church; An underground route for the water cycle; Nature; 380 579-580.
[9] W. S. Moore; Large groundwater inputs to coastal waters revealed by 226Ra enrichments;
Nature; 380 (1996) 612-614.
[10] P. L. Younger, W. S. Moore, T. M. Church; Submarine groundwater discharge:
discussion and reply; Nature; 382 (1996) 121-122.
[11] L. Li, D. A. Barry, F. Stagnitti, J. Y. Parlange; Submarine groundwater discharge and
associated chemical input to a coastal sea; Water Resources Research;
35 (1999) 3253-3259.
Einleitung und Zielsetzung 6
[12] I. S. Zektser, H. A. Loaiciga; Ground water fluxes in the global hydrologic cycle: past,
present and future; Journal of Hydrology; 144 (1993) 405-427.
[13] Rama, W. S. Moore; Using the radium quartet for evaluating groundwater input and
water exchange in salt marshes. Geochimica et Cosmochimica Acta,
60 (1996) 4645-4652.
[14] J. E. Cable, G. C. Bugna, W. C. Burnett, J. P. Chanton; Application of 222Rn and CH4 for
assessment of groundwater discharge to the coastal ocean; Limnology and
Oceanography; 41 (1996) 1347-1353.
[15] W. S. Moore; Ages of continental shelf waters determined from 223Ra and 224Ra; Journal
of Geophysical Research; 105 (2000) 22117-22122.
[16] W. S. Moore; D. F. Reid; Extraction of radium from natural waters using manganese-
impregnated acrylic fibers; Journal of Geophysical Research;
78 (1973) 8880-8886.
[17] R. J., Elsinger, P. T. King, W. S. Moore; 224Ra in natural waters measured by γ-ray
spectrometry; Analytica Chemica Acta; 144 (1982) 227-281.
[18] R. J. Elsinger, W. S. Moore; 224Ra, 228Ra, 226Ra in Winyah Bay and Delaware Bay; Earth
and Planetary Science Letters; 64 (1983), 430-436.
[19] Rama, J. F. Todd, J. L. Butts, W. S. Moore; A new method for the rapid measurement of224Ra in natural waters; Marine Chemistry; 22 (1987) 43-54.
[20] W. S. Moore, R. Arnold; Measurement of 223Ra and 224Ra in coastal waters using a
delayed coincidence counter; Journal of Geophysical Research;
101 (1996) 1321-1329.
[21] Y. Sun, T. Torgersen; The effects of water content and Mn-fiber surface conditions on224Ra measurement by 220Rn emanation; Marine Chemistry; 62 (1998) 299-306.
[22] S. A. Short; Measurement of all Radium isotopes at environmental levels on a single
electrodeposited source; Nuclear Instruments and Methodes in Physics Research;
17 (1986) 540-544.
[23] G. J. Hancock, P. Martin; Determination of Ra in environmental samples by α-particle
spectrometry; International Journal of Applied Radiation and Isotopes; 42 (1991) 63-69.
[24] M. Yamamoto, K. Komura; Determination of low-level 226Ra in environmental water
samples by alpha-ray Spectrometry; Radiochimica Acta; 46 (1980) 137-142.
Einleitung und Zielsetzung 7
[25] G. L. Goken, R. L. Bruening, K. E. Krakowiak, R. M. Izatt; In Metal-ion separation and
preconcentration: Progress and opportunities; A.H, Bond, M.L, Dietz, R.D, Rogers
(Eds.); ACS Symposium Series 716; Washington, D.C. (1999) pp. 251-259.
[26] R. M. Izatt, J. S. Bradshaw, R. L. Bruening; Accomplishment of difficult chemical
separations using solid phase extraction; Pure & Applied Chemistry;
68 (1996) 1237-1241.
[27] A. Durecova; Contribution to the simultaneous determination of 228Ra and 226Ra by 3M`s
EmporeTM Radium Rad Disks; Journal of Radioanalytical and Nuclear Chemistry; 223
(1997) 225-228.
Neue analytische Methoden Teil 1 8
Kapitel I: Neue analytische Methoden Teil 1
Solid-Phase Extraction Using EmporeTM Radium Rad
Disks to Separate Radium from Thorium
Stefan Purkl and Anton Eisenhauer
Neue analytische Methoden Teil 1 9
Abstract
A new method is presented for rapid and selective enrichment of radium (Ra) in natural samples
using 225Ra as a chemical yield tracer. The new technique allows a complete separation of the
target nuclide from the sample matrix with high separation factors for thorium (Th) and
uranium (U). The use of EmporeTM Radium Rad Disks combines the easy handling of column
chromatography with the high selectivity and rapid extraction kinetics of solvent extraction
chromatography. Following this new chemical approach, eluats are obtained which are well
suited for α-spectrometric analysis of Ra, Th and U.
1. Introduction
Independent of the method chosen to determine Ra its concentrations in natural waters
normally requires a pre-concentration before chemical analysis. There are already numerous
procedures published like Ba- or Pb-coprecipitation [1,2], adsorption onto MnO2-films [3] and
MnO2-fibres [4] as well as the use of cation exchange resins [5] or solvent extraction techniques
[6]. Methods including coprecipitation or adsorption suffer from low specificity of the reagents
being used whereas preconcentration via cation exchange is time-consuming due to low reaction
kinetics. In contrast, solvent extraction using crown ethers achieve high selectivity for Ra and
show rapid extraction kinetics. However, their disadvantage is that the number of practicable
measurement methods following the preconcentration procedure is reduced and furthermore
the sample volume that can be processed is restricted.
The development of macrocyclic and chelating ligands that are enmeshed in a matrix of PTFE
fibrils offers new ways for metal-ion separation. These ligands are able to selectively recognise
the ionic radius, shape and electrical charge of a certain target ion. The ligands are connected
covalently with a spacer to silica gel representing the solid phase support. The spacer has the
important function of allowing the ligand to be immersed in the aqueous phase. The stable
covalent bonding prevents dissolution in the used medium [7]. The silica gel particles, with a
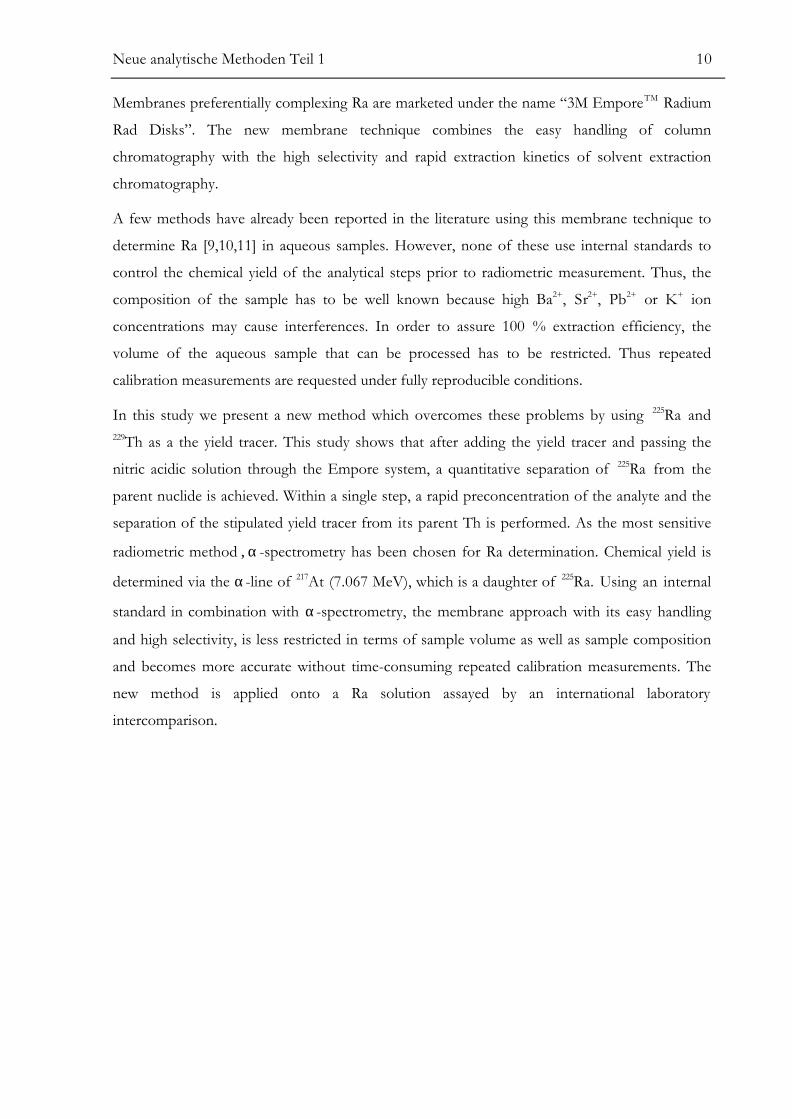
diameter of less then 10 µm, are enmeshed in a fibrous PTFE-matrix (Fig. 1). Comprising
90 ± 2 % of so-called AnaLig particles, the membrane can be considered as a short column (500
µm) that is more compact than a typical solid phase extraction column. Due to the large
concentration of active sites, high flow rates can be attained, exceeding those of typical column
systems and can be up to 4000 times [8] those of ion-exchange. Adjusting the flow-rate to 50
ml/min, rapid and quantitative sample extraction can be achieved.
Neue analytische Methoden Teil 1 10
Membranes preferentially complexing Ra are marketed under the name “3M EmporeTM Radium
Rad Disks”. The new membrane technique combines the easy handling of column
chromatography with the high selectivity and rapid extraction kinetics of solvent extraction
chromatography.
A few methods have already been reported in the literature using this membrane technique to
determine Ra [9,10,11] in aqueous samples. However, none of these use internal standards to
control the chemical yield of the analytical steps prior to radiometric measurement. Thus, the
composition of the sample has to be well known because high Ba2+, Sr2+, Pb2+ or K+ ion
concentrations may cause interferences. In order to assure 100 % extraction efficiency, the
volume of the aqueous sample that can be processed has to be restricted. Thus repeated
calibration measurements are requested under fully reproducible conditions.
In this study we present a new method which overcomes these problems by using 225Ra and229Th as a the yield tracer. This study shows that after adding the yield tracer and passing the
nitric acidic solution through the Empore system, a quantitative separation of 225Ra from the
parent nuclide is achieved. Within a single step, a rapid preconcentration of the analyte and the
separation of the stipulated yield tracer from its parent Th is performed. As the most sensitive
radiometric method , α-spectrometry has been chosen for Ra determination. Chemical yield is
determined via the α-line of 217At (7.067 MeV), which is a daughter of 225Ra. Using an internal
standard in combination with α-spectrometry, the membrane approach with its easy handling
and high selectivity, is less restricted in terms of sample volume as well as sample composition
and becomes more accurate without time-consuming repeated calibration measurements. The
new method is applied onto a Ra solution assayed by an international laboratory
intercomparison.
Neue analytische Methoden Teil 1 11
Fig. 1: Electron microscope photograph of a 3M EmporeTM Radium Rad Disk. AnaLigTM particles, crown etherscovalently bond to a silica gel support, are enmeshed in a fibrous PTFE-matrix.
2. Experimental Setup
2.1. Instrumentation
γ-ray counting was done with an n-type, planar, HPGe low-energy photon detector. The active
area was 2000 mm² and the crystal depth was 10 mm. Energy resolution at 6.4 keV and
1330 keV was 8 keV and 1.9 keV respectively. The Be window thickness of 0.5 mm allows
optimal counting conditions for low-energy γ-ray emitters.
The α-particle spectroscopy system used consists of an octal α-spectrometer, OCTÊTETM PC
(EG&G ORTEC, Oak Ridge) and eight independent ion-implanted silicon ULTRATM α-
detectors with 450 mm2 active area, guaranteed resolution of 20 keV (Full-Width-at-Half-
Maximum, FWHM) and an especially low background of 1-6 counts/d. The operating pressure
was 20-25 Pa and the source/detector distance was chosen as 16 mm.
Neue analytische Methoden Teil 1 12
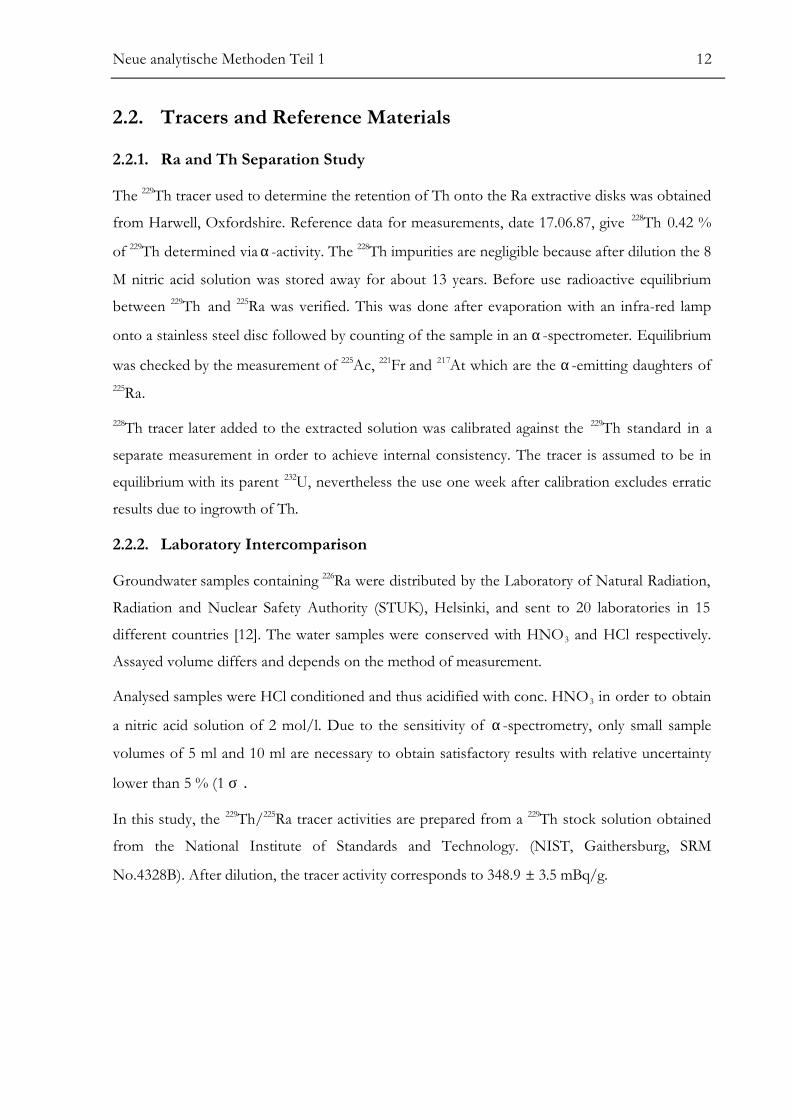
2.2. Tracers and Reference Materials
2.2.1. Ra and Th Separation Study
The 229Th tracer used to determine the retention of Th onto the Ra extractive disks was obtained
from Harwell, Oxfordshire. Reference data for measurements, date 17.06.87, give 228Th 0.42 %
of 229Th determined via α-activity. The 228Th impurities are negligible because after dilution the 8
M nitric acid solution was stored away for about 13 years. Before use radioactive equilibrium
between 229Th and 225Ra was verified. This was done after evaporation with an infra-red lamp
onto a stainless steel disc followed by counting of the sample in an α-spectrometer. Equilibrium
was checked by the measurement of 225Ac, 221Fr and 217At which are the α-emitting daughters of225Ra.
228Th tracer later added to the extracted solution was calibrated against the 229Th standard in a
separate measurement in order to achieve internal consistency. The tracer is assumed to be in
equilibrium with its parent 232U, nevertheless the use one week after calibration excludes erratic
results due to ingrowth of Th.
2.2.2. Laboratory Intercomparison
Groundwater samples containing 226Ra were distributed by the Laboratory of Natural Radiation,
Radiation and Nuclear Safety Authority (STUK), Helsinki, and sent to 20 laboratories in 15
different countries [12]. The water samples were conserved with HNO3 and HCl respectively.
Assayed volume differs and depends on the method of measurement.
Analysed samples were HCl conditioned and thus acidified with conc. HNO3 in order to obtain
a nitric acid solution of 2 mol/l. Due to the sensitivity of α-spectrometry, only small sample
volumes of 5 ml and 10 ml are necessary to obtain satisfactory results with relative uncertainty
lower than 5 % (1 σ).
In this study, the 229Th/225Ra tracer activities are prepared from a 229Th stock solution obtained
from the National Institute of Standards and Technology. (NIST, Gaithersburg, SRM
No.4328B). After dilution, the tracer activity corresponds to 348.9 ± 3.5 mBq/g.
Neue analytische Methoden Teil 1 13
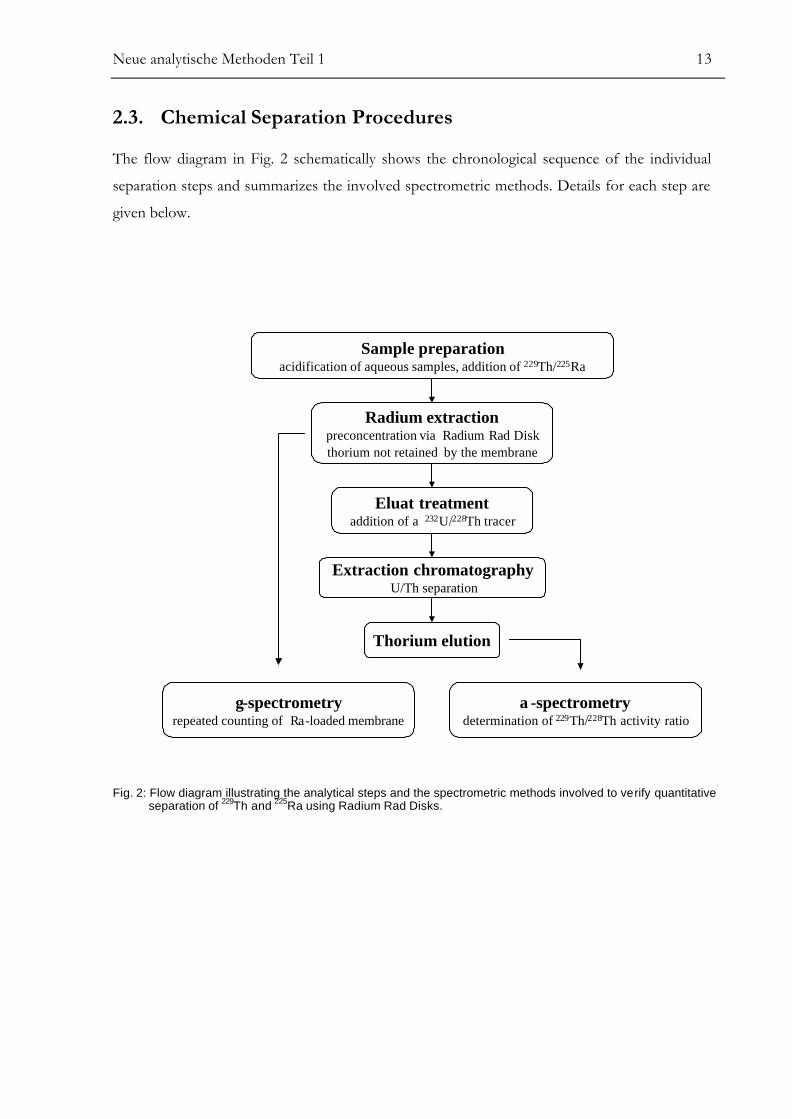
2.3. Chemical Separation Procedures
The flow diagram in Fig. 2 schematically shows the chronological sequence of the individual
separation steps and summarizes the involved spectrometric methods. Details for each step are
given below.
Sample preparationacidification of aqueous samples, addition of 229Th/225Ra
Radium extractionpreconcentration via Radium Rad Diskthorium not retained by the membrane
γ-spectrometryrepeated counting of Ra-loaded membrane
α-spectrometrydetermination of 229Th/228Th activity ratio
Eluat treatmentaddition of a 232U/228Th tracer
Extraction chromatography U/Th separation
Thorium elution
Fig. 2: Flow diagram illustrating the analytical steps and the spectrometric methods involved to verify quantitativeseparation of 229Th and 225Ra using Radium Rad Disks.
Neue analytische Methoden Teil 1 14
2.3.1. Preconcentration of Ra and Separation from Th via Ion-Selective
Extraction Disks
Concentrated HNO3 is added to deionised water to raise the HNO3 concentration to 2 mol/l.
Then a 229Th-solution containing 225Ra in radioactive equilibrium is added and the sample is
heated to boiling. After cooling down, a homogeneous distribution of tracer activities in the
solution is ensured.
Prior to sample processing, the Radium Rad disk is conditioned using 20 ml of 2 mol/l HNO3
under a gentle vacuum. The sample is extracted in a 47 mm diameter vacuum filter apparatus
(Roth, Karlsruhe) adjusting the flow rate to 50 ml/min. The Ra-loaded membrane is washed
with three 20 ml aliquots of 2 mol/l HNO3. After drying overnight, the disk is measured
periodically in a γ-ray counting system.
2.3.2. Procedure for Eluat Processing
The eluats from the extraction procedure are combined in a Teflon beaker yielding about
750 ml HNO3 acidic solution. The amount of 232U and 228Th tracer activities added corresponds
to those of 229Th activity levels, expected in the solution. 228Th is used to control the chemical
yield of the procedure, which is necessary to quantify the amount of 229Th that passed through
the membrane. The chemical procedure described below requires a reduced volume of 10 ml of
1 mol/l HNO3.
The column material for the extraction chromatography is produced by mixing of “Reversed-
Phase-Material Chromabond NO2” (Macherey-Nagel, Düren) and trioctylphosphin (TOPO)
(Merck, Darmstadt) in a weight proportion of five to one in the presence of CHCl3 as solvent.
CHCl3 has to be quantitatively removed via evaporation before the material can be used.
350 mg of the prepared material is poured into a Teflon column with 5 mm inner diameter.
5 ml of HNO3 (1 mol/l) is used for conditioning the column. The sample is extracted under
gentle vacuum in order to attain a flow rate of 1 ml/min. After successive washings with 10 ml
of HNO3 (1 mol/l), 10 ml of a 10 % (mass to volume) solution of ascorbic acid in HNO3
(1 mol/l) and 10 ml deionisied water Th is eluted using 5 ml of H2SO4 (0.8 mol/l) and 5 ml of
deionisied water. The U-fraction remains on the column and, if required, could also be eluted
with a saturated (NH4)2CO3 solution. Details for analysis are given in [13].
For α-spectrometric assay, 1 g (NH4)2SO4 is added to the collected Th fraction [14] and the pH-
value is adjusted to 2.5 using NH4OH [15]. After transferring the solution obtained into an
Neue analytische Methoden Teil 1 15
appropriate electrodeposition cell, Th is plated onto a polished stainless steel planchette and
flamed to assure fixation.
2.4. Spectrometry
2.4.1. α-Spectrometric Determination of 229Th in the Eluat
The amount of 229Th is evaluated using α-lines in the energy region between 4.730 MeV and
5.052 MeV. The chemical yield is calculated by analysing those α-lines of 228Th at 5.423 MeV
and 5.340 MeV. Due to good α-energy resolution (17.3 keV, FWHM), the presence of 232U
(5.320 MeV and 5.263 MeV) could be excluded by monitoring the peak at 5.263 MeV. Direct
counting after sample preparation minimises the ingrowth of 224Ra (5.686 MeV and 5.445 MeV)
into the 228Th peak at 5.423 MeV. The residual could be calculated and stripped from the region
via analysis of the well-separated peak at 5.686 MeV.
2.4.2. γ-Spectrometric Determination of 229Th on the Ra Extractive Disk
Due to low γ-ray intensities of 229Th (4.4 % at 193.5 keV and 2.8 % at 210.9 keV) residual Th
that remains on the Ra-loaded membrane is determined by analysing the decay of its daughter225Ra. The photopeak at 40.0 keV with an easily detectable γ- transition probability of 30.0 %
was used. Within the time interval of 103 days (close to 7 half-lives) 10 successionally performed
measurements were conducted. During the whole time the disk was attached in a defined
counting geometry.
Searching for the initial activity ratio of 229Th and 225Ra (ATh/ 0RaA ) at time t0 after sample
extraction, the acquired γ-spectrometric data are used as follows:
Counts measured using the 225Ra photopeak (ERa,tot) consist of those supported by Th (ERa,s) in
radioactive equilibrium with its daughter and of unsupported 225Ra (ERa,us):
ERa,tot = ERa,s + ERa,us (1)
The counts resulting from Th decay-fed and correspondingly constant 225Ra activity (ARa,s) within
one measuring period (∆t) are given by:
ERa,s = ARa,s∆t (2)
Neue analytische Methoden Teil 1 16
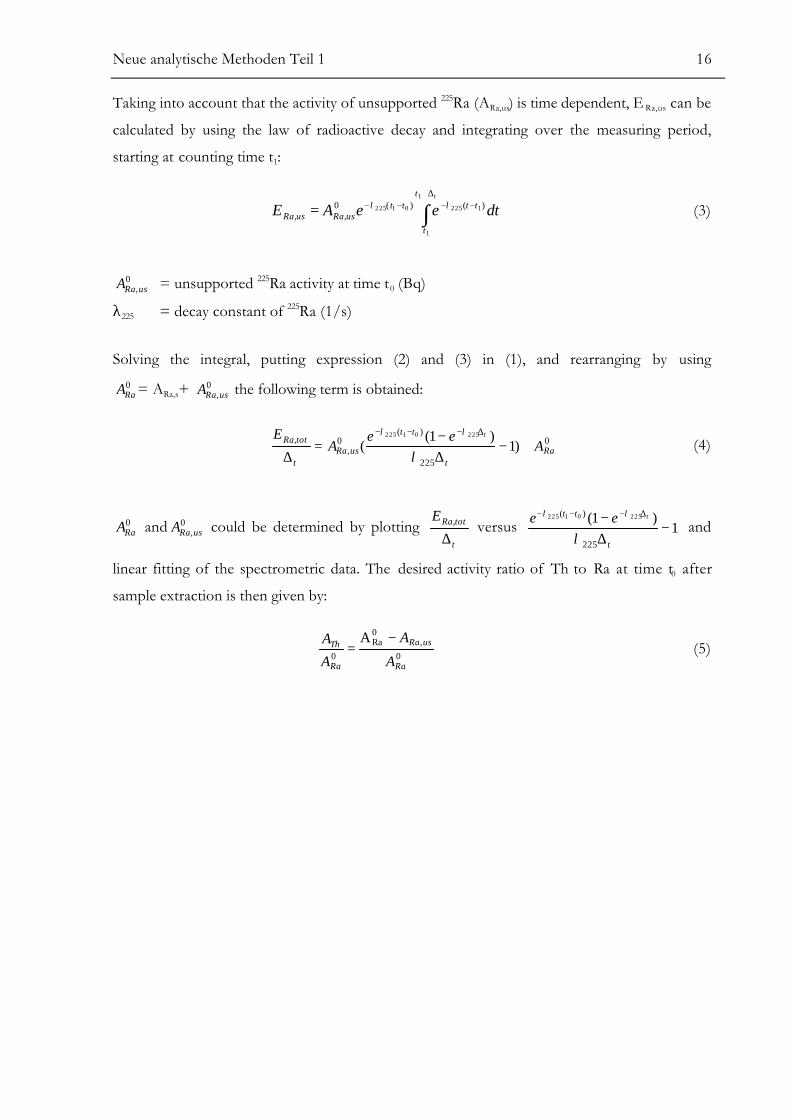
Taking into account that the activity of unsupported 225Ra (ARa,us) is time dependent, E Ra,us can be
calculated by using the law of radioactive decay and integrating over the measuring period,
starting at counting time t1:
dteeAEtt
t
ttttusRausRa ∫
∆+−−−−=
1
1
122501225 )()(0,, λλ (3)
0,usRaA = unsupported 225Ra activity at time t0 (Bq)
λ225 = decay constant of 225Ra (1/s)
Solving the integral, putting expression (2) and (3) in (1), and rearranging by using0RaA = ARa,s+ 0
,usRaA the following term is obtained:
0
225
)(0
,, )1
)1((
22501225
Rat
tt
usRat
totRa Aee
AE t
+−∆−
=∆
∆−−−
λ
λλ
(4)
0RaA and 0
,usRaA could be determined by plotting t
totRaE
∆, versus 1
)1(
225
)( 22501225
−∆− ∆−−−
t
tt teeλ
λλ
and
linear fitting of the spectrometric data. The desired activity ratio of Th to Ra at time t0 after
sample extraction is then given by:
0,
0Ra
0
A
Ra
usRa
Ra
Th
A
A
A
A −= (5)
Neue analytische Methoden Teil 1 17
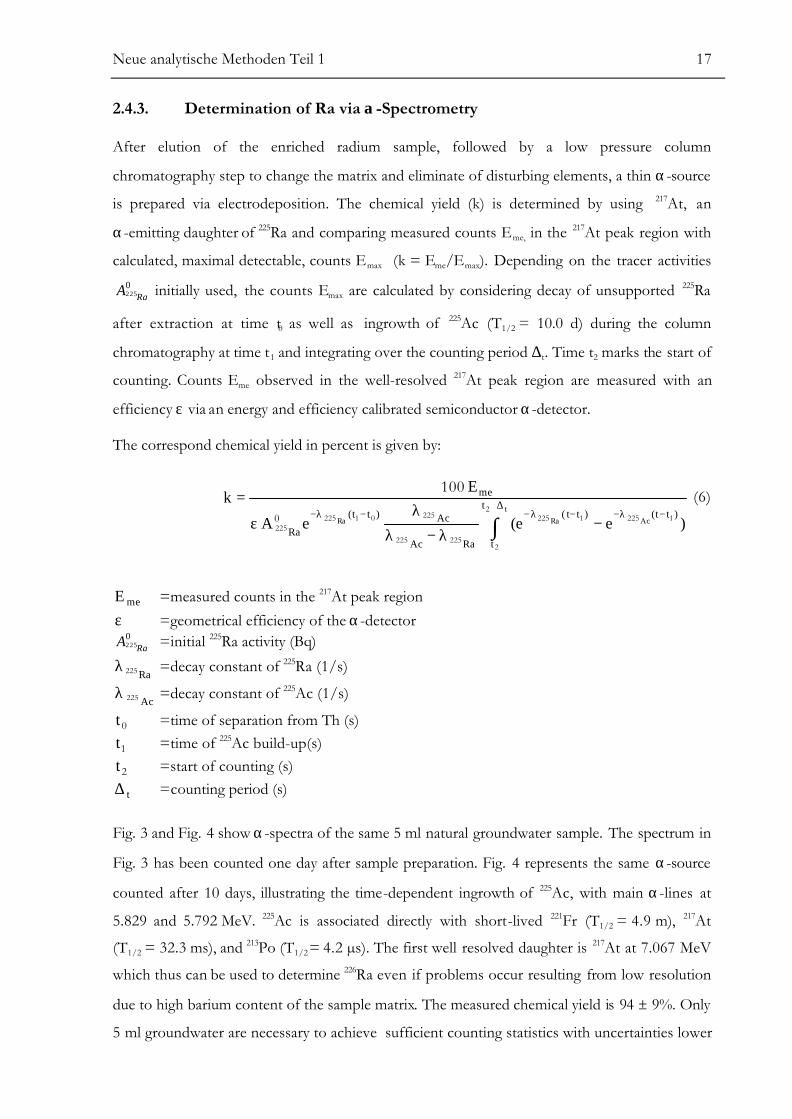
2.4.3. Determination of Ra via α-Spectrometry
After elution of the enriched radium sample, followed by a low pressure column
chromatography step to change the matrix and eliminate of disturbing elements, a thin α-source
is prepared via electrodeposition. The chemical yield (k) is determined by using 217At, an
α-emitting daughter of 225Ra and comparing measured counts Eme, in the 217At peak region with
calculated, maximal detectable, counts Emax (k = Eme/Emax). Depending on the tracer activities0225RaA initially used, the counts Emax are calculated by considering decay of unsupported 225Ra
after extraction at time t0 as well as ingrowth of 225Ac (T1/2 = 10.0 d) during the column
chromatography at time t1 and integrating over the counting period ∆t. Time t2 marks the start of
counting. Counts Eme observed in the well-resolved 217At peak region are measured with an
efficiency ε via an energy and efficiency calibrated semiconductor α-detector.
The correspond chemical yield in percent is given by:
∫∆+
−λ−−λ−−λ−−
λ−λ
λε
=t
AcRaRa
t
t
)tt()tt(
RaAc
Ac)tt(
Ra
me
)ee(eA
Ek
2
2
12251225
225225
225012252250
100 (6)
meE =measured counts in the 217At peak regionε =geometrical efficiency of the α-detector
0225RaA =initial 225Ra activity (Bq)
Ra225λ =decay constant of 225Ra (1/s)
Ac225λ =decay constant of 225Ac (1/s)
0t =time of separation from Th (s)
1t =time of 225Ac build-up(s)
2t =start of counting (s)
t∆ =counting period (s)
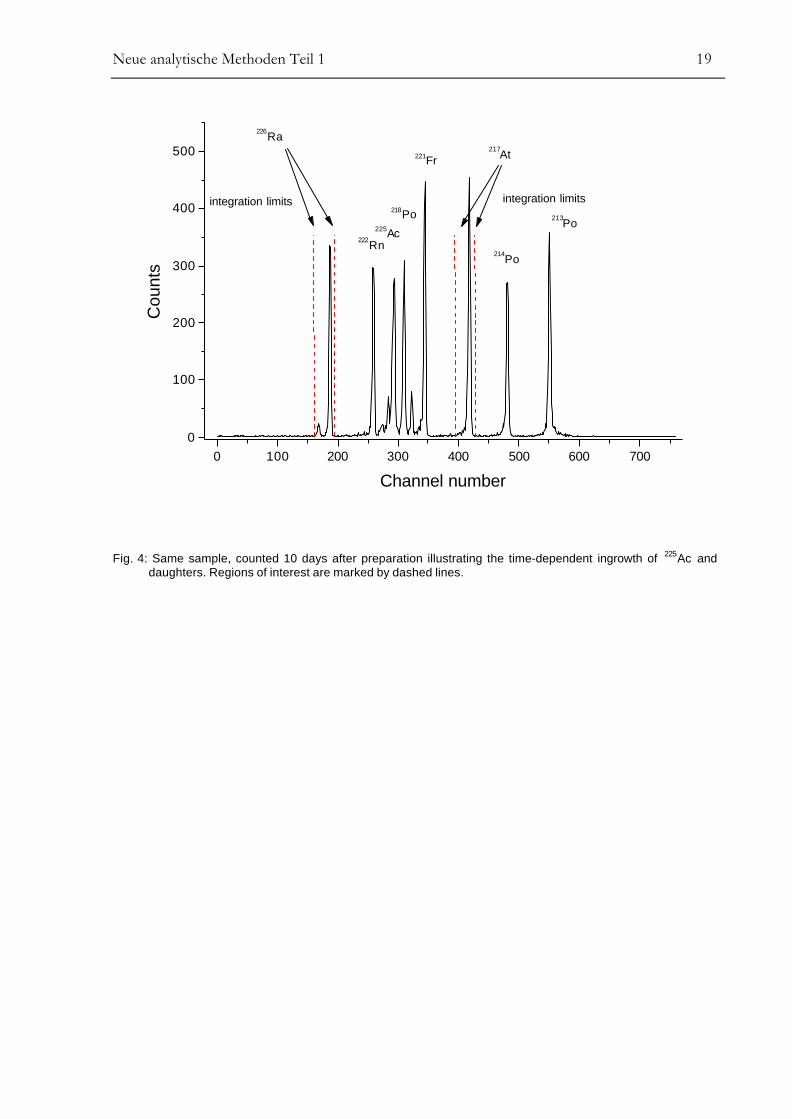
Fig. 3 and Fig. 4 show α-spectra of the same 5 ml natural groundwater sample. The spectrum in
Fig. 3 has been counted one day after sample preparation. Fig. 4 represents the same α-source
counted after 10 days, illustrating the time-dependent ingrowth of 225Ac, with main α-lines at
5.829 and 5.792 MeV. 225Ac is associated directly with short-lived 221Fr (T1/2 = 4.9 m), 217At
(T1/2 = 32.3 ms), and 213Po (T1/2 = 4.2 µs). The first well resolved daughter is 217At at 7.067 MeV
which thus can be used to determine 226Ra even if problems occur resulting from low resolution
due to high barium content of the sample matrix. The measured chemical yield is 94 ± 9%. Only
5 ml groundwater are necessary to achieve sufficient counting statistics with uncertainties lower
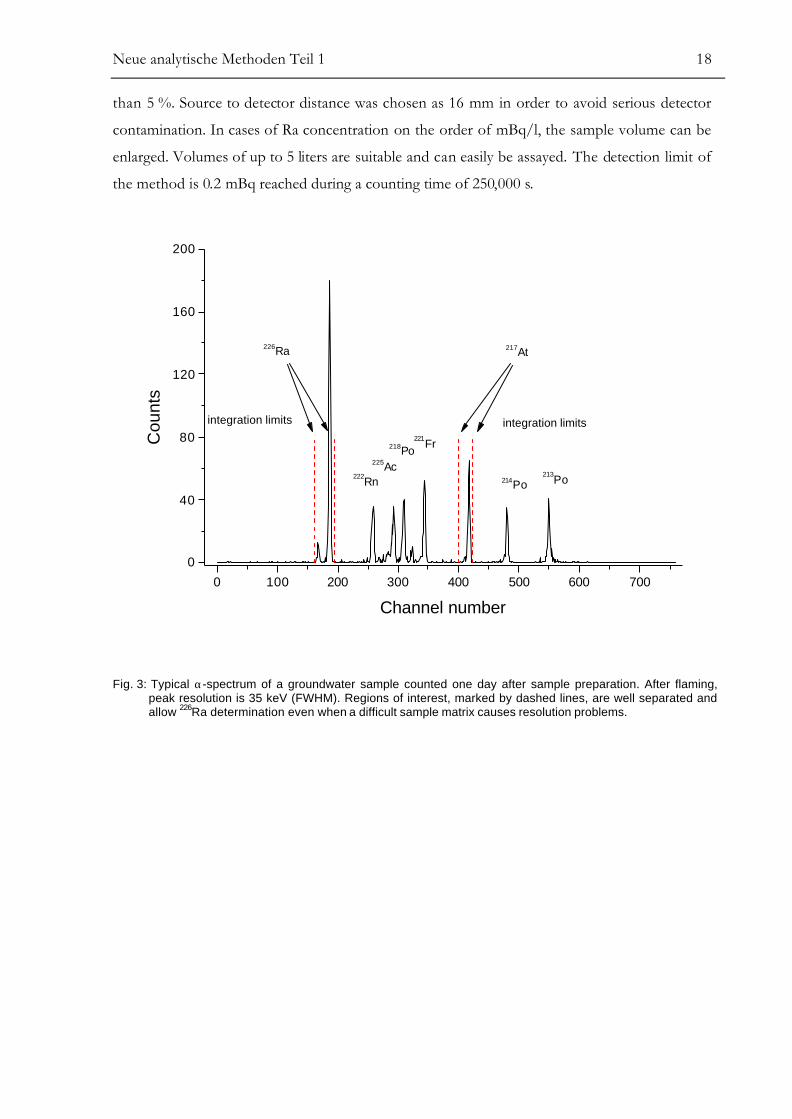
Neue analytische Methoden Teil 1 18
than 5 %. Source to detector distance was chosen as 16 mm in order to avoid serious detector
contamination. In cases of Ra concentration on the order of mBq/l, the sample volume can be
enlarged. Volumes of up to 5 liters are suitable and can easily be assayed. The detection limit of
the method is 0.2 mBq reached during a counting time of 250,000 s.
0 100 200 300 400 500 600 700
0
40
80
120
160
200
integration limitsintegration limits
213Po214Po
218Po221Fr
225Ac222Rn
217At226Ra
Cou
nts
Channel number
Fig. 3: Typical α-spectrum of a groundwater sample counted one day after sample preparation. After flaming,peak resolution is 35 keV (FWHM). Regions of interest, marked by dashed lines, are well separated andallow 226Ra determination even when a difficult sample matrix causes resolution problems.
Neue analytische Methoden Teil 1 19
0 100 200 300 400 500 600 7000
100
200
300
400
500
integration limitsintegration limits213Po
214Po
218Po
221Fr
225Ac222Rn
217At
226Ra
Cou
nts
Channel number
Fig. 4: Same sample, counted 10 days after preparation illustrating the time-dependent ingrowth of 225Ac anddaughters. Regions of interest are marked by dashed lines.
Neue analytische Methoden Teil 1 20
3. Results and Discussion
3.1. Separation of Ra from Th
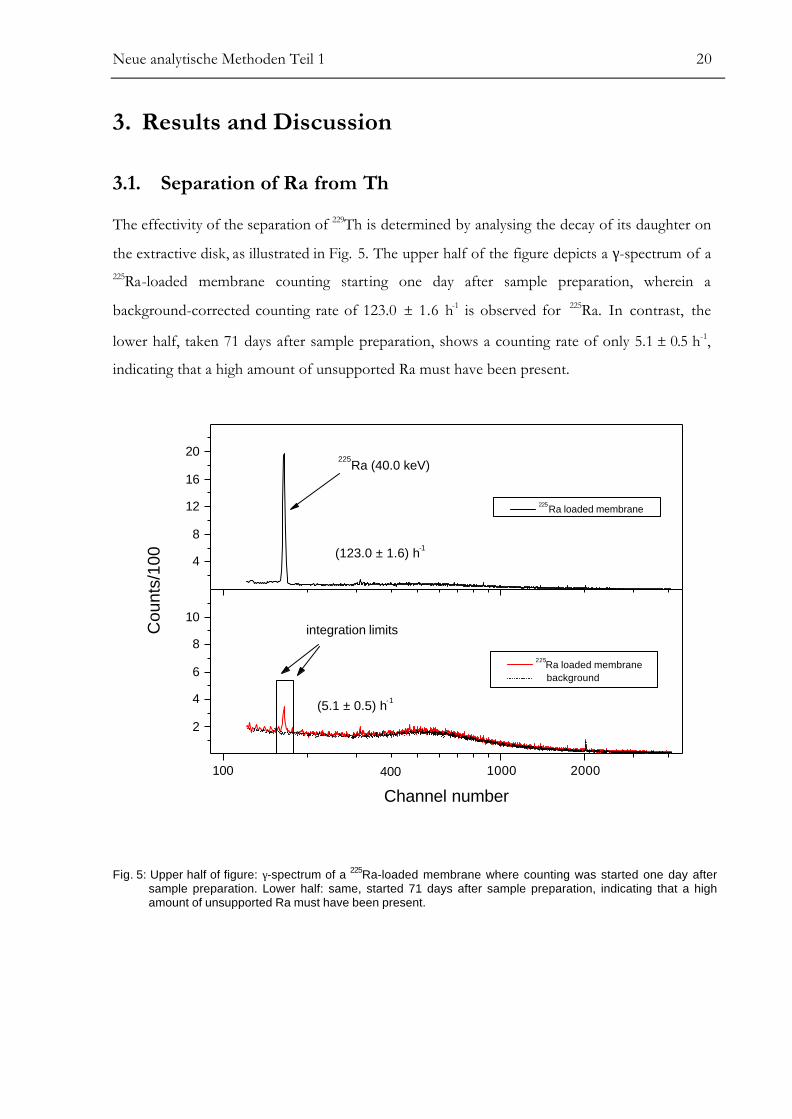
The effectivity of the separation of 229Th is determined by analysing the decay of its daughter on
the extractive disk, as illustrated in Fig. 5. The upper half of the figure depicts a γ-spectrum of a225Ra-loaded membrane counting starting one day after sample preparation, wherein a
background-corrected counting rate of 123.0 ± 1.6 h-1 is observed for 225Ra. In contrast, the
lower half, taken 71 days after sample preparation, shows a counting rate of only 5.1 ± 0.5 h-1,
indicating that a high amount of unsupported Ra must have been present.
100 1000 2000
2
4
6
8
10
(5.1 ± 0.5) h-1
integration limits
400
225Ra loaded membrane background
Cou
nts/
100
Channel number
4
8
12
16
20
(123.0 ± 1.6) h-1
225Ra (40.0 keV)
225Ra loaded membrane
Fig. 5: Upper half of figure: γ-spectrum of a 225Ra-loaded membrane where counting was started one day aftersample preparation. Lower half: same, started 71 days after sample preparation, indicating that a highamount of unsupported Ra must have been present.
Neue analytische Methoden Teil 1 21
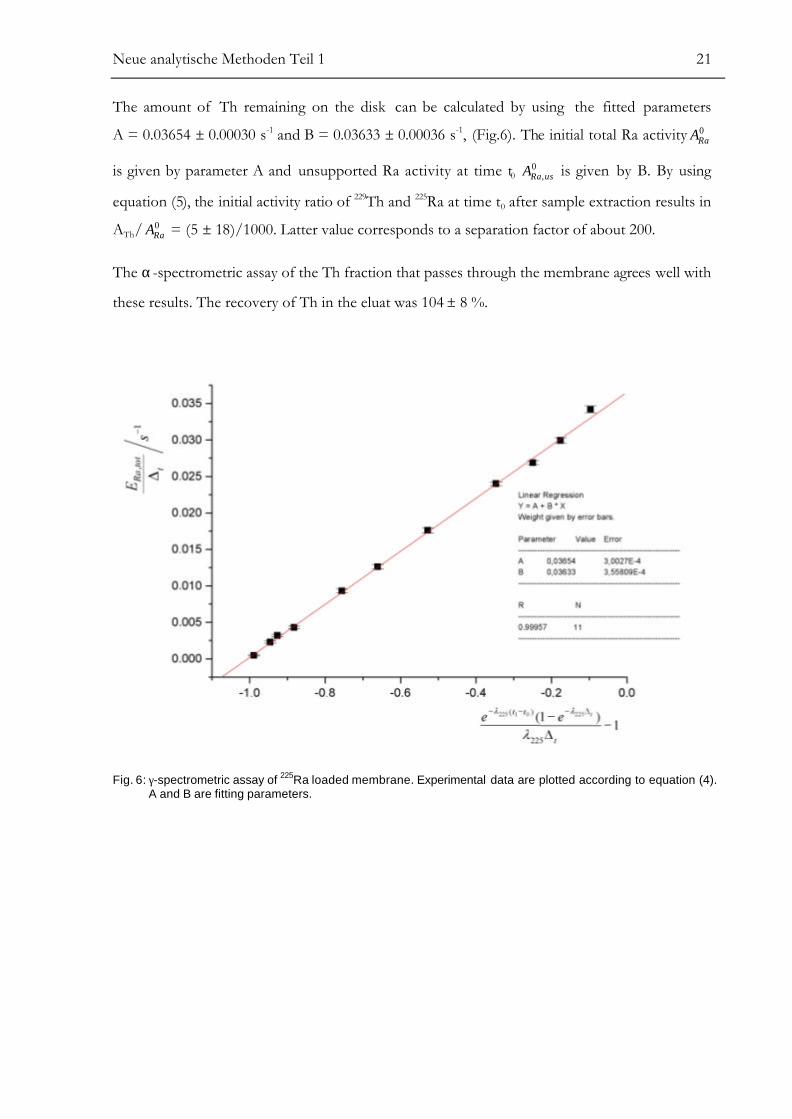
The amount of Th remaining on the disk can be calculated by using the fitted parameters
A = 0.03654 ± 0.00030 s-1 and B = 0.03633 ± 0.00036 s-1, (Fig.6). The initial total Ra activity 0RaA
is given by parameter A and unsupported Ra activity at time t0 0
,usRaA is given by B. By using
equation (5), the initial activity ratio of 229Th and 225Ra at time t0 after sample extraction results in
ATh/ 0RaA = (5 ± 18)/1000. Latter value corresponds to a separation factor of about 200.
The α-spectrometric assay of the Th fraction that passes through the membrane agrees well with
these results. The recovery of Th in the eluat was 104 ± 8 %.
Fig. 6: γ-spectrometric assay of 225Ra loaded membrane. Experimental data are plotted according to equation (4).A and B are fitting parameters.
Neue analytische Methoden Teil 1 22
3.2. Intercomparison of Ra Measurements226Ra-containing groundwater assayed by an international laboratory intercomparison is used as
reference material in order to verify the membrane approach in combination with 225Ra as yield
tracer. The mean value of the intercomparison is cRa = 22.4 Bq/l. Excluding two outliers
(42.5 Bq/l and 10.5 Bq/l), the mean value is given as cRa = 21.9 Bq/l (L. Salonen, personal
communication).
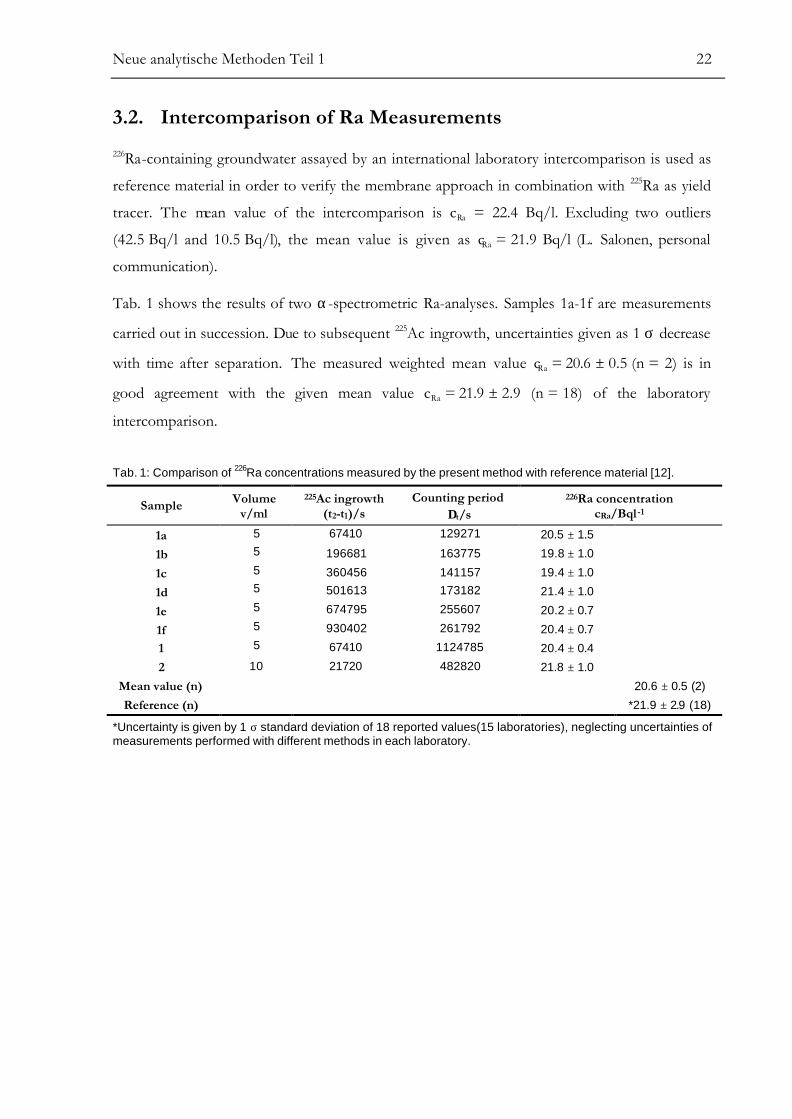
Tab. 1 shows the results of two α-spectrometric Ra-analyses. Samples 1a-1f are measurements
carried out in succession. Due to subsequent 225Ac ingrowth, uncertainties given as 1 σ decrease
with time after separation. The measured weighted mean value cRa = 20.6 ± 0.5 (n = 2) is in
good agreement with the given mean value cRa = 21.9 ± 2.9 (n = 18) of the laboratory
intercomparison.
Tab. 1: Comparison of 226Ra concentrations measured by the present method with reference material [12].
Sample Volumev/ml
225Ac ingrowth(t2-t1)/s
Counting period ∆t/s
226Ra concentrationcRa/Bql-1
1a 5 67410 129271 20.5 ± 1.5
1b 5 196681 163775 19.8 ± 1.0
1c 5 360456 141157 19.4 ± 1.0
1d 5 501613 173182 21.4 ± 1.0
1e 5 674795 255607 20.2 ± 0.7
1f 5 930402 261792 20.4 ± 0.7
1 5 67410 1124785 20.4 ± 0.4
2 10 21720 482820 21.8 ± 1.0
Mean value (n) 20.6 ± 0.5 (2)
Reference (n) *21.9 ± 2.9 (18)
*Uncertainty is given by 1 σ standard deviation of 18 reported values(15 laboratories), neglecting uncertainties ofmeasurements performed with different methods in each laboratory.
Neue analytische Methoden Teil 1 23
4. Summary and Conclusions
The solid-phase extraction method allows the rapid and easy to accomplished preconcentration,
desired for Ra analysis in environmental samples. The use of the stipulated yield tracer offers
broad adaptability as well as guaranteed accurate measurements even if the analyte is present in
difficult matrices and in low concentrations. Effective separation of 225Ra from the parent 229Th
within a single step reduces complicated and time-consuming sample preparation and minimises
the number of chemical operations.
In addition to 226Ra long lived Th isotopes, 230Th and 232Th as well as U isotopes 234U and 238U
also can be determined by using a 236U/229Th/225Ra mixed tracer. The retention of thorium and
U [11] is negligible due to the high selectivity of the Ra extractive disks. Following the procedure
for eluat processing, by using Reversed-Phase-Material Chromabond NO2 impregnated with
TOPO, the U and Th fractions could be analysed separately via α-spectrometric analysis.
γ-spectrometric measurements indicate that the percentage of Th remaining on the disk is much
lower then 2%. This also allows the usage of 224Ra as an internal yield tracer added as daughter of
an equilibrated 232U standard solution. Due to the short half life of 224Ra (T1/2 = 3.66 d), the
sample should be processed as fast as possible. Nevertheless, recently collected aqueous samples
can contain high amounts of 224Ra and thus have to be stored for about 20 days before chemical
analysis. Using an aged 232U standard solution becomes attractive because it provides 232U, 228Th
and 224Ra in radioactive equilibrium. Such a tracer can then be applied without complicated
calibration and mixing procedures. Regarding importance for radiation protection, simultaneous
α-spectrometric determination of long lived U, Th and Ra isotopes are likewise possible using
one single spike.
Neue analytische Methoden Teil 1 24
References
[1] H. Jiang and R.B. Holtzman, Health Phys. 57 (1989) 167.
[2] G.J. Hancock and P. Martin, Int. J. Appl. Radiat. Isot. 42 (1991) 63.
[3] H. Surbeck, Int. J. Appl. Radiat. Isot. 53 (2000) 97.
[4] D.F. Reid, R. M. Key and D.R. Schink, Earth Planet. Sci. Lett. 43 (1979) 223.
[5] V.F. Hodge and G. A. Laing, Radiochim. Acta 64 (1994) 211.
[6] R. Chiarizia, M.L. Dietz, E.P. Horwitz, W.C. Burnett and P.H. Cable,
Sep. Sci. Technol. 34 (1999) 931.
[7] G.L. Goken, R.L. Bruening, K.E. Krakowiak, and R.M. Izatt, In: Metal-Ion Separation
and Preconcentration: Progress and Opportunities, A.H Bond, M.L Dietz, R.D Rogers
(Eds.), ACS Symposium Series 716, Washington, D.C., 1999, pp. 251-259.
[8] R.M. Izatt, J.S. Bradshaw and R.L. Bruening, Pure Appl. Chem., 68 (1996) 1237.
[9] D.C. Seely and J. A. Osterheim, J. Radioanal. Nucl. Chem. Art. 236 (1998) 175.
[10] A. Durecova, J. Radioanal. Nucl. Chem. Art. 223 (1997) 225.
[11] L.L. Smith, J.S. Alvarado, F.J. Markun, K.M. Hoffmann, D.C. Seely and R.T. Shannon,
Radioac. Radiochem. 8 (1997) 30.
[12] L. Salonen and T. Ilus, LSC 2001, International Conference on Advances in Liquid
Scintillation Spectrometry, Karlsruhe, 2001.
[13] R. Weber, R.A. Esterlund and P. Patzelt, Int. J. Appl. Radiat. Isot. 50 (1999) 929.
[14] F.V. Tome and A.M. Sanchez, Int. J. Appl. Radiat. Isot. 42 (1991) 135.
[15] L. Hallstadius, Nucl. Instrum. Methods Phys. Res. 223 (1984) 266.
Neue analytische Methoden Teil 2 25
Kapitel II. Neue analytische Methoden Teil 2
A Rapid Method for α-Spectrometric Analysis of
Radium Isotopes in Natural Waters Using Ion-Selective
Membrane Technology
Stefan Purkl and Anton Eisenhauer
Neue analytische Methoden Teil 2 26
Abstract
A α-spectrometric method for the rapid determination of all four naturally occurring Radium
isotopes (223Ra, 224Ra, 226Ra, 228Ra) in environmental samples is presented. Using EmporeTM
Radium Rad Disks complete separation of the target nuclide from the sample matrix is achieved.
High separation factors for Thorium (Th) allow the straightforward use of 225Ra as a yield tracer.
The chemical procedure can be accomplished within 5 hours with a chemical yield of up to
92±9 %. The prepared α-sources show energy resolution in the range of typically 26 to 40 keV
(FWHM). Despite the minimal thickness of the sources no significant Radon (Rn) losses could
be observed. The good Rn-retention is achieved by a protective film most likely consisting of
deposited Platinum (Pt).
1. Introduction
The use of ion-selective membrane technology (Goken et al., 1999) combines the easy handling
of column chromatography with the high selectivity and rapid extraction kinetics of solvent
extraction chromatography. Previous studies (Smith et al., 1997, Seely and Osterheim, 1998)
using EmporeTM Radium Rad Disks with high enrichment factors for Ra. However, none of
these methods use internal standards to control the chemical yield of the whole chemical
procedure prior to radiometric or mass-spectrometric (Joannon and Pin, 2001) measurement.
Furthermore, if in addition to 226Ra also 228Ra has to be determined the applied methods require
time consuming procedures like precipitation, centrifugation, filtration and redissolution in order
to obtain the requested purity for β-spectrometry. Improved background characteristic of Liquid
scintillation counting (LSC) (Schönhofer and Wallner, 2001) allows determination of 228Ra even
in mBq quantities. Nevertheless, poor energy resolution of LSC results in extensive peak
overlapping in α- and β-window and thus making identification of interfering radio nuclides
remaining in the prepared source, difficult.
In contrast, high resolution α-spectrometry allows simultaneous determination of all four
naturally occurring Ra isotopes, including short lived isotopes 223Ra and 224Ra on a single
α-source. The selectivity of the new analytical method presented here allows straightforward use
of 225Ra as internal standard and furthermore combines sensitivity of high resolution
α-spectrometry with easy handling, high selectivity and advantageous extraction kinetics of solid
phase extraction disks, making the procedure very rapid and sensitive.
Neue analytische Methoden Teil 2 27
2. Chemical Procedures
2.1. Flow Diagram for Sample Preparation
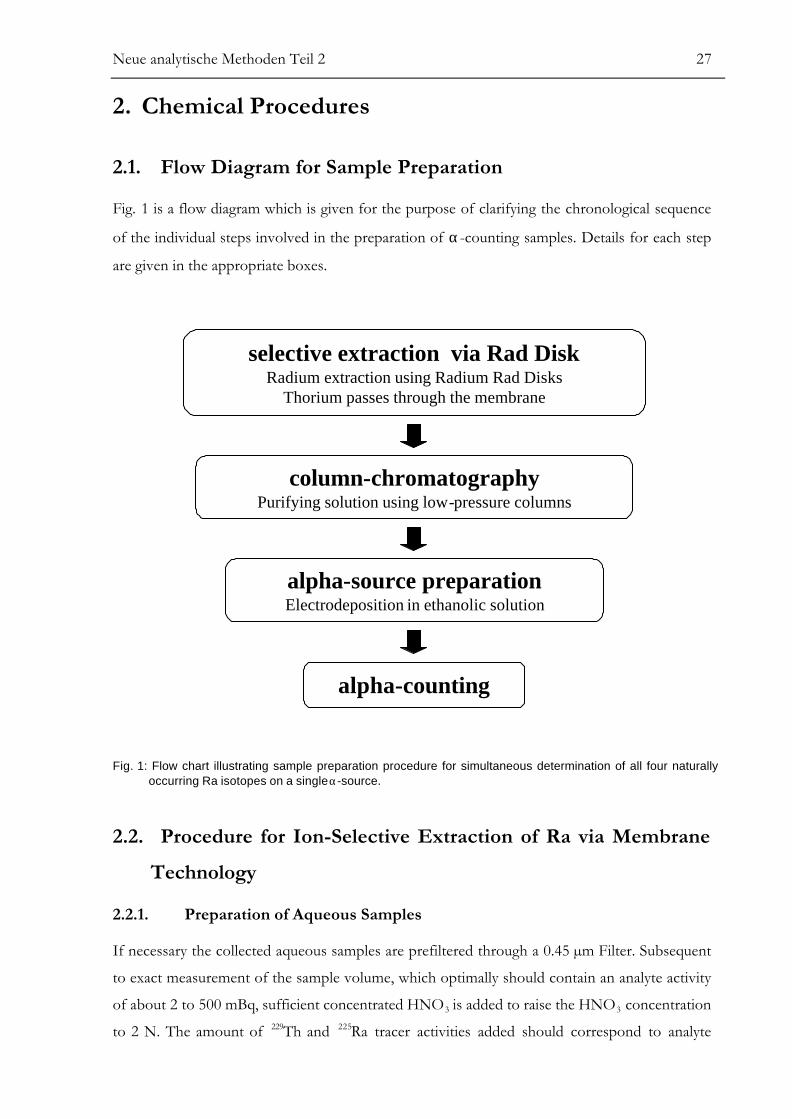
Fig. 1 is a flow diagram which is given for the purpose of clarifying the chronological sequence
of the individual steps involved in the preparation of α-counting samples. Details for each step
are given in the appropriate boxes.
selective extraction via Rad DiskRadium extraction using Radium Rad Disks
Thorium passes through the membrane
column-chromatographyPurifying solution using low-pressure columns
alpha-source preparationElectrodeposition in ethanolic solution
alpha-counting
Fig. 1: Flow chart illustrating sample preparation procedure for simultaneous determination of all four naturallyoccurring Ra isotopes on a single α-source.
2.2. Procedure for Ion-Selective Extraction of Ra via Membrane
Technology
2.2.1. Preparation of Aqueous Samples
If necessary the collected aqueous samples are prefiltered through a 0.45 µm Filter. Subsequent
to exact measurement of the sample volume, which optimally should contain an analyte activity
of about 2 to 500 mBq, sufficient concentrated HNO3 is added to raise the HNO3 concentration
to 2 N. The amount of 229Th and 225Ra tracer activities added should correspond to analyte
Neue analytische Methoden Teil 2 28
activity levels expected in the sample volumes to be analysed. The prepared sample is stirred
vigorously for several times in order to assure a completely equilibrated distribution of tracer
activities.
2.2.2. Rapid and Selective Ra Enrichment Using Membrane Technology
Prior to the sample processing the Radium Rad disk is conditioned using 20 ml of 2 N HNO3
under a gentle vacuum. The sample is extracted in a 47 mm diameter vacuum filter apparatus
(Roth, Karlsruhe) adjusting the flow rate to 50 ml/min. Afterwards the membrane is washed
with three 20 ml aliquots of 2 N HNO3 to remove any remnants of the processed solution. Like
the target nuclides the added internal yield tracer 225Ra is retained on the membrane whereas229Th passes through. Time t0 of Ra extraction has to be noted. For sample sizes widely
exceeding one liter, note start tB and endpoint tE. Do not allow the disk to go dry.
2.2.3. Quantitative Ra Elution
Elution of the Ra loaded membrane is accomplished using 3 ml of
0.25 N EDTA/1.7 N ammonium acetate in 6 N NH4OH which is directly mounted onto the
extractive disk, followed by a wash of 16 ml 0.01 N EDTA previously adjusted to about pH 10
using NH4OH as well. The EDTA wash solution is added continuously using gravity flow or if
necessary by applying a gentle vacuum. Flow rate of 1 ml/min is well suited. The obtained eluats
are combined and semi concentrated HNO3 is added to achieve a pH of 4.5. Now sample
volume corresponds to about 22 ml.
2.3. Low Pressure Column-Chromatography
2.3.1. Conditioning
A low pressure cation exchange column (Bio-Rad AG50W-X12, 200-400 mesh,7 mm in
diameter) is prepared and converted in the ammonium form by washing with 15 ml 1.5 N
ammonium acetate, followed by 15 ml 0.25 N ammonium acetate solution previously adjusted to
pH = 4,5 (Hancock and Martin, 1991). Resulting column height is 75 mm. For the purposes of
rapid and unhindered separation gravity flow is not recommended. Applying a gentle pressure
the required continuously stable flow rate of 1.0 - 1.2 ml/min could be provided during the
whole separation procedure.
Neue analytische Methoden Teil 2 29
2.3.2. EDTA Removal and Ingrowth of Actinium (Ac)
The eluat obtained from Ra extraction, is passed through the column. By washing with 50 ml 1.5
N ammonium acetate in 0.1 N HNO3, disturbing EDTA matrix is eluted, avoiding formation of
precipitates and thus painstaking filtering processes afterwards. Residual actinides are complexed
and likewise eluted. After ammonium acetate wash 225Ac starts to build-up. The time t1 of the
end of EDTA removal has to be noted.
2.3.3. Separation of Ba and Elution of Ra
About 54 ml of 2.5 N HCl are used to remove Barium (Ba). Then by adding another 25 ml of
6 N HNO3 the retained Ra fraction is eluted. The separation of Ba from Ra has to be verified
because it is crucial for later electroplating. The solution is evaporated in a PFA beaker in order
to remove HNO3 although complete evaporation to dryness has to be avoided.
2.4. Electrodeposition from Ethanolic Solution
After the selective enrichment, removal of interfering elements and separation from complexing
agents the analyte is electrodeposited onto a polished stainless steel disc for α-spectrometric
assay. Prior to electrodeposition planchettes have to be cleaned with acetone to remove any oil
to ensure that the analyte solution is in uniform contact with it all over its surface.
The evaporated residue is dissolved in 0.5 ml 0.1 M HNO3 and the beaker is successively flushed
with 1 ml 0.05 M HCl (Hancock and Martin, 1991).Combined solutions are transferred together
with 9 ml ethanol into a electrodeposition cell. Distance between the electrodes is adjusted to
7 mm in order to attain a homogenous electrical field. The shape and material of the anode are
crucial and consist of a plane surface with laser welded Pt-rings. Very low oxidation potential
assures that it does not appreciably corrode during the electrodeposition. However, a small
amount of platinum dissolves (Ferrero Calabuig et al., 1998) and serves as a carrier (Weber et al.,
1999). Electroplating is performed for 1 h at a current of 120 mA and a voltage of about 90 to
100 V. About 1 min before the end of electrodeposition 1 ml NH4OH is added to the solution
in order to prevent redissolution of Ra once the electrical current is turned off.
After deposition the disc is cautiously rinsed either with ethanol or acetone. The brownish film
appearing after volatilisation of acetone is most likely consisting of deposited Pt. During a final
flaming to glow of the prepared α-source, hydroxides are converted to oxides and the analyte is
permanently affixed to the disc.
Neue analytische Methoden Teil 2 30
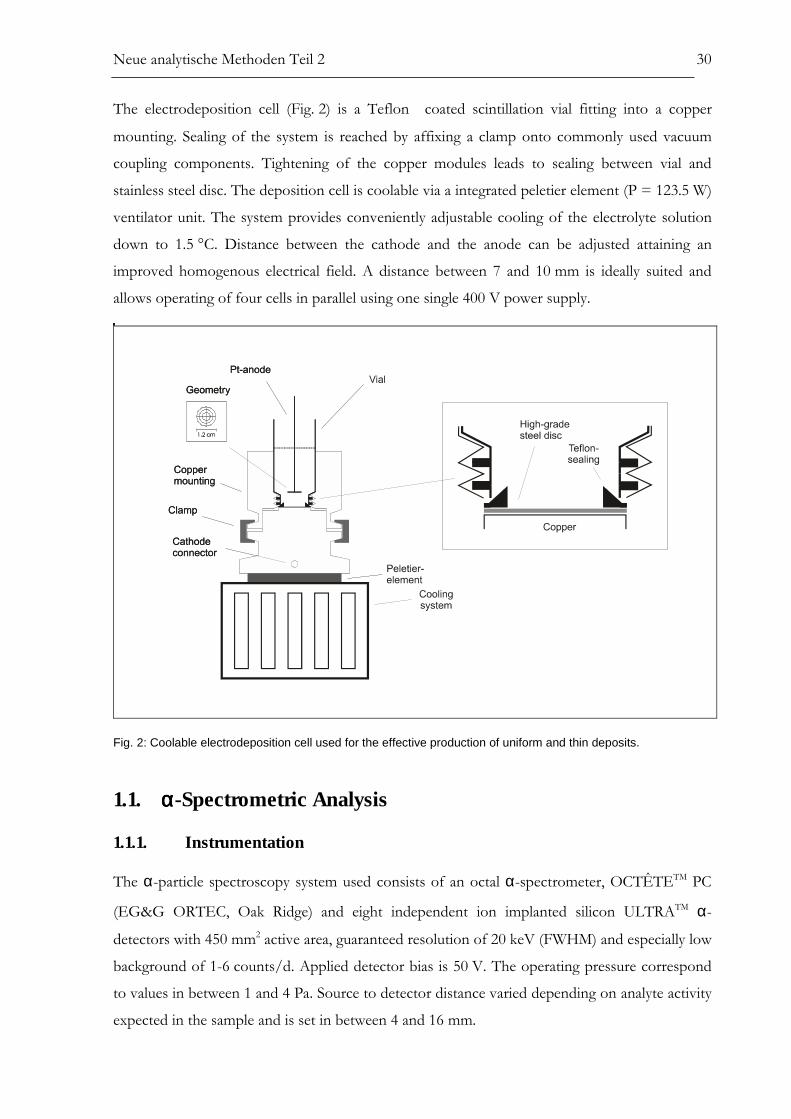
The electrodeposition cell (Fig. 2) is a Teflon coated scintillation vial fitting into a copper
mounting. Sealing of the system is reached by affixing a clamp onto commonly used vacuum
coupling components. Tightening of the copper modules leads to sealing between vial and
stainless steel disc. The deposition cell is coolable via a integrated peletier element (P = 123.5 W)
ventilator unit. The system provides conveniently adjustable cooling of the electrolyte solution
down to 1.5 °C. Distance between the cathode and the anode can be adjusted attaining an
improved homogenous electrical field. A distance between 7 and 10 mm is ideally suited and
allows operating of four cells in parallel using one single 400 V power supply.
Fig. 2: Coolable electrodeposition cell used for the effective production of uniform and thin deposits.
1.1. αααα-Spectrometric Analysis
1.1.1. Instrumentation
The α-particle spectroscopy system used consists of an octal α-spectrometer, OCTÊTETM PC
(EG&G ORTEC, Oak Ridge) and eight independent ion implanted silicon ULTRATM α-
detectors with 450 mm2 active area, guaranteed resolution of 20 keV (FWHM) and especially low
background of 1-6 counts/d. Applied detector bias is 50 V. The operating pressure correspond
to values in between 1 and 4 Pa. Source to detector distance varied depending on analyte activity
expected in the sample and is set in between 4 and 16 mm.
Neue analytische Methoden Teil 2 31
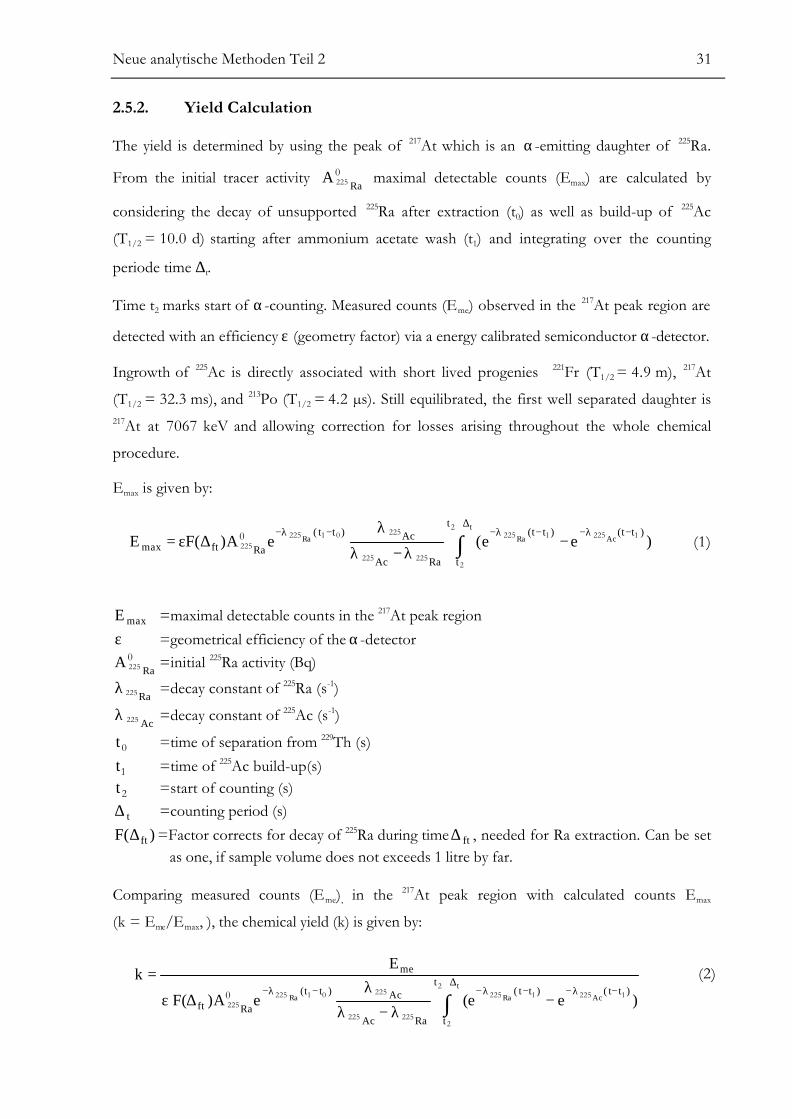
2.5.2. Yield Calculation
The yield is determined by using the peak of 217At which is an α-emitting daughter of 225Ra.
From the initial tracer activity 0225 Ra
A maximal detectable counts (Emax) are calculated by
considering the decay of unsupported 225Ra after extraction (t0) as well as build-up of 225Ac
(T1/2 = 10.0 d) starting after ammonium acetate wash (t1) and integrating over the counting
periode time ∆t.
Time t2 marks start of α-counting. Measured counts (Eme) observed in the 217At peak region are
detected with an efficiency ε (geometry factor) via a energy calibrated semiconductor α-detector.
Ingrowth of 225Ac is directly associated with short lived progenies 221Fr (T1/2 = 4.9 m), 217At
(T1/2 = 32.3 ms), and 213Po (T1/2 = 4.2 µs). Still equilibrated, the first well separated daughter is217At at 7067 keV and allowing correction for losses arising throughout the whole chemical
procedure.
Emax is given by:
∫∆+
−λ−−λ−−λ−−
λ−λ
λ∆ε=
tAcRaRa
t
t
)tt()tt(
RaAc
Ac)tt(
Raftmax )ee(eA)(FE2
2
12251225
225225
225012252250 (1)
maxE =maximal detectable counts in the 217At peak regionε =geometrical efficiency of the α-detector
0225 Ra
A =initial 225Ra activity (Bq)
Ra225λ =decay constant of 225Ra (s-1)
Ac225λ =decay constant of 225Ac (s-1)
0t =time of separation from 229Th (s)
1t =time of 225Ac build-up(s)
2t =start of counting (s)
t∆ =counting period (s))(F ft∆ =Factor corrects for decay of 225Ra during time ft∆ , needed for Ra extraction. Can be set
as one, if sample volume does not exceeds 1 litre by far.
Comparing measured counts (Eme), in the 217At peak region with calculated counts Emax
(k = Eme/Emax, ), the chemical yield (k) is given by:
∫∆+
−λ−−λ−−λ−−
λ−λ
λ∆ε
=t
AcRaRa
t
t
)tt()tt(
RaAc
Ac)tt(
Raft
me
)ee(eA)(F
Ek
2
2
12251225
225225
225012252250
(2)
Neue analytische Methoden Teil 2 32
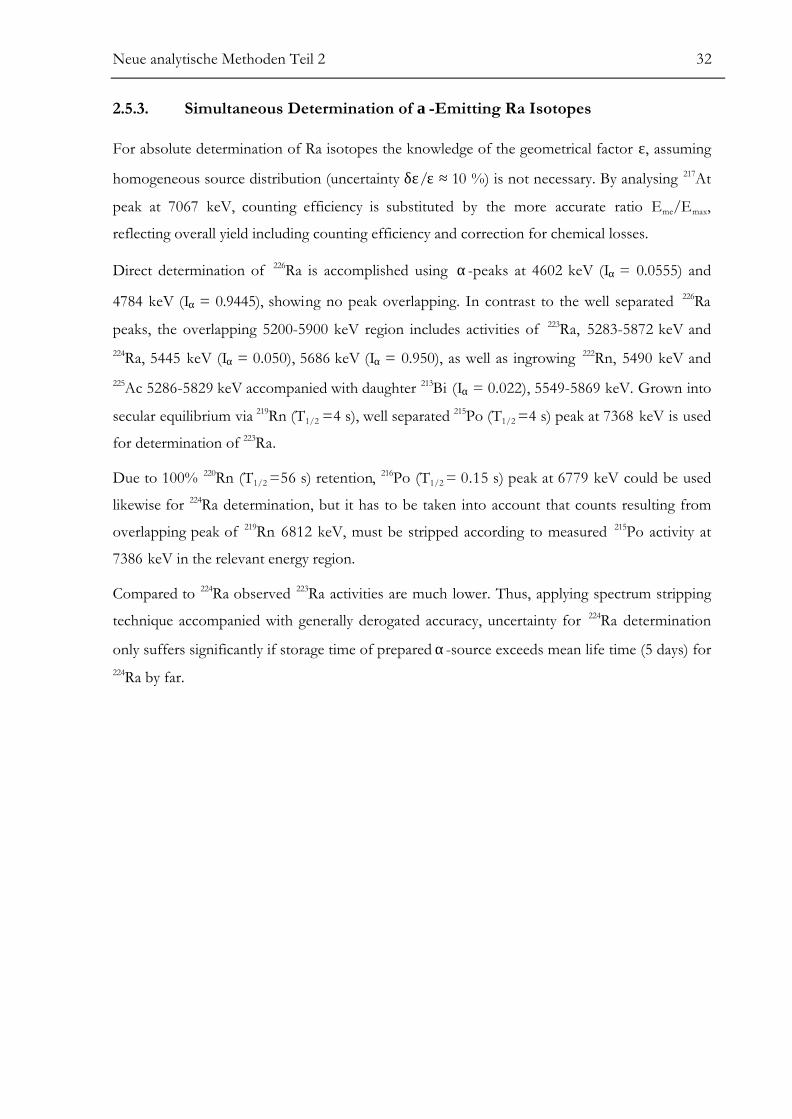
2.5.3. Simultaneous Determination of α-Emitting Ra Isotopes
For absolute determination of Ra isotopes the knowledge of the geometrical factor ε, assuming
homogeneous source distribution (uncertainty δε/ε ≈ 10 %) is not necessary. By analysing 217At
peak at 7067 keV, counting efficiency is substituted by the more accurate ratio Eme/Emax,
reflecting overall yield including counting efficiency and correction for chemical losses.
Direct determination of 226Ra is accomplished using α-peaks at 4602 keV (Iα = 0.0555) and
4784 keV (Iα = 0.9445), showing no peak overlapping. In contrast to the well separated 226Ra
peaks, the overlapping 5200-5900 keV region includes activities of 223Ra, 5283-5872 keV and224Ra, 5445 keV (Iα = 0.050), 5686 keV (Iα = 0.950), as well as ingrowing 222Rn, 5490 keV and225Ac 5286-5829 keV accompanied with daughter 213Bi (Iα = 0.022), 5549-5869 keV. Grown into
secular equilibrium via 219Rn (T1/2 =4 s), well separated 215Po (T1/2 =4 s) peak at 7368 keV is used
for determination of 223Ra.
Due to 100% 220Rn (T1/2 =56 s) retention, 216Po (T1/2 = 0.15 s) peak at 6779 keV could be used
likewise for 224Ra determination, but it has to be taken into account that counts resulting from
overlapping peak of 219Rn 6812 keV, must be stripped according to measured 215Po activity at
7386 keV in the relevant energy region.
Compared to 224Ra observed 223Ra activities are much lower. Thus, applying spectrum stripping
technique accompanied with generally derogated accuracy, uncertainty for 224Ra determination
only suffers significantly if storage time of prepared α-source exceeds mean life time (5 days) for224Ra by far.
Neue analytische Methoden Teil 2 33
3. Discussion
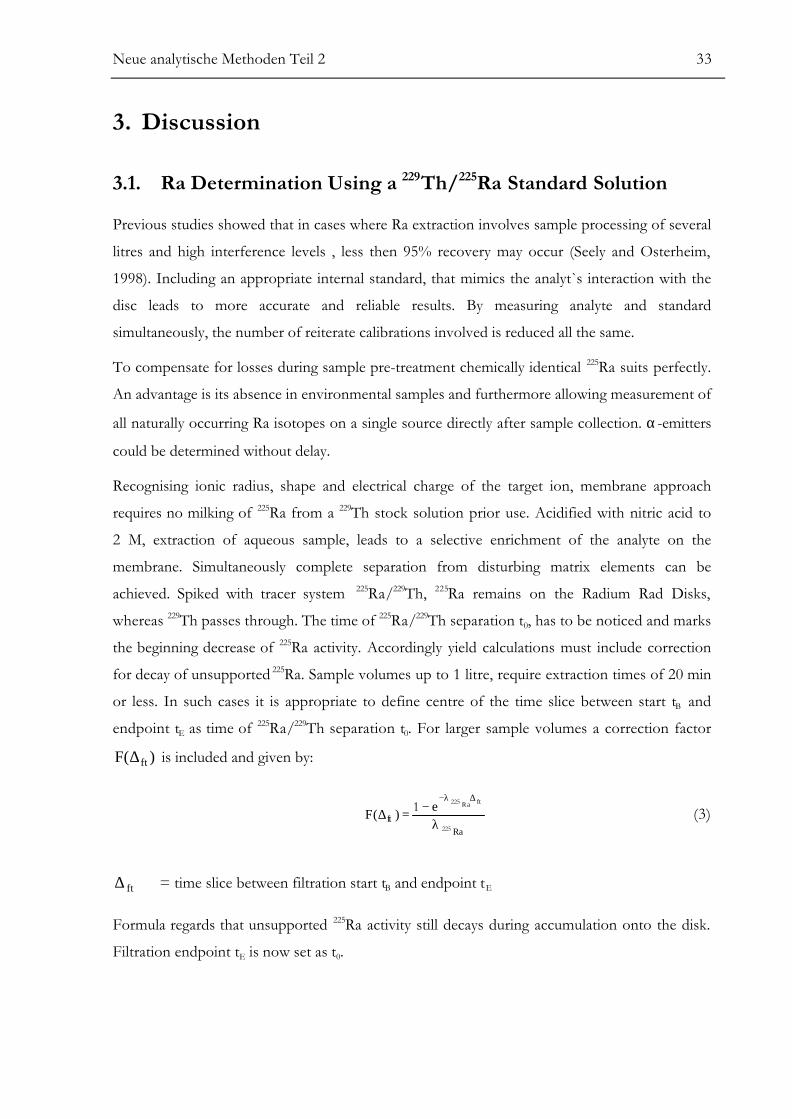
3.1. Ra Determination Using a 229Th/225Ra Standard Solution
Previous studies showed that in cases where Ra extraction involves sample processing of several
litres and high interference levels , less then 95% recovery may occur (Seely and Osterheim,
1998). Including an appropriate internal standard, that mimics the analyt`s interaction with the
disc leads to more accurate and reliable results. By measuring analyte and standard
simultaneously, the number of reiterate calibrations involved is reduced all the same.
To compensate for losses during sample pre-treatment chemically identical 225Ra suits perfectly.
An advantage is its absence in environmental samples and furthermore allowing measurement of
all naturally occurring Ra isotopes on a single source directly after sample collection. α-emitters
could be determined without delay.
Recognising ionic radius, shape and electrical charge of the target ion, membrane approach
requires no milking of 225Ra from a 229Th stock solution prior use. Acidified with nitric acid to
2 M, extraction of aqueous sample, leads to a selective enrichment of the analyte on the
membrane. Simultaneously complete separation from disturbing matrix elements can be
achieved. Spiked with tracer system 225Ra/229Th, 225Ra remains on the Radium Rad Disks,
whereas 229Th passes through. The time of 225Ra/229Th separation t0, has to be noticed and marks
the beginning decrease of 225Ra activity. Accordingly yield calculations must include correction
for decay of unsupported 225Ra. Sample volumes up to 1 litre, require extraction times of 20 min
or less. In such cases it is appropriate to define centre of the time slice between start tB and
endpoint tE as time of 225Ra/229Th separation t0. For larger sample volumes a correction factor
)(F ft∆ is included and given by:
Raft
ftRae)(F225
2251λ
−=∆∆λ−
(3)
ft∆ = time slice between filtration start tB and endpoint tE
Formula regards that unsupported 225Ra activity still decays during accumulation onto the disk.
Filtration endpoint tE is now set as t0.
Neue analytische Methoden Teil 2 34
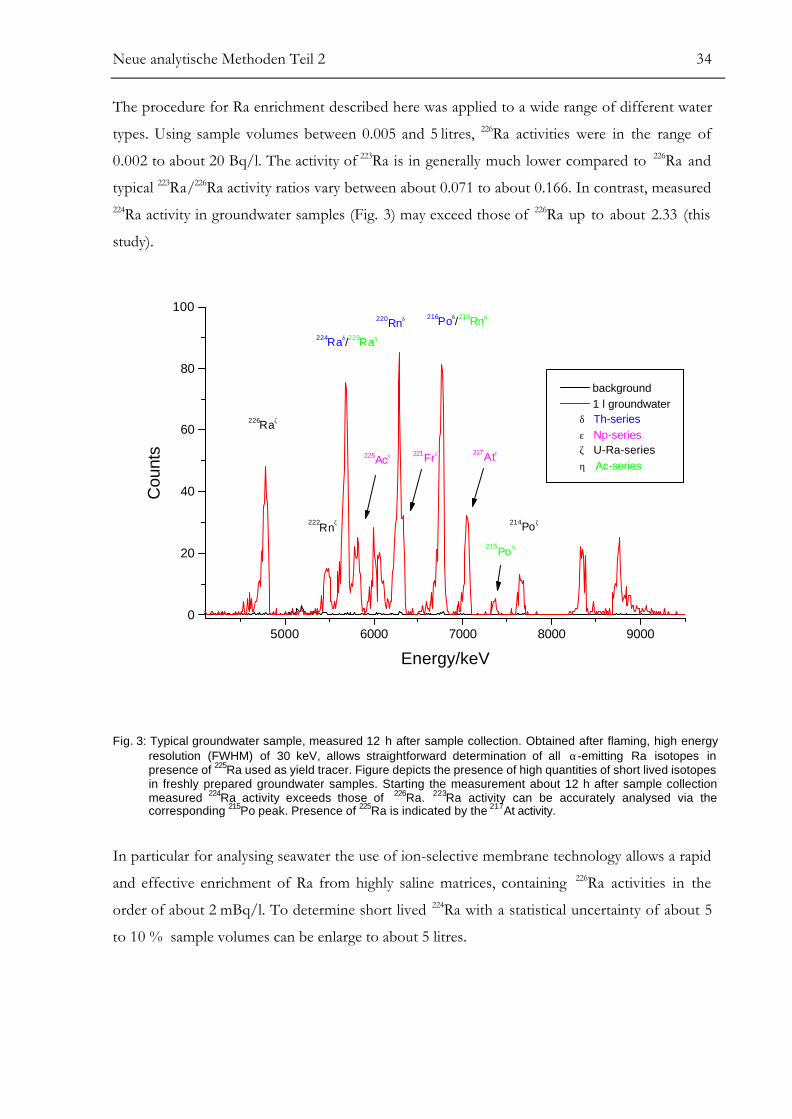
The procedure for Ra enrichment described here was applied to a wide range of different water
types. Using sample volumes between 0.005 and 5 litres, 226Ra activities were in the range of
0.002 to about 20 Bq/l. The activity of 223Ra is in generally much lower compared to 226Ra and
typical 223Ra/226Ra activity ratios vary between about 0.071 to about 0.166. In contrast, measured224Ra activity in groundwater samples (Fig. 3) may exceed those of 226Ra up to about 2.33 (this
study).
5000 6000 7000 8000 90000
20
40
60
80
100
217Atε221Frε225Acε
215Po
η
216Poδ/219Rnη220Rnδ
224Raδ/223Raη
214Poζ222Rn
ζ
226Raζ
background 1 l groundwater
δ Th-series ε Np-series ζ U-Ra-series η Ac-series
Cou
nts
Energy/keV
Fig. 3: Typical groundwater sample, measured 12 h after sample collection. Obtained after flaming, high energyresolution (FWHM) of 30 keV, allows straightforward determination of all α-emitting Ra isotopes inpresence of 225Ra used as yield tracer. Figure depicts the presence of high quantities of short lived isotopesin freshly prepared groundwater samples. Starting the measurement about 12 h after sample collectionmeasured 224Ra activity exceeds those of 226Ra. 223Ra activity can be accurately analysed via thecorresponding 215Po peak. Presence of 225Ra is indicated by the 217At activity.
In particular for analysing seawater the use of ion-selective membrane technology allows a rapid
and effective enrichment of Ra from highly saline matrices, containing 226Ra activities in the
order of about 2 mBq/l. To determine short lived 224Ra with a statistical uncertainty of about 5
to 10 % sample volumes can be enlarge to about 5 litres.
Neue analytische Methoden Teil 2 35
1.2. Ra Stripping Using Adapted EDTA-Mixtures
For a straightforward assay of Ra loaded onto a membrane it is important to avoid lengthy
analytical techniques for Ra stripping. Ensuing eluat should be suited to allow a separation of
extraneous matrix components without further pre-treatment. Complete destruction of the disk
(Joannon and Pin, 2001) or high amounts of alkaline EDTA (Schönhofer and Wallner, 2001, 3M
Test Method Ra-395, 1995) have to be avoided. By using adapted EDTA-mixtures in a specially
designed extraction apparatus Ra is effectively stripped and sample pre-treatment involving
volume reduction, precipitation or wet ashing are not necessary.
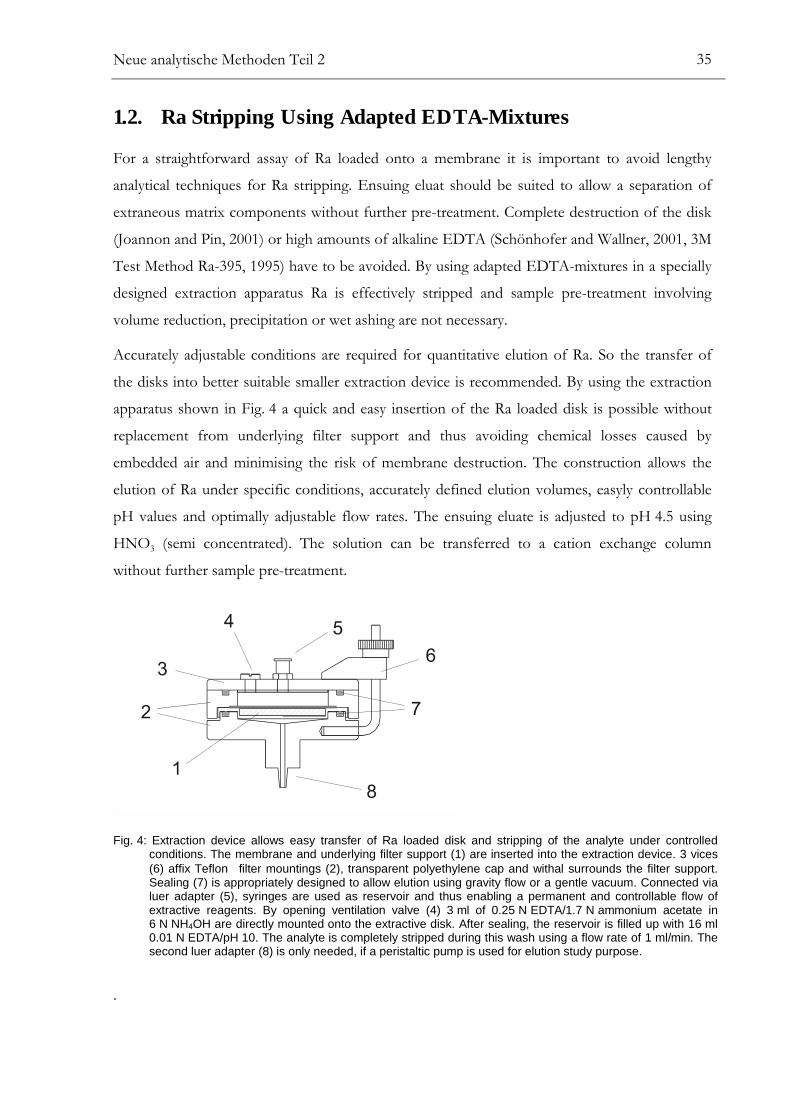
Accurately adjustable conditions are required for quantitative elution of Ra. So the transfer of
the disks into better suitable smaller extraction device is recommended. By using the extraction
apparatus shown in Fig. 4 a quick and easy insertion of the Ra loaded disk is possible without
replacement from underlying filter support and thus avoiding chemical losses caused by
embedded air and minimising the risk of membrane destruction. The construction allows the
elution of Ra under specific conditions, accurately defined elution volumes, easyly controllable
pH values and optimally adjustable flow rates. The ensuing eluate is adjusted to pH 4.5 using
HNO3 (semi concentrated). The solution can be transferred to a cation exchange column
without further sample pre-treatment.
Fig. 4: Extraction device allows easy transfer of Ra loaded disk and stripping of the analyte under controlledconditions. The membrane and underlying filter support (1) are inserted into the extraction device. 3 vices(6) affix Teflon filter mountings (2), transparent polyethylene cap and withal surrounds the filter support.Sealing (7) is appropriately designed to allow elution using gravity flow or a gentle vacuum. Connected vialuer adapter (5), syringes are used as reservoir and thus enabling a permanent and controllable flow ofextractive reagents. By opening ventilation valve (4) 3 ml of 0.25 N EDTA/1.7 N ammonium acetate in6 N NH4OH are directly mounted onto the extractive disk. After sealing, the reservoir is filled up with 16 ml0.01 N EDTA/pH 10. The analyte is completely stripped during this wash using a flow rate of 1 ml/min. Thesecond luer adapter (8) is only needed, if a peristaltic pump is used for elution study purpose.
.
Neue analytische Methoden Teil 2 36
3.3. Separation of Disturbing Matrix Composition Using Low
Pressure Column-Chromatography
The separation principle is based on low complexation ability of alkaline earth elements. Ra
shows no capability to form EDTA complexes at pH 4.5 and regarding its small hydrate shell is
similar to Ba strongly adsorbed on the top of the cation exchange column. Disturbing EDTA-
matrix passes through and is completely washed out of the column by using ammonium acetate.
This treatment was reported by Hancock and Martin (1991) to elute lead carrier but it is also
perfectly suited to prevent formation of EDTA precipitates on the column. Interfering Th, Ac
(Durecova, 1997) and uranium (Smith et al., 1997) are not retained on the Radium Rad Disks
and thus should not be present on the column. However residual actinides that may have
remained are complexed and completely removed (Khopkar and De, 1960).
Separation procedure requires highly cross linked 200-400 mesh cation exchange resins to
achieve a sufficient separation of Ra and Ba. Denoted amounts of resin (Hancock and Martin,
1991) are usually adequate to achieve sufficient Ba separation, resulting in excellent α-spectrum
resolution. But flow rates, obtained by gravity flow, are too low for our purpose and even
degreased with time. By using low pressure column chromatography flow rates are stable and
can be adjusted to 1.0-1.2 ml/l. Convenient handling of the separation procedure described in
this paper allows parallel processing of 8 to 10 samples within 5 hours. The chemical procedure
could be easily automated via computer-controlled valves and pumps and operator time could
be minimised furthermore.
3.4. Production of Homogenous α-Sources in Presence of Ba
Electrochemical parameters, such as ionic strength (Tome and Sanchez, 1991), deposition time,
distance between the cathode and the anode, pH-value (Lee and Pimpl, 1999) and temperature
(Talvity, 1972) are important factors in achieving a thin and uniform deposit, their influences are
well studied in the effective production of actinide sources. In contrast to the quantitative
plating of actinides from hot aqueous solutions, sufficient deposition of Ra could not be
achieved under similar conditions. Optimised conditions allow deposition from aqueous solution
(Roman, 1984), but suffer from long plating time. Plating from organic solutions (Koide and
Bruland, 1974, Short, 1986) allows adequate Ra deposition with improved energy resolution and
reduced deposition time.
In the case of minimal Ba contamination of several µg observed energy resolution shows no
strong dependence of chosen distance between electrodes. After flaming FWHM-values are in
Neue analytische Methoden Teil 2 37
the range of 26-40 keV. In environmental samples complete separation of Ba and Ra is difficult
and not given for groundwater samples, that containe Ba in quantities exceeding 1 mg by far.
After chemical preparation a Ba residual remains in the final Ra fraction and a critical value of
100 µg may be exceeded. Avoiding renewed chemical processing, α-spectrometric assay
becomes more robust to the presence of Ba by increasing the distance between the electrodes
during electrolysis. Thus, in the case of higher aerial mass an improved homogeneity of the
electrical field guarantees optimal spectrum resolution and allows uniform plating of Ra and Ba
likewise. Self absorption in the prepared source is brought to a minimum. Evaporation of the
volatile electrolyte composition is negligible and refilling is not necessary due to compensation
of increased heat dissipation. More over cooling of the deposition cell enhances deposition yield.
In a series of experiments efficient plating of the analyte has been tested by the behaviour of Ba,
acting as a carrier. Equilibrium between the deposition of bariumhydroxyd (Ba(OH)2) and its
redissolution is controlled by the temperature of the solution. Accordingly, improved plating
efficiency of easily soluble Ba and Ra can be attained in a cooled electrolyte solutions.
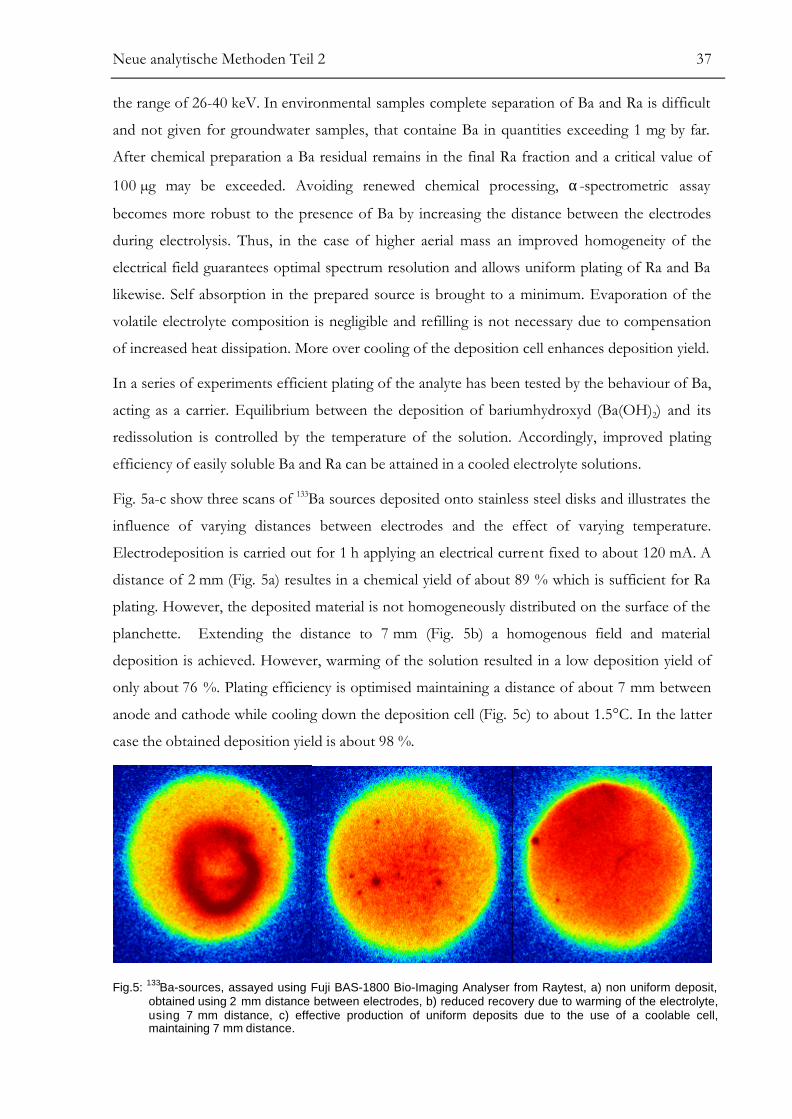
Fig. 5a-c show three scans of 133Ba sources deposited onto stainless steel disks and illustrates the
influence of varying distances between electrodes and the effect of varying temperature.
Electrodeposition is carried out for 1 h applying an electrical current fixed to about 120 mA. A
distance of 2 mm (Fig. 5a) resultes in a chemical yield of about 89 % which is sufficient for Ra
plating. However, the deposited material is not homogeneously distributed on the surface of the
planchette. Extending the distance to 7 mm (Fig. 5b) a homogenous field and material
deposition is achieved. However, warming of the solution resulted in a low deposition yield of
only about 76 %. Plating efficiency is optimised maintaining a distance of about 7 mm between
anode and cathode while cooling down the deposition cell (Fig. 5c) to about 1.5°C. In the latter
case the obtained deposition yield is about 98 %.
Fig.5: 133Ba-sources, assayed using Fuji BAS-1800 Bio-Imaging Analyser from Raytest, a) non uniform deposit,obtained using 2 mm distance between electrodes, b) reduced recovery due to warming of the electrolyte,using 7 mm distance, c) effective production of uniform deposits due to the use of a coolable cell,maintaining 7 mm distance.
Neue analytische Methoden Teil 2 38
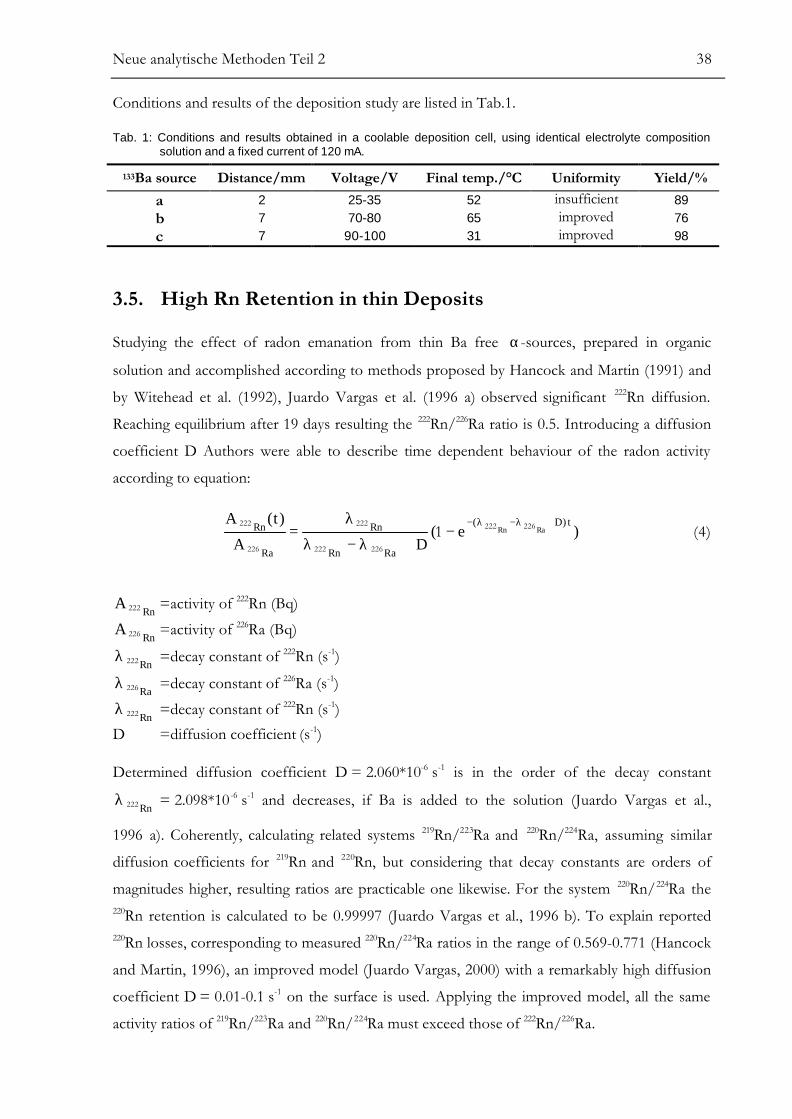
Conditions and results of the deposition study are listed in Tab.1.
Tab. 1: Conditions and results obtained in a coolable deposition cell, using identical electrolyte compositionsolution and a fixed current of 120 mA.
133Ba source Distance/mm Voltage/V Final temp./°C Uniformity Yield/%a 2 25-35 52 insufficient 89b 7 70-80 65 improved 76c 7 90-100 31 improved 98
3.5. High Rn Retention in thin Deposits
Studying the effect of radon emanation from thin Ba free α-sources, prepared in organic
solution and accomplished according to methods proposed by Hancock and Martin (1991) and
by Witehead et al. (1992), Juardo Vargas et al. (1996 a) observed significant 222Rn diffusion.
Reaching equilibrium after 19 days resulting the 222Rn/226Ra ratio is 0.5. Introducing a diffusion
coefficient D Authors were able to describe time dependent behaviour of the radon activity
according to equation:
)e(DA
)t(A t)D(
RaRn
Rn
Ra
Rn RaRn+λ−λ−
−+λ−λ
λ= 226222
226222
222
226
2221 (4)
RnA 222 =activity of 222Rn (Bq)
RnA 226 =activity of 226Ra (Bq)
Rn222λ =decay constant of 222Rn (s-1)
Ra226λ =decay constant of 226Ra (s-1)
Rn222λ =decay constant of 222Rn (s-1)D =diffusion coefficient (s-1)
Determined diffusion coefficient D = 2.060*10-6 s-1 is in the order of the decay constant
Rn222λ = 2.098*10 -6 s-1 and decreases, if Ba is added to the solution (Juardo Vargas et al.,
1996 a). Coherently, calculating related systems 219Rn/223Ra and 220Rn/224Ra, assuming similar
diffusion coefficients for 219Rn and 220Rn, but considering that decay constants are orders of
magnitudes higher, resulting ratios are practicable one likewise. For the system 220Rn/224Ra the220Rn retention is calculated to be 0.99997 (Juardo Vargas et al., 1996 b). To explain reported220Rn losses, corresponding to measured 220Rn/224Ra ratios in the range of 0.569-0.771 (Hancock
and Martin, 1996), an improved model (Juardo Vargas, 2000) with a remarkably high diffusion
coefficient D = 0.01-0.1 s-1 on the surface is used. Applying the improved model, all the same
activity ratios of 219Rn/223Ra and 220Rn/224Ra must exceed those of 222Rn/226Ra.
Neue analytische Methoden Teil 2 39
Thus, quantitative 222Rn retention will guarantee complete sealing for 219Rn and 220Rn.
Consequently this will simplify 223Ra and 224Ra determination and, without further calibration,
allow their straitforward determination via their daughters. Indeed, using recommended
electrochemical parameters to prepare α-sources and heating to glow to affix the deposit, a
quantitative 222Rn retention is observed. Without a diffusion term and taking into account
Rn222λ >> Ra226λ , Fig. 6 shows time dependent behaviour of 222Rn according to commonly used
ingrowth equation:
t
Ra
Rn RneA
tA )( 222
226
222
1)( λ−
−= (5)
During six measurements (53a – 53f, Tab. 2), accomplished in succession, the activity ratio222Rn/226Ra is determined. After integration of equation (5) over time of measurement t∆ and
rearranging, detected counts E222, E226 in the 222Rn and 226Ra peak region are analysed according
to the resulting equation:
)(1
1ln 01226
222222
222
222
tteE
ERn
tRntRn
−=
−
∆
−
∆−λ
λλ
(6)
t0-t1 =time slice between flaming, t0, and start of counting, t1.
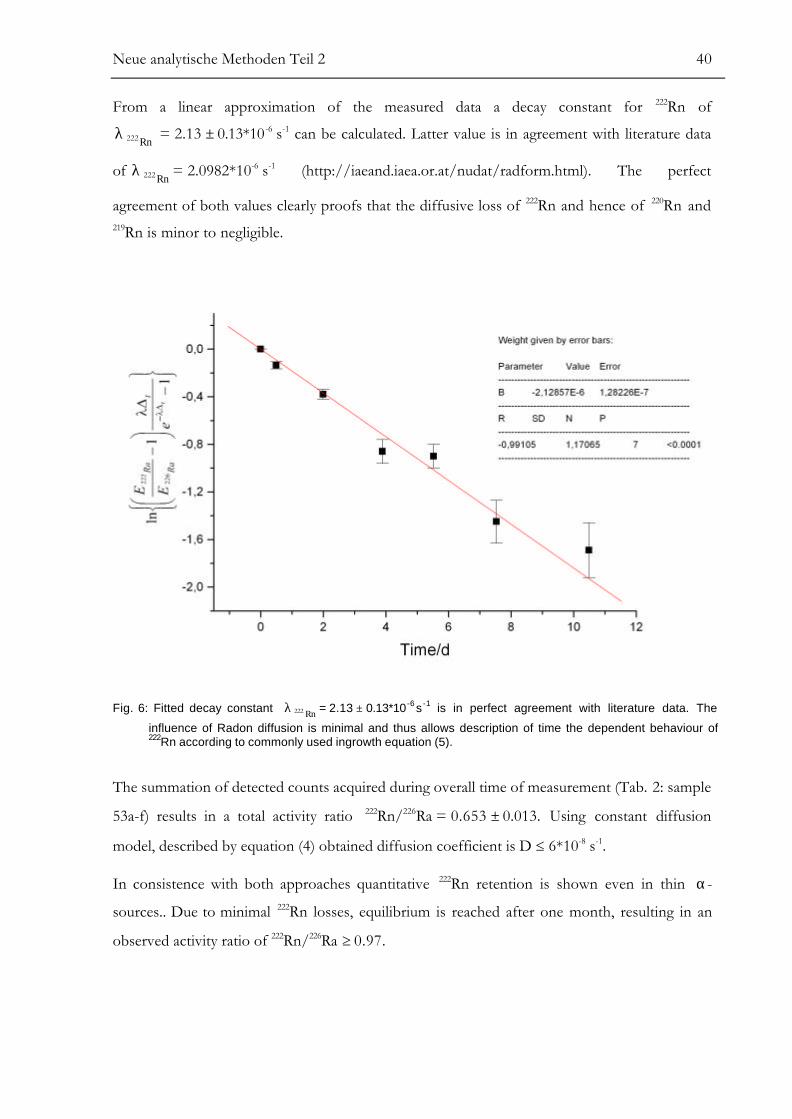
Neue analytische Methoden Teil 2 40
From a linear approximation of the measured data a decay constant for 222Rn of
Rn222λ = 2.13 ± 0.13*10 -6 s-1 can be calculated. Latter value is in agreement with literature data
of Rn222λ = 2.0982*10-6 s-1 (http://iaeand.iaea.or.at/nudat/radform.html). The perfect
agreement of both values clearly proofs that the diffusive loss of 222Rn and hence of 220Rn and219Rn is minor to negligible.
Fig. 6: Fitted decay constant Rn222λ = 2.13 ± 0.13*10 -6 s -1 is in perfect agreement with literature data. The
influence of Radon diffusion is minimal and thus allows description of time the dependent behaviour of222Rn according to commonly used ingrowth equation (5).
The summation of detected counts acquired during overall time of measurement (Tab. 2: sample
53a-f) results in a total activity ratio 222Rn/226Ra = 0.653 ± 0.013. Using constant diffusion
model, described by equation (4) obtained diffusion coefficient is D ≤ 6*10-8 s-1.
In consistence with both approaches quantitative 222Rn retention is shown even in thin α-
sources.. Due to minimal 222Rn losses, equilibrium is reached after one month, resulting in an
observed activity ratio of 222Rn/226Ra ≥ 0.97.
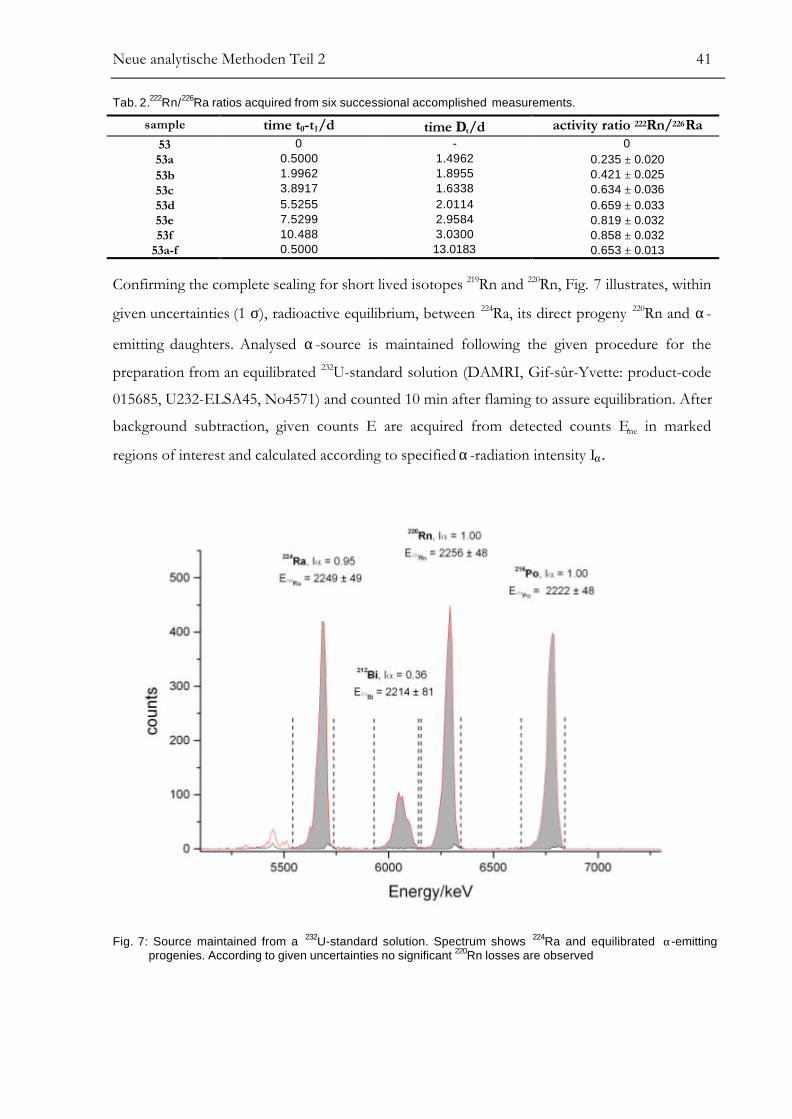
Neue analytische Methoden Teil 2 41
Tab. 2.222Rn/226Ra ratios acquired from six successional accomplished measurements.
sample time t0-t1/d time ∆t/d activity ratio 222Rn/226Ra53 0 - 053a 0.5000 1.4962 0.235 ± 0.02053b 1.9962 1.8955 0.421 ± 0.02553c 3.8917 1.6338 0.634 ± 0.03653d 5.5255 2.0114 0.659 ± 0.03353e 7.5299 2.9584 0.819 ± 0.03253f 10.488 3.0300 0.858 ± 0.032
53a-f 0.5000 13.0183 0.653 ± 0.013
Confirming the complete sealing for short lived isotopes 219Rn and 220Rn, Fig. 7 illustrates, within
given uncertainties (1 σ), radioactive equilibrium, between 224Ra, its direct progeny 220Rn and α-
emitting daughters. Analysed α-source is maintained following the given procedure for the
preparation from an equilibrated 232U-standard solution (DAMRI, Gif-sûr-Yvette: product-code
015685, U232-ELSA45, No4571) and counted 10 min after flaming to assure equilibration. After
background subtraction, given counts E are acquired from detected counts Eme in marked
regions of interest and calculated according to specified α-radiation intensity Iα.
Fig. 7: Source maintained from a 232U-standard solution. Spectrum shows 224Ra and equilibrated α-emittingprogenies. According to given uncertainties no significant 220Rn losses are observed
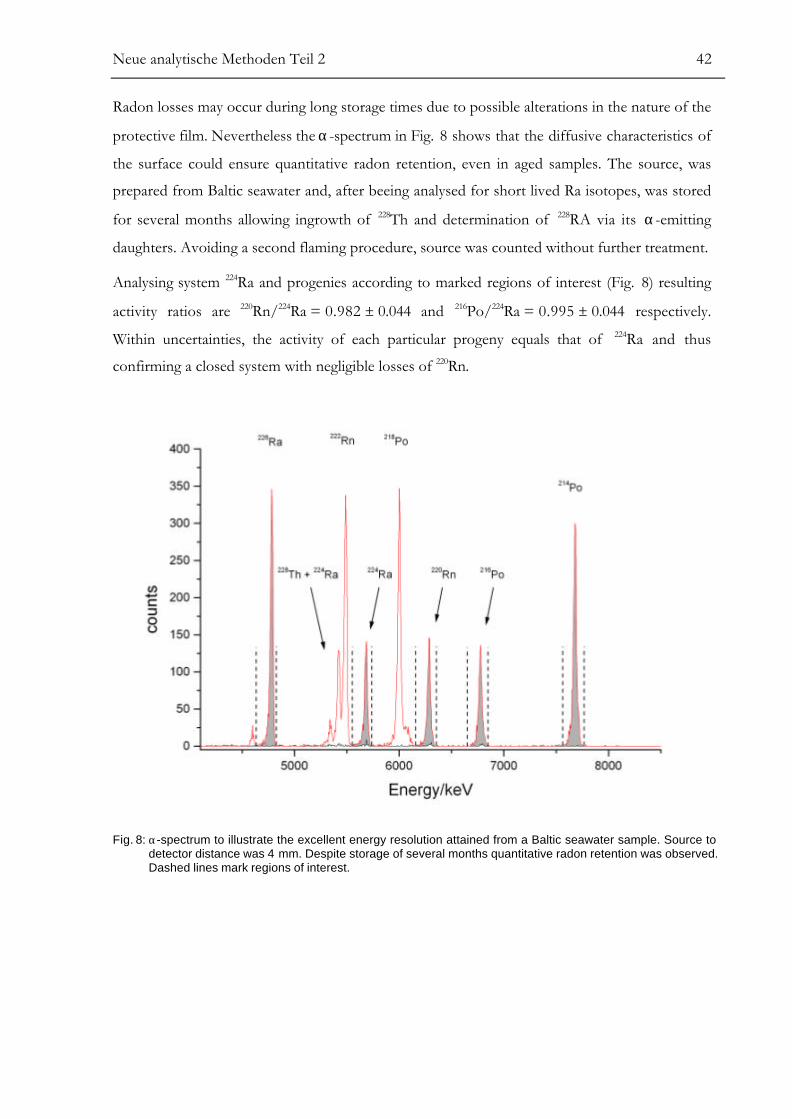
Neue analytische Methoden Teil 2 42
Radon losses may occur during long storage times due to possible alterations in the nature of the
protective film. Nevertheless the α-spectrum in Fig. 8 shows that the diffusive characteristics of
the surface could ensure quantitative radon retention, even in aged samples. The source, was
prepared from Baltic seawater and, after beeing analysed for short lived Ra isotopes, was stored
for several months allowing ingrowth of 228Th and determination of 228RA via its α-emitting
daughters. Avoiding a second flaming procedure, source was counted without further treatment.
Analysing system 224Ra and progenies according to marked regions of interest (Fig. 8) resulting
activity ratios are 220Rn/224Ra = 0.982 ± 0.044 and 216Po/224Ra = 0.995 ± 0.044 respectively.
Within uncertainties, the activity of each particular progeny equals that of 224Ra and thus
confirming a closed system with negligible losses of 220Rn.
Fig. 8: α-spectrum to illustrate the excellent energy resolution attained from a Baltic seawater sample. Source todetector distance was 4 mm. Despite storage of several months quantitative radon retention was observed.Dashed lines mark regions of interest.
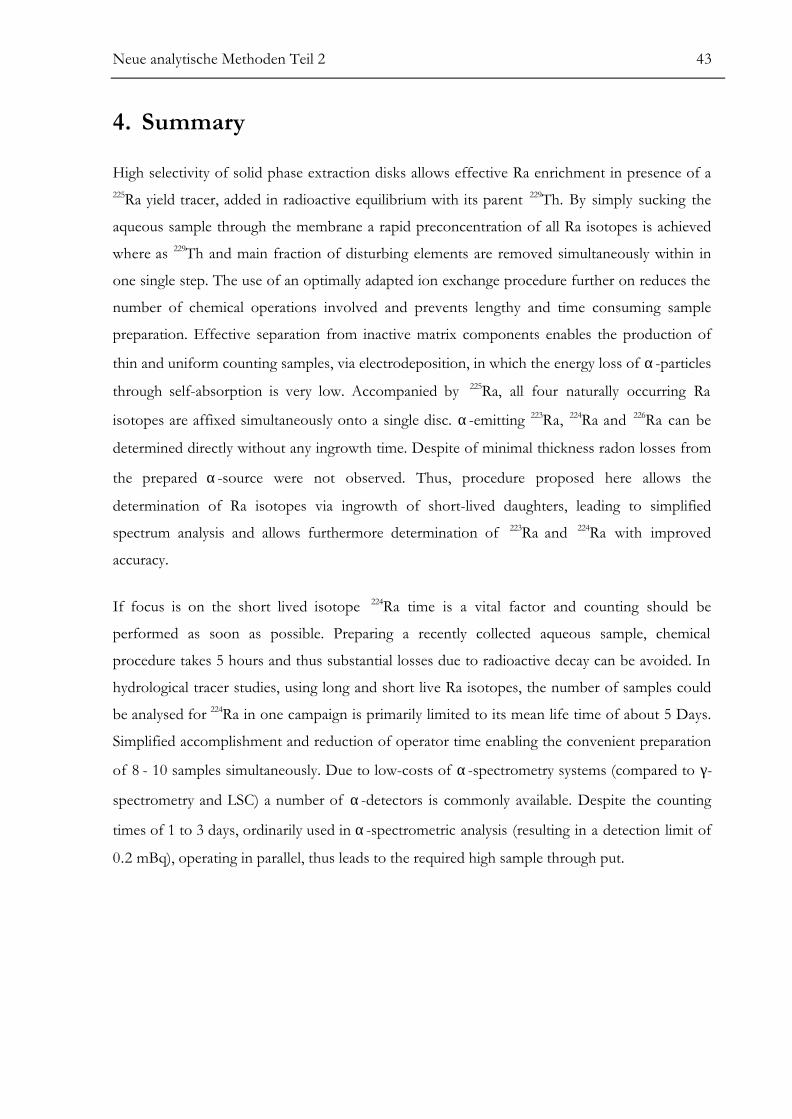
Neue analytische Methoden Teil 2 43
4. Summary
High selectivity of solid phase extraction disks allows effective Ra enrichment in presence of a225Ra yield tracer, added in radioactive equilibrium with its parent 229Th. By simply sucking the
aqueous sample through the membrane a rapid preconcentration of all Ra isotopes is achieved
where as 229Th and main fraction of disturbing elements are removed simultaneously within in
one single step. The use of an optimally adapted ion exchange procedure further on reduces the
number of chemical operations involved and prevents lengthy and time consuming sample
preparation. Effective separation from inactive matrix components enables the production of
thin and uniform counting samples, via electrodeposition, in which the energy loss of α-particles
through self-absorption is very low. Accompanied by 225Ra, all four naturally occurring Ra
isotopes are affixed simultaneously onto a single disc. α-emitting 223Ra, 224Ra and 226Ra can be
determined directly without any ingrowth time. Despite of minimal thickness radon losses from
the prepared α-source were not observed. Thus, procedure proposed here allows the
determination of Ra isotopes via ingrowth of short-lived daughters, leading to simplified
spectrum analysis and allows furthermore determination of 223Ra and 224Ra with improved
accuracy.
If focus is on the short lived isotope 224Ra time is a vital factor and counting should be
performed as soon as possible. Preparing a recently collected aqueous sample, chemical
procedure takes 5 hours and thus substantial losses due to radioactive decay can be avoided. In
hydrological tracer studies, using long and short live Ra isotopes, the number of samples could
be analysed for 224Ra in one campaign is primarily limited to its mean life time of about 5 Days.
Simplified accomplishment and reduction of operator time enabling the convenient preparation
of 8 - 10 samples simultaneously. Due to low-costs of α-spectrometry systems (compared to γ-
spectrometry and LSC) a number of α-detectors is commonly available. Despite the counting
times of 1 to 3 days, ordinarily used in α-spectrometric analysis (resulting in a detection limit of
0.2 mBq), operating in parallel, thus leads to the required high sample through put.
Neue analytische Methoden Teil 2 44
References
Durecova, A., 1997. Contribution to the simultaneous determination of 228Ra and 226Ra by using
3M`s EmporeTM Radium Rad Disks, J. Radioanal. Nucl. Chem. Art. 223, 225.
Ferrero Calabuig, J.L., Martín Sánchez, A., Roldán García, C., Vera Tome, F., Da Silva, M.F.,Soares, J.C., Juanes Barber, D.,1998. Semipermeable membrane to retain platinum atoms in theelectrodeposition process of alpha spectrometry sources, Int. J. Appl. Radiat. Isot. 49, 1269.
Goken, G.L., Bruening, R.L., Krakowiak, K.E., Izatt, R.M., 1999. In Metal-ion separation and
preconcentration: Progress and opportunities, Bond, A.H, Dietz, M.L, Rogers, R.D, (Eds.), pp.251-259, ACS Symposium Series 716, Washington, D.C..
Joannon, S., Pin, C., 2001. Ultra-trace determination of 226Ra in thermal waters by high sensitivityquadrupol ICP-mass spectrometry following selective extraction and concentration usingradium-specific membrane disks, J. Anal. At. Spectrom. 16, 32.
Juardo Vargas, M., Fernández de Soto, F., 1996a. A study of 222Rn emanation in electrodepositedsources of 226Ra with barium, Nucl. Instrum. Methods Phys. Res. A368, 488.
Juardo Vargas, M., Fernández de Soto, F., 1996b. On the determination of 223Ra and 224Ra fromtheir daughter products in electrodeposited sources of radium, Int. J. Appl. Radiat. Isot. 47, 129.
Jurado Vargas, M., 2000. A model to explain simultaneously the 222Rn and 220Rn emanation from
thin electrodeposited sources; Nucl. Instrum. Methods Phys. Res. A447, 608.
Hancock, G.J., Martin, P., 1991. Determination of Ra in environmental samples by α-particle
spectrometry, Int. J. Appl. Radiat. Isot. 42, 63.
Hancock, G.J., Martin, P., 1996. Reply to Vargas and de Soto: On the determination of 223Ra and224Ra from their daughter products in electrodeposited sources of radium, Int. J. Appl. Radiat.
Isot. 47, 131.
Khopkar, S.M., De, A.K., 1960. Cation-exchange behaviour of barium on Dowex 50W-X8,Analytica Chimica Acta 23, 441.
Koide, M., Bruland, K.W., 1974. The electrodeposition and determination of radium by isotopicdilution in sea water and in sediments simultaneously with other natural radionuclides; Analytica
Chimica Acta 75, 1.
Lee, M.H., Pimpl, M., 1999. Development of a new electrodeposition method for Pu-determination in environmental samples, Int. J. Appl. Radiat. Isot. 50, 851.
Roman, D., 1984. Electrodeposition of radium on stainless steal from aqueous solutions, Int. J.Appl. Radiat. Isot. 35, 990.
Neue analytische Methoden Teil 2 45
Tome, F.V., Sanchez, A.M., 1991. Optimizing the parameters affecting the yield and energyresolution in the electrodeposition of uranium. Int. J. Appl. Radiat. Isot. 42, 135.
Schönhofer, F., Wallner, G., 2001. Very rapid determination of 226Ra, 228Ra and 210Pb by selectiveadsorption and liquid scintillation spectrometry, Radioac. Radiochem. 12, 33.
Seely, D.C., Osterheim, J.A., 1998. Radiochemical analyses using EmporeTM Disk Technology, J.Radioanal. Nucl. Chem. Art. 236, 175.
Short, S.A., 1986. Measurement of all radium isotopes at environmental levels on a singleelectrodeposited source; Nucl. Instrum. Methods Phys. Res. B17, 540.
Smith, L.L., Alvarado, J.S., Markun, F.J., Hoffmann, K.M., Seely, D.C., Shannon, R.T., 1997. An
evaluation of radium-specific, solid phase extraction membranes, Radioac. Radiochem. 8, 30.
Talvitie, N.A., 1972. Electrodeposition of actinides for alpha spectrometric determination, Anal.Chem. 44, 280.
Weber, R., Esterlund, R.A., Patzelt, P., 1999. On the energy resolution of α-sources prepared by
electrodeposition of uranium, Nucl. Instrum. Methods Phys. Res. A423, 468.
Whitehead, N.E, Ditchburn, R.G., McCabe, W.J., Van der Raaij, R, 1992. Factors affecting the
electrodeposition of 226Ra. J. Radioanal. Nucl. Chem. Art. 160, 477.
3M Test Method Ra-395, 1995. Rapid determination of radium-226 in water using EmporeTM
Radium Rad Disks, www.3m.com/empore/Library/PDFS/RAD/Ra_395.pdf
Radiation retrieval parameters, http://iaeand.iaea.or.at/nudat/radform.html.
Radium und Radon als natürliche Tracer 46
Kapitel III. Radium und Radon als natürliche Tracer
Determination of Radium Isotopes and 222Rn in a
Groundwater Affected Coastal Area of the Baltic Sea
and the Underlying Sub-Sea Floor Aquifer
Stefan Purkl and Anton Eisenhauer
Radium und Radon als natürliche Tracer 47
Abstract
All four naturally occurring radium isotopes (223Ra, 224Ra, 226Ra, 228Ra) and 222Rn in the
groundwater affected Eckernförder Bay (EB) of the Baltic Sea (Germany) were measured using
optimal adapted analytical methods for their extensive field surveillance.
Dispersive physical mixing acting over time scales in the order of days is responsible for the
distribution of 223Ra, 224Ra and 222Rn in EB. The distribution of these natural tracers is controlled
by the strength of the sedimentary source, the influence of direct groundwater input, the
dispersive mixing coefficient in the water column and their own radioactive decay. Using a one-
dimensional transport model, distribution of 224Ra in the deep water can be described suggesting
a horizontal dispersivity in the range between 100 to 5*101 m2s-1.
From the inventory of 222Rn (72.4±7.4 Bqm-2) in the EB the obtained groundwater discharge rate
can be estimated to be 1.7±0.3 m3s-1. In order to balance the inventory of 223Ra
(0.52±0.22 Bqm-2) and 224Ra (6.46±2.6 Bqm-2) a source other than groundwater seepage has to
responsible for almost all of the 224Ra and 223Ra inventory of the EB. Diffusion from sediments
seems to be the major source for short-lived Ra isotopes in the lower water column of EB.
1. Introduction
Ra (Bollinger and Moore, 1993; Rama and Moore,1996) and Rn (Cable et al., 1996) are ideal
suited natural tracers to analyse mixing processes between ground- and near coastal seawater. In
seawater the generally low Ra and Rn concentrations (in the order of mBql-1) are related to the
insolubility of thorium (Th) being the parent (grandparent) nuclide of Ra and Rn, respectively
(Fig. 1). A major source for Ra in seawater is diffusion out of the marine sediments (Li, 1977)
and the riverine input including both, dissolved and sedimentary load (Hancock and Murray,
1996). However, there is a third important source being the direct input of Ra enriched
groundwaters into the coastal zone which has recently been recognised and emphasized by
Moore (1996). During the percolation of groundwater through the geological structure the fluid
becomes enriched in Rn and Ra. High concentrations (in the order of Bql-1) are mainly related to
their easy solubility but also controlled by their adsorptive behaviour. For short-lived isotopes
enrichment via α-recoil mechanisms (Krishnaswami et al., 1982) have to be taken in
consideration. The discharge of these natural tracers into the depleted water column, provides a
time information due to their radioactive decay. The spectrum of half-lives (T1/2) (Fig. 1) allows
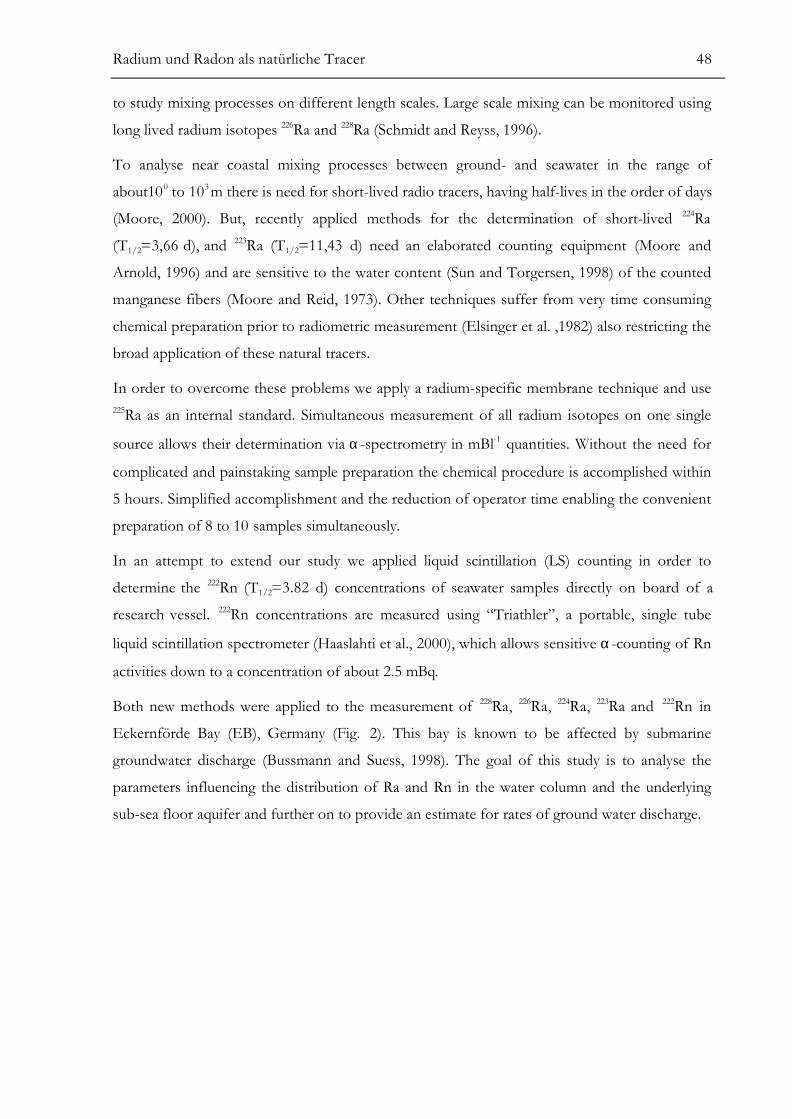
Radium und Radon als natürliche Tracer 48
to study mixing processes on different length scales. Large scale mixing can be monitored using
long lived radium isotopes 226Ra and 228Ra (Schmidt and Reyss, 1996).
To analyse near coastal mixing processes between ground- and seawater in the range of
about100 to 103 m there is need for short-lived radio tracers, having half-lives in the order of days
(Moore, 2000). But, recently applied methods for the determination of short-lived 224Ra
(T1/2=3,66 d), and 223Ra (T1/2=11,43 d) need an elaborated counting equipment (Moore and
Arnold, 1996) and are sensitive to the water content (Sun and Torgersen, 1998) of the counted
manganese fibers (Moore and Reid, 1973). Other techniques suffer from very time consuming
chemical preparation prior to radiometric measurement (Elsinger et al. ,1982) also restricting the
broad application of these natural tracers.
In order to overcome these problems we apply a radium-specific membrane technique and use225Ra as an internal standard. Simultaneous measurement of all radium isotopes on one single
source allows their determination via α-spectrometry in mBl-1 quantities. Without the need for
complicated and painstaking sample preparation the chemical procedure is accomplished within
5 hours. Simplified accomplishment and the reduction of operator time enabling the convenient
preparation of 8 to 10 samples simultaneously.
In an attempt to extend our study we applied liquid scintillation (LS) counting in order to
determine the 222Rn (T1/2=3.82 d) concentrations of seawater samples directly on board of a
research vessel. 222Rn concentrations are measured using “Triathler”, a portable, single tube
liquid scintillation spectrometer (Haaslahti et al., 2000), which allows sensitive α-counting of Rn
activities down to a concentration of about 2.5 mBq.
Both new methods were applied to the measurement of 228Ra, 226Ra, 224Ra, 223Ra and 222Rn in
Eckernförde Bay (EB), Germany (Fig. 2). This bay is known to be affected by submarine
groundwater discharge (Bussmann and Suess, 1998). The goal of this study is to analyse the
parameters influencing the distribution of Ra and Rn in the water column and the underlying
sub-sea floor aquifer and further on to provide an estimate for rates of ground water discharge.
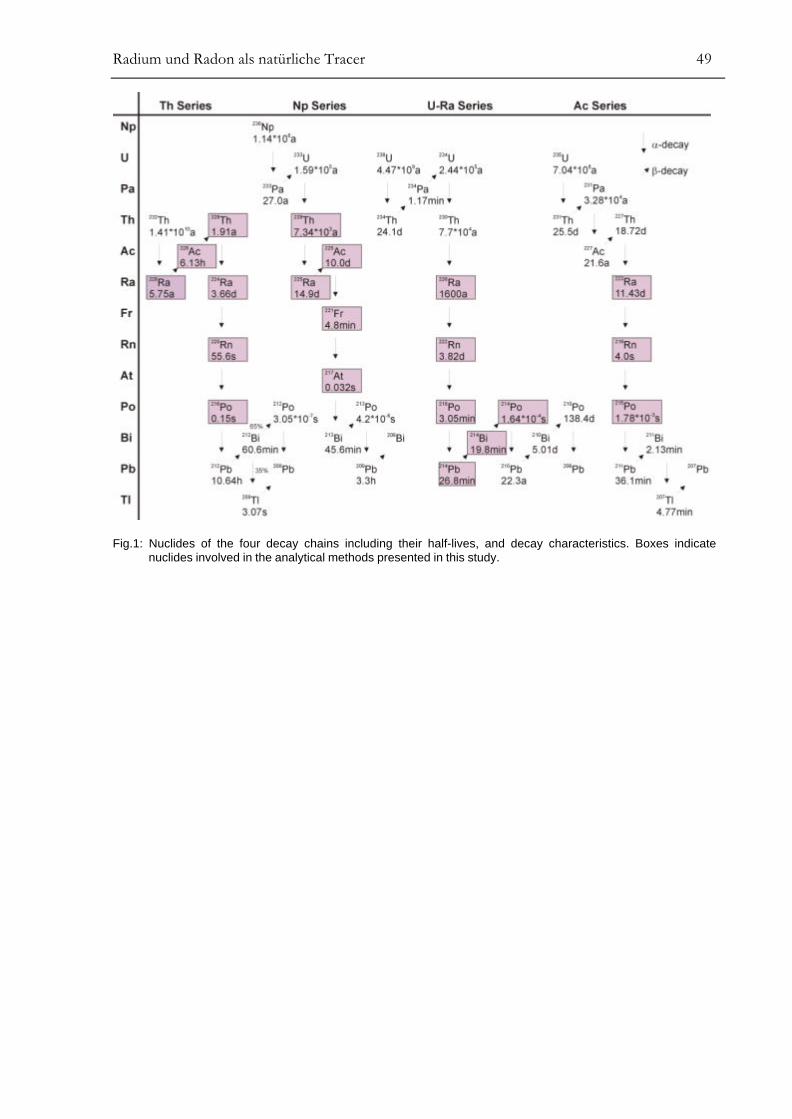
Radium und Radon als natürliche Tracer 49
Fig.1: Nuclides of the four decay chains including their half-lives, and decay characteristics. Boxes indicatenuclides involved in the analytical methods presented in this study.
Radium und Radon als natürliche Tracer 50
2. Location and Sampling
Morphology of EB was largely created during the Scandinavian ice sheet retreat. Main
groundwater aquifers consist of layers of high hydraulic conductivity deposited during the
Pleistocene and the Holocene. The upper boundary of the studied aquifer lies only 4 to 5 meters
below the sea floor (Sauter et al., in press). Within the framework of the EU project
SUB-G.A.T.E. (Submarine Groundwater-fluxes and Transport-processes from methane-rich
coastal sedimentary Environments) diffusive submarine freshwater seepage was mainly observed
near the coast. In bowl-shaped bottom depressions ((pockmarks), (Edgerton et al., 1966)
(Hovland and Judd, 1988)), also observed in greater distance from the shore (Whiticar and
Werner, 1981), salinity degreases downwards to freshwater values as a function of the sediment
depth representing the increasing influence of the groundwater input.
EB water profiling and groundwater monitoring was carried out during seven cruises between
Mai 2000 and September 2001. The deeper water column was sampled at several depths. For
high resolution sampling a horizontal 5 litre water sampler was applied. Standard oceanographic
profiles were taken using a CTD sensor. Typically, the thermocline is observed between 7 and
11 m water depth (not observed in February 2001). In general, the deeper water is poorly
stratified indicating a well mixed water column. During two weeks before sampling no
considerable changes in hydrographic conditions are observed. All Sites are shown in Fig. 2
together with a well onshore, sampled in August 2000.
Pre-investigating the underlying aquifer (1 km off shore), a temporary well was deployed at P2.
The deploying technique is based on a modified sediment vibro corer system, described in detail
by Sauter et al. (in press). The groundwater obtained 4-6 m below the sea floor, was pure
freshwater, indicated by a salinity of 0.2 ‰. For the following long term monitoring a stationary
well was drilled at the same site in November 2000. For both wells a GrundfosTM MP1
submersible pump had been used for groundwater collection.
For Ra analysis sea- and groundwater was pre-filtered through NucleporeTM polycarbonate filters
(diameter ø = 142 mm, 0.4 µm nominal pore width) and directly transferred into five litre PP-
canisters (seawater) and one litre PE-bottles (groundwater) respectively. A certain amount of
nitric acid (w = 65 %) has to be added until, as to achieve a final concentration of about
c(HNO3) = 2 mol-1. After adding a defined amount of a 229Th/225Ra standard solution, the
sample is shaken vigorously several times assuring complete equilibration. Radium analysis is
carried out as described in chapter 3.
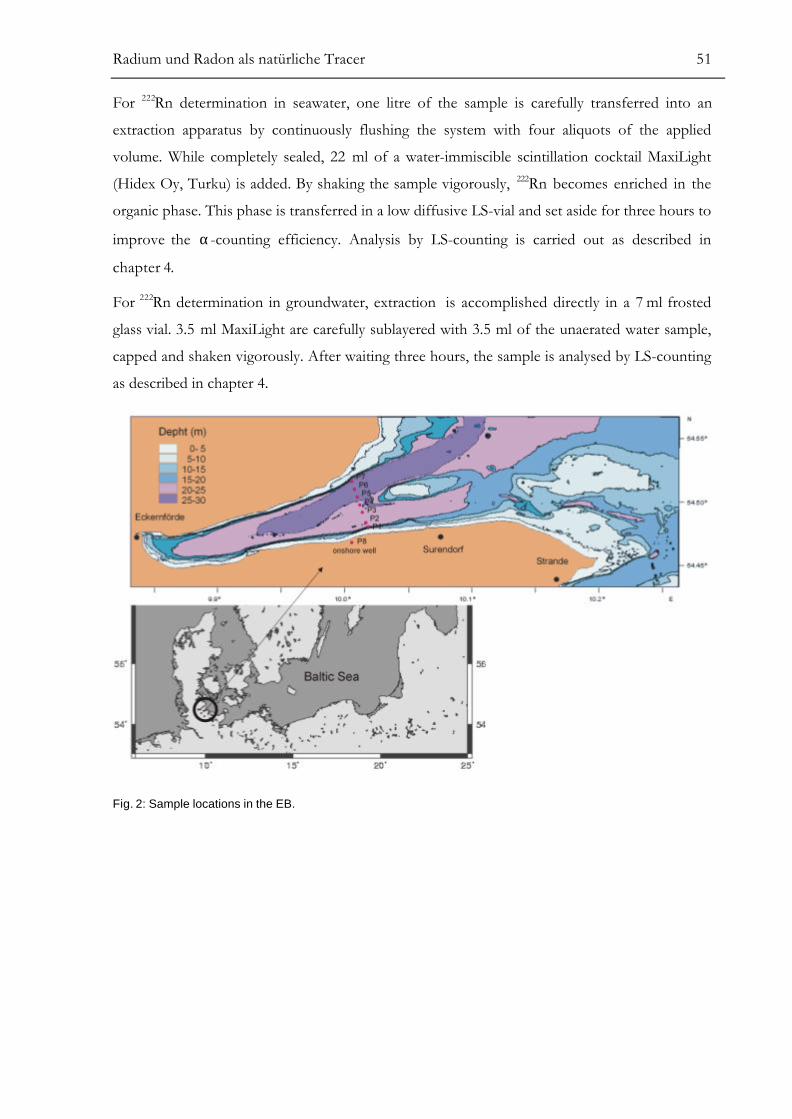
Radium und Radon als natürliche Tracer 51
For 222Rn determination in seawater, one litre of the sample is carefully transferred into an
extraction apparatus by continuously flushing the system with four aliquots of the applied
volume. While completely sealed, 22 ml of a water-immiscible scintillation cocktail MaxiLight
(Hidex Oy, Turku) is added. By shaking the sample vigorously, 222Rn becomes enriched in the
organic phase. This phase is transferred in a low diffusive LS-vial and set aside for three hours to
improve the α-counting efficiency. Analysis by LS-counting is carried out as described in
chapter 4.
For 222Rn determination in groundwater, extraction is accomplished directly in a 7 ml frosted
glass vial. 3.5 ml MaxiLight are carefully sublayered with 3.5 ml of the unaerated water sample,
capped and shaken vigorously. After waiting three hours, the sample is analysed by LS-counting
as described in chapter 4.
Fig. 2: Sample locations in the EB.
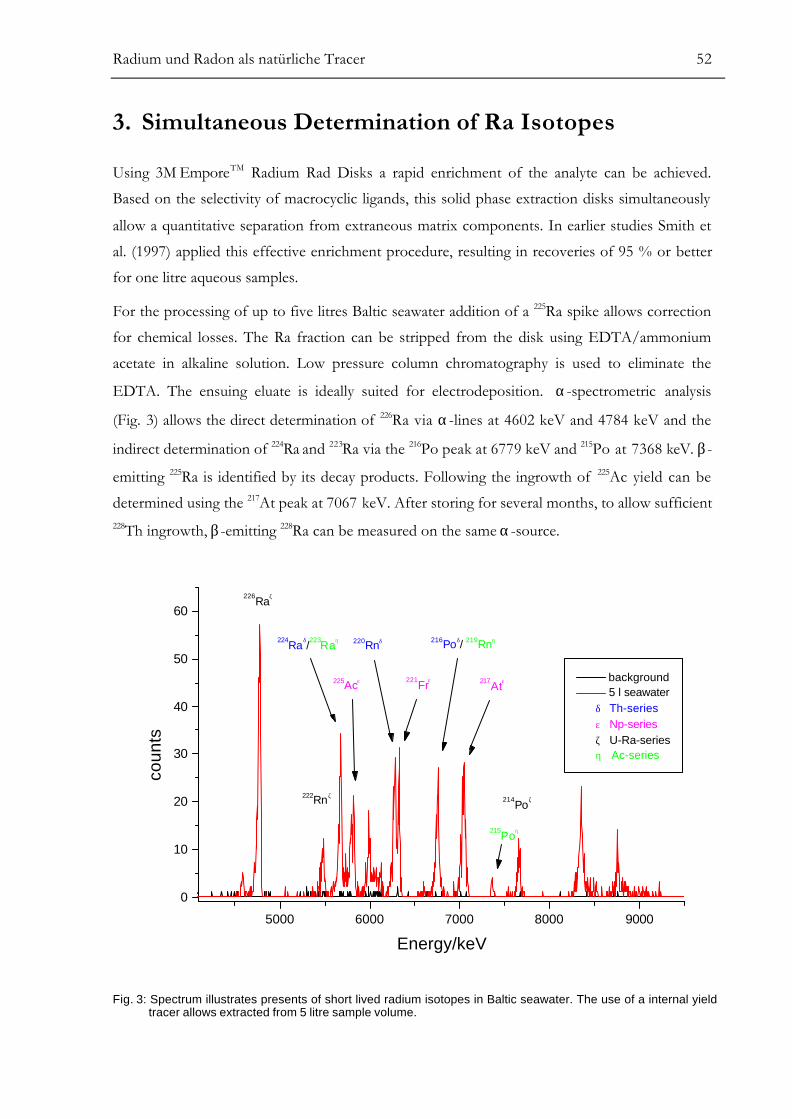
Radium und Radon als natürliche Tracer 52
3. Simultaneous Determination of Ra Isotopes
Using 3M EmporeTM Radium Rad Disks a rapid enrichment of the analyte can be achieved.
Based on the selectivity of macrocyclic ligands, this solid phase extraction disks simultaneously
allow a quantitative separation from extraneous matrix components. In earlier studies Smith et
al. (1997) applied this effective enrichment procedure, resulting in recoveries of 95 % or better
for one litre aqueous samples.
For the processing of up to five litres Baltic seawater addition of a 225Ra spike allows correction
for chemical losses. The Ra fraction can be stripped from the disk using EDTA/ammonium
acetate in alkaline solution. Low pressure column chromatography is used to eliminate the
EDTA. The ensuing eluate is ideally suited for electrodeposition. α-spectrometric analysis
(Fig. 3) allows the direct determination of 226Ra via α-lines at 4602 keV and 4784 keV and the
indirect determination of 224Ra and 223Ra via the 216Po peak at 6779 keV and 215Po at 7368 keV. β-
emitting 225Ra is identified by its decay products. Following the ingrowth of 225Ac yield can be
determined using the 217At peak at 7067 keV. After storing for several months, to allow sufficient228Th ingrowth, β-emitting 228Ra can be measured on the same α-source.
5000 6000 7000 8000 9000
0
10
20
30
40
50
60
214Po
ζ
215Po
η
217At
ε
216Poδ/ 219Rnη
221Fr
ε
220Rnδ
225Acε
222Rnζ
224Ra
δ/223
Raη
226Ra
ζ
background 5 l seawater
δ Th-series ε Np-series ζ U-Ra-series η Ac-series
coun
ts
Energy/keV
Fig. 3: Spectrum illustrates presents of short lived radium isotopes in Baltic seawater. The use of a internal yieldtracer allows extracted from 5 litre sample volume.
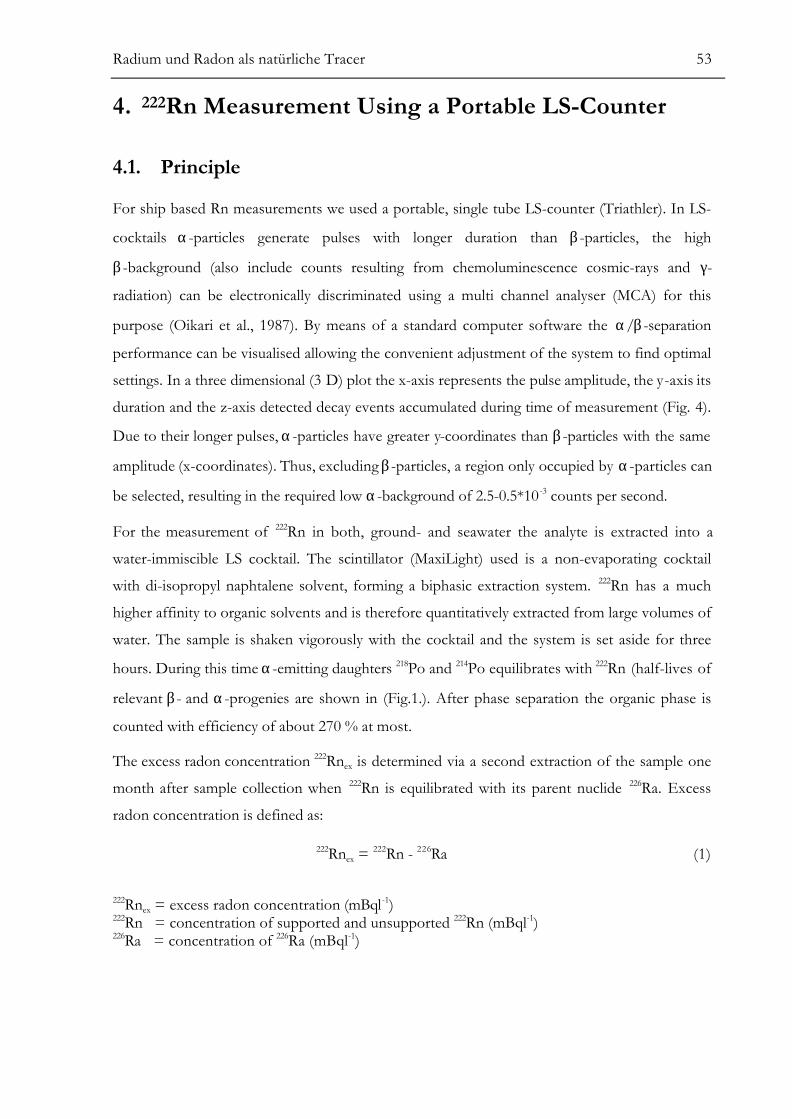
Radium und Radon als natürliche Tracer 53
4. 222Rn Measurement Using a Portable LS-Counter
4.1. Principle
For ship based Rn measurements we used a portable, single tube LS-counter (Triathler). In LS-
cocktails α-particles generate pulses with longer duration than β-particles, the high
β-background (also include counts resulting from chemoluminescence cosmic-rays and γ-
radiation) can be electronically discriminated using a multi channel analyser (MCA) for this
purpose (Oikari et al., 1987). By means of a standard computer software the α/β-separation
performance can be visualised allowing the convenient adjustment of the system to find optimal
settings. In a three dimensional (3 D) plot the x-axis represents the pulse amplitude, the y-axis its
duration and the z-axis detected decay events accumulated during time of measurement (Fig. 4).
Due to their longer pulses, α-particles have greater y-coordinates than β-particles with the same
amplitude (x-coordinates). Thus, excluding β-particles, a region only occupied by α-particles can
be selected, resulting in the required low α-background of 2.5-0.5*10 -3 counts per second.
For the measurement of 222Rn in both, ground- and seawater the analyte is extracted into a
water-immiscible LS cocktail. The scintillator (MaxiLight) used is a non-evaporating cocktail
with di-isopropyl naphtalene solvent, forming a biphasic extraction system. 222Rn has a much
higher affinity to organic solvents and is therefore quantitatively extracted from large volumes of
water. The sample is shaken vigorously with the cocktail and the system is set aside for three
hours. During this time α-emitting daughters 218Po and 214Po equilibrates with 222Rn (half-lives of
relevant β- and α-progenies are shown in (Fig.1.). After phase separation the organic phase is
counted with efficiency of about 270 % at most.
The excess radon concentration 222Rnex is determined via a second extraction of the sample one
month after sample collection when 222Rn is equilibrated with its parent nuclide 226Ra. Excess
radon concentration is defined as:
222Rnex = 222Rn - 226Ra (1)
222Rnex = excess radon concentration (mBql-1)222Rn = concentration of supported and unsupported 222Rn (mBql-1)226Ra = concentration of 226Ra (mBql-1)
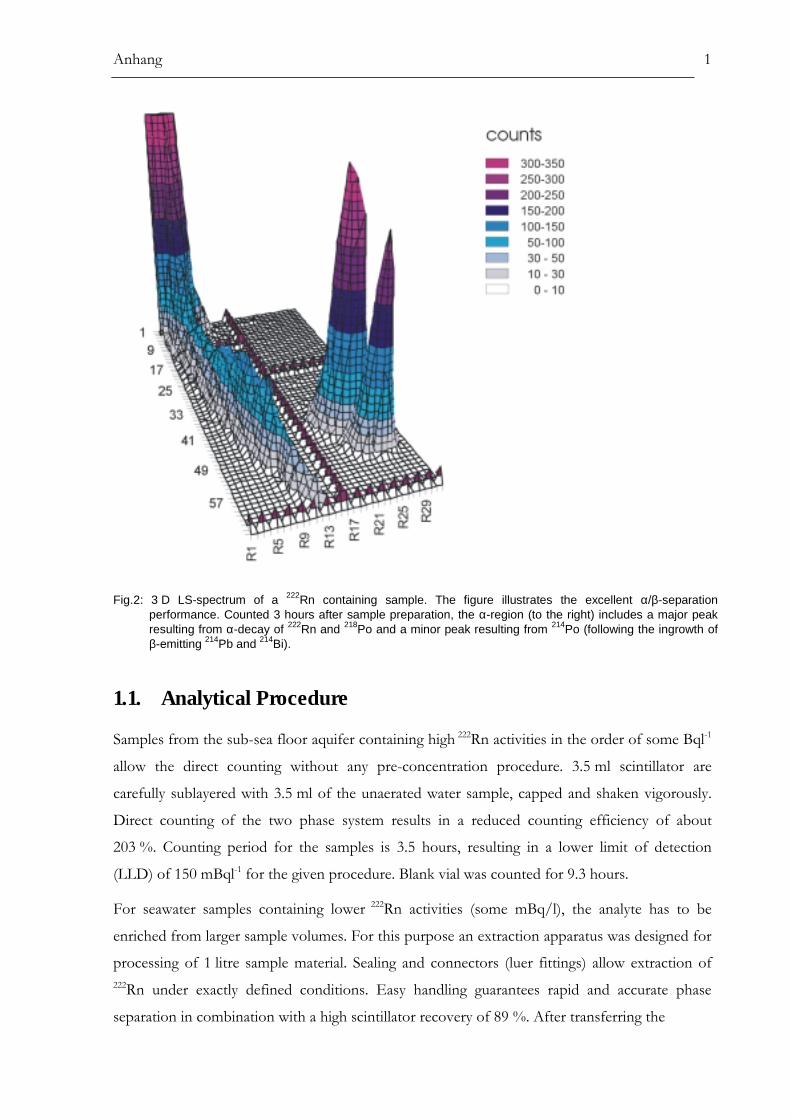
Anhang 1
Fig.2: 3 D LS-spectrum of a 222Rn containing sample. The figure illustrates the excellent α/β-separationperformance. Counted 3 hours after sample preparation, the α-region (to the right) includes a major peakresulting from α-decay of 222Rn and 218Po and a minor peak resulting from 214Po (following the ingrowth ofβ-emitting 214Pb and 214Bi).
1.1. Analytical Procedure
Samples from the sub-sea floor aquifer containing high 222Rn activities in the order of some Bql-1
allow the direct counting without any pre-concentration procedure. 3.5 ml scintillator are
carefully sublayered with 3.5 ml of the unaerated water sample, capped and shaken vigorously.
Direct counting of the two phase system results in a reduced counting efficiency of about
203 %. Counting period for the samples is 3.5 hours, resulting in a lower limit of detection
(LLD) of 150 mBql-1 for the given procedure. Blank vial was counted for 9.3 hours.
For seawater samples containing lower 222Rn activities (some mBq/l), the analyte has to be
enriched from larger sample volumes. For this purpose an extraction apparatus was designed for
processing of 1 litre sample material. Sealing and connectors (luer fittings) allow extraction of222Rn under exactly defined conditions. Easy handling guarantees rapid and accurate phase
separation in combination with a high scintillator recovery of 89 %. After transferring the
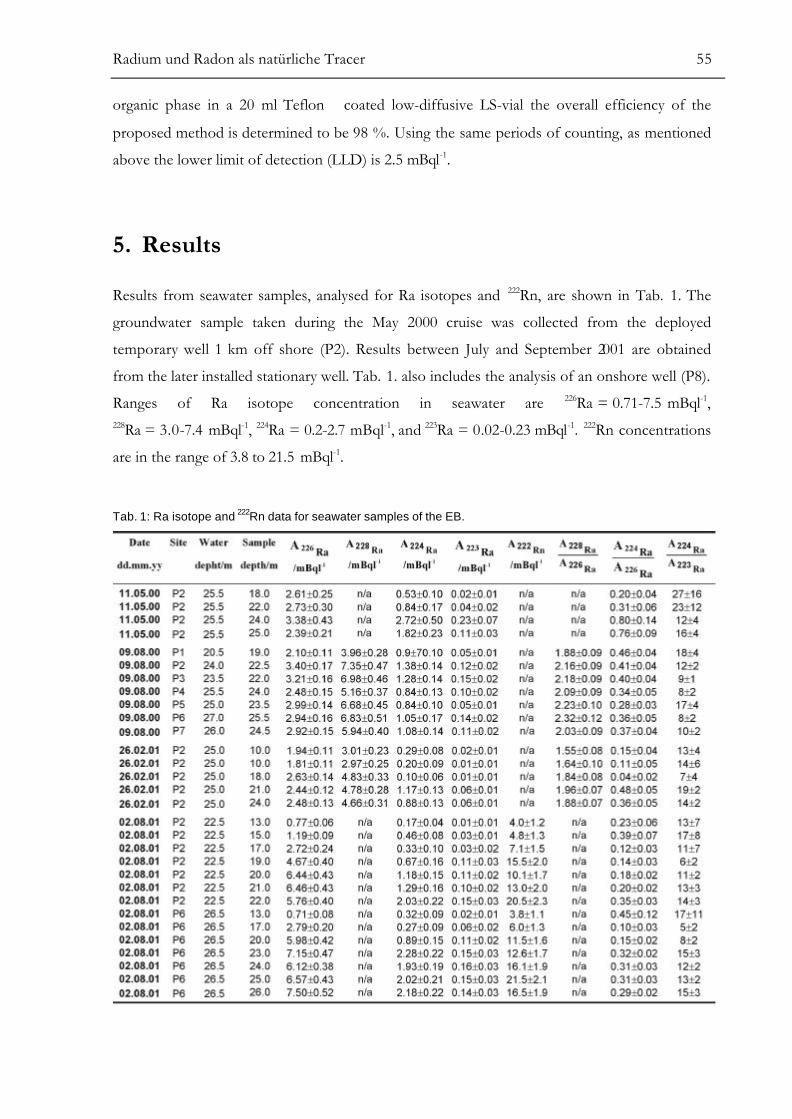
Radium und Radon als natürliche Tracer 55
organic phase in a 20 ml Teflon coated low-diffusive LS-vial the overall efficiency of the
proposed method is determined to be 98 %. Using the same periods of counting, as mentioned
above the lower limit of detection (LLD) is 2.5 mBql-1.
5. Results
Results from seawater samples, analysed for Ra isotopes and 222Rn, are shown in Tab. 1. The
groundwater sample taken during the May 2000 cruise was collected from the deployed
temporary well 1 km off shore (P2). Results between July and September 2001 are obtained
from the later installed stationary well. Tab. 1. also includes the analysis of an onshore well (P8).
Ranges of Ra isotope concentration in seawater are 226Ra = 0.71-7.5 mBql-1,228Ra = 3.0-7.4 mBql-1, 224Ra = 0.2-2.7 mBql-1, and 223Ra = 0.02-0.23 mBql-1. 222Rn concentrations
are in the range of 3.8 to 21.5 mBql-1.
Tab. 1: Ra isotope and 222Rn data for seawater samples of the EB.
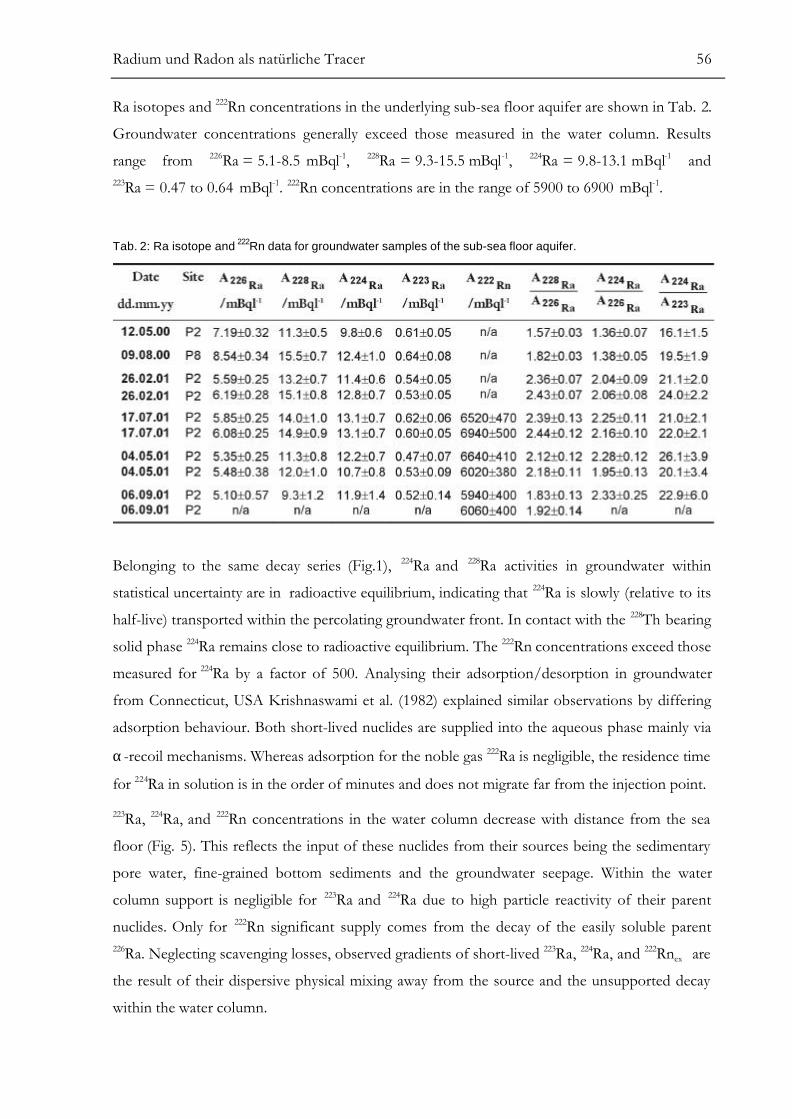
Radium und Radon als natürliche Tracer 56
Ra isotopes and 222Rn concentrations in the underlying sub-sea floor aquifer are shown in Tab. 2.
Groundwater concentrations generally exceed those measured in the water column. Results
range from 226Ra = 5.1-8.5 mBql-1, 228Ra = 9.3-15.5 mBql-1, 224Ra = 9.8-13.1 mBql-1 and223Ra = 0.47 to 0.64 mBql-1. 222Rn concentrations are in the range of 5900 to 6900 mBql-1.
Tab. 2: Ra isotope and 222Rn data for groundwater samples of the sub-sea floor aquifer.
Belonging to the same decay series (Fig.1), 224Ra and 228Ra activities in groundwater within
statistical uncertainty are in radioactive equilibrium, indicating that 224Ra is slowly (relative to its
half-live) transported within the percolating groundwater front. In contact with the 228Th bearing
solid phase 224Ra remains close to radioactive equilibrium. The 222Rn concentrations exceed those
measured for 224Ra by a factor of 500. Analysing their adsorption/desorption in groundwater
from Connecticut, USA Krishnaswami et al. (1982) explained similar observations by differing
adsorption behaviour. Both short-lived nuclides are supplied into the aqueous phase mainly via
α-recoil mechanisms. Whereas adsorption for the noble gas 222Ra is negligible, the residence time
for 224Ra in solution is in the order of minutes and does not migrate far from the injection point.
223Ra, 224Ra, and 222Rn concentrations in the water column decrease with distance from the sea
floor (Fig. 5). This reflects the input of these nuclides from their sources being the sedimentary
pore water, fine-grained bottom sediments and the groundwater seepage. Within the water
column support is negligible for 223Ra and 224Ra due to high particle reactivity of their parent
nuclides. Only for 222Rn significant supply comes from the decay of the easily soluble parent226Ra. Neglecting scavenging losses, observed gradients of short-lived 223Ra, 224Ra, and 222Rnex are
the result of their dispersive physical mixing away from the source and the unsupported decay
within the water column.
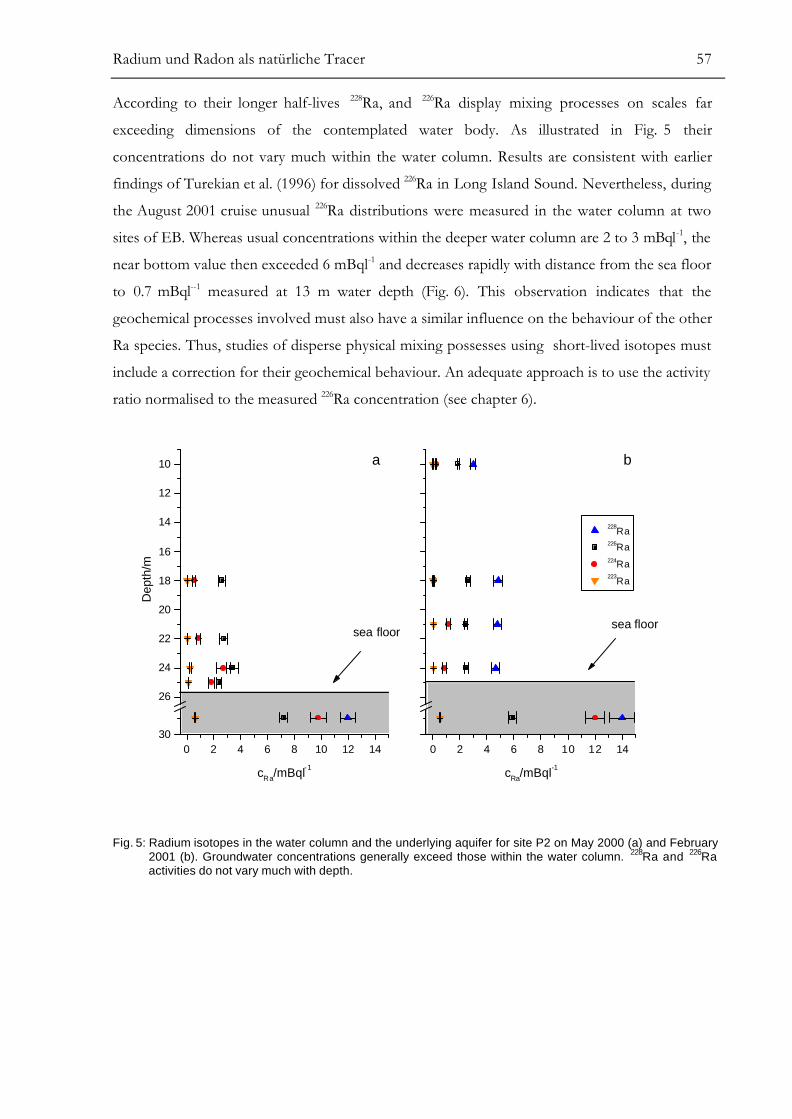
Radium und Radon als natürliche Tracer 57
According to their longer half-lives 228Ra, and 226Ra display mixing processes on scales far
exceeding dimensions of the contemplated water body. As illustrated in Fig. 5 their
concentrations do not vary much within the water column. Results are consistent with earlier
findings of Turekian et al. (1996) for dissolved 226Ra in Long Island Sound. Nevertheless, during
the August 2001 cruise unusual 226Ra distributions were measured in the water column at two
sites of EB. Whereas usual concentrations within the deeper water column are 2 to 3 mBql-1, the
near bottom value then exceeded 6 mBql-1 and decreases rapidly with distance from the sea floor
to 0.7 mBql--1 measured at 13 m water depth (Fig. 6). This observation indicates that the
geochemical processes involved must also have a similar influence on the behaviour of the other
Ra species. Thus, studies of disperse physical mixing possesses using short-lived isotopes must
include a correction for their geochemical behaviour. An adequate approach is to use the activity
ratio normalised to the measured 226Ra concentration (see chapter 6).
30
26
24
22
20
18
16
14
12
10
0 2 4 6 8 10 12 14
a
sea floor
228Ra
226Ra224Ra223
Ra
cRa/mBql-1
Dep
th/m
0 2 4 6 8 10 12 14
b
sea floor
cRa/mBql-1
Fig. 5: Radium isotopes in the water column and the underlying aquifer for site P2 on May 2000 (a) and February2001 (b). Groundwater concentrations generally exceed those within the water column. 228Ra and 226Raactivities do not vary much with depth.
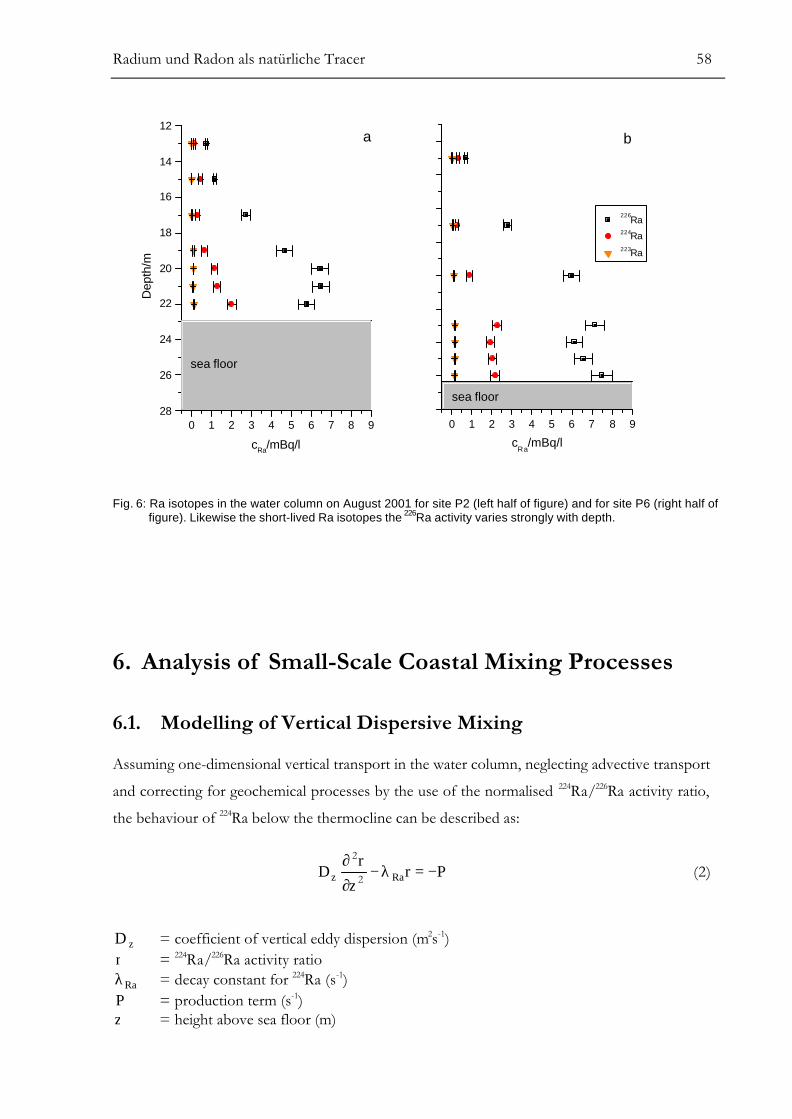
Radium und Radon als natürliche Tracer 58
28
26
24
22
20
18
16
14
12
0 1 2 3 4 5 6 7 8 9
a
sea floor
226Ra
224Ra223Ra
cRa/mBq/l
Dep
th/m
0 1 2 3 4 5 6 7 8 9
b
sea floor
cRa
/mBq/l
Fig. 6: Ra isotopes in the water column on August 2001 for site P2 (left half of figure) and for site P6 (right half offigure). Likewise the short-lived Ra isotopes the 226Ra activity varies strongly with depth.
6. Analysis of Small-Scale Coastal Mixing Processes
6.1. Modelling of Vertical Dispersive Mixing
Assuming one-dimensional vertical transport in the water column, neglecting advective transport
and correcting for geochemical processes by the use of the normalised 224Ra/226Ra activity ratio,
the behaviour of 224Ra below the thermocline can be described as:
Prz
rD Raz −=λ−
∂
∂2
2
(2)
zD = coefficient of vertical eddy dispersion (m2s-1)r = 224Ra/226Ra activity ratio
Raλ = decay constant for 224Ra (s-1)P = production term (s-1)z = height above sea floor (m)
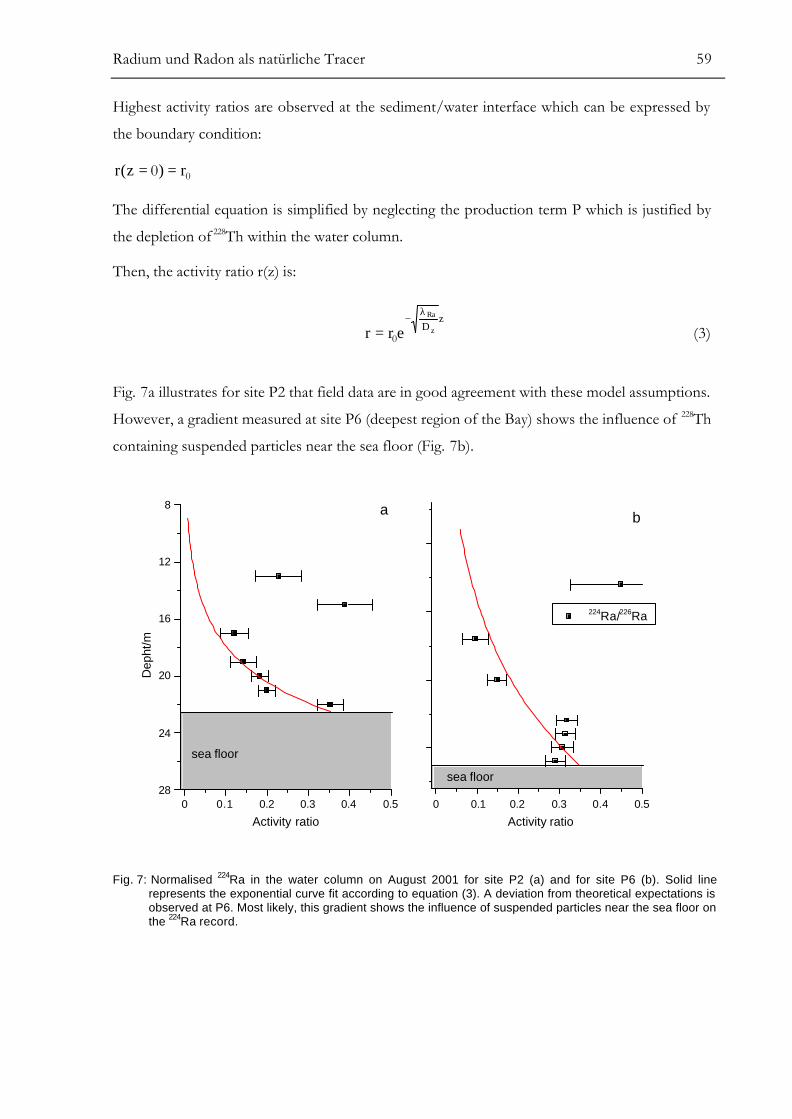
Radium und Radon als natürliche Tracer 59
Highest activity ratios are observed at the sediment/water interface which can be expressed by
the boundary condition:
00 r)z(r ==
The differential equation is simplified by neglecting the production term P which is justified by
the depletion of 228Th within the water column.
Then, the activity ratio r(z) is:
zD z
Ra
errλ
−= 0 (3)
Fig. 7a illustrates for site P2 that field data are in good agreement with these model assumptions.
However, a gradient measured at site P6 (deepest region of the Bay) shows the influence of 228Th
containing suspended particles near the sea floor (Fig. 7b).
28
24
20
16
12
8
0 0.50.5 0.40.4 0.30.3 0.20.2 0.10.10
a
sea floor
224Ra/226Ra
Activity ratio
Dep
ht/m
b
sea floor
Activity ratio
Fig. 7: Normalised 224Ra in the water column on August 2001 for site P2 (a) and for site P6 (b). Solid linerepresents the exponential curve fit according to equation (3). A deviation from theoretical expectations isobserved at P6. Most likely, this gradient shows the influence of suspended particles near the sea floor onthe 224Ra record.
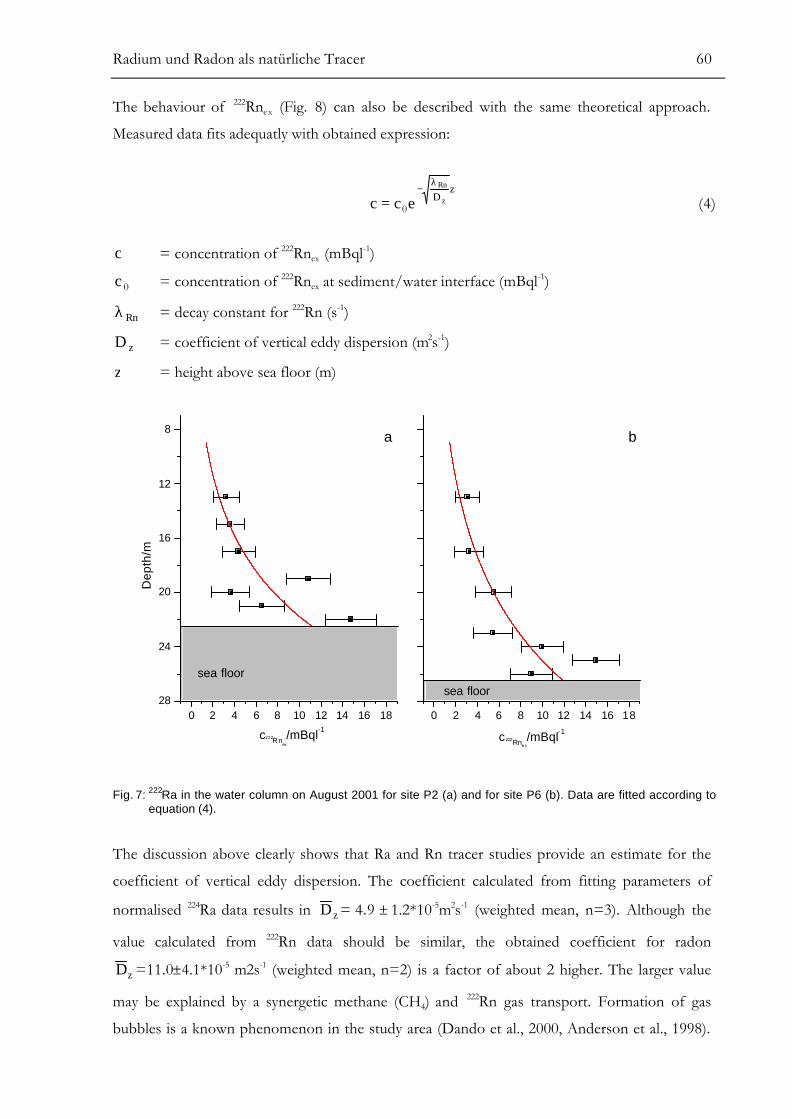
Radium und Radon als natürliche Tracer 60
The behaviour of 222Rnex (Fig. 8) can also be described with the same theoretical approach.
Measured data fits adequatly with obtained expression:
zD z
Rn
eccλ
−= 0 (4)
c = concentration of 222Rnex (mBql-1)
0c = concentration of 222Rnex at sediment/water interface (mBql-1)
Rnλ = decay constant for 222Rn (s-1)
zD = coefficient of vertical eddy dispersion (m2s-1)
z = height above sea floor (m)
28
24
20
16
12
8
0 2 4 6 8 10 12 14 16 18
a
sea floor
c222Rnex
/mBql-1
Dep
th/m
0 2 4 6 8 10 12 14 16 18
b
sea floor
c 222Rne x/mBql-1
Fig. 7: 222Ra in the water column on August 2001 for site P2 (a) and for site P6 (b). Data are fitted according toequation (4).
The discussion above clearly shows that Ra and Rn tracer studies provide an estimate for the
coefficient of vertical eddy dispersion. The coefficient calculated from fitting parameters of
normalised 224Ra data results in zD = 4.9 ± 1.2*10-5m2s-1 (weighted mean, n=3). Although the
value calculated from 222Rn data should be similar, the obtained coefficient for radon
zD =11.0±4.1*10-5 m2s-1 (weighted mean, n=2) is a factor of about 2 higher. The larger value
may be explained by a synergetic methane (CH4) and 222Rn gas transport. Formation of gas
bubbles is a known phenomenon in the study area (Dando et al., 2000, Anderson et al., 1998).
Radium und Radon als natürliche Tracer 61
Thus, it can be supposed that methane gas acting as a carrier and supports a rapid transport of222Rn within the water column when compared to the Ra.
6.2. Modelling of Horizontal Dispersive Mixing
To provide an estimate of the coefficient Dx for horizontal diffusive dispersion, field data of the
transect through the EB, collected during the August 2000 cruise, are compared to the best fit
obtained from solving the general differential equation (2) for horizontal transport in the deep
water near the sea floor. Solving the second order inhomogeneous differential equation is
simplified using an appropriate co-ordinate system:
• The distance between intersection points of the near coastal 20 m iso-line of water depth and
the transect-line are defined as total length of the system (4100 m).
• The centre of the transect is defined as x = 0.
• The co-ordinate of the southern intersection point is x = -L.
• The co-ordinate of the northern intersection point is x = L.
Adequate model assumptions are:
• constant sediment production term, 0=∂∂xP
• influence by groundwater discharge/freshly eroded deposits primarily from the coast
• equal quantities of 224Ra discharged from both sides of the Bay
Searching for a symmetrical function a promising Ansatz to solve the homogeneous part of the
equation is:
xD
xD
sxx BeAer
λ−
λ
+= (5)
Radium und Radon als natürliche Tracer 62
Inserting into equation (2) gives the general solution:
λ++=
λ−
λP
BeAerx
Dx
D xx (6)
With the boundary conditions:
maxr)Lx(r =±=
minr)x(r == 0
the following equation is obtained describing the horizontal mixing behaviour of 224Ra near the
sea floor:
2−+
+−+=
−−
λ−
λ
λ−
λλ−
λ
)ee(
)ee()ee(rr
)x(rr
LD
LD
xD
xD
LD
LD
minmax
max
xx
xxxx
(7)
Choosing values of rmax = 0.42 and rmin = 0.30 adapted from measured 224Ra/226Ra activity ratios
(Tab. 1) and varying the value for Dx in the range of 10-2 - 5*101 m2s-1 the quality of obtained
fitting results is improved by increasing the values chosen for Dx. Fig. 9 illustrates that all fits
using values of Dx ≥ 100 m2s-1 are generally in good agreement with the measured data. As curves
for Dx = 5*100 m2s-1 and Dx = 5*101 m2s-1 are already almost identical, the graph also depicts
that, due to geological settings, the used model is only sensitive for values of Dx ≤ 100 m2s-1. This
leads to the estimate of Dx= 100 m2s-1 as lower-limit value of the coefficient for horizontal eddy
dispersion.
Torgersen et al. (1996) analysed the movement of 224Ra in the deep water of Long Island Sound
and observed maximal 224Ra activities in the centre of the Bay. Different geological settings lead
to improved sensitivity for Dx ≥ 100 m2s-1. Thus, the reported upper limit 5*101 m2s-1 is certainly
a good approximation and can also be considered as conservative estimate regarding horizontal
eddy dispersion in the EB.
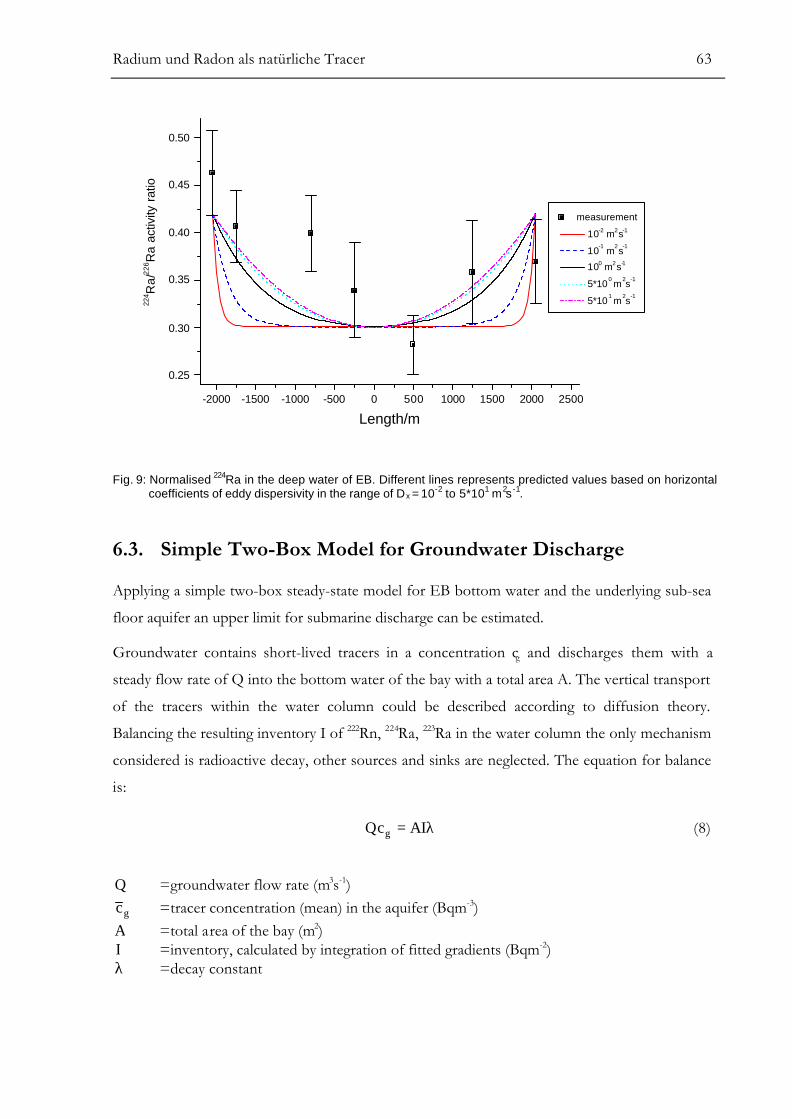
Radium und Radon als natürliche Tracer 63
-2000 -1500 -1000 -500 0 500 1000 1500 2000 2500
0.50
0.45
0.40
0.35
0.30
0.25
measurement
10-2 m2s-1
10-1 m
2s
-1
100 m2s-1
5*100 m
2s
-1
5*101 m
2s
-1
224 R
a/22
6 Ra
activ
ity r
atio
Length/m
Fig. 9: Normalised 224Ra in the deep water of EB. Different lines represents predicted values based on horizontalcoefficients of eddy dispersivity in the range of Dx = 10-2 to 5*101 m2s -1.
6.3. Simple Two-Box Model for Groundwater Discharge
Applying a simple two-box steady-state model for EB bottom water and the underlying sub-sea
floor aquifer an upper limit for submarine discharge can be estimated.
Groundwater contains short-lived tracers in a concentration cg and discharges them with a
steady flow rate of Q into the bottom water of the bay with a total area A. The vertical transport
of the tracers within the water column could be described according to diffusion theory.
Balancing the resulting inventory I of 222Rn, 224Ra, 223Ra in the water column the only mechanism
considered is radioactive decay, other sources and sinks are neglected. The equation for balance
is:
λ= AIQcg (8)
Q =groundwater flow rate (m3s-1)
gc =tracer concentration (mean) in the aquifer (Bqm-3)A =total area of the bay (m2)I =inventory, calculated by integration of fitted gradients (Bqm-2)λ =decay constant
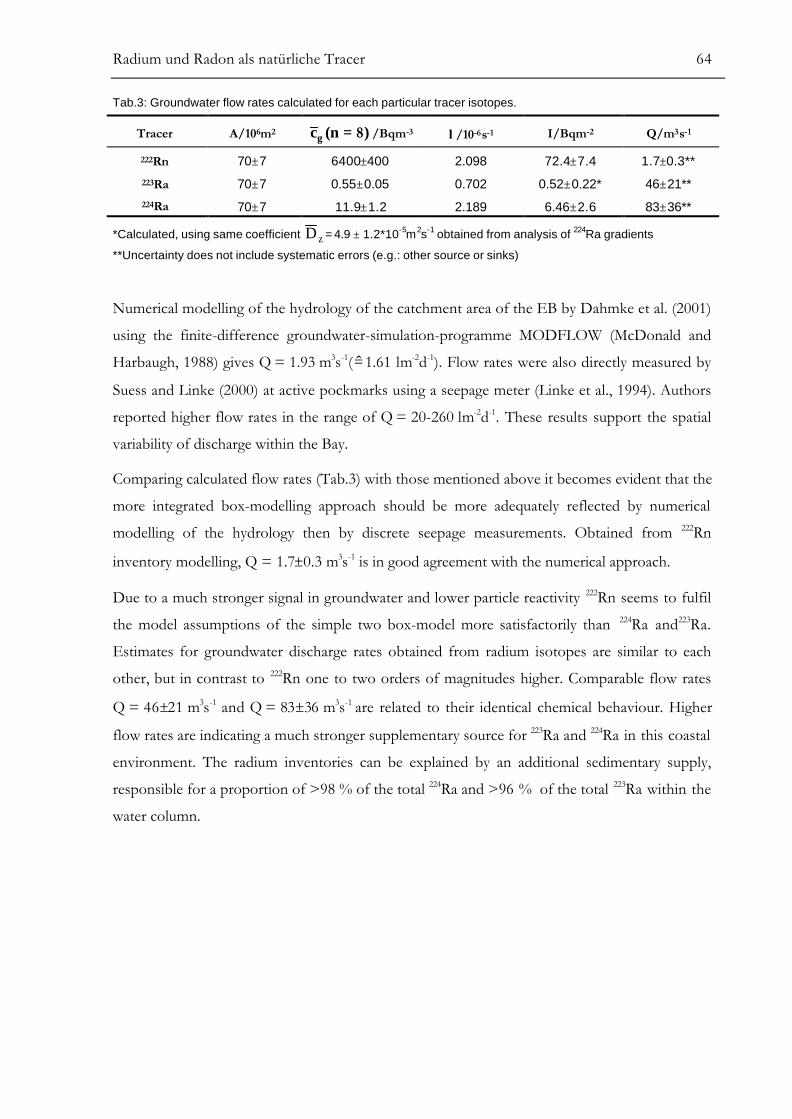
Radium und Radon als natürliche Tracer 64
Tab.3: Groundwater flow rates calculated for each particular tracer isotopes.
Tracer A/106m2 )n(cg 8= /Bqm-3 λ/10-6s-1 I/Bqm-2 Q/m3s-1
222Rn 70±7 6400±400 2.098 72.4±7.4 1.7±0.3**
223Ra 70±7 0.55±0.05 0.702 0.52±0.22* 46±21**224Ra 70±7 11.9±1.2 2.189 6.46±2.6 83±36**
*Calculated, using same coefficient zD = 4.9 ± 1.2*10-5m2s-1 obtained from analysis of 224Ra gradients
**Uncertainty does not include systematic errors (e.g.: other source or sinks)
Numerical modelling of the hydrology of the catchment area of the EB by Dahmke et al. (2001)
using the finite-difference groundwater-simulation-programme MODFLOW (McDonald and
Harbaugh, 1988) gives Q = 1.93 m3s-1( = 1.61 lm-2d-1). Flow rates were also directly measured by
Suess and Linke (2000) at active pockmarks using a seepage meter (Linke et al., 1994). Authors
reported higher flow rates in the range of Q = 20-260 lm-2d-1. These results support the spatial
variability of discharge within the Bay.
Comparing calculated flow rates (Tab.3) with those mentioned above it becomes evident that the
more integrated box-modelling approach should be more adequately reflected by numerical
modelling of the hydrology then by discrete seepage measurements. Obtained from 222Rn
inventory modelling, Q = 1.7±0.3 m3s-1 is in good agreement with the numerical approach.
Due to a much stronger signal in groundwater and lower particle reactivity 222Rn seems to fulfil
the model assumptions of the simple two box-model more satisfactorily than 224Ra and223Ra.
Estimates for groundwater discharge rates obtained from radium isotopes are similar to each
other, but in contrast to 222Rn one to two orders of magnitudes higher. Comparable flow rates
Q = 46±21 m3s-1 and Q = 83±36 m3s-1 are related to their identical chemical behaviour. Higher
flow rates are indicating a much stronger supplementary source for 223Ra and 224Ra in this coastal
environment. The radium inventories can be explained by an additional sedimentary supply,
responsible for a proportion of >98 % of the total 224Ra and >96 % of the total 223Ra within the
water column.
Radium und Radon als natürliche Tracer 65
7. Summary and Conclusion
Analytical methods presented here are ideally suited for the determination of all four natural
radium isotopes and 222Rn in the near coastal marine environment. Samples can be easily
processed without delay even on restricted conditions aboard small marine research vessels. By
sampling the water column and the underlying sub-sea floor aquifer of EB results demonstrate
the use of short lived natural tracers to study small scale mixing processes. Dispersive physical
mixing acting over the time scale in the order of days are responsible for the distribution of223Ra, 224Ra and 222Rn in the EB. Measured variations in the concentrations depend on the
distance from the source. The distribution of the used tracers is controlled by the strength of the
sediment source, the influence of the direct groundwater input, the dispersive mixing coefficient
in the water column and it own radioactive decay.
In this particular marine environment seepage of pure freshwater with salinity of 0.2‰
promotes adsorption of radium onto sediment particles within the aquifer and thus the tracer
does not migrate far from the point of injection. Due to increased mobility 222Rn provide a much
stronger groundwater signal. The obtained 222Rn discharge rates are in agreement with
hydrogeological modelling. To balance measured 223Ra and 224Ra inventories, in distinction to
radon measurements, there is need for a strong additional source. Based one the calculated flow
rate Q = 1.7±0.3 m3s-1, a supply from sediment must be responsible for a proportion of >98 %224Ra and >96 % 223Ra.
Radium und Radon als natürliche Tracer 66
References
Anderson, A. L., Abegg, F., Hawkins, J. A., Duncan, M. E., Lyons, A. P., 1998. Bubblepopulations and acoustic interaction with the gassy floor of Eckernförde Bay. Cont. ShelfRes. 18, 1807-1838.
Bollinger, M. S., Moore, W. S., 1993. Evaluation of salt marsh hydrology using radium as a tracer.Geochim. Cosmochim. Acta 57, 2203-2212.
Bussmann, I., Suess, E., 1998. Groundwater seepage in Eckernförde Bay (Western Baltic Sea):effect on methane and salinity distribution of the water column. Cont. ShelfRes. 18, 1795-1806.
Cable, J. E., Burnett, W. C., Chanton, J. P., Weatherly, G. L., 1996. Estimating groundwaterdischarge into the northeastern Gulf of Mexico using radon-222. Earth Planet. Sci.Lett. 144, 591-604.
Dahmke, A., Piotrowski, J. A., Marczinek, S., 2001. Hydrogeology of the catchment area ofEckernförde Bay. Sub-Gate, Final sum. report. Kiel, Germany, Part B.
Dando, P.R., Rees, E. I. S., Dando, M. A. Schlüter, M. Sauter, E. J., 2000. Methane ventingassociated with submarine groundwater discharge in Eckerförde Bucht; Baltic Sea. 6th Int.Conf. on Gas in Marine Sediments-Geology-Chemistry-Mircobiology-Applications, St.Petersburg.
Edgerton, H., Seibold, E., Vollbrecht, K., Werner, F., 1966. Morphologische Untersuchungen amMittelgrund (Eckernförde Bucht, westliche Ostsee). Meyniana 16, 37-50.
Elsinger, R. J., King, P. T., Moore, W. S., 1982. 224Ra in natural waters measured by γ-rayspectrometry. Anal. Chem. Acta 144, 227-281.
Haaslahti, J.,Aalto, J., Oikari, T., 2000. A portable liquid scintillation counter for general LSC andhigh sensitivity alpha-counting applications. J. Radioanal. Nucl. Chem. Art. 243, 377-381.
Hancock, G. J. and Murray, A. S., 1996. Source and distribution of dissolved radium in the BegaRiver estuary, southeastern Australia. Earth Planet. Sci. Lett. 138, 145-155.
Hovland, M. and Judd, A. G. 1988. Seabed pockmarks and seepages: impact on geology, biologyand the marine environment. Graham & Trotman.
Kandriche, A., Werner, F., 1995. Freshwater-induced pockmarks in Bay of Eckernförde, WesternBaltic. Proc. 3rd Marine Geol. Conf. “The Baltic”,155-164.
Krishnaswami, S., Graustein, W. C., Turekian, K. K., Dowd, J. F., 1982. Radium, thorium andradioactive lead isotopes in groundwaters; application to the in situ determination ofadsorption-desorption rate constants and retardation factors. Water Resour.Res. 18, 1663-1675.
Li, Y. H., 1977. The flux of 226Ra from estuarine and continental shelf sediments. Earth Planet.Sci. Lett. 37, 237-241.
Radium und Radon als natürliche Tracer 67
Linke, P., Suess, E., Torres, M., Martens, V., Rugh, W. D., Ziebis, W., Kulm, L. D., 1994. In situmeasurement of fluid flow from cold seeps at active continental margins. Deep-SeaRes. 41, 721-739.
McDonald, M. C., Harbaugh, A. W., 1988. MODFLOW, A modular three-dimensional finitedifference ground-water flow model, U.S. Geological Survey, Open-filereport 83-875, Chapter A1.
Moore, W. S., 1996. Large groundwater inputs to coastal waters revealed by 226Ra enrichments.Nature 380, 612-614.
Moore, W. S., 2000. Ages of continental shelf waters determined from 223Ra and 224Ra.J. Geophys. Res. 105, 22117-22122.
Moore, W. S., Reid, D. F., 1973. Extraction of Radium from Natural Waters Using Manganese-Impregnated Acrylic Fibers. J. Geophys. Res. 78, 8880-8886.
Moore, W. S., Arnold, R., 1996. Measurement of 223Ra and 224Ra in coastal waters using a delayedcoincidence counter. J. Geophys. Res. 101, 1321-1329.
Oikari, T., Kojola, H., Nurmi, J. Kaihola, L., 1987. Simultaneous counting of low alpha- and beta-particle activities with liquid-scintillation spectrometry and pulse shape analysis. Int. J. Appl.Radiat. Isot. 38 : 875–878
Rama, Moore, W. S., 1996. Using the radium quartet for evaluating groundwater input and waterexchange in salt marshes. Geochim. Cosmochim. Acta 60, 4645-4652.
Sauter, E. J., Laier, T., Andersen, C. E., Dahlgaard, H. Schlüter, M., (in press) Sampling of sub-sea floor aquifers by a temporary well for CFC dating and natural tracer investigations. J. SeaRes.
Schmidt, S., Reyss, J. L., 1996. Radium as internal tracer of Mediterranean Outflow Water. J.Geophys. Res. 101, 3589-3595.
Smith, L. L., Alvarado, J. S., Markun, F. J., Hoffmann, K. M., Seely, D.C., Shannon, R.T., 1997.An evaluation of radium-specific, solid phase extraction membranes, Radioac.Radiochem. 8, 30.
Suess, E., Linke, P., 2000. Continuous monitoring of fluid flow at vent sites. Sub-Gate, SummaryProgress Report (End of year 2). Kiel, Germany, Part B.
Sun, Y., Torgersen, T., 1998. The effects of water content and Mn-fiber surface conditions on224Ra measurement by 220Rn emanation. Mar. Chem. 62, 299-306.
Torgersen, T., Turekian, K. K., Turekian, V. C., Tanaka, N., DeAngelo, E., and O`Donnell, J.,1996. 224Ra distribution in surface and deep water of Long Island Sound; sources andhorizontal transport rates. Cont. Shelf Res. 16, 1545-1559.
Turekian, K. K., Tanaka, N., Turekian, V. C., Torgersen, T., and Deangelo, E. C., 1996. Transferrates of dissolved tracers through estuaries based on 228Ra; a study of Long Island Sound.Cont. Shelf Res. 16, 863-873.
Whiticar, M., Werner, F., 1981. Pockmarks: Submarine vents of natural gas or freshwater seeps?.Geo Marine Lett. 1, 193-199.
Neuanmeldung zum Gebrauchsmuster 68
Kapitel IV. Neuanmeldung zum Gebrauchsmuster
Vorrichtung zur Extraktion von Stoffen von einer
Membran
Stefan Purkl und Anton Eisenhauer
Neuanmeldung zum Gebrauchsmuster 69
Neuanmeldung zum Gebrauchsmuster 70
Neuanmeldung zum Gebrauchsmuster 71
Neuanmeldung zum Gebrauchsmuster 72
Neuanmeldung zum Gebrauchsmuster 73
Neuanmeldung zum Gebrauchsmuster 74
Neuanmeldung zum Gebrauchsmuster 75
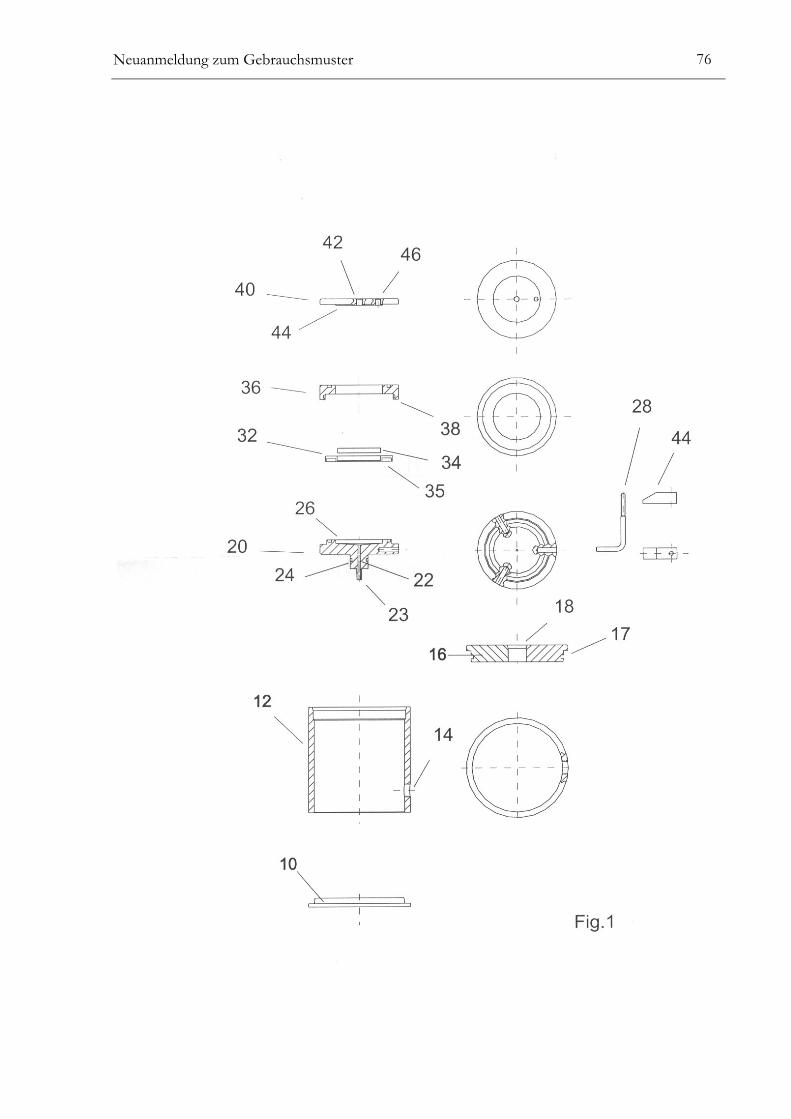
Neuanmeldung zum Gebrauchsmuster 76
Zusammenfassung 77
Zusammenfassung
Diese Arbeit stellt durch die Entwicklung und Anwendung neuer analytischer Methoden zur
schnellen Bestimmung von kurzlebigen Radiumisotopen und Radon im
grundwasserbeeinflussten Milieu der Ostsee einen Beitrag zur Untersuchung von küstennahen
Mischungsprozessen dar.
Die Kombination der ionenselektiven Membrantechnik mit der Sensitivität der α-Spektrometrie
stellt die geforderte einfache Messbarkeit für alle Radiumisotope sicher. Durch die Verwendung
von EmporeTM Radium Rad Disks kann der Analyt sehr effizient angereichert werden. Die
durchgeführten α- und γ-spektrometrischen Untersuchungen zeigen, dass neben anderen
störenden Matrixkomponenten auch Thorium nicht auf der Membrane festgehalten wird. Bei
der Extraktion von 229Th/225Ra-Lösungen werden Separationsfaktoren von etwa 200 erreicht.
Damit ergibt sich die einfache Verwendung von 225Ra als interner Standard zur
Radiumbestimmung.
Das neue Verfahren konnte so optimiert werden, dass eine Bestimmung der α-strahlenden
Radiumisotope 223Ra, 224Ra und 226Ra innerhalb von 5 Stunden Aufarbeitungszeit möglich ist. Die
erzielten Ausbeuten betrugen mit diesem Verfahren bis zu 92±9 %. Durch die Reduktion
zeitaufwendiger Analyseschritte können 8 bis 10 Proben gleichzeitig aufgearbeitet werden. Die
Anzahl der vorhandenen α-Messplätze limitiert den Probendurchsatz, der innerhalb von etwa 5
Tagen (mittlere Lebensdauer von 224Ra) zu erreichen ist.
Zusammen mit der Bestimmung von Radon über Flüssigszintillationsmesstechnik konnten die
neuen Verfahren erfolgreich für die Analyse von küstennahen Mischungsprozessen eingesetzt
werden. Der Einfluss submariner Grundwasseraustritte auf das Verhalten und den Transport
von kurzlebigen Radiumisotopen und Radon im küstennahen Bereich wurde am Beispiel der
Eckernförder Bucht studiert. Bedingt durch die geringe Mobilität von Radium im betrachteten
Grundwasserleiter ist die Hauptquelle für die kurzlebigen Isotope die Freisetzung aus den
Sedimenten. Die gewonnenen Felddaten erlauben die Beschreibung der Tracerverteilung von223Ra 224Ra und 222Rn in der Wassersäule über diffusive Modellansätze. In Übereinstimmung mit
hydrogeologischen Untersuchungen im Einzugsgebiet der Eckernförder Bucht konnten
weiterhin submarine Ausstromraten von 1,7±0,3 m3s-1 quantifiziert werden.
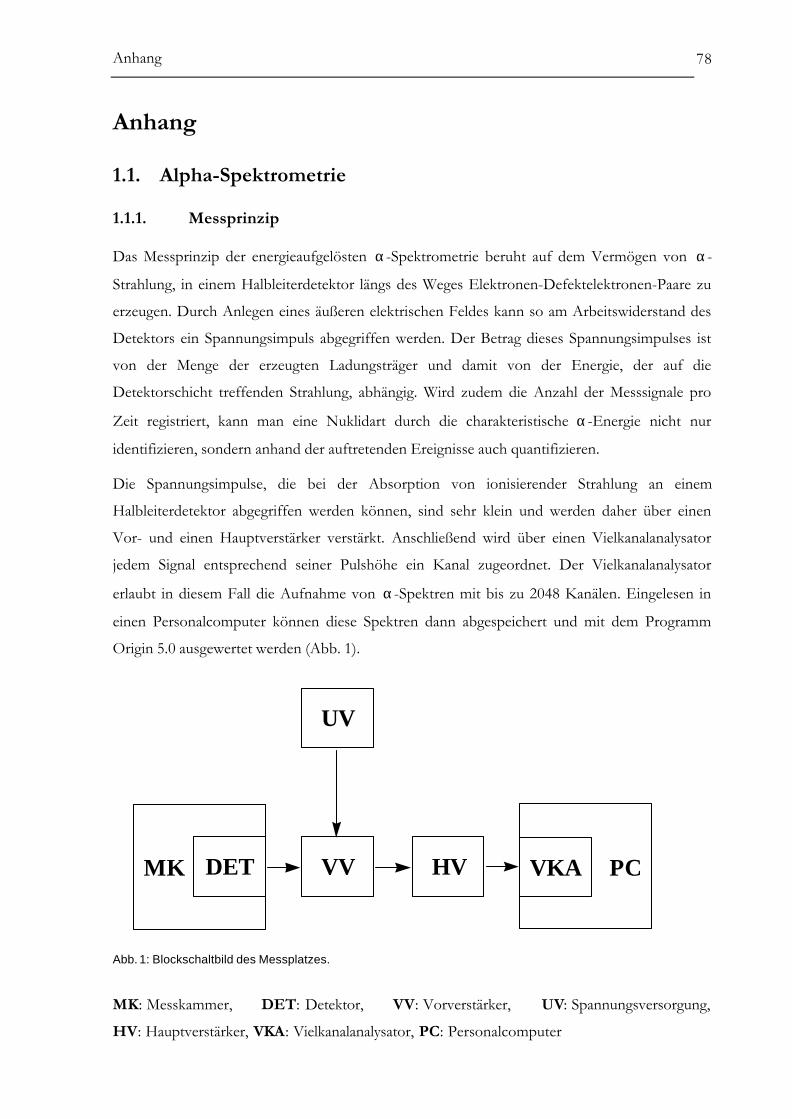
Anhang 78
Anhang
1.1. Alpha-Spektrometrie
1.1.1. Messprinzip
Das Messprinzip der energieaufgelösten α-Spektrometrie beruht auf dem Vermögen von α-
Strahlung, in einem Halbleiterdetektor längs des Weges Elektronen-Defektelektronen-Paare zu
erzeugen. Durch Anlegen eines äußeren elektrischen Feldes kann so am Arbeitswiderstand des
Detektors ein Spannungsimpuls abgegriffen werden. Der Betrag dieses Spannungsimpulses ist
von der Menge der erzeugten Ladungsträger und damit von der Energie, der auf die
Detektorschicht treffenden Strahlung, abhängig. Wird zudem die Anzahl der Messsignale pro
Zeit registriert, kann man eine Nuklidart durch die charakteristische α-Energie nicht nur
identifizieren, sondern anhand der auftretenden Ereignisse auch quantifizieren.
Die Spannungsimpulse, die bei der Absorption von ionisierender Strahlung an einem
Halbleiterdetektor abgegriffen werden können, sind sehr klein und werden daher über einen
Vor- und einen Hauptverstärker verstärkt. Anschließend wird über einen Vielkanalanalysator
jedem Signal entsprechend seiner Pulshöhe ein Kanal zugeordnet. Der Vielkanalanalysator
erlaubt in diesem Fall die Aufnahme von α-Spektren mit bis zu 2048 Kanälen. Eingelesen in
einen Personalcomputer können diese Spektren dann abgespeichert und mit dem Programm
Origin 5.0 ausgewertet werden (Abb. 1).
UV
HVVVDETMK VKA PC
Abb. 1: Blockschaltbild des Messplatzes.
MK: Messkammer, DET: Detektor, VV: Vorverstärker, UV: Spannungsversorgung,
HV: Hauptverstärker, VKA: Vielkanalanalysator, PC: Personalcomputer
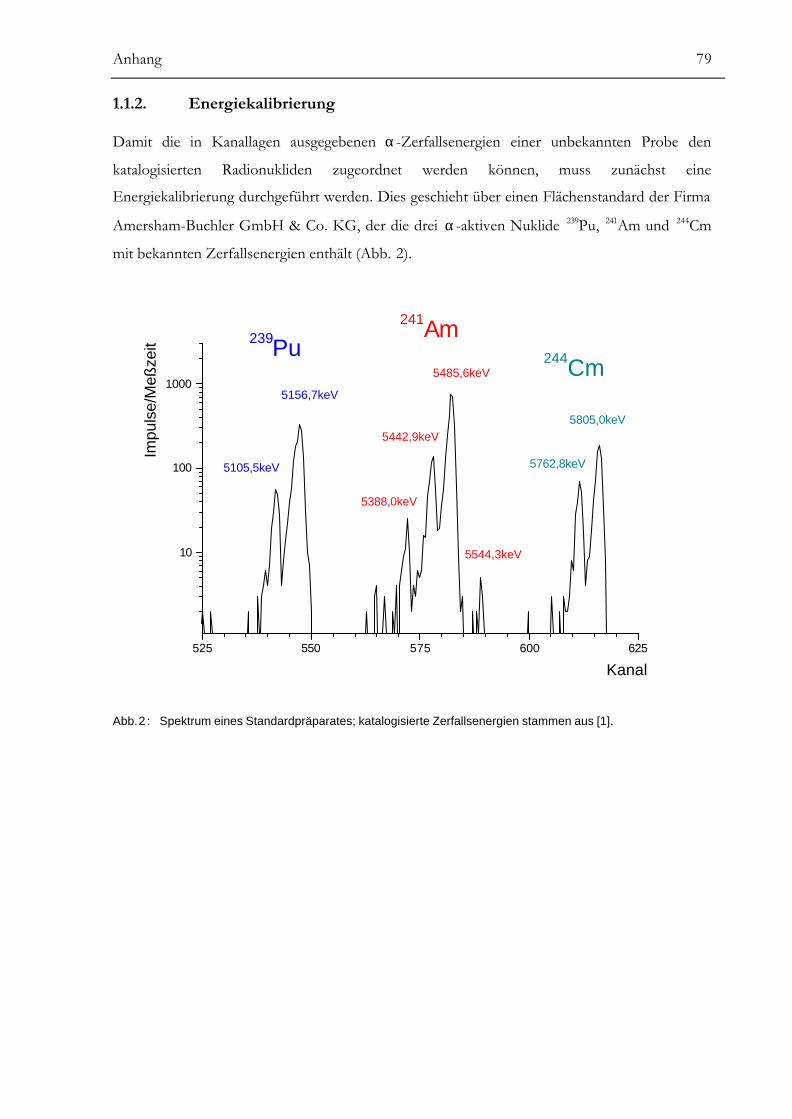
Anhang 79
1.1.2. Energiekalibrierung
Damit die in Kanallagen ausgegebenen α-Zerfallsenergien einer unbekannten Probe den
katalogisierten Radionukliden zugeordnet werden können, muss zunächst eine
Energiekalibrierung durchgeführt werden. Dies geschieht über einen Flächenstandard der Firma
Amersham-Buchler GmbH & Co. KG, der die drei α-aktiven Nuklide 239Pu, 241Am und 244Cm
mit bekannten Zerfallsenergien enthält (Abb. 2).
525 550 575 600 625
10
100
1000
5805,0keV
5762,8keV
244Cm
5544,3keV
5485,6keV
5442,9keV
5388,0keV
5156,7keV
5105,5keV
241Am239Pu
Impu
lse/
Meß
zeit
Kanal
Abb. 2 : Spektrum eines Standardpräparates; katalogisierte Zerfallsenergien stammen aus [1].
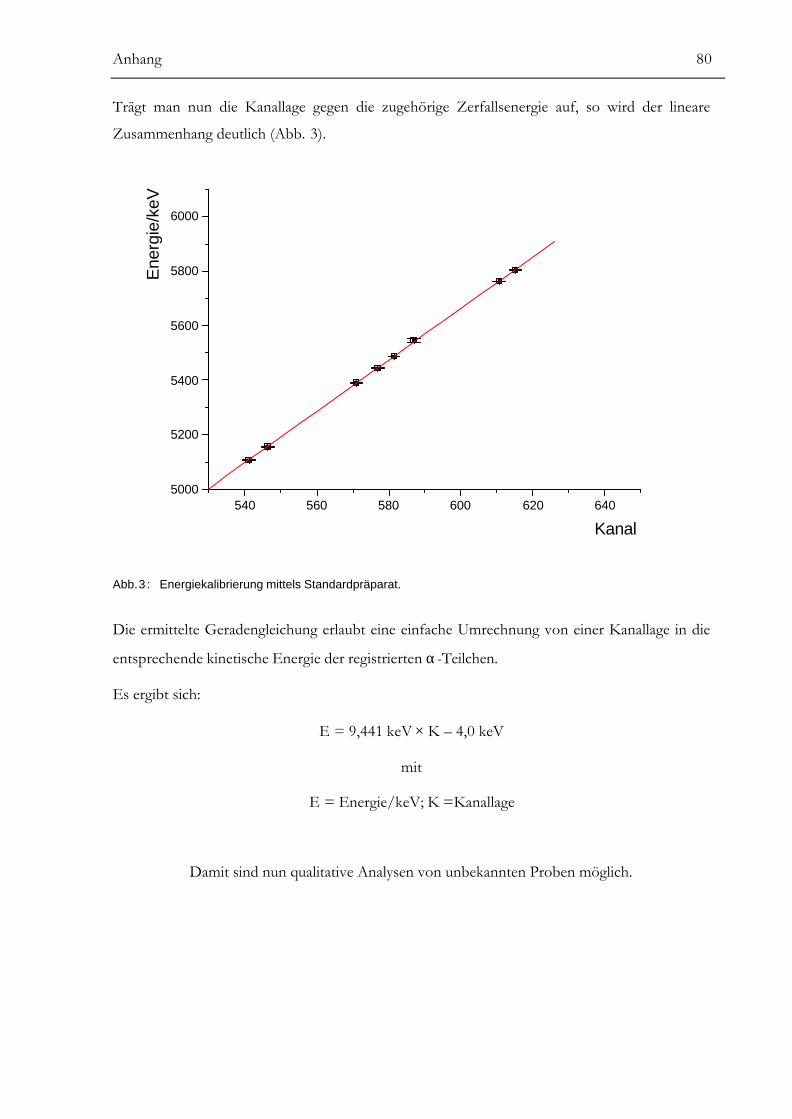
Anhang 80
Trägt man nun die Kanallage gegen die zugehörige Zerfallsenergie auf, so wird der lineare
Zusammenhang deutlich (Abb. 3).
540 560 580 600 620 6405000
5200
5400
5600
5800
6000
Ene
rgie
/keV
Kanal
Abb. 3 : Energiekalibrierung mittels Standardpräparat.
Die ermittelte Geradengleichung erlaubt eine einfache Umrechnung von einer Kanallage in die
entsprechende kinetische Energie der registrierten α-Teilchen.
Es ergibt sich:
E = 9,441 keV × K – 4,0 keV
mit
E = Energie/keV; K =Kanallage
Damit sind nun qualitative Analysen von unbekannten Proben möglich.
Anhang 81
1.1.3. Probenpräparation
Die α-Spektrometrie ist ein sehr sensitives analytisches Werkzeug und damit hervorragend zur
Spurenanalyse geeignet, doch stellt sie hohe Anforderungen an die Probenpräparation.
Emittierte Heliumkerne wechselwirken aufgrund ihrer hohen Ladung besonders stark mit
Materie und verlieren dabei sehr schnell ihre kinetische Energie. Absorption der α-Strahlung in
der Probenmatrix führt dazu, dass Messsignale eines Radionuklides auch bei wesentlich
niedrigeren Energien registriert werden. Dieses „low-energy tailing“ kann bei dicken Proben die
qualitative/quantitative Auswertung des aufgenommenen Spektrums erschweren, bzw.
unmöglich machen. Besondere Maßnahmen sind daher nötig, um dünne Präparate und somit
eine ausreichende Energieauflösung zu erreichen. Dies sind z.B.:
• Anreicherung des Analyten
• Abtrennung der inaktiven Probenmatrix
• Abtrennung störender Radionuklide
• Herstellung eines Messpräparates mit homogener Analytverteilung
1.1.4. Herstellung des Messpräparats
Es existieren verschiedene Möglichkeiten, Proben mit möglichst dünner und homogener
Analytverteilung herzustellen. Ein Maß für die Güte des hergestellten Präparates ist die Breite
des Energieintervalls, betrachtet zwischen den beiden Halbwerten der maximalen
Zählereignishöhe. Die Energieauflösung wird üblicherweise als FWHM (Full-Width-at-Half-
Maximum)-Wert in keV angegeben.
Eine gute Zusammenstellung der angewendeten Techniken zur Herstellung von Messpräparaten
findet sich in [2]. Die dargestellten Methoden Vakuumsublimation, Evaporation und
Elektrodeposition haben gemeinsam, dass der praktisch gewichtslose Analyt auf ein Substrat mit
einer perfekt glatten Oberfläche [3] (meist Platin, Tantal oder polierter Edelstahl) gebracht wird.
Für die Analyse von Umweltproben ist die Probenpräparation mittels Elektrodeposition jedoch
besonders vorteilhaft, da hier gute Energieauflösungen bei gleichzeitig minimalen
Aufarbeitungsverlusten erzielt werden. Durch Anlegen einer Spannung wird in einer meist
wässrigen Elektrolytlösung ein pH-Gradient erzeugt. Die Radionuklide scheiden sich dann als
Hydroxide auf der Kathode, in der Regel polierter Edelstahl, ab. Es ist zu beachten, dass die
Deposition kein Reinigungsschritt ist. Verunreinigungen der Elektrolytlösung mit aktiven und
inaktiven Metallionen führen ebenfalls zu deren Abscheidung und damit zu einer erschwerten
Auswertung.
Anhang 82
1.1.5. Interner Standard
Bei der gewählten 2π Messgeometrie treffen nie 50% der α-Partikel die sensitive Oberfläche des
Detektors [4]. Die Zählausbeute hängt von der Größe des verwendeten Detektors, der
Verteilung des Analyten auf dem Träger, dem gewählten Abstand aber auch von den
stattfindenden Rückstoß- und Absorptionsprozessen in der Probe ab. Absolutbestimmungen
von Aktivitäten sind daher nur schwer möglich, zumal bei Umweltanalysen durch die
notwendige chemische Aufarbeitung immer mit Aktivitätsverlusten zu rechnen ist. Einen
Ausweg bietet das Benutzen eines internen Standards (engl. Spike oder Tracer genannt). Als
Spike werden manchmal chemisch verwandte Elemente, meist jedoch Radioisotope verwendet,
die unter den gegebenen Bedingungen gleiches chemisches Verhalten aufweisen wie der zu
bestimmende Analyt. Der interne Standard wird der Probe vor Beginn der Analyse hinzugefügt.
Ist die Aktivität des Standards zu diesem Zeitpunkt bekannt, spielen Verluste während der
chemischen Aufbereitung und die Abhängigkeit der Zählausbeute von der Geometrie der
Messanordnung keine Rolle. Bei der Spektrenauswertung kann durch Vergleich der Peakflächen
von eingesetztem, internem Standard zum Analyt dessen absolute Aktivität bestimmt werden.
1.1.6. Nulleffekt
Im Gegensatz zu γ-Strahlung ist α-Strahlung nicht in der Lage, die Wände der Messkammer zu
durchdringen. Die trotzdem auftretenden Nulleffektzählraten stammen im wesentlichen von der
Kontamination des Detektors und des Kammerinneren aus vorangegangene Messungen. Bei der
Probenpräparation ist daher darauf zur achten, dass das Präparat mechanisch stabil ist und keine
flüssigen Bestandteile enthält, die beim Anlegen des Vakuums explosionsartig sieden und zum
Verspritzen des aktiven Materials führen. Die Proben sollten außerdem in nicht zu geringem
Abstand vom Detektor gemessen werden. Zwar ist für kurze Abstände die Zählausbeute höher,
doch steigt damit auch die Gefahr einer Detektorkontamination durch Cluster, die beim α-
Zerfall infolge von Rückstoßprozessen aus der Probe herausgeschleudert werden. Eine effektive
Dekontamination ist oft nicht möglich, da sowohl saure als auch alkalische Bedingungen zur
Zerstörung der empfindlichen Detektoroberfläche führen. Für Messpräparate mit Aktivitäten
zwischen 10 mBq und 1 Bq wird ein Abstand von 1,6 cm gewählt. Präparate mit höheren
Aktivitäten sollten in größerem Abstand gemessen werden. Die Nulleffektzählrate beeinflusst
die Messgenauigkeit. Hohe Zählraten lassen die Nachweisgrenzen ansteigen. Eine über einen
langen Zeitraum bestimmte Nulleffektzählrate vergrößert die Sicherheit, registrierte
Zählereignisse dem Untergrund zuzuordnen, die Nachweisgrenzen sinken dadurch.
Üblicherweise werden Untergrundspektren mit Messzeiten von 3–10 Tagen aufgenommen. Bei
der Analyse einer α-Probe werden die auf die Meßzeit normierten Ereignisse des Nulleffekts
von den durch Probe und Untergrund verursachten Impulsen subtrahiert.
Anhang 83
1.1.7. Erkennungs- und Nachweisgrenzen
Die Berechnung von Nachweis- und Erkennungsgrenzen wird durchgeführt, um die
Leistungsfähigkeit des verwendeten Analyseverfahrens zu kennen. Wenn in Messpräparaten z.B.
kein Analyt nachgewiesen werden konnte, gelingt mit diesen Grenzwerten eine Abschätzung der
maximalen Analytkonzentration in der Probe. Erkennungs- und Nachweisgrenzen für die α-
spektrometrischen Messungen wurden gemäß Literatur [5] berechnet; sie sind auf die DIN-
Norm 25482 Teil 1 [6] zurückzuführen. Die folgenden Gleichungen, die auf der Annahme einer
Poisson- bzw. Normalverteilung der gemessenen Ereignisse beruhen, stellen für die Praxis
brauchbare Näherungen für die Berechnung dar.
Erkennungsgrenze
Die Erkennungsgrenze wird berechnet, um feststellen zu können, ob eine gemessene Zählrate
neben Untergrundereignissen auch Ereignisse aus der Probe enthält. Die Aussage des Vorliegens
eines Probenbeitrags ist bei Anwendung von Gleichung (1) mit der Wahrscheinlichkeit a falsch.
Deswegen muss a für eine konservative Abschätzung möglichst klein sein.
+++
ε=
ε=ϕ=
−α
−
α ma
a*n*
nA*
tt
ktZ
tIk
IZ
ZG 021
00
0
21 1
411
2(1)
*G =Erkennungsgrenze (Bq)Aϕ =Kalibrierfaktor*nZ =Nettozählrate für die Berechnung der Erkennungsgrenze (I s-1)
ε =geometrische Effizienz des verwendeten MesssystemsαI =Intensität des betrachteten α-Übergangs
ak −1 =Quantil der Normalverteilung; für a=1 % beträgt der Wert für ak −1 =2,326
0Z =Nulleffektzählrate (I s-1)
0t =Messdauer der Nulleffektmessung (s)
mt =Messdauer der Probe (s)
Für die α-spektrometrische 226Ra-Bestimmung mit dem in dieser Arbeit verwendeten
Messsystem mussten üblicherweise die folgenden Werte in die Gleichung eingesetzt werden:
0Z =13*10-6 I s-1, ε =32%, αI =100 %, 0t =1000000, mt =250000 s, ak −1 =2,326
Die angegebene Nulleffektzählrate bezieht sich auf den gesamten Energiebereich, in dem
α-Teilchen des 226Ra registriert werden können. Durch das Einsetzen der Werte in die Gleichung
wird für 226Ra eine allein auf das Messsystem bezogene Erkennungsgrenze von 0,07 mBq
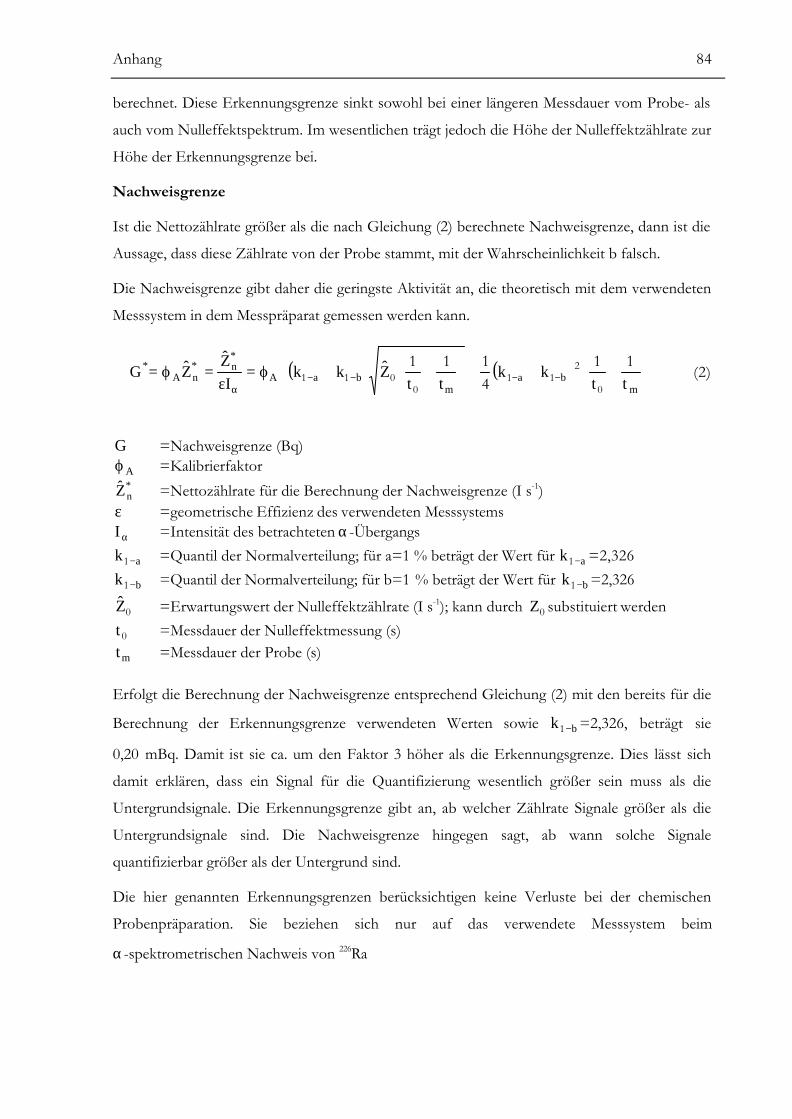
Anhang 84
berechnet. Diese Erkennungsgrenze sinkt sowohl bei einer längeren Messdauer vom Probe- als
auch vom Nulleffektspektrum. Im wesentlichen trägt jedoch die Höhe der Nulleffektzählrate zur
Höhe der Erkennungsgrenze bei.
Nachweisgrenze
Ist die Nettozählrate größer als die nach Gleichung (2) berechnete Nachweisgrenze, dann ist die
Aussage, dass diese Zählrate von der Probe stammt, mit der Wahrscheinlichkeit b falsch.
Die Nachweisgrenze gibt daher die geringste Aktivität an, die theoretisch mit dem verwendeten
Messsystem in dem Messpräparat gemessen werden kann.
( ) ( )
+++
++ϕ=
ε=ϕ= −−−−
α mba
mbaA
*n*
nA*
ttkk
ttZkk
IZ
ZG11
4111
0
211
0011 (2)
G =Nachweisgrenze (Bq)Aϕ =Kalibrierfaktor*nZ =Nettozählrate für die Berechnung der Nachweisgrenze (I s-1)
ε =geometrische Effizienz des verwendeten MesssystemsαI =Intensität des betrachteten α-Übergangs
ak −1 =Quantil der Normalverteilung; für a=1 % beträgt der Wert für ak −1 =2,326
bk −1 =Quantil der Normalverteilung; für b=1 % beträgt der Wert für bk −1 =2,326
0Z =Erwartungswert der Nulleffektzählrate (I s-1); kann durch 0Z substituiert werden
0t =Messdauer der Nulleffektmessung (s)
mt =Messdauer der Probe (s)
Erfolgt die Berechnung der Nachweisgrenze entsprechend Gleichung (2) mit den bereits für die
Berechnung der Erkennungsgrenze verwendeten Werten sowie bk −1 =2,326, beträgt sie
0,20 mBq. Damit ist sie ca. um den Faktor 3 höher als die Erkennungsgrenze. Dies lässt sich
damit erklären, dass ein Signal für die Quantifizierung wesentlich größer sein muss als die
Untergrundsignale. Die Erkennungsgrenze gibt an, ab welcher Zählrate Signale größer als die
Untergrundsignale sind. Die Nachweisgrenze hingegen sagt, ab wann solche Signale
quantifizierbar größer als der Untergrund sind.
Die hier genannten Erkennungsgrenzen berücksichtigen keine Verluste bei der chemischen
Probenpräparation. Sie beziehen sich nur auf das verwendete Messsystem beim
α-spektrometrischen Nachweis von 226Ra
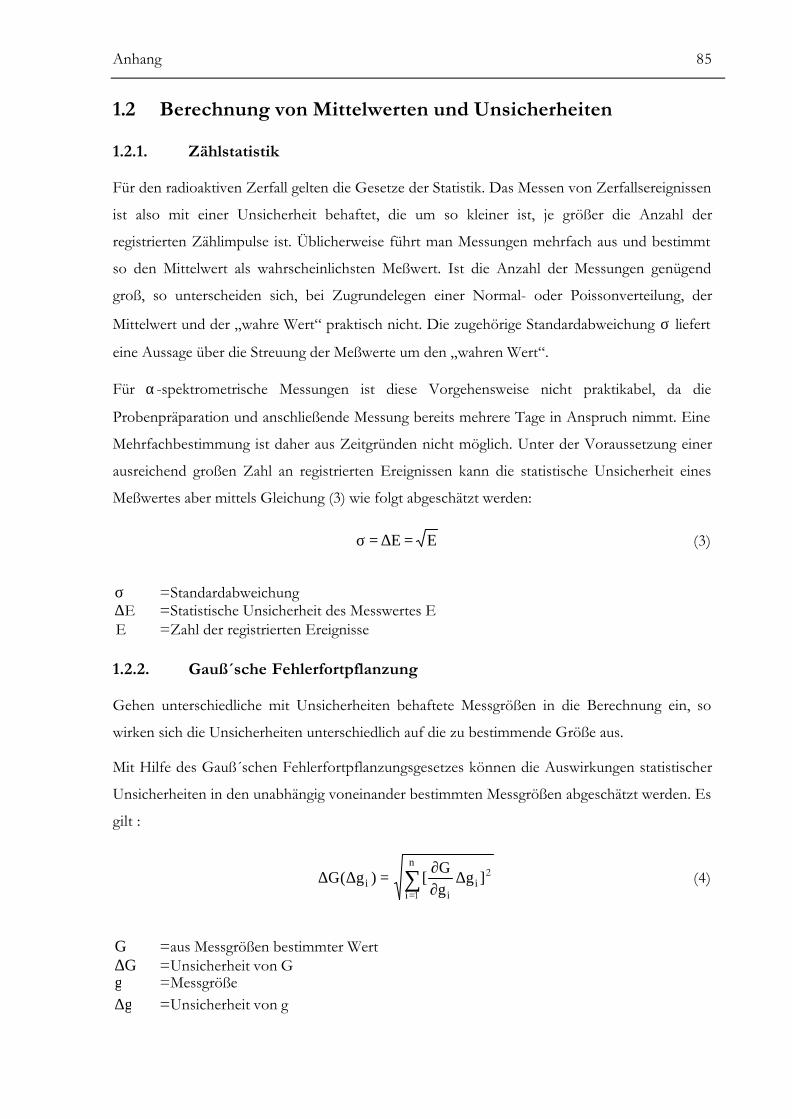
Anhang 85
1.2 Berechnung von Mittelwerten und Unsicherheiten
1.2.1. Zählstatistik
Für den radioaktiven Zerfall gelten die Gesetze der Statistik. Das Messen von Zerfallsereignissen
ist also mit einer Unsicherheit behaftet, die um so kleiner ist, je größer die Anzahl der
registrierten Zählimpulse ist. Üblicherweise führt man Messungen mehrfach aus und bestimmt
so den Mittelwert als wahrscheinlichsten Meßwert. Ist die Anzahl der Messungen genügend
groß, so unterscheiden sich, bei Zugrundelegen einer Normal- oder Poissonverteilung, der
Mittelwert und der „wahre Wert“ praktisch nicht. Die zugehörige Standardabweichung σ liefert
eine Aussage über die Streuung der Meßwerte um den „wahren Wert“.
Für α-spektrometrische Messungen ist diese Vorgehensweise nicht praktikabel, da die
Probenpräparation und anschließende Messung bereits mehrere Tage in Anspruch nimmt. Eine
Mehrfachbestimmung ist daher aus Zeitgründen nicht möglich. Unter der Voraussetzung einer
ausreichend großen Zahl an registrierten Ereignissen kann die statistische Unsicherheit eines
Meßwertes aber mittels Gleichung (3) wie folgt abgeschätzt werden:
EE =∆=σ (3)
σ =StandardabweichungE∆ =Statistische Unsicherheit des Messwertes E
E =Zahl der registrierten Ereignisse
1.2.2. Gauß´sche Fehlerfortpflanzung
Gehen unterschiedliche mit Unsicherheiten behaftete Messgrößen in die Berechnung ein, so
wirken sich die Unsicherheiten unterschiedlich auf die zu bestimmende Größe aus.
Mit Hilfe des Gauß´schen Fehlerfortpflanzungsgesetzes können die Auswirkungen statistischer
Unsicherheiten in den unabhängig voneinander bestimmten Messgrößen abgeschätzt werden. Es
gilt :
2
1]g
gG
[)g(G ii
n
ii ∆
∂∂
=∆∆ ∑=
(4)
G =aus Messgrößen bestimmter WertG∆ =Unsicherheit von G
g =Messgrößeg∆ =Unsicherheit von g
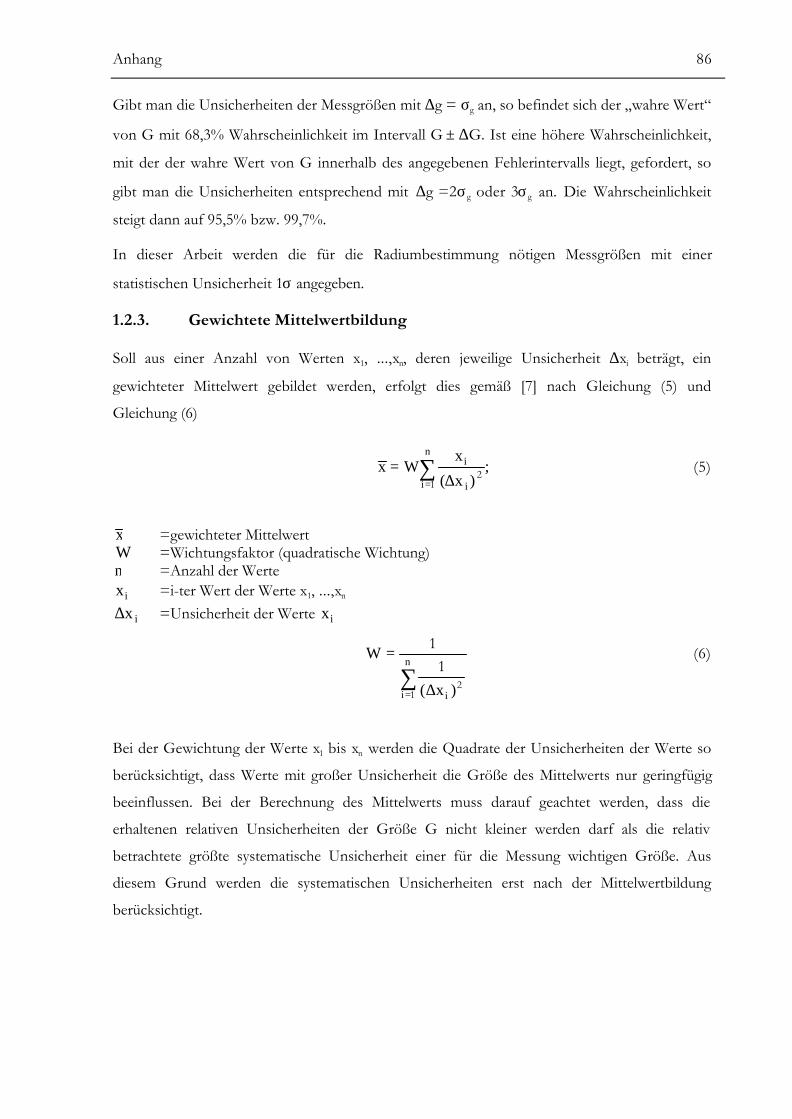
Anhang 86
Gibt man die Unsicherheiten der Messgrößen mit ∆g = σg an, so befindet sich der „wahre Wert“
von G mit 68,3% Wahrscheinlichkeit im Intervall G ± ∆G. Ist eine höhere Wahrscheinlichkeit,
mit der der wahre Wert von G innerhalb des angegebenen Fehlerintervalls liegt, gefordert, so
gibt man die Unsicherheiten entsprechend mit ∆g =2σg oder 3σg an. Die Wahrscheinlichkeit
steigt dann auf 95,5% bzw. 99,7%.
In dieser Arbeit werden die für die Radiumbestimmung nötigen Messgrößen mit einer
statistischen Unsicherheit 1σ angegeben.
1.2.3. Gewichtete Mittelwertbildung
Soll aus einer Anzahl von Werten x1, ...,xn, deren jeweilige Unsicherheit ∆xi beträgt, ein
gewichteter Mittelwert gebildet werden, erfolgt dies gemäß [7] nach Gleichung (5) und
Gleichung (6)
;)x(
xWx
n
i i
i∑= ∆
=1
2 (5)
x =gewichteter MittelwertW =Wichtungsfaktor (quadratische Wichtung)n =Anzahl der Werte
ix =i-ter Wert der Werte x1, ...,xn
ix∆ =Unsicherheit der Werte ix
∑= ∆
=n
i i )x(
W
12
11 (6)
Bei der Gewichtung der Werte x1 bis xn werden die Quadrate der Unsicherheiten der Werte so
berücksichtigt, dass Werte mit großer Unsicherheit die Größe des Mittelwerts nur geringfügig
beeinflussen. Bei der Berechnung des Mittelwerts muss darauf geachtet werden, dass die
erhaltenen relativen Unsicherheiten der Größe G nicht kleiner werden darf als die relativ
betrachtete größte systematische Unsicherheit einer für die Messung wichtigen Größe. Aus
diesem Grund werden die systematischen Unsicherheiten erst nach der Mittelwertbildung
berücksichtigt.
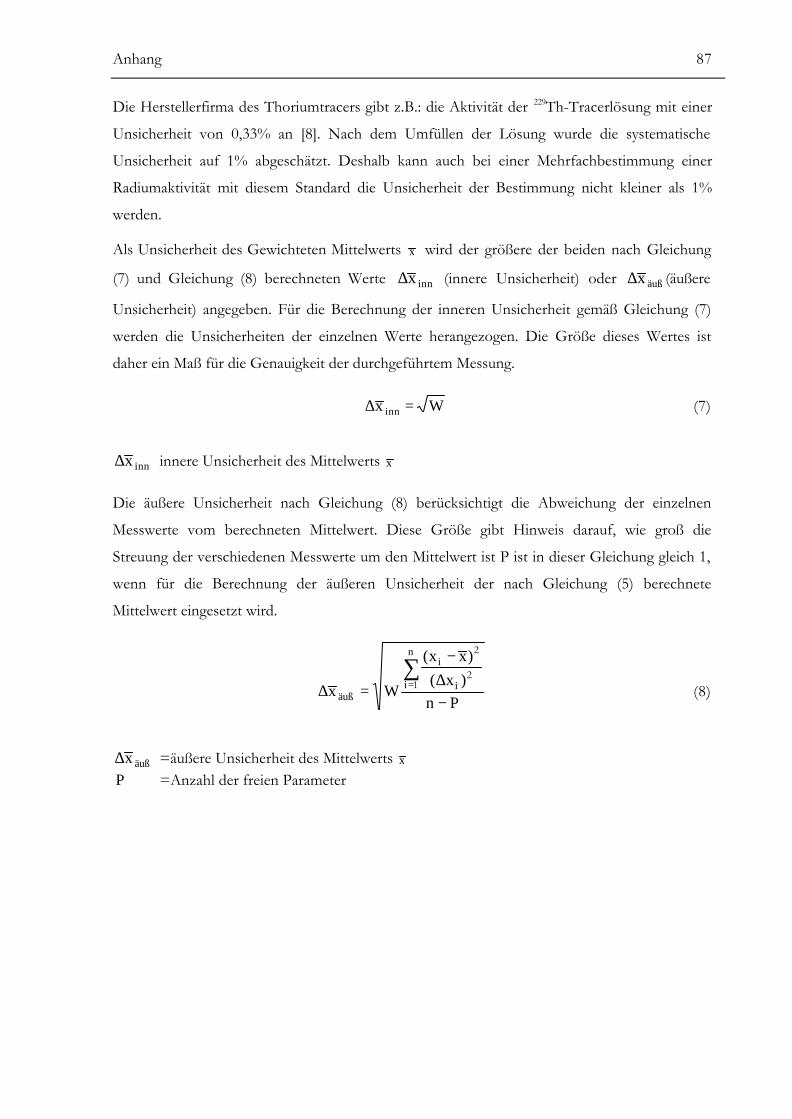
Anhang 87
Die Herstellerfirma des Thoriumtracers gibt z.B.: die Aktivität der 229Th-Tracerlösung mit einer
Unsicherheit von 0,33% an [8]. Nach dem Umfüllen der Lösung wurde die systematische
Unsicherheit auf 1% abgeschätzt. Deshalb kann auch bei einer Mehrfachbestimmung einer
Radiumaktivität mit diesem Standard die Unsicherheit der Bestimmung nicht kleiner als 1%
werden.
Als Unsicherheit des Gewichteten Mittelwerts x wird der größere der beiden nach Gleichung
(7) und Gleichung (8) berechneten Werte innx∆ (innere Unsicherheit) oder äußx∆ (äußere
Unsicherheit) angegeben. Für die Berechnung der inneren Unsicherheit gemäß Gleichung (7)
werden die Unsicherheiten der einzelnen Werte herangezogen. Die Größe dieses Wertes ist
daher ein Maß für die Genauigkeit der durchgeführtem Messung.
Wx inn =∆ (7)
innx∆ innere Unsicherheit des Mittelwerts x
Die äußere Unsicherheit nach Gleichung (8) berücksichtigt die Abweichung der einzelnen
Messwerte vom berechneten Mittelwert. Diese Größe gibt Hinweis darauf, wie groß die
Streuung der verschiedenen Messwerte um den Mittelwert ist P ist in dieser Gleichung gleich 1,
wenn für die Berechnung der äußeren Unsicherheit der nach Gleichung (5) berechnete
Mittelwert eingesetzt wird.
Pn)x()xx(
Wx
n
i i
i
äuß −∆
−
=∆∑=1
2
2
(8)
äußx∆ =äußere Unsicherheit des Mittelwerts x
P =Anzahl der freien Parameter
Anhang 88
1.3 Urkunde über die Eintragung des Gebrauchsmusters
Anhang 89
Literatur
[1] W. Westmeier, A. Merklin; Catalog of Alpha Particles from Radioactive Decay; Physik
Daten/Physics Data; Nr. 29-1 (1985)
[2] P. de Regge, R. Boden; Review of Chemical Separation Techniques applicable to Alpha
Spectrometric Measurements; Nuclear Instruments and Methods in Physics Research;
223 (1984) 181-187.
[3] A.E. Lally, K.M. Glover; Source Preparation in Alpha Spectrometry; Nuclear
Instruments and Methods in Physik Research; 223 (1984) 259-265.
[4] P. Blanco Rodriguez, A. Martin Sánchez, F. Vera Tome; Experimental Studies of Self-
absorption and Backscattering in Alpha-particle Sources; Internatioal Journal of Applied
Radiation and Isotopes; 48 (1997) 1215-1220.
[5] Der Bundesminister für Umwelt, Naturschutz und Reaktorsicherheit; Messanleitung für
die Überwachung der Radioaktivität in der Umwelt und zur Erfassung radioaktiver
Emissionen aus kerntechnischen Anlagen; Gustav Fischer Verlag; Stuttgart (1994).
[6] DIN-Norm 25482 Teil 1: Nachweisgrenze und Erkennungsgrenze bei
Kernstrahlungsmessungen-Zählende Messungen ohne Berücksichtigung des
Probenbehandlungseinflusses.
[7] Nuclear Data Sheets, Academic Press, New York and London, „Die Vorschrift zur
Berechnung gewichteter Mittelwerte ist in den Policies angegeben.“ (Anmerkung des
Autors)
[8] NIST, Standard-Referenz-Materialnummer: SRM No. 4328B, Referenz-Zeit: 01.07.96,
33,36 Bq 229Th g-1 Lösung, Unsicherheit: 0,33% c(HNO3)=1,1 mol/l, Gaithersburg, USA
Lebenslauf
Name: Stefan Purkl
Anschrift: Holtenauer Str. 59
24105 Kiel
Geburtsdatum: 11.08.1973 in Bad Hersfeld
Nationalität: deutsch
Studium Hochschulsemester
1993
21.09.1993
21.09.1995
21.07.1998
21.06.1999
01.08.1999
29.09.1999
Abitur, Jakob-Grimm-Schule
Immatrikulation Lehramt L3, Fächer: Physik/Chemie
Philipps-Universität Marburg
Immatrikulation Geologie/Paläo.
Philipps-Universität Marburg
Vordiplom Geologie, Gesamtnote „sehr gut“
1. Staatsexamen, Gesamtnote: „mit Auszeichnung“
Exmatrikulation, Philipps-Universität Marburg
Graduiertenkolleg „Dynamik Globaler Kreisläufe“ an der
Christian-Albrechts-Universität zu Kiel
Immatrikulation Geologie/Paläo., CAU Kiel
10
12
12
Kiel, den 6. Mai 2002 Stefan Purkl