Embed Size (px)
Citation preview
Contents lists available at ScienceDirect
Biological Conservation
journal homepage: www.elsevier.com/locate/biocon
Eutrophication decreases salt marsh resilience through proliferation of algalmats
Kerstin Wassona,b,⁎, Rikke Jeppesena, Charlie Endrisa, Danielle C. Perrya,c, Andrea Woolfolka,Kathryn Beheshtib, Miguel Rodrigueza, Ron Ebya, Elizabeth B. Watsond, Farzana Rahmand,John Haskinsa, Brent B. Hughesb,e
a Elkhorn Slough National Estuarine Research Reserve, Watsonville, CA, USAb Ecology and Evolutionary Biology, University of California, Santa Cruz, Santa Cruz, CA, USAc Biology and Environmental Science, University of New Haven, New Haven, CT, USAd Department of Biodiversity, Earth & Environmental Sciences and The Academy of Natural Sciences, Drexel University, Philadelphia, PA, USAe Nicholas School of the Environment, Duke University, Beaufort, NC, USA
A R T I C L E I N F O
Keywords:EutrophicationNutrient loadingSalt marshUlvaWrack
A B S T R A C T
Globally, many estuaries are affected by nutrient loading from human land uses in the surrounding watersheds.One consequence of increased nutrient levels is proliferation of opportunistic macroalgae. We sought tounderstand spatial and temporal dynamics of ephemeral macroalgal mats and to examine their effects on saltmarsh in a eutrophic estuary in central California. A time series analysis spanning 80 years revealed that algalwrack has increased exponentially in frequency on the salt marsh, and was highly correlated with nutrientconcentrations in the estuary, which have increased along with fertilizer use. Analysis of sediment δ15N showeda dramatic increase in nutrient loads attributable to agricultural fertilizer over the past 50 years. We monitored15 salt marsh plots along the bank edge and detected a negative relationship between algal wrack cover and saltmarsh cover, flowering, and canopy height. Moreover, algal wrack led to retreat of vegetation from the bankedge, and increased bank erosion. We also experimentally added algal wrack to salt marsh edge plots. Algaladdition decreased salt marsh cover, flowering, and canopy height, and increased retreat rate. By integratingtime series analyses, isotope data, algal and marsh monitoring and manipulative experiments, we have identifiedrobust linkages between increased anthropogenic nutrient loading, increased algal wrack cover, reduction inmarsh resilience and conversion of marsh habitat to mudflat through bank erosion. Decreasing nutrient inputs toeutrophic estuaries is thus essential for conservation and restoration of salt marshes and enhancing theirresilience in the face of sea level rise.
1. Introduction
Estuaries have been altered by human activities for centuries.Wetlands have been “reclaimed” for agricultural and urban land uses,freshwater has been diverted, and overfishing has restructured trophicinteractions (Kennish, 2002). As coastal populations of humans con-tinue to grow, one threat of particular concern is increased nutrientinputs from fertilizer, livestock waste, and fossil fuel composition; thisnutrient enrichment can lead to eutrophication, the increase in the rateof supply of organic matter (Nixon, 1995). The majority of US estuariesare currently considered moderately to highly eutrophic (Bricker et al.,2008; Greene et al., 2015). Nutrient loading can enhance some desiredecosystem services, such as increasing fish production and catch in theNile River delta (Oczkowski et al., 2009). However, many negative
effects of eutrophication reverberate through estuarine ecosystems, forinstance harming fish communities through decreases in oxygenconcentrations (Diaz and Rosenberg, 1995; Powers et al., 2005) anddegrading seagrass beds through algal blooms (Valiela et al., 1997).
Salt marshes are valued habitats in temperate estuaries, providingecosystem services including water quality improvement, shorelineprotection, fisheries support, and carbon sequestration (Gedan et al.,2009; McLeod et al., 2011). Salt marshes are nitrogen limited (Valielaand Teal, 1979), and fertilization with nitrogen enhances above-groundproductivity (Boyer et al., 2001; Nelson and Zavaleta, 2012). Butnitrogen enrichment can decrease below-ground production, whichcan impede the ability of marshes to build elevation through subsurfaceorganic accretion and thus limit their ability to track sea level rise(Turner et al., 2009; Deegan et al., 2012; Watson et al., 2014). While
http://dx.doi.org/10.1016/j.biocon.2017.05.019Received 17 January 2017; Received in revised form 7 May 2017
⁎ Corresponding author at: Elkhorn Slough National Estuarine Research Reserve, Watsonville, CA, USA.E-mail address: [email protected] (K. Wasson).
Biological Conservation 212 (2017) 1–11
Available online 06 June 20170006-3207/ © 2017 Elsevier Ltd. All rights reserved.
MARK
plot-scale experiments with high nutrient addition levels can generatestrong responses from the marsh, more realistic application of nutrientsleads to much milder responses (Johnson et al., 2016). Whethernutrient loading enhances or degrades salt marsh resilience in the faceof sea level rise may vary across different marshes, and remains acontroversial topic among marsh ecologists (Morris et al., 2013;Graham and Mendelssohn, 2014).
One characteristic of nutrient loading in estuaries is proliferation ofopportunistic macroalgae (Duarte, 1995; Fletcher, 1996; Valiela et al.,1997). While macroalgae are a natural component of estuarineecosystems, they have likely increased over past decades in manyestuaries, though time series documentation is rare (Raffaelli, 1999).Macroalgal blooms are well-known to have negative impacts onseagrass beds through shading (Hauxwell et al., 2001). Effects ofmacroalgal blooms on salt marsh vegetation are less well understood.Macroalgal wrack that drifts onto the marsh can potentially benefitmarsh plants by providing nutrients. Mesocosm experiments havedemonstrated the transfer of nutrients from macroalgae to marsh plants(Boyer and Fong, 2005; Watson et al., 2015) and increased marsh plantgrowth with macroalgal addition (Newton and Thornber, 2013).However, macroalgal wrack also can have negative effects aboveground through shading, and below ground, as decomposing algae
increase sediment hypoxia and sulfide concentrations (Caffrey et al.,2002b). Field experiments have revealed negative effects on above-ground plant growth (Hulzen et al., 2006, Newton and Thornber, 2013)while laboratory mesocosm experiments showed negative effects onboth above- and below-ground biomass (Watson et al., 2015). Theeffects of algal wrack may depend on duration or intensity of exposure.For instance for mudflat invertebrates, thin algal mats increase diversitywhile thick algal mats decrease it (Green and Fong, 2015). For saltmarshes, it is possible that short-term or low-level exposure to algalwrack provides beneficial nutrient subsidies, while more intenseexposure is harmful.
The lower edge of a salt marsh is a front between alternate stablestates, mudflat and marsh (McGlathery et al., 2013). This boundary isvery dynamic, and in many estuaries, where sediment supply has beendecreased by human activities such as river diversion and damming,marsh loss and bank erosion are common (Fagherazzi et al., 2013).Nutrient loading can have direct effects on marsh edges, with decreasedplant allocation to roots and higher microbial decomposition rates,leading to lower bank stability and increased bank erosion rates(Deegan et al., 2012). Nutrient loading may also have indirect effectson the marsh-mudflat boundary through disturbance by algal wrack,but previous considerations of the role algal wrack may play in shifts
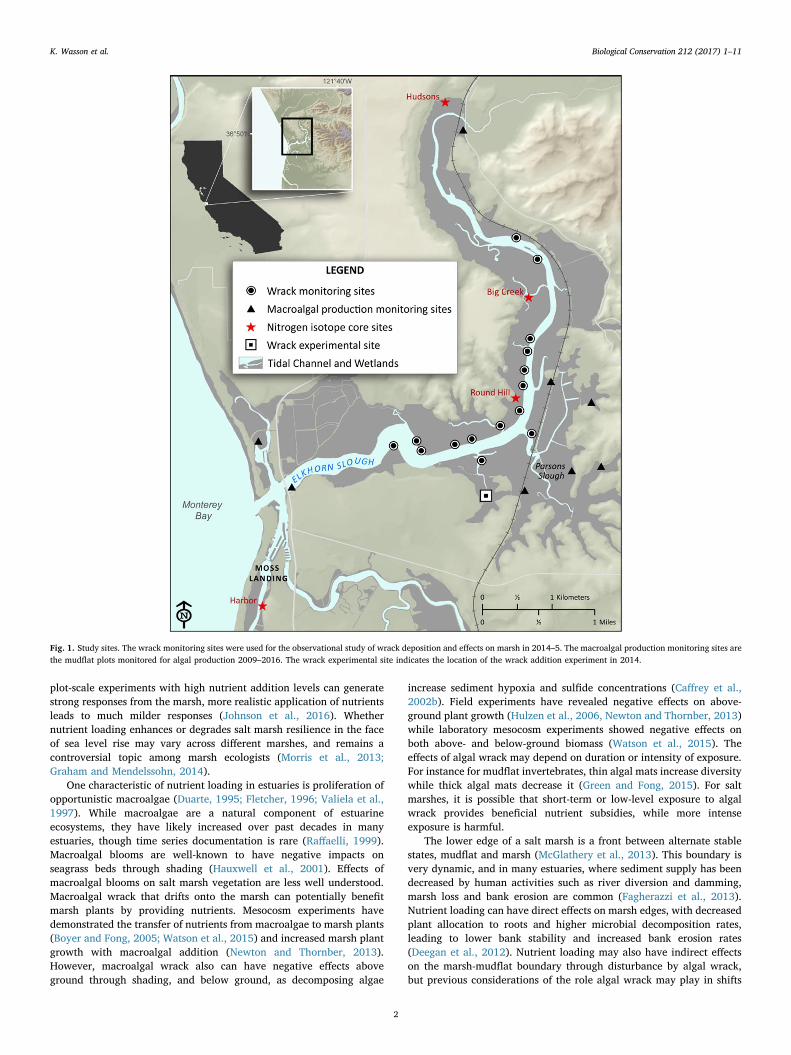
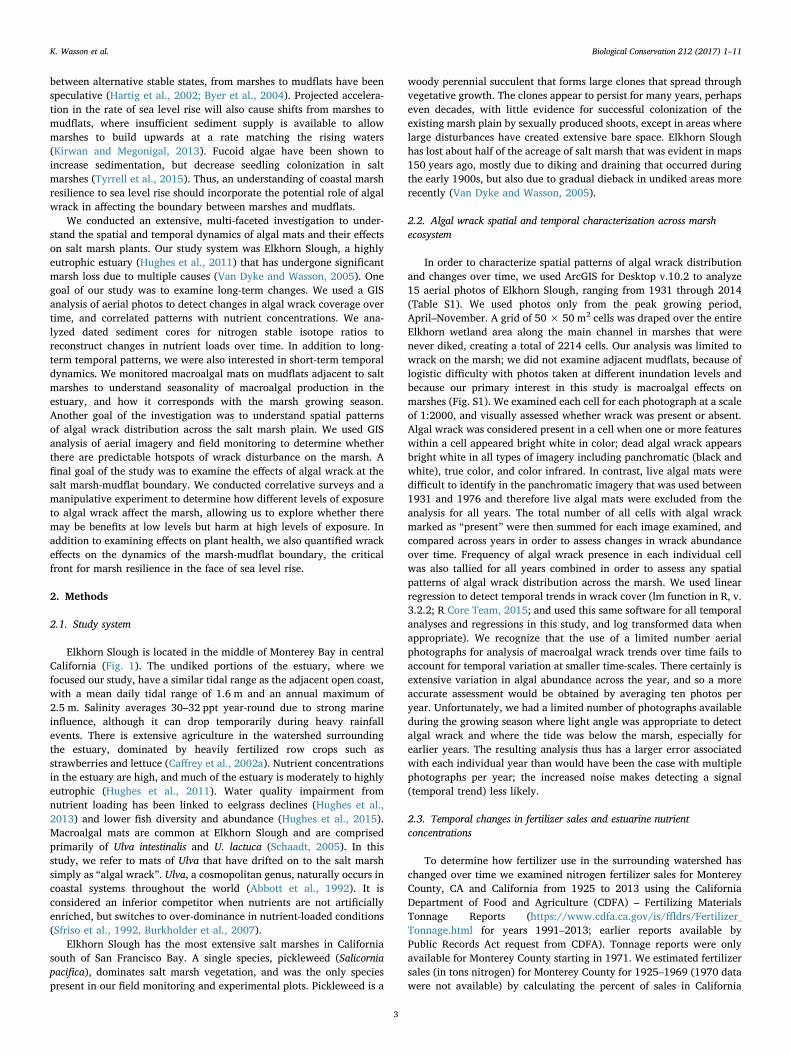
Fig. 1. Study sites. The wrack monitoring sites were used for the observational study of wrack deposition and effects on marsh in 2014–5. The macroalgal production monitoring sites arethe mudflat plots monitored for algal production 2009–2016. The wrack experimental site indicates the location of the wrack addition experiment in 2014.
K. Wasson et al. Biological Conservation 212 (2017) 1–11
2
between alternative stable states, from marshes to mudflats have beenspeculative (Hartig et al., 2002; Byer et al., 2004). Projected accelera-tion in the rate of sea level rise will also cause shifts from marshes tomudflats, where insufficient sediment supply is available to allowmarshes to build upwards at a rate matching the rising waters(Kirwan and Megonigal, 2013). Fucoid algae have been shown toincrease sedimentation, but decrease seedling colonization in saltmarshes (Tyrrell et al., 2015). Thus, an understanding of coastal marshresilience to sea level rise should incorporate the potential role of algalwrack in affecting the boundary between marshes and mudflats.
We conducted an extensive, multi-faceted investigation to under-stand the spatial and temporal dynamics of algal mats and their effectson salt marsh plants. Our study system was Elkhorn Slough, a highlyeutrophic estuary (Hughes et al., 2011) that has undergone significantmarsh loss due to multiple causes (Van Dyke and Wasson, 2005). Onegoal of our study was to examine long-term changes. We used a GISanalysis of aerial photos to detect changes in algal wrack coverage overtime, and correlated patterns with nutrient concentrations. We ana-lyzed dated sediment cores for nitrogen stable isotope ratios toreconstruct changes in nutrient loads over time. In addition to long-term temporal patterns, we were also interested in short-term temporaldynamics. We monitored macroalgal mats on mudflats adjacent to saltmarshes to understand seasonality of macroalgal production in theestuary, and how it corresponds with the marsh growing season.Another goal of the investigation was to understand spatial patternsof algal wrack distribution across the salt marsh plain. We used GISanalysis of aerial imagery and field monitoring to determine whetherthere are predictable hotspots of wrack disturbance on the marsh. Afinal goal of the study was to examine the effects of algal wrack at thesalt marsh-mudflat boundary. We conducted correlative surveys and amanipulative experiment to determine how different levels of exposureto algal wrack affect the marsh, allowing us to explore whether theremay be benefits at low levels but harm at high levels of exposure. Inaddition to examining effects on plant health, we also quantified wrackeffects on the dynamics of the marsh-mudflat boundary, the criticalfront for marsh resilience in the face of sea level rise.
2. Methods
2.1. Study system
Elkhorn Slough is located in the middle of Monterey Bay in centralCalifornia (Fig. 1). The undiked portions of the estuary, where wefocused our study, have a similar tidal range as the adjacent open coast,with a mean daily tidal range of 1.6 m and an annual maximum of2.5 m. Salinity averages 30–32 ppt year-round due to strong marineinfluence, although it can drop temporarily during heavy rainfallevents. There is extensive agriculture in the watershed surroundingthe estuary, dominated by heavily fertilized row crops such asstrawberries and lettuce (Caffrey et al., 2002a). Nutrient concentrationsin the estuary are high, and much of the estuary is moderately to highlyeutrophic (Hughes et al., 2011). Water quality impairment fromnutrient loading has been linked to eelgrass declines (Hughes et al.,2013) and lower fish diversity and abundance (Hughes et al., 2015).Macroalgal mats are common at Elkhorn Slough and are comprisedprimarily of Ulva intestinalis and U. lactuca (Schaadt, 2005). In thisstudy, we refer to mats of Ulva that have drifted on to the salt marshsimply as “algal wrack”. Ulva, a cosmopolitan genus, naturally occurs incoastal systems throughout the world (Abbott et al., 1992). It isconsidered an inferior competitor when nutrients are not artificiallyenriched, but switches to over-dominance in nutrient-loaded conditions(Sfriso et al., 1992, Burkholder et al., 2007).
Elkhorn Slough has the most extensive salt marshes in Californiasouth of San Francisco Bay. A single species, pickleweed (Salicorniapacifica), dominates salt marsh vegetation, and was the only speciespresent in our field monitoring and experimental plots. Pickleweed is a
woody perennial succulent that forms large clones that spread throughvegetative growth. The clones appear to persist for many years, perhapseven decades, with little evidence for successful colonization of theexisting marsh plain by sexually produced shoots, except in areas wherelarge disturbances have created extensive bare space. Elkhorn Sloughhas lost about half of the acreage of salt marsh that was evident in maps150 years ago, mostly due to diking and draining that occurred duringthe early 1900s, but also due to gradual dieback in undiked areas morerecently (Van Dyke and Wasson, 2005).
2.2. Algal wrack spatial and temporal characterization across marshecosystem
In order to characterize spatial patterns of algal wrack distributionand changes over time, we used ArcGIS for Desktop v.10.2 to analyze15 aerial photos of Elkhorn Slough, ranging from 1931 through 2014(Table S1). We used photos only from the peak growing period,April–November. A grid of 50 × 50 m2 cells was draped over the entireElkhorn wetland area along the main channel in marshes that werenever diked, creating a total of 2214 cells. Our analysis was limited towrack on the marsh; we did not examine adjacent mudflats, because oflogistic difficulty with photos taken at different inundation levels andbecause our primary interest in this study is macroalgal effects onmarshes (Fig. S1). We examined each cell for each photograph at a scaleof 1:2000, and visually assessed whether wrack was present or absent.Algal wrack was considered present in a cell when one or more featureswithin a cell appeared bright white in color; dead algal wrack appearsbright white in all types of imagery including panchromatic (black andwhite), true color, and color infrared. In contrast, live algal mats weredifficult to identify in the panchromatic imagery that was used between1931 and 1976 and therefore live algal mats were excluded from theanalysis for all years. The total number of all cells with algal wrackmarked as “present” were then summed for each image examined, andcompared across years in order to assess changes in wrack abundanceover time. Frequency of algal wrack presence in each individual cellwas also tallied for all years combined in order to assess any spatialpatterns of algal wrack distribution across the marsh. We used linearregression to detect temporal trends in wrack cover (lm function in R, v.3.2.2; R Core Team, 2015; and used this same software for all temporalanalyses and regressions in this study, and log transformed data whenappropriate). We recognize that the use of a limited number aerialphotographs for analysis of macroalgal wrack trends over time fails toaccount for temporal variation at smaller time-scales. There certainly isextensive variation in algal abundance across the year, and so a moreaccurate assessment would be obtained by averaging ten photos peryear. Unfortunately, we had a limited number of photographs availableduring the growing season where light angle was appropriate to detectalgal wrack and where the tide was below the marsh, especially forearlier years. The resulting analysis thus has a larger error associatedwith each individual year than would have been the case with multiplephotographs per year; the increased noise makes detecting a signal(temporal trend) less likely.
2.3. Temporal changes in fertilizer sales and estuarine nutrientconcentrations
To determine how fertilizer use in the surrounding watershed haschanged over time we examined nitrogen fertilizer sales for MontereyCounty, CA and California from 1925 to 2013 using the CaliforniaDepartment of Food and Agriculture (CDFA) – Fertilizing MaterialsTonnage Reports (https://www.cdfa.ca.gov/is/ffldrs/Fertilizer_Tonnage.html for years 1991–2013; earlier reports available byPublic Records Act request from CDFA). Tonnage reports were onlyavailable for Monterey County starting in 1971. We estimated fertilizersales (in tons nitrogen) for Monterey County for 1925–1969 (1970 datawere not available) by calculating the percent of sales in California
K. Wasson et al. Biological Conservation 212 (2017) 1–11
3
coming from Monterey County from 1971 to 2008 (mean = 4.2% ±0.72 SD). Since the mean and SD were consistent across nearly fourdecades, we assumed that the percentage was consistent from 1925 to1969, and calculated the annual fertilizer sales in Monterey County bymultiplying the annual California fertilizer sales by 4.2%.
To determine trends in water column nitrate values in ElkhornSlough, we constructed a time series drawing on different sources fordifferent periods: 1970 to 1972 (Smith, 1973), 1974 to 1976 (Nybakkenet al., 1977), 1977 from the California Central Coast Regional WaterQuality Control Board, and 1989 to 2015 Elkhorn Slough NationalEstuarine Research Reserve (ESNERR). We also examined the relation-ship between fertilizer sales and nitrate concentrations.
Historical changes in nitrogen isotopic composition were examinedat four locations across Elkhorn Slough. Sediment cores (50–60 cm inlength) were analyzed at one cm increments for stable nitrogen isotopiccomposition using a Finnegan Delta IX continuous flow isotope ratiomass spectrometer (CF-IRMS) using standard methods (McClellandet al., 1997; McKinney et al., 2001). Cores were collected using aRussian peat corer, a side filling coring device that prevents compaction(Aquatic Research Instruments, Hope, ID). Chronological control wasprovided using downcore profiles of 210Pb and 226Ra (SupplementalMethods). The stable nitrogen isotope composition of the soil isexpressed as a per mill difference relative to the reference standard(air-N2) such that δ N = × 1000R R
R15 −sample standard
standardwhere R is the ratio of
15N to 14N (Mariotti, 1983). Duplicates were run every five sampleswith a typical difference of 0.09‰. Here, we interpret increasingsedimentary δ15N signatures as reflecting historic increases in nitrogeninputs, in accordance with previous studies demonstrating linkagesbetween high N loads and high stable nitrogen isotope ratios (Kreitleret al., 1978; Fry and Allen, 2003; Fry et al., 2003). Enrichment in δ15Nsignatures is often the result of fractionation that occurs with deni-trification. While synthetic fertilizer has a nitrogen stable isotopesignature similar to atmospheric air (δ15N = 0; Aly et al., 1982),denitrification can fractionate nitrogen stable isotopes as denitrifyingbacteria take up 14N at a faster rate than 15N, leaving the remainingdissolved inorganic nitrate enriched in 15N (Lehmann et al., 2003;Oczkowski et al., 2008). Support for the interpretation of 15N enrich-ment as a result of fertilizer application is supported by previoussurveys of nitrogen stable isotopes in agriculturally dominated areas,such as the Mississippi River, the Nile Delta, and Portuguese Lagoons(Fry and Allen, 2003; Castro et al., 2007; Oczkowski et al., 2008).
2.4. Macroalgal production and seasonality
To monitor algal production over time, we established a permanentplot 100 × 50 m in size at each of eight intertidal mudflats in ElkhornSlough (Fig. 1). We sampled percent cover of green macroalgae (Ulvaspp.) at each plot, approximately once per month, from 2010 to 2016,during tides below Mean Lower Low Water (MLLW); these plots spanelevations of approximately 0 cm below MLLW to 50 cm above MLLW.We determined percent cover using a modified random point contact(RPC) method described by Nedwell et al. (2002). We surveyed plotsfrom nearby upland positions using a rifle scope with crosshairsmounted to a tripod. Transects were run across the entire plot areaby moving the scope at ~10° angles, looking through the scope andrecording if the crosshairs intercepted algae, for a total of 100 points.We tallied points to generate percent cover of algae.
2.5. Monitoring of algal wrack dynamics and effects on marsh edge
We characterized algal wrack and effects on the marsh at 15 sitesalong the main channel of Elkhorn Slough (Fig. 1). Methods aresummarized here and detailed in the Supplement. During monthly boatsurveys, we assigned wrack along the marsh edge an index score of 0–3based on cover and thickness. To examine whether this wrack index
correlated with marsh health and habitat loss, we used the average ofthe index across the four summer months in 2014 for each site. Todetermine whether our algal wrack index correlated with biomass ofalgal wrack on the marsh, we harvested wrack biomass once during themonitoring period and weighed each sample before and after drying.
In order to characterize marsh plant health at each of the sites, weassessed a 0.5 × 0.5 m quadrat centered on each monitoring plot inAugust 2014. Percent cover of succulent marsh plant tissue wasassessed by dropping a metal rod at 16 intercepts and tallying thenumber of intercepts where the rod touched succulent tissue. Succulenttissue was chosen as a more sensitive response variable because woodypickleweed tissue can persist in this perennial even in stressed plants.Percent flowering was assessed by searching for flowers on marshplants in each of five equal sections of the quadrat separated by string;we then tallied the percent of the rows that had flowers. Maximumcanopy height was assessed by using a meter stick to measure the talleststem in the quadrat.
To assess habitat change rates at each site, we took identicalmeasurements in January 2014 and 2015. A one-year interval waschosen rather than the shorter summer Ulva monitoring period becausehabitat effects can take months to manifest. We ran a transect tapeperpendicular to the shoreline, from our plot markers (set about 2 mlandward of the bank edge) to the bank edge. We measured the distanceto the most seaward succulent marsh plant tissue (the live marsh edge)and to the bank edge. We then calculated the difference between themeasurements made a year apart as the bank erosion rate and thevegetation retreat rate, respectively. We quantified the number ofholes> 1 cm in diameter (large holes in this estuary are made onlyby the crab Pachygrapsus crassipes) within a 0.5 × 0.5 m quadrat heldvertically on the bank edge just below the marsh edge. To estimate therole of physical forcing of bank erosion through tidal scour, wedeployed erodible plasters for two weeks in June 2015, spanning aperiod of strong spring tides, and weighed the plasters before and afterdeployment (see Supplement for details).
To examine the relationship between the algal wrack index and thepotential response variables, we conducted simple linear regressions.Linear regressions were appropriate based on the distribution of thedata for all analyses except flowering, where a logarithmic regressionwas used.
2.6. Experimental test of algal wrack effects on low marsh edge
To test the effect of different time lengths of wrack exposure on saltmarsh health and habitat change, we conducted a field experiment(methods are summarized here, with more detail in the Supplement).We conducted the experiment on a former levee near the lowerelevational limit for salt marsh in the estuary (Fig. 1). Ten plotsreceived no wrack; ten were covered with wrack (applied at approxi-mately 1500 g/m2 dry weight) for 8 weeks (May–July); ten werecovered with wrack for 12 weeks (May–September). All plots (wrackand control) were fenced and a mesh placed on top to retain the wrack.We assessed the plots in early May 2014, prior to initiating wrackaddition, in late July, for flowering during the reproductive peak, andin late September, for all other parameters. We surveyed the plots ayear later, in September 2015, to assess recovery.
To evaluate salt marsh response, we assessed marsh plants within a0.5 × 0.5 m quadrat placed within each plot. Percent cover of succu-lent vegetation, percent flowering, and maximum canopy height wereassessed with the same methods as described above for the fieldsurveys. We also collected succulent marsh plant biomass (snipped allsucculent growing tips with scissors) as a proxy for recent productionfrom 0.15 × 0.15 m quadrats located outside the focal assessment area,using a different portion of the plot in September 2014 vs. 2015 toavoid resampling the same area. Biomass samples were dried andweighed. To evaluate potential vegetation retreat, we assessed thelocation of the seaward pickleweed boundary by measuring the
K. Wasson et al. Biological Conservation 212 (2017) 1–11
4
distance to the most seaward succulent tissue from four stakes along theseaward plot boundary; positive numbers were used for vegetationseaward of stakes, negative numbers for landward. We used Analysis ofVariance (ANOVA) to test for effect of the three treatments on thevarious response variables, with a Tukey HSD post-hoc test for pair-wisecomparisons of treatments. We used a Pearson's Chi-square test todetermine effect of the treatments on flowering in pickleweed.
3. Results
3.1. Algal wrack spatial and temporal characterization across marshecosystem
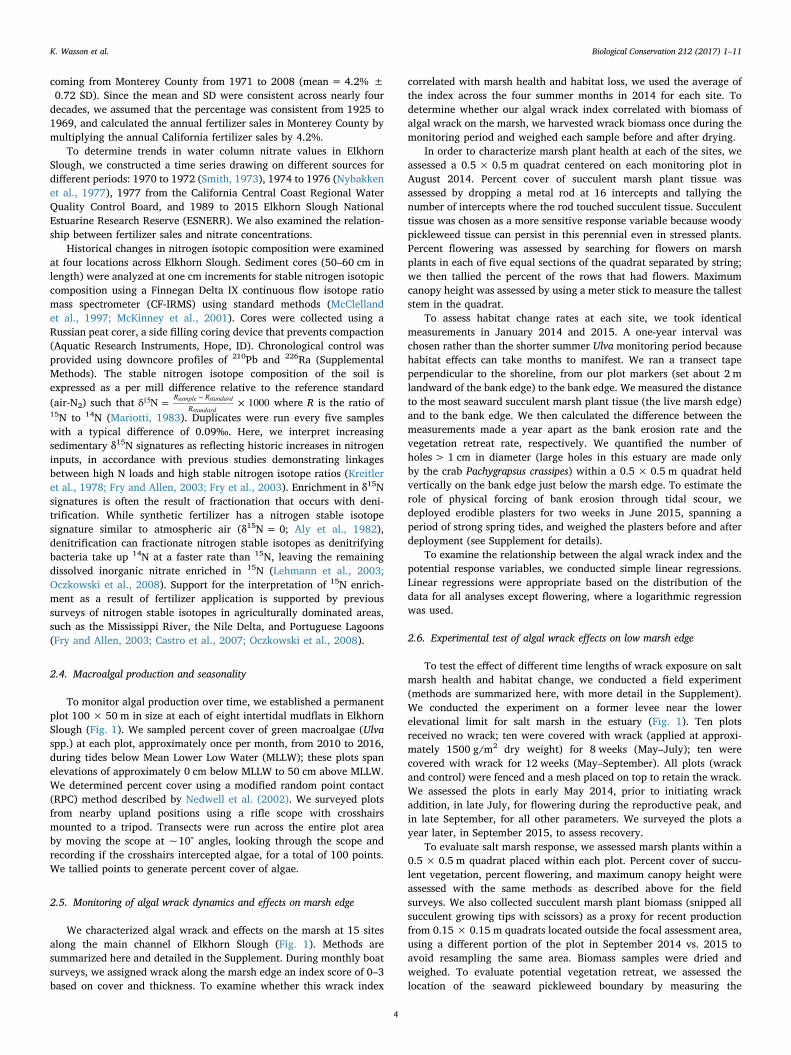
We detected significant increases in algal wrack (log transformed)on marshes over time (R2 = 0.56, P = 0.0014; Fig. 2a). Results of theGIS spatial analysis of algal wrack indicates low wrack abundance (e.g.fewer than 5% of cells observed with wrack present per year) between1931 and 1980 followed by a significant increase in wrack abundancebetween 1992 and 2014 (Fig. 2a, Fig. S1). A maximum of 18% of cellswere observed to contain algal wrack in May 2012.
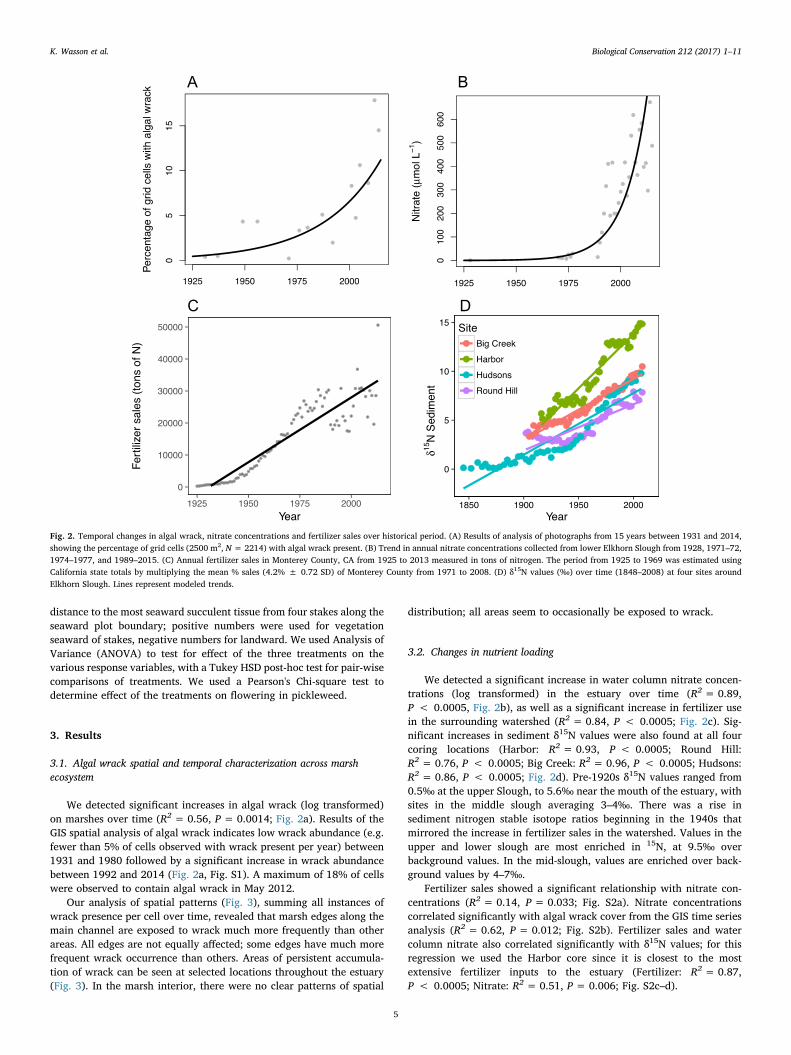
Our analysis of spatial patterns (Fig. 3), summing all instances ofwrack presence per cell over time, revealed that marsh edges along themain channel are exposed to wrack much more frequently than otherareas. All edges are not equally affected; some edges have much morefrequent wrack occurrence than others. Areas of persistent accumula-tion of wrack can be seen at selected locations throughout the estuary(Fig. 3). In the marsh interior, there were no clear patterns of spatial
distribution; all areas seem to occasionally be exposed to wrack.
3.2. Changes in nutrient loading
We detected a significant increase in water column nitrate concen-trations (log transformed) in the estuary over time (R2 = 0.89,P < 0.0005, Fig. 2b), as well as a significant increase in fertilizer usein the surrounding watershed (R2 = 0.84, P < 0.0005; Fig. 2c). Sig-nificant increases in sediment δ15N values were also found at all fourcoring locations (Harbor: R2 = 0.93, P < 0.0005; Round Hill:R2 = 0.76, P < 0.0005; Big Creek: R2 = 0.96, P < 0.0005; Hudsons:R2 = 0.86, P < 0.0005; Fig. 2d). Pre-1920s δ15N values ranged from0.5‰ at the upper Slough, to 5.6‰ near the mouth of the estuary, withsites in the middle slough averaging 3–4‰. There was a rise insediment nitrogen stable isotope ratios beginning in the 1940s thatmirrored the increase in fertilizer sales in the watershed. Values in theupper and lower slough are most enriched in 15N, at 9.5‰ overbackground values. In the mid-slough, values are enriched over back-ground values by 4–7‰.
Fertilizer sales showed a significant relationship with nitrate con-centrations (R2 = 0.14, P = 0.033; Fig. S2a). Nitrate concentrationscorrelated significantly with algal wrack cover from the GIS time seriesanalysis (R2 = 0.62, P = 0.012; Fig. S2b). Fertilizer sales and watercolumn nitrate also correlated significantly with δ15N values; for thisregression we used the Harbor core since it is closest to the mostextensive fertilizer inputs to the estuary (Fertilizer: R2 = 0.87,P < 0.0005; Nitrate: R2 = 0.51, P = 0.006; Fig. S2c–d).
Fig. 2. Temporal changes in algal wrack, nitrate concentrations and fertilizer sales over historical period. (A) Results of analysis of photographs from 15 years between 1931 and 2014,showing the percentage of grid cells (2500 m2, N= 2214) with algal wrack present. (B) Trend in annual nitrate concentrations collected from lower Elkhorn Slough from 1928, 1971–72,1974–1977, and 1989–2015. (C) Annual fertilizer sales in Monterey County, CA from 1925 to 2013 measured in tons of nitrogen. The period from 1925 to 1969 was estimated usingCalifornia state totals by multiplying the mean % sales (4.2% ± 0.72 SD) of Monterey County from 1971 to 2008. (D) δ15N values (‰) over time (1848–2008) at four sites aroundElkhorn Slough. Lines represent modeled trends.
K. Wasson et al. Biological Conservation 212 (2017) 1–11
5
3.3. Macroalgal production and seasonality
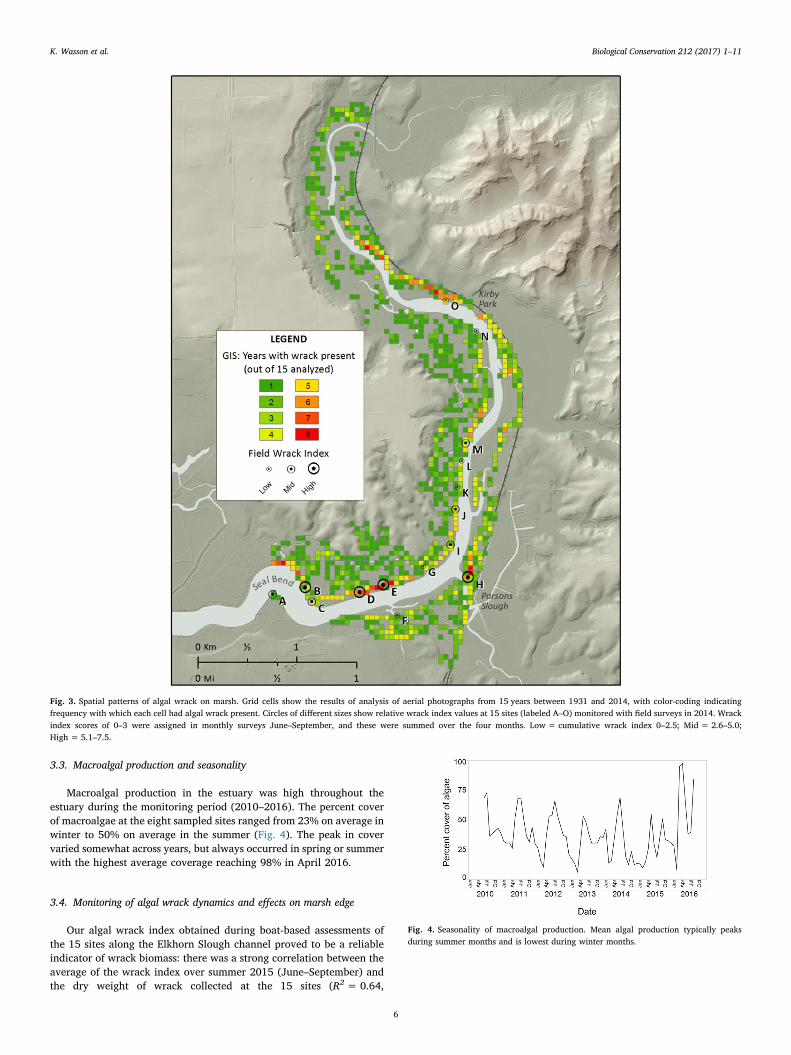
Macroalgal production in the estuary was high throughout theestuary during the monitoring period (2010–2016). The percent coverof macroalgae at the eight sampled sites ranged from 23% on average inwinter to 50% on average in the summer (Fig. 4). The peak in covervaried somewhat across years, but always occurred in spring or summerwith the highest average coverage reaching 98% in April 2016.
3.4. Monitoring of algal wrack dynamics and effects on marsh edge
Our algal wrack index obtained during boat-based assessments ofthe 15 sites along the Elkhorn Slough channel proved to be a reliableindicator of wrack biomass: there was a strong correlation between theaverage of the wrack index over summer 2015 (June–September) andthe dry weight of wrack collected at the 15 sites (R2 = 0.64,
Fig. 3. Spatial patterns of algal wrack on marsh. Grid cells show the results of analysis of aerial photographs from 15 years between 1931 and 2014, with color-coding indicatingfrequency with which each cell had algal wrack present. Circles of different sizes show relative wrack index values at 15 sites (labeled A–O) monitored with field surveys in 2014. Wrackindex scores of 0–3 were assigned in monthly surveys June–September, and these were summed over the four months. Low = cumulative wrack index 0–2.5; Mid = 2.6–5.0;High = 5.1–7.5.
Fig. 4. Seasonality of macroalgal production. Mean algal production typically peaksduring summer months and is lowest during winter months.
K. Wasson et al. Biological Conservation 212 (2017) 1–11
6
P = 0.0003) (Fig. S3a). The average dry weight of wrack was 359 g/m2
across all sites, with a range of 0–1422 g/m2.Deposition of algal wrack along the channel banks was sometimes
very high (Fig. 5), but spatially variable. Some sites repeatedly scoredhigh on the index, while others scored low (Fig. S4). The sites withhighest cumulative cover (B, D, E, H) were located near hotspotsidentified by the time series analysis (Fig. 3). The average algal wrackindex was 0.97, with averages for individual sites ranging from 0.1 to1.7. The average duration of wrack cover over the four summer monthswas 2.1 months, but ranged from 0 to 4 months across the sites. Therewas a significant correlation (R2 = 0.32,P = 0.029) between theSummer 2014 index across the 15 sites and the index in June 2015,suggesting spatial patterns of deposition are similar across years (Fig.S3b).
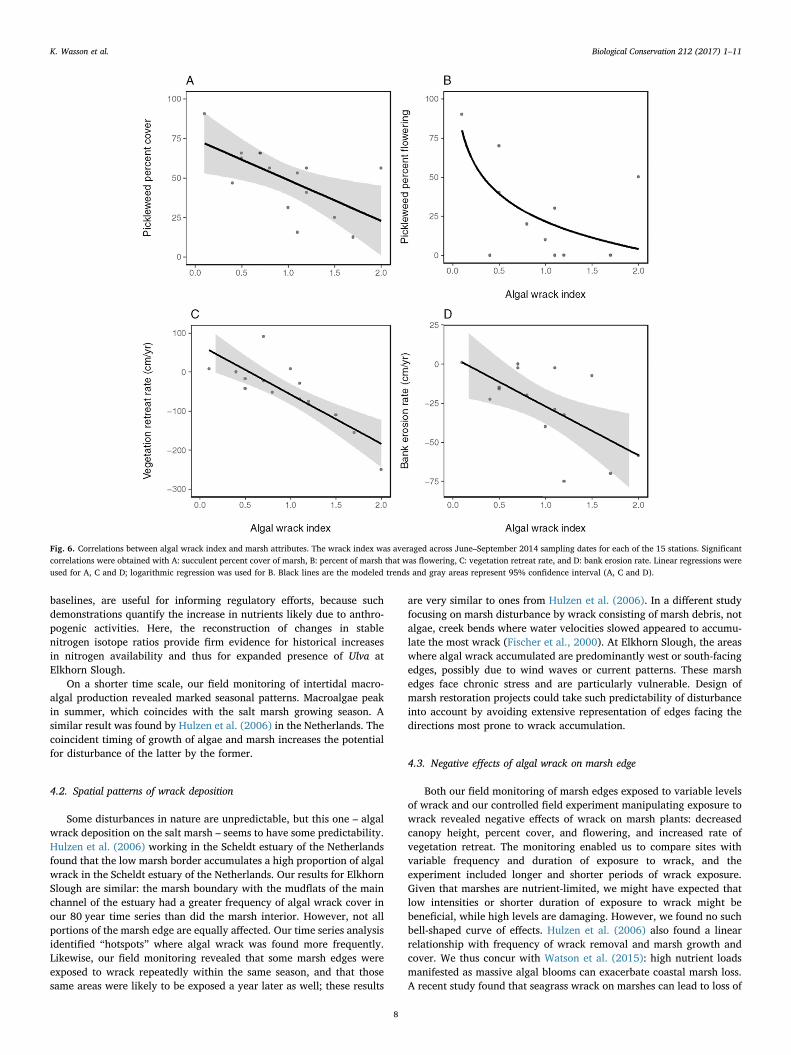
Algal wrack correlated negatively with all three indicators of marshhealth that we assessed. There was a significant negative correlationbetween the wrack index and percent cover of succulent marsh tissue(R2 = 0.39, P= 0.013) (Fig. 6a). In addition, there was a significantnegative correlation between the wrack index and percent flowering(R2 = 0.29, P = 0.041) (Fig. 6b). There was also a marginally sig-nificant negative correlation between the wrack index and maximumcanopy height (R2 = 0.23, P = 0.0069) (Fig. S3c).
Algal wrack correlated with both indicators of marsh habitat loss.There was a very strong relationship between the algal wrack index andvegetation retreat rate (R2 = 0.67, P = 0.0002) (Fig. 6c), and a weakerbut still highly significant relationship with bank erosion rate(R2 = 0.41, P= 0.0096) (Fig. 6d). The vegetation retreat rate did notcorrelate with plaster loss (proxy for physical forcing by tidal erosion)
(R2 = 0.11, P= 0.26), and showed a weak relationship with crab holes(R2 = 0.23, P = 0.07) (Fig. S5a,c). The bank erosion rate was corre-lated with plaster loss (R2 = 0.36, P = 0.023) as well as crab holes(R2 = 0.55, P= 0.0016) (Fig. S5b,d).
3.5. Experimental test of algal wrack effects on low marsh edge
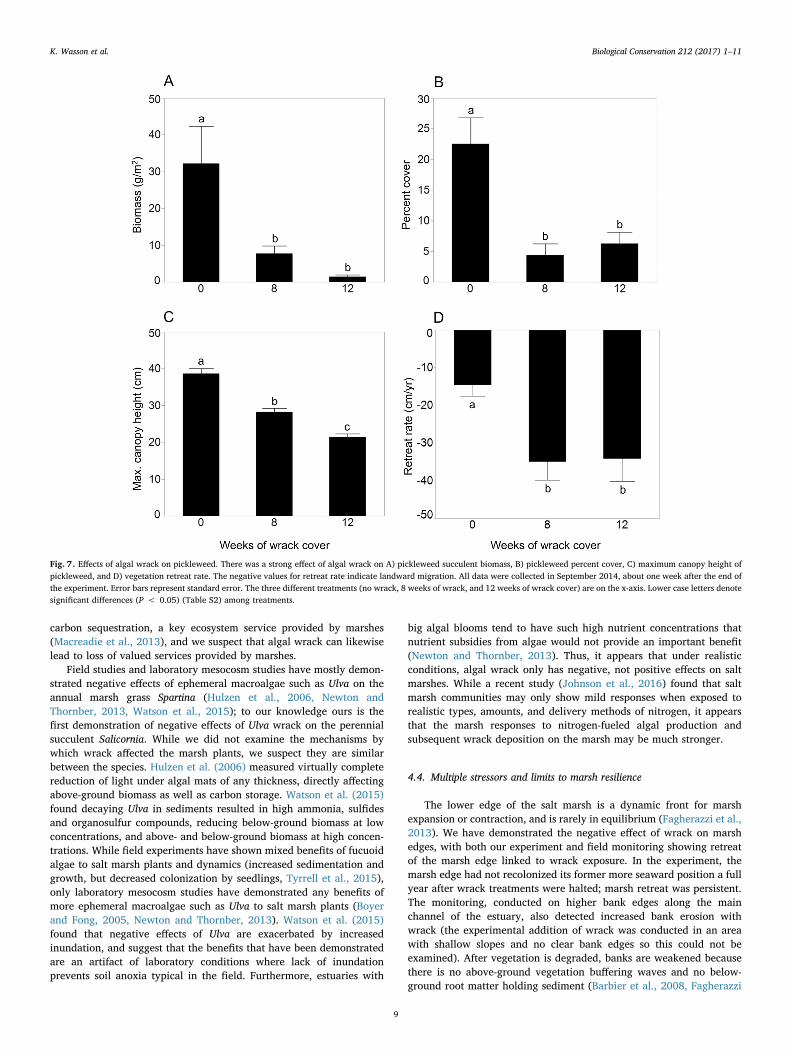
Prior to the initiation of the wrack treatments, in the May 2014assessment, plots assigned to the three different treatments did notdiffer significantly in ANOVA conducted on each parameter (Fig. S6). Inthe July 2014 assessment of flowering, we found flowers only in the “nowrack” treatment, a significant result (Pearson's Chi-square,P = 0.025). In the September 2014 assessment, we found the “nowrack” treatment differed significantly from the two wrack treatmentsfor two indicators of plant health (Fig. 7, Table S2), pickleweedsucculent biomass and pickleweed percent cover; the 8 and 12 weekwrack cover treatments did not differ significantly from each other. Forthe third indicator of plant health, maximum canopy height, all threetreatments differed; canopy height was far higher in the “no wrack”than “wrack” treatments, and it was also greater in the 8 vs. the12 week wrack treatment. Significantly less vegetation retreat occurredin the “no wrack” vs. wrack treatments; the two wrack treatments werenot significantly different. The control “no wrack” treatment had lowermarsh health in September 2014 than May 2014 (Fig. S6), and hadundergone some vegetation retreat, presumably in response to theextensive trampling from weekly visits to the plots.
In September 2015, the plots had not yet recovered (Fig. S6, TableS3). The “no wrack” treatment was significantly different from bothwrack treatments for two indicators (canopy height and vegetationretreat), and significantly different from just the 8 week treatment forthe other two indicators (biomass and percent cover). The 8 and12 week wrack treatments were not significantly different from eachother for any of the indicators of marsh health.
4. Discussion
4.1. Temporal patterns of eutrophication
Our time series spanning eight decades showed that macroalgalwrack on the salt marsh has increased over time, concurrent withnutrient concentrations and fertilizer use. The strong correlationobserved between wrack and nutrient concentrations over time sug-gests fertilizers intended for crops such as lettuce and strawberries inthis watershed are inadvertently also growing sea lettuce (Ulva) inElkhorn Slough. While the relationship between nutrient loading andincreases in macroalgal abundance is well known, primarily fromcomparative studies of estuaries with different nutrient loading levels(Duarte, 1995, Valiela et al., 1997), there are relatively few studiesquantifying change in nutrients and macroalgae at a single site overextended periods of time. Raffaelli (1999) demonstrated an increasebetween the 1950s and 1980s in a Scottish estuary using repeat fieldsurvey data. Repeated field surveys have also been useful for detectingdecreases in macroalgae likely resulting from better nutrient manage-ment practices; Sfriso et al. (2003) demonstrated a decrease inmacroalgae in Venice Lagoon between the 1980s and 1990s, whileKrause-Jensen et al. (2012) and Rasmussen et al. (2015) revealeddecreases in Danish coastal waters between the 1990s and 2000s. Wedo not know of a macroalgal time series as long as ours (80 years).Multi-decadal studies of changes in estuaries are rare, but critical forwise stewardship of coastal resources (Cloern et al., 2015). The remotesensing technique we used could readily be applied to other locations tolook at changes in frequency of wrack in photos over time.
Our δ15N analysis also provided a deeper temporal perspective onnutrient loading, examining current nutrient signatures relative to thosefrom the period before the widespread use of synthetic fertilizers. Bothdecadal and centennial demonstrations of nutrient loading, relative to
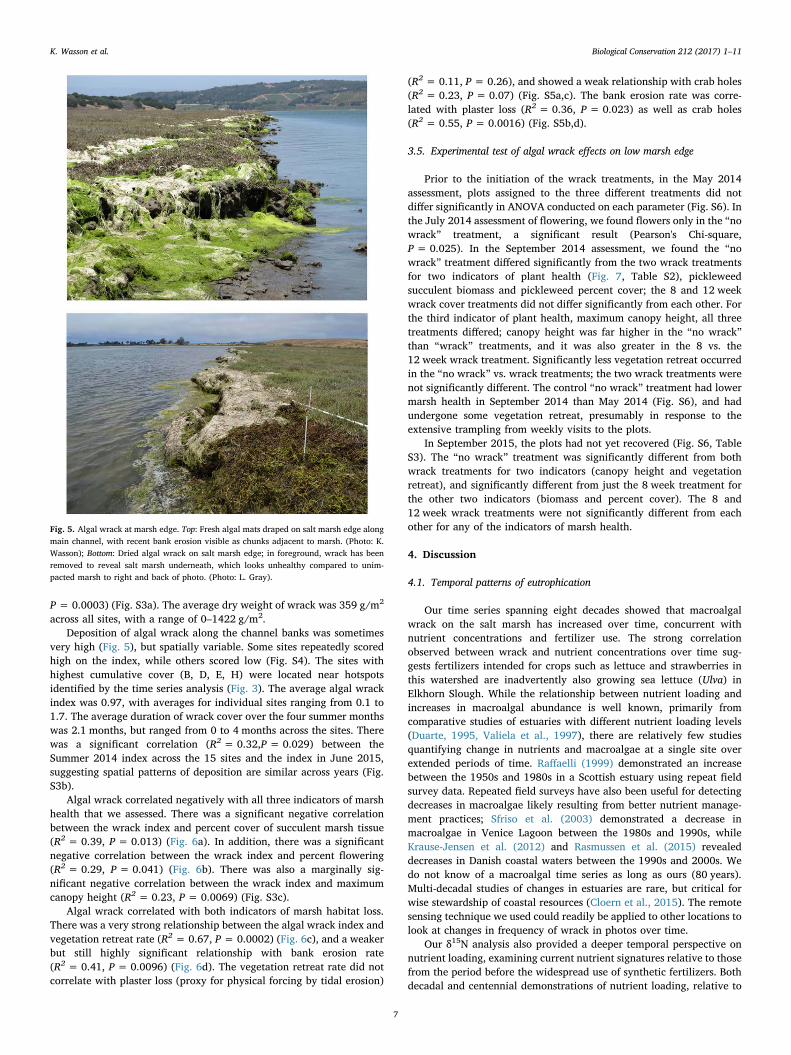
Fig. 5. Algal wrack at marsh edge. Top: Fresh algal mats draped on salt marsh edge alongmain channel, with recent bank erosion visible as chunks adjacent to marsh. (Photo: K.Wasson); Bottom: Dried algal wrack on salt marsh edge; in foreground, wrack has beenremoved to reveal salt marsh underneath, which looks unhealthy compared to unim-pacted marsh to right and back of photo. (Photo: L. Gray).
K. Wasson et al. Biological Conservation 212 (2017) 1–11
7
baselines, are useful for informing regulatory efforts, because suchdemonstrations quantify the increase in nutrients likely due to anthro-pogenic activities. Here, the reconstruction of changes in stablenitrogen isotope ratios provide firm evidence for historical increasesin nitrogen availability and thus for expanded presence of Ulva atElkhorn Slough.
On a shorter time scale, our field monitoring of intertidal macro-algal production revealed marked seasonal patterns. Macroalgae peakin summer, which coincides with the salt marsh growing season. Asimilar result was found by Hulzen et al. (2006) in the Netherlands. Thecoincident timing of growth of algae and marsh increases the potentialfor disturbance of the latter by the former.
4.2. Spatial patterns of wrack deposition
Some disturbances in nature are unpredictable, but this one – algalwrack deposition on the salt marsh – seems to have some predictability.Hulzen et al. (2006) working in the Scheldt estuary of the Netherlandsfound that the low marsh border accumulates a high proportion of algalwrack in the Scheldt estuary of the Netherlands. Our results for ElkhornSlough are similar: the marsh boundary with the mudflats of the mainchannel of the estuary had a greater frequency of algal wrack cover inour 80 year time series than did the marsh interior. However, not allportions of the marsh edge are equally affected. Our time series analysisidentified “hotspots” where algal wrack was found more frequently.Likewise, our field monitoring revealed that some marsh edges wereexposed to wrack repeatedly within the same season, and that thosesame areas were likely to be exposed a year later as well; these results
are very similar to ones from Hulzen et al. (2006). In a different studyfocusing on marsh disturbance by wrack consisting of marsh debris, notalgae, creek bends where water velocities slowed appeared to accumu-late the most wrack (Fischer et al., 2000). At Elkhorn Slough, the areaswhere algal wrack accumulated are predominantly west or south-facingedges, possibly due to wind waves or current patterns. These marshedges face chronic stress and are particularly vulnerable. Design ofmarsh restoration projects could take such predictability of disturbanceinto account by avoiding extensive representation of edges facing thedirections most prone to wrack accumulation.
4.3. Negative effects of algal wrack on marsh edge
Both our field monitoring of marsh edges exposed to variable levelsof wrack and our controlled field experiment manipulating exposure towrack revealed negative effects of wrack on marsh plants: decreasedcanopy height, percent cover, and flowering, and increased rate ofvegetation retreat. The monitoring enabled us to compare sites withvariable frequency and duration of exposure to wrack, and theexperiment included longer and shorter periods of wrack exposure.Given that marshes are nutrient-limited, we might have expected thatlow intensities or shorter duration of exposure to wrack might bebeneficial, while high levels are damaging. However, we found no suchbell-shaped curve of effects. Hulzen et al. (2006) also found a linearrelationship with frequency of wrack removal and marsh growth andcover. We thus concur with Watson et al. (2015): high nutrient loadsmanifested as massive algal blooms can exacerbate coastal marsh loss.A recent study found that seagrass wrack on marshes can lead to loss of
Fig. 6. Correlations between algal wrack index and marsh attributes. The wrack index was averaged across June–September 2014 sampling dates for each of the 15 stations. Significantcorrelations were obtained with A: succulent percent cover of marsh, B: percent of marsh that was flowering, C: vegetation retreat rate, and D: bank erosion rate. Linear regressions wereused for A, C and D; logarithmic regression was used for B. Black lines are the modeled trends and gray areas represent 95% confidence interval (A, C and D).
K. Wasson et al. Biological Conservation 212 (2017) 1–11
8
carbon sequestration, a key ecosystem service provided by marshes(Macreadie et al., 2013), and we suspect that algal wrack can likewiselead to loss of valued services provided by marshes.
Field studies and laboratory mesocosm studies have mostly demon-strated negative effects of ephemeral macroalgae such as Ulva on theannual marsh grass Spartina (Hulzen et al., 2006, Newton andThornber, 2013, Watson et al., 2015); to our knowledge ours is thefirst demonstration of negative effects of Ulva wrack on the perennialsucculent Salicornia. While we did not examine the mechanisms bywhich wrack affected the marsh plants, we suspect they are similarbetween the species. Hulzen et al. (2006) measured virtually completereduction of light under algal mats of any thickness, directly affectingabove-ground biomass as well as carbon storage. Watson et al. (2015)found decaying Ulva in sediments resulted in high ammonia, sulfidesand organosulfur compounds, reducing below-ground biomass at lowconcentrations, and above- and below-ground biomass at high concen-trations. While field experiments have shown mixed benefits of fucuoidalgae to salt marsh plants and dynamics (increased sedimentation andgrowth, but decreased colonization by seedlings, Tyrrell et al., 2015),only laboratory mesocosm studies have demonstrated any benefits ofmore ephemeral macroalgae such as Ulva to salt marsh plants (Boyerand Fong, 2005, Newton and Thornber, 2013). Watson et al. (2015)found that negative effects of Ulva are exacerbated by increasedinundation, and suggest that the benefits that have been demonstratedare an artifact of laboratory conditions where lack of inundationprevents soil anoxia typical in the field. Furthermore, estuaries with
big algal blooms tend to have such high nutrient concentrations thatnutrient subsidies from algae would not provide an important benefit(Newton and Thornber, 2013). Thus, it appears that under realisticconditions, algal wrack only has negative, not positive effects on saltmarshes. While a recent study (Johnson et al., 2016) found that saltmarsh communities may only show mild responses when exposed torealistic types, amounts, and delivery methods of nitrogen, it appearsthat the marsh responses to nitrogen-fueled algal production andsubsequent wrack deposition on the marsh may be much stronger.
4.4. Multiple stressors and limits to marsh resilience
The lower edge of the salt marsh is a dynamic front for marshexpansion or contraction, and is rarely in equilibrium (Fagherazzi et al.,2013). We have demonstrated the negative effect of wrack on marshedges, with both our experiment and field monitoring showing retreatof the marsh edge linked to wrack exposure. In the experiment, themarsh edge had not recolonized its former more seaward position a fullyear after wrack treatments were halted; marsh retreat was persistent.The monitoring, conducted on higher bank edges along the mainchannel of the estuary, also detected increased bank erosion withwrack (the experimental addition of wrack was conducted in an areawith shallow slopes and no clear bank edges so this could not beexamined). After vegetation is degraded, banks are weakened becausethere is no above-ground vegetation buffering waves and no below-ground root matter holding sediment (Barbier et al., 2008, Fagherazzi
Fig. 7. Effects of algal wrack on pickleweed. There was a strong effect of algal wrack on A) pickleweed succulent biomass, B) pickleweed percent cover, C) maximum canopy height ofpickleweed, and D) vegetation retreat rate. The negative values for retreat rate indicate landward migration. All data were collected in September 2014, about one week after the end ofthe experiment. Error bars represent standard error. The three different treatments (no wrack, 8 weeks of wrack, and 12 weeks of wrack cover) are on the x-axis. Lower case letters denotesignificant differences (P < 0.05) (Table S2) among treatments.
K. Wasson et al. Biological Conservation 212 (2017) 1–11
9
et al., 2013). While decline in marsh cover on the marsh plain can bereversible, bank erosion is not, in this low sediment system. Theelevation undergoes a sharp drop of 20–100 cm when chunks of bankerode (Fig. 5), and in the absence of a massive sediment supply, thismeans that marsh has permanently converted to mudflat. Mudflat andmarsh are thus alternate stable states at the bank edge in this estuarinesystem, and wrack can cause state shifts beyond the limits of marshresilience.
While we have focused on one stressor to the marsh edge, algalwrack, this stressor does not operate in isolation. Marsh edges areinherently unstable, and will retreat if loss due to erosion exceedssediment supply (Fagherazzi et al., 2013). Elkhorn Slough has experi-enced both increased erosion due to increased tidal currents resultingfrom an artificial harbor mouth, and decreased sediment supply due toriver diversion (Watson et al., 2011). Eutrophication also likely hasnegative effects other than wrack; monitoring data reveal subsidence ofthe marsh plain (C. Endris, unpublished data) that may be related toincreased microbial activity or decreased below-ground organic matteraccumulation such as has been demonstrated for other nutrient-loadedmarshes (Deegan et al., 2012). During the period of our monitoring andexperiment, California was experiencing unusually high water levels,and perhaps related to this, monitoring data showed retreat of the lowermarsh vegetation edge even at sites not affected by wrack (K. Wasson,A. Woolfolk, unpublished data). This may explain why even the lowwrack monitoring sites, and the control plots in the experiment under-went some vegetation retreat at the marsh edge (although we cannotrule out a cage effect). Furthermore, unavoidable trampling associatedwith weekly visits to the experimental sites appears to have negativelyaffected the entire marsh area, such that even the control plots had lesscover and biomass at the end of the experiment than the start. The lackof recovery of the wrack plots even after a full year may thus be due tothe combined effect of wrack, higher water levels, and trampling. Inanother example, Watson et al. (2015) showed that macroalgae havemuch stronger negative effects in highly inundated sediments, so wrackand sea level rise are likely to have synergistically negative effects onmarsh resilience. Likewise, Brewer et al. (1998) found an interactionbetween (non-algal) wrack and marsh elevation. We thus conclude thatin order to understand marsh resilience at the mudflat boundary, it iscritical to examine both abiotic drivers such as water levels andsediment supply and biotic drivers such as algal wrack and crabburrowing, as well as the interactions among them.
Acknowledgements
We are grateful to many dedicated volunteers for help with field-work, in particular L. Elder, H. Gonzales, S. Murphy, L. Mercado, B.Latham, A. Peters, and the Elkhorn Slough Stewardship Crew. S. Forkwas instrumental for all field assessments. We are indebted to C.Angelini, M. Fountain, and B. Silliman for guidance on the project, toP. Zelanko for assistance with laboratory analysis, and A. Oczkowski forhelpful discussions. Facilities and vehicles were provided by theCalifornia Department of Fish and Wildlife. The investigation wasfunded by a grant from NOAA's Office for Coastal Management to theElkhorn Slough Foundation on behalf of the Elkhorn Slough NationalEstuarine Research Reserve.
Appendix A. Supplementary methods and analyses
Supplementary details on the methods employed and additionalanalyses of the results related to this article can be found online athttp://dx.doi.org/10.1016/j.biocon.2017.05.019.
References
Abbott, I.A., Isabella, A., Hollenberg, G.J., 1992. Marine Algae of California. StanfordUniversity Press.
Aly, A.I.M., Mohamed, M.A., Hallaba, E., 1982. In: Schmidt, H.L., Forstel, H., Heinzinger,K. (Eds.), Natural variations of 15N-content of nitrate in ground and surface watersand total nitrogen of soil in the Wadi El-Natrun area in Egypt. Pages 475–481.Analytical Chemistry Symposia Series. Volume 11, Stable isotopes. Proceedings of theFourth International Conference, Juelich. 23–26 March 1981. Elsevier, Amsterdam,The Netherlands.
Barbier, E.B., Koch, E.W., Silliman, B.R., Hacker, S.D., Wolanski, E., Primavera, J.,Granek, E.F., Polasky, S., Aswani, S., Cramer, L.A., 2008. Coastal ecosystem-basedmanagement with nonlinear ecological functions and values. Science 319, 321–323.
Boyer, K.E., Fong, P., 2005. Macroalgal-mediated transfers of water column nitrogen tointertidal sediments and salt marsh plants. J. Exp. Mar. Biol. Ecol. 321, 59–69.
Boyer, K.E., Fong, P., Vance, R.R., Ambrose, R.F., 2001. Salicornia virginica in a southernCalifornia salt marsh: seasonal patterns and a nutrient-enrichment experiment.Wetlands 21, 315–326.
Brewer, J.S., Levine, J.M., Bertness, M.D., 1998. Interactive effects of elevation and burialwith wrack on plant community structure in some Rhode Island salt marshes. J. Ecol.86, 125–136.
Bricker, S.B., Longstaff, B., Dennison, W., Jones, A., Boicourt, K., Wicks, C., Woerner, J.,2008. Effects of nutrient enrichment in the nation's estuaries: a decade of change.Harmful Algae 8, 21–32.
Burkholder, J.M., Tomasko, D.A., Touchette, B.W., 2007. Seagrasses and eutrophication.J. Exp. Mar. Biol. Ecol. 350, 46–72.
Byer, M.D., Frame, G.W., Panagakos, W., Waaijer, M., Aranbayev, Z., Michaels, Y., Stalter,R., Schreibman, M.P., 2004. Effects of wrack accumulation on Spartina alterniflora,Jamiaca Bay Wildlife Refuge, New York City. 2004. Pages 183-190. In: Brebbia, C.A.,Saval Perez, J.M., Garcia Andion, L., Villacampa, Y. (Eds.), Coastal Environments V,Incorporating Oil Spill Studies. WIT Press, Southampton, UK.
Caffrey, J.M., Brown, M., Tyler, W.B., Silberstein, M. (Eds.), 2002. Changes in a CaliforniaEstuary: A Profile of Elkhorn Slough. Elkhorn Slough Foundation, Moss Landing.
Caffrey, J.M., Harrington, N., Ward, B., 2002b. Biogeochemical processes in a smallCalifornia estuary. 1. Benthic fluxes and pore water constituents reflect high nutrientfreshwater inputs. Mar. Ecol. Prog. Ser. 233, 39–53.
Castro, P., Valiela, I., Freitas, H., 2007. Eutrophication in Portuguese estuaries evidencedby δ15N of macrophytes. Mar. Ecol. Prog. Ser. 351, 43–51.
Cloern, J.E., Abreu, P.C., Carstensen, J., Chauvaud, L., Elmgren, R., Grall, J., Greening, H.,Johansson, J.O.R., Kahru, M., Sherwood, E.T., 2015. Human activities and climatevariability drive fast-paced change across the world's estuarine–coastal ecosystems.Glob. Chang. Biol.
Core Team, R., 2015. R: A Language and Environment for Statistical Computing. RFoundation for Statistical Computing, Vienna, Austria.
Deegan, L.A., Johnson, D.S., Warren, R.S., Peterson, B.J., Fleeger, J.W., Fagherazzi, S.,Wollheim, W.M., 2012. Coastal eutrophication as a driver of salt marsh loss. Nature490, 388–392.
Diaz, R.J., Rosenberg, R., 1995. Marine benthic hypoxia: a review of its ecological effectsand the behavioural responses of benthic macrofauna. Oceanogr. Mar. Biol. Annu.Rev. 33 (245–203).
Duarte, C.M., 1995. Submerged aquatic vegetation in relation to different nutrientregimes. Ophelia 41, 87–112.
Fagherazzi, S., Mariotti, G., Wiberg, P., McGlathery, K., 2013. Marsh collapse does notrequire sea level rise. Oceanography 26, 70–77.
Fischer, J.M., Reed-Andersen, T., Klug, J.L., Chalmers, A.G., 2000. Spatial pattern oflocalized disturbance along a southeastern salt marsh tidal creek. Estuaries 23,565–571.
Fletcher, R., 1996. The occurrence of “green tides”—a review. Pages 7–43. In: Schramm,W., Nienhuis, P. (Eds.), Marine Benthic Vegetation: Recent Changes and the Effects ofEutrophication. Springer, Berlin.
Fry, B., Allen, Y.C., 2003. Stable isotopes in zebra mussels as bioindicators ofriver–watershed linkages. River Res. Appl. 19, 683–696.
Fry, B., Gace, A., McClelland, J.W., 2003. Chemical indicators of anthropogenic nitrogen-loading in four Pacific estuaries. Pac. Sci. 57, 77–101.
Gedan, K.B., Silliman, B., Bertness, M., 2009. Centuries of human-driven change in saltmarsh ecosystems. Mar. Sci. 1.
Graham, S.A., Mendelssohn, I.A., 2014. Coastal wetland stability maintained throughcounterbalancing accretionary responses to chronic nutrient enrichment. Ecology 95,3271–3283.
Green, L., Fong, P., 2015. The good, the bad and the Ulva: the density dependent role ofmacroalgal subsidies in influencing diversity and trophic structure of an estuarinecommunity. Oikos.
Greene, C.M., Blackhart, K., Nohner, J., Candelmo, A., Nelson, D.M., 2015. A nationalassessment of stressors to estuarine fish habitats in the contiguous USA. Estuar. Coasts38, 782–799.
Hartig, E.K., Gornitz, V., Kolker, A., Mushacke, F., Fallon, D., 2002. Anthropogenic andclimate-change impacts on salt marshes of Jamaica Bay, New York City. Wetlands 22(1), 71–89.
Hauxwell, J., Cebrián, J., Furlong, C., Valiela, I., 2001. Macroalgal canopies contribute toeelgrass (Zostera marina) decline in temperate estuarine ecosystems. Ecology 82,1007–1022.
Hughes, B.B., Haskins, J.C., Wasson, K., Watson, E., 2011. Identifying factors thatinfluence expression of eutrophication in a central California estuary. Mar. Ecol.Prog. Ser. 439, 31–43.
Hughes, B.B., Eby, R., Van Dyke, E., Tinker, M.T., Marks, C.I., Johnson, K.S., Wasson, K.,2013. Recovery of a top predator mediates negative eutrophic effects on seagrass.Proc. Natl. Acad. Sci. 110, 15313–15318.
Hughes, B.B., Levey, M.D., Fountain, M.C., Carlisle, A.B., Chavez, F.P., Gleason, M.G.,2015. Climate mediates hypoxic stress on fish diversity and nursery function at theland–sea interface. Proc. Natl. Acad. Sci. 112, 8025–8030.
K. Wasson et al. Biological Conservation 212 (2017) 1–11
10
Hulzen, J.v., Soelen, J.v., Herman, P., Bouma, T., 2006. The significance of spatial andtemporal patterns of algal mat deposition in structuring salt marsh vegetation. J. Veg.Sci. 17, 291–298.
Johnson, D.S., Warren, R.S., Deegan, L.A., Mozdzer, T.J., 2016. Saltmarsh plant responsesto eutrophication. Ecol. Appl. 26, 2647–2659.
Kennish, M.J., 2002. Environmental threats and environmental future of estuaries.Environ. Conserv. 29, 78–107.
Kirwan, M.L., Megonigal, J.P., 2013. Tidal wetland stability in the face of human impactsand sea level rise. Nature 504, 53–60.
Krause-Jensen, D., Markager, S., Dalsgaard, T., 2012. Benthic and pelagic primaryproduction in different nutrient regimes. Estuar. Coasts 35, 527–545.
Kreitler, C.W., Ragone, S.E., Katz, B.G., 1978. N15/N14 ratios of ground-water nitrate,Long Island, New York. Ground Water 16, 404–409.
Lehmann, M.F., Reichert, P., Bernasconi, S.M., Barbieri, A., McKenzie, J.A., 2003.Modelling nitrogen and oxygen isotope fractionation during denitrification in alacustrine redox-transition zone. Geochim. Cosmochim. Acta 67, 2529–2542.
Macreadie, P.I., Hughes, A.R., Kimbro, D.L., 2013. Loss of ‘blue carbon’ from coastal saltmarshes following habitat disturbance. PLoS One 8, e69244.
Mariotti, A., 1983. Atmospheric nitrogen is a reliable standard for natural 15N abundancemeasurements. Nature 303, 685–687.
McClelland, J.W., Valiela, I., Michener, R.H., 1997. Nitrogen-stable isotope signatures inestuarine food webs: a record of increasing urbanization in coastal watersheds.Limnol. Oceanogr. 42, 930–937.
McGlathery, K.J., Reidenbach, M.A., D'Odorico, P., Fagherazzi, S., Pace, M.L., Porter,J.H., 2013. Nonlinear dynamics and alternative stable states in shallow coastalsystems. Oceanography 26, 220–231.
McKinney, R., Nelson, W., Charpentier, M., Wigand, C., 2001. Ribbed mussel nitrogenisotope signatures reflect nitrogen sources in coastal salt marshes. Ecol. Appl. 11,203–214.
Mcleod, E., Chmura, G.L., Bouillon, S., Salm, R., Björk, M., Duarte, C.M., Lovelock, C.E.,Schlesinger, W.H., Silliman, B.R., 2011. A blueprint for blue carbon: toward animproved understanding of the role of vegetated coastal habitats in sequestering CO2.Front. Ecol. Environ. 9, 552–560.
Morris, J., Shaffer, G., Nyman, J., 2013. Brinson review: Perspectives on the influence ofnutrients on the sustainability of coastal wetlands. Wetlands 33, 975–988.
Nedwell, D., Sage, A., Underwood, G., 2002. Rapid assessment of macro algal cover onintertidal sediments in a nutrified estuary. Sci. Total Environ. 285, 97–105.
Nelson, J.L., Zavaleta, E.S., 2012. Salt marsh as a coastal filter for the oceans: changes infunction with experimental increases in nitrogen loading and sea level rise. PLoS One7, e38558.
Newton, C., Thornber, C., 2013. Ecological impacts of macroalgal blooms on salt marshcommunities. Estuar. Coasts 36, 365–376.
Nixon, S.W., 1995. Coastal marine eutrophication: a definition, social causes, and futureconcerns. Ophelia 41, 199–219.
Nybakken, J.W., Cailliet, G.M., Broenkow, W.W., 1977. Ecologic and HydrographicStudies of Elkhorn Slough, Moss Landing Harbor and Nearshore Coastal Waters: July1974 to June 1976. Moss Landing Marine Laboratories.
Oczkowski, A., Nixon, S., Granger, S., El-Sayed, A.-F.M., Altabet, M., McKinney, R., 2008.
A preliminary survey of the nitrogen and carbon isotope characteristics of fish fromthe lagoons of Egypt's Nile delta. Estuar. Coasts 31, 1130–1142.
Oczkowski, A.J., Nixon, S.W., Granger, S.L., El-Sayed, A.-F.M., McKinney, R.A., 2009.Anthropogenic enhancement of Egypt's Mediterranean fishery. Proc. Natl. Acad. Sci.106, 1364–1367.
Powers, S.P., Peterson, C.H., Christian, R.R., Sullivan, E., Powers, M.J., Bishop, M.J.,Buzzelli, C.P., 2005. Effects of eutrophication on bottom habitat and prey resources ofdemersal fishes. Mar. Ecol. Prog. Ser. 302, 233–243.
Raffaelli, D., 1999. Nutrient enrichment and trophic organisation in an estuarine foodweb. Acta Oecol. 20, 449–461.
Rasmussen, J.R., Dromph, K.M., Göke, C., Krause-Jensen, D., 2015. Reduced cover ofdrifting macroalgae following nutrient reduction in Danish coastal waters. Estuar.Coasts 38, 1664–1677.
Schaadt, T., 2005. Patterns and Causes of Variability in the Cover, Biomass, and TotalAbundance of Ulva Spp. Elkhorn Slough, California. (MS Thesis) California StateUniversity, Monterey Bay.
Sfriso, A., Pavoni, B., Marcomini, A., Orio, A., 1992. Macroalgae, nutrient cycles, andpollutants in the Lagoon of Venice. Estuaries 15, 517–528.
Sfriso, A., Facca, C., Ghetti, P., 2003. Temporal and spatial changes of macroalgae andphytoplankton in a Mediterranean coastal area: the Venice lagoon as a case study.Mar. Environ. Res. 56, 617–636.
Smith, R.E., 1973. The hydrography of Elkhorn Slough: a shallow California coastalembayment. In: Contributions from the Moss Landing Marine Laboratories No. 42,Technical Publication 73–2. Moss Landing Marine Laboratories, Moss Landing, CA.
Turner, R.E., Howes, B.L., Teal, J.M., Milan, C.S., Swenson, E.M., Goehringer-Toner, D.D.,2009. Salt marshes and eutrophication: an unsustainable outcome. Limnol. Oceanogr.54, 1634.
Tyrrell, M., Thornber, C.S., Burkhardt, J., Congretel, M., 2015. The influence of salt marshfucoid algae (Ecads) on sediment dynamics of northwest Atlantic marshes. Estuar.Coasts 38, 1262–1273.
Valiela, I., Teal, J.M., 1979. The nitrogen budget of a salt marsh ecosystem. Nature 280,652–656.
Valiela, I., McClelland, J., Hauxwell, J., Behr, P.J., Hersh, D., Foreman, K., 1997.Macroalgal blooms in shallow estuaries: controls and ecophysiological and ecosystemconsequences. Limnol. Oceanogr. 42, 1105–1118.
Van Dyke, E., Wasson, K., 2005. Historical ecology of a central California estuary:150 years of habitat change. Estuaries 28, 173–189.
Watson, E.B., Wasson, K., Pasternack, G.B., Woolfolk, A., Van Dyke, E., Gray, A.B.,Pakenham, A., Wheatcroft, R.A., 2011. Applications from paleoecology toenvironmental management and restoration in a dynamic coastal environment.Restor. Ecol. 19, 765–775.
Watson, E., Oczkowski, A., Wigand, C., Hanson, A., Davey, E., Crosby, S., Johnson, R.,Andrews, H., 2014. Nutrient enrichment and precipitation changes do not enhanceresiliency of salt marshes to sea level rise in the Northeastern US. Clim. Chang. 125,501–509.
Watson, E., Wigand, C., Oczkowski, A., Sundberg, K., Vendettuoli, D., Jayaraman, S.,Saliba, K., Morris, J., 2015. Ulva additions alter soil biogeochemistry and negativelyimpact Spartina alterniflora growth. Mar. Ecol. Prog. Ser. 532, 59–72.
K. Wasson et al. Biological Conservation 212 (2017) 1–11
11