Embed Size (px)
Citation preview
TECHNISCHE UNIVERSITÄT MÜNCHEN
Fakultät Wissenschaftszentrum Weihenstephan für Ernährung, Landnutzung und Umwelt
Lehrstuhl für Technische Mikrobiologie
Evaluation of levan-producing acetic acid bacteria for their potential in gluten-free baking applications
Tharalinee Osen
Vollständiger Abdruck der von der Fakultät Wissenschaftszentrum Weihenstephan für
Ernährung, Landnutzung und Umwelt der Technischen Universität München zur Erlangung
des akademischen Grades eines
Doktors der Naturwissenschaften
genehmigten Dissertation.
Vorsitzender: Prof. Dr. Karl-Heinz Engel
Prüfer der Dissertation: 1. Prof. Dr. Rudi F. Vogel
2. apl. Prof. Dr. Peter Köhler
Die Dissertation wurde am 12.02.2018 bei der Technischen Universität München eingereicht
und durch die Fakultät Wissenschaftszentrum Weihenstephan für Ernährung, Landnutzung und
Umwelt am 16.05.2018 angenommen.

Acknowledgments
i
Acknowledgements
First of all, I would like to express my gratitude to my PhD advisor, Prof. Dr. Rudi F. Vogel,
for his patient guidance, invaluable suggestions, and useful critiques of this research work.
Secondly, I would like to thank my supervisor, Dr. Frank Jakob, for his support, motivation,
and help throughout my time as a PhD candidate. This PhD thesis would not have been possible
without the ideas and initiation from both of them.
I am particularly grateful to Prof. Dr. Peter Köhler for his time as the second examiner for my
PhD defense, and also for enabling measurements with the Volscan Profiler and texture
analyzer used in this work. Furthermore, I would like to thank Prof. Dr. Karl-Heinz Engel for
his time as the chairman of the examination committee. I also thank my students: Dorothee
Janßen, Janina Röller, and Sara Lopez-Grado Vela, for their works in supporting the
preliminary studies.
I wish to acknowledge the help provided by all the technical assistants, especially Monika
Engel for her help during my first months, and Sabine Forster for her technical assistance in
conducting the baking. In addition, I would like to thank Angela Seppeuer for her
administrative support of the project and my PhD study.
Additionally, I would like to acknowledge my colleagues: Dr. Andreas Geißler, Linda Höll,
Ann-Sophie Schott, and Alexander Lauterbach, for the good time we had shared inside and
outside of the office. I would like to offer my special thanks to Julia Brandt, my project partner,
and Desideria Brignone for their genuine friendship.
Finally, I wish to thank my father and my husband, Raffael, for their support and
encouragement that have helped me throughout my study. And I would like to dedicate this
work to my late mother, who I hope would be proud of me.

Abbreviations
iii
Abbreviations
% percentage
°C degree celcius
× g times gravity
A. Acetobacter
AAB acetic acid bacteria
AACC American Association for Clinical Chemistry
AF4 asymmetric flow field flow fractionation
ATP adenosine triphosphate
B. Bacillus
BLAST Basic Local Alignment Search Tool
bp base pair
CFU colony forming unit
CMC carboxymethyl cellulose
CO2 carbon dioxide
DNA deoxyribonucleic acid
dH2O demineralized water
dL deciliter
DY dough yield
EPS exopolysaccharide
FOS fructooligosaccharides
FQ fermentation quotient
g gram
G. Gluconobacter
Ga. Gluconacetobacter
GF gluten-free
h hour
Abbreviations
iv
HePS heteropolysaccharide
HoPS homopolysaccharide
HPLC High Performance Liquid Chromatography
HPMC hydroxypropyl methylcellulose
K. Kozakia
kDa kilodalton
kg kilogram
Kl. Klebsiella
L liter
L. Lactobacillus
LAB lactic acid bacteria
M molarity
MALDI-TOF-MS Matrix-Assisted-Laser-Desorption-Ionization-Time-Of-Flight Mass
Spectrometry
MALS Multi-Angle Light Scattering
MDa megadalton
Mg magnesium
min minute
mL milliliter
mm millimeter
mmol millimole
mMRS modified de Man, Rogosa and Sharpe medium
Mn Number average molecular weight
mN millinormality
Mw Weight average molecular weight
N newton
N. Neoasaia
NAD+ nicotinamide adenine nucleotide
Abbreviations
v
NaG sodium gluconate medium
NaOH sodium hydroxide
NCBI National Center for Biotechnology Information
nm nanometer
OD optical density
P. Pediococcus
PCR Polymerase Chain Reaction
Rn geo number average geometric radius
Rw geo weight average geometric radius
rpm round per minute
rRNA ribosomal ribonucleic acid
s second
S. Saccharomyces
sp. species
St. Streptococcus
TCA tricarboxylic acid
TMW Technische Mikrobiologie Weihenstephan
V volt
v/v volume by volume
vvm volume of air (Liter) per unit of medium (Liter) per unit of time (minute)
W. Weissella
w/w weight by weight
WSP water-soluble polysaccharide
X. Xanthomonas
Z. Zymomonas
µg microgram

Table of contents
vii
Table of contents
Acknowledgements ................................................................................................................. i
Abbreviations ....................................................................................................................... iii
Table of contents .................................................................................................................. vii
1. INTRODUCTION .............................................................................................................. 1
1.1. Celiac disease and gluten-free breads .......................................................................... 1
Using hydrocolloids to improve GF bread quality ............................................... 1
Sourdough technology for GF breads ................................................................... 2
1.2. Levan ........................................................................................................................... 3
Biosynthesis and bacterial levan production ......................................................... 4
Applications of levan ............................................................................................ 5
1.3. Acetic acid bacteria ..................................................................................................... 6
EPS from AAB ..................................................................................................... 7
Biotechnological and food applications of AAB .................................................. 7
1.4. Motivation and aims of this work ................................................................................ 8
Motivation and working hypotheses ..................................................................... 8
Aims and approach ............................................................................................... 9
2. MATERIAL AND METHODS ....................................................................................... 10
2.1. Strains, medium and cultivation ................................................................................ 10
AAB strains ......................................................................................................... 10
Cultivation of bacteria ......................................................................................... 10
Absorbance, cell counts, and pH determination ................................................. 10
2.2. Molecular techniques ................................................................................................. 11
16S rRNA colony PCR ....................................................................................... 11
NCBI BLAST ..................................................................................................... 11
2.3. Buckwheat sourdough fermentation .......................................................................... 12
Table of contents
viii
Preparation of sourdough .................................................................................... 12
Variation of molasses concentrations, inoculum sizes and dough yields ........... 12
Strain verification and identification .................................................................. 13
Determination of metabolites in buckwheat sourdoughs .................................... 13
2.4. EPS production, isolation, and analysis ..................................................................... 14
Levan production in shake flasks ........................................................................ 14
Levan production in bioreactor ........................................................................... 14
Isolation of EPS .................................................................................................. 14
Determination of sugar monomers in isolated EPS ............................................ 15
Structural analysis of levans from AAB ............................................................. 15
2.5. Baking experiments ................................................................................................... 16
Bread preparation and baking ............................................................................. 16
Sensory evaluation of sourdough breads ............................................................ 16
Instrumental analysis .......................................................................................... 17
Bread staling analysis ......................................................................................... 17
2.6. Statistical analysis ...................................................................................................... 18
3. RESULTS ........................................................................................................................ 19
3.1. Evaluation of in situ levan production by AAB in GF sourdoughs ........................... 19
Screening of levan producing AAB from molasses agar .................................... 19
Selection of levan-producing AAB from molasses medium .............................. 20
Characterization of growth and EPS production in sourdough .......................... 22
Backslopping experiments .................................................................................. 26
Effect of molasses concentrations, inoculum sizes and dough yields on the growth
and levan production of G. albidus and K. baliensis .................................................... 27
Size of levans produced by AAB in buckwheat doughs ..................................... 29
3.2. Influence of levan-producing AAB on buckwheat sourdough breads ...................... 32
Characterization of buckwheat sourdoughs fermented by AAB ......................... 32
Table of contents
ix
Evaluation of the sourdough addition on bread characteristics .......................... 35
Analyses of sourdough bread characteristics ...................................................... 36
Influence of added levan on the buckwheat bread quality .................................. 40
Size of levans produced by G. albidus in buckwheat doughs ............................. 43
3.3. Levan structure .......................................................................................................... 45
Levan production in shake flasks without pH control ........................................ 45
pH controlled levan production in bioreactors .................................................... 46
Effects of differently produced levans on the volume and crumb hardness of
gluten-free breads .......................................................................................................... 49
3.4. Levan production using molasses as carbon source .................................................. 52
Influence of molasses concentrations and inoculum sizes on the EPS production
....................................................................................................................................... 52
Levan production from molasses ........................................................................ 53
Alternative GF breads with levan-containing molasses ...................................... 59
4. DISCUSSION .................................................................................................................. 64
4.1. Evaluation of in situ levan production by AAB in GF sourdoughs ........................... 64
Buckwheat sourdough fermentations by different levan-producing AAB strains
....................................................................................................................................... 65
Effects of molasses concentrations, inoculum sizes and DY .............................. 69
In situ levans from AAB in buckwheat doughs .................................................. 71
4.2. Influence of levan-producing AAB on buckwheat sourdough breads ...................... 73
GF sourdough fermentations by AAB ................................................................ 73
Influences of sourdough fermentations from AAB on buckwheat sourdough
breads ............................................................................................................................ 75
Effects of levan on the buckwheat bread quality ................................................ 77
In situ levan in sourdoughs retarded the staling of buckwheat breads ............... 80
4.3. Levan structure .......................................................................................................... 83
Table of contents
x
Changes of levan size and mass during production ............................................ 83
Influence of differently produced levans on the quality of GF breads ............... 85
4.4. Levan production using molasses as carbon source .................................................. 88
Levan production from molasses by G. albidus and K. baliensis ....................... 88
HePS production by K. baliensis from molasses ................................................ 92
Alternative GF breads with EPS-containing molasses ....................................... 93
5. SUMMARY ..................................................................................................................... 97
6. ZUSAMMENFASSUNG ............................................................................................... 101
7. REFERENCES ............................................................................................................... 105
8. APPENDIX .................................................................................................................... 121
8.1. Appendix A: Sensory evaluation form for acceptance test ..................................... 121
8.2. Appendix B: Influence of Mg2+ on EPS production ................................................ 123
8.3. Appendix C: Water retention capacity of buckwheat flour with levan ................... 125
8.4. Appendix D: Moisture content of bread crumbs during storage ............................. 126
8.5. Appendix E: Levan production by G. albidus in shake flask VS bioreactor ........... 127
8.6. Appendix F: Alternative breads from fermented molasses ..................................... 128
9. List of publications derived from this work ................................................................... 131
10. Curriculum Vitae .......................................................................................................... 133
Introduction
1
1. INTRODUCTION
1.1. Celiac disease and gluten-free breads
Celiac disease is a chronic systemic autoimmune disorder that is triggered by a presence of
gluten peptides contained in the food products, causing an impaired expression of villi on
mucosal cell surfaces in the small intestine. The damaged villi consequently cause
malabsorption of nutrients and other negative effects on the body such as chronic diarrhea,
weight loss, and iron deficiency (Catassi et al., 2013; Fasano and Catassi, 2012). The only
treatment of celiac disease so far is a permanent consumption of gluten-free (GF) foods (Fasano
and Catassi, 2012). Gluten is a composite of structural proteins found in flours such as wheat,
rye, and barley, which are the key factors for quality of bread making (Gallagher et al., 2003).
The use of GF flours, which lack gluten proteins and some nutrients for the production of GF
breads, therefore, results in a lower product quality such as dry crumbling texture and poor
sensorial properties (Moroni et al., 2009). GF products are beneficial to people diagnosed with
gluten intolerance and wheat allergy, and they are also consumed by the health-conscious
consumers. Accordingly, there is still an increasing demand for the GF products, especially for
GF breads with similar quality to the normal, gluten-containing breads (Zannini et al., 2012).
Using hydrocolloids to improve GF bread quality
Due to the poor quality and low nutritional values of GF breads, combinations of methods have
been used to improve the GF bread quality. This includes the use of (1) different types of GF
flours and starches such as rice, corn, and buckwheat, (2) additives such as hydrocolloids,
proteins, and enzymes, (3) different production technologies such as partial baking and
sourdough fermentation, and (4) nutritional ingredients such as dietary fibers, minerals, and
vitamins, etc. (Capriles and Arêas, 2014; Zannini et al., 2012).
To replace the properties of gluten and ultimately improve the bread characteristics, additives
especially hydrocolloids are commonly used in the GF baking recipes. Hydrocolloids can be
used as bread-making improvers (Arendt et al., 2008), which bind water and change the dough
viscosity and viscoelastic properties, subsequently improving the loaf volume and crumb
structure of the breads (Anton and Artfield, 2008; Lazaridou et al., 2007; Rosell et al., 2001;
Sciarini et al., 2010). Hydrocolloids or gums are water-soluble, long-chain polysaccharides that
originate from different sources, for example, from the cellulose derivatives such as
hydroxypropyl methylcellulose (HPMC) and carboxymethyl cellulose (CMC); from plants or
Introduction
2
plant seeds such as pectin, locust bean gum, and guar gum; or from bacteria such as xanthan
gum, dextran, and levan (Anton and Artfield, 2008; Lazaridou et al., 2007; Rosell et al., 2001;
Rühmkorf et al., 2012b; Sciarini et al., 2010). Currently, xanthan gum and HPMC are the most
common hydrocolloids used to produce GF breads by the baking industry (Anton and Artfield,
2008).
Despite the potential of hydrocolloids in improving GF bread characteristics, the use of
hydrocolloids as the additive in bread can be considered as artificial or even unhealthy by the
consumers (Bredahl, 1999). The negative perception of consumers on the additives is even
higher, when hydrocolloids with unfamiliar names such as CMC and xanthan gum are used
(Varela and Fiszman, 2013). As a result, although there are already some GF breads with
improved quality available commercially, there is still a gap in the GF market where the natural,
additive-free GF products can fill to serve the growing consumer demand (Di Cagno et al.,
2006; Rühmkorf et al., 2012b; Varela and Fiszman, 2013).
Sourdough technology for GF breads
Sourdoughs have long been used for the leavening of the doughs as well as for the acid and
flavor formations in wheat and rye doughs (Arendt et al., 2007; Vogel et al., 1994). They are a
mixture of flour and water fermented by lactic acid bacteria (LAB) and yeasts in a complex
ecosystem, resulting in several biochemical processes such as acidification, proteolysis, and
syntheses of enzymes, antifungal compounds (Corsetti et al., 1998b; Lavermicocca et al., 2000)
as well as exopolysaccharides (EPS) (Korakli et al., 2001; Tieking et al., 2003). Such bacterial
and enzymatic biochemical changes positively enhance the sensory, nutritional values, and
physical qualities of the breads (Arendt et al., 2007; Gobbetti et al., 2014), which may also be
applicable to the GF breads (Moroni et al., 2009; Thompson, 2000).
In sourdough, levan is one type of EPS that is formed naturally in situ during a classical
wheat/rye sourdough fermentation by cereal-related LAB strains such as Lactobacillus (L.)
reuteri (Galle et al., 2012b; Schwab et al., 2008) or L. sanfranciscensis (Kaditzky et al., 2008;
Korakli et al., 2001; Tieking et al., 2003). The naturally presence of EPS in the sourdough can
contribute to the structural development of GF sourdough breads (Tieking et al., 2003), since
it may replace the hydrocolloids currently added in GF breads to mimic the structure forming
impact of the missing gluten proteins (Anton and Artfield, 2008; Hager and Arendt, 2013;
Lazaridou et al., 2007). The use of EPS-containing sourdough for the production of GF breads
Introduction
3
without additives would be ideal to serve the market of high quality, clean-label GF products
as mentioned earlier (Capriles and Arêas, 2014).
However, mixed results on the effect of in situ produced EPS on the quality of GF sourdough
breads were shown by different studies, for example, Galle et al. (2012b) reported the reduction
in the crumb hardness and prolongation of the shelf-life of sorghum sourdough breads in the
presence of in situ produced fructan by L. reuteri Y2, while no positive influence was found
by levan from L. reuteri LTH5448 on sorghum breads (Schwab et al., 2008) or from L.
sanfranciscensis on wheat breads (Kaditzky et al., 2008). The inconsistent results may be
influenced by the low quantity of levan formed in sourdough and/or by the acidification from
bacterial fermentation (Kaditzky and Rudi, 2008). Additionally, previous research has pointed
out the influence of EPS structure on the degree of bread improvement (Rühmkorf et al.,
2012b), which might also contribute to the varying results by different authors, which mostly
focus on EPS amounts and neglect EPS macromolecular properties. As a result, the use of
different bacterial strains or growth conditions that can produce higher concentration and/or
effective structure of levan during sourdough fermentation may provide a better positive effect
on the bread quality than the currently used strains.
1.2. Levan
Levan is a biopolymer of fructose. It is a homopolysaccharide (HoPS) of the fructan type,
consisting mostly of fructose monomers linked by β-(2,6) glycosidic bonds with possible
β-(2,1) branches. This EPS can be synthesized by some plant species usually with lower degree
of polymerization (DP < 100) as part of storage carbohydrate (Pontis, 1990), or produced
extracellularly by several microorganisms generally with higher molecular masses (Öner et al.,
2016). The bacterial levan has been found in some biofilms in various environments such as
soil, plants, and fermented food; and it may provide resistance to bacterial cells under stress
such as high osmotic or desiccated conditions (Velazquez-Hernandez et al., 2011) or serve as
an energy source under starvation of bacteria (Öner et al., 2016).
The remarkable properties of levan over other polysaccharides are the non-gelling behavior,
high water solubility (Han and Clarke, 1990), and low intrinsic viscosity (Arvidson et al.,
2006). The intrinsic viscosity of levan was reported to be around 0.07-0.38 dL/g (Arvidson et
al., 2006; Bae et al., 2008; Benigar et al., 2014), compared to 1 dL/g in amylose and dextran,
Introduction
4
or 5-50 dL/g in cellulose, carrageenan, xanthan or guar gum (Carriere et al., 1993; Chronakis
et al., 2000; Funami et al., 2005; Morris and Ross-Murphy, 1981). The low intrinsic viscosity
of levan indicates a relatively small space per unit mass required by levan, which implies the
spherical and compact nature of the levan molecules (Arvidson et al., 2006; Bae et al., 2008).
In aqueous solution, a Newtonian-like behavior was observed at low levan concentration, while
a pseudoplastic (shear-thinning) behavior was reported at higher concentration (Arvidson et
al., 2006; Benigar et al., 2014). The point of this transition in rheology of levan solution varies
among different bacterial sources, wherein the molecular weight (Mw) of levan was reported to
influence levan solubility and the associated rheology (Benigar et al., 2014).
Biosynthesis and bacterial levan production
For bacterial levan synthesis, levansucrases (E.C. 2.4.1.10, sucrose:2-6-β-D-fructan 6-β-D-
fructosyltransferase) are the enzymes responsible for the catalysis of polyfructose chains from
sucrose substrate. In addition to their fructosyltransferase activity, which results in the
formation of levan and/or oligosaccharides (having fructan chain or sucrose as acceptors,
respectively), levansucrases also exhibit a sucrose hydrolysis activity when water is used as an
acceptor (Yanase et al., 1991).
Several bacterial strains are reported to produce levan from sucrose, including gram-positive
bacteria such as Bacillus (B.) subtilis (Tanaka et al., 1978), Paenibacillus (Pa.) polymyxa
(Liang and Wang, 2015), Leuconostoc (Le.) citreum (Han et al., 2016), and Streptococcus (St.)
sp. (Simms et al., 1990), as well as gram-negative bacteria such as Gluconobacter (G.) species
(Jakob et al., 2012a), Gluconacetobacter (Ga.) diazotrophicus (Molinari and Boiardi, 2013),
Halomonas sp. (Kucukasik et al., 2011), Zymomonas (Z.) mobilis (Yanase et al., 1991), and
Pseudomonas fluorescens (Raza et al., 2012). In addition to the differences in the final levan
concentrations, bacterial levans also vary in their molecular sizes and masses, depending on the
strains used. For example, B. subtilis NATTO produced levan with two fractions of Mw less
than 50 kDa and 0.5-2 MDa (Dos Santos et al., 2013; Wu et al., 2013), while levans isolated
from Kozakia (K.) baliensis DSM 14400 was remarkably large with Mw of 1000-2000 MDa
(Jakob et al., 2013). In addition to levan synthesis in the whole cell systems, isolated
levansucrase was also used to produce levan in a cell-free environment, in which the
contamination risk can be avoided (Srikanth et al., 2015) and the transferase as well as
hydrolysis activities of the enzyme can be exclusively monitored (Euzenat et al., 1997; Yanase
et al., 1992).
Introduction
5
Environmental factors such as sucrose concentration, pH, temperature, oxygen concentration
(aeration and agitation speed) as well as culture medium were reported to influence the levan
production (Abdel-Fattah et al., 2005; Euzenat et al., 1997; Öner et al., 2016; Santos-Moriano
et al., 2015; Wu et al., 2013). The highest bacterial levan productions reported so far were
111.6 g/L by submerged culture of B. subtilis NATTO from 400 g/L sucrose (Dos Santos et
al., 2013), 112.53 g/L by immobilized Z. mobilis CCT4494 from 300 g/L sucrose (Lorenzetti
et al., 2015), or up to 100 g/L by intracellular levansucrase of B. methylotrophicus SK 21.002
(Zhang et al., 2014).
Interestingly, some conditions such as sucrose concentration, enzyme concentration, and
temperature were shown to also influence the Mw of levan from B. subtilis (Abdel-Fattah et al.,
2005; Euzenat et al., 1997; Wu et al., 2013). These findings are crucial, since the variations of
levan size have been shown to influence not only on the characteristics but also on its functions,
e.g. on antitumor (Calazans et al., 2000) and antiviral activities (Esawy et al., 2011) of levan
from Z. mobilis and Bacillus sp., respectively. Nevertheless, no information is available if the
structure of levan from other bacteria is also affected by varying growth conditions; or if the
change of levan size by these bacteria also influences its functionality in other applications.
Applications of levan
Due to the unique characteristics of levan, it can be used in several applications ranging from
food and feed (prebiotics, stabilizer, fat substitute), cosmetics (whitener, moisturizer), to
pharmaceuticals (anti-oxidant, anti-inflammatory, anti-cancer activities) industries (Kang et
al., 2009; Moscovici, 2015; Öner et al., 2016; Srikanth et al., 2015). The commercial use of
levan is currently still limited, which might be due to (1) the weak chemical stability under acid
or high temperature conditions (Bekers et al., 2005) or (2) the costly purification process in
large scale production (Kang et al., 2009). Nonetheless, an increasing availability of levan by
different companies is anticipated due to its several valuable potentials (Öner et al., 2016).
In fermented food products, levan may be consumed unconsciously by human since it is
produced naturally. In addition to fructooligosaccharides (FOS) and inulin as the well-known
prebiotics, levan also has the prebiotic effect in food (Adamberg et al., 2015). Since levan is
acid hydrolyzed in the stomach, it is degraded and fully fermented by lumen bacteria, thus
increasing the population of endogenous bifidobacteria in ceacum and colon (Kang et al., 2009;
Srikanth et al., 2015). The rheological properties of levan also allow its application in food as
Introduction
6
a stabilizer, an emulsifier, a flavor enhancer or a texture improver in dairy, beverages, and
baked products (Booten et al., 1998; Han, 1990; Jakob et al., 2012b; Vincent et al., 2005).
In the case of baking application, levan acted as hydrocolloid and could increase the specific
volume, reduce the crumb hardness and delay the staling rate of different types of breads (Jakob
et al., 2012b; Kaditzky et al., 2008; Rühmkorf et al., 2012b). However, the real effect of levan
on bread quality is still unclear, since influences from bacterial strains and other EPS (e.g.
dextran and reuteran) existed in earlier studies (Jakob et al., 2012b; Rühmkorf et al., 2012b).
1.3. Acetic acid bacteria
Acetic acid bacteria (AAB) are obligate aerobic, gram-negative bacteria that have the ability
to incompletely oxidize several types of sugar and alcohol into organic acids (Deppenmeier et
al., 2002). There are currently 17 genera of AAB, even though most of the species are in the
genera Acetobacter, Gluconobacter, Gluconacetobacter, Asaia, and Komagataeibacter
(Yamada, 2016). Based on the oxidation capability, AAB can also be categorized into 3 groups:
full (e.g. Acetobacter, Gluconacetobacter, Asaia), weak (e.g. Kozakia), and incomplete
oxidizers (e.g. Neoasaia, Gluconobacter) (Sengun and Karabiyikli, 2011). The full and weak
oxidizers have a complete set of tricarboxylic acid cycle (TCA) enzymes necessary for the
further oxidization of organic acids into carbon dioxide (CO2) and water (Benito, 2005). In
contrast, the incomplete oxidizers lack some enzymes in the TCA cycle such as succinate
dehydrogenase and succinyl-CoA synthetase (Prust et al., 2005), making it valuable for the
biotechnological applications for glutamate, aspartate and succinate syntheses (Macauley et al.,
2001; Mamlouk and Gullo, 2013).
In nature, AAB strains are widely found in the sugary, alcoholic, and acidic environments such
as in fruits, flowers, and some fermented beverages (Deppenmeier et al., 2002; Mamlouk and
Gullo, 2013). They can be considered as food spoilage organisms, when grown in the products
where acidity is unfavorable such as beer and wine; or as desired acid-producing organisms for
some fermented food such as kombucha, Bionade, vinegar, and water kefir (Pothakos et al.,
2016; Raspor and Goranovic, 2008). AAB are often found together with other microorganisms
such as yeasts and LAB in a symbiosis relationship e.g. in water kefir grain (Gulitz et al., 2011)
or cocoa bean fermentation (Lefeber et al., 2010).
Introduction
7
EPS from AAB
Some AAB strains were found to produce different types of EPS, for example, dextran from
dextrin by G. oxydans (formerly Acetobacter viscosum), or water-insoluble cellulose from
glucose and water-soluble heteropolysaccharide (HePS) called acetan by Ga. xylinus (Hehre
and Hamilton, 1949; Hernández et al., 1995; Mamlouk and Gullo, 2013). Cellulose synthesis
by AAB has been widely studied due to its excellent properties and unique nano-morphology
than the plant cellulose (Raspor and Goranovic, 2008). In a static culture, a cellulose mat is
formed, covering the surface of the growth medium to provide oxygen and nutrient supply for
the entrapped cells (Mamlouk and Gullo, 2013). In food, this cellulose mat can be called
differently depending on its source, for example, as a mother of vinegar in the traditional
vinegar production, SCOBY (symbiotic culture of bacteria and yeast) in the kombucha
production, or Nata de coco in the coconut jelly production.
Many AAB strains such as Ga. diazotrophicus (Molinari and Boiardi, 2013), Ga. xylinus
(Kornmann et al., 2003), K. baliensis (Lisdiyanti et al., 2002), and Asaia bogorensis (Kato et
al., 2007) harbor levansucrase enzyme and, therefore, are able to produce levan from sucrose.
The soluble levan is produced extracellularly into the liquid medium and causes the slimy
appearance to the bacterial colonies when grown on solid medium containing sucrose (Idogawa
et al., 2014; Jakob et al., 2012a). Some of these strains produce relatively high amount and/or
remarkably higher Mw of levan than other known microorganisms (Hernandez et al., 2000;
Jakob et al., 2013; Kato et al., 2007; Kornmann et al., 2003; Molinari and Boiardi, 2013); but
so far only few information is available on these levan-producing AAB strains or on the
possible application of the high Mw levan. More studies on the levan-producing AAB and the
high Mw levan production are important to broaden the potential of both AAB and levan in the
unexplored applications.
Biotechnological and food applications of AAB
The unique characteristics of AAB allows several oxidative fermentations of sugars, sugar
alcohols, and ethanol into products used in various biotechnology industries. This includes, for
example, the production of L-ascorbic acid (vitamin C) from D-sorbitol, or gluconate and
ketogluconates from D-glucose (Deppenmeier et al., 2002; Raspor and Goranovic, 2008;
Sengun and Karabiyikli, 2011). Moreover, AAB play an important role in the food industry,
Introduction
8
ranging from the production of vinegar, cocoa pulps fermentation for chocolate, tea
fermentation for kombucha beverage, to cellulose production for coconut jelly as dessert.
Some of these biotechnological processes have long been practiced for thousands of years, at
the same time new AAB species have been continuously isolated; nevertheless, only few AAB
strains of Acetobacter, Gluconacetobacter, and Gluconobacter are widely studied and
commercially used (Raspor and Goranovic, 2009), leaving the potentials of other AAB
unexplored. The utilization of AAB for biotechnological applications from low cost substrate,
for example, can be of interest by the industry. As levan production requires sucrose as
substrate, the search for AAB strain that produce high Mw levan from molasses, which contains
40-50% sucrose as well as salts, minerals, and heavy metals (Roukas and Liakopoulou-
Kyriakides, 1999), will be beneficial for the applications of high Mw levan in a more
economical way.
1.4. Motivation and aims of this work
Motivation and working hypotheses
Despite the potential of EPS-containing sourdough for the development of additive-free GF
bread, low production of EPS in GF substrate by LAB may not effectively improve the bread
quality as anticipated. Additionally, the strain-dependent characteristics of EPS such as Mw,
degree of branching, and type of linkages also influence the rheological properties and
ultimately its function in breads (Lacaze et al., 2007; Rühmkorf et al., 2012b). Recent findings
reported the higher production of larger molecular size levan by some AAB strains than the
traditional LAB; and the levans from these AAB were also shown to significantly improve the
volume and texture of wheat breads, in which the dough structure has already existed (Jakob
et al., 2012b). Since the necessary structure-forming compound is absent in the GF ingredients,
the positive effect of levan from AAB as a structure improver could be even more prominent
in the GF breads than in the wheat breads. Additionally, because sucrose is necessary for the
competitiveness of AAB in sourdough (Brandt, 2013), molasses can be selected as an
alternative, natural source of sucrose for the levan production in sourdough, as it has already
been used for the nutritional improvement of several kinds of breads (Bakr, 1997; Filipcev,
2011; Simurina et al., 2012). Accordingly, replacing the traditional LAB with the levan-
producing AAB in the GF sourdough fermentation may successfully result in the in situ
Introduction
9
production of effective levan that can improve the quality of GF breads in a clean and natural
way.
The working hypotheses of this dissertation are (1) AAB can produce high amount of high Mw
levan in buckwheat molasses sourdough, (2) due to the structure formed in dough by levan,
addition of levan-containing sourdough from AAB can significantly improve the GF bread
quality, (3) the molecular size of bacterial levan can be controlled by fermentation parameters,
and (4) molasses is a suitable source for growth and levan production of AAB.
Aims and approach
Based on the key hypothesis that levan from AAB can significantly improve the textural quality
of GF bread due to its high amount and high Mw, the main goal of this work is to evaluate the
potential of levan from AAB in GF baking application. Accordingly, we aim to (1) develop a
novel, aerobic GF sourdough fermentation by levan-producing AAB using buckwheat flour as
a model GF flour and molasses as the sucrose source, (2) improve the quality of additive-free
GF breads using these sourdoughs, (3) uncover the parameters involved in the formation of
levan during AAB fermentation, and (4) establish a new levan production by AAB using low
cost substrate such as molasses.
To achieve these aims, the study will start with the screening and selection of levan-producing
AAB strains from molasses. The ability of AAB to grow and produce high amount of levan in
situ in buckwheat sourdoughs containing molasses will be determined. Afterwards the sensory
and physical quality of GF breads prepared with sourdoughs from AAB will be evaluated. In
addition, we will monitor the changes of levan molecular size and mass during the levan
production in sourdough and in laboratory medium. Subsequently, the effect of levan size on
its function in GF baking will be elaborated. Lastly, levan production by AAB fermentation
from molasses will be performed to evaluate its potential in the biotechnological aspect.
The results of this dissertation will not only offer an alternative method for the development of
GF bread using novel sourdough from levan-producing AAB, but also broaden the application
of levan and AAB strains in food industry. In addition, further analysis of levan structure and
its effect in baking application as well as the study of levan production from molasses will
provide valuable information for the levan-relating industries, which are not limited only to
food application.
Material and methods
10
2. MATERIAL AND METHODS
2.1. Strains, medium and cultivation
AAB strains
A total of 24 AAB strains were used in this work, including strains of Asaia, Gluconobacter
(G.), Gluconacetobacter (Ga.), Neoasaia (N.), and Kozakia (K.). The most used AAB strains
were G. albidus TMW 2.1191 isolated from water kefir (Gulitz et al., 2011), K. baliensis NBRC
16680 from Indonesian ragi starter (Lisdiyanti et al., 2002), N. chiangmaiensis NBRC 101099
from a Thai red ginger flower (Yukphan et al., 2005), and Ga. azotocaptans DSM 13594 from
Mexican coffee plants (Fuentes-Ramirez et al., 2001). The mutant strain of K. baliensis NBRC
16680 without the ability to produce heteropolysaccharide (rough strain) was a courtesy of
Julia Brandt (Brandt et al., 2016). All strains were stored in a glycerol stock (40%) at - 80 °C
for long term storage.
Cultivation of bacteria
The AAB strains were cultivated aerobically in a sodium gluconate (NaG) medium modified
from Adachi et al. (1979) containing 20 g/L sodium gluconate, 3 g/L yeast extract, 2 g/L
peptone from casein, 3 g/L glycerol, 0.2 g/L MgSO4.7H2O, 10 g/L mannitol, and 20 g/L agar
for agar plates (pH 6.0). For screening of levan-producing AAB strains, molasses agar plates
were used. The molasses agar plates were prepared by pasteurizing 20% (w/w) molasses in a
water bath at 100 °C for 45 min, before mixing with sterile 4% (w/w) agar solution to obtain a
final molasses concentration of 10% (w/w). For cultivation of AAB in liquid culture, pre-
cultures were first prepared in liquid NaG medium to the mid-exponential growth phase to the
cell concentration of ca. 109 CFU/mL. The liquid medium in the Erlenmayer flask was
inoculated at 5% (v/v) with the pre-culture and incubated in the orbital shaker (WiseCube®,
Witeg Labortechnik GmbH, Germany) at 200 rpm, 30 °C in triplicate.
Absorbance, cell counts, and pH determination
The optical density (OD) of fermentation broth was measured at 600 nm using a
spectrophotometer (Novaspec® Plus, Amersham Biosciences, UK). Viable cell counts were
determined by serial dilutions with 0.1% peptone-salt solution (1 g/L peptone from casein, 8.5
g/L NaCl, pH 7.0) and subsequently plating on NaG agar plates. For plating from sourdough
Material and methods
11
samples, NaG agar plates containing 65 mg/L Penicillin G (to suppress the Gram-positive
bacteria) were used for AAB selection, with additional 40 g/L sucrose in case of K. baliensis.
A modified de Man, Rogosa and Sharpe medium (mMRS) (Stolz et al., 1995) containing 10
g/L maltose, 5 g/L glucose, 5 g/L fructose, and 15 g/L agar (pH 6.2) was used to determine the
cell counts of LAB with an addition of 3 g/L 2-Phenyl ethanol to suppress the Gram-negative
bacteria (Lilley and Brewer, 1953). The pH of fermentation broths or sourdoughs were
measured by a pH meter (Calimatic 761, Knick, Germany). In sourdough fermentation, cell
counts and dough pH were determined at 0, 6, 24, 30, and 48 h (small scale) and at 0, 6, 24,
30, 48, 54, and 72 h (big scale), respectively. For growth in controlled pH conditions, OD600
was measured every 2 hours in the first 12 h and at 24, 32, and 48 h.
2.2. Molecular techniques
16S rRNA colony PCR
The amplification of 16S ribosomal RNA (rRNA) gene was performed in order to identify
and/or verify AAB and the sourdough isolated LAB strains using a Taq DNA core kit (MP
Biomedicals, USA). One polymerase chain reaction (PCR) of 50 µL contained 1x PCR buffer
with 1.5 mM MgCl2, 0.2 mM dNTPs, 0.5 µM 616V and 609R primers (Eurofins Genomics
GmbH, Germany) and 1.25 U Taq DNA polymerase. The 16S colony PCR was performed in
a gradient cycler (Mastercycler gradient, Eppendorf, Germany) using a program that started
with an initial denaturation at 94 °C for 2 min, followed by 32 cycles of denaturation (94 °C,
45 s), annealing (52 °C, 90 s) and elongation (72 °C, 2 min). Final elongation was at 72 °C for
5 min. The positive PCR reactions with a single band at 800-900 bp were detected by a gel
electrophoresis using 1% agarose (Biozym LE Agarose, Biozym Scientific GmbH, Germany)
at 120 V, 250 mA for 60 min.
NCBI BLAST
The PCR products were first purified with an E.Z.N.A.® Cycle-Pure kit (Omega Bio-tek, USA)
and later sequenced by GATC Biotech (Germany). The sequencing chromatograms were
examined by BioEdit program (version 7.2.0, USA) and the nucleotide sequences were
BLASTed to search for the best match sequences to identify the microorganisms in the NCBI
database (Johnson et al., 2008).
Material and methods
12
2.3. Buckwheat sourdough fermentation
Preparation of sourdough
Buckwheat doughs with a dough yield (DY) of 350 were prepared with 100 g organic
buckwheat flour (Bauck GmbH & Co. KG, Rosche, Germany), 250 g tap water, and 35 g
sugarcane molasses as sugar sources, consisting of 41.2% (w/w) sucrose, 7.3% glucose, and
10.3% fructose (supplier data: August Töpfer & Co. (GmbH & Co.) KG, Hamburg, Germany).
Erlenmeyer flasks (100-mL or 2-L size) containing 15.4 g of dough (small scale) or 300 g
doughs (large scale) were inoculated with the pre-cultures to approximately 5 x 10⁷ CFU/g
dough and incubated at 30 °C, 200 rpm. The pre-cultures of N. chiangmaiensis was
concentrated 5 times to increase the cell density before inoculation. To prepare sourdoughs for
bread makings, buckwheat doughs were fermented for 24, 30, or 48 h and stored at - 20 °C.
Chemically acidified control doughs (C.A.) were prepared by adding 20 µg/g flour
chloramphenicol and 10 µg/g flour erythromycin, and was acidified with glacial acetic acid to
pH 3.5 (small scale) or with 100% acetic acid, 90% D,L-lactic acid, and 50% gluconic acid
(large scale) before incubation without inoculation. The blank doughs without antibiotics and
acidification were also prepared to observe the natural microbiota fermentation. Different
amounts of organic acids were added to obtain the concentrations similar to the acids formed
in the real sourdoughs fermented for 24, 30, and 48 h by G. albidus. All fermentations were
carried out in triplicate.
Variation of molasses concentrations, inoculum sizes and dough yields
To determine the effect of molasses concentration, the buckwheat doughs (DY 350) containing
8.75, 17.50, 26.25, 35.00, 52.50, 70.00, and 87.50% (flour base) molasses were prepared, which
corresponded to sucrose concentrations of 10, 20, 30, 40, 60, 80, and 100 g/L dough,
respectively. The initial cell counts of these doughs were approximately 5 x 10⁷ CFU/g dough.
The effect of inoculum size was determined by inoculating the dough (35% molasses, DY 350)
with 2.5, 5, 7.5, and 10% (v/v) of a mid-exponential pre-culture, resulting in an initial cell count
of approximately 3 × 10⁷, 6 × 10⁷, 9 × 10⁷, and 1.2 × 10⁸ CFU/g dough, respectively. The effect
of DY was determined by preparing the dough with DY of 250, 350, 450, and 550. In order to
observe a sole effect of DY, molasses concentration in each DY was kept constant at 90.91
g/kg dough, which was the concentration of molasses at 35% (flour base) in the dough with
Material and methods
13
DY 350. Accordingly, the effect of DY on the EPS production was expressed based on the
dough weight (g/kg dough) instead of the flour base (g/kg flour) as in other cases. All
experiments were performed at 30 °C, 200 rpm for 48 h in triplicate.
Strain verification and identification
Due to the distinctive colony morphologies of AAB, their growth in the buckwheat doughs
could differentiated visually. In addition, the matrix-assisted-laser-desorption-ionization-time-
of-flight mass spectrometry (MALDI-TOF MS) was also used to verify the growth of AAB in
buckwheat doughs as well as to identify the LAB strains isolated from such doughs. Single
colonies on agar plates from the viable cell count determinations were randomly picked (3
colonies per plate) and prepared using a cell smear and an on-target extraction method
according to Kern et al. (2013). The mass spectra of each colony was obtained from a MALDI-
TOF mass spectrometer (Microflex LT, Bruker Daltonics, Germany) and was compared to the
databases of Bruker and the in-house database for strain identification.
Determination of metabolites in buckwheat sourdoughs
Acetic acid, lactic acid, and sugars in the doughs were determined by high pressure liquid
chromatography (HPLC) following the methods described by Rühmkorf et al. (2012a).
Enzymatic assays were used for the determination of sugars and D-gluconic acid. The
sourdoughs were first mixed with 2 volumes of dH2O, centrifuged at 13000 × g for 30 min and
the supernatants (‘extracts’) were collected. For acetic acid and lactic acid analysis, the extracts
were deproteinized overnight at 4 °C with 5% perchloric acid (70%) before HPLC analysis
using a Rezex ROA column (Phenomenex, USA) and 5 mN H2SO4 as mobile phase at 0.7
mL/min.
For sugar analysis, the supernatants were first heated at 80 °C for 15 min to stop the enzymatic
reactions. The samples were then deproteinized with Carrez reagents (4.26 mM Carrez solution
I (K4[Fe(CN)6].3H2O), 12.52 mM Carrez solution II (ZnSO4.7H2O) and 10 mM NaOH)
adapted from Cabálková et al. (2004). The mixtures were centrifuged at 13000 × g for 10 min
and filtered with 0.20 µm syringe filters (Phenomenex, USA) before HPLC analysis with a
Rezex RPM column (Phenomenex, USA) using dH2O as eluent at 0.6 mL/min flow rate. The
deproteinized extracts by Carrez reagents were also used in a sucrose, D-fructose, and
D-glucose or D-gluconic acid enzymatic assay kits, following the instructions provided by the
Material and methods
14
manufacturer (Megazyme, Ireland). The assays were carried out in triplicate in a 96-well plate
at 25 °C using a microplate reader (SPECTRO Star Nano, BMG Labtech GmbH, Germany).
2.4. EPS production, isolation, and analysis
Levan production in shake flasks
For the production of levan in shake flasks, 300 mL of NaG medium containing 80 g/L sucrose
(NaGS) or 300 mL of unsterile molasses medium containing 10% (w/w) sugarcane molasses
(Mol) in 2-L Erlenmeyer flasks were cultivated with initial cell count of ca. 1×10⁷ CFU/mL at
30 °C, 200 rpm for 32 h. For the study of levan size during the fermentation process in an
uncontrolled pH condition, 100-mL Erlenmeyer flasks containing 10 mL of NaG medium
supplemented with 40 g/L sucrose, 7 g/L glucose, and 10 g/L fructose were cultivated
aerobically for up to 48 h at 30 °C, 200 rpm in triplicate.
Levan production in bioreactor
Batch fermentations were performed in 1-L bioreactor (Biostat® A, Sartorius Stedim Biotech
GmbH, Germany) at 800 mL working volume using NaG medium containing 80 g/L sucrose
or 10% (w/w) molasses medium for levan production. Pre-cultures (40 mL) were prepared in
shake flasks (500 mL) to mid-exponential growth phase, centrifuged at 13000 × g for 15 min
and re-suspended in 4 mL fresh NaG medium or sterile water (in case of molasses medium) for
inoculation. The fermentation was operated at 30 °C with 600 rpm agitation and 1 vvm aeration
(air) for up to 48 h using 10% Antifoam B emulsion (A5757, Sigma-Aldrich, Germany) for
foaming control. For the fermentations with lower oxygen condition, the stirring rate of 300
rpm and aeration rate of 0.5 vvm were used. For levan production at controlled pH conditions,
sterile 3 M NaOH was used to control the production pH at a constant value of 4.5, 5.5, or 6.5,
respectively.
Isolation of EPS
The isolation and quantification of levan were performed following the common method of
EPS purification which included cell removal, ethanol precipitation, dialysis, and
lyophilization (Korakli et al., 2001; Notararigo et al., 2013; Torino et al., 2015). Levan was
isolated from the sourdoughs or from chemical medium according to the methods of Korakli
et al. (2001). The doughs (diluted 1:2 with demineralized water (dH2O)) or fermentation broths
Material and methods
15
were centrifuged at 13000 × g, 30 min at 4 °C to remove the cells and flour particles.
Afterwards, the supernatants were mixed with two volumes of absolute ethanol (- 20 °C),
incubated overnight at 4 °C before centrifugation using the same condition. The precipitates
were dried overnight, re-dissolved in dH2O and dialyzed against dH2O for at least 48 h at 4 °C
using a dialysis tubing with a molecular weight cut-off of 3500 (MEMBRA-CEL, Serva
Electrophoresis GmbH, Germany). Later, the EPS were lyophilized for at least 24 h in a freeze
dryer (FreezeZone 2.5 Plus, Labconco, USA), weighed for quantification and stored at - 20 °C
for further analysis. For the determination of in situ produced levan in sourdoughs, in which
the freeze dried samples were a mixture of bacterial EPS and water-soluble polysaccharides
(WSP) originating from flour, the samples were hydrolyzed by 0.5% perchloric acid and
analyzed by HPLC using the Rezex RPM column as described in section 2.3.4 to determine
the amount of fructose in the samples. For the structural analysis of levans from sourdoughs,
the freeze dried samples were re-dissolved in dH2O and precipitated with absolute ethanol for
the second time to improve the sample purity.
Determination of sugar monomers in isolated EPS
Lyophilized samples were dissolved in dH2O at a concentration of 10 g/L and hydrolyzed at
100 °C with 0.5% perchloric acid (70%) for 5 h for levan or with 5% perchloric acid for 6 h
for dextran and HePS identification. The samples were centrifuged at 13000 × g for 10 min and
the supernatants were filtered with syringe filters before HPLC analysis. Sugar monomers in
the EPS were determined by the same HPLC system with the Rezex RPM column as described
in the sugar determination method (section 2.3.4).
Structural analysis of levans from AAB
Bacterial levans from AAB were separated and characterized regarding the particle sizes and
molecular weights by asymmetric flow field-flow fractionation (AF4) (Wyatt Technology,
Germany) coupled to multi-angle light scattering (MALS) (Dawn Heleos II, Wyatt
Technology, Germany) and UV (concentration) detection (Dionex Ultimate 3000, Thermo
Fisher Scientific, USA) to calculate molar masses as described in Ua-Arak et al. (2016). The
isolated, freeze-dried EPS was re-dissolved in dH2O to 0.1-0.33 g/L and 100 µL of this solution
was subsequently injected into the separation channel. The separation method used was
modified from Jakob et al. (2013), using 50 mM NaNO3 (aq.) as eluent solution with 0.2
mL/min injection flow and 1 mL/min elution flow. The gradient cross flow rate was set from
Material and methods
16
3 mL/min to 0.1 mL/min within 10 min, then kept at 0.1 mL/min for 30 min, and finally reduced
to 0 mL/min within 15 min. The separations were performed on 10 kDa regenerated cellulose
membranes (Superon GmbH, Germany). The purified levans from NaG medium supplemented
with 40 g/L sucrose, 7 g/L glucose, and 10 g/L fructose, which had similar retention times to
the levans produced in situ in the buckwheat doughs, were used as external standards for the
estimation of levan molar mass from buckwheat doughs. At least two measurements were
performed from each sample and the data were analyzed regarding geometric radii (MALS
signals) and molar masses (MALS and UV signals) using the sphere model (Jakob et al., 2013).
All data were recorded on-line and analyzed by the ASTRA 6.1 software (Wyatt Technology,
Germany). Data shown in the results are representative of at least two measurements.
2.5. Baking experiments
Bread preparation and baking
Control breads (DY 200) were prepared by mixing 100 g of buckwheat flour with 100 g of tap
water, 2 g of salt, and 3 g of instant dried yeast (Fermipan® Red, UK). To prepare sourdough
breads, sourdoughs from AAB fermented for 24, 30, or 48 h were added at 40% (total weight)
while the amount of flour and water in the recipe were reduced to obtain the same concentration
as in the control breads. For breads containing isolated levan or HPMC, 0.1-2 g of water was
replaced by freeze dried levan (1% flour base addition, which was equivalent to 0.49% (w/w)
of total dough weight) or HPMC at 0.1-2% addition, respectively. For molasses breads, tap
water was replaced by 10% (w/w) fresh molasses or molasses fermented with G. albidus or
K. baliensis. Doughs were mixed with a hand mixer (450W Bosch, Germany) using speed no.1
for 10 s and speed no. 5 for 1 min and 50 s before distributing 50 g into mini aluminum trays.
The doughs were proofed at 30 °C, 80% humidity for 45 min and then baked at 230 °C for 15
min in the oven (Wachtel Piccolo, Germany). Bread loaves were cooled for 2 h before analysis.
Three bread loaves of each sample were made from one individual baking and three separated
bakings were performed for each type of breads.
Sensory evaluation of sourdough breads
Breads were sliced into 15-mm thickness, coded with 3-digit numbers and presented to the
untrained panels (n = 18) in randomized orders. An affective test was used to determine the
Material and methods
17
acceptance of consumers on 5 attributes (color, aroma, texture, taste, and overall acceptance)
of the bread samples: C, 24, 30, 48 (control, sourdough breads of 24, 30, and 48 h fermented
sourdoughs by G. albidus or K. baliensis). A 9-point Hedonic scale was used for the attribute
rating, ranging from dislike extremely (1) to like extremely (9). The sensory evaluation was
performed in a quiet, well-lit room. Tap water is used to rinse the palate before and between
the samples.
Instrumental analysis
The analysis of bread volume and crumb hardness was modified from Konitzer et al. (2013).
The specific volume [mL/g] of a bread loaf was measured in triplicate by a laser-based scanner
(Volscan Profiler 300, Stable Micro Systems, UK). For the crumb hardness determination, the
heels of the loaf of bread (10 mm thick) were first removed, then the breads were sliced into
15 mm thickness. Texture Profile Analysis (TPA) of the bread crumbs were performed by a
texture analyzer (TA.XT.plus, Stable Micro Systems, UK) using a 20 mm diameter cylinder
probe with a test speed of 0.50 mm/s. The force that the probe required to penetrate the bread
slice to 7.0 mm was recorded and displayed as crumb hardness in newton [N]. Four slices/bread
of a total 3 breads per sample were analyzed in one individual baking.
Bread staling analysis
The staling of breads was performed by measuring the crumb hardness of breads at day 0, 1,
and 4 and the dehydration rate of bread. After baking, breads were cooled for 1 h, packed in a
partially vacuum polyethylene bag (FoodSaver® V286, USA) and stored at room temperature.
The bread moisture content was determined by using an air-oven method adapted from AACC
method 44-15A (AACC, 2000a). To measure the moisture content of bread, a pre-weighed 15
mm-thick bread slice was dried in a 130 °C oven (Memmert GmbH, Germany) for at least 20
h, cooled for 90 min in a desiccator, and weighed. The dehydration rate was calculated from
the differences between moisture contents of breads at day 1 and 2 in percentage. Two bread
slices from 3 breads each were used in one sample. Three separated bakings and measurements
were performed.
Material and methods
18
2.6. Statistical analysis
The statistical evaluations of all data were performed with SigmaPlot (version 12.5, Systat
Software Inc., USA) using one-way ANOVA. The Tukey's honestly significant difference
(HSD) was used to describe means at 5% significance level (p < 0.05).
Results
19
3. RESULTS
3.1. Evaluation of in situ levan production by AAB in GF sourdoughs
Screening of levan producing AAB from molasses agar
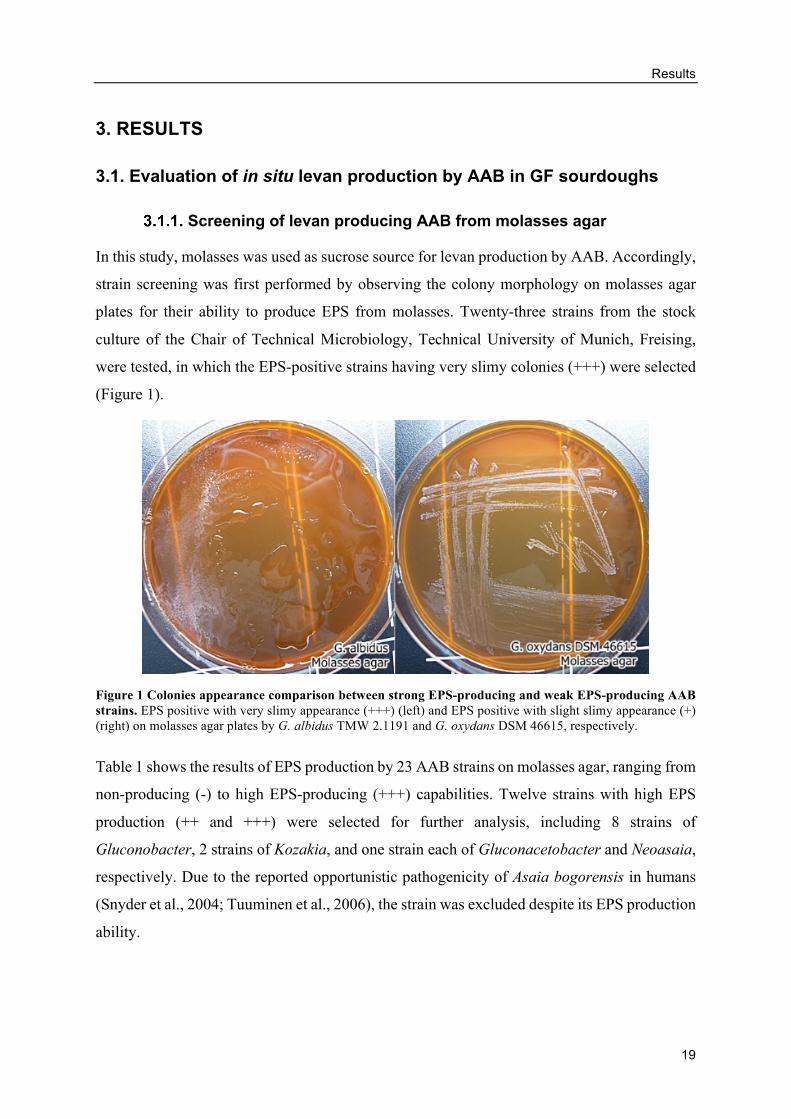
In this study, molasses was used as sucrose source for levan production by AAB. Accordingly,
strain screening was first performed by observing the colony morphology on molasses agar
plates for their ability to produce EPS from molasses. Twenty-three strains from the stock
culture of the Chair of Technical Microbiology, Technical University of Munich, Freising,
were tested, in which the EPS-positive strains having very slimy colonies (+++) were selected
(Figure 1).
Figure 1 Colonies appearance comparison between strong EPS-producing and weak EPS-producing AAB strains. EPS positive with very slimy appearance (+++) (left) and EPS positive with slight slimy appearance (+) (right) on molasses agar plates by G. albidus TMW 2.1191 and G. oxydans DSM 46615, respectively.
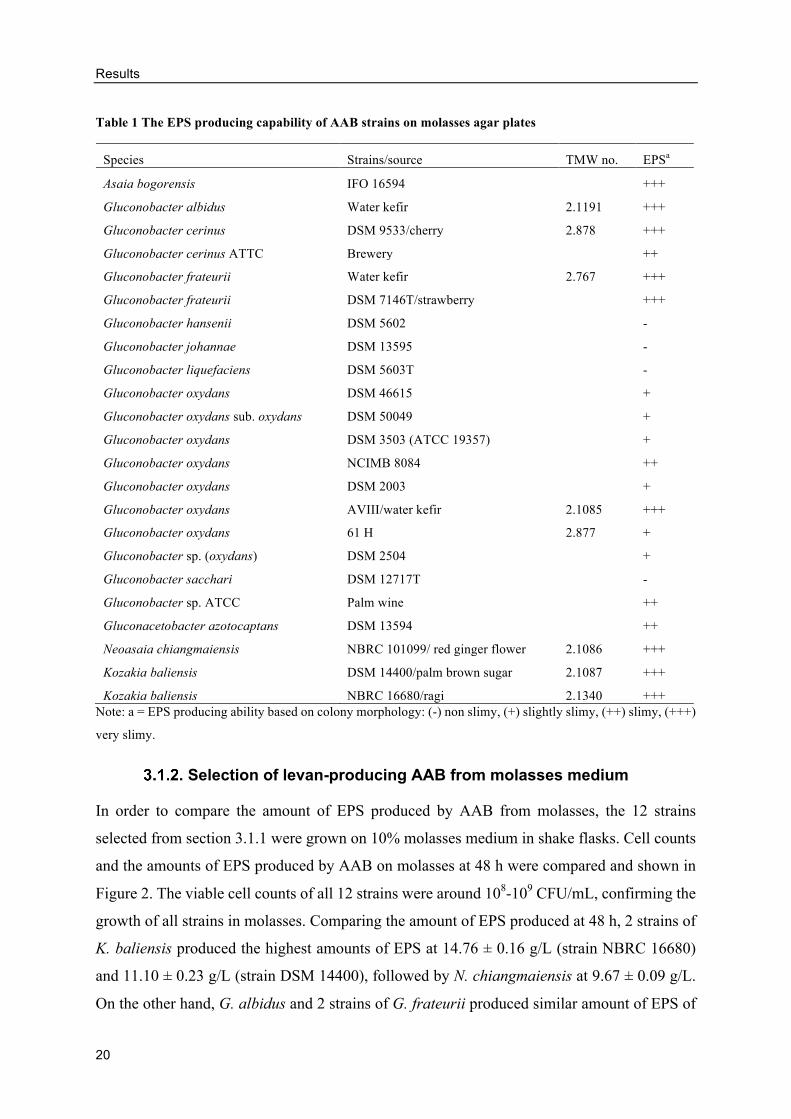
Table 1 shows the results of EPS production by 23 AAB strains on molasses agar, ranging from
non-producing (-) to high EPS-producing (+++) capabilities. Twelve strains with high EPS
production (++ and +++) were selected for further analysis, including 8 strains of
Gluconobacter, 2 strains of Kozakia, and one strain each of Gluconacetobacter and Neoasaia,
respectively. Due to the reported opportunistic pathogenicity of Asaia bogorensis in humans
(Snyder et al., 2004; Tuuminen et al., 2006), the strain was excluded despite its EPS production
ability.
Results
20
Table 1 The EPS producing capability of AAB strains on molasses agar plates
Species Strains/source TMW no. EPSa
Asaia bogorensis IFO 16594 +++
Gluconobacter albidus Water kefir 2.1191 +++
Gluconobacter cerinus DSM 9533/cherry 2.878 +++
Gluconobacter cerinus ATTC Brewery ++
Gluconobacter frateurii Water kefir 2.767 +++
Gluconobacter frateurii DSM 7146T/strawberry +++
Gluconobacter hansenii DSM 5602 -
Gluconobacter johannae DSM 13595 -
Gluconobacter liquefaciens DSM 5603T -
Gluconobacter oxydans DSM 46615 +
Gluconobacter oxydans sub. oxydans DSM 50049 +
Gluconobacter oxydans DSM 3503 (ATCC 19357) +
Gluconobacter oxydans NCIMB 8084 ++
Gluconobacter oxydans DSM 2003 +
Gluconobacter oxydans AVIII/water kefir 2.1085 +++
Gluconobacter oxydans 61 H 2.877 +
Gluconobacter sp. (oxydans) DSM 2504 +
Gluconobacter sacchari DSM 12717T -
Gluconobacter sp. ATCC Palm wine ++
Gluconacetobacter azotocaptans DSM 13594 ++
Neoasaia chiangmaiensis NBRC 101099/ red ginger flower 2.1086 +++
Kozakia baliensis DSM 14400/palm brown sugar 2.1087 +++
Kozakia baliensis NBRC 16680/ragi 2.1340 +++ Note: a = EPS producing ability based on colony morphology: (-) non slimy, (+) slightly slimy, (++) slimy, (+++)
very slimy.
Selection of levan-producing AAB from molasses medium
In order to compare the amount of EPS produced by AAB from molasses, the 12 strains
selected from section 3.1.1 were grown on 10% molasses medium in shake flasks. Cell counts
and the amounts of EPS produced by AAB on molasses at 48 h were compared and shown in
Figure 2. The viable cell counts of all 12 strains were around 108-109 CFU/mL, confirming the
growth of all strains in molasses. Comparing the amount of EPS produced at 48 h, 2 strains of
K. baliensis produced the highest amounts of EPS at 14.76 ± 0.16 g/L (strain NBRC 16680)
and 11.10 ± 0.23 g/L (strain DSM 14400), followed by N. chiangmaiensis at 9.67 ± 0.09 g/L.
On the other hand, G. albidus and 2 strains of G. frateurii produced similar amount of EPS of
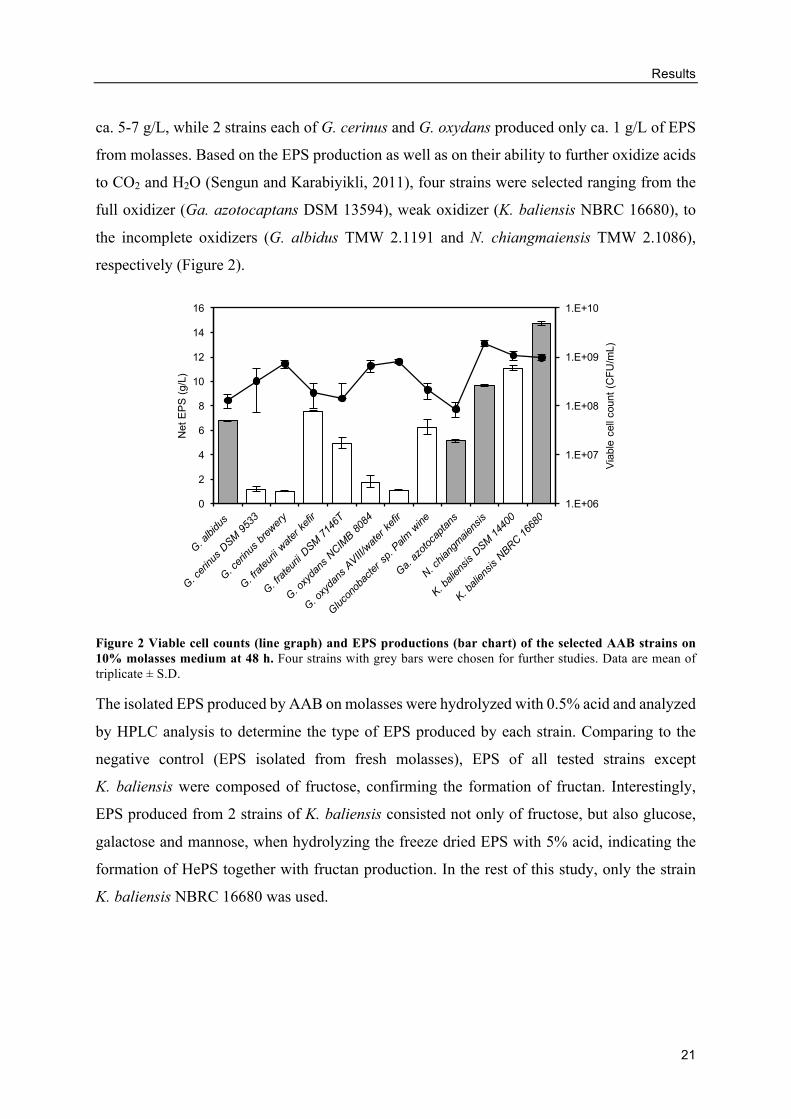
Results
21
ca. 5-7 g/L, while 2 strains each of G. cerinus and G. oxydans produced only ca. 1 g/L of EPS
from molasses. Based on the EPS production as well as on their ability to further oxidize acids
to CO2 and H2O (Sengun and Karabiyikli, 2011), four strains were selected ranging from the
full oxidizer (Ga. azotocaptans DSM 13594), weak oxidizer (K. baliensis NBRC 16680), to
the incomplete oxidizers (G. albidus TMW 2.1191 and N. chiangmaiensis TMW 2.1086),
respectively (Figure 2).
Figure 2 Viable cell counts (line graph) and EPS productions (bar chart) of the selected AAB strains on 10% molasses medium at 48 h. Four strains with grey bars were chosen for further studies. Data are mean of triplicate ± S.D.
The isolated EPS produced by AAB on molasses were hydrolyzed with 0.5% acid and analyzed
by HPLC analysis to determine the type of EPS produced by each strain. Comparing to the
negative control (EPS isolated from fresh molasses), EPS of all tested strains except
K. baliensis were composed of fructose, confirming the formation of fructan. Interestingly,
EPS produced from 2 strains of K. baliensis consisted not only of fructose, but also glucose,
galactose and mannose, when hydrolyzing the freeze dried EPS with 5% acid, indicating the
formation of HePS together with fructan production. In the rest of this study, only the strain
K. baliensis NBRC 16680 was used.
1.E+06
1.E+07
1.E+08
1.E+09
1.E+10
0
2
4
6
8
10
12
14
16
Via
ble
cell c
ount
(CF
U/m
L)
Net
EP
S (
g/L
)
Results
22
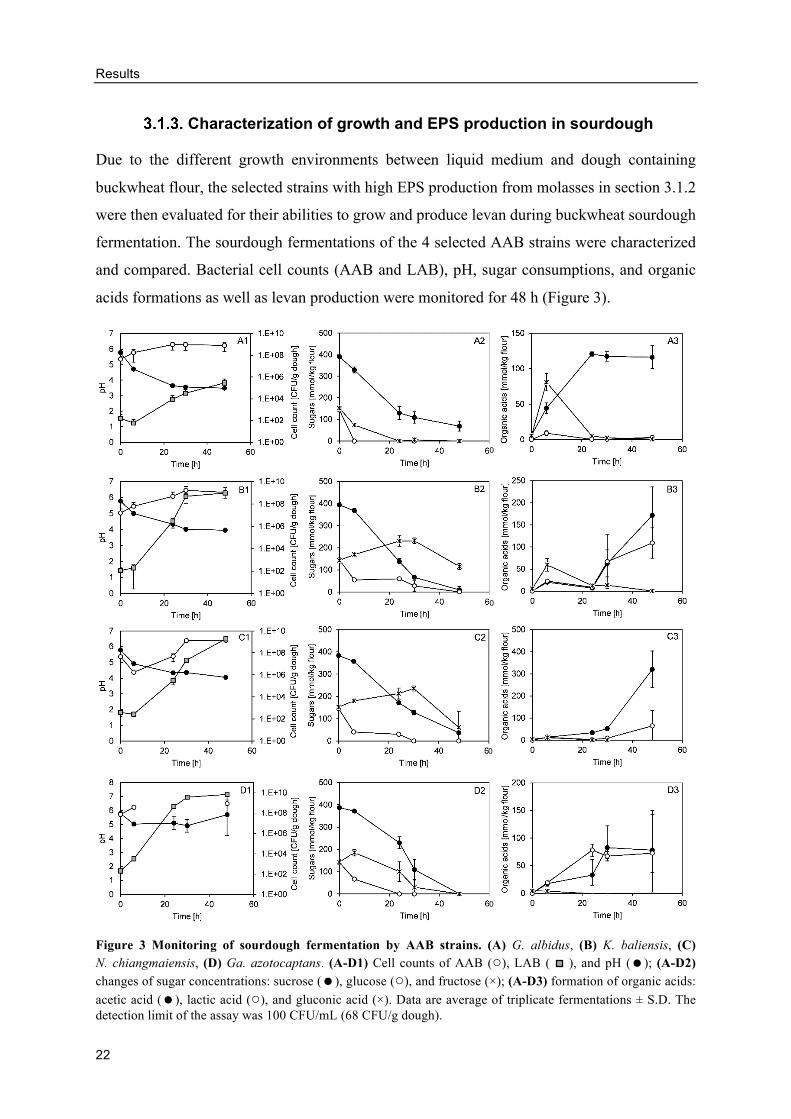
Characterization of growth and EPS production in sourdough
Due to the different growth environments between liquid medium and dough containing
buckwheat flour, the selected strains with high EPS production from molasses in section 3.1.2
were then evaluated for their abilities to grow and produce levan during buckwheat sourdough
fermentation. The sourdough fermentations of the 4 selected AAB strains were characterized
and compared. Bacterial cell counts (AAB and LAB), pH, sugar consumptions, and organic
acids formations as well as levan production were monitored for 48 h (Figure 3).
Figure 3 Monitoring of sourdough fermentation by AAB strains. (A) G. albidus, (B) K. baliensis, (C) N. chiangmaiensis, (D) Ga. azotocaptans. (A-D1) Cell counts of AAB (○), LAB ( ), and pH (=); (A-D2) changes of sugar concentrations: sucrose (=), glucose (○), and fructose (×); (A-D3) formation of organic acids: acetic acid (=), lactic acid (○), and gluconic acid (×). Data are average of triplicate fermentations ± S.D. The detection limit of the assay was 100 CFU/mL (68 CFU/g dough).
0
0
0
0
Results
23
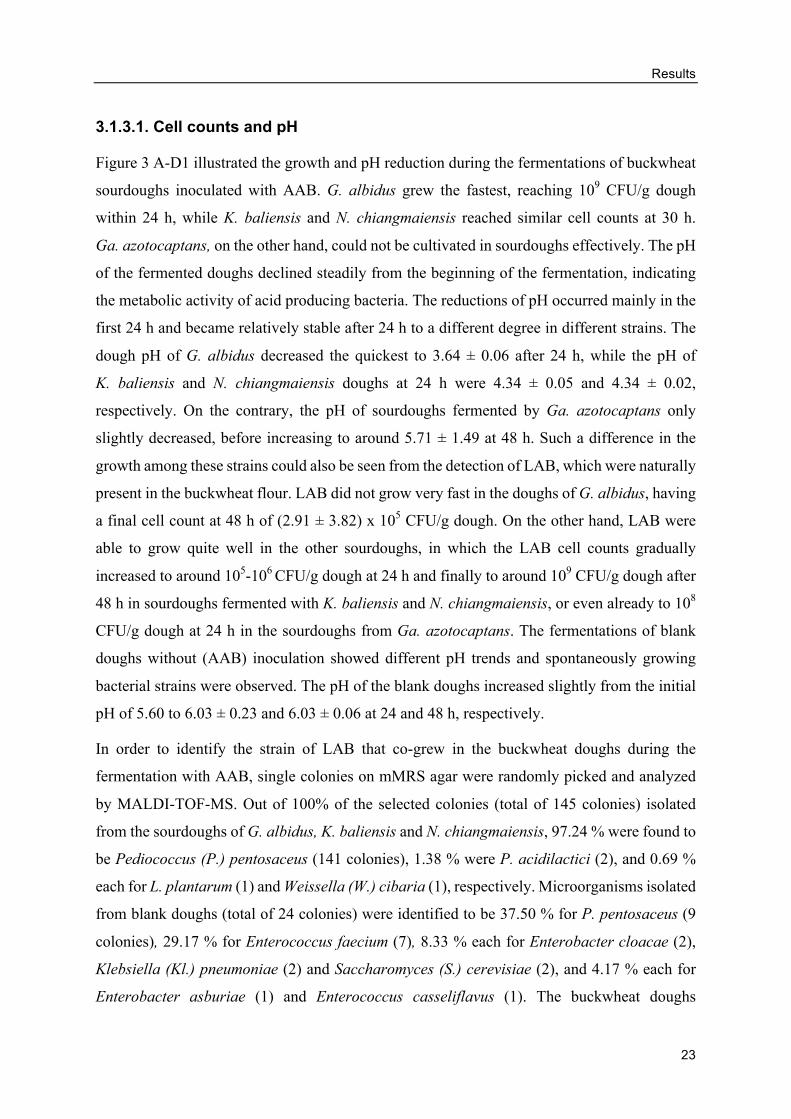
3.1.3.1. Cell counts and pH
Figure 3 A-D1 illustrated the growth and pH reduction during the fermentations of buckwheat
sourdoughs inoculated with AAB. G. albidus grew the fastest, reaching 109 CFU/g dough
within 24 h, while K. baliensis and N. chiangmaiensis reached similar cell counts at 30 h.
Ga. azotocaptans, on the other hand, could not be cultivated in sourdoughs effectively. The pH
of the fermented doughs declined steadily from the beginning of the fermentation, indicating
the metabolic activity of acid producing bacteria. The reductions of pH occurred mainly in the
first 24 h and became relatively stable after 24 h to a different degree in different strains. The
dough pH of G. albidus decreased the quickest to 3.64 ± 0.06 after 24 h, while the pH of
K. baliensis and N. chiangmaiensis doughs at 24 h were 4.34 ± 0.05 and 4.34 ± 0.02,
respectively. On the contrary, the pH of sourdoughs fermented by Ga. azotocaptans only
slightly decreased, before increasing to around 5.71 ± 1.49 at 48 h. Such a difference in the
growth among these strains could also be seen from the detection of LAB, which were naturally
present in the buckwheat flour. LAB did not grow very fast in the doughs of G. albidus, having
a final cell count at 48 h of (2.91 ± 3.82) x 105 CFU/g dough. On the other hand, LAB were
able to grow quite well in the other sourdoughs, in which the LAB cell counts gradually
increased to around 105-106 CFU/g dough at 24 h and finally to around 109 CFU/g dough after
48 h in sourdoughs fermented with K. baliensis and N. chiangmaiensis, or even already to 108
CFU/g dough at 24 h in the sourdoughs from Ga. azotocaptans. The fermentations of blank
doughs without (AAB) inoculation showed different pH trends and spontaneously growing
bacterial strains were observed. The pH of the blank doughs increased slightly from the initial
pH of 5.60 to 6.03 ± 0.23 and 6.03 ± 0.06 at 24 and 48 h, respectively.
In order to identify the strain of LAB that co-grew in the buckwheat doughs during the
fermentation with AAB, single colonies on mMRS agar were randomly picked and analyzed
by MALDI-TOF-MS. Out of 100% of the selected colonies (total of 145 colonies) isolated
from the sourdoughs of G. albidus, K. baliensis and N. chiangmaiensis, 97.24 % were found to
be Pediococcus (P.) pentosaceus (141 colonies), 1.38 % were P. acidilactici (2), and 0.69 %
each for L. plantarum (1) and Weissella (W.) cibaria (1), respectively. Microorganisms isolated
from blank doughs (total of 24 colonies) were identified to be 37.50 % for P. pentosaceus (9
colonies), 29.17 % for Enterococcus faecium (7), 8.33 % each for Enterobacter cloacae (2),
Klebsiella (Kl.) pneumoniae (2) and Saccharomyces (S.) cerevisiae (2), and 4.17 % each for
Enterobacter asburiae (1) and Enterococcus casseliflavus (1). The buckwheat doughs
Results
24
inoculated with G. albidus, K. baliensis, and N. chiangmaiensis were found to solely contain
the respective AAB strain, LAB (mainly P. pentosaceus), and few yeasts (C. robusta and
S. cerevisiae), while Kl. pneumoniae and Cronobacter sakazakii were also found in the doughs
fermented with Ga. azotocaptans. Further analysis of the main LAB strain, P. pentosaceus,
showed no EPS formation in the buckwheat sourdoughs, eliminating the possibility of
secondary EPS-forming from these bacteria.
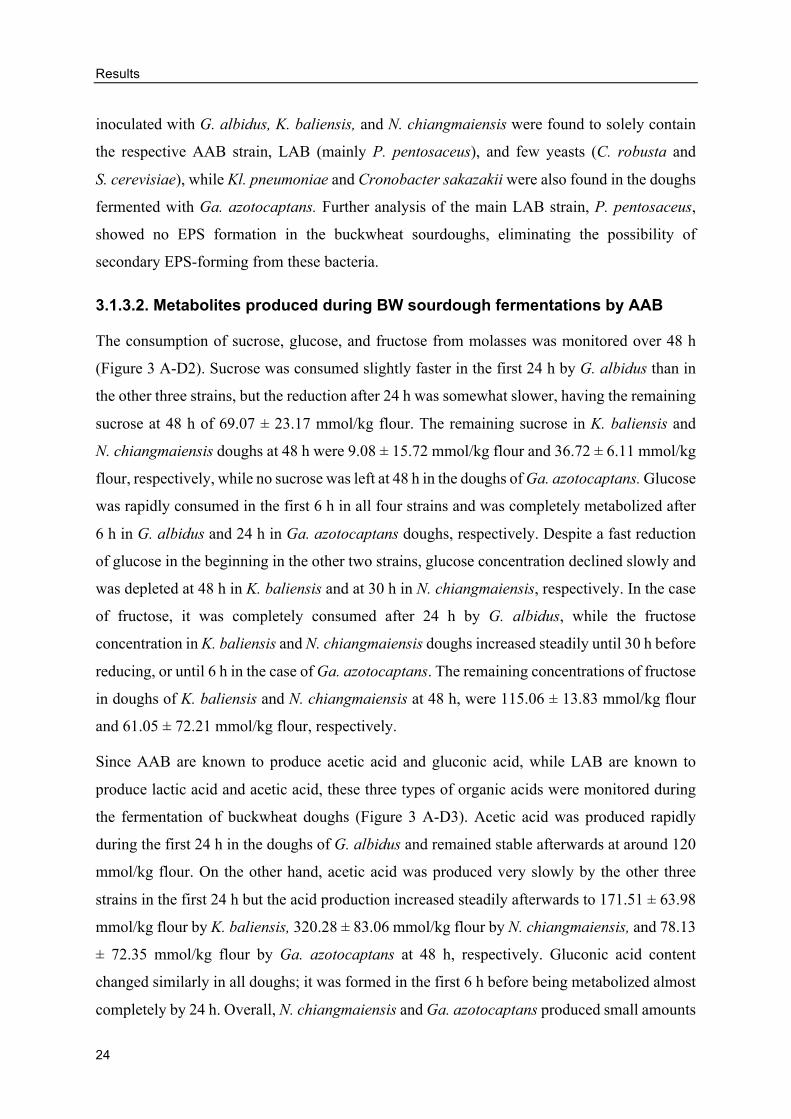
3.1.3.2. Metabolites produced during BW sourdough fermentations by AAB
The consumption of sucrose, glucose, and fructose from molasses was monitored over 48 h
(Figure 3 A-D2). Sucrose was consumed slightly faster in the first 24 h by G. albidus than in
the other three strains, but the reduction after 24 h was somewhat slower, having the remaining
sucrose at 48 h of 69.07 ± 23.17 mmol/kg flour. The remaining sucrose in K. baliensis and
N. chiangmaiensis doughs at 48 h were 9.08 ± 15.72 mmol/kg flour and 36.72 ± 6.11 mmol/kg
flour, respectively, while no sucrose was left at 48 h in the doughs of Ga. azotocaptans. Glucose
was rapidly consumed in the first 6 h in all four strains and was completely metabolized after
6 h in G. albidus and 24 h in Ga. azotocaptans doughs, respectively. Despite a fast reduction
of glucose in the beginning in the other two strains, glucose concentration declined slowly and
was depleted at 48 h in K. baliensis and at 30 h in N. chiangmaiensis, respectively. In the case
of fructose, it was completely consumed after 24 h by G. albidus, while the fructose
concentration in K. baliensis and N. chiangmaiensis doughs increased steadily until 30 h before
reducing, or until 6 h in the case of Ga. azotocaptans. The remaining concentrations of fructose
in doughs of K. baliensis and N. chiangmaiensis at 48 h, were 115.06 ± 13.83 mmol/kg flour
and 61.05 ± 72.21 mmol/kg flour, respectively.
Since AAB are known to produce acetic acid and gluconic acid, while LAB are known to
produce lactic acid and acetic acid, these three types of organic acids were monitored during
the fermentation of buckwheat doughs (Figure 3 A-D3). Acetic acid was produced rapidly
during the first 24 h in the doughs of G. albidus and remained stable afterwards at around 120
mmol/kg flour. On the other hand, acetic acid was produced very slowly by the other three
strains in the first 24 h but the acid production increased steadily afterwards to 171.51 ± 63.98
mmol/kg flour by K. baliensis, 320.28 ± 83.06 mmol/kg flour by N. chiangmaiensis, and 78.13
± 72.35 mmol/kg flour by Ga. azotocaptans at 48 h, respectively. Gluconic acid content
changed similarly in all doughs; it was formed in the first 6 h before being metabolized almost
completely by 24 h. Overall, N. chiangmaiensis and Ga. azotocaptans produced small amounts
Results
25
of gluconic acid, with concentrations at 6 h of 11.64 ± 1.64 mmol/kg flour and 4.01 ± 0.41
mmol/kg flour, respectively, compared to 80.92 ± 12.20 and 59.45 ± 14.23 mmol/kg flour in
G. albidus and K. baliensis doughs, respectively. In addition to acetic acid and gluconic acid,
lactic acid was also detected in the doughs fermented by AAB. A trace amount of lactic acid
was found in the doughs fermented by G. albidus, while larger amounts were detected in the
doughs fermented by the other three strains. The final concentrations of lactic acid at 48 h in
K. baliensis, N. chiangmaiensis, and Ga. azotocaptans doughs were 108.93 ± 34.41 mmol/kg
flour, 64.55 ± 70.22 mmol/kg flour, and 72.69 ± 70.13 mmol/kg flour, respectively.
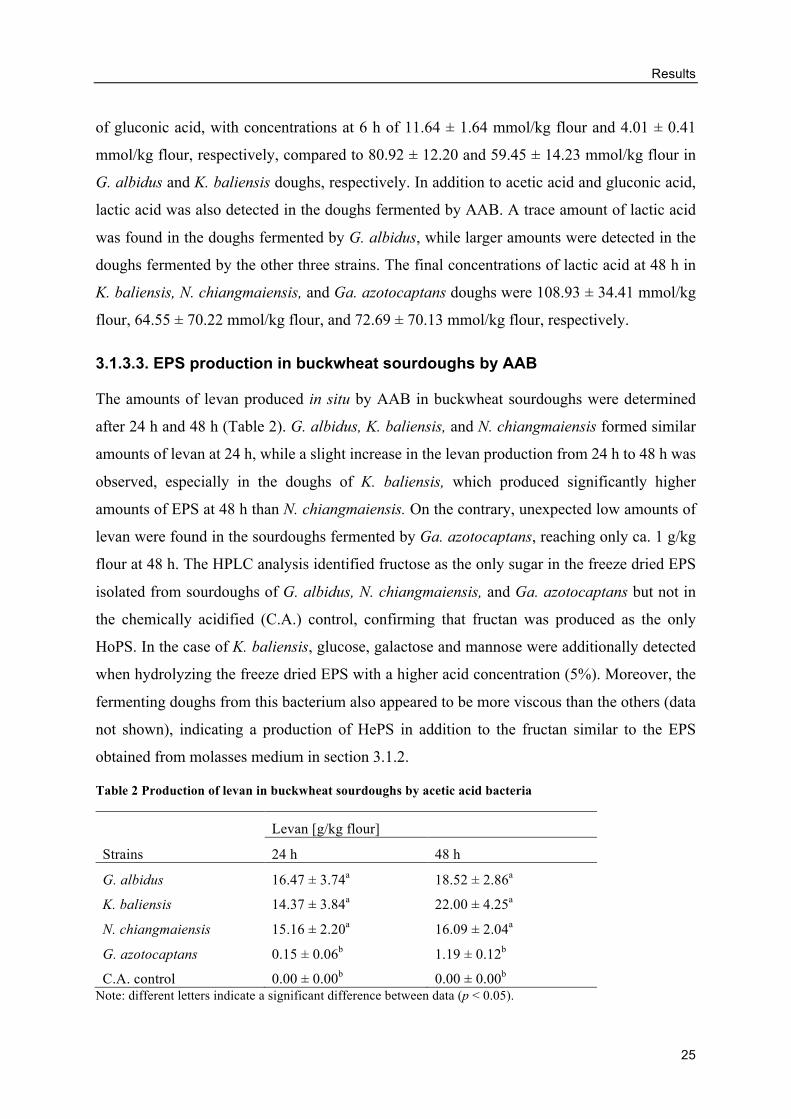
3.1.3.3. EPS production in buckwheat sourdoughs by AAB
The amounts of levan produced in situ by AAB in buckwheat sourdoughs were determined
after 24 h and 48 h (Table 2). G. albidus, K. baliensis, and N. chiangmaiensis formed similar
amounts of levan at 24 h, while a slight increase in the levan production from 24 h to 48 h was
observed, especially in the doughs of K. baliensis, which produced significantly higher
amounts of EPS at 48 h than N. chiangmaiensis. On the contrary, unexpected low amounts of
levan were found in the sourdoughs fermented by Ga. azotocaptans, reaching only ca. 1 g/kg
flour at 48 h. The HPLC analysis identified fructose as the only sugar in the freeze dried EPS
isolated from sourdoughs of G. albidus, N. chiangmaiensis, and Ga. azotocaptans but not in
the chemically acidified (C.A.) control, confirming that fructan was produced as the only
HoPS. In the case of K. baliensis, glucose, galactose and mannose were additionally detected
when hydrolyzing the freeze dried EPS with a higher acid concentration (5%). Moreover, the
fermenting doughs from this bacterium also appeared to be more viscous than the others (data
not shown), indicating a production of HePS in addition to the fructan similar to the EPS
obtained from molasses medium in section 3.1.2.
Table 2 Production of levan in buckwheat sourdoughs by acetic acid bacteria
Levan [g/kg flour]
Strains 24 h 48 h
G. albidus 16.47 ± 3.74a 18.52 ± 2.86a
K. baliensis 14.37 ± 3.84a 22.00 ± 4.25a
N. chiangmaiensis 15.16 ± 2.20a 16.09 ± 2.04a
G. azotocaptans 0.15 ± 0.06b 1.19 ± 0.12b
C.A. control 0.00 ± 0.00b 0.00 ± 0.00b
Note: different letters indicate a significant difference between data (p < 0.05).
Results
26
Interestingly, a preliminary experiment showed that the second EPS (HePS) produced by
K. baliensis were observed within the first 24 h in the small volumes and high shaking rate
conditions (e.g. 15 mL dough and 200 rpm). At the higher fermentation volumes used for the
bread baking, only fructan was observed within 48 h of observation.
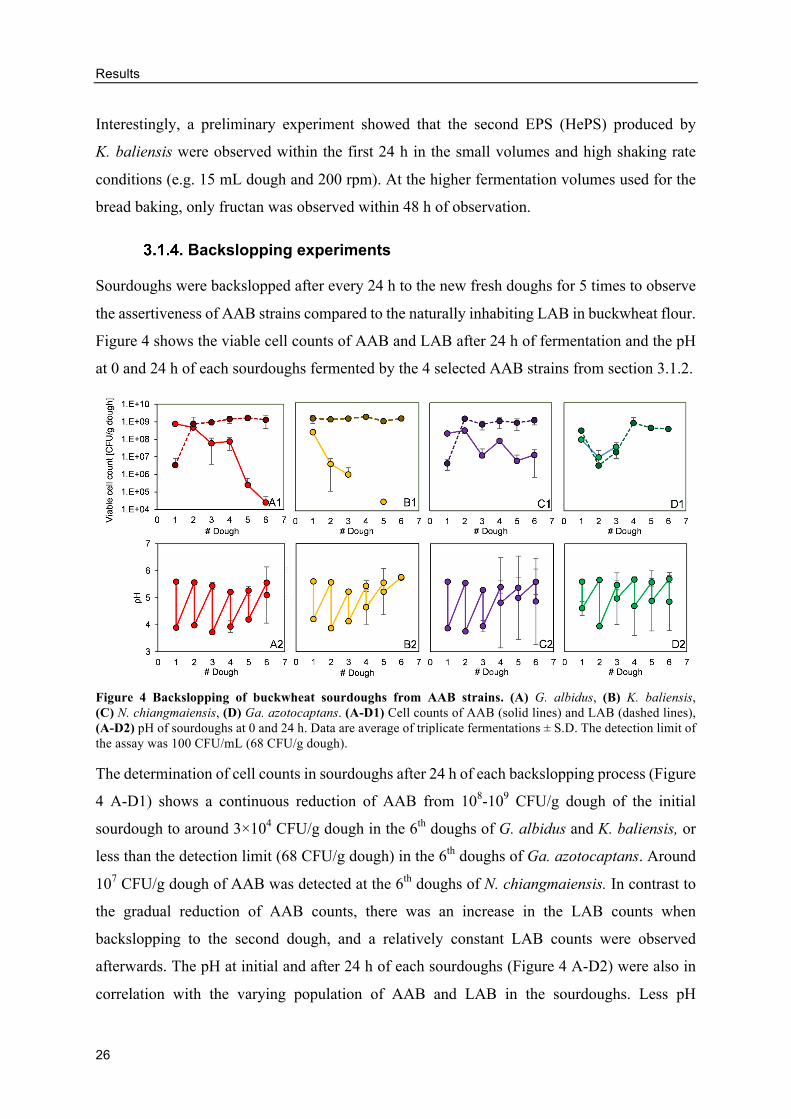
Backslopping experiments
Sourdoughs were backslopped after every 24 h to the new fresh doughs for 5 times to observe
the assertiveness of AAB strains compared to the naturally inhabiting LAB in buckwheat flour.
Figure 4 shows the viable cell counts of AAB and LAB after 24 h of fermentation and the pH
at 0 and 24 h of each sourdoughs fermented by the 4 selected AAB strains from section 3.1.2.
Figure 4 Backslopping of buckwheat sourdoughs from AAB strains. (A) G. albidus, (B) K. baliensis, (C) N. chiangmaiensis, (D) Ga. azotocaptans. (A-D1) Cell counts of AAB (solid lines) and LAB (dashed lines), (A-D2) pH of sourdoughs at 0 and 24 h. Data are average of triplicate fermentations ± S.D. The detection limit of the assay was 100 CFU/mL (68 CFU/g dough).
The determination of cell counts in sourdoughs after 24 h of each backslopping process (Figure
4 A-D1) shows a continuous reduction of AAB from 108-109 CFU/g dough of the initial
sourdough to around 3×10⁴ CFU/g dough in the 6th doughs of G. albidus and K. baliensis, or
less than the detection limit (68 CFU/g dough) in the 6th doughs of Ga. azotocaptans. Around
107 CFU/g dough of AAB was detected at the 6th doughs of N. chiangmaiensis. In contrast to
the gradual reduction of AAB counts, there was an increase in the LAB counts when
backslopping to the second dough, and a relatively constant LAB counts were observed
afterwards. The pH at initial and after 24 h of each sourdoughs (Figure 4 A-D2) were also in
correlation with the varying population of AAB and LAB in the sourdoughs. Less pH
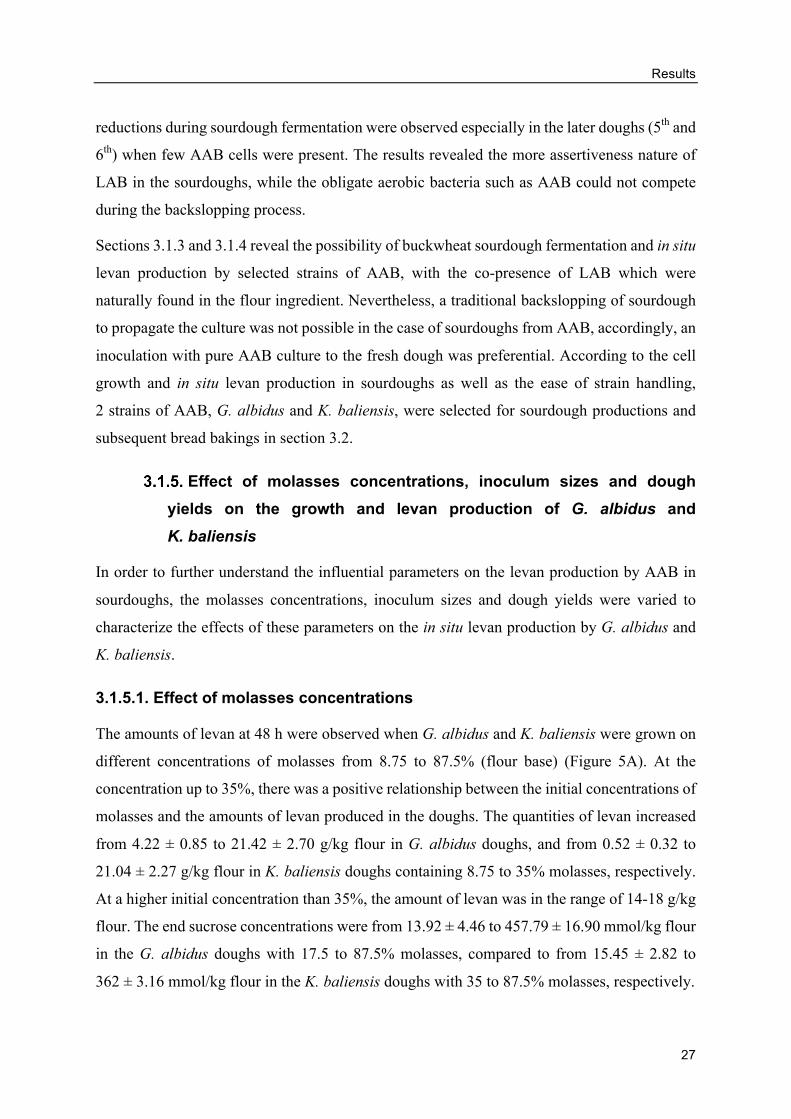
Results
27
reductions during sourdough fermentation were observed especially in the later doughs (5th and
6th) when few AAB cells were present. The results revealed the more assertiveness nature of
LAB in the sourdoughs, while the obligate aerobic bacteria such as AAB could not compete
during the backslopping process.
Sections 3.1.3 and 3.1.4 reveal the possibility of buckwheat sourdough fermentation and in situ
levan production by selected strains of AAB, with the co-presence of LAB which were
naturally found in the flour ingredient. Nevertheless, a traditional backslopping of sourdough
to propagate the culture was not possible in the case of sourdoughs from AAB, accordingly, an
inoculation with pure AAB culture to the fresh dough was preferential. According to the cell
growth and in situ levan production in sourdoughs as well as the ease of strain handling,
2 strains of AAB, G. albidus and K. baliensis, were selected for sourdough productions and
subsequent bread bakings in section 3.2.
Effect of molasses concentrations, inoculum sizes and dough yields on the growth and levan production of G. albidus and K. baliensis
In order to further understand the influential parameters on the levan production by AAB in
sourdoughs, the molasses concentrations, inoculum sizes and dough yields were varied to
characterize the effects of these parameters on the in situ levan production by G. albidus and
K. baliensis.
3.1.5.1. Effect of molasses concentrations
The amounts of levan at 48 h were observed when G. albidus and K. baliensis were grown on
different concentrations of molasses from 8.75 to 87.5% (flour base) (Figure 5A). At the
concentration up to 35%, there was a positive relationship between the initial concentrations of
molasses and the amounts of levan produced in the doughs. The quantities of levan increased
from 4.22 ± 0.85 to 21.42 ± 2.70 g/kg flour in G. albidus doughs, and from 0.52 ± 0.32 to
21.04 ± 2.27 g/kg flour in K. baliensis doughs containing 8.75 to 35% molasses, respectively.
At a higher initial concentration than 35%, the amount of levan was in the range of 14-18 g/kg
flour. The end sucrose concentrations were from 13.92 ± 4.46 to 457.79 ± 16.90 mmol/kg flour
in the G. albidus doughs with 17.5 to 87.5% molasses, compared to from 15.45 ± 2.82 to
362 ± 3.16 mmol/kg flour in the K. baliensis doughs with 35 to 87.5% molasses, respectively.
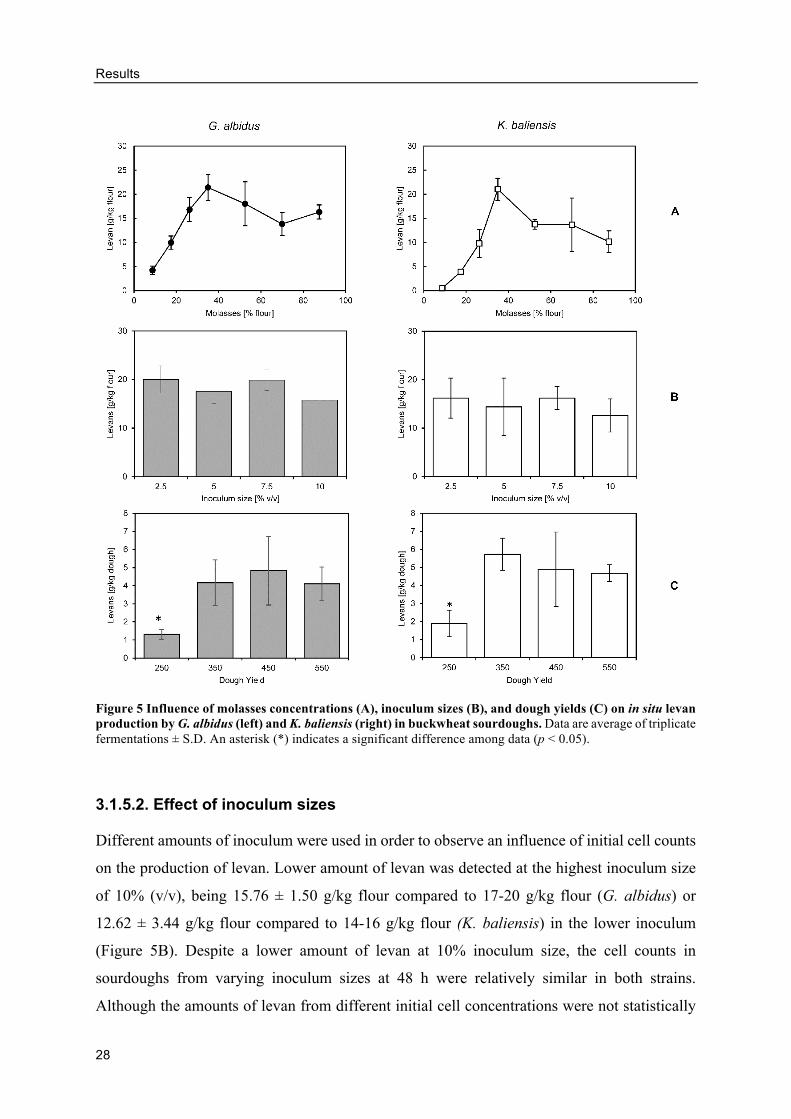
Results
28
Figure 5 Influence of molasses concentrations (A), inoculum sizes (B), and dough yields (C) on in situ levan production by G. albidus (left) and K. baliensis (right) in buckwheat sourdoughs. Data are average of triplicate fermentations ± S.D. An asterisk (*) indicates a significant difference among data (p < 0.05).
3.1.5.2. Effect of inoculum sizes
Different amounts of inoculum were used in order to observe an influence of initial cell counts
on the production of levan. Lower amount of levan was detected at the highest inoculum size
of 10% (v/v), being 15.76 ± 1.50 g/kg flour compared to 17-20 g/kg flour (G. albidus) or
12.62 ± 3.44 g/kg flour compared to 14-16 g/kg flour (K. baliensis) in the lower inoculum
(Figure 5B). Despite a lower amount of levan at 10% inoculum size, the cell counts in
sourdoughs from varying inoculum sizes at 48 h were relatively similar in both strains.
Although the amounts of levan from different initial cell concentrations were not statistically
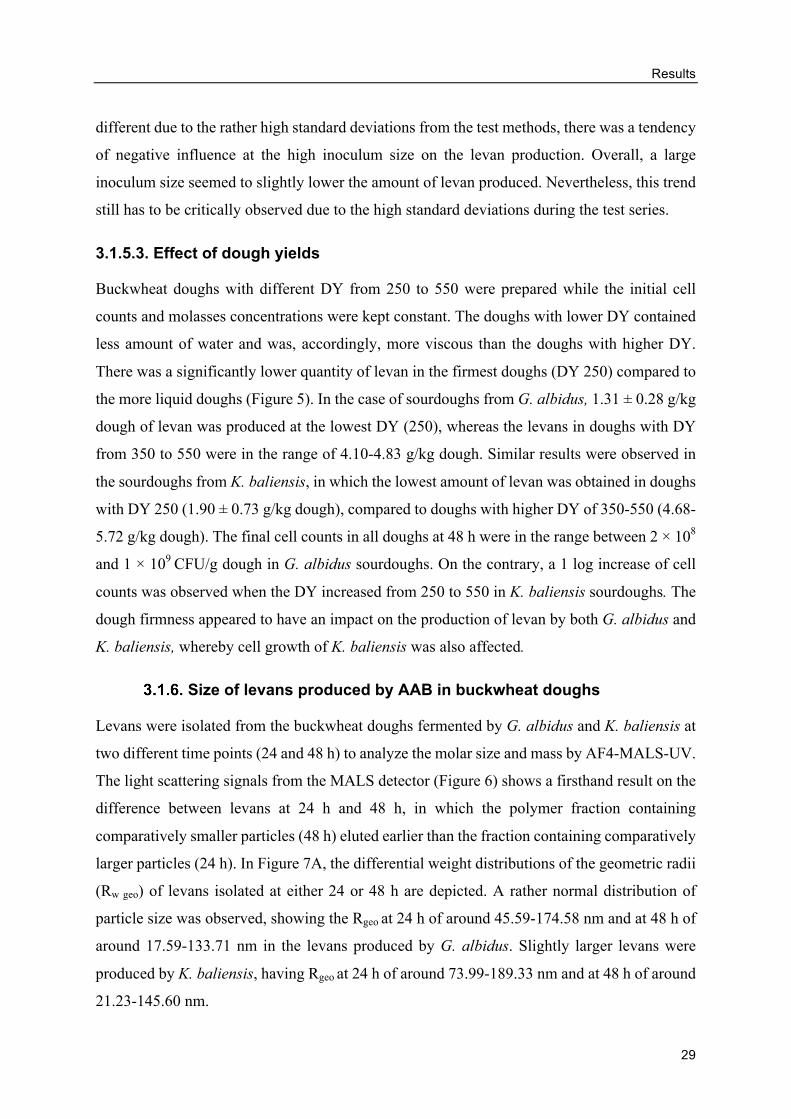
Results
29
different due to the rather high standard deviations from the test methods, there was a tendency
of negative influence at the high inoculum size on the levan production. Overall, a large
inoculum size seemed to slightly lower the amount of levan produced. Nevertheless, this trend
still has to be critically observed due to the high standard deviations during the test series.
3.1.5.3. Effect of dough yields
Buckwheat doughs with different DY from 250 to 550 were prepared while the initial cell
counts and molasses concentrations were kept constant. The doughs with lower DY contained
less amount of water and was, accordingly, more viscous than the doughs with higher DY.
There was a significantly lower quantity of levan in the firmest doughs (DY 250) compared to
the more liquid doughs (Figure 5). In the case of sourdoughs from G. albidus, 1.31 ± 0.28 g/kg
dough of levan was produced at the lowest DY (250), whereas the levans in doughs with DY
from 350 to 550 were in the range of 4.10-4.83 g/kg dough. Similar results were observed in
the sourdoughs from K. baliensis, in which the lowest amount of levan was obtained in doughs
with DY 250 (1.90 ± 0.73 g/kg dough), compared to doughs with higher DY of 350-550 (4.68-
5.72 g/kg dough). The final cell counts in all doughs at 48 h were in the range between 2 × 10⁸
and 1 × 10⁹ CFU/g dough in G. albidus sourdoughs. On the contrary, a 1 log increase of cell
counts was observed when the DY increased from 250 to 550 in K. baliensis sourdoughs. The
dough firmness appeared to have an impact on the production of levan by both G. albidus and
K. baliensis, whereby cell growth of K. baliensis was also affected.
Size of levans produced by AAB in buckwheat doughs
Levans were isolated from the buckwheat doughs fermented by G. albidus and K. baliensis at
two different time points (24 and 48 h) to analyze the molar size and mass by AF4-MALS-UV.
The light scattering signals from the MALS detector (Figure 6) shows a firsthand result on the
difference between levans at 24 h and 48 h, in which the polymer fraction containing
comparatively smaller particles (48 h) eluted earlier than the fraction containing comparatively
larger particles (24 h). In Figure 7A, the differential weight distributions of the geometric radii
(Rw geo) of levans isolated at either 24 or 48 h are depicted. A rather normal distribution of
particle size was observed, showing the Rgeo at 24 h of around 45.59-174.58 nm and at 48 h of
around 17.59-133.71 nm in the levans produced by G. albidus. Slightly larger levans were
produced by K. baliensis, having Rgeo at 24 h of around 73.99-189.33 nm and at 48 h of around
21.23-145.60 nm.
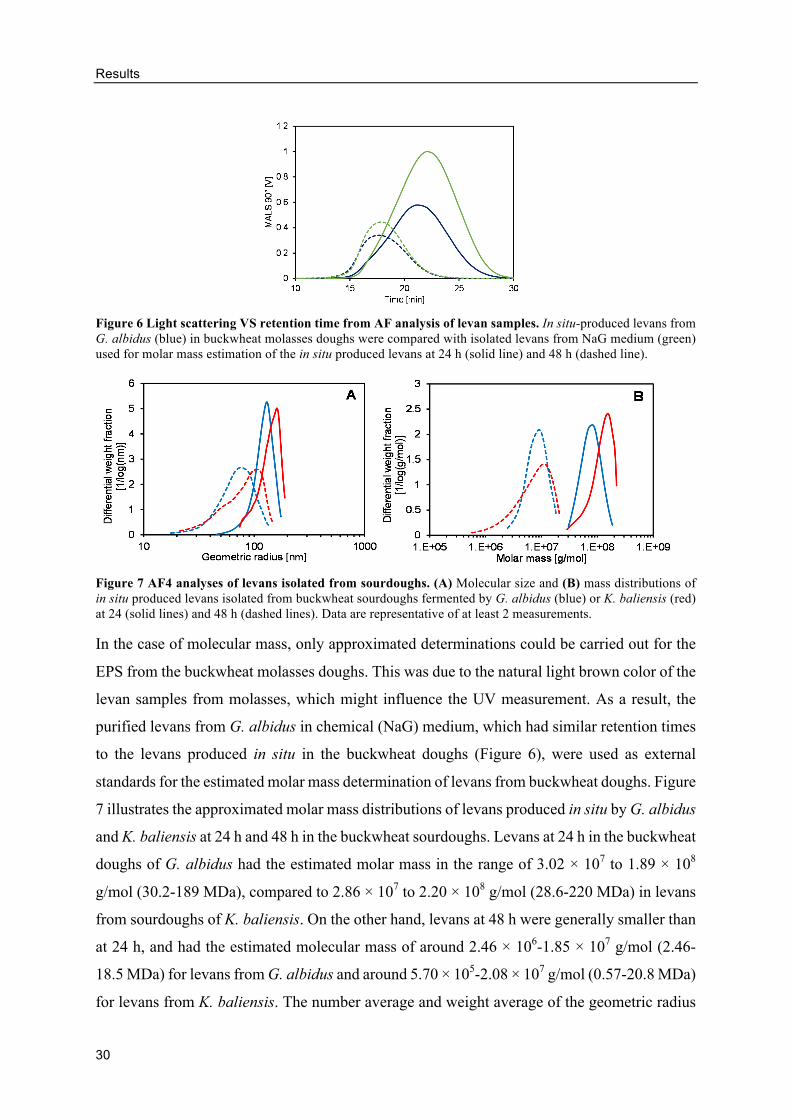
Results
30
Figure 6 Light scattering VS retention time from AF analysis of levan samples. In situ-produced levans from G. albidus (blue) in buckwheat molasses doughs were compared with isolated levans from NaG medium (green) used for molar mass estimation of the in situ produced levans at 24 h (solid line) and 48 h (dashed line).
Figure 7 AF4 analyses of levans isolated from sourdoughs. (A) Molecular size and (B) mass distributions of in situ produced levans isolated from buckwheat sourdoughs fermented by G. albidus (blue) or K. baliensis (red) at 24 (solid lines) and 48 h (dashed lines). Data are representative of at least 2 measurements.
In the case of molecular mass, only approximated determinations could be carried out for the
EPS from the buckwheat molasses doughs. This was due to the natural light brown color of the
levan samples from molasses, which might influence the UV measurement. As a result, the
purified levans from G. albidus in chemical (NaG) medium, which had similar retention times
to the levans produced in situ in the buckwheat doughs (Figure 6), were used as external
standards for the estimated molar mass determination of levans from buckwheat doughs. Figure
7 illustrates the approximated molar mass distributions of levans produced in situ by G. albidus
and K. baliensis at 24 h and 48 h in the buckwheat sourdoughs. Levans at 24 h in the buckwheat
doughs of G. albidus had the estimated molar mass in the range of 3.02 × 10⁷ to 1.89 × 10⁸
g/mol (30.2-189 MDa), compared to 2.86 × 10⁷ to 2.20 × 10⁸ g/mol (28.6-220 MDa) in levans
from sourdoughs of K. baliensis. On the other hand, levans at 48 h were generally smaller than
at 24 h, and had the estimated molecular mass of around 2.46 × 10⁶-1.85 × 10⁷ g/mol (2.46-
18.5 MDa) for levans from G. albidus and around 5.70 × 10⁵-2.08 × 10⁷ g/mol (0.57-20.8 MDa)
for levans from K. baliensis. The number average and weight average of the geometric radius
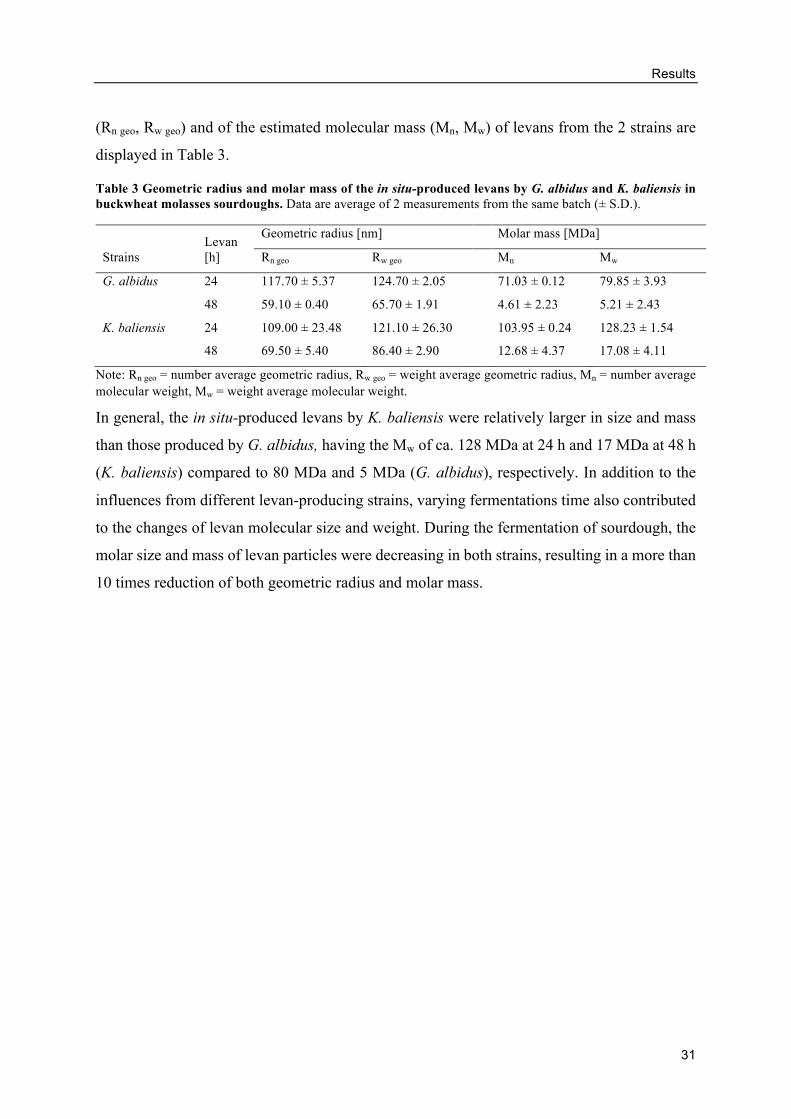
Results
31
(Rn geo, Rw geo) and of the estimated molecular mass (Mn, Mw) of levans from the 2 strains are
displayed in Table 3.
Table 3 Geometric radius and molar mass of the in situ-produced levans by G. albidus and K. baliensis in buckwheat molasses sourdoughs. Data are average of 2 measurements from the same batch (± S.D.).
Strains Levan [h]
Geometric radius [nm] Molar mass [MDa]
Rn geo Rw geo Mn Mw
G. albidus 24 117.70 ± 5.37 124.70 ± 2.05 71.03 ± 0.12 79.85 ± 3.93
48 59.10 ± 0.40 65.70 ± 1.91 4.61 ± 2.23 5.21 ± 2.43
K. baliensis 24 109.00 ± 23.48 121.10 ± 26.30 103.95 ± 0.24 128.23 ± 1.54
48 69.50 ± 5.40 86.40 ± 2.90 12.68 ± 4.37 17.08 ± 4.11
Note: Rn geo = number average geometric radius, Rw geo = weight average geometric radius, Mn = number average molecular weight, Mw = weight average molecular weight.
In general, the in situ-produced levans by K. baliensis were relatively larger in size and mass
than those produced by G. albidus, having the Mw of ca. 128 MDa at 24 h and 17 MDa at 48 h
(K. baliensis) compared to 80 MDa and 5 MDa (G. albidus), respectively. In addition to the
influences from different levan-producing strains, varying fermentations time also contributed
to the changes of levan molecular size and weight. During the fermentation of sourdough, the
molar size and mass of levan particles were decreasing in both strains, resulting in a more than
10 times reduction of both geometric radius and molar mass.
Results
32
3.2. Influence of levan-producing AAB on buckwheat sourdough breads
After the characterizations of sourdough fermentation and in situ levan production by AAB,
sourdough fermentations by selected strains of AAB were performed in a larger scale in order
to obtain enough material for sourdough bread baking. Due to the possible changes of growth
and levan production after scaling-up, sourdough fermentations in 2-L flasks were monitored
and the characteristics of sourdoughs after 24, 30, and 48 h, which were later used for bread
baking, were determined.
Characterization of buckwheat sourdoughs fermented by AAB
Buckwheat doughs that were inoculated with G. albidus or K. baliensis were monitored over
72 h (Figure 8). For both strains, the cell counts of AAB increased from ca. 3 × 10⁷ CFU/g
dough to approximately 2 × 10⁸ CFU/g dough within 24 h and slightly reduced to 106-107 at
72 h. On the contrary, there was an increasing number of LAB from initially around 102 CFU/g
dough to 107-108 at 24 h and remained in a relatively higher concentration than the AAB counts.
The pH of sourdoughs reduced gradually from around 6 to the end pH at 72 h of 3.64 ± 0.09
(G. albidus) and 3.80 ± 0.03 (K. baliensis), respectively. The majority of LAB isolates from all
sourdoughs were identified as P. pentosaceus (70.4%) and W. cibaria (28.7%); in which W.
cibaria was detected in the sourdoughs of K. baliensis, when another batch of buckwheat flour
was used (for bread staling experiment). Further HPLC analysis of these strains on mMRS
medium or buckwheat dough containing sucrose indicated that P. pentosaceus did not produce
EPS, while W. cibaria produced HoPS consisted of glucose monomers (glucan). The presence
of glucan in addition to levan in the sourdoughs of K. baliensis used in section 3.2.3 contributed
to the staling characteristics of the associated buckwheat breads. The amounts of in situ
produced levan by AAB during the dough fermentations were different between the two strains.
G. albidus produced more levan than K. baliensis throughout the fermentation process, having
the highest concentrations of 14.85 ± 3.92 g/kg flour in G. albidus doughs at 48 h and 10.96 ±
2.24 g/kg flour in K. baliensis doughs at 54 h, respectively (Figure 9).
For baking purposes, buckwheat sourdoughs were prepared by fermentation with G. albidus or
K. baliensis at 24, 30, or 48 h. Table 4 displays the dough pH, remaining sugar, organic acids,
and levan concentrations of each sourdough that was later used in the real baking. In general,
sourdoughs of G. albidus had higher concentrations of gluconic acid than sourdoughs of
K. baliensis, while higher amounts of lactic acid were found in the K. baliensis doughs
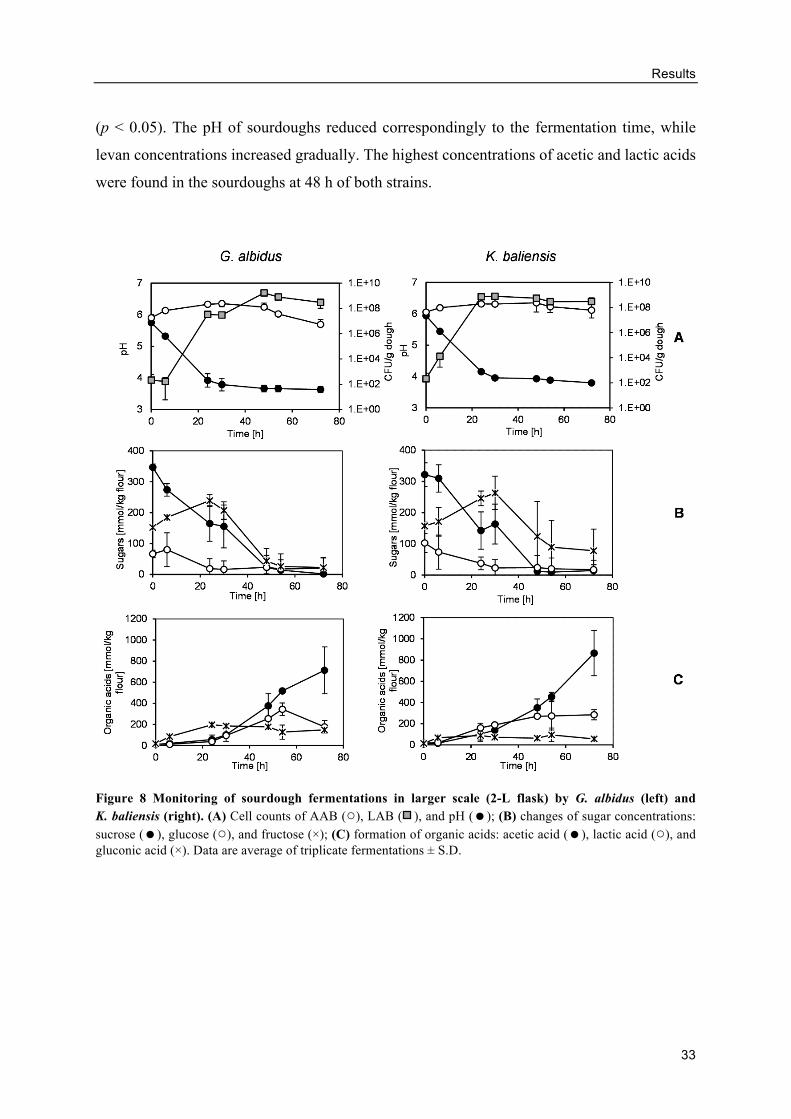
Results
33
(p < 0.05). The pH of sourdoughs reduced correspondingly to the fermentation time, while
levan concentrations increased gradually. The highest concentrations of acetic and lactic acids
were found in the sourdoughs at 48 h of both strains.
Figure 8 Monitoring of sourdough fermentations in larger scale (2-L flask) by G. albidus (left) and K. baliensis (right). (A) Cell counts of AAB (○), LAB ( ), and pH (=); (B) changes of sugar concentrations: sucrose (=), glucose (○), and fructose (×); (C) formation of organic acids: acetic acid (=), lactic acid (○), and gluconic acid (×). Data are average of triplicate fermentations ± S.D.
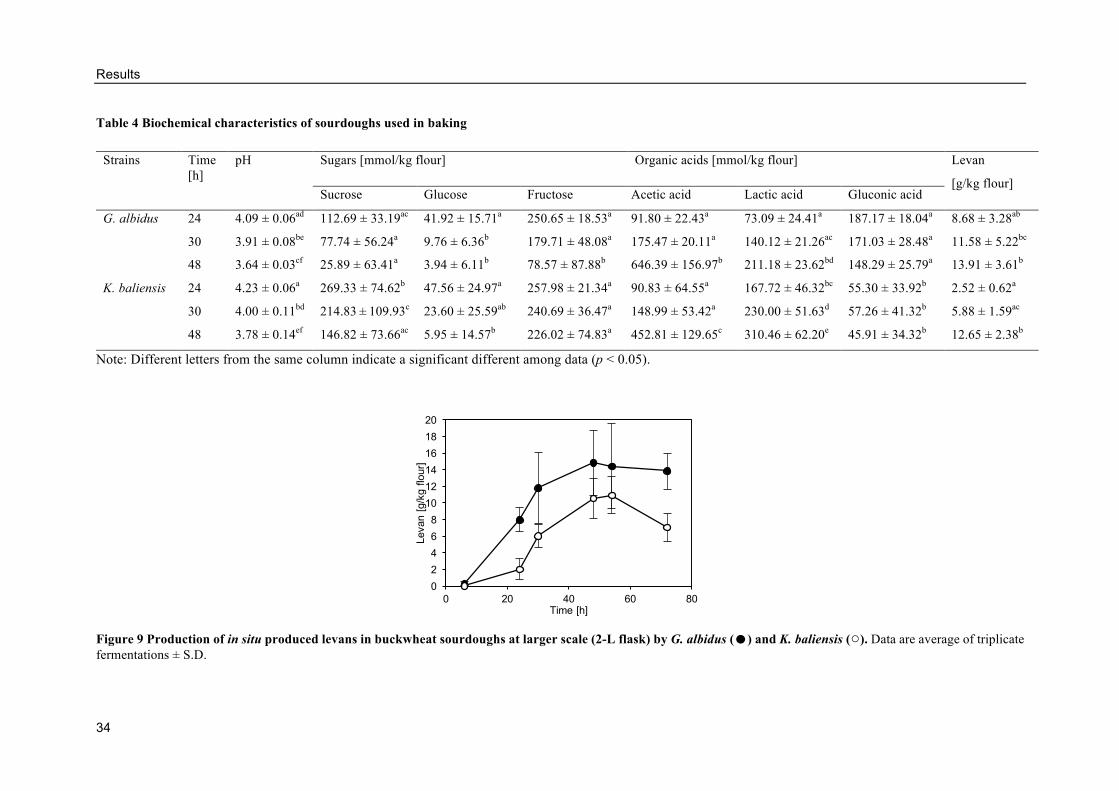
Results
34
Table 4 Biochemical characteristics of sourdoughs used in baking
Strains Time [h]
pH Sugars [mmol/kg flour] Organic acids [mmol/kg flour] Levan
[g/kg flour] Sucrose Glucose Fructose Acetic acid Lactic acid Gluconic acid
G. albidus 24 4.09 ± 0.06ad 112.69 ± 33.19ac 41.92 ± 15.71a 250.65 ± 18.53a 91.80 ± 22.43a 73.09 ± 24.41a 187.17 ± 18.04a 8.68 ± 3.28ab
30 3.91 ± 0.08be 77.74 ± 56.24a 9.76 ± 6.36b 179.71 ± 48.08a 175.47 ± 20.11a 140.12 ± 21.26ac 171.03 ± 28.48a 11.58 ± 5.22bc
48 3.64 ± 0.03cf 25.89 ± 63.41a 3.94 ± 6.11b 78.57 ± 87.88b 646.39 ± 156.97b 211.18 ± 23.62bd 148.29 ± 25.79a 13.91 ± 3.61b
K. baliensis 24 4.23 ± 0.06a 269.33 ± 74.62b 47.56 ± 24.97a 257.98 ± 21.34a 90.83 ± 64.55a 167.72 ± 46.32bc 55.30 ± 33.92b 2.52 ± 0.62a
30 4.00 ± 0.11bd 214.83 ± 109.93c 23.60 ± 25.59ab 240.69 ± 36.47a 148.99 ± 53.42a 230.00 ± 51.63d 57.26 ± 41.32b 5.88 ± 1.59ac
48 3.78 ± 0.14ef 146.82 ± 73.66ac 5.95 ± 14.57b 226.02 ± 74.83a 452.81 ± 129.65c 310.46 ± 62.20e 45.91 ± 34.32b 12.65 ± 2.38b
Note: Different letters from the same column indicate a significant different among data (p < 0.05).
Figure 9 Production of in situ produced levans in buckwheat sourdoughs at larger scale (2-L flask) by G. albidus (=) and K. baliensis (○). Data are average of triplicate fermentations ± S.D.
02468
101214161820
0 20 40 60 80
Leva
n [g
/kg
flour
]
Time [h]
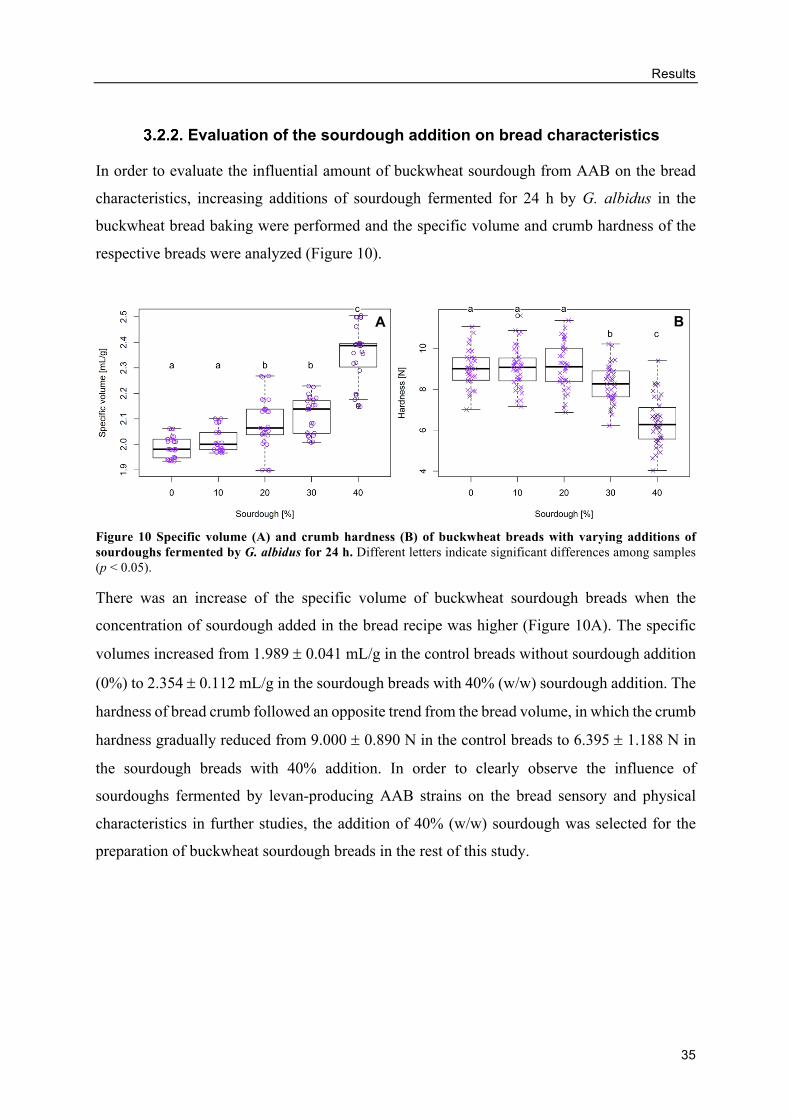
Results
35
Evaluation of the sourdough addition on bread characteristics
In order to evaluate the influential amount of buckwheat sourdough from AAB on the bread
characteristics, increasing additions of sourdough fermented for 24 h by G. albidus in the
buckwheat bread baking were performed and the specific volume and crumb hardness of the
respective breads were analyzed (Figure 10).
Figure 10 Specific volume (A) and crumb hardness (B) of buckwheat breads with varying additions of sourdoughs fermented by G. albidus for 24 h. Different letters indicate significant differences among samples (p < 0.05).
There was an increase of the specific volume of buckwheat sourdough breads when the
concentration of sourdough added in the bread recipe was higher (Figure 10A). The specific
volumes increased from 1.989 ± 0.041 mL/g in the control breads without sourdough addition
(0%) to 2.354 ± 0.112 mL/g in the sourdough breads with 40% (w/w) sourdough addition. The
hardness of bread crumb followed an opposite trend from the bread volume, in which the crumb
hardness gradually reduced from 9.000 ± 0.890 N in the control breads to 6.395 ± 1.188 N in
the sourdough breads with 40% addition. In order to clearly observe the influence of
sourdoughs fermented by levan-producing AAB strains on the bread sensory and physical
characteristics in further studies, the addition of 40% (w/w) sourdough was selected for the
preparation of buckwheat sourdough breads in the rest of this study.
A B
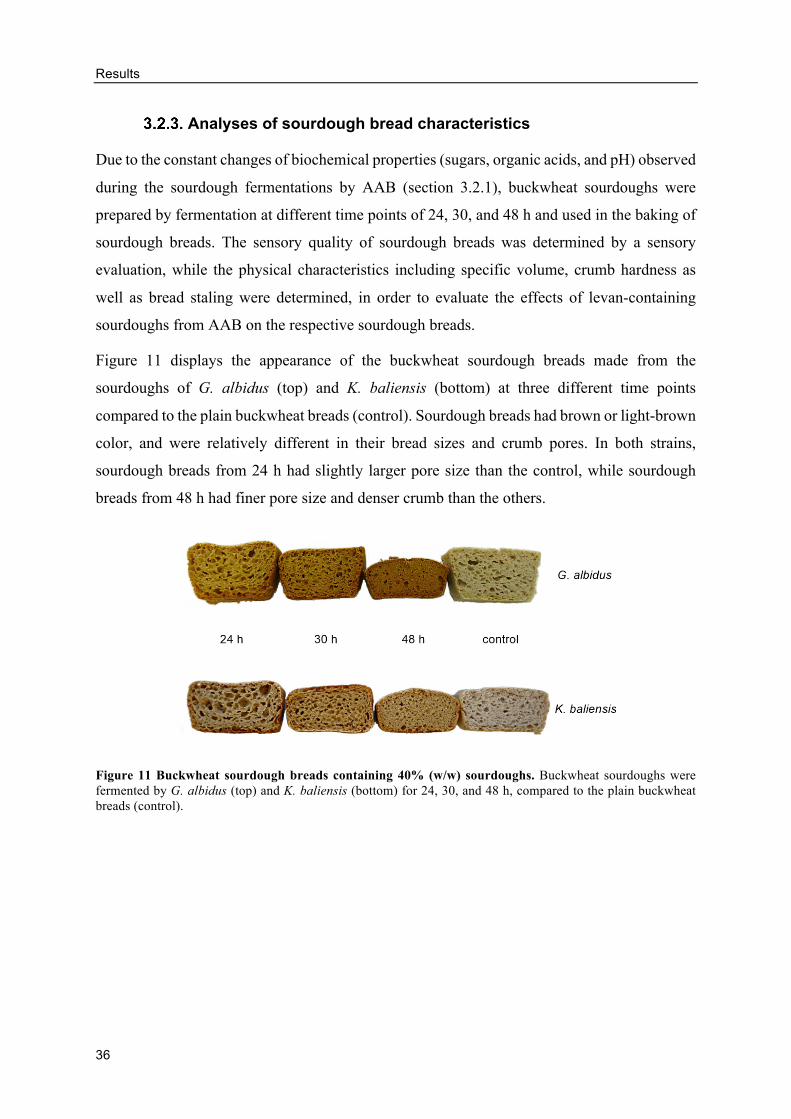
Results
36
Analyses of sourdough bread characteristics
Due to the constant changes of biochemical properties (sugars, organic acids, and pH) observed
during the sourdough fermentations by AAB (section 3.2.1), buckwheat sourdoughs were
prepared by fermentation at different time points of 24, 30, and 48 h and used in the baking of
sourdough breads. The sensory quality of sourdough breads was determined by a sensory
evaluation, while the physical characteristics including specific volume, crumb hardness as
well as bread staling were determined, in order to evaluate the effects of levan-containing
sourdoughs from AAB on the respective sourdough breads.
Figure 11 displays the appearance of the buckwheat sourdough breads made from the
sourdoughs of G. albidus (top) and K. baliensis (bottom) at three different time points
compared to the plain buckwheat breads (control). Sourdough breads had brown or light-brown
color, and were relatively different in their bread sizes and crumb pores. In both strains,
sourdough breads from 24 h had slightly larger pore size than the control, while sourdough
breads from 48 h had finer pore size and denser crumb than the others.
Figure 11 Buckwheat sourdough breads containing 40% (w/w) sourdoughs. Buckwheat sourdoughs were fermented by G. albidus (top) and K. baliensis (bottom) for 24, 30, and 48 h, compared to the plain buckwheat breads (control).
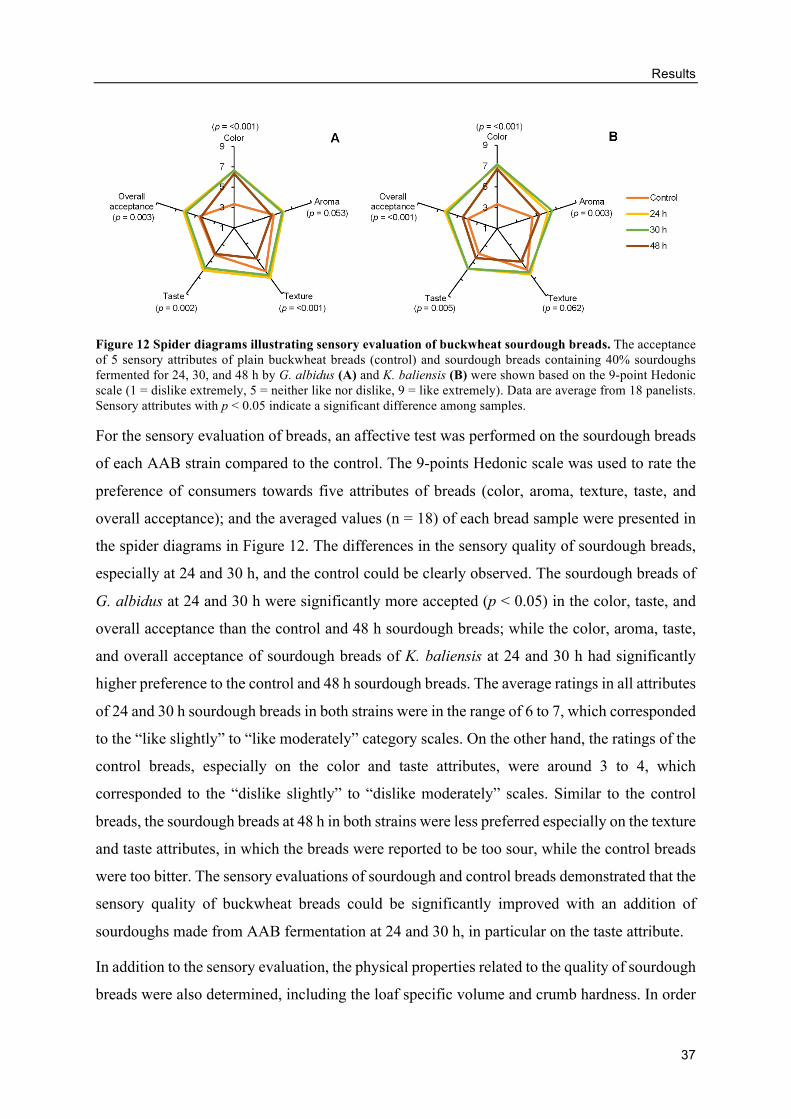
Results
37
Figure 12 Spider diagrams illustrating sensory evaluation of buckwheat sourdough breads. The acceptance of 5 sensory attributes of plain buckwheat breads (control) and sourdough breads containing 40% sourdoughs fermented for 24, 30, and 48 h by G. albidus (A) and K. baliensis (B) were shown based on the 9-point Hedonic scale (1 = dislike extremely, 5 = neither like nor dislike, 9 = like extremely). Data are average from 18 panelists. Sensory attributes with p < 0.05 indicate a significant difference among samples.
For the sensory evaluation of breads, an affective test was performed on the sourdough breads
of each AAB strain compared to the control. The 9-points Hedonic scale was used to rate the
preference of consumers towards five attributes of breads (color, aroma, texture, taste, and
overall acceptance); and the averaged values (n = 18) of each bread sample were presented in
the spider diagrams in Figure 12. The differences in the sensory quality of sourdough breads,
especially at 24 and 30 h, and the control could be clearly observed. The sourdough breads of
G. albidus at 24 and 30 h were significantly more accepted (p < 0.05) in the color, taste, and
overall acceptance than the control and 48 h sourdough breads; while the color, aroma, taste,
and overall acceptance of sourdough breads of K. baliensis at 24 and 30 h had significantly
higher preference to the control and 48 h sourdough breads. The average ratings in all attributes
of 24 and 30 h sourdough breads in both strains were in the range of 6 to 7, which corresponded
to the “like slightly” to “like moderately” category scales. On the other hand, the ratings of the
control breads, especially on the color and taste attributes, were around 3 to 4, which
corresponded to the “dislike slightly” to “dislike moderately” scales. Similar to the control
breads, the sourdough breads at 48 h in both strains were less preferred especially on the texture
and taste attributes, in which the breads were reported to be too sour, while the control breads
were too bitter. The sensory evaluations of sourdough and control breads demonstrated that the
sensory quality of buckwheat breads could be significantly improved with an addition of
sourdoughs made from AAB fermentation at 24 and 30 h, in particular on the taste attribute.
In addition to the sensory evaluation, the physical properties related to the quality of sourdough
breads were also determined, including the loaf specific volume and crumb hardness. In order
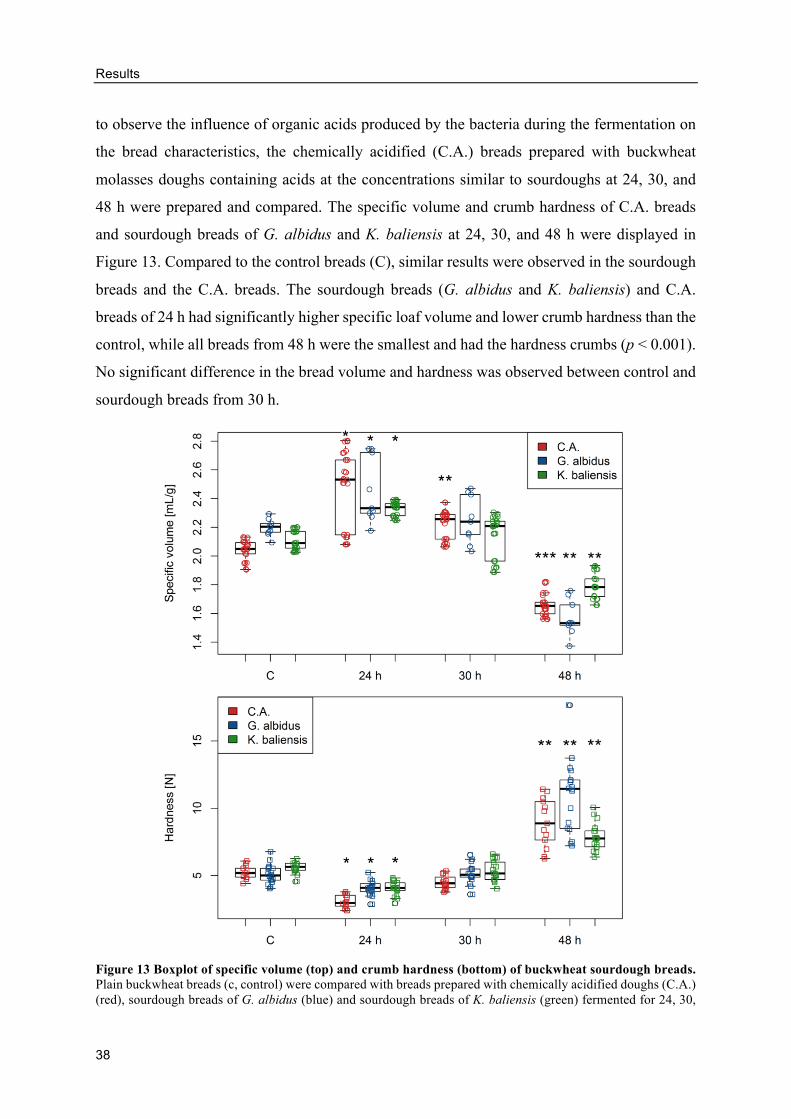
Results
38
to observe the influence of organic acids produced by the bacteria during the fermentation on
the bread characteristics, the chemically acidified (C.A.) breads prepared with buckwheat
molasses doughs containing acids at the concentrations similar to sourdoughs at 24, 30, and
48 h were prepared and compared. The specific volume and crumb hardness of C.A. breads
and sourdough breads of G. albidus and K. baliensis at 24, 30, and 48 h were displayed in
Figure 13. Compared to the control breads (C), similar results were observed in the sourdough
breads and the C.A. breads. The sourdough breads (G. albidus and K. baliensis) and C.A.
breads of 24 h had significantly higher specific loaf volume and lower crumb hardness than the
control, while all breads from 48 h were the smallest and had the hardness crumbs (p < 0.001).
No significant difference in the bread volume and hardness was observed between control and
sourdough breads from 30 h.
Figure 13 Boxplot of specific volume (top) and crumb hardness (bottom) of buckwheat sourdough breads. Plain buckwheat breads (c, control) were compared with breads prepared with chemically acidified doughs (C.A.) (red), sourdough breads of G. albidus (blue) and sourdough breads of K. baliensis (green) fermented for 24, 30,
Results
39
and 48 h. Data are average of 3 independent experiments. Asterisks (*) indicate significant differences among the treatments (p < 0.05).
In order to further investigate the effect of levan-containing sourdoughs on bread staling, only
sourdough breads of 24 h were prepared. The staling of bread was determined by evaluating
the crumb hardness of breads at day 0, 1, and 4, and by the dehydration rate of bread slices
during storage from day 1 to 2. The staling of sourdough breads prepared by sourdoughs of
G. albidus and K. baliensis were compared to (1) control breads, (2) breads containing HPMC
as an additive, and (3) the chemically acidified (C.A.) control breads (Figure 14, top). In
general, the hardness of bread crumbs increased during the storage of breads, resulting in a dry-
looking, hardened breads already after 1 day of storage. Interestingly, the crumb hardness of
breads containing 1% HPMC and sourdough breads were still significantly lower than the
control and the C.A. control, being around 9.75-11.28 N compared to 12.66-13.05 N in the
control. Nevertheless, after 4 days of storage, all breads became harder and had similar crumb
hardness to the control breads, while the C.A. bread crumbs were the hardest at 20.119 ±
2.181 N.
The dehydration rates of bread slices during storage also revealed slightly less reductions of
bread dehydration (loss in moisture content) during the storage of breads with HPMC and
sourdough breads from both G. albidus and K. baliensis, compared to the control and C.A.
breads (Figure 14, bottom). Overall, levan-containing sourdoughs fermented for 24 h by
G. albidus and K. baliensis could improve the sensory attributes of buckwheat breads, increase
the specific volume, and reduce the crumb hardness. The staling rate of sourdough breads could
also be reduced after 1 day storage, comparable to the breads with additive (HPMC).
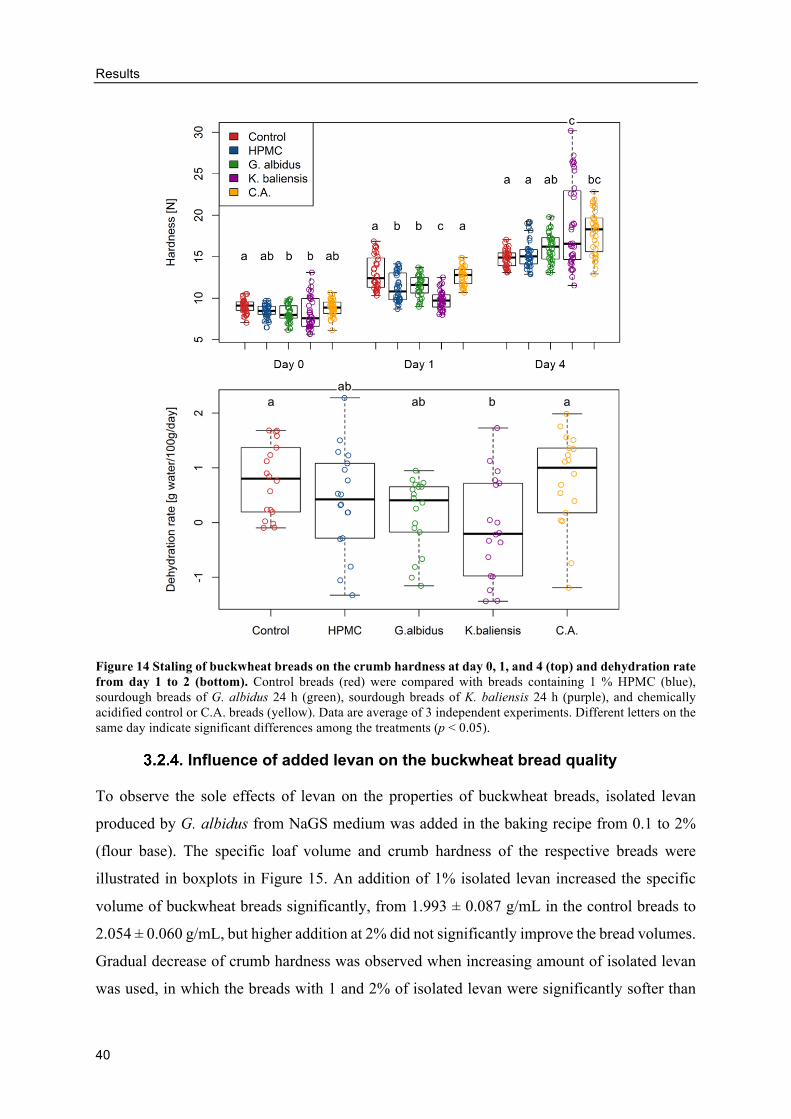
Results
40
Figure 14 Staling of buckwheat breads on the crumb hardness at day 0, 1, and 4 (top) and dehydration rate from day 1 to 2 (bottom). Control breads (red) were compared with breads containing 1 % HPMC (blue), sourdough breads of G. albidus 24 h (green), sourdough breads of K. baliensis 24 h (purple), and chemically acidified control or C.A. breads (yellow). Data are average of 3 independent experiments. Different letters on the same day indicate significant differences among the treatments (p < 0.05).
Influence of added levan on the buckwheat bread quality
To observe the sole effects of levan on the properties of buckwheat breads, isolated levan
produced by G. albidus from NaGS medium was added in the baking recipe from 0.1 to 2%
(flour base). The specific loaf volume and crumb hardness of the respective breads were
illustrated in boxplots in Figure 15. An addition of 1% isolated levan increased the specific
volume of buckwheat breads significantly, from 1.993 ± 0.087 g/mL in the control breads to
2.054 ± 0.060 g/mL, but higher addition at 2% did not significantly improve the bread volumes.
Gradual decrease of crumb hardness was observed when increasing amount of isolated levan
was used, in which the breads with 1 and 2% of isolated levan were significantly softer than
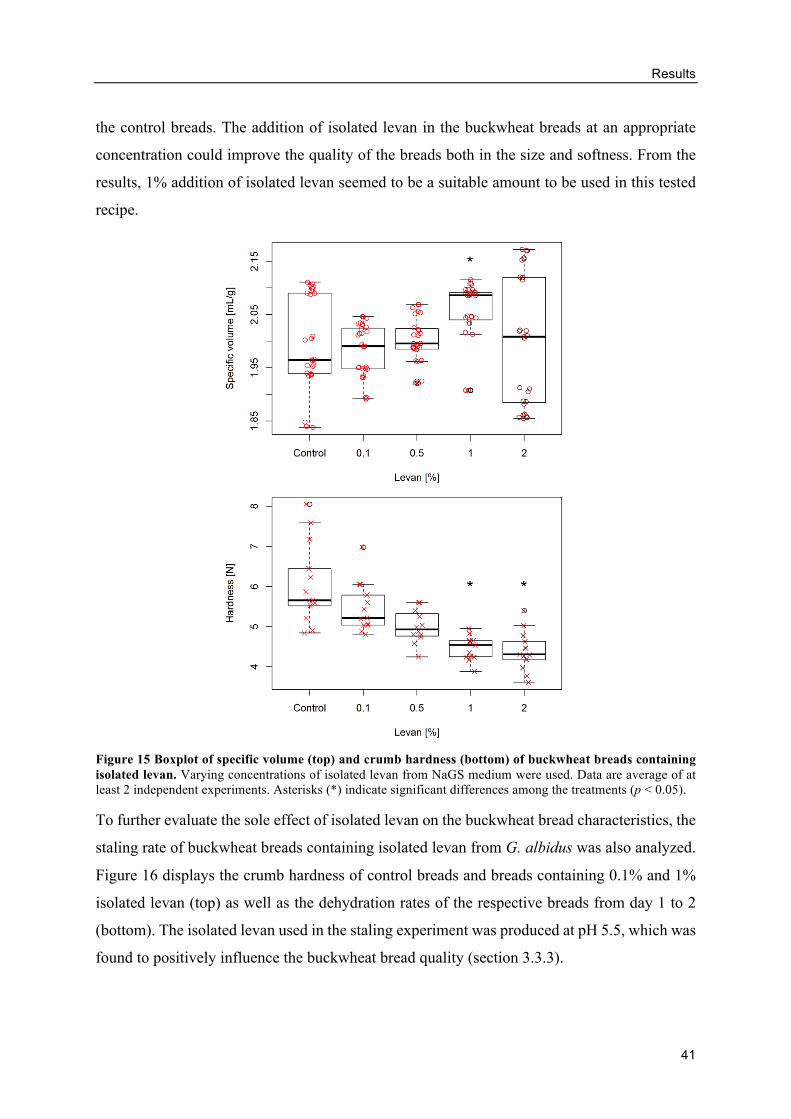
Results
41
the control breads. The addition of isolated levan in the buckwheat breads at an appropriate
concentration could improve the quality of the breads both in the size and softness. From the
results, 1% addition of isolated levan seemed to be a suitable amount to be used in this tested
recipe.
Figure 15 Boxplot of specific volume (top) and crumb hardness (bottom) of buckwheat breads containing isolated levan. Varying concentrations of isolated levan from NaGS medium were used. Data are average of at least 2 independent experiments. Asterisks (*) indicate significant differences among the treatments (p < 0.05).
To further evaluate the sole effect of isolated levan on the buckwheat bread characteristics, the
staling rate of buckwheat breads containing isolated levan from G. albidus was also analyzed.
Figure 16 displays the crumb hardness of control breads and breads containing 0.1% and 1%
isolated levan (top) as well as the dehydration rates of the respective breads from day 1 to 2
(bottom). The isolated levan used in the staling experiment was produced at pH 5.5, which was
found to positively influence the buckwheat bread quality (section 3.3.3).
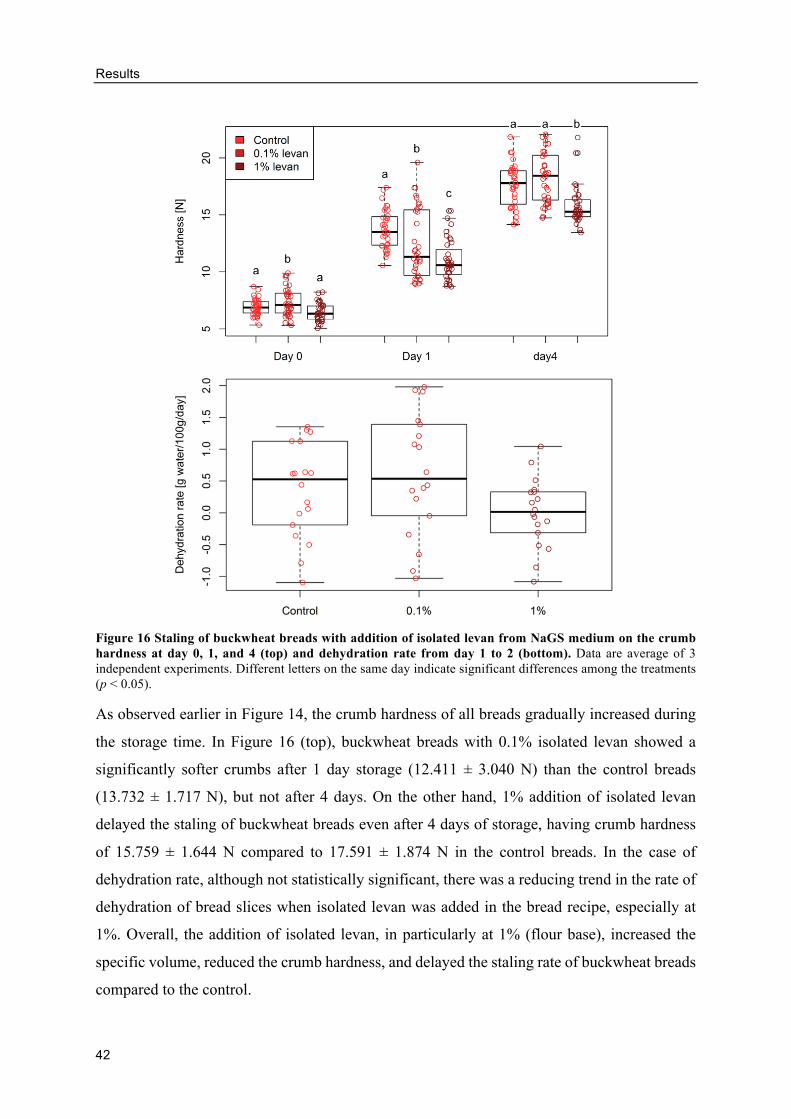
Results
42
Figure 16 Staling of buckwheat breads with addition of isolated levan from NaGS medium on the crumb hardness at day 0, 1, and 4 (top) and dehydration rate from day 1 to 2 (bottom). Data are average of 3 independent experiments. Different letters on the same day indicate significant differences among the treatments (p < 0.05).
As observed earlier in Figure 14, the crumb hardness of all breads gradually increased during
the storage time. In Figure 16 (top), buckwheat breads with 0.1% isolated levan showed a
significantly softer crumbs after 1 day storage (12.411 ± 3.040 N) than the control breads
(13.732 ± 1.717 N), but not after 4 days. On the other hand, 1% addition of isolated levan
delayed the staling of buckwheat breads even after 4 days of storage, having crumb hardness
of 15.759 ± 1.644 N compared to 17.591 ± 1.874 N in the control breads. In the case of
dehydration rate, although not statistically significant, there was a reducing trend in the rate of
dehydration of bread slices when isolated levan was added in the bread recipe, especially at
1%. Overall, the addition of isolated levan, in particularly at 1% (flour base), increased the
specific volume, reduced the crumb hardness, and delayed the staling rate of buckwheat breads
compared to the control.
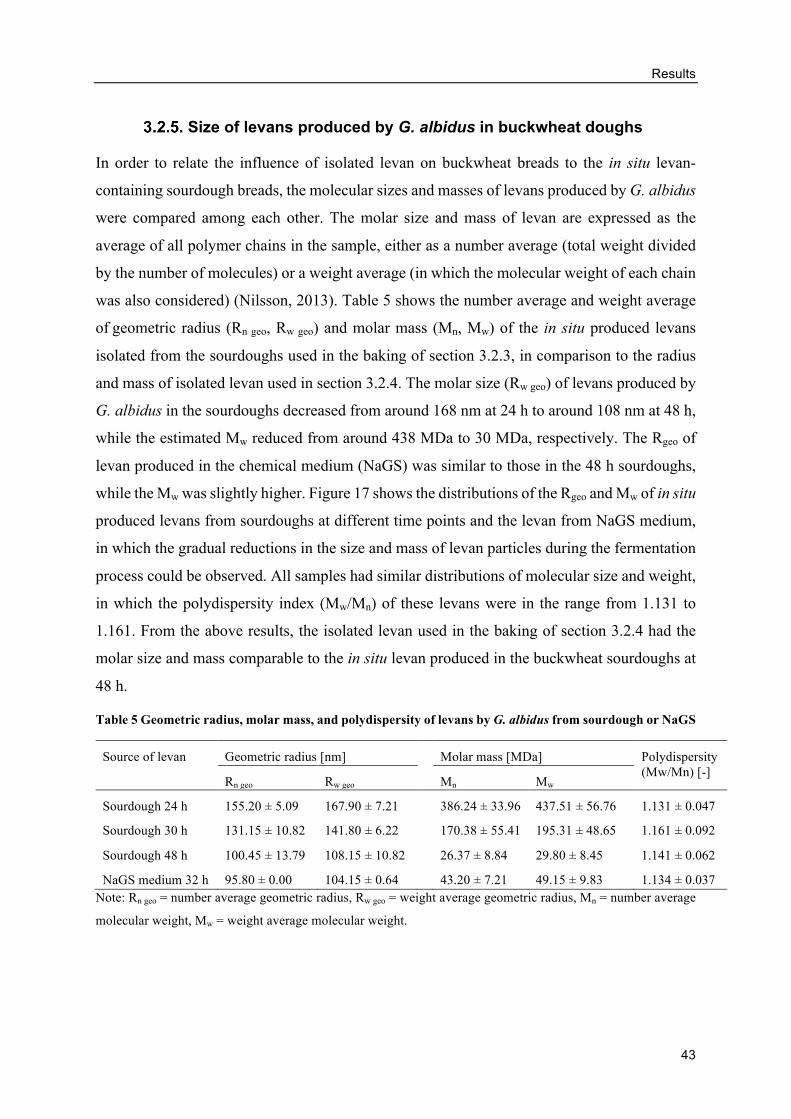
Results
43
Size of levans produced by G. albidus in buckwheat doughs
In order to relate the influence of isolated levan on buckwheat breads to the in situ levan-
containing sourdough breads, the molecular sizes and masses of levans produced by G. albidus
were compared among each other. The molar size and mass of levan are expressed as the
average of all polymer chains in the sample, either as a number average (total weight divided
by the number of molecules) or a weight average (in which the molecular weight of each chain
was also considered) (Nilsson, 2013). Table 5 shows the number average and weight average
of geometric radius (Rn geo, Rw geo) and molar mass (Mn, Mw) of the in situ produced levans
isolated from the sourdoughs used in the baking of section 3.2.3, in comparison to the radius
and mass of isolated levan used in section 3.2.4. The molar size (Rw geo) of levans produced by
G. albidus in the sourdoughs decreased from around 168 nm at 24 h to around 108 nm at 48 h,
while the estimated Mw reduced from around 438 MDa to 30 MDa, respectively. The Rgeo of
levan produced in the chemical medium (NaGS) was similar to those in the 48 h sourdoughs,
while the Mw was slightly higher. Figure 17 shows the distributions of the Rgeo and Mw of in situ
produced levans from sourdoughs at different time points and the levan from NaGS medium,
in which the gradual reductions in the size and mass of levan particles during the fermentation
process could be observed. All samples had similar distributions of molecular size and weight,
in which the polydispersity index (Mw/Mn) of these levans were in the range from 1.131 to
1.161. From the above results, the isolated levan used in the baking of section 3.2.4 had the
molar size and mass comparable to the in situ levan produced in the buckwheat sourdoughs at
48 h.
Table 5 Geometric radius, molar mass, and polydispersity of levans by G. albidus from sourdough or NaGS
Source of levan Geometric radius [nm] Molar mass [MDa] Polydispersity (Mw/Mn) [-]
Rn geo Rw geo Mn Mw
Sourdough 24 h 155.20 ± 5.09 167.90 ± 7.21 386.24 ± 33.96 437.51 ± 56.76 1.131 ± 0.047
Sourdough 30 h 131.15 ± 10.82 141.80 ± 6.22 170.38 ± 55.41 195.31 ± 48.65 1.161 ± 0.092
Sourdough 48 h 100.45 ± 13.79 108.15 ± 10.82 26.37 ± 8.84 29.80 ± 8.45 1.141 ± 0.062
NaGS medium 32 h 95.80 ± 0.00 104.15 ± 0.64 43.20 ± 7.21 49.15 ± 9.83 1.134 ± 0.037 Note: Rn geo = number average geometric radius, Rw geo = weight average geometric radius, Mn = number average
molecular weight, Mw = weight average molecular weight.
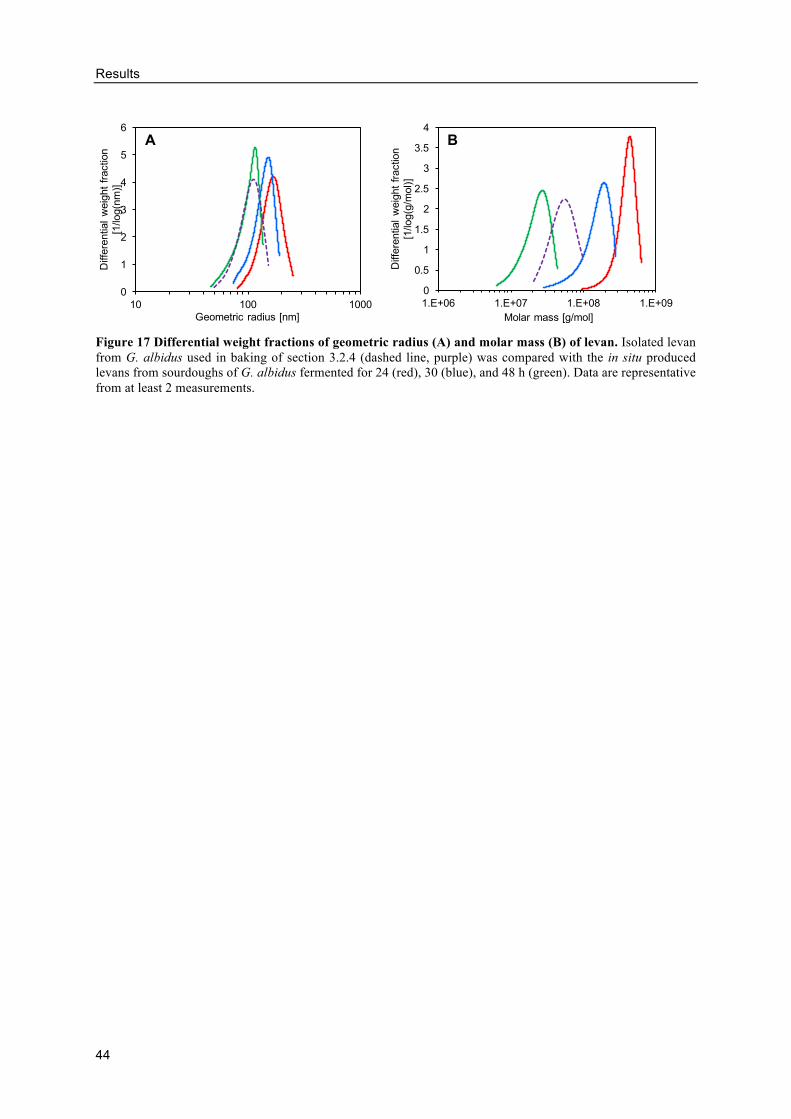
Results
44
Figure 17 Differential weight fractions of geometric radius (A) and molar mass (B) of levan. Isolated levan from G. albidus used in baking of section 3.2.4 (dashed line, purple) was compared with the in situ produced levans from sourdoughs of G. albidus fermented for 24 (red), 30 (blue), and 48 h (green). Data are representative from at least 2 measurements.
0
1
2
3
4
5
6
10 100 1000
Diffe
rential
weig
ht
fraction
[1/log(n
m)]
Geometric radius [nm]
A
0
0.5
1
1.5
2
2.5
3
3.5
4
1.E+06 1.E+07 1.E+08 1.E+09
Diffe
rential
weig
ht
fraction
[1/log(g
/mol)
]
Molar mass [g/mol]
B
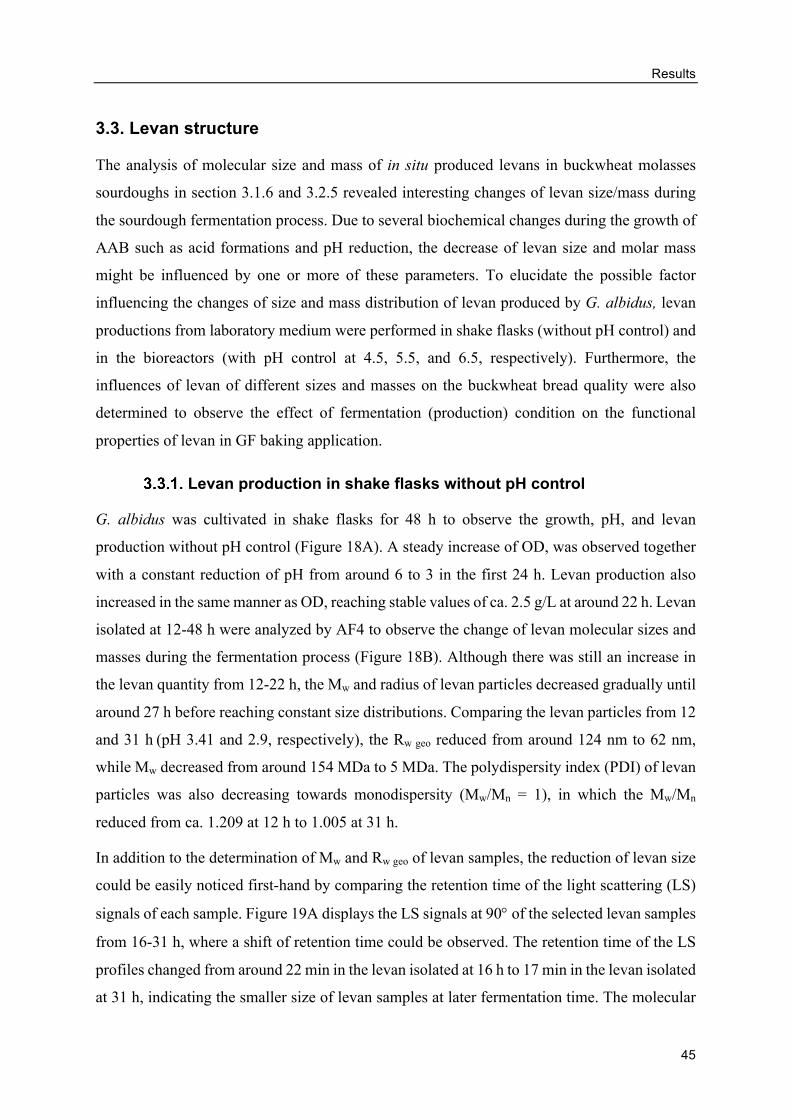
Results
45
3.3. Levan structure
The analysis of molecular size and mass of in situ produced levans in buckwheat molasses
sourdoughs in section 3.1.6 and 3.2.5 revealed interesting changes of levan size/mass during
the sourdough fermentation process. Due to several biochemical changes during the growth of
AAB such as acid formations and pH reduction, the decrease of levan size and molar mass
might be influenced by one or more of these parameters. To elucidate the possible factor
influencing the changes of size and mass distribution of levan produced by G. albidus, levan
productions from laboratory medium were performed in shake flasks (without pH control) and
in the bioreactors (with pH control at 4.5, 5.5, and 6.5, respectively). Furthermore, the
influences of levan of different sizes and masses on the buckwheat bread quality were also
determined to observe the effect of fermentation (production) condition on the functional
properties of levan in GF baking application.
Levan production in shake flasks without pH control
G. albidus was cultivated in shake flasks for 48 h to observe the growth, pH, and levan
production without pH control (Figure 18A). A steady increase of OD, was observed together
with a constant reduction of pH from around 6 to 3 in the first 24 h. Levan production also
increased in the same manner as OD, reaching stable values of ca. 2.5 g/L at around 22 h. Levan
isolated at 12-48 h were analyzed by AF4 to observe the change of levan molecular sizes and
masses during the fermentation process (Figure 18B). Although there was still an increase in
the levan quantity from 12-22 h, the Mw and radius of levan particles decreased gradually until
around 27 h before reaching constant size distributions. Comparing the levan particles from 12
and 31 h (pH 3.41 and 2.9, respectively), the Rw geo reduced from around 124 nm to 62 nm,
while Mw decreased from around 154 MDa to 5 MDa. The polydispersity index (PDI) of levan
particles was also decreasing towards monodispersity (Mw/Mn = 1), in which the Mw/Mn
reduced from ca. 1.209 at 12 h to 1.005 at 31 h.
In addition to the determination of Mw and Rw geo of levan samples, the reduction of levan size
could be easily noticed first-hand by comparing the retention time of the light scattering (LS)
signals of each sample. Figure 19A displays the LS signals at 90° of the selected levan samples
from 16-31 h, where a shift of retention time could be observed. The retention time of the LS
profiles changed from around 22 min in the levan isolated at 16 h to 17 min in the levan isolated
at 31 h, indicating the smaller size of levan samples at later fermentation time. The molecular
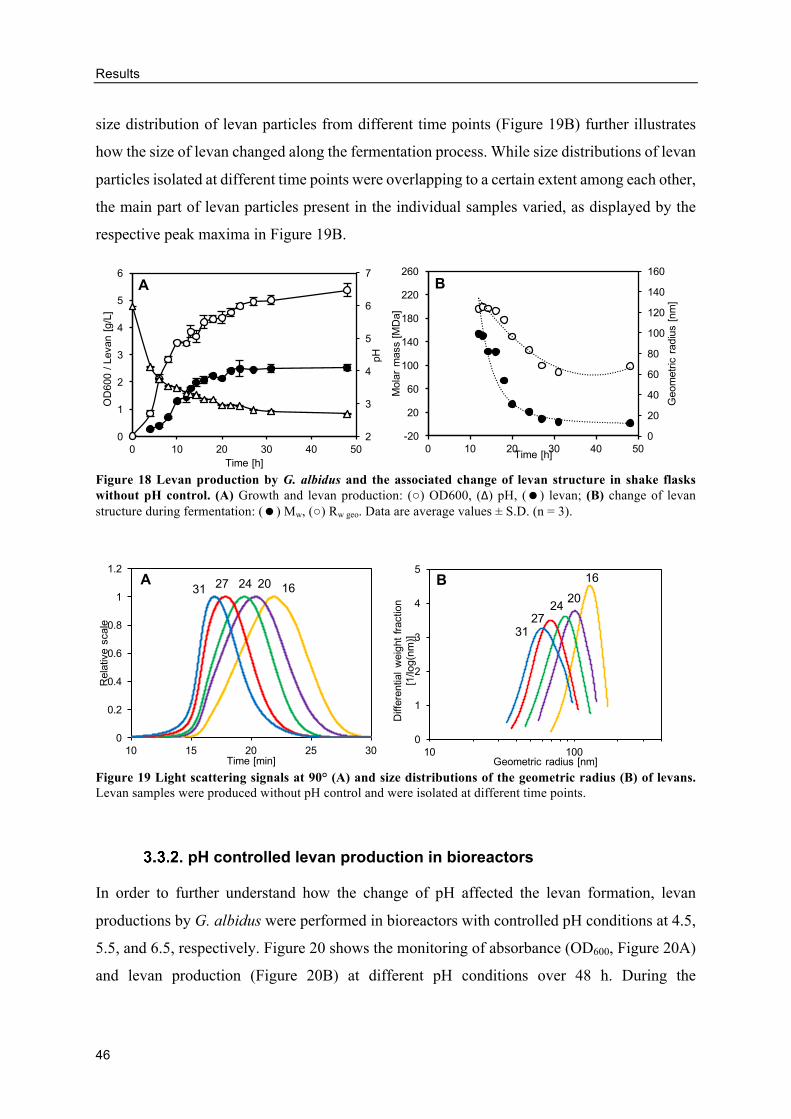
Results
46
size distribution of levan particles from different time points (Figure 19B) further illustrates
how the size of levan changed along the fermentation process. While size distributions of levan
particles isolated at different time points were overlapping to a certain extent among each other,
the main part of levan particles present in the individual samples varied, as displayed by the
respective peak maxima in Figure 19B.
Figure 18 Levan production by G. albidus and the associated change of levan structure in shake flasks without pH control. (A) Growth and levan production: (○) OD600, (∆) pH, (=) levan; (B) change of levan structure during fermentation: (=) Mw, (○) Rw geo. Data are average values ± S.D. (n = 3).
Figure 19 Light scattering signals at 90° (A) and size distributions of the geometric radius (B) of levans. Levan samples were produced without pH control and were isolated at different time points.
pH controlled levan production in bioreactors
In order to further understand how the change of pH affected the levan formation, levan
productions by G. albidus were performed in bioreactors with controlled pH conditions at 4.5,
5.5, and 6.5, respectively. Figure 20 shows the monitoring of absorbance (OD600, Figure 20A)
and levan production (Figure 20B) at different pH conditions over 48 h. During the
2
3
4
5
6
7
0
1
2
3
4
5
6
0 10 20 30 40 50
pH
OD
600 /
Levan [
g/L
]
Time [h]
A
0
20
40
60
80
100
120
140
160
-20
20
60
100
140
180
220
260
0 10 20 30 40 50
Geom
etr
ic r
adiu
s [
nm
]
Mola
r m
ass [
MD
a]
Time [h]
B
0
0.2
0.4
0.6
0.8
1
1.2
10 15 20 25 30
Rela
tive s
cale
Time [min]
1620242731
A
0
1
2
3
4
5
10 100
Diffe
rential
weig
ht
fraction
[1/log(n
m)]
Geometric radius [nm]
16
2024
27
31
B
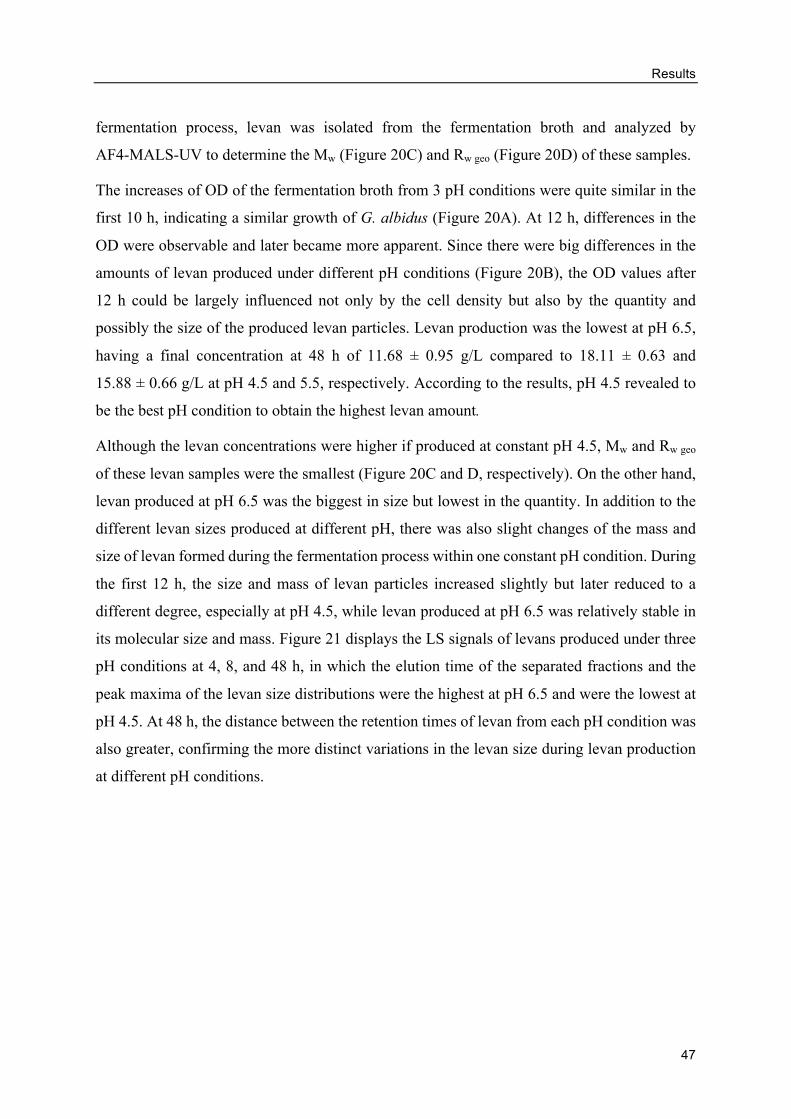
Results
47
fermentation process, levan was isolated from the fermentation broth and analyzed by
AF4-MALS-UV to determine the Mw (Figure 20C) and Rw geo (Figure 20D) of these samples.
The increases of OD of the fermentation broth from 3 pH conditions were quite similar in the
first 10 h, indicating a similar growth of G. albidus (Figure 20A). At 12 h, differences in the
OD were observable and later became more apparent. Since there were big differences in the
amounts of levan produced under different pH conditions (Figure 20B), the OD values after
12 h could be largely influenced not only by the cell density but also by the quantity and
possibly the size of the produced levan particles. Levan production was the lowest at pH 6.5,
having a final concentration at 48 h of 11.68 ± 0.95 g/L compared to 18.11 ± 0.63 and
15.88 ± 0.66 g/L at pH 4.5 and 5.5, respectively. According to the results, pH 4.5 revealed to
be the best pH condition to obtain the highest levan amount.
Although the levan concentrations were higher if produced at constant pH 4.5, Mw and Rw geo
of these levan samples were the smallest (Figure 20C and D, respectively). On the other hand,
levan produced at pH 6.5 was the biggest in size but lowest in the quantity. In addition to the
different levan sizes produced at different pH, there was also slight changes of the mass and
size of levan formed during the fermentation process within one constant pH condition. During
the first 12 h, the size and mass of levan particles increased slightly but later reduced to a
different degree, especially at pH 4.5, while levan produced at pH 6.5 was relatively stable in
its molecular size and mass. Figure 21 displays the LS signals of levans produced under three
pH conditions at 4, 8, and 48 h, in which the elution time of the separated fractions and the
peak maxima of the levan size distributions were the highest at pH 6.5 and were the lowest at
pH 4.5. At 48 h, the distance between the retention times of levan from each pH condition was
also greater, confirming the more distinct variations in the levan size during levan production
at different pH conditions.
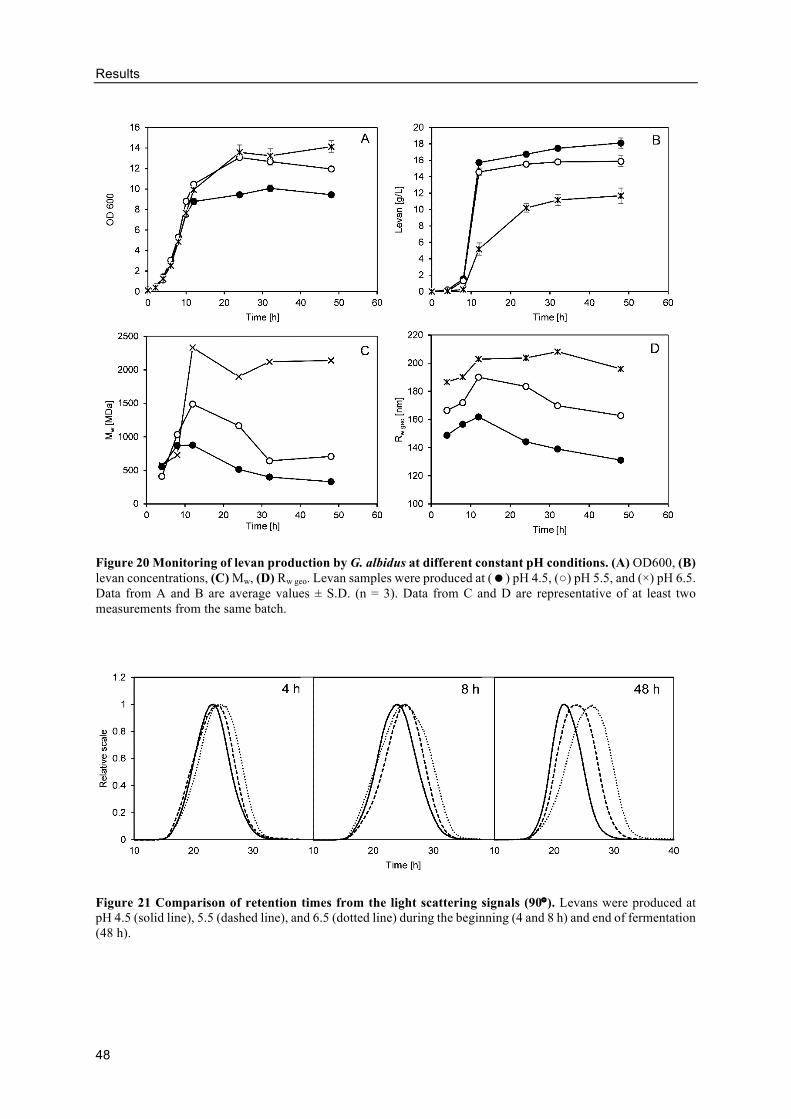
Results
48
Figure 20 Monitoring of levan production by G. albidus at different constant pH conditions. (A) OD600, (B) levan concentrations, (C) Mw, (D) Rw geo. Levan samples were produced at (=) pH 4.5, (○) pH 5.5, and (×) pH 6.5. Data from A and B are average values ± S.D. (n = 3). Data from C and D are representative of at least two measurements from the same batch.
Figure 21 Comparison of retention times from the light scattering signals (90°). Levans were produced at pH 4.5 (solid line), 5.5 (dashed line), and 6.5 (dotted line) during the beginning (4 and 8 h) and end of fermentation (48 h).
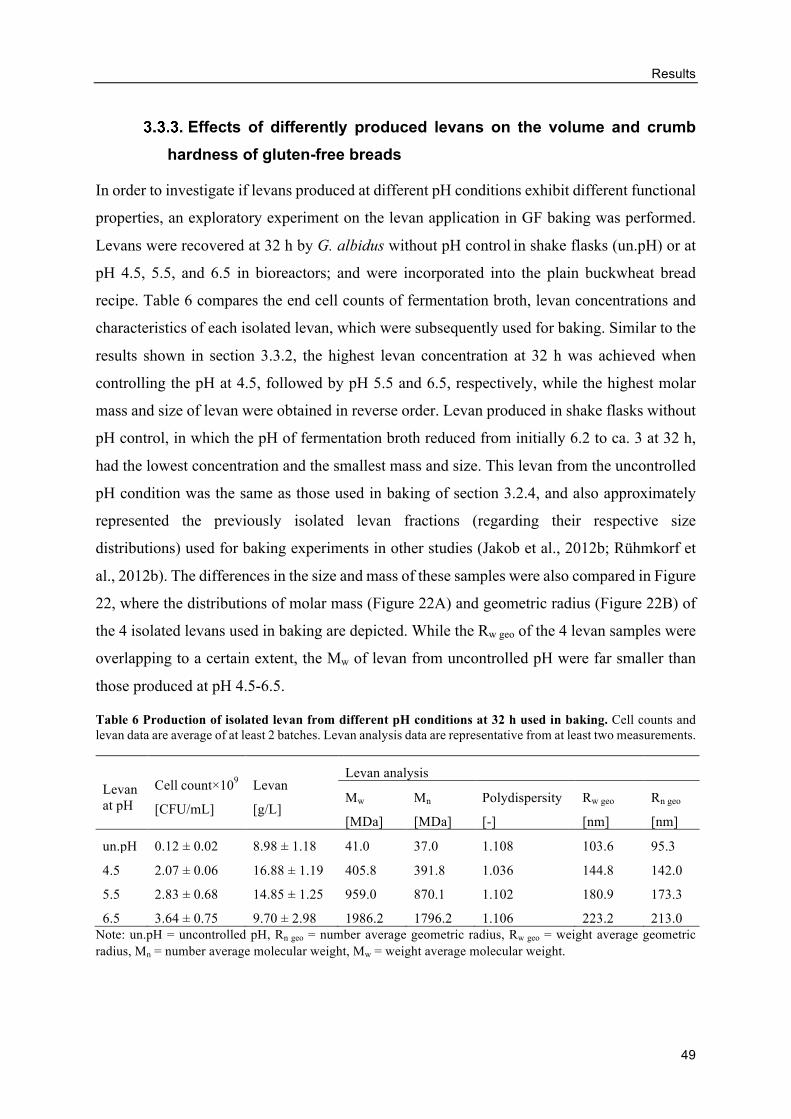
Results
49
Effects of differently produced levans on the volume and crumb
hardness of gluten-free breads
In order to investigate if levans produced at different pH conditions exhibit different functional
properties, an exploratory experiment on the levan application in GF baking was performed.
Levans were recovered at 32 h by G. albidus without pH control in shake flasks (un.pH) or at
pH 4.5, 5.5, and 6.5 in bioreactors; and were incorporated into the plain buckwheat bread
recipe. Table 6 compares the end cell counts of fermentation broth, levan concentrations and
characteristics of each isolated levan, which were subsequently used for baking. Similar to the
results shown in section 3.3.2, the highest levan concentration at 32 h was achieved when
controlling the pH at 4.5, followed by pH 5.5 and 6.5, respectively, while the highest molar
mass and size of levan were obtained in reverse order. Levan produced in shake flasks without
pH control, in which the pH of fermentation broth reduced from initially 6.2 to ca. 3 at 32 h,
had the lowest concentration and the smallest mass and size. This levan from the uncontrolled
pH condition was the same as those used in baking of section 3.2.4, and also approximately
represented the previously isolated levan fractions (regarding their respective size
distributions) used for baking experiments in other studies (Jakob et al., 2012b; Rühmkorf et
al., 2012b). The differences in the size and mass of these samples were also compared in Figure
22, where the distributions of molar mass (Figure 22A) and geometric radius (Figure 22B) of
the 4 isolated levans used in baking are depicted. While the Rw geo of the 4 levan samples were
overlapping to a certain extent, the Mw of levan from uncontrolled pH were far smaller than
those produced at pH 4.5-6.5.
Table 6 Production of isolated levan from different pH conditions at 32 h used in baking. Cell counts and levan data are average of at least 2 batches. Levan analysis data are representative from at least two measurements.
Levan at pH
Cell count×109
[CFU/mL]
Levan
[g/L]
Levan analysis
Mw
[MDa]
Mn
[MDa]
Polydispersity
[-]
Rw geo
[nm]
Rn geo
[nm]
un.pH 0.12 ± 0.02 8.98 ± 1.18 41.0 37.0 1.108 103.6 95.3
4.5 2.07 ± 0.06 16.88 ± 1.19 405.8 391.8 1.036 144.8 142.0
5.5 2.83 ± 0.68 14.85 ± 1.25 959.0 870.1 1.102 180.9 173.3
6.5 3.64 ± 0.75 9.70 ± 2.98 1986.2 1796.2 1.106 223.2 213.0 Note: un.pH = uncontrolled pH, Rn geo = number average geometric radius, Rw geo = weight average geometric radius, Mn = number average molecular weight, Mw = weight average molecular weight.
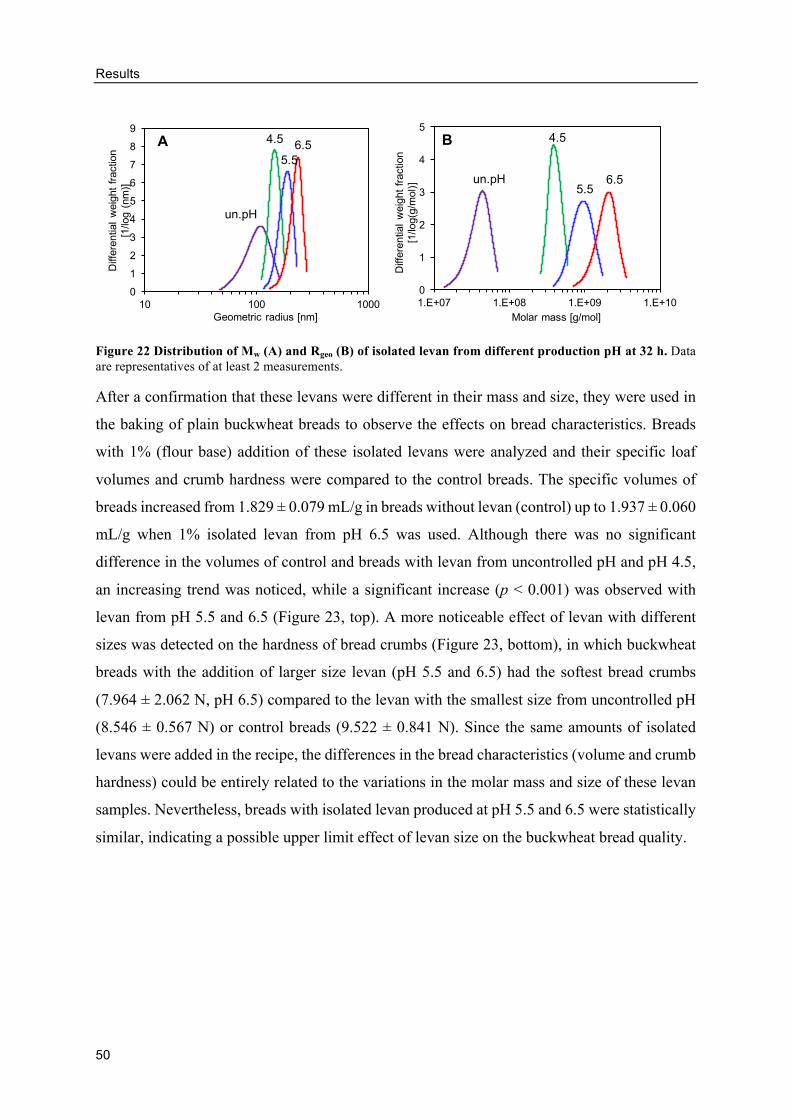
Results
50
Figure 22 Distribution of Mw (A) and Rgeo (B) of isolated levan from different production pH at 32 h. Data are representatives of at least 2 measurements.
After a confirmation that these levans were different in their mass and size, they were used in
the baking of plain buckwheat breads to observe the effects on bread characteristics. Breads
with 1% (flour base) addition of these isolated levans were analyzed and their specific loaf
volumes and crumb hardness were compared to the control breads. The specific volumes of
breads increased from 1.829 ± 0.079 mL/g in breads without levan (control) up to 1.937 ± 0.060
mL/g when 1% isolated levan from pH 6.5 was used. Although there was no significant
difference in the volumes of control and breads with levan from uncontrolled pH and pH 4.5,
an increasing trend was noticed, while a significant increase (p < 0.001) was observed with
levan from pH 5.5 and 6.5 (Figure 23, top). A more noticeable effect of levan with different
sizes was detected on the hardness of bread crumbs (Figure 23, bottom), in which buckwheat
breads with the addition of larger size levan (pH 5.5 and 6.5) had the softest bread crumbs
(7.964 ± 2.062 N, pH 6.5) compared to the levan with the smallest size from uncontrolled pH
(8.546 ± 0.567 N) or control breads (9.522 ± 0.841 N). Since the same amounts of isolated
levans were added in the recipe, the differences in the bread characteristics (volume and crumb
hardness) could be entirely related to the variations in the molar mass and size of these levan
samples. Nevertheless, breads with isolated levan produced at pH 5.5 and 6.5 were statistically
similar, indicating a possible upper limit effect of levan size on the buckwheat bread quality.
0
1
2
3
4
5
6
7
8
9
10 100 1000
Diffe
rential
weig
ht
fraction
[1/log (
nm
)]
Geometric radius [nm]
A 6.5
5.5
4.5
un.pH
0
1
2
3
4
5
1.E+07 1.E+08 1.E+09 1.E+10
Diffe
rential
weig
ht
fraction
[1/log(g
/mol)
]
Molar mass [g/mol]
B
6.55.5
4.5
un.pH
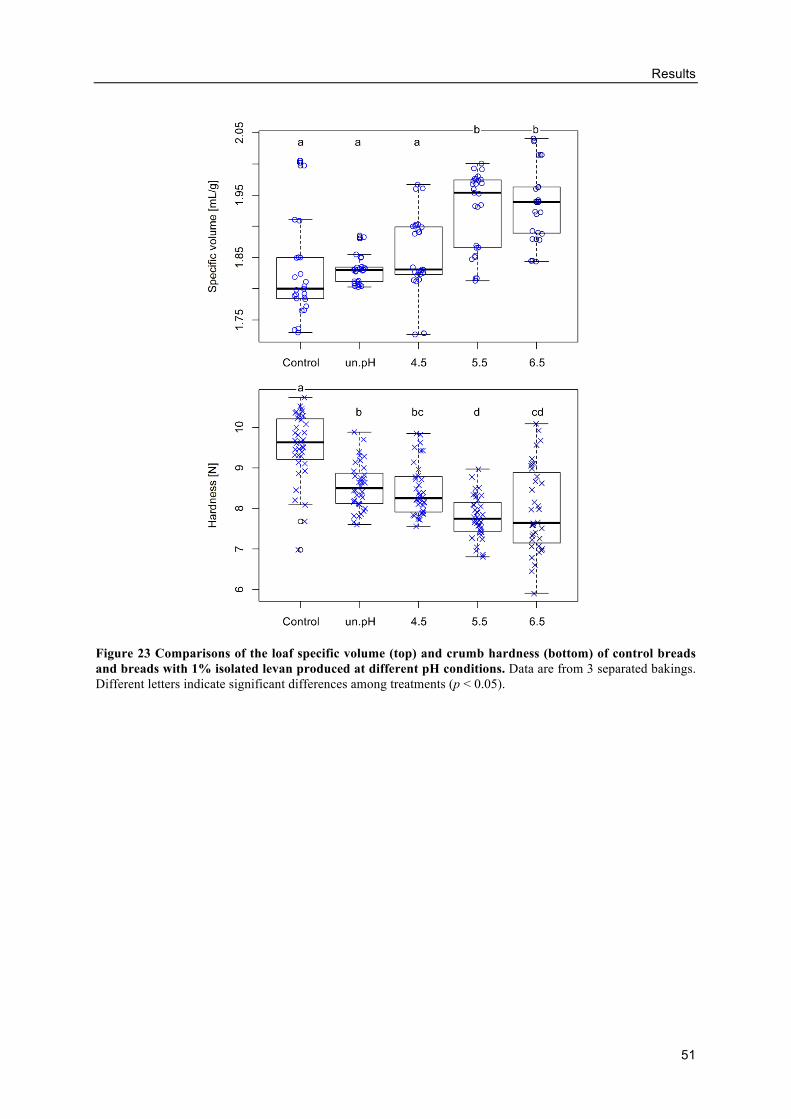
Results
51
Figure 23 Comparisons of the loaf specific volume (top) and crumb hardness (bottom) of control breads and breads with 1% isolated levan produced at different pH conditions. Data are from 3 separated bakings. Different letters indicate significant differences among treatments (p < 0.05).
Results
52
3.4. Levan production using molasses as carbon source
The analysis on growth and levan production by selected AAB strains on buckwheat molasses
sourdoughs in the previous sections confirmed the ability of AAB to grow and produce levan
from untreated molasses. To further explore and understand the nature of these strains during
the fermentation process, for example for an industrial production goal, the growth and levan
productions from molasses medium by G. albidus and K. baliensis were performed in various
conditions such as with and without pH control (G. albidus), or under high and low O2
conditions (K. baliensis).
Influence of molasses concentrations and inoculum sizes on the
EPS production
Similar to the buckwheat molasses sourdoughs, the influence of molasses concentrations and
inoculum sizes on the EPS production by G. albidus and K. baliensis were investigated. In both
strains, there was a positive correlation between the initial molasses concentration and the
amount of EPS produced at 48 h at the molasses concentrations up to 15% (w/w), reaching
9.92 ± 0.08 g/L in G. albidus and 12.93 ± 2.63 g/L in K. baliensis (Figure 24A). At the initial
concentrations higher than 15%, a relatively steady amount of EPS was observed. In contrast
to the results from buckwheat sourdoughs in section 3.1.5, the initial cell concentration did not
affect the EPS production in molasses medium, in which similar amount of EPS as well as final
viable cell counts were detected (Figure 24B). An exception was found in the levan production
by G. albidus with 7.5% inoculum, in which a rather lower concentration levan and cell counts
were detected. At 10% inoculum or in the case of K. baliensis, however, no reduction in the
final cell counts and EPS concentration were observed.
For the rest of the study, only 10% (w/w) molasses and 5% inoculum were used as the
production medium and inoculum size. Since these levan-containing molasses would later be
incorporated into the bread doughs (section 3.4.3), an appropriate molasses concentration (i.e.
10%) ensured that only minimal amount of sugars were left after fermentation. Additionally,
higher molasses concentration used would intensify the brown color of levan isolated from
molasses medium, which could in turn cause more difficulties during the size analysis of levan
by AF4.
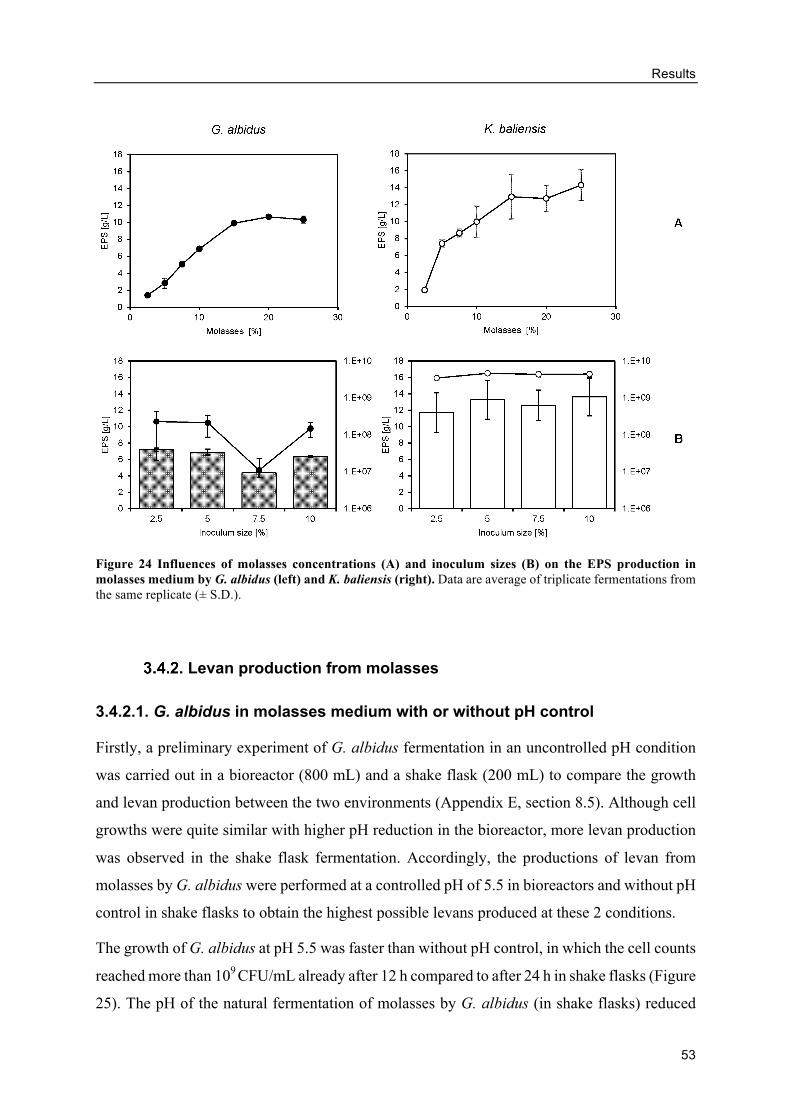
Results
53
Figure 24 Influences of molasses concentrations (A) and inoculum sizes (B) on the EPS production in molasses medium by G. albidus (left) and K. baliensis (right). Data are average of triplicate fermentations from the same replicate (± S.D.).
Levan production from molasses
3.4.2.1. G. albidus in molasses medium with or without pH control
Firstly, a preliminary experiment of G. albidus fermentation in an uncontrolled pH condition
was carried out in a bioreactor (800 mL) and a shake flask (200 mL) to compare the growth
and levan production between the two environments (Appendix E, section 8.5). Although cell
growths were quite similar with higher pH reduction in the bioreactor, more levan production
was observed in the shake flask fermentation. Accordingly, the productions of levan from
molasses by G. albidus were performed at a controlled pH of 5.5 in bioreactors and without pH
control in shake flasks to obtain the highest possible levans produced at these 2 conditions.
The growth of G. albidus at pH 5.5 was faster than without pH control, in which the cell counts
reached more than 109 CFU/mL already after 12 h compared to after 24 h in shake flasks (Figure
25). The pH of the natural fermentation of molasses by G. albidus (in shake flasks) reduced
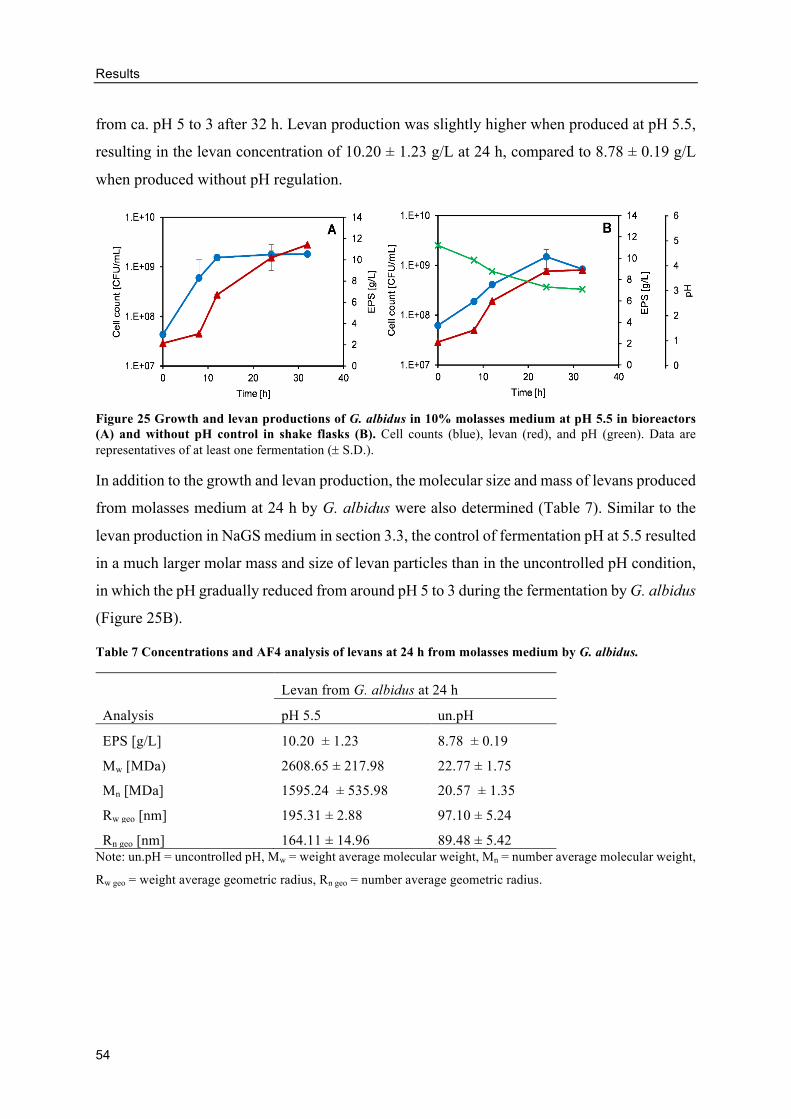
Results
54
from ca. pH 5 to 3 after 32 h. Levan production was slightly higher when produced at pH 5.5,
resulting in the levan concentration of 10.20 ± 1.23 g/L at 24 h, compared to 8.78 ± 0.19 g/L
when produced without pH regulation.
Figure 25 Growth and levan productions of G. albidus in 10% molasses medium at pH 5.5 in bioreactors (A) and without pH control in shake flasks (B). Cell counts (blue), levan (red), and pH (green). Data are representatives of at least one fermentation (± S.D.).
In addition to the growth and levan production, the molecular size and mass of levans produced
from molasses medium at 24 h by G. albidus were also determined (Table 7). Similar to the
levan production in NaGS medium in section 3.3, the control of fermentation pH at 5.5 resulted
in a much larger molar mass and size of levan particles than in the uncontrolled pH condition,
in which the pH gradually reduced from around pH 5 to 3 during the fermentation by G. albidus
(Figure 25B).
Table 7 Concentrations and AF4 analysis of levans at 24 h from molasses medium by G. albidus.
Analysis
Levan from G. albidus at 24 h
pH 5.5 un.pH
EPS [g/L] 10.20 ± 1.23 8.78 ± 0.19
Mw [MDa) 2608.65 ± 217.98 22.77 ± 1.75
Mn [MDa] 1595.24 ± 535.98 20.57 ± 1.35
Rw geo [nm] 195.31 ± 2.88 97.10 ± 5.24
Rn geo [nm] 164.11 ± 14.96 89.48 ± 5.42 Note: un.pH = uncontrolled pH, Mw = weight average molecular weight, Mn = number average molecular weight,
Rw geo = weight average geometric radius, Rn geo = number average geometric radius.
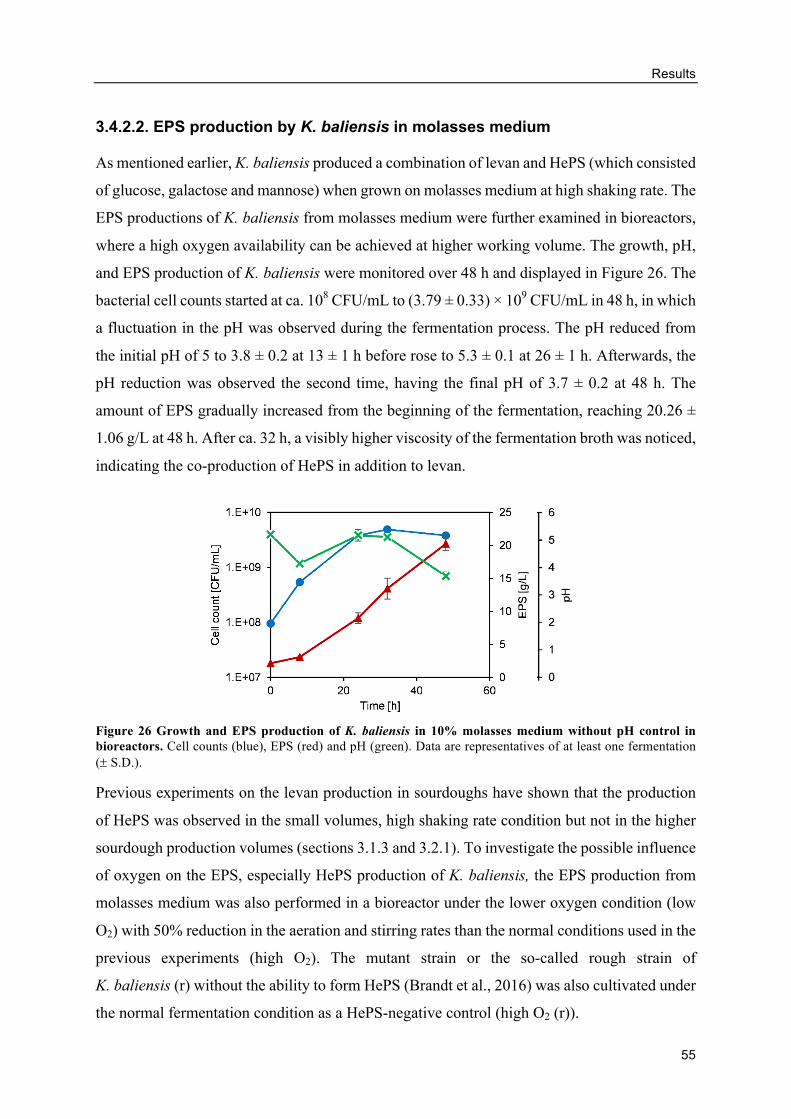
Results
55
3.4.2.2. EPS production by K. baliensis in molasses medium
As mentioned earlier, K. baliensis produced a combination of levan and HePS (which consisted
of glucose, galactose and mannose) when grown on molasses medium at high shaking rate. The
EPS productions of K. baliensis from molasses medium were further examined in bioreactors,
where a high oxygen availability can be achieved at higher working volume. The growth, pH,
and EPS production of K. baliensis were monitored over 48 h and displayed in Figure 26. The
bacterial cell counts started at ca. 108 CFU/mL to (3.79 ± 0.33) × 109 CFU/mL in 48 h, in which
a fluctuation in the pH was observed during the fermentation process. The pH reduced from
the initial pH of 5 to 3.8 ± 0.2 at 13 ± 1 h before rose to 5.3 ± 0.1 at 26 ± 1 h. Afterwards, the
pH reduction was observed the second time, having the final pH of 3.7 ± 0.2 at 48 h. The
amount of EPS gradually increased from the beginning of the fermentation, reaching 20.26 ±
1.06 g/L at 48 h. After ca. 32 h, a visibly higher viscosity of the fermentation broth was noticed,
indicating the co-production of HePS in addition to levan.
Figure 26 Growth and EPS production of K. baliensis in 10% molasses medium without pH control in bioreactors. Cell counts (blue), EPS (red) and pH (green). Data are representatives of at least one fermentation (± S.D.).
Previous experiments on the levan production in sourdoughs have shown that the production
of HePS was observed in the small volumes, high shaking rate condition but not in the higher
sourdough production volumes (sections 3.1.3 and 3.2.1). To investigate the possible influence
of oxygen on the EPS, especially HePS production of K. baliensis, the EPS production from
molasses medium was also performed in a bioreactor under the lower oxygen condition (low
O2) with 50% reduction in the aeration and stirring rates than the normal conditions used in the
previous experiments (high O2). The mutant strain or the so-called rough strain of
K. baliensis (r) without the ability to form HePS (Brandt et al., 2016) was also cultivated under
the normal fermentation condition as a HePS-negative control (high O2 (r)).
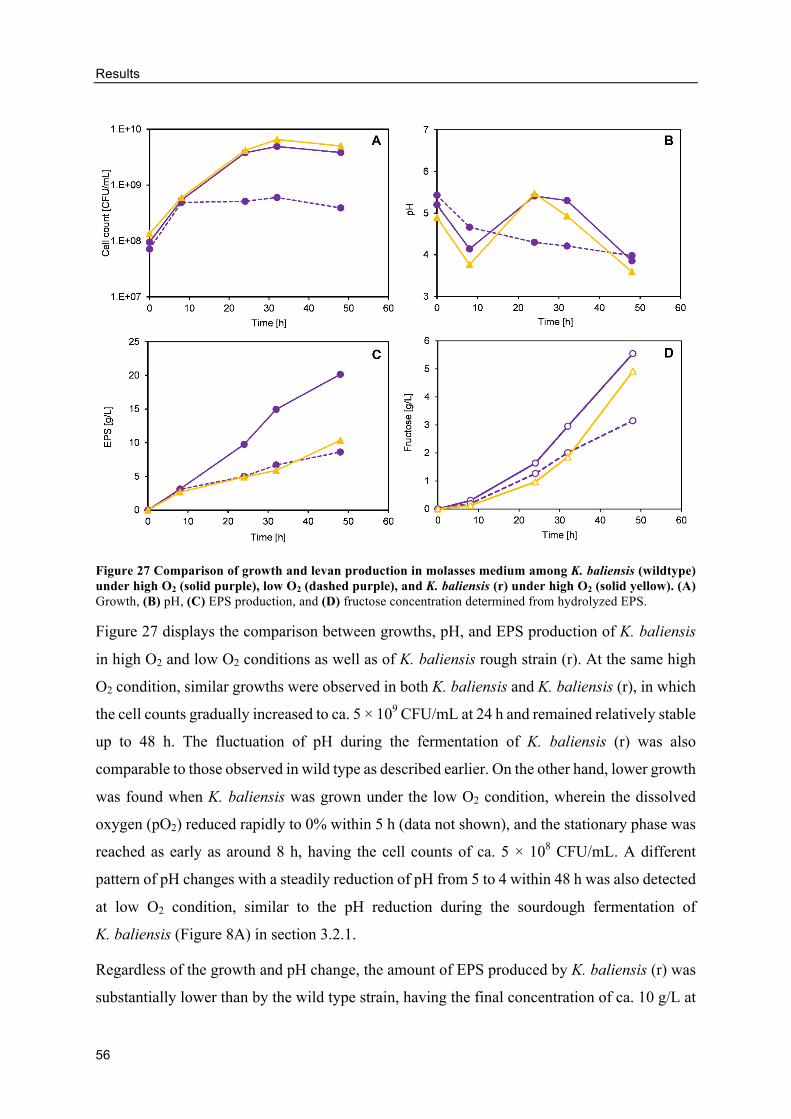
Results
56
Figure 27 Comparison of growth and levan production in molasses medium among K. baliensis (wildtype) under high O2 (solid purple), low O2 (dashed purple), and K. baliensis (r) under high O2 (solid yellow). (A) Growth, (B) pH, (C) EPS production, and (D) fructose concentration determined from hydrolyzed EPS.
Figure 27 displays the comparison between growths, pH, and EPS production of K. baliensis
in high O2 and low O2 conditions as well as of K. baliensis rough strain (r). At the same high
O2 condition, similar growths were observed in both K. baliensis and K. baliensis (r), in which
the cell counts gradually increased to ca. 5 × 10⁹ CFU/mL at 24 h and remained relatively stable
up to 48 h. The fluctuation of pH during the fermentation of K. baliensis (r) was also
comparable to those observed in wild type as described earlier. On the other hand, lower growth
was found when K. baliensis was grown under the low O2 condition, wherein the dissolved
oxygen (pO2) reduced rapidly to 0% within 5 h (data not shown), and the stationary phase was
reached as early as around 8 h, having the cell counts of ca. 5 × 10⁸ CFU/mL. A different
pattern of pH changes with a steadily reduction of pH from 5 to 4 within 48 h was also detected
at low O2 condition, similar to the pH reduction during the sourdough fermentation of
K. baliensis (Figure 8A) in section 3.2.1.
Regardless of the growth and pH change, the amount of EPS produced by K. baliensis (r) was
substantially lower than by the wild type strain, having the final concentration of ca. 10 g/L at
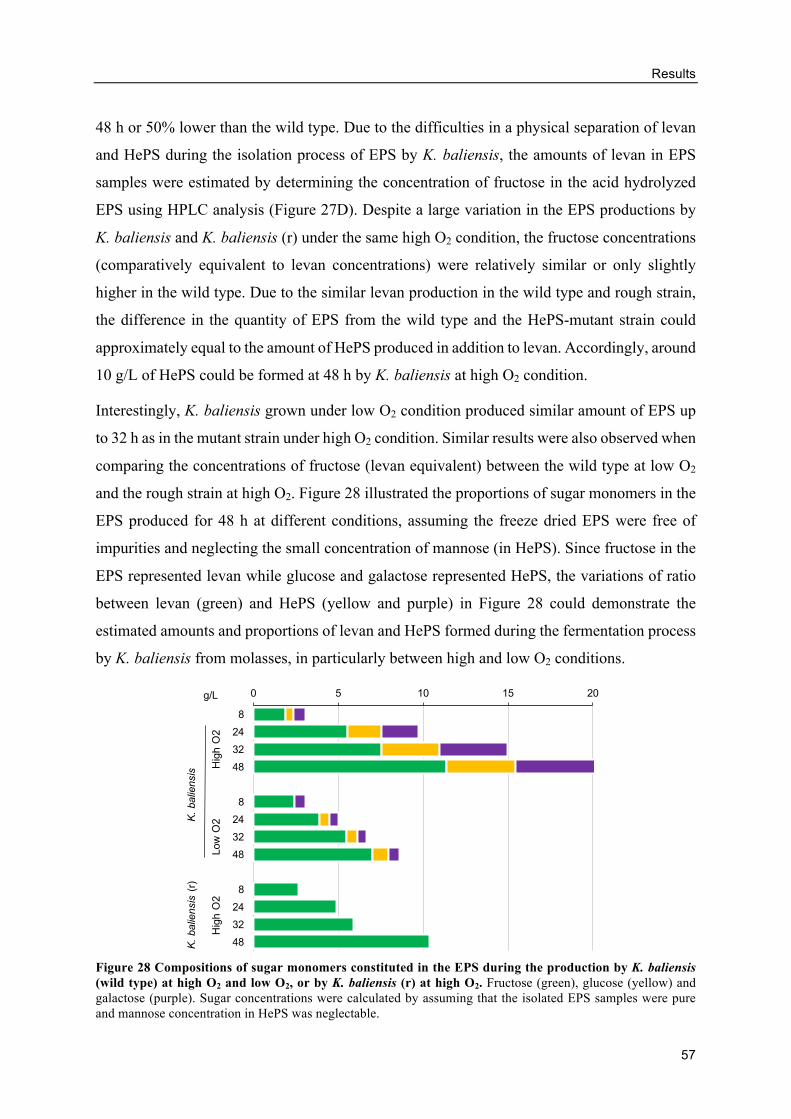
Results
57
48 h or 50% lower than the wild type. Due to the difficulties in a physical separation of levan
and HePS during the isolation process of EPS by K. baliensis, the amounts of levan in EPS
samples were estimated by determining the concentration of fructose in the acid hydrolyzed
EPS using HPLC analysis (Figure 27D). Despite a large variation in the EPS productions by
K. baliensis and K. baliensis (r) under the same high O2 condition, the fructose concentrations
(comparatively equivalent to levan concentrations) were relatively similar or only slightly
higher in the wild type. Due to the similar levan production in the wild type and rough strain,
the difference in the quantity of EPS from the wild type and the HePS-mutant strain could
approximately equal to the amount of HePS produced in addition to levan. Accordingly, around
10 g/L of HePS could be formed at 48 h by K. baliensis at high O2 condition.
Interestingly, K. baliensis grown under low O2 condition produced similar amount of EPS up
to 32 h as in the mutant strain under high O2 condition. Similar results were also observed when
comparing the concentrations of fructose (levan equivalent) between the wild type at low O2
and the rough strain at high O2. Figure 28 illustrated the proportions of sugar monomers in the
EPS produced for 48 h at different conditions, assuming the freeze dried EPS were free of
impurities and neglecting the small concentration of mannose (in HePS). Since fructose in the
EPS represented levan while glucose and galactose represented HePS, the variations of ratio
between levan (green) and HePS (yellow and purple) in Figure 28 could demonstrate the
estimated amounts and proportions of levan and HePS formed during the fermentation process
by K. baliensis from molasses, in particularly between high and low O2 conditions.
Figure 28 Compositions of sugar monomers constituted in the EPS during the production by K. baliensis (wild type) at high O2 and low O2, or by K. baliensis (r) at high O2. Fructose (green), glucose (yellow) and galactose (purple). Sugar concentrations were calculated by assuming that the isolated EPS samples were pure and mannose concentration in HePS was neglectable.
8
24
32
48
8
24
32
48
8
24
32
48
Hig
h O
2Low
O2
Hig
h O
2
0 5 10 15 20g/L
K. b
alie
nsis
K. b
alie
nsis
(r)
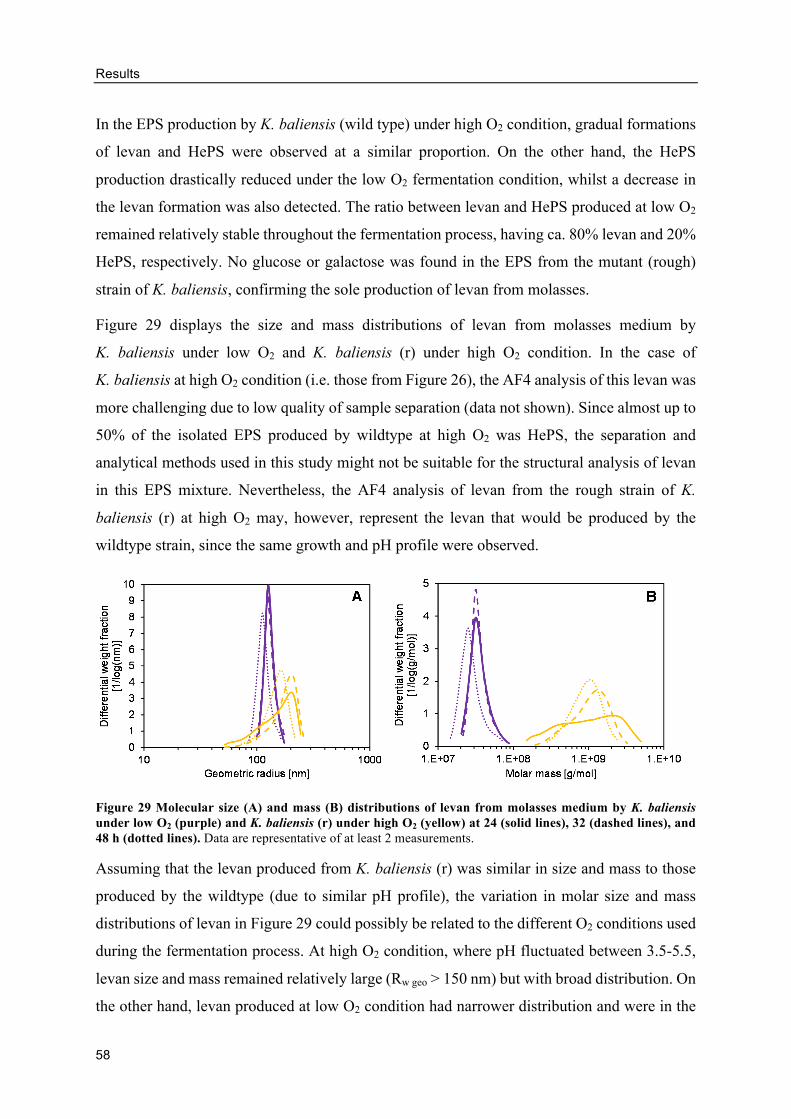
Results
58
In the EPS production by K. baliensis (wild type) under high O2 condition, gradual formations
of levan and HePS were observed at a similar proportion. On the other hand, the HePS
production drastically reduced under the low O2 fermentation condition, whilst a decrease in
the levan formation was also detected. The ratio between levan and HePS produced at low O2
remained relatively stable throughout the fermentation process, having ca. 80% levan and 20%
HePS, respectively. No glucose or galactose was found in the EPS from the mutant (rough)
strain of K. baliensis, confirming the sole production of levan from molasses.
Figure 29 displays the size and mass distributions of levan from molasses medium by
K. baliensis under low O2 and K. baliensis (r) under high O2 condition. In the case of
K. baliensis at high O2 condition (i.e. those from Figure 26), the AF4 analysis of this levan was
more challenging due to low quality of sample separation (data not shown). Since almost up to
50% of the isolated EPS produced by wildtype at high O2 was HePS, the separation and
analytical methods used in this study might not be suitable for the structural analysis of levan
in this EPS mixture. Nevertheless, the AF4 analysis of levan from the rough strain of K.
baliensis (r) at high O2 may, however, represent the levan that would be produced by the
wildtype strain, since the same growth and pH profile were observed.
Figure 29 Molecular size (A) and mass (B) distributions of levan from molasses medium by K. baliensis under low O2 (purple) and K. baliensis (r) under high O2 (yellow) at 24 (solid lines), 32 (dashed lines), and 48 h (dotted lines). Data are representative of at least 2 measurements.
Assuming that the levan produced from K. baliensis (r) was similar in size and mass to those
produced by the wildtype (due to similar pH profile), the variation in molar size and mass
distributions of levan in Figure 29 could possibly be related to the different O2 conditions used
during the fermentation process. At high O2 condition, where pH fluctuated between 3.5-5.5,
levan size and mass remained relatively large (Rw geo > 150 nm) but with broad distribution. On
the other hand, levan produced at low O2 condition had narrower distribution and were in the
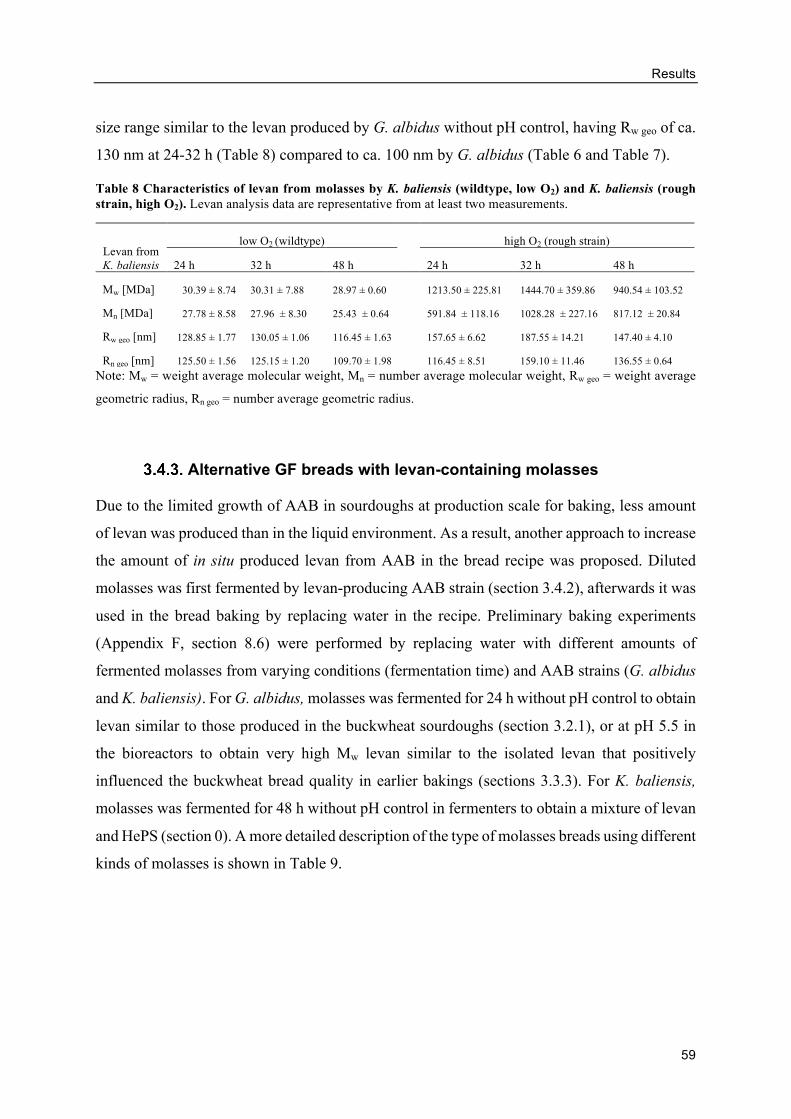
Results
59
size range similar to the levan produced by G. albidus without pH control, having Rw geo of ca.
130 nm at 24-32 h (Table 8) compared to ca. 100 nm by G. albidus (Table 6 and Table 7).
Table 8 Characteristics of levan from molasses by K. baliensis (wildtype, low O2) and K. baliensis (rough strain, high O2). Levan analysis data are representative from at least two measurements.
Note: Mw = weight average molecular weight, Mn = number average molecular weight, Rw geo = weight average
geometric radius, Rn geo = number average geometric radius.
Alternative GF breads with levan-containing molasses
Due to the limited growth of AAB in sourdoughs at production scale for baking, less amount
of levan was produced than in the liquid environment. As a result, another approach to increase
the amount of in situ produced levan from AAB in the bread recipe was proposed. Diluted
molasses was first fermented by levan-producing AAB strain (section 3.4.2), afterwards it was
used in the bread baking by replacing water in the recipe. Preliminary baking experiments
(Appendix F, section 8.6) were performed by replacing water with different amounts of
fermented molasses from varying conditions (fermentation time) and AAB strains (G. albidus
and K. baliensis). For G. albidus, molasses was fermented for 24 h without pH control to obtain
levan similar to those produced in the buckwheat sourdoughs (section 3.2.1), or at pH 5.5 in
the bioreactors to obtain very high Mw levan similar to the isolated levan that positively
influenced the buckwheat bread quality in earlier bakings (sections 3.3.3). For K. baliensis,
molasses was fermented for 48 h without pH control in fermenters to obtain a mixture of levan
and HePS (section 0). A more detailed description of the type of molasses breads using different
kinds of molasses is shown in Table 9.
Levan from K. baliensis
low O2 (wildtype) high O2 (rough strain)
24 h 32 h 48 h 24 h 32 h 48 h
Mw [MDa] 30.39 ± 8.74 30.31 ± 7.88 28.97 ± 0.60 1213.50 ± 225.81 1444.70 ± 359.86 940.54 ± 103.52
Mn [MDa] 27.78 ± 8.58 27.96 ± 8.30 25.43 ± 0.64 591.84 ± 118.16 1028.28 ± 227.16 817.12 ± 20.84
Rw geo [nm] 128.85 ± 1.77 130.05 ± 1.06 116.45 ± 1.63 157.65 ± 6.62 187.55 ± 14.21 147.40 ± 4.10
Rn geo [nm] 125.50 ± 1.56 125.15 ± 1.20 109.70 ± 1.98 116.45 ± 8.51 159.10 ± 11.46 136.55 ± 0.64
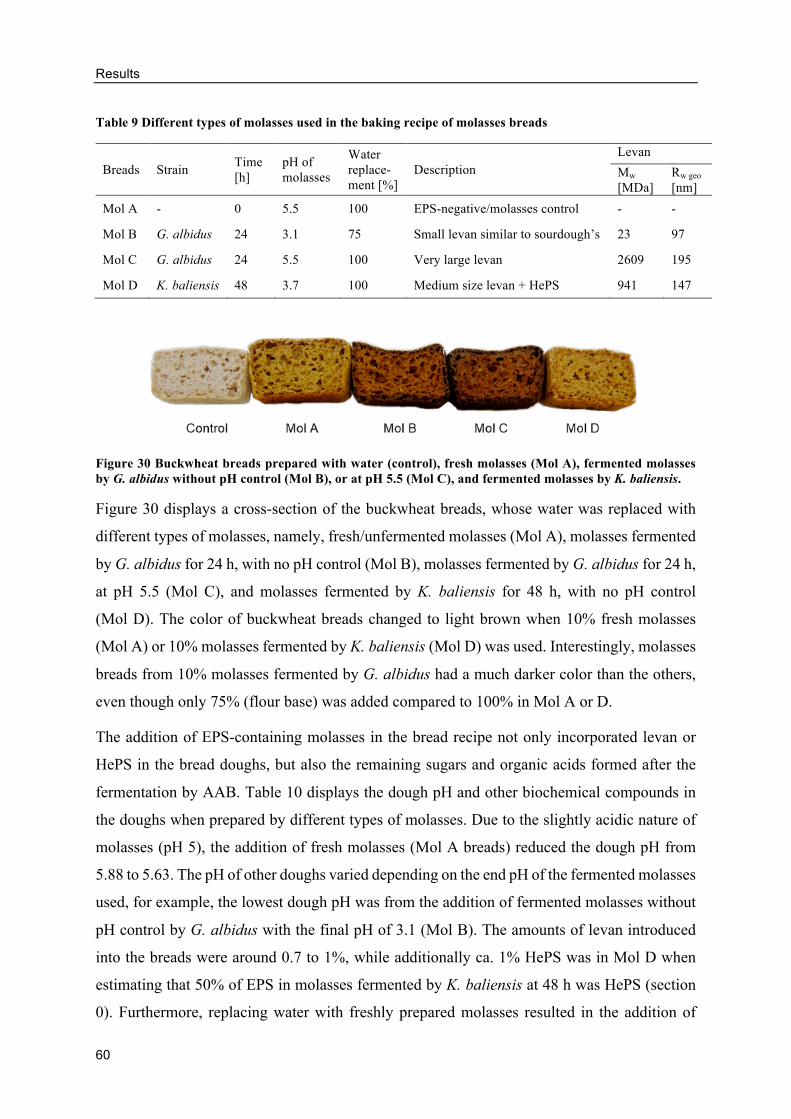
Results
60
Table 9 Different types of molasses used in the baking recipe of molasses breads
Breads Strain Time [h]
pH of molasses
Water replace-ment [%]
Description Levan Mw [MDa]
Rw geo [nm]
Mol A - 0 5.5 100 EPS-negative/molasses control - -
Mol B G. albidus 24 3.1 75 Small levan similar to sourdough’s 23 97
Mol C G. albidus 24 5.5 100 Very large levan 2609 195
Mol D K. baliensis 48 3.7 100 Medium size levan + HePS 941 147
Figure 30 Buckwheat breads prepared with water (control), fresh molasses (Mol A), fermented molasses by G. albidus without pH control (Mol B), or at pH 5.5 (Mol C), and fermented molasses by K. baliensis.
Figure 30 displays a cross-section of the buckwheat breads, whose water was replaced with
different types of molasses, namely, fresh/unfermented molasses (Mol A), molasses fermented
by G. albidus for 24 h, with no pH control (Mol B), molasses fermented by G. albidus for 24 h,
at pH 5.5 (Mol C), and molasses fermented by K. baliensis for 48 h, with no pH control
(Mol D). The color of buckwheat breads changed to light brown when 10% fresh molasses
(Mol A) or 10% molasses fermented by K. baliensis (Mol D) was used. Interestingly, molasses
breads from 10% molasses fermented by G. albidus had a much darker color than the others,
even though only 75% (flour base) was added compared to 100% in Mol A or D.
The addition of EPS-containing molasses in the bread recipe not only incorporated levan or
HePS in the bread doughs, but also the remaining sugars and organic acids formed after the
fermentation by AAB. Table 10 displays the dough pH and other biochemical compounds in
the doughs when prepared by different types of molasses. Due to the slightly acidic nature of
molasses (pH 5), the addition of fresh molasses (Mol A breads) reduced the dough pH from
5.88 to 5.63. The pH of other doughs varied depending on the end pH of the fermented molasses
used, for example, the lowest dough pH was from the addition of fermented molasses without
pH control by G. albidus with the final pH of 3.1 (Mol B). The amounts of levan introduced
into the breads were around 0.7 to 1%, while additionally ca. 1% HePS was in Mol D when
estimating that 50% of EPS in molasses fermented by K. baliensis at 48 h was HePS (section
0). Furthermore, replacing water with freshly prepared molasses resulted in the addition of
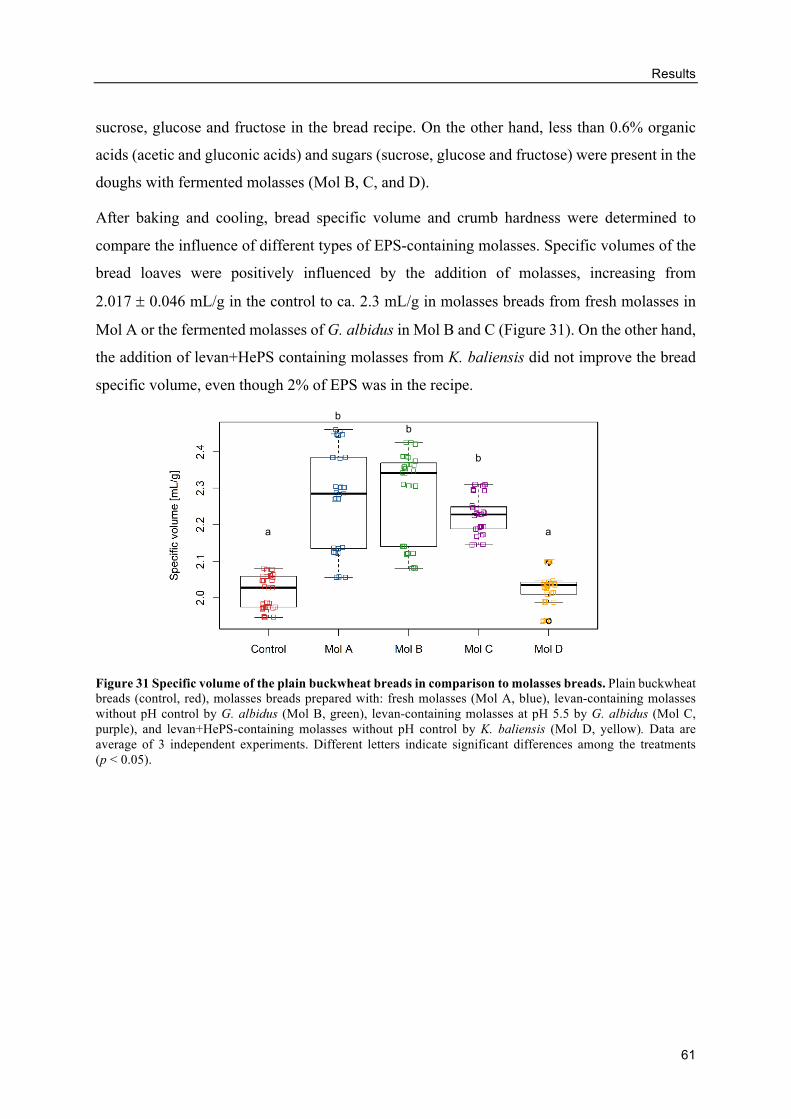
Results
61
sucrose, glucose and fructose in the bread recipe. On the other hand, less than 0.6% organic
acids (acetic and gluconic acids) and sugars (sucrose, glucose and fructose) were present in the
doughs with fermented molasses (Mol B, C, and D).
After baking and cooling, bread specific volume and crumb hardness were determined to
compare the influence of different types of EPS-containing molasses. Specific volumes of the
bread loaves were positively influenced by the addition of molasses, increasing from
2.017 ± 0.046 mL/g in the control to ca. 2.3 mL/g in molasses breads from fresh molasses in
Mol A or the fermented molasses of G. albidus in Mol B and C (Figure 31). On the other hand,
the addition of levan+HePS containing molasses from K. baliensis did not improve the bread
specific volume, even though 2% of EPS was in the recipe.
Figure 31 Specific volume of the plain buckwheat breads in comparison to molasses breads. Plain buckwheat breads (control, red), molasses breads prepared with: fresh molasses (Mol A, blue), levan-containing molasses without pH control by G. albidus (Mol B, green), levan-containing molasses at pH 5.5 by G. albidus (Mol C, purple), and levan+HePS-containing molasses without pH control by K. baliensis (Mol D, yellow). Data are average of 3 independent experiments. Different letters indicate significant differences among the treatments (p < 0.05).
a
b
b
b
a
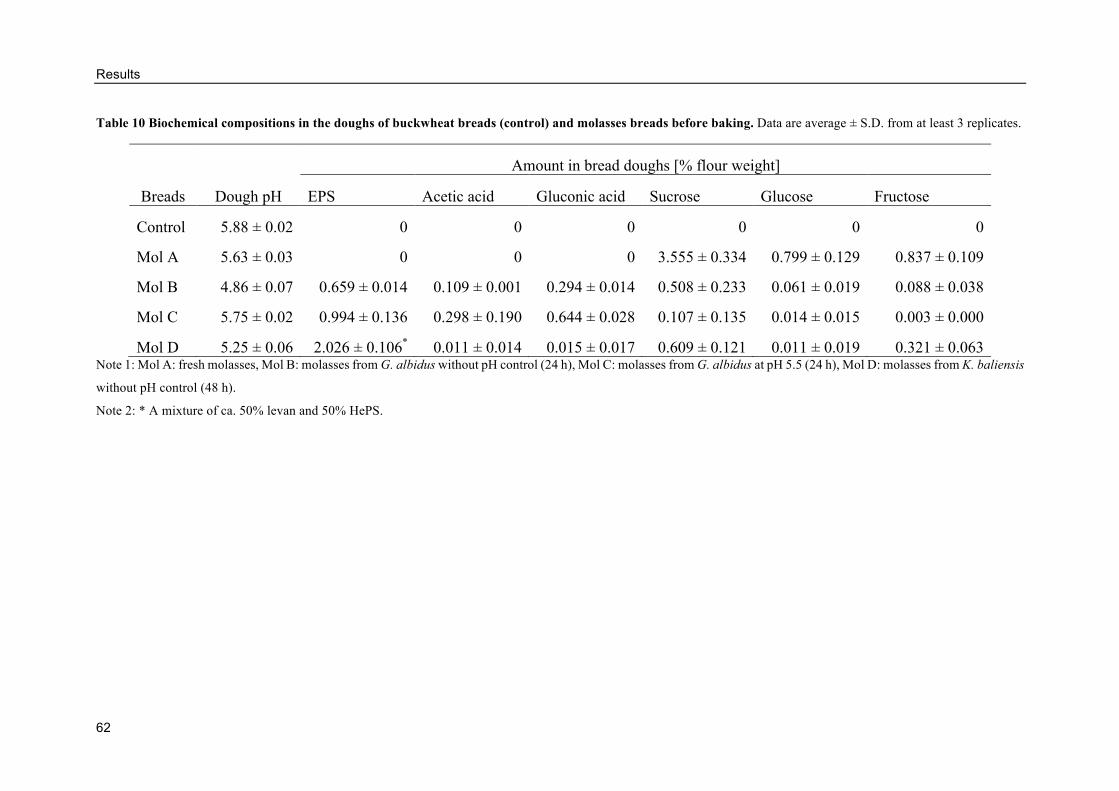
Results
62
Table 10 Biochemical compositions in the doughs of buckwheat breads (control) and molasses breads before baking. Data are average ± S.D. from at least 3 replicates.
Breads Dough pH
Amount in bread doughs [% flour weight]
EPS Acetic acid Gluconic acid Sucrose Glucose Fructose
Control 5.88 ± 0.02 0 0 0 0 0 0
Mol A 5.63 ± 0.03 0 0 0 3.555 ± 0.334 0.799 ± 0.129 0.837 ± 0.109
Mol B 4.86 ± 0.07 0.659 ± 0.014 0.109 ± 0.001 0.294 ± 0.014 0.508 ± 0.233 0.061 ± 0.019 0.088 ± 0.038
Mol C 5.75 ± 0.02 0.994 ± 0.136 0.298 ± 0.190 0.644 ± 0.028 0.107 ± 0.135 0.014 ± 0.015 0.003 ± 0.000
Mol D 5.25 ± 0.06 2.026 ± 0.106* 0.011 ± 0.014 0.015 ± 0.017 0.609 ± 0.121 0.011 ± 0.019 0.321 ± 0.063 Note 1: Mol A: fresh molasses, Mol B: molasses from G. albidus without pH control (24 h), Mol C: molasses from G. albidus at pH 5.5 (24 h), Mol D: molasses from K. baliensis
without pH control (48 h).
Note 2: * A mixture of ca. 50% levan and 50% HePS.
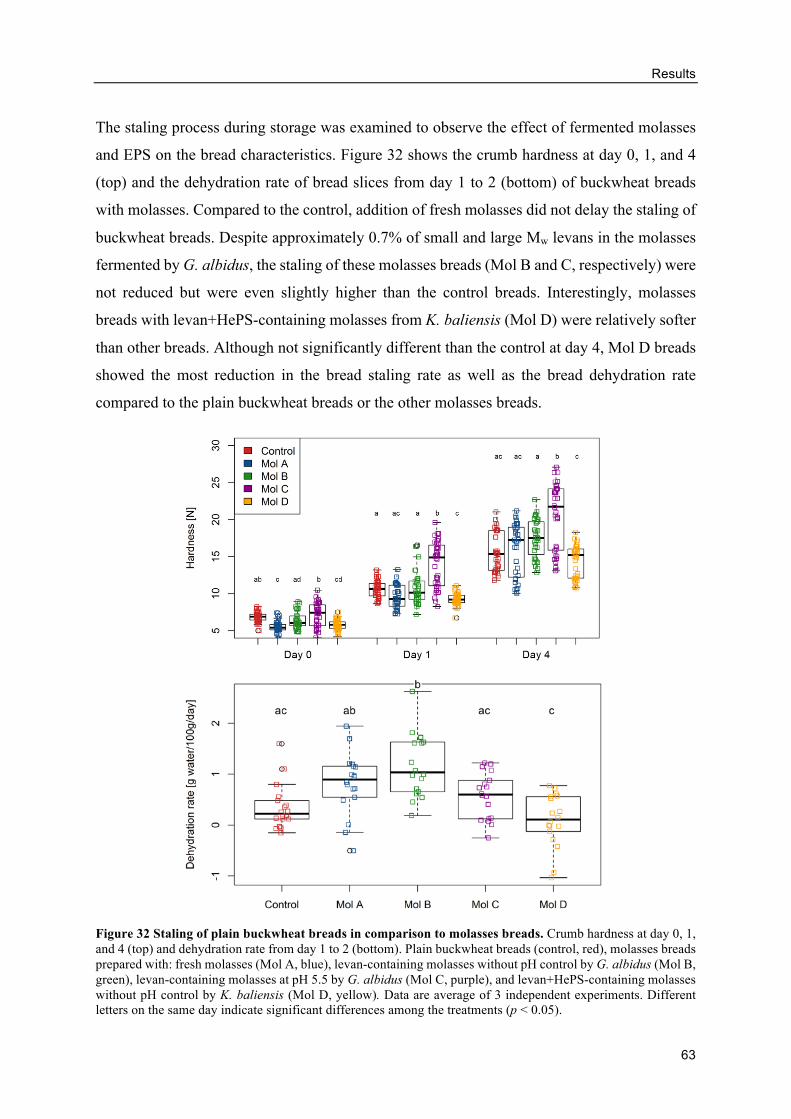
Results
63
The staling process during storage was examined to observe the effect of fermented molasses
and EPS on the bread characteristics. Figure 32 shows the crumb hardness at day 0, 1, and 4
(top) and the dehydration rate of bread slices from day 1 to 2 (bottom) of buckwheat breads
with molasses. Compared to the control, addition of fresh molasses did not delay the staling of
buckwheat breads. Despite approximately 0.7% of small and large Mw levans in the molasses
fermented by G. albidus, the staling of these molasses breads (Mol B and C, respectively) were
not reduced but were even slightly higher than the control breads. Interestingly, molasses
breads with levan+HePS-containing molasses from K. baliensis (Mol D) were relatively softer
than other breads. Although not significantly different than the control at day 4, Mol D breads
showed the most reduction in the bread staling rate as well as the bread dehydration rate
compared to the plain buckwheat breads or the other molasses breads.
Figure 32 Staling of plain buckwheat breads in comparison to molasses breads. Crumb hardness at day 0, 1, and 4 (top) and dehydration rate from day 1 to 2 (bottom). Plain buckwheat breads (control, red), molasses breads prepared with: fresh molasses (Mol A, blue), levan-containing molasses without pH control by G. albidus (Mol B, green), levan-containing molasses at pH 5.5 by G. albidus (Mol C, purple), and levan+HePS-containing molasses without pH control by K. baliensis (Mol D, yellow). Data are average of 3 independent experiments. Different letters on the same day indicate significant differences among the treatments (p < 0.05).
Discussion
64
4. DISCUSSION
In this study, the use of novel sourdough from levan-producing AAB to develop the clean,
additive-free GF breads was shown for the first time. Some strains of AAB were good levan
producers not only in laboratory medium but also in the untreated, diluted molasses as well as
in the GF buckwheat sourdoughs. Aerobic fermentation of sourdough from AAB to facilitate
growth and high levan formation was possible by the use of pure culture inoculation; while the
traditional propagation of sourdough by backslopping was limited due to strain competition
with the indigenous LAB such as pediococci. These levan-containing sourdoughs from AAB,
which contained higher amount of larger size levan, could improve the sensory and quality of
buckwheat breads in a natural way. Moreover, pH was the key parameter for the levan
production in AAB, and it could be used to manipulate the molecular size of levan by
controlling the fermentation condition. This variation in the levan size also contributed to its
functionality in baking application by influencing on the degree of bread improvement. The
similar level of improvement in GF breads, however, was not higher than in the wheat breads
reported earlier (Jakob et al., 2012b), which implied that levan did not act as a structural former
but as an improver. The characteristics of levan particle and the significance of levan size on
breads further suggested that the function of levan in the bread was responsible by the intrinsic
property of the levan particle itself, rather than the association with other flour components to
form the bread structure. Due to the simple and efficient levan production from low cost
substrate such as molasses, these AAB strains showed their potential as the high Mw levan
producers also for many other biotechnological industries.
The following discussion parts explain in more detail on the in situ levan formation in
sourdough, how levan from AAB in sourdough, as well as molasses, contributed to the
development of GF bread, and the suitability of molasses for levan production by AAB.
4.1. Evaluation of in situ levan production by AAB in GF sourdoughs
The results from section 3.1.3 reveal that selected AAB strains were capable of producing high
amount, large molecular size levan in situ in buckwheat sourdoughs from molasses, whereby
the inoculation with pure-culture was necessary to start the sourdough fermentation and
Discussion
65
compete with the indigenous LAB strains. Aerobic fermentation of liquid (high DY)
sourdough, initial molasses concentrations, and appropriate inoculum size were important for
the bacterial growth and subsequent levan forming capabilities. In addition, the structural
analysis of levans from AAB in buckwheat sourdoughs at 24 and 48 h revealed the changes of
particle sizes during fermentation, suggesting the importance of fermentation time on the
amount and size of in situ produced levan in sourdoughs.
Buckwheat sourdough fermentations by different levan-producing
AAB strains
The final cell counts of the three levan-producing AAB strains: G. albidus, K. baliensis, and
N. chiangmaiensis in the buckwheat doughs at 109 indicated their dominance in the dough
system up to 48 h, similar to the cell density of LAB (≥ 108) found in the traditional sourdoughs
(De Vuyst and Neysens, 2005). Similar results were also demonstrated by Hermann et al.
(2015), when K. baliensis DSM 14400 and N. chiangmaiensis NBRC 101099 were cultivated
in wheat, whole wheat, rye and spelt doughs in aerobic fermentations (Hermann et al., 2015).
The detection of LAB in the buckwheat doughs of AAB was foreseeable, due to a low pH in
the fermented dough, which served as a selective growth condition for LAB over other
contaminants. Such a co-existence of LAB and AAB was also observed in naturally fermented
foods such as water kefir (Gulitz et al., 2011) and traditional vinegar (Wu et al., 2012). The
presence of LAB in the buckwheat doughs of AAB need not be seen as a disadvantage for such
fermentations, but may be favorable since it has been widely proven that LAB are responsible
for several beneficial properties of sourdough in the bread baking (Corsetti and Settanni, 2007;
Gobbetti et al., 2014; Moroni et al., 2009) and contribute to stable fermentation conditions. The
majority of LAB isolated from these buckwheat doughs were P. pentosaceus, which was also
detected in the spontaneously fermented buckwheat doughs by Moroni et al. (2011), supporting
that the LAB were natural contaminants originating from the flour. Although LAB were
detected, the fermentation of buckwheat by AAB could inhibit other contaminants, which were
potentially pathogenic bacteria such as some members of the Enterobacteriaceae, which were
only detected in the uninoculated blank doughs. The inhibition of undesired and/or pathogenic
contaminants in the fermenting doughs of AAB complies with the desirable characteristics of
LAB in the conventional sourdoughs (De Vuyst and Neysens, 2005), strengthening the
possibility of utilizing the sourdough from AAB as ingredients in baking applications.
Discussion
66
An exception was found in the sourdoughs fermented by Ga. azotocaptans, where mainly LAB
and other Enterobacteriaceae strains were detected. Since Ga. azotocaptans were able to grow
well in molasses (section 3.1.2) but not in buckwheat-molasses doughs, it was possible that the
additional buckwheat flour was not preferred by Ga. azotocaptans, allowing the growth of
other indigenous microorganisms. This growth preference towards specific types of flour by
different bacterial strains have been shown before in the earlier sourdough fermentations by
LAB (Rühmkorf et al., 2012a) or AAB (Hermann et al., 2015). Additionally, the full oxidation
capability of Ga. azotocaptans to oxidize acetate further to CO2 and H2O (Fuentes-Ramirez et
al., 2001) might result in less pH reductions in the Ga. azotocaptans doughs (pH 5.0) than in
other AAB strains (pH 4.0). This could subsequently allow the growth of other undesired
indigenous microorganisms such as those from Enterobacteriaceae, which were generally
inhibited by the lower pH in other AAB sourdoughs. The presence of these undesired, spoilage
microorganisms might further increase the pH in the doughs as seen at 48 h, challenging the
concerns for food-safety of sourdoughs from Ga. azotocaptans.
The changes in sugars and organic acids concentrations in the doughs revealed a different
behavior among the strains of AAB during the fermentations, which were also influenced by
the presence of LAB. The sugar consumptions and organic acid productions in G. albidus
doughs were most different from the other strains, which was probably due to a better growth
of G. albidus and, accordingly, faster sugar consumptions and acetic acid production in the first
24 h. The fast consumption of glucose by G. albidus within the first 6 h might be due to the
presence of 2 pathways for the glucose metabolism in the Gluconobacter strains, in which
glucose can be directly oxidized by the membrane-bound glucose dehydrogenases, or it can be
taken up and further metabolized in the cytoplasm via the pentose phosphate pathway
(Macauley et al., 2001; Sengun and Karabiyikli, 2011). The presence of lactic acid in the
sourdough conformed to the amounts of LAB detected by MALDI-TOF-MS. The high
numbers of the LAB found in the doughs of K. baliensis, N. chiangmaiensis, and
Ga. azotocaptans also contributed to the lower residual sucrose (9, 37, and 0 mmol/kg flour,
respectively) and higher lactic acid at 48 h than the G. albidus doughs. Despite the faster
productions of acetic acid in the first 24 h of G. albidus, the final acetic acid concentration in
the doughs of K. baliensis and N. chiangmaiensis at 48 h were higher. This might be due to a
higher amount of lactate presented in these doughs, which were later converted into additional
acetate by lactate dehydrogenases (Illeghems et al., 2013; Prust et al., 2005), or by the possible
Discussion
67
production of acetic acid by the co-grown LAB. Even though the majority of the LAB found
in these doughs were homofermentative LAB (P. pentosaceus, P. acidilactici, and
L. plantarum), under an aerobic condition the cells might convert into a mixed acid
fermentation and produced acetic acid in addition to lactic acid (Mayo et al., 2010). Such a case
is true for L. plantarum, whose growth under aerobic and glucose-limiting condition converted
lactate into pyruvate and eventually to acetate and adenosine triphosphate (ATP) production
(Goffin et al., 2004). An increase in the concentration of fructose during the fermentation of K.
baliensis and N. chiangmaiensis was possibly from an additional sucrose metabolism of the
increasing LAB (Gänzle and Follador, 2012), in which the hydrolysis product glucose might
be preferable to fructose (Charalampopoulos et al., 2002).
In all doughs fermented by AAB, a transient increase of gluconic acid were found. This trend
was similar to the results from Hermann et al. (2015), who fermented AAB with other types of
flour. The reduction of gluconic acid could result from a phosphorylation of gluconate into
6-phosphogluconate, which was further catabolized to pyruvate via the Entner-Doudoroff
pathway and eventually to acetate by the pyruvate decarboxylase and acetaldehyde
decarboxylase (Peters et al., 2013; Schweiger et al., 2007). In addition, gluconic acid could be
oxidized by the membrane-bound or NADH+-dependent dehydrogenases to 2-keto-gluconic
acid, 5-keto-gluconic acid or 2,5-diketogluconic acid (Deppenmeier and Ehrenreich, 2009;
Matsushita et al., 1994), which were not detected by the enzymatic assay used in this study.
The reductions of the produced gluconic acid was also demonstrated in a study of glucose
metabolism in G. oxydans 621H, where the gluconic acid concentration reduced gradually at
around 6 h whilst the 2-keto-gluconate increased steadily (Richhardt et al., 2013).
The freeze dried EPS-containing samples isolated directly from the sourdoughs contained both
bacterial EPS and water-soluble polysaccharides (WSP) originating from the flour.
Accordingly, the quantifications of levan in the samples were based on the quantity of fructose
determined by the HPLC analysis. In this study, the fructose monomer was not detected in the
chemically acidified negative controls, so the amounts of fructose in the freeze dried samples
could directly represent the quantity of levan produced by the bacteria. In this work, the
3 selected AAB strains (except Ga. azotocaptans) produced 14-22 g/kg flour of levans in the
buckwheat dough, which was considerably higher than the fructan produced by LAB in
sourdoughs reported in earlier findings. The well-studied L. sanfranciscensis TMW 1.392
(former LTH 2950) produced levans in a range between 2 to 5.2 g/kg flour in wheat sourdoughs
Discussion
68
(Galle et al., 2010; Kaditzky et al., 2008; Tieking et al., 2003), while L. reuteri Y2 formed
around 3.28 g/kg dough (equivalent to 6.56 g/kg flour) of fructan in the sorghum sourdoughs
(Galle et al., 2012b). Since the additions of 10 and 20% of these levan-containing sorghum
sourdoughs from L. reuteri Y2 could soften the bread crumbs in the fresh and stored sorghum
breads (Galle et al., 2012b), the high levan quantities in the buckwheat sourdoughs from AAB
would be a surplus in improving the bread quality. In the case of Ga. azotocaptans, very low
amount of levan was produced in the sourdoughs, which could be due to the limited growth of
the bacteria in the dough system and the co-growth of LAB and other undesired
microorganisms as described earlier. Accordingly, despite its ability to produce relatively high
amount of levan from molasses medium (section 3.1.2), Ga. azotocaptans was not suitable for
the in situ levan production in buckwheat molasses sourdoughs.
In addition to the growth and amount of levan produced during the buckwheat sourdough
fermentations, sourdoughs from each AAB strains were also backslopped for 5 times to observe
the dominancy of bacterial strains over other indigenous microorganisms. Backslopping
method is a traditional propagation of sourdough and some other fermented food products, in
which a sample of the previously successful batch is used to start the next batch (Hansen, 2002).
The method depends on the assertiveness of microorganisms in the specific environment,
which is influenced by the environmental condition and indigenous microbiota. The sourdough
fermented by selected AAB strains, despite their ability to grow and produce levan in the
sourdough after pure-culture inoculation, were not assertive during the 5 backslopping
processes. The results contradicted to those reported by Hermann et al. (2015), where relatively
high cell counts of K. baliensis DSM 14400 were observed even after 8 refreshments in the
spelt doughs. The reduction in the cell counts of AAB strains after the refreshment could be
from the slower growth of AAB in sourdoughs from buckwheat flour than LAB, which was
increasing in their numbers after each backslopping steps. Due to the facultative anaerobic
nature of LAB, it was foreseeable that they had faster growth than the AAB in the dough
environment which had higher viscosity and less oxygen availability than it would be preferred
by the obligate aerobes such as AAB. These results suggested the propagation of sourdough
from AAB by the pure culture inoculum than backslopping, which would ensure a certain high
number of cell counts and subsequently, high amount of in situ produced levan in the
sourdoughs.
Discussion
69
Effects of molasses concentrations, inoculum sizes and DY
The production of levans by G. albidus and K. baliensis with increasing initial concentrations
of molasses appeared to be limited at molasses concentrations higher than 35% (flour base),
which equaled to 14% sucrose or 40 g/L dough. This was probably due to the saturation of
enzyme levansucrases when the sucrose substrate was in excess. Rühmkorf et al. (2012a) also
observed the saturation curves in the EPS production by L. animalis and L. curvatus when the
sucrose concentrations in GF sourdoughs increased to around 11.25%. Because of the
comparable cell growths of both strains in all sucrose concentrations, the saturation of the
enzymes glucosyltransferases in LAB was suggested to be due to the high sucrose amount
(Rühmkorf et al., 2012a). The substrate saturation of levansucrases, however, was not detected
in the work of Hermann et al. (2015), whereby the increasing quantities of EPS by K. baliensis
DSM 14400 and N. chiangmaiensis in various cereal doughs were still observed at the sucrose
concentration up to 100 g/L. This might be due to different kinetics of levansucrases in different
strains, or due to the influences of flour types on the cell growth and the subsequent enzyme
production. Besides the effects of initial molasses concentration on the levan formation, the
remaining amounts of sugars also needed to be considered when applying the sourdoughs in a
real baking application, as it could influence the growth of yeast during the proofing process
or the sensory of the final breads. Considering the saturation of enzyme and the remaining
amounts of sugars, the optimal concentration of molasses in the buckwheat doughs for levan
production by G. albidus and K. baliensis should not be higher than 35%.
The amount of levan at 10% inoculum size tended to be lower than those at the lower initial
cell concentrations. Although the decrease of levan was not statistically significant, which was
possibly because of the high standard deviations from the levan quantification methods, the
original amounts of the freeze dried samples were significantly lower (p = 0.0005) (data not
shown). This finding was in contradiction to the production of EPS by L. curvatus TMW 1.624
in the buckwheat doughs, which produced the increasing amounts of EPS when the initial cell
counts increased from 2.89 × 10⁷ to 1.01 × 10⁸ CFU/g dough (Rühmkorf et al., 2012a). The
authors proposed the need of sucrose metabolism for a biomass production by the bacteria, thus
hindered the formation of EPS in the lower cell count doughs (Rühmkorf et al., 2012a). In the
case of G. albidus, the genus Gluconobacter is known for its high oxidation rate and low
biomass production (Deppenmeier et al., 2002). The small initial cell concentrations might not
stimulate the biomass production rate of the cells, rather, the bacteria possibly focused on the
Discussion
70
oxidation rate to handle the sugar-rich environment by the membrane-bound dehydrogenases,
which function independently from the cell growth (Macauley et al., 2001). In addition, the
high initial cell counts could promote fast cell growths and subsequently rapid pH reductions
in the doughs, which in turn negatively affected the levan formation activity of levansucrases.
Although there is no information on the characteristics of levansucrase from G. albidus and
K. baliensis available so far, the optimal pH of the levansucrases from LAB which tolerate
acidic conditions similar to AAB could be found. The fructosyl transferases from L. panis had
the optimal pH at 4.0-4.6, while 50% of the maximum activity was detected at pH 3 and 5.5
(Waldherr et al., 2008). The levansucrases from L. sanfranciscensis TMW 1.392 had the
optimal pH at 5.4 and more than 50% of the optimal activity was at the pH between 4.0-6.2
(Tieking et al., 2005). Considering the lower enzymatic activities at the low pH conditions, the
fast pH reductions from around 6.5 to 3.5 in the buckwheat doughs would provide a shorter
time frame for the enzyme to operate at its optimal conditions, resulting in the lower amounts
of levan despite the high cell concentrations.
Dough yield is another important factor to be considered for the cereal fermentations by AAB
because it depicts the water activity and viscosity of the doughs (Arendt et al., 2007). To
observe the sole effects of DY on the production of EPS, the concentrations of sugars in all
sourdoughs (per dough weight) were kept constant in this study. Accordingly, the quantity of
levan was shown based on the total weight of dough in kilogram. Levans from DY 250 were
produced significantly lower than at higher DY. Similar results were found in the work of
Kaditzky and Vogel (2008), where the EPS production reduced to 70% by L. reuteri TMW
1.106 in wheat sourdoughs with DY 220 compared to DY 550. The lower EPS amounts in the
firmer doughs (lower DY) might result from the limited mass transfer and/or lower water
activity, which could restrict the cell growth, reduce the substrate diffusion, and subsequently
limit the enzyme activity (Kaditzky and Vogel, 2008). On the contrary, Rühmkorf et al. (2012a)
obtained lower amounts of EPS at higher DY of buckwheat doughs with 7.5% sucrose for L.
curvatus TMW 1.624. An osmotic stress, caused by the low water activity and the high sucrose
concentrations as well as flour ingredients in the firm doughs, were proposed to induce the
higher EPS formations in this strain (Rühmkorf et al., 2012a). In this study, the low water
activity of the firm doughs seemed to affect G. albidus and K. baliensis by the reduced mass
transfer efficiency than by the stress response of the cells. The water activity and oxygen/mass
transfer at DY 350 appeared to be sufficient for the levan production by AAB. On the other
Discussion
71
hand, more free water available at higher DY could not improve the levan formation, which
might be due to the saturation of the substrate as discussed earlier. The fermentations by
obligate aerobic bacteria such as AAB require good oxygen supplementation, therefore, the
liquid doughs with DY 350 or more would be more preferable to the firm sourdoughs (DY
160-200) to ensure the proper cell growth and good mass transfer within the dough systems.
In situ levans from AAB in buckwheat doughs
Jakob et al. (2013) reported the NMR (nuclear magnetic resonance spectroscopy) analysis of
fructans from G. cerinus DSM 9533T, Gluconobacter sp. TMW 2.767 and K. baliensis DSM
14400 to be of levan type. Since the levansucrases from G. albidus TMW 2.1191 have 100%
similarity to those of G. cerinus and Gluconobacter sp. (Jakob et al., 2012a), while identical
sequences of levansucrases from K. baliensis NBRC 16680 (this study) and DSM 14400 were
reported (Brandt et al., 2016), it can be assumed that the in situ fructans in the buckwheat
doughs in this study were also levans. The spherical model was chosen for the evaluation due
to its most fitted model and the previous reports on the compact spherical or spheroidal shape
of levans from different bacteria such as Streptococcus (St.) salivarius (Newbrun et al., 1971),
Bacillus sp. (Arvidson et al., 2006), Z. mobilis (Runyon et al., 2014), and AAB strains (Jakob
et al., 2013).
The size distributions of levan samples over time from G. albidus and K. baliensis were similar
in trend, although levans from K. baliensis were slightly larger than from G. albidus. Higher
Mw levan from K. baliensis was reported before in the strain of DSM 14400, when compared
to levans from other Gluconobacter strains produced under the same condition (Jakob et al.,
2013). In general, the size and mass of EPS reduced when the fermentation time increased from
24 to 48 h, even though the total amount of levans slightly increased when the fermentation
was longer. This indicated that levans were formed continuously during the cell growth, but
were at the same time hydrolyzed into smaller fractions at the longer fermentation period. The
higher quantities but smaller levan sizes at 48 h could result from the hydrolysis activity of
enzymes such as levanases on the levan substrate, which increased its activity when the
availability of the levan was high. In addition, it might be due to the changes from transferase
to hydrolysis activities of the levansucrases itself (Kim et al., 1998), which in turn hydrolyzed
levans into sucrose and shorter chained EPS molecules. Another possibility was the instability
of levan at low pH during the long fermentation time. The low pH instability of levans was
demonstrated in the work of Runyon et al. (2014), who reported the hydrolysis of levan from
Discussion
72
Z. mobilis at 40 °C in the buffer with pH lower than 5.5, resulting in the lower Mw and lower
Rgeo of the levan particles.
Considering the size of levan from different bacterial sources, Runyon et al. (2014) reported
the molar mass of 105 to 5 ×10⁷ g/mol and the hydrodynamic radius (Rh) of 3-151 nm of the
commercial levans from Z. mobilis. This levan had considerably broader particle size
distribution compared to the levans from G. albidus, which might be due to the differences in
the levans production process at a commercial scale. The more similar ranges of levan size
were found in the lab scale studies. The levans from G. frateuri TMW 2.767 had molecular
mass of 4-98 MDa and radius of gyration (RGi) of 27-100 nm, while 6-98 MDa and 33-124 nm,
respectively, were found in the levan from G. cerinus DSM 9533T (Jakob et al., 2013). The
particularly larger levans were described to be from another genus of AAB; N. chiangmaiensis
NBRC 101099 produced levans with molar mass of 100-575 MDa and RGi of 50-277 nm, while
the mass and size of levans from K. baliensis DSM 14400 was 1000-2000 MDa and 189-658
nm, respectively (Jakob et al., 2013). In the case of LAB, levan from L. sanfranciscensis TMW
1.392 was reported to have 44.8-94.9 MDa molar mass and 35-100 nm root mean square radius
(Rrms), while L. animalis TMW 1.971 produced fructan with Mw of 19.7-56.0 MDa and 35-150
nm Rrms (Rühmkorf et al., 2012b).
Here we demonstrated the possibility of employing levan-producing AAB strains in sourdough
fermentations for the GF baking applications. The dominant growth over pathogenic
contaminants, the pH reduction through organic acids production, and the high amounts of
levan produced in situ in the buckwheat doughs were achieved by the fermentations with 3
strains of AAB (G. albidus, K. baliensis, and N. chiangmaiensis). Some parameters can be
adjusted to optimize the EPS production, but the molecular size of levan particles should also
be thoughtfully considered. Additionally, it was shown that the molar mass and radius of levan
particles changes during the fermentation process, mainly depending on substrate
concentration, fermentation time and pH, regardless of the total quantity. These factors need to
be considered in tailoring processes and levan sizes to maximum effectiveness.
Discussion
73
4.2. Influence of levan-producing AAB on buckwheat sourdough breads
The addition of sourdoughs from levan-producing AAB strains obtained upon 24 h of
fermentation improved the sensory and quality (higher volume and lower crumb hardness) of
buckwheat breads. These effects were influenced by both in situ formed levan and other
enzymatic reactions during the sourdough fermentation. The positive effects of levan could be
masked to a certain extent by the impact from the natural acidification at a longer fermentation
period, even though higher amount of levan was obtained. Interestingly, levan might not
actually form the structure in dough as expected in the working hypothesis, since the loaf
volume improvement by levan addition was not drastically different from the negative control
(structure-less) bread. Rather, levan worked as the texture improver and shelf-life extender,
whose function was based on the possible water absorption of levan particles, and the
effectiveness depended on its amount and size. This section demonstrates the promising
sourdough alternative by levan-producing AAB for the development of clean-label GF breads
without the need of additives, in which an appropriate balance between acidification and levan
production (amount and structure) must be reached.
GF sourdough fermentations by AAB
The growths of AAB in buckwheat sourdoughs for bread baking (300 g dough in 2-L flask)
were different than the results reported in section 3.1.3 at smaller volume (15 g dough in
100-mL flask). Both strains had lower viable cell counts but higher LAB counts than in the
smaller flasks, resulting in slower pH reductions and less in situ levan productions. The slower
growth of AAB in a larger Erlenmeyer flask was anticipated, since there was a lower oxygen
transfer rate from a reduction of surface area-to-volume ratio of the flask geometry when
up-scaling (Duetz and Witholt, 2004; Garcia-Ochoa and Gomez, 2009). The oxygen transfer
rate in the culture medium is an important factor for the growth of obligate aerobes like AAB,
in which oxygen is used to generate ATP via the oxidations of carbon sources such as sugars
into organic acids (Deppenmeier et al., 2002; Macauley et al., 2001). The lower growth of AAB
was consequently followed by a better growth of the acid-tolerant LAB strains, which co-
existed in the buckwheat flour ingredient (Moroni et al., 2011). The lower oxygen availability
in the larger flasks could also be observed by the presence of gluconic acid even after 48 h
fermentation, whereas it would normally either be phosphorylated into the cellular metabolism
Discussion
74
or further oxidized to ketogluconates as reported earlier in section 4.1.1 and in other works
(Deppenmeier et al., 2002; Hermann et al., 2015; Richhardt et al., 2013; Ua-Arak et al., 2016).
Accordingly, compared to the small volume sourdough fermentation, the production of levans
during sourdough fermentations were also reduced, with around 20 and 50% reduction in the
G. albidus and K. baliensis doughs, respectively. Nevertheless, the maximum amount of levan
produced by AAB strains in buckwheat sourdoughs were still higher than those produced by
LAB in other studies, being ca. 15 g/kg flour in G. albidus doughs at 48 h and 11 g/kg flour
K. baliensis doughs at 54 h, compared to around 2-6.56 g/kg flour in LAB sourdoughs (Galle
et al., 2010; Galle et al., 2012b; Kaditzky et al., 2008; Tieking et al., 2003). At a longer
fermentation time, the levan concentration reduced. This was also observed before regarding
the fructan formation by K. baliensis DSM 14400 and N. chiangmaiensis in Hermann et al.
(2015). The decreasing levan concentration was probably due to the slower production rate
when the cells were in the late stationary phase, together with the simultaneous enzymatic
hydrolyses of levan by extracellular levanases (Menéndez et al., 2002) or the levansucrases
itself (Kim et al., 1998; Méndez-Lorenzo et al., 2015). Additionally, the released fructose
monomers from levan hydrolysis might be used in the catabolic metabolism of the cells when
the other available sugar sources were depleted.
The analysis of sourdoughs from AAB used in the bread baking revealed some similarities to
the conventional sourdoughs from LAB reported in other studies. The pH and lactic acid
concentrations were comparable to those from the traditional LAB strains, while the AAB
sourdoughs contained additional gluconic acid as well as higher concentration of acetic acid,
especially in 30 and 48 h doughs. For example, the wheat sourdough of the levan-producing
L. sanfranciscensis TMW 1.392 had a pH of 3.5 and contained 142.05 mmol/kg flour of lactate
and 55.34 mmol/kg flour of acetate after 22 h of fermentation (Kaditzky et al., 2008), while the
sorghum sourdough of the levan-producing L. reuteri LTH5448 had a pH of 3.8 and contained
214 mM/g lactate and 121 mM/g acetate, respectively (Schwab et al., 2008). The formation of
organic acids during the sourdough fermentation is important for the dough properties and the
characteristics of the resulting bread. In the traditional sourdough, acetic acid and lactic acid
formed by LAB significantly influenced the rheology of dough, and the structure and shelf-life
of the final bread (Arendt et al., 2007; Corsetti and Settanni, 2007; Kaditzky et al., 2008). An
increase of acetic acid during the sourdough fermentation resulted in an improved aroma in
wheat bread (Czerny and Schieberle, 2002). However, high concentration of acetic acid
Discussion
75
negatively affected the bread volume (Barber et al., 1992), which was due to an inhibition of
the metabolism of S. cerevisiae employed to the dough for leavening process. Accordingly, the
different organic acid compositions in sourdoughs should also be critically considered in
addition to the amount of in situ produced levan during GF bread development.
Influences of sourdough fermentations from AAB on buckwheat
sourdough breads
Sourdoughs influence significantly the sensory, physical properties, nutritional values and the
shelf-life of sourdough breads (Arendt et al., 2007), which result from a combination of
metabolic and enzymatic processes during the fermentation such as acidification, proteolysis,
production of volatiles and anti-fungal compounds, etc. (Arendt et al., 2007; Corsetti and
Settanni, 2007). Such influences were also observed by the unconventional sourdoughs from
AAB strains in this study, in particular by the addition of buckwheat sourdoughs at 24 and/or
30 h. The development of brown color was most likely from the molasses, which was added in
the sourdough as a sucrose source for levan production, although the final breads were not
reported to be sweet. According to the characteristics of buckwheat sourdoughs from G. albidus
in Table 4, around 2% (flour base) of sugars (sucrose, glucose, and fructose) were introduced
into the breads prepared with sourdoughs fermented for 24 h, while only 0.6% (flour base) of
sugars were found in the sourdough breads of 48 h (data not shown). Since part of these sugars
would also be metabolized by yeasts during the proofing process, the remaining sugars in the
finished breads would be lower than 2% in sourdough breads of 24 h or none in sourdough
breads of 48 h.
The improved aroma and taste in buckwheat breads could be from the combination of organic
acids, Maillard reaction, possible volatile compounds production by AAB and LAB (Czerny
and Schieberle, 2002) as well as the molasses itself. These combinations masked the bitter taste
normally encountered in the buckwheat breads (Campo et al., 2016; Rózylo et al., 2015;
Torbica et al., 2010), which resulted from the enzymatic degradation of rutin, a polyphenol that
existed in a high concentration in buckwheat seeds and flour (Costantini et al., 2014; Suzuki et
al., 2015). This bitterness in buckwheat breads were also masked by sour taste in the breads
from 48 h sourdoughs, which had also very dense texture and sour smell compared to the others.
The sour taste in breads most likely resulted from the high concentrations of acetic and lactic
acids in the sourdoughs at longer fermentation time (48 h). Although these sourdough breads
were not preferred by most of the tested panels, few panels had preference towards these breads
Discussion
76
due to their very fine texture and sour taste, which resembled to the dark rye breads.
Interestingly, these breads might find a place in a niche market, where GF breads with sour and
dense structure are preferred (Campo et al., 2016).
Sourdough fermentation by AAB at 24 h apparently presented the condition favorable to the
yeast activity during the proofing process, as seen by the higher loaf volume of sourdough
breads and C.A. breads at 24 h than other breads. The appropriate pH and amounts of organic
acids in the sourdoughs could increase the baker’s yeast activity (higher CO2 release in shorter
times), which subsequently resulted in a better dough development (Moroni et al., 2012). For
example, up to 1.0% of acetic acid was found to stimulate S. cerevisiae under appropriate
conditions (Garay-Arroyo et al., 2004; Pampulha and Loureiro-Dias, 2000; Taherzadeh et al.,
1997). In addition, the yeast metabolism and CO2 production might be increased due to the
presence of residual sugars (Galle et al., 2012b), which were introduced by the addition of
sourdoughs containing molasses (and remaining sugars) especially from 24 and 30 h. On the
other hand, the high concentrations of acetic and lactic acids as well as very low pH in the
sourdoughs at 48 h were responsible for the sourness and dense texture (small volume, hard
crumbs) of breads, since too high acid concentrations negatively affected the yeast growth and
activity (Hammes and Gänzle, 1997). The partial inhibition of yeast cells were also observed
by Rózylo et al. (2015) and Moroni et al. (2012), in which higher addition of buckwheat
sourdoughs (40 and ca. 33.28% flour base, respectively) or C.A. doughs negatively influenced
the loaf volume and bread crumb; while smaller sourdough additions in the recipe improved
bread quality than the controls.
Interestingly, different types of acids seemed to affect the yeast activity differently. Barber et
al. (1992) reported a stronger reduction in loaf volume with acetic acid addition (dough pH 4.3)
than with lactic acid (dough pH 4.1), indicating that the type of acids had more effects on the
activity of baker’s yeast than the pH value. This was also supported by the work of Gänzle et
al. (1998), who found a much higher inhibitory effect of acetic acid than lactic acid on the
growth of Candida milleri LTH H198, which was commonly found in wheat sourdough
(Spicher, 1987). A synergistic effect of acetic acid and lactic acid on the yeast activity was also
possible, as demonstrated by Graves et al. (2007) on the inhibition of S. cerevisiae especially
at higher temperature. Since AAB are well-recognized for their ability to oxidize sugars and
alcohols into different types of acids especially acetic acid (Raspor and Goranovic, 2008),
while the spontaneously co-growing LAB also produced additional amounts of acetic acid
Discussion
77
(W. cibaria) and lactic acid (W. cibaria and P. pentosaceus), the sourdough fermentations by
AAB seemed to have a more critical influence on the yeast activity during the leavening process
than the traditional sourdoughs from LAB at the same fermentation time.
Generally, the ratio between lactic and acetic acids or the so-called fermentation quotient (FQ)
of a traditional sourdough was recommended for a particular type of flour, e.g. FQ close to 4
was reported to be optimal for wheat (Barber et al., 1991) or FQ around 2-2.7 or lower for rye
(Hammes and Gänzle, 1997). These data, however, are not transferable to the unconventional
sourdoughs fermented by AAB since different metabolic products were formed, in which
considerably higher amounts of acetic acid and gluconic acid were present, while lower
concentration of lactic acid was produced from the spontaneously co-growing LAB.
Nonetheless, it can be roughly estimated from the results of this study, that the recommended
levels of lactic acid and acetic acid for the improved sensory and physical properties of
buckwheat breads used in this work should be in the range of 90-175 mmol/kg flour for lactic
acid and 70-230 mmol/kg flour for acetic acid, respectively.
Effects of levan on the buckwheat bread quality
So far, the additions of isolated levans have been shown to improve the volume and/or crumb
hardness in the wheat (Jakob et al., 2012b) and rice-buckwheat breads (Rühmkorf et al.,
2012b). Nevertheless, it was also demonstrated that the degree of improvement depends not
only on the amount of the EPS but also on the size and/or structure of the EPS itself. For
example, the larger molar sizes of levans from K. baliensis DSM 14400 and N. chiangmaiensis
NBRC 101099 reduced the staling rates of the wheat breads better than the smaller size EPS
from G. frateurii and G. cerinus (Jakob et al., 2012b), or the EPS (dextran) from L. curvatus
TMW 1.624 with small particle size distribution, more compact configuration and higher Mw
(118-242 MDa) had higher impacts on the bread quality than the glucans or levans from other
LAB (< 100 MDa) (Rühmkorf et al., 2012b). Since it was shown in section 3.1.6 that the molar
mass and size of levan were changing during the fermentation time, it is important to consider
not only the quantity of EPS produced in situ in the sourdoughs, but also the size of levans
which was influenced by the fermentation time and growth conditions in the uncontrolled batch
process.
In order to understand the impacts of levans on the bread quality, the isolated levans from the
laboratory medium were used to exclude the influence of other factors in the sourdoughs (Jakob
Discussion
78
et al., 2012b; Rühmkorf et al., 2012b). But the variations in the cell growth and fermentation
conditions between the chemical medium and sourdough systems exist. This may lead to the
formation of different size and mass of EPS, even though the growth conditions such as
temperature and shaking rate were the same (Abdel-Aziz et al., 2012). In order to conduct the
more extensive research on the effects of the levans on the quality and structure of the breads,
the isolated levans used for baking in this study were prepared from defined medium (NaGS)
and were verified to have the size and mass of the EPS resemble to those produced in situ in
the sourdoughs (section 3.2.5).
Since there were no clear observable differences regarding the characteristics between the
sourdoughs and C.A. breads, the influence of in situ levan produced by AAB in the sourdoughs
could not be pointed out. To examine the sole influence of levan on the buckwheat bread quality
without the influence from acidification, isolated levan produced by G. albidus was added into
the GF bread recipe. Isolated levan at 1% (flour base) addition seemed to be the best
concentration to both increase the specific volume and reduce the crumb hardness of the plain
buckwheat breads. The increasing addition of levan resulted in a concomitant trend of bread
improvement especially with respect to the crumb hardness, although not significantly at 0.1
and 0.5%. Similar effects have been reported earlier in the wheat breads at 1 and 2% addition
of levan from several AAB strains (Jakob et al., 2012b), or in the GF breads of buckwheat and
rice flours at 1% levan from L. sanfranciscensis TMW 1.392 (Rühmkorf et al., 2012b); but this
is the first report on the positive effects of levan on the plain GF buckwheat bread, which
contained no other structural-building or supporting ingredients in the recipe.
The mechanism of levan for GF bread improvement is still unclear (Galle et al., 2012b;
Rühmkorf et al., 2012b), but the varying size and structure of EPS could influence the levan
function in the bread matrix differently. The molecular size and weight of levan particles were
reported to be a key factor in the function of levan in bread, in which higher Mw EPS had
stronger influences on the bread quality and staling rate (Jakob et al., 2012b; Rühmkorf et al.,
2012b). Levan particles at a certain Mw developed a compact, spherical molecule, while lower
Mw levan particles tended to be random-coil like (Arvidson et al., 2006; Benigar et al., 2014;
Jakob et al., 2013; Newbrun et al., 1971). The micro-gel behavior of fructan particles, which
bind to water molecules individually via intramolecular interactions (Kitamura et al., 1994),
suggested the possible contribution of levan on the bread quality improvement upon increasing
amount of addition. The reduction in crumb hardness probably resulted from the trapped water
Discussion
79
in each levan molecules between the flour particles as well as from the correlation to larger
bread volume (Sciarini et al., 2010). Although there was no significant increase in the specific
volume of breads with 2% levan due to high standard deviations, the softer bread crumbs were
still observed. The variations in the bread volume at 2% addition could result from the deficient
amount of water added in the recipe, which might be needed to obtain proper dough
characteristics at higher hydrocolloid addition (Lazaridou et al., 2007; Sabanis and Tzia, 2011).
Overall, it was clear that levan had a positive effect on the bread quality even in the simple GF
breads such as these buckwheat breads, in which a certain concentration (1% flour base) was
necessary to obtain a significant development.
The isolated levan used during the investigated baking trials (section 3.2.4) was similar to the
size of in situ produced levan at 48 h, wherein only approximately 0.33% (flour base) in situ
levan was in the bread recipe (data not shown). Although this concentration might not be high
enough to significantly influence the buckwheat bread quality as shown in this study (0.33%
vs. 1%), it might be enough to improve the structural properties of wheat breads as
demonstrated by Kaditzky et al. (2008), where 0.3% addition of isolated levan positively
increased the water absorption of doughs and improved the loaf volume of wheat breads.
Nevertheless, there was also a strong impact from the acidification of sourdoughs, especially
when fermented by AAB strains, which could subsequently mask any possible influences of
the in situ produced levan on the bread characteristics. Further optimization on the levan
production in sourdoughs by AAB would be necessary to obtain a higher concentration of
in situ produced levan with a significant effect on buckwheat bread quality. Since the structure
of EPS was found to be related to its function on the bread quality (Rühmkorf et al., 2012b), it
is also important to ensure that the levan produced in the sourdough exhibits an effective size
and mass. The decrease in Mw of levan particles at longer fermentation time confirmed the
earlier results in the small scale fermentation, and indicated a partial degradation of in situ
produced levan during the fermentation, suggesting that shorter fermentation time would be
preferred to the longer one. This partial degradation of EPS could be either explained by the
instability of levan at lower pH (Runyon et al., 2014) or by the exo-hydrolytic activities of
levansucrases or levanases secreted by AAB (Kim et al., 1998; Menéndez et al., 2002) as
discussed earlier. On the other hand, a concomitant increasing concentration of levan was
observed at fermentation time of around 48-54 h (Figure 8), which could origin from the
remaining specific transferase activities of levansucrases from AAB. As a result, it is crucial
Discussion
80
for the optimization process to achieve the best possible compromise between the effective
quantity and structure of in situ produced levan.
In situ levan in sourdoughs retarded the staling of buckwheat
breads
In addition to the improved quality and sensory of buckwheat breads, sourdoughs at 24 h from
AAB were also found to delay the staling of buckwheat breads similar to breads with HPMC
(positive control), having a significantly lower crumb hardness than the control breads and the
C.A. breads after 1-day storage. The ability of sourdough from AAB to retard the bread staling
conformed to the positive effect of traditional sourdoughs from LAB, which have been shown
before in many studies on both gluten-containing (Galle et al., 2012a; Kaditzky et al., 2008)
and GF breads (Galle et al., 2012b; Moore et al., 2007; Schober et al., 2007; Wolter et al.,
2014a, 2014b). The negative effect of acidification, as shown by the firmest crumb in C.A.
breads compared to the other breads in day 1 and 4, was masked or reduced in the sourdough
breads from AAB. This increased crumb firmness during storage of the C.A. breads have been
shown before in the earlier works (Galle et al., 2012b; Moore et al., 2007; Schober et al., 2007);
and the inactivation of α-amylases by high acids/low pH in C.A. breads, which would normally
hydrolyze starch and reduce the starch retrogradation, was suggested to be responsible for the
hardening of bread crumb (Morgan et al., 1997; Schober et al., 2007).
Corsetti et al. (1998a) suggested the proteolytic and amylolytic abilities of some LAB strains
to be responsible for the starch hydrolysis and subsequent staling retardation of sourdough
breads. Nevertheless, the effects were strain-dependent and the study did not consider the
possible influence of EPS produced in situ by the tested strains such as L. plantarum and
L. sanfranciscensis, which are commonly found to be EPS producers (Corsetti et al., 1998a;
Tieking and Gänzle, 2005). To observe the separated effects of bacterial metabolic activities
(proteolysis, starch hydrolysis, etc.) and the in situ produced EPS from sourdough fermentation
on the bread staling, sourdough breads from the non-EPS producing strains or from the
EPS-producing strains but without sucrose addition (hence, no EPS production) were prepared
as EPS-negative controls in some studies (Galle et al., 2010; Kaditzky et al., 2008). The authors
reported the slower staling rate observed only in the EPS positive breads, as a result, the
presence of EPS by in situ production was concluded to be responsible for the delay of bread
staling in sourdough breads (Galle et al., 2010; Kaditzky et al., 2008).
Discussion
81
In the case of AAB, where sourdough fermentation without sucrose addition was not possible
due to contamination and lack of assertiveness of AAB (data not shown), the effect of levan on
bread staling was only observed by addition of isolated levan to buckwheat breads in
comparison to the control. The retardation of bread staling by sourdough breads from AAB
was then confirmed to be responsible by, but not limited to, the levan produced from AAB.
The crumb firmness was delayed after 1-day storage by 0.1% addition, which was the similar
amount to the in situ produced levan in sourdoughs at 24 h (section 3.2.1). The prolongation of
bread softness was more pronounced at higher levan concentration, in which the breads with
1% levan remained significantly softer than the control even after 4 days. This positive
influence of levan on the reduction of bread staling confirmed the earlier findings in the wheat
breads (Jakob et al., 2012b) and buckwheat-rice breads (Rühmkorf et al., 2012b).
Although the real mechanism of levan on the retardation of bread staling is not yet understood,
the anti-staling effect of levan in breads was confirmed; and it was comparable to other
hydrocolloids commonly used in the baking industries such as HPMC (Jakob et al., 2012b;
Rühmkorf et al., 2012b). Rühmkorf et al. (2012b) reported that the slower staling of breads
with different types of hydrocolloids including levan was from the hydration capacity of the
additives, which increased the water retention capacity (WRC) of doughs and subsequently
enhanced moisture content of stored breads (Gray and Bemiller, 2003; Rühmkorf et al., 2012b).
The moisture contents of sourdough breads and breads with isolated levan in this study were,
however, not higher than the control (data shown in Appendix D, section 8.4), even though
addition of isolated levan also exhibited a slight increase of WRC of buckwheat flour (data
shown in Appendix C, section 8.3). This might be due to the adverse effect from the addition
of molasses in the case of sourdough breads, as seen by the lowest moisture content in molasses
breads (Appendix D, section 8.4); or different dough recipe, in which a specific amount of
water was replaced by the amount of added EPS, causing a possible lower initial moisture
content of bread at higher levan addtition. Nevertheless, by determining the dehydration rate
of bread crumbs, a difference between buckwheat breads with or without levan could be
observed. The lower dehydration rate of bread crumbs has also been shown before by the
addition of locust bean gum, whose function on the staling of white bread was different from
the other hydrocolloids such as xanthan and alginate (Davidou et al., 1996).
It should also be reminded that, due to the co-presence of W. cibaria in addition to
P. pentosaceus in the sourdoughs fermented by K. baliensis when a different lot of buckwheat
Discussion
82
flour was used (section 3.2.1), the staling of sourdough breads from K. baliensis was also
influenced by another type of EPS (glucan) produced by W. cibaria. Although the detection of
W. cibaria and its glucan production were unexpected, it did not negatively affect the bread
quality or challenge the food safety concern, since the strain has been widely used in various
studies for the in situ production of dextran in sourdoughs for wheat (Galle et al., 2012a; Katina
et al., 2009) and GF breads (Galle et al., 2012b; Wolter et al., 2014c). In this study, the
additional glucan in the sourdough of K. baliensis additionally reduced the bread staling, as
observed by the lower crumb hardness at day 1 of sourdough breads from K. baliensis than
from G. albidus. The average rate of dehydration of bread crumb was also generally lower than
those from G. albidus, even though the data dispersion was quite high. The co-growth of
indigenous LAB including the EPS-producing strains during the sourdough fermentation by
AAB was unavoidable, and the type of LAB strains seemed to be dependent on the source of
buckwheat flour (e.g. product batch). Accordingly, a routine strain identification might be
required during the sourdough fermentation by AAB to monitor the possible changes of the
indigenous LAB diversity and the possible additional EPS production, when a specific type of
EPS in the sourdough from AAB is of concern.
This section confirmed the positive effect of levan-containing sourdoughs from AAB on the
improvement of buckwheat bread sensory and quality (specific volume and crumb hardness)
as well as on the delay of bread staling to a certain degree. Levan was shown to be responsible
for the enhanced bread characteristics, in which the effects as the texture improver and shelf-
life extender were dependent on the levan concentration in the bread recipe. In the case of
sourdoughs, acidification during AAB fermentation also played an important role in
influencing the bread properties especially on loaf volume and crumb hardness. In conclusion,
several factors such as strains, fermentation time, type, and concentration of organic acids, pH
as well as amount and structure of levan were involved during the unconventional GF
sourdough fermentation by selected AAB strains, affecting the sourdough properties, the
proofing process, and subsequently the sourdough breads characteristics. To successfully
obtain a significantly improved bread quality, it is very important to have the right balance
between the time of fermentation (consequently, the pH and organic acid concentrations) and
the effective amount and molecular size and mass of levan. The ability to produce large quantity
and high Mw levan by AAB is still very attractive and can be beneficial to the GF bread
Discussion
83
development, nevertheless, the high oxygen requirement for growth during sourdough
fermentation as well as the strong acidification can be a challenge for a large scale production.
4.3. Levan structure
The importance of pH on the change of levan size and mass during the fermentation process
was confirmed in this section. In the uncontrolled fermentations, the levan size/molar mass
continuously decreased due to the continuous acidification of the nutrient medium. By
controlling the pH during fermentation, the levan size could be directly manipulated. Using
equal initial substrate amount, the largest Mw and Rw geo of levan were observed at constant pH
6.5, while the highest levan concentration was obtained at constant pH 4.5. More importantly,
the changes in molecular size of these levans affected their functionality on buckwheat bread
characteristics when used in baking. Levan of the same bacterial strain but with the highest
mass and radius improved buckwheat bread quality the most. This effect further supported the
suggestion that the intrinsic property of individual levan particles (e.g. on trapping/releasing
water, or on the viscoelasticity of dough) was responsible for the improved bread texture. These
results demonstrate that one bacterial strain can produce specific high Mw fractions of one EPS
type, which differ in properties and sizes among each other in dependence of the controllable
production conditions.
Changes of levan size and mass during production
The monitoring of levan size and mass during the levan production in shake flasks
(uncontrolled pH) by G. albidus confirmed earlier findings on the reduction of Mw and Rgeo of
in situ produced levan in section 3.1.6 and 3.2.5. The levan size decreased even though the
levan concentration increased, suggesting that more levan of smaller size was produced whilst
the already-synthesized levans were also hydrolyzed, resulting in the decline of average molar
mass and radius along the fermentation process. During the fermentation by G. albidus TMW
2.1191, which expresses the levansucrase constitutively (Jakob, 2014), there were constant
variations in the liquid culture such as substrate (sucrose), organic acids (acetic and gluconic
acids) and pH. Since pH is one important factor affecting the structure and activity of enzymes,
such a constant change of pH during AAB fermentation could indisputably influence the
function of levansucrase. This change of levan size produced at different pH was later
confirmed when the levan production was performed in a controlled pH condition (section
Discussion
84
3.3.2), demonstrating that the reduction of pH during the levan production by AAB was the
key factor regulating the size of levan being produced during the bacterial fermentation.
In addition to the formation of smaller levan at lower pH by levansucrase, the shift of levan
size distribution towards the smaller range at longer fermentation time (Figure 19B) revealed
that the existing larger levans produced at earlier time points were also hydrolyzed. The
hydrolysis of the already-synthesized levan could result from a combination of factors such as
enzymatic activities (Tanaka et al., 1978; Vigants et al., 2013) and acid hydrolysis or pH
instability (Runyon et al., 2014; Sarilmiser et al., 2015). As reported for levansucrases from
other bacterial species such as Z. mobilis (Yanase et al., 1992) and B. subtilis (Tanaka et al.,
1978), levansucrases exhibit not only the fructosyltransferase activity, which transfers a
fructose molecule from sucrose to the growing chain of levan (levan synthesis), but also an
intrinsic levanase activity that releases a fructosyl moiety of a levan chain if water is used as
acceptor (levan hydrolysis). The relation between transferase and hydrolysis activities of
levansucrases can be influenced by parameters such as sucrose concentration, temperature, pH
(Santos-Moriano et al., 2015; Vigants et al., 2013; Yanase et al., 1992), and possibly the
branching point on the levan substrate (Méndez-Lorenzo et al., 2015); all of which could
eventually contribute to the final molecular size distribution of levan in the liquid culture. An
example of levan degradation by hydrolysis activity of levansucrase has been shown in the
work of Ozinek et al. (2006), which occurred when the sucrose substrate depleted at high
levansucrase activity isolated form L. reuteri 121 (Ozimek et al., 2006).
Besides the levan hydrolysis by levansucrase, the enzyme levanase might also be responsible
for the levan hydrolysis during the bacterial fermentation. For example, the expression of
levanase gene from Ga. diazotrophicus was induced when glucose was depleted or when
fructose concentration was lower than 0.44 mM (Menéndez et al., 2009). Although not fully
characterized, a putative levanase (glycoside hydrolase family 32) encoding gene is strictly
conserved in the genus Gluconobacter including G. albidus (data from BLASTP search at
NCBI), which might be necessary for cell survival in case of carbon starvation (Öner et al.,
2016). Nevertheless, since the total amount of levan was still relatively stable during 48 h of
levan production as shown in section 3.3.1, the levanase activity might not yet be fully active
or there was a similar rate of levan synthesis and hydrolysis at this stage of fermentation.
Due to the formation of organic acids during the AAB fermentation as well as the pH reduction
to a minimum of pH 2.8, it was possible that the reduction of levan size and mass was partially
Discussion
85
due to spontaneous acid hydrolysis. At 40 °C, the hydrolytic degradation of levan has been
reported in the commercial levan from Z. mobilis at pH lower than 5.5 (Runyon et al., 2014),
while no acid hydrolysis was observed at 30 °C even at pH 3.7 (Bekers et al., 2005). Since the
pH in section 3.3.1 (levan production without pH control in shake flasks) was reduced to around
pH 2-3, the acid hydrolysis of levan at the mild temperature of 30 °C might still occur.
Varying pH conditions influenced both on the levan production and its molecular size. The
difference in the levan production could be from the differences in the levansucrase activity as
well as enzyme concentration at varying pH conditions. pH has always been one of the key
factors affecting the levansucrase activity, in which the optimal pH of the enzyme differs
depending on the source of levansucrase (Öner et al., 2016). For example, the highest
levansucrase activity was found at pH 5.0 in levansucrase from Z. mobilis (Jang et al., 2001),
Ga. diazotrophicus (Hernández et al., 1995) and G. albidus (Jakob and Vogel, 2015), at pH 6.0
from Bacillus sp. TH4-2 (Ben Ammar et al., 2002) and at pH 8.0 from B. subtilis NRC1aza
(Esawy et al., 2013), respectively. In addition to the influence of pH on enzyme activity, the
amount of enzyme being synthesized and/or secreted in the liquid medium might also be
different. Abdel-Fattah et al. (2005) reported the influence of enzyme concentration on the
levan production by levansucrase from B. subtilis NRC33a, in which increasing levansucrase
concentration synthesized higher amounts of levan with relatively similar Mw (Abdel-Fattah et
al., 2005). Accordingly, assuming that the production and constitutive secretion of levansucrase
by G. albidus in liquid culture was higher at pH 4.5 than at 6.5, there could be higher
concentrations of levansucrases at certain pH, resulting in higher amount of produced levan
and a possible concomitant faster consumption of the substrate sucrose; which again would
increase the possibility to partially hydrolyze levan chains due to the intrinsic levanase activity
of levansucrases as mentioned above.
Influence of differently produced levans on the quality of GF breads
Levan has been of interest for the improvement of GF bread quality since it is produced
naturally by some indigenous sourdough bacteria such as L. sanfranciscensis (Korakli et al.,
2001) and L. reuteri (Schwab et al., 2008). The positive effect of levan on wheat bread quality
was shown before by Jakob et al. (2012), where an increase of loaf volume and a reduction of
bread staling rate were observed by the addition of isolated levans from different strains of
AAB (Jakob et al., 2012b). Additionally, Rühmkorf et al. (2012) demonstrated the contribution
Discussion
86
of branching position and size of EPS to the structural improvement of GF bread (Rühmkorf
et al., 2012b). Nevertheless, EPS from these earlier studies were produced from different
bacterial strains and were sometimes a mixture of different types of EPS, which could to some
extent influence the bread characteristics. In this study, levan was produced by G. albidus at
varied pH conditions to obtain the same levan with only differences in size and mass, in which
the stronger positive effect was observed when using larger isolated levan. The size and mass
distributions of levan (Figure 22) shows that the differences in radii of each levan samples were
smaller than the differences in molar mass, indicating a more compact nature of levan
molecules at larger size, as observed before in levan from other AAB (Jakob et al., 2013),
Bacillus sp. (Arvidson et al., 2006) and St. salivarius (Newbrun et al., 1971).
Although the mechanism of levan on the improvement of bread quality is still unclear, the
micro-gel characteristic of the spherical levan molecules might bind water individually
(Kitamura et al., 1994) and/or interact with water and flour particles (Rühmkorf et al., 2012b),
as discussed earlier. The influences of levan from 3 different bacterial strains with varied Mw
but similar branching on the rheological properties of levan aqueous solutions were
demonstrated before by Benigar et al. (2014), whereby a pseudoplastic behavior (shear
thinning) of levan solution with higher Mw was observed at a lower concentration than the
smaller levan, and the aqueous solutions of larger levan were more viscous than the smaller
ones at the same concentration (Benigar et al., 2014). In this study, the larger levans affected
more positively on the bread characteristics than the smaller levans. This might be due to the
stronger influences of high Mw levan on the viscoelastic properties of the bread batter, and
subsequently on the better quality of GF bread. The sourdough production is generally a natural
fermentation process with the end pH ranges from 3.5-4.0 (Arendt et al., 2007), subsequently,
the in situ produced levan in the sourdough would probably have decreasing size in accordance
to the pH reduction. The smaller levan due to low pH in sourdough might be one of the reasons
that little or no significant effect on the bread characteristics was observed in some studies
(Kaditzky et al., 2008; Schwab et al., 2008), signifying the influence of production pH on the
function of levan in the end application.
This utilization of levan for the improvement of GF bread quality was an example to illustrate
the impact of levan size and mass on its function in a baking application. Generally, a typical
optimization of levan production would focus on the amount of levan being produced, i.e. at
pH 4.5 by G. albidus in this work, while the changes of the levan size at varying optimizing
Discussion
87
parameters were overlooked. This may lead to a loss in the opportunity of utilizing levan in a
potential application, which may be possible only with the levan of a particular size, as
demonstrated by the significant improvement of breads with levan produced from pH 5.5 and
6.5. Several environmental conditions have been described to be responsible for the variations
in the levan production and the molecular size and mass of the produced levan. Levan
concentration is influenced mainly by sucrose concentration, and also by other factors such as
incubation time, temperature, initial pH, presence of yeast extract and Mg2+, NaCl, thiamine
content, etc. (Ernandes and Garcia-Cruz, 2011; Santos-Moriano et al., 2015; Santos et al., 2014;
Sarilmiser et al., 2015; Silbir et al., 2014; Zhang et al., 2014). The change in levan size could
result from a combination of factors such as the hydrolytic effect of organic acids (formed by
bacteria) (Bekers et al., 2005), low pH instability (Runyon et al., 2014), temperature (Euzenat
et al., 1997) as well as hydrolysis activities of levanases and/or levansucrases itself (Menéndez
et al., 2009; Santos-Moriano et al., 2015; Yanase et al., 1992).
Since the molar mass and size of EPS influence their characteristics and eventually determine
their functions, understanding the change of levan size and mass under a certain culture
condition will give more insights into the production of levan. We have demonstrated here, that
the levan production with the desired characteristics is possible by tailoring the molecular mass
of choice, and how a simple control of pH during the levan production can be used to produce
the levan with specific size ranges for a specific application such as in GF baking.
Discussion
88
4.4. Levan production using molasses as carbon source
In contrast to the earlier reports on levan production from pre-treated molasses by some bacteria
(de Oliveira et al., 2007; Han and Watson, 1992; Kucukasik et al., 2011), the selected strains
of AAB could effectively produce EPS from the diluted, untreated sugarcane molasses. The
production of high amount, high Mw levan from molasses by AAB was comparable to the
previous works, but without pretreatments and sterilization of molasses needed. For K.
baliensis NBRC 16680, oxygen availability played an important role on the co-production of
HePS in molasses, and also influenced the molar size of produced levan due to the change of
pH caused by possible oxidation of acetic acid to CO2 and water. The co-presence of HePS
from K. baliensis contributed to the softer crumb and longer staling rate of buckwheat breads
containing molasses fermented by this strain, encouraging the possible use of the synergistic
effects between the naturally-produced levan and HePS in other applications. Although not yet
optimized, levan production by AAB using low cost substrate such as molasses was shown to
be efficient and economical, and can offer an attractive choice for the production of high Mw
levan in various industries.
Levan production from molasses by G. albidus and K. baliensis
Preliminary experiments comparing the levan productions without pH control in shake flasks
VS bioreactors (Appendix E, section 8.5) revealed the influence of oxygen availability on the
levan production by G. albidus. In the fermenters, where higher oxygen transfer was provided
to bacterial cells through aeration and agitation, faster pH reduction and lower EPS production
were observed compared to the shake flasks. The higher oxygen availability in the fermenter
could promote faster sugar metabolism of G. albidus, whose genus Gluconobacter is
well-known for high rate of incomplete sugar oxidation (Deppenmeier et al., 2002), causing
higher acids formation and subsequently lower pH reduction. The lower levan production in
the bioreactor could also result from this faster sugar oxidation under high aeration. For
example, too low pH (pH 2.30 in bioreactor compared to pH 3.04 in shake flasks at 32 h) might
reduce/inactivate the levansucrases activities and/or initiate levan hydrolysis as discussed
earlier in section 4.3.1 (Runyon et al., 2014; Santos-Moriano et al., 2015).
Despite the high O2 condition used in the fermenter, which might promote higher acid
formation, the control of pH (e.g. at constant pH 5.5) overcame the problem and improved the
growth as well as levan production of G. albidus compared to the uncontrolled condition
Discussion
89
(Figure 25). This further emphasized the importance of pH on the levan production by
G. albidus, in which the increased bacterial oxidation (hence, less levan production) was
compensated by higher levan formation activity at the more favorable pH. The optimum pH
for AAB is around 5.0-6.5 (Sievers and Swings, 2005), as a result, better growth and the
subsequent levansucrases secretion were predictable at pH 5.5 used in this study. Gebrande
(2015) has reported the influence of pH during the levansucrase secretion of G. albidus on the
enzymatic activities and levan concentration, wherein the highest levan amount and overall
activities (transferase and hydrolase) were found at the production pH of 5.70, and the lowest
at pH 4.65 (Gebrande, 2015). Accordingly, higher concentration and/or activities of
levansucrases at the near optimum pH seemed to be the main responsibilities for the high levan
formation. When comparing the size of levan produced by G. albidus at pH 5.5 in two different
media, similar levan size at 24 h in NaG medium (Mw ca.1165 MDa, Rw geo ca. 180 nm) and
molasses medium (Mw ca. 1265 MDa, Rw geo ca. 195 nm) was observed, even though the initial
concentrations of sucrose in these media were different (80 g/L VS ca. 40 g/L, respectively).
This additionally confirmed the possible control of levan size by fermentation pH, regardless
of the medium type and possibly initial sucrose concentration.
In contrast to G. albidus, the levan production by K. baliensis from molasses without pH
control resulted in a fluctuation of pH within 48 h and an additional formation of HePS that
increased the viscosity of the fermentation medium. As stated earlier, the additional production
of HePS was detected especially in the smaller volumes at high shaking rate, causing an
increased viscosity or even gel-like texture of medium (e.g. Figure 37 in Appendix B, section
8.2). The variation of pH during the fermentation process was probably due to the
characteristics of the genera Kozakia as a weak oxidizer (Lisdiyanti et al., 2002), in which the
forming acetate that caused the initial pH reduction, was further oxidized to CO2 and water,
resulting in an increased of pH during ca. 13-26 h. The second pH reduction observed after
26 h was possibly because not all acetic acid was converted (due to the weak oxidizing
capability of the strain), and/or because the dissolved oxygen (pO2) had already reached 0% at
ca. 25 h (data not shown), limiting further oxidation of acids. The amount of EPS produced by
K. baliensis in the fermenters (800 mL) was even higher than those produced in the small shake
flasks (10 mL), being ca. 20 g/L at 48 h compared to ca. 15 g/L (section 0), demonstrating the
comparable culture condition after up-scaling. Because there was a mixture of levan and HePS
in the freeze dried EPS samples, the concentration of only levan produced by the strain was
Discussion
90
estimated from the amount of fructose in the hydrolyzed EPS. Additionally, a rough estimation
of levan could also be made by assuming similar bacterial metabolisms (based on similar
growth curve and pH profile) between the K. baliensis wild type and the mutant strain (HePS-
negative), wherein the levan production by K. baliensis (r) at high O2 could be accounted as
the production of levan by K. baliensis (wildtype) when HePS was not co-produced. The
amount of levan produced at 48 h by K. baliensis from molasses medium was, therefore,
considered to be ca. 10 g/L, which was comparable to the levan production by G. albidus at pH
5.5.
Although the levan production process from molasses by G. albidus and K. baliensis shown in
this study was not yet optimized, the amount and yield of levan (per g sucrose) were still higher
than many strains reported in the literature (Table 11). The highest levan yield from molasses
so far was reported by Halomonas sp. (12.4 g/L), but several physical and chemical treatment
steps were required to pretreat the molasses substrate before fermentation to improve the levan
production (Kucukasik et al., 2011). Pretreatments of molasses prior to bacterial fermentation
such as acid hydrolysis, activated carbon treatment, or filtration (Lazaridou et al., 2002; Öner,
2013; Razack et al., 2013; Roukas, 1998) have been commonly used to increase the bacterial
growth and the associated EPS production by reducing the potentially harmful compounds that
might inhibit cell growth such as coloring substances, impurities, volatile organic acids, and
heavy metals (Kucukasik et al., 2011; Lazaridou et al., 2002). Some studies have also reported
the utilization of molasses without pretreatment as a carbon source to produce EPS such as
dextran by Le. mesenteroides V-2317D (Vedyashkina et al., 2005), gellan by Sphingomonas
paucimobilis ATCC 31461 (Banik et al., 2007) and xanthan by Xanthomonas campestris
ATCC 1395 (Kalogiannis et al., 2003). Nonetheless, some supplementations to molasses such
as potassium, magnesium or sodium ions were still needed to improve the productivity. In the
case of bacterial levan, this study has reported for the first time a plausible production of levan
from the untreated, nonsterile molasses by AAB, which would open a new possibility for the
levan production in a more cost-efficient, environmental friendly approach.
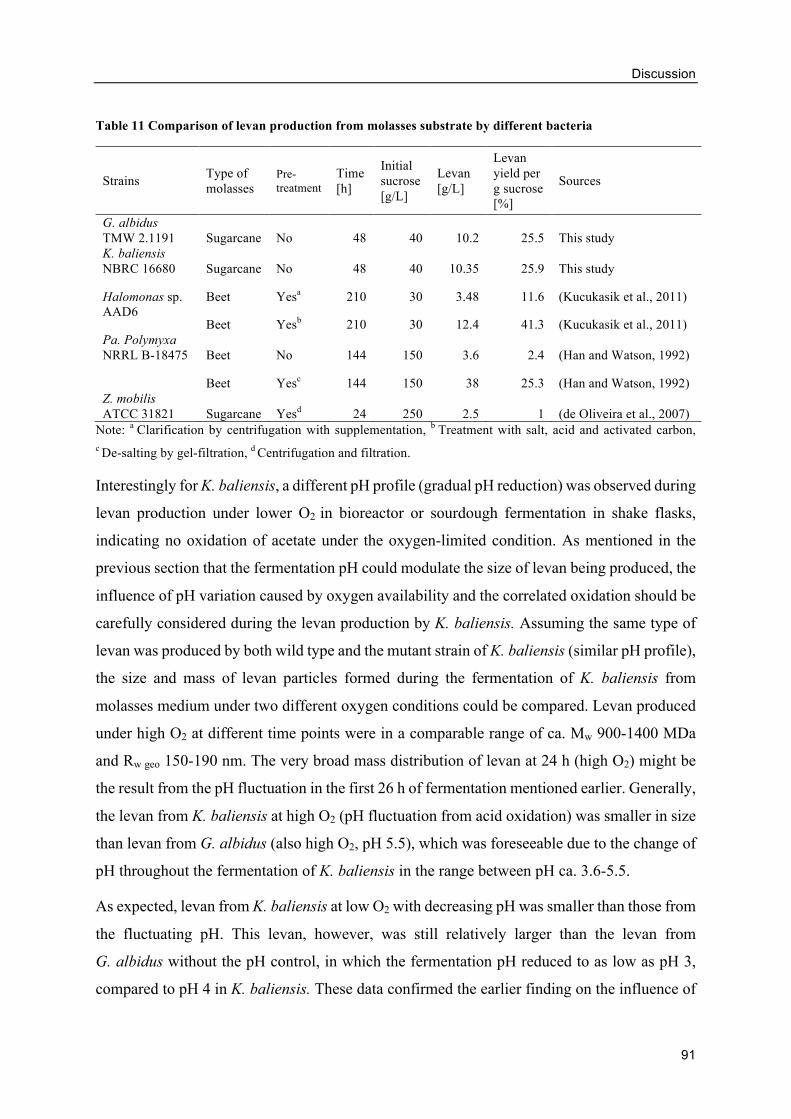
Discussion
91
Table 11 Comparison of levan production from molasses substrate by different bacteria
Strains Type of molasses
Pre-treatment
Time [h]
Initial sucrose [g/L]
Levan [g/L]
Levan yield per g sucrose [%]
Sources
G. albidus TMW 2.1191 Sugarcane No 48 40 10.2 25.5 This study K. baliensis NBRC 16680 Sugarcane No 48 40 10.35 25.9 This study
Halomonas sp. AAD6
Beet Yesa 210 30 3.48 11.6 (Kucukasik et al., 2011)
Beet Yesb 210 30 12.4 41.3 (Kucukasik et al., 2011) Pa. Polymyxa NRRL B-18475 Beet No 144 150 3.6 2.4 (Han and Watson, 1992)
Beet Yesc 144 150 38 25.3 (Han and Watson, 1992) Z. mobilis ATCC 31821 Sugarcane Yesd 24 250 2.5 1 (de Oliveira et al., 2007)
Note: a Clarification by centrifugation with supplementation, b Treatment with salt, acid and activated carbon, c De-salting by gel-filtration, d Centrifugation and filtration.
Interestingly for K. baliensis, a different pH profile (gradual pH reduction) was observed during
levan production under lower O2 in bioreactor or sourdough fermentation in shake flasks,
indicating no oxidation of acetate under the oxygen-limited condition. As mentioned in the
previous section that the fermentation pH could modulate the size of levan being produced, the
influence of pH variation caused by oxygen availability and the correlated oxidation should be
carefully considered during the levan production by K. baliensis. Assuming the same type of
levan was produced by both wild type and the mutant strain of K. baliensis (similar pH profile),
the size and mass of levan particles formed during the fermentation of K. baliensis from
molasses medium under two different oxygen conditions could be compared. Levan produced
under high O2 at different time points were in a comparable range of ca. Mw 900-1400 MDa
and Rw geo 150-190 nm. The very broad mass distribution of levan at 24 h (high O2) might be
the result from the pH fluctuation in the first 26 h of fermentation mentioned earlier. Generally,
the levan from K. baliensis at high O2 (pH fluctuation from acid oxidation) was smaller in size
than levan from G. albidus (also high O2, pH 5.5), which was foreseeable due to the change of
pH throughout the fermentation of K. baliensis in the range between pH ca. 3.6-5.5.
As expected, levan from K. baliensis at low O2 with decreasing pH was smaller than those from
the fluctuating pH. This levan, however, was still relatively larger than the levan from
G. albidus without the pH control, in which the fermentation pH reduced to as low as pH 3,
compared to pH 4 in K. baliensis. These data confirmed the earlier finding on the influence of
Discussion
92
pH on the levan size. Most importantly, the culture condition such as oxygen supply (agitation
and aeration rates) were also proven to be essential on the levan production of AAB, whose
strains also vary in their ability to further oxidize acids into CO2 and water. The change of pH
in relation to bacterial metabolism played a crucial role in the levan formation both on the
concentration and on the molecular size and mass.
HePS production by K. baliensis from molasses
When comparing the fermentations between high and low O2 of K. baliensis (wild type), the
effect of oxygen culture condition on fermentation by this strain was apparent not only on the
bacterial growth but also on the amount and type of EPS being produced. Reduced O2 condition
decreased the EPS production, which was expected due to ca. 1 log reduction of cell count.
This lower bacterial cell counts would result in less amount of levansucrase secreted into the
medium and subsequently less levan formation. Nevertheless, the percentage of levan reduction
was not comparable to a drastic decrease of HePS at O2 limited condition. Interestingly, the
oxygen availability effect seemed to influence more on the HePS production than on levan
formation, as seen by a significant reduction of HePS in proportion to levan, especially at 24,
32, and 48 h (Figure 28). As a result, oxygen availability was assumed to be involved in the
production of HePS by K. baliensis. This could be because of the high energy requirement for
the production of HePS compared to levan by the bacteria, as observed by the requirements of
NAD+ for the HePS synthesis in Ga. xylinus I-2281 (Kornmann et al., 2003) or in LAB (De
Vuyst and Degeest, 1999). The oxygen availability as energy source might be restricted in the
low O2 condition used in this study, limiting the cells from producing HePS. Similar effect was
observed before in section 3.2.1, whereby only levan was detected as the in situ EPS produced
by the bacteria during the preparation of larger volume sourdough by K. baliensis for the real
baking applications. Brandt et al. (2016) has determined the monomer composition of HePS
isolated from K. baliensis NBRC 16680 (the same strain used in this study) to be consisted of
D-glucose, D-galactose, D-mannose, and glucuronic acid (Brandt et al., 2016). This HePs could
possess interesting rheological and technological characteristics, which should be investigated
further in another study, in particular, on the possible synergistic effect of this HePS with the
co-produced levan.
Discussion
93
Alternative GF breads with EPS-containing molasses
The previous study on the influence of levan-containing sourdoughs from AAB on the
buckwheat sourdough breads (section 3.2) revealed the low amount of levan in the sourdough
as part of the difficulties in improving the buckwheat bread quality. This less-than-effective
amount of levan was due to lower growth of AAB in the flour mixture environment, which
could not provide sufficient oxygen supply as in the liquid medium, and the subsequent co-
growth of indigenous strains such as LAB. On the contrary, AAB was shown to produce
sufficient amount of levan (and HePS, in the case of K. baliensis) in the diluted molasses, and
the molasses fermentation at a controlled pH condition to produce levan with remarkably large
size was also practically possible. As a result, the use of fermented molasses by selected AAB
strains in the baking to improve the quality of buckwheat breads could be achievable, due to
the appropriate amount of levan with effective molecular size in the molasses. Besides the
potential effect of levan in the fermented molasses, the addition of molasses itself could also
be accounted as a method to improve the sensorial quality (Pribis et al., 2008) and/or the
nutritional value of GF breads, e.g. by increasing the mineral contents such as potassium,
magnesium and calcium (Filipcev, 2011).
Three types of fermented molasses were used in the preparation of buckwheat molasses breads,
each containing levan of different sizes, ranging from Mw ca. 20-2600 MDa. Additionally,
freshly prepared molasses (diluted to 10% w/w) was used in Mol A breads as the EPS-negative
molasses control bread in addition to the plain buckwheat bread (‘control’). Mol B breads
contained small levan particles, which resembled the in situ produced levan in the buckwheat
sourdoughs in earlier study, and has been shown to enhance the bread quality at more than 1%
addition (section 3.2.4). Mol C breads contained the very large size levan which has shown the
significant improvements on bread specific volume, crumb hardness as well as staling rate
(section 3.3.3). Mol D breads contained a mixture of medium-size levan (with broad size
distribution in the range of levan from pH 4.5 and 5.5 by G. albidus, data not shown) and HePS,
which could viscosify the medium at the concentration of ca. 5 g/L (Brandt et al., 2016), and
has not been explored before on its potential application. Accordingly, the effects of levan-
containing molasses on Mol B and Mol C breads could be compared with the earlier results
from sourdough breads and breads with isolated levan (section 3.2), while the influence of
additional HePS from K. baliensis could be observed for the first time in Mol D breads.
Discussion
94
Despite the positive effects of isolated levan on the physical properties and staling of
buckwheat breads demonstrated earlier, the addition of fermented molasses containing in situ
produced levan did not cause the same results as expected. Although the specific volume was
increased with the addition of molasses (fresh and fermented), an exception was observed on
molasses breads containing additional HePS (Mol D). Addition of fresh molasses might
increase the specific volume of buckwheat breads by providing additional sugars for yeast
during proofing, thus increasing the yeast metabolic activity such as CO2 formation. Moreover,
the slight acidic pH of molasses might reduce the dough pH close to the optimal pH for the
Baker’s yeast (Erkmen and Bozoglu, 2016), increasing the metabolic activity. Additionally,
this slightly lower dough pH was also comparable to the acidification effect of sourdough (final
dough pH ca. 4.7-5.4), and could therefore affect the structural-forming components in dough
such as protein and starch, as well as cereal enzymes such as proteases (Arendt et al., 2007). In
the case of Mol D, the presence of HePS seemed to negatively affect the specific volume of
breads, considering that the loaf volume of other molasses breads without HePS was increased
after molasses addition.
Varying effects were also observed on the crumb hardness (day 0) and staling rate of the breads.
The higher specific volume of the fresh molasses breads (Mol A) could lead to lower crumb
hardness than the control at day 0, but the hardening of breads was eventually higher after 4
days of storage. In the case of Mol B containing small levan, the crumb hardness was not
significantly lower than the control breads even at day 0, which was different from the results
found on sourdough breads of G. albidus (24 h). Unexpectedly, the very large levan of almost
up to 1% concentration in Mol C breads did not decrease the crumb hardness nor the staling
rate of the breads, which contradicted to the earlier positive results when isolated levan (pH
5.5, 1% flour base) was used in the bread recipe. The inability to improve the bread quality by
the addition of levan-containing molasses especially on the crumb hardness and staling rate
implied the negative influence of molasses addition, which was not observed before when
levan-containing buckwheat molasses sourdoughs or freeze dried isolated levan were used.
Although the addition of molasses has been shown before to reduce the specific volume and
increase the crumb hardness of wheat breads (Filipcev, 2011; Levic et al., 2005; Simurina et
al., 2012), the sourdough breads prepared from sourdough of buckwheat and molasses did not
have the same negative results, especially on the freshly baked breads (day 0). It was possible
that the proteolysis, starch hydrolysis and other activities during the sourdough fermentation
Discussion
95
promoted the softening effect on bread crumbs (Arendt et al., 2007; Gobbetti et al., 2014) and
overcame the negative effects of molasses, which were absent when only fermented molasses
was used in the baking.
Interestingly, Mol D breads containing a mixture of levan and HePS showed a significant
reduction in the crumb hardness and staling rate compared to the control and other molasses
breads. Although the crumb hardness at day 4 and the dehydration rate of Mol D bread crumbs
were not significantly lower than the control breads, a reducing trend could still be noticed.
The presence of HePS in the molasses breads appeared to prevail the adverse effects of
molasses found in other breads, possibly by retaining the moisture and subsequently
maintaining the crumb softness for a longer period of time. Due to limited knowledge on this
novel HePS from K. baliensis, the mechanism of HePS on the bread characteristics was still
unknown. Nevertheless, it is clear that the effects of this HePS will also vary depending on the
type of raw material and the concentration of the EPS, similar to other hydrocolloids that have
been used in the commercial GF products such as HPMC and xanthan gum (Hager and Arendt,
2013). Due to the gel-like characteristics of HePS which is different from levan, this novel
HePS (e.g. together with the co-produced levan) may exhibit interesting functionality that is
suitable for a particular application that has not been explored before.
So far, the undesired effects of molasses on the hardening of bread crumbs and increased staling
rate have not been investigated. Due to the complex compositions in the molasses such as
sugars, amino acids, salts, and trace elements (Šárka et al., 2013), which vary among types,
locality and production processes (Olbrich, 1963), it could be challenging to identify the
influential substance(s). Interestingly, some compounds in the molasses have been reported to
reduce the retrogradation of starch, which is a process that involves the recrystallization of
amylose and amylopectin molecules (Wang et al., 2015). For example, monosacchardies and
oligosaccharides (e.g. glucose and sucrose in molasses, respectively) were reported to inhibit
the retrogradation of starch gels to a certain extent by competing with starch for water (Wang
et al., 2015). Additionally, some salts that are present in the molasses such as Na+, Mg2+, Ca2+
and K+ were also found to decrease the retrogradation of various starches (Beck et al., 2011;
Wang et al., 2015). Nevertheless, the adverse effects of molasses breads observed in this study
contradicted to the above findings, and revealed that other compounds in the molasses might
be responsible for the bread staling. Another possibility that caused the increase in staling rate
of molasses breads in this work might be the lower amount of water in the bread recipe due to
Discussion
96
diluted molasses substitution. Approximately 10% of water was reduced (replaced by crude
molasses), which resulted in ca. 8% lower moisture content of bread crumbs than the control
breads (data not shown). This reduced water content might cause higher crumb hardness and
increase the starch retrogradation (and subsequently, the staling rate) of molasses breads (Wang
and Copeland, 2013).
In general, the intention to improve the buckwheat bread quality by addition of molasses
containing in situ produced levan of effective amount and size, to avoid the difficulty of lower
growth and levan production by AAB in sourdough, was not achievable due to the negative
influence of the molasses itself; which was not detected before when sourdough was used. This
finding however emphasized the advantages of sourdough fermentation on the improvement
of additive-free bread quality, which involved a combination of effects including efficient
amount and size of EPS, proper acidification, and other enzymatic processes (e.g. proteolysis
and starch hydrolysis), that could not be replaced by fermenting the liquid diluted molasses.
Nevertheless, the co-production of HePS in molasses at sufficient oxygen condition by
K. baliensis which helped overcoming the negative effect from molasses on crumb hardness
was also fascinating, and it might be applied together with the sourdough fermentation e.g. in
the bioreactor with high oxygen supply.
Summary
97
5. SUMMARY
Currently the only treatment for celiac disease is a life-long gluten-free (GF) diet (Fasano and
Catassi, 2012), which includes food such as GF breads, which lack the structural-forming
gluten proteins and have poor sensorial and textural quality. The use of sourdough is a
promising approach to improve the quality of GF breads, by replacing the addition of
hydrocolloids with the in situ produced exopolysaccharides (EPS) from bacteria. One of these
EPS is a polymer of fructose molecules called levan, which is formed naturally in situ in the
wheat/rye sourdough fermentation containing sucrose by some lactic acid bacteria (LAB)
(Galle et al., 2012b; Schwab et al., 2008). However, inconsistent results on the bread
improvement by in situ produced levan were observed, which can be due to the low amount of
levan produced by LAB (Galle et al., 2012b; Kaditzky et al., 2008). Acetic acid bacteria (AAB)
are acid producers and are commonly found in many naturally fermented food products.
Interestingly, some AAB strains produce high molecular weight levan in high amounts (Jakob
et al., 2013). Since it was found that the amount and size of isolated EPS from LAB influence
the bread characteristics (Rühmkorf et al., 2012b), the in situ levan production in sourdough
by AAB should have a better effect on the GF bread quality than the traditional LAB strains.
Hence, a study that investigates the influence of in situ produced levan by AAB as well as the
sourdough properties on the GF bread quality would be valuable for the development of
additive-free, clean-label GF bread products. In addition, more information on the factors that
influence the molecular size and mass of bacterial levan would broaden the understanding of
levan formation and its applications in other fields. Lastly, the study of levan production from
a low cost carbon source e.g. molasses would further highlight the potential of selected AAB
strains for the more economically-oriented levan production.
In this study, several AAB strains were screened for their growth and levan production ability
from molasses as a natural source of sucrose. Afterwards, cell growth, sugar consumption,
metabolites and levan formations of the 4 selected AAB strains: Gluconobacter (G.) albidus,
Kozakia (K.) baliensis, Neoasaia chiangmaiensis, and Gluconacetobacter azotocaptans were
monitored during the buckwheat molasses sourdough fermentations, to observe the potential
of AAB for the in situ levan production in sourdoughs compared to LAB. The buckwheat
sourdough fermentations were later performed in a bigger scale in order to study the influence
of levan-containing sourdoughs by AAB (G. albidus and K. baliensis) on the properties of
buckwheat breads. The sensory (e.g. taste, aroma, texture) and physical quality parameters
Summary
98
(specific volume and crumb hardness) of sourdough breads were evaluated in comparison to
the controls (plain buckwheat breads and chemically acidified breads). Additionally, the effect
of levan on the buckwheat bread properties was verified by the addition of isolated levans in
the plain buckwheat breads. In addition to the baking experiments, the levans isolated from
sourdoughs of AAB were characterized regarding the molecular size and mass. The levan
formation by G. albidus was further examined by production under different pH conditions.
These isolated levans were later used in the bread baking, to demonstrate the influence of
fermentation condition (i.e. pH) on the effect of levan on bread quality. Lastly, levan
productions by AAB from molasses were further investigated under different production
conditions to investigate the potential of levan production from cheap carbon source (molasses)
for other possible applications.
The results of this work showed that some AAB strains grew well and produced high amounts
of high Mw levan from molasses and buckwheat molasses sourdoughs. Additionally, the GF
sourdoughs fermented by selected AAB strains, when inoculated with pure culture and
provided with adequate aeration, contained higher levan concentrations than the traditional
sourdoughs fermented by LAB reported in other studies. When sourdough from both G. albidus
and K. baliensis was fermented to have the right balance between levan amount and
acidification, its addition in the bread recipe improved the quality of buckwheat bread by
increasing the specific volume, decreasing the crumb hardness, and reducing the staling rate.
The positive influence of levan in sourdough on the bread characteristics was confirmed by the
addition of isolated levan, which resulted in a significant improvement of the bread quality. It
was observed that levan-containing breads had a softer crumb and longer shelf-life but mild
increase of volume. This could be due to the water absorption characteristics of individual
levan particles, rather than the actual forming of a structural network similar to from gluten
proteins. Accordingly, it was suggested that levan functioned as a texture improver and shelf-
life extender.
Interestingly, by means of structural analysis of isolated levan during fermentation of
G. albidus, a constant reduction of levan particle size was observed with decreasing pH, which
was caused by incomplete oxidation activity of bacteria. The production of levan under
controlled pH of 4.5, 5.5, and 6.5 in the fermenters confirmed the significant influence of
fermentation pH on the size and mass of levan. Levan of larger sizes (e.g. those produced at
pH 5.5 and 6.5) had a greater effect on the bread volume and crumb hardness than the smaller
Summary
99
sizes (e.g. those from pH 4.5 or without pH control), suggesting the impact of molar size and
mass of levan on its functionality in GF baking. These results pointed out the importance of
the EPS size in addition to the usual EPS concentration during the optimization process of
levan production, which could vary depending on the fermentation condition and might
successively affect the EPS characteristics. More importantly, this finding suggested that by
simply controlling the pH during levan production, one can control the levan properties for
specific applications.
Additional studies on the use of molasses as a single source of substrate for AAB fermentation
demonstrated the potential of cost-effective alternative levan production by AAB. For
K. baliensis, the production of heteropolysaccharide (HePS) in addition to levan was observed
at high oxygen level, causing an increase in the medium viscosity in contrast to the fermentation
with low agitation and aeration. The production of high amount of levan from molasses by
AAB was proven possible without any pretreatment or sterilization of molasses needed. The
simplicity in the levan production from low-cost substrate such as molasses by AAB offers an
attractive choice of high molecular weight levan production over other levan-producing strains
(de Oliveira et al., 2007; Han and Watson, 1992; Kucukasik et al., 2011).
Further research is necessary to optimize the levan production with appropriate acid formation
during the sourdough fermentation by AAB. Furthermore, the baking recipe for GF sourdough
bread, e.g. using a combination of different types of GF flour and starch, needs to be developed
to obtain desirable sensory and texture properties that meet the consumer expectations.
Moreover, the effect of production pH on the molecular mass of other types of bacterial EPS
such as glucan or HePS should also be studied to evaluate the significance of pH on other
bacterial EPS productions. Lastly, to better understand the mechanism of molecular size and
mass change by pH during levan production, experiments using purified enzyme should be
carried out.
In conclusion, this dissertation has demonstrated that selected AAB strains can be useful
producers of high Mw levan for GF baking applications and beyond. The alternative method
for development of clean-label GF bread using novel sourdough from levan-producing AAB
was promising. Additionally, we propose that the intrinsic properties of individual levan
particles could be responsible for the functions of levan as the structure-improver and shelf-
life extender in GF bread. Furthermore, simple control of fermentation pH is a key to regulate
the formation of levan with specific size/mass range, which eventually affects its characteristics
Summary
100
in the end application. Accordingly, both amount and molecular size of levan should be taken
into account during the optimization of the production process to achieve the desired
characteristics of levan in a specific application. Finally, due to the simple fermentation process
requirement of molasses, it can be a potential low cost substrate for bacterial levan production
by AAB, which can ultimately lead to the cost-effective production of bacterial levan with the
molecular weight of choice for any possible industries.
Zusammenfassung
101
6. ZUSAMMENFASSUNG
Gegenwärtig ist die einzige Behandlung für Zöliakie eine lebenslange Diät (Fasano and
Catassi, 2012), die den Verzehr glutenfreier (GF) Nahrungsmittel wie zum Beispiel GF-Brote
einschließt. Diesen Produkten fehlen die strukturbildenden Glutenproteine, was sich i. d. R.
negativ auf die sensorische und texturelle Qualität der entsprechenden Lebensmittel auswirkt.
Die Verwendung von Sauerteig ist ein vielversprechender Ansatz, um die Qualität von GF-
Broten zu verbessern, indem die Zugabe von deklarationspflichtigen Hydrokolloiden durch die
in situ hergestellten Exopolysaccharide (EPS) von Bakterien ersetzt wird. Eines dieser EPS ist
ein Polymer aus Fructosemolekülen, das Levan genannt wird und in situ in der Weizen /
Roggen-Sauerteig-Fermentation mit Saccharose durch einige Milchsäurebakterien (MSB)
gebildet wird (Galle et al., 2012; Schwab et al., 2008). Es wurden jedoch inkonsistente
Ergebnisse bei der Brotverbesserung durch in situ hergestelltes Levan beobachtet, was auf die
geringe Menge an von MSB produziertem Levan zurückzuführen ist (Galle et al., 2012;
Kaditzky et al., 2008). Essigsäurebakterien (ESB) sind Säureproduzenten und kommen in
vielen fermentierten Nahrungsmitteln vor. Interessanterweise produzieren einige ESB-Stämme
Levan in hohen Mengen und mit hohem Molekulargewicht (Jakob et al., 2013). Da die Menge
und Größe von isoliertem EPS aus MSB die Broteigenschaften beeinflusst (Rühmkorf et al.,
2012b), könnte der Einsatz von in-situ-Levan in Sauerteig aus ESB die GF-Brotqualität im
Gegensatz zu traditionellen MSB-Stämmen weiterhin verbessern. Hierfür sind empirische
Studien zum Einfluss von in situ produziertem Levan aus ESB sowie von spezifischen
Sauerteigeigenschaften auf die Qualität von GF-Brot erforderlich, um die Entwicklung von
zusatzstofffreien GF-Produkten mit „Clean Label“ zu ermöglichen. Das Wissen zu Faktoren,
die die molekulare Größe und Masse von bakteriellem Levan beeinflussen, würde das
Verständnis zur Bildung von Levan und dessen Anwendungen in anderen Bereichen erweitern.
Schließlich würden Studien zur Bildung von Levan aus einer kostengünstigen
Kohlenstoffquelle wie z. B. Melasse das Potenzial ausgewählter ESB-Stämme für eine
wirtschaftliche Levan-Produktion weiter hervorheben.
In dieser Studie wurden ESB-Stämme auf Melasse als natürlicher Saccharose-Quelle
fermentiert, und hinsichtlich Zellwachstum und der Fähigkeit zur Levanproduktion
charakterisiert. Danach wurden 4 ausgewählte ESB-Stämme: Gluconobacter (G.) albidus,
Kozakia (K.) baliensis, Neoasaia chiangmaiensis, und Gluconacetobacter azotocaptans in
Buchweizen-Melasse-Sauerteigen bezüglich Zellwachstum, Zuckerverbrauch, Metaboliten-
Zusammenfassung
102
sowie Levan-produktion untersucht, um das Potenzial der ESB für die in situ-Produktion von
Levan in Sauerteig im Vergleich zu MSB zu bewerten. Die Buchweizen-
Sauerteigfermentationen wurden im weiteren Verlauf der Arbeit in größerem Maßstab
durchgeführt, um den Einfluss von levanhaltigen ESB-Sauerteigen (G. albidus und
K. baliensis) auf die Eigenschaften von Buchweizenbroten zu untersuchen. Hierzu wurden die
sensorischen (Geschmack, Aroma, Textur) und physikalischen Qualitätsparameter
(spezifisches Volumen, Krumenhärte) im Vergleich zu Kontrollen (einfaches Buchweizenbrot
mit und ohne chemische Ansäuerung) untersucht. Um den Effekt von Levan auf die Qualität
von Buchweizenbrot zu verifizieren wurden darüber hinaus Brote mit Zugabe von isoliertem
Levan ohne Sauerteigzugabe analysiert. Zusätzlich zu den empirischen Backexperimenten
wurde das im Sauerteig isolierte Levan in Bezug auf Molekülgröße und -masse charakterisiert.
Weiterhin wurde Levan von G. albidus bei verschiedenen pH-Bedingungen hergestellt und
beim Brotbacken eingesetzt, um den Einfluss der Fermentationsbedingungen (pH) bei der
Herstellung von Levan auf die Brotqualität zu untersuchen. Schließlich wurde die Levan-
Bildung von ESB aus Melasse unter verschiedenen Produktionsbedingungen weiter analysiert,
um das Potential der Levan-Produktion aus einer kostengünstigen Kohlenstoffquelle (Melasse)
für andere mögliche Anwendungen zu untersuchen.
Die Ergebnisse dieser Arbeit zeigen, dass einige ESB-Stämme in der Lage sind sowohl auf
Melasse als auch auf einer Melasse-Sauerteig-Mischung aus Buchweizenmehl zu wachsen und
erhebliche Mengen an hochmolekularem Levan zu produzieren. Darüber hinaus ließen sich in
Sauerteig nach Fermentation mit ESB höhere Levan-Konzentrationen feststellen als in
traditionellem Sauerteig nach Fermentation mit MSB. Unter der Voraussetzung eines
ausgewogenen Verhältnisses aus Levanmenge und Absäureung, ließ sich durch die Zugabe von
Sauerteig (G. albidus und K. baliensis) in der Rezeptur die Qualität von Buchweizenbrot durch
Erhöhung des spezifischen Volumens, Reduzierung der Krumenhärte sowie der
Verlangsamung des Altbackenwerdens verbessern. Der positive Effekt von Levan im Sauerteig
auf die Brotqualität konnte durch die Zugabe von isoliertem Levan bestätigt werden, da sich
ähnliche positive Effekte auf die Qualitätsparameter des Brots zeigten wie bei der Zugabe von
levanhaltigem Sauerteig. Der Effekt von Levan auf die Krumenhärte und der leichte Anstieg
des Brotvolumens legten das Potential von Levan als Texturverbesserer und
Haltbarkeitsverlängerer nahe, was sich möglicherweise auf die Wasserabsorptions-
eigenschaften einzelner Levanpartikel zurückführen lässt. Im Gegensatz dazu scheint der
Zusammenfassung
103
positive Effekt von Levan auf das Brotvolumen in GF-Brot vermutlich nicht auf der Bildung
eines Gluten-ähnlichen Netzwerks zu basieren.
Interessanterweise ließ sich mittels Strukturanalyse von isoliertem Levan während der
Fermentation eine konstante Reduktion der Molekülgröße- und Masse der Levanmoleküle bei
sinkendem pH-Wert beobachten. Die Herstellung von Levan unter kontrollierten pH-
Bedingungen von 4,5, 5,5 und 6,5 bestätigte den Einfluss des pH-Werts auf die Größe und
Masse des gebildeten Levans während der Fermentation. In Backversuchen zeigte sich, dass
größere Levanfraktionen (hergestellt bei pH 5,5 und 6,5) Brotvolumen und Krumenhärte
stärker beeinflussen als kleinere Fraktionen (z. B. solche hergestellt bei pH 4,5 oder ohne pH-
Kontrolle), was auf die Relevanz von Molekülgröße – und Masse von Levan für den Einsatz
in GF-Brot hinweist. Diese Ergebnisse verdeutlichen die Bedeutung der Molekülgröße
zusätzlich zur Levankonzentration während des Optimierungsprozesses, welche jeweils von
den Fermentationsbedingungen abhängen und in Kombination die Eigenschaften von Levan
beeinflussen. Daraus geht hervor, dass sich durch einfaches Steuern des pH-Wertes während
der Levanherstellung dessen Eigenschaften für spezifische Anwendungen beeinflussen lassen.
Zusätzliche Studien über die Verwendung von Melasse als eine einzige Substratquelle für die
ESB-Fermentationen zeigten das Potenzial einer kostengünstigen Alternative zur Levan-
Produktion durch ESB auf. Für K. baliensis wurde die Produktion von Heteropolysacchariden
(HePS) zusätzlich zu Levan bei hohem Sauerstoffgehalt beobachtet, was im Gegensatz zur
Fermentation mit geringer Bewegung und Belüftung zu einer deutlichen Erhöhung der
Viskosität der Nährmedien führte. Die Herstellung einer großen Menge an Levan aus Melasse
durch ESB war zudem ohne jegliche Vorbehandlung oder Sterilisation von Melasse möglich.
Die Einfachheit der Levan-Produktion auf kostengünstigem Substrat wie Melasse durch ESB
bietet eine attraktive Möglichkeit zur Produktion von Levan hohen Molekulargewichtes
gegenüber anderen Levan-produzierenden Stämmen (de Oliveira et al., 2007; Han et al., 1992;
Kucukasik et al., 2011).
Weitere Untersuchungen sind notwendig, um die Levan-Produktion bei entsprechender
Säurebildung während der Sauerteigfermentation durch ESB zu optimieren. Darüber hinaus
müssen Rezepturen für GF-Sauerteigbrot entwickelt werden, um erwünschte sensorische und
texturelle Eigenschaften zu erhalten, die den Konsumentenansprüchen entsprechen, z. B. durch
Verwendung einer Kombination von verschiedenen Arten von GF-Mehl und Stärke. Darüber
hinaus sollte der Effekt des pH auf die Molekülmasse während der Herstellung anderer Arten
Zusammenfassung
104
von bakteriellem EPS wie Glucan oder HePS untersucht werden, um die Signifikanz des pH
auf andere bakterielle EPS-Produktionen bewerten zu können. Um schließlich ein besseres
Verständnis des Mechanismus der pH-abhängigen Änderungen von Molekülgröße- und Masse
zu erreichen, sollten weitere Experimente mit gereinigten Enzymen durchgeführt werden.
Die Arbeiten im Rahmen dieser Dissertation haben gezeigt, dass mittels ausgewählter ESB-
Stämme hochmolekulares Levan für GF Backanwendungen kontrolliert produziert werden
kann. Die alternative Methode zur Entwicklung von Clean-Label-GF-Brot unter Nutzung von
neuartigem Sauerteig aus Levan-produzierenden ESB erwies sich als erfolgsversprechend.
Vermutlich sind die intrinsischen Eigenschaften einzelner Levan-Partikel für die Funktion von
Levan als Strukturverbesserer und Haltbarkeitsverlängerer in GF-Brot verantwortlich. Es
zeigte sich, dass mittels Einstellung des pH-Wertes während der Fermentation die Herstellung
von Levan mit einem spezifischen Größen- / Massenbereich möglich ist, was letztendlich die
Eigenschaften von Levan in der Endanwendung beeinflusst. Dementsprechend sollten sowohl
die Menge als auch die Molekülgröße von Levan bei der Optimierung des
Produktionsprozesses berücksichtigt werden, um die gewünschten Eigenschaften von Levan in
einer spezifischen Anwendung zu erreichen. Aufgrund seiner einfachen Fermentationsprozess-
Anforderungen stellt Melasse ein potentiell kostengünstiges Substrat für die bakterielle Levan-
Produktion durch ESB dar, was letztendlich die kostengünstige Herstellung von bakteriellem
Levan mit einem zielgerichteten Molekulargewicht für verschiedene Branchen ermöglicht.
References
105
7. REFERENCES
AACC, 2000a. Approved Methods of Analysis, 10th Ed. Method 44-15.02. Moisture -- Air-Oven Methods. Approved November 3, 1999. AACC International, St. Paul, MN, U.S.A.
AACC, 2000b. Approved Methods of Analysis, 10th Ed. Method 56-11.02. Solvent retention capacity profile. Approved November 8, 2000. AACC International, St. Paul, MN, U.S.A.
Abdel-Aziz, S.M., Hamed, H.A., Mouafi, F.E., Gad, A.S., 2012. Acidic pH-shock induces the production of an exopolysaccharide by the fungus Mucor rouxii: Utilization of beet-molasses. N. Y. Sci. J. 5, 52-61.
Abdel-Fattah, A.F., Mahmoud, D.A.R., Esawy, M.A.T., 2005. Production of levansucrase from Bacillus subtilis NRC 33a and enzymic synthesis of levan and fructo-oligosaccharides. Curr. Microbiol. 51, 402-407.
Adachi, O., Matsushita, K., Shinagawa, E., Ameyama, M., 1979. Occurrence of old yellow enzyme in Gluconobacter suboxydans, and the cyclic regeneration of NADP. J. Biochem. 86, 699-709.
Adamberg, K., Tomson, K., Talve, T., Pudova, K., Puurand, M., Visnapuu, T., Alamäe, T., Adamberg, S., 2015. Levan enhances associated growth of Bacteroides, Escherichia, Streptococcus and Faecalibacterium in fecal microbiota. PLoS ONE 10.
Anton, A.A., Artfield, S.D., 2008. Hydrocolloids in gluten-free breads: A review. Int. J. Food Sci. Nutr. 59, 11-23.
Arendt, E.K., Morrissey, A., Moore, M.M., Dal Bello, F., 2008. Gluten-free breads, in: Arendt, E.K., Bello, F.D. (Eds.), Gluten-Free Cereal Products and Beverages. Academic Press, San Diego, pp. 289-VII.
Arendt, E.K., Ryan, L.A., Dal Bello, F., 2007. Impact of sourdough on the texture of bread. Food Microbiol. 24, 165-174.
Arvidson, S.A., Rinehart, B.T., Gadala-Maria, F., 2006. Concentration regimes of solutions of levan polysaccharide from Bacillus sp. Carbohydr. Polym. 65, 144-149.
Bae, I.Y., Oh, I.K., Lee, S., Yoo, S.H., Lee, H.G., 2008. Rheological characterization of levan polysaccharides from Microbacterium laevaniformans. Int. J. Biol. Macromol. 42, 10-13.
Bakr, A.A., 1997. Production of iron-fortified bread employing some selected natural iron sources. Food / Nahrung 41, 293-298.
Banik, R.M., Santhiagu, A., Upadhyay, S.N., 2007. Optimization of nutrients for gellan gum production by Sphingomonas paucimobilis ATCC-31461 in molasses based medium using response surface methodology. Bioresour. Technol. 98, 792-797.
References
106
Barber, B., Ortolá, C., Barber, S., Fernández, F., 1992. Storage of packaged white bread - III. Effects of sour dough and addition of acids on bread characteristics. Z. Lebensm.-Unters. Forsch. 194, 442-449.
Barber, S., Báguena, R., de Barber, C.B., Martínez-Anaya, M.A., 1991. Evolution of biochemical and rheological characteristics and breadmaking quality during a multistage wheat sour dough process. Z. Lebensm.-Unters. Forsch. 192, 46-52.
Beck, M., Jekle, M., Becker, T., 2011. Starch re-crystallization kinetics as a function of various cations. Starch/Staerke 63, 792-800.
Bekers, M., Upite, D., Kaminska, E., Laukevics, J., Grube, M., Vigants, A., Linde, R., 2005. Stability of levan produced by Zymomonas mobilis. Process Biochem. 40, 1535-1539.
Ben Ammar, Y., Matsubara, T., Ito, K., Iizuka, M., Limpaseni, T., Pongsawasdi, P., Minamiura, N., 2002. Characterization of a thermostable levansucrase from Bacillus sp. TH4-2 capable of producing high molecular weight levan at high temperature. J. Biotechnol. 99, 111-119.
Benigar, E., Dogsa, I., Stopar, D., Jamnik, A., Cigić, I.K., Tomšič, M., 2014. Structure and dynamics of a polysaccharide matrix: aqueous solutions of bacterial levan. Langmuir 30, 4172-4182.
Benito, A.G., 2005. Application of molecular techniques for identification and enumeration of acetic acid bacteria, PhD thesis, Department of Biochemistry and Biotechnology, Faculty of Oenology. Rovira i Virgili University, Sapin.
Booten, K., De, S.J., Frippiat, A., 1998. Fructan- and/or polydextrose-containing dairy powders, process for preparing same and their use. European patent, EP0821885.
Brandt, J.U., Jakob, F., Behr, J., Geissler, A.J., Vogel, R.F., 2016. Dissection of exopolysaccharide biosynthesis in Kozakia baliensis. Microb. Cell Fact. 15, 170.
Brandt, M., 2013. Einsatz von Essigsäurebakterien zur Herstellung von Backwaren, European patent, WO2013113602 A2 ed.
Bredahl, L., 1999. Consumers' cognitions with regard to genetically modified foods. Results of a qualitative study in four countries. Appetite 33, 343-360.
Cabálková, J., Židková, J., Přibyla, L., Chmelík, J., 2004. Determination of carbohydrates in juices by capillary electrophoresis, high-performance liquid chromatography, and matrix-assisted laser desorption/ionization-time of flight-mass spectrometry. Electrophoresis 25, 487-493.
Calazans, G.M.T., Lima, R.C., De França, F.P., Lopes, C.E., 2000. Molecular weight and antitumour activity of Zymomonas mobilis levans. Int. J. Biol. Macromol. 27, 245-247.
Campo, E., del Arco, L., Urtasun, L., Oria, R., Ferrer-Mairal, A., 2016. Impact of sourdough on sensory properties and consumers' preference of gluten-free breads enriched with teff flour. J. Cereal Sci. 67, 75-82.
References
107
Capriles, V.D., Arêas, J.A.G., 2014. Novel approaches in gluten-free breadmaking: Interface between food science, nutrition, and health. Comp. Rev. Food Sci. Food Safety 13, 871-890.
Carriere, C.J., Amis, E.J., Schrag, J.L., Ferry, J.D., 1993. Dilute-solution dynamic viscoelastic properties of xanthan polysaccharide. J. Rheol. 37, 469-478.
Catassi, C., Bai, J., Bonaz, B., Bouma, G., Calabrò, A., Carroccio, A., Castillejo, G., Ciacci, C., Cristofori, F., Dolinsek, J., Francavilla, R., Elli, L., Green, P., Holtmeier, W., Koehler, P., Koletzko, S., Meinhold, C., Sanders, D., Schumann, M., Schuppan, D., Ullrich, R., Vécsei, A., Volta, U., Zevallos, V., Sapone, A., Fasano, A., 2013. Non-celiac gluten sensitivity: the new frontier of gluten related disorders. Nutrients 5, 3839-3853.
Charalampopoulos, D., Pandiella, S.S., Webb, C., 2002. Growth studies of potentially probiotic lactic acid bacteria in cereal-based substrates. J. Appl. Microbiol. 92, 851-859.
Chronakis, I.S., Doublier, J.L., Piculell, L., 2000. Viscoelastic properties for kappa- and iota-carrageenan in aqueous NaI from the liquid-like to the solid-like behaviour. Int. J. Biol. Macromol. 28, 1-14.
Corsetti, A., Gobbetti, M., Balestrieri, F., Paoletti, F., Russi, L., Rossi, J., 1998a. Sourdough lactic acid bacteria effects on bread firmness and staling. J. Food Sci. 63, 347-351.
Corsetti, A., Gobbetti, M., Rossi, J., Damiani, P., 1998b. Antimould activity of sourdough lactic acid bacteria: Identification of a mixture of organic acids produced by Lactobacillus sanfrancisco CB1. Appl. Microbiol. Biotechnol. 50, 253-256.
Corsetti, A., Settanni, L., 2007. Lactobacilli in sourdough fermentation. Food Res. Int. 40, 539-558.
Costantini, L., Lukšič, L., Molinari, R., Kreft, I., Bonafaccia, G., Manzi, L., Merendino, N., 2014. Development of gluten-free bread using tartary buckwheat and chia flour rich in flavonoids and omega-3 fatty acids as ingredients. Food Chem. 165, 232-240.
Czerny, M., Schieberle, P., 2002. Important aroma compounds in freshly ground wholemeal and white wheat flour - Identification and quantitative changes during sourdough fermentation. J. Agric. Food Chem. 50, 6835-6840.
Davidou, S., Le Meste, M., Debever, E., Bekaert, D., 1996. A contribution to the study of staling of white bread: Effect of water and hydrocolloid. Food Hydrocolloids 10, 375-383.
de Oliveira, M.R., da Silva, R.S.S.F., Buzato, J.B., Celligoi, M.A.P.C., 2007. Study of levan production by Zymomonas mobilis using regional low-cost carbohydrate sources. Biochem. Eng. J. 37, 177-183.
De Vuyst, L., Degeest, B., 1999. Heteropolysaccharides from lactic acid bacteria. FEMS Microbiol. Rev. 23, 153-177.
De Vuyst, L., Neysens, P., 2005. The sourdough microflora: Biodiversity and metabolic interactions. Trends Food Sci. Technol. 16, 43-56.
References
108
Deppenmeier, U., Ehrenreich, A., 2009. Physiology of acetic acid bacteria in light of the genome sequence of Gluconobacter oxydans. J. Mol. Microbiol. Biotechnol. 16, 69-80.
Deppenmeier, U., Hoffmeister, M., Prust, C., 2002. Biochemistry and biotechnological applications of Gluconobacter strains. Appl. Microbiol. Biotechnol. 60, 233-242.
Di Cagno, R., De Angelis, M., Limitone, A., Minervini, F., Carnevali, P., Corsetti, A., Gaenzle, M., Ciati, R., Gobbetti, M., 2006. Glucan and fructan production by sourdough Weissella cibaria and Lactobacillus plantarum. J. Agric. Food Chem. 54, 9873-9881.
Dos Santos, L.F., Bazani Cabral De Melo, F.C., Martins Paiva, W.J., Borsato, D., Corradi Custódio Da Silva, M.D.L., Colabone Celligoi, M.A.P., 2013. Characterization and optimization of levan production by Bacillus subtilis NATTO. Rom. Biotech. Lett. 18, 8413-8422.
Duetz, W.A., Witholt, B., 2004. Oxygen transfer by orbital shaking of square vessels and deepwell microtiter plates of various dimensions. Biochem. Eng. J. 17, 181-185.
Erkmen, O., Bozoglu, T.F., 2016. Food Microbiology: Principles into Practice. John Wiley & Sons, UK.
Ernandes, F.M.P.G., Garcia-Cruz, C.H., 2011. Nutritional requirements of Zymomonas mobilis CCT 4494 for levan production. Braz. Arch. Biol. Technol. 54, 589-600.
Esawy, M.A., Abdel-Fattah, A.M., Ali, M.M., Helmy, W.A., Salama, B.M., Taie, H.A., Hashem, A.M., Awad, G.E., 2013. Levansucrase optimization using solid state fermentation and levan biological activities studies. Carbohydr. Polym. 96, 332-341.
Esawy, M.A., Ahmed, E.F., Helmy, W.A., Mansour, N.M., El-Senousy, W.M., El-Safty, M.M., 2011. Production of levansucrase from novel honey Bacillus subtilis isolates capable of producing antiviral levans. Carbohydr. Polym. 86, 823-830.
Euzenat, O., Guibert, A., Combes, D., 1997. Production of fructo-oligosaccharides by levansucrase from Bacillus subtilis C4. Process Biochem. 32, 237-243.
Fasano, A., Catassi, C., 2012. Celiac disease. New Engl. J. Med. 367, 2419-2426.
Filipcev, P., 2011. Sugar beet molasses: an ingredient to enhance micronutrients and funtionality in bread. Food and Feed Research 38, 95-100.
Fuentes-Ramirez, L.E., Bustillos-Cristales, R., Tapia-Hernandez, A., Wang, E.T., Martinez-Romero, E., Caballero-Mellado, J., 2001. Novel nitrogen-fixing acetic acid bacteria, Gluconacetobacter johannae sp. nov. and Gluconacetobacter azotocaptans sp. nov., associated with coffee plants. Int. J. Syst. Evol. Microbiol. 51, 1305-1314.
Funami, T., Kataoka, Y., Omoto, T., Goto, Y., Asai, I., Nishinari, K., 2005. Food hydrocolloids control the gelatinization and retrogradation behavior of starch. 2a. Functions of guar gums with different molecular weights on the gelatinization behavior of corn starch. Food Hydrocolloids 19, 15-24.
References
109
Gallagher, E., Gormley, T.R., Arendt, E.K., 2003. Crust and crumb characteristics of gluten free breads. J. Food Eng. 56, 153-161.
Galle, S., Schwab, C., Arendt, E., Ganzle, M., 2010. Exopolysaccharide-forming Weissella strains as starter cultures for sorghum and wheat sourdoughs. J. Agric. Food Chem. 58, 5834-5841.
Galle, S., Schwab, C., Bello, F.D., Coffey, A., Gänzle, M., Arendt, E., 2012a. Comparison of the impact of dextran and reuteran on the quality of wheat sourdough bread. J. Cereal Sci. 56, 531-537.
Galle, S., Schwab, C., Dal Bello, F., Coffey, A., Ganzle, M.G., Arendt, E.K., 2012b. Influence of in-situ synthesized exopolysaccharides on the quality of gluten-free sorghum sourdough bread. Int. J. Food Microbiol. 155, 105-112.
Gänzle, M.G., Ehmann, M., Hammes, W.P., 1998. Modeling of growth of Lactobacillus sanfranciscensis and Candida milleri in response to process parameters of sourdough fermentation. Appl. Environ. Microbiol. 64, 2616-2623.
Gänzle, M.G., Follador, R., 2012. Metabolism of oligosaccharides and starch in lactobacilli: A review. Front. Microbiol. 3, 1-15.
Garay-Arroyo, A., Covarrubias, A.A., Clark, I., Niño, I., Gosset, G., Martinez, A., 2004. Response to different environmental stress conditions of industrial and laboratory Saccharomyces cerevisiae strains. Appl. Microbiol. Biotechnol. 63, 734-741.
Garcia-Ochoa, F., Gomez, E., 2009. Bioreactor scale-up and oxygen transfer rate in microbial processes: an overview. Biotechnol. Adv. 27, 153-176.
Gebrande, C., 2015. Functional analysis of native levansucrases from Gluconobacter species TMW 2.1191 in dependence of selected environmental conditions. Master thesis, Technical University of Munich, Germany.
Gobbetti, M., Rizzello, C.G., Di Cagno, R., De Angelis, M., 2014. How the sourdough may affect the functional features of leavened baked goods. Food Microbiol. 37, 30-40.
Goffin, P., Lorquet, F., Kleerebezem, M., Hols, P., 2004. Major role of NAD-dependent lactate dehydrogenases in aerobic lactate utilization in Lactobacillus plantarum during early stationary phase. J. Bacteriol. 186, 6661-6666.
Graves, T., Narendranath, N.V., Dawson, K., Power, R., 2007. Interaction effects of lactic acid and acetic acid at different temperatures on ethanol production by Saccharomyces cerevisiae in corn mash. Appl. Microbiol. Biotechnol. 73, 1190-1196.
Gray, J.A., Bemiller, J.N., 2003. Bread Staling: Molecular Basis and Control. Comp. Rev. Food Sci. Food Safety 2, 1-21.
Gulitz, A., Stadie, J., Wenning, M., Ehrmann, M.A., Vogel, R.F., 2011. The microbial diversity of water kefir. Int. J. Food Microbiol. 151, 284-288.
References
110
Hager, A.-S., Arendt, E.K., 2013. Influence of hydroxypropylmethylcellulose (HPMC), xanthan gum and their combination on loaf specific volume, crumb hardness and crumb grain characteristics of gluten-free breads based on rice, maize, teff and buckwheat. Food Hydrocolloids 32, 195-203.
Hammes, W.P., Gänzle, M.G., 1997. Sourdough breads and related products, in: Wood, B.J.B. (Ed.), Microbiology of Fermented Foods. Springer US, Boston, MA, pp. 199-216.
Han, J., Xu, X., Gao, C., Liu, Z., Wu, Z., 2016. Levan-producing Leuconostoc citreum strain BD1707 and its growth in tomato juice supplemented with sucrose. Appl. Environ. Microbiol. 82, 1383-1390.
Han, Y.W., 1990. Microbial levan. Adv. Appl. Microbiol. 35, 171-194.
Han, Y.W., Clarke, M.A., 1990. Production and characterization of microbial levan. J. Agric. Food Chem. 38, 393-396.
Han, Y.W., Watson, M.A., 1992. Production of microbial levan from sucrose, sugarcane juice and beet molasses. J. Ind. Microbiol. 9, 257-260.
Hansen, E.B., 2002. Commercial bacterial starter cultures for fermented foods of the future. Int. J. Food Microbiol. 78, 119-131.
Hehre, E.J., Hamilton, D.M., 1949. Bacterial conversion of dextrin into a polysaccharide with the serological properties of dextran. Proc. Soc. Exp. Biol. Med. 71, 336-339.
Hermann, M., Petermeier, H., Vogel, R., 2015. Development of novel sourdoughs with in situ formed exopolysaccharides from acetic acid bacteria. Eur. Food Res. Technol., 1-13.
Hernández, L., Arrieta, J., Menendez, C., Vazquez, R., Coego, A., Suarez, V., Selman, G., Petit-Glatron, M.F., Chambert, R., 1995. Isolation and enzymic properties of levansucrase secreted by Acetobacter diazotrophicus SRT4, a bacterium associated with sugar cane. Biochem. J. 309, 113-118.
Hernandez, L., Sotolongo, M., Rosabal, Y., Menendez, C., Ramirez, R., Caballero-Mellado, J., Arrieta, J., 2000. Structural levansucrase gene (lsdA) constitutes a functional locus conserved in the species Gluconacetobacter diazotrophicus. Arch. Microbiol. 174, 120-124.
Idogawa, N., Amamoto, R., Murata, K., Kawai, S., 2014. Phosphate enhances levan production in the endophytic bacterium Gluconacetobacter diazotrophicus Pal5. Bioengineered 5, 173-179.
Illeghems, K., De Vuyst, L., Weckx, S., 2013. Complete genome sequence and comparative analysis of Acetobacter pasteurianus 386B, a strain well-adapted to the cocoa bean fermentation ecosystem. BMC Genomics 14, 1-14.
Jakob, F., 2014. Novel fructans from acetic acid bacteria. PhD Thesis, Technical University of Munich, Munich.
Jakob, F., Meißner, D., Vogel, R.F., 2012a. Comparison of novel GH 68 levansucrases of levan-overproducing Gluconobacter species. Acetic Acid Bact. 1.
References
111
Jakob, F., Pfaff, A., Novoa-Carballal, R., Rubsam, H., Becker, T., Vogel, R.F., 2013. Structural analysis of fructans produced by acetic acid bacteria reveals a relation to hydrocolloid function. Carbohydr. Polym. 92, 1234-1242.
Jakob, F., Steger, S., Vogel, R.F., 2012b. Influence of novel fructans produced by selected acetic acid bacteria on the volume and texture of wheat breads. Eur. Food Res. Technol. 234, 493-499.
Jakob, F., Vogel, R.F., 2015. Method for producing exopolysaccharides, products and uses thereof, European patent, EP2829612 A1.
Jang, K.H., Song, K.B., Park, B.S., Kim, C.H., Chung, B.H., Choue, R.W., Lee, K.S., Lee, C., Chun, U.H., Rhee, S.K., 2001. Levan production by use of the recombinant levansucrase immobilized on titanium-activated magnetite. Process Biochem. 37, 339-343.
Johnson, M., Zaretskaya, I., Raytselis, Y., Merezhuk, Y., McGinnis, S., Madden, T.L., 2008. NCBI BLAST: a better web interface. Nucleic Acids Res. 36, W5-W9.
Kaditzky, S., Seitter, M., Hertel, C., Vogel, R.F., 2008. Performance of Lactobacillus sanfranciscensis TMW 1.392 and its levansucrase deletion mutant in wheat dough and comparison of their impact on bread quality. Eur. Food Res. Technol. 227, 433-442.
Kaditzky, S., Vogel, R.F., 2008. Optimization of exopolysaccharide yields in sourdoughs fermented by lactobacilli. Eur. Food Res. Technol. 228, 291-299.
Kaditzky, S.V., Rudi, F., 2008. Optimization of exopolysaccharide yields in sourdoughs fermented by Lactobacilli. Eur. Food Res. Technol. 2008.
Kalogiannis, S., Iakovidou, G., Liakopoulou-Kyriakides, M., Kyriakidis, D.A., Skaracis, G.N., 2003. Optimization of xanthan gum production by Xanthomonas campestris grown in molasses. Process Biochem. 39, 249-256.
Kang, S.A., Jang, K.-H., Seo, J.-W., Kim, K.H., Kim, Y.H., Rairakhawada, D., Seo, M.Y., Lee, J.O., Ha, S.D., Kim, C.H., Rhee, S.K., 2009. Levan: applications and perspectives, in: Rhem, B.H.A. (Ed.), Microbial production of biopolymers and polymer precursors: Applications and perspectives. Caister Academic Press, UK.
Katina, K., Maina, N.H., Juvonen, R., Flander, L., Johansson, L., Virkki, L., Tenkanen, M., Laitila, A., 2009. In situ production and analysis of Weissella confusa dextran in wheat sourdough. Food Microbiol. 26, 734-743.
Kato, N., Mizuno, M., Nakai, Y., Nozaki, K., Suga, H., Kanda, T., Yamanaka, S., Amano, Y., 2007. Structural analysis of the water-soluble carbohydrate from Asaia bogorensis by NMR spectroscopy. J. Appl. Glycosci. 54, 231-233.
Kern, C.C., Usbeck, J.C., Vogel, R.F., Behr, J., 2013. Optimization of Matrix-Assisted-Laser-Desorption–Ionization-Time-Of-Flight Mass Spectrometry for the identification of bacterial contaminants in beverages. J. Microbiol. Methods 93, 185-191.
References
112
Kim, M.G., Seo, J.W., Song, K.B., Kim, C.H., Chung, B.H., Rhee, S.K., 1998. Levan and fructosyl derivatives formation by a recombinant levansucrase from Rahnella aquatilis. Biotechnol. Lett. 20, 333-336.
Kitamura, S., Hirano, T., Takeo, K., Mimura, M., Kajiwara, K., Stokke, B.T., Harada, T., 1994. Conformation of (2→1)-β-d-fructan in aqueous solution. Int. J. Biol. Macromol. 16, 313-317.
Konitzer, K., Pflaum, T., Oliveira, P., Arendt, E., Koehler, P., Hofmann, T., 2013. Kinetics of sodium release from wheat bread crumb as affected by sodium distribution. J. Agric. Food Chem. 61, 10659-10669.
Korakli, M., Rossmann, A., Gänzle, M.G., Vogel, R.F., 2001. Sucrose metabolism and exopolysaccharide production in wheat and rye sourdoughs by Lactobacillus sanfranciscensis. J. Agric. Food Chem. 49, 5194-5200.
Kornmann, H., Duboc, P., Marison, I., von Stockar, U., 2003. Influence of nutritional factors on the nature, yield, and composition of exopolysaccharides produced by Gluconacetobacter xylinus I-2281. Appl. Environ. Microbiol. 69, 6091-6098.
Kucukasik, F., Kazak, H., Guney, D., Finore, I., Poli, A., Yenigun, O., Nicolaus, B., Oner, E.T., 2011. Molasses as fermentation substrate for levan production by Halomonas sp. Appl. Microbiol. Biotechnol. 89, 1729-1740.
Lacaze, G., Wick, M., Cappelle, S., 2007. Emerging fermentation technologies: Development of novel sourdoughs. Food Microbiol. 24, 155-160.
Lavermicocca, P., Valerio, F., Evidente, A., Lazzaroni, S., Corsetti, A., Gobbetti, M., 2000. Purification and characterization of novel antifungal compounds from the sourdough Lactobacillus plantarum strain 21B. Appl. Environ. Microbiol. 66, 4084-4090.
Lazaridou, A., Duta, D., Papageorgiou, M., Belc, N., Biliaderis, C.G., 2007. Effects of hydrocolloids on dough rheology and bread quality parameters in gluten-free formulations. J. Food Eng. 79, 1033-1047.
Lazaridou, A., Roukas, T., Biliaderis, C.G., Vaikousi, H., 2002. Characterization of pullulan produced from beet molasses by Aureobasidium pullulans in a stirred tank reactor under varying agitation. Enzyme Microb. Technol. 31, 122-132.
Lefeber, T., Janssens, M., Camu, N., De Vuyst, L., 2010. Kinetic analysis of strains of lactic acid bacteria and acetic acid bacteria in cocoa pulp simulation media toward development of a starter culture for cocoa bean fermentation. Appl. Environ. Microbiol. 76, 7708-7716.
Levic, L., Filipcev, B., Simurina, O., Kuljanin, T., 2005. Dough rheology and quality attributes of wheat bread supplemented with sugar beet molasses. J. Process Energy Agric. 9, 129-131.
Liang, T.W., Wang, S.L., 2015. Recent advances in exopolysaccharides from Paenibacillus spp.: production, isolation, structure, and bioactivities. Mar. Drugs 13, 1847-1863.
References
113
Lilley, B.D., Brewer, J.H., 1953. The selective antibacterial action of phenylethyl alcohol. J. Am. Pharm. Assoc. 42, 6-8.
Lisdiyanti, P., Kawasaki, H., Widyastuti, Y., Saono, S., Seki, T., Yamada, Y., Uchimura, T., Komagata, K., 2002. Kozakia baliensis gen. nov., sp. nov., a novel acetic acid bacterium in the alpha-Proteobacteria. Int. J. Syst. Evol. Microbiol. 52, 813-818.
Lorenzetti, M.F.S., Moro, M.R., García-Cruz, C.H., 2015. Alginate/PVA beads for levan production by Zymomonas mobilis. J. Food Process Eng. 38, 31-36.
Macauley, S., McNeil, B., Harvey, L.M., 2001. The genus Gluconobacter and its applications in biotechnology. Crit. Rev. Biotechnol. 21, 1-25.
Mamlouk, D., Gullo, M., 2013. Acetic acid bacteria: Physiology and carbon sources oxidation. Indian J. Microbiol. 53, 377-384.
Matsushita, K., Toyama, H., Adachi, O., 1994. Respiratory chains and bioenergetics of acetic acid bacteria. Adv. Microb. Physiol. 36, 247-301.
Mayo, B., Aleksandrzak-Piekarczyk, T., Fernández, M., Kowalczyk, M., Álvarez-Martín, P., Bardowski, J., 2010. Updates in the metabolism of lactic acid bacteria, in: Mozzi, F., Raya, R.R., Vignolo, G.M. (Eds.), Biotechnology of Lactic Acid Bacteria: Novel Applications. Wiley-Blackwell, Oxford, UK, pp. 3-33.
Méndez-Lorenzo, L., Porras-Domínguez, J.R., Raga-Carbajal, E., Olvera, C., Rodríguez-Alegría, M.E., Carrillo-Nava, E., Costas, M., Munguía, A.L., 2015. Intrinsic levanase activity of Bacillus subtilis 168 levansucrase (SacB). PLoS ONE 10.
Menéndez, C., Banguela, A., Caballero-Mellado, J., Hernández, L., 2009. Transcriptional regulation and signal-peptide-dependent secretion of exolevanase (LsdB) in the endophyte Gluconacetobacter diazotrophicus. Appl. Environ. Microbiol. 75, 1782-1785.
Menéndez, C., Hernández, L., Selman, G., Mendoza, M.F., Hevia, P., Sotolongo, M., Arrieta, J.G., 2002. Molecular cloning and expression in Escherichia coli of an exo-levanase gene from the endophytic bacterium Gluconacetobacter diazotrophicus SRT4. Curr. Microbiol. 45, 5-12.
Molinari, M.L., Boiardi, J.L., 2013. Levans production by Gluconacetobacter diazotrophicus. Electron. J. Biotechnol. 16.
Moore, M.M., Juga, B., Schober, T.J., Arendt, E.K., 2007. Effect of lactic acid bacteria on properties of gluten-free sourdoughs, batters, and quality and ultrastructure of gluten-free bread. Cereal Chem. 84, 357-364.
Morgan, K.R., Gerrard, J., Every, D., Ross, M., Gilpin, M., 1997. Staling in starch breads: The effect of antistaling α-amylase. Starch/Staerke 49, 54-59.
Moroni, A.V., Arendt, E.K., Bello, F.D., 2011. Biodiversity of lactic acid bacteria and yeasts in spontaneously-fermented buckwheat and teff sourdoughs. Food Microbiol. 28, 497-502.
References
114
Moroni, A.V., Dal Bello, F., Arendt, E.K., 2009. Sourdough in gluten-free bread-making: an ancient technology to solve a novel issue? Food Microbiol. 26, 676-684.
Moroni, A.V., Zannini, E., Sensidoni, G., Arendt, E.K., 2012. Exploitation of buckwheat sourdough for the production of wheat bread. Eur. Food Res. Technol. 235, 659-668.
Morris, E.R., Ross-Murphy, S.B., 1981. Chain flexibility of polysaccharides and glycoproteins from viscosity measurements, Techniques in Carbohydrate Metabolism. Elsevier, London, pp. 201-246.
Moscovici, M., 2015. Present and future medical applications of microbial exopolysaccharides. Front. Microbiol. 6.
Newbrun, E., Lacy, R., Christie, T.M., 1971. The morphology and size of the extracellular polysaccharides from oral streptococci. Arch. Oral. Biol. 16, 863-872.
Nilsson, L., 2013. Separation and characterization of food macromolecules using field-flow fractionation: A review. Food Hydrocolloids 30, 1-11.
Notararigo, S., Nácher-Vázquez, M., Ibarburu, I., Werning, M., De Palencia, P.F., Dueñas, M.T., Aznar, R., López, P., Prieto, A., 2013. Comparative analysis of production and purification of homo- and hetero-polysaccharides produced by lactic acid bacteria. Carbohydr. Polym. 93, 57-64.
Olbrich, H., 1963. The molasses. Berlin: Institut für Zuckerindustrie, Biotechnologie-Kempe GmbH.
Öner, E.T., 2013. Microbial Production of Extracellular Polysaccharides from Biomass, in: Fang, Z. (Ed.), Pretreatment Techniques for Biofuels and Biorefinerie, Green Energy and Technology. Springer-Verlag, Heidelberg, pp. 35-56.
Öner, E.T., Hernández, L., Combie, J., 2016. Review of levan polysaccharide: from a century of past experiences to future prospects. Biotechnol. Adv. 34, 827-844.
Ozimek, L.K., Kralj, S., van der Maarel, M.J.E.C., Dijhuizen, L., 2006. The levansucrase and inulosucrase enzymes of Lactobacillus reuteri 121 catalyse processive and non-processive transglycosylation reactions. Microbiology 152, 1187-1196.
Pampulha, M.E., Loureiro-Dias, M.C., 2000. Energetics of the effect of acetic acid on growth of Saccharomyces cerevisiae. FEMS Microbiol. Lett. 184, 69-72.
Peters, B., Junker, A., Brauer, K., Mühlthaler, B., Kostner, D., Mientus, M., Liebl, W., Ehrenreich, A., 2013. Deletion of pyruvate decarboxylase by a new method for efficient markerless gene deletions in Gluconobacter oxydans. Appl. Microbiol. Biotechnol. 97, 2521-2530.
Pontis, H.G., 1990. Fructans, in: Dey, P.M. (Ed.), Methods in Plant Biochemistry, vol. 2. Academic Press Ltd., London, pp. 353-369.
Pothakos, V., Illeghems, K., Laureys, D., Spitaels, F., Vandamme, P., De Vuyst, L., 2016. Acetic Acid Bacteria in Fermented Food and Beverage Ecosystems, in: Matsushita, K., Toyama, H., Tonouchi, N.,
References
115
Okamoto-Kainuma, A. (Eds.), Acetic Acid Bacteria: Ecology and Physiology. Springer Japan, Tokyo, pp. 73-99.
Pribis, V., Levic, L., Filipcev, B., Simurina, O., 2008. Nutritive quality and sensory properties of fine yeast leavened bakery products with sugar beet molasses. J. Process Energy Agric. 12, 158-161.
Prust, C., Hoffmeister, M., Liesegang, H., Wiezer, A., Fricke, W.F., Ehrenreich, A., Gottschalk, G., Deppenmeier, U., 2005. Complete genome sequence of the acetic acid bacterium Gluconobacter oxydans. Nat. Biotechnol. 23, 195-200.
Raspor, P., Goranovic, D., 2008. Biotechnological applications of acetic acid bacteria. Crit. Rev. Biotechnol. 28, 101-124.
Raspor, P., Goranovic, D., 2009. Biotechnological applications of acetic acid bacteria in food production, in: Doelle, H.W., Roken, J.S., Berovic, M. (Eds.), Biotechnology - Volume VII: Fundamentals in Biotechnology. UNESCO-EOLSS, UK, pp. 178-198.
Raza, W., Yang, W., Jun, Y., Shakoor, F., Huang, Q., Shen, Q., 2012. Optimization and characterization of a polysaccharide produced by Pseudomonas fluorescens WR-1 and its antioxidant activity. Carbohydr. Polym. 90, 921-929.
Razack, S.A., Velayutham, V., Thangavelu, V., 2013. Medium optimization for the production of exopolysaccharide by Bacillus subtilis using synthetic sources and agro wastes. Turkish J. Biol. 37, 280-288.
Richhardt, J., Bringer, S., Bott, M., 2013. Role of the pentose phosphate pathway and the Entner-Doudoroff pathway in glucose metabolism of Gluconobacter oxydans 621H. Appl. Microbiol. Biotechnol. 97, 4315-4323.
Rosell, C.M., Rojas, J.A., Benedito de Barber, C., 2001. Influence of hydrocolloids on dough rheology and bread quality. Food Hydrocolloids 15, 75-81.
Roukas, T., 1998. Pretreatment of beet molasses to increase pullulan production. Process Biochem. 33, 805-810.
Roukas, T., Liakopoulou-Kyriakides, M., 1999. Production of pullulan from beet molasses by Aureobasidium pullulans in a stirred tank fermentor. J. Food Eng. 40, 89-94.
Rózylo, R., Rudy, S., Krzykowski, A., Dziki, D., Gawlik-Dziki, U., Rózylo, K., Skonecki, S., 2015. Effect of adding fresh and freeze-dried buckwheat sourdough on gluten-free bread quality. Int. J. Food Sci. Technol. 50, 313-322.
Rühmkorf, C., Jungkunz, S., Wagner, M., Vogel, R.F., 2012a. Optimization of homoexopolysaccharide formation by lactobacilli in gluten-free sourdoughs. Food Microbiol. 32, 286-294.
Rühmkorf, C., Rübsam, H., Becker, T., Bork, C., Voiges, K., Mischnick, P., Brandt, M.J., Vogel, R.F., 2012b. Effect of structurally different microbial homoexopolysaccharides on the quality of gluten-free bread. Eur. Food Res. Technol. 235, 139-146.
References
116
Runyon, J.R., Nilsson, L., Ulmius, M., Castro, A., Ionescu, R., Andersson, C., Schmidt, C., 2014. Characterizing changes in levan physicochemical properties in different pH environments using asymmetric flow field-flow fractionation. Anal. Bioanal. Chem. 406, 1597-1605.
Sabanis, D., Tzia, C., 2011. Effect of hydrocolloids on selected properties of gluten-free dough and bread. Food Sci. Technol. Int. 17, 279-291.
Santos-Moriano, P., Fernandez-Arrojo, L., Poveda, A., Jimenez-Barbero, J., Ballesteros, A.O., Plou, F.J., 2015. Levan versus fructooligosaccharide synthesis using the levansucrase from Zymomonas mobilis: effect of reaction conditions. J. Mol. Catal. B: Enzym. 119, 18-25.
Santos, V.A.Q., Del Bianchi, V.L., Garcia-Cruz, C.H., 2014. Effect of initial pH in levan production by Zymomonas mobilis immobilized in sodium alginate. Acta Sci-Technol. 36, 349-354.
Sarilmiser, H.K., Ates, O., Ozdemir, G., Arga, K.Y., Oner, E.T., 2015. Effective stimulating factors for microbial levan production by Halomonas smyrnensis AAD6T. J. Biosci. Bioeng. 119, 455-463.
Šárka, E., Bubnik, Z., Hinkova, A., Gebler, J., Kadlec, P., 2013. Beet molasses – desugarization, composition, properties and application possibilities. Sugar Industry 138, 105-114.
Schober, T.J., Bean, S.R., Boyle, D.L., 2007. Gluten-free sorghum bread improved by sourdough fermentation: Biochemical, rheological, and microstructural background. J. Agric. Food Chem. 55, 5137-5146.
Schwab, C., Mastrangelo, M., Corsetti, A., Gänzle, M., 2008. Formation of oligosaccharides and polysaccharides by Lactobacillus reuteri LTH5448 and Weissella cibaria 10M in sorghum sourdoughs. Cereal Chem. 85, 679-684.
Schweiger, P., Volland, S., Deppenmeier, U., 2007. Overproduction and characterization of two distinct aldehyde-oxidizing enzymes from Gluconobacter oxydans 621H. J. Mol. Microbiol. Biotechnol. 13, 147-155.
Sciarini, L.S., Ribotta, P.D., León, A.E., Pérez, G.T., 2010. Effect of hydrocolloids on gluten-free batter properties and bread quality. Int. J. Food Sci. Tech. 45, 2306-2312.
Sengun, I.Y., Karabiyikli, S., 2011. Importance of acetic acid bacteria in food industry. Food Control 22, 647-656.
Sievers, M., Swings, J., 2005. Family Acetobacteraceae, in: Garrity, G.M. (Ed.), Bergey's manual of systematic bacteriology, 2nd ed. Springer, New York, pp. 41-95.
Silbir, S., Dagbagli, S., Yegin, S., Baysal, T., Goksungur, Y., 2014. Levan production by Zymomonas mobilis in batch and continuous fermentation systems. Carbohydr. Polym. 99, 454-461.
Simms, P.J., Boyko, W.J., Edwards, J.R., 1990. The structural analysis of a levan produced by Streptococcus salivarius SS2. Carbohydr. Res. 208, 193-198.
References
117
Simurina, O.D., Ikonic, B.B., Jevtic−Mucibabic, R.C., Belovic, M.M., Koprivica, G.B., Misljenovic, N.M., 2012. Application of reponse surface methodology in the development of specialty bread with sugar beet molasses, flax seed and vital wheat gluten. Food and Feed Research 39, 11-21.
Snyder, R.W., Ruhe, J., Kobrin, S., Wasserstein, A., Doline, C., Nachamkin, I., Lipschutz, J.H., 2004. Asaia bogorensis peritonitis identified by 16S ribosomal RNA sequence analysis in a patient receiving peritoneal dialysis. Am. J. Kidney Dis. 44, e15-e17.
Spicher, G., 1987. The microflora of sourdough - XXII. Communication: The lactobacillus species of wheat sourdough. Z. Lebensm.-Unters. Forsch. 184, 300-303.
Srikanth, R., Reddy, C.H.S.S.S., Siddartha, G., Ramaiah, M.J., Uppuluri, K.B., 2015. Review on production, characterization and applications of microbial levan. Carbohydr. Polym. 120, 102-114.
Stolz, P., Böcker, G., Hammes, W.P., Vogel, R.F., 1995. Utilization of electron acceptors by lactobacilli isolated from sourdough - I. Lactobacillus sanfrancisco. Z. Lebensm.-Unters. Forsch. 201, 91-96.
Suzuki, T., Morishita, T., Mukasa, Y., Takigawa, S., Yokota, S., Ishiguro, K., Noda, T., 2015. Breeding of ‘Manten-Kirari’, a non-bitter and trace-rutinosidase variety of tartary buckwheat (Fagopyrum tataricum Gaertn.). Breed. Sci. 64, 344-350.
Taherzadeh, M.J., Niklasson, C., Lidén, G., 1997. Acetic acid-friend or foe in anaerobic batch conversion of glucose to ethanol by Saccharomyces cerevisiae? Chem. Eng. Sci. 52, 2653-2659.
Tanaka, T., Oi, S., Iizuka, M., Yamamoto, T., 1978. Levansucrase of Bacillus subtilis. Agric. Biol. Chem. 42, 323-326.
Thompson, T., 2000. Folate, iron, and dietary fiber contents of the gluten-free diet. J. Am. Diet. Assoc. 100, 1389-1396.
Tieking, M., Ehrmann, M., Vogel, R., Gänzle, M., 2005. Molecular and functional characterization of a levansucrase from the sourdough isolate Lactobacillus sanfranciscensis TMW 1.392. Appl. Microbiol. Biotechnol. 66, 655-663.
Tieking, M., Gänzle, M.G., 2005. Exopolysaccharides from cereal-associated lactobacilli. Trends Food Sci. Technol. 16, 79-84.
Tieking, M., Korakli, M., Ehrmann, M.A., Ganzle, M.G., Vogel, R.F., 2003. In situ production of exopolysaccharides during sourdough fermentation by cereal and intestinal isolates of lactic acid bacteria. Appl. Environ. Microbiol. 69, 945-952.
Torbica, A., Hadnađev, M., Dapčević, T., 2010. Rheological, textural and sensory properties of gluten-free bread formulations based on rice and buckwheat flour. Food Hydrocolloids 24, 626-632.
Torino, M., Font de Valdez, G., Mozzi, F., 2015. Biopolymers from lactic acid bacteria. Novel applications in foods and beverages. Front. Microbiol. 6.
References
118
Tuuminen, T., Heinäsmäki, T., Kerttula, T., 2006. First report of bacteremia by Asaia bogorensis, in a patient with a history of intravenous-drug abuse. J. Clin. Microbiol. 44, 3048-3050.
Ua-Arak, T., Jakob, F., Vogel, R.F., 2016. Characterization of growth and exopolysaccharide production of selected acetic acid bacteria in buckwheat sourdoughs. Int. J. Food Microbiol. 239, 103-112.
Varela, P., Fiszman, S.M., 2013. Exploring consumers' knowledge and perceptions of hydrocolloids used as food additives and ingredients. Food Hydrocolloids 30, 477-484.
Vedyashkina, T.A., Revin, V.V., Gogotov, I.N., 2005. Optimizing the conditions of dextran synthesis by the bacterium Leuconostoc mesenteroides grown in a molasses-containing medium. Appl. Biochem. Microbiol. 41, 361-364.
Velazquez-Hernandez, M.L., Baizabal-Aguirre, V.M., Cruz-Vazquez, F., Trejo-Contreras, M.J., Fuentes-Ramirez, L.E., Bravo-Patino, A., Cajero-Juarez, M., Chavez-Moctezuma, M.P., Valdez-Alarcon, J.J., 2011. Gluconacetobacter diazotrophicus levansucrase is involved in tolerance to NaCl, sucrose and desiccation, and in biofilm formation. Arch. Microbiol. 193, 137-149.
Vigants, A., Upite, D., Scherbaka, R., Lukjanenko, J., Ionina, R., 2013. An influence of ethanol and temperature on products formation by different preparations of Zymomonas mobilis extracellular levansucrase. Folia Microbiol. 58, 75-80.
Vincent, S., Brandt, M., Cavadini, C., Hammes, W.P., Neeser, J.R., Waldbuesser, S., 2005. Levan-producing Lactobacillus strain and method of preparing human or pet food products using the same. US Patent, US6932991.
Vogel, R.F., Bocker, G., Stolz, P., Ehrmann, M., Fanta, D., Ludwig, W., Pot, B., Kersters, K., Schleifer, K.H., Hammes, W.P., 1994. Identification of lactobacilli from sourdough and description of Lactobacillus pontis sp. nov. Int. J. Syst. Bacteriol. 44, 223-229.
Waldherr, F., Meissner, D., Vogel, R., 2008. Genetic and functional characterization of Lactobacillus panis levansucrase. Arch. Microbiol. 190, 497-505.
Wang, S., Copeland, L., 2013. Molecular disassembly of starch granules during gelatinization and its effect on starch digestibility: A review. Food and Function 4, 1564-1580.
Wang, S., Li, C., Copeland, L., Niu, Q., Wang, S., 2015. Starch Retrogradation: A Comprehensive Review. Comp. Rev. Food Sci. Food Safety 14, 568-585.
Wolter, A., Hager, A.S., Zannini, E., Czerny, M., Arendt, E.K., 2014a. Impact of sourdough fermented with Lactobacillus plantarum FST 1.7 on baking and sensory properties of gluten-free breads. Eur. Food Res. Technol., 1-12.
Wolter, A., Hager, A.S., Zannini, E., Czerny, M., Arendt, E.K., 2014b. Influence of dextran-producing Weissella cibaria on baking properties and sensory profile of gluten-free and wheat breads. Int. J. Food Microbiol. 172, 83-91.
References
119
Wolter, A., Hager, A.S., Zannini, E., Galle, S., Ganzle, M.G., Waters, D.M., Arendt, E.K., 2014c. Evaluation of exopolysaccharide producing Weissella cibaria MG1 strain for the production of sourdough from various flours. Food Microbiol. 37, 44-50.
Wu, F.C., Chou, S.Z., Shih, I.L., 2013. Factors affecting the production and molecular weight of levan of Bacillus subtilis natto in batch and fed-batch culture in fermenter. J. Taiwan Inst. Chem. Eng. 44, 846-853.
Wu, J.J., Ma, Y.K., Zhang, F.F., Chen, F.S., 2012. Biodiversity of yeasts, lactic acid bacteria and acetic acid bacteria in the fermentation of "Shanxi aged vinegar", a traditional chinese vinegar. Food Microbiol. 30, 289-297.
Yamada, Y., 2016. Systematics of acetic acid bacteria, in: Matsushita, K., Toyama, H., Tonouchi, N., Okamoto-Kainuma, A. (Eds.), Acetic acid bacteria: ecology and physiology. Springer Japan, Tokyo, pp. 1-50.
Yanase, H., Fukushi, H., Ueda, N., Maeda, Y., Toyoda, A., Tonomura, K., 1991. Cloning, sequencing, and characterization of the intracellular invertase gene from Zymomonas mobilis. Agric. Biol. Chem. 55, 1383-1390.
Yanase, H., Iwata, M., Nakahigashi, R., Kita, K., Kato, N., Tonomura, K., Iwata, M., Nakahigashi, R., Tonomura, K., 1992. Purification, crystallization, and properties of the extracellular levansucrase from Zymomonas mobilis. Biosci. Biotechnol. Biochem. 56, 1335-1337.
Yukphan, P., Malimas, T., Potacharoen, W., Tanasupawat, S., Tanticharoen, M., Yamada, Y., 2005. Neoasaia chiangmaiensis gen. nov., sp. nov., a novel osmotolerant acetic acid bacterium in the a-Proteobacteria. J. Gen. Appl. Microbiol. 51, 301-311.
Zannini, E., Jones, J.M., Renzetti, S., Arendt, E.K., 2012. Functional replacements for gluten. Annu Rev Food Sci Technol 3, 227-245.
Zhang, T., Li, R., Qian, H., Mu, W., Miao, M., Jiang, B., 2014. Biosynthesis of levan by levansucrase from Bacillus methylotrophicus SK 21.002. Carbohydr. Polym. 101, 975-981.

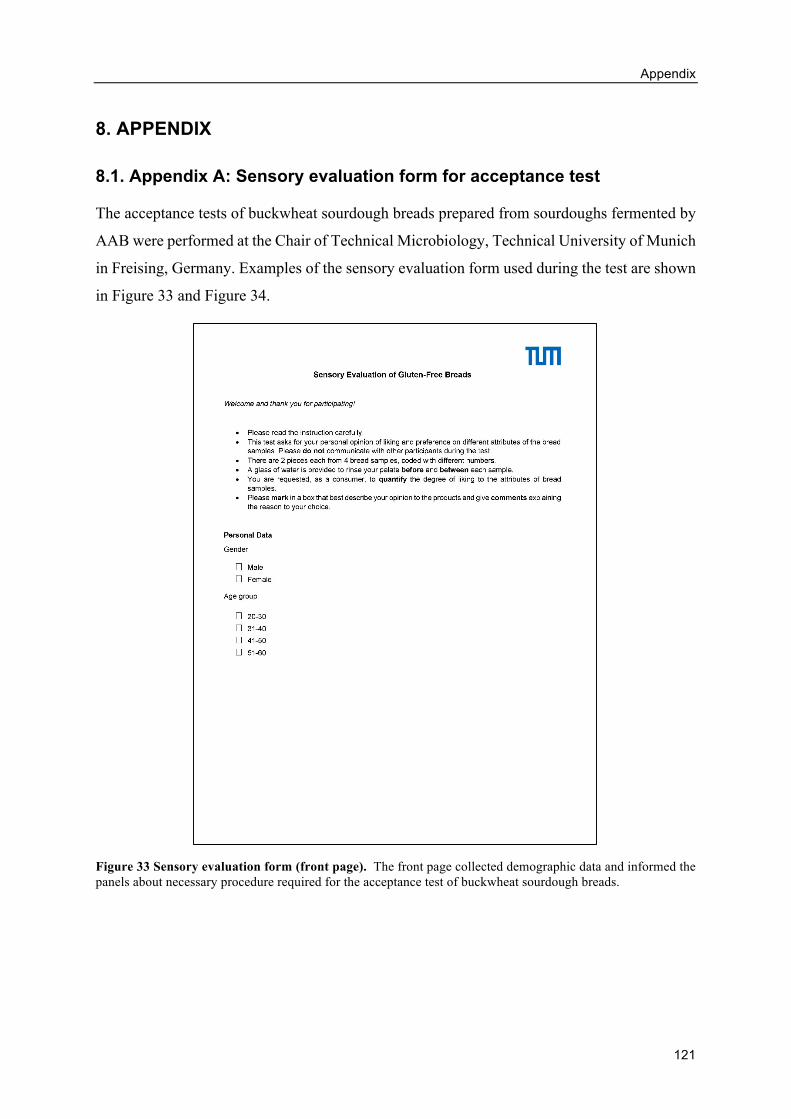
Appendix
121
8. APPENDIX
8.1. Appendix A: Sensory evaluation form for acceptance test
The acceptance tests of buckwheat sourdough breads prepared from sourdoughs fermented by
AAB were performed at the Chair of Technical Microbiology, Technical University of Munich
in Freising, Germany. Examples of the sensory evaluation form used during the test are shown
in Figure 33 and Figure 34.
Figure 33 Sensory evaluation form (front page). The front page collected demographic data and informed the panels about necessary procedure required for the acceptance test of buckwheat sourdough breads.
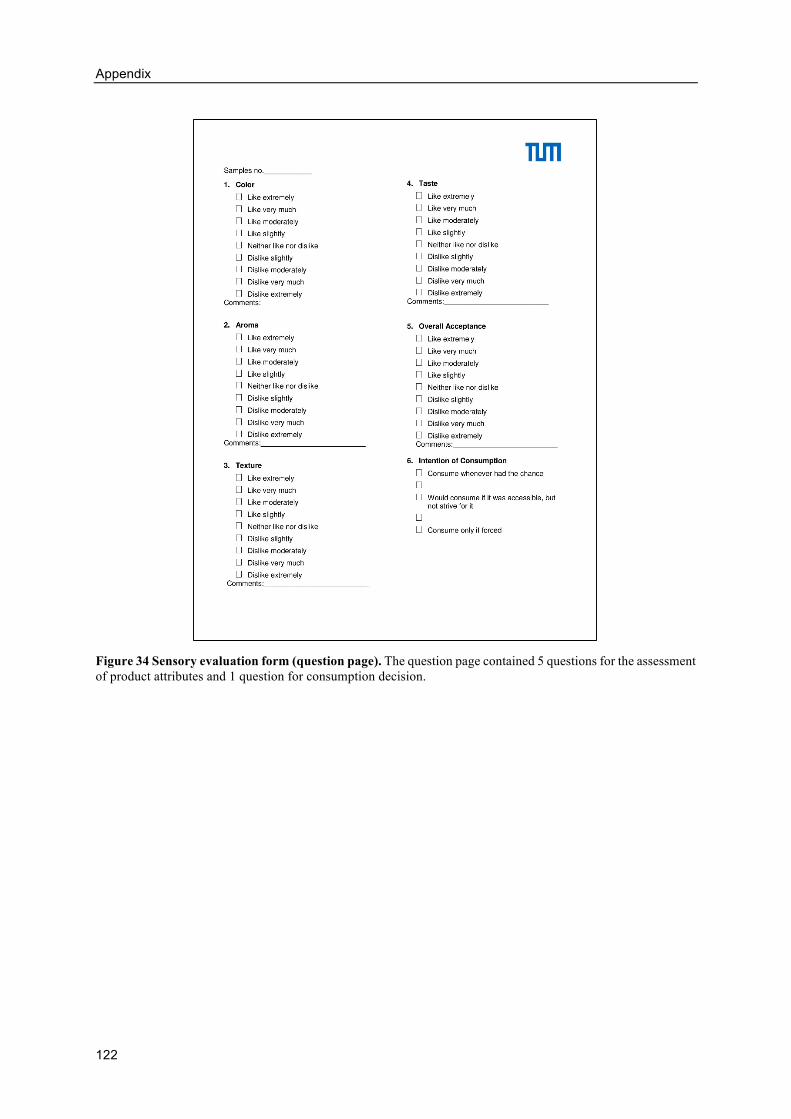
Appendix
122
Figure 34 Sensory evaluation form (question page). The question page contained 5 questions for the assessment of product attributes and 1 question for consumption decision.
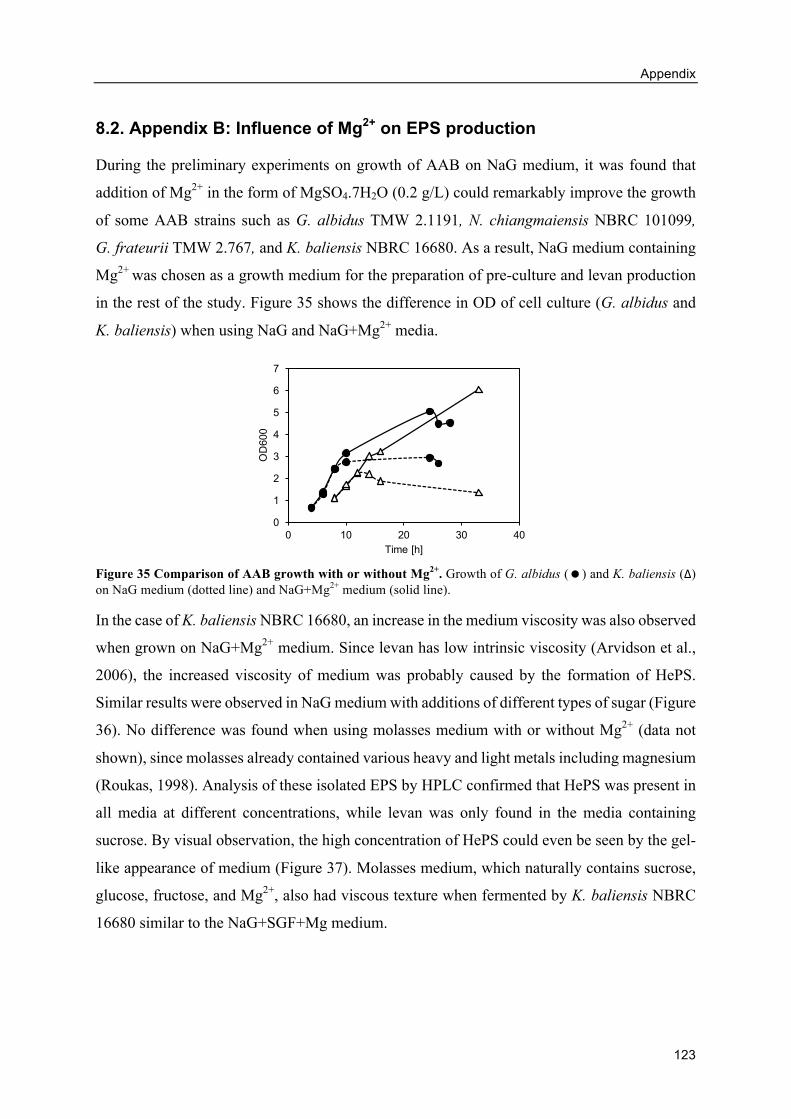
Appendix
123
8.2. Appendix B: Influence of Mg2+ on EPS production
During the preliminary experiments on growth of AAB on NaG medium, it was found that
addition of Mg2+ in the form of MgSO4.7H2O (0.2 g/L) could remarkably improve the growth
of some AAB strains such as G. albidus TMW 2.1191, N. chiangmaiensis NBRC 101099,
G. frateurii TMW 2.767, and K. baliensis NBRC 16680. As a result, NaG medium containing
Mg2+ was chosen as a growth medium for the preparation of pre-culture and levan production
in the rest of the study. Figure 35 shows the difference in OD of cell culture (G. albidus and
K. baliensis) when using NaG and NaG+Mg2+ media.
Figure 35 Comparison of AAB growth with or without Mg2+. Growth of G. albidus (=) and K. baliensis (∆) on NaG medium (dotted line) and NaG+Mg2+ medium (solid line).
In the case of K. baliensis NBRC 16680, an increase in the medium viscosity was also observed
when grown on NaG+Mg2+ medium. Since levan has low intrinsic viscosity (Arvidson et al.,
2006), the increased viscosity of medium was probably caused by the formation of HePS.
Similar results were observed in NaG medium with additions of different types of sugar (Figure
36). No difference was found when using molasses medium with or without Mg2+ (data not
shown), since molasses already contained various heavy and light metals including magnesium
(Roukas, 1998). Analysis of these isolated EPS by HPLC confirmed that HePS was present in
all media at different concentrations, while levan was only found in the media containing
sucrose. By visual observation, the high concentration of HePS could even be seen by the gel-
like appearance of medium (Figure 37). Molasses medium, which naturally contains sucrose,
glucose, fructose, and Mg2+, also had viscous texture when fermented by K. baliensis NBRC
16680 similar to the NaG+SGF+Mg medium.
0
1
2
3
4
5
6
7
0 10 20 30 40
OD
600
Time [h]
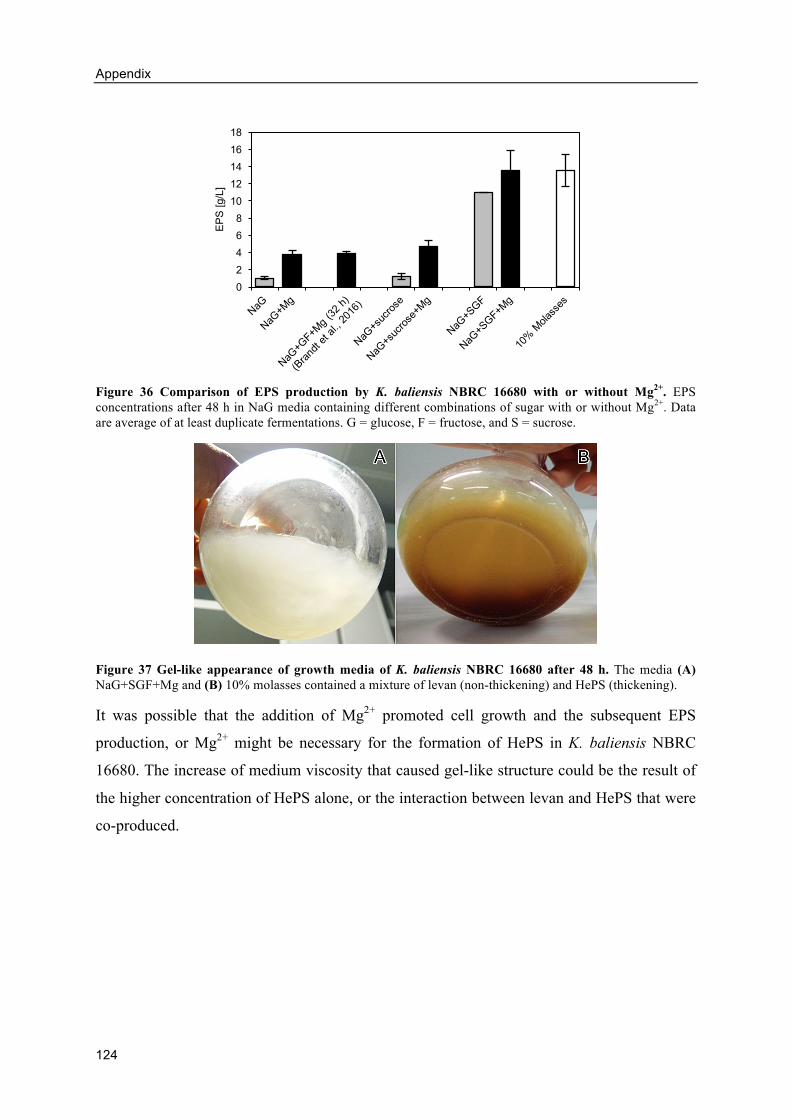
Appendix
124
Figure 36 Comparison of EPS production by K. baliensis NBRC 16680 with or without Mg2+. EPS concentrations after 48 h in NaG media containing different combinations of sugar with or without Mg2+. Data are average of at least duplicate fermentations. G = glucose, F = fructose, and S = sucrose.
Figure 37 Gel-like appearance of growth media of K. baliensis NBRC 16680 after 48 h. The media (A) NaG+SGF+Mg and (B) 10% molasses contained a mixture of levan (non-thickening) and HePS (thickening).
It was possible that the addition of Mg2+ promoted cell growth and the subsequent EPS
production, or Mg2+ might be necessary for the formation of HePS in K. baliensis NBRC
16680. The increase of medium viscosity that caused gel-like structure could be the result of
the higher concentration of HePS alone, or the interaction between levan and HePS that were
co-produced.
02468
1012141618
EPS
[g/L
]
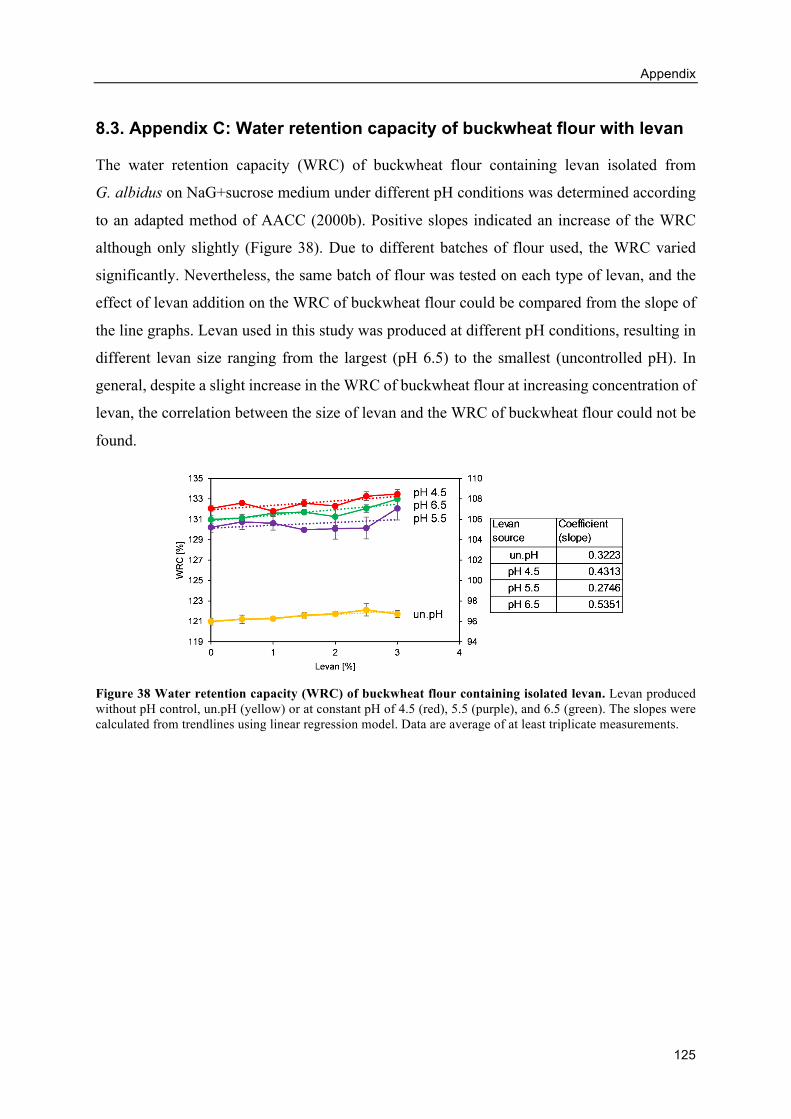
Appendix
125
8.3. Appendix C: Water retention capacity of buckwheat flour with levan
The water retention capacity (WRC) of buckwheat flour containing levan isolated from
G. albidus on NaG+sucrose medium under different pH conditions was determined according
to an adapted method of AACC (2000b). Positive slopes indicated an increase of the WRC
although only slightly (Figure 38). Due to different batches of flour used, the WRC varied
significantly. Nevertheless, the same batch of flour was tested on each type of levan, and the
effect of levan addition on the WRC of buckwheat flour could be compared from the slope of
the line graphs. Levan used in this study was produced at different pH conditions, resulting in
different levan size ranging from the largest (pH 6.5) to the smallest (uncontrolled pH). In
general, despite a slight increase in the WRC of buckwheat flour at increasing concentration of
levan, the correlation between the size of levan and the WRC of buckwheat flour could not be
found.
Figure 38 Water retention capacity (WRC) of buckwheat flour containing isolated levan. Levan produced without pH control, un.pH (yellow) or at constant pH of 4.5 (red), 5.5 (purple), and 6.5 (green). The slopes were calculated from trendlines using linear regression model. Data are average of at least triplicate measurements.
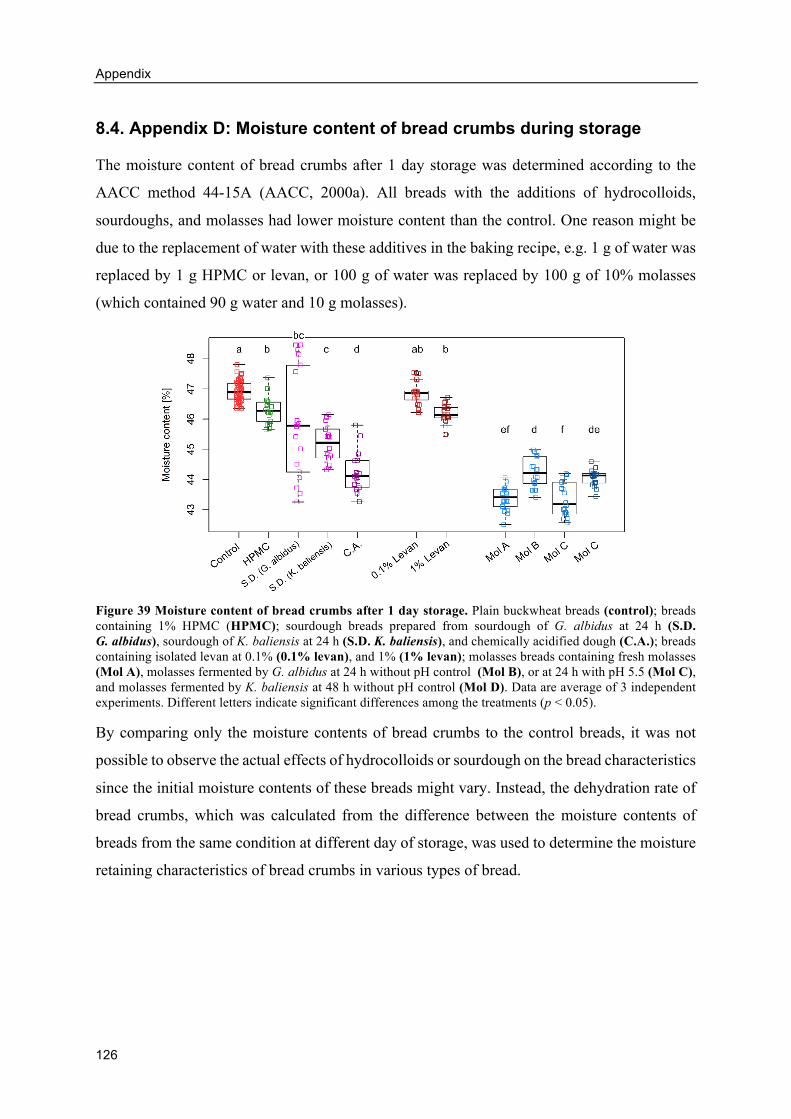
Appendix
126
8.4. Appendix D: Moisture content of bread crumbs during storage
The moisture content of bread crumbs after 1 day storage was determined according to the
AACC method 44-15A (AACC, 2000a). All breads with the additions of hydrocolloids,
sourdoughs, and molasses had lower moisture content than the control. One reason might be
due to the replacement of water with these additives in the baking recipe, e.g. 1 g of water was
replaced by 1 g HPMC or levan, or 100 g of water was replaced by 100 g of 10% molasses
(which contained 90 g water and 10 g molasses).
Figure 39 Moisture content of bread crumbs after 1 day storage. Plain buckwheat breads (control); breads containing 1% HPMC (HPMC); sourdough breads prepared from sourdough of G. albidus at 24 h (S.D. G. albidus), sourdough of K. baliensis at 24 h (S.D. K. baliensis), and chemically acidified dough (C.A.); breads containing isolated levan at 0.1% (0.1% levan), and 1% (1% levan); molasses breads containing fresh molasses (Mol A), molasses fermented by G. albidus at 24 h without pH control (Mol B), or at 24 h with pH 5.5 (Mol C), and molasses fermented by K. baliensis at 48 h without pH control (Mol D). Data are average of 3 independent experiments. Different letters indicate significant differences among the treatments (p < 0.05).
By comparing only the moisture contents of bread crumbs to the control breads, it was not
possible to observe the actual effects of hydrocolloids or sourdough on the bread characteristics
since the initial moisture contents of these breads might vary. Instead, the dehydration rate of
bread crumbs, which was calculated from the difference between the moisture contents of
breads from the same condition at different day of storage, was used to determine the moisture
retaining characteristics of bread crumbs in various types of bread.
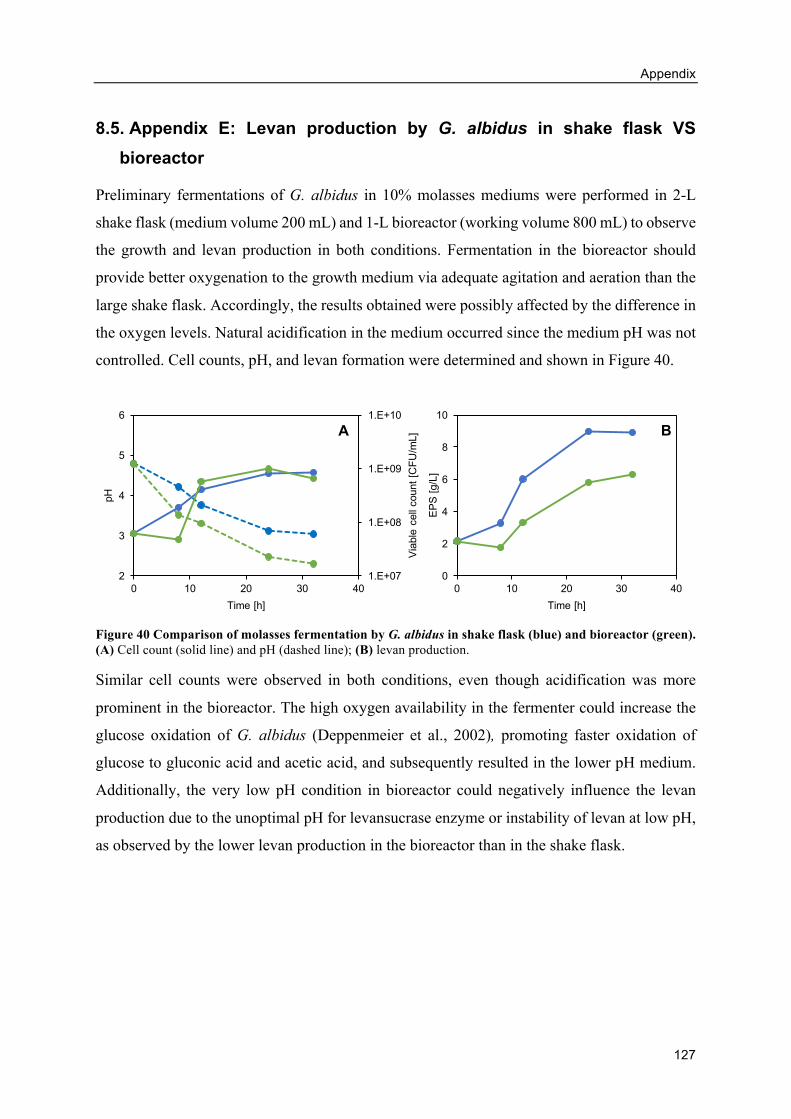
Appendix
127
8.5. Appendix E: Levan production by G. albidus in shake flask VS
bioreactor
Preliminary fermentations of G. albidus in 10% molasses mediums were performed in 2-L
shake flask (medium volume 200 mL) and 1-L bioreactor (working volume 800 mL) to observe
the growth and levan production in both conditions. Fermentation in the bioreactor should
provide better oxygenation to the growth medium via adequate agitation and aeration than the
large shake flask. Accordingly, the results obtained were possibly affected by the difference in
the oxygen levels. Natural acidification in the medium occurred since the medium pH was not
controlled. Cell counts, pH, and levan formation were determined and shown in Figure 40.
Figure 40 Comparison of molasses fermentation by G. albidus in shake flask (blue) and bioreactor (green). (A) Cell count (solid line) and pH (dashed line); (B) levan production.
Similar cell counts were observed in both conditions, even though acidification was more
prominent in the bioreactor. The high oxygen availability in the fermenter could increase the
glucose oxidation of G. albidus (Deppenmeier et al., 2002), promoting faster oxidation of
glucose to gluconic acid and acetic acid, and subsequently resulted in the lower pH medium.
Additionally, the very low pH condition in bioreactor could negatively influence the levan
production due to the unoptimal pH for levansucrase enzyme or instability of levan at low pH,
as observed by the lower levan production in the bioreactor than in the shake flask.
1.E+07
1.E+08
1.E+09
1.E+10
2
3
4
5
6
0 10 20 30 40
Viab
le c
ell c
ount
[CFU
/mL]
pH
Time [h]
A
0
2
4
6
8
10
0 10 20 30 40
EPS
[g/L
]
Time [h]
B
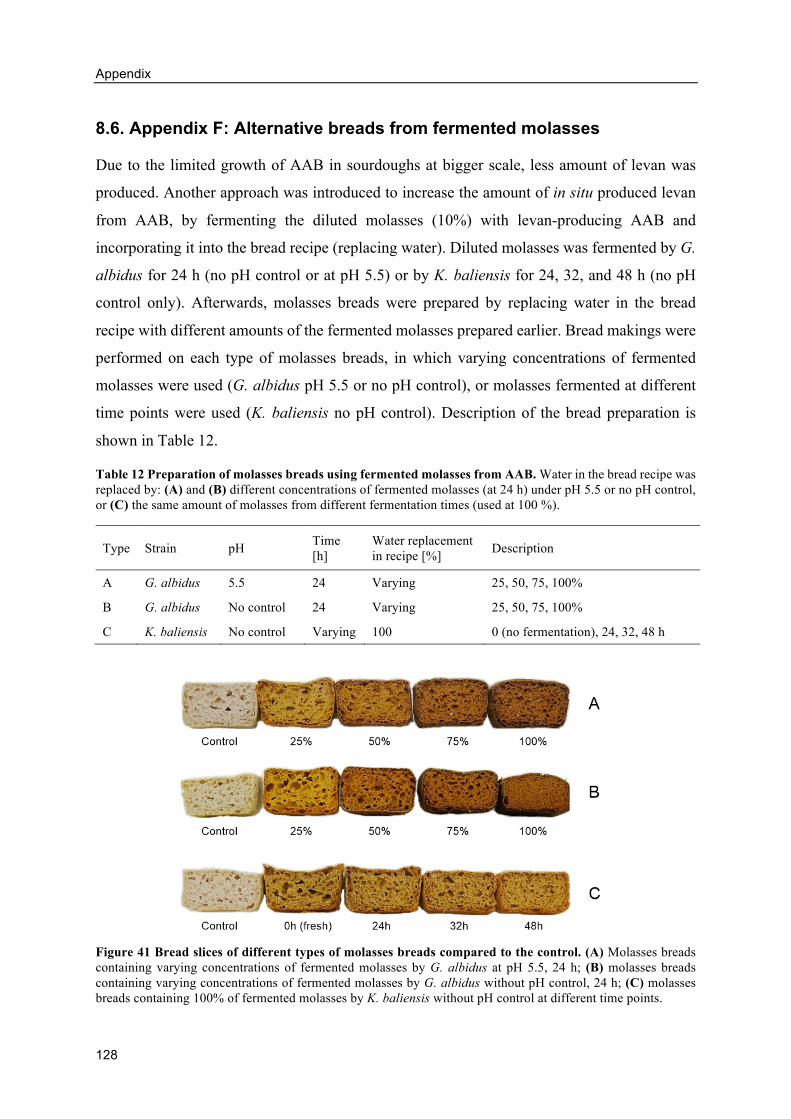
Appendix
128
8.6. Appendix F: Alternative breads from fermented molasses
Due to the limited growth of AAB in sourdoughs at bigger scale, less amount of levan was
produced. Another approach was introduced to increase the amount of in situ produced levan
from AAB, by fermenting the diluted molasses (10%) with levan-producing AAB and
incorporating it into the bread recipe (replacing water). Diluted molasses was fermented by G.
albidus for 24 h (no pH control or at pH 5.5) or by K. baliensis for 24, 32, and 48 h (no pH
control only). Afterwards, molasses breads were prepared by replacing water in the bread
recipe with different amounts of the fermented molasses prepared earlier. Bread makings were
performed on each type of molasses breads, in which varying concentrations of fermented
molasses were used (G. albidus pH 5.5 or no pH control), or molasses fermented at different
time points were used (K. baliensis no pH control). Description of the bread preparation is
shown in Table 12.
Table 12 Preparation of molasses breads using fermented molasses from AAB. Water in the bread recipe was replaced by: (A) and (B) different concentrations of fermented molasses (at 24 h) under pH 5.5 or no pH control, or (C) the same amount of molasses from different fermentation times (used at 100 %).
Type Strain pH Time [h]
Water replacement in recipe [%] Description
A G. albidus 5.5 24 Varying 25, 50, 75, 100%
B G. albidus No control 24 Varying 25, 50, 75, 100%
C K. baliensis No control Varying 100 0 (no fermentation), 24, 32, 48 h
Figure 41 Bread slices of different types of molasses breads compared to the control. (A) Molasses breads containing varying concentrations of fermented molasses by G. albidus at pH 5.5, 24 h; (B) molasses breads containing varying concentrations of fermented molasses by G. albidus without pH control, 24 h; (C) molasses breads containing 100% of fermented molasses by K. baliensis without pH control at different time points.
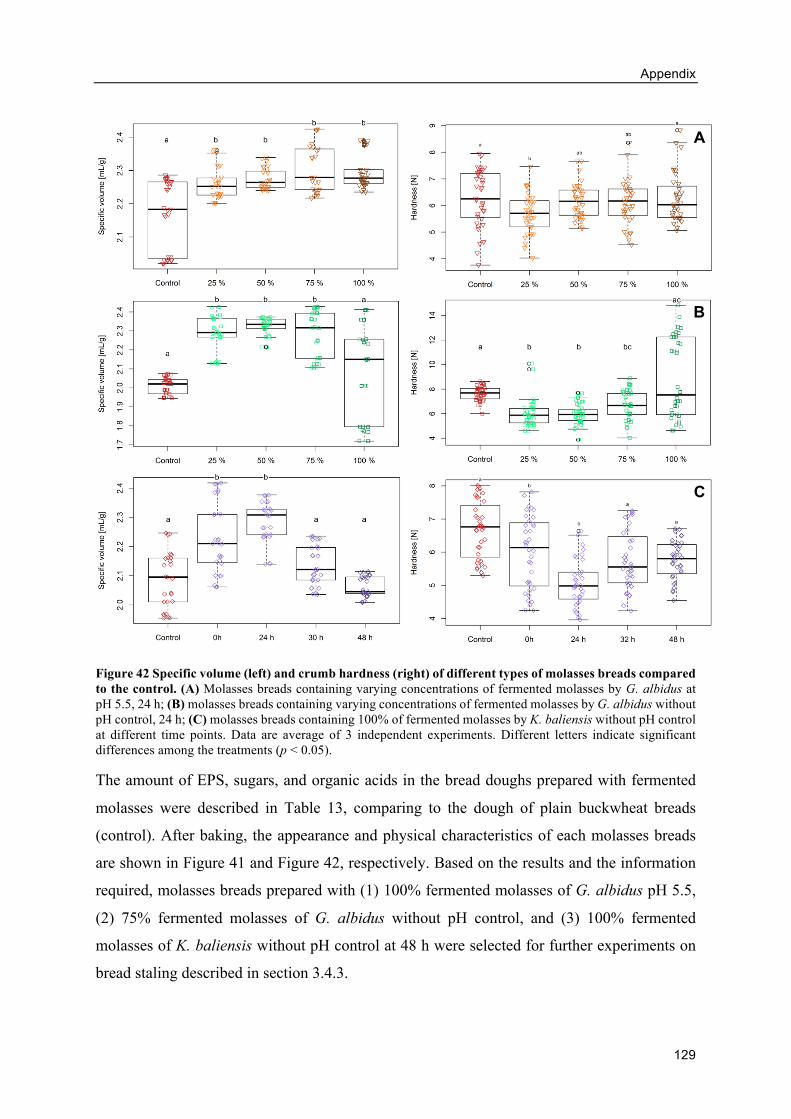
Appendix
129
Figure 42 Specific volume (left) and crumb hardness (right) of different types of molasses breads compared to the control. (A) Molasses breads containing varying concentrations of fermented molasses by G. albidus at pH 5.5, 24 h; (B) molasses breads containing varying concentrations of fermented molasses by G. albidus without pH control, 24 h; (C) molasses breads containing 100% of fermented molasses by K. baliensis without pH control at different time points. Data are average of 3 independent experiments. Different letters indicate significant differences among the treatments (p < 0.05).
The amount of EPS, sugars, and organic acids in the bread doughs prepared with fermented
molasses were described in Table 13, comparing to the dough of plain buckwheat breads
(control). After baking, the appearance and physical characteristics of each molasses breads
are shown in Figure 41 and Figure 42, respectively. Based on the results and the information
required, molasses breads prepared with (1) 100% fermented molasses of G. albidus pH 5.5,
(2) 75% fermented molasses of G. albidus without pH control, and (3) 100% fermented
molasses of K. baliensis without pH control at 48 h were selected for further experiments on
bread staling described in section 3.4.3.
A
B
C
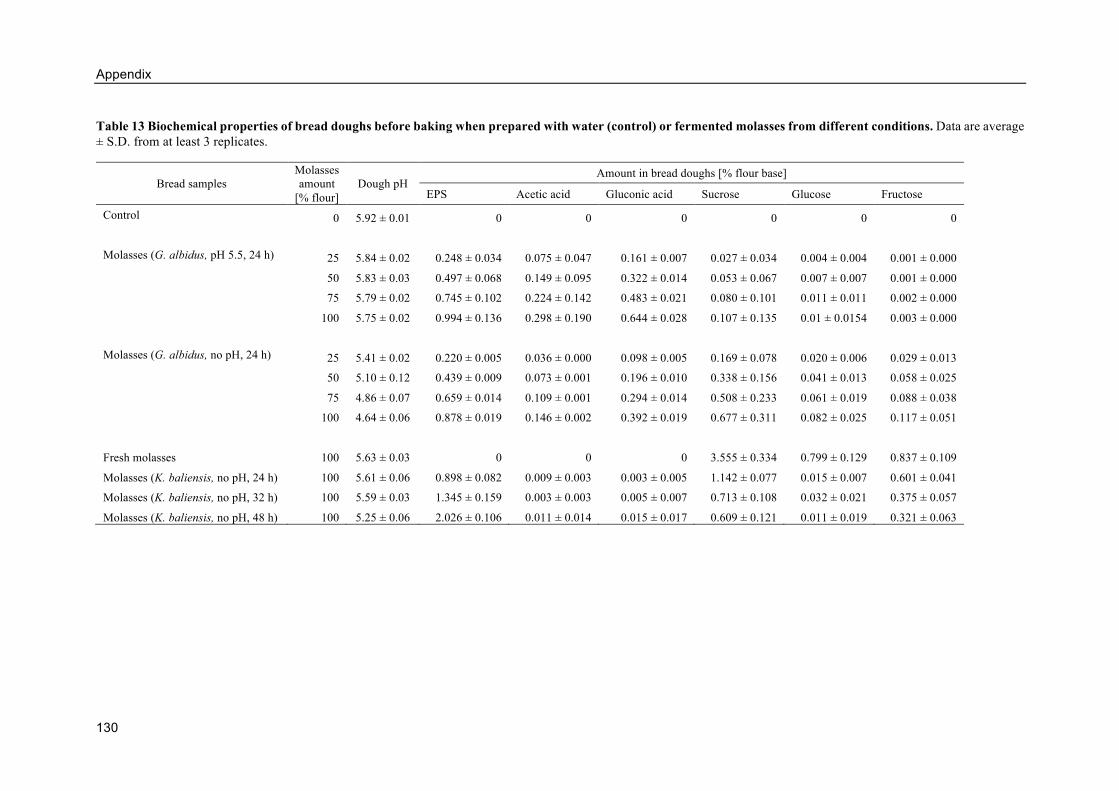
Appendix
130
Table 13 Biochemical properties of bread doughs before baking when prepared with water (control) or fermented molasses from different conditions. Data are average ± S.D. from at least 3 replicates.
Bread samples Molasses amount
[% flour] Dough pH
Amount in bread doughs [% flour base]
EPS Acetic acid Gluconic acid Sucrose Glucose Fructose
Control 0 5.92 ± 0.01 0 0 0 0 0 0
Molasses (G. albidus, pH 5.5, 24 h) 25 5.84 ± 0.02 0.248 ± 0.034 0.075 ± 0.047 0.161 ± 0.007 0.027 ± 0.034 0.004 ± 0.004 0.001 ± 0.000 50 5.83 ± 0.03 0.497 ± 0.068 0.149 ± 0.095 0.322 ± 0.014 0.053 ± 0.067 0.007 ± 0.007 0.001 ± 0.000 75 5.79 ± 0.02 0.745 ± 0.102 0.224 ± 0.142 0.483 ± 0.021 0.080 ± 0.101 0.011 ± 0.011 0.002 ± 0.000 100 5.75 ± 0.02 0.994 ± 0.136 0.298 ± 0.190 0.644 ± 0.028 0.107 ± 0.135 0.01 ± 0.0154 0.003 ± 0.000
Molasses (G. albidus, no pH, 24 h) 25 5.41 ± 0.02 0.220 ± 0.005 0.036 ± 0.000 0.098 ± 0.005 0.169 ± 0.078 0.020 ± 0.006 0.029 ± 0.013
50 5.10 ± 0.12 0.439 ± 0.009 0.073 ± 0.001 0.196 ± 0.010 0.338 ± 0.156 0.041 ± 0.013 0.058 ± 0.025
75 4.86 ± 0.07 0.659 ± 0.014 0.109 ± 0.001 0.294 ± 0.014 0.508 ± 0.233 0.061 ± 0.019 0.088 ± 0.038
100 4.64 ± 0.06 0.878 ± 0.019 0.146 ± 0.002 0.392 ± 0.019 0.677 ± 0.311 0.082 ± 0.025 0.117 ± 0.051
Fresh molasses 100 5.63 ± 0.03 0 0 0 3.555 ± 0.334 0.799 ± 0.129 0.837 ± 0.109
Molasses (K. baliensis, no pH, 24 h) 100 5.61 ± 0.06 0.898 ± 0.082 0.009 ± 0.003 0.003 ± 0.005 1.142 ± 0.077 0.015 ± 0.007 0.601 ± 0.041
Molasses (K. baliensis, no pH, 32 h) 100 5.59 ± 0.03 1.345 ± 0.159 0.003 ± 0.003 0.005 ± 0.007 0.713 ± 0.108 0.032 ± 0.021 0.375 ± 0.057
Molasses (K. baliensis, no pH, 48 h) 100 5.25 ± 0.06 2.026 ± 0.106 0.011 ± 0.014 0.015 ± 0.017 0.609 ± 0.121 0.011 ± 0.019 0.321 ± 0.063
List of publications
131
9. List of publications derived from this work
Peer-reviewed journals
Ua-Arak T., Jakob F., and Vogel R.F. (2017) Fermentation pH modulates the size
distributions and functional properties of Gluconobacter albidus TMW 2.1191 levan.
Frontiers in Microbiology. Vol 8, Issue 807. doi: 10.3389/fmicb.2017.00807
Ua-Arak T., Jakob F., and Vogel R.F. (2017) Influence of levan-producing acetic acid
bacteria on buckwheat-sourdough breads. Food Microbiology. Vol 65, pp. 95-104. doi:
10.1016/j.fm.2017.02.002
Ua-Arak T., Jakob F., and Vogel R.F. (2016) Characterization of growth and
exopolysaccharide production of selected acetic acid bacteria in buckwheat
sourdoughs. International Journal of Food Microbiology, Vol 239, pp. 103-112. doi:
10.1016/j.ijfoodmicro.2016.04.009
Oral presentation
Ua-Arak T., Jakob F. and Vogel R. F., (2015) Growth and exopolysaccharide
production of acetic acid bacteria in buckwheat molasses dough for gluten-free baking,
6th Sourdough and Cereal Fermentation Symposium, Nantes, France.
Poster presentations
Ua-Arak T., Jakob F. and Vogel R. F., (2016) Influence of levan-producing acetic acid
bacteria on the buckwheat sourdoughs and the sensory of sourdough breads, 25th
International ICFMH Conference 2016 (FoodMicro2016), Dublin, Ireland.
Ua-Arak T., Jakob F. and Vogel R. F., (2016) Instrumental and sensory evaluation of
gluten-free sourdough breads using acetic acid bacteria, 5. Frühjahrstagung des
Weihenstaphaner Instituts für Getreideforschung (WIG), Freising, Germany.
Oral presentations (co-author, speaker is underlined)
Ua-Arak T., Jakob F. and Vogel R. F., (2017) Enzymatic and fermentative tailoring of
fructose polymers using the food-grade acetic acid bacterium Gluconobacter albidus
TMW 2.1191, The University of Queensland-Technische Universität München -
Research Symposium on Biotechnology for Food & Chemicals, Freising, Germany.

Curriculum Vitae
133
10. Curriculum Vitae
Contact details
Name: Tharalinee Osen (née Ua-Arak) Address: Fischergasse 5, 85354 Freising
Date of birth: 27.11.1983 Place of birth: Bangkok, Thailand
Education
08/2013 - Present Doctorate in Natural Sciences (Dr. rer. nat.)
Lehrstuhl für Technische Mikrobiologie, Technical University of Munich (TUM), Freising
• Thesis: “Evaluation of levan-producing acetic acid bacteria for their potential in gluten-free baking applications”
10/2008 – 02/2011 Master of Science (M.Sc.)
Institute of Technical Microbiology, Hamburg University of Technology (TUHH), Hamburg
• Thesis: “Heterologous expression and characterization of metagenomic glycosyl hydrolases from marine subsurface sediments”
06/2002 – 03/2006 Bachelor of Science (B.Sc.)
Department of Agro-Industry, School of Biotechnology, Assumption University, Bangkok, Thailand
• Thesis: “The study of antibacterial compound production of Monascus purpureus using cassava as a carbon source”
05/1999 – 03/2002 High school diploma
Science-Mathematics program, Saint Joseph Convent School, Bangkok, Thailand