Embed Size (px)
Citation preview
Atmos. Chem. Phys., 15, 14005–14030, 2015
www.atmos-chem-phys.net/15/14005/2015/
doi:10.5194/acp-15-14005-2015
© Author(s) 2015. CC Attribution 3.0 License.
Evaluation of the MACC operational forecast system – potential and
challenges of global near-real-time modelling with respect to
reactive gases in the troposphere
A. Wagner1, A.-M. Blechschmidt2, I. Bouarar3,a, E.-G. Brunke4, C. Clerbaux3, M. Cupeiro5, P. Cristofanelli6,
H. Eskes7, J. Flemming8, H. Flentje1, M. George3, S. Gilge1, A. Hilboll2, A. Inness8, J. Kapsomenakis9, A. Richter2,
L. Ries10, W. Spangl11, O. Stein12, R. Weller13, and C. Zerefos9
1Deutscher Wetterdienst, Meteorologisches Observatorium Hohenpeissenberg, Hohenpeissenberg, Germany2Institute of Environmental Physics, University of Bremen, Bremen, Germany3Sorbonne Universités, UPMC Univ. Paris 06, Université Versailles St-Quentin, CNRS/INSU, LATMOS-IPSL,
Paris, France4South African Weather Service, Stellenbosch, South Africa5National Meteorological Service, Ushuaia, Tierra del Fuego, Argentina6National Research Council of Italy, ISAC, Bologna, Italy7Royal Netherlands Meteorological Institute, De Bilt, the Netherlands8European Centre for Medium-range Weather Forecasts, Reading, UK9Academy of Athens, Research Centre for Atmospheric Physics and Climatology, Athens, Greece10Federal Environment Agency, GAW Global Station Zugspitze/Hohenpeissenberg, Zugspitze 5,
82475 Zugspitze, Germany11Umweltbundesamt GmbH, Air Pollution Control & Climate Change Mitigation, Vienna, Austria12Forschungszentrum Jülich, IEK-8 (Troposphere), Jülich, Germany13Alfred Wegener Institute, Bremerhaven, Germanyanow at: Max Planck Institute for Meteorology, Hamburg, Germany
Correspondence to: A. Wagner ([email protected])
Received: 7 October 2014 – Published in Atmos. Chem. Phys. Discuss.: 4 March 2015
Revised: 30 October 2015 – Accepted: 7 November 2015 – Published: 18 December 2015
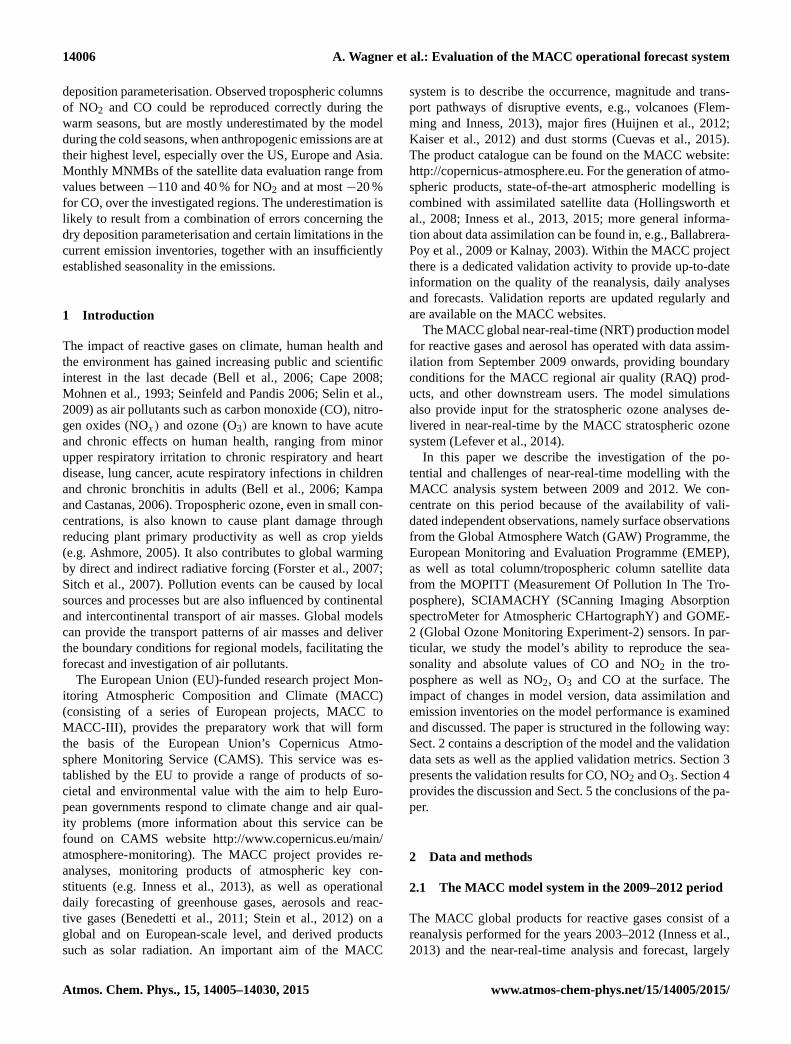
Abstract. The Monitoring Atmospheric Composition and
Climate (MACC) project represents the European Union’s
Copernicus Atmosphere Monitoring Service (CAMS) (http:
//www.copernicus.eu/), which became fully operational dur-
ing 2015. The global near-real-time MACC model produc-
tion run for aerosol and reactive gases provides daily analy-
ses and 5-day forecasts of atmospheric composition fields. It
is the only assimilation system worldwide that is operational
to produce global analyses and forecasts of reactive gases
and aerosol fields. We have investigated the ability of the
MACC analysis system to simulate tropospheric concentra-
tions of reactive gases covering the period between 2009 and
2012. A validation was performed based on carbon monoxide
(CO), nitrogen dioxide (NO2) and ozone (O3) surface obser-
vations from the Global Atmosphere Watch (GAW) network,
the O3 surface observations from the European Monitoring
and Evaluation Programme (EMEP) and, furthermore, NO2
tropospheric columns, as well as CO total columns, derived
from satellite sensors. The MACC system proved capable of
reproducing reactive gas concentrations with consistent qual-
ity; however, with a seasonally dependent bias compared to
surface and satellite observations – for northern hemispheric
surface O3 mixing ratios, positive biases appear during the
warm seasons and negative biases during the cold parts of the
year, with monthly modified normalised mean biases (MN-
MBs) ranging between −30 and 30 % at the surface. Model
biases are likely to result from difficulties in the simulation
of vertical mixing at night and deficiencies in the model’s dry
Published by Copernicus Publications on behalf of the European Geosciences Union.
14006 A. Wagner et al.: Evaluation of the MACC operational forecast system
deposition parameterisation. Observed tropospheric columns
of NO2 and CO could be reproduced correctly during the
warm seasons, but are mostly underestimated by the model
during the cold seasons, when anthropogenic emissions are at
their highest level, especially over the US, Europe and Asia.
Monthly MNMBs of the satellite data evaluation range from
values between −110 and 40 % for NO2 and at most −20 %
for CO, over the investigated regions. The underestimation is
likely to result from a combination of errors concerning the
dry deposition parameterisation and certain limitations in the
current emission inventories, together with an insufficiently
established seasonality in the emissions.
1 Introduction
The impact of reactive gases on climate, human health and
the environment has gained increasing public and scientific
interest in the last decade (Bell et al., 2006; Cape 2008;
Mohnen et al., 1993; Seinfeld and Pandis 2006; Selin et al.,
2009) as air pollutants such as carbon monoxide (CO), nitro-
gen oxides (NOx) and ozone (O3) are known to have acute
and chronic effects on human health, ranging from minor
upper respiratory irritation to chronic respiratory and heart
disease, lung cancer, acute respiratory infections in children
and chronic bronchitis in adults (Bell et al., 2006; Kampa
and Castanas, 2006). Tropospheric ozone, even in small con-
centrations, is also known to cause plant damage through
reducing plant primary productivity as well as crop yields
(e.g. Ashmore, 2005). It also contributes to global warming
by direct and indirect radiative forcing (Forster et al., 2007;
Sitch et al., 2007). Pollution events can be caused by local
sources and processes but are also influenced by continental
and intercontinental transport of air masses. Global models
can provide the transport patterns of air masses and deliver
the boundary conditions for regional models, facilitating the
forecast and investigation of air pollutants.
The European Union (EU)-funded research project Mon-
itoring Atmospheric Composition and Climate (MACC)
(consisting of a series of European projects, MACC to
MACC-III), provides the preparatory work that will form
the basis of the European Union’s Copernicus Atmo-
sphere Monitoring Service (CAMS). This service was es-
tablished by the EU to provide a range of products of so-
cietal and environmental value with the aim to help Euro-
pean governments respond to climate change and air qual-
ity problems (more information about this service can be
found on CAMS website http://www.copernicus.eu/main/
atmosphere-monitoring). The MACC project provides re-
analyses, monitoring products of atmospheric key con-
stituents (e.g. Inness et al., 2013), as well as operational
daily forecasting of greenhouse gases, aerosols and reac-
tive gases (Benedetti et al., 2011; Stein et al., 2012) on a
global and on European-scale level, and derived products
such as solar radiation. An important aim of the MACC
system is to describe the occurrence, magnitude and trans-
port pathways of disruptive events, e.g., volcanoes (Flem-
ming and Inness, 2013), major fires (Huijnen et al., 2012;
Kaiser et al., 2012) and dust storms (Cuevas et al., 2015).
The product catalogue can be found on the MACC website:
http://copernicus-atmosphere.eu. For the generation of atmo-
spheric products, state-of-the-art atmospheric modelling is
combined with assimilated satellite data (Hollingsworth et
al., 2008; Inness et al., 2013, 2015; more general informa-
tion about data assimilation can be found in, e.g., Ballabrera-
Poy et al., 2009 or Kalnay, 2003). Within the MACC project
there is a dedicated validation activity to provide up-to-date
information on the quality of the reanalysis, daily analyses
and forecasts. Validation reports are updated regularly and
are available on the MACC websites.
The MACC global near-real-time (NRT) production model
for reactive gases and aerosol has operated with data assim-
ilation from September 2009 onwards, providing boundary
conditions for the MACC regional air quality (RAQ) prod-
ucts, and other downstream users. The model simulations
also provide input for the stratospheric ozone analyses de-
livered in near-real-time by the MACC stratospheric ozone
system (Lefever et al., 2014).
In this paper we describe the investigation of the po-
tential and challenges of near-real-time modelling with the
MACC analysis system between 2009 and 2012. We con-
centrate on this period because of the availability of vali-
dated independent observations, namely surface observations
from the Global Atmosphere Watch (GAW) Programme, the
European Monitoring and Evaluation Programme (EMEP),
as well as total column/tropospheric column satellite data
from the MOPITT (Measurement Of Pollution In The Tro-
posphere), SCIAMACHY (SCanning Imaging Absorption
spectroMeter for Atmospheric CHartographY) and GOME-
2 (Global Ozone Monitoring Experiment-2) sensors. In par-
ticular, we study the model’s ability to reproduce the sea-
sonality and absolute values of CO and NO2 in the tro-
posphere as well as NO2, O3 and CO at the surface. The
impact of changes in model version, data assimilation and
emission inventories on the model performance is examined
and discussed. The paper is structured in the following way:
Sect. 2 contains a description of the model and the validation
data sets as well as the applied validation metrics. Section 3
presents the validation results for CO, NO2 and O3. Section 4
provides the discussion and Sect. 5 the conclusions of the pa-
per.
2 Data and methods
2.1 The MACC model system in the 2009–2012 period
The MACC global products for reactive gases consist of a
reanalysis performed for the years 2003–2012 (Inness et al.,
2013) and the near-real-time analysis and forecast, largely
Atmos. Chem. Phys., 15, 14005–14030, 2015 www.atmos-chem-phys.net/15/14005/2015/
A. Wagner et al.: Evaluation of the MACC operational forecast system 14007
based on the same assimilation and forecasting system, but
targeting different user groups (operational air quality fore-
casting and regional climate modelling, respectively). The
Model for OZone And Related chemical Tracers (MOZART)
chemical transport model (CTM) is coupled to the integrated
forecast system (IFS) of the European Centre for Medium-
Range Weather Forecast (ECMWF), which together rep-
resent the MOZART–IFS model system (Flemming et al.,
2009; Stein et al., 2012). An alternative analysis system has
been set up based on the global chemistry transport model
version 5 (TM5; see also Huijnen et al., 2010). Details of the
MOZART version used in the MACC global products can be
found in Kinnison et al. (2007) and Stein et al. (2011, 2012).
In our simulation, the IFS and the MOZART model run in
parallel and exchange several two- and three-dimensional
fields every model hour using the Ocean Atmosphere Sea
Ice Soil version 4 (OASIS4) coupling software (Valcke
and Redler, 2006), thereby producing three-dimensional IFS
fields for O3, CO, SO2, NOx , HCHO, sea salt aerosol, desert
dust, black carbon, organic matter, and total aerosol. The IFS
provides meteorological data to MOZART. Data assimilation
and transport of the MACC species takes place in the IFS,
while the whole chemical reaction system is calculated in the
MOZART model.
The MACC_osuite (operational suite) is the global near-
real-time MACC model production run for aerosol and re-
active gases. Here, we have investigated only the MACC
analysis. In contrast to the reanalysis, the MACC_osuite is
a near-real-time run, which implies that it is only run once
in near-real-time and may thus contain inconsistencies in,
e.g., the assimilated data. The MACC_osuite was based on
the IFS cycle CY36R1 with IFS model resolution of ap-
proximately 100 km by 100 km at 60 levels (T159L60) from
September 2009 to July 2012. The gas-phase chemistry mod-
ule in this cycle is based on MOZART version 3.0 (Kinni-
son et al., 2007). The model has been upgraded, following
updates of the ECMWF meteorological model and MACC-
specific updates, i.e. in chemical data assimilation and with
respect to the chemical model itself. Thus, from July 2012
onwards, the MACC_osuite has run with a change of the me-
teorological model to a new IFS cycle (version CY37R3),
with an IFS model resolution of approximately 80 km at
60 levels (T255L60) and an upgrade of the MOZART ver-
sion 3.5 (Kinnison et al., 2007; Emmons et al., 2011; Stein
et al., 2013). This includes, amongst others, updated veloc-
ity fields for the dry deposition of O3 over ice, as described
in Stein et al. (2013). A detailed documentation of sys-
tem changes can be found at http://atmosphere.copernicus.
eu/user-support/operational-info.
Emission inventories and assimilated data sets
In the MACC_osuite, anthropogenic emissions are based
on emissions from the EU project REanalysis of the TRo-
pospheric chemical composition Over (RETRO) the past
40 years merged with updated emissions for East Asia from
the Regional Emission inventory in ASia (REAS) inven-
tory (Schultz et al., 2007) – in the following referred to as
RETRO–REAS. The horizontal resolution is 0.5◦ in latitude
and longitude and it contains a monthly temporal resolu-
tion. Biogenic emissions are taken from Global Emissions
InitiAtive (GEIA), fire emissions are based on a climatol-
ogy derived from Global Fire Emissions Database version
2 (GFEDv2; van der Werf et al., 2006) until April 2010,
when fire emissions change to global fire assimilation system
(GFAS) emissions (Kaiser et al., 2012). Between January and
October 2011 there has been a fire emission reading error in
the model where, instead of adjusting emissions to the ap-
propriate month, the same set of emissions have been read
throughout this period.
After the model upgrade to the new cycle version
CY37R3, in July 2012, the emission inventories changed
from the merged RETRO–REAS and GEIA inventories, used
in the previous cycle, to the MACCity (MACC/CityZEN EU
projects) anthropogenic and biogenic emissions (Granier et
al., 2011) and (climatological) Model of Emissions of Gases
and Aerosols from Nature version 2 (MEGAN-v2; see Guen-
ther et al., 2006) emission inventories. Wintertime anthro-
pogenic CO emissions are scaled up over Europe and North
America (see Stein et al., 2014). Near-real-time fire emis-
sions are taken from GFASv1.0 (Kaiser et al., 2012), for both
gas-phase and aerosol.
In the MACC_osuite, the initial conditions for some of
the chemical species are provided by data assimilation of
atmospheric composition observations from satellites (see
Benedetti et al., 2008; Inness et al., 2009, 2013; Massart et
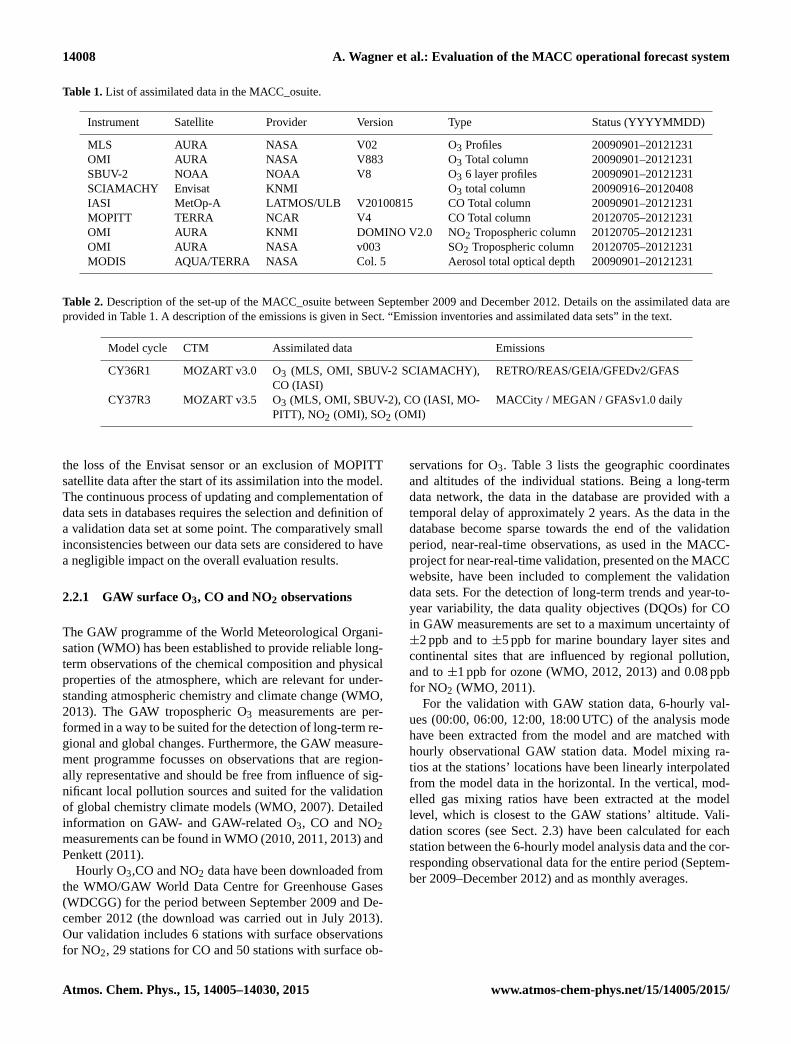
al., 2014). Table 1 lists the assimilated data products. From
September 2009 to June 2012, O3 total columns from the
microwave limb sounder (MLS) and solar backscatter ul-
traviolet (SBUV-2) instruments are assimilated, as well as
ozone monitoring instrument (OMI) and SCIAMACHY to-
tal columns (the latter only until March 2012, when the Eu-
ropean Space Agency lost contact with the ENVIronmen-
tal SATellite – ENVISAT). The CO total columns are as-
similated from the Infrared Atmospheric Sounding Interfer-
ometer (IASI) sensor and aerosol total optical depth is as-
similated from the Moderate Resolution Imaging Spectro-
radiometer (MODIS) instrument. After the model cycle up-
date in July 2012, data assimilation also includes OMI tro-
pospheric columns of NO2 and SO2, as well as CO MOPITT
total columns.
Tables 1 and 2 summarise the data assimilation and set-up
of the MACC_osuite.
2.2 Validation data and methodology
In this study, we have tended to use the same evaluation data
sets as during the MACC near-real-time validation exercise.
This implies some discontinuities in the evaluations, e.g. the
substitution of SCIAMACHY data with GOME-2 data after
www.atmos-chem-phys.net/15/14005/2015/ Atmos. Chem. Phys., 15, 14005–14030, 2015
14008 A. Wagner et al.: Evaluation of the MACC operational forecast system
Table 1. List of assimilated data in the MACC_osuite.
Instrument Satellite Provider Version Type Status (YYYYMMDD)
MLS AURA NASA V02 O3 Profiles 20090901–20121231
OMI AURA NASA V883 O3 Total column 20090901–20121231
SBUV-2 NOAA NOAA V8 O3 6 layer profiles 20090901–20121231
SCIAMACHY Envisat KNMI O3 total column 20090916–20120408
IASI MetOp-A LATMOS/ULB V20100815 CO Total column 20090901–20121231
MOPITT TERRA NCAR V4 CO Total column 20120705–20121231
OMI AURA KNMI DOMINO V2.0 NO2 Tropospheric column 20120705–20121231
OMI AURA NASA v003 SO2 Tropospheric column 20120705–20121231
MODIS AQUA/TERRA NASA Col. 5 Aerosol total optical depth 20090901–20121231
Table 2. Description of the set-up of the MACC_osuite between September 2009 and December 2012. Details on the assimilated data are
provided in Table 1. A description of the emissions is given in Sect. “Emission inventories and assimilated data sets” in the text.
Model cycle CTM Assimilated data Emissions
CY36R1 MOZART v3.0 O3 (MLS, OMI, SBUV-2 SCIAMACHY),
CO (IASI)
RETRO/REAS/GEIA/GFEDv2/GFAS
CY37R3 MOZART v3.5 O3 (MLS, OMI, SBUV-2), CO (IASI, MO-
PITT), NO2 (OMI), SO2 (OMI)
MACCity / MEGAN / GFASv1.0 daily
the loss of the Envisat sensor or an exclusion of MOPITT
satellite data after the start of its assimilation into the model.
The continuous process of updating and complementation of
data sets in databases requires the selection and definition of
a validation data set at some point. The comparatively small
inconsistencies between our data sets are considered to have
a negligible impact on the overall evaluation results.
2.2.1 GAW surface O3, CO and NO2 observations
The GAW programme of the World Meteorological Organi-
sation (WMO) has been established to provide reliable long-
term observations of the chemical composition and physical
properties of the atmosphere, which are relevant for under-
standing atmospheric chemistry and climate change (WMO,
2013). The GAW tropospheric O3 measurements are per-
formed in a way to be suited for the detection of long-term re-
gional and global changes. Furthermore, the GAW measure-
ment programme focusses on observations that are region-
ally representative and should be free from influence of sig-
nificant local pollution sources and suited for the validation
of global chemistry climate models (WMO, 2007). Detailed
information on GAW- and GAW-related O3, CO and NO2
measurements can be found in WMO (2010, 2011, 2013) and
Penkett (2011).
Hourly O3,CO and NO2 data have been downloaded from
the WMO/GAW World Data Centre for Greenhouse Gases
(WDCGG) for the period between September 2009 and De-
cember 2012 (the download was carried out in July 2013).
Our validation includes 6 stations with surface observations
for NO2, 29 stations for CO and 50 stations with surface ob-
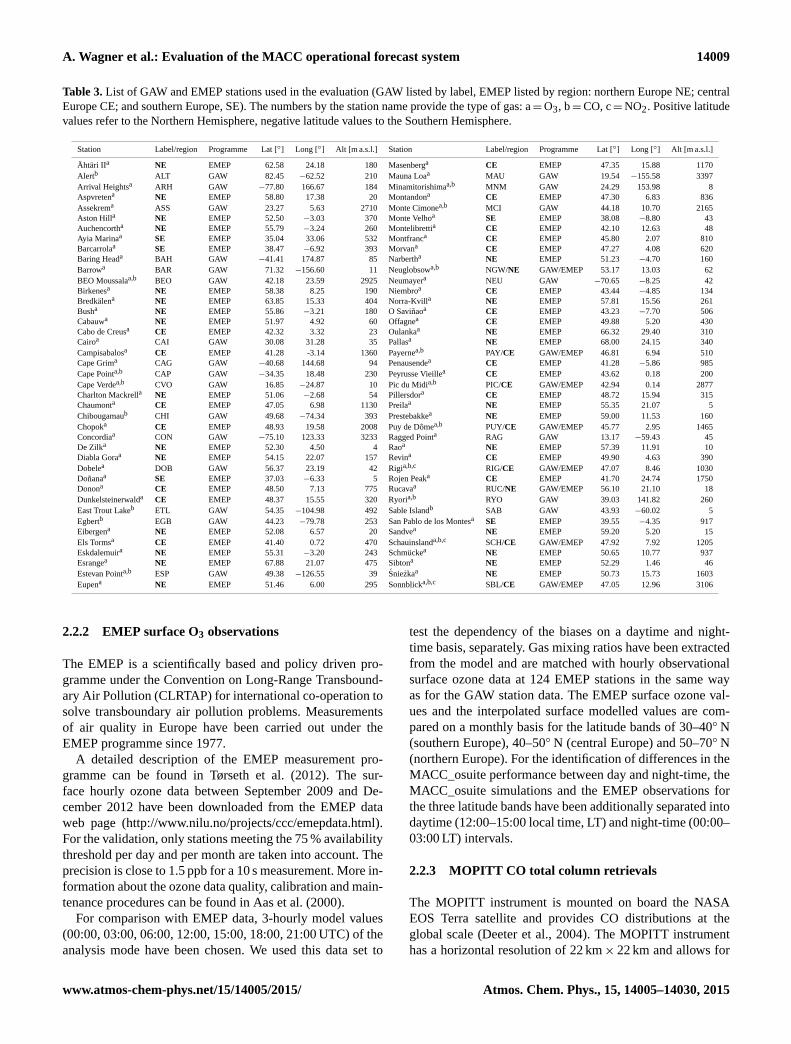
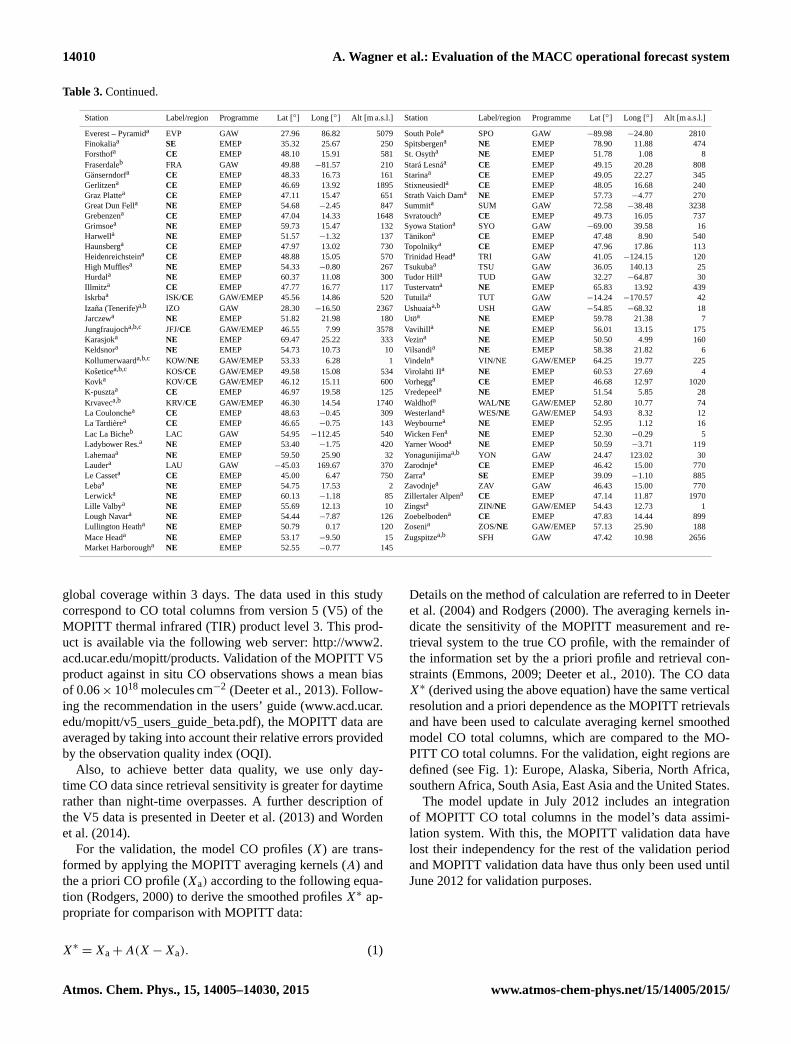
servations for O3. Table 3 lists the geographic coordinates
and altitudes of the individual stations. Being a long-term
data network, the data in the database are provided with a
temporal delay of approximately 2 years. As the data in the
database become sparse towards the end of the validation
period, near-real-time observations, as used in the MACC-
project for near-real-time validation, presented on the MACC
website, have been included to complement the validation
data sets. For the detection of long-term trends and year-to-
year variability, the data quality objectives (DQOs) for CO
in GAW measurements are set to a maximum uncertainty of
±2 ppb and to ±5 ppb for marine boundary layer sites and
continental sites that are influenced by regional pollution,
and to ±1 ppb for ozone (WMO, 2012, 2013) and 0.08 ppb
for NO2 (WMO, 2011).
For the validation with GAW station data, 6-hourly val-
ues (00:00, 06:00, 12:00, 18:00 UTC) of the analysis mode
have been extracted from the model and are matched with
hourly observational GAW station data. Model mixing ra-
tios at the stations’ locations have been linearly interpolated
from the model data in the horizontal. In the vertical, mod-
elled gas mixing ratios have been extracted at the model
level, which is closest to the GAW stations’ altitude. Vali-
dation scores (see Sect. 2.3) have been calculated for each
station between the 6-hourly model analysis data and the cor-
responding observational data for the entire period (Septem-
ber 2009–December 2012) and as monthly averages.
Atmos. Chem. Phys., 15, 14005–14030, 2015 www.atmos-chem-phys.net/15/14005/2015/
A. Wagner et al.: Evaluation of the MACC operational forecast system 14009
Table 3. List of GAW and EMEP stations used in the evaluation (GAW listed by label, EMEP listed by region: northern Europe NE; central
Europe CE; and southern Europe, SE). The numbers by the station name provide the type of gas: a=O3, b=CO, c=NO2. Positive latitude
values refer to the Northern Hemisphere, negative latitude values to the Southern Hemisphere.
Station Label/region Programme Lat [◦] Long [◦] Alt [m a.s.l.] Station Label/region Programme Lat [◦] Long [◦] Alt [m a.s.l.]
Ähtäri IIa NE EMEP 62.58 24.18 180 Masenberga CE EMEP 47.35 15.88 1170
Alertb ALT GAW 82.45 −62.52 210 Mauna Loaa MAU GAW 19.54 −155.58 3397
Arrival Heightsa ARH GAW −77.80 166.67 184 Minamitorishimaa,b MNM GAW 24.29 153.98 8
Aspvretena NE EMEP 58.80 17.38 20 Montandona CE EMEP 47.30 6.83 836
Assekrema ASS GAW 23.27 5.63 2710 Monte Cimonea,b MCI GAW 44.18 10.70 2165
Aston Hilla NE EMEP 52.50 −3.03 370 Monte Velhoa SE EMEP 38.08 −8.80 43
Auchencortha NE EMEP 55.79 −3.24 260 Montelibrettia CE EMEP 42.10 12.63 48
Ayia Marinaa SE EMEP 35.04 33.06 532 Montfranca CE EMEP 45.80 2.07 810
Barcarrolaa SE EMEP 38.47 −6.92 393 Morvana CE EMEP 47.27 4.08 620
Baring Heada BAH GAW −41.41 174.87 85 Narbertha NE EMEP 51.23 −4.70 160
Barrowa BAR GAW 71.32 −156.60 11 Neuglobsowa,b NGW/NE GAW/EMEP 53.17 13.03 62
BEO Moussalaa,b BEO GAW 42.18 23.59 2925 Neumayera NEU GAW −70.65 −8.25 42
Birkenesa NE EMEP 58.38 8.25 190 Niembroa CE EMEP 43.44 −4.85 134
Bredkälena NE EMEP 63.85 15.33 404 Norra-Kvilla NE EMEP 57.81 15.56 261
Busha NE EMEP 55.86 −3.21 180 O Saviñaoa CE EMEP 43.23 −7.70 506
Cabauwa NE EMEP 51.97 4.92 60 Offagnea CE EMEP 49.88 5.20 430
Cabo de Creusa CE EMEP 42.32 3.32 23 Oulankaa NE EMEP 66.32 29.40 310
Cairoa CAI GAW 30.08 31.28 35 Pallasa NE EMEP 68.00 24.15 340
Campisabalosa CE EMEP 41.28 -3.14 1360 Payernea,b PAY/CE GAW/EMEP 46.81 6.94 510
Cape Grima CAG GAW −40.68 144.68 94 Penausendea CE EMEP 41.28 −5.86 985
Cape Pointa,b CAP GAW −34.35 18.48 230 Peyrusse Vieillea CE EMEP 43.62 0.18 200
Cape Verdea,b CVO GAW 16.85 −24.87 10 Pic du Midia,b PIC/CE GAW/EMEP 42.94 0.14 2877
Charlton Mackrella NE EMEP 51.06 −2.68 54 Pillersdora CE EMEP 48.72 15.94 315
Chaumonta CE EMEP 47.05 6.98 1130 Preilaa NE EMEP 55.35 21.07 5
Chibougamaub CHI GAW 49.68 −74.34 393 Prestebakkea NE EMEP 59.00 11.53 160
Chopoka CE EMEP 48.93 19.58 2008 Puy de Dômea,b PUY/CE GAW/EMEP 45.77 2.95 1465
Concordiaa CON GAW −75.10 123.33 3233 Ragged Pointa RAG GAW 13.17 −59.43 45
De Zilka NE EMEP 52.30 4.50 4 Raoa NE EMEP 57.39 11.91 10
Diabla Goraa NE EMEP 54.15 22.07 157 Revina CE EMEP 49.90 4.63 390
Dobelea DOB GAW 56.37 23.19 42 Rigia,b,c RIG/CE GAW/EMEP 47.07 8.46 1030
Doñanaa SE EMEP 37.03 −6.33 5 Rojen Peaka CE EMEP 41.70 24.74 1750
Donona CE EMEP 48.50 7.13 775 Rucavaa RUC/NE GAW/EMEP 56.10 21.10 18
Dunkelsteinerwalda CE EMEP 48.37 15.55 320 Ryoria,b RYO GAW 39.03 141.82 260
East Trout Lakeb ETL GAW 54.35 −104.98 492 Sable Islandb SAB GAW 43.93 −60.02 5
Egbertb EGB GAW 44.23 −79.78 253 San Pablo de los Montesa SE EMEP 39.55 −4.35 917
Eibergena NE EMEP 52.08 6.57 20 Sandvea NE EMEP 59.20 5.20 15
Els Tormsa CE EMEP 41.40 0.72 470 Schauinslanda,b,c SCH/CE GAW/EMEP 47.92 7.92 1205
Eskdalemuira NE EMEP 55.31 −3.20 243 Schmückea NE EMEP 50.65 10.77 937
Esrangea NE EMEP 67.88 21.07 475 Sibtona NE EMEP 52.29 1.46 46
Estevan Pointa,b ESP GAW 49.38 −126.55 39 Sniezkaa NE EMEP 50.73 15.73 1603
Eupena NE EMEP 51.46 6.00 295 Sonnblicka,b,c SBL/CE GAW/EMEP 47.05 12.96 3106
2.2.2 EMEP surface O3 observations
The EMEP is a scientifically based and policy driven pro-
gramme under the Convention on Long-Range Transbound-
ary Air Pollution (CLRTAP) for international co-operation to
solve transboundary air pollution problems. Measurements
of air quality in Europe have been carried out under the
EMEP programme since 1977.
A detailed description of the EMEP measurement pro-
gramme can be found in Tørseth et al. (2012). The sur-
face hourly ozone data between September 2009 and De-
cember 2012 have been downloaded from the EMEP data
web page (http://www.nilu.no/projects/ccc/emepdata.html).
For the validation, only stations meeting the 75 % availability
threshold per day and per month are taken into account. The
precision is close to 1.5 ppb for a 10 s measurement. More in-
formation about the ozone data quality, calibration and main-
tenance procedures can be found in Aas et al. (2000).
For comparison with EMEP data, 3-hourly model values
(00:00, 03:00, 06:00, 12:00, 15:00, 18:00, 21:00 UTC) of the
analysis mode have been chosen. We used this data set to
test the dependency of the biases on a daytime and night-
time basis, separately. Gas mixing ratios have been extracted
from the model and are matched with hourly observational
surface ozone data at 124 EMEP stations in the same way
as for the GAW station data. The EMEP surface ozone val-
ues and the interpolated surface modelled values are com-
pared on a monthly basis for the latitude bands of 30–40◦ N
(southern Europe), 40–50◦ N (central Europe) and 50–70◦ N
(northern Europe). For the identification of differences in the
MACC_osuite performance between day and night-time, the
MACC_osuite simulations and the EMEP observations for
the three latitude bands have been additionally separated into
daytime (12:00–15:00 local time, LT) and night-time (00:00–
03:00 LT) intervals.
2.2.3 MOPITT CO total column retrievals
The MOPITT instrument is mounted on board the NASA
EOS Terra satellite and provides CO distributions at the
global scale (Deeter et al., 2004). The MOPITT instrument
has a horizontal resolution of 22 km× 22 km and allows for
www.atmos-chem-phys.net/15/14005/2015/ Atmos. Chem. Phys., 15, 14005–14030, 2015
14010 A. Wagner et al.: Evaluation of the MACC operational forecast system
Table 3. Continued.
Station Label/region Programme Lat [◦] Long [◦] Alt [m a.s.l.] Station Label/region Programme Lat [◦] Long [◦] Alt [m a.s.l.]
Everest – Pyramida EVP GAW 27.96 86.82 5079 South Polea SPO GAW −89.98 −24.80 2810
Finokaliaa SE EMEP 35.32 25.67 250 Spitsbergena NE EMEP 78.90 11.88 474
Forsthofa CE EMEP 48.10 15.91 581 St. Osytha NE EMEP 51.78 1.08 8
Fraserdaleb FRA GAW 49.88 −81.57 210 Stará Lesnáa CE EMEP 49.15 20.28 808
Gänserndorfa CE EMEP 48.33 16.73 161 Starinaa CE EMEP 49.05 22.27 345
Gerlitzena CE EMEP 46.69 13.92 1895 Stixneusiedla CE EMEP 48.05 16.68 240
Graz Plattea CE EMEP 47.11 15.47 651 Strath Vaich Dama NE EMEP 57.73 −4.77 270
Great Dun Fella NE EMEP 54.68 −2.45 847 Summita SUM GAW 72.58 −38.48 3238
Grebenzena CE EMEP 47.04 14.33 1648 Svratoucha CE EMEP 49.73 16.05 737
Grimsoea NE EMEP 59.73 15.47 132 Syowa Stationa SYO GAW −69.00 39.58 16
Harwella NE EMEP 51.57 −1.32 137 Tänikona CE EMEP 47.48 8.90 540
Haunsberga CE EMEP 47.97 13.02 730 Topolnikya CE EMEP 47.96 17.86 113
Heidenreichsteina CE EMEP 48.88 15.05 570 Trinidad Heada TRI GAW 41.05 −124.15 120
High Mufflesa NE EMEP 54.33 −0.80 267 Tsukubaa TSU GAW 36.05 140.13 25
Hurdala NE EMEP 60.37 11.08 300 Tudor Hilla TUD GAW 32.27 −64.87 30
Illmitza CE EMEP 47.77 16.77 117 Tustervatna NE EMEP 65.83 13.92 439
Iskrbaa ISK/CE GAW/EMEP 45.56 14.86 520 Tutuilaa TUT GAW −14.24 −170.57 42
Izaña (Tenerife)a,b IZO GAW 28.30 −16.50 2367 Ushuaiaa,b USH GAW −54.85 −68.32 18
Jarczewa NE EMEP 51.82 21.98 180 Utöa NE EMEP 59.78 21.38 7
Jungfraujocha,b,c JFJ/CE GAW/EMEP 46.55 7.99 3578 Vavihilla NE EMEP 56.01 13.15 175
Karasjoka NE EMEP 69.47 25.22 333 Vezina NE EMEP 50.50 4.99 160
Keldsnora NE EMEP 54.73 10.73 10 Vilsandia NE EMEP 58.38 21.82 6
Kollumerwaarda,b,c KOW/NE GAW/EMEP 53.33 6.28 1 Vindelna VIN/NE GAW/EMEP 64.25 19.77 225
Koseticea,b,c KOS/CE GAW/EMEP 49.58 15.08 534 Virolahti IIa NE EMEP 60.53 27.69 4
Kovka KOV/CE GAW/EMEP 46.12 15.11 600 Vorhegga CE EMEP 46.68 12.97 1020
K-pusztaa CE EMEP 46.97 19.58 125 Vredepeela NE EMEP 51.54 5.85 28
Krvaveca,b KRV/CE GAW/EMEP 46.30 14.54 1740 Waldhofa WAL/NE GAW/EMEP 52.80 10.77 74
La Coulonchea CE EMEP 48.63 −0.45 309 Westerlanda WES/NE GAW/EMEP 54.93 8.32 12
La Tardièrea CE EMEP 46.65 −0.75 143 Weybournea NE EMEP 52.95 1.12 16
Lac La Bicheb LAC GAW 54.95 −112.45 540 Wicken Fena NE EMEP 52.30 −0.29 5
Ladybower Res.a NE EMEP 53.40 −1.75 420 Yarner Wooda NE EMEP 50.59 −3.71 119
Lahemaaa NE EMEP 59.50 25.90 32 Yonagunijimaa,b YON GAW 24.47 123.02 30
Laudera LAU GAW −45.03 169.67 370 Zarodnjea CE EMEP 46.42 15.00 770
Le Casseta CE EMEP 45.00 6.47 750 Zarraa SE EMEP 39.09 −1.10 885
Lebaa NE EMEP 54.75 17.53 2 Zavodnjea ZAV GAW 46.43 15.00 770
Lerwicka NE EMEP 60.13 −1.18 85 Zillertaler Alpena CE EMEP 47.14 11.87 1970
Lille Valbya NE EMEP 55.69 12.13 10 Zingsta ZIN/NE GAW/EMEP 54.43 12.73 1
Lough Navara NE EMEP 54.44 −7.87 126 Zoebelbodena CE EMEP 47.83 14.44 899
Lullington Heatha NE EMEP 50.79 0.17 120 Zosenia ZOS/NE GAW/EMEP 57.13 25.90 188
Mace Heada NE EMEP 53.17 −9.50 15 Zugspitzea,b SFH GAW 47.42 10.98 2656
Market Harborougha NE EMEP 52.55 −0.77 145
global coverage within 3 days. The data used in this study
correspond to CO total columns from version 5 (V5) of the
MOPITT thermal infrared (TIR) product level 3. This prod-
uct is available via the following web server: http://www2.
acd.ucar.edu/mopitt/products. Validation of the MOPITT V5
product against in situ CO observations shows a mean bias
of 0.06× 10¹⁸ molecules cm−2 (Deeter et al., 2013). Follow-
ing the recommendation in the users’ guide (www.acd.ucar.
edu/mopitt/v5_users_guide_beta.pdf), the MOPITT data are
averaged by taking into account their relative errors provided
by the observation quality index (OQI).
Also, to achieve better data quality, we use only day-
time CO data since retrieval sensitivity is greater for daytime
rather than night-time overpasses. A further description of
the V5 data is presented in Deeter et al. (2013) and Worden
et al. (2014).
For the validation, the model CO profiles (X) are trans-
formed by applying the MOPITT averaging kernels (A) and
the a priori CO profile (Xa) according to the following equa-
tion (Rodgers, 2000) to derive the smoothed profiles X∗ ap-
propriate for comparison with MOPITT data:
X∗ =Xa+A(X−Xa). (1)
Details on the method of calculation are referred to in Deeter
et al. (2004) and Rodgers (2000). The averaging kernels in-
dicate the sensitivity of the MOPITT measurement and re-
trieval system to the true CO profile, with the remainder of
the information set by the a priori profile and retrieval con-
straints (Emmons, 2009; Deeter et al., 2010). The CO data
X∗ (derived using the above equation) have the same vertical
resolution and a priori dependence as the MOPITT retrievals
and have been used to calculate averaging kernel smoothed
model CO total columns, which are compared to the MO-
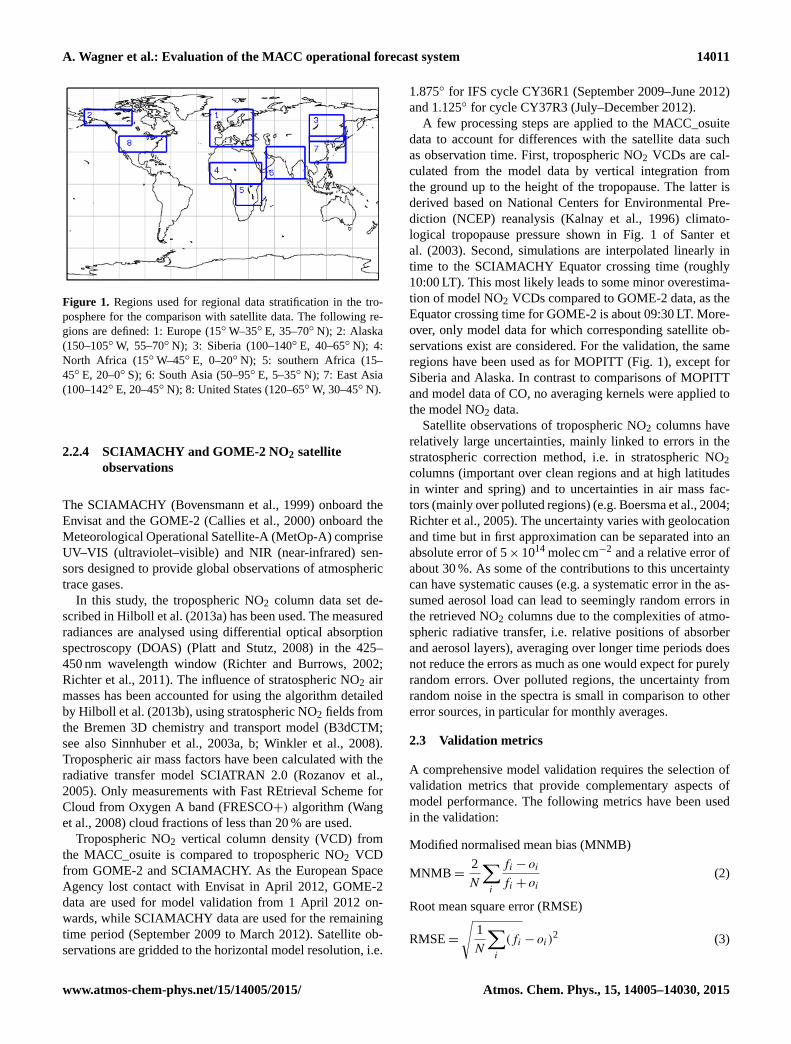
PITT CO total columns. For the validation, eight regions are
defined (see Fig. 1): Europe, Alaska, Siberia, North Africa,
southern Africa, South Asia, East Asia and the United States.
The model update in July 2012 includes an integration
of MOPITT CO total columns in the model’s data assimi-
lation system. With this, the MOPITT validation data have
lost their independency for the rest of the validation period
and MOPITT validation data have thus only been used until
June 2012 for validation purposes.
Atmos. Chem. Phys., 15, 14005–14030, 2015 www.atmos-chem-phys.net/15/14005/2015/
A. Wagner et al.: Evaluation of the MACC operational forecast system 14011
Figure 1. Regions used for regional data stratification in the tro-
posphere for the comparison with satellite data. The following re-
gions are defined: 1: Europe (15◦W–35◦ E, 35–70◦ N); 2: Alaska
(150–105◦W, 55–70◦ N); 3: Siberia (100–140◦ E, 40–65◦ N); 4:
North Africa (15◦W–45◦ E, 0–20◦ N); 5: southern Africa (15–
45◦ E, 20–0◦ S); 6: South Asia (50–95◦ E, 5–35◦ N); 7: East Asia
(100–142◦ E, 20–45◦ N); 8: United States (120–65◦W, 30–45◦ N).
2.2.4 SCIAMACHY and GOME-2 NO2 satellite
observations
The SCIAMACHY (Bovensmann et al., 1999) onboard the
Envisat and the GOME-2 (Callies et al., 2000) onboard the
Meteorological Operational Satellite-A (MetOp-A) comprise
UV–VIS (ultraviolet–visible) and NIR (near-infrared) sen-
sors designed to provide global observations of atmospheric
trace gases.
In this study, the tropospheric NO2 column data set de-
scribed in Hilboll et al. (2013a) has been used. The measured
radiances are analysed using differential optical absorption
spectroscopy (DOAS) (Platt and Stutz, 2008) in the 425–
450 nm wavelength window (Richter and Burrows, 2002;
Richter et al., 2011). The influence of stratospheric NO2 air
masses has been accounted for using the algorithm detailed
by Hilboll et al. (2013b), using stratospheric NO2 fields from
the Bremen 3D chemistry and transport model (B3dCTM;
see also Sinnhuber et al., 2003a, b; Winkler et al., 2008).
Tropospheric air mass factors have been calculated with the
radiative transfer model SCIATRAN 2.0 (Rozanov et al.,
2005). Only measurements with Fast REtrieval Scheme for
Cloud from Oxygen A band (FRESCO+) algorithm (Wang
et al., 2008) cloud fractions of less than 20 % are used.
Tropospheric NO2 vertical column density (VCD) from
the MACC_osuite is compared to tropospheric NO2 VCD
from GOME-2 and SCIAMACHY. As the European Space
Agency lost contact with Envisat in April 2012, GOME-2
data are used for model validation from 1 April 2012 on-
wards, while SCIAMACHY data are used for the remaining
time period (September 2009 to March 2012). Satellite ob-
servations are gridded to the horizontal model resolution, i.e.
1.875◦ for IFS cycle CY36R1 (September 2009–June 2012)
and 1.125◦ for cycle CY37R3 (July–December 2012).
A few processing steps are applied to the MACC_osuite
data to account for differences with the satellite data such
as observation time. First, tropospheric NO2 VCDs are cal-
culated from the model data by vertical integration from
the ground up to the height of the tropopause. The latter is
derived based on National Centers for Environmental Pre-
diction (NCEP) reanalysis (Kalnay et al., 1996) climato-
logical tropopause pressure shown in Fig. 1 of Santer et
al. (2003). Second, simulations are interpolated linearly in
time to the SCIAMACHY Equator crossing time (roughly
10:00 LT). This most likely leads to some minor overestima-
tion of model NO2 VCDs compared to GOME-2 data, as the
Equator crossing time for GOME-2 is about 09:30 LT. More-
over, only model data for which corresponding satellite ob-
servations exist are considered. For the validation, the same
regions have been used as for MOPITT (Fig. 1), except for
Siberia and Alaska. In contrast to comparisons of MOPITT
and model data of CO, no averaging kernels were applied to
the model NO2 data.
Satellite observations of tropospheric NO2 columns have
relatively large uncertainties, mainly linked to errors in the
stratospheric correction method, i.e. in stratospheric NO2
columns (important over clean regions and at high latitudes
in winter and spring) and to uncertainties in air mass fac-
tors (mainly over polluted regions) (e.g. Boersma et al., 2004;
Richter et al., 2005). The uncertainty varies with geolocation
and time but in first approximation can be separated into an
absolute error of 5× 10¹⁴ molec cm−2 and a relative error of
about 30 %. As some of the contributions to this uncertainty
can have systematic causes (e.g. a systematic error in the as-
sumed aerosol load can lead to seemingly random errors in
the retrieved NO2 columns due to the complexities of atmo-
spheric radiative transfer, i.e. relative positions of absorber
and aerosol layers), averaging over longer time periods does
not reduce the errors as much as one would expect for purely
random errors. Over polluted regions, the uncertainty from
random noise in the spectra is small in comparison to other
error sources, in particular for monthly averages.
2.3 Validation metrics
A comprehensive model validation requires the selection of
validation metrics that provide complementary aspects of
model performance. The following metrics have been used
in the validation:
Modified normalised mean bias (MNMB)
MNMB=2
N
∑i
fi − oi
fi + oi(2)
Root mean square error (RMSE)
RMSE=
√1
N
∑i
(fi − oi)2 (3)
www.atmos-chem-phys.net/15/14005/2015/ Atmos. Chem. Phys., 15, 14005–14030, 2015
14012 A. Wagner et al.: Evaluation of the MACC operational forecast system
Correlation coefficient
R =
1N
∑i
(fi − f
)(oi − o)
σf σo, (4)
whereN is the number of observations, f the modelled anal-
ysis and o the observed values, f and o are the mean values
of the analysis and observed values and σf and σo the corre-
sponding standard deviations.
The validation metrics above have been chosen to provide
complementary aspects of model performance. The modified
normalised mean bias is a normalisation based on the mean
of the observed and forecast value (e.g. Elguindi et al., 2010).
It ranges between −2 and 2 and when multiplied by 100 %,
it can be interpreted as a percentage bias.
We chose to use the modified normalised mean bias
(MNMB) in our evaluations because verifying chemical
species concentration values significantly differs from ver-
ifying standard meteorological fields. For example, spatial
or temporal variations can be much greater and the differ-
ences between model and observed values (“model errors”)
are frequently much larger in magnitude. Most importantly,
typical concentrations can vary quite widely between differ-
ent pollutant types (e.g. O3 and CO) and regions (e.g. Eu-
rope vs. Antarctica), and a given bias or error value can have
a quite different significance. It is useful, therefore, to con-
sider bias and error metrics that are normalised with respect
to observed concentrations and hence can provide a consis-
tent scale regardless of pollutant type (see e.g. Elguindi et
al., 2010, or Savage et al., 2013). Moreover, the MNMB is
robust to outliers and converges to the normal bias for biases
approaching zero, while taking into account the representa-
tiveness issue when comparing coarse-resolved global mod-
els versus site-specific station observations. Though GAW
stations prove regionally representative in general, the expe-
rience is that local effects cannot always be ruled out reli-
ably in long worldwide data sets, because each of the differ-
ent species has its individual scale of transport and chem-
ical processes, which in one case may exceed and in the
other case fall bellow the model resolution. Referencing to
the model/observation mean again constitutes a pragmatic
solution to avoid misleading bias tendencies, particularly in
sensitive regions with sparse data coverage. Within MACC,
the MNMB is used as an important standard score. It is used
in the MACC quarterly validation reports and it appears in
many recent publications, e.g. Cuevas et al. (2015), Eskes et
al. (2015), Sheel et al. (2014).
The MNMB varies symmetrically with respect to under-
and overestimation. However, when calculated over longer
time periods, a balance in model error, with model over- and
underestimation compensating each other, can lead to a small
MNMB for the overall period. For this reason, it is important
to additionally consider an absolute measure, such as the root
mean square error (RMSE). However, it has to be noted that
the RMSE is strongly influenced by larger values and out-
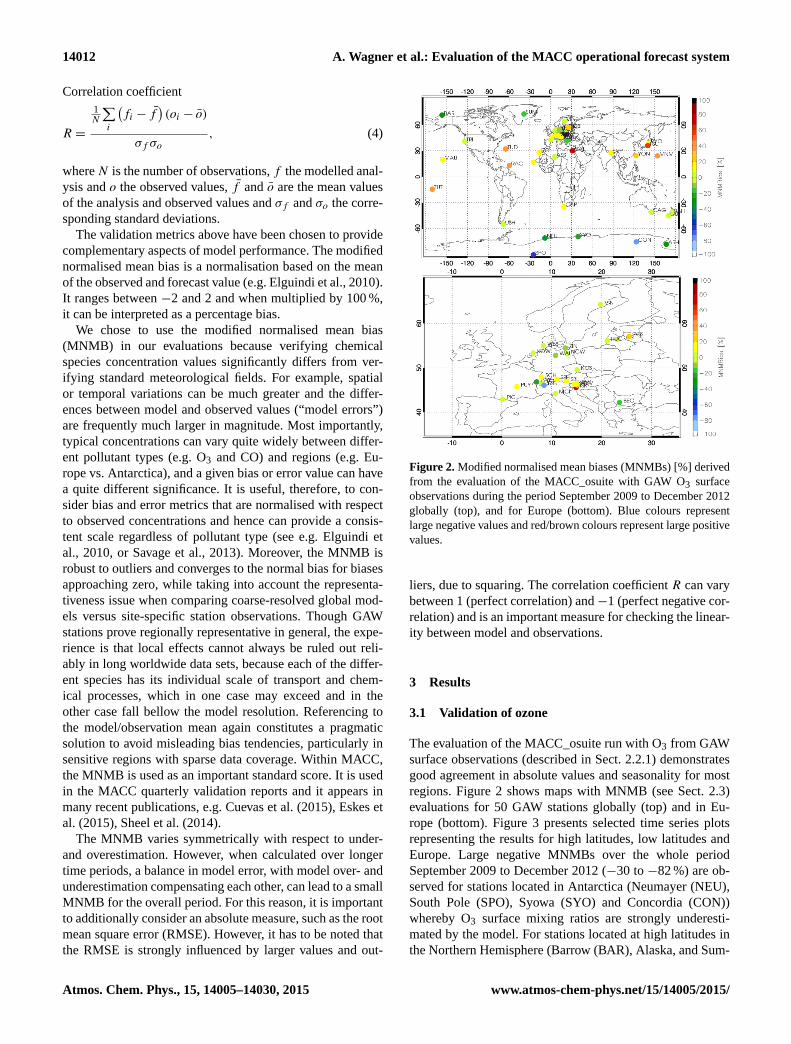
Figure 2. Modified normalised mean biases (MNMBs) [%] derived
from the evaluation of the MACC_osuite with GAW O3 surface
observations during the period September 2009 to December 2012
globally (top), and for Europe (bottom). Blue colours represent
large negative values and red/brown colours represent large positive
values.
liers, due to squaring. The correlation coefficient R can vary
between 1 (perfect correlation) and−1 (perfect negative cor-
relation) and is an important measure for checking the linear-
ity between model and observations.
3 Results
3.1 Validation of ozone
The evaluation of the MACC_osuite run with O3 from GAW
surface observations (described in Sect. 2.2.1) demonstrates
good agreement in absolute values and seasonality for most
regions. Figure 2 shows maps with MNMB (see Sect. 2.3)
evaluations for 50 GAW stations globally (top) and in Eu-
rope (bottom). Figure 3 presents selected time series plots
representing the results for high latitudes, low latitudes and
Europe. Large negative MNMBs over the whole period
September 2009 to December 2012 (−30 to −82 %) are ob-
served for stations located in Antarctica (Neumayer (NEU),
South Pole (SPO), Syowa (SYO) and Concordia (CON))
whereby O3 surface mixing ratios are strongly underesti-
mated by the model. For stations located at high latitudes in
the Northern Hemisphere (Barrow (BAR), Alaska, and Sum-
Atmos. Chem. Phys., 15, 14005–14030, 2015 www.atmos-chem-phys.net/15/14005/2015/
A. Wagner et al.: Evaluation of the MACC operational forecast system 14013
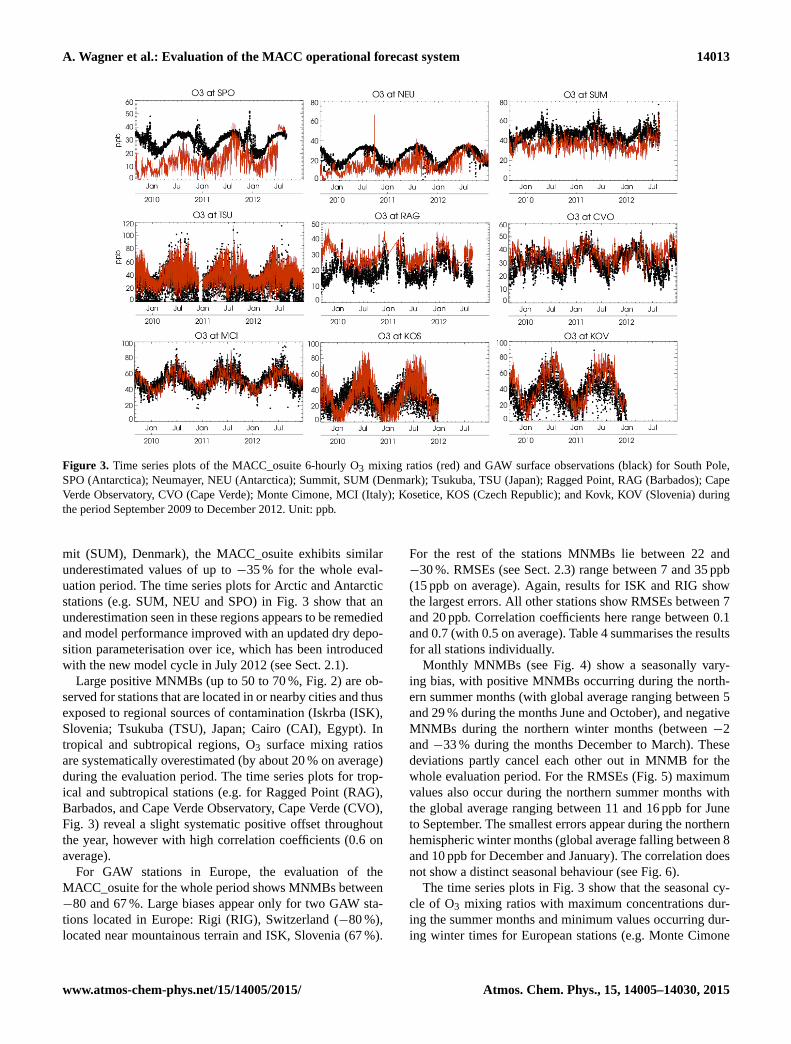
Figure 3. Time series plots of the MACC_osuite 6-hourly O3 mixing ratios (red) and GAW surface observations (black) for South Pole,
SPO (Antarctica); Neumayer, NEU (Antarctica); Summit, SUM (Denmark); Tsukuba, TSU (Japan); Ragged Point, RAG (Barbados); Cape
Verde Observatory, CVO (Cape Verde); Monte Cimone, MCI (Italy); Kosetice, KOS (Czech Republic); and Kovk, KOV (Slovenia) during
the period September 2009 to December 2012. Unit: ppb.
mit (SUM), Denmark), the MACC_osuite exhibits similar
underestimated values of up to −35 % for the whole eval-
uation period. The time series plots for Arctic and Antarctic
stations (e.g. SUM, NEU and SPO) in Fig. 3 show that an
underestimation seen in these regions appears to be remedied
and model performance improved with an updated dry depo-
sition parameterisation over ice, which has been introduced
with the new model cycle in July 2012 (see Sect. 2.1).
Large positive MNMBs (up to 50 to 70 %, Fig. 2) are ob-
served for stations that are located in or nearby cities and thus
exposed to regional sources of contamination (Iskrba (ISK),
Slovenia; Tsukuba (TSU), Japan; Cairo (CAI), Egypt). In
tropical and subtropical regions, O3 surface mixing ratios
are systematically overestimated (by about 20 % on average)
during the evaluation period. The time series plots for trop-
ical and subtropical stations (e.g. for Ragged Point (RAG),
Barbados, and Cape Verde Observatory, Cape Verde (CVO),
Fig. 3) reveal a slight systematic positive offset throughout
the year, however with high correlation coefficients (0.6 on
average).
For GAW stations in Europe, the evaluation of the
MACC_osuite for the whole period shows MNMBs between
−80 and 67 %. Large biases appear only for two GAW sta-
tions located in Europe: Rigi (RIG), Switzerland (−80 %),
located near mountainous terrain and ISK, Slovenia (67 %).
For the rest of the stations MNMBs lie between 22 and
−30 %. RMSEs (see Sect. 2.3) range between 7 and 35 ppb
(15 ppb on average). Again, results for ISK and RIG show
the largest errors. All other stations show RMSEs between 7
and 20 ppb. Correlation coefficients here range between 0.1
and 0.7 (with 0.5 on average). Table 4 summarises the results
for all stations individually.
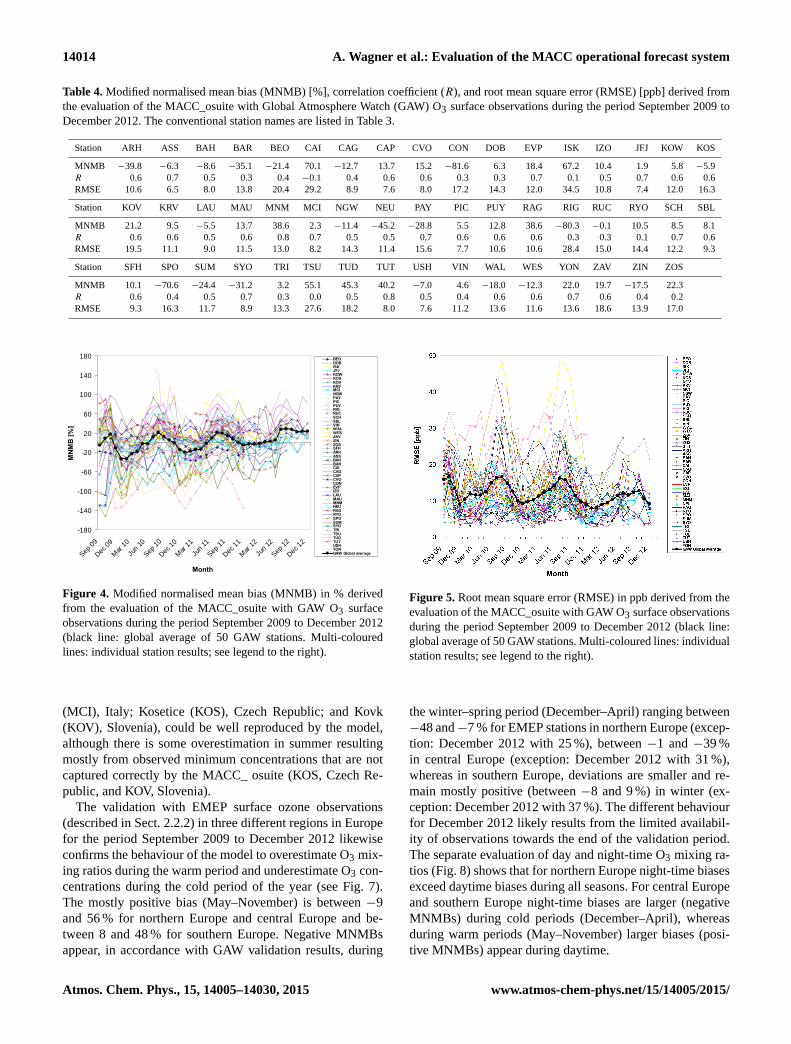
Monthly MNMBs (see Fig. 4) show a seasonally vary-
ing bias, with positive MNMBs occurring during the north-
ern summer months (with global average ranging between 5
and 29 % during the months June and October), and negative
MNMBs during the northern winter months (between −2
and −33 % during the months December to March). These
deviations partly cancel each other out in MNMB for the
whole evaluation period. For the RMSEs (Fig. 5) maximum
values also occur during the northern summer months with
the global average ranging between 11 and 16 ppb for June
to September. The smallest errors appear during the northern
hemispheric winter months (global average falling between 8
and 10 ppb for December and January). The correlation does
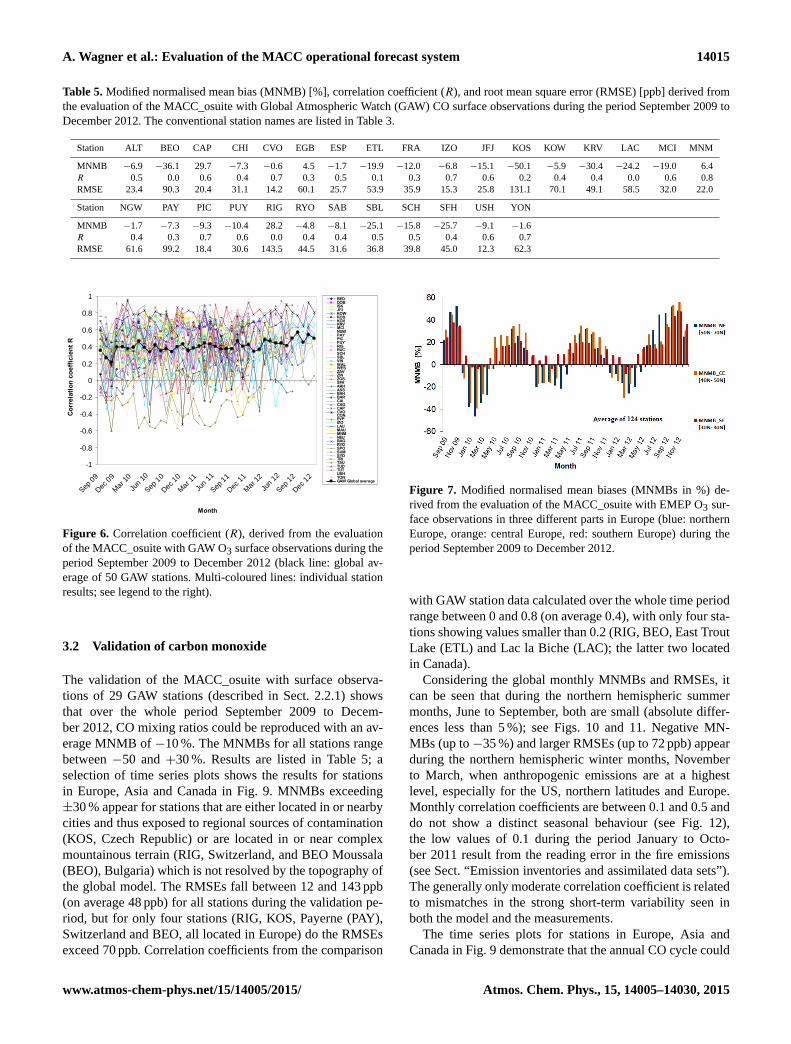
not show a distinct seasonal behaviour (see Fig. 6).
The time series plots in Fig. 3 show that the seasonal cy-
cle of O3 mixing ratios with maximum concentrations dur-
ing the summer months and minimum values occurring dur-
ing winter times for European stations (e.g. Monte Cimone
www.atmos-chem-phys.net/15/14005/2015/ Atmos. Chem. Phys., 15, 14005–14030, 2015
14014 A. Wagner et al.: Evaluation of the MACC operational forecast system
Table 4. Modified normalised mean bias (MNMB) [%], correlation coefficient (R), and root mean square error (RMSE) [ppb] derived from
the evaluation of the MACC_osuite with Global Atmosphere Watch (GAW) O3 surface observations during the period September 2009 to
December 2012. The conventional station names are listed in Table 3.
Station ARH ASS BAH BAR BEO CAI CAG CAP CVO CON DOB EVP ISK IZO JFJ KOW KOS
MNMB −39.8 −6.3 −8.6 −35.1 −21.4 70.1 −12.7 13.7 15.2 −81.6 6.3 18.4 67.2 10.4 1.9 5.8 −5.9
R 0.6 0.7 0.5 0.3 0.4 −0.1 0.4 0.6 0.6 0.3 0.3 0.7 0.1 0.5 0.7 0.6 0.6
RMSE 10.6 6.5 8.0 13.8 20.4 29.2 8.9 7.6 8.0 17.2 14.3 12.0 34.5 10.8 7.4 12.0 16.3
Station KOV KRV LAU MAU MNM MCI NGW NEU PAY PIC PUY RAG RIG RUC RYO SCH SBL
MNMB 21.2 9.5 −5.5 13.7 38.6 2.3 −11.4 −45.2 −28.8 5.5 12.8 38.6 −80.3 −0.1 10.5 8.5 8.1
R 0.6 0.6 0.5 0.6 0.8 0.7 0.5 0.5 0.7 0.6 0.6 0.6 0.3 0.3 0.1 0.7 0.6
RMSE 19.5 11.1 9.0 11.5 13.0 8.2 14.3 11.4 15.6 7.7 10.6 10.6 28.4 15.0 14.4 12.2 9.3
Station SFH SPO SUM SYO TRI TSU TUD TUT USH VIN WAL WES YON ZAV ZIN ZOS
MNMB 10.1 −70.6 −24.4 −31.2 3.2 55.1 45.3 40.2 −7.0 4.6 −18.0 −12.3 22.0 19.7 −17.5 22.3
R 0.6 0.4 0.5 0.7 0.3 0.0 0.5 0.8 0.5 0.4 0.6 0.6 0.7 0.6 0.4 0.2
RMSE 9.3 16.3 11.7 8.9 13.3 27.6 18.2 8.0 7.6 11.2 13.6 11.6 13.6 18.6 13.9 17.0
-180
-140
-100
-60
-20
20
60
100
140
180
Sep 09
Dec 09
Mar 10
Jun 1
0
Sep 10
Dec 10
Mar 11
Jun 1
1
Sep 11
Dec 11
Mar 12
Jun 1
2
Sep 12
Dec 12
Month
MNM
B [%
]
BEODOBISKJFJKOWKOSKOVKRVMCINGWPAYPICPUYRIGRUCSCHSBLVINWALWESZAVZINZOSSFHARHASSBAHBARCAICAGCAPCVOCONEVPIZOLAUMAUMNMNEURAGRYOSPOSUMSYOTRITSUTUDTUTUSHYONGAW Global average
Figure 4. Modified normalised mean bias (MNMB) in % derived
from the evaluation of the MACC_osuite with GAW O3 surface
observations during the period September 2009 to December 2012
(black line: global average of 50 GAW stations. Multi-coloured
lines: individual station results; see legend to the right).
(MCI), Italy; Kosetice (KOS), Czech Republic; and Kovk
(KOV), Slovenia), could be well reproduced by the model,
although there is some overestimation in summer resulting
mostly from observed minimum concentrations that are not
captured correctly by the MACC_ osuite (KOS, Czech Re-
public, and KOV, Slovenia).
The validation with EMEP surface ozone observations
(described in Sect. 2.2.2) in three different regions in Europe
for the period September 2009 to December 2012 likewise
confirms the behaviour of the model to overestimate O3 mix-
ing ratios during the warm period and underestimate O3 con-
centrations during the cold period of the year (see Fig. 7).
The mostly positive bias (May–November) is between −9
and 56 % for northern Europe and central Europe and be-
tween 8 and 48 % for southern Europe. Negative MNMBs
appear, in accordance with GAW validation results, during
Figure 5. Root mean square error (RMSE) in ppb derived from the
evaluation of the MACC_osuite with GAW O3 surface observations
during the period September 2009 to December 2012 (black line:
global average of 50 GAW stations. Multi-coloured lines: individual
station results; see legend to the right).
the winter–spring period (December–April) ranging between
−48 and−7 % for EMEP stations in northern Europe (excep-
tion: December 2012 with 25 %), between −1 and −39 %
in central Europe (exception: December 2012 with 31 %),
whereas in southern Europe, deviations are smaller and re-
main mostly positive (between −8 and 9 %) in winter (ex-
ception: December 2012 with 37 %). The different behaviour
for December 2012 likely results from the limited availabil-
ity of observations towards the end of the validation period.
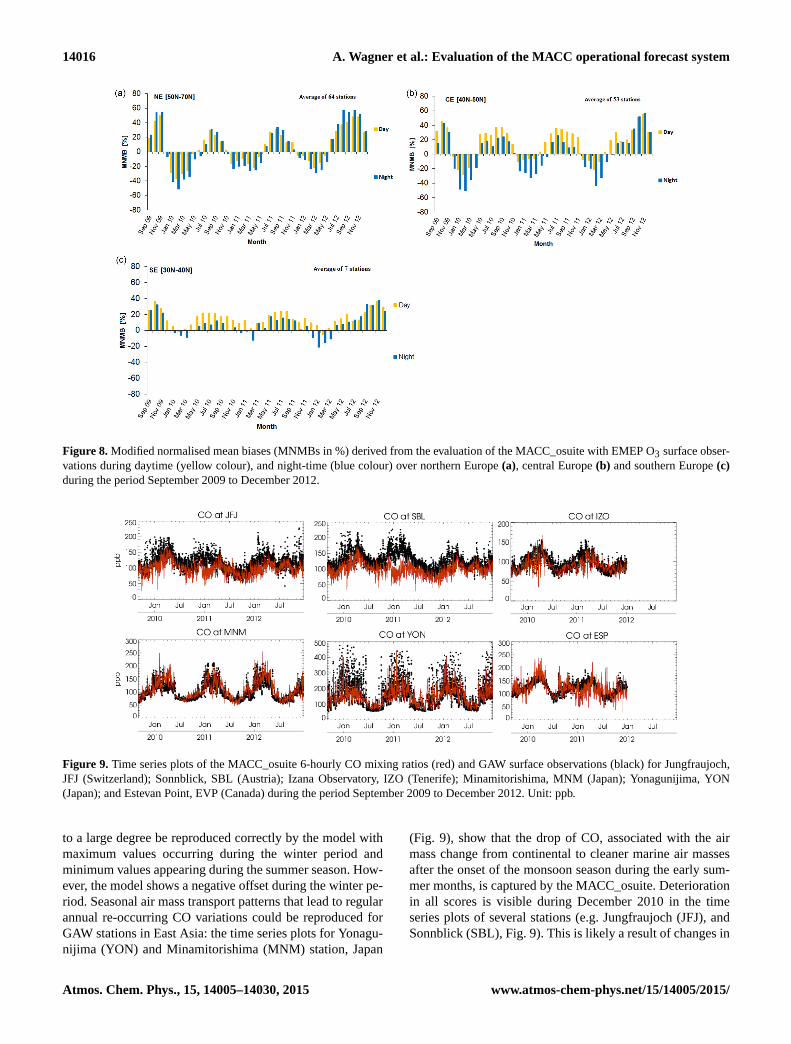
The separate evaluation of day and night-time O3 mixing ra-
tios (Fig. 8) shows that for northern Europe night-time biases
exceed daytime biases during all seasons. For central Europe
and southern Europe night-time biases are larger (negative
MNMBs) during cold periods (December–April), whereas
during warm periods (May–November) larger biases (posi-
tive MNMBs) appear during daytime.
Atmos. Chem. Phys., 15, 14005–14030, 2015 www.atmos-chem-phys.net/15/14005/2015/
A. Wagner et al.: Evaluation of the MACC operational forecast system 14015
Table 5. Modified normalised mean bias (MNMB) [%], correlation coefficient (R), and root mean square error (RMSE) [ppb] derived from
the evaluation of the MACC_osuite with Global Atmospheric Watch (GAW) CO surface observations during the period September 2009 to
December 2012. The conventional station names are listed in Table 3.
Station ALT BEO CAP CHI CVO EGB ESP ETL FRA IZO JFJ KOS KOW KRV LAC MCI MNM
MNMB −6.9 −36.1 29.7 −7.3 −0.6 4.5 −1.7 −19.9 −12.0 −6.8 −15.1 −50.1 −5.9 −30.4 −24.2 −19.0 6.4
R 0.5 0.0 0.6 0.4 0.7 0.3 0.5 0.1 0.3 0.7 0.6 0.2 0.4 0.4 0.0 0.6 0.8
RMSE 23.4 90.3 20.4 31.1 14.2 60.1 25.7 53.9 35.9 15.3 25.8 131.1 70.1 49.1 58.5 32.0 22.0
Station NGW PAY PIC PUY RIG RYO SAB SBL SCH SFH USH YON
MNMB −1.7 −7.3 −9.3 −10.4 28.2 −4.8 −8.1 −25.1 −15.8 −25.7 −9.1 −1.6
R 0.4 0.3 0.7 0.6 0.0 0.4 0.4 0.5 0.5 0.4 0.6 0.7
RMSE 61.6 99.2 18.4 30.6 143.5 44.5 31.6 36.8 39.8 45.0 12.3 62.3
-1
-0.8
-0.6
-0.4
-0.2
0
0.2
0.4
0.6
0.8
1
Sep 09
Dec 09
Mar 10
Jun 10
Sep 10
Dec 10
Mar 11
Jun 11
Sep 11
Dec 11
Mar 12
Jun 12
Sep 12
Dec 12
Month
Corr
elat
ion co
effic
ient
R
BEODOBISKJFJKOWKOSKOVKRVMCINGWPAYPICPUYRIGRUCSCHSBLVINWALWESZAVZINZOSSFHARHASSBAHBARCAICAGCAPCVOCONEVPIZOLAUMAUMNMNEURAGRYOSPOSUMSYOTRITSUTUDTUTUSHYONGAW Global average
Figure 6. Correlation coefficient (R), derived from the evaluation
of the MACC_osuite with GAW O3 surface observations during the
period September 2009 to December 2012 (black line: global av-
erage of 50 GAW stations. Multi-coloured lines: individual station
results; see legend to the right).
3.2 Validation of carbon monoxide
The validation of the MACC_osuite with surface observa-
tions of 29 GAW stations (described in Sect. 2.2.1) shows
that over the whole period September 2009 to Decem-
ber 2012, CO mixing ratios could be reproduced with an av-
erage MNMB of −10 %. The MNMBs for all stations range
between −50 and +30 %. Results are listed in Table 5; a
selection of time series plots shows the results for stations
in Europe, Asia and Canada in Fig. 9. MNMBs exceeding
±30 % appear for stations that are either located in or nearby
cities and thus exposed to regional sources of contamination
(KOS, Czech Republic) or are located in or near complex
mountainous terrain (RIG, Switzerland, and BEO Moussala
(BEO), Bulgaria) which is not resolved by the topography of
the global model. The RMSEs fall between 12 and 143 ppb
(on average 48 ppb) for all stations during the validation pe-
riod, but for only four stations (RIG, KOS, Payerne (PAY),
Switzerland and BEO, all located in Europe) do the RMSEs
exceed 70 ppb. Correlation coefficients from the comparison
Figure 7. Modified normalised mean biases (MNMBs in %) de-
rived from the evaluation of the MACC_osuite with EMEP O3 sur-
face observations in three different parts in Europe (blue: northern
Europe, orange: central Europe, red: southern Europe) during the
period September 2009 to December 2012.
with GAW station data calculated over the whole time period
range between 0 and 0.8 (on average 0.4), with only four sta-
tions showing values smaller than 0.2 (RIG, BEO, East Trout
Lake (ETL) and Lac la Biche (LAC); the latter two located
in Canada).
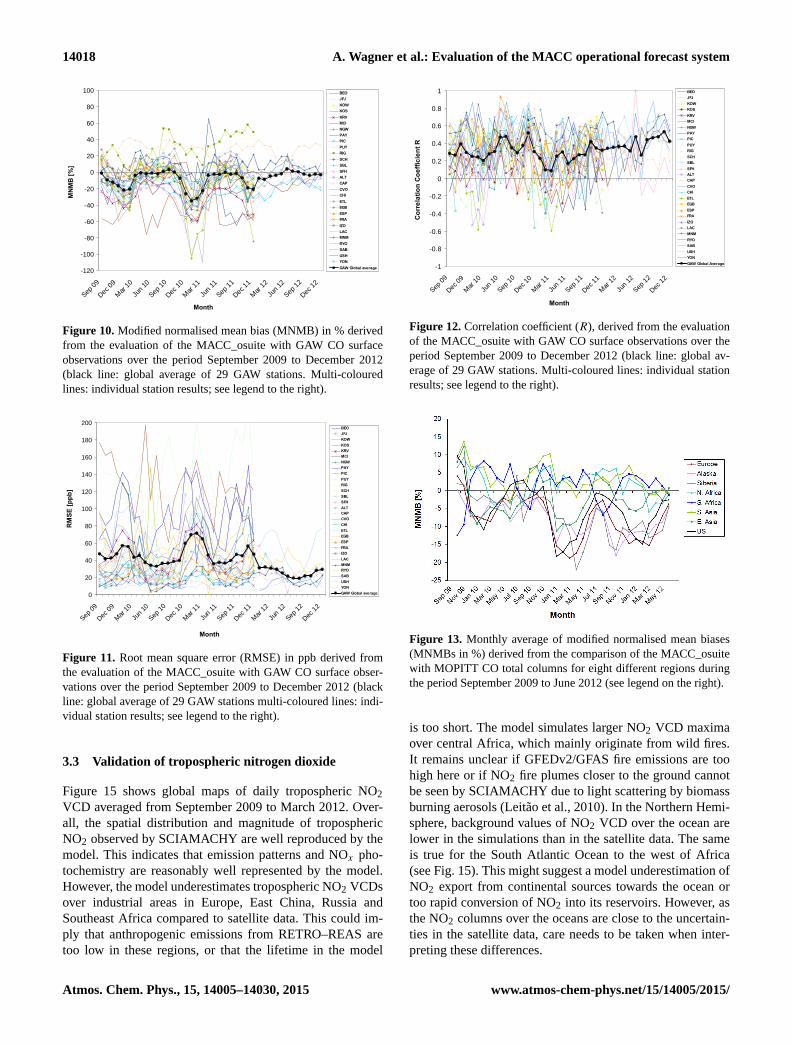
Considering the global monthly MNMBs and RMSEs, it
can be seen that during the northern hemispheric summer
months, June to September, both are small (absolute differ-
ences less than 5 %); see Figs. 10 and 11. Negative MN-
MBs (up to −35 %) and larger RMSEs (up to 72 ppb) appear
during the northern hemispheric winter months, November
to March, when anthropogenic emissions are at a highest
level, especially for the US, northern latitudes and Europe.
Monthly correlation coefficients are between 0.1 and 0.5 and
do not show a distinct seasonal behaviour (see Fig. 12),
the low values of 0.1 during the period January to Octo-
ber 2011 result from the reading error in the fire emissions
(see Sect. “Emission inventories and assimilated data sets”).
The generally only moderate correlation coefficient is related
to mismatches in the strong short-term variability seen in
both the model and the measurements.
The time series plots for stations in Europe, Asia and
Canada in Fig. 9 demonstrate that the annual CO cycle could
www.atmos-chem-phys.net/15/14005/2015/ Atmos. Chem. Phys., 15, 14005–14030, 2015
14016 A. Wagner et al.: Evaluation of the MACC operational forecast system
Figure 8. Modified normalised mean biases (MNMBs in %) derived from the evaluation of the MACC_osuite with EMEP O3 surface obser-
vations during daytime (yellow colour), and night-time (blue colour) over northern Europe (a), central Europe (b) and southern Europe (c)
during the period September 2009 to December 2012.
Figure 9. Time series plots of the MACC_osuite 6-hourly CO mixing ratios (red) and GAW surface observations (black) for Jungfraujoch,
JFJ (Switzerland); Sonnblick, SBL (Austria); Izana Observatory, IZO (Tenerife); Minamitorishima, MNM (Japan); Yonagunijima, YON
(Japan); and Estevan Point, EVP (Canada) during the period September 2009 to December 2012. Unit: ppb.
to a large degree be reproduced correctly by the model with
maximum values occurring during the winter period and
minimum values appearing during the summer season. How-
ever, the model shows a negative offset during the winter pe-
riod. Seasonal air mass transport patterns that lead to regular
annual re-occurring CO variations could be reproduced for
GAW stations in East Asia: the time series plots for Yonagu-
nijima (YON) and Minamitorishima (MNM) station, Japan
(Fig. 9), show that the drop of CO, associated with the air
mass change from continental to cleaner marine air masses
after the onset of the monsoon season during the early sum-
mer months, is captured by the MACC_osuite. Deterioration
in all scores is visible during December 2010 in the time
series plots of several stations (e.g. Jungfraujoch (JFJ), and
Sonnblick (SBL), Fig. 9). This is likely a result of changes in
Atmos. Chem. Phys., 15, 14005–14030, 2015 www.atmos-chem-phys.net/15/14005/2015/
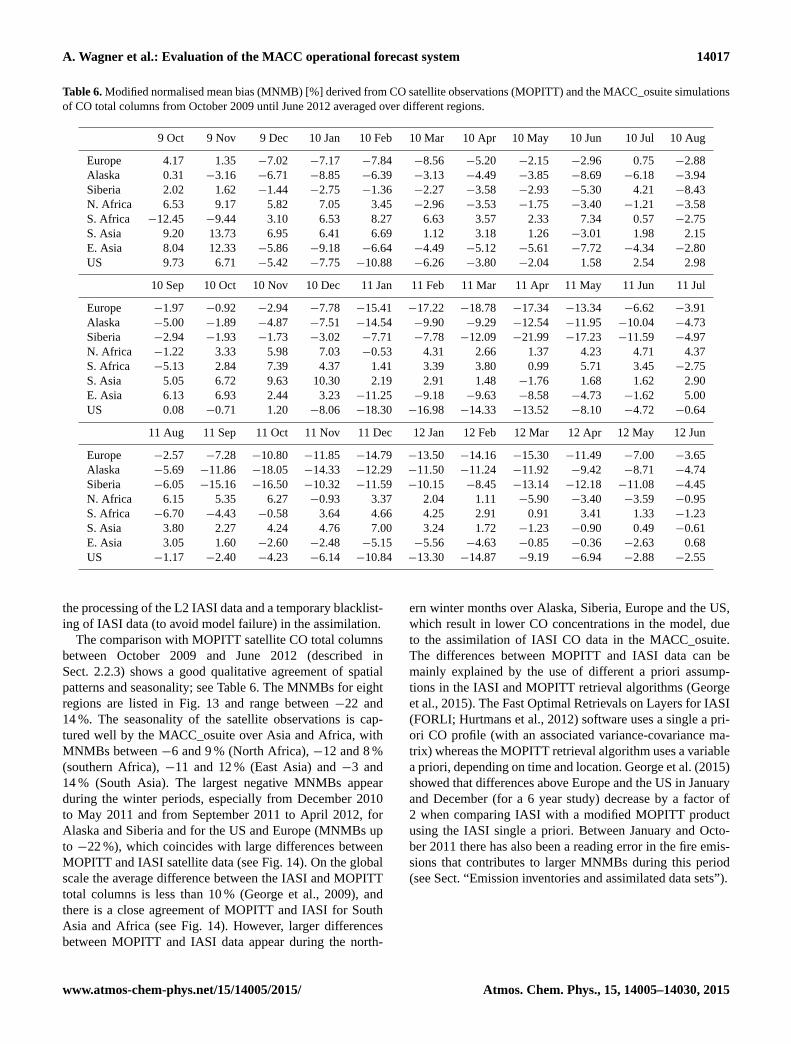
A. Wagner et al.: Evaluation of the MACC operational forecast system 14017
Table 6. Modified normalised mean bias (MNMB) [%] derived from CO satellite observations (MOPITT) and the MACC_osuite simulations
of CO total columns from October 2009 until June 2012 averaged over different regions.
9 Oct 9 Nov 9 Dec 10 Jan 10 Feb 10 Mar 10 Apr 10 May 10 Jun 10 Jul 10 Aug
Europe 4.17 1.35 −7.02 −7.17 −7.84 −8.56 −5.20 −2.15 −2.96 0.75 −2.88
Alaska 0.31 −3.16 −6.71 −8.85 −6.39 −3.13 −4.49 −3.85 −8.69 −6.18 −3.94
Siberia 2.02 1.62 −1.44 −2.75 −1.36 −2.27 −3.58 −2.93 −5.30 4.21 −8.43
N. Africa 6.53 9.17 5.82 7.05 3.45 −2.96 −3.53 −1.75 −3.40 −1.21 −3.58
S. Africa −12.45 −9.44 3.10 6.53 8.27 6.63 3.57 2.33 7.34 0.57 −2.75
S. Asia 9.20 13.73 6.95 6.41 6.69 1.12 3.18 1.26 −3.01 1.98 2.15
E. Asia 8.04 12.33 −5.86 −9.18 −6.64 −4.49 −5.12 −5.61 −7.72 −4.34 −2.80
US 9.73 6.71 −5.42 −7.75 −10.88 −6.26 −3.80 −2.04 1.58 2.54 2.98
10 Sep 10 Oct 10 Nov 10 Dec 11 Jan 11 Feb 11 Mar 11 Apr 11 May 11 Jun 11 Jul
Europe −1.97 −0.92 −2.94 −7.78 −15.41 −17.22 −18.78 −17.34 −13.34 −6.62 −3.91
Alaska −5.00 −1.89 −4.87 −7.51 −14.54 −9.90 −9.29 −12.54 −11.95 −10.04 −4.73
Siberia −2.94 −1.93 −1.73 −3.02 −7.71 −7.78 −12.09 −21.99 −17.23 −11.59 −4.97
N. Africa −1.22 3.33 5.98 7.03 −0.53 4.31 2.66 1.37 4.23 4.71 4.37
S. Africa −5.13 2.84 7.39 4.37 1.41 3.39 3.80 0.99 5.71 3.45 −2.75
S. Asia 5.05 6.72 9.63 10.30 2.19 2.91 1.48 −1.76 1.68 1.62 2.90
E. Asia 6.13 6.93 2.44 3.23 −11.25 −9.18 −9.63 −8.58 −4.73 −1.62 5.00
US 0.08 −0.71 1.20 −8.06 −18.30 −16.98 −14.33 −13.52 −8.10 −4.72 −0.64
11 Aug 11 Sep 11 Oct 11 Nov 11 Dec 12 Jan 12 Feb 12 Mar 12 Apr 12 May 12 Jun
Europe −2.57 −7.28 −10.80 −11.85 −14.79 −13.50 −14.16 −15.30 −11.49 −7.00 −3.65
Alaska −5.69 −11.86 −18.05 −14.33 −12.29 −11.50 −11.24 −11.92 −9.42 −8.71 −4.74
Siberia −6.05 −15.16 −16.50 −10.32 −11.59 −10.15 −8.45 −13.14 −12.18 −11.08 −4.45
N. Africa 6.15 5.35 6.27 −0.93 3.37 2.04 1.11 −5.90 −3.40 −3.59 −0.95
S. Africa −6.70 −4.43 −0.58 3.64 4.66 4.25 2.91 0.91 3.41 1.33 −1.23
S. Asia 3.80 2.27 4.24 4.76 7.00 3.24 1.72 −1.23 −0.90 0.49 −0.61
E. Asia 3.05 1.60 −2.60 −2.48 −5.15 −5.56 −4.63 −0.85 −0.36 −2.63 0.68
US −1.17 −2.40 −4.23 −6.14 −10.84 −13.30 −14.87 −9.19 −6.94 −2.88 −2.55
the processing of the L2 IASI data and a temporary blacklist-
ing of IASI data (to avoid model failure) in the assimilation.
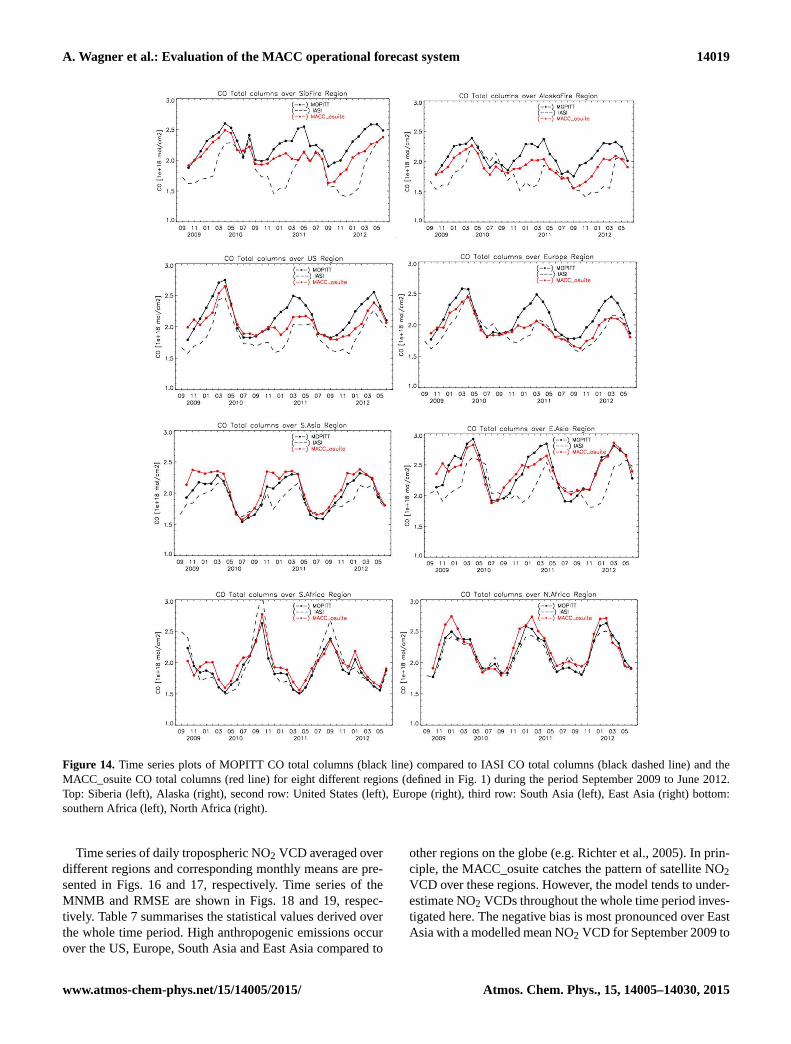
The comparison with MOPITT satellite CO total columns
between October 2009 and June 2012 (described in
Sect. 2.2.3) shows a good qualitative agreement of spatial
patterns and seasonality; see Table 6. The MNMBs for eight
regions are listed in Fig. 13 and range between −22 and
14 %. The seasonality of the satellite observations is cap-
tured well by the MACC_osuite over Asia and Africa, with
MNMBs between −6 and 9 % (North Africa), −12 and 8 %
(southern Africa), −11 and 12 % (East Asia) and −3 and
14 % (South Asia). The largest negative MNMBs appear
during the winter periods, especially from December 2010
to May 2011 and from September 2011 to April 2012, for
Alaska and Siberia and for the US and Europe (MNMBs up
to −22 %), which coincides with large differences between
MOPITT and IASI satellite data (see Fig. 14). On the global
scale the average difference between the IASI and MOPITT
total columns is less than 10 % (George et al., 2009), and
there is a close agreement of MOPITT and IASI for South
Asia and Africa (see Fig. 14). However, larger differences
between MOPITT and IASI data appear during the north-
ern winter months over Alaska, Siberia, Europe and the US,
which result in lower CO concentrations in the model, due
to the assimilation of IASI CO data in the MACC_osuite.
The differences between MOPITT and IASI data can be
mainly explained by the use of different a priori assump-
tions in the IASI and MOPITT retrieval algorithms (George
et al., 2015). The Fast Optimal Retrievals on Layers for IASI
(FORLI; Hurtmans et al., 2012) software uses a single a pri-
ori CO profile (with an associated variance-covariance ma-
trix) whereas the MOPITT retrieval algorithm uses a variable
a priori, depending on time and location. George et al. (2015)
showed that differences above Europe and the US in January
and December (for a 6 year study) decrease by a factor of
2 when comparing IASI with a modified MOPITT product
using the IASI single a priori. Between January and Octo-
ber 2011 there has also been a reading error in the fire emis-
sions that contributes to larger MNMBs during this period
(see Sect. “Emission inventories and assimilated data sets”).
www.atmos-chem-phys.net/15/14005/2015/ Atmos. Chem. Phys., 15, 14005–14030, 2015
14018 A. Wagner et al.: Evaluation of the MACC operational forecast system
-120
-100
-80
-60
-40
-20
0
20
40
60
80
100
Sep 09
Dec 09
Mar 10
Jun 1
0
Sep 10
Dec 10
Mar 11
Jun 1
1
Sep 11
Dec 11
Mar 12
Jun 1
2
Sep 12
Dec 12
Month
MNM
B [%
]
BEOJFJKOWKOSKRVMCINGWPAYPICPUYRIGSCHSBLSFHALTCAPCVOCHIETLEGBESPFRAIZOLACMNMRYOSABUSHYONGAW Global average
Figure 10. Modified normalised mean bias (MNMB) in % derived
from the evaluation of the MACC_osuite with GAW CO surface
observations over the period September 2009 to December 2012
(black line: global average of 29 GAW stations. Multi-coloured
lines: individual station results; see legend to the right).
0
20
40
60
80
100
120
140
160
180
200
Sep 09
Dec 09
Mar 10
Jun 1
0
Sep 10
Dec 10
Mar 11
Jun 1
1
Sep 11
Dec 11
Mar 12
Jun 1
2
Sep 12
Dec 12
Month
RMSE
[ppb
]
BEOJFJKOWKOSKRVMCINGWPAYPICPUYRIGSCHSBLSFHALTCAPCVOCHIETLEGBESPFRAIZOLACMNMRYOSABUSHYONGAW Global average
Figure 11. Root mean square error (RMSE) in ppb derived from
the evaluation of the MACC_osuite with GAW CO surface obser-
vations over the period September 2009 to December 2012 (black
line: global average of 29 GAW stations multi-coloured lines: indi-
vidual station results; see legend to the right).
3.3 Validation of tropospheric nitrogen dioxide
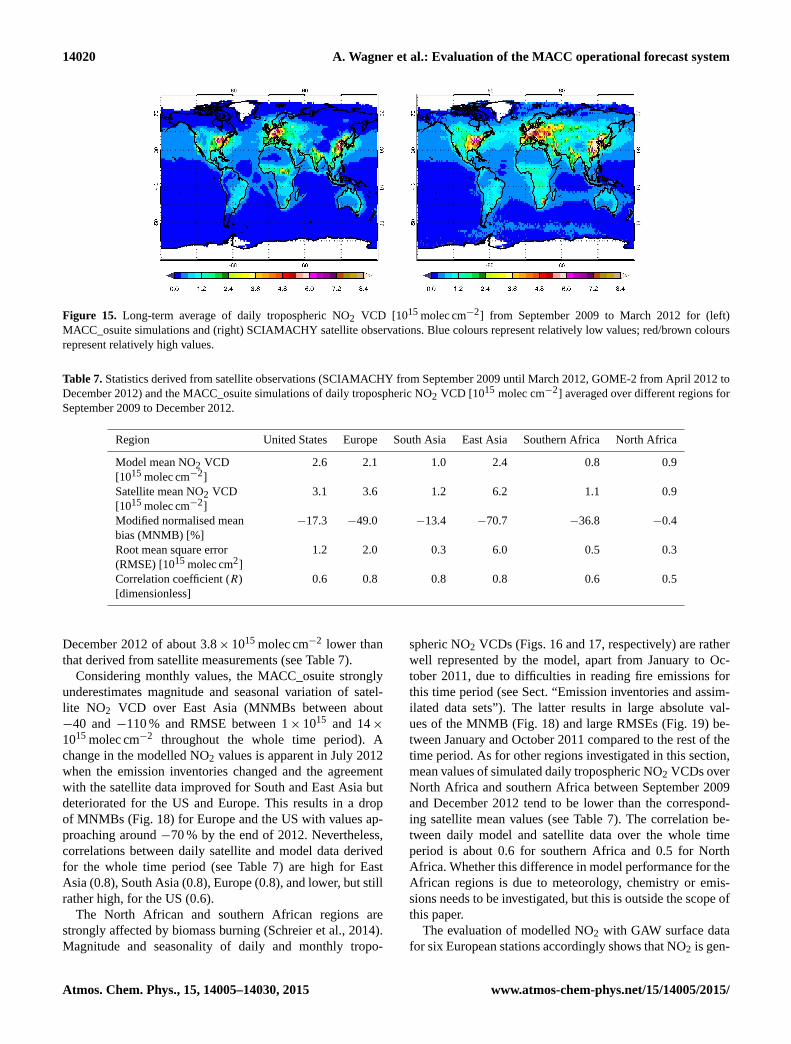
Figure 15 shows global maps of daily tropospheric NO2
VCD averaged from September 2009 to March 2012. Over-
all, the spatial distribution and magnitude of tropospheric
NO2 observed by SCIAMACHY are well reproduced by the
model. This indicates that emission patterns and NOx pho-
tochemistry are reasonably well represented by the model.
However, the model underestimates tropospheric NO2 VCDs
over industrial areas in Europe, East China, Russia and
Southeast Africa compared to satellite data. This could im-
ply that anthropogenic emissions from RETRO–REAS are
too low in these regions, or that the lifetime in the model
-1
-0.8
-0.6
-0.4
-0.2
0
0.2
0.4
0.6
0.8
1
Sep 09
Dec 09
Mar 10
Jun 1
0
Sep 10
Dec 10
Mar 11
Jun 1
1
Sep 11
Dec 11
Mar 12
Jun 1
2
Sep 12
Dec 12
Month
Corr
elat
ion
Coef
ficie
nt R
BEOJFJKOWKOSKRVMCINGWPAYPICPUYRIGSCHSBLSFHALTCAPCVOCHIETLEGBESPFRAIZOLACMNMRYOSABUSHYONGAW Global Average
Figure 12. Correlation coefficient (R), derived from the evaluation
of the MACC_osuite with GAW CO surface observations over the
period September 2009 to December 2012 (black line: global av-
erage of 29 GAW stations. Multi-coloured lines: individual station
results; see legend to the right).
Figure 13. Monthly average of modified normalised mean biases
(MNMBs in %) derived from the comparison of the MACC_osuite
with MOPITT CO total columns for eight different regions during
the period September 2009 to June 2012 (see legend on the right).
is too short. The model simulates larger NO2 VCD maxima
over central Africa, which mainly originate from wild fires.
It remains unclear if GFEDv2/GFAS fire emissions are too
high here or if NO2 fire plumes closer to the ground cannot
be seen by SCIAMACHY due to light scattering by biomass
burning aerosols (Leitão et al., 2010). In the Northern Hemi-
sphere, background values of NO2 VCD over the ocean are
lower in the simulations than in the satellite data. The same
is true for the South Atlantic Ocean to the west of Africa
(see Fig. 15). This might suggest a model underestimation of
NO2 export from continental sources towards the ocean or
too rapid conversion of NO2 into its reservoirs. However, as
the NO2 columns over the oceans are close to the uncertain-
ties in the satellite data, care needs to be taken when inter-
preting these differences.
Atmos. Chem. Phys., 15, 14005–14030, 2015 www.atmos-chem-phys.net/15/14005/2015/
A. Wagner et al.: Evaluation of the MACC operational forecast system 14019
Figure 14. Time series plots of MOPITT CO total columns (black line) compared to IASI CO total columns (black dashed line) and the
MACC_osuite CO total columns (red line) for eight different regions (defined in Fig. 1) during the period September 2009 to June 2012.
Top: Siberia (left), Alaska (right), second row: United States (left), Europe (right), third row: South Asia (left), East Asia (right) bottom:
southern Africa (left), North Africa (right).
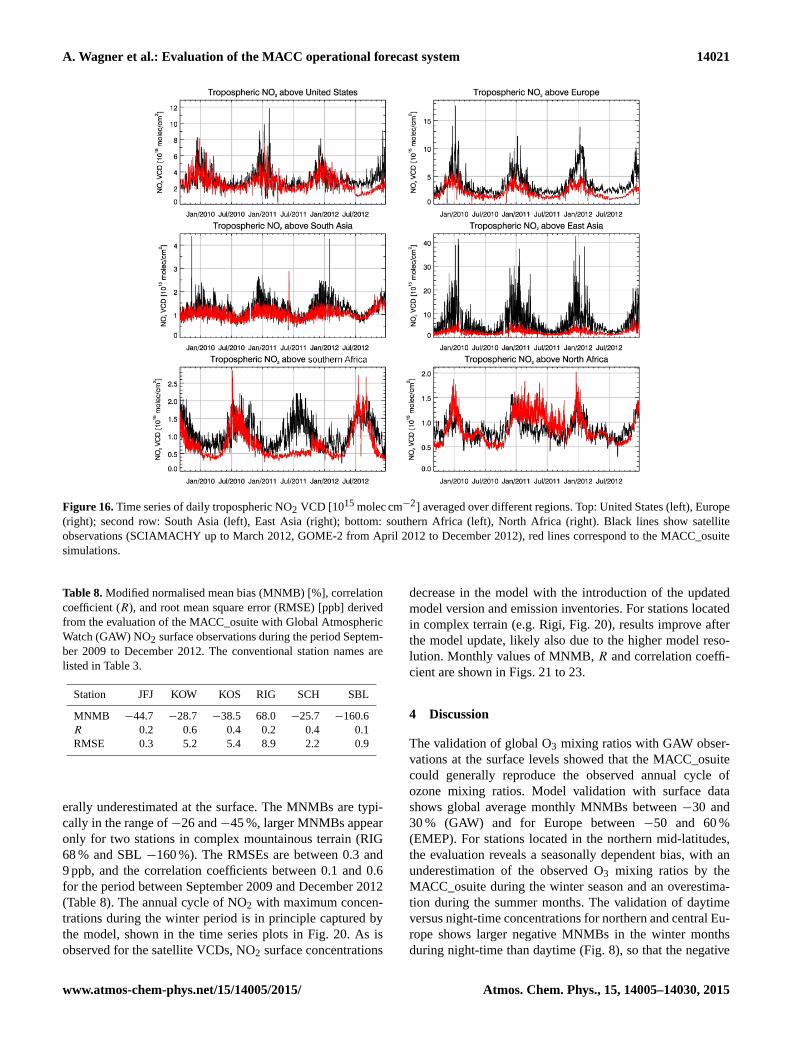
Time series of daily tropospheric NO2 VCD averaged over
different regions and corresponding monthly means are pre-
sented in Figs. 16 and 17, respectively. Time series of the
MNMB and RMSE are shown in Figs. 18 and 19, respec-
tively. Table 7 summarises the statistical values derived over
the whole time period. High anthropogenic emissions occur
over the US, Europe, South Asia and East Asia compared to
other regions on the globe (e.g. Richter et al., 2005). In prin-
ciple, the MACC_osuite catches the pattern of satellite NO2
VCD over these regions. However, the model tends to under-
estimate NO2 VCDs throughout the whole time period inves-
tigated here. The negative bias is most pronounced over East
Asia with a modelled mean NO2 VCD for September 2009 to
www.atmos-chem-phys.net/15/14005/2015/ Atmos. Chem. Phys., 15, 14005–14030, 2015
14020 A. Wagner et al.: Evaluation of the MACC operational forecast system
Figure 15. Long-term average of daily tropospheric NO2 VCD [1015 molec cm−2] from September 2009 to March 2012 for (left)
MACC_osuite simulations and (right) SCIAMACHY satellite observations. Blue colours represent relatively low values; red/brown colours
represent relatively high values.
Table 7. Statistics derived from satellite observations (SCIAMACHY from September 2009 until March 2012, GOME-2 from April 2012 to
December 2012) and the MACC_osuite simulations of daily tropospheric NO2 VCD [1015 molec cm−2] averaged over different regions for
September 2009 to December 2012.
Region United States Europe South Asia East Asia Southern Africa North Africa
Model mean NO2 VCD
[1015 molec cm−2]
2.6 2.1 1.0 2.4 0.8 0.9
Satellite mean NO2 VCD
[1015 molec cm−2]
3.1 3.6 1.2 6.2 1.1 0.9
Modified normalised mean
bias (MNMB) [%]
−17.3 −49.0 −13.4 −70.7 −36.8 −0.4
Root mean square error
(RMSE) [1015 molec cm2]
1.2 2.0 0.3 6.0 0.5 0.3
Correlation coefficient (R)
[dimensionless]
0.6 0.8 0.8 0.8 0.6 0.5
December 2012 of about 3.8× 10¹⁵ molec cm−2 lower than
that derived from satellite measurements (see Table 7).
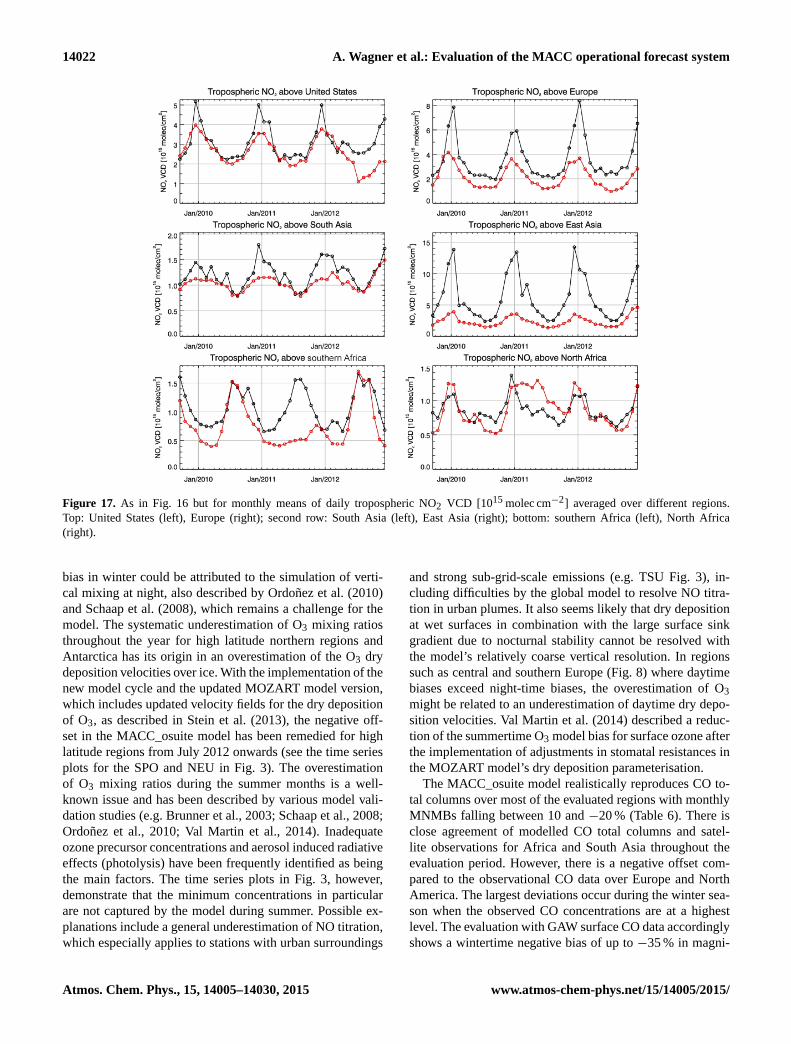
Considering monthly values, the MACC_osuite strongly
underestimates magnitude and seasonal variation of satel-
lite NO2 VCD over East Asia (MNMBs between about
−40 and −110 % and RMSE between 1× 10¹⁵ and 14×
1015 molec cm−2 throughout the whole time period). A
change in the modelled NO2 values is apparent in July 2012
when the emission inventories changed and the agreement
with the satellite data improved for South and East Asia but
deteriorated for the US and Europe. This results in a drop
of MNMBs (Fig. 18) for Europe and the US with values ap-
proaching around −70 % by the end of 2012. Nevertheless,
correlations between daily satellite and model data derived
for the whole time period (see Table 7) are high for East
Asia (0.8), South Asia (0.8), Europe (0.8), and lower, but still
rather high, for the US (0.6).
The North African and southern African regions are
strongly affected by biomass burning (Schreier et al., 2014).
Magnitude and seasonality of daily and monthly tropo-
spheric NO2 VCDs (Figs. 16 and 17, respectively) are rather
well represented by the model, apart from January to Oc-
tober 2011, due to difficulties in reading fire emissions for
this time period (see Sect. “Emission inventories and assim-
ilated data sets”). The latter results in large absolute val-
ues of the MNMB (Fig. 18) and large RMSEs (Fig. 19) be-
tween January and October 2011 compared to the rest of the
time period. As for other regions investigated in this section,
mean values of simulated daily tropospheric NO2 VCDs over
North Africa and southern Africa between September 2009
and December 2012 tend to be lower than the correspond-
ing satellite mean values (see Table 7). The correlation be-
tween daily model and satellite data over the whole time
period is about 0.6 for southern Africa and 0.5 for North
Africa. Whether this difference in model performance for the
African regions is due to meteorology, chemistry or emis-
sions needs to be investigated, but this is outside the scope of
this paper.
The evaluation of modelled NO2 with GAW surface data
for six European stations accordingly shows that NO2 is gen-
Atmos. Chem. Phys., 15, 14005–14030, 2015 www.atmos-chem-phys.net/15/14005/2015/
A. Wagner et al.: Evaluation of the MACC operational forecast system 14021
Figure 16. Time series of daily tropospheric NO2 VCD [1015 molec cm−2] averaged over different regions. Top: United States (left), Europe
(right); second row: South Asia (left), East Asia (right); bottom: southern Africa (left), North Africa (right). Black lines show satellite
observations (SCIAMACHY up to March 2012, GOME-2 from April 2012 to December 2012), red lines correspond to the MACC_osuite
simulations.
Table 8. Modified normalised mean bias (MNMB) [%], correlation
coefficient (R), and root mean square error (RMSE) [ppb] derived
from the evaluation of the MACC_osuite with Global Atmospheric
Watch (GAW) NO2 surface observations during the period Septem-
ber 2009 to December 2012. The conventional station names are
listed in Table 3.
Station JFJ KOW KOS RIG SCH SBL
MNMB −44.7 −28.7 −38.5 68.0 −25.7 −160.6
R 0.2 0.6 0.4 0.2 0.4 0.1
RMSE 0.3 5.2 5.4 8.9 2.2 0.9
erally underestimated at the surface. The MNMBs are typi-
cally in the range of −26 and −45 %, larger MNMBs appear
only for two stations in complex mountainous terrain (RIG
68 % and SBL −160 %). The RMSEs are between 0.3 and
9 ppb, and the correlation coefficients between 0.1 and 0.6
for the period between September 2009 and December 2012
(Table 8). The annual cycle of NO2 with maximum concen-
trations during the winter period is in principle captured by
the model, shown in the time series plots in Fig. 20. As is
observed for the satellite VCDs, NO2 surface concentrations
decrease in the model with the introduction of the updated
model version and emission inventories. For stations located
in complex terrain (e.g. Rigi, Fig. 20), results improve after
the model update, likely also due to the higher model reso-
lution. Monthly values of MNMB, R and correlation coeffi-
cient are shown in Figs. 21 to 23.
4 Discussion
The validation of global O3 mixing ratios with GAW obser-
vations at the surface levels showed that the MACC_osuite
could generally reproduce the observed annual cycle of
ozone mixing ratios. Model validation with surface data
shows global average monthly MNMBs between −30 and
30 % (GAW) and for Europe between −50 and 60 %
(EMEP). For stations located in the northern mid-latitudes,
the evaluation reveals a seasonally dependent bias, with an
underestimation of the observed O3 mixing ratios by the
MACC_osuite during the winter season and an overestima-
tion during the summer months. The validation of daytime
versus night-time concentrations for northern and central Eu-
rope shows larger negative MNMBs in the winter months
during night-time than daytime (Fig. 8), so that the negative
www.atmos-chem-phys.net/15/14005/2015/ Atmos. Chem. Phys., 15, 14005–14030, 2015
14022 A. Wagner et al.: Evaluation of the MACC operational forecast system
Figure 17. As in Fig. 16 but for monthly means of daily tropospheric NO2 VCD [1015 molec cm−2] averaged over different regions.
Top: United States (left), Europe (right); second row: South Asia (left), East Asia (right); bottom: southern Africa (left), North Africa
(right).
bias in winter could be attributed to the simulation of verti-
cal mixing at night, also described by Ordoñez et al. (2010)
and Schaap et al. (2008), which remains a challenge for the
model. The systematic underestimation of O3 mixing ratios
throughout the year for high latitude northern regions and
Antarctica has its origin in an overestimation of the O3 dry
deposition velocities over ice. With the implementation of the
new model cycle and the updated MOZART model version,
which includes updated velocity fields for the dry deposition
of O3, as described in Stein et al. (2013), the negative off-
set in the MACC_osuite model has been remedied for high
latitude regions from July 2012 onwards (see the time series
plots for the SPO and NEU in Fig. 3). The overestimation
of O3 mixing ratios during the summer months is a well-
known issue and has been described by various model vali-
dation studies (e.g. Brunner et al., 2003; Schaap et al., 2008;
Ordoñez et al., 2010; Val Martin et al., 2014). Inadequate
ozone precursor concentrations and aerosol induced radiative
effects (photolysis) have been frequently identified as being
the main factors. The time series plots in Fig. 3, however,
demonstrate that the minimum concentrations in particular
are not captured by the model during summer. Possible ex-
planations include a general underestimation of NO titration,
which especially applies to stations with urban surroundings
and strong sub-grid-scale emissions (e.g. TSU Fig. 3), in-
cluding difficulties by the global model to resolve NO titra-
tion in urban plumes. It also seems likely that dry deposition
at wet surfaces in combination with the large surface sink
gradient due to nocturnal stability cannot be resolved with
the model’s relatively coarse vertical resolution. In regions
such as central and southern Europe (Fig. 8) where daytime
biases exceed night-time biases, the overestimation of O3
might be related to an underestimation of daytime dry depo-
sition velocities. Val Martin et al. (2014) described a reduc-
tion of the summertime O3 model bias for surface ozone after
the implementation of adjustments in stomatal resistances in
the MOZART model’s dry deposition parameterisation.
The MACC_osuite model realistically reproduces CO to-
tal columns over most of the evaluated regions with monthly
MNMBs falling between 10 and −20 % (Table 6). There is
close agreement of modelled CO total columns and satel-
lite observations for Africa and South Asia throughout the
evaluation period. However, there is a negative offset com-
pared to the observational CO data over Europe and North
America. The largest deviations occur during the winter sea-
son when the observed CO concentrations are at a highest
level. The evaluation with GAW surface CO data accordingly
shows a wintertime negative bias of up to −35 % in magni-
Atmos. Chem. Phys., 15, 14005–14030, 2015 www.atmos-chem-phys.net/15/14005/2015/
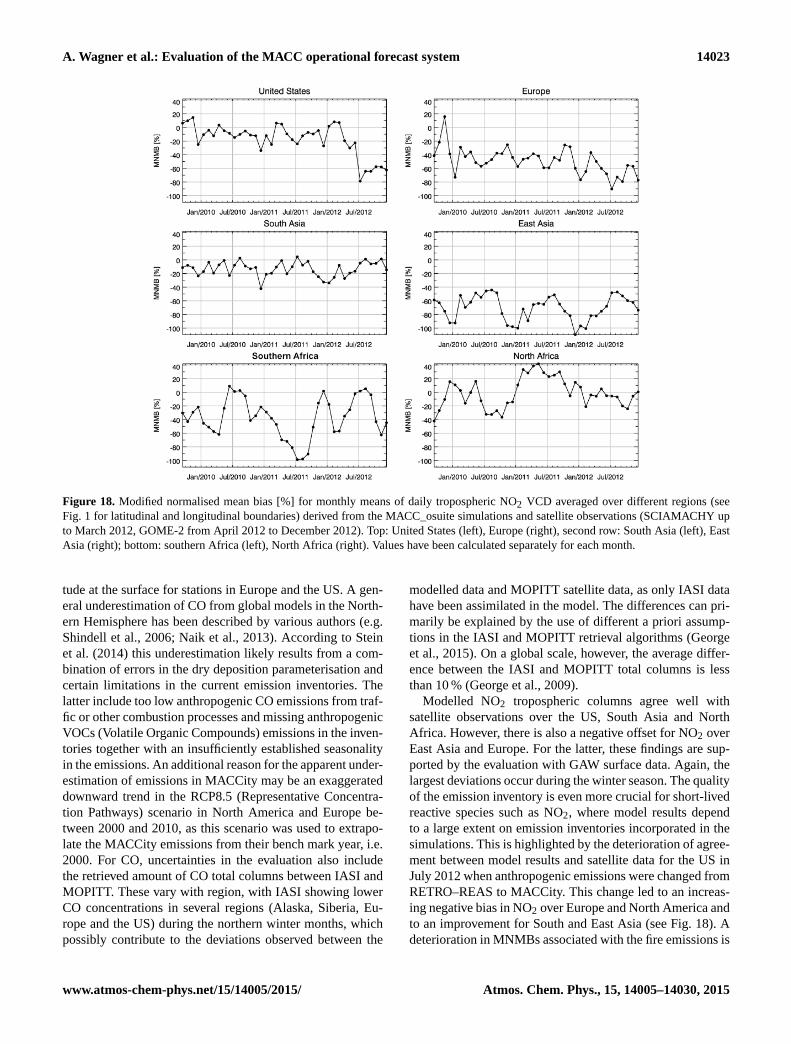
A. Wagner et al.: Evaluation of the MACC operational forecast system 14023
Figure 18. Modified normalised mean bias [%] for monthly means of daily tropospheric NO2 VCD averaged over different regions (see
Fig. 1 for latitudinal and longitudinal boundaries) derived from the MACC_osuite simulations and satellite observations (SCIAMACHY up
to March 2012, GOME-2 from April 2012 to December 2012). Top: United States (left), Europe (right), second row: South Asia (left), East
Asia (right); bottom: southern Africa (left), North Africa (right). Values have been calculated separately for each month.
tude at the surface for stations in Europe and the US. A gen-
eral underestimation of CO from global models in the North-
ern Hemisphere has been described by various authors (e.g.
Shindell et al., 2006; Naik et al., 2013). According to Stein
et al. (2014) this underestimation likely results from a com-
bination of errors in the dry deposition parameterisation and
certain limitations in the current emission inventories. The
latter include too low anthropogenic CO emissions from traf-
fic or other combustion processes and missing anthropogenic
VOCs (Volatile Organic Compounds) emissions in the inven-
tories together with an insufficiently established seasonality
in the emissions. An additional reason for the apparent under-
estimation of emissions in MACCity may be an exaggerated
downward trend in the RCP8.5 (Representative Concentra-
tion Pathways) scenario in North America and Europe be-
tween 2000 and 2010, as this scenario was used to extrapo-
late the MACCity emissions from their bench mark year, i.e.
2000. For CO, uncertainties in the evaluation also include
the retrieved amount of CO total columns between IASI and
MOPITT. These vary with region, with IASI showing lower
CO concentrations in several regions (Alaska, Siberia, Eu-
rope and the US) during the northern winter months, which
possibly contribute to the deviations observed between the
modelled data and MOPITT satellite data, as only IASI data
have been assimilated in the model. The differences can pri-
marily be explained by the use of different a priori assump-
tions in the IASI and MOPITT retrieval algorithms (George
et al., 2015). On a global scale, however, the average differ-
ence between the IASI and MOPITT total columns is less
than 10 % (George et al., 2009).
Modelled NO2 tropospheric columns agree well with
satellite observations over the US, South Asia and North
Africa. However, there is also a negative offset for NO2 over
East Asia and Europe. For the latter, these findings are sup-
ported by the evaluation with GAW surface data. Again, the
largest deviations occur during the winter season. The quality
of the emission inventory is even more crucial for short-lived
reactive species such as NO2, where model results depend
to a large extent on emission inventories incorporated in the
simulations. This is highlighted by the deterioration of agree-
ment between model results and satellite data for the US in
July 2012 when anthropogenic emissions were changed from
RETRO–REAS to MACCity. This change led to an increas-
ing negative bias in NO2 over Europe and North America and
to an improvement for South and East Asia (see Fig. 18). A
deterioration in MNMBs associated with the fire emissions is
www.atmos-chem-phys.net/15/14005/2015/ Atmos. Chem. Phys., 15, 14005–14030, 2015
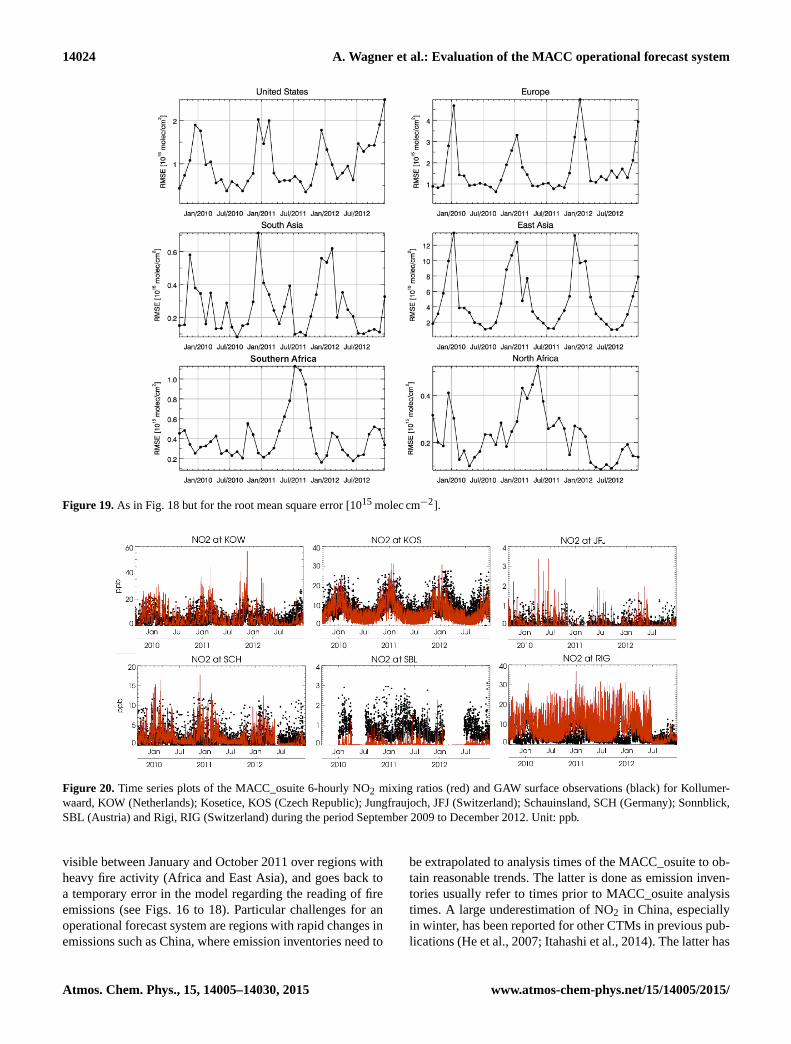
14024 A. Wagner et al.: Evaluation of the MACC operational forecast system
Figure 19. As in Fig. 18 but for the root mean square error [1015 molec cm−2].
Figure 20. Time series plots of the MACC_osuite 6-hourly NO2 mixing ratios (red) and GAW surface observations (black) for Kollumer-
waard, KOW (Netherlands); Kosetice, KOS (Czech Republic); Jungfraujoch, JFJ (Switzerland); Schauinsland, SCH (Germany); Sonnblick,
SBL (Austria) and Rigi, RIG (Switzerland) during the period September 2009 to December 2012. Unit: ppb.
visible between January and October 2011 over regions with
heavy fire activity (Africa and East Asia), and goes back to
a temporary error in the model regarding the reading of fire
emissions (see Figs. 16 to 18). Particular challenges for an
operational forecast system are regions with rapid changes in
emissions such as China, where emission inventories need to
be extrapolated to analysis times of the MACC_osuite to ob-
tain reasonable trends. The latter is done as emission inven-
tories usually refer to times prior to MACC_osuite analysis
times. A large underestimation of NO2 in China, especially
in winter, has been reported for other CTMs in previous pub-
lications (He et al., 2007; Itahashi et al., 2014). The latter has
Atmos. Chem. Phys., 15, 14005–14030, 2015 www.atmos-chem-phys.net/15/14005/2015/
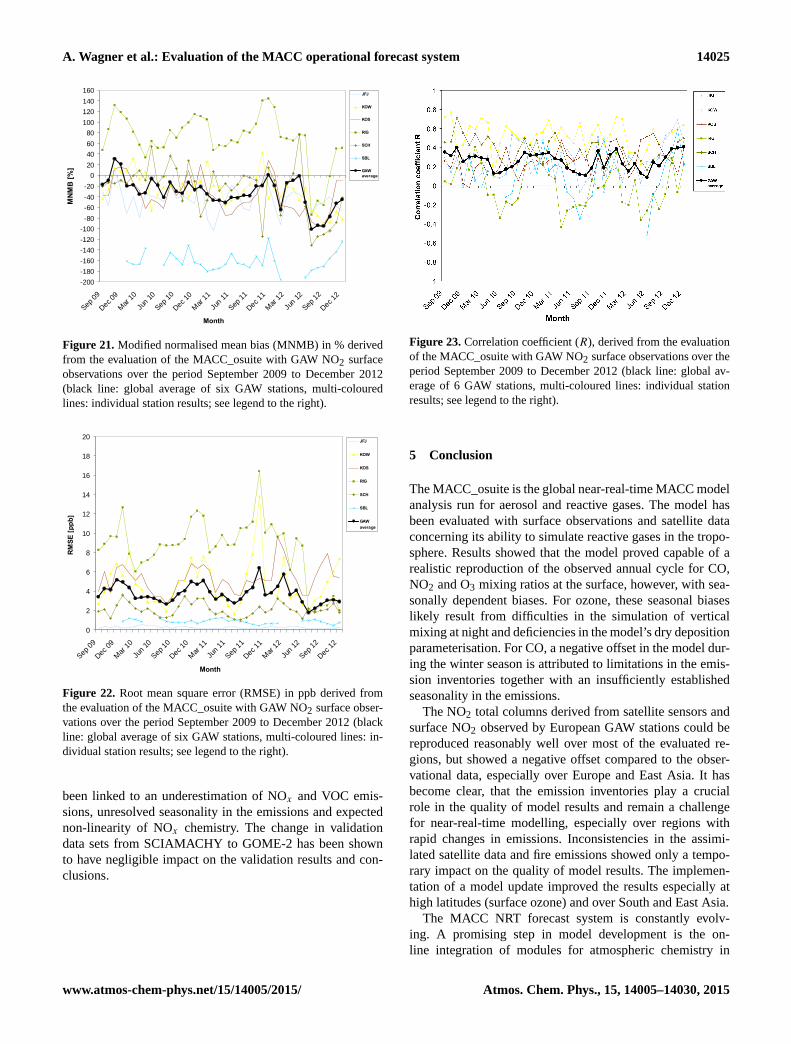
A. Wagner et al.: Evaluation of the MACC operational forecast system 14025
-200-180-160-140-120-100
-80-60-40-20
020406080
100120140160
Sep 09
Dec 09
Mar 10
Jun 1
0Sep
10Dec 1
0Mar
11Ju
n 11
Sep 11
Dec 11
Mar 12
Jun 1
2Sep
12Dec 1
2Month
MNM
B [%
]
JFJ
KOW
KOS
RIG
SCH
SBL
GAWaverage
Figure 21. Modified normalised mean bias (MNMB) in % derived
from the evaluation of the MACC_osuite with GAW NO2 surface
observations over the period September 2009 to December 2012
(black line: global average of six GAW stations, multi-coloured
lines: individual station results; see legend to the right).
0
2
4
6
8
10
12
14
16
18
20
Sep 09
Dec 09
Mar 10
Jun 1
0Sep
10Dec
10Mar
11Ju
n 11
Sep 11
Dec 11
Mar 12
Jun 1
2Sep
12Dec
12
Month
RMSE
[ppb
]
JFJ
KOW
KOS
RIG
SCH
SBL
GAWaverage
Figure 22. Root mean square error (RMSE) in ppb derived from
the evaluation of the MACC_osuite with GAW NO2 surface obser-
vations over the period September 2009 to December 2012 (black
line: global average of six GAW stations, multi-coloured lines: in-
dividual station results; see legend to the right).
been linked to an underestimation of NOx and VOC emis-
sions, unresolved seasonality in the emissions and expected
non-linearity of NOx chemistry. The change in validation
data sets from SCIAMACHY to GOME-2 has been shown
to have negligible impact on the validation results and con-
clusions.
Figure 23. Correlation coefficient (R), derived from the evaluation
of the MACC_osuite with GAW NO2 surface observations over the
period September 2009 to December 2012 (black line: global av-
erage of 6 GAW stations, multi-coloured lines: individual station
results; see legend to the right).
5 Conclusion
The MACC_osuite is the global near-real-time MACC model
analysis run for aerosol and reactive gases. The model has
been evaluated with surface observations and satellite data
concerning its ability to simulate reactive gases in the tropo-
sphere. Results showed that the model proved capable of a
realistic reproduction of the observed annual cycle for CO,
NO2 and O3 mixing ratios at the surface, however, with sea-
sonally dependent biases. For ozone, these seasonal biases
likely result from difficulties in the simulation of vertical
mixing at night and deficiencies in the model’s dry deposition
parameterisation. For CO, a negative offset in the model dur-
ing the winter season is attributed to limitations in the emis-
sion inventories together with an insufficiently established
seasonality in the emissions.
The NO2 total columns derived from satellite sensors and
surface NO2 observed by European GAW stations could be
reproduced reasonably well over most of the evaluated re-
gions, but showed a negative offset compared to the obser-
vational data, especially over Europe and East Asia. It has
become clear, that the emission inventories play a crucial
role in the quality of model results and remain a challenge
for near-real-time modelling, especially over regions with
rapid changes in emissions. Inconsistencies in the assimi-
lated satellite data and fire emissions showed only a tempo-
rary impact on the quality of model results. The implemen-
tation of a model update improved the results especially at
high latitudes (surface ozone) and over South and East Asia.
The MACC NRT forecast system is constantly evolv-
ing. A promising step in model development is the on-
line integration of modules for atmospheric chemistry in
www.atmos-chem-phys.net/15/14005/2015/ Atmos. Chem. Phys., 15, 14005–14030, 2015
14026 A. Wagner et al.: Evaluation of the MACC operational forecast system
the IFS, currently being tested for implementation in the
MACC_osuite (Flemming et al., 2015). In contrast to the
coupled model configuration as used in this paper, the on-
line integration in the Composition IFS (C-IFS) provides ma-
jor advantages; apart from an enhanced computational effi-
ciency, C-IFS promises an optimisation of the implementa-
tion of feedback processes between gas-phase/aerosol chem-
ical processes and atmospheric composition and meteorol-
ogy, which is expected to improve the modelling results for
reactive gases. Additionally, C-IFS will be available in com-
bination with different CTMs (MOZART and TM5), which
will help to explain whether deviations between model and
observations go back to deficiencies in the chemistry scheme
of a model.
Acknowledgements. This work has been carried out in the
framework of the MACC projects, funded under the EU Seventh
Research Framework Programme for research and technological
development. The authors thank the MACC validation and reactive
gas subproject teams for fruitful discussions. Model simulations
were carried out using the ECMWF supercomputer. We wish to
acknowledge the provision of GAW hourly station data from the
World Data Centre of Greenhouse Gases (WDCGG) and hourly
EMEP station data from the Norwegian Institute for Air Research
(NILU) database. Specifically, we like to thank the Commonwealth
Scientific and Industrial Research Organisation (CSIRO) Oceans
and Atmosphere Flagship for making the data freely available and
the Australian Bureau of Meteorology for continued operation
and support of the Cape Grim station. We also like to thank Izaña
Atmospheric Research Center (AEMET) for providing CO and O3
data. Special thanks to the providers of NRT data to the MACC
project, namely Institute of Atmospheric Sciences and Climate
(ISAC) of the Italian National Research Council (CNR), South
African Weather Service, The University of York and National
Centre for Atmospheric Science (NCAS (AMF)) (UK), and the
Instituto Nacional de Meteorologia e Geofisica (INMG) (Cape
Verde), National Air Pollution Monitoring Network (NABEL)
(Federal Office for the Environment FOEN and Swiss Federal
Laboratories for Materials Testing and Research EMPA), Japan
Meteorological Agency (JMA), Alfred Wegener Institute, Umwelt-
bundesamt (Austria), National Meteorological Service (Argentina),
Umweltbundesamt (UBA, Germany). We thank the National Center
for Atmospheric Research (NCAR) MOPITT science team and
the NASA Langley Research Center, Atmospheric Science Data
Center (ASDC), for producing and archiving the MOPITT CO
product. IASI has been developed and built under the responsibility
of the Centre National D’Etudes Spatiales (CNES, France). We are
grateful to Juliette Hadji-Lazaro and the ULB/LATMOS IASI team
for establishing the IASI-MACC near-real-time processing chain.
We wish to acknowledge that SCIAMACHY lv1 (level 1) radiances
were provided to the Institute of Environmental Physics, University
of Bremen by ESA through DLR/DFD.
Edited by: W. Lahoz
References
Aas, W., Hjellbrekke, A.-G., and Schaug, J.: Data quality 1998,
quality assurance and field comparisons, Kjeller, Norwegian In-
stitute for Air Research (EMEP/CCC-Report 6/2000), Oslo, Nor-
way, 2000.
Ashmore, M. R.: Assessing the future global impacts of ozone on
vegetation, Plant Cell Environ., 28, 949–964, 2005.
Ballabrera-Poy, J., Kalnay, E., and Yang, S.: Data assimila-
tion in a system with two scales – combining two initial-
ization techniques, Tellus, 61A, 539–549, doi:10.1111/j.1600-
0870.2009.00400.x, 2009.
Bell, M. L., Peng, R. D., and Dominici, F.: The exposure–response
curve for O3 and risk of mortality and the adequacy of current
O3 regulations, Environ. Health Persp., 114, 532–536, 2006.
Benedetti, A., Morcrette, J.-J., Boucher, O., Dethof, A., Engelen, R.
J., Fisher, M., Flentje, H., Huneeus, N., Jones, L., Kaiser, J. W.,
Kinne, S., Mangold, A., Razinger, M., Simmons, A. J., Suttie,
M., and the GEMS-AER team: Aerosol analysis and forecast in
the European Centre for Medium-Range Weather Forecasts In-
tegrated Forecast System: Data Assimilation, J. Geophys. Res.,
114, D13205, doi:10.1029/2008JD011115, 2008.
Benedetti, A., Kaiser, J. W., and Morcrette, J.-J.: Aerosols, B. Am.
Meterol. Sci., 92, S65–S67, 2011.
Boersma, K. F., Eskes, H. J., and Brinksma, E. J.: Error analysis for
tropospheric NO2 retrieval from space, J. Geophys. Res., 109,
D04311, doi:10.1029/2003JD003962, 2004.
Bovensmann, H., Burrows, J. P., Buchwitz, M., Frerick, J., Noël,
S., Rozanov, V. V., Chance, K. V., and Goede, A. P. H.: SCIA-
MACHY: Mission Objectives and Measurement Modes, J. At-
mos. Sci., 56, 127–150, 1999.
Brunner, D., Staehelin, J., Rogers, H. L., Köhler, M. O., Pyle, J. A.,
Hauglustaine, D., Jourdain, L., Berntsen, T. K., Gauss, M., Isak-
sen, I. S. A., Meijer, E., van Velthoven, P., Pitari, G., Mancini,
E., Grewe, G., and Sausen, R.: An evaluation of the performance
of chemistry transport models by comparison with research air-
craft observations. Part 1: Concepts and overall model perfor-
mance, Atmos. Chem. Phys., 3, 1609–1631, doi:10.5194/acp-3-
1609-2003, 2003.
Callies, J., Corpaccioli, E., Eisinger, M., Hahne, A., and Lefeb-
vre, A.: GOME-2 Metop’s Second-Generation Sensor for Op-
erational Ozone Monitoring, ESA Bull., 102, 28–36, 2000.
Cape, J. N.: Surface ozone concentrations and ecosystem health:
Past trends and a guide to future projections, Sci. Total Environ.,
400, 257–269, doi:10.1016/j.scitotenv.2008.06.025, 2008.
Cuevas, E., Camino, C., Benedetti, A., Basart, S., Terradellas, E.,
Baldasano, J. M., Morcrette, J. J., Marticorena, B., Goloub,
P., Mortier, A., Berjón, A., Hernández, Y., Gil-Ojeda, M.,
and Schulz, M.: The MACC-II 2007–2008 reanalysis: atmo-
spheric dust evaluation and characterization over northern Africa
and the Middle East, Atmos. Chem. Phys., 15, 3991–4024,
doi:10.5194/acp-15-3991-2015, 2015.
Deeter, M. N., Emmons, L. K., Edwards, D. P., Gille, J. C., and
Drummond, J. R.: Vertical resolution and information content
of CO profiles retrieved by MOPITT, Geophys. Res. Lett., 31,
L15112, doi:10.1029/2004GL020235, 2004.
Deeter, M. N., Edwards, D. P., Gille, J. C., Emmons, L. K., Fran-
cis, G., Ho, S.-P., Mao, D., Masters, D., Worden, H., Drummond,
J. R., Novelli, P. C.: The MOPITT version 4 CO product: Algo-
Atmos. Chem. Phys., 15, 14005–14030, 2015 www.atmos-chem-phys.net/15/14005/2015/
A. Wagner et al.: Evaluation of the MACC operational forecast system 14027
rithm enhancements, validation, and long-term stability, J. Geo-
phys. Res., 115, D07306, doi:10.1029/2009JD013005, 2010.
Deeter, M. N., Martínez-Alonso, S., Edwards, D. P., Emmons, L.
K., Gille, J. C., Worden, H. M., Pittman, J. V., Daube, B. C.,
and Wofsy, S. C.: Validation of MOPITT Version 5 thermal-
infrared, near-infrared, and multispectral carbon monoxide pro-
file retrievals for 2000–2011, J. Geophys. Res.-Atmos., 118,
6710–6725, doi:10.1002/jgrd.50272, 2013.
Elguindi, N., Clark, H., Ordóñez, C., Thouret, V., Flemming, J.,
Stein, O., Huijnen, V., Moinat, P., Inness, A., Peuch, V.-H., Stohl,
A., Turquety, S., Athier, G., Cammas, J.-P., and Schultz, M.: Cur-
rent status of the ability of the GEMS/MACC models to repro-
duce the tropospheric CO vertical distribution as measured by
MOZAIC, Geosci. Model Dev., 3, 501–518, doi:10.5194/gmd-3-
501-2010, 2010.
Emmons, L. K., Edwards, D. P., Deeter, M. N., Gille, J. C., Cam-
pos, T., Nédélec, P., Novelli, P., and Sachse, G.: Measurements
of Pollution In The Troposphere (MOPITT) validation through
2006, Atmos. Chem. Phys., 9, 1795–1803, doi:10.5194/acp-9-
1795-2009, 2009.
Eskes, H., Huijnen, V., Arola, A., Benedictow, A., Blechschmidt,
A.-M., Botek, E., Boucher, O., Bouarar, I., Chabrillat, S., Cuevas,
E., Engelen, R., Flentje, H., Gaudel, A., Griesfeller, J., Jones,
L., Kapsomenakis, J., Katragkou, E., Kinne, S., Langerock,
B., Razinger, M., Richter, A., Schultz, M., Schulz, M., Su-
darchikova, N., Thouret, V., Vrekoussis, M., Wagner, A., and
Zerefos, C.: Validation of reactive gases and aerosols in the
MACC global analysis and forecast system, Geosci. Model Dev.,
8, 3523–3543, doi:10.5194/gmd-8-3523-2015, 2015.
Flemming, J. and Inness, A.: Volcanic sulfur dioxide plume fore-
casts based on UV satellite retrievals for the 2011 Grímsvötn
and the 2010 Eyjafjallajökull eruption, J. Geophys. Res.-Atmos.,
118, 10172–10189, doi:10.1002/jgrd.50753, 2013.
Flemming, J., Inness, A., Flentje, H., Huijnen, V., Moinat, P.,
Schultz, M. G., and Stein, O.: Coupling global chemistry trans-
port models to ECMWF’s integrated forecast system, Geosci.
Model Dev., 2, 253–265, doi:10.5194/gmd-2-253-2009, 2009.
Flemming, J., Huijnen, V., Arteta, J., Bechtold, P., Beljaars, A.,
Blechschmidt, A.-M., Diamantakis, M., Engelen, R. J., Gaudel,
A., Inness, A., Jones, L., Josse, B., Katragkou, E., Marecal,
V., Peuch, V.-H., Richter, A., Schultz, M.-G., Stein, O., and
Tsikerdekis, A.: Tropospheric chemistry in the Integrated Fore-
casting System of ECMWF, Geosci. Model Dev., 8, 975–1003,
doi:10.5194/gmd-8-975-2015, 2015.
Forster, P., Ramaswamy, V., Artaxo, P., Berntsen, T., Betts, R., Fa-
hey, D. W., Haywood, J., Lean, J., Lowe, D. C., Myhre, G.,
Nganga, J., Prinn, R., Raga, G., Schulz, M., and Van Dorland,
R.: Changes in Atmospheric Constituents and in Radiative Forc-
ing, in: Climate Change 2007: The Physical Science Basis. Con-
tribution of Working Group I to the Fourth Assessment Report
of the Intergovernmental Panel on Climate Change, edited by:
Solomon, S., Qin, D., Manning, M., Chen, Z., Marquis, M., Av-
eryt, K. B., Tignor, M., and Miller, H. L., USA, 2007.
George, M., Clerbaux, C., Hurtmans, D., Turquety, S., Coheur, P.-
F., Pommier, M., Hadji-Lazaro, J., Edwards, D. P., Worden, H.,
Luo, M., Rinsland, C., and McMillan, W.: Carbon monoxide dis-
tributions from the IASI/METOP mission: evaluation with other
space-borne remote sensors, Atmos. Chem. Phys., 9, 8317–8330,
doi:10.5194/acp-9-8317-2009, 2009.
George, M., Clerbaux, C., Bouarar, I., Coheur, P.-F., Deeter, M. N.,
Edwards, D. P., Francis, G., Gille, J. C., Hadji-Lazaro, J., Hurt-
mans, D., Inness, A., Mao, D., and Worden, H. M.: An examina-
tion of the long-term CO records from MOPITT and IASI: com-
parison of retrieval methodology, Atmos. Meas. Tech., 8, 4313–
4328, doi:10.5194/amt-8-4313-2015, 2015.
Granier, C., Bessagnet, B., Bond, T., D’Angiola, A., van der Gon,
H. D., Frost, G. J., Heil, A., Kaiser, J. W., Kinne, S., Klimont,
Z., Kloster, S., Lamarque, J.-F., Liousse, C., Masui, T., Meleux,
F., Mieville, A., Ohara, T., Raut, J. C., Riahi, K., Schultz, M.
G., Smith, S. J., Thompson, A., van Aardenne, J., van der Werf,
G. R., and van Vuuren, D. P.: Evolution of anthropogenic and
biomass burning emissions of air pollutants at global and re-
gional scales during the 1980–2010 period, Climatic Change,
109, 163–190, doi:10.1007/s10584-011-0154-1, 2011.
Guenther, A., Karl, T., Harley, P., Wiedinmyer, C., Palmer, P. I.,
and Geron, C.: Estimates of global terrestrial isoprene emissions
using MEGAN (Model of Emissions of Gases and Aerosols from
Nature), Atmos. Chem. Phys., 6, 3181–3210, doi:10.5194/acp-6-
3181-2006, 2006.
He, Y., Uno, I., Wang, Z., Ohara, T., Sugimoto, N., Shimizu, A.,
Richter, A., and Burrows, J. P.: Variations of the increasing trend
of tropospheric NO2 over central east China during the past
decade, Atmos. Environ., 41, 4865–4876, 2007.
Hilboll, A., Richter, A., and Burrows, J. P.: Long-term changes
of tropospheric NO2 over megacities derived from multiple
satellite instruments, Atmos. Chem. Phys., 13, 4145–4169,
doi:10.5194/acp-13-4145-2013, 2013a.
Hilboll, A., Richter, A., Rozanov, A., Hodnebrog, Ø., Heckel, A.,
Solberg, S., Stordal, F., and Burrows, J. P.: Improvements to the
retrieval of tropospheric NO2 from satellite – stratospheric cor-
rection using SCIAMACHY limb/nadir matching and compari-
son to Oslo CTM2 simulations, Atmos. Meas. Tech., 6, 565–584,
doi:10.5194/amt-6-565-2013, 2013b.
Hollingsworth, A., Engelen, R. J., Benedetti, A., Dethof, A., Flem-
ming, J., Kaiser, J. W., and Simmons, A. J.: Toward a mon-
itoring and forecasting system for atmospheric composition:
The GEMS project, B. Am. Meteorol. Soc., 89, 1147–1164,
doi:10.1175/2008BAMS2355.1, 2008.
Huijnen, V., Williams, J., van Weele, M., van Noije, T., Krol, M.,
Dentener, F., Segers, A., Houweling, S., Peters, W., de Laat, J.,
Boersma, F., Bergamaschi, P., van Velthoven, P., Le Sager, P., Es-
kes, H., Alkemade, F., Scheele, R., Nédélec, P., and Pätz, H.-W.:
The global chemistry transport model TM5: description and eval-
uation of the tropospheric chemistry version 3.0, Geosci. Model
Dev., 3, 445–473, doi:10.5194/gmd-3-445-2010, 2010.
Huijnen, V., Flemming, J., Kaiser, J. W., Inness, A., Leitão, J., Heil,
A., Eskes, H. J., Schultz, M. G., Benedetti, A., Hadji-Lazaro, J.,
Dufour, G., and Eremenko, M.: Hindcast experiments of tropo-
spheric composition during the summer 2010 fires over western
Russia, Atmos. Chem. Phys., 12, 4341–4364, doi:10.5194/acp-
12-4341-2012, 2012.
Hurtmans, D., Coheur, P.-F., Wespes, C., Clarisse, L., Scharf,
O., Clerbaux, C., Hadji-Lazaro, J., George, M., and Tur-
quety, S.: FORLI radiative transfer and retrieval code
for IASI, J Quant. Spectrosc. Ra., 113, 1391–1408,
doi:10.1016/j.jqsrt.2012.02.036, 2012.
Inness, A., Flemming, J., Suttie, M., and Jones, L.: GEMS data as-
similation system for chemically reactive gases. ECMWF RD
www.atmos-chem-phys.net/15/14005/2015/ Atmos. Chem. Phys., 15, 14005–14030, 2015
14028 A. Wagner et al.: Evaluation of the MACC operational forecast system
Tech Memo 587, available at: http://www.ecmwf.int (last access:
February 2015), 2009.
Inness, A., Baier, F., Benedetti, A., Bouarar, I., Chabrillat, S., Clark,
H., Clerbaux, C., Coheur, P., Engelen, R. J., Errera, Q., Flem-
ming, J., George, M., Granier, C., Hadji-Lazaro, J., Huijnen,
V., Hurtmans, D., Jones, L., Kaiser, J. W., Kapsomenakis, J.,
Lefever, K., Leitão, J., Razinger, M., Richter, A., Schultz, M. G.,
Simmons, A. J., Suttie, M., Stein, O., Thépaut, J.-N., Thouret, V.,
Vrekoussis, M., Zerefos, C., and the MACC team: The MACC
reanalysis: an 8 yr data set of atmospheric composition, Atmos.
Chem. Phys., 13, 4073–4109, doi:10.5194/acp-13-4073-2013,
2013.
Inness, A., Blechschmidt, A.-M., Bouarar, I., Chabrillat, S., Cre-
pulja, M., Engelen, R. J., Eskes, H., Flemming, J., Gaudel,
A., Hendrick, F., Huijnen, V., Jones, L., Kapsomenakis, J.,
Katragkou, E., Keppens, A., Langerock, B., de Mazière, M.,
Melas, D., Parrington, M., Peuch, V. H., Razinger, M., Richter,
A., Schultz, M. G., Suttie, M., Thouret, V., Vrekoussis, M.,
Wagner, A., and Zerefos, C.: Data assimilation of satellite-
retrieved ozone, carbon monoxide and nitrogen dioxide with
ECMWF’s Composition-IFS, Atmos. Chem. Phys., 15, 5275–
5303, doi:10.5194/acp-15-5275-2015, 2015.
Itahashi, S., Uno, I., Irie, H., Kurokawa, J.-I., and Ohara, T.: Re-
gional modeling of tropospheric NO2 vertical column density
over East Asia during the period 2000–2010: comparison with
multisatellite observations, Atmos. Chem. Phys., 14, 3623–3635,
doi:10.5194/acp-14-3623-2014, 2014.
Kaiser, J. W., Heil, A., Andreae, M. O., Benedetti, A., Chubarova,
N., Jones, L., Morcrette, J.-J., Razinger, M., Schultz, M. G.,
Suttie, M., and van der Werf, G. R.: Biomass burning emis-
sions estimated with a global fire assimilation system based
on observed fire radiative power, Biogeosciences, 9, 527–554,
doi:10.5194/bg-9-527-2012, 2012.
Kalnay, E.: Atmospheric Modeling, Data Assimilation and Pre-
dictability, Cambridge University Press, 2003.
Kalnay, E., Kanamitsu, M., Kistler, R., Collins, W., Deaven, D.,
Gandin, L., Iredell, M., Saha, S., White, G., Woollen, J., Zhu,
Y., Chelliah, M., Ebisuzaki, W., Higgins, W., Janowiak, J., Mo,
K. C., Ropelewski, C., Wang, J., Leetmaa, A., Reynolds, R.,
Jenne, R., and Joseph, D.: The NCEP/NCAR 40-Year Reanalysis
Project, B. Am. Meteorol. Soc., 77, 437–471, doi:10.1175/1520-
0477(1996)077<0437:TNYRP>2.0.CO;2, 1996.
Kampa, M. and Castanas, E.: Human health effects of air pollution,
Environ. Pollut., 151, 362–367, 2008.
Kinnison, D. E., Brasseur, G. P., Walters, S., Gracia, R. R., Marsh,
D. R., Sassi, F., Harvey, V. L., Randall, C. E., Emmons, L.,
Lamarque, J. F., Hess, P., Orlando, J. J., Tie, X. X., Randel, W.,
Pan, L. L., Gettelman, A., Granier, C., Diehl, T., Niemeier, U.,
and Simmons, A. J.: Sensitivity of chemical tracers to meteoro-
logical parameters in the MOZART-3 chemical transport model,
J. Geophys. Res., 112, D20302, doi:10.1029/2006JD007879,
2007.
Lefever, K., van der A, R., Baier, F., Christophe, Y., Errera, Q.,
Eskes, H., Flemming, J., Inness, A., Jones, L., Lambert, J.-
C., Langerock, B., Schultz, M. G., Stein, O., Wagner, A., and
Chabrillat, S.: Copernicus stratospheric ozone service, 2009–
2012: validation, system intercomparison and roles of input data
sets, Atmos. Chem. Phys., 15, 2269–2293, doi:10.5194/acp-15-
2269-2015, 2015.
Leitão, J., Richter, A., Vrekoussis, M., Kokhanovsky, A., Zhang, Q.
J., Beekmann, M., and Burrows, J. P.: On the improvement of
NO2 satellite retrievals – aerosol impact on the airmass factors,
Atmos. Meas. Tech., 3, 475–493, doi:10.5194/amt-3-475-2010,
2010.
Massart, S., Agusti-Panareda, A., Aben, I., Butz, A., Chevallier, F.,
Crevoisier, C., Engelen, R., Frankenberg, C., and Hasekamp, O.:
Assimilation of atmospheric methane products into the MACC-II
system: from SCIAMACHY to TANSO and IASI, Atmos. Chem.
Phys., 14, 6139–6158, doi:10.5194/acp-14-6139-2014, 2014.
Mohnen, V. A., Goldstein, W., and Wang, W.-C.: Tropospheric
Ozone and Climate Change, Air & Waste, 43, 1332–1334,
doi:10.1080/1073161X.1993.10467207, 1993.
Naik, V., Voulgarakis, A., Fiore, A. M., Horowitz, L. W., Lamar-
que, J.-F., Lin, M., Prather, M. J., Young, P. J., Bergmann, D.,
Cameron-Smith, P. J., Cionni, I., Collins, W. J., Dalsøren, S. B.,
Doherty, R., Eyring, V., Faluvegi, G., Folberth, G. A., Josse, B.,
Lee, Y. H., MacKenzie, I. A., Nagashima, T., van Noije, T. P. C.,
Plummer, D. A., Righi, M., Rumbold, S. T., Skeie, R., Shindell,
D. T., Stevenson, D. S., Strode, S., Sudo, K., Szopa, S., and Zeng,
G.: Preindustrial to present-day changes in tropospheric hydroxyl
radical and methane lifetime from the Atmospheric Chemistry
and Climate Model Intercomparison Project (ACCMIP), Atmos.
Chem. Phys., 13, 5277–5298, doi:10.5194/acp-13-5277-2013,
2013.
Ordóñez, C., Elguindi, N., Stein, O., Huijnen, V., Flemming, J., In-
ness, A., Flentje, H., Katragkou, E., Moinat, P., Peuch, V.-H.,
Segers, A., Thouret, V., Athier, G., van Weele, M., Zerefos, C. S.,
Cammas, J.-P., and Schultz, M. G.: Global model simulations of
air pollution during the 2003 European heat wave, Atmos. Chem.
Phys., 10, 789–815, doi:10.5194/acp-10-789-2010, 2010.
Penkett, S., Gilge, S., Plass-Duelmer, C., and Galbally, I.:
WMO/GAW Expert Workshop on Global Long-term Measure-
ments of Nitrogen Oxides and Recommendations for GAW Ni-
trogen Oxides Network, WMO, Geneva, 2011.
Platt, U. and Stutz, J.: Differential Optical Absorption Spec-
troscopy, Physics of Earth and Space Environments, Berlin:
Springer, available at: http://www.springerlink.com/content/
978-3-540-21193-8 (last access: February 2015), 2008.
Richter, A. and Burrows, J. P.: Tropospheric NO2 from
GOME Measurements, Adv. Space Res., 29, 1673–1683,
doi:10.1016/S0273-1177(02)00100-X, 2002.
Richter, A., Burrows, J. P., Nüß, H., Granier, C., and Niemeier, U.:
Increase in tropospheric nitrogen dioxide over China observed
from space, Nature, 437–132, doi:10.1038/nature04092, 2005.
Richter, A., Begoin, M., Hilboll, A., and Burrows, J. P.: An im-
proved NO2 retrieval for the GOME-2 satellite instrument, At-
mos. Meas. Tech., 4, 1147–1159, doi:10.5194/amt-4-1147-2011,
2011.
Rodgers, C. D.: Inverse Methods for Atmospheric Sounding, The-
ory and Practice, World Scientific, Singapore, 2000.
Rozanov, A., Vladimir, V., Rozanov, M., Buchwitz, A.,
Kokhanovsky, A., and Burrows, J. P.: SCIATRAN 2.0 – A
New Radiative Transfer Model for Geophysical Applications
in the 175–2400 Nm Spectral Region, Adv. Space Res., 36,
1015–1019, doi:10.1016/j.asr.2005.03.012, 2005.
Santer, B. D., Sausen, R., Wigley, T. M. L., Boyle, J. S., AchutaRao,
K., Doutriaux, C., Hansen, J. E., Meehl, G. A., Roeckner,
E., Ruedy, R., Schmidt, G., and Taylor, K. E.: Behavior of
Atmos. Chem. Phys., 15, 14005–14030, 2015 www.atmos-chem-phys.net/15/14005/2015/
A. Wagner et al.: Evaluation of the MACC operational forecast system 14029
tropopause height and atmospheric temperature in models, re-
analyses, and observations: Decadal changes, J. Geophys. Res.,
108, 4002, doi:10.1029/2002JD002258, 2003.
Savage, N. H., Agnew, P., Davis, L. S., Ordóñez, C., Thorpe, R.,
Johnson, C. E., O’Connor, F. M., and Dalvi, M.: Air quality mod-
elling using the Met Office Unified Model (AQUM OS24-26):
model description and initial evaluation, Geosci. Model Dev., 6,
353–372, doi:10.5194/gmd-6-353-2013, 2013.
Schaap, M., Renske, M. A., Timmermans, M. R., Boersen, G. A. C.,
and Builtjes, P. J. H.: The LOTOS–EUROS model: description,
validation and latest developments, Int. J. Environ. Pollut., 32,
270–290, 2008.
Schreier, S. F., Richter, A., Kaiser, J. W., and Burrows, J. P.:
The empirical relationship between satellite-derived tropospheric
NO2 and fire radiative power and possible implications for fire
emission rates of NOx , Atmos. Chem. Phys., 14, 2447–2466,
doi:10.5194/acp-14-2447-2014, 2014.
Schultz, M. G., Backman, L., Balkanski, Y., Bjoerndalsaeter, S.,
Brand, R., Burrows, J. P., Dalsoeren, S., de Vasconcelos, M.,
Grodtmann, B., Hauglustaine, D. A., Heil, A., Hoelzemann,
J. J., Isaksen, I. S. A., Kaurola, J., Knorr, W., Ladstaetter-
Weißenmayer, B., Mota, A., Oom, D., Pacyna, J., Panasiuk, D.,
Pereira, J. M. C., Pulles, T., Pyle, J., Rast, S., Richter, A., Savage,
N., Schnadt, C., Schulz, M., Spessa, A., Staehelin, J., Sundet, J.
K., Szopa, S., Thonicke, K., van het, Bolscher, M., van Noije,
T., van Velthoven, P., Vik, A. F., and Wittrock, F.: REanalysis of
the TROpospheric chemical composition over the past 40 years
(RETRO) – A long-term global modeling study of tropospheric
chemistry, Final Report Jülich/ Hamburg, Germany, published as
report no. 48/2007 in the series, Reports on Earth System Sci-
ence“ of the Max Planck Institute for Meteorology, Hamburg,
ISSN 1614-1199, 2007.
Seinfeld, J. H. and Pandis, S. N.: Atmospheric Chemistry and
Physics: From Air Pollution to Climate Change, John Wiley,
Hoboken, N. J., 2006.
Selin, N. E., Wu, S., Reilly, J. M., Paltsev, S., Prinn, R. G., and Web-
ster, M. D.: Global health and economic impacts of future ozone
pollution, Environ. Res. Lett., 4, 044014, doi:10.1088/1748-
9326/4/4/044014, 2009.
Sheel, V., Sahu, L. K., Kajinu, M., Deushi, M., Stein, O., and Ned-
elec, P.: Seasonal and interannual variability of carbon monoxide
based on MOZAIC observations, MACC reanalysis, and model
simulations over an urban site in India, J. Geophys. Res., 119,
9123–9141, 2014.
Shindell, D. T., Faluvegi, G., Stevenson, D. S., Krol, M. C.,
Emmons, L. K., Lamarque, J.-F., Petron, G., Dentener, F. J.,
Ellingsen, K., Schultz, M. G., Wild, O., Amann, M., Atherton,
C. S., Bergmann, D. J., Bey, I., Butler, T., Cofala, J., Collins, W.
J., Derwent, R. G., Doherty, R. M., Drevet, J., Eskes, H. J., Fiore,
A. M., Gauss, M., Hauglustaine, D. A., Horowitz, L. W., Isaksen,
I. S. A., Lawrence, M. G., Montanaro, V., Müller, J.-F., Pitari,
G., Prather, M. J., Pyle, J. A., Rast, S., Rodriguez, J. M., Sander-
son, M. G., Savage, N. H., Strahan, S., E., Sudo, K., Szopa, S.,
Unger, N., van Noije, T. P. C., and Zeng, G.: Multimodel simu-
lations of carbon monoxide: Comparison with observations and
projected near-future changes, J. Geophys. Res., 111, D19306,
doi:10.1029/2006JD007100, 2006.
Sinnhuber, B. M., Weber, M., Amankwah, A., and Burrows, J. P.:
Total Ozone during the Unusual Antarctic Winter of 2002, Geo-
phys. Res. Lett., 30, 1580–1584, doi:10.1029/2002GL016798,
2003.
Sinnhuber, M., Burrows, J. P., Chipperfield, M. P., Jackman, C. H.,
Kallenrode, M.-B., Künzi, K. F., and Quack, M.: A Model Study
of the Impact of Magnetic Field Structure on Atmospheric Com-
position during Solar Proton Events, Geophys. Res. Lett., 30,
1818–1821, doi:10.1029/2003GL017265, 2003.
Sitch, S., Cox, P. M., Collins, W. J., Huntingford, C.: Indirect radia-
tive forcing of climate change through ozone effects on the land-
carbon sink, Nature, 448, 791–794, doi:10.1038/nature06059,
2007.
Stein, O., Schultz, M. G., Flemming, J., Inness, A., Kaiser, J.,
Jones, L., Benedetti, A., and Morcrette, J.-J.: MACC Global air
quality services – Technical Documentation, MACC project de-
liverable D_G-RG_3.8, available at: www.gmes-atmosphere.eu/
documents/deliverables/g-rg/ (last access: February 2015), 2011.
Stein, O., Flemming, J., Inness, A., Kaiser, J. W., and
Schultz, M. G.: Global reactive gases and reanalysis in
the 5 MACC project, J. Integr. Environ. Sci., 9, 57–70,
doi:10.1080/1943815X.2012.696545, 2012.
Stein, O., Huijnen, V., and Flemming, J.: Model description of the
IFS-MOZART and IFS-TM5 coupled systems, MACC-II project
deliverable D_55.4, available at: https://www.gmes-atmosphere.
eu/documents/maccii/deliverables/grg/ (last access: February
2015), 2013.
Stein, O., Schultz, M. G., Bouarar, I., Clark, H., Huijnen, V.,
Gaudel, A., George, M., and Clerbaux, C.: On the wintertime
low bias of Northern Hemisphere carbon monoxide found in
global model simulations, Atmos. Chem. Phys., 14, 9295–9316,
doi:10.5194/acp-14-9295-2014, 2014.
Tørseth, K., Aas, W., Breivik, K., Fjæraa, A. M., Fiebig, M.,
Hjellbrekke, A. G., Lund Myhre, C., Solberg, S., and Yttri,
K. E.: Introduction to the European Monitoring and Evalua-
tion Programme (EMEP) and observed atmospheric composition
change during 1972–2009, Atmos. Chem. Phys., 12, 5447–5481,
doi:10.5194/acp-12-5447-2012, 2012.
Valcke, S. and Redler, R.: OASIS4 User Guide (OASIS4_0_2).
PRISM–Support Initiative, Technical Report No 4, available at:
http://www.prism.enes.org/Publications/Reports/OASIS4_User_
Guide_T4.pdf (last access: February 2015), 2006.
Val Martin, M., Heald, C. L., and Arnold, S. R.: Coupling dry depo-
sition to vegetation phenology in the Community Earth System
Model: Implications for the simulation of surface O3, Geophys
Res. Lett., 41, 2988–2996, doi:10.1002/2014GL059651, 2014.
van der Werf, G. R., Randerson, J. T., Giglio, L., Collatz, G. J.,
Kasibhatla, P. S., and Arellano Jr., A. F.: Interannual variabil-
ity in global biomass burning emissions from 1997 to 2004, At-
mos. Chem. Phys., 6, 3423–3441, doi:10.5194/acp-6-3423-2006,
2006.
Wang, P., Stammes, P., van der A, R., Pinardi, G., and van Roozen-
dael, M.: FRESCO+: an improved O2 A-band cloud retrieval
algorithm for tropospheric trace gas retrievals, Atmos. Chem.
Phys., 8, 6565–6576, doi:10.5194/acp-8-6565-2008, 2008.
Winkler, H., Sinnhuber, M., Notholt, J., Kallenrode, M. B.,
Steinhilber, F., Vogt, J., Zieger, B., Glassmeier, K. H., and
Stadelmann, A.: Modeling impacts of geomagnetic field vari-
ations on middle atmospheric ozone responses to solar pro-
ton events on long timescales, J. Geophys. Res., 113, D02302,
doi:10.1029/2007JD008574, 2008.
www.atmos-chem-phys.net/15/14005/2015/ Atmos. Chem. Phys., 15, 14005–14030, 2015
14030 A. Wagner et al.: Evaluation of the MACC operational forecast system
WMO: WMO Global Atmosphere Watch (GAW) Strategic
Plan: 2008–2015, World Meteorological Organization, Geneva,
Switzerland, 2007.
WMO: Guidelines for the Measurement of Atmospheric Carbon
Monoxide, GAW Report No. 192, World Meteorological Orga-
nization, Geneva, Switzerland, 2010.
WMO: WMO/GAW Expert Workshop on Global Long-term Mea-
surements of Nitrogen Oxides and Recommendations for GAW
Nitrogen Oxides Network, GAW Report No. 195, World Meteo-
rological Organization, Geneva, Switzerland, 2011.
WMO: 16th WMO/IAEA Meeting on Carbon Dioxide, Other
greenhouse Gases and Related Measurement Techniques
(GGMT-2011), Geneva, 2012.
WMO: Guidelines for the Continuous Measurements of Ozone in
the Troposphere, GAW Report No. 209, World Meteorological
Organization, Geneva, Switzerland, 2013.
Worden, H. M., Deeter, M. N., Edwards, D. P., Gille, J., Drummond,
J., Emmons, L. K., Francis, G., and Martínez-Alonso, S.: 13
years of MOPITT operations: lessons from MOPITT retrieval al-
gorithm development, Ann. Geophys., 56, doi:10.4401/ag-6330,
2014.
Atmos. Chem. Phys., 15, 14005–14030, 2015 www.atmos-chem-phys.net/15/14005/2015/