Embed Size (px)
Citation preview
Leonardo Electronic Journal of Practices and Technologies
ISSN 1583-1078
Issue 31, July- December 2017
p. 183-200
183
Engineering, Environment
Experimental investigation of effects of partial shading and faults on
photovoltaic modules performances
Amor FEZZANI1*, Idriss HADJ MAHAMMED1, Said DRID2, Layachi ZAGHBA1,
Abdelhak BOUCHAKOUR1, Messaouda KHENNANE BENBITOUR1
1 Unité de Recherche Appliquée en Energies Renouvelables, URAER, Centre de
Développement des Energies Renouvelables, CDER, 47133, Ghardaïa, Alegria 2LSPIE, Laboratory, Electrical Engineering Department, University of Batna, Algeria
E-mail(s): [email protected]; [email protected] * Corresponding author, phone: 00213 664056302, fax: 00213 29870146
Received: July 18, 2017/ Accepted: December 01, 2017 / Published: December 30, 2017
Abstract
Temperature, solar insolation, shading and faults affect the performance of the
photovoltaic array. Often, the PV arrays get shadowed, completely or partially, by the
passing clouds neigh boring buildings, towers or by trees, and other utilities. The
situation is of a interest in a case of the large PV power plants. In the case of the
shading the characteristics of the PV module are more complex with the several peak
values. Under such conditions, it is very difficult to determine the maximum power
point (MPP). MATLAB-programmed modelling and simulation of photovoltaic
module is presented here, by focusing on the effects of partial shading on the output of
the photovoltaic (PV) module and Faults Bypass Diode. The proposed models
facilitate simulating the dynamic performances of PV-based power systems and have
been validated by means of simulation study. The southern part of Algeria, where the
experimental system is mounted, is particularly well appropriate to photovoltaic
systems. To evaluate the effectiveness of the proposed model, experiments have been
conducted to compare the experimental and simulated current-voltage (I-V) and
power-voltage (P-V) curves of a PV system under some predefined partial shading and
faults bypass diode, using different PV technologies such as mono-crystalline and
multi-crystalline.
Keywords
Photovoltaic module (PV); MATLAB; Partial shading; Faults Bypass Diode
Experimental investigation of effects of partial shading and faults on photovoltaic modules performances
Amor FEZZANI, Idriss HADJ MAHAMMED, Said DRID, Layachi ZAGHBA, Abdelhak BOUCHAKOUR,
Messaouda KHENNANE BENBITOUR
184
Introduction
The photovoltaic system has attracted much attention due to the oil and environment
pollution in recent years [1-3]. Its merits are: inexhaustible; pollution-free; abundant; silent
and with no rotating parts and size-independent electricity conversion efficiently. The main
drawback is that: Form an operational point of the view, a photovoltaic array experiences
large variation of its output power under intermittent weather conditions. These phenomena
may cause operational problems at a central control centre in a power utility, such as
excessive frequency deviations, spinning reserve increase.
Integrating the PV power plant with other power sources such as diesel backup [2],
fuel cell backup [3], battery backup, super conductive magnetic energy storage backup are
ways to overcome variations of its output power problem [1,3]. However, a major challenge
in using a PV resource is to undertake its nonlinear output characteristics, which vary with
temperature and solar irradiance. The characteristics get more complex if the entire array does
not receive uniform irradiance, as in partially cloudy (shaded) conditions, resulting in multiple
peaks.
The presence of multiple peaks reduces the effectiveness of the existing maximum
power point tracking (MPPT) schemes [4, 7] due to their inability to discriminate between the
local and global peaks.
On the other hand, the performance of a photovoltaic generator is unfortunately
degraded by the presence of defects which may cause significant power losses; especially
reversed polarity [8, 9]. Nevertheless, it is very important to understand and predict the PV
characteristics to use a PV installation effectively, under all conditions.
Recently, the influence of partial shading on the energy yield of PV systems has been
widely discussed [10, 11]. The output current of the PV module is reduced by the number of
PV cells affected by shading. The most shaded PV cell in a string limits the total current in
that module. Moreover, there is also a reduction in the output voltage of the PV Module due
to shadow [12]. Many models have been reported in literature. A model, based on the one
diode model was given by Bishop [13]. This model offers optimal conditions for description
of the solar cell characteristics. Experimental results confirmed the effectiveness of the
proposed method.
The overall decline in the output voltage depends on the number of bypass diodes that
Leonardo Electronic Journal of Practices and Technologies
ISSN 1583-1078
Issue 31, July- December 2017
p. 183-200
185
are activated in the PV modules that form the PV generator [14]. In [15, 16] the influence of
the bypass-diodes on mismatched PV systems is investigated. A study by Bia et al. [17]
presents a method to simulate the characteristic output of a photovoltaic system under partial
shading or mismatch conditions.
This paper presents the modelling and experimental verification of the PV energy
production losses under partial conditions based on one-diode mathematical model. The non-
uniform irradiance or partial shading occurs very habitually in solar PV arrays. To study the
shading effects modelling of solar PV module in reverse biased conditions is necessary.
The main feature of the proposed model is to include the effect of complete or partial
shading and fault in bypass diode in the model. Here, we present a MATLAB-based
modelling and experimental verification of scheme for studying the current-voltage
characteristic (I-V) and power-voltage (P-V) of a photovoltaic module under a non-
inhomogeneous irradiance due to partial shading and fault in bypass diode. The experimental
study of the PV energy production losses under partial shading conditions is conducted on a
real PV plant within the URAER of Ghardaïa, Algeria. Different shading scenarios and faults
are analysed, considering a one or more cell of PV module shaded from 0% to 100%. The I-V
and P-V outputs characteristic curves of the PV measured in real conditions are reported.
Material and method
Model and simulation procedure
The physical behaviour of the module has conventionally been studied by representing
it as an equivalent electrical circuit composed of linear and non-linear components.
Solar cell (SPV) is the elementary component which converts the energy of light
directly into electricity by the PV effect. Photovoltaic (PV) arrays are built up with combined
series/parallel combinations of solar PV (SPV) cells [18, 19]. Each cell is typically a p-n
junction. There are several electrical circuit models for a PV cell in literature. An electrical
circuit with a single diode is considered as the equivalent photovoltaic cell in the present
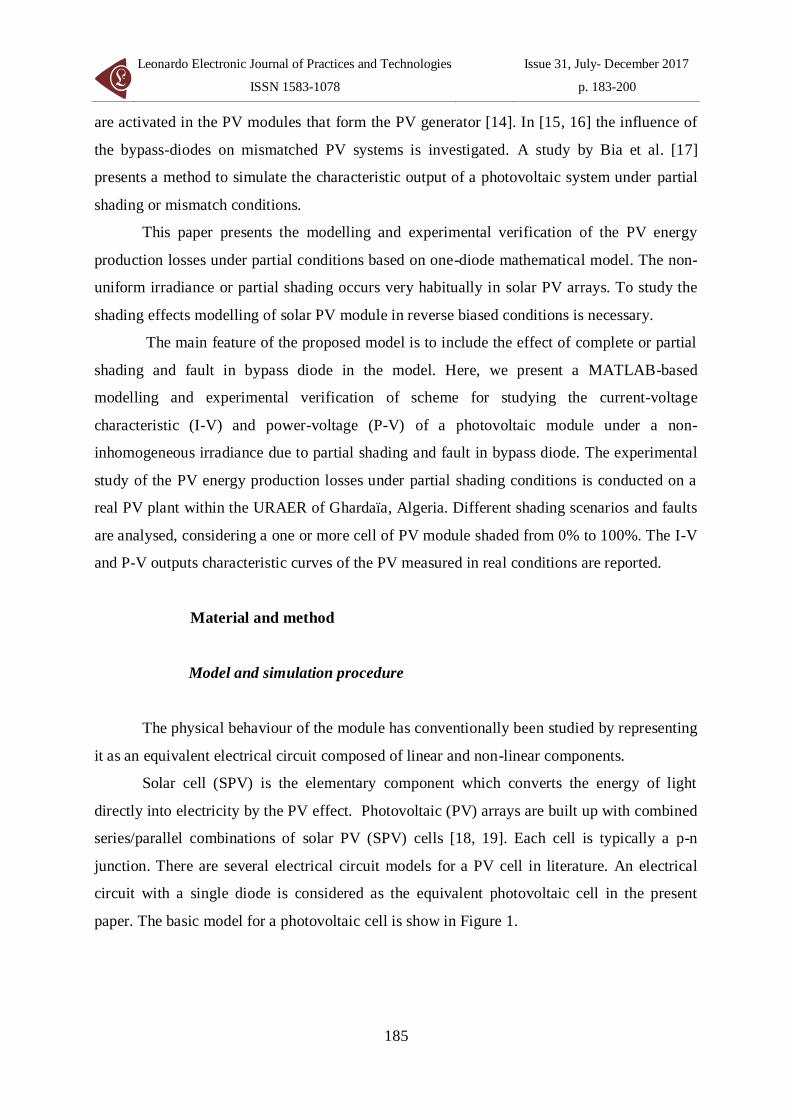
paper. The basic model for a photovoltaic cell is show in Figure 1.
Experimental investigation of effects of partial shading and faults on photovoltaic modules performances
Amor FEZZANI, Idriss HADJ MAHAMMED, Said DRID, Layachi ZAGHBA, Abdelhak BOUCHAKOUR,
Messaouda KHENNANE BENBITOUR
186
Figure 1. Simplified equivalent circuit PV model
In obscurity, the solar cell is not an active device; it works as a diode, i.e. a p-n
junction. It produces neither a current nor a voltage. However, if it is connected to an external
supply it generates a current Id, called diode (D) current or dark current.
The one diode equivalent circuit determines the I-V characteristics of the cell [19].
The equivalent circuit is described by the following Eq. (1):
sh
sV
IRV
phR
IRVeIII t
s
10
(1)
Where: I is the cell output current [A], V is the cell output voltage [V], Iph is the photocurrent,
function of the irradiation level (G) and junction temperature, I0 is the reverse saturation
current of diode, Vt=aKTc/q is the thermal voltage, q is the electron charge (1.602×10⁻¹⁹C), K
is the Boltzmann constant (1.38 × 10⁻²³J/K), a is the ideal factor, Tc is the temperature of the
cell, Rs and Rsh the series and shunt resistance respectively.
The photocurrent Iph can be evaluated with the Eq. (2):
STCcc
STC
STCph TTG
GII ,1
(2)
Where: ISTC is the short circuit current at Standard Test Condition (STC), while GSTC and
Tc,STC are the irradiation and temperature of the PV cell at STC, respectively, is the current
temperature coefficient.
Regarding the reverse saturation current I0 parameter, its value changes with the cell
temperature at STC conditions and can be found by using the following Eq. (3).
Ka
TTqE
STCc
crs
STCcc
g
eT
TII
,
11
3
,
0
(3)
Where: Irs is the reverse saturation current at STC conditions, Eg is the band-gap energy of the
_
Rs
Id Iph Ish
Rsh
T
G
Leonardo Electronic Journal of Practices and Technologies
ISSN 1583-1078
Issue 31, July- December 2017
p. 183-200
187
material.
In this work for Rs and Rsh the same relations in [20] are used as Eq. (4-5)
STCss RR , (4)
STC
STCshshG
GRR ,
(5)
Where: Rs,STC and Rsh,STC are the serial resistance and shunt resistance at STC conditions,
respectively.
Equation (1) is valid for a solar cell. For the exact application of this equation for PV
module, the term of (V+RsI) is replaced by (V+NsRsI)/Ns. To determine the five parameters,
exist in (1), which are: Iph, Rs, Rsh, I0 and a, you can see [21, 22].
Typically, Ns cells are connected in series to get the requisite voltage of PV module.
All the cells are forced to carry the same current called panel current in series panel. If one or
more cells are not receiving the equal solar irradiance or shaded these cells become reverse
biased which leads to power dissipation and thus to heating effects.
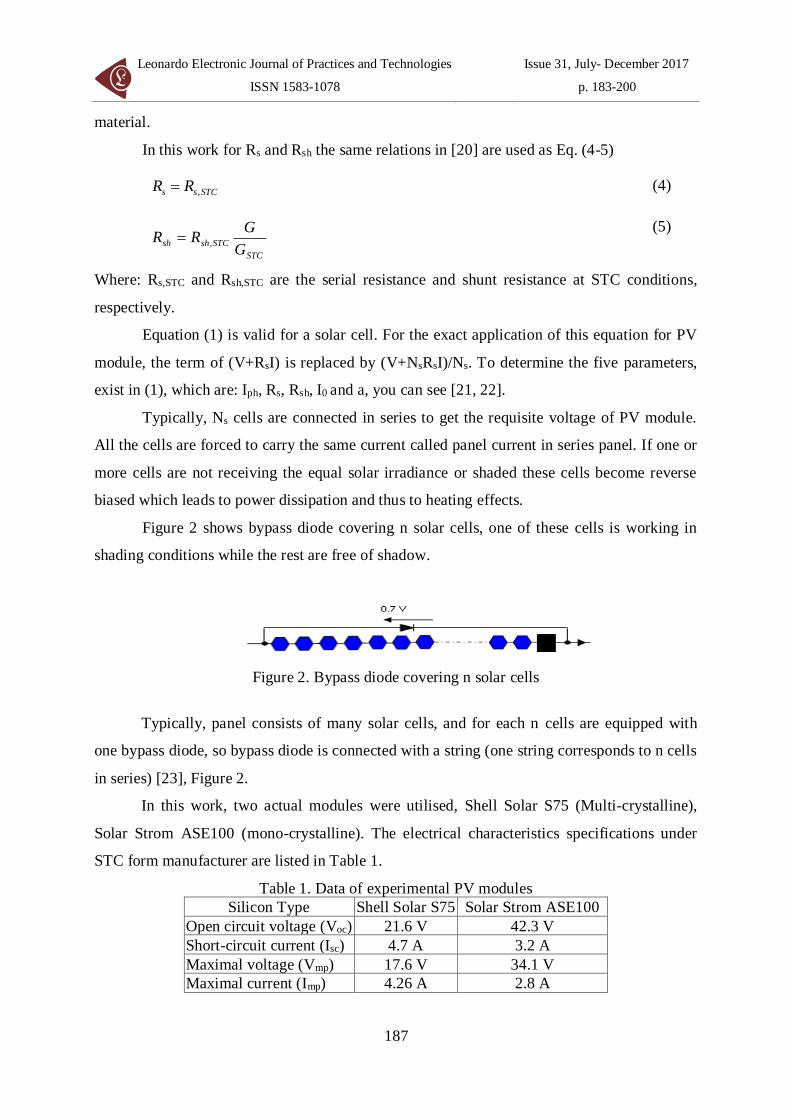
Figure 2 shows bypass diode covering n solar cells, one of these cells is working in
shading conditions while the rest are free of shadow.
Figure 2. Bypass diode covering n solar cells
Typically, panel consists of many solar cells, and for each n cells are equipped with
one bypass diode, so bypass diode is connected with a string (one string corresponds to n cells
in series) [23], Figure 2.
In this work, two actual modules were utilised, Shell Solar S75 (Multi-crystalline),
Solar Strom ASE100 (mono-crystalline). The electrical characteristics specifications under
STC form manufacturer are listed in Table 1.
Table 1. Data of experimental PV modules
Silicon Type Shell Solar S75 Solar Strom ASE100
Open circuit voltage (Voc) 21.6 V 42.3 V
Short-circuit current (Isc) 4.7 A 3.2 A
Maximal voltage (Vmp) 17.6 V 34.1 V
Maximal current (Imp) 4.26 A 2.8 A
Experimental investigation of effects of partial shading and faults on photovoltaic modules performances
Amor FEZZANI, Idriss HADJ MAHAMMED, Said DRID, Layachi ZAGHBA, Abdelhak BOUCHAKOUR,
Messaouda KHENNANE BENBITOUR
188
Maximal Power (Pmp) 75 W 95 W
Number of cells (Ns) 36 72
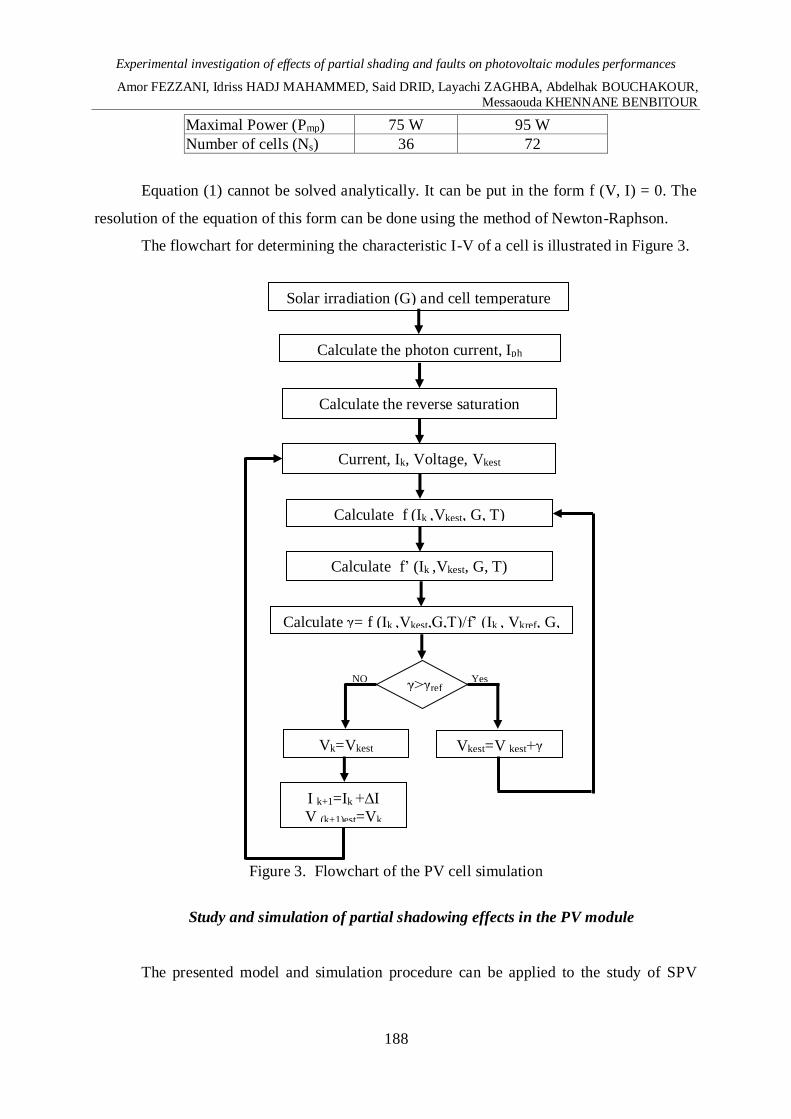
Equation (1) cannot be solved analytically. It can be put in the form f (V, I) = 0. The
resolution of the equation of this form can be done using the method of Newton-Raphson.
The flowchart for determining the characteristic I-V of a cell is illustrated in Figure 3.
Figure 3. Flowchart of the PV cell simulation
Study and simulation of partial shadowing effects in the PV module
The presented model and simulation procedure can be applied to the study of SPV
Solar irradiation (G) and cell temperature
(T)
Calculate the photon current, Iph
Calculate f (Ik ,Vkest, G, T)
Calculate the reverse saturation
current, I0
Current, Ik, Voltage, Vkest
Calculate f’ (Ik ,Vkest, G, T)
Calculate γ= f (Ik ,Vkest,G,T)/f’ (Ik , Vkref, G,
T)
γ>γref Yes
Vkest=V kest+γ Vk=Vkest
NO
I k+1=Ik +∆I
V (k+1)est=Vk
Leonardo Electronic Journal of Practices and Technologies
ISSN 1583-1078
Issue 31, July- December 2017
p. 183-200
189
working in partial shadowing conditions and faults in PV arrays.
2-
1+
a
beat
-C-
alfa
-C-
Voc_stc
v+
-
V
-C-
Tc_stc
-C-
Rsh
Rs
Rs
Ns
Ns
Np
Np1
-K-
Np
-C-
Isc_stc
MATLABFunction
IV
G
G
Diodes -
+
Controlled Current Source
1/Ns
1/Ns
(a) Block diagram of the PV model
+
-
PV module
(b) Encapsulated block
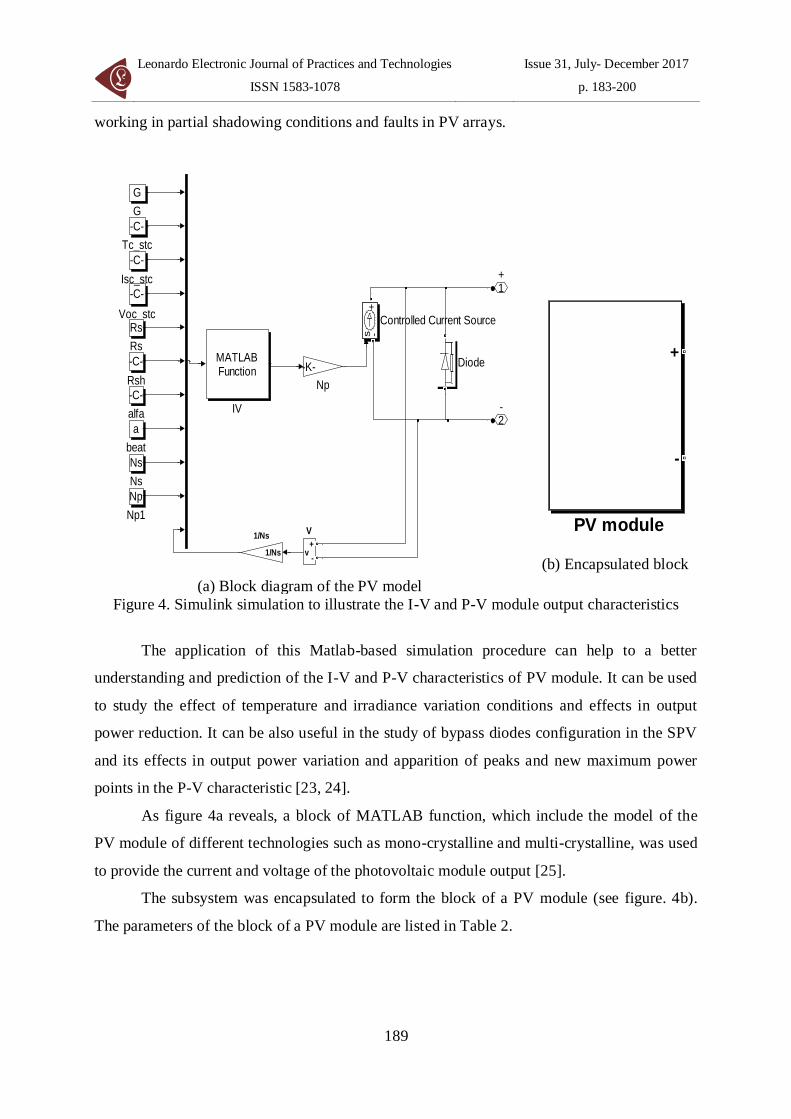
Figure 4. Simulink simulation to illustrate the I-V and P-V module output characteristics
The application of this Matlab-based simulation procedure can help to a better
understanding and prediction of the I-V and P-V characteristics of PV module. It can be used
to study the effect of temperature and irradiance variation conditions and effects in output
power reduction. It can be also useful in the study of bypass diodes configuration in the SPV
and its effects in output power variation and apparition of peaks and new maximum power
points in the P-V characteristic [23, 24].
As figure 4a reveals, a block of MATLAB function, which include the model of the
PV module of different technologies such as mono-crystalline and multi-crystalline, was used
to provide the current and voltage of the photovoltaic module output [25].
The subsystem was encapsulated to form the block of a PV module (see figure. 4b).
The parameters of the block of a PV module are listed in Table 2.
Experimental investigation of effects of partial shading and faults on photovoltaic modules performances
Amor FEZZANI, Idriss HADJ MAHAMMED, Said DRID, Layachi ZAGHBA, Abdelhak BOUCHAKOUR,
Messaouda KHENNANE BENBITOUR
190
Table 2. Parameter of PV module
Irradiation (W/m2) 914.5
Temperature (STC) (K) 298
Open circuit voltage Voc (V) 21.6
Short-circuit current Isc_stc (A) 4.7
Serial resistance cell Rs (Ω) 0.0108
Shunt resistance cell Rsh (Ω) 13.52
Number of cells (Ns) 36
Current temperature coefficient (%/K) 0.04
Ideal factor (a) 1.04
In addition, to calculate the accuracy of the proposed technique, the relative error of
the generation power γP,v, the relative error of the generation current γI,v were defined by Eq.
(6-7) [17]:
100,
,,
,
exv
exvsiv
vPP
PP
(6)
100,
,;
,
exv
exvsiv
vII
II
(7)
Where: v means a certain voltage in the simulated and experimental I-V and P-V curves, Pv,si
and Pv,ex are the simulated and experimental powers at the voltage v in the P-V curve, Iv,si and
Iv,ex are the simulated and experimental current at the voltage v in the I-V curves.
Experiments and verification
The outdoor measurements were performed in the site of Applied Research Unit in
Renewable Energy (URAER), Ghardaïa, Algeria (latitude 32.49°N, longitude 3.67°E), and
Sunlight duration in number of days by year [26]. Additionally, the following meteorological
parameters are measured as two minutes averages:
• Solar irradiance measured by a Pyranometer (kipp ZonenTM CMP21) with is also
installed on a metal plate, coplanar with the PV field.
• Back of panel is recorded via PT100 resistive thermal sensors.
• Save the measurements in data loggers and store it for later analysis.
On overview, the test system is shown in Figure 5.
Leonardo Electronic Journal of Practices and Technologies
ISSN 1583-1078
Issue 31, July- December 2017
p. 183-200
191
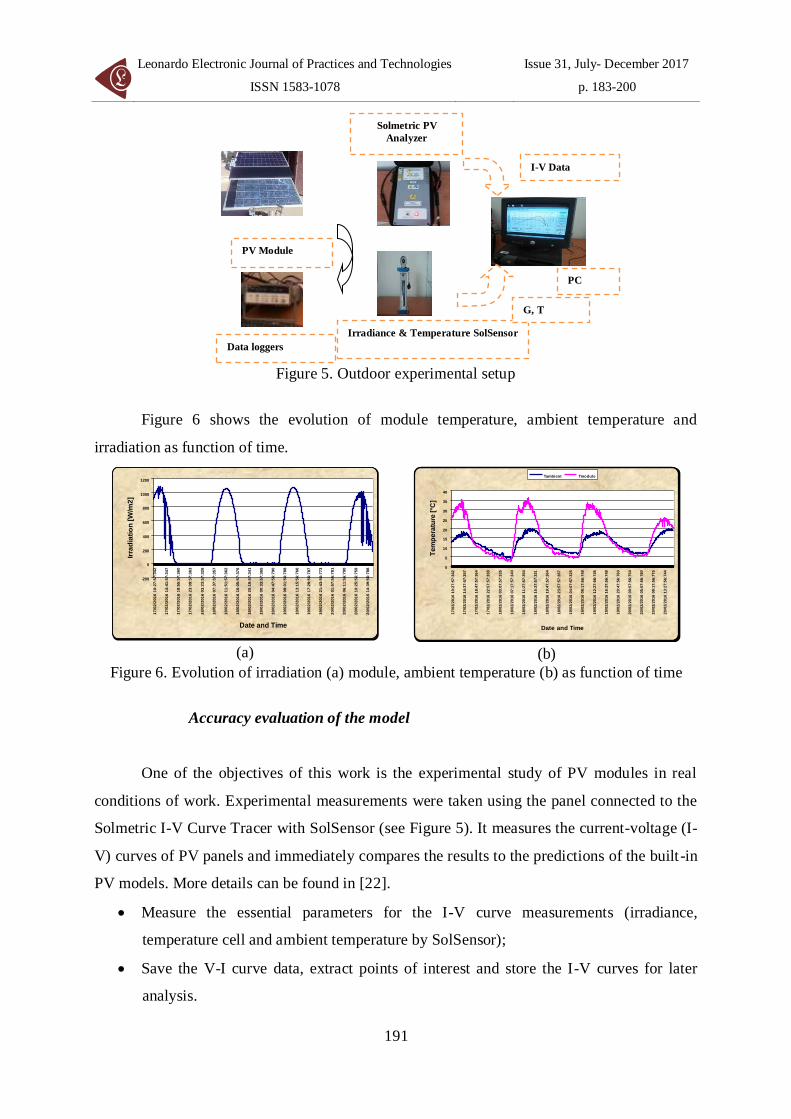
Figure 5. Outdoor experimental setup
Figure 6 shows the evolution of module temperature, ambient temperature and
irradiation as function of time.
-200
0
200
400
600
800
1000
1200
17/0
2/2
01
6 1
0:2
7:5
7:3
42
17/0
2/2
01
6 1
4:4
1:5
7:3
47
17/0
2/2
01
6 1
8:5
5:5
7:3
60
17/0
2/2
01
6 2
3:0
9:5
7:3
63
18/0
2/2
01
6 0
3:2
3:5
7:3
26
18/0
2/2
01
6 0
7:3
7:5
7:3
57
18/0
2/2
01
6 1
1:5
1:5
7:3
62
18/0
2/2
01
6 1
6:0
5:5
7:3
76
18/0
2/2
01
6 2
0:1
9:5
7:3
41
19/0
2/2
01
6 0
0:3
3:5
7:3
65
19/0
2/2
01
6 0
4:4
7:5
6:7
90
19/0
2/2
01
6 0
9:0
1:5
6:7
88
19/0
2/2
01
6 1
3:1
5:5
6:7
66
19/0
2/2
01
6 1
7:2
9:5
6:7
87
19/0
2/2
01
6 2
1:4
3:5
6:7
73
20/0
2/2
01
6 0
1:5
7:5
6:7
81
20/0
2/2
01
6 0
6:1
1:5
6:7
90
20/0
2/2
01
6 1
0:2
5:5
6:7
59
20/0
2/2
01
6 1
4:3
9:5
6:7
88
Date and Time
Irra
dia
tio
n [
W/m
2]
(a)
0
5
10
15
20
25
30
35
40
17/0
2/2
016 1
0:2
7:5
7:3
42
17/0
2/2
016 1
4:3
7:5
7:3
57
17/0
2/2
016 1
8:4
7:5
7:3
64
17/0
2/2
016 2
2:5
7:5
7:3
38
18/0
2/2
016 0
3:0
7:5
7:3
35
18/0
2/2
016 0
7:1
7:5
7:3
40
18/0
2/2
016 1
1:2
7:5
7:3
54
18/0
2/2
016 1
5:3
7:5
7:3
31
18/0
2/2
016 1
9:4
7:5
7:3
64
18/0
2/2
016 2
3:5
7:5
7:3
67
19/0
2/2
016 0
4:0
7:5
7:3
26
19/0
2/2
016 0
8:1
7:5
6:7
49
19/0
2/2
016 1
2:2
7:5
6:7
45
19/0
2/2
016 1
6:3
7:5
6:7
48
19/0
2/2
016 2
0:4
7:5
6:7
60
20/0
2/2
016 0
0:5
7:5
6:7
54
20/0
2/2
016 0
5:0
7:5
6:7
80
20/0
2/2
016 0
9:1
7:5
6:7
75
20/0
2/2
016 1
3:2
7:5
6:7
44
Date and Time
Te
mp
era
ture
[°C
]
Tambient Tmodule
(b)
Figure 6. Evolution of irradiation (a) module, ambient temperature (b) as function of time
Accuracy evaluation of the model
One of the objectives of this work is the experimental study of PV modules in real
conditions of work. Experimental measurements were taken using the panel connected to the
Solmetric I-V Curve Tracer with SolSensor (see Figure 5). It measures the current-voltage (I-
V) curves of PV panels and immediately compares the results to the predictions of the built -in
PV models. More details can be found in [22].
• Measure the essential parameters for the I-V curve measurements (irradiance,
temperature cell and ambient temperature by SolSensor);
• Save the V-I curve data, extract points of interest and store the I-V curves for later
analysis.
PV Module
Irradiance & Temperature SolSensor
PC
I-V Data
G, T
Solmetric PV
Analyzer
Data loggers
Experimental investigation of effects of partial shading and faults on photovoltaic modules performances
Amor FEZZANI, Idriss HADJ MAHAMMED, Said DRID, Layachi ZAGHBA, Abdelhak BOUCHAKOUR,
Messaouda KHENNANE BENBITOUR
192
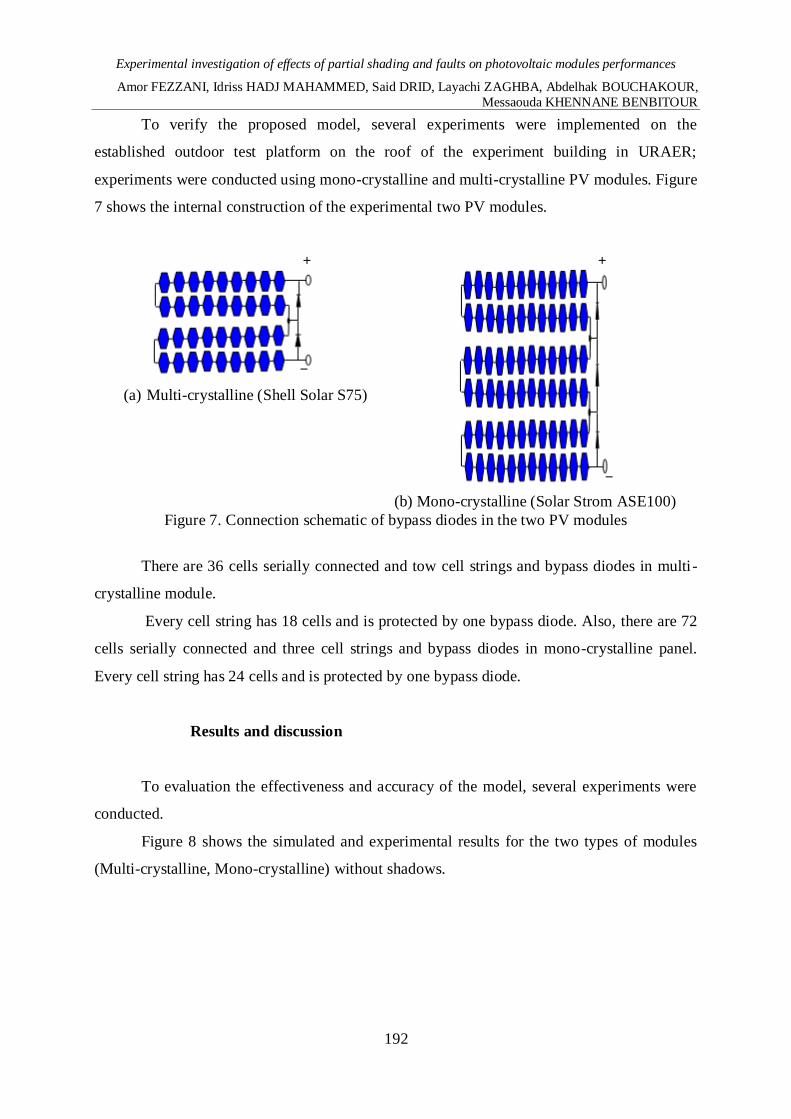
To verify the proposed model, several experiments were implemented on the
established outdoor test platform on the roof of the experiment building in URAER;
experiments were conducted using mono-crystalline and multi-crystalline PV modules. Figure
7 shows the internal construction of the experimental two PV modules.
(a) Multi-crystalline (Shell Solar S75)
(b) Mono-crystalline (Solar Strom ASE100)
Figure 7. Connection schematic of bypass diodes in the two PV modules
There are 36 cells serially connected and tow cell strings and bypass diodes in multi -
crystalline module.
Every cell string has 18 cells and is protected by one bypass diode. Also, there are 72
cells serially connected and three cell strings and bypass diodes in mono-crystalline panel.
Every cell string has 24 cells and is protected by one bypass diode.
Results and discussion
To evaluation the effectiveness and accuracy of the model, several experiments were
conducted.
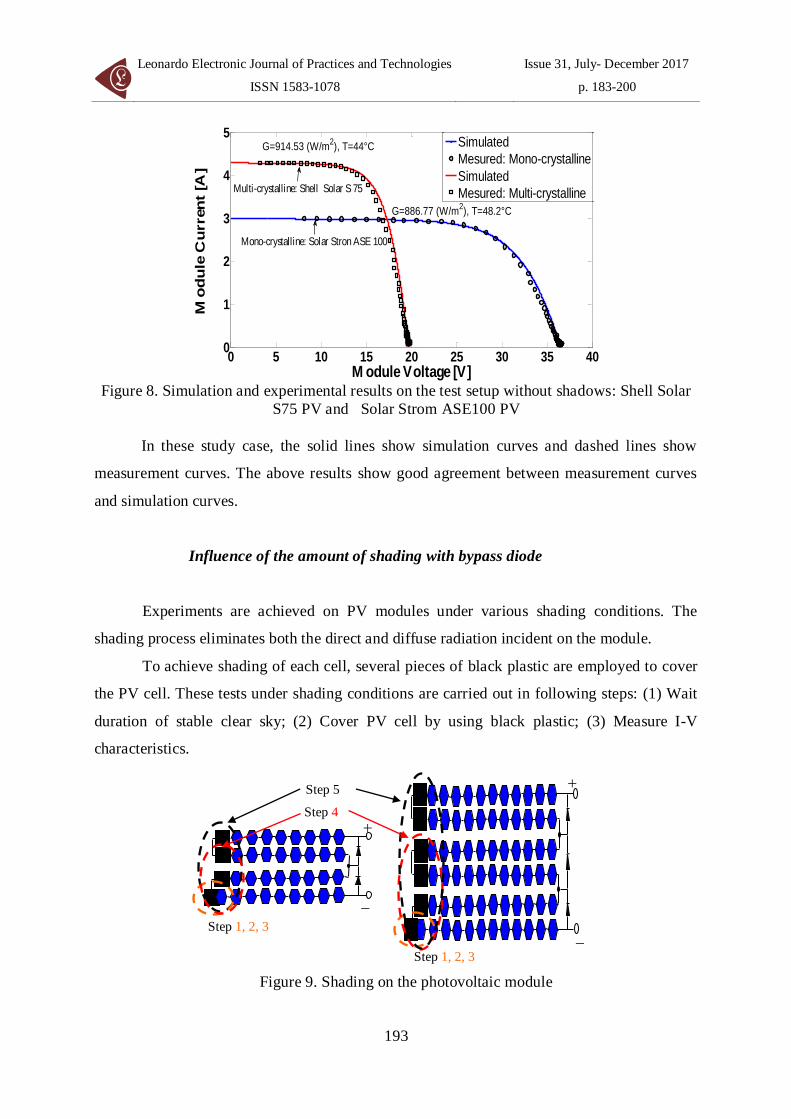
Figure 8 shows the simulated and experimental results for the two types of modules
(Multi-crystalline, Mono-crystalline) without shadows.
Leonardo Electronic Journal of Practices and Technologies
ISSN 1583-1078
Issue 31, July- December 2017
p. 183-200
193
0 5 10 15 20 25 30 35 400
1
2
3
4
5
M odule Voltage [V]
Mo
du
le C
urren
t [A
]
Simulated
Mesured: Mono-crystalline
Simulated
Mesured: Multi-crystalline
G=914.53 (W/m2), T=44°C
G=886.77 (W/m2), T=48.2°C
Mono-crystalline: Solar Stron ASE 100
Multi-crystalline: Shell Solar S 75
Figure 8. Simulation and experimental results on the test setup without shadows: Shell Solar
S75 PV and Solar Strom ASE100 PV
In these study case, the solid lines show simulation curves and dashed lines show
measurement curves. The above results show good agreement between measurement curves
and simulation curves.
Influence of the amount of shading with bypass diode
Experiments are achieved on PV modules under various shading conditions. The
shading process eliminates both the direct and diffuse radiation incident on the module.
To achieve shading of each cell, several pieces of black plastic are employed to cover
the PV cell. These tests under shading conditions are carried out in following steps: (1) Wait
duration of stable clear sky; (2) Cover PV cell by using black plastic; (3) Measure I-V
characteristics.
Figure 9. Shading on the photovoltaic module
Step 1, 2, 3
Step 1, 2, 3
Step 5
Step 4
Experimental investigation of effects of partial shading and faults on photovoltaic modules performances
Amor FEZZANI, Idriss HADJ MAHAMMED, Said DRID, Layachi ZAGHBA, Abdelhak BOUCHAKOUR,
Messaouda KHENNANE BENBITOUR
194
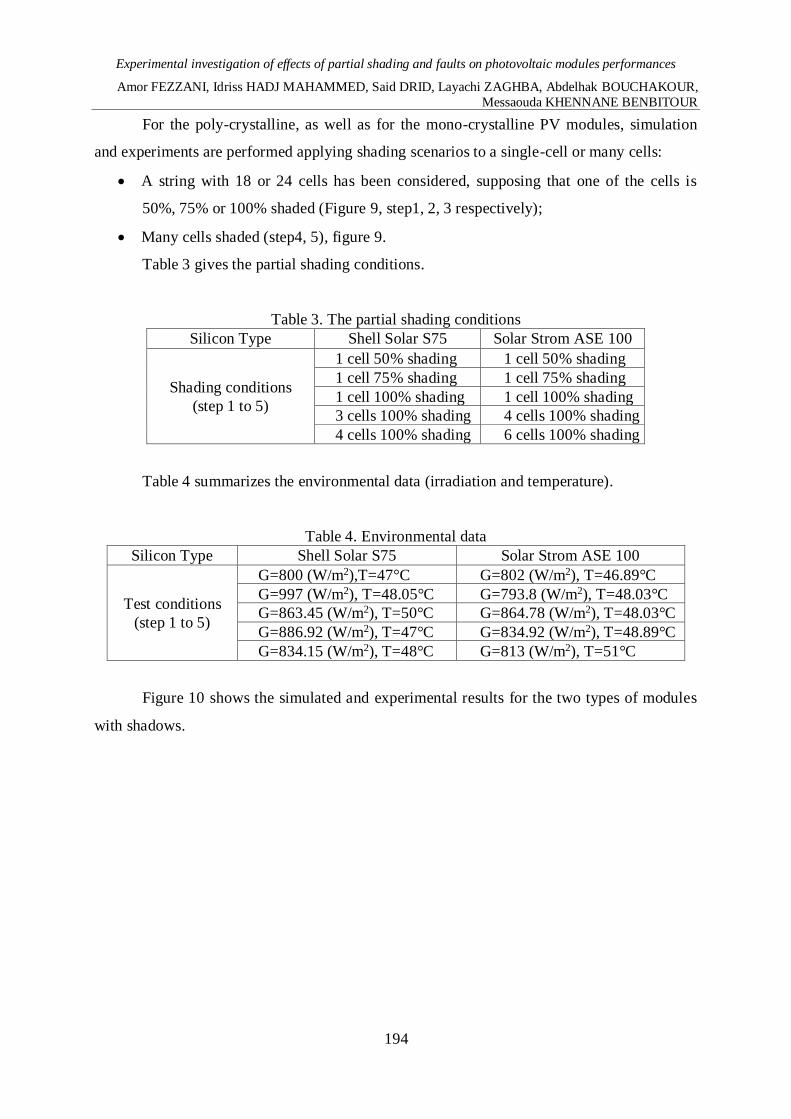
For the poly-crystalline, as well as for the mono-crystalline PV modules, simulation
and experiments are performed applying shading scenarios to a single-cell or many cells:
• A string with 18 or 24 cells has been considered, supposing that one of the cells is
50%, 75% or 100% shaded (Figure 9, step1, 2, 3 respectively);
• Many cells shaded (step4, 5), figure 9.
Table 3 gives the partial shading conditions.
Table 3. The partial shading conditions
Silicon Type Shell Solar S75 Solar Strom ASE 100
Shading conditions
(step 1 to 5)
1 cell 50% shading 1 cell 50% shading
1 cell 75% shading 1 cell 75% shading
1 cell 100% shading 1 cell 100% shading
3 cells 100% shading 4 cells 100% shading
4 cells 100% shading 6 cells 100% shading
Table 4 summarizes the environmental data (irradiation and temperature).
Table 4. Environmental data
Silicon Type Shell Solar S75 Solar Strom ASE 100
Test conditions
(step 1 to 5)
G=800 (W/m2),T=47°C G=802 (W/m2), T=46.89°C
G=997 (W/m2), T=48.05°C G=793.8 (W/m2), T=48.03°C
G=863.45 (W/m2), T=50°C G=864.78 (W/m2), T=48.03°C
G=886.92 (W/m2), T=47°C G=834.92 (W/m2), T=48.89°C
G=834.15 (W/m2), T=48°C G=813 (W/m2), T=51°C
Figure 10 shows the simulated and experimental results for the two types of modules
with shadows.
Leonardo Electronic Journal of Practices and Technologies
ISSN 1583-1078
Issue 31, July- December 2017
p. 183-200
195
0 5 10 15 200
1
2
3
4
Module Voltage [V]
Mo
du
le C
urren
t [A
]
Multi-crystalline
1 cell 50% shading
1 cell 75% shading
1 cell 100% shading
3 cells 100% shading
4 cells 100% shading
No shading
G=863.45 (W/m2),T=50°C
G=800 (W/m2) ,T=47°C
G=886.92 (W/m2) ,T=37.84°C
G=997.45 (W/m2),T=48.07°C
G=886.92 (W/m2) ,T=47°C
G=834.15 (W/m2) ,T=48°C
(a)
(b)
0 10 20 30 400
0.5
1
1.5
2
2.5
3
Module Voltage [V]
Mo
du
le C
urren
t [A
]
Mono-crystalline
No shading
1 cell 100% shading
4 cells 100% shading
6 cells 100% shading
1 cell 50% shading
1 cell 75% shading
Simulation
G=813 (W/m2),T=51°C
G=793.8 (W/m2),T=48.03°C
G=802 (W/m2),T=46.89°C
G=864.78 (W/m2),T=48.03°C
G=886.77 (W/m2),T=48.02°CG=834 (W/m
2),T=48.8°C
(c)
(d)
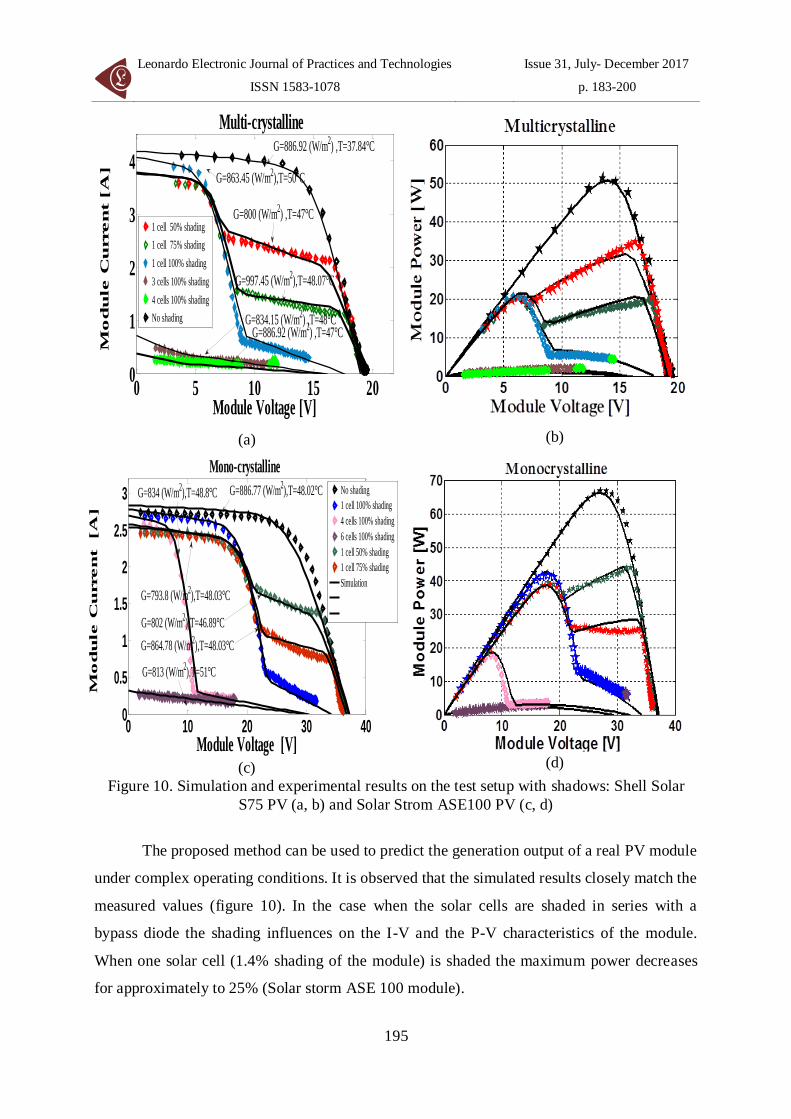
Figure 10. Simulation and experimental results on the test setup with shadows: Shell Solar
S75 PV (a, b) and Solar Strom ASE100 PV (c, d)
The proposed method can be used to predict the generation output of a real PV module
under complex operating conditions. It is observed that the simulated results closely match the
measured values (figure 10). In the case when the solar cells are shaded in series with a
bypass diode the shading influences on the I-V and the P-V characteristics of the module.
When one solar cell (1.4% shading of the module) is shaded the maximum power decreases
for approximately to 25% (Solar storm ASE 100 module).
Experimental investigation of effects of partial shading and faults on photovoltaic modules performances
Amor FEZZANI, Idriss HADJ MAHAMMED, Said DRID, Layachi ZAGHBA, Abdelhak BOUCHAKOUR,
Messaouda KHENNANE BENBITOUR
196
It is observed from the above results; the use of bypass diodes can save the poorly
illuminated panels from damage and make this energy available to the load. But the P-V
characteristics under non-uniform irradiance with bypass diodes contain multiple peaks [27,
28]. The magnitude of the global maxima is dependent on the array configuration and shading
patterns.
Form Figure 10, it is clear that the larger γP,v and γI,v appears in the step 2, 3 for the
two modules. The calculated larger γP,v and γI,v is about 4.27% and 3.8% (Multi- crystalline)
and is about 4.5% and 4 % (Mono-crystalline).
Table 5 gives the relative errors between the proposed model and the experimental
data:
Table 5. Parameter of PV module
Error relative (%) γp,v γI,v
Mono-crystalline 4.5 4
Multi-crystalline 4.27 3.8
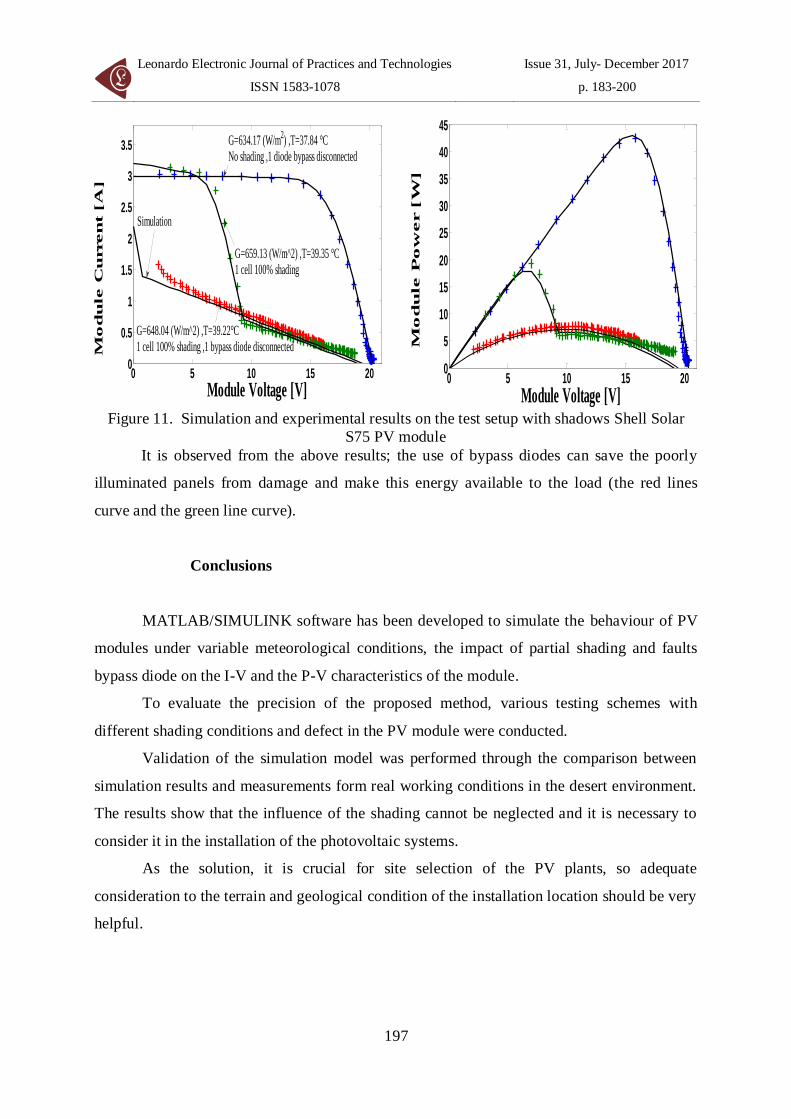
Faults bypass diode
In this scenario, different defect modes on the bypass diode are examined. Firstly,
disconnecting a bypass diode module without shadows, one cell 100% shading and one
bypass disconnected.
Figure 11 shows the simulation result of the behaviour of a module for various types
of faults bypass diode when a cell is 100% shaded.
Leonardo Electronic Journal of Practices and Technologies
ISSN 1583-1078
Issue 31, July- December 2017
p. 183-200
197
0 5 10 15 200
5
10
15
20
25
30
35
40
45
Module Voltage [V] M
od
ule P
ow
er [W
]
Figure 11. Simulation and experimental results on the test setup with shadows Shell Solar
S75 PV module
It is observed from the above results; the use of bypass diodes can save the poorly
illuminated panels from damage and make this energy available to the load (the red lines
curve and the green line curve).
Conclusions
MATLAB/SIMULINK software has been developed to simulate the behaviour of PV
modules under variable meteorological conditions, the impact of partial shading and faults
bypass diode on the I-V and the P-V characteristics of the module.
To evaluate the precision of the proposed method, various testing schemes with
different shading conditions and defect in the PV module were conducted.
Validation of the simulation model was performed through the comparison between
simulation results and measurements form real working conditions in the desert environment.
The results show that the influence of the shading cannot be neglected and it is necessary to
consider it in the installation of the photovoltaic systems.
As the solution, it is crucial for site selection of the PV plants, so adequate
consideration to the terrain and geological condition of the installation location should be very
helpful.
0 5 10 15 200
0.5
1
1.5
2
2.5
3
3.5
Module Voltage [V]
Mo
du
le C
urren
t [A
]
Simulation
G=648.04 (W/m^2) ,T=39.22°C
1 cell 100% shading ,1 bypass diode disconnected
G=659.13 (W/m^2) ,T=39.35 °C
1 cell 100% shading
G=634.17 (W/m2) ,T=37.84 °C
No shading ,1 diode bypass disconnected
Experimental investigation of effects of partial shading and faults on photovoltaic modules performances
Amor FEZZANI, Idriss HADJ MAHAMMED, Said DRID, Layachi ZAGHBA, Abdelhak BOUCHAKOUR,
Messaouda KHENNANE BENBITOUR
198
References
1. Bose M.K., Microcomputer control of a residential photovoltaic power conditioning
system, IEEE Transactions on Industry Applications, 1988, 21 (5), p. 1182-1191.
2. Calloway T.M., Autonomous photovoltaic diesel power system design, Proc. IEEE PV
Specialists Conference, Las Vegas, Nevada, 1985, p. 280-284.
3. Ohnishi M. and Takeoka A., Advanced photovoltaic technologies and residential
applications, Renewable Energy, 1995, 6 (3), p. 275-282.
4. Hecktheuer L.A., Krenzinger A., Prieb C.W.M., Methodology for photovoltaic module
characterization and shading effects analysis, Journal Brazilian Society of Mechanical
Sciences, 2002, 24 (1), p. 26-32.
5. Koutroulis E., Kalaitzakis K., Voulgaris N. C., Development of a microcontroller-based
photovoltaic maximum power point tracking control system, IEEE Trans. Power Electron.,
2001, 16 (1), p. 46-54.
6. Hussein K.H. and Muta I., Maximum photovoltaic power tracking: an algorithm for
rapidly changing atmospheric conditions, Proc. Inst. Electr. Eng. Gener. Transmiss. Distrib.,
1995, 142 (1), p. 59-64,
7. Jain S., Agarwal V., A new algorithm for rapid tracking of approximate maximum
power point in photovoltaic systems, IEEE Power Electron. Lett, 2004, 2 (1), p. 16-19.
8. Vajargah S.H., Woo S.Y., Ghanad-Tavakoli S., Kleiman R.N., Preston J.S., Botton
G.A., Atomic-resolution study of polarity reversal in GASB grown on Si by scanning
transmission electron microscopy, Journal of Applied Physics, 2012, 112 (9), p. 093101- 9.
9. Gang L., Lin L., Feng J., Wenping L., Youliang S., Bo L., Jinzhong L., Analysis of
transient electric field and charge density of converter transformer under polarity reversal
voltage, IEEE Transactions on Magnetics, 2012, 48 (2), p. 275 -278.
10. Deline C., Dobos A., Janzou S., Meydbray J., Donovan M., A simplified model of
uniform shading in large photovoltaic arrays, Solar. Energy, 2013, 96, p. 274-282.
11. Dolara A., Lazaroiu G.C., Leva S., Manzolini G., Experimental investigation of
partial shading scenarios on PV (photovoltaic) modules, Energy, 2013, 55, p. 466-475.
12. Rodrigo P., Fernandez E.F., Almonacid F., Pérez-Higueras P.J., A simple accurate
model for the calculation of shading power losses in photovoltaic generators , Solar Energy,
2013, 93, p. 322-33.
Leonardo Electronic Journal of Practices and Technologies
ISSN 1583-1078
Issue 31, July- December 2017
p. 183-200
199
13. Bishop J.W., Computer simulation of the effects of electrical mismatches in
photovoltaic cell interconnection circuits, Solar Cells, 1988, 25(1), p. 73 - 89.
14. Celik B., Karatepe E., Gokmen N., Silvestre S., A virtual reality study of
surrounding obstacles on BIPV systems for estimation of long-term performance of partially
shaded PV arrays, Renew Energy 2013, 60, p. 402-14.
15. Al-Rawi N.A., Al-Kaisi M.M., Asfer D., Reliability of photovoltaic modules II.
Interconnections and bypass diodes effects, Solar Energy Materials and Solar Cells, 1994, 31
(4), p. 469-80.
16. Alonso-Garcia M.C., Ruiz J. M., Analysis and modelling the reverse characteristic
of photovoltaic cells, Solar Energy Materials and Solar Cells 2006, 90 (7), p. 1105-20.
17. Bai J., Cao Y., Hao Y., Zhang Z., Liu S., Cao F., Characteristic output of PV
systems under partial shading or mismatch conditions, Solar Energy, 2015, 112, p. 41 54.
18. Patel H., Agarwal V., Matlab- based modeling to study the effects of partial shading
on PV array characteristic, IEEE Trans. on Energy Conversion, 2008, 23 (1), p. 302-310.
19. Siddiqui M.U., Arif A. F. M., Bilton A.M., Dubowsky S., Elshafei M., An improved
electric circuit model for photovoltaic modules based on sensitivity analysis, Solar Energy,
2013, 90, p. 29 - 42.
20. Soto W. D., Klein S. A., Beckam W.A., Improvement and validation of a model for
photovoltaic array performance, Energy, 2006, 80 (1), p. 78 88.
21. Fezzani A., Hadj-Mahammed I., Drid S., Bouchakour A., Zaghba L., Benbitour M.,
Oudjana H.S., Degradation evaluation of PV module using sol metric PVA-600 analyser, The
4th International Seminar on New and Renewable Energies (SIENR’2016), 2016, p. 1-9.
22. Fezzani A., Hadj-Mahammed. I., Drid S., Zaghba L., Bouchakour A., Benbitour M.,
Degradation and performance evaluation of PV module in desert climate conditions with
estimate uncertainty in measuring, SJEE, 14 (2), 2017, p. 277-299.
23. Silvestre S., Boronat A., Chouder A., Study of bypass diodes configuration on PV
modules, Applied Energy, 2009, 36, p. 1632-1640.
24. Fezzani A., Hadj. Mahammed I., Drid S., Chrifi-Alaoui L., Modelling and analysis
of the photovoltaic array faults, The 3th International Conference on Control, Engineering and
Information Technology (CEIT’2015), Tlemcen (Algeria), p. 1-9.
25. Ding K., Bian X., Liu H., Peng T., A MATLAB-Simulink based PV module model
and its application under conditions of nonuniform irradiance, IEEE Trans. Energy Convers,
Experimental investigation of effects of partial shading and faults on photovoltaic modules performances
Amor FEZZANI, Idriss HADJ MAHAMMED, Said DRID, Layachi ZAGHBA, Abdelhak BOUCHAKOUR,
Messaouda KHENNANE BENBITOUR
200
2012, 27, p. 864-872.
26. Semaoui S., Hadj Arab A., Bacha S., Azoui B., The new strategy of energy
management for a photovoltaic system without extra intended for remote-housing, Solar
Energy, 2013, 94, p. 71-85.
27. Alonso M.C., Arribas L.M., Chenlo F., Cruz I., Shading effects on a roof integrated
grid-connected PV plants, in. Proc. of the 14th European Photovoltaic Solar Energy
Conference, 1997, p. 1891-4.
28. Bun L., Détection et localisation de défauts pour un système PV, thèse doctorat Génie
Electrique, université de Grenoble 2011.


![Mathematics by Experiment: Exploring Patterns of Integer ...users.rowan.edu/~nguyen/experimentalmath/... · experimental mathematics in [BB]: Experimental mathematics is the methodology](https://img.pdfslide.org/doc/110x75/5f571ce9bdfe5b4c9e5c36bc/mathematics-by-experiment-exploring-patterns-of-integer-usersrowanedunguyenexperimentalmath.jpg)