Embed Size (px)
Citation preview
Experiments and numerical
studies on transport of
sulfadiazine in soil columns
Inaugural-Dissertation
zur Erlangung des Grades Doktor der Agrarwissenschaft
(Dr. agr.)
der Hohen Landwirtschaftlichen Fakultät
der Rheinischen Friedrich-Wilhelms-Universität
zu Bonn
vorgelegt am 18. Dezember 2009
von Myriam Unold
aus Landstuhl, Deutschland

Referent: Prof. Dr. Harry Vereecken
Ko-Referent: Prof. Dr. Wulf Amelung
Tag der mündlichen Prüfung: 07. Juli 2010
Erscheinungsjahr: 2010
i
Acknowledgements First of all I want to thank my promotor Prof. Harry Vereecken, head of the ICG-4,
Agrosphere, Forschungszentrum Jülich GmbH, Dr. Thomas Pütz and Dr. Joost Groeneweg,
head of the project “Veterinary pharmaceuticals in soils”, for the chance to conduct this
thesis at the Agrosphere Institute which included amongst others the possibility to stay in
the USA for three month. Furthermore I thank Prof. Wulf Amelung (University of Bonn)
for being my co-promotor. I express my gratitude to the German Research Foundation for
funding this thesis in the frame of the research group “Veterinary medicines in soils – Basic
Research for Risk analysis” and I thank the members of the research group for many
inspiring discussions and information. I am especially grateful to Dr. Marc Lamshöft
(University of Dortmund) for his support in the analysis of metabolites. I also thank Bayer
HealthCare for providing the 14C-labeled sulfadiazine and BayerCropScience AG for the
performance of the feeding experiment.
I appreciate the staff of the ICG-4 for the pleasant working atmosphere, especially
numerous people who greatly contributed to the performance of the experiments and the
evaluation of data. A special thank goes to my direct mentor Dr. Roy Kasteel for his
excellent advice and support during the last years. For adapting the Hydrus-1D code to my
experiments, the corrections of the second manuscript and the kind hospitality I thank Prof.
Jirka Šimůnek and also his working group at the University of California, Riverside. For
building the experimental setup for the soil column experiments and their quick help in all
kind of technical questions I express my gratitude to Ansgar Weuthen and Jürgen
Höltkemeier. I am also very grateful to Thorsten Büttner and Rainer Harms for their efforts
during sampling in the field. The performance of the transport experiments in the laboratory
would have been impossible without the splendid help of Thorsten Büttner, Kavita
Mayekar, Stefan Masjosthuisman and Maja Stiefelhagen. For conducting the HPLC-
measurements and his patience in detecting and quantifying metabolites I am very grateful
to Stephan Köppchen. For advice in questions regarding laboratory issues I thank also
Odilia Esser, Werner Mittelstädt, Anke Langen, Herbert Philipp, Anne Berns, Ulrike
Langen and Martina Krause. For answering all questions regarding programming and the
Hydrus1D-code I am much obliged to Horst Hardelauf. I thank Roy Kasteel, Joost
Groeneweg and Harry Vereecken for reading drafts of the manuscript. For their company
and friendship during my stay in Jülich I thank my fellow PhD-students, especially my
roommates Jana and Katrin as well as our neighbours Christoph and John. Finally, special
thanks to my family, friends and Ansgar for their love, support and understanding.

ii
iii
Summary Veterinary antibiotics like sulfadiazine (SDZ) are used in large amounts worldwide.
Excreted as parent compounds or in the form of metabolites they reach agricultural soils
mainly via spreading of manure or sewage sludge and may be transported to the
groundwater. Recently, antibiotics have been detected in several environmental
compartments leading to an increasing concern about their hazardous effects. To asses the
leaching potential of SDZ from soils into groundwater, knowledge on its transport
processes in soils is necessary. Also the transport of its metabolites as well as possible
transformation processes have to be considered.
In this work transport experiments at the column scale were performed. Therefore,
SDZ and pig manure were used to analyze the governing processes that affect the transport
of SDZ in disturbed and undisturbed soil columns of a loamy sand and a silty loam. For this
purpose the Hydrus model (Šimůnek et al., 2008) has been adapted and applied to the
observed BTCs and resident concentrations.
The occurrence of transformation products in the outflow of repacked soil columns of
both soils was investigated in experiments with a SDZ-solution. For the prediction of the 14C-distribution in the repacked soil columns, empirical approaches to describe irreversible
sorption were tested. Furthermore the influence of flow rate and concentration/applied mass
on SDZ transport was investigated and the respective experiments were simultaneously
described with a common set of parameters. In transport experiments with pig manure, the
effect of pig manure on the transport of SDZ as well as the transport behavior of the main
metabolites of SDZ present in pig manure, N-Ac-SDZ and 4-OH-SDZ, were investigated.
Without considering a known photo-degradation product transformation was very low
in both investigated soils. In soil columns where most of the 14C was found near the soil
surface, the prediction of the 14C-concentration profiles was improved by applying two
empirical models other than first-order to predict irreversible sorption. The application of
SDZ at a higher flow rate led to higher eluted masses and concentrations compared to
experiments conducted at a lower flow rate. The simultaneous fitting process with a three
site attachment/detachment model revealed that although the same sorption mechanisms
seem to occur in all experiments, their characteristic time scales were different, especially
under transient flow conditions. As the main difference between experiments with manure
and SDZ-solution an accumulation of 14C in the upper soil layer was found in the
experiments with manure. The modeling process revealed a high mobility of both SDZ and
its transformation products. While the transformation of N-Ac-SDZ into SDZ was fast and
no extended tailing of N-Ac-SDZ was observed, the transport behavior of 4-OH-SDZ was
similar to SDZ.

iv
v
Kurzfassung In der Tiermedizin angewandte Antibiotika wie Sulfadiazin (SDZ) werden weltweit
in großen Mengen eingesetzt. Nachdem sie als Ausgangssubstanz oder in der Form von
Metaboliten ausgeschieden werden, gelangen sie hauptsächlich durch das Ausbringen von
Gülle oder Klärschlamm in landwirtschaftliche Böden von wo aus sie ins Grundwasser
transportiert werden können. In den letzten Jahren wurden Antibiotika in verschiedenen
Umweltmedien nachgewiesen was aufgrund ihrer schädlichen Auswirkungen zu einer
steigenden Besorgnis geführt hat. Um das Potential einer möglichen Auswaschung von
SDZ ins Grundwasser einschätzen zu können, sind Kenntnisse über die Transportprozesse
in Böden entscheidend. Auch der Transport der Metabolite sowie mögliche
Transformationsprozesse müssen berücksichtigt werden.
In dieser Dissertation wurden Transportexperimente auf der Skala von Bodensäulen
durchgeführt. Anhand von SDZ-Lösungen und SDZ-haltiger Schweinegülle wurden
Prozesse untersucht, die den Transport von SDZ in gestörten und ungestörten Bodensäulen
eines lehmigen Sandes und eines schluffigen Lehms beeinflussen. Dazu wurde das Model
Hydrus (Šimůnek et al., 2008) verändert und zur Modellierung der gemessenen
Durchbruchskurven und Profilkonzentrationen genutzt.
Das Auftreten von Transformationsprodukten im Ausfluss von gepackten
Bodensäulen beider Böden wurde in Experimenten mit einer SDZ-Lösung untersucht. Zur
Vorhersage der 14C-Konzentrationen in den Bodenprofilen wurden empirische Ansätze zur
Beschreibung der irreversiblen Sorption getestet. Zusätzlich wurde der Einfluss von
Fließrate und Konzentration/applizierter Masse auf den Transport von SDZ untersucht.
Während des Modellierungsprozesses wurden die entsprechenden Experimente mit einem
gemeinsamen Parametersatz beschrieben. In Transportexperimenten mit Schweinegülle
wurden der Einfluss von Schweinegülle auf den Transport von SDZ sowie das Verhalten
der in der Schweingülle vorhandenen Hauptmetabolite, N-Ac-SDZ und 4-OH-SDZ,
untersucht.
Ohne Berücksichtung eines bekannten Phototransformationsproduktes war die
Transformation von SDZ in beiden Böden sehr gering. In den Bodensäulen wurde die
größte Menge an 14C nahe der Oberfläche gefunden. Die Beschreibung dieses Musters
konnte durch die Anwendung zweier empirischer Modelle zur Beschreibung der
irreversiblen Sorption verbessert werden. Die Applikation von SDZ bei einer höheren
Fließrate führte, im Vergleich zu Experimenten, die bei einer geringen Fließrate
durchgeführt wurden, zu höheren eluierten Mengen. Die simultane Modellierung mit einem
dreiseitigen attachment/detachment Model zeigte, dass die charakteristischen Zeitskalen in
den Experimenten verschieden sind, obwohl in allen Experimenten dieselben

vi
Sorptionsmechanismen stattzufinden scheinen. Dies gilt insbesondere im Vergleich
zwischen Experimenten mit konstanten und transienten Fließbedingungen. Der
Hauptunterschied zwischen Experimenten mit SDZ-Lösung und Gülle war eine
Anreicherung von 14C in der obersten Schicht der Bodensäulen in den Experimenten mit
Gülle. Die Ergebnisse der Modellierung ergaben eine hohe Mobilität für SDZ und die
Transformationsprodukte. Während die Transformation von N-Ac-SDZ zu SDZ schnell
verlief und die Durchbruchskurven von N-Ac-SDZ kein ausgeprägtes Tailing aufwiesen,
war das Transportverhalten von 4-OH-SDZ dem von SDZ ähnlich.
vii
Contents Page
List of Tables ........................................................................................................ix
List of Figures.......................................................................................................xi
Abbreviations ......................................................................................................xv
Symbols ................................................................................................................xv
1 Introduction ...................................................................................................1
1.1 Antibiotics in the environment.................................................................1
1.2 Objectives and Experimental approach ...................................................2
1.3 Thesis outline ...........................................................................................4
2 Transport and transformation of sulfadiazine in soil columns packed with a silty loam and a loamy sand.................................................5
2.1 Objectives.................................................................................................5
2.2 Introduction ..............................................................................................5
2.3 Materials & Methods ...............................................................................7
2.3.1 Experimental set-up ..........................................................................7
2.3.2 Analytics of sulfadiazine and transformation products ....................9
2.3.3 Theory of solute transport...............................................................14
2.4 Results & Discussion .............................................................................17
2.5 Conclusions ............................................................................................27
3 Transport of sulfadiazine in undisturbed soil columns: the effect of flow rate and applied mass .........................................................................29
3.1 Objectives...............................................................................................29
3.2 Introduction ............................................................................................29
3.3 Material & Methods ...............................................................................32
3.3.1 Soil ..................................................................................................32
3.3.2 Analytics of sulfadiazine and transformation products ..................34
3.3.3 Theory of solute transport...............................................................35
3.4 Results & Discussion .............................................................................40
3.4.1 Chloride Breakthrough Curves .......................................................40
3.4.2 14C Breakthrough Curves................................................................41
3.4.3 Transformation of Sulfadiazine ......................................................44
3.4.4 Modeling Results ............................................................................45
3.4.5 Fitting the BTCs of SDZ and its transformation products for experiment C ...................................................................................50
viii
3.4.6 Simultaneous fitting of the steady-state flow experiments ............ 51
3.5 Conclusions ........................................................................................... 56
4 Transport of manure-based applied sulfadiazine and its main transformation products in soil columns .................................................. 57
4.1 Objectives .............................................................................................. 57
4.2 Introduction ........................................................................................... 57
4.3 Materials & Methods............................................................................. 60
4.3.1 Experimental set-up ....................................................................... 60
4.3.2 Analytics of sulfadiazine and transformation products ................. 64
4.3.3 Theory of solute transport .............................................................. 66
4.4 Results and Discussion .......................................................................... 69
4.4.1 Chloride breakthrough curves........................................................ 69
4.4.2 14C breakthrough curves and concentration profiles...................... 71
4.4.3 Breakthrough curves of SDZ and its transformation products....... 74
4.4.4 BTC of the organic material........................................................... 76
4.4.5 Modeling Results ........................................................................... 78
4.5 Conclusions ........................................................................................... 85
5 Final Remarks ............................................................................................. 87
5.1 General discussion................................................................................. 87
5.2 The influence of soil properties............................................................. 89
5.3 Description of profile data..................................................................... 90
5.4 Transport behavior of the transformation products............................... 91
5.5 Comparison of the transport model for SDZ and its main transformation products with other existing models............................. 92
5.6 General Conclusions.............................................................................. 93
5.7 Outlook .................................................................................................. 94
6 References .................................................................................................... 95
7 Appendixes................................................................................................. 105
7.1 Appendix A: Sulfadiazine and its transformation products ................ 105
7.2 Appendix B: Soil Properties................................................................ 108
7.3 Appendix C: Experimental Setup........................................................ 109
7.4 Appendix D: Analysis of 14C and the transformation products in liquid samples ..................................................................................... 111
7.5 Appendix E: Chemicals and Instruments .................................................114
ix
List of Tables
Page
Table 2.1: Selected physical and chemical properties of the Kaldenkirchen soil (K) and the Merzenhausen soil (M) .................................................................................... 8
Table 2.2: Selected physicochemical properties of sulfadiazine........................................ 9
Table 2.3: Transport parameters for the conservative tracer chloride. V is pore-water velocity, D is dispersion coefficient, the R²-value is a measure of the relative magnitude of the total sum of squares associated with the fitted equation, q is the experimentally determined Darcian flux density, θ is water content, λ is dispersivity and ρ is the bulk density............................................................ 17
Table 2.4: Mass recoveries and the mean distribution of SDZ and the transformation products in the outflow samples of the two soils...................................... 19
Table 2.5: Fitting parameters for the Freundlich sorption models for 14C-BTCs ............ 25
Table 3.1: Experimental conditions for the different soil column experiments ............... 32
Table 3.2: Transport parameters for the conservative tracer chloride. V is pore-water velocity, D is dispersion coefficient, R² is coefficient of determination, ρ is bulk density, q is flux density, λ is dispersivity, and θ is water content........................ 41
Table 3.3: Mass recovery of 14C in the breakthrough curves and the concentration profiles, as well as transformation products in the drainage water of experiment C. ................................................................................................................ 42
Table 3.4: Fitted parameters for the log-normalized 14C-BTCs and concentration profiles for all experiments using attachment/ detachment and isotherm-based models. Presented are the irreversible sorption rate coefficients (µ, β3) for SDZ, attachment- (β1, β2) and detachment rates (γ1,γ2) for the kinetic reversible sorption as well as the Freundlich parameters (Kf, and m) and the kinetic rate coeffient (α). ................................................................................................... 47
Table 3.5: Fitted parameters for the breakthrough curves of 14C, SDZ and the transformation products 4-OH-SDZ and An-SDZ of experiment C, including the degradation rates from SDZ into the respective transformation products, the irreversible sorption rate coefficient (µ) for SDZ and the fitted Freundlich parameters (Kf, and m) as well as the kinetic rate coefficient (α) for SDZ or the transformation products..................................................................................................... 50
Table 3.6: Simultaneously fitted parameters to 14C-BTC and concentration profile data of the experiments with the low concentration (A, B, D) and the experiments with the high flow rate (A, B, C) using the attachment detachment concept as well as fitted parameters for BTCs of experiments A, B, D & C
x
which were either fitted simultaneously (A, B, C, D) or partly individually for the single experiments (A, B, C, D, β1 variable, ratio) ......................................................53
Table 4.1: Selected physical and chemical properties of the Kaldenkirchen soil (K) and the Merzenhausen soil (M)...................................................................................61
Table 4.2: Experimental conditions for different soil column experiments .....................62
Table 4.3: Transport parameters for the conservative tracer chloride. V is pore-water velocity, D is dispersion coefficient, R² is a measure of the relative magnitude of the total sum of squares associated with the fitted equation, ρ is bulk density, λ is dispersivity and θ is water content. .......................................................70
Table 4.4: Mass fractions of 14C in BTCs and soil profile distributions and mass fractions (in %) of the parent compound SDZ and the transformation products in BTCs. ..............................................................................................................73
Table 4.5: Fitting parameters for the BTCs of SDZ, 4-OH-SDZ and 4-[2-imino-pyrimidine-1(2H)-yl]-aniline for the experiments with the SDZ-solution .............81
Table 4.6: Fitting parameters for the BTCs of SDZ, 4-OH-SDZ and N-Ac-SDZ for the experiments with manure ..............................................................................83
xi
List of Figures Page
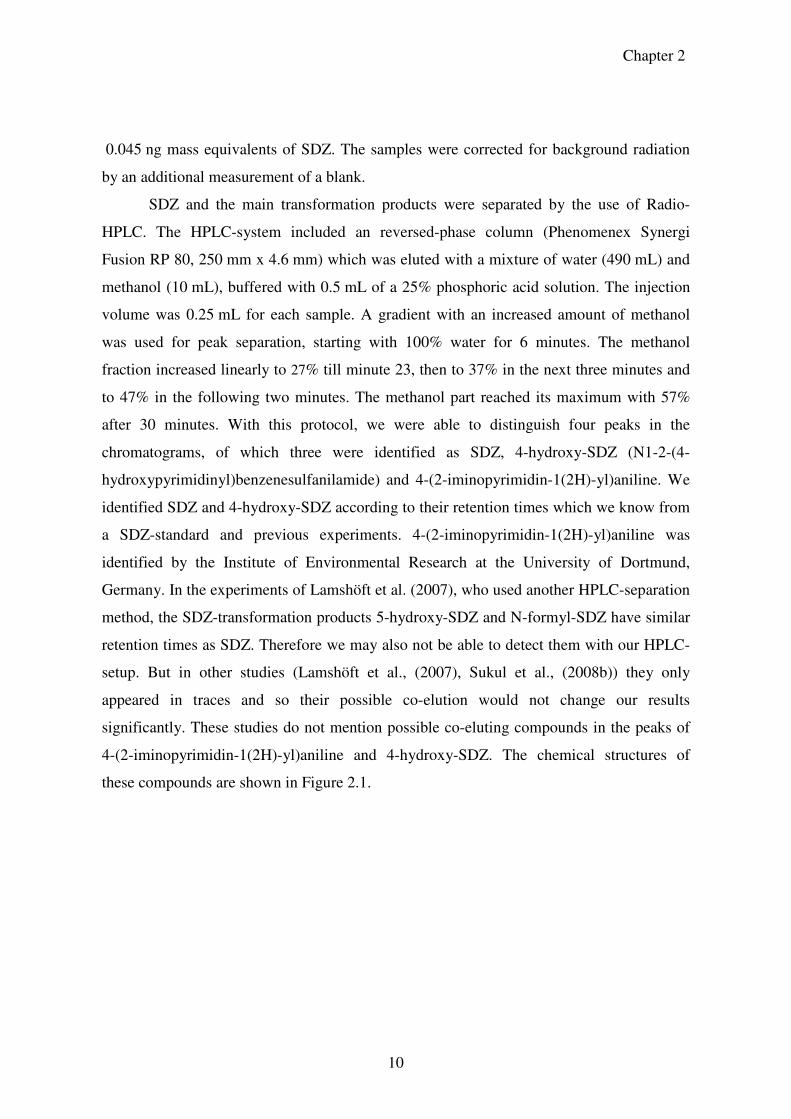
Figure 2.1. Chemical structure of (a) SDZ, the 14C-labelling with a specific radioactivity of 8.88 MBq mg-1 is marked by a star and the ionisable moieties (Sakurai & Ishimitsu 1980) at the two pka values are marked by rectangles, (b) 4-(2-iminopyrimidin-1(2H)-yl)aniline and (c) 4-hydroxy-SDZ...............................11
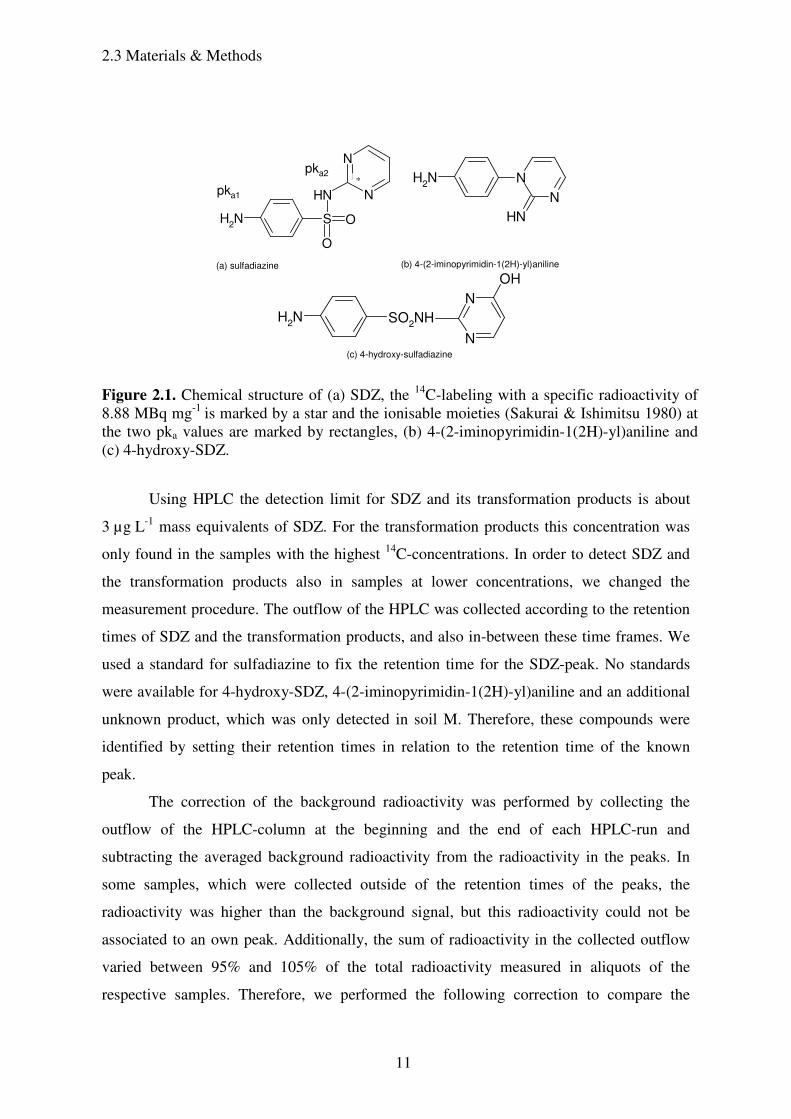
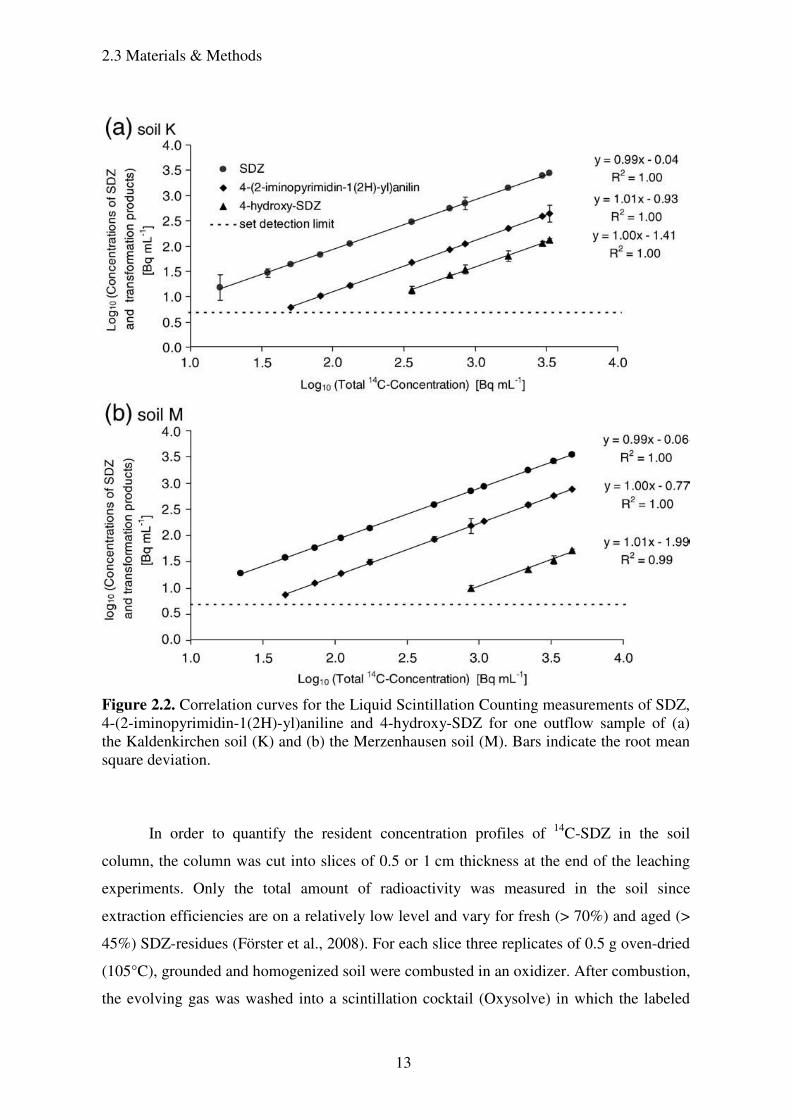
Figure 2.2. Correlation curves for the Liquid Scintillation Counting measurements of SDZ, 4-(2-iminopyrimidin-1(2H)-yl)aniline and 4-hydroxy-SDZ for one outflow sample of (a) the Kaldenkirchen soil (K) and (b) the Merzenhausen soil (M). Bars indicate the root mean square deviation. ..................13
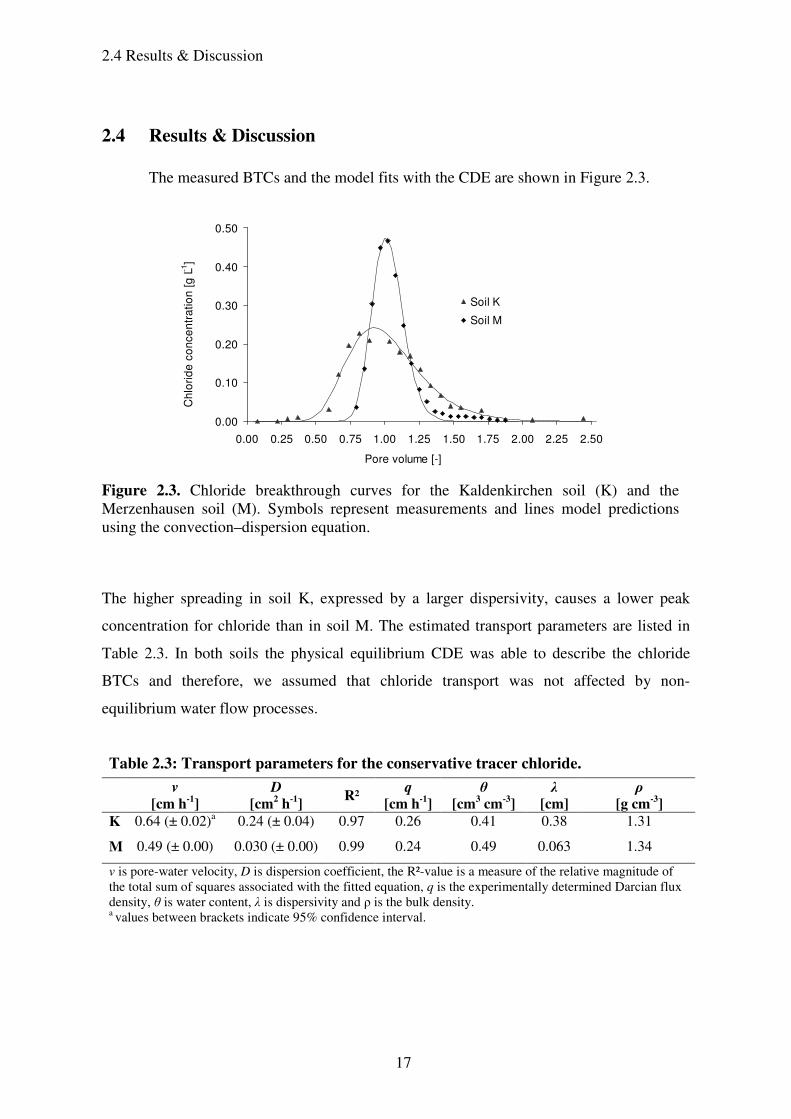
Figure 2.3. Chloride breakthrough curves for the Kaldenkirchen soil (K) and the Merzenhausen soil (M). Symbols represent measurements and lines model predictions using the convection–dispersion equation. Notice that time was transformed into pore volume after the fitting procedure. .......................................17
Figure 2.4. Semi-log plots of the measured BTCs of SDZ and its transformation products in (a) the Kaldenkirchen soil (K) and (b) the Merzenhausen soil (M). Time is expressed as pore volume. Bars indicate the root mean square deviation.......................................................................................18
Figure 2.5. 14C distributions in the soil column profiles of the Kaldenkirchen
soil (K) and the Merzenhausen soil (M). Bars indicate the root mean square deviation. ..................................................................................................................20
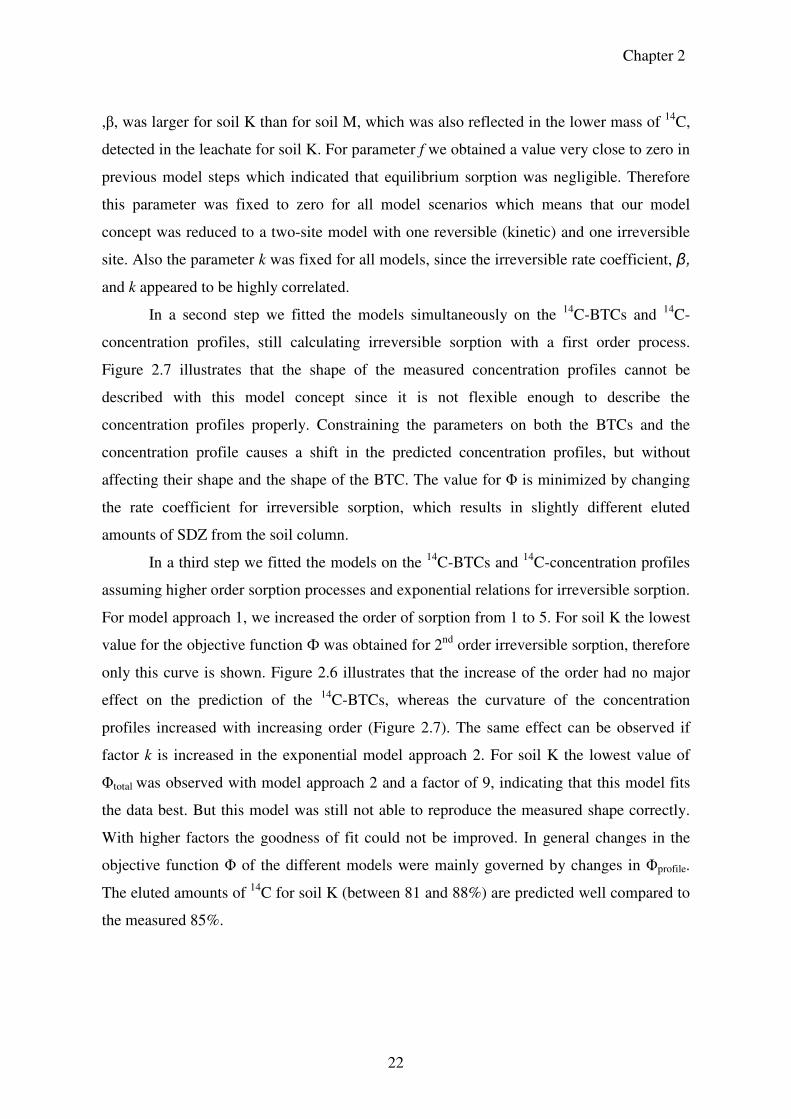
Figure 2.6. 14C-breakthrough curves of (a) the Kaldenkirchen soil (K) and (b) the Merzenhausen soil (M) with the fitted two-site two rates (2S2R) Freundlich models. .....................................................................................................................23
Figure 2.7. 14C-concentration profile in the soil columns of (a) the
Kaldenkirchen soil (K) and (b) the Merzenhausen soil (M) with the fitted two-site two rates (2S2R) Freundlich models. ................................................................24
Figure 2.8. Measured 14C-breakthrough curve of the Kaldenkirchen soil (K) and model predictions with fitted parameter sets of the Merzenhausen soil (M) and the Greifensee soil used by Wehrhan et al. (2007)............................................27
Figure 3.1. The measured breakthrough curves of chloride (symbols) fitted with the convection-dispersion equation (solid lines) for the five experiments. Time is expressed as dimensionless pore volumes, i.e., the time needed to replace all water in the soil column. Concentrations were transformed by dividing through the applied mass of chloride per m², M0.......................................40
Figure 3.2. (a) 14C breakthrough curves and (b) concentration profiles of 14C in the soil column for the five experiments. Time is expressed as pore volume,
xii
bars indicate standard error. Concentrations were transformed by dividing through the applied mass of SDZ per cm², M0. ........................................................43
Figure 3.3. Breakthrough curves of 14C, SDZ, 4-OH-SDZ and An-SDZ of experiment C. Symbols represent measurements and solid lines model predictions using the isotherm-based concept of the convection-dispersion equation with transformation. Concentrations were transformed by dividing through the applied mass of SDZ per cm², M0. ........................................................44
Figure 3.4. 14C breakthrough curves for (a) the high flow rate and (b) the low flow rate; 14C concentration profiles for (c) the high flow rate and (d) the low flow rate. Symbols represent measurements, solid lines are model predictions for the isotherm-based approach and dashed lines are model predictions for the attachment/detachment approach. Concentrations were transformed by dividing through the applied mass of SDZ per cm², M0 .........................................................46
Figure 3.5. Breakthrough curves of experiments A, B, C and D and models fitted to the single BTCs (black lines), simultaneously either to experiments A, B and D (blue lines), A, B and C (green lines), A, B, C and D (red lines) as well as the model for which β1 was fitted individually to each BTC together with the ratio β1/γ1 (dashed red lines). Concentrations were transformed by dividing through the applied mass of SDZ per cm², M0...........................................54
Figure 3.6. Breakthrough curve of experiment E and model predictions using the estimated parameters for the single BTC, the models fitted simultaneously either to experiments A, B and D (blue line), A, B and C (green line) or A, B, C and D (red line). Concentrations were transformed by dividing through the applied mass of SDZ per cm², M0. ...........................................................................55
Figure 4.1. The conceptual model for the transport of SDZ and its transformation products in the experiments with manure. .......................................67
Figure 4.2. selected chloride breakthrough curves for soil columns KundMAN (a) and MundMAN (b) measured on soil columns before and after incorporating pig manure..........................................................................................69
Figure 4.3. 14C BTCs for a) soil K and c) soil M, as well as distributions of 14C
in the soil column profiles for b) soil K and d) soil M. 14C concentrations are given in mass equivalents of SDZ. ...........................................................................71
Figure 4.4. BTCs of SDZ and its transformation products 4-OH-SDZ and 4-[2-iminopyrimidine-1(2H)-yl]-aniline, as well as 14C-concentration profiles for the experiments with the SDZ solution. Simulations using a model with one reversible kinetic and one irreversible sorption site are also presented. Letters a) and b) represent the KrepSOL experiments and c) and d) the MrepSOL experiments. Concentrations are given in mass equivalents of SDZ. Run 1: Models were fitted to BTCs of SDZ and 4-OH-SDZ; Run 2: Models were fitted to BTCs of SDZ and 4-[2-iminopyrimidine-1(2H)-yl]-aniline; Run 3: Models were fitted to BTCs of SDZ and the sum of both transformation products as well as to the 14C data in the profile. ........................................................................75
xiii
Figure 4.5. BTCs of SDZ, 4-OH-SDZ and N-Ac-SDZ in repacked and undisturbed soil columns of soils K and M for the experiments with manure, as well as simulations using a model with one reversible kinetic and one irreversible sorption site: a) KrepMAN, b) MrepMAN, c) KundMAN and d) MundMAN. Concentrations are given in mass equivalents of SDZ. .......................76
Figure 4.6. Breakthrough curves of 14C, electrical conductivity and total organic carbon measured in the soil column KundMAN after the manure application. ...............................................................................................................77
Figure 4.7. 14C distributions in soil columns KrepMAN and MrepMAN and
simulations using a model with one reversible and one irreversible kinetic sorption site. 14C concentrations are given in mass equivalents of SDZ..................84
Figure 5.1. BTC data measured for the saturated soil column experiment in soil K (chapter 2) and model fitted to the corresponding experiment with soil M (chapter 2), selected models fitted to the experiments with undisturbed soil columns (chapter 3) and the model fitted to the experiments with SDZ solution application in soil K (chapter 4). The chapter to which the respective models belong to is given in parentheses..............................................................................88

xiv
xv
Abbreviations An-SDZ 4-(2-iminopyrimidin-1(2H)-yl)aniline BTC Breakthrough curve CDE Convection–Dispersion equation 14C Sum of SDZ and the transformation products HPLC High performance liquid chromatography LSC Liquid scintillation counting N-Ac-SDZ N4-acetyl-N1-2-pyrimidinylsulfanilamide 4-OH-SDZ N1-2-(4-Hydroxypyrimidinyl)sulfanilamide RA Radioactivity SDZ Sulfadiazine
Symbols C solute concentration in the liquid phase [ML-3] Ck solute concentration in the liquid phase [ML-3] of solute k Corg content of organic carbon CEC cation exchange capacity [chargeM-1] D hydrodynamic dispersion coefficient [L2T-1] f fraction of sorption sites in equilibrium [-] i,j indizes for counting k 1. counter of solutes (Chapter 3, 4)
2. exponent or factor to enlarge the exponent in the exponential function (Chapter 2)
Kf Freundlich soil water distribution coefficient [ 131 −−soil
mm
solute MLM ]
L Length [cm] m Freundlich exponent [-] n number of data points r difference between data and model outcome S solute concentration in the solid phase [MM-1] Sk solute concentration in the solid phase [MM-1] of solute k pH negative decadic logarithm of the hydronium ion concentration pKa acidity constant t time [T] T time [h] V Volume [L3] w weighting factor for the data points for a group of data z depth [L] α kinetic mass transfer coefficient [T-1] β irreversible rate coefficient (Chapter 2) βi attachment rate to sorption site i [T-1] γi detachment rate from sorption site i [T-1] λ dispersivity [L] ρ soil bulk density [ML-3]

xvi
θ volumetric water content [L3L-3] v pore water velocity [LT-1] µ (k) first order rate coefficient for irreversible sorption from liquid phase [T-1]
(of solute k) µ (k)’ first order rate coefficient for transformation from liquid phase [T-1] (of
solute k) ɸ sum of squared weighed deviations between data and modeling results
1
1 Introduction
1.1 Antibiotics in the environment
The frequent use of antibiotics in human and veterinary medicine in the last decades
lead to their widespread dispersion in the environment (Thiele-Bruhn, 2003). Hence, in the
last years antibiotics were detected in surface waters (Pailler et al., 2008; Tamtam et al.,
2009, Christian et al., 2003; Managaki, 2007), groundwaters (Focazio, 2008; Hamscher,
2005; Sacher, 2001) and soils (Boxall, 2004; Hamscher, 2005; Höper, 2002). The major
concern of the occurrence of antibiotics in the environment is the development and
spreading of resistant pathogens (Kemper 2008), especially since these chemicals can reach
the food chain via drinking water (Batt et al., 2006; Ye et al., 2007) or the root uptake by
plants (Dolliver et al., 2007). In human therapy effects of increasing antibiotic resistance to
older antibiotics are clearly visible and cause the search for new and more effective drugs.
Contributions to this problem via diffuse pathways like agricultural input must be
considered (Rooklidge 2004). Another point of concern is the influence of antibiotics on
microbial populations, especially since this kind of pharmaceuticals was explicitly designed
to affect bacteria. Influences on microbial process and community structures in soils were
demonstrated (Hammesfahr et al., 2008; Kotzerke et al., 2008; Zielezny et al., 2006).
Veterinary antibiotics reach soils mainly through the application of manure or
sewage sludge on agricultural fields (Jørgensen and Halling-Sørensen, 2000). Thus to asses
their environmental fate knowledge on governing sorption, transport and degradation
processes in soils are essential.
One group of antibiotics are the sulfonamides to which the target substance of this
thesis, sulfadiazine, belongs to. This group of synthetic antibiotics was discovered in the
early 1930s and represents the first group of broad spectra antibiotics (Nobel Lectures,
1965). Sulfonamides affect the growth of bacteria based on the competitive inhibition of the
folic acid synthesis in bacterial cells (Löscher et al., 1994) and are still among the most
used antibiotics in European countries with contributions between 11 and 21% (Kools et al.,
2008). Recently, this group was classified as relevant to the environment (Bergmann et al.,
2008). In the last decades a lot of information on the behavior of SDZ of soils was
ascertained. In short, a lower sorption coefficient compared to other classes of antibiotics
Chapter 1
2
indicates good water solubility and a higher mobility (Thiele-Bruhn et al., 2004). Sorption
proved to be characterized as a nonlinear (Thiele-Bruhn et al., 2004) non-equilibrium
process with sorption coefficients increasing with time (Förster et al., 2009, Wehrhan et al.,
2009) which may be explained by diffusion processes into the intra-particle pore systems or
organic matter. Also sorption hysteresis was reported (Sukul et al., 2008a, Wehrhan et al.,
2009) as well as true irreversible sorption via covalent bonding to organic substances (Bialk
et al., 2008). In transport experiments, sorption hysteresis became visible in incomplete
breakthroughs where parts of the substance were retained in the uppermost soil layers
(Kreuzig et al., 2005; Unold et al., 2009a,b; Wehrhan et al., 2007). Measured breakthrough
curves (BTCs) showed extended tailings which can be explained by slow kinetic processes
or non-linear sorption behavior. Furthermore, the pH value (Kahle and Stamm, 2007a;
Kurwadkar et al., 2007) as well as the amount and composition of organic material (Kahle
and Stamm, 2007b; Thiele-Bruhn et al., 2004) affected sorption of SDZ. Several studies
indicated that transformation of sulfonamides in soils occurs (Burkhardt & Stamm 2007;
Unold et al., 2009a,b; Wehrhan, 2006).
However, the influence of many factors is still unknown. With the help of the
experiments conducted in this thesis knowledge on the transport behavior of SDZ in soils
was supplemented.
1.2 Objectives and Experimental approach
The overall objective of this thesis was to improve the understanding of SDZ
transport in soils by means of soil column experiments with two different agricultural soils
and modeling of the resulting BTCs and concentration profiles. Specific aims were:
• To investigate the occurrence of transformation products in the outflow of the
soil columns to which SDZ was applied in a solution
• To test if empirical approaches for modeling irreversible sorption can improve
the description of the 14C concentration profiles
• To study the influence of flow rate and concentration/applied mass on SDZ
transport
• To describe experiments with different flow rates and applied SDZ
concentrations simultaneously with a common set of parameters
1.3 Objectives and Experimental approach
3
• To determine the effect of pig manure on SDZ transport
• To study the transport of the main SDZ metabolites in pig manure
In order to get a basic knowledge on the transport of a compound in soils, experiments in
the laboratory are suitable because boundary conditions can be defined and controlled. In
general sorption parameters of a compound can be characterized by batch or soil column
experiments. Compared to batch experiments, soil column experiments have the advantage
that they are closer to reality, where transport processes are also influenced by water flow.
The effect of water flow can be determined and excluded from the estimation of sorption
parameters by conducting transport experiments with a conservative tracer like chloride, for
which no sorption is considered.
This thesis was performed within the frame of the research group: Veterinary
medicines in Soils – Basic Research for Risk Analysis. In the research group a feeding
experiment with 14C-labeled SDZ was performed where 14C-SDZ was applied to fattening
pigs. The collection of the manure allowed the investigation of SDZ fate under most
realistic conditions since manure is the most important pathway for veterinary antibiotics
into soils. The usage of a 14C- labeled compound allowed the detection of SDZ and its
transformation products in solutions and soil, independent of the sorption processes or
matrix effects.
SDZ was applied in solution and together with pig-manure. The application of SDZ
in solution enabled the investigation of substance specific sorption and transformation
processes under different boundary conditions without interfering influences like organic
particles, ion intensities and transformation products which occur in the presence of slurry.
Experiments with SDZ containing manure were closer to reality and provided also insights
into the transport of the main SDZ metabolites.
Chapter 1
4
1.3 Thesis outline
The results of the thesis are presented in three chapters (2-4), corresponding to
published or submitted publications to international peer-reviewed journals. Some
information on the sorption and transport behavior of SDZ that was ascertained in the last
decades is presented in the introductions of chapters 2, 3 and 4. Since all these chapters deal
with SDZ transport, repetitions could not be avoided.
In the experiments presented in chapter 2, a SDZ-solution was applied to repacked
soil columns of the two soils. BTCs of SDZ and the transformation products An-SDZ and
4-OH-SDZ were measured, as well as vertical 14C-distributions in the soil columns. Both,
the BTCs and the concentration profiles were described using a model with one kinetic
reversible and one irreversible kinetic sorption site. Two empirical approaches for modeling
irreversible sorption were tested in order to improve the description of the 14C concentration
profiles.
In chapter 3, SDZ transport in dependence of flow rate and applied input
concentration was studied using five undisturbed soil columns of the loamy sand. Measured
BTCs and concentration profiles of different experiments were modeled with common
parameter sets using an attachment/detachment based model approach.
For the experiments described in chapter 4 either a SDZ-solution or pig manure
were blended into repacked and undisturbed soil columns. A comparison of the measured
BTCs and concentration profiles revealed the effect of pig manure on SDZ transport.
Additionally the transport of the main transformation products of SDZ present in pig
manure, N-Ac-SDZ and 4-OH-SDZ, was studied.
Finally in chapter 5 the individual results are synthesized and the general
conclusions are presented. Detailed information on the investigated solutes, soils, chemicals
and instruments is given in the Appendix.
5
2 Transport and transformation of sulfadiazine in soil columns packed with a silty loam and a
loamy sand1
2.1 Objectives
The objectives of the experiments presented in chapter two were to investigate the
occurrence of transformation products in the outflow of the soil columns and to test if
empirical approaches for modeling irreversible sorption can improve the description of the 14C concentration profiles.
2.2 Introduction
The chemical group of sulfonamides to which our target substance sulfadiazine
(SDZ) belongs to is among the most used antibiotics in European countries with
contributions between 11 and 24% (Kools et al., 2008). Like other veterinary
pharmaceuticals, sulfonamides reach agricultural soils mainly through the use of manure or
directly through grazing livestock (Jørgensen and Halling-Sørensen, 2000). Evidence that
sulfonamides released to soils can possibly reach the food-chain is given by the detection of
surface water contamination (Christian et al., 2003), by transport through soil (Hamscher et
al., 2005) or surface runoff (Davis et al., 2006) and uptake by plants (Dolliver et al., 2007).
Besides possible adverse effects on microorganisms, the major risk of introducing
antibiotics into the environment is the development and spreading of resistant pathogens
(Heuer and Smalla, 2007; Kemper, 2008; Mazel and Davies, 1998).
To asses the leaching potential of SDZ, it is important to understand its sorption and
transport behavior. Thiele-Bruhn et al. (2004) found a nonlinear sorption behavior which
was best described by the Freundlich equation. Compared to other classes of antibiotics,
SDZ has a low adsorption coefficient indicating good water solubility and therefore a
higher mobility (Thiele-Bruhn et al., 2004). Having two pKa values, SDZ sorption is likely
to be pH-dependent, as was shown for other sulfonamides (Gao and Pedersen, 2005; Kahle
* adapted from: Unold, M., R. Kasteel, J. Groeneweg and H. Vereecken (2009). Transport and Transformation of the veterinary antibiotic sulfadiazine in soil columns. Journal of Contaminant Hydrology 103. 38-47.1
Chapter 2
6
and Stamm, 2007; Kurwadkar et al., 2007). SDZ was characterized by a fast dissipation
after application to soil, since it could not be detected in soil samples treated with SDZ-
contaminated manure (Martinez-Carballo et al., 2007). This fast dissipation is not
necessarily equivalent to a fast transformation or biodegradation, since in other studies SDZ
showed a low mineralisation rate (Kreuzig et al., 2003) and a strong tendency to form non-
extractable residues in the upper soil layer (Kreuzig and Höltge, 2005). Examples of non-
extractable residues are covalent bondings between sulfonamides and soil organic matter
(Bialk et al., 2007). In field studies surface runoff and leaching were two important
transport pathways for the fate of SDZ (Burkhardt and Stamm, 2007; Kreuzig et al., 2005).
For soil columns Wehrhan et al. (2007) showed an influence of the applied concentration
and application time on the shape of 14C-SDZ breakthrough curves and 14C-distributions in
soil columns.
Transformation or biodegradation of SDZ in soils is not well understood yet. In pig
manure N-acetyl-SDZ and 4-hydroxy-SDZ were found as the main metabolism products
(Lamshöft et al., 2007), whereas Woolley and Sigel (1979) detected N-acetyl-SDZ and N-
glucuronide-SDZ as the main metabolism products for rats. Results from Wehrhan (2006)
and Burkhardt & Stamm (2007) indicated that transformation occurred also in soils.
Wehrhan (2006) detected N-acetyl-SDZ, 4-hydroxy-SDZ and an additional unknown
product in batch and soil column studies without manure. Burkhardt & Stamm (2007)
found the acetylated form of sulfadimidine in soil extracts but not in manure.
Transformation products like 4-hydroxy-SDZ can still be active against micro-organisms
(Nouws et al., 1989) or they can be re-transformed again into SDZ like N-acetyl-SDZ
(Berger et al., 1986). Therefore, the fate of the transformation products in the environment
has to be considered, too.
For the transport of reactive solutes in soils, various model concepts are available
considering different sorption and degradation processes. The transport of organic
compounds was described with models that include multiple sorption regions to account for
the heterogeneity of soil materials and sorption properties (Brusseau and Rao, 1989).
Sorption of the antibiotic tetracycline on silica, for example, was successfully described
with a two-site model containing one irreversible and one reversible sorption site (Turku et
al., 2007). Wehrhan et al. (2007) showed that kinetic models based on the Freundlich
sorption isotherm which included two reversible and one irreversible sorption site can
describe 14C-BTCs of SDZ, but not the 14C-distributions in the soil column profiles. In two
2.3 Materials & Methods
7
out of three experiments the 14C-concentrations in the soil profiles decreased with depth and
were remarkably higher in the uppermost layer, a pattern which could not be described by
assuming a first order process. Most mass of 14C which was not eluted out of the soil
column after the leaching experiment resided in the irreversible sorption site. It was not
possible to distinguish between “bound residues”, i.e. no desorption, and very slow
desorption processes in her experiments, due to the limited duration of the leaching
experiment.
Irreversible sorption, which can be considered as no desorption or a very slow
desorption compared to the characteristic time scale of the experiment, is often described
with a first-order degradation process (e.g. Baek et al., 2003), although other model
concepts have also been applied (Pignatello and Xing, 1996). Kan et al. (1998) used a
Langmuirian-type equation to calculate the amount of irreversibly sorbed hydrocarbons and
Wilson et al. (2004) used a reversible sorption site, from which irreversible sorption
occurred consecutively.
The objectives of this study were a) the detection of possible transformation
products in the outflow of the soil columns in order to get information on the persistence of
SDZ in soils and b) to model the transport of SDZ with a special emphasis on the 14C-
distribution in the soil column profiles which is assumed to be dominated by irreversible
sorption. With an improved chemical analysis we were able to distinguish between SDZ
and its transformation products in the outflow of the soil columns. Breakthrough curves of 14C-SDZ and 14C-SDZ concentration profiles were fitted with a convective-dispersive
transport model with two reversible and one irreversible sorption site. One of the reversible
sorption sites is in equilibrium with the concentration in the liquid phase and one exhibits
kinetic sorption. We tested two empirical approaches to calculate irreversible sorption,
which were different from first-order kinetics.
2.3 Materials & Methods
2.3.1 Experimental set-up
We studied the transport of SDZ in two repacked soil columns near water saturation.
No replicates were run. The experimental design of this study corresponded to application
scenario B of Wehrhan et al. (2007). The soil materials were collected from the upper
Chapter 2
8
30 cm of two fields with representative soil types for agricultural land use in Germany: a
silt loam (Orthic Luvisol, soil M) from a field near Jülich-Merzenhausen (Germany) and a
loamy sand (Gleyic Cambisol, soil K) from a field near Kaldenkirchen (Germany). Selected
soil properties are shown in Table 2.1. Both soils were sieved to < 2 mm and air-dried. We
additionally ground the silt loam, since small aggregates led to asymmetrical breakthrough
curves (BTCs) of the conservative tracer chloride which we used to characterize the water
flow pathways in the soil columns. Stainless steel columns with an inner diameter of 8.5 cm
and a height of 10 cm were used for the experiments. During the packing procedure, layers
of about 1 cm thickness were filled into the columns and compacted by a weak pressing
with a pestle. Since the air-dried loamy sand was highly water-repellent, this soil was
slightly wetted before packing. A thin layer of coarse quartz sand on the top of the column
prevented splashing of soil material. The soil columns were slowly saturated from the
bottom with tap water for 3 to 4 days. The soil columns were mounted on a porous ceramic
plate (high flow, air-entry point > 1 bar). No suction was applied to the system.
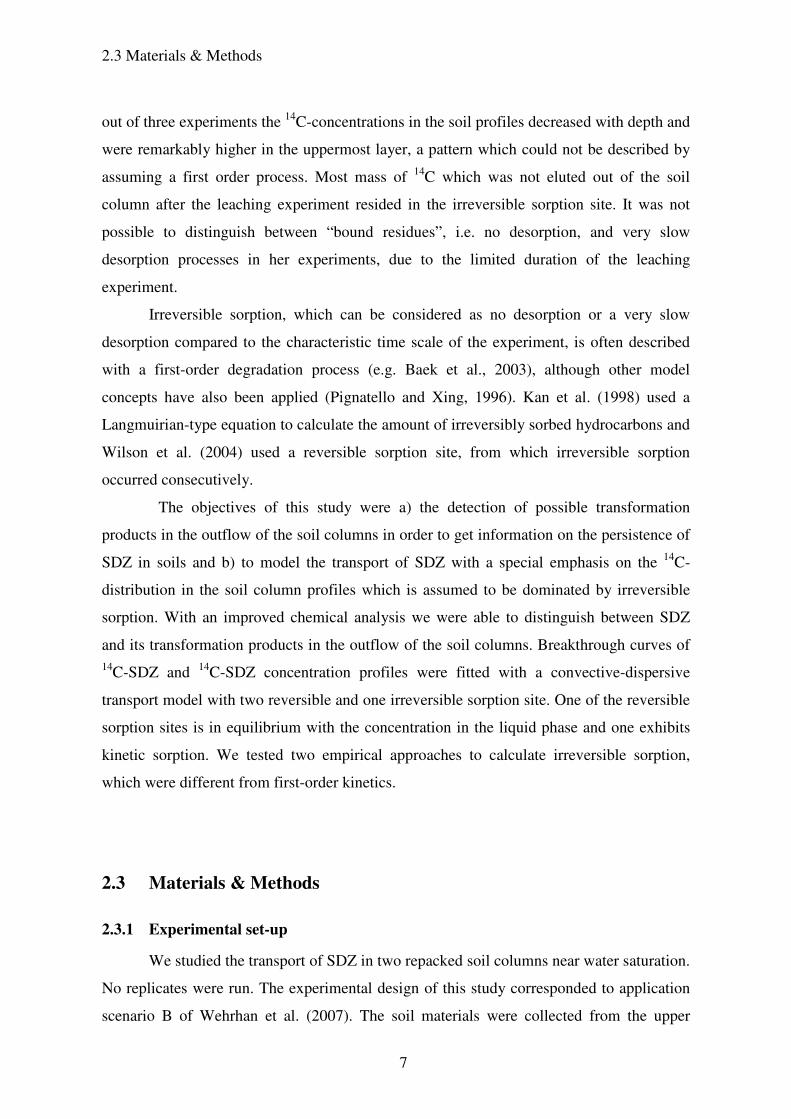
Table 2.1: Selected physical and chemical properties of the Kaldenkirchen soil (K)
and the Merzenhausen soil (M)
Unit Soil K Soil M
Clay (<0.002 mm)a [% mass] 4.9 15.4
Silt (0.002-0.064 mm)a [% mass] 26.7 78.7
Sand (0.064-2.000 mm)a [% mass] 68.5 5.9
pH (0.01 M CaCl2)b 5.9 6.2
Corg a,c [% mass] 1.07 1.24
CECd [cmolckg-1] 7.8 11.4 a Data were measured at the “Institut für Nutzpflanzenwissenschaften und Ressourcenschutz” at the University of Bonn. b average pH-values in the soil columns after the experiments. c Corg
is the concentration of total organic matter content. d Data for CEC were taken from Förster et al. (2008).
In order to establish steady state flow conditions, the soil columns were irrigated
with a 0.01 M CaCl2-solution at a constant rate of approximately 0.25 cm h-1 for a few days
using an irrigation device with 12 needles. The device was placed on the top of the column.
The influent solution was supplied by a flexible-tube pump and the irrigation rate was
controlled by weighing the water loss from the fluent storage. The outflow was collected in
test tubes of a fraction collector.
2.3 Materials & Methods
9
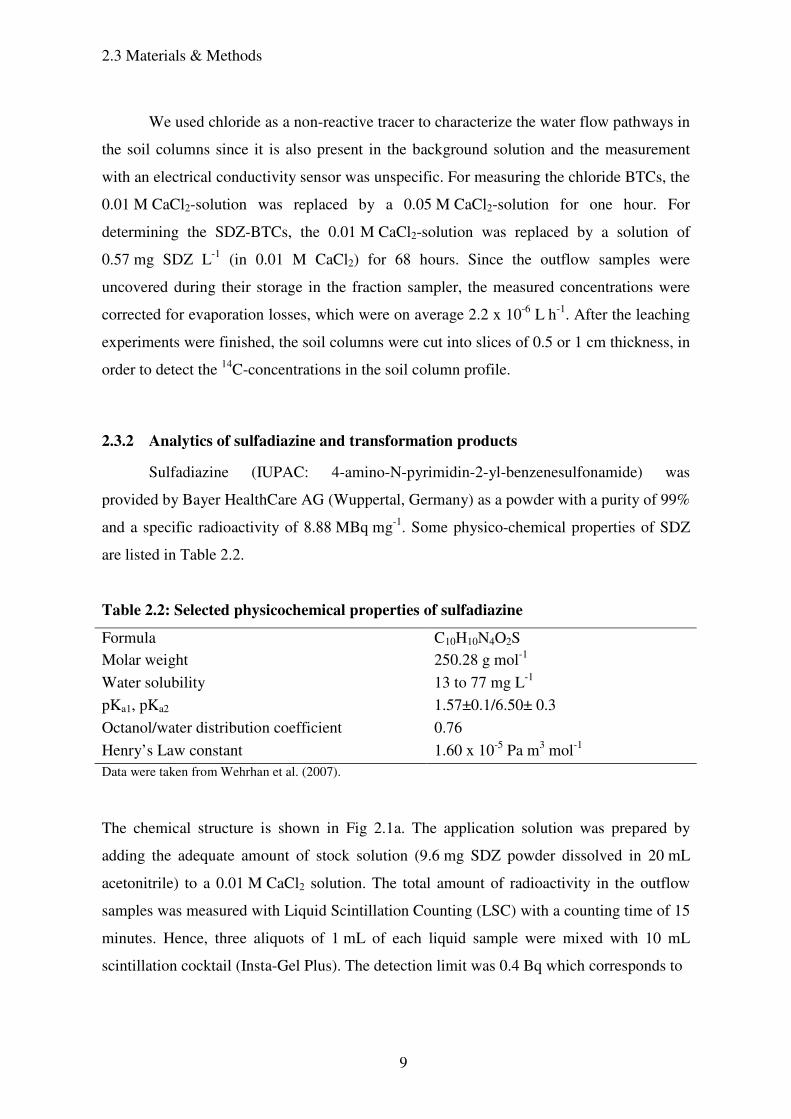
We used chloride as a non-reactive tracer to characterize the water flow pathways in
the soil columns since it is also present in the background solution and the measurement
with an electrical conductivity sensor was unspecific. For measuring the chloride BTCs, the
0.01 M CaCl2-solution was replaced by a 0.05 M CaCl2-solution for one hour. For
determining the SDZ-BTCs, the 0.01 M CaCl2-solution was replaced by a solution of
0.57 mg SDZ L-1 (in 0.01 M CaCl2) for 68 hours. Since the outflow samples were
uncovered during their storage in the fraction sampler, the measured concentrations were
corrected for evaporation losses, which were on average 2.2 x 10⁻⁶ L h-1. After the leaching
experiments were finished, the soil columns were cut into slices of 0.5 or 1 cm thickness, in
order to detect the 14C-concentrations in the soil column profile.
2.3.2 Analytics of sulfadiazine and transformation products
Sulfadiazine (IUPAC: 4-amino-N-pyrimidin-2-yl-benzenesulfonamide) was
provided by Bayer HealthCare AG (Wuppertal, Germany) as a powder with a purity of 99%
and a specific radioactivity of 8.88 MBq mg-1. Some physico-chemical properties of SDZ
are listed in Table 2.2.
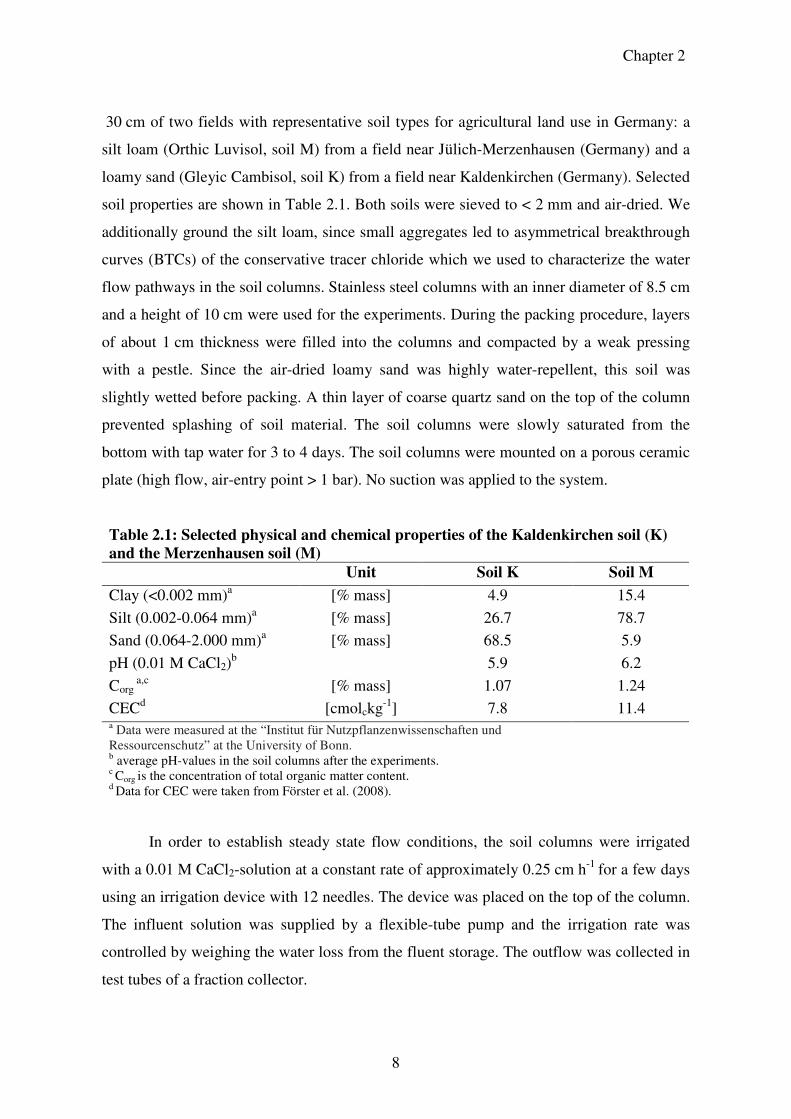
Table 2.2: Selected physicochemical properties of sulfadiazine
Formula C10H10N4O2S Molar weight 250.28 g mol-1
Water solubility 13 to 77 mg L-1
pKa1, pKa2 1.57±0.1/6.50± 0.3
Octanol/water distribution coefficient 0.76
Henry’s Law constant 1.60 x 10⁻⁵ Pa m3 mol-1 Data were taken from Wehrhan et al. (2007).
The chemical structure is shown in Fig 2.1a. The application solution was prepared by
adding the adequate amount of stock solution (9.6 mg SDZ powder dissolved in 20 mL
acetonitrile) to a 0.01 M CaCl2 solution. The total amount of radioactivity in the outflow
samples was measured with Liquid Scintillation Counting (LSC) with a counting time of 15
minutes. Hence, three aliquots of 1 mL of each liquid sample were mixed with 10 mL
scintillation cocktail (Insta-Gel Plus). The detection limit was 0.4 Bq which corresponds to
Chapter 2
10
0.045 ng mass equivalents of SDZ. The samples were corrected for background radiation
by an additional measurement of a blank.
SDZ and the main transformation products were separated by the use of Radio-
HPLC. The HPLC-system included an reversed-phase column (Phenomenex Synergi
Fusion RP 80, 250 mm x 4.6 mm) which was eluted with a mixture of water (490 mL) and
methanol (10 mL), buffered with 0.5 mL of a 25% phosphoric acid solution. The injection
volume was 0.25 mL for each sample. A gradient with an increased amount of methanol
was used for peak separation, starting with 100% water for 6 minutes. The methanol
fraction increased linearly to 27% till minute 23, then to 37% in the next three minutes and
to 47% in the following two minutes. The methanol part reached its maximum with 57%
after 30 minutes. With this protocol, we were able to distinguish four peaks in the
chromatograms, of which three were identified as SDZ, 4-hydroxy-SDZ (N1-2-(4-
hydroxypyrimidinyl)benzenesulfanilamide) and 4-(2-iminopyrimidin-1(2H)-yl)aniline. We
identified SDZ and 4-hydroxy-SDZ according to their retention times which we know from
a SDZ-standard and previous experiments. 4-(2-iminopyrimidin-1(2H)-yl)aniline was
identified by the Institute of Environmental Research at the University of Dortmund,
Germany. In the experiments of Lamshöft et al. (2007), who used another HPLC-separation
method, the SDZ-transformation products 5-hydroxy-SDZ and N-formyl-SDZ have similar
retention times as SDZ. Therefore we may also not be able to detect them with our HPLC-
setup. But in other studies (Lamshöft et al., (2007), Sukul et al., (2008b)) they only
appeared in traces and so their possible co-elution would not change our results
significantly. These studies do not mention possible co-eluting compounds in the peaks of
4-(2-iminopyrimidin-1(2H)-yl)aniline and 4-hydroxy-SDZ. The chemical structures of
these compounds are shown in Figure 2.1.
2.3 Materials & Methods
11
S O
O
NH2
NH N
N
pka1
pka2
(a) sulfadiazine
NH2 N
N
NH
(b) 4-(2-iminopyrimidin-1(2H)-yl)aniline
SO2NHNH
2
N
N
OH
(c) 4-hydroxy-sulfadiazine
*
Figure 2.1. Chemical structure of (a) SDZ, the 14C-labeling with a specific radioactivity of 8.88 MBq mg-1 is marked by a star and the ionisable moieties (Sakurai & Ishimitsu 1980) at the two pka values are marked by rectangles, (b) 4-(2-iminopyrimidin-1(2H)-yl)aniline and (c) 4-hydroxy-SDZ.
Using HPLC the detection limit for SDZ and its transformation products is about
3 µg L-1 mass equivalents of SDZ. For the transformation products this concentration was
only found in the samples with the highest 14C-concentrations. In order to detect SDZ and
the transformation products also in samples at lower concentrations, we changed the
measurement procedure. The outflow of the HPLC was collected according to the retention
times of SDZ and the transformation products, and also in-between these time frames. We
used a standard for sulfadiazine to fix the retention time for the SDZ-peak. No standards
were available for 4-hydroxy-SDZ, 4-(2-iminopyrimidin-1(2H)-yl)aniline and an additional
unknown product, which was only detected in soil M. Therefore, these compounds were
identified by setting their retention times in relation to the retention time of the known
peak.
The correction of the background radioactivity was performed by collecting the
outflow of the HPLC-column at the beginning and the end of each HPLC-run and
subtracting the averaged background radioactivity from the radioactivity in the peaks. In
some samples, which were collected outside of the retention times of the peaks, the
radioactivity was higher than the background signal, but this radioactivity could not be
associated to an own peak. Additionally, the sum of radioactivity in the collected outflow
varied between 95% and 105% of the total radioactivity measured in aliquots of the
respective samples. Therefore, we performed the following correction to compare the
Chapter 2
12
concentration (Ci) of compound i, with the total measured 14C-concentration (14Ctotal) in an
aliquot of the respective sample:
Ci= total
correctedj
backgroundduncorrecteiC
RA
RARA 14
*)(
Σ
−
(2.1)
where RAi,uncorrected is the radioactivity in the peak before subtracting the background
radioactivity RAbackground and RAjcorrected is the background corrected radioactivity of
compound j in the respective sample. With this procedure, the sum of the transformation
products adds up to 100% radioactivity. With the help of the specific radioactivity of SDZ
the transformation products can be quantified in mass equivalents of SDZ according to the
calculated parts. A transformation product was quantified, when the measured radioactivity
was higher than 1.2 Bq, which is three times the detection limit of the LSC. Otherwise its
contribution was set to zero. With this method the transformation products could be
identified down to a concentration of 0.5 µg L-1 mass equivalents of SDZ. The method was
validated by determining the correlation between the total radioactivity in one diluted
outflow sample of each soil and the radioactivity measured in the peaks of this sample (see
Figure 2.2). The obtained correlations for SDZ, 4-(2-iminopyrimidin-1(2H)-yl)aniline and
4-hydroxy-SDZ were high (R2 > 0.99) and significant (t-test) with a probability of 99%.
2.3 Materials & Methods
13
Figure 2.2. Correlation curves for the Liquid Scintillation Counting measurements of SDZ, 4-(2-iminopyrimidin-1(2H)-yl)aniline and 4-hydroxy-SDZ for one outflow sample of (a) the Kaldenkirchen soil (K) and (b) the Merzenhausen soil (M). Bars indicate the root mean square deviation.
In order to quantify the resident concentration profiles of 14C-SDZ in the soil
column, the column was cut into slices of 0.5 or 1 cm thickness at the end of the leaching
experiments. Only the total amount of radioactivity was measured in the soil since
extraction efficiencies are on a relatively low level and vary for fresh (> 70%) and aged (>
45%) SDZ-residues (Förster et al., 2008). For each slice three replicates of 0.5 g oven-dried
(105°C), grounded and homogenized soil were combusted in an oxidizer. After combustion,
the evolving gas was washed into a scintillation cocktail (Oxysolve) in which the labeled
Chapter 2
14
CO2 was trapped. This cocktail was measured with LSC. Blanks were run before and after
the samples to check for background and cross contamination. The efficiency of the
combustion process (>98%) was ascertained by combusting samples spiked with a known
amount of the model compound 14C-Anilazine prior and after the samples of the
experiment.
2.3.3 Theory of solute transport
Water flow and solute transport in the repacked soil columns were treated as one-
dimensional transport problems in the mathematical solutions. The convection–dispersion
equation (CDE) is commonly used to describe the transport of solutes. For conservative
tracers, like chloride, it can be written for steady state flow conditions as:
where t is time [T], v is pore-water velocity [L T-1], C is solute concentration in the liquid
phase [M L-3], D is dispersion coefficient [L2 T-1] and z is depth [L]. The chloride BTCs
were used to estimate the parameters v and D by a non-linear parameter estimation
procedure based on the Levenberg-Marquardt algorithm. We used the CXTFIT code
(Toride et al., 1999), which analytically solves the CDE for the appropriate boundary
conditions, i.e. a flux-type upper boundary condition and a zero gradient at the lower
boundary. With the estimated transport parameters and the experimentally determined
Darcian flow velocity, q, the volumetric water content, θ=q/v, and the dispersivity, λ=D/ v,
were calculated and used to fix the water flow for the transport simulations of the reactive
tracer SDZ.
For modeling the transport of SDZ, we used an isotherm-based model concept with
two reversible and one irreversible sorption site, like in the work of Wehrhan et al. (2007).
For this model concept the transport equation can be written as:
2
2
z
CD
z
Cv
t
C
∂
∂+
∂
∂−=
∂
∂
(2.2)
µθ
ρ−
∂
∂+
∂
∂−=
∂
∂+
∂
∂2
2
z
CD
z
Cv
t
S
t
C
(2.3)
2.3 Materials & Methods
15
where θ is the water content [L3 L-3], ρ is bulk density [M L-3], S is the adsorbed solute
concentration [M M-1] and µ [M L-3 T-1] is a term that accounts for degradation, which is
used here to mimic irreversible sorption (Baek et al., 2003).
The adsorbed solute concentration, S, is defined as the sum of the solute concentration
adsorbed at the equilibrium sorption site S1 and the rate-limited sorption site S2 [M M-1].
S1 and S2 are described as:
where Kf [M1-msoluteL
3mM-1soil] is the Freundlich coefficient and m [-] is the Freundlich
exponent, f [-] is the fraction of total sorption sites which are in equilibrium with the
concentration in the liquid phase and α [T-1] is the sorption rate coefficient. The transport
parameters were fitted to the log10-transformed concentration data so that the BTC tailing
got an increased weighting. To account for differences in the number of data points and the
absolute concentration values, the data of the profiles were weighed with a factor, w,
according to
profilei
n
i
BTCi
n
i
BTC
profile
C
C
n
nw
profile
BTC
,1
,1
=
=
∑
∑=
(2.7)
where n accounts for the number of data points in the respective BTC and concentration
profile and Ci are the measured concentrations at time i for the BTC expressed in mass of
SDZ per volume of solution and the measured concentrations at depth i in the soil profile
expressed in mass of SDZ per volume of soil.
The results of Wehrhan et al. (2007) showed that both an isotherm-based and an
attachment/detachment model with two reversible and one irreversible sorption site were
able to describe the measured SDZ-BTCs in soil columns of a silty loam, but not the 14C-
distribution in the soil column profiles. In these two models irreversible sorption was
treated as a first-order process. In this study we test two additional approaches to account
21 SSS += (2.4)
m
f CfKS =1 (2.5)
))1(( 222 SCKft
S m
f −−=∂
∂α (2.6)
Chapter 2
16
for irreversible sorption. In a first approach we assume higher-order irreversible sorption
according to the orders of chemical reactions and in a second approach we used an
exponential model, like it was applied for example in Elovich´s equation (Zeldowitsch,
1934). For model approach 1, the term used to calculate irreversible sorption µ was
calculated as
kCβµ = (2.8)
where β is the irreversible rate coefficient [L3(k-1)M1-kT-1] and k [-] is an exponent. Notice
that for k=1, irreversible sorption is described by a first-order process. In the second
approach µ is expressed as:
)(exp kCβµ = , (2.9)
where β is again the irreversible rate coefficient [M L-3 T-1]and k [L3M-1] is now a factor to
enlarge the exponent in the exponential function.
We used the finite element code Hydrus6.0 (Šimůnek et al., 1998) to solve the
convection-dispersion equation for solute transport and modified it to account for the two
irreversible sorption concepts. We coupled Hydrus6.0 with the non-linear parameter
estimation code PEST (Doherty, 2002) which estimates the transport parameters using the
Gauss-Levenberg-Marquardt algorithm. For the optimal parameter set, the sum of squared
deviations between model-generated and experimental observations, expressed by the
objective function Ф, is reduced to a minimum:
( ) ,1
2∑
=
=Φm
i
iirw (2.10)
where m is the total number of the observed data points and model outcomes, wi is a
weighting factor for the i´th observation and ri is the difference between the i´th
modeloutcome and the corresponding observed value (Doherty, 2002).
2.4 Results & Discussion
17
2.4 Results & Discussion
The measured BTCs and the model fits with the CDE are shown in Figure 2.3.
0.00
0.10
0.20
0.30
0.40
0.50
0.00 0.25 0.50 0.75 1.00 1.25 1.50 1.75 2.00 2.25 2.50
Pore volume [-]
Ch
lori
de
co
nce
ntr
atio
n [
g L
-1]
Soil K
Soil M
Figure 2.3. Chloride breakthrough curves for the Kaldenkirchen soil (K) and the Merzenhausen soil (M). Symbols represent measurements and lines model predictions using the convection–dispersion equation.
The higher spreading in soil K, expressed by a larger dispersivity, causes a lower peak
concentration for chloride than in soil M. The estimated transport parameters are listed in
Table 2.3. In both soils the physical equilibrium CDE was able to describe the chloride
BTCs and therefore, we assumed that chloride transport was not affected by non-
equilibrium water flow processes.
Table 2.3: Transport parameters for the conservative tracer chloride.
v
[cm h-1] D
[cm2 h-1] R²
q [cm h-1]
θ [cm3 cm-3]
λ [cm]
ρ [g cm-3]
K 0.64 (± 0.02)a 0.24 (± 0.04) 0.97 0.26 0.41 0.38 1.31
M 0.49 (± 0.00) 0.030 (± 0.00) 0.99 0.24 0.49 0.063 1.34
v is pore-water velocity, D is dispersion coefficient, the R²-value is a measure of the relative magnitude of the total sum of squares associated with the fitted equation, q is the experimentally determined Darcian flux density, θ is water content, λ is dispersivity and ρ is the bulk density. a values between brackets indicate 95% confidence interval.
Chapter 2
18
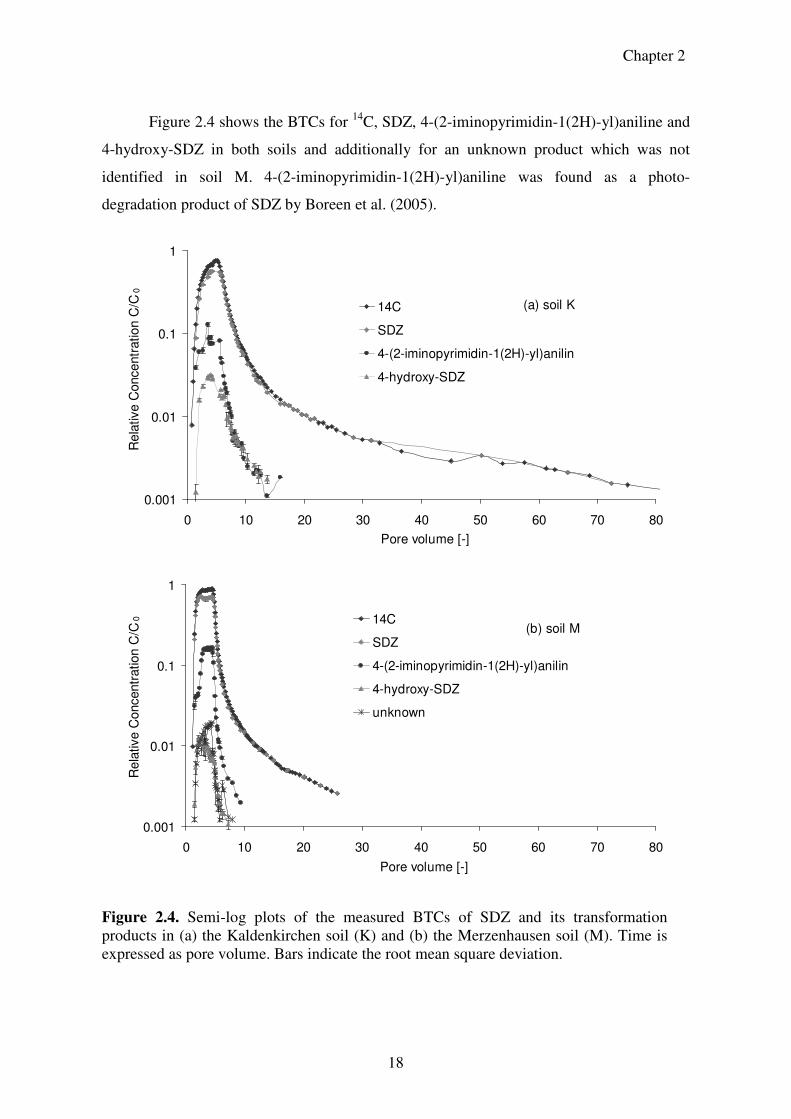
Figure 2.4 shows the BTCs for 14C, SDZ, 4-(2-iminopyrimidin-1(2H)-yl)aniline and
4-hydroxy-SDZ in both soils and additionally for an unknown product which was not
identified in soil M. 4-(2-iminopyrimidin-1(2H)-yl)aniline was found as a photo-
degradation product of SDZ by Boreen et al. (2005).
(a) soil K
0.001
0.01
0.1
1
0 10 20 30 40 50 60 70 80
Pore volume [-]
Rela
tive C
oncentr
ation C
/C0
14C
SDZ
4-(2-iminopyrimidin-1(2H)-yl)anilin
4-hydroxy-SDZ
(b) soil M
0.001
0.01
0.1
1
0 10 20 30 40 50 60 70 80
Pore volume [-]
Rela
tive C
oncentr
ation C
/C0
14C
SDZ
4-(2-iminopyrimidin-1(2H)-yl)anilin
4-hydroxy-SDZ
unknown
Figure 2.4. Semi-log plots of the measured BTCs of SDZ and its transformation products in (a) the Kaldenkirchen soil (K) and (b) the Merzenhausen soil (M). Time is expressed as pore volume. Bars indicate the root mean square deviation.
2.4 Results & Discussion
19
In additional experiments we observed an increase of this product after exposure of SDZ-
solutions to light (data not shown). The outflow samples were exposed to light in the
fraction collector (normal light conditions in the laboratory) and we assume that the
transformation had occurred at least partly in the tubes and not in the soils. Therefore this
product was added to SDZ for the modeling process. The highest 14C-concentrations in the
BTCs amounted to 76% of the applied 14C-concentration for soil K and 88% for soil M.
The contribution of transformation products to the total concentration was low for both
soils, with on average 4.8% in soil K and 2.9% in soil M, after adding 4-(2-
iminopyrimidin-1(2H)-yl) to SDZ (Table 2.4).
Table 2.4: Mass recoveries and the mean distribution of SDZ and the transformation
products in the outflow samples of the two soils
14C eluted [%]
14C in profile
[%]
14C total [%]
SDZ [%]
4-(2-iminopyrimidin
-1(2H)-
yl)aniline [%]
4-hydroxy-SDZ [%]
Unknown [%]
K 84.9 11.6 96.5 86.2 9.0 4.8 -
M 91.4 7.8 99.2 84.1 13.0 1.2 1.7 14C-totals are the mass balances for the two experiments. The percentages for sulfadiazine and the transformation products represent the average parts in the outflow samples. If measured value below the set detection limit of 1.2 Bq they were set to zero.
With this we found a remarkable lower part of transformation products as Wehrhan
et al. (2006) who detected 43% of the total radioactivity in the transformation products in a
soil column study with a corresponding experimental setup but with a different soil type.
The 14C-peak is pointed in soil K, whereas it reached a semi-plateau after a strong increase
of concentration in soil M. This might point at different sorption kinetics. After the peak
maxima the decrease of concentration is faster in soil M. Nevertheless, the 14C-BTCs in
both soils are characterized by an extended tailing. The BTCs of our study have similar
shapes as the corresponding curve (column B) of Wehrhan et al. (2007), which was run
under the same boundary conditions but with a different soil type. With total mass balances
of almost 100%, the eluted amount of 14C is lower in soil K (85%) than in soil M (91%).
Speciation could be a possible reason for this. The distribution of species in the two soils
was calculated according to Schwarzenbach et al. (2003). For soil K, 80.3% consisted of
the neutral species and 19.2% of the anionic species. For soil M the amount of the less
sorbing anionic species was higher with 35.5%. Although the difference between the
measured pH-values in the soils after the experiments was not high (Table 2.1), the
Chapter 2
20
distribution of species is different since both pH-values are close to pKa2 where small
changes in the pH-value lead to high changes in the distribution of the species. For other
sulfonamides, Kurwadkar et al. (2007) observed a decreased sorption capacity with
increasing pH due to the repulsive forces with the predominantly negatively charged soil
particles. The percentage of organic carbon which has also a great influence on the sorption
behavior of sulfonamides (Thiele-Bruhn et al., 2004) is higher in soil M. Also the CEC is
higher in soil M but due to the high pH-values the part of the cationic species is negligible.
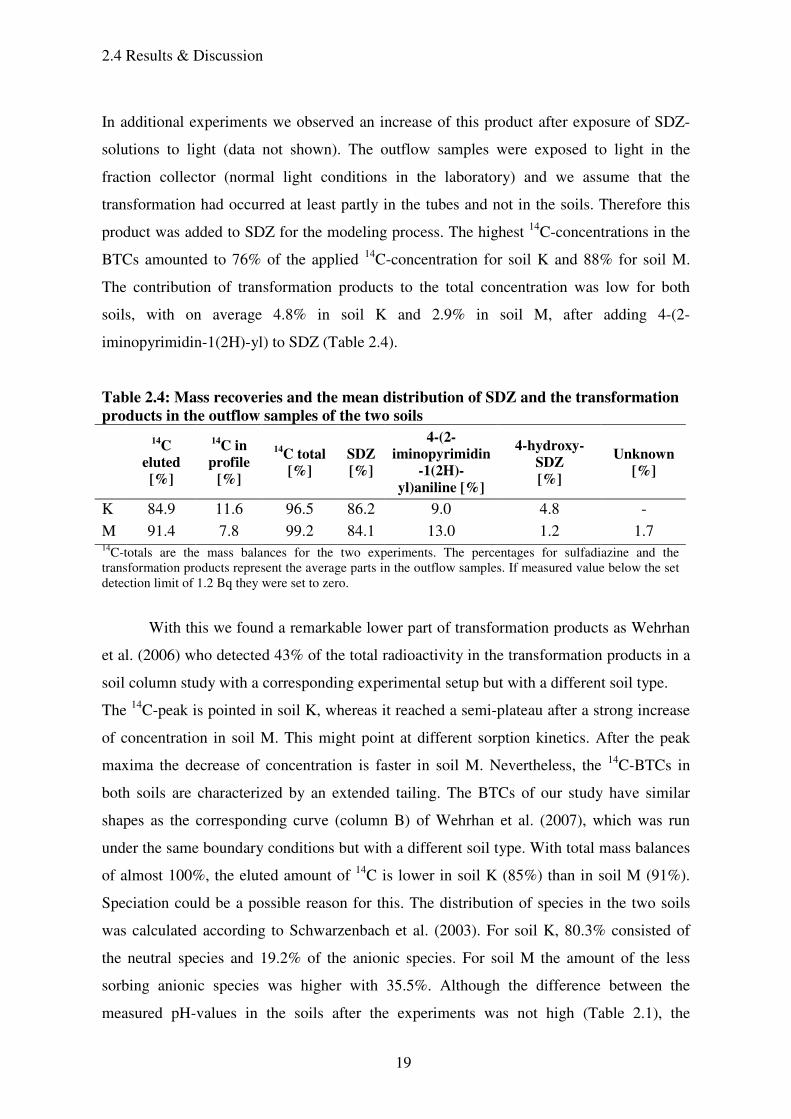
The shape of the measured concentration profiles looked different (Figure 2.5).
Although most of the 14C mass was found in the uppermost layers of both soils, the 14C-
profile was more curved in soil M, with higher concentrations in the surface layer and
lower concentrations in the bottom layer. The profile of soil K was additionally
characterized by an increased 14C-concentration below a depth of 6 cm. This increase may
result from an accidental compression of the soil during the cutting procedure when the soil
was too wet. Various authors have observed incomplete breakthrough of sulfonamides
(Boxall et al., 2002; Drillia et al., 2005; Kay et al., 2004; Kay et al., 2005a). Kreuzig &
Höltge (2005) detected 64% of the applied amount of 14C-SDZ in the first 5 cm of a
-10.0
-8.0
-6.0
-4.0
-2.0
0.0
0 0.1 0.2 0.3 0.4 0.514
C-Concentration in SDZ-equivalents [µg cm-3
]
Depth
[cm
] soil K
soil M
Figure 2.5. 14C distributions in the soil column profiles of the Kaldenkirchen soil (K) and
the Merzenhausen soil (M). Bars indicate the root mean square deviation.
2.4 Results & Discussion
21
lysimeter, with decreasing amounts down to greater depths. Similar 14C-SDZ distributions
in soil columns were reported by Wehrhan et al. (2007), who found most of the applied 14C-
SDZ in the first three centimeters of soil columns, except for a short application duration
with a high input concentration. Similar patterns of concentration profiles were for example
found and successfully modeled for the transport of colloids (Bradford et al., 2002) or the
endocrine disruptor testosterone (Fan et al., 2007). According to these studies such
concentration profiles can be explained by depth-dependent processes like blocking,
filtration or straining or a high transformation into a daughter product with different
sorption properties as the parent compound. For a solute like SDZ we do not have any
indication for depth-dependent filtration processes and a fast transformation into a daughter
product seemed also not likely, since the detected transformation products in the outflow of
the soil columns show a high mobility in soil columns (unpublished data) and in literature
we found no evidence of a strong sorbing transformation product which is immediately
developed after contact to soil.
Figures 2.6 und 2.7 show the modeling results for 14C-BTCs and -distributions for
both modeling approaches of irreversible sorption. The fitted parameters of the various
models are listed in Table 2.5. First, we fitted the model on the BTC data only, describing
irreversible sorption with a first order process. These models (K/M 1- 1st order only BTC)
described the 14C-BTCs quite well in both soils, although we observed a systematical
underestimation of the measured concentrations at the beginning of the descending branch
of the BTC and at longer times in the tailing, and an overestimation in between. For soil K,
the leached concentrations were notably underestimated after 600 h, which corresponds to
about 50 pore volumes. Notice that the duration of the leaching experiment was 1200 hours
for soil K compared to 500 hours for soil M. One reason for this notable underestimation
may be that we measured fewer samples at the end of the leaching experiment and so the
weighting of this part was lower. The kinetic sorption rate coefficient, α, was three times
higher in soil M, which means that sorption approaches equilibrium faster in soil M than in
soil K. The Freundlich coefficient, Kf, was lower in soil M, which indicates a lower
sorption potential. Due to the larger clay content in soil M we expected a larger specific
surface area of the mineral constituents in this soil together with a higher sorption. Also the
CEC and the concentration of total organic matter are higher in soil M. One explanation for
the lower observed sorption may be again the higher amount of the less sorbing anionic
SDZ-species in soil M caused by the higher pH in this soil. The irreversible rate coefficient
Chapter 2
22
,β, was larger for soil K than for soil M, which was also reflected in the lower mass of 14C,
detected in the leachate for soil K. For parameter f we obtained a value very close to zero in
previous model steps which indicated that equilibrium sorption was negligible. Therefore
this parameter was fixed to zero for all model scenarios which means that our model
concept was reduced to a two-site model with one reversible (kinetic) and one irreversible
site. Also the parameter k was fixed for all models, since the irreversible rate coefficient, β,
and k appeared to be highly correlated.
In a second step we fitted the models simultaneously on the 14C-BTCs and 14C-
concentration profiles, still calculating irreversible sorption with a first order process.
Figure 2.7 illustrates that the shape of the measured concentration profiles cannot be
described with this model concept since it is not flexible enough to describe the
concentration profiles properly. Constraining the parameters on both the BTCs and the
concentration profile causes a shift in the predicted concentration profiles, but without
affecting their shape and the shape of the BTC. The value for Φ is minimized by changing
the rate coefficient for irreversible sorption, which results in slightly different eluted
amounts of SDZ from the soil column.
In a third step we fitted the models on the 14C-BTCs and 14C-concentration profiles
assuming higher order sorption processes and exponential relations for irreversible sorption.
For model approach 1, we increased the order of sorption from 1 to 5. For soil K the lowest
value for the objective function Ф was obtained for 2nd order irreversible sorption, therefore
only this curve is shown. Figure 2.6 illustrates that the increase of the order had no major
effect on the prediction of the 14C-BTCs, whereas the curvature of the concentration
profiles increased with increasing order (Figure 2.7). The same effect can be observed if
factor k is increased in the exponential model approach 2. For soil K the lowest value of
Φtotal was observed with model approach 2 and a factor of 9, indicating that this model fits
the data best. But this model was still not able to reproduce the measured shape correctly.
With higher factors the goodness of fit could not be improved. In general changes in the
objective function Φ of the different models were mainly governed by changes in Φprofile.
The eluted amounts of 14C for soil K (between 81 and 88%) are predicted well compared to
the measured 85%.
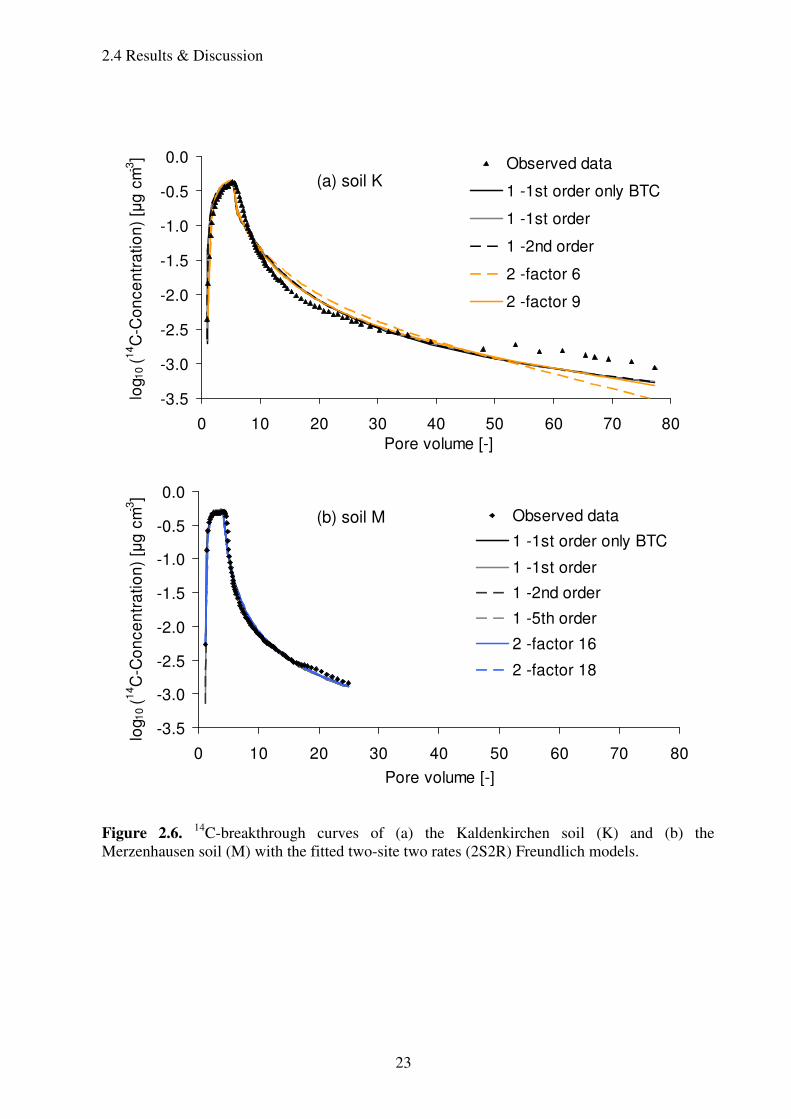
2.4 Results & Discussion
23
-3.5
-3.0
-2.5
-2.0
-1.5
-1.0
-0.5
0.0
0 10 20 30 40 50 60 70 80
Pore volume [-]
log 1
0 (
14C
-Co
nce
ntr
atio
n)
[µg
cm
-3]
Observed data
1 -1st order only BTC
1 -1st order
1 -2nd order
2 -factor 6
2 -factor 9
-3.5
-3.0
-2.5
-2.0
-1.5
-1.0
-0.5
0.0
0 10 20 30 40 50 60 70 80
Pore volume [-]
log 1
0 (
14C
-Co
nce
ntr
atio
n)
[µg
cm
-3]
Observed data
1 -1st order only BTC
1 -1st order
1 -2nd order
1 -5th order
2 -factor 16
2 -factor 18
(a) soil K
(b) soil M
Figure 2.6. 14C-breakthrough curves of (a) the Kaldenkirchen soil (K) and (b) the Merzenhausen soil (M) with the fitted two-site two rates (2S2R) Freundlich models.
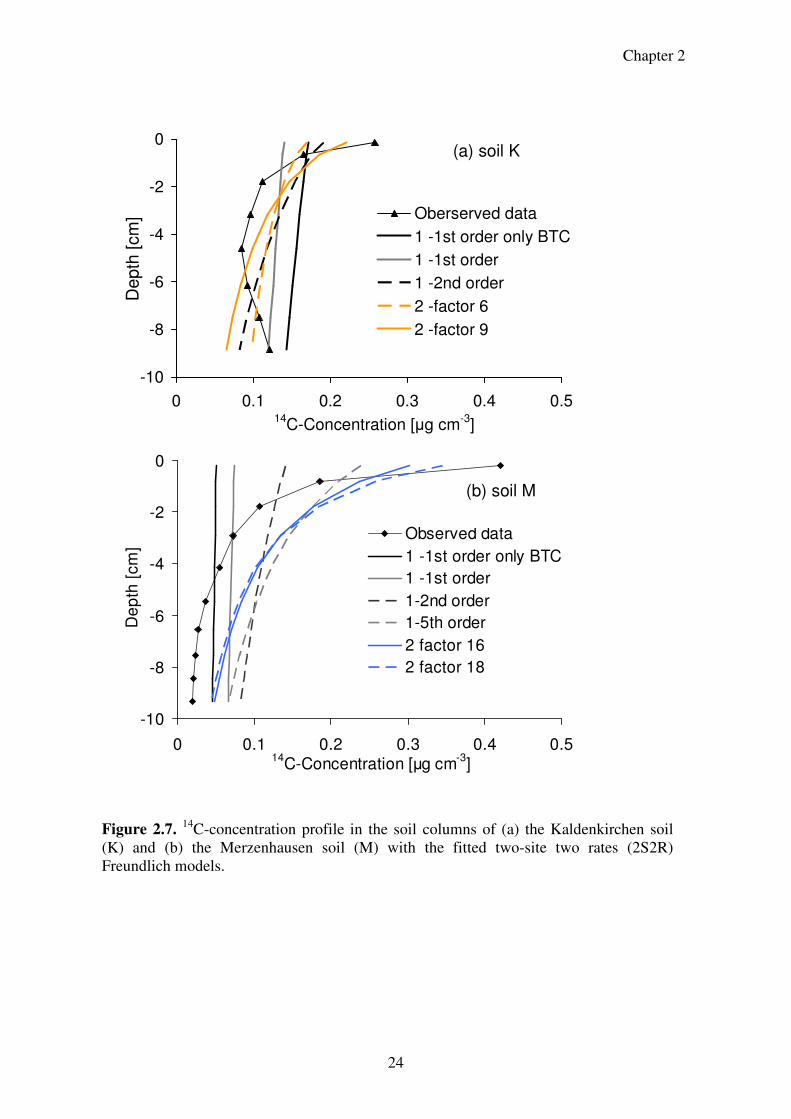
Chapter 2
24
-10
-8
-6
-4
-2
0
0 0.1 0.2 0.3 0.4 0.514
C-Concentration [µg cm-3
]
Depth
[cm
] Oberserved data
1 -1st order only BTC
1 -1st order
1 -2nd order
2 -factor 6
2 -factor 9
-10
-8
-6
-4
-2
0
0 0.1 0.2 0.3 0.4 0.514
C-Concentration [µg cm-3
]
De
pth
[cm
]
Observed data
1 -1st order only BTC
1 -1st order
1-2nd order
1-5th order
2 factor 16
2 factor 18
(a) soil K
(b) soil M
Figure 2.7. 14C-concentration profile in the soil columns of (a) the Kaldenkirchen soil
(K) and (b) the Merzenhausen soil (M) with the fitted two-site two rates (2S2R) Freundlich models.
2.4 Results & Discussion
25
Table 2.5: Fitting parameters for the Freundlich sorption models for 14
C-BTCs
α [h
-1]
Kf
[µg1-m
cm3m
kg-1
] m
β
[cm3(k-1)
mg1-k
h-1
]a
/[µg cm-3
h-1
]b
k
[-]a/
[cm3µg
-1]b
Φtotal ΦBTC Φprofile R2
Eluted
[%]
K - 1 –1st order only BTC
4.40 x 10⁻²
(±4.98 x 10⁻³)d 3.20 x 10⁻¹
(±3.62 x 10⁻²) 3.08 x 10⁻¹
(±4.44 x 10⁻²) 1.09 x 10⁻²
(±7.07 x 10⁻³) 1c 2.29 2.29 - 0.98 81.4
K 14C- 1 –1st order
4.42 x 10⁻²
(±7.21 x 10⁻³) 3.19 x 10⁻¹
(±4.54 x 10⁻²) 3.06 x 10⁻¹
(±6.63 x 10⁻²) 8.93 x 10⁻³
(±9.96 x 10⁻⁴) 1c 5.15 2.31 2.84 0.98 83.9
K 14C- 1 –2nd order
4.73 x 10⁻²
(±6.42 x 10⁻³) 3.04 x 10⁻¹
(±3.60 x 10⁻²) 3.08 x 10⁻¹
(±5.24 x 10⁻²) 2.27 x 10⁻²
(±2.29 x 10⁻³) 2c 3.83 2.29 1.54 0.99 84.7
K 14C- 2 – factor 6
4.23 x 10⁻²
(±7.25 x 10⁻³) 3.88 x 10⁻¹
(±2.85 x 10⁻²) 2.01 x 10⁻¹
(±2.25 x 10⁻²) 1.41 x 10⁻⁴
(±1.49 x 10⁻⁵) 6c 4.80 3.15 1.65 0.98 87.6
K 14C- 2 – factor 9
5.57 x 10⁻²
(±5.81 x 10⁻³) 3.21 x 10⁻¹
(±2.42 x 10⁻²) 2.11 x 10⁻¹
(±1.04 x 10⁻²) 5.05 x 10⁻⁵
(±4.52 x 10⁻⁶) 9c 2.89 1.73 1.15 0.99 82.0
M 14C- 1 –1st order BTC only
1.48 x 10⁻¹
(±3.31 x 10⁻²) 1.69 x 10⁻¹
(±1.09 x 10⁻²) 2.22 x 10⁻¹
(±4.00 x 10⁻²) 2.09 x 10⁻³
(±3.53 x 10⁻⁴) 1c 1.29 1.29 - 0.99 91.9
M 14C- 1 –1st order
1.48 x 10⁻¹ c 1.69 x 10⁻¹ c 2.22 x 10⁻¹ c 3.91 x 10⁻³ (±2.23
x 10-5) 1c 41.94 1.23 40.72 0.89 88.3
M 14C- 1 –2nd order
1.48 x 10⁻¹ c 1.69 x 10⁻¹ c 2.22 x 10⁻¹ c 1.34 x 10⁻²
(±6.18 x 10⁻⁴) 2c 32.29 1.49 30.80 0.91 84.6
M 14C- 1 –5th order
1.48 x 10⁻¹ c 1.69 x 10⁻¹ c 2.22 x 10⁻¹ c 1.29 x 10⁻¹
(±1.80 x 10⁻²) 5c 19.70 1.21 18.49 0.95 82.8
M 14C- 2 –factor 14
1.11 x 10⁻⁶
(±8.28 x 10⁻⁸) 16c 11.11 1.05 10.1 0.97 81.8
M 14C- 2 –factor 18
4.35 x 10⁻⁷
(±2.11 x 10⁻⁸) 18c 9.45 1.22 8.24 0.98 81.0
Parameters of Wehrhan et al. 2007
2.76 x 10⁻² c
6.08 x 10⁻¹ c 4.54 x 10⁻¹ c 2.53 x 10⁻² c 1c 59.0
a unit for model approach one; b unit for model approach two; c value was fixed, d value between brackets indicate 95% confidence interval.
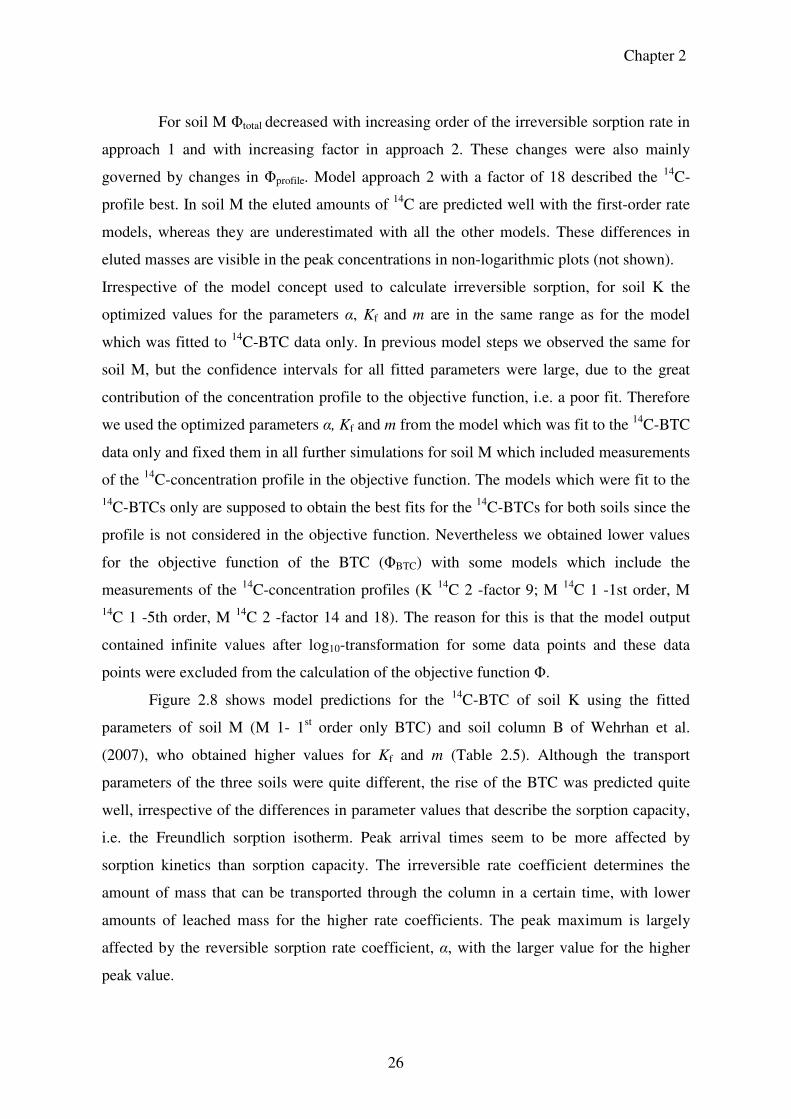
Chapter 2
26
For soil M Φtotal decreased with increasing order of the irreversible sorption rate in
approach 1 and with increasing factor in approach 2. These changes were also mainly
governed by changes in Φprofile. Model approach 2 with a factor of 18 described the 14C-
profile best. In soil M the eluted amounts of 14C are predicted well with the first-order rate
models, whereas they are underestimated with all the other models. These differences in
eluted masses are visible in the peak concentrations in non-logarithmic plots (not shown).
Irrespective of the model concept used to calculate irreversible sorption, for soil K the
optimized values for the parameters α, Kf and m are in the same range as for the model
which was fitted to 14C-BTC data only. In previous model steps we observed the same for
soil M, but the confidence intervals for all fitted parameters were large, due to the great
contribution of the concentration profile to the objective function, i.e. a poor fit. Therefore
we used the optimized parameters α, Kf and m from the model which was fit to the 14C-BTC
data only and fixed them in all further simulations for soil M which included measurements
of the 14C-concentration profile in the objective function. The models which were fit to the 14C-BTCs only are supposed to obtain the best fits for the 14C-BTCs for both soils since the
profile is not considered in the objective function. Nevertheless we obtained lower values
for the objective function of the BTC (ΦBTC) with some models which include the
measurements of the 14C-concentration profiles (K 14C 2 -factor 9; M 14C 1 -1st order, M 14C 1 -5th order, M 14C 2 -factor 14 and 18). The reason for this is that the model output
contained infinite values after log10-transformation for some data points and these data
points were excluded from the calculation of the objective function Φ.
Figure 2.8 shows model predictions for the 14C-BTC of soil K using the fitted
parameters of soil M (M 1- 1st order only BTC) and soil column B of Wehrhan et al.
(2007), who obtained higher values for Kf and m (Table 2.5). Although the transport
parameters of the three soils were quite different, the rise of the BTC was predicted quite
well, irrespective of the differences in parameter values that describe the sorption capacity,
i.e. the Freundlich sorption isotherm. Peak arrival times seem to be more affected by
sorption kinetics than sorption capacity. The irreversible rate coefficient determines the
amount of mass that can be transported through the column in a certain time, with lower
amounts of leached mass for the higher rate coefficients. The peak maximum is largely
affected by the reversible sorption rate coefficient, α, with the larger value for the higher
peak value.
2.5 Conclusions
27
-4.0
-3.5
-3.0
-2.5
-2.0
-1.5
-1.0
-0.5
0.0
0 10 20 30 40 50 60 70 80Pore volume [-]
log
10 (1
4C
-Concentr
ation)
[µg
cm
-3]
Observed data soil K
prediction with parameters of soil M
prediction with parameters of soil Greifensee
Figure 2.8. Measured 14C-breakthrough curve of the Kaldenkirchen soil (K) and model predictions with fitted parameter sets of the Merzenhausen soil (M) and the Greifensee soil used by Wehrhan et al. (2007).
Up to now we used the 14C data to determine the transport parameters. Since we
measured the SDZ-BTCs explicitly, we followed an approach to fit the transport parameters
to the measured SDZ-BTCs, by interpreting the effective first-order rate coefficient as
being comprised of irreversible sorption and transformation. However, since only 4.8%
(soil K) and 2.9% (soil M) of the applied SDZ was found as 4-hydroxy-SDZ in soil K and
as 4-hydroxy-SDZ and an unknown transformation product in soil M, simulations
concerning the estimation of transport parameters for SDZ itself proved to be not
meaningful. The model concepts seem not sensitive enough to deal with such minor
concentration changes in the BTCs of 14C and sulfadiazine.
2.5 Conclusions
The transport and transformation of SDZ were studied in laboratory soil column
experiments. An analytical method for the detection of SDZ and its transformation products
4-hydroxy-SDZ and 4-(2-iminopyrimidin-1(2H)-yl)aniline was developed with a detection
limit of 0.5 µg L−1.
With this the experiments revealed first insights in the transformation of SDZ during
the transport in soil columns. Aside from a low amount of 4-hydroxy-SDZ, 4-(2-
iminopyrimidin-1(2H)-yl)aniline, known as a photo-degradation product of SDZ, was
Chapter 2
28
detected in the outflow of the soil columns. Future experiments are necessary to asses
whether this transformation is a possible degradation process which reduces the persistence
of SDZ in soils. Under the given experimental conditions SDZ showed a high leaching
potential but also a tendency to accumulate in the uppermost layers of the soil columns,
probably due to the formation of irreversibly bound residues. A comparison of the model
parameters confirmed a higher leaching potential for the silty loam than for the loamy sand
and showed that the description of the concentration profiles in the soil columns is mainly
governed by the rate coefficient for irreversible sorption. The estimation of the 14C-
concentration profiles in the soil columns could be improved using two empirical
approaches to account for irreversible sorption, but the concentration profiles can still not
be predicted correctly. The sorption process which leads to irreversible sorption of SDZ is
still not well understood and requires further investigations.
29
3 Transport of sulfadiazine in undisturbed soil columns: the effect of flow rate and applied
mass2
3.1 Objectives
The objective of chapter 3 was to investigate SDZ transport in dependence of flow
rate and applied input concentration/mass using five undisturbed soil columns of the loamy
sand. Measured BTCs and concentration profiles of different experiments were modeled
with common parameter sets using an attachment/detachment based model approach.
3.2 Introduction
Introduction of antibiotic substances in the environment has become a serious
concern in the last decade. Through application of manure or sewage sludge on agricultural
fields these antibiotics are introduced in soils (Jørgensen and Halling-Sørensen, 2000)
where they may affect microbial processes and community structures (Hammesfahr et al.,
2008, Kotzerke et al., 2008) or may be leached to the groundwater (Sacher et al., 2001;
Hamscher et al., 2005; Focazio et al., 2008).
Our target substance SDZ belongs to the chemical class of sulfonamides which was
frequently detected throughout various environmental compartments and recently classified
as relevant to the environment in Germany (Bergmann et al., 2008). The understanding of
sorption and transport mechanisms is important to assess the spreading of SDZ in the
environment, especially its leaching potential from soils into groundwater. Compared to
antibiotics from other chemical classes, SDZ has a lower sorption coefficient, indicating
good water solubility and a higher mobility (Thiele-Bruhn et al., 2004). Experimental SDZ
sorption data could be best described as a nonlinear (Thiele-Bruhn et al., 2004) non-
equilibrium process with sorption coefficients increasing with time (Förster et al., 2009,
Wehrhan et al., 2009). This non-equilibrium or kinetic process may be explained by
diffusion processes into the intra-particle pore systems or organic matter and was also
2adapted from: Unold, M., R. Kasteel, J. Groeneweg and H. Vereecken (2009). Transport of sulfadiazine in undisturbed soil columns: the effect of flow rate and applied mass. Submitted to Journal of Environmental quality.
Chapter 3
30
found for pesticides like atrazine (Park et al., 2004). Sorption hysteresis was also reported
(Sukul et al., 2008a, Wehrhan et al., 2009). While this could be partly explained with a
kinetic process having slow desorption, also irreversible sorption of SDZ via covalent
bonding to organic substances was found (Bialk et al., 2008). In transport experiments,
sorption hysteresis became visible in incomplete breakthroughs where parts of the
substance were retained in the uppermost soil layers (Kreuzig et al., 2005; Unold et al.,
2009a,b; Wehrhan et al., 2007). Measured breakthrough curves (BTCs) showed extended
tailings which can be explained by slow kinetic processes or non-linear sorption behavior.
Furthermore, the pH value (Kahle and Stamm, 2007a; Kurwadkar et al., 2007) as well as
the amount and composition of organic material (Kahle and Stamm, 2007b; Thiele-Bruhn et
al., 2004) affected sorption of SDZ.
Several studies indicated that transformation of sulfonamides in soils occurs. This
was shown for acetylation (Burkhardt & Stamm 2007; Wehrhan, 2006) or hydroxylation
processes (Unold et al., 2009a,b; Wehrhan 2006). The hydroxylated form of SDZ, 4-OH-
SDZ (N1-2-(4-hydroxypyrimidinyl)benzenesulfanilamide), was also determined as one of
the main metabolites of SDZ in pig manure (Lamshöft et al., 2007). 4-OH-SDZ was found
to be still microbial active (Nouws 1989) which means that its fate has to be considered,
too. An-SDZ (4-[2-iminopyrimidine-1(2H)-yl]-aniline) was identified as a photo
degradation product of SDZ (Sukul et al., 2008b), but it was also detected in transport
experiments with soil performed in the dark (Unold et al., 2009b). To our knowledge,
potential adverse effects of the An-SDZ are unknown.
SDZ concentrations in manure and the amounts of manure applied to fields vary
which results in different masses of SDZ reaching the field. Also the flow rate in the field is
not constant due to rainfall events and evaporation which results in different pore-water
velocities. Effects of concentration and total applied mass on SDZ transport were revealed
in transport experiments in a silty loam conducted by Wehrhan et al. (2007). They found
that when the same mass of SDZ was applied by varying input concentration and pulse
duration, remarkably more mass was eluted in the experiment with the lower input
concentration. But when SDZ solutions with different concentrations were applied for the
same time, more mass eluted in the experiment with the higher input concentration. In
general, less retardation can be expected in higher concentration ranges for non-linear
sorbing solutes with adsorption isotherms that exhibit a convex shape with respect to the
solute concentration, like SDZ. The concentration of non-linear sorbing substances
3.2 Introduction
31
determines also the time which is needed to reach equilibrium. Braida et al. (2001) showed
that for PAHs sorption equilibrium was reached faster at higher concentrations.
Discussions in the literature on the effect of flow rate on sorption are ambiguous.
While some researchers observed changes in reaction rates with pore water velocity
(Brusseau, 1992; Kim et al., 2006) others did not (Deng et al., 2008). Due to the
pronounced differences in experimental results the hypothesis was developed that the
relationship between adsorption rate and pore water velocity is not simply determined by
the contact time between the solute and the soil surface (Zhang and Lv, 2009). Based on
pore scale simulations, Zhang and Lv (2009) and Zhang et al. (2008) proposed that
different reaction rates with pore water velocity are caused by heterogeneous sorption on
the microscopic scale.
Numerical analysis of experimental data allows the quantification and partly the
identification of governing transport processes. Parameter estimates obtained from a fit to
data can be used for the prediction of substance behavior. So far, attempts to
mathematically describe SDZ transport in soil columns have been very difficult due to the
complexity of the sorption processes. Besides irreversible sorption, reversible kinetic
sorption has to be considered. Wehrhan et al. (2007) could describe BTCs of SDZ best with
an attachment/detachment model which included two reversible kinetic sorption sites and
one kinetic irreversible sorption site. Unold et al. (2009a,b) used a fully kinetic model with
one reversible kinetic sorption site and one irreversible sorption site. Sorption on the
reversible sites was described by the Freundlich sorption isotherm. The study of Wehrhan
et al. (2007) revealed that, although one model concept was able to fit all BTCs, the
estimated parameters differed for BTCs made with different boundary conditions i.e., input
concentration and pulse duration.
The aims of the study were i) to investigate the effect of different input
concentrations and flow velocities on SDZ transport and ii) to investigate differences and
similarities in fitted parameter sets by simultaneously fitting BTCs obtained under different
experimental conditions. Measured 14C-breakthrough curves and concentration profiles
were modeled using two model concepts based on the convective-dispersive transport
model. The first model described the sorption process with a two-site model with one
reversible kinetic (described by Freundlich sorption) and one irreversible kinetic sorption
site. This model was also used for describing the transformation of SDZ into 4-OH-SDZ
and An-SDZ. The second model was based on the attachment/detachment approach using
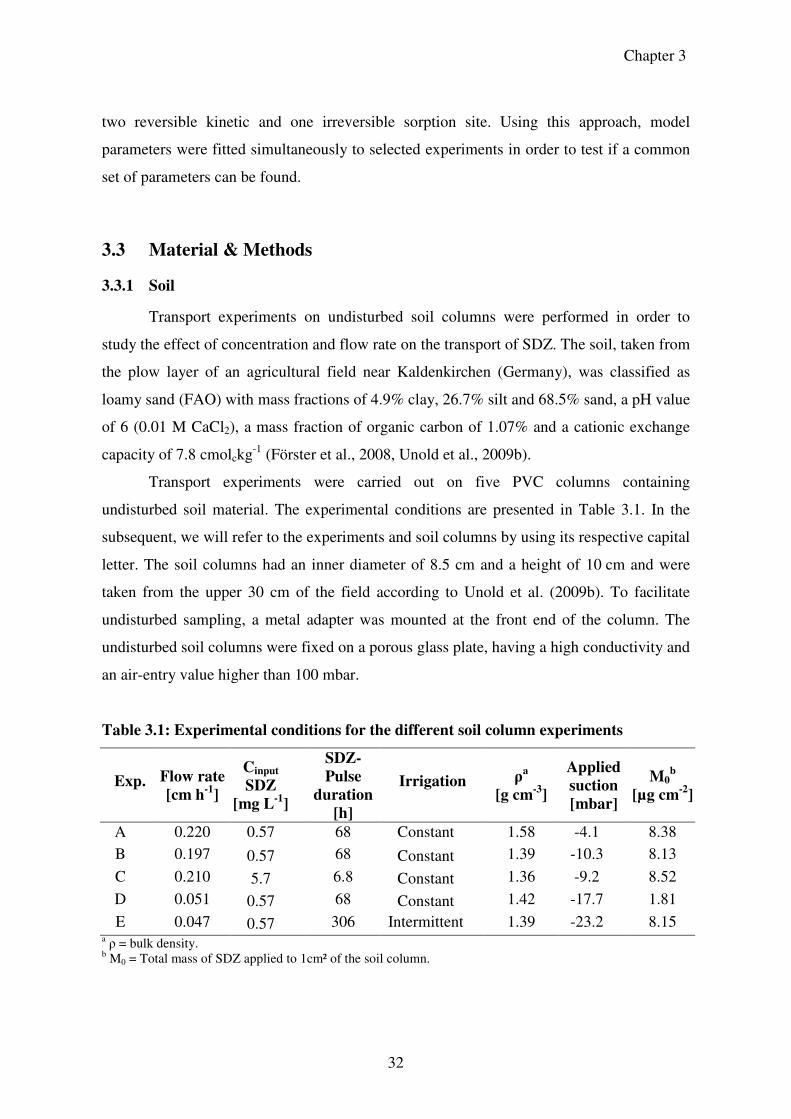
Chapter 3
32
two reversible kinetic and one irreversible sorption site. Using this approach, model
parameters were fitted simultaneously to selected experiments in order to test if a common
set of parameters can be found.
3.3 Material & Methods
3.3.1 Soil
Transport experiments on undisturbed soil columns were performed in order to
study the effect of concentration and flow rate on the transport of SDZ. The soil, taken from
the plow layer of an agricultural field near Kaldenkirchen (Germany), was classified as
loamy sand (FAO) with mass fractions of 4.9% clay, 26.7% silt and 68.5% sand, a pH value
of 6 (0.01 M CaCl2), a mass fraction of organic carbon of 1.07% and a cationic exchange
capacity of 7.8 cmolckg-1 (Förster et al., 2008, Unold et al., 2009b).
Transport experiments were carried out on five PVC columns containing
undisturbed soil material. The experimental conditions are presented in Table 3.1. In the
subsequent, we will refer to the experiments and soil columns by using its respective capital
letter. The soil columns had an inner diameter of 8.5 cm and a height of 10 cm and were
taken from the upper 30 cm of the field according to Unold et al. (2009b). To facilitate
undisturbed sampling, a metal adapter was mounted at the front end of the column. The
undisturbed soil columns were fixed on a porous glass plate, having a high conductivity and
an air-entry value higher than 100 mbar.
Table 3.1: Experimental conditions for the different soil column experiments
Exp. Flow rate
[cm h-1
]
Cinput
SDZ
[mg L-1
]
SDZ-
Pulse
duration
[h]
Irrigation ρa
[g cm-3
]
Applied
suction
[mbar]
M0b
[µg cm-2
]
A 0.220 0.57 68 Constant 1.58 -4.1 8.38
B 0.197 0.57 68 Constant 1.39 -10.3 8.13
C 0.210 5.7 6.8 Constant 1.36 -9.2 8.52
D 0.051 0.57 68 Constant 1.42 -17.7 1.81
E 0.047 0.57 306 Intermittent 1.39 -23.2 8.15 a ρ = bulk density. b M0 = Total mass of SDZ applied to 1cm² of the soil column.
3.3 Materials & Methods
33
Prior to the leaching experiments, the soil columns were slowly saturated from the
bottom with a 0.01 M CaCl2 solution for approximately 2 days. To avoid splashing of the
soil material during the irrigation process, a thin layer of coarse quartz sand was placed on
the top of the columns. Soil columns A, B and C were irrigated with a constant flow rate of
approximately 0.2 cm h-1; soil columns D and E with a lower flow rate of approximately
0.049 cm h-1. For soil column E the amount of irrigated water per hour was applied at a
higher flow rate during 5 minutes, followed by 55 minutes without irrigation.
All soil column experiments were run with a software-controlled experimental setup
that was described in more detail by Unold et al. (2009b). Irrigation with the 0.01 M CaCl2
background solution started a few days prior to the leaching experiments in order to
establish steady-state water flow conditions in the soil columns. Applied suctions were in a
range from -4.1 to -23.2 mbar. They were chosen separately for each soil column to
establish a constant pressure head in the soil columns for the given flow rates. This meant
that water was only driven by gravity. An electrical conductivity sensor integrated in the
experimental setup allowed the on-line measurement of BTCs with the conservative salt
tracer CaCl2. These BTCs were used to characterize physical transport mechanisms in the
soil columns. Electrical conductivity was related to chloride concentrations by determining
a calibration curve with samples of known chloride concentrations. Chloride was applied as
a 0.05 M CaCl2-solution in a pulse with one hour duration.
For measuring the BTCs of SDZ the background solution was replaced with the
respective SDZ-application solution for the time of the pulse duration (Table 2.1). The
outflow of the soil columns was collected in test tubes of a fraction collector. Measured
concentrations in the outflow samples were corrected for evaporation losses, which were
approximately 2.19 x 10⁻⁶ L h-1. The transport experiments were performed in the dark in
order to prevent photo-degradation. Only during sample collection and preparation, a short
exposure of the effluent samples to artificial light occurred. The samples were then stored
in the fridge at 5°C until measurements were conducted. After the leaching experiments,
the soil columns were cut into slices of 0.5 or 1 cm thickness, in order to detect the 14C-
concentrations in the soil column profile.
Chapter 3
34
3.3.2 Analytics of sulfadiazine and transformation products
The application solutions for the different experiments were prepared by adding the
adequate amounts of 14C-SDZ (solved in a 0.01 M CaCl2 stock solution) to a 0.01 M CaCl2
solution. 14C-SDZ (IUPAC: 4-amino-N-pyrimidin-2-yl-benzenesulfonamide) was provided
by Bayer HealthCare AG (Wuppertal, Germany) as a powder with a purity of 99% and a
specific radioactivity of 8.88 MBq mg-1. The pH value of the application solutions was
buffered to the pH value of the CaCl2 background solution (pH~5.6) in order to avoid a
change of the SDZ-speciation at the beginning and end of the application time.
The total amount of radioactivity in the outflow samples was measured in triplicates
with liquid scintillation counting (LSC) for a counting time of 15 minutes. Therefore
aliquots of 0.5 mL of each liquid sample were mixed with 10 mL scintillation cocktail
(Insta-Gel Plus, Canberra Packard GmbH, Dreieich, Germany). The detection limit of the
LSC measurements was 0.4 Bq corresponding to 0.045 ng mass equivalents of SDZ.
Samples were corrected for background radiation by an additional measurement of a blank.
For experiment C the concentrations of SDZ and its transformation products in the
outflow samples were determined using Radio-HPLC separation. The HPLC-system
contained a reversed-phase column (Phenomenex Synergi Fusion RP 80, 250 mm x
4.6 mm) which was eluted with a mixture of water (490 mL) and methanol (10 mL),
buffered with 0.5 mL of a 25% phosphoric acid solution. The injection volume was
0.25 mL for each sample. A gradient with an increased amount of methanol was used for
peak separation, starting with 100% water for 6 minutes. The methanol fraction increased
linearly to 27% till minute 23, then to 37% in the next three minutes and to 47% in the
following two minutes. The methanol part reached its maximum with 57% after 30 minutes
(Unold et al. 2009b).
Three peaks were distinguished in the drainage water of experiment C. According to
their known retention times from standards and previous studies, we identified them as
SDZ, 4-OH-SDZ and An-SDZ. Using the HPLC-detector (LB 509 detector, Berthold
Technologies, Bad Wildbad, Germany) the detection limit for SDZ and its transformation
products was about 3 µg L-1 mass equivalents of SDZ. We applied the same measurement
technique as in previous studies (Unold et al., 2009a,b) in order to detect SDZ and the
transformation products also in samples at lower concentrations. There, the outflow of the
HPLC-column was collected according to the retention times of SDZ and the
transformation products, and also in-between these time frames for determining background
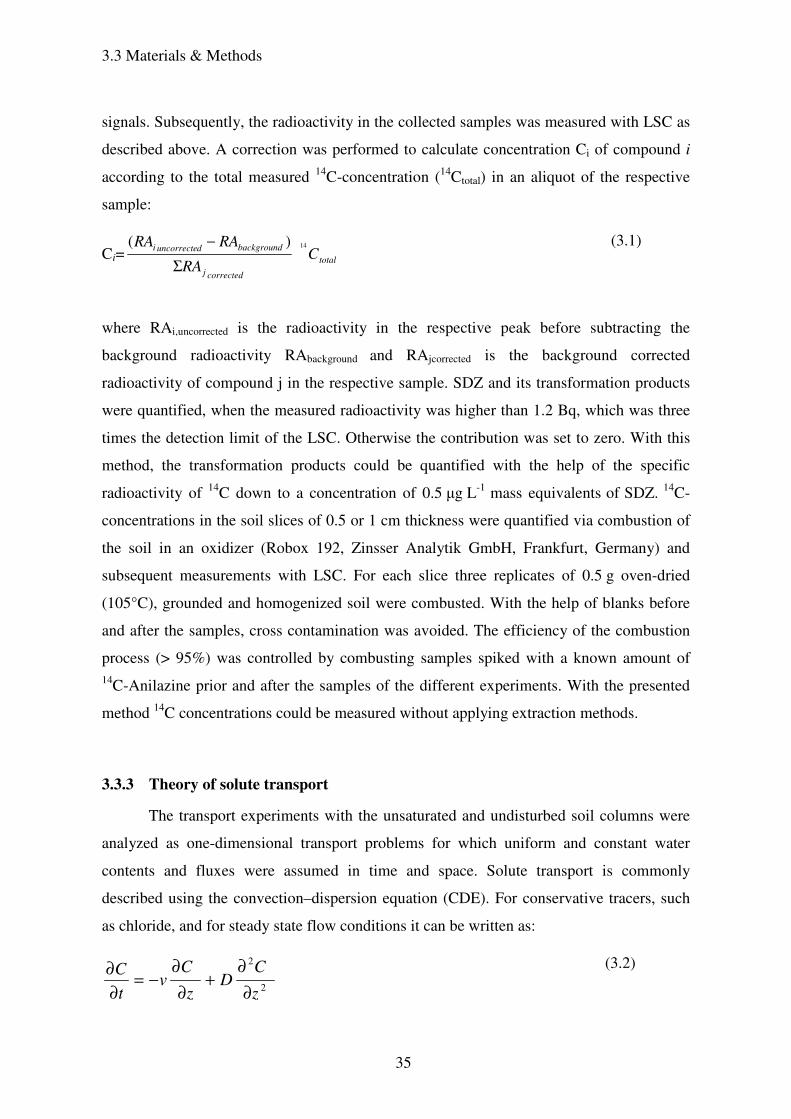
3.3 Materials & Methods
35
signals. Subsequently, the radioactivity in the collected samples was measured with LSC as
described above. A correction was performed to calculate concentration Ci of compound i
according to the total measured 14C-concentration (14Ctotal) in an aliquot of the respective
sample:
where RAi,uncorrected is the radioactivity in the respective peak before subtracting the
background radioactivity RAbackground and RAjcorrected is the background corrected
radioactivity of compound j in the respective sample. SDZ and its transformation products
were quantified, when the measured radioactivity was higher than 1.2 Bq, which was three
times the detection limit of the LSC. Otherwise the contribution was set to zero. With this
method, the transformation products could be quantified with the help of the specific
radioactivity of 14C down to a concentration of 0.5 µg L-1 mass equivalents of SDZ. 14C-
concentrations in the soil slices of 0.5 or 1 cm thickness were quantified via combustion of
the soil in an oxidizer (Robox 192, Zinsser Analytik GmbH, Frankfurt, Germany) and
subsequent measurements with LSC. For each slice three replicates of 0.5 g oven-dried
(105°C), grounded and homogenized soil were combusted. With the help of blanks before
and after the samples, cross contamination was avoided. The efficiency of the combustion
process (> 95%) was controlled by combusting samples spiked with a known amount of 14C-Anilazine prior and after the samples of the different experiments. With the presented
method 14C concentrations could be measured without applying extraction methods.
3.3.3 Theory of solute transport
The transport experiments with the unsaturated and undisturbed soil columns were
analyzed as one-dimensional transport problems for which uniform and constant water
contents and fluxes were assumed in time and space. Solute transport is commonly
described using the convection–dispersion equation (CDE). For conservative tracers, such
as chloride, and for steady state flow conditions it can be written as:
Ci= total
correctedj
backgroundduncorrecteiC
RA
RARA 14)(
Σ
−
(3.1)
2
2
z
CD
z
Cv
t
C
∂
∂+
∂
∂−=
∂
∂
(3.2)
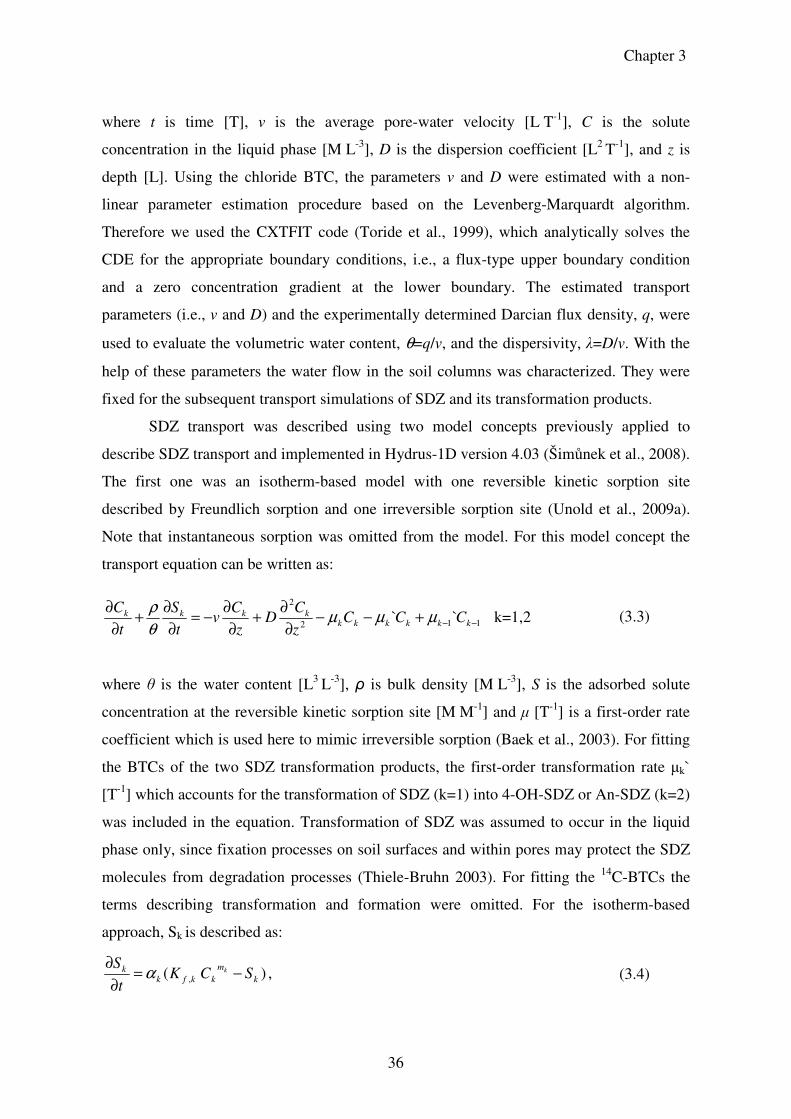
Chapter 3
36
where t is time [T], v is the average pore-water velocity [L T-1], C is the solute
concentration in the liquid phase [M L-3], D is the dispersion coefficient [L2 T-1], and z is
depth [L]. Using the chloride BTC, the parameters v and D were estimated with a non-
linear parameter estimation procedure based on the Levenberg-Marquardt algorithm.
Therefore we used the CXTFIT code (Toride et al., 1999), which analytically solves the
CDE for the appropriate boundary conditions, i.e., a flux-type upper boundary condition
and a zero concentration gradient at the lower boundary. The estimated transport
parameters (i.e., v and D) and the experimentally determined Darcian flux density, q, were
used to evaluate the volumetric water content, θ=q/v, and the dispersivity, λ=D/v. With the
help of these parameters the water flow in the soil columns was characterized. They were
fixed for the subsequent transport simulations of SDZ and its transformation products.
SDZ transport was described using two model concepts previously applied to
describe SDZ transport and implemented in Hydrus-1D version 4.03 (Šimůnek et al., 2008).
The first one was an isotherm-based model with one reversible kinetic sorption site
described by Freundlich sorption and one irreversible sorption site (Unold et al., 2009a).
Note that instantaneous sorption was omitted from the model. For this model concept the
transport equation can be written as:
where θ is the water content [L3 L-3], ρ is bulk density [M L-3], S is the adsorbed solute
concentration at the reversible kinetic sorption site [M M-1] and µ [T-1] is a first-order rate
coefficient which is used here to mimic irreversible sorption (Baek et al., 2003). For fitting
the BTCs of the two SDZ transformation products, the first-order transformation rate µk`
[T-1] which accounts for the transformation of SDZ (k=1) into 4-OH-SDZ or An-SDZ (k=2)
was included in the equation. Transformation of SDZ was assumed to occur in the liquid
phase only, since fixation processes on soil surfaces and within pores may protect the SDZ
molecules from degradation processes (Thiele-Bruhn 2003). For fitting the 14C-BTCs the
terms describing transformation and formation were omitted. For the isotherm-based
approach, Sk is described as:
112
2
`` −−+−−∂
∂+
∂
∂−=
∂
∂+
∂
∂kkkkkk
kkkk CCCz
CD
z
Cv
t
S
t
Cµµµ
θ
ρ k=1,2 (3.3)
)( , k
m
kkfkk SCKt
Sk −=
∂
∂α , (3.4)
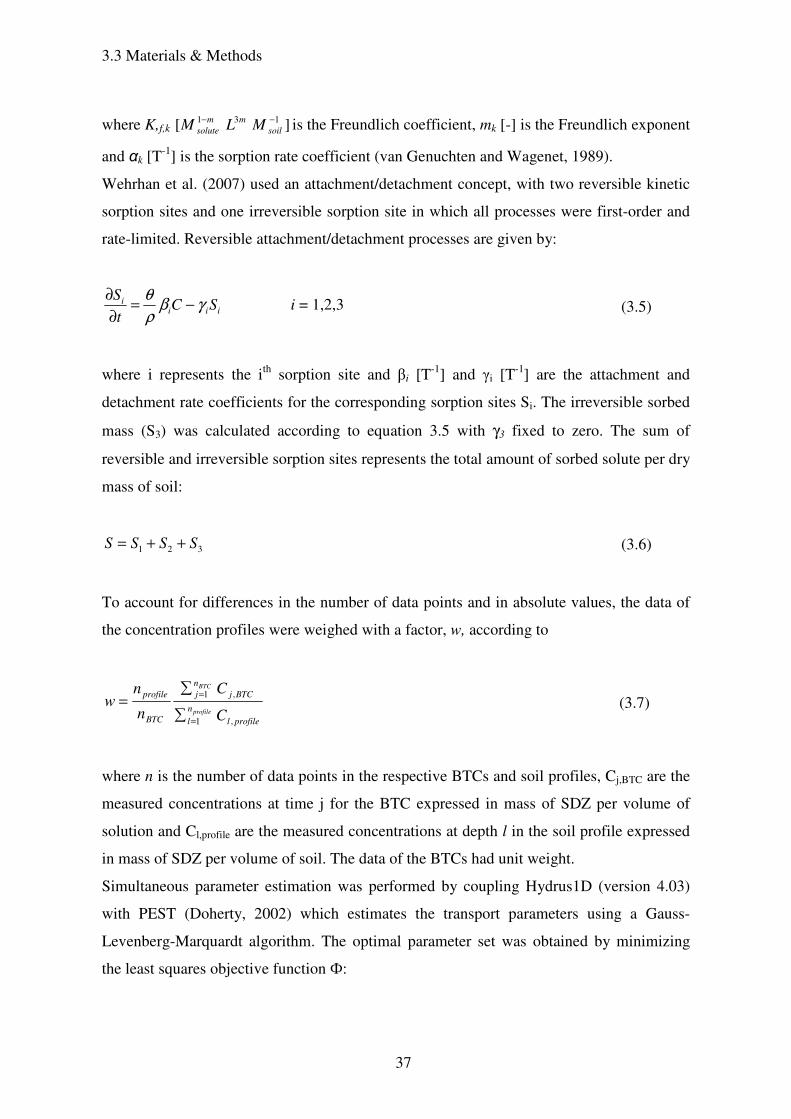
3.3 Materials & Methods
37
where K,f,k ][ 131 −−soil
mm
solute MLM is the Freundlich coefficient, mk [-] is the Freundlich exponent
and αk [T-1] is the sorption rate coefficient (van Genuchten and Wagenet, 1989).
Wehrhan et al. (2007) used an attachment/detachment concept, with two reversible kinetic
sorption sites and one irreversible sorption site in which all processes were first-order and
rate-limited. Reversible attachment/detachment processes are given by:
iiii SC
t
Sγβ
ρ
θ−=
∂
∂ i = 1,2,3 (3.5)
where i represents the ith sorption site and βi [T-1] and γi [T-1] are the attachment and
detachment rate coefficients for the corresponding sorption sites Si. The irreversible sorbed
mass (S3) was calculated according to equation 3.5 with γ3 fixed to zero. The sum of
reversible and irreversible sorption sites represents the total amount of sorbed solute per dry
mass of soil:
321 SSSS ++= (3.6)
To account for differences in the number of data points and in absolute values, the data of
the concentration profiles were weighed with a factor, w, according to
profilel
n
l
BTCj
n
j
BTC
profile
C
C
n
nw
profile
BTC
,1
,1
=
=
∑
∑= (3.7)
where n is the number of data points in the respective BTCs and soil profiles, Cj,BTC are the
measured concentrations at time j for the BTC expressed in mass of SDZ per volume of
solution and Cl,profile are the measured concentrations at depth l in the soil profile expressed
in mass of SDZ per volume of soil. The data of the BTCs had unit weight.
Simultaneous parameter estimation was performed by coupling Hydrus1D (version 4.03)
with PEST (Doherty, 2002) which estimates the transport parameters using a Gauss-
Levenberg-Marquardt algorithm. The optimal parameter set was obtained by minimizing
the least squares objective function Ф:
Chapter 3
38
( ) ,1
2∑
=
=Φn
i
iirw (3.8)
where n is the total number of the observed data points and model outcomes, wi is a
weighting factor for the i´th observation and ri is the difference between the i´th model
outcome and the corresponding observed value (Doherty, 2002).
Both the 14C-BTCs and concentration profiles were included in the objective
function. The data points of the soil column profiles were weighed according to Equation
3.7. 14C-measurements in the drainage water were log-transformed since otherwise it was
not possible to capture the tailings of the BTCs adequately. Consequently, we obtained less
good agreement for the peak concentrations.
The development of transformation products and their transport could only be
investigated in soil column C. For soil columns A and B, we observed a white clouding in
the samples, possibly caused by a precipitation reaction, which made the HPLC-
measurement impossible; for soil columns D and E the concentrations of SDZ and the
transformation products in the outflow samples were below the detection limit. We used the
isotherm-based approach to describe the transformation process of SDZ since this approach
described the data of experiment C better. The model parameters were fitted to the log10-
transformed concentrations in the drainage water. BTCs of the transformation products
were modeled by fitting the transformation of SDZ into each of the products separately in
two separate model runs using the procedure proposed by Unold et al. (2009b). First, the
reversible sorption parameters (Kf, m, α) of SDZ were fitted where transformation into both
transformation products was described by one effective transformation rate. In the next
steps, these reversible sorption parameters of SDZ were fixed to the parameters fitted for
the SDZ BTC, while the parameters for irreversible sorption and transformation of SDZ
were fitted together with the transport parameters of the respective transformation product.
Irreversible sorption of the transformation products was neglected in order to avoid
parameter interactions with the transformation rate. The profile data were included in the
objective function to fit the 14C- and SDZ BTCs according to equation 3.7, but not in the
fits for the transformation products since the amount of SDZ which degraded into the other
transformation product was added to irreversible sorption of SDZ. This resulted in higher
irreversible sorption rates for SDZ (Table 3.5) which would lead to an overestimation of the
irreversibly sorbed amount.
3.3 Materials & Methods
39
After modeling the single experiments, several parameter combinations were
simultaneously fitted to three or four experiments performed at a constant flow rate using
the attachment/detachment approach. In a first run, all five parameters (β1, β2, β3, γ1, γ2)
were fitted concurrently to the experiments conducted with the low concentration (A, B &
D). The profile data were included in the fit with the same weight as calculated for the
single BTCs. Since experiments A and B were replicates, both the weights for the BTC and
concentration profile data of experiment D were multiplied with a factor of two. In the
second run, the same procedure was followed for the experiments performed at the higher
flow rate (A, B & C). Finally, the five parameters were simultaneously fitted to all four
experiments (A, B, C &D). To investigate the influence of the attachment (β1) and
detachment rate (γ1) of one reversible sorption site on the goodness of fit, one additional
model run was performed. For this purpose the attachments rates β2 and β3 as well as the
detachment rate γ2 were fitted to all four experiments simultaneously while β1 was fitted
separately to the four single experiments, together with one value “ratio”, defined as β1/γ1.
Using this ratio, γ1 could be calculated for each BTC separately.
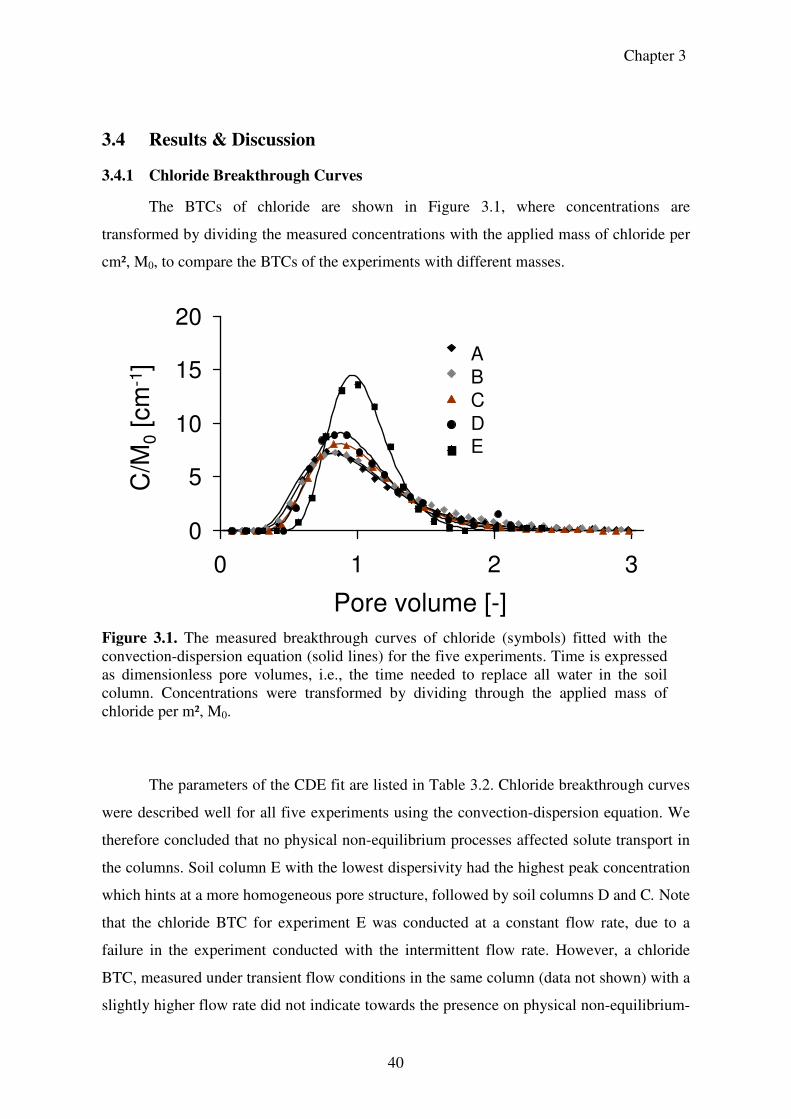
Chapter 3
40
3.4 Results & Discussion
3.4.1 Chloride Breakthrough Curves
The BTCs of chloride are shown in Figure 3.1, where concentrations are
transformed by dividing the measured concentrations with the applied mass of chloride per
cm², M0, to compare the BTCs of the experiments with different masses.
The parameters of the CDE fit are listed in Table 3.2. Chloride breakthrough curves
were described well for all five experiments using the convection-dispersion equation. We
therefore concluded that no physical non-equilibrium processes affected solute transport in
the columns. Soil column E with the lowest dispersivity had the highest peak concentration
which hints at a more homogeneous pore structure, followed by soil columns D and C. Note
that the chloride BTC for experiment E was conducted at a constant flow rate, due to a
failure in the experiment conducted with the intermittent flow rate. However, a chloride
BTC, measured under transient flow conditions in the same column (data not shown) with a
slightly higher flow rate did not indicate towards the presence on physical non-equilibrium-
Figure 3.1. The measured breakthrough curves of chloride (symbols) fitted with the convection-dispersion equation (solid lines) for the five experiments. Time is expressed as dimensionless pore volumes, i.e., the time needed to replace all water in the soil column. Concentrations were transformed by dividing through the applied mass of chloride per m², M0.
Pore volume [-]
C/M
0[c
m-1
] A
B
C
DE
0
5
10
15
20
0 1 2 3
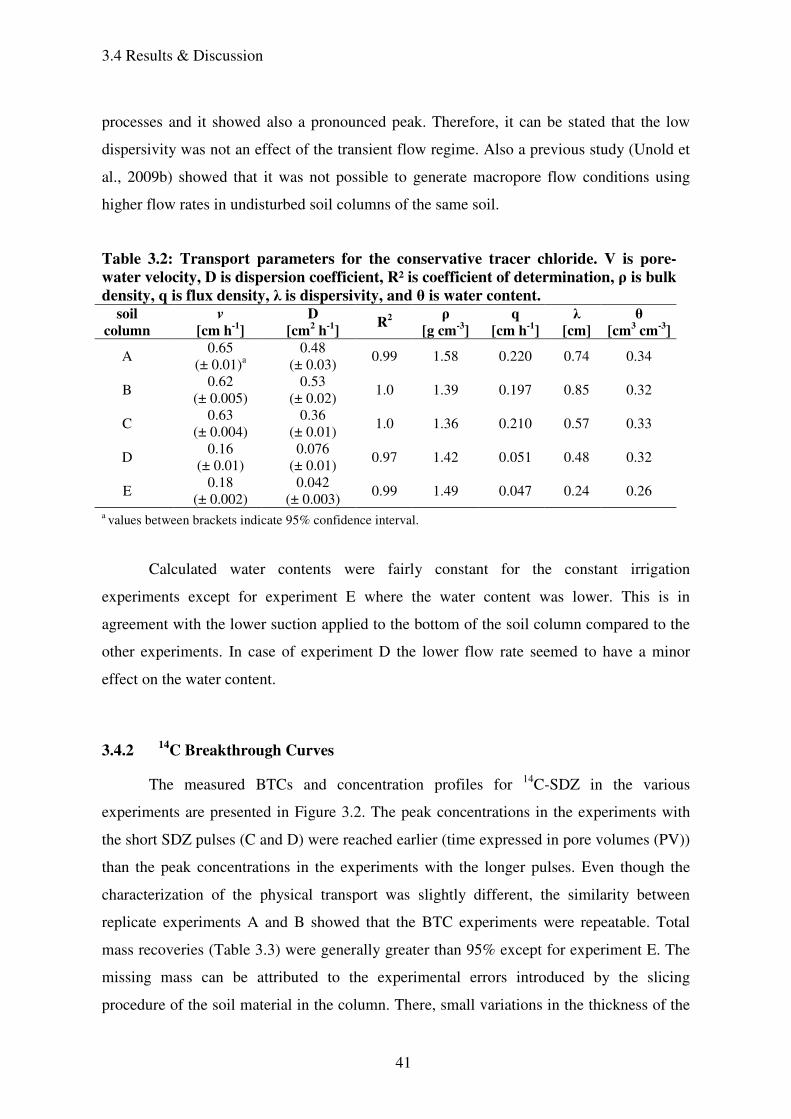
3.4 Results & Discussion
41
processes and it showed also a pronounced peak. Therefore, it can be stated that the low
dispersivity was not an effect of the transient flow regime. Also a previous study (Unold et
al., 2009b) showed that it was not possible to generate macropore flow conditions using
higher flow rates in undisturbed soil columns of the same soil.
Calculated water contents were fairly constant for the constant irrigation
experiments except for experiment E where the water content was lower. This is in
agreement with the lower suction applied to the bottom of the soil column compared to the
other experiments. In case of experiment D the lower flow rate seemed to have a minor
effect on the water content.
3.4.2 14
C Breakthrough Curves
The measured BTCs and concentration profiles for 14C-SDZ in the various
experiments are presented in Figure 3.2. The peak concentrations in the experiments with
the short SDZ pulses (C and D) were reached earlier (time expressed in pore volumes (PV))
than the peak concentrations in the experiments with the longer pulses. Even though the
characterization of the physical transport was slightly different, the similarity between
replicate experiments A and B showed that the BTC experiments were repeatable. Total
mass recoveries (Table 3.3) were generally greater than 95% except for experiment E. The
missing mass can be attributed to the experimental errors introduced by the slicing
procedure of the soil material in the column. There, small variations in the thickness of the
Table 3.2: Transport parameters for the conservative tracer chloride. V is pore-
water velocity, D is dispersion coefficient, R² is coefficient of determination, ρ is bulk
density, q is flux density, λ is dispersivity, and θ is water content. soil
column
v
[cm h-1]
D
[cm2 h-1] R2
ρ
[g cm-3]
q
[cm h-1]
λ
[cm]
θ
[cm3 cm-3]
A 0.65
(± 0.01)a 0.48
(± 0.03) 0.99 1.58 0.220 0.74 0.34
B 0.62
(± 0.005) 0.53
(± 0.02) 1.0 1.39 0.197 0.85 0.32
C 0.63
(± 0.004) 0.36
(± 0.01) 1.0 1.36 0.210 0.57 0.33
D 0.16
(± 0.01) 0.076
(± 0.01) 0.97 1.42 0.051 0.48 0.32
E 0.18
(± 0.002) 0.042
(± 0.003) 0.99 1.49 0.047 0.24 0.26
a values between brackets indicate 95% confidence interval.
Chapter 3
42
slices can lead to errors in the mass balance. These errors are expected to be larger than
errors in the measurements of liquid concentrations. Experiments with the higher and lower
flow rates could be distinguished by means of their eluted mass (Table 3.3). Distinct higher
eluted amounts of mass were found in the experiments with the higher flow rate, probably
due to less contact time.
Also the experiments with the high and low input concentrations differed. The
eluted amount was highest for experiment C (71%) which was performed at the high flow
rate and with the high input concentration. For experiments A and B which were conducted
at the same flow rate but with the low input concentration the eluted mass was lower (57-
60%). Only 19% (D) and 11% (E) of the applied mass were eluted in the experiments with
the lower flow rates. This trend of higher eluted masses with higher flow rates was
supported by the results of a previous experiment made with a soil column repacked with
the same soil near saturation (Unold et al., 2009a). This experiment was conducted at a
slighted higher flow rate (0.25 cm h-1),which resulted in a higher eluted mass (85%).
Srivastava et al. (2009) conducted transport experiments with the sulfonamide
sulfadimethoxine in two soils and a sand in repacked soil columns with a remarkably higher
flow rate (~9.2 cm h-1) than in our study and found mass recoveries in the effluent > 90%.
Except for experiment E, the BTCs were characterized by a steep increase of
concentrations in the drainage water. This difference in the rise of the BTC may be
attributed to the different flow regimes for SDZ (intermittent vs. constant irrigation). After
the peak maxima were reached, concentrations decreased initially fast and then slower in all
Table 3.3: Mass recovery of 14
C in the breakthrough curves and the concentration
profiles, as well as transformation products in the drainage water of experiment C.
14C in
breakthrough
curves
[%]
14C in the soil
Profile
[%]
SDZ
[%]
OH-SDZ
[%]
An-SDZ
[%]
A 57.4 37.6 n.da n.d n.d
B 59.5 39.3 n.d n.d n.d
C 71.4 30.5 61.7 16.9 21.4
D 10.8 86.0 n.d n.d n.d
E 19.1 72.9 n.d n.d n.d n.da
concentration was not determined
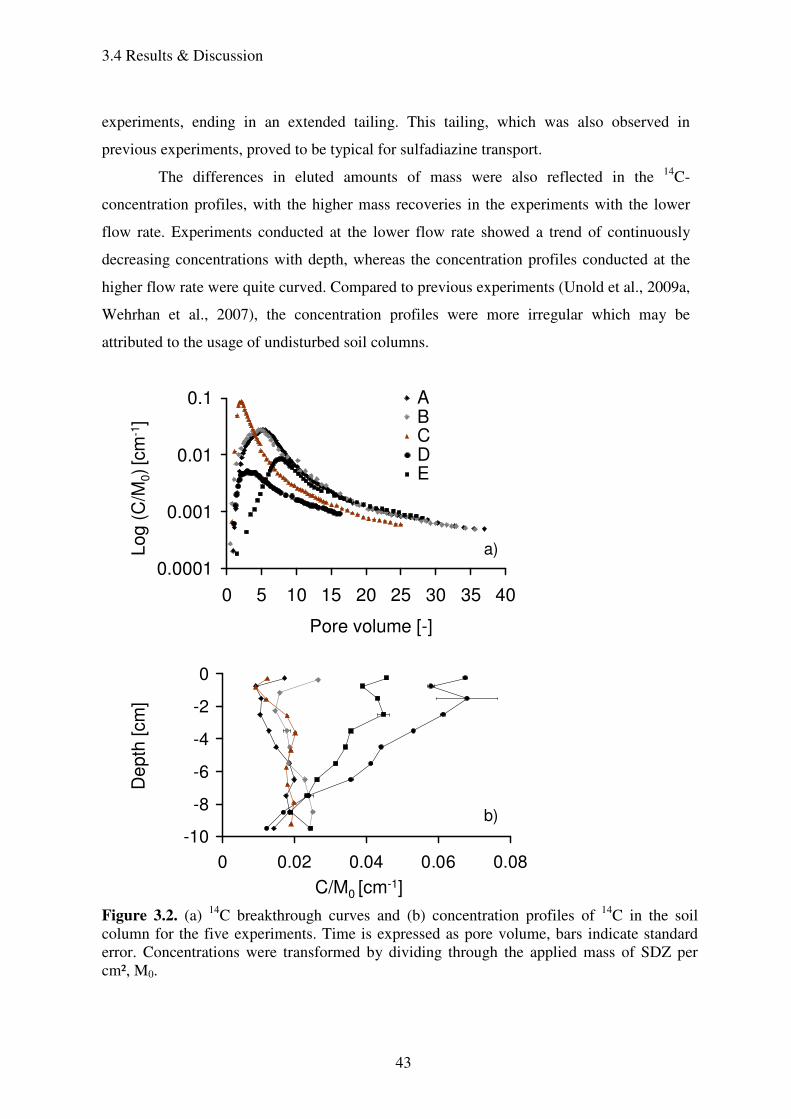
3.4 Results & Discussion
43
experiments, ending in an extended tailing. This tailing, which was also observed in
previous experiments, proved to be typical for sulfadiazine transport.
The differences in eluted amounts of mass were also reflected in the 14C-
concentration profiles, with the higher mass recoveries in the experiments with the lower
flow rate. Experiments conducted at the lower flow rate showed a trend of continuously
decreasing concentrations with depth, whereas the concentration profiles conducted at the
higher flow rate were quite curved. Compared to previous experiments (Unold et al., 2009a,
Wehrhan et al., 2007), the concentration profiles were more irregular which may be
attributed to the usage of undisturbed soil columns.
Figure 3.2. (a) 14C breakthrough curves and (b) concentration profiles of 14C in the soil column for the five experiments. Time is expressed as pore volume, bars indicate standard error. Concentrations were transformed by dividing through the applied mass of SDZ per cm², M0.
Pore volume [-]
C/M0 [cm-1]
Log
(C
/M0)[c
m-1
]D
epth
[cm
]
a)
b)
0.0001
0.001
0.01
0.1
0 5 10 15 20 25 30 35 40
ABCDE
-10
-8
-6
-4
-2
0
0 0.02 0.04 0.06 0.08
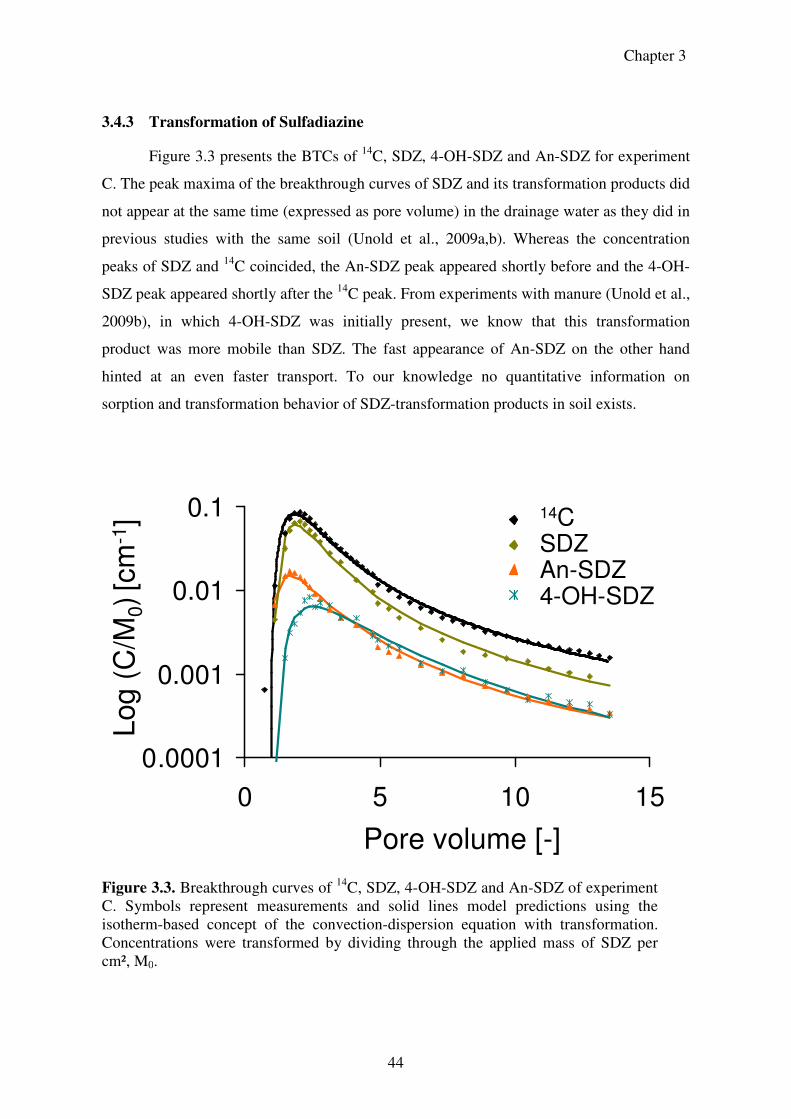
Chapter 3
44
3.4.3 Transformation of Sulfadiazine
Figure 3.3 presents the BTCs of 14C, SDZ, 4-OH-SDZ and An-SDZ for experiment
C. The peak maxima of the breakthrough curves of SDZ and its transformation products did
not appear at the same time (expressed as pore volume) in the drainage water as they did in
previous studies with the same soil (Unold et al., 2009a,b). Whereas the concentration
peaks of SDZ and 14C coincided, the An-SDZ peak appeared shortly before and the 4-OH-
SDZ peak appeared shortly after the 14C peak. From experiments with manure (Unold et al.,
2009b), in which 4-OH-SDZ was initially present, we know that this transformation
product was more mobile than SDZ. The fast appearance of An-SDZ on the other hand
hinted at an even faster transport. To our knowledge no quantitative information on
sorption and transformation behavior of SDZ-transformation products in soil exists.
Figure 3.3. Breakthrough curves of 14C, SDZ, 4-OH-SDZ and An-SDZ of experiment C. Symbols represent measurements and solid lines model predictions using the isotherm-based concept of the convection-dispersion equation with transformation. Concentrations were transformed by dividing through the applied mass of SDZ per cm², M0.
Pore volume [-]
14CSDZAn-SDZ4-OH-SDZ
Log
(C
/M0)[c
m-1
]
0.0001
0.001
0.01
0.1
0 5 10 15
3.4 Results & Discussion
45
3.4.4 Modeling Results
3.4.4.1
14C-BTCs: single fits
Each experiment was fitted with the isotherm-based and the attachment/detachment
approach. We did not include 14C-concentrations in the drainage water below 0.006 µg
mL-1 in the objective function for experiment A (3 data points) and experiment C (1 data
point). This is justified by the severe impact of concentrations equaling zero on the
objective function when using log-transformed values. Figure 3.4 shows the results and the
respective parameter estimates are listed in Table 3.4. Compared to a previous study (Unold
et al., 2009a), Kf and m were not highly correlated, so both parameters were fitted.
Except for experiment C, the attachment/detachment model described all
experiments better than the isotherm-based model in terms of the sum of squared weighed
residuals (Table 3.4). While the difference in model performance was quite small for
experiment C, distinct differences in the prediction of the BTCs were found between both
model approaches for the other experiments, where the isotherm-based model was not able
to correctly capture the tailings (Figure 3.4). Both model approaches failed to describe the
rise of the peak of experiment E but the tailing was well captured with the
attachment/detachment approach. The sorbed mass was predicted well on average for
experiments A, B, and C for both model approaches. However, the fairly curved measured
concentration distribution with depth could not be captured by the models. For experiment
D and E, the concentration profile data could be described quite well below -2 cm. One
kinetic sorption site in the attachment/detachment approach showed considerably faster ad-
and desorption rates for all experiments, hinting on the fact that sorption of SDZ was
characterized by a fast and a slow reversible process in addition to irreversible sorption.
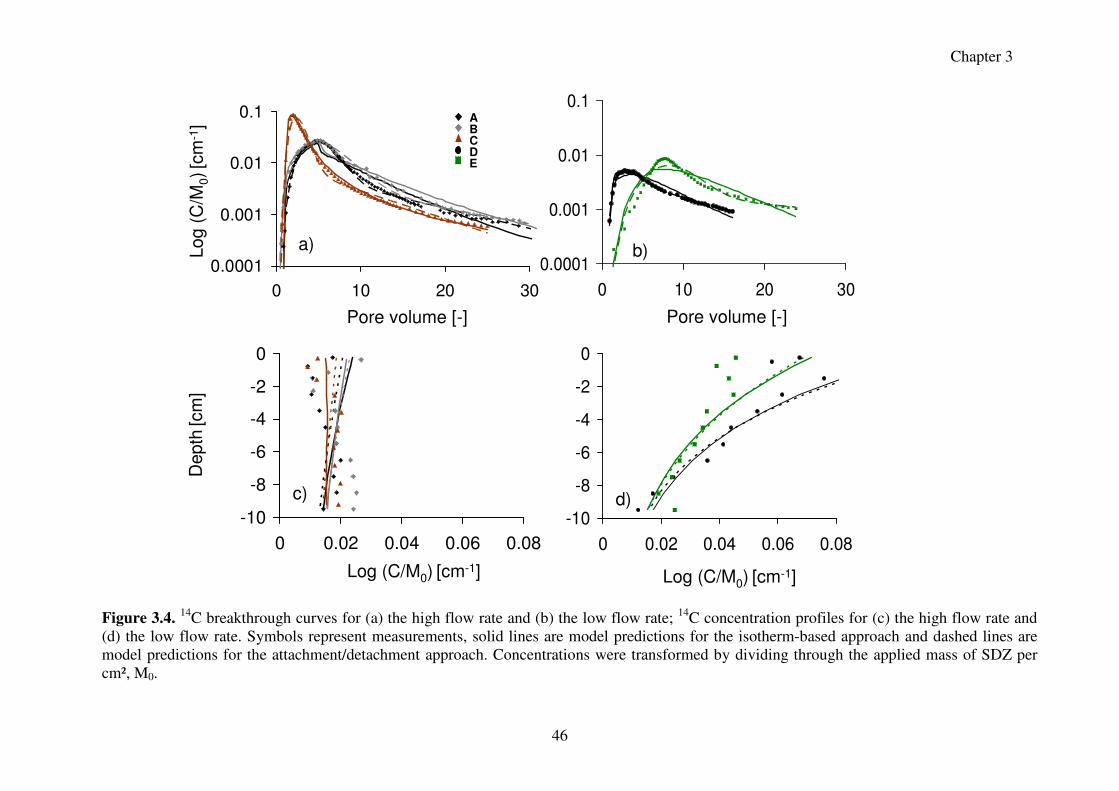
Chapter 3
46
Figure 3.4. 14C breakthrough curves for (a) the high flow rate and (b) the low flow rate; 14C concentration profiles for (c) the high flow rate and (d) the low flow rate. Symbols represent measurements, solid lines are model predictions for the isotherm-based approach and dashed lines are model predictions for the attachment/detachment approach. Concentrations were transformed by dividing through the applied mass of SDZ per cm², M0.
0.0001
0.001
0.01
0.1
0 10 20 30
-10
-8
-6
-4
-2
0
0 0.02 0.04 0.06 0.08
-10
-8
-6
-4
-2
0
0 0.02 0.04 0.06 0.08
0.0001
0.001
0.01
0.1
0 10 20 30
Log (
C/M
0)[c
m-1
]D
epth
[cm
]
Pore volume [-] Pore volume [-]
Log (C/M0) [cm-1] Log (C/M0) [cm-1]
a) b)
c) d)
A
BC
DE
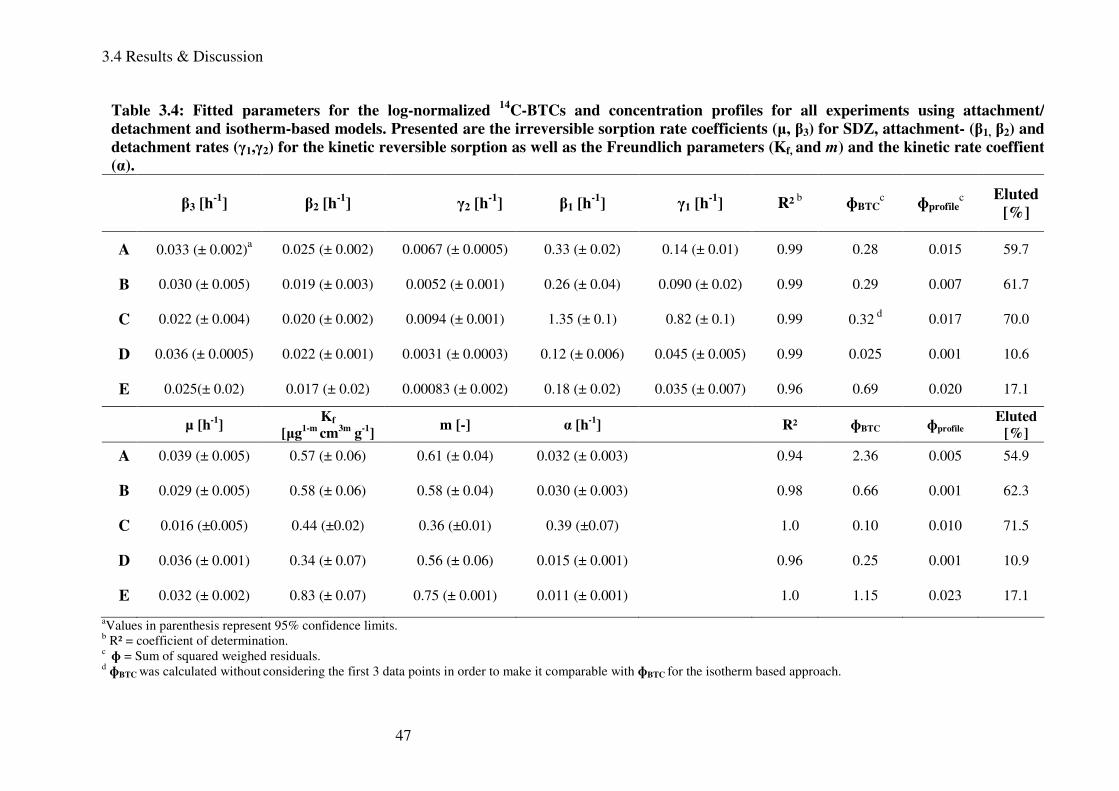
3.4 Results & Discussion
47
aValues in parenthesis represent 95% confidence limits. b R² = coefficient of determination. c ɸ = Sum of squared weighed residuals. d ɸBTC was calculated without considering the first 3 data points in order to make it comparable with ɸBTC for the isotherm based approach.
Table 3.4: Fitted parameters for the log-normalized 14
C-BTCs and concentration profiles for all experiments using attachment/
detachment and isotherm-based models. Presented are the irreversible sorption rate coefficients (µ, β3) for SDZ, attachment- (β1, β2) and
detachment rates (γ1,γ2) for the kinetic reversible sorption as well as the Freundlich parameters (Kf, and m) and the kinetic rate coeffient
(α).
β3 [h-1
] β2 [h-1
] γ2 [h-1
] β1 [h-1
] γ1 [h-1
] R² b
ɸBTCc ɸprofile
c
Eluted
[%]
A 0.033 (± 0.002)a 0.025 (± 0.002) 0.0067 (± 0.0005) 0.33 (± 0.02) 0.14 (± 0.01) 0.99 0.28 0.015 59.7
B 0.030 (± 0.005) 0.019 (± 0.003) 0.0052 (± 0.001) 0.26 (± 0.04) 0.090 (± 0.02) 0.99 0.29 0.007 61.7
C 0.022 (± 0.004) 0.020 (± 0.002) 0.0094 (± 0.001) 1.35 (± 0.1) 0.82 (± 0.1) 0.99 0.32 d 0.017 70.0
D 0.036 (± 0.0005) 0.022 (± 0.001) 0.0031 (± 0.0003) 0.12 (± 0.006) 0.045 (± 0.005) 0.99 0.025 0.001 10.6
E 0.025(± 0.02) 0.017 (± 0.02) 0.00083 (± 0.002) 0.18 (± 0.02) 0.035 (± 0.007) 0.96 0.69 0.020 17.1
µ [h-1] Kf
[µg1-m cm3m g-1] m [-] α [h-1] R² ɸBTC ɸprofile
Eluted [%]
A 0.039 (± 0.005) 0.57 (± 0.06) 0.61 (± 0.04) 0.032 (± 0.003) 0.94 2.36 0.005 54.9
B 0.029 (± 0.005) 0.58 (± 0.06) 0.58 (± 0.04) 0.030 (± 0.003) 0.98 0.66 0.001 62.3
C 0.016 (±0.005) 0.44 (±0.02) 0.36 (±0.01) 0.39 (±0.07) 1.0 0.10 0.010 71.5
D 0.036 (± 0.001) 0.34 (± 0.07) 0.56 (± 0.06) 0.015 (± 0.001) 0.96 0.25 0.001 10.9
E 0.032 (± 0.002) 0.83 (± 0.07) 0.75 (± 0.001) 0.011 (± 0.001) 1.0 1.15 0.023 17.1
Chapter 3
48
The experiment with the high input concentration (C) showed distinct differences
compared to the other experiments. In the attachment/detachment approach pronounced
higher attachment/detachment rates for the faster reversible kinetic sorption sites were
observed compared to the other experiments, meaning that sorption can be approximated by
an instantaneous process. This was confirmed with the isotherm-based model concept,
where the kinetic sorption rate, α, was almost one order of magnitude higher than for the
other experiments. In the case of instantaneous sorption both model approaches are
equivalent. This is supported by the similar values obtained for the kinetic sorption rate, α,
in the equilibrium approach and for the ratio of the detachment and attachment rate (γ2/β2)
for the slower sorption site in the attachment/detachment approach. Although the other
fitted parameters (β2, β3, γ3, Kf, m, µ) in the two models differed between the five
experiments, the absolute differences among them were generally small. The experiments
with the lower flow rate D and E had slower ad- and desorption rates at the fast sorption
site than the experiments with the higher flow rate.
The ratio between the attachment and detachment rates (βi/γi) represents the sorption
affinity to the respective sorption site (Wehrhan et al., 2007). Calculated sorption affinities
were higher for the slower reversible sorption site than for the faster reversible sorption site
in all experiments. For the experiments with the lower flow rate (D & E) sorption affinities
at the slower reversible sorption site were on average more than two (D) or seven (E) times
higher than for the experiments conducted at a higher flow rate. This resulted in higher
reversibly sorbed parts of the total applied mass in experiments D (6.2%) and E (18.8%) at
the end of the leaching experiments, accompanied by a lower eluted amount of 14C. Since
the attachment rate for the slower reversible sorption process was quite similar for all
experiments, its sorption affinity was mainly determined by the value of the detachment
rate. As is visible from the higher eluted amounts in experiment C, both reversible sorption
sites had lower sorption affinities compared to the other experiments.
The rate for irreversible sorption was in the same range for both model approaches,
had the same order of magnitude as the attachment rate for the slower reversible sorption
site and was inversely related to the amount of eluted mass for experiments A, B, C and D.
This trend was not confirmed by experiment E which had a relatively low irreversible
sorption rate, but also a low amount of eluted mass. Overall the large difference in sorbed
amounts between experiments with the higher and lower flow rates was most probably
caused by the differences in contact time. The characteristic time scale of the experiments
3.4 Results & Discussion
49
(1/γ3) was on average one and a half day. Thus due to the longer residence time in the soil
column, much more 14C could adsorb in the experiments with the lower flow rate.
The attachment/detachment concept, commonly used to predict particle transport,
had the disadvantage that it did not consider concentration-dependent processes which were
reported for SDZ sorption (Thiele-Bruhn et al., 2004). Also the presented data and
modeling results in this study showed that SDZ transport was highly dependent on
concentration. In previous studies (Unold et al., 2009a,b) where higher outflow
concentrations were observed, the 2-site kinetic model was able to describe the BTCs quite
well. This supports the results of Braida et al. (2001), who found that sorption equilibrium
for non-linear sorbing substances was reached faster at higher concentrations. However, the
flexibility of the 3-site attachment/detachment model was needed to describe the BTCs of
the experiments with the low input concentration which corresponds to the finding of
Wehrhan et al. (2007).
Compared to the results of Wehrhan et al. (2007), we observed an opposite trend.
When the same mass of SDZ was applied during a short and a long pulse, more mass was
eluted in the experiment with the high concentration in our study. The higher eluted mass
for the experiment with the high concentration in our study may be explained by a lower
sorption capacity of the loamy sand compared to the silty loam of Wehrhan et al. (2007)
which had higher contents of clay and organic material. Since the pH values of both soils
were almost equal, pH dependent sorption behavior of SDZ should not have caused the
difference. This highlights the importance of soil properties like clay content and organic
matter content as important factors in explaining differences in SDZ transport.
The fitted parameters for experiments A and B using the isotherm-based approach
can be compared to one experiment of Unold et al. (2009a), where SDZ was applied using
the same input concentration for the same pulse duration to a repacked soil column of the
same soil, but at a slightly higher flow rate. In our study, higher Freundlich coefficients and
exponents were found as well as a higher rate coefficient for irreversible sorption which
explained the lower eluted mass. Equilibrium was reached slightly faster in the previous
study.
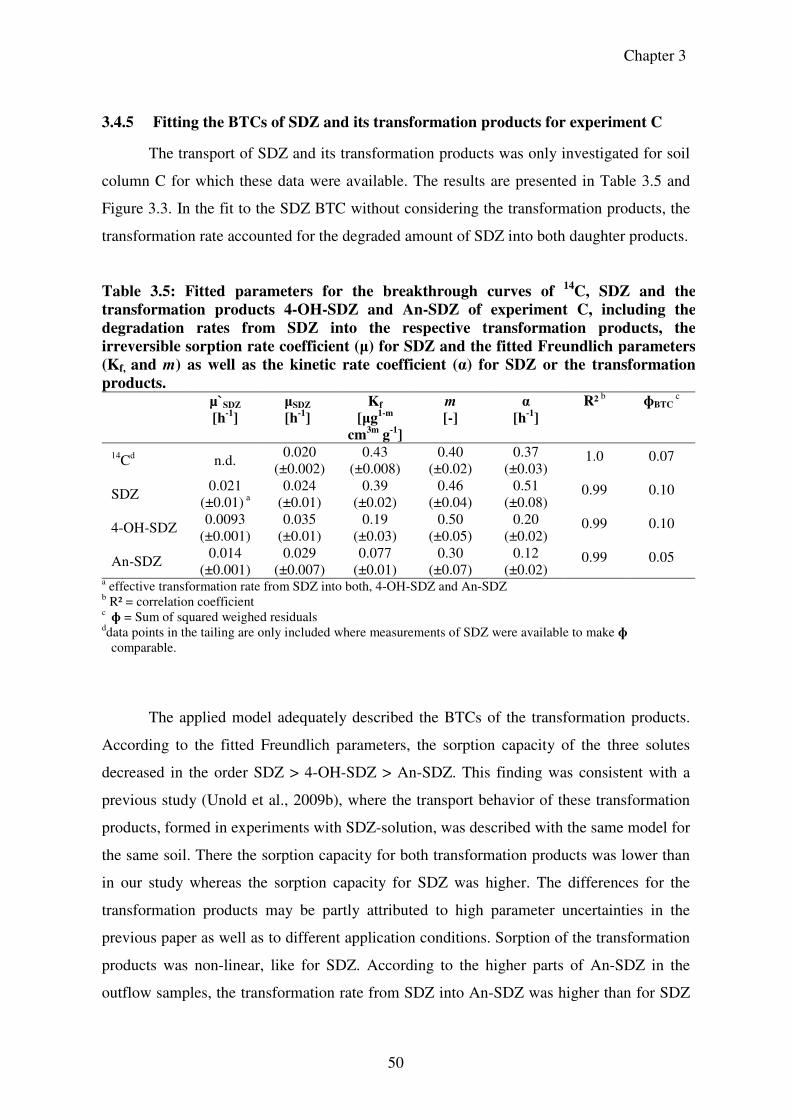
Chapter 3
50
3.4.5 Fitting the BTCs of SDZ and its transformation products for experiment C
The transport of SDZ and its transformation products was only investigated for soil
column C for which these data were available. The results are presented in Table 3.5 and
Figure 3.3. In the fit to the SDZ BTC without considering the transformation products, the
transformation rate accounted for the degraded amount of SDZ into both daughter products.
Table 3.5: Fitted parameters for the breakthrough curves of 14
C, SDZ and the
transformation products 4-OH-SDZ and An-SDZ of experiment C, including the
degradation rates from SDZ into the respective transformation products, the
irreversible sorption rate coefficient (µ) for SDZ and the fitted Freundlich parameters
(Kf, and m) as well as the kinetic rate coefficient (α) for SDZ or the transformation
products. µ`SDZ
[h-1] µSDZ
[h-1] Kf
[µg1-m
cm3m g-1]
m
[-] α
[h-1]
R² b ɸBTC c
14Cd n.d. 0.020
(±0.002) 0.43
(±0.008) 0.40
(±0.02) 0.37
(±0.03) 1.0 0.07
SDZ 0.021
(±0.01) a 0.024
(±0.01) 0.39
(±0.02) 0.46
(±0.04) 0.51
(±0.08) 0.99 0.10
4-OH-SDZ 0.0093
(±0.001) 0.035
(±0.01) 0.19
(±0.03) 0.50
(±0.05) 0.20
(±0.02) 0.99 0.10
An-SDZ 0.014
(±0.001) 0.029
(±0.007) 0.077
(±0.01) 0.30
(±0.07) 0.12
(±0.02) 0.99 0.05
a effective transformation rate from SDZ into both, 4-OH-SDZ and An-SDZ b R² = correlation coefficient c ɸ = Sum of squared weighed residuals ddata points in the tailing are only included where measurements of SDZ were available to make ɸ
comparable.
The applied model adequately described the BTCs of the transformation products.
According to the fitted Freundlich parameters, the sorption capacity of the three solutes
decreased in the order SDZ > 4-OH-SDZ > An-SDZ. This finding was consistent with a
previous study (Unold et al., 2009b), where the transport behavior of these transformation
products, formed in experiments with SDZ-solution, was described with the same model for
the same soil. There the sorption capacity for both transformation products was lower than
in our study whereas the sorption capacity for SDZ was higher. The differences for the
transformation products may be partly attributed to high parameter uncertainties in the
previous paper as well as to different application conditions. Sorption of the transformation
products was non-linear, like for SDZ. According to the higher parts of An-SDZ in the
outflow samples, the transformation rate from SDZ into An-SDZ was higher than for SDZ
3.4 Results & Discussion
51
into 4-OH-SDZ. Contrary to An-SDZ, the peak arrival time of 4-OH-SDZ could not be
correlated to the sorption capacity, since the peak of 4-OH-SDZ appeared shortly after the
peaks of SDZ and 14C for which the sorption capacities were higher.
An apparent DT50 value for the dissipation of SDZ from the liquid phase by
irreversible sorption and transformation was calculated as 0.64 d. This value is lower, but in
the same order of magnitude than the DT50 value of 3 days determined for SDZ dissipation
in a silty clay loam soil by Kreuzig et al. (2005) and the DT50 value of 3.5 days for the
sulfonamide sulfochloropyridazin in a sandy loam with manure application (Blackwell et
al., 2007). Förster et al. (2009) found a higher DT50 value (19 d) for SDZ with manure
application (CaCl2-fraction) in the same sandy soil as was used in this study.
Figure 3.3 shows that the shapes of the 14C and SDZ BTCs were quite similar. When
the isotherm-based model was fitted to both of them the estimated parameters values were
not the same, but differences were small. Therefore, the transport of SDZ can be reasonably
well described by fitting the 14C data in this case.
3.4.6 Simultaneous fitting of the steady-state flow experiments
Apart from the physical characterization of the water flow, one set of transport
parameters should be able to describe the measured BTCs for all experimental conditions,
in case the model reflected all relevant processes. However, as Table 3.5 shows, the
estimated parameter sets differed among the various experiments. With the help of the
simultaneous modeling of three or four experiments, we tested if a common set of
parameters existed which was able to describe all experiments. We used the
attachment/detachment model for the simultaneous fitting, since it better described the
measured BTCs for most experimental conditions. Experiment E was not included, since
either the transient (intermittent) flow regime or the soil itself clearly affected the transport
of the reactive tracer SDZ.
Figure 3.5 shows that the general shapes of all BTCs conducted under steady-state flow
conditions could be described quite well for the various simultaneous parameter fits. Peak
arrival times were predicted correctly, although the common sets of parameters were not
able to compensate the different eluted masses observed in the single experiments which
led to over- and underestimations of the peak heights. Also the slopes of the tailings were
Chapter 3
52
not adequately captured. As could be expected, the sum of squared weighed residuals (ɸ)
was higher for the simultaneously fitted models than for those fitted to the individual BTCs.
In the model run in which all five parameters were fitted to the experiments with the
lower concentration (A, B, D) the description of experiments A and B was better than for
the model that was fitted to the experiments conducted at the high flow rate (A, B, C). This
was probably caused by the more pronounced difference in absolute parameter values of
experiment C compared to the other experiments, especially for the parameter values
describing the faster reversible sorption process (β1, γ1). The influence of these two
parameters on the modeling results was further investigated by fitting the attachment rate β1
individually to each BTC, together with an additional ratio of β1/γ1 instead of γ1. As became
visible in the sum of squared weighed residuals, the performance of this model run led to
the best descriptions of the single BTCs using simultaneously fitted parameters, especially
for experiments A and B for which the parameters for the single BTCs lay in most cases
between the estimated values for experiments C and D. For experiments C and D ɸ was in
same range as for the models fitted either to experiments A, B and D or A, B and C.
For the model run in which all parameters were fitted simultaneously to experiments A, B,
C and D, ɸ was remarkably higher for all BTCs. This confirmed the hypothesis that the
process described by the faster attachment/detachment rates was the main difference
between the investigated experiments. A higher flexibility in these rates led to pronounced
better descriptions of the single BTCs.
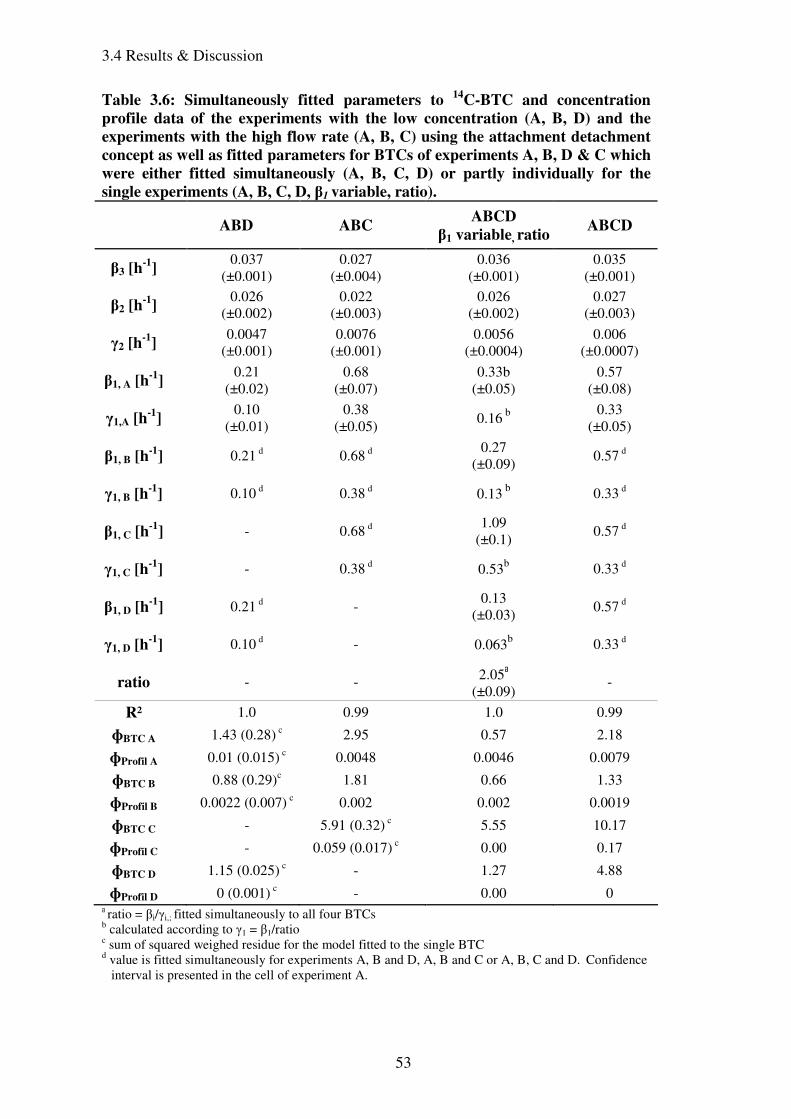
3.4 Results & Discussion
53
a ratio = βi/γi,; fitted simultaneously to all four BTCs b calculated according to γ1 = β1/ratio c sum of squared weighed residue for the model fitted to the single BTC d value is fitted simultaneously for experiments A, B and D, A, B and C or A, B, C and D. Confidence
interval is presented in the cell of experiment A.
Table 3.6: Simultaneously fitted parameters to 14
C-BTC and concentration
profile data of the experiments with the low concentration (A, B, D) and the
experiments with the high flow rate (A, B, C) using the attachment detachment
concept as well as fitted parameters for BTCs of experiments A, B, D & C which
were either fitted simultaneously (A, B, C, D) or partly individually for the
single experiments (A, B, C, D, β1 variable, ratio).
ABD ABC ABCD
β1 variable, ratio ABCD
β3 [h-1
] 0.037
(±0.001) 0.027
(±0.004) 0.036
(±0.001) 0.035
(±0.001)
β2 [h-1
] 0.026
(±0.002) 0.022
(±0.003) 0.026
(±0.002) 0.027
(±0.003)
γ2 [h-1
] 0.0047
(±0.001) 0.0076
(±0.001) 0.0056
(±0.0004) 0.006
(±0.0007)
β1, A [h-1
] 0.21
(±0.02) 0.68
(±0.07) 0.33b
(±0.05) 0.57
(±0.08)
γ1,A [h-1
] 0.10
(±0.01) 0.38
(±0.05) 0.16 b
0.33 (±0.05)
β1, B [h-1
] 0.21 d 0.68 d 0.27
(±0.09) 0.57 d
γ1, B [h-1
] 0.10 d 0.38 d 0.13 b 0.33 d
β1, C [h-1
] - 0.68 d 1.09
(±0.1) 0.57 d
γ1, C [h-1
] - 0.38 d 0.53b 0.33 d
β1, D [h-1
] 0.21 d - 0.13
(±0.03) 0.57 d
γ1, D [h-1
] 0.10 d - 0.063b 0.33 d
ratio - - 2.05a (±0.09)
-
R² 1.0 0.99 1.0 0.99
ɸBTC A 1.43 (0.28) c 2.95 0.57 2.18
ɸProfil A 0.01 (0.015) c 0.0048 0.0046 0.0079
ɸBTC B 0.88 (0.29)c 1.81 0.66 1.33
ɸProfil B 0.0022 (0.007) c 0.002 0.002 0.0019
ɸBTC C - 5.91 (0.32) c 5.55 10.17
ɸProfil C - 0.059 (0.017) c 0.00 0.17
ɸBTC D 1.15 (0.025) c - 1.27 4.88
ɸProfil D 0 (0.001) c - 0.00 0
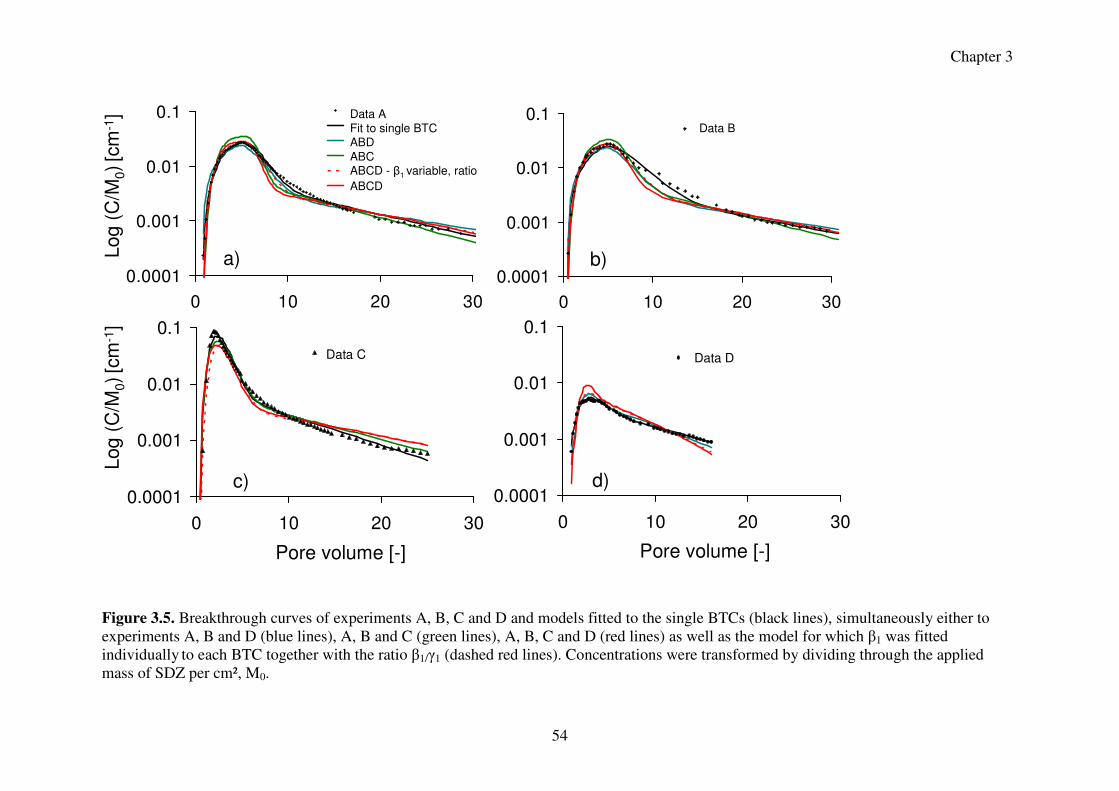
Chapter 3
54
Figure 3.5. Breakthrough curves of experiments A, B, C and D and models fitted to the single BTCs (black lines), simultaneously either to experiments A, B and D (blue lines), A, B and C (green lines), A, B, C and D (red lines) as well as the model for which β1 was fitted individually to each BTC together with the ratio β1/γ1 (dashed red lines). Concentrations were transformed by dividing through the applied mass of SDZ per cm², M0.
0.0001
0.001
0.01
0.1
0 10 20 30
0.0001
0.001
0.01
0.1
0 10 20 30
0.0001
0.001
0.01
0.1
0 10 20 30
0.0001
0.001
0.01
0.1
0 10 20 30
Log (
C/M
0)[c
m-1
]
Pore volume [-]Pore volume [-]
a) b)
c) d)
Data A
Fit to single BTCABD
ABCABCD - β1 variable, ratio
ABCD
Data C Data D
Data BLog (
C/M
0)[c
m-1
]
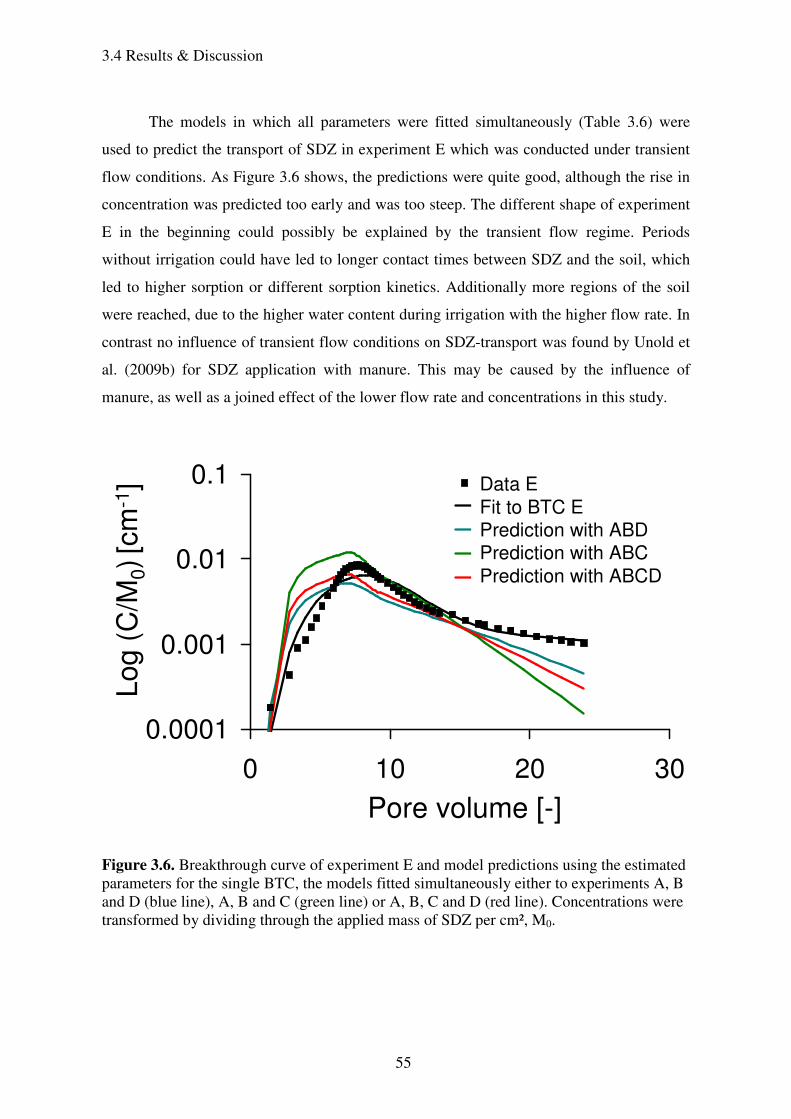
3.4 Results & Discussion
55
The models in which all parameters were fitted simultaneously (Table 3.6) were
used to predict the transport of SDZ in experiment E which was conducted under transient
flow conditions. As Figure 3.6 shows, the predictions were quite good, although the rise in
concentration was predicted too early and was too steep. The different shape of experiment
E in the beginning could possibly be explained by the transient flow regime. Periods
without irrigation could have led to longer contact times between SDZ and the soil, which
led to higher sorption or different sorption kinetics. Additionally more regions of the soil
were reached, due to the higher water content during irrigation with the higher flow rate. In
contrast no influence of transient flow conditions on SDZ-transport was found by Unold et
al. (2009b) for SDZ application with manure. This may be caused by the influence of
manure, as well as a joined effect of the lower flow rate and concentrations in this study.
Figure 3.6. Breakthrough curve of experiment E and model predictions using the estimated parameters for the single BTC, the models fitted simultaneously either to experiments A, B and D (blue line), A, B and C (green line) or A, B, C and D (red line). Concentrations were transformed by dividing through the applied mass of SDZ per cm², M0.
0.0001
0.001
0.01
0.1
0 10 20 30
Lo
g (
C/M
0)[c
m-1
]
Pore volume [-]
Data E
Fit to BTC EPrediction with ABDPrediction with ABC
Prediction with ABCD
Chapter 3
56
3.5 Conclusions
We conducted transport experiments with SDZ on five undisturbed soil materials
using different top boundary conditions and input concentrations. The experiments
confirmed that the applied solute mass, i.e. input concentration and pulse duration, and flow
rate influenced the transport of sulfadiazine in soil columns. The slower flow rate led to
remarkably lower eluted masses of SDZ compared to the experiments with the higher flow
rate. Eluted masses were also moderately lower for the experiments with the low input
concentration than for the high input concentration. The parameterization of the BTCs of
total- 14C proved to be appropriate to predict SDZ transport. While a two-site isotherm-
based model approach was able to describe the transport of sulfadiazine applied at the high
input concentration, sorption kinetics became more dominant in the lower concentration
range and at the slower flow rate, where a three-site attachment/detachment model better
fitted the measured BTCs. The description of the concentration profiles with the two model
concepts was similar with the two model approaches. The parts of transformation products
in the effluent of soil column C were substantial, with 17% for 4-OH-SDZ and 21% for An-
SDZ. Modeling revealed a higher mobility for the transformation products than for SDZ,
with a higher sorption capacity for 4-OH-SDZ than for An-SDZ. The modeling process
using the attachment/detachment concept arranged sorption into a faster and a slower
reversible kinetic process, as well as irreversible sorption. We concluded from the
simultaneous fits that the overall BTC shapes of experiments conducted under steady state
flow conditions can be described quite well with one common parameter set. But it was
impossible with the estimated parameters to compensate the differences in observed eluted
masses in the experiments, which led to over- and underestimation of peak heights and
tailings and were mainly described by the attachment- detachment rate of the faster sorption
site. Fitting the faster attachment rate individually together with the ratio of the faster
attachment and detachment rate clearly improved the simultaneous fits. Transport behavior
of SDZ was different for transient flow conditions, which led to a higher retention
especially at the slow reversible sorption site. This shows that the prediction of SDZ
leaching in the field, where flow conditions are highly variable, still is a challenge. The
results imply that the leaching potential of SDZ remarkably decreases for low input
concentrations and under soil moisture conditions where low water flow velocities
dominate.
57
4 Transport of manure-based applied sulfadiazine and its main transformation products in soil
columns3
4.1 Objectives
In chapter 4 the effect of pig manure on SDZ was investigated by comparing
experiments conducted using SDZ containing manure with experiments performed with a
SDZ-solution. Also the transport of the main metabolites in pig manure, 4-OH-SDZ and N-
AC-SDZ, was investigated. The transport of SDZ and the metabolites was described
simultaneously using a model including a degradation chain from N-Ac-SDZ into SDZ and
from SDZ into 4-OH-SDZ as well as one reversible kinetic and one irreversible sorption
site for SDZ and 4-OH-SDZ. For N-Ac-SDZ no irreversible sorption was included.
4.2 Introduction
In recent years, several studies have shown the widespread occurrence of
sulfonamide antibiotics in surface waters (Christian et al., 2003; Managaki et al., 2007),
groundwaters (Sacher et al., 2001; Hamscher et al., 2005; Focazio et al., 2008) and soils
(Höper et al., 2002; Boxall, 2004; Hamscher et al., 2005). The major risk of introducing
these substances into the environment is the development and spreading of resistant
pathogens (Kemper, 2008), especially since the probability of these chemicals reaching the
food chain via drinking water (Batt et al., 2006; Ye et al., 2007) or the root uptake by plants
(Dolliver et al., 2007) is high.
The main difference in how antibiotics and other organic contaminants, such as pesticides,
are introduced into the environment is the way of their application. While pesticides are
intentionally spread over the field, antibiotics are mostly introduced unintentionally with
the application of manure (Jørgensen & Halling-Sørensen, 2000). The application of the
sulfonamide antibiotic sulfadiazine (SDZ) with incorporation of manure into the root zone,
which is a common practice in Germany, may influence soil structure and other
3 * adapted from: Unold M., J. Simunek, R. Kasteel, J. Groeneweg and H. Vereecken: Transport of manure-based applied sulfadiazine and its main transformation products in soil columns. Vadose Zone Journal, 8, 677-689
Chapter 4
58
conditions affecting the solute transport in the soil profile. The effects of the manure
application on soil aggregation were studied by many, including Wortmann & Shapiro
(2008). These researchers found that manure application resulted in the formation of macro-
aggregates. They concluded that the risk of surface runoff may be greatest shortly after
application because macro-aggregates have had no time to develop.
Suspended colloidal material, as found in manure, can facilitate the transport of
pollutants in soils. Molecules of organic substances can sorb to small particles (McGechan
& Lewis, 2002) and travel along with them at usually rapid un-retarded velocities. Colloid-
facilitated transport has been shown, for example, to accelerate the transport of pesticides,
phosphates, and heavy metals (Hesketh et al., 2001; de Jonge et al., 2004; Pang and
Šimůnek, 2006). McGechan & Lewis (2002) indicated in their review that macropores are
the main pathways for colloidal transport since such larger particles are otherwise
effectively retained by physical filtration processes (Jarvis et al., 1999; Kretzschmar, 1994).
Due to speciation, sorption of sulfonamide antibiotics to soils (Kurwadkar et al.,
2007) and organic material (Kahle & Stamm, 2007b) is strongly dependent on pH. Due to
high amounts of NH4 present in manure, the soil water pH can increase by 1.5 units after
the application of manure (Kay et al., 2005a), which may lead to a significantly lower
sorption of SDZ.
Several studies focused on the sorption and transport of antibiotics in the presence
of manure (Boxall et al., 2002; Kay et al., 2004; Kay et al., 2005a; Kreuzig & Höltge, 2005;
Blackwell et al., 2007; Stoob et al., 2007). Antibiotics of the sulfonamide group seem to
have a stronger tendency for leaching and overland flow than other antibiotics, such as
tetracyclines and tylosin. Blackwell et al. (2007) and Kay et al. (2005b) demonstrated this
tendency for sulfachloropyridazine in field and lysimeter studies. Kay et al. (2005a) found
no influence of manure on the transport of the tetracycline antibiotic oxytetracycline. In
batch studies, Kreuzig and Höltge (2005) observed a tendency of SDZ to form a non-
extractable fraction, which remained in the manure matrix. Additionally, the extractable
fraction of SDZ in a soil was much lower when SDZ was applied together with manure. In
contrast, Thiele and Aust (2004) and Boxall et al. (2002) found decreased sorption of SDZ
and other sulfonamide antibiotics in the presence of manure, probably due to the use of
different soils and manures in their experiments.
Kreuzig et al. (2005) and Heise et al. (2006) reported that sulfonamides quickly
form non-extractable residues in soils. Bialk and Pedersen (2008) showed that the
4.2 Introduction
59
sulfonamide antibiotic sulfapyridine can be covalently bound to the model humic substance
protocatechuic acid, which is one explanation for the observed irreversible sorption
behavior of sulfonamides. While degradation of sulfonamides was often observed (Sukul et
al., 2008b; Wang, 2006), their mineralization has been found to be relatively low (Loftin et
al., 2008; Schmidt et al., 2008).
Various studies have shown that manure from SDZ administered animals contains
the parent compound SDZ as well as several transformation products. Lamshöft et al.
(2007) studied excretion patterns from pigs that were administered with 14C-SDZ. They
detected about 96% of the applied 14C excreted in manure and identified five transformation
products in addition to SDZ. While 4-N-acetyl-SDZ (N-Ac-SDZ) and 4-hydroxy-SDZ (4-
OH-SDZ) were found in larger concentrations, formyl-SDZ and acetyl-hydroxyl-SDZ were
found only in trace amounts.
The occurrence of these transformation products cannot be regarded as the result of
a degradation process that makes the parent compound harmless, since it is known, for
example, that the metabolite 4-OH-SDZ can still be microbially active (Nouws et al., 1989)
and that N-Ac-SDZ can retransform into the active parent compound SDZ (Berger et al.,
1986). There are indications that transformations not only occur during metabolization in
animals, but also in soils (Burkhardt et al., 2005; Wehrhan, 2006; Wehrhan et al., 2007) and
aqueous solutions (Sukul et al., 2008b).
Up to now, little has been known about the occurrence and fate of transformation
products in the environment. This may be due to the lack of reference substances (Diaz-
Cruz & Barcello, 2006). Their relevance in environmental assessments was shown by
Hilton & Thomas (2003), who detected relatively high concentrations of the acetyl form of
the antibiotic sulfamethoxazole in effluent and surface waters, whereas the concentration of
the parent compound was lower than the detection limit.
Various types of models are available to simulate the transport of antibiotics. These
models need to consider various physical processes involved in the transport of antibiotics,
as well as chemical processes, including kinetic and equilibrium sorption and degradation.
The process of degradation is usually simulated in transport models as a first-order process.
Examples of model applications that considered first-order degradation are, for example,
Casey and Šimůnek (2001) and Schaerlaekens et al. (1999) for the transport of
trichloroethylene, Casey et al. (2003, 2004, 2005), Das et al. (2004) and Fan et al. (2007)
for the transport of hormones, and Papiernik et al. (2007) for the transport of a herbicide.
Chapter 4
60
Das et al. (2004), for example, used a bicontinuum model with first-order degradation to
describe the transport of estradiol and testosterone, as well as their daughter products.
Similarly, Casey et al. (2003, 2004, 2005) included first-order degradation to describe the
transport of estradiol and testosterone, as well as their daughter products. Similar first-order
reaction pathways are also often used to describe the simultaneous transport of N species
(Hanson et al., 2006), radionuclides (van Genuchten, 1985) or organic explosives (Šimůnek
et al., 2006).
The main objectives of this study were to investigate (i) the effects of pig manure on
the fate and transport of SDZ in soil columns and (ii) the transport in soil columns of two
SDZ transformation products present in applied manure. To achieve these objectives, solute
displacement experiments were performed using both repacked and undisturbed soil
columns involving two soils. Pig manure containing 14C-SDZ, 14C-4-OH-SDZ, and 14C-N-
Ac-SDZ was incorporated into the top of the soil columns. A 14C-SDZ solution was
additionally incorporated into one repacked column of each soil. Breakthrough curves and 14C distributions vs. depth were analyzed using a transport model that considered
convective–dispersive transport with one kinetic reversible and one kinetic irreversible
sorption site. Transformation and sorption rates for the different solutes were determined
using an inverse parameter optimization procedure based on the Levenberg–Marquardt
algorithm.
4.3 Materials & Methods
4.3.1 Experimental set-up
To study the effects of manure on the transport of SDZ and its transformation
products, we conducted experiments on undisturbed and repacked columns of two soils.
Soil samples for both the repacked and undisturbed soil columns were collected from the
upper 30 cm of two fields with soil types that are typical for agricultural land use in
Northrhine-Westpfalia, Germany. A silt loam soil (an Alfisol or Orthic Luvisol) was
collected from a field near Jülich-Merzenhausen (denoted below as Soil M), while a loamy
sand soil (an Inceptisol or Gleyic Cambisol) was sampled from a field near Kaldenkirchen
(denoted below as Soil K). Selected soil properties are shown in Table 4.1.
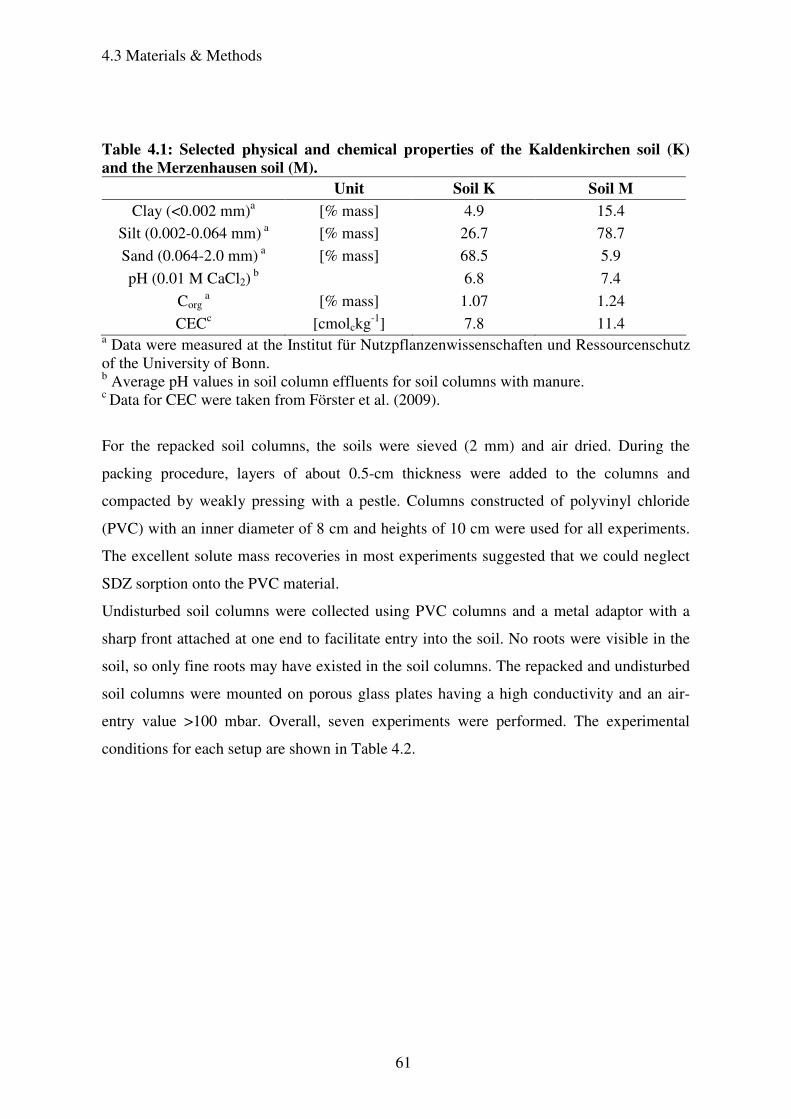
4.3 Materials & Methods
61
Table 4.1: Selected physical and chemical properties of the Kaldenkirchen soil (K)
and the Merzenhausen soil (M).
Unit Soil K Soil M
Clay (<0.002 mm)a [% mass] 4.9 15.4
Silt (0.002-0.064 mm) a [% mass] 26.7 78.7
Sand (0.064-2.0 mm) a [% mass] 68.5 5.9
pH (0.01 M CaCl2) b 6.8 7.4
Corg a [% mass] 1.07 1.24
CECc [cmolckg-1] 7.8 11.4 a Data were measured at the Institut für Nutzpflanzenwissenschaften und Ressourcenschutz of the University of Bonn. b Average pH values in soil column effluents for soil columns with manure. c Data for CEC were taken from Förster et al. (2009).
For the repacked soil columns, the soils were sieved (2 mm) and air dried. During the
packing procedure, layers of about 0.5-cm thickness were added to the columns and
compacted by weakly pressing with a pestle. Columns constructed of polyvinyl chloride
(PVC) with an inner diameter of 8 cm and heights of 10 cm were used for all experiments.
The excellent solute mass recoveries in most experiments suggested that we could neglect
SDZ sorption onto the PVC material.
Undisturbed soil columns were collected using PVC columns and a metal adaptor with a
sharp front attached at one end to facilitate entry into the soil. No roots were visible in the
soil, so only fine roots may have existed in the soil columns. The repacked and undisturbed
soil columns were mounted on porous glass plates having a high conductivity and an air-
entry value >100 mbar. Overall, seven experiments were performed. The experimental
conditions for each setup are shown in Table 4.2.
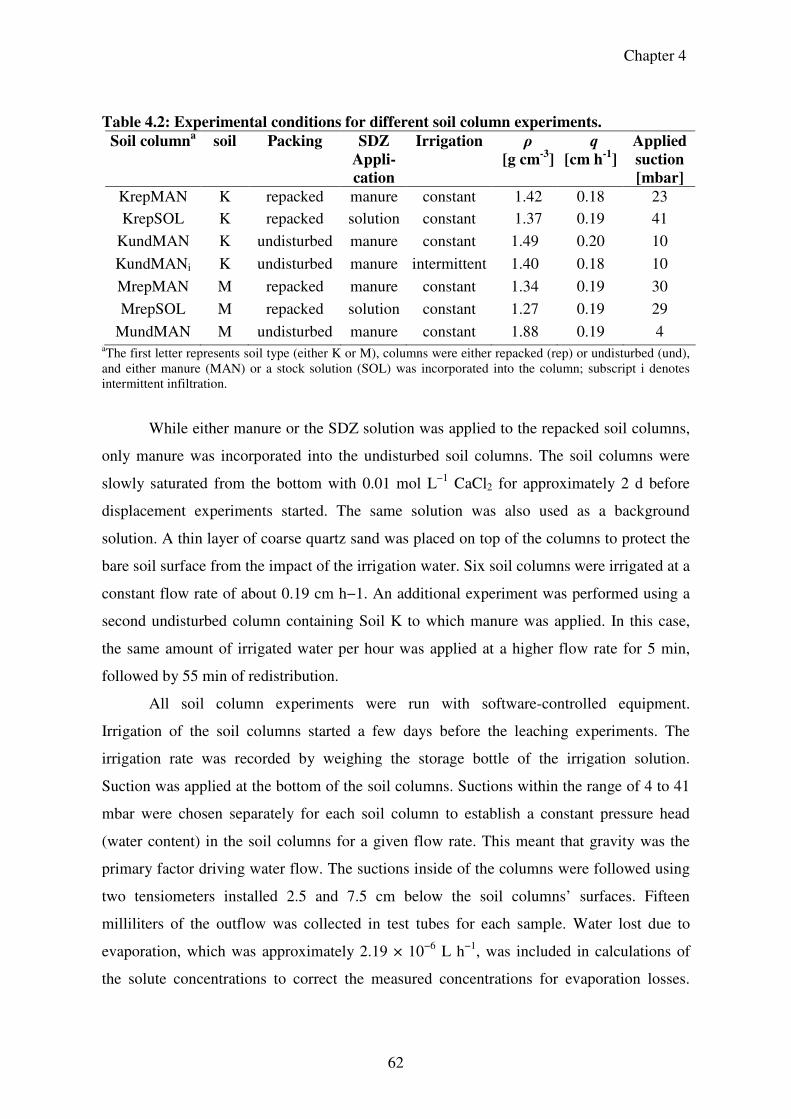
Chapter 4
62
Table 4.2: Experimental conditions for different soil column experiments.
Soil columna soil Packing SDZ
Appli-
cation
Irrigation ρ
[g cm-3
]
q
[cm h-1
]
Applied
suction
[mbar]
KrepMAN K repacked manure constant 1.42 0.18 23
KrepSOL K repacked solution constant 1.37 0.19 41
KundMAN K undisturbed manure constant 1.49 0.20 10
KundMANi K undisturbed manure intermittent 1.40 0.18 10
MrepMAN M repacked manure constant 1.34 0.19 30
MrepSOL M repacked solution constant 1.27 0.19 29
MundMAN M undisturbed manure constant 1.88 0.19 4 aThe first letter represents soil type (either K or M), columns were either repacked (rep) or undisturbed (und), and either manure (MAN) or a stock solution (SOL) was incorporated into the column; subscript i denotes intermittent infiltration.
While either manure or the SDZ solution was applied to the repacked soil columns,
only manure was incorporated into the undisturbed soil columns. The soil columns were
slowly saturated from the bottom with 0.01 mol L−1 CaCl2 for approximately 2 d before
displacement experiments started. The same solution was also used as a background
solution. A thin layer of coarse quartz sand was placed on top of the columns to protect the
bare soil surface from the impact of the irrigation water. Six soil columns were irrigated at a
constant flow rate of about 0.19 cm h−1. An additional experiment was performed using a
second undisturbed column containing Soil K to which manure was applied. In this case,
the same amount of irrigated water per hour was applied at a higher flow rate for 5 min,
followed by 55 min of redistribution.
All soil column experiments were run with software-controlled equipment.
Irrigation of the soil columns started a few days before the leaching experiments. The
irrigation rate was recorded by weighing the storage bottle of the irrigation solution.
Suction was applied at the bottom of the soil columns. Suctions within the range of 4 to 41
mbar were chosen separately for each soil column to establish a constant pressure head
(water content) in the soil columns for a given flow rate. This meant that gravity was the
primary factor driving water flow. The suctions inside of the columns were followed using
two tensiometers installed 2.5 and 7.5 cm below the soil columns’ surfaces. Fifteen
milliliters of the outflow was collected in test tubes for each sample. Water lost due to
evaporation, which was approximately 2.19 × 10⁻⁶ L h−1, was included in calculations of
the solute concentrations to correct the measured concentrations for evaporation losses.
4.3 Materials & Methods
63
Evaporation losses were determined by weighing two water-filled tubes at regular time
steps.
Before and after the SDZ-transport experiments, we used Cl− as a non-reactive
tracer to characterize the physical transport mechanisms in the soil columns. For this
purpose, pulses of 0.05 mol L−1 CaCl2 solution were applied to the columns for 1 h
(corresponding pore volumes are listed in Table 4.3. The Cl− concentration in the outflow
samples was measured using an electrical conductivity sensor included in the experimental
setup. The correlation between electrical conductivity and Cl− concentration was
determined by establishing a calibration curve using samples of known Cl− concentration.
For determining the BTCs of SDZ and its transformation products, either 15.07 g of pig
manure containing 14C-SDZ or 15.07 g of a 0.01 mol L−1 CaCl2 solution with the same
amount of SDZ was incorporated into the top 1 cm of the soil columns. Manure or the SDZ
solution was first mixed with the air-dried soil of the particular soil type and then added to
the top of the soil columns from which the original soil had been removed.
When the leaching experiments were finished, the soil columns were cut into slices of 0.5
or 1 cm thickness to measure 14C concentrations in the column profiles by combusting
aliquots of each slice in an oxidizer (Robox 192, Zinsser Analytik GmbH, Frankfurt,
Germany), following the approach described in Unold et al. (2009). This method allows 14C
concentrations in soils to be measured without applying any extraction procedures, which
were reported to have low efficiencies and variations between fresh (<71%) and aged
(<46%) SDZ residues (Förster et al., 2009). Thus only the total amount of radioactivity was
measured in the soil. For each slice, three 0.5-g replicates of ovendried (105°C), ground,
and homogenized soil were combusted in an oxidizer. After combustion, the evolving gas
was washed into a scintillation cocktail (Oxysolve C-400, Zinsser Analytics, Frankfurt,
Germany), in which the labeled CO2 was trapped and then analyzed by liquid scintillation
counting (LSC). Blanks were run before and after the samples to check for background and
cross-contamination. The efficiency of the combustion process (>95%) was ascertained by
combusting samples spiked with a known amount of the model compound 14C-anilazine
prior to and after analyzing the samples.
All experiments were performed in a laboratory without sunlight to prevent
photodegradation. Samples were exposed only briefly to artificial light during sample
collection and preparation. Biodegradation was not impeded. Samples were stored in a
refrigerator until measurements were conducted within approximately 2 or 3 wk. We
Chapter 4
64
assumed that concentrations of the transformation products did not change during this time
due to the low temperature environment.
The content of total organic C (TOC) in selected samples was measured using a TOC
5050A analyzer (Shimazdu, Duisburg, Germany). Samples for this purpose were frozen
before TOC measurements.
4.3.2 Analysis of sulfadiazine and transformation products
The pig manure containing 14C-labeled sulfonamides used in our studies was
obtained from a feeding experiment conducted at Bayer AG Monheim where 14C-SDZ with
single labeling of the pyrimidine ring and 12C-SDZ were administered to pigs in a ratio of
1:19. The specific radioactivity of SDZ in manure was 0.44 MBq mg−1. After dosing,
manure was collected, mixed, and stored at 4°C in darkness. The total 14C concentration of
the manure was 270 mg L−1 in mass equivalents of SDZ. Carbon-14-SDZ was provided by
Bayer HealthCare AG (Wuppertal, Germany) as a powder with a purity of 99% and a
specific radioactivity of 8.88 MBq mg−1. The application solution for the experiments
without manure was prepared by adding appropriate amounts of 14C- and 12C-SDZ (Sigma
Aldrich, Germany) to a 0.01 mol L−1 CaCl2 solution. Since the pH value of the manure was
approximately 8, the SDZ application solutions were buffered to this pH value by adding
low amounts of 0.01 mol L−1 NaOH. Since the added amounts of Na were very low, its
presence should not have substantially affected the results.
The method of Lamshöft et al. (2007) was used to determine the transformation
products in the manure. Briefly, 4 cm3 of McIlvaine buffer (1 mol L−1 citric acid/1 mol L−1
Na2HPO4, 18.15 cm3/81.85 cm3; adjusted to pH 7) was added to centrifuging vials
containing 1 g of homogenized manure. The extracts were shaken for 30 s with a vortex
mixer, treated for 15 min in an ultrasonic bath, and centrifuged for 0.5 h (514 × g) in an
Allegra 6 KR centrifuge (Beckmann Coulter, Palo Alto, CA). This procedure produced
clear supernatants, which were transferred into high performance liquid chromatography
(HPLC) vials and analyzed with radio HPLC (LB 509 detector, Berthold Technologies, Bad
Wildbad, Germany). Our HPLC system included a reversed-phase column (Phenomenex
Synergi Fusion RP 80, 250 by 4.6 mm), which was eluted with a mixture of water (490
cm3) and methanol (10 cm3), buffered with 0.5 cm3 of a 25% H3PO4 solution. The injection
volume was 0.25 cm3 for each sample. A gradient with an increased amount of methanol
was used for peak separation, starting with 100% water for 6 min. The methanol fraction
4.3 Materials & Methods
65
increased linearly to 27% during the first 23 min, then to 37% within the next 3 min, and to
47% during the following 2 min. The methanol part reached its maximum of 57% after 30
min. Sulfadiazine, N-Ac-SDZ, and 4-OH-SDZ could be detected using this HPLC method.
The substances were identified according to their retention times compared with standards
of SDZ and N-Ac-SDZ. The retention time of 4-OH-SDZ was known from previous
experiments. Retention times of SDZ, N-Ac-SDZ, and 4-OH-SDZ were approximately
16.70, 20.18, and 15.60 min. The detection limit of the radio HPLC was about 3 µg L−1
mass equivalents of SDZ. For two manure extractions that we conducted, 7.6 and 8.3% of
the radioactivity could not be assigned to a peak, probably due to sorption onto organic
material.
Sulfadiazine and its main transformation products in the outflow samples were also
separated using radio HPLC. Using the measurement protocol described above, four peaks
could be distinguished in the chromatograms. In addition to SDZ and the two main
transformation products, we also detected 4-[2-iminopyrimidine-1(2H)-yl]-aniline with a
known retention time from previous experiments of approximately 6.2 min. The same
measurement technique applied in previous experiments (Unold et al., 2009a) was also used
here to detect SDZ and its transformation products in samples with concentrations below
the detection limit of the HPLC radio detector. Outflow from the HPLC was collected
during the retention times of SDZ and its transformation products, as well as within these
time frames, for background correction. Solutes in three replicate samples were quantified
with LSC using a counting time of 15 min, for which the samples were mixed with 10 cm3
of the scintillation cocktail (Insta-Gel Plus, Canberra Packard GmbH, Dreieich, Germany).
The detection limit of the LSC detector was 0.4 Bq, which corresponds to 0.045 ng mass
equivalents of SDZ dissolved in an aliquot of the outflow sample. Non-zero concentrations
were assigned to a solute when the measured radioactivity was >1.2 Bq, which was three
times the detection limit of LSC. Otherwise its contribution was set to zero. Using this
method, the transformation products could be quantified with the help of the specific
radioactivity of 14C down to a concentration of 0.5 µg L−1 mass equivalents of SDZ in the
outflow samples. A background correction of the HPLC measurements was done and the
method was validated by measuring a calibration curve. Triplicate measurements of total
radioactivity in the samples were performed with LSC after mixing an aliquot of 0.5 cm3
with 10 cm3 of the scintillation cocktail. Selected samples were filtered (Centricon 10,
Millipore, Billerica, MA) and total 14C was measured before and after filtration. Since there
Chapter 4
66
was no difference in the measurements, we concluded that solutes in the outflow samples
were not attached to colloidal particles.
4.3.3 Theory of solute transport
The steady-state transport experiments on unsaturated repacked and undisturbed soil
columns were analyzed as one- dimensional transport problems, assuming constant water
contents and fluxes throughout the soil columns. Solute transport is commonly described
using the convection–dispersion equation (CDE), which for conservative, non-reacting
tracers during steady state flow conditions can be expressed as
where t is time [T], v is the average pore-water velocity [L T−1], C is the solute
concentration in the liquid phase [M L−3], D is the dispersion coefficient [L2 T−1], and z is
depth [L]. The parameters v and D for the Cl− BTCs were estimated using a nonlinear
parameter estimation procedure based on the Levenberg–Marquardt algorithm. We used the
CXTFIT code (Toride et al., 1999), which analytically solves the CDE for appropriate
boundary conditions. The estimated transport parameters (i.e., v and D) and the
experimentally determined Darcian flux, q [L T−1], were then used to evaluate the
volumetric water content, θ = q/v [L3 L−3], and the longitudinal dispersivity, λ = D/v. These
parameters were assumed to fully characterize the physical transport process and were fixed
in subsequent transport simulations of reactive SDZ and its transformation products using a
modified version 4.03 of HYDRUS-1D (Šimůnek et al., 2008).
Based on a previous study with SDZ BTCs (Unold et al., 2009a), a model concept with one
reversible and one irreversible kinetic sorption site was used to analyze the BTCs of SDZ
and its transformation products. The model concept (Figure 4.1) for the experiments was
developed to account for all known processes. We included the transformation of N-Ac-
SDZ into SDZ according to information from the literature (Berger et al., 1986). The
irreversible sorption site was omitted for N-Ac-SDZ according to Förster et al. (2009), who
found no significant sequestration of the N-Ac-SDZ metabolite in soils. Covalent coupling
to organic material as described by Bialk and Pedersen (2008) is also unlikely for N-Ac-
SDZ since the free aniline moiety is not available. A transformation from SDZ into 4-OH-
SDZ was included in the model according to our experimental results using SDZ solutions.
2
2
z
CD
z
Cv
t
C
∂
∂+
∂
∂−=
∂
∂ , (4.1)
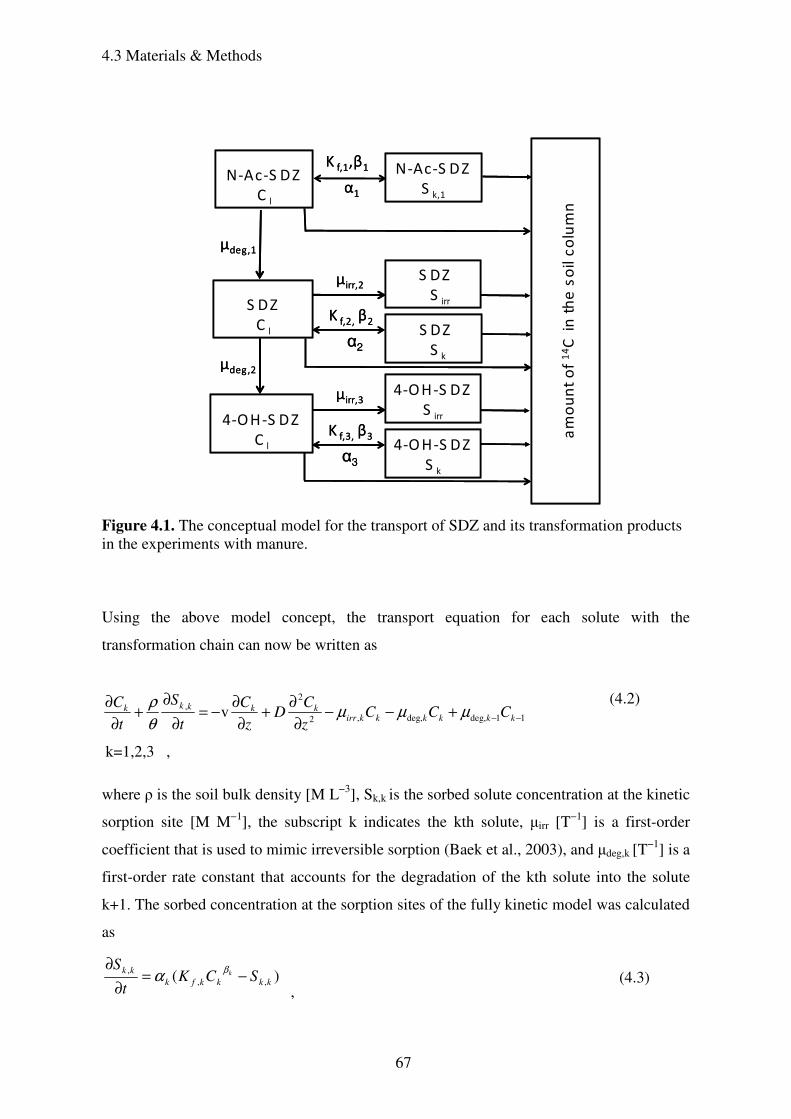
4.3 Materials & Methods
67
Figure 4.1. The conceptual model for the transport of SDZ and its transformation products in the experiments with manure.
Using the above model concept, the transport equation for each solute with the
transformation chain can now be written as
where ρ is the soil bulk density [M L−3], Sk,k is the sorbed solute concentration at the kinetic
sorption site [M M−1], the subscript k indicates the kth solute, µirr [T−1] is a first-order
coefficient that is used to mimic irreversible sorption (Baek et al., 2003), and µdeg,k [T−1] is a
first-order rate constant that accounts for the degradation of the kth solute into the solute
k+1. The sorbed concentration at the sorption sites of the fully kinetic model was calculated
as
11deg,deg,,2
2, v −−+−−
∂
∂+
∂
∂−=
∂
∂+
∂
∂kkkkkkirr
kkkkk CCCz
CD
z
C
t
S
t
Cµµµ
θ
ρ
k=1,2,3 ,
(4.2)
)( ,,,
kkkkfk
kkSCK
t
Sk −=
∂
∂ βα
, (4.3)
am
ou
nt
of
14C
in
th
e s
oil c
olu
mn
4-O H-S DZ
S k
S DZ
S k
N-Ac-S DZ
S k,1
S DZ
S irr
4-OH-S DZ
Sirr
µdeg,2
µirr,3
µirr,2
K f,1,β1
α1
K f,2, β2
α2
K f,3, β3
α3
N-Ac-S DZ
C l
µdeg,1
S DZ
Cl
4-OH-S DZ
C l
am
ou
nt
of
14C
in
th
e s
oil c
olu
mn
4-O H-S DZ
S k
S DZ
S k
N-Ac-S DZ
S k,1
S DZ
S irr
4-OH-S DZ
Sirr
µdeg,2
µirr,3
µirr,2
K f,1,β1
α1
K f,2, β2
α2
K f,3, β3
α3
N-Ac-S DZ
C l
µdeg,1
S DZ
Cl
4-OH-S DZ
C l
Chapter 4
68
where Kf,k [M1-βsoluteL
3βM-1soil] is the Freundlich coefficient, βk [-] is the Freundlich
exponent and αk [T-1] is a first-order sorption rate coefficient.
While a flux-type boundary condition with zero concentration for all compounds
was used as the upper boundary condition, the lower boundary condition was a zero-
concentration gradient in the numerical solutions. Liquid-phase initial concentrations of
SDZ and its transformation products in the uppermost centimeter of the soil profile were
calculated using the initial total mass of solutes (Table 4.4) and water contents of the
particular soil columns. In the experiments with the SDZ solution, all of the mass was
initially contributed to SDZ since no transformation products were present in the input
solution. For the fully kinetic model, all solid-phase concentrations were initially set to
zero. While BTCs were available for each particular solute, only total 14C measurements
(i.e., the sum of all three solutes in both the liquid and the solid phases) were available for
the various solutes in the soil columns at the end of the experiments. The HYDRUS-1D
code was therefore modified to add the sorbed (both reversible and irreversible) and liquid
concentrations of all three solutes in a particular degradation chain. Concentrations of the
transformation products were lower than those of SDZ. To obtain adequate fits for all BTCs
during the simultaneous fitting process, the data points of N-Ac-SDZ, 4-OH-SDZ, and the
total concentration profile were weighed relative to SDZ according to
ofileBTCi
n
i
SDZi
n
i
SDZ
ofileBTC
C
C
n
nw
ofileBTC
SDZ
Pr,,1
,1Pr,
deg
Pr,deg
deg
=
=
∑
∑= , (4.4)
where n accounts for the number of data points of the BTCs or concentration profiles of
SDZ and its transformation products (BTCdeg), and Ci are measured concentrations at the ith
time for a particular BTC expressed in mass equivalents of SDZ per volume of solution (or
per volume of soil for the concentration profile).
The goodness of fit for particular solutes and BTCs was expressed using the mean absolute
error:
||1
ii yfn
MAE −Σ= ,
(4.5)
where n is the number of data points on a particular BTC, and where fi and yi are predicted
and measured values, respectively.
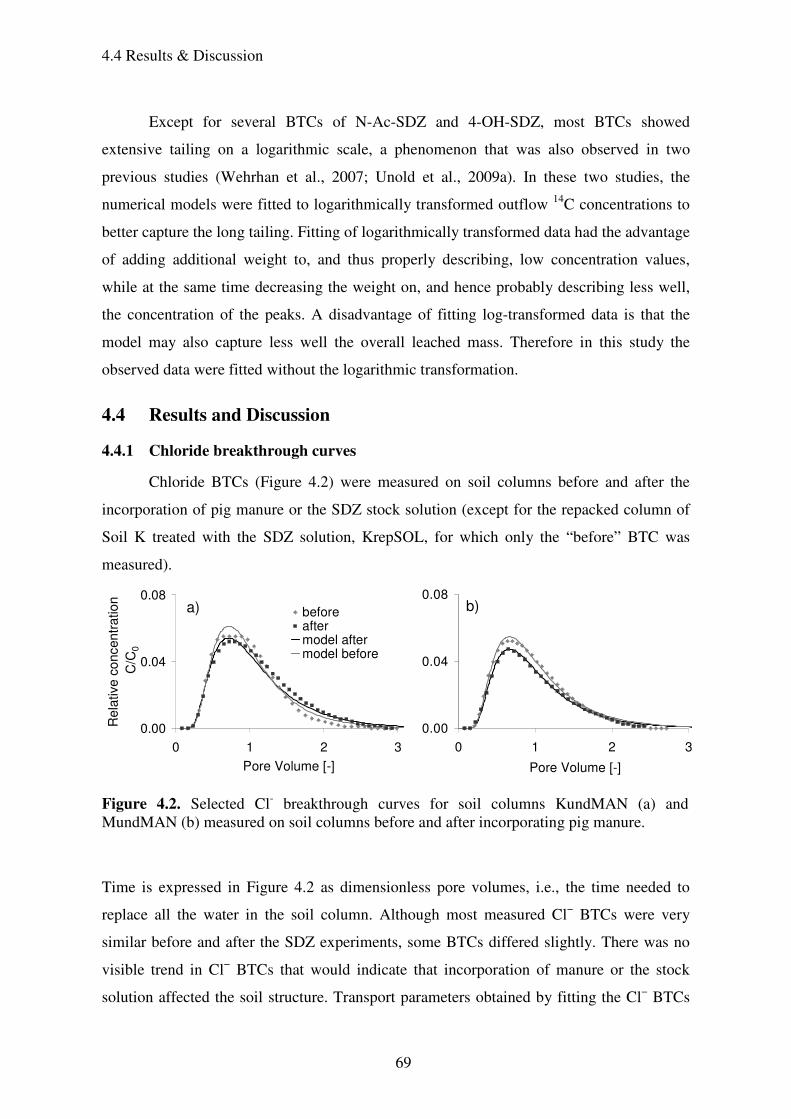
4.4 Results & Discussion
69
Except for several BTCs of N-Ac-SDZ and 4-OH-SDZ, most BTCs showed
extensive tailing on a logarithmic scale, a phenomenon that was also observed in two
previous studies (Wehrhan et al., 2007; Unold et al., 2009a). In these two studies, the
numerical models were fitted to logarithmically transformed outflow 14C concentrations to
better capture the long tailing. Fitting of logarithmically transformed data had the advantage
of adding additional weight to, and thus properly describing, low concentration values,
while at the same time decreasing the weight on, and hence probably describing less well,
the concentration of the peaks. A disadvantage of fitting log-transformed data is that the
model may also capture less well the overall leached mass. Therefore in this study the
observed data were fitted without the logarithmic transformation.
4.4 Results and Discussion
4.4.1 Chloride breakthrough curves
Chloride BTCs (Figure 4.2) were measured on soil columns before and after the
incorporation of pig manure or the SDZ stock solution (except for the repacked column of
Soil K treated with the SDZ solution, KrepSOL, for which only the “before” BTC was
measured).
Figure 4.2. Selected Cl- breakthrough curves for soil columns KundMAN (a) and MundMAN (b) measured on soil columns before and after incorporating pig manure.
Time is expressed in Figure 4.2 as dimensionless pore volumes, i.e., the time needed to
replace all the water in the soil column. Although most measured Cl− BTCs were very
similar before and after the SDZ experiments, some BTCs differed slightly. There was no
visible trend in Cl− BTCs that would indicate that incorporation of manure or the stock
solution affected the soil structure. Transport parameters obtained by fitting the Cl− BTCs
0.00
0.04
0.08
0 1 2 3
0.00
0.04
0.08
0 1 2 3
beforeaftermodel aftermodel before
Pore Volume [-] Pore Volume [-]
Re
lative
co
ncen
tra
tio
n
C/C
0
a) b)
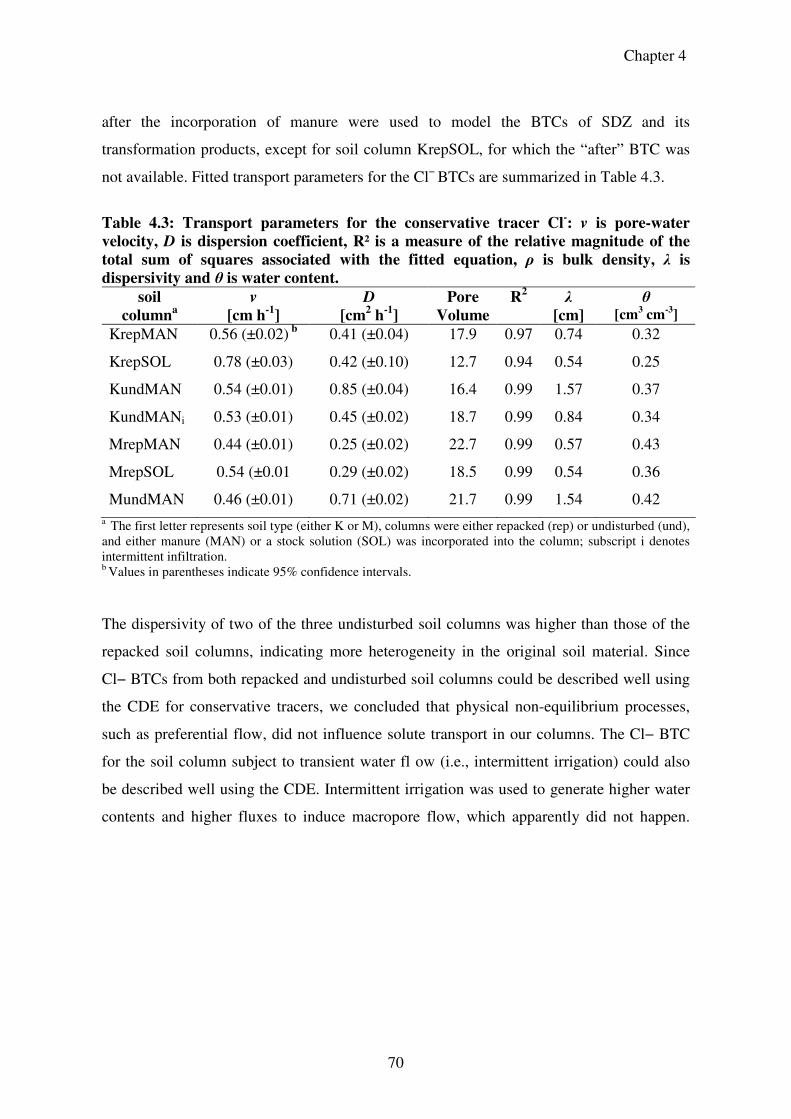
Chapter 4
70
after the incorporation of manure were used to model the BTCs of SDZ and its
transformation products, except for soil column KrepSOL, for which the “after” BTC was
not available. Fitted transport parameters for the Cl− BTCs are summarized in Table 4.3.
Table 4.3: Transport parameters for the conservative tracer Cl
-: v is pore-water
velocity, D is dispersion coefficient, R² is a measure of the relative magnitude of the
total sum of squares associated with the fitted equation, ρ is bulk density, λ is
dispersivity and θ is water content.
soil
columna
v
[cm h-1
]
D
[cm2 h
-1]
Pore
Volume
R2 λ
[cm]
θ [cm3 cm-3]
KrepMAN 0.56 (±0.02) b 0.41 (±0.04) 17.9 0.97 0.74 0.32
KrepSOL 0.78 (±0.03) 0.42 (±0.10) 12.7 0.94 0.54 0.25
KundMAN 0.54 (±0.01) 0.85 (±0.04) 16.4 0.99 1.57 0.37
KundMANi 0.53 (±0.01) 0.45 (±0.02) 18.7 0.99 0.84 0.34
MrepMAN 0.44 (±0.01) 0.25 (±0.02) 22.7 0.99 0.57 0.43
MrepSOL 0.54 (±0.01 0.29 (±0.02) 18.5 0.99 0.54 0.36
MundMAN 0.46 (±0.01) 0.71 (±0.02) 21.7 0.99 1.54 0.42 a The first letter represents soil type (either K or M), columns were either repacked (rep) or undisturbed (und),
and either manure (MAN) or a stock solution (SOL) was incorporated into the column; subscript i denotes intermittent infiltration. b Values in parentheses indicate 95% confidence intervals.
The dispersivity of two of the three undisturbed soil columns was higher than those of the
repacked soil columns, indicating more heterogeneity in the original soil material. Since
Cl− BTCs from both repacked and undisturbed soil columns could be described well using
the CDE for conservative tracers, we concluded that physical non-equilibrium processes,
such as preferential flow, did not influence solute transport in our columns. The Cl− BTC
for the soil column subject to transient water fl ow (i.e., intermittent irrigation) could also
be described well using the CDE. Intermittent irrigation was used to generate higher water
contents and higher fluxes to induce macropore flow, which apparently did not happen.
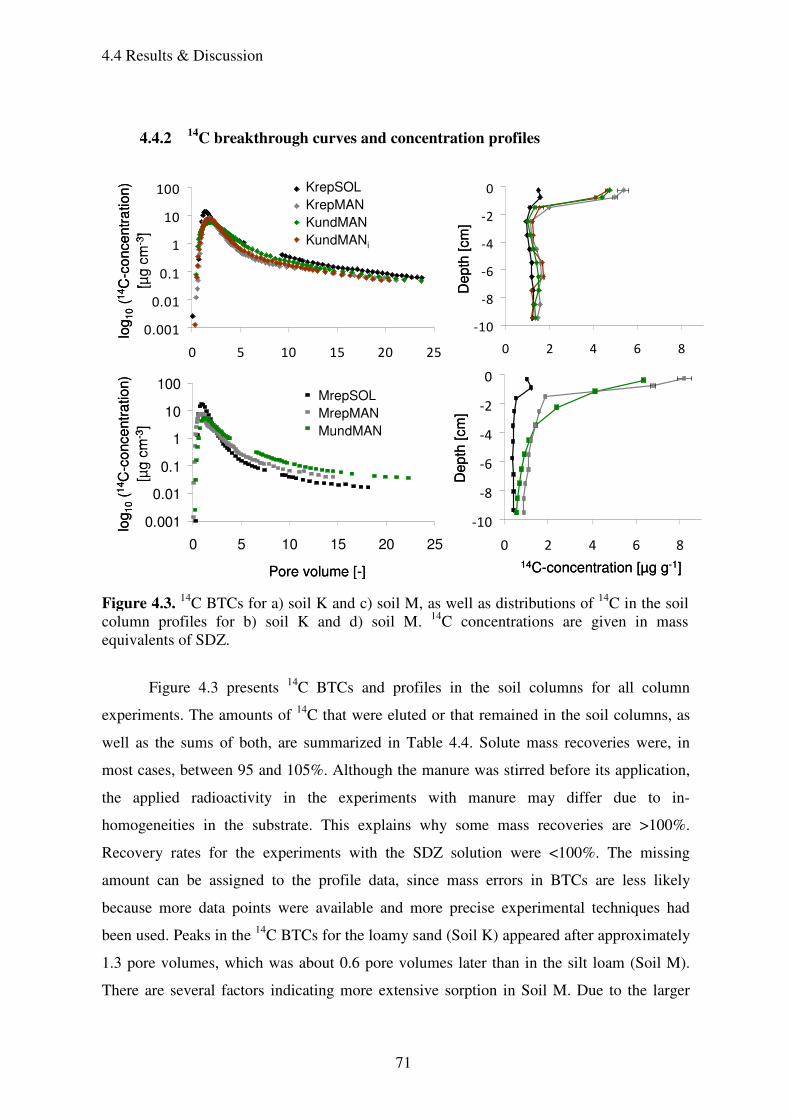
4.4 Results & Discussion
71
4.4.2 14
C breakthrough curves and concentration profiles
Figure 4.3 presents 14C BTCs and profiles in the soil columns for all column
experiments. The amounts of 14C that were eluted or that remained in the soil columns, as
well as the sums of both, are summarized in Table 4.4. Solute mass recoveries were, in
most cases, between 95 and 105%. Although the manure was stirred before its application,
the applied radioactivity in the experiments with manure may differ due to in-
homogeneities in the substrate. This explains why some mass recoveries are >100%.
Recovery rates for the experiments with the SDZ solution were <100%. The missing
amount can be assigned to the profile data, since mass errors in BTCs are less likely
because more data points were available and more precise experimental techniques had
been used. Peaks in the 14C BTCs for the loamy sand (Soil K) appeared after approximately
1.3 pore volumes, which was about 0.6 pore volumes later than in the silt loam (Soil M).
There are several factors indicating more extensive sorption in Soil M. Due to the larger
Figure 4.3. 14C BTCs for a) soil K and c) soil M, as well as distributions of 14C in the soil
column profiles for b) soil K and d) soil M. 14C concentrations are given in mass equivalents of SDZ.
De
pth
[cm
]
14C-concentration [µg g-1]Pore volume [-]
De
pth
[cm
]
a)b)
c)
d)
0.001
0.01
0.1
1
10
100
0 5 10 15 20 25
KrepSOL
KrepMAN
KundMAN
KundMANi
-10
-8
-6
-4
-2
0
0 2 4 6 8
log
10
(14C
-co
nce
ntr
ation
)
[µg c
m-3
]
0.001
0.01
0.1
1
10
100
0 5 10 15 20 25
log
10
(14C
-co
nce
ntr
atio
n)
[µg
cm
-3]
MrepSOL
MrepMAN
MundMAN
-10
-8
-6
-4
-2
0
0 2 4 6 8
De
pth
[cm
]
14C-concentration [µg g-1]Pore volume [-]
De
pth
[cm
]
a)b)
c)
d)
0.001
0.01
0.1
1
10
100
0 5 10 15 20 25
KrepSOL
KrepMAN
KundMAN
KundMANi
-10
-8
-6
-4
-2
0
0 2 4 6 8
log
10
(14C
-co
nce
ntr
ation
)
[µg c
m-3
]
0.001
0.01
0.1
1
10
100
0 5 10 15 20 25
log
10
(14C
-co
nce
ntr
atio
n)
[µg
cm
-3]
MrepSOL
MrepMAN
MundMAN
-10
-8
-6
-4
-2
0
0 2 4 6 8
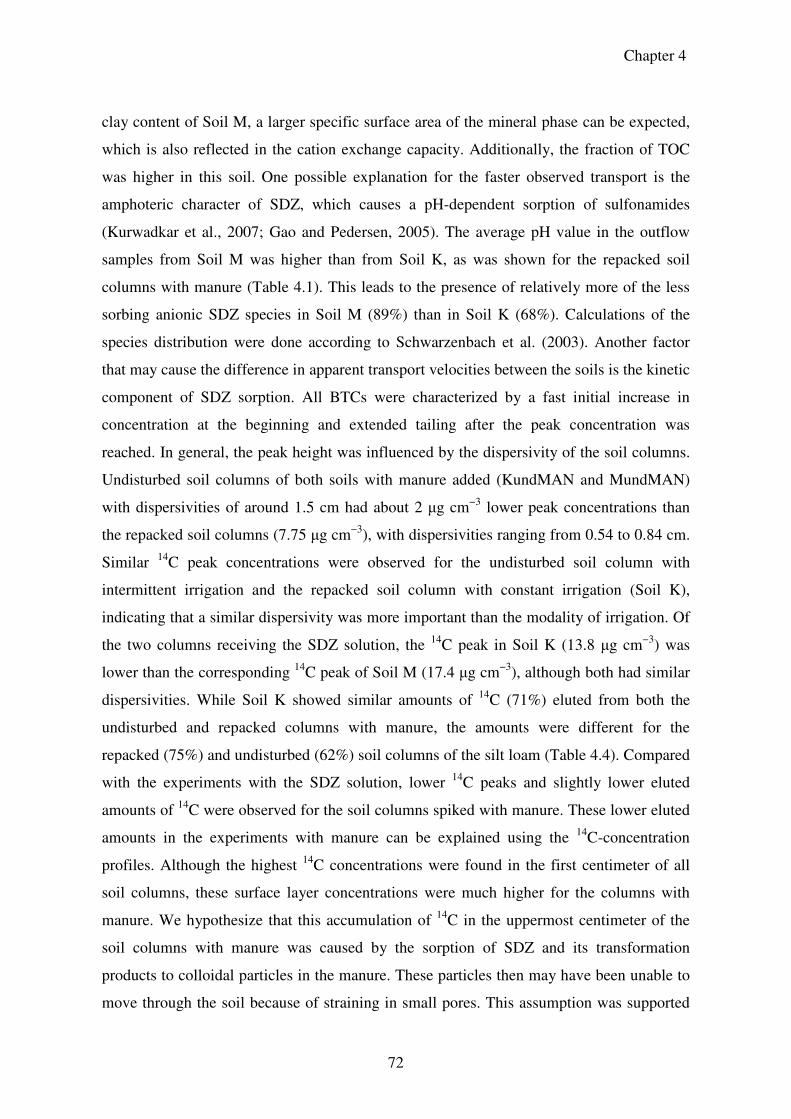
Chapter 4
72
clay content of Soil M, a larger specific surface area of the mineral phase can be expected,
which is also reflected in the cation exchange capacity. Additionally, the fraction of TOC
was higher in this soil. One possible explanation for the faster observed transport is the
amphoteric character of SDZ, which causes a pH-dependent sorption of sulfonamides
(Kurwadkar et al., 2007; Gao and Pedersen, 2005). The average pH value in the outflow
samples from Soil M was higher than from Soil K, as was shown for the repacked soil
columns with manure (Table 4.1). This leads to the presence of relatively more of the less
sorbing anionic SDZ species in Soil M (89%) than in Soil K (68%). Calculations of the
species distribution were done according to Schwarzenbach et al. (2003). Another factor
that may cause the difference in apparent transport velocities between the soils is the kinetic
component of SDZ sorption. All BTCs were characterized by a fast initial increase in
concentration at the beginning and extended tailing after the peak concentration was
reached. In general, the peak height was influenced by the dispersivity of the soil columns.
Undisturbed soil columns of both soils with manure added (KundMAN and MundMAN)
with dispersivities of around 1.5 cm had about 2 µg cm−3 lower peak concentrations than
the repacked soil columns (7.75 µg cm−3), with dispersivities ranging from 0.54 to 0.84 cm.
Similar 14C peak concentrations were observed for the undisturbed soil column with
intermittent irrigation and the repacked soil column with constant irrigation (Soil K),
indicating that a similar dispersivity was more important than the modality of irrigation. Of
the two columns receiving the SDZ solution, the 14C peak in Soil K (13.8 µg cm−3) was
lower than the corresponding 14C peak of Soil M (17.4 µg cm−3), although both had similar
dispersivities. While Soil K showed similar amounts of 14C (71%) eluted from both the
undisturbed and repacked columns with manure, the amounts were different for the
repacked (75%) and undisturbed (62%) soil columns of the silt loam (Table 4.4). Compared
with the experiments with the SDZ solution, lower 14C peaks and slightly lower eluted
amounts of 14C were observed for the soil columns spiked with manure. These lower eluted
amounts in the experiments with manure can be explained using the 14C-concentration
profiles. Although the highest 14C concentrations were found in the first centimeter of all
soil columns, these surface layer concentrations were much higher for the columns with
manure. We hypothesize that this accumulation of 14C in the uppermost centimeter of the
soil columns with manure was caused by the sorption of SDZ and its transformation
products to colloidal particles in the manure. These particles then may have been unable to
move through the soil because of straining in small pores. This assumption was supported
4.4 Results & Discussion
73
by the fact that, during the HPLC measurements of the manure extracts, approximately 8%
of the radioactivity could not be related to a peak, probably due to adsorption to organic
material. Filtration of manure particles dependent on the pore size distribution of the porous
medium was shown by Bradford et al. (2006). They determined concentration profiles of
manure particles in sandy soil columns and similarly found that most manure particles were
retained in the uppermost layer.
Table 4.4: Mass fractions of
14C in the breakthrough curves (BTCs) and the soil profile
and mass fractions (in %) of the parent compound sulfadiazine (SDZ) and the
transformation products in the BTCs.
a The first letter represents soil type (either K or M), columns were either repacked (rep) or undisturbed (und), and either manure (MAN) or a stock solution (SOL) was incorporated into the column; subscript i denotes intermittent infiltration. b The amount of 14C which could not be associated with a peak was distributed among SDZ and the transformation products c n.d. indicates that the transformation product could not be detected d Manure 2 was applied to soil column MundMAN
The presence of manure may also influence sorption behavior in other ways. Sukul
et al. (2008a) found in batch experiments an increased sorption of SDZ onto soils of
different origins when manure was present. Kreuzig and Höltge (2005) also found in batch
experiments a higher tendency of SDZ to form nonextractable residues in the presence of
manure with 7-d-old SDZ. In their lysimeter studies in which an SDZ test slurry was
incorporated into undisturbed profiles, Kreuzig and Höltge (2005) observed similar
concentration profiles as in our soil columns. Distinct differences were observed in the 14C
concentration profiles between the sand and loam columns. The observed amount of 14C in
Columna
Radio-
activity in BTC
[%]
Radio-
activity in the soil
profile [%]
Total
mass recover
y [%]
SDZ [%]
Acetyl-
SDZ [%]
OH-
SDZ [%]
4-[2-
iminopyri-midine-1(2H)-
yl]-aniline [%]
Manure1 67.7 b 14.9 b 17.4 b n.d. c
Manure2 d 82.4 b 8.7 b 8.8 b n.d.
KrepMAN 70.3 32.3 102.6 76.0 9.7 17.3 n.d.
KrepSOL 76.0 19.0 95.0 75.9 n.d. 7.8 16.1
KundMAN 70.9 30.5 101.4 78.0 9.9 15.2 n.d.
KundMANi 74.2 28.3 102.5 80.7 8.9 12.5 n.d.
MrepMAN 75.3 29.0 104.3 74.0 7.7 18.5 n.d.
MrepSOL 86.0 6.4 92.4 90.0 n.d. 1 12.0
MundMAN† 62.0 37.8 99.8 91.0 7.4 4.8 0.9
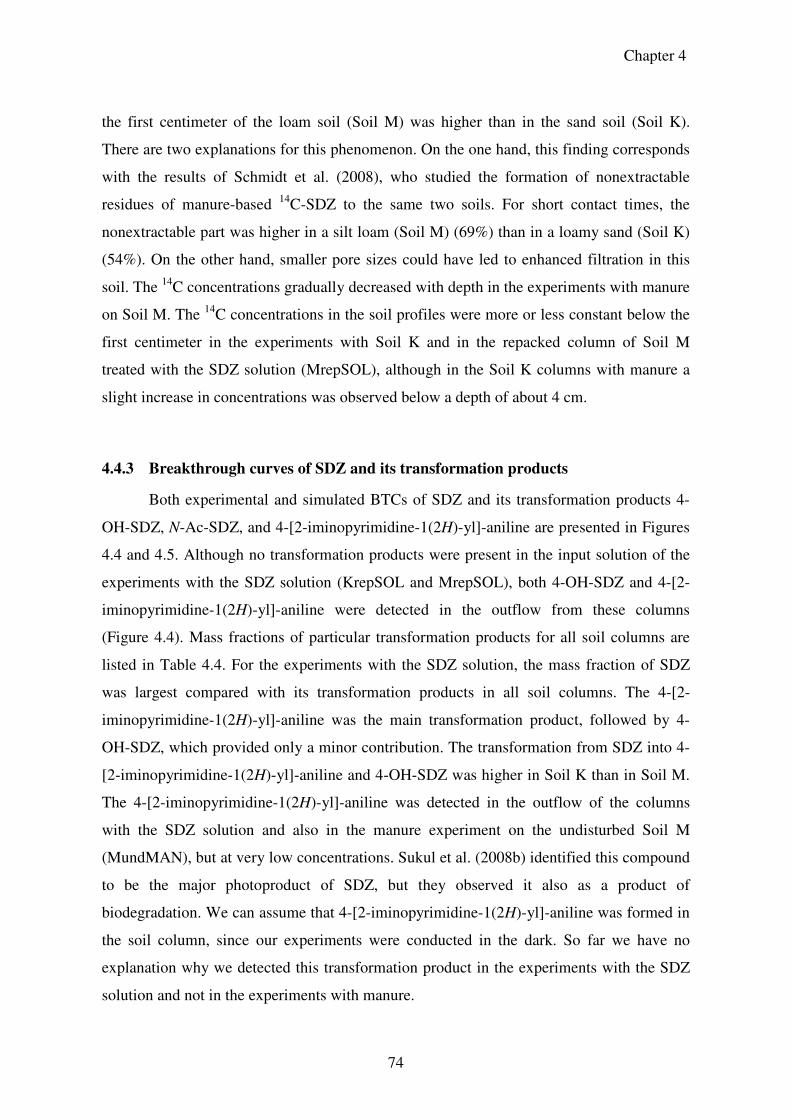
Chapter 4
74
the first centimeter of the loam soil (Soil M) was higher than in the sand soil (Soil K).
There are two explanations for this phenomenon. On the one hand, this finding corresponds
with the results of Schmidt et al. (2008), who studied the formation of nonextractable
residues of manure-based 14C-SDZ to the same two soils. For short contact times, the
nonextractable part was higher in a silt loam (Soil M) (69%) than in a loamy sand (Soil K)
(54%). On the other hand, smaller pore sizes could have led to enhanced filtration in this
soil. The 14C concentrations gradually decreased with depth in the experiments with manure
on Soil M. The 14C concentrations in the soil profiles were more or less constant below the
first centimeter in the experiments with Soil K and in the repacked column of Soil M
treated with the SDZ solution (MrepSOL), although in the Soil K columns with manure a
slight increase in concentrations was observed below a depth of about 4 cm.
4.4.3 Breakthrough curves of SDZ and its transformation products
Both experimental and simulated BTCs of SDZ and its transformation products 4-
OH-SDZ, N-Ac-SDZ, and 4-[2-iminopyrimidine-1(2H)-yl]-aniline are presented in Figures
4.4 and 4.5. Although no transformation products were present in the input solution of the
experiments with the SDZ solution (KrepSOL and MrepSOL), both 4-OH-SDZ and 4-[2-
iminopyrimidine-1(2H)-yl]-aniline were detected in the outflow from these columns
(Figure 4.4). Mass fractions of particular transformation products for all soil columns are
listed in Table 4.4. For the experiments with the SDZ solution, the mass fraction of SDZ
was largest compared with its transformation products in all soil columns. The 4-[2-
iminopyrimidine-1(2H)-yl]-aniline was the main transformation product, followed by 4-
OH-SDZ, which provided only a minor contribution. The transformation from SDZ into 4-
[2-iminopyrimidine-1(2H)-yl]-aniline and 4-OH-SDZ was higher in Soil K than in Soil M.
The 4-[2-iminopyrimidine-1(2H)-yl]-aniline was detected in the outflow of the columns
with the SDZ solution and also in the manure experiment on the undisturbed Soil M
(MundMAN), but at very low concentrations. Sukul et al. (2008b) identified this compound
to be the major photoproduct of SDZ, but they observed it also as a product of
biodegradation. We can assume that 4-[2-iminopyrimidine-1(2H)-yl]-aniline was formed in
the soil column, since our experiments were conducted in the dark. So far we have no
explanation why we detected this transformation product in the experiments with the SDZ
solution and not in the experiments with manure.
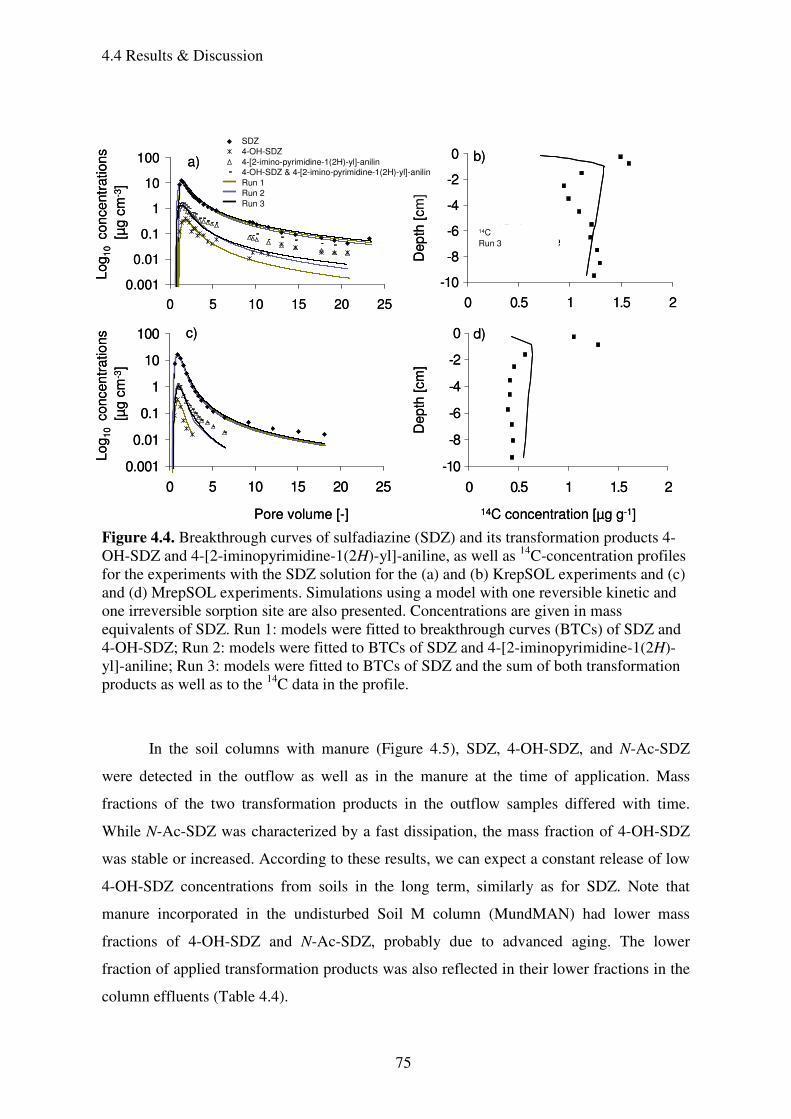
4.4 Results & Discussion
75
Figure 4.4. Breakthrough curves of sulfadiazine (SDZ) and its transformation products 4-OH-SDZ and 4-[2-iminopyrimidine-1(2H)-yl]-aniline, as well as 14C-concentration profiles for the experiments with the SDZ solution for the (a) and (b) KrepSOL experiments and (c) and (d) MrepSOL experiments. Simulations using a model with one reversible kinetic and one irreversible sorption site are also presented. Concentrations are given in mass equivalents of SDZ. Run 1: models were fitted to breakthrough curves (BTCs) of SDZ and 4-OH-SDZ; Run 2: models were fitted to BTCs of SDZ and 4-[2-iminopyrimidine-1(2H)-yl]-aniline; Run 3: models were fitted to BTCs of SDZ and the sum of both transformation products as well as to the 14C data in the profile.
In the soil columns with manure (Figure 4.5), SDZ, 4-OH-SDZ, and N-Ac-SDZ
were detected in the outflow as well as in the manure at the time of application. Mass
fractions of the two transformation products in the outflow samples differed with time.
While N-Ac-SDZ was characterized by a fast dissipation, the mass fraction of 4-OH-SDZ
was stable or increased. According to these results, we can expect a constant release of low
4-OH-SDZ concentrations from soils in the long term, similarly as for SDZ. Note that
manure incorporated in the undisturbed Soil M column (MundMAN) had lower mass
fractions of 4-OH-SDZ and N-Ac-SDZ, probably due to advanced aging. The lower
fraction of applied transformation products was also reflected in their lower fractions in the
column effluents (Table 4.4).
0.001
0.01
0.1
1
10
100
0 5 10 15 20 25
-10
-8
-6
-4
-2
0
0 0.5 1 1.5 2
14C-datafit with profile
Log
10
concen
tra
tio
ns
[µg
cm
-3]
Log
10
con
centr
ation
s
[µg c
m-3
]
Dep
th[c
m]
Pore volume [-] 14C concentration [µg g-1]
SDZ
4-OH-SDZ
4-[2-imino-pyrimidine-1(2H)-yl]-anilin 4-OH-SDZ & 4-[2-imino-pyrimidine-1(2H)-yl]-anilin
Run 1
Run 2
Run 3
a) b)
14C
Run 3
Dep
th[c
m]
c) d)
0.001
0.01
0.1
1
10
100
0 5 10 15 20 25
-10
-8
-6
-4
-2
0
0 0.5 1 1.5 2
0.001
0.01
0.1
1
10
100
0 5 10 15 20 25
-10
-8
-6
-4
-2
0
0 0.5 1 1.5 2
14C-datafit with profile
Log
10
concen
tra
tio
ns
[µg
cm
-3]
Log
10
con
centr
ation
s
[µg c
m-3
]
Dep
th[c
m]
Pore volume [-] 14C concentration [µg g-1]
SDZ
4-OH-SDZ
4-[2-imino-pyrimidine-1(2H)-yl]-anilin 4-OH-SDZ & 4-[2-imino-pyrimidine-1(2H)-yl]-anilin
Run 1
Run 2
Run 3
a) b)
14C
Run 3
Dep
th[c
m]
c) d)
0.001
0.01
0.1
1
10
100
0 5 10 15 20 25
-10
-8
-6
-4
-2
0
0 0.5 1 1.5 2
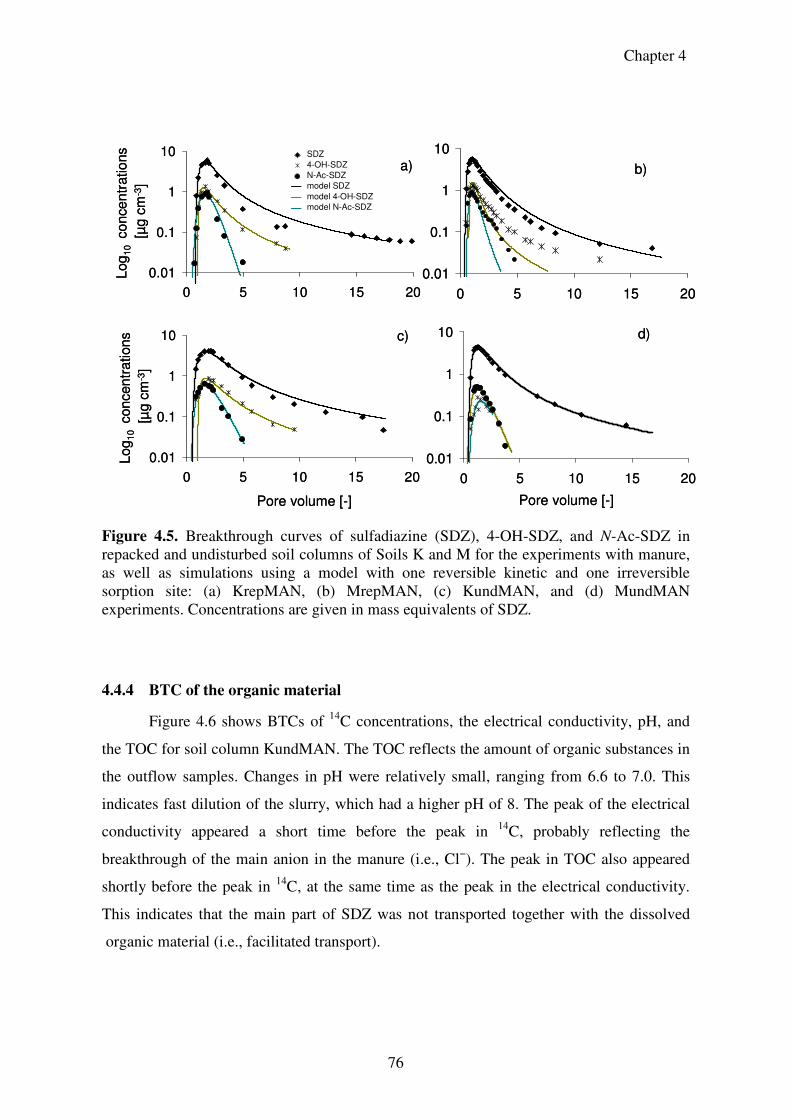
Chapter 4
76
Figure 4.5. Breakthrough curves of sulfadiazine (SDZ), 4-OH-SDZ, and N-Ac-SDZ in repacked and undisturbed soil columns of Soils K and M for the experiments with manure, as well as simulations using a model with one reversible kinetic and one irreversible sorption site: (a) KrepMAN, (b) MrepMAN, (c) KundMAN, and (d) MundMAN experiments. Concentrations are given in mass equivalents of SDZ.
4.4.4 BTC of the organic material
Figure 4.6 shows BTCs of 14C concentrations, the electrical conductivity, pH, and
the TOC for soil column KundMAN. The TOC reflects the amount of organic substances in
the outflow samples. Changes in pH were relatively small, ranging from 6.6 to 7.0. This
indicates fast dilution of the slurry, which had a higher pH of 8. The peak of the electrical
conductivity appeared a short time before the peak in 14C, probably reflecting the
breakthrough of the main anion in the manure (i.e., Cl−). The peak in TOC also appeared
shortly before the peak in 14C, at the same time as the peak in the electrical conductivity.
This indicates that the main part of SDZ was not transported together with the dissolved
organic material (i.e., facilitated transport).
0.01
0.1
1
10
0 5 10 15 20
Log
10 co
nce
ntr
atio
ns
[µg
cm
-3]
Lo
g1
0 con
cen
tra
tion
s
[µg c
m-3
]
Pore volume [-] Pore volume [-]
a) b)
c) d)
SDZ
4-OH-SDZ
N-Ac-SDZ
model SDZ
model 4-OH-SDZ
model N-Ac-SDZ
0.01
0.1
1
10
0 5 10 15 20
0.01
0.1
1
10
0 5 10 15 20
0.01
0.1
1
10
0 5 10 15 20
0.01
0.1
1
10
0 5 10 15 20
Log
10 co
nce
ntr
atio
ns
[µg
cm
-3]
Lo
g1
0 con
cen
tra
tion
s
[µg c
m-3
]
Pore volume [-] Pore volume [-]
a) b)
c) d)
SDZ
4-OH-SDZ
N-Ac-SDZ
model SDZ
model 4-OH-SDZ
model N-Ac-SDZ
0.01
0.1
1
10
0 5 10 15 20
0.01
0.1
1
10
0 5 10 15 20
0.01
0.1
1
10
0 5 10 15 20
4.4 Results & Discussion
77
We could not observe any differences in 14C concentrations between filtered and
unfiltered outflow samples. These findings are consistent with observations by Thiele-
Bruhn and Aust (2004), who did not find any sulfonamide losses in their batch experiments
during solid phase extraction with the supernatants. Solid-phase extraction is supposed to
remove the dissolved organic material (pig slurry and soil organic matter) together with the
adsorbed substances. We therefore conclude that although transport facilitated by dissolved
organic C may not be completely ruled out, this process does not seem to be a major
transport mechanism involved in the leaching of SDZ and its transformation products. The
outflow TOC concentrations, however, did not reach zero during the experiments (Figure
4.6), thus suggesting a continuous release of organic material. While this supports the
hypothesis that the 14C accumulation in the first centimeter of the soil columns is caused by
the filtration of organic material, in the long term the release of organic material, possibly
together with bound SDZ residues, may still be possible.
0
1
2
3
4
5
6
7
8
0 5 10 15 20 25
Pore Volume [-]
0
50
100
150
200
250
electrical conductivity [nS/cm] (left axis)
14C [µg/ml] (left axis)
pH-value (left axis)
TOC [mg/L] (right axis)
Figure 4.6. Breakthrough curves of 14C, electrical conductivity, and total organic C (TOC) measured in the soil column KundMAN after the manure application.
Chapter 4
78
4.4.5 Modeling Results
Similarly to Unold et al. (2009a), we selected a transport model with one kinetic
reversible and one kinetic irreversible sorption site. Sorption on the reversible site was
described assuming a first-order process and Freundlich-type sorption. The conceptual
model could describe most curves quite well (see Figures 4.4 and 4.5). The long tailing is
characteristic for chemical non-equilibrium processes and nonlinear sorption. The tailing
could not be described solely by assuming a fully kinetic process, however. It was also
necessary to consider nonlinearity of the sorption process by using low values of the
Freundlich exponent, β. Initial estimates of the Freundlich parameters were selected in a
way so that the tailing was described well. This was accomplished by choosing a
Freundlich exponent <0.44, similar to the findings of the previous studies of Wehrhan et al.
(2007) and Unold et al. (2009a). In the experiments of Kurwadkar et al. (2007), a linear
sorption isotherm was able to describe the sorption data of sulfonamides for concentrations
up to approximately 0.5 mg L−1. Concentrations of both the applied solution and the
manure were much higher (272 mg L−1) in our study. Because of the much wider
concentration range in our study, we can assume strong nonlinear sorption behavior.
4.4.5.1 Experiments with the SDZ solution
The modeling process for each experiment with the SDZ solution was split into
three parts, since it was not possible with HYDRUS-1D to simultaneously fit degradation
from SDZ into 4-OH-SDZ and 4-[2-iminopyrimidine-1(2H)-yl]-aniline. In the first run, the
BTCs of SDZ and 4-OH-SDZ were fitted without considering the profile data. In the
second model run, the same was done for 4-[2-iminopyrimidine-1(2H)-yl]-aniline. The
profile data were not included in these optimization runs since degradation into a particular
transformation product was compensated by an increase in irreversible SDZ sorption.
Irreversible sorption of the transformation products was fixed to zero since the rate of their
formation (degradation of SDZ) would have otherwise been influenced by this process. In
the third run, concentrations of the two transformation products were summed up and the
resulting BTC was fitted together with the BTC of SDZ and the 14C concentration profile
data. The degradation coefficient in this case refers to the sum of 4-OH-SDZ and 4-[2-
iminopyrimidine-1(2H)-yl]-aniline degradation. For all transformation products that
showed very low concentrations in the SDZ-solution experiments, we fixed the kinetic
4.4 Results & Discussion
79
sorption rate coefficient, α, at the very high value of 10 h−1, thus assuming that sorption was
basically an equilibrium process. This was done to reduce the number of optimized
parameters and to increase the reliability of the optimized sorption parameters, which had
in some cases large confidence intervals. Values of the Freundlich exponents for SDZ and
its transformation products were closely correlated with the Kf values and therefore were
fixed in optimization model runs to values that were needed to describe the tailing of the
BTCs. The model could describe the BTCs of SDZ and 4-OH-SDZ reasonably well, except
for the observed increase in the 4-OH-SDZ concentration after 10 pore volumes. There is a
clear difference between the two soils in terms of the Freundlich sorption coefficients for
SDZ (Table 4.5). While the Freundlich sorption coefficients for the silt loam are lower than
for the loamy sand, the Freundlich exponents are in a similar range. This indicates a lower
sorption capacity for the silt loam and reflects the earlier breakthrough in this soil. On the
other hand, the lower kinetic sorption rate reflects the slightly faster transport in Soil M.
Optimized Freundlich parameters for 4-OH-SDZ in the loamy sand produced an
isotherm with a much lower sorption capacity than for SDZ. No sorption parameters were
fitted for this transformation product for the silt loam because of very low observed
concentrations. Sorption capacities for 4-[2-iminopyrimidine-1(2H)-yl]-aniline were in a
similar range in both soils and for Soil K the sorption capacity for 4-[2-iminopyrimidine-
1(2H)-yl]-aniline was lower than for 4-OH-SDZ. Breakthrough curve tailing of 4-[2-
iminopyrimidine-1(2H)-yl]-aniline in both soils could not be described with the model,
although the Freundlich exponent was in a range low enough to describe the tailing of SDZ
and 4-OH-SDZ in the experiments with manure.
In the first model run to optimize the BTC parameters of 4-OH-SDZ and SDZ, the
profile data were considerably overestimated for both soils since the amount of SDZ that
degraded to form 4-[2-iminopyrimidine-1(2H)-yl]-aniline was added to irreversible
sorption. While the same tendency was observed for Soil K for the model run that
optimized the BTC parameters of SDZ and 4-[2-iminopyrimidine-1(2H)-yl]-aniline, this
run described the profile data best for Soil M. The reason is that the effect of 4-OH-SDZ
formation on irreversible sorption was negligible. Since the third model run included the
profile data (Figure 4.4), this run was expected to provide the best fits. While this was true
for Soil K, we overestimated data points in deeper layers of soil M. Increased irreversible
sorption to reduce the misfits between observed and simulated values in the top layer was
the reason for this overestimation. This effect was smaller for Soil K, where the difference
Chapter 4
80
between concentrations in the top and deeper soil layers was smaller. Average
concentrations in the soil profiles were captured reasonably well by the model, although the
sorption process was probably not correctly understood. This became obvious from the
opposite trends between the data and the model in the uppermost layers.
Compared with previous experiments with SDZ solutions (Unold et al., 2009a),
optimized values of the kinetic sorption rate coefficient, α, were higher, indicating that
kinetic sorption was faster when SDZ was incorporated directly into the soil. In several
cases, sorption was even close to equilibrium. Therefore, some BTCs could be fitted
reasonably well by assuming equilibrium reversible sorption, but in such cases the initial
increase in the BTCs was predicted less well.
4.4.5.2 Experiments with manure
For each experiment with manure, the BTCs of SDZ and its transformation products
were fitted simultaneously together with the concentration profile data below the uppermost
1 cm. Concentrations in the top 1 cm were significantly higher than in the rest of the soil
profile. We hypothesized that the high sorbed concentrations in the uppermost soil column
layers were the result of interactions between the organic material of the slurry and the soil
structure. We did not attempt to model these processes. Therefore, the two uppermost data
points in the profiles were not included in the objective function and hence we did not
expect that the high sorbed concentrations in the top of the soil columns would be
reproduced by the model. The Freundlich exponents for SDZ were fixed to values
optimized to experimental data with the SDZ solution to avoid large parameter correlations
with the Freundlich distribution coefficients. The kinetic sorption rate coefficients for the
transformation products were again fixed to 10 h−1 to decrease the number of parameters
and to increase parameter reliability. Since most BTCs of N-Ac-SDZ did not show much
tailing, its Freundlich exponent was fixed to one, thus assuming linear sorption in all soil
columns except for the repacked Soil M column treated with manure (MrepMAN). In
preliminary model runs, the tailing of 4-OH-SDZ concentrations was not captured well
since it was described by only a few data points. Therefore, we increased the weights on the
tailing concentrations compared with the data points in the peak according to Eq. [4.4]. For
Soil K, the Freundlich exponent was fitted for the repacked soil column with the manure
application and fixed for the undisturbed soil columns. For Soil M, this parameter was
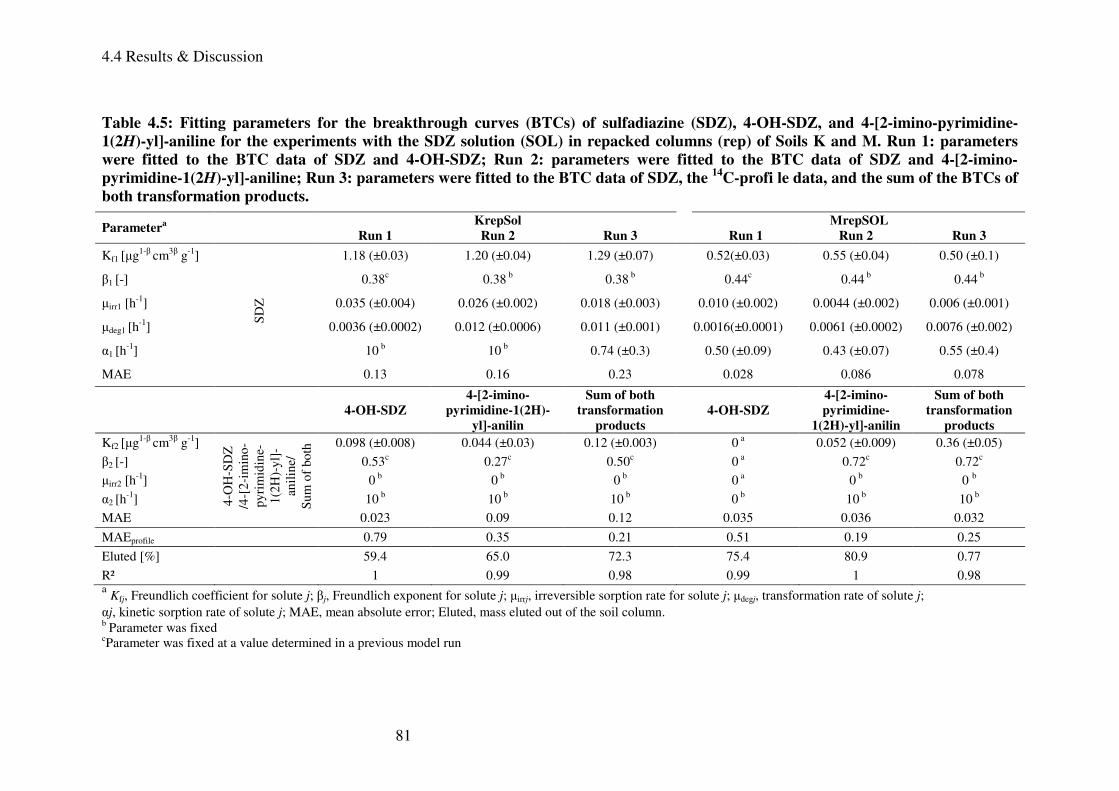
4.4 Results & Discussion
81
Table 4.5: Fitting parameters for the breakthrough curves (BTCs) of sulfadiazine (SDZ), 4-OH-SDZ, and 4-[2-imino-pyrimidine-
1(2H)-yl]-aniline for the experiments with the SDZ solution (SOL) in repacked columns (rep) of Soils K and M. Run 1: parameters
were fitted to the BTC data of SDZ and 4-OH-SDZ; Run 2: parameters were fitted to the BTC data of SDZ and 4-[2-imino-
pyrimidine-1(2H)-yl]-aniline; Run 3: parameters were fitted to the BTC data of SDZ, the 14
C-profi le data, and the sum of the BTCs of
both transformation products.
a Kfj, Freundlich coefficient for solute j; βj, Freundlich exponent for solute j; µirrj, irreversible sorption rate for solute j; µdegj, transformation rate of solute j; αj, kinetic sorption rate of solute j; MAE, mean absolute error; Eluted, mass eluted out of the soil column. b Parameter was fixed
cParameter was fixed at a value determined in a previous model run
KrepSol MrepSOL Parametera
Run 1 Run 2 Run 3 Run 1 Run 2 Run 3
Kf1 [µg1-β cm3β g-1] 1.18 (±0.03) 1.20 (±0.04) 1.29 (±0.07) 0.52(±0.03) 0.55 (±0.04) 0.50 (±0.1)
β1 [-] 0.38c 0.38 b 0.38 b 0.44c 0.44 b 0.44 b
µirr1 [h-1] 0.035 (±0.004) 0.026 (±0.002) 0.018 (±0.003) 0.010 (±0.002) 0.0044 (±0.002) 0.006 (±0.001)
µdeg1 [h-1] 0.0036 (±0.0002) 0.012 (±0.0006) 0.011 (±0.001) 0.0016(±0.0001) 0.0061 (±0.0002) 0.0076 (±0.002)
α1 [h-1] 10 b 10 b 0.74 (±0.3) 0.50 (±0.09) 0.43 (±0.07) 0.55 (±0.4)
MAE
S
DZ
0.13 0.16 0.23 0.028 0.086 0.078
4-OH-SDZ
4-[2-imino-pyrimidine-1(2H)-
yl]-anilin
Sum of both transformation
products 4-OH-SDZ
4-[2-imino-pyrimidine-
1(2H)-yl]-anilin
Sum of both transformation
products
Kf2 [µg1-β cm3β g-1] 0.098 (±0.008) 0.044 (±0.03) 0.12 (±0.003) 0 a 0.052 (±0.009) 0.36 (±0.05)
β2 [-] 0.53c 0.27c 0.50c 0 a 0.72c 0.72c
µirr2 [h-1] 0 b 0 b 0 b 0 a 0 b 0 b
α2 [h-1] 10 b 10 b 10 b 0 b 10 b 10 b
MAE
4-O
H-S
DZ
/4
-[2-
imin
o-py
rim
idin
e-1(
2H)-
yl]-
anil
ine/
S
um o
f bo
th
0.023 0.09 0.12 0.035 0.036 0.032
MAEprofile 0.79 0.35 0.21 0.51 0.19 0.25
Eluted [%] 59.4 65.0 72.3 75.4 80.9 0.77
R² 1 0.99 0.98 0.99 1 0.98
Chapter 4
82
fitted for each soil column separately, since no extended tailing for the 4-OH-SDZ BTC
was observed for the undisturbed column treated with manure (MundMAN).
The relatively low transformation rates from SDZ into 4-OH-SDZ as estimated from the
experimental data with the SDZ solution were used to model the experiments with manure.
A possible transformation reaction from 4-OH-SDZ into another product was not included
in the model, since no additional product was detected in the outflow samples. The model
with optimized parameters produced reasonable descriptions of the transport of SDZ and its
two transformation products for the experiments with manure. Four examples are presented
in Figure 4.5. Similarly as for the experiments with the SDZ solution, the SDZ sorption
capacity for the experiments with manure was lower for Soil M than for Soil K, but the
difference was smaller. The same tendency in Kf values as for SDZ was found for N-Ac-
SDZ, and partly also for 4-OH-SDZ, for which the soil column MrepMAN had a similar
Freundlich coefficient as the soil column KrepMAN. For 4-OH-SDZ, fitted Freundlich
exponents were similar as for SDZ but the Freundlich coefficients were lower, indicating a
lower sorption capacity for 4-OH-SDZ. On the other hand, the irreversible sorption rate
was higher for 4-OH-SDZ and thus the overall sorption may be similar. Since linear
sorption was found for N-Ac-SDZ in most soil columns, the sorption capacity was lower
than for SDZ only when the concentration was <8 µg cm−3. In our experiments, both higher
and lower concentrations were present. Fitted Freundlich coefficients for SDZ in the
experiments with manure were higher than for the experiments with the SDZ solution for
both soils, reflecting the slightly higher sorbed amounts in the experiments with manure.
For Soil K, the kinetic effect was more distinct for the experiments with manure than for
the experiments with the SDZ solution (Table 4.6). There was no clear difference in the
kinetic sorption rates α in the experiments with manure between the two soils. The 14C-
concentration profiles were described quite well in the deeper soil layers below the depth of
application, where they reached more or less constant values (Figure 4.7). Simulations for
cases where no profile data were included in the objective function led to similar results
(data not shown).
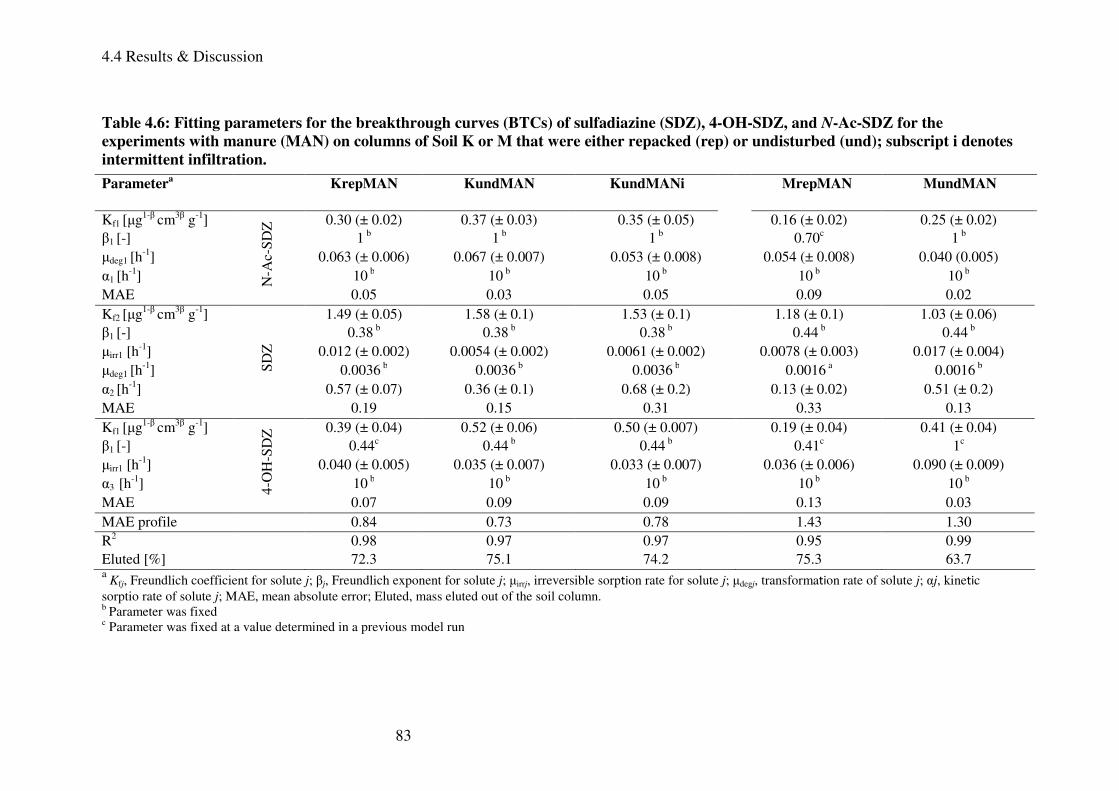
4.4 Results & Discussion
83
Table 4.6: Fitting parameters for the breakthrough curves (BTCs) of sulfadiazine (SDZ), 4-OH-SDZ, and N-Ac-SDZ for the
experiments with manure (MAN) on columns of Soil K or M that were either repacked (rep) or undisturbed (und); subscript i denotes
intermittent infiltration.
a Kfj, Freundlich coefficient for solute j; βj, Freundlich exponent for solute j; µirrj, irreversible sorption rate for solute j; µdegj, transformation rate of solute j; αj, kinetic
sorptio rate of solute j; MAE, mean absolute error; Eluted, mass eluted out of the soil column. b Parameter was fixed
c Parameter was fixed at a value determined in a previous model run
Parametera KrepMAN KundMAN KundMANi MrepMAN MundMAN
Kf1 [µg1-β cm3β g-1] 0.30 (± 0.02) 0.37 (± 0.03) 0.35 (± 0.05) 0.16 (± 0.02) 0.25 (± 0.02) β1 [-] 1 b 1 b 1 b 0.70c 1 b µdeg1 [h
-1] 0.063 (± 0.006) 0.067 (± 0.007) 0.053 (± 0.008) 0.054 (± 0.008) 0.040 (0.005) α1 [h
-1] 10 b 10 b 10 b 10 b 10 b MAE
N
-Ac-
SD
Z
0.05 0.03 0.05 0.09 0.02 Kf2 [µg1-β cm3β g-1] 1.49 (± 0.05) 1.58 (± 0.1) 1.53 (± 0.1) 1.18 (± 0.1) 1.03 (± 0.06) β1 [-] 0.38 b 0.38 b 0.38 b 0.44 b 0.44 b µirr1 [h
-1] 0.012 (± 0.002) 0.0054 (± 0.002) 0.0061 (± 0.002) 0.0078 (± 0.003) 0.017 (± 0.004) µdeg1 [h
-1] 0.0036 b 0.0036 b 0.0036 b 0.0016 a 0.0016 b α2 [h
-1] 0.57 (± 0.07) 0.36 (± 0.1) 0.68 (± 0.2) 0.13 (± 0.02) 0.51 (± 0.2) MAE
S
DZ
0.19 0.15 0.31 0.33 0.13 Kf1 [µg1-β cm3β g-1]
0.39 (± 0.04) 0.52 (± 0.06) 0.50 (± 0.007) 0.19 (± 0.04) 0.41 (± 0.04) β1 [-] 0.44c 0.44 b 0.44 b 0.41c 1c µirr1 [h
-1] 0.040 (± 0.005) 0.035 (± 0.007) 0.033 (± 0.007) 0.036 (± 0.006) 0.090 (± 0.009) α3 [h
-1] 10 b 10 b 10 b 10 b 10 b MAE
4-
OH
-SD
Z
0.07 0.09 0.09 0.13 0.03 MAE profile 0.84 0.73 0.78 1.43 1.30 R2 0.98 0.97 0.97 0.95 0.99 Eluted [%] 72.3 75.1 74.2 75.3 63.7
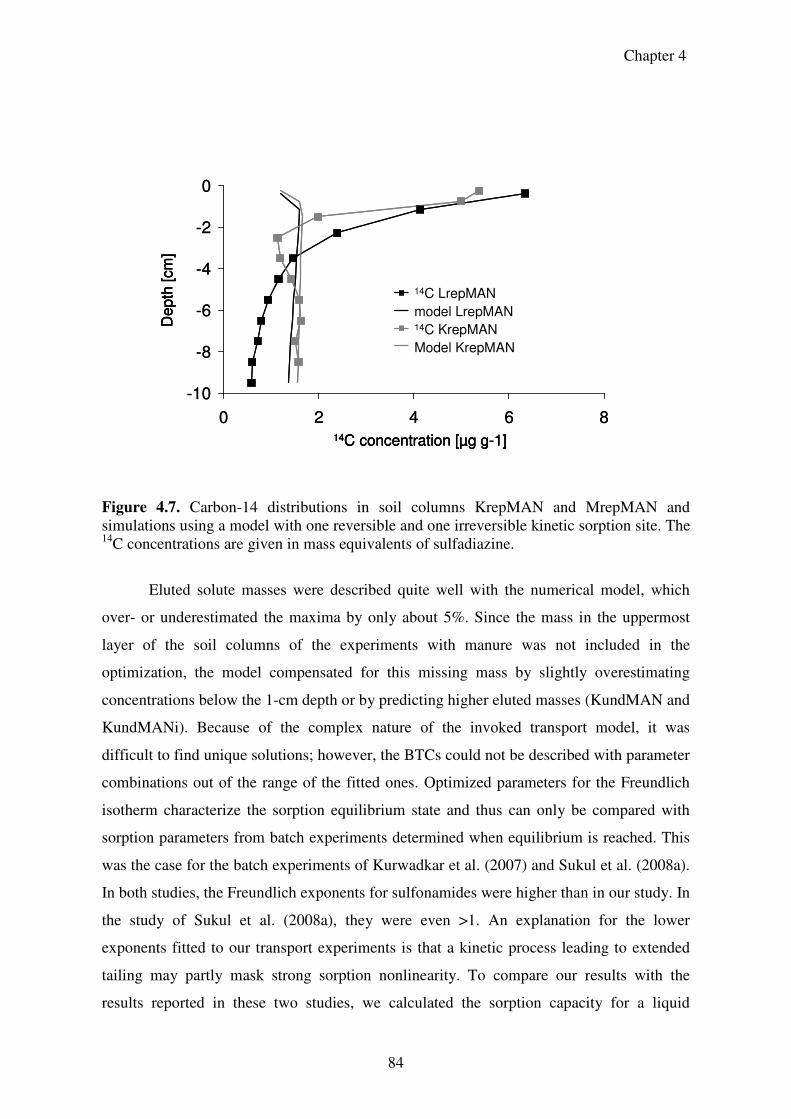
Chapter 4
84
-10
-8
-6
-4
-2
0
0 2 4 6 8
14C LrepMAN
model fit LrepM
14C SrepMAN
model fit SrepMAN
14C concentration [µg g-1]
Depth
[cm
]
14C LrepMAN
model LrepMAN14C KrepMAN
Model KrepMAN
-10
-8
-6
-4
-2
0
0 2 4 6 8
14C LrepMAN
model fit LrepM
14C SrepMAN
model fit SrepMAN
14C concentration [µg g-1]
Depth
[cm
]
14C LrepMAN
model LrepMAN14C KrepMAN
Model KrepMAN
14C concentration [µg g-1]
Depth
[cm
]
14C LrepMAN
model LrepMAN14C KrepMAN
Model KrepMAN
Figure 4.7. Carbon-14 distributions in soil columns KrepMAN and MrepMAN and simulations using a model with one reversible and one irreversible kinetic sorption site. The 14C concentrations are given in mass equivalents of sulfadiazine.
Eluted solute masses were described quite well with the numerical model, which
over- or underestimated the maxima by only about 5%. Since the mass in the uppermost
layer of the soil columns of the experiments with manure was not included in the
optimization, the model compensated for this missing mass by slightly overestimating
concentrations below the 1-cm depth or by predicting higher eluted masses (KundMAN and
KundMANi). Because of the complex nature of the invoked transport model, it was
difficult to find unique solutions; however, the BTCs could not be described with parameter
combinations out of the range of the fitted ones. Optimized parameters for the Freundlich
isotherm characterize the sorption equilibrium state and thus can only be compared with
sorption parameters from batch experiments determined when equilibrium is reached. This
was the case for the batch experiments of Kurwadkar et al. (2007) and Sukul et al. (2008a).
In both studies, the Freundlich exponents for sulfonamides were higher than in our study. In
the study of Sukul et al. (2008a), they were even >1. An explanation for the lower
exponents fitted to our transport experiments is that a kinetic process leading to extended
tailing may partly mask strong sorption nonlinearity. To compare our results with the
results reported in these two studies, we calculated the sorption capacity for a liquid
4.5 Conclusions
85
concentration of 1 µg cm−3 and compared it with the highest and lowest reported values.
The Freundlich sorption capacities in the batch studies were higher than in our study,
probably because in batch sorption experiments the process of irreversible sorption is not
considered separately.
4.5 Conclusions
The application of pig manure containing SDZ and its transformation products to
soil columns led to an accumulation of total 14C in the uppermost soil layers and resulted in
lower peak values of the 14C BTCs compared with experiments with a pure SDZ solution.
For the assumed experimental conditions, SDZ as well as its transformation products
showed a high potential for leaching. Co-transport with dissolved organic matter did not
seem to be a major transport mechanism for the solutes. The conceptual model with
degradation and one kinetic and one irreversible sorption site provided a good description
for most BTCs of SDZ and its transformation products 4-[2-iminopyrimidine-1(2H)-yl]-
aniline, N-Ac-SDZ, and 4-OH-SDZ. The 14C concentrations remaining in the soil columns
could not be predicted correctly for the experiments with the SDZ solution, which suggests
a sorption process that is not well understood. Transport parameters fitted to BTCs of
individual species (SDZ and its transformation products) revealed a lower sorption capacity
for the transformation products than for SDZ in the low concentration ranges. The N-Ac-
SDZ was rapidly transformed and did not show any patterns useful for characterizing SDZ
transport, such as an extended tailing of the BTCs or irreversible sorption. The transport
behavior of 4-OH-SDZ seemed to be similar to that of SDZ. The model also revealed a
higher sorption capacity for SDZ in the presence of manure.

86
87
5 Final Remarks
5.1 General discussion
The transport and transformation of SDZ in two agricultural soils was studied using
soil column experiments and numerical studies. While the experiments presented in
chapters 2 and 3 deal with the characteristic transport behavior of SDZ applied as a solution
via irrigation, the transport of SDZ and its transformation products in presence of manure
was investigated in chapter four. Analysis of the experimental data shows that a single
column experiment with specific boundary and application conditions is not sufficient to
understand the complex sorption behavior of SDZ. With the help of various experiments
differing in input concentration, flow conditions and mode of application, some important
factors which contribute to the overall understanding of the fate of SDZ in soils have been
identified.
The modeling of the experimental results showed that sorption behavior of SDZ was
time and concentration dependent requiring different modeling concepts. The term
“concentration” in this case refers to the outflow concentration which was mainly governed
by flow rate, the applied concentration or mass and the investigated soil. So in the
experiments with higher SDZ (outflow) concentrations (chapter 2 and 4) an isotherm-based
model using one reversible kinetic sorption site with Freundlich sorption and one
irreversible sorption site could describe the experiments quite well, whereas for the
experiments with lower outflow concentrations (chapter 3) the attachment detachment
approach with an additional parameter was needed, especially for the description of the
BTC tailings. For the experiments of chapter 4, where the applied (and outflow)
concentrations where highest, even a two site model with one sorption site in equilibrium
could describe the experiments reasonably well.
Figure 5.1 presents the measured 14C data of the BTC of soil K (chapter 2) described
with a two-site two rates (2S2R) Freundlich model together with various predictions of this
BTC using the fitted parameters of models used to describe different experiments. First,
predictions were made with parameters fitted to the corresponding experiment in soil M
with the same model. Second, the parameters of the attachment/detachment models fitted to
experiments conducted in undisturbed soil columns with lower flow rates and different
modes of application (chapter 3) were used for the description. Finally, the parameters of
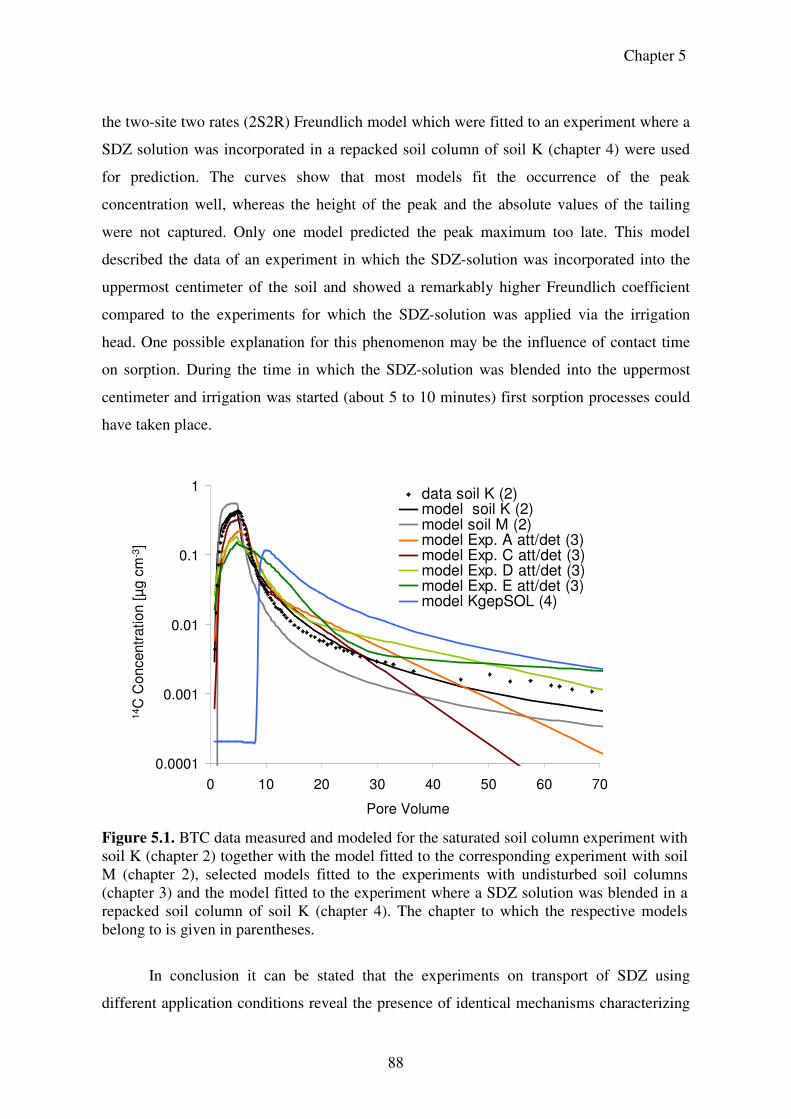
Chapter 5
88
the two-site two rates (2S2R) Freundlich model which were fitted to an experiment where a
SDZ solution was incorporated in a repacked soil column of soil K (chapter 4) were used
for prediction. The curves show that most models fit the occurrence of the peak
concentration well, whereas the height of the peak and the absolute values of the tailing
were not captured. Only one model predicted the peak maximum too late. This model
described the data of an experiment in which the SDZ-solution was incorporated into the
uppermost centimeter of the soil and showed a remarkably higher Freundlich coefficient
compared to the experiments for which the SDZ-solution was applied via the irrigation
head. One possible explanation for this phenomenon may be the influence of contact time
on sorption. During the time in which the SDZ-solution was blended into the uppermost
centimeter and irrigation was started (about 5 to 10 minutes) first sorption processes could
have taken place.
Figure 5.1. BTC data measured and modeled for the saturated soil column experiment with soil K (chapter 2) together with the model fitted to the corresponding experiment with soil M (chapter 2), selected models fitted to the experiments with undisturbed soil columns (chapter 3) and the model fitted to the experiment where a SDZ solution was blended in a repacked soil column of soil K (chapter 4). The chapter to which the respective models belong to is given in parentheses.
In conclusion it can be stated that the experiments on transport of SDZ using
different application conditions reveal the presence of identical mechanisms characterizing
0.0001
0.001
0.01
0.1
1
0 10 20 30 40 50 60 70
data soil K (2)model soil K (2)model soil M (2)model Exp. A att/det (3)model Exp. C att/det (3)model Exp. D att/det (3)model Exp. E att/det (3)model KgepSOL (4)
Pore Volume
14C
Concentr
ation
[µg c
m-3
]
5.2 The influence of soil properties
89
SDZ transport, although fitted sorption parameters and rates for the various experiments are
different. Important factors influencing SDZ transport are the flow rate, the applied
concentration/mass, the soil properties and also the way of application.
In the following paragraphs several points are discussed in more detail. Additionally, the
model is compared with other developed models for the fate of sulfonamides.
5.2 The influence of soil properties
Analysis of the BTCs measured in repacked soil columns of the silty loam and the
loamy sand showed a clear difference in total eluted amount of 14C. The amount eluted was
larger for the silty loam (soil M) than for the loamy sand (soil K). This suggests that
sulfadiazine is being sorbed to a lesser extent in the M soil which is also supported by the
modeling results. At the same time the sorbed amount in the uppermost cm of the soil
column profile were higher for soil M. The transport experiments which were conducted
with manure application showed comparable results. This means that on the one hand
transport in the silty loam soil is faster. This may be due to the higher pH value connected
with a higher part of the anionic species. On the other hand the process which led to the
accumulation of 14C in the uppermost soil layers (chapter 2) seems to be stronger for soil
M. The empirical model approaches showed that the prediction of the soil concentration
profile is mainly governed by the irreversible sorption process. According to the defined
fractions by Förster et al. (2009) and Zarfl (2008) this fraction could be subdivided in the
reversible bound residual fraction and the actual bound amount of substance. Either both or
one of this processes seems to be more intense in the loamy soil which may be caused by a
more diverse pore structure, a higher mineral surface area or the higher amount of soil
organic matter. While the more diverse pore structure would provide more space for
sequestration process, the organic substance is a partner for covalent binding.
A comparison with data from Förster et al. (2009) provides a hint that the pore
structure plays a role in the different results for the soils. In incubation experiments with
SDZ amended manure made with the same soils (sieved to 2 mm) the influence of the soil
type on the fate of SDZ was considered to be low. This was confirmed in the modeling of
the data and in almost equal apparent Kd values (Zarfl 2008) for the two soils. In the batch
Chapter 5
90
techniques the influence of different pore structures is supposed to be low, whereas it may
lead to a higher contact area in transport experiments.
Based on experiments with disturbed soil columns of soil M and K (chapter 2),
which correspond to one scenario in the work of Wehrhan et al. (2007), the two soils used
in this thesis can be also compared to a silty loam soil from Greifensee (Wehrhan et al.,
2007). These authors found that the leached amounts were lower under similar boundary
conditions as used in chapter 2. The silty loam used in the study of Wehrhan et al. (2007)
had higher clay and organic carbon contents, whereas the pH-vale was with 6.1 was close to
the pH values of the investigated soils. The difference in eluted amounts shows that clay
and organic carbon content influence SDZ transport. This may also cause the different
reaction as the same amount of SDZ is applied in a higher concentration (chapter 3): While
in chapter 3 an increase of the eluted amount in soil K was observed, the eluted amount
decreased strongly in the experiments of Wehrhan et al. (2007). This may be explained with
a higher sorption capacity in the soil from Greifensee. The role of organic carbon on
sorption is also shown in the sorption experiments of Sukul et al. (2008a). In one of their
five experiments the content of organic carbon was more than two times higher compared
to the other soils connected with a lower pH value. In this soil the determined sorption
coefficients were remarkably higher than in the other soils. But the order of decreasing
sorption does not follow only one parameter. The second highest sorption was found in a
soil with high clay content but a relatively low content of organic carbon and a high pH-
value. Also transformation processes depend on the soil properties. Transformation was
higher in the loamy sand than in silty loam soil. Since these transformation processes are
not yet fully understood no explanation can be given at this stage.
5.3 Description of profile data
The description of the vertical 14C-distribution in the various soil columns was also
one aim of this thesis. Therefore, two empirical model approaches were applied to describe
the concentration profiles. While the description could be improved with the applied
models, the governing process could not be identified. This lack of fitting the SDZ
concentration profiles was also raised in the study of Wehrhan et al. (2007).
5.4 Transport behavior of the transformation products
91
In experiments run with undisturbed soil columns at a lower flow rate different
patterns for the 14C-concentration profiles were found (chapter 3). There, the 14C-
concentration decreased also within the first centimeters, but the differences in
concentrations were less pronounced and the concentration profiles were generally more
curved. One reason for the different patterns may be the usage of undisturbed and
unsaturated soil columns, meaning that the probability for 14C to reach areas with lower
flow velocities and be subject to subsequent binding processes may be higher. Another
impact factor may the pH value of the input solutions. In the experiments of Wehrhan et al.
(2007) and Unold et al. (2009a) the SDZ application solution (in CaCl2) was directly
applied onto soil, whereas in the experiments in chapter 4 the pH-value of the application
solution was buffered to the pH-value of the background CaCl2 solution (~5.6). Indeed the
specific effect of the change in pH values is unknown.
In almost all transport experiments with soil K an increase in resident concentrations
within the soil column profiles was observed but not in the experiments with soil M. One
possible explanation could be the development of a strong sorbing transformation product.
As experiments of chapter 2 and 3 revealed, transformation was higher in soil K. In future
experiments this could be possibly checked using extraction procedures of the soil after
finishing the leaching experiments.
5.4 Transport behavior of the transformation products
For experiments with SDZ-solution a transformation from SDZ into An-SDZ and 4-
OH-SDZ was shown for both soils. The parts of transformation products in the outflow of
the soil columns were different (13.8-38.3%) throughout the various experiments and seem
to be dependent on concentration and soil properties.
The transport of the main transformation products present in pig manure (N-Ac-SDZ and 4-
OH-SDZ) was studied using the experiments with manure application. Transport
parameters fitted to the BTCs of individual species (SDZ and its transformation products)
using a conceptual model with one kinetic and one irreversible sorption site as well as a
degradation chain from N-Ac-SDZ to SDZ and from SDZ to 4-OH-SDZ revealed a lower
sorption capacity for the transformation products than for SDZ in low concentration ranges.
In the case of 4-OH-SDZ the lower sorption capacity could be confirmed with the
experiments with SDZ-solution. The transport behavior of 4-OH-SDZ seems to be similar
Chapter 5
92
as for SDZ having BTCs with an extended tailing. The same was true for An-SDZ for
which lower sorption capacities than for 4-OH-SDZ were found. N-Ac-SDZ on the other
hand was rapidly transformed and did not show patterns which proved to be characteristic
for SDZ-transport, like an extended tailing of the BTCs or irreversible sorption. This was a
hint that not only the irreversible sorption of SDZ but also reversible processes
characteristic for the sorption and transport behavior of SDZ are mainly dominated by the
NH2-moiety of SDZ. This hypothesis is supported by the description of aniline sorption by
Kosson & Byrne (1995) who described a process occurring in two steps: First a very rapid
process occurs which was attributed to ionic binding on cation exchange sites. Then
covalent bonds with soil organic matter are developed.
5.5 Comparison of the transport model for SDZ and its main transformation products with other existing models
In chapter 4 a model was developed that comprises the simultaneous transport of
SDZ and its main metabolites in pig manure including transformation processes and
different sorption properties for the three solutes. Based on the sorption experiments and
following sequential extraction steps of Förster et al. (2009) a similar model was developed
by Zarfl (2008) where comparable pig manure was applied to the same two soils. This
model includes three compartments for SDZ: One compartment, called the available
fraction, comprises the SDZ and metabolite fractions that could be extracted using CaCl2
and methanol as solvents. These parts represent the amounts of solutes present in solution
as well as sorbed amounts that were not yet subject to sequestration. The second
compartment, the residual fraction, contains the amount of solutes that was sequestered by
reversible processes and could be extracted with a harsher extraction method (acetonitrile-
water, microwave). The third fraction is the irreversibly sorbed amount that was defined as
not extractable with the applied methods.
For the description of the available fraction instantaneous equilibrium sorption is
considered implicitly by Zarfl et al. (2008). This compartment includes the dissolved and
kinetically sorbed amounts of SDZ in the transport model used in chapter 4. There the three
compartments (dissolved, reversibly sorbed and irreversibly sorbed) are based on the results
of the modeling process. The assumption of equilibrium sorption of Zarfl et al. (2008)
supports the finding of a very fast kinetic rate coefficient for reversible kinetic sorption
5.6 General Conclusions
93
compared to a previous study (chapter 2), even if sorption is considered as non-linear
Freundlich sorption there. The irreversibly sorbed amount in the transport model comprised
both the residual and the irreversibly sorbed amount of the sorption model.
As is described by Zarfl (2008), the structure of the sorption model and transport models
can also be compared to the models with 3 sorption sites used by Wehrhan et al. (2007) and
in the experiments presented in chapter 3.
The residual fraction, defined by Förster et al. (2009) as the amount of SDZ which
can be extracted with a water acetonitrile mixture and subsequent microwave extraction,
possibly provides the amount of SDZ which is eluted from the soil columns in the transport
experiments step by step. This part may become visible in the long tailing of SDZ BTCs
(Wehrhan et al., 2007, chapter 2 & 3) and in the observed desorption in batch experiments
(Wehrhan et al., 2009). However, soil columns where only eluted with CaCl2, and it is not
clear how much of the residual fraction can thus be extracted. Furthermore the BTC tailings
may also be partly attributed to the non-linear sorption behavior of SDZ. Therefore, the
respective sites in the sorption and transport models can not be related one to one.
In general the comparison of the models reveals that the fraction which provides a
reversibly bound but not easily extractable part of SDZ seems to be very important to
describe the sorption and transport of SDZ. This is supported by the fact that a three
sorption site model was needed to properly describe the observed BTCs showing a
pronounced tailing. In transport experiments the quantification of this fraction using
extraction methods could possibly be helpful.
5.6 General Conclusions
Flow rate, applied concentration, application conditions, pig manure as well as the
soil properties affect SDZ transport. The concentration dependent sorption behavior of SDZ
led to different appropriate model concepts. A two-site isotherm based model including one
reversible kinetic sorption site was able to describe the experiments conducted at higher
concentrations, whereas a three site attachment-detachment model was needed to describe
the experiments with a lower concentration range. However, both models had to capture the
BTC tailings which are caused either by the non-linear sorption behavior of SDZ or by
kinetic processes.
Chapter 5
94
Modeling revealed a higher mobility for all transformation products than for the
parent compound SDZ. While the shapes of the BTCs for An-SDZ and 4-OH-SDZ are
similar to the BTCs of SDZ, the BTC of N-Ac-SDZ does not show the extended tailing
which hints on an influence of the aniline-moiety on the long term reversible sorption of
SDZ.
The prediction of one BTC using the parameters from other BTCs reveals that the
overall shape and in most cases also the peak maximum or arrival can be predicted
correctly. This shows that the same sorption mechanisms occur. However, peak heights and
tailings could not be captured which may be caused by i) an inappropriate model concept to
describe the transport, or ii) unknown influence factors on transport.
In conclusion it can be stated that the experiments helped to understand the transport
behavior of SDZ, but that the processes which govern SDZ sorption in detail are still not
sufficiently understood.
5.7 Outlook
For the future prediction of SDZ transport, the processes that govern the sorption
mechanisms need to be understood better. Applying extraction procedures to the soil after
the leaching experiments could clarify whether the sorbed amount of 14C is present as SDZ
or in the form of transformation products. Fractionation of the soil and identification of the
soil organic matter can help to identify the most important sorption sites for SDZ during
transport. To be able to study the transport of SDZ without the interference of
transformation processes transport experiments in sterilized soil could be helpful. Also the
kind of application seems to be important, since higher Freundlich coefficients were
observed in the experiments where SDZ was blended into the soil columns. For the
prediction of SDZ transport in the field, also the influence of transient flow conditions as
well as multiple application times has to be determined.
95
6 References
Baek, D.S., Kim, S.B. and D.J. Kim. 2003. Irreversible sorption of benzene in sandy aquifer
materials. Hydrological Processes 17 (6), 1239-1251
Batt, A., S. Kim, I.B. Bruce and D.S. Aga. 2006. Determination of antibiotics within
various wastewater treatment plants and the impact of their discharges on
surrounding surface waters. Abstracts of Papers American. Chemical Society, 231,
151-ENVR
Berger, K., Petersen, B. and H.B. Pfaue. 1986. Persistenz von Gülle-Arzneistoffen in der
Nahrungskette. Archiv für Lebensmittelchemie. 37, 99-102 Bergmann, A., R. Fohrmann and A. Hembrock-Heger. 2008. Bewertung der
Umweltrelevanz von Arzneistoffen. Umweltwissenschaften und Schadstoff-
Forschung, 20, 197-298
Bialk, H.M., Hedmann, C., Castillo, A. and J. Pedersen. 2007. Laccase-Mediated Michael
Addition of 15N-Sulfapyridine to a Model Humic Constituent. Environmental
Science and Technology, 41 (10), 3593-3600
Bialk, H.M. and J.A. Pedersen. 2008. NMR investigation of enzymatic coupling of
sulfonamide antimicrobials with humic substances. Environmental Science and
Technology, 42, 106-112
Blackwell, P., P. Kay and A.B.A. Boxall. 2007. The dissipation and transport of veterinary
antibiotics in a sandy loam soil. Chemosphere, 67, 292-299
Boreen, A., 2005. Triplet-sensitized photodegradation of sulfa drugs containing six-
membered heterocyclic groups: Identification of an SO2 extrusion photoproduct.
Environmental Science & Technology, 39 (10), 3630-3638
Boxall, A.B.A., Blackwell, P., Cavallo, R., Kay, P. and J. Tolls. 2002. The sorption and
transport of a sulphonamide antibiotic in soil systems. Toxicology Letters, 131 (1-
2), 19-2
Boxall, A.B.A. 2004. The environmental side effects of medication - How are human and
veterinary medicines in soils and water bodies affecting human and environmental
health? Embo Reports, 5, 1110-1116
Bradford, S.A., Yates, S.R., Bettahar, M. and J. Šimůnek. 2002. Physical factors affecting
the transport and fate of colloids in saturated porous media. Water Resources
Research, 38 (12), doi: 10.1029/2002WR001340
Chapter 6
96
Bradford, S., Y.F. Tadassa and Y. Pachepsky. 2006. Transport of Giardia and Manure
Suspensions in Saturated Porous Media. Journal of Environmental Quality, 35, 749-
757
Braida, W.J., J.C. White, F.J. Ferrandino and J.J. Pignatello. 2001. Effect of solute
concentration on sorption of polyaromatic hydrocarbons in soil: Uptake rates.
Environmental Science and Technology, 35, 2765-2772
Brusseau, M.L. and P.S.C. Rao. 1989. Sorption Nonideality during Organic Contaminant
Transport in Porous-Media. Critical Reviews in Environmental Control, 19 (1), 33-
99
Brusseau, M.L. 1992. Nonequilibrium Transport of Organic-Chemicals - the Impact of
Pore-Water Velocity. Journal of Contaminant Hydrology, 9, 353-368
Burkhardt, M., C. Stamm, C. Waul, H. Singer and S. Muller. 2005. Surface runoff and
transport of sulfonamide antibiotics and tracers on manured grassland. Journal of
Environmental Quality, 34, 1363-1371
Burkhardt, M. and C. Stamm. 2007. Depth distribution of sulfonamide antibiotics in pore
water of an undisturbed loamy grassland soil. Journal of Environmental Quality, 36,
588-596
Casey, F.X.M., H. Hakk, J. Šimůnek and G.L. Larsen. 2004. Fate and transport of
testosterone in agricultural soils. Environmental Science and Technology, 38, 790-
798
Casey, F.X.M., G.L. Larsen, H. Hakk and J. Šimůnek. 2003. Fate and transport of 17 beta-
estradiol in soil-water systems. Environmental Science and Technology, 37, 2400-
2409
Casey, F.X.M. and J. Šimůnek. 2001. Inverse analyses of transport of chlorinated
hydrocarbons subject to sequential transformation reactions. Journal of
Environmental Quality, 30, 1354-1360
Casey, F.X.M., J. Šimůnek, J. Lee, G.L. Larsen and H. Hakk. 2005. Sorption, mobility, and
transformation of estrogenic hormones in natural soil. Journal of Environmental
Quality, 34, 1372-1379
Christian, T., Schneider, R.J., Farber, H.A., Skutlarek, D., Meyer, M.T. and H.E. Goldbach.
2003. Determination of antibiotic residues in manure, soil, and surface waters. Acta
Hydrochimica Et Hydrobiologica, 31 (1), 36-44
References
97
Das, B.S., L.S. Lee, P.S.C. Rao and R.P. Hultgren. 2004. Sorption and degradation of
steroid hormones in soils during transport: Column studies and model evaluation.
Environmental Science and Technology, 38, 1460-1470
Davis, J.G., Truman, C.C., Kim, S.C., Ascough, J.C. and K. Carlson. 2006. Antibiotic
transport via runoff and soil loss. Journal of Environmental Quality, 35 (6), 2250-
2260
Deng, J.C., X. Jiang, X.X. Zhang, W.P. Hu and J.W. Crawford. 2008. Continuous time
random walk model better describes the tailing of atrazine transport in soil.
Chemosphere, 71, 2150-2157
de Jonge, L., C. Kjaergaard and P. Moldrup. 2004. Colloids and colloid-faciliated transport
of contaminants in soils: An introduction. Vadose Zone Journal, 3, 321-325
Diaz-Cruz, M. and D. Barcelo. 2006. Determination of antimicrobial residues and
metabolites in the aquatic environment by liquid chromatography tandem mass
spectrometry. Analalytical and Bioanalytical Chemistry, 386, 973-985
Doherty, J., 2002. PEST: Model-independent parameter estimation v4. Watermark
Numerical Modeling.
Dolliver, H., Kumar, K. and S. Gupta. 2007. Sulfamethazine uptake by plants from manure-
amended soil. Journal of Environmental Quality, 36 (4), 1224-1230
Drillia, P., Stamatelatou, K. and G. Lyberatos. 2005. Fate and mobility of pharmaceuticals
in solid matrices. Chemosphere, 60 (8), 1034-1044
Fan, Z.S., Casey, F.X.M., Hakk, H. and G.L. Larsen. 2007. Discerning and modeling the
fate and transport of testosterone in undisturbed soil. Journal of Environmental
Quality, 36 (3), 864-873
Focazio, M.J., D.W. Kolpin, K.K. Barnes, E.T. Furlong, M.T. Meyer, S.D. Zaugg, L.B.
Barber, and M.E. Thurman. 2008. A national reconaissance for pharmaceuticals and
other organic wastewater contaminants in the United States - II) Untreated drinking
water resources. Science of the total Environment, 402, 201-216
Förster, M., Laabs, V., Lamshöft, M., Pütz, T. and W. Amelung. 2008. Analysis of aged
sulfadiazine residues in soils using microwave extraction and liquid
chromatography tandem mass spectrometry. Analytical and Bioanalytical
Chemistry, 391 (3), 1029-1038
Förster, M., Laabs, V., Lamshöft, M. Groeneweg, J. Zühlke, S, Spiteller M., Krauss, M.,
Kaupenjohann, M. and W. Amelung. 2009: Sequestration of Manure-Applied
Chapter 6
98
Sulfadiazine Residues in Soils. Environmental Science and Technology, 43, 1824-
1830
Gao, J.A. and J.A. Pedersen. 2005. Adsorption of sulfonamide antimicrobial agents to clay
minerals. Environmental Science & Technology, 39 (24), 9509-9516
Hammesfahr, U., Heuer, H., Manzke, B., Smalla, K. and S. Thiele-Bruhn. 2008. Impact
of the antibiotic sulfadiazine and pig manure on the microbial community
structure in agricultural soils. Soil Biology & Biochemistry. 40 1583-1591
Hamscher, G., Pawelzick, H.T., Hoper, H. and H. Nau. 2005. Different behavior of
tetracyclines and sulfonamides in sandy soils after repeated fertilization with liquid
manure. Environmental Toxicology and Chemistry, 24 (4), 861-868
Hanson, B.R., J. Šimůnek and J.W. Hopmans. 2006. Evaluation of urea-ammonium-nitrate
fertigation with drip irrigation using numerical modeling. Agricultural Water
Management, 86, 102-113
Heise, J., S. Höltge, S. Schrader and R. Kreuzig. 2006. Chemical and biological
characterization of non-extractable residues in soil. Chemosphere, 65, 2352-2357
Hesketh, N., P.C. Brookes and T.M. Addiscott. 2001. Effect of suspended soil material and
pig slurry on the facilitated transport of pesticides, phosphate and bromide in sandy
soil. European Journal of Soil Science, 52, 287-296
Heuer, H. and K. Smalla. 2007. Manure and sulfadiazine synergistically increased bacterial
antibiotic resistance in soil over at least two months. Environmental Microbiology,
9 (3), 657-666
Hilton, M.J. and K.V. Thomas. 2003. Determination of selected human pharmaceutical
compounds in effluent and surface water samples by high-performance liquid
chromatography-electrospray tandem mass spectrometry. Journal of
Chromatography A, 1015, 129-141
Höper, H., Kues, J., Nau, H., and G. Hamscher. 2002. Eintrag und Verbleib von
Tierarzneimitteln in Böden. Bodenschutz, 4, 141-148
Jarvis, N.J., K.G. Villholth and B. Ulen. 1999. Modelling particle mobilization and leaching
in macroporous soil. European Journal of Soil Science, 50, 621-632
Jørgensen, S.E. and B. Halling-Sørensen. 2000. Drugs in the environment. Chemosphere,
40 (7), 691-699
References
99
Kahle, M. and C. Stamm. 2007a. Time and pH-dependent sorption of the veterinary
antimicrobial sulfathiazole to clay minerals and ferrihydrite. Chemosphere. 68,
1224-1231
Kahle, M. and C. Stamm. 2007b. Sorption of the veterinary antimicrobial sulfathiazole to
organic materials of different origin. Environmental Science & Technology, 41 (1),
132-138
Kan, A.T., Fu, G., Hunter, M., Chen, W., Ward, C.H. and M.B. Tomson. 1998. Irreversible
sorption of neutral hydrocarbons to sediments: Experimental observations and
model predictions. Environmental Science & Technology. 32 (7), 892-902
Kay, P., Blackwell, P.A. and A.B.A. Boxall. 2004. Fate of veterinary antibiotics in a
macroporous tile drained clay soil. Environmental Toxicology and Chemistry, 23
(5), 1136-1144
Kay, P., Blackwell, P.A. and A.B.A. Boxall. 2005a. Column studies to investigate the fate
of veterinary antibiotics in clay soils following slurry application to agricultural
land. Chemosphere, 60 (4), 497-507
Kay, P., P.A. Blackwell and A.B.A. Boxall. 2005b. A lysimeter experiment to investigate
the leaching of veterinary antibiotics through a clay soil and comparison with field
data. Environmental Pollution, 134, 333-341
Kemper, N., 2008. Veterinary antibiotics in the aquatic and terrestrial environment.
Ecological indicators, 8 (1), 1-13
Kim, S.B., H.C. Ha, N.C. Choi and D.J. Kim. 2006. Influence of flow rate and organic
carbon content on benzene transport in a sandy soil. Hydrological Processes, 20,
4307-4316
Kools, S.A.E., Moltmann, J.F., and T. Knacker. 2008. Estimating the use of veterinary
medicines in the European union. Regulatory Toxicology and Pharmacology, 50,
59-65
Kosson, D.S. and S.V. Byrne. 1995. Interactions of Aniline with Soil and Groundwater at
an Industrial Spill site. Environmental Health Perspectives, 103, 00-00 (Suppl 5)
Kotzerke, A., Sharma, S., Schauss, K., Heuer, H., Thiele-Bruhn, S., Smalla, K., Wilke,
B-M. and M. Schloter. 2008. Alterations in soil microbial activity and N-
transformation processes due to sulfadiazine loads in pig-manure. Environmental
Pollution. 153, 315-322
Chapter 6
100
Kretzschmar, R. 1994. Filter Efficiency of 3 Saprolites for natural Clay and Iron-Oxide
Colloids. Environmental Science and Technology, 28, 1907-1915
Kreuzig, R., Kullmer, C., Matthies, B., Höltge, S. and H. Dieckmann. 2003. Fate and
behaviour of pharmaceutical residues in soils. Fresenius Environmental Bulletin, 12
(6), 550-558
Kreuzig, R. and S. Höltge. 2005. Investigations on the fate of sulfadiazine in manured soil:
Laboratory experiments and test plot studies. Environmental Toxicology and
Chemistry, 24 (4), 771-776
Kreuzig, R., S. Holtge, J. Brunotte, N. Berenzen, J. Wogram and R. Schulz. 2005. Test-plot
studies on runoff of sulfonamides from manured soils after sprinkler irrigation.
Environmental Toxicology and Chemistry, 24, 777-781
Kurwadkar, S.T., Adams, C.D., Meyer, M.T. and D.W. Kolpin. 2007. Effects of sorbate
speciation on sorption of selected sulfonamides in three loamy soils. Journal of
Agricultural and Food Chemistry, 55 (4), 1370-1376
Lamshöft, M., Sukul, P., Zühle, S. and M. Spiteller. 2007. Metabolism of 14C-labelled and
non-labelled sulfadiazine after administration to pigs. Analytical and Bioanalytical
Chemistry, 388 (8), 1733-1745
Löscher, W., Ungemach, R. and R. Kroker. 1994.Grundlagen der Pharmakotherapie bei
Haus- und Nutztieren-2., neubearbeitete und erweiterte Auflage, mit 13
Abbildungen und 80 Tabellen. Paul Parey
Loftin, K.A., C.D. Adams, M.T. Meyer and R. Surampalli. 2008. Effects of ionic strength,
temperature, and pH on degradation of selected antibiotics. Journal of Environental
Quality, 37, 378-386
Managaki, S., A. Murata, H. Takada, B.C. Tuyen and N.H. Chiem. 2007. Distribution of
macrolides, sulfonamides, and trimethoprim in tropical waters: Ubiquitous
occurrence of veterinary antibiotics in the Mekong Delta. Environmental Science
and Technology, 41, 8004-8010
McGechan, M.B. and D.R. Lewis. 2002. Transport of particulate and colloid-sorbed
contaminants through soil, part 1: General principles. Biosystems Engineering, 83,
255-273
Martinez-Carballo E., G.-B.C., Scharf S., and O. Gans. 2007. Environmental monitoring
study of selected veterinary antibiotics in animal manure and soils in Austria.
Environmental Pollution, 148, 570-579
References
101
Mazel, D. and J. Davies. 1998. Antibiotic resistance - The big picture. Resolving the
Antibiotic Paradox, 456, 1-6
Nobel Lectures. 1965. Physiology or Medicine 1922-1941. Elsevier Publishing Company.
Amsterdam
Nouws, J.F.M., Mevius, D., Vree, T.B. and M. Degen. 1989. Pharmacokinetics and Renal
Clearance of Sulfadimidine, Sulfamerazine and Sulfadiazine and Their N4-Acetyl
and Hydroxy Metabolites in Pigs. Veterinary Quarterly, 11 (2), 78-86
Pailler, J.-Y., Krein, A., Pfister, L., Hoffmann, L., and C. Guignard. 2009. Solid phase
extraction coupled to liquid chromatography-tandem mass spectrometry analysis of
sulfonamides, tetracyclines, analgesics and hormones in surface water and
wastewater in Luxembourg. Science of the total Environment. 407, 4736-4743
Pang, L. and J. Šimůnek. 2006. Evaluation of bacteria-facilitated cadmium transport in
gravel columns using the HYDRUS colloid-facilitated solute transport model.
Water Resources Research, 42, W12S10
Papiernik, S.K., S.R. Yates, W.C. Koskinen and B. Barber. 2007. Processes affecting the
dissipation of the herbicide isoxaflutole and its diketonitrile metabolite in
agricultural soils under field conditions. Journal of .Agricultural and Food
Chemistry, 55, 8630-8639
Park, JH., YC. Feng, SY Cho, TC Voice and SA Boyd. 2004. Sorbed atrazine shifts into
non-desorbable sites of soil organic matter during aging. Water Research, 18, 3881-
3892
Pignatello, J.J. and B.S. Xing. 1996. Mechanisms of slow sorption of organic chemicals to
natural particles. Environmental Science & Technology, 30 (1), 1-11
Rooklidge, S.J. 2004. Environmental antimicrobial contamination from terraccumulation
and diffuse pollution pathways. Science of the Total Environment, 325, 1-13
Sacher, F., Lange, F.T., Brauch, H.-J., and I. Blankenhorn. 2001. Pharmaceuticals in
groundwaters - analytical methods and results of a monitoring program in Baden-
Würtemberg, Germany. Journal of Chromatograhy A, 938, 199-210
Sakurai, H. and T. Ishimitsu. 1980. Microionization constants of sulphonamides. Talanta,
27, 293-298
Schaerlaekens, J., D. Mallants, J. Šimůnek, M.T. van Genuchten and J. Feyen. 1999.
Numerical simulation of transport and sequential biodegradation of chlorinated
aliphatic hydrocarbons using CHAIN_2D. Hydrological Processes, 13, 2847-2859
Chapter 6
102
Schmidt, B., J. Ebert, M. Lamshoft, B. Thiede, R. Schumacher-Buffel, R. Ji, P.F.X. Corvini
and A. Schaeffer. 2008. Fate in soil of C-14-sulfadiazine residues contained in the
manure of young pigs treated with a veterinary antibiotic. Journal of Environmental
Science and Health B, 43, 8-20
Schwarzenbach, R.P., Geschwend, P.M. and D.M. Imboden. 2003. Environmental Organic
Chemistry (second ed.). John Wiley & Sons. New Jersey.
Šimůnek, J., D. Jacques, M.T. van Genuchten and D. Mallants. 2006. Multicomponent
geochemical transport modeling using HYDRUS-1D and HP1. Journal of the
American Water Resources Association, 42, 1537-1547
Šimůnek, J., Huang, K. and M.T. Van Genuchten. 1998. The Hydrus code for simulating
the movement of water, heat and multiple solutes in variably saturated media.
Version 6.0. , U.S. Salinity Laboratory, Agricultural Research Service US
Department of Agriculture, Riverside, California, Research Report, vol 144
Šimůnek, J., H. Sejna, M. Saito, M. Sakai and M.T. van Genuchten, 2008. The Hydrus-1D
Software Package for Simulating the One-Dimensional Movement of Water, Heat,
and Multiple Solutes in Variably-Saturated Media. Version 4.0. Department of
Environmental Sciences, University of California Riverside, Riverside, California.
Srivastava, P.; S.M. Sanders, J.H. Dane, Y. Feng, J.Basile and M.I. Barnett. 2009. Fate and
Transport of Sulfadimethoxine and Ormetoprim in Two Southeastern Unites States
Soils. Vadose Zone Journal, 8, 32-41
Stoob, K., H.P. Singer, S.R. Mueller, R.P. Schwarzenbach and C.H. Stamm. 2007.
Dissipation and transport of veterinary sulfonamide antibiotics after manure
application to grassland in a small catchment. Environmental Science and
Technology, 41, 7349-7355
Sukul, P., M. Lamshöft, S. Zuhlke and M. Spiteller. 2008a. Sorption and desorption of
sulfadiazine in soil and soil-manure systems. Chemosphere, 73, 1344-1350
Sukul, P., Lamshöft, M., Zühlke, S. and M. Spiteller. 2008b. Photolysis of C14-sulfadiazine
in water and manure. Chemosphere, 71 (4), 717-725
Tamtam, F., Mercier, F., Le Bot, B., Eurin, J., Dinh, Quoc T., Clement, M. and M.
Chevreuil. 2008. Occurrence and fate of antibiotics in the Seine River in various
hydrological conditions. Science of the total environment. 393 84-95
Thiele-Bruhn,S. 2003. Pharmaceutical antibiotic compounds in soils – a review. Journal of
Plant Nutrition and Soil Science, 166, 145-167
References
103
Thiele-Bruhn, S. and M.O. Aust. 2004. Effects of pig slurry on the sorption of sulfonamide
antibiotics in soil. Archives of Environmental Contamination and Toxicology, 47,
31-39
Thiele-Bruhn, S., Seibicke, T., Schulten, H.R. and P. Leinweber. 2004. Sorption of
sulfonamide pharmaceutical antibiotics on whole soils and particle-size fractions.
Journal of Environmental Quality, 33 (4), 1331-1342
Toride, T., F.J. Leij and M.T. van Genuchten. 1999. The CXTFIT code for estimating
transport parameters from laboratory or field tracer experiments. Version 2.1. US
Salinity Laboratory, Agricultural Research Service US Department of Agriculture,
Riverside, California, Research Report, vol 137.
Turku, I., Sainio, T. and E. Paatero. 2007. Thermodynamics of tetracycline adsorption on
silica. Environmental Chemistry Letters 5 (4), 225-228.
Unold, M., R. Kasteel, J. Groeneweg and H. Vereecken. 2009a. Transport and
transformation of sulfadiazine in soil columns packed with a silt loam and a loamy
sand. Journal of Contaminant Hydrology, 103, 38-47
Unold, M., J. Šimůnek, R. Kasteel, J. Groeneweg and H. Vereecken. 2009b. Transport of
manure-based applied sulfadiazine and its main transformation products in soil
columns. Vadose Zone Journal, 8, 677-689
van Genuchten, M.T. 1985. Convective-Dispersive Transport of Solutes involved in
sequential 1st-order decay reactions. Computers and Geosciences, 11, 129-147
van Genuchten, M.T. and R.J. Wagenet. 1989. 2-Site 2-Region Models for Pesticide
Transport and Degradation - Theoretical Development and Analytical Solutions.
Soil Science Society of America Journal, 53, 1303-1310
Wang, Q. 2006. Sulfadimethoxine degradation kinetics in manure as affected by initial
concentration, moisture, and temperature. Journal of Environmental Quality, 35,
2162-2169
Wehrhan, A., 2006. Fate of veterinary pharmaceuticals in soil: An experimental and
numerical study on the mobility, sorption and transformation of sulfadiazine.
Doctoral Thesis. Forschungszentrum Jülich GmbH, Germany
Chapter 6
104
Wehrhan, A., Kasteel, R., Šimůnek, J., Groeneweg, J. and H. Vereecken. 2007. Transport
of sulfadiazine in soil columns - Experiments and modelling approaches. Journal of
Contaminant Hydrology, 89 (1-2), 107-135
Wehrhan A., T. Streck, J. Groeneweg, H. Vereecken and R. Kasteel. 2009. Long-term
sorption and desorption of sulfadiazine in soil - experiments and modelling.
Accepted by Journal of Environmental Quality.
Wilson, G.V., Rhoton, F.E. and H.M. Selim. 2004. Modeling the impact of ferrihydrite on
adsorption-desorption of soil phosphorus. Soil Science, 169 (4), 271-281
Woolley, J.L. and C.W. Sigel. 1979. Metabolism and Disposition by the Rat of
Sulfadiazine-S-35 Alone and in the Presence of Trimethoprim. Drug Metabolism
and Disposition, 7 (2), 94-99
Wortmann, C.S. and C.A. Shapiro. 2008. The effects of manure application on soil
aggregation. Nutrient Cycling in Agroecosystems, 80, 173-180
Ye, Z.Q., H.S. Weinberg and M.T. Meyer. 2007. Trace analysis of trimethoprim and
sulfonamide, macrolide, quinolone, and tetracycline antibiotics in chlorinated
drinking water using liquid chromatography electrospray tandem mass
spectrometry. Analytical Chemistry, 79, 1135-1144
Zeldowitsch, J., 1934. Über den Mechanismus der katalytischen Oxydation von CO an
MnO2. Acta Physicochimica URSS, 1, 364-449
Zhang, X.X., J.W. Crawford and L.M. Young. 2008. Does pore water velocity affect the
reaction rates of adsorptive solute transport in soils? Demonstration with pore-scale
modelling. Advances in Water Resources, 31,425-437
Zhang, X.X and M. Lv. 2009. The nonlinear adsorptive kinetics of solute transport in soil
does not change with pore water velocity: Demonstration with pore scale
simulations. Journal of Hydrology, 371, 42-52
Zielezny, Y., Groeneweg, J., Vereecken, H., and W. Tappe. 2006. Impact of sulfadiazine
and chlorotetracycline on soil bacterial community structure and respiratory activity.
Soil Biology & Biochemistry. 38, 2372-2380
Zarfl, C. 2008: Chemical Fate of Sulfadiazine in Soil: Mechanisms and Modelling
Approaches (Dissertation). Shaker Verlag. Aachen. ISBN 978-3-8322-7491-7
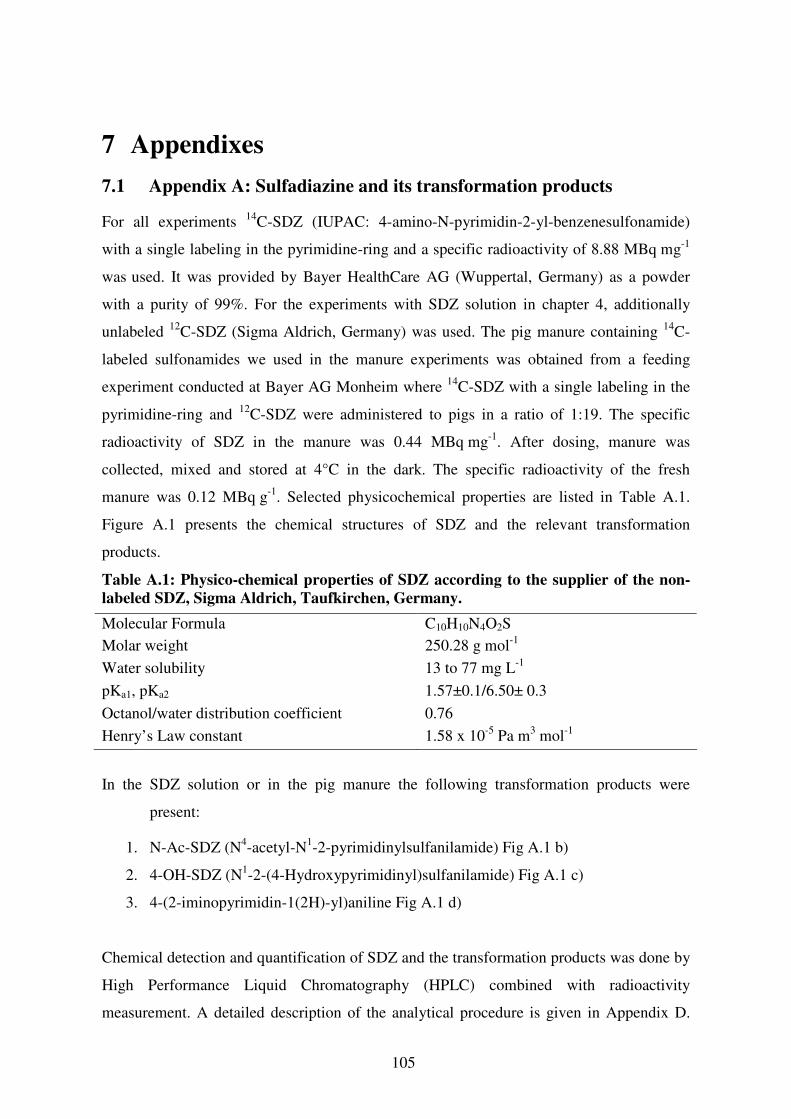
105
7 Appendixes
7.1 Appendix A: Sulfadiazine and its transformation products
For all experiments 14C-SDZ (IUPAC: 4-amino-N-pyrimidin-2-yl-benzenesulfonamide)
with a single labeling in the pyrimidine-ring and a specific radioactivity of 8.88 MBq mg-1
was used. It was provided by Bayer HealthCare AG (Wuppertal, Germany) as a powder
with a purity of 99%. For the experiments with SDZ solution in chapter 4, additionally
unlabeled 12C-SDZ (Sigma Aldrich, Germany) was used. The pig manure containing 14C-
labeled sulfonamides we used in the manure experiments was obtained from a feeding
experiment conducted at Bayer AG Monheim where 14C-SDZ with a single labeling in the
pyrimidine-ring and 12C-SDZ were administered to pigs in a ratio of 1:19. The specific
radioactivity of SDZ in the manure was 0.44 MBq mg-1. After dosing, manure was
collected, mixed and stored at 4°C in the dark. The specific radioactivity of the fresh
manure was 0.12 MBq g-1. Selected physicochemical properties are listed in Table A.1.
Figure A.1 presents the chemical structures of SDZ and the relevant transformation
products.
Table A.1: Physico-chemical properties of SDZ according to the supplier of the non-
labeled SDZ, Sigma Aldrich, Taufkirchen, Germany.
In the SDZ solution or in the pig manure the following transformation products were
present:
1. N-Ac-SDZ (N4-acetyl-N1-2-pyrimidinylsulfanilamide) Fig A.1 b)
2. 4-OH-SDZ (N1-2-(4-Hydroxypyrimidinyl)sulfanilamide) Fig A.1 c)
3. 4-(2-iminopyrimidin-1(2H)-yl)aniline Fig A.1 d)
Chemical detection and quantification of SDZ and the transformation products was done by
High Performance Liquid Chromatography (HPLC) combined with radioactivity
measurement. A detailed description of the analytical procedure is given in Appendix D.
Molecular Formula C10H10N4O2S
Molar weight 250.28 g mol-1
Water solubility 13 to 77 mg L-1
pKa1, pKa2 1.57±0.1/6.50± 0.3
Octanol/water distribution coefficient 0.76
Henry’s Law constant 1.58 x 10⁻⁵ Pa m3 mol-1
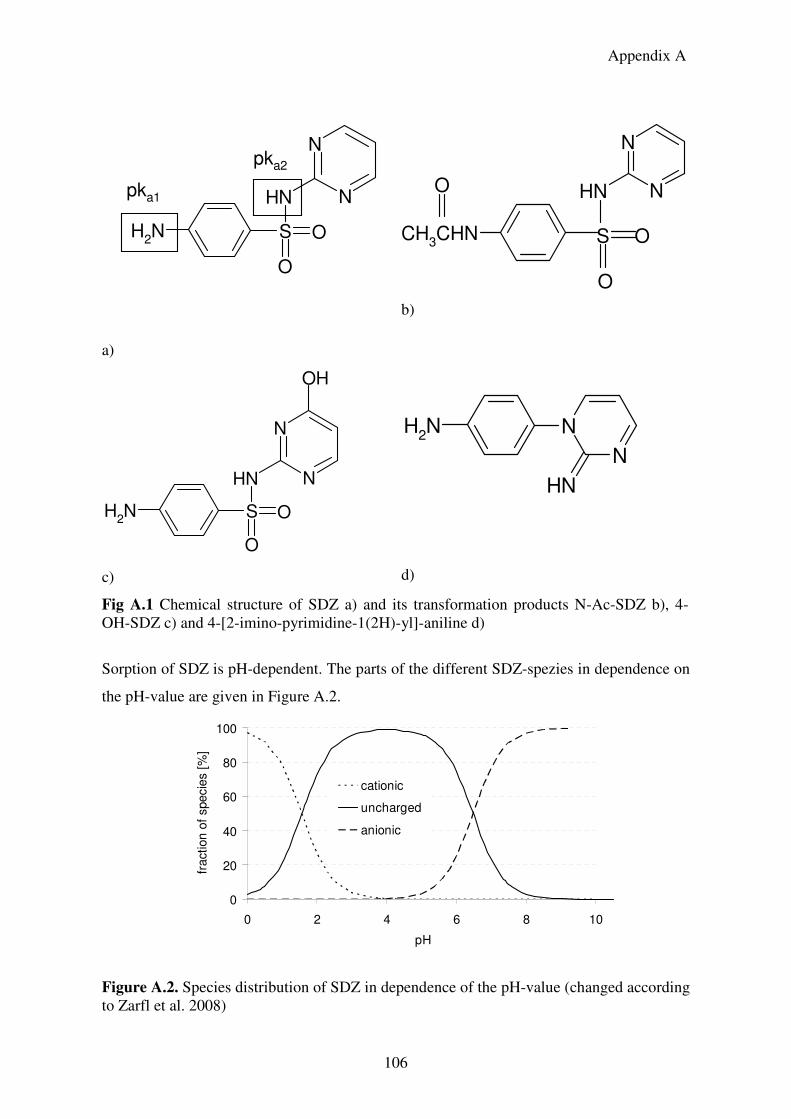
Appendix A
106
a)
CH3CHN
O
S
O
O
NH N
N
b)
S O
O
NH2
NH N
N
OH
c)
NH2 N
N
NH
d) Fig A.1 Chemical structure of SDZ a) and its transformation products N-Ac-SDZ b), 4-OH-SDZ c) and 4-[2-imino-pyrimidine-1(2H)-yl]-aniline d)
Sorption of SDZ is pH-dependent. The parts of the different SDZ-spezies in dependence on
the pH-value are given in Figure A.2.
0
20
40
60
80
100
0 2 4 6 8 10
pH
fra
ction o
f specie
s [
%]
cationic
uncharged
anionic
Figure A.2. Species distribution of SDZ in dependence of the pH-value (changed according to Zarfl et al. 2008)
S O
O
NH2
NH N
N
pka1
pka2
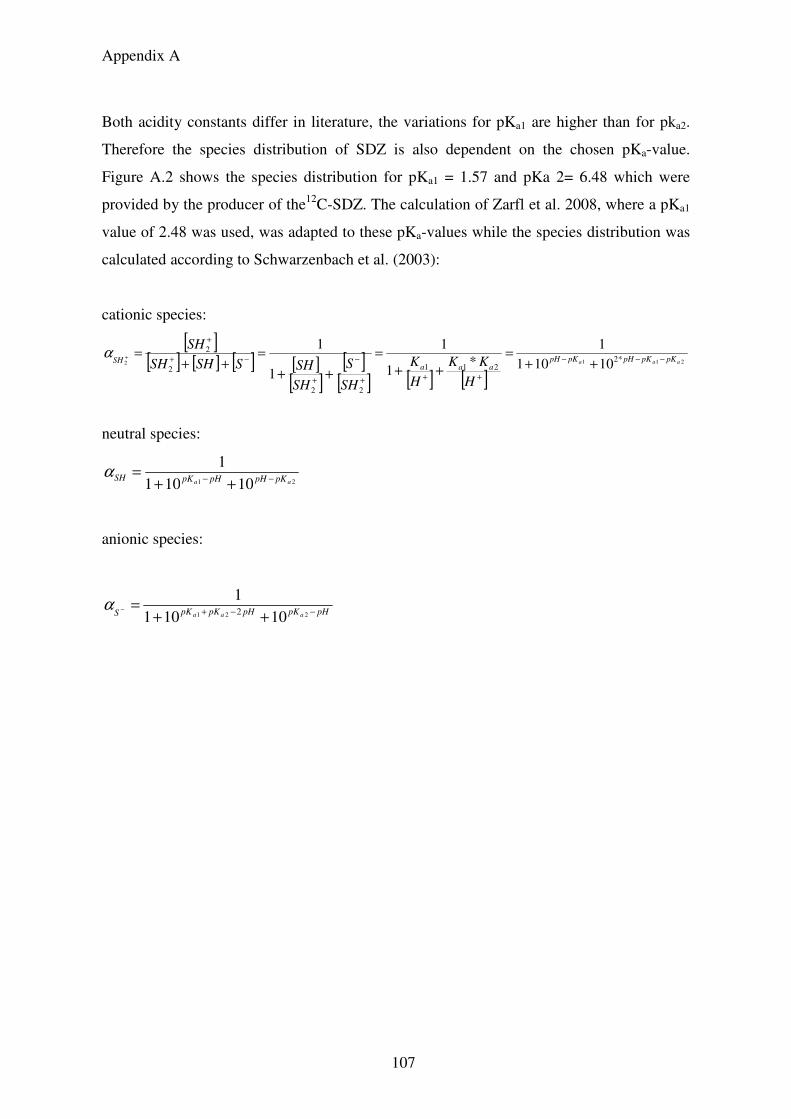
Appendix A
107
Both acidity constants differ in literature, the variations for pKa1 are higher than for pka2.
Therefore the species distribution of SDZ is also dependent on the chosen pKa-value.
Figure A.2 shows the species distribution for pKa1 = 1.57 and pKa 2= 6.48 which were
provided by the producer of the12C-SDZ. The calculation of Zarfl et al. 2008, where a pKa1
value of 2.48 was used, was adapted to these pKa-values while the species distribution was
calculated according to Schwarzenbach et al. (2003):
cationic species:
[ ][ ] [ ] [ ] [ ]
[ ][ ]
[ ] [ ] [ ]2112 *2
211
22
2
2
10101
1*
1
1
1
1aaa pKpKpHpKpH
aaaSH
H
KK
H
K
SH
S
SH
SHSSHSH
SH−−−
+++
−
+
−+
+
++=
++
=
++
=++
=+α
neutral species:
21 10101
1aa pKpHpHpKSH −− ++
=α
anionic species:
pHpKpHpKpKS aaa −−+ ++=−
221 10101
12α
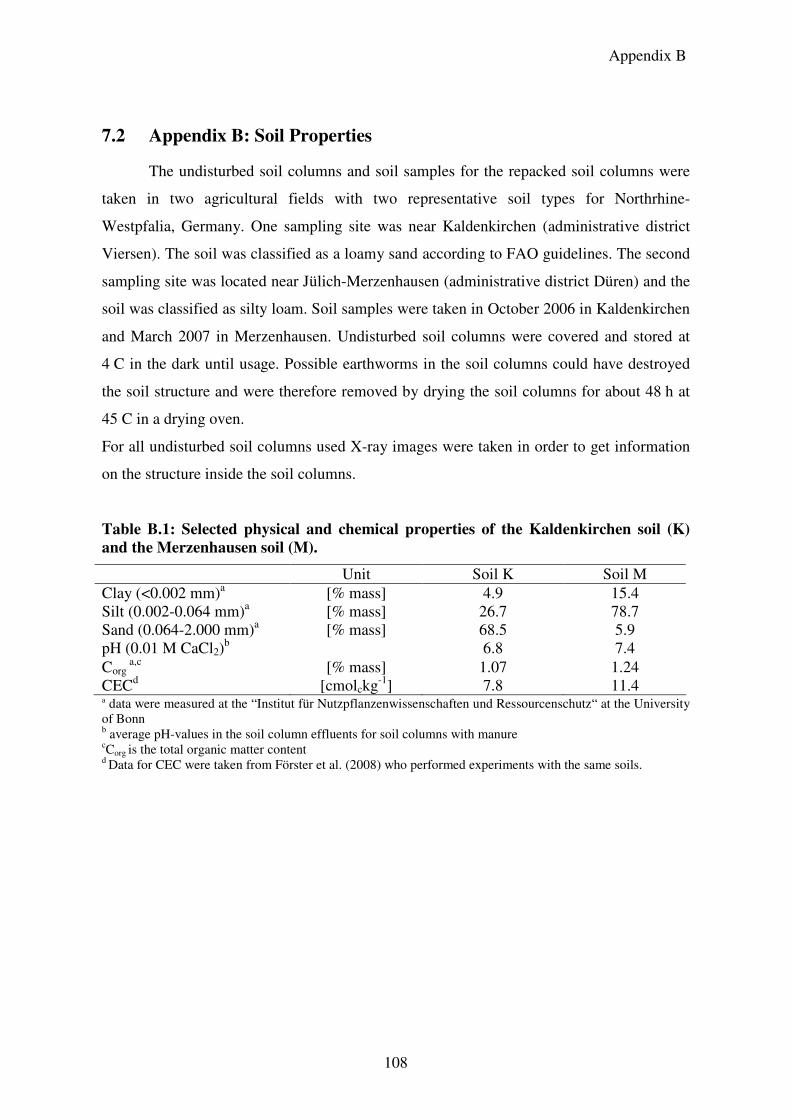
Appendix B
108
7.2 Appendix B: Soil Properties
The undisturbed soil columns and soil samples for the repacked soil columns were
taken in two agricultural fields with two representative soil types for Northrhine-
Westpfalia, Germany. One sampling site was near Kaldenkirchen (administrative district
Viersen). The soil was classified as a loamy sand according to FAO guidelines. The second
sampling site was located near Jülich-Merzenhausen (administrative district Düren) and the
soil was classified as silty loam. Soil samples were taken in October 2006 in Kaldenkirchen
and March 2007 in Merzenhausen. Undisturbed soil columns were covered and stored at
4 C in the dark until usage. Possible earthworms in the soil columns could have destroyed
the soil structure and were therefore removed by drying the soil columns for about 48 h at
45 C in a drying oven.
For all undisturbed soil columns used X-ray images were taken in order to get information
on the structure inside the soil columns.
Table B.1: Selected physical and chemical properties of the Kaldenkirchen soil (K)
and the Merzenhausen soil (M).
a data were measured at the “Institut für Nutzpflanzenwissenschaften und Ressourcenschutz“ at the University of Bonn b average pH-values in the soil column effluents for soil columns with manure cCorg
is the total organic matter content d Data for CEC were taken from Förster et al. (2008) who performed experiments with the same soils.
Unit Soil K Soil M Clay (<0.002 mm)a [% mass] 4.9 15.4 Silt (0.002-0.064 mm)a [% mass] 26.7 78.7 Sand (0.064-2.000 mm)a [% mass] 68.5 5.9 pH (0.01 M CaCl2)
b 6.8 7.4 Corg
a,c [% mass] 1.07 1.24 CECd [cmolckg-1] 7.8 11.4
Appendix C
109
7.3 Appendix C: Experimental Setup
Figure C.1 shows the experimental setup which was used for the unsaturated soil
column experiments of chapters three and four. The setup was built by members of the
Agrosphere Institute within the Research Centre Jülich and controlled with a LabView
based software. The solution for irrigating the soil columns was pumped out of a storage
bottle with the help of a peristaltic pump (REGLO Digital MS-2/12, ISMATEC
Laboratoriumstechnik GmbH, Wertheim-Mondfeld, Germany). The storage bottle was
placed on a balance (Kern DS 8K0 1, Gottl. Kern & Sohn GmbH, Balingen-Frommern,
Germany) in order to record the irrigation rate regularly. At the bottom of the soil columns
suction was applied with the help of a peristaltic pump and a pressure regulation system.
The suction was chosen separately for each soil column to establish a constant pressure
head (water content) in the soil columns at the given flow rate. This means that water flow
was driven only by gravity. The suction inside of the columns was controlled using two
tensiometers (T5, UMS GmbH, München, Germany) installed 2.5 and 7.5 cm below the
soil column surface. Suctions ranged from 4 to 45 mbar for different soil columns. The
outflow from the soil columns was first collected in a buffer vessel. When approximately
15 cm³ were collected, an electric circuit with two water level sensors was closed.
Thereupon a magnetic valve to the cell where the electrical conductivity was measured and
recorded automatically, opened and the outflow flew into this cell. For the SDZ-transport
experiments the samples were collected in a test tube in the fraction sampler after the
measurement of the electrical conductivity.
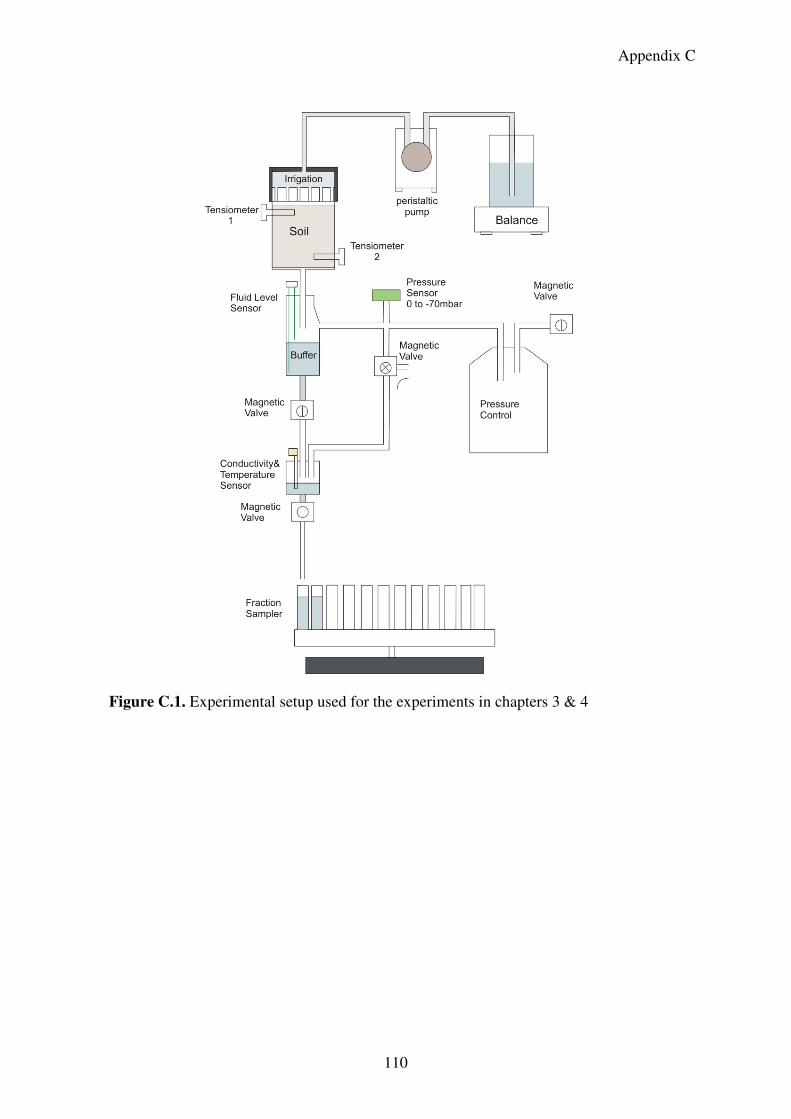
Appendix C
110
Figure C.1. Experimental setup used for the experiments in chapters 3 & 4
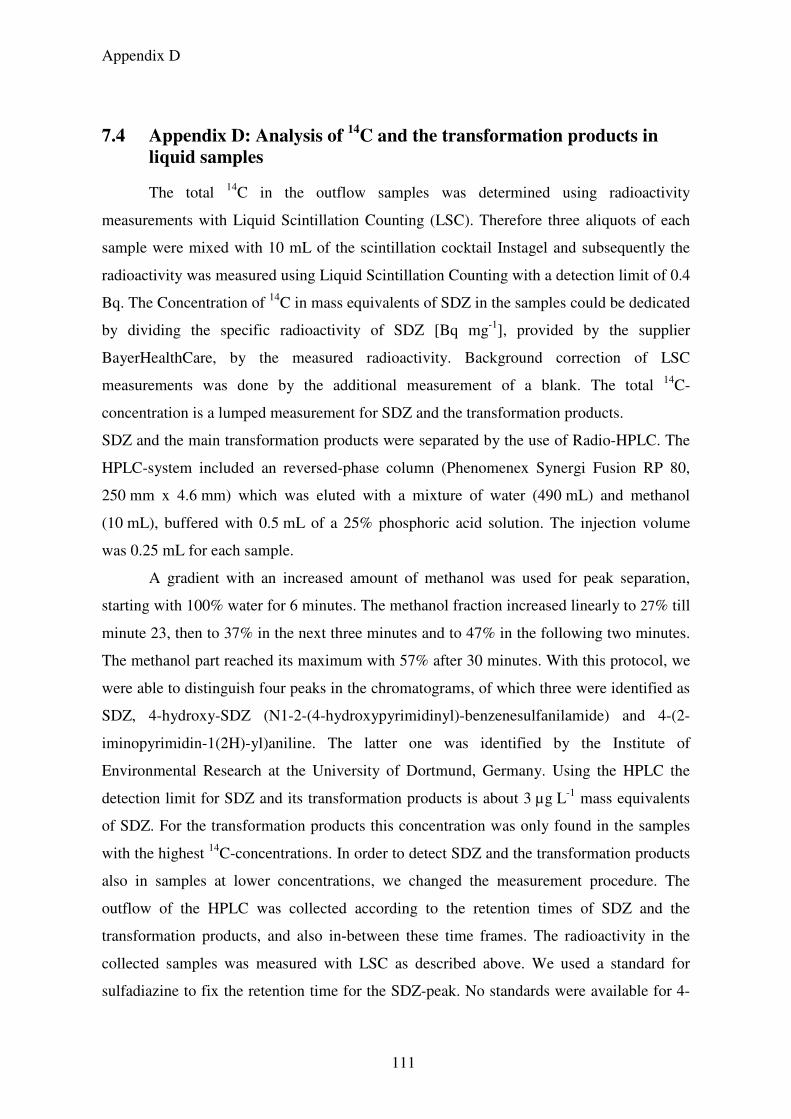
Appendix D
111
7.4 Appendix D: Analysis of 14
C and the transformation products in liquid samples
The total 14C in the outflow samples was determined using radioactivity
measurements with Liquid Scintillation Counting (LSC). Therefore three aliquots of each
sample were mixed with 10 mL of the scintillation cocktail Instagel and subsequently the
radioactivity was measured using Liquid Scintillation Counting with a detection limit of 0.4
Bq. The Concentration of 14C in mass equivalents of SDZ in the samples could be dedicated
by dividing the specific radioactivity of SDZ [Bq mg-1], provided by the supplier
BayerHealthCare, by the measured radioactivity. Background correction of LSC
measurements was done by the additional measurement of a blank. The total 14C-
concentration is a lumped measurement for SDZ and the transformation products.
SDZ and the main transformation products were separated by the use of Radio-HPLC. The
HPLC-system included an reversed-phase column (Phenomenex Synergi Fusion RP 80,
250 mm x 4.6 mm) which was eluted with a mixture of water (490 mL) and methanol
(10 mL), buffered with 0.5 mL of a 25% phosphoric acid solution. The injection volume
was 0.25 mL for each sample.
A gradient with an increased amount of methanol was used for peak separation,
starting with 100% water for 6 minutes. The methanol fraction increased linearly to 27% till
minute 23, then to 37% in the next three minutes and to 47% in the following two minutes.
The methanol part reached its maximum with 57% after 30 minutes. With this protocol, we
were able to distinguish four peaks in the chromatograms, of which three were identified as
SDZ, 4-hydroxy-SDZ (N1-2-(4-hydroxypyrimidinyl)-benzenesulfanilamide) and 4-(2-
iminopyrimidin-1(2H)-yl)aniline. The latter one was identified by the Institute of
Environmental Research at the University of Dortmund, Germany. Using the HPLC the
detection limit for SDZ and its transformation products is about 3 µg L-1 mass equivalents
of SDZ. For the transformation products this concentration was only found in the samples
with the highest 14C-concentrations. In order to detect SDZ and the transformation products
also in samples at lower concentrations, we changed the measurement procedure. The
outflow of the HPLC was collected according to the retention times of SDZ and the
transformation products, and also in-between these time frames. The radioactivity in the
collected samples was measured with LSC as described above. We used a standard for
sulfadiazine to fix the retention time for the SDZ-peak. No standards were available for 4-
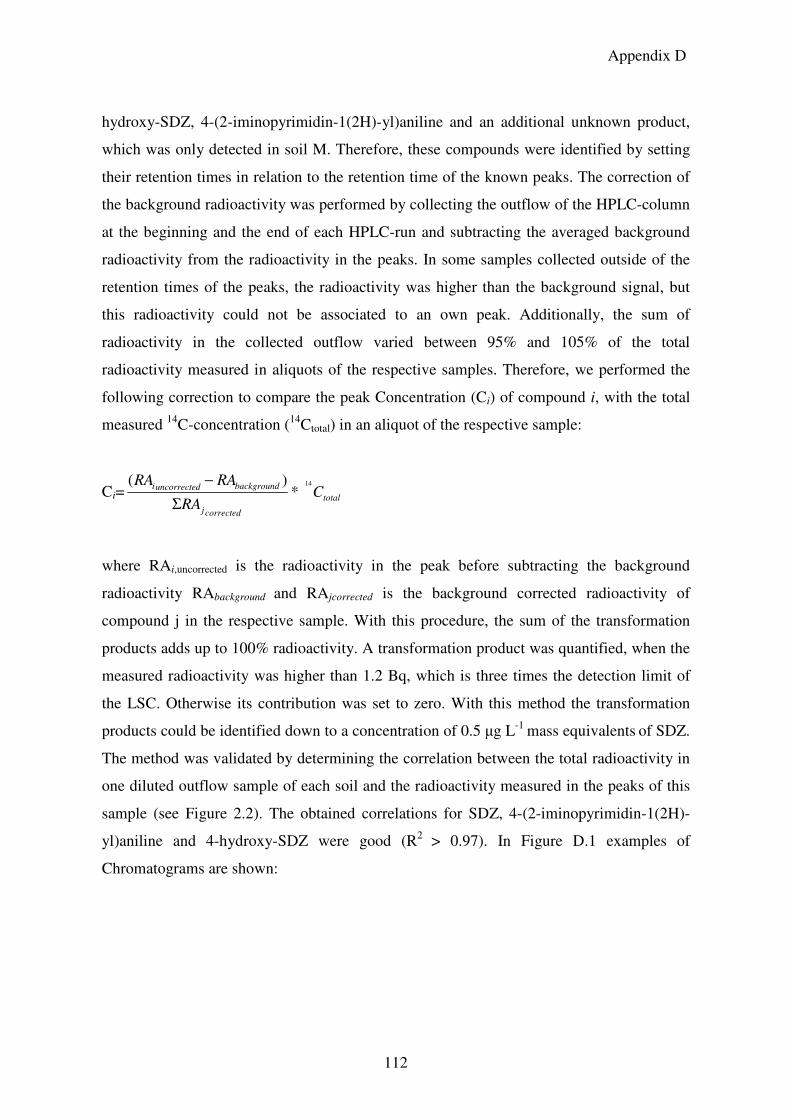
Appendix D
112
hydroxy-SDZ, 4-(2-iminopyrimidin-1(2H)-yl)aniline and an additional unknown product,
which was only detected in soil M. Therefore, these compounds were identified by setting
their retention times in relation to the retention time of the known peaks. The correction of
the background radioactivity was performed by collecting the outflow of the HPLC-column
at the beginning and the end of each HPLC-run and subtracting the averaged background
radioactivity from the radioactivity in the peaks. In some samples collected outside of the
retention times of the peaks, the radioactivity was higher than the background signal, but
this radioactivity could not be associated to an own peak. Additionally, the sum of
radioactivity in the collected outflow varied between 95% and 105% of the total
radioactivity measured in aliquots of the respective samples. Therefore, we performed the
following correction to compare the peak Concentration (Ci) of compound i, with the total
measured 14C-concentration (14Ctotal) in an aliquot of the respective sample:
Ci= total
correctedj
backgroundduncorrecteiC
RA
RARA 14
*)(
Σ
−
where RAi,uncorrected is the radioactivity in the peak before subtracting the background
radioactivity RAbackground and RAjcorrected is the background corrected radioactivity of
compound j in the respective sample. With this procedure, the sum of the transformation
products adds up to 100% radioactivity. A transformation product was quantified, when the
measured radioactivity was higher than 1.2 Bq, which is three times the detection limit of
the LSC. Otherwise its contribution was set to zero. With this method the transformation
products could be identified down to a concentration of 0.5 µg L-1 mass equivalents of SDZ.
The method was validated by determining the correlation between the total radioactivity in
one diluted outflow sample of each soil and the radioactivity measured in the peaks of this
sample (see Figure 2.2). The obtained correlations for SDZ, 4-(2-iminopyrimidin-1(2H)-
yl)aniline and 4-hydroxy-SDZ were good (R2 > 0.97). In Figure D.1 examples of
Chromatograms are shown:
Appendix D
113
Figure D.1. Example Chromatograms measured in liquid samples with the application of a) manure (chapter 4: KundMAN) and b) a SDZ solution (chapter 2, soil K).
a)
b)
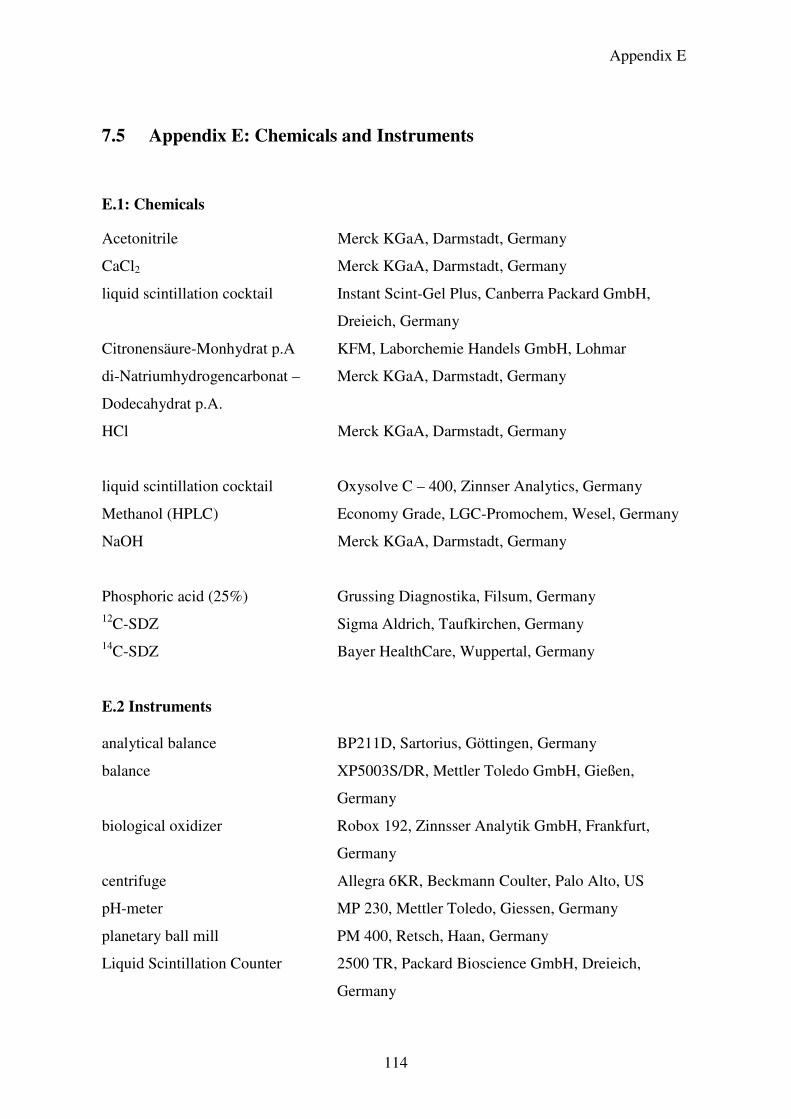
Appendix E
114
7.5 Appendix E: Chemicals and Instruments
E.1: Chemicals
Acetonitrile Merck KGaA, Darmstadt, Germany
CaCl2 Merck KGaA, Darmstadt, Germany
liquid scintillation cocktail Instant Scint-Gel Plus, Canberra Packard GmbH,
Dreieich, Germany
Citronensäure-Monhydrat p.A KFM, Laborchemie Handels GmbH, Lohmar
di-Natriumhydrogencarbonat – Merck KGaA, Darmstadt, Germany
Dodecahydrat p.A.
HCl Merck KGaA, Darmstadt, Germany
liquid scintillation cocktail Oxysolve C – 400, Zinnser Analytics, Germany
Methanol (HPLC) Economy Grade, LGC-Promochem, Wesel, Germany
NaOH Merck KGaA, Darmstadt, Germany
Phosphoric acid (25%) Grussing Diagnostika, Filsum, Germany 12C-SDZ Sigma Aldrich, Taufkirchen, Germany 14C-SDZ Bayer HealthCare, Wuppertal, Germany
E.2 Instruments analytical balance BP211D, Sartorius, Göttingen, Germany
balance XP5003S/DR, Mettler Toledo GmbH, Gießen,
Germany
biological oxidizer Robox 192, Zinnsser Analytik GmbH, Frankfurt,
Germany
centrifuge Allegra 6KR, Beckmann Coulter, Palo Alto, US
pH-meter MP 230, Mettler Toledo, Giessen, Germany
planetary ball mill PM 400, Retsch, Haan, Germany
Liquid Scintillation Counter 2500 TR, Packard Bioscience GmbH, Dreieich,
Germany
Appendix E
115
E.3 Experimental setup
needles (irrigation head) Sterican Insulin G30X ½, B.Braun Melsungen AG,
Melsungen, Germany
glass filter Vitrapor Glasfilter (Por. 4, B = 80 mm) ROBU
Glasfiltergeräte GmbH, Hattert, Germany
conductivity meter Cond 340i, WTW GmbH, Weilheim, Germany
fraction collector Fraktionssammler Modell III, Firma Köhler technische
Produkte, Neulußheim, Germany
peristaltic pump (suction) 520 DU, Watson-Marlow GmbH, Rommerskirchen,
Germany
peristaltic pumps (irrigation) REGLO Digital MS-2/12, ISMATEC
Laboratoriumstechnik GmbH, Wertheim-Mondfeld,
Germany
tubes SC0303 ID mm 0.25, SC0307 ID mm 0.76, Ismaprene,
ISMATEC Laboratoriumstechnik GmbH, Wertheim-
Mondfeld, Germany
pressure sensors CTEM7N0706P0, Sensortechnics GmbH, Puchheim,
Germany
tensiometers T5, UMS GmbH, München, Germany
tubes TU0425 BU, TU0805 BU, TU0805 B, SMC
Pneumatik GmbH, Egelsbach, Germany
E.4 HPLC
HPLC – Column Phenomenex Synergi Fusion RP 80, 4μ grain size,
250 mm x 4.6 mm, Phenomenex Ltd. Aschaffenburg,
Germany
pump PU 1580, Jasco, Gross. Umstadt, Germany
autosampler Gina 50, Gynkotek, Germering, Germany
column oven ST585, Gynkotek, Germering, Germany
radio detector LB508-C, YG-150U4D, Berthold, Bad Wildbad,
Germany