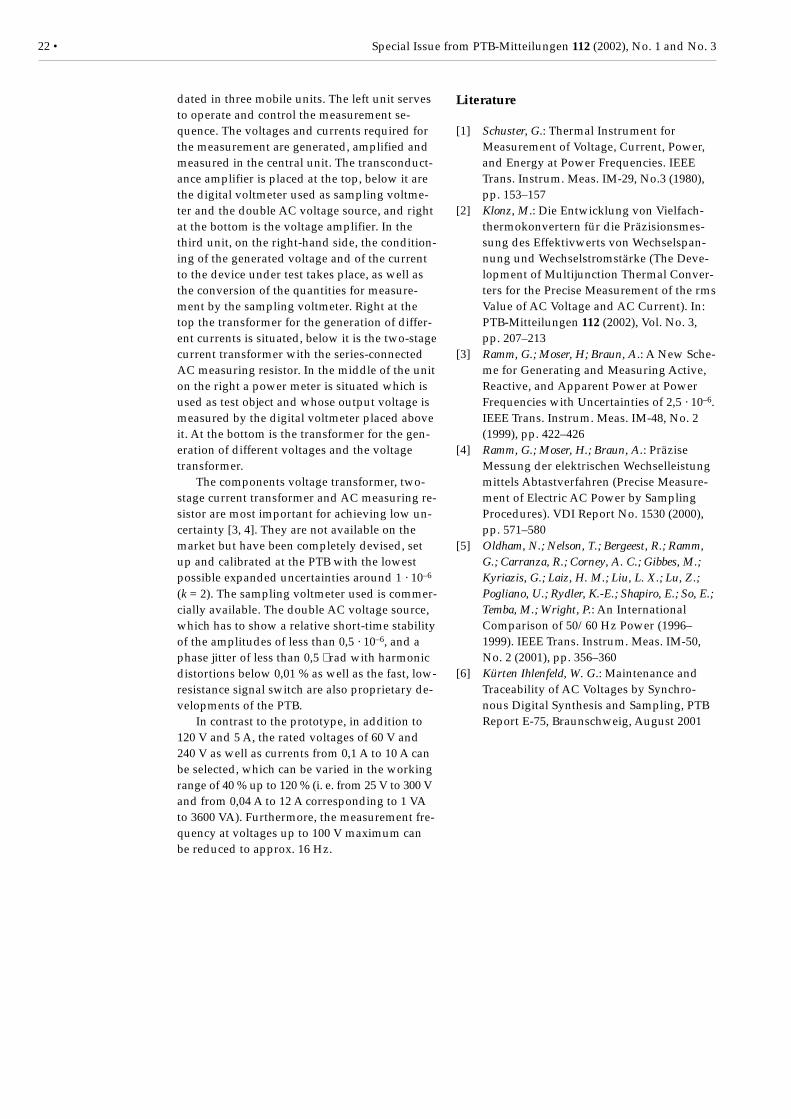
Embed Size (px)
Citation preview
Special Issue from PTB-Mitteilungen 112 (2002), No. 1 and No. 3 • 1
Fachorgan für Wirtschaft und Wissenschaft
Amts- und Mitteilungsblatt derPhysikalisch-Technischen BundesanstaltBraunschweig und Berlin
Special Issue
112. Volume (2002) No.1 and No. 3
•Andreas Braun: Present state and prospects of electrical energymeasuring techniques at the PTB 3
• Hans-Georg Latzel, Martin Kahmann, Helmut Seifert,Andreas Suchy: Approval, testing and calibration of equipmentfor electric energy measurements 8
• Günther Ramm, Harald Moser, Rainer Bergeest,Waldemar Guilherme Kürten Ihlenfeld: PTB StandardMeasuring Devices for Electric AC Power 17
• Manfred Klonz: The development of multijunction thermalconverters for precise measurement of the rms value ofAC voltage and AC current 23
• Helmut Seifert, Hans-Georg Latzel, Andreas Braun:Non-conventional current and voltage transformers 29
• Klaus Schon, Wolfgang Lucas, Rainer Marx, Enrico Mohns,Günter Roeissle: Development and calibration ofhigh-voltage and high-current measuring devices 36
• Martin Kahmann: Measures to assure the reliability of digitalinformation 45
• Peter Zayer: Challenges to Legal Metrology in terms ofMetering and Information Technology due to theLiberalization of the Power Market 46
Electrical Energy Measuring Techniques
Note:
This reprint titled “electrical energy meas-uring technique” was published in Germanin the year 2002. Laws, regulations ordirectives cited herein may be have been
altered or substituted by new ones in themeantime.Coordination of this special issue byHelmut Seifert
Contens
2 • Special Issue from PTB-Mitteilungen 112 (2002), No. 1 and No. 3
Die PTB-Mitteilungen sind metrologisches Fachjournal und amtlichesMitteilungsblatt der Physikalisch-Technischen Bundesanstalt, Braunschweigund Berlin. Als Fachjournal veröffentlichen die PTB-Mitteilungen wissen-schaftliche Fachaufsätze zu metrologischen Themen aus den Arbeitsgebietender PTB. Als amtliches Mitteilungsblatt steht die Zeitschrift in einer langenTradition, die bis zu den Anfängen der Physikalisch-Technischen Reichs-anstalt (gegründet 1887) zurückreicht. Die PTB-Mitteilungen veröffentlichen inihrer Rubrik „Amtliche Bekanntmachungen“ unter anderem die aktuellenGeräte-Prüfungen und -Zulassungen aus den Gebieten des Eich-, Prüfstellen-und Gesundheitswesens, des Strahlenschutzes und der Sicherheitstechnik.
Impressum
VerlagWirtschaftsverlag NWVerlag für neue Wissenschaft GmbHBürgermeister-Smidt-Str. 74–76,27568 BremerhavenPostfach 10 11 10, 27511 BremerhavenInternet: www.nw-verlag.deE-Mail: [email protected]
HerausgeberPhysikalisch-Technische Bundesanstalt (PTB),Braunschweig und BerlinPostanschrift:Postfach 33 45, 38023 BraunschweigLieferanschrift:Bundesallee 100, 38116 Braunschweig
Redaktion/LayoutPresse- und Öffentlichkeitsarbeit, PTBDr. Dr. Jens Simon (verantwortlich)Gisela LinkTelefon: (05 31) 592-82 02Telefax: (05 31) 592-30 08E-Mail: [email protected]
Leser- und Abonnement-ServiceMarina KornahrensTelefon: (04 71) 9 45 44-61Telefax: (04 71) 9 45 44-88E-Mail: [email protected]
AnzeigenserviceKarin DrewesTelefon: (04 71) 9 45 44-21Telefax: (04 71) 9 45 44-77E-Mail: [email protected]
Erscheinungsweise und BezugspreiseDie PTB-Mitteilungen erscheinen viermal jährlich.Das Jahresabonnement kostet 50,50 Euro, dasEinzelheft 15 Euro, jeweils zzgl. Versandkosten.Bezug über den Buchhandel oder den Verlag.Abbestellungen müssen spätestens drei Monatevor Ende eines Kalenderjahres schriftlich beimVerlag erfolgen.
© Wirtschaftsverlag NW, Verlag für neue Wissen-schaft GmbH, Bremerhaven, 2003
Alle Rechte vorbehalten. Kein Teil dieser Zeitschriftdarf ohne schriftliche Genehmigung des Verlagesvervielfältigt oder verbreitet werden. Unter diesesVerbot fällt insbesondere die gewerbliche Verviel-fältigung per Kopie, die Aufnahme in elektronischeDatenbanken und die Vervielfältigung auf CD-ROMund in allen anderen elektronischen Datenträgern.
Printed in Germany ISSN 0030-834X
Special Issue from PTB-Mitteilungen 112 (2002), No. 1 and No. 3 • 3
Present state and prospects of electrical energymeasuring techniques at the PTB
Andreas Braun*
1 Introduction
Electrical energy measuring techniques have al-ways ranked among the classical areas of workof the PTB and its predecessor, the Physikalisch-Technische Reichsanstalt (PTR). As in the past,the activities are still mainly focussed on measu-ring the quantities relevant to the generation,transmission, distribution and consumption ofelectrical energy.
In the Federal Republic of Germany, electri-cal energy to the amount of approximately50 billion euro per year is consumed. Assuranceof the uniformity of energy measurement withinthe framework of legal metrology is one of thecentral tasks assigned by the Verification Act tothe PTB. Fulfilment of this task requires the de-velopment and realization of the physical tech-nical units which are to be disseminated – throughthe testing of standard measuring devices – tothe responsible agencies, i.e. the verification au-thorities of the federal states and the state-ap-proved test centres for electricity meters.
Another important task of the PTB is to keepand further develop the national standards forelectrical energy measurement with which thecalibration laboratories of industry can comparetheir standards. This not only guarantees uniform-ity of the measurements performed by industrybut also allows products to be manufacturedwhich are competitive on the world market.
When handling these two tasks it has timeand again – both in the days of the PTR and to-day – been necessary to develop measuring in-struments which were not available on the mar-ket. In quite a lot of cases, these instrumentsthen were of such great interest to the instru-ment-manufacturing industry that companiesacquired the expertise to produce them in series.This too has enabled the PTB to make a contri-bution to the competitiveness of industry.
The PTB – and thus also the PTB’s “ElectricalEnergy Measuring Techniques” Department –ensures its own competitiveness by practising
quality management in accordance withISO 17025 and global metrological integrationthrough international comparisons. Thesemeasures will contribute to the traditional con-fidence the PTB, and before it the PTR, have en-joyed for decades being justified also in future.
The Department is subdivided into the Sec-tions “Instrument Transformers and High-Volta-ge”, “AC/DC Transfer” and “Electricity Me-ters.” Add to this the “Measurement of Non-electrical Quantities” Project which succeededthe former “Instrument Transformers” Labora-tory and is closely connected with the Depart-ment although it is not formally part of it.Within the scope of this project, measurementprocedures are being developed and measuringset-ups installed in close cooperation with therelevant sections.
The tasks of the “Instrument Transformersand High-Voltage” Section comprise the field ofcurrent and voltage transformers, instrumenttransformer test sets and burdens as well as themeasurement of high DC and AC voltages, im-pulse voltages and impulse currents and the cal-ibration of peak voltmeters, partial dischargemeters and digital recorders for impulse voltagemeasurements. The “AC/DC Transfer” Sectionis responsible for the development of planarthermal converters, the development and cali-bration of AC-DC voltage and AC-DC currenttransfer standards and of AC voltage and ACcurrent measuring set-ups. The “Electricity Me-ters” Section deals with electricity meters, tariffdevices, reference meters and energy and powermeters.
The work in these fields essentially covers:• Type approvals of measuring instruments
for verification.• Testing of standard devices within the scope
of legal metrology.• Calibration of measuring instruments within
the framework of the DKD and for domesticand foreign manufacturers.
1 Dr.-Ing. AndreasBraun, Head of thePTB’s “ElectricalEnergy MeasuringTechniques” Depart-ment;e-mail:[email protected]
4 • Special Issue from PTB-Mitteilungen 112 (2002), No. 1 and No. 3
• Development of measuring methods andsetting-up of measuring equipment.
• Consultancy services and assessment of testand calibration centres.
• International cooperation, and collaborationin standardization.
The working methods of the Department arecharacterized by the interaction between tes-ting/approval/calibration (TAC) on the onehand, and research and development (R&D) onthe other. So the necessity of rationalizing theperformance of TAC tasks or of enabling it at allhas, for example, led to R&D solutions by thedevelopment of new measurement proceduresand the establishment of measuring set-ups.The permanent enhancement of the measure-ment capabilities on its part has made it possib-le to extend the offer of technical and scientificservices in compliance with the requirements ofpractice.
2 Legal metrology
The activities in the area of legal metrology areregulated by laws and ordinances by which spe-cific tasks are assigned to the PTB:
• Approval of instrument transformers andelectricity meters and their auxiliary devicesfor verification.
• Prior to new developments, consultancy ser-vices to manufacturers of such devices.
• Testing of the standards of the verificationauthorities and the state-approved electrici-ty test centres.
• Cooperation with the verification authoritiesin the establishment and inspection of testcentres.
A significant part of the Department’s capacitiesare absorbed by the performance of these tasks
(see Latzel, H.G. et al.). So it is most important topermanently check the scope of these tasks inorder that they might be carried out as efficient-ly as possible. This is achieved, among otherthings, by:
• Provision of permanently updated informa-tion material on the Department’s Internetpages (including application forms).
• Reduction of test effort and expense by theinclusion of test results of external bodies(e.g. state-approved test centres).
• Allocation of partial tasks to cooperationpartners on a contractual basis (for examplethe Bavarian State Authority of Weights andMeasures).
By far the most important contribution to therationalization of these activities is the develop-ment of measurement procedures and the set-ting-up of measuring facilities. So the calibrati-ons upon type approval and upon the testing ofstandard measuring devices today is in greatpart performed with automated measuring de-vices which have been designed and realized atthe Department or within the “Non-electricalQuantities” Project mentioned above (see Latzel,H.G. et al., Ramm G. et al., and Schon, K. et al.).
It is in the field of legal metrology that thereis a strong interaction between the requirementsof the market, i.e. of the manufacturers, energysuppliers and test centres and the activities ofthe PTB. A fundamental change which is ac-tively supported by the PTB in close cooperati-on with the other stakeholders, is taking placein particular as a result of the liberalization ofthe electric current market.
Recently, the desire to use non-conventionalinstrument transformers has repeatedly beenexpressed again also in connection with legalmetrology. Since the early seventies, the Depart-
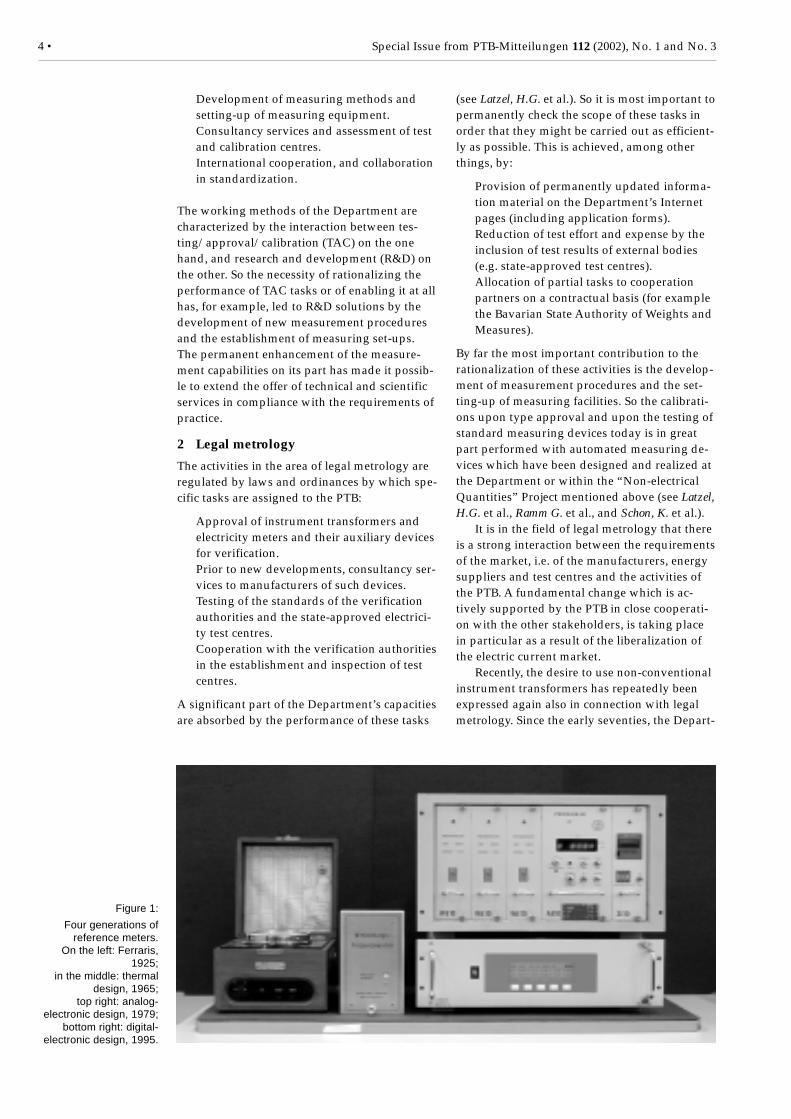
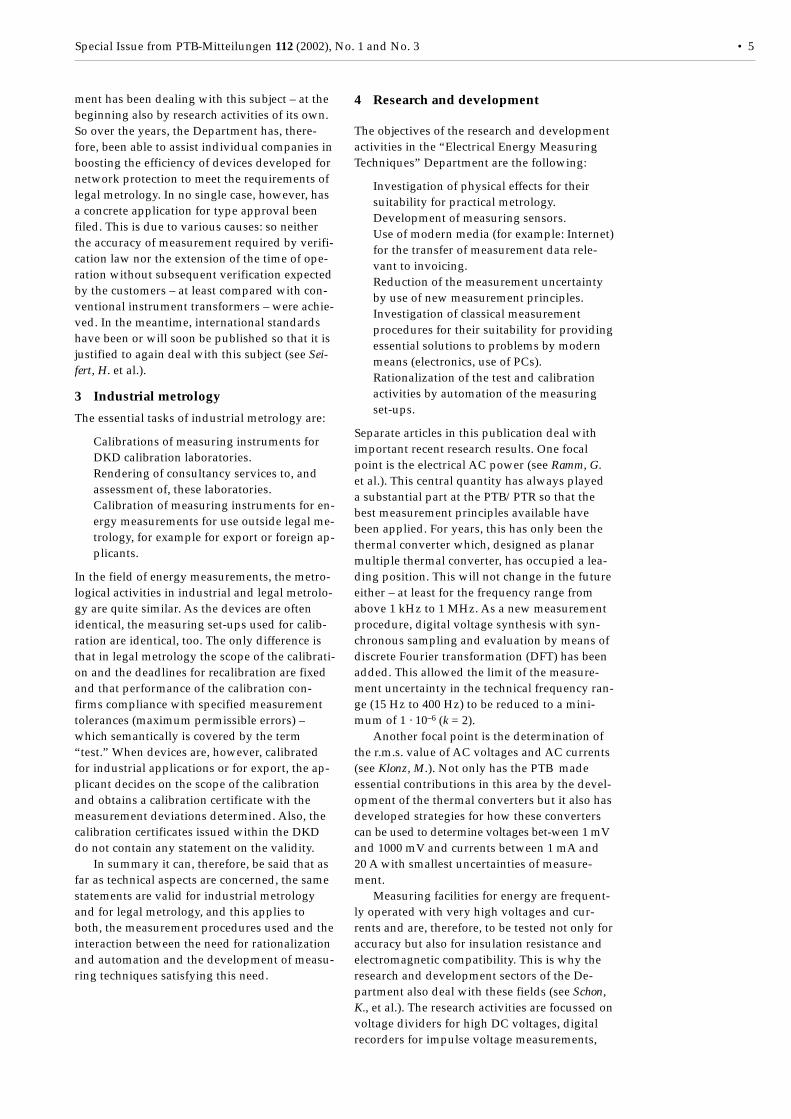
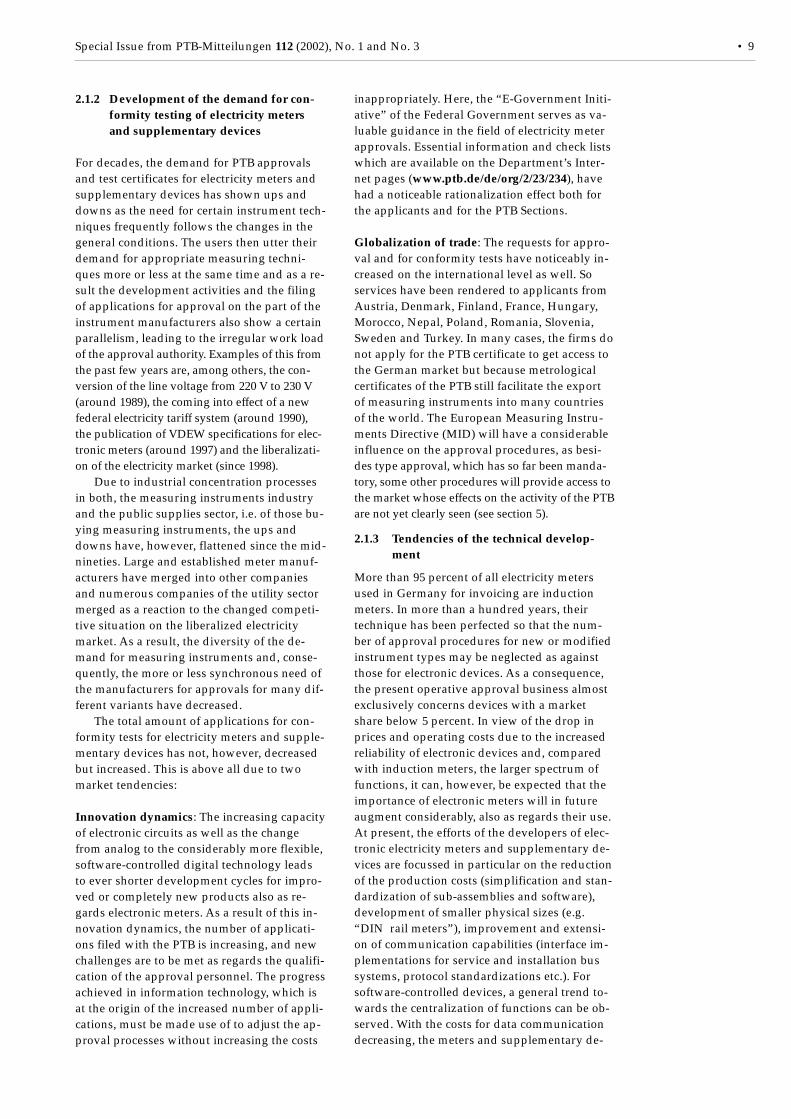
Figure 1:
Four generations ofreference meters.
On the left: Ferraris,1925;
in the middle: thermaldesign, 1965;
top right: analog-electronic design, 1979;
bottom right: digital-electronic design, 1995.
Special Issue from PTB-Mitteilungen 112 (2002), No. 1 and No. 3 • 5
ment has been dealing with this subject – at thebeginning also by research activities of its own.So over the years, the Department has, there-fore, been able to assist individual companies inboosting the efficiency of devices developed fornetwork protection to meet the requirements oflegal metrology. In no single case, however, hasa concrete application for type approval beenfiled. This is due to various causes: so neitherthe accuracy of measurement required by verifi-cation law nor the extension of the time of ope-ration without subsequent verification expectedby the customers – at least compared with con-ventional instrument transformers – were achie-ved. In the meantime, international standardshave been or will soon be published so that it isjustified to again deal with this subject (see Sei-fert, H. et al.).
3 Industrial metrology
The essential tasks of industrial metrology are:
• Calibrations of measuring instruments forDKD calibration laboratories.
• Rendering of consultancy services to, andassessment of, these laboratories.
• Calibration of measuring instruments for en-ergy measurements for use outside legal me-trology, for example for export or foreign ap-plicants.
In the field of energy measurements, the metro-logical activities in industrial and legal metrolo-gy are quite similar. As the devices are oftenidentical, the measuring set-ups used for calib-ration are identical, too. The only difference isthat in legal metrology the scope of the calibrati-on and the deadlines for recalibration are fixedand that performance of the calibration con-firms compliance with specified measurementtolerances (maximum permissible errors) –which semantically is covered by the term“test.” When devices are, however, calibratedfor industrial applications or for export, the ap-plicant decides on the scope of the calibrationand obtains a calibration certificate with themeasurement deviations determined. Also, thecalibration certificates issued within the DKDdo not contain any statement on the validity.
In summary it can, therefore, be said that asfar as technical aspects are concerned, the samestatements are valid for industrial metrologyand for legal metrology, and this applies toboth, the measurement procedures used and theinteraction between the need for rationalizationand automation and the development of measu-ring techniques satisfying this need.
4 Research and development
The objectives of the research and developmentactivities in the “Electrical Energy MeasuringTechniques” Department are the following:
• Investigation of physical effects for theirsuitability for practical metrology.
• Development of measuring sensors.• Use of modern media (for example: Internet)
for the transfer of measurement data rele-vant to invoicing.
• Reduction of the measurement uncertaintyby use of new measurement principles.
• Investigation of classical measurementprocedures for their suitability for providingessential solutions to problems by modernmeans (electronics, use of PCs).
• Rationalization of the test and calibrationactivities by automation of the measuringset-ups.
Separate articles in this publication deal withimportant recent research results. One focalpoint is the electrical AC power (see Ramm, G.et al.). This central quantity has always playeda substantial part at the PTB/PTR so that thebest measurement principles available havebeen applied. For years, this has only been thethermal converter which, designed as planarmultiple thermal converter, has occupied a lea-ding position. This will not change in the futureeither – at least for the frequency range fromabove 1 kHz to 1 MHz. As a new measurementprocedure, digital voltage synthesis with syn-chronous sampling and evaluation by means ofdiscrete Fourier transformation (DFT) has beenadded. This allowed the limit of the measure-ment uncertainty in the technical frequency ran-ge (15 Hz to 400 Hz) to be reduced to a mini-mum of 1 · 10–6 (k = 2).
Another focal point is the determination ofthe r.m.s. value of AC voltages and AC currents(see Klonz, M.). Not only has the PTB madeessential contributions in this area by the devel-opment of the thermal converters but it also hasdeveloped strategies for how these converterscan be used to determine voltages bet-ween 1 mVand 1000 mV and currents between 1 mA and20 A with smallest uncertainties of measure-ment.
Measuring facilities for energy are frequent-ly operated with very high voltages and cur-rents and are, therefore, to be tested not only foraccuracy but also for insulation resistance andelectromagnetic compatibility. This is why theresearch and development sectors of the De-partment also deal with these fields (see Schon,K., et al.). The research activities are focussed onvoltage dividers for high DC voltages, digitalrecorders for impulse voltage measurements,
6 • Special Issue from PTB-Mitteilungen 112 (2002), No. 1 and No. 3
impulse current generation and measurementas well as measurements of partial discharges.
High requirements must be met when theexchange of sensible measurement data from le-gal metrology is concerned. For this topic, at theDepartment’s suggestion, the SELMA project“Safe electronic exchange of measurement data”has been established within the framework ofVERNET – an ideas competition of the BMWi tosupport German industry in the implementati-on of safety technologies in open communicati-on networks – and will be handled by a pool ofenergy suppliers, manufacturers, federal andstate authorities (PTB, BSI, AGME) as well astwo universities (Münster and Siegen).The pro-ject is for the time being limited to electricityand gas meters, it may, however, be generallyregarded as trend-setting for the transfer of datasubject to legal control. A prerequisite for thisare modern, communication-capable energymeasuring instruments as they are evaluated to
an increasing extent in the Department withinthe scope of type approvals. The SELMA projectconfirms that the competence established in thehandling of approvals can give impetus to pro-mising industrial developments.
The success of these research and develop-ment activities is favoured by the fact that thesame electrotechnical qualification is requiredfor handling the tasks (testing and calibration ofelectrical devices) and for finding solutions(electric/electronic measuring procedures). Thisis why the employees entrusted with TAC andR&D activities as colleagues are in direct con-tact with one another and, as they have thesame technical background, can optimally bringtheir plans and ideas into accord.
Also, the heads of the organizational units ofthe Department have the same professionalqualification so that – in addition to their orga-nizational management functions – they can actas contact persons and coordinators for both,the TAC and the R&D sector. This also ensuresthat within the organizational structure whichwill in future be more project-oriented they willbe able to effectively control the cooperationbetween the TAC and R&D projects.
5 National and international cooperation
The integration of the Department into national,regional and international activities has manyaspects. Focal points are:
• Cooperation in legal metrology bodies (to-gether with the verification authorities,state-approved test centres, manufacturersof measuring instruments subject to legalcontrol, electricity suppliers, OIML).
• Cooperation in the Deutscher Kalibrier-dienst.
• Cooperation in standardization (DKE,CENELEC, IEC).
• International comparisons (EUROMET,CCEM).
• Consultancy services to foreign state institu-tes and instrument manufacturers for the ex-tension of their measurement capabilities.
These activities require considerable commit-ment which, as experience gained has shownwill be called for also in future, as precisely these links are necessary to perform need-ori-ented work, i.e. work with due regard to prac-tice. Here, too, however, the possibilities of rati-onalization as offered by modern means (videoconferences and measurement comparisons viaInternet) are already used and the developmentof information technology will in future furtherincrease their effectiveness.
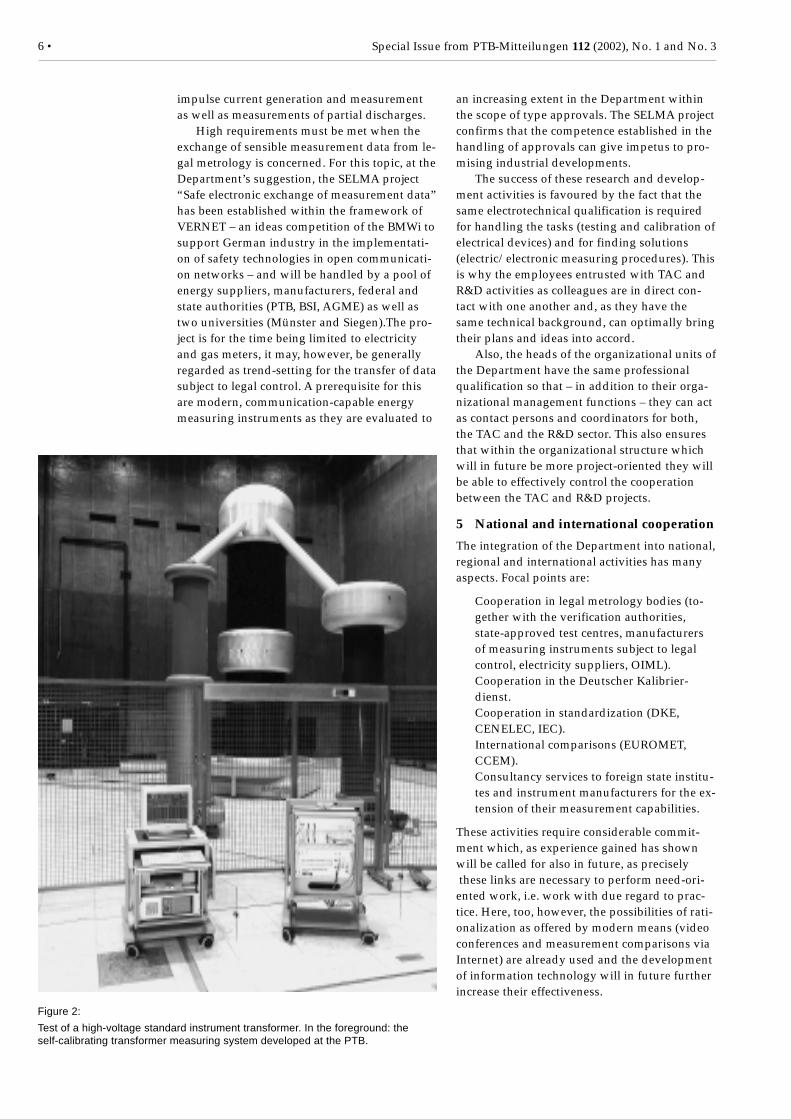
Figure 2:
Test of a high-voltage standard instrument transformer. In the foreground: theself-calibrating transformer measuring system developed at the PTB.
Special Issue from PTB-Mitteilungen 112 (2002), No. 1 and No. 3 • 7
6 Outlook
The future development will have to cope withboth, declining resources (personnel and equip-ment) and unchanging or even increasing require-ments. This challenge can be met only if severalmeasures are combined. Among these are:• Organizational changes to flexibilize the
assignment of the employees, i.e. establish-ment of projects of limited duration to solvespecial development tasks.
• Use of the latest commercial measuringequipment for data acquisition and proces-sing to enable the employees to concentratetheir development capabilities on the dev-elopment of measuring sensors and their ad-justment to the measuring instruments andthe development of the required measure-ment programs (software development).
• Formation of working groups for severalmeasuring instruments, including testing,approval and calibration.
• Thorough analysis of what services can bereduced or outsourced by cooperation withother agencies to allow important new tasksto be taken over.
At PTB/PTR, electrical energy measuring tech-niques have a long tradition which is associatedwith names like H. Schering, R. Vieweg,W. Hohle, E. Zinn, H.-J. Schrader, W. Claussnit-zer and R. Friedl. In the past hundred years, thefocal points of the work have not, however, con-siderably changed. Now as before, the servicessector with type approval, testing and calibrati-on is up against the research and developmentsector dealing with the development of measu-rement procedures and the setting-up of measu-ring facilities. What has fundamentally changedis the technology used which has led to perso-nal computers being universally used in measu-rement procedures and measuring facilities. Notonly has this resulted in more accurate measu-rement results being obtained, but the time re-quired could be considerably reduced. As a re-sult, an extended spectrum of services could beoffered to the electricity suppliers and the veri-fication authorities and the manufacturers ofmeasuring instruments despite their increasedrequirements. It is the central task of the Electri-cal Energy Measuring Techniques Departmentof the PTB to ensure this also in future.
8 • Special Issue from PTB-Mitteilungen 112 (2002), No. 1 and No. 3
1 Introduction
To support consumer protection, the FederalGerman Verification Act prescribes that onlyapproved and verified measuring instrumentsmay be used for invoicing electric energy [1].“Approved” here means that a measuring in-strument type must comply with the legal re-quirements [2], and the PTB tests on the appli-cation of the manufacturer whether this compli-ance is achieved. After type approval has beengranted, electricity meters and instrumenttransformers are verified in one of the approxi-mately 150 state-approved test centres for elec-tricity measuring instruments and only then arethey installed in the electricity supply system.The standard measuring devices used at the testcentres for verification must be tested at regularintervals at the PTB for compliance with the re-quirements of the PTB Testing Instructions[3, 4]. The measuring facilities required for thispurpose are also used for the metrological inspec-tion of instrument types within the scope of accep-tance tests and for comparison with national andinternational standards. In addition, they are usedto calibrate measuring instruments of customersoutside the area subject to legal control.
2 Approvals
For electricity meters and instrument transfor-mers, an informal application for acceptancefor verification, including a description of theconstruction and the technical data of the equip-ment, can be filed with the PTB. Approval isgranted after successful checking of the docu-ments and, where appropriate, testing of aspecimen. Within the scope certified in the ap-proval, the applicant is entitled to manufacturedevices in series and to have them verified by astate-approved test centre. Just like the verifica-tion offices, these institutions which deal exclu-sively with the areas of gas, heat, water andelectricity perform sovereign tasks and are cont-rolled by the supervising verification authorityof the respective federal state.
2.1 Electricity meters
2.1.1 Requirements
In its “Electric energy Measuring Techniques”Department, the PTB grants at the moment typeapprovals for verification for electricity metersof the following instrument categories: motor-operated electricity meters (“induction me-ters”), electronic electricity meters and supple-mentary devices for electricity meters. For theseinstrument categories, the standard require-ments for construction stipulated by verificationlaw have been published as the so-called PTBRequirements 20.1 [5]. For electricity meters,the requirements mainly make reference to in-dustrial standards. For motor-operated meters,these are EN 60521 (for active power) and DINVDE 0418 part 2 (for reactive power). In the caseof electronic electricity meters, a differentiationaccording to class accuracies is to be madebetween EN 60687 (for active power, classes0,2S and 0,5S) and EN 61036 (for active power,classes 1 and 2) on the one hand, and EN 61268(for reactive power, classes 2 and 3) on theother. For supplementary devices, only part ofthe requirements have been explicitly fixed inthe PTB Requirements 20.1, while the standardrequirements for construction are mainly foundin the PTB Requirements 50.6 and 50.7 [6, 7].These requirements apply also to supplementa-ry devices for gas, water and heat measuringdevices which fall within the province of otherPTB Divisions.
As implementation regulation for the verifi-cation of approved electricity meters and sup-plementary devices, i.e. for the official routinetest, the verification authorities and state-appro-ved test centres have to use Volume 6 of the PTBTesting Instructions [3]. This volume is at pre-sent composed of parts A (induction meters), B(electronic electricity meters), C (DC meters)and D (supplementary devices). Part E withspecifications for the equipment of the test labo-ratories is under preparation.
Approval, testing and calibration of equipmentfor electric energy measurements
Hans-Georg Latzel1, Martin Kahmann2, Helmut Seifert3,Andreas Suchy4
1 Dr.-Ing. Hans-GeorgLatzel, employee ofthe PTB’s “Instru-ment Transformersand High-Voltage”Team;e-mail: [email protected]
2 Dr.-Ing. Martin Kah-mann, leader of thePTB’s “Power andEnergy, Pattern Ap-proval” Team;e-mail:[email protected]
3 Dipl.-Ing. HelmutSeifert, employee ofthe PTB’s “Powerand Energy, PatternApproval” Team;e-mail:[email protected]
4 Dipl.-Ing. AndreasSuchy, employee ofthe PTB’s “Powerand Energy, PatternApproval” Team;e-mail:[email protected]
Special Issue from PTB-Mitteilungen 112 (2002), No. 1 and No. 3 • 9
2.1.2 Development of the demand for con-formity testing of electricity metersand supplementary devices
For decades, the demand for PTB approvalsand test certificates for electricity meters andsupplementary devices has shown ups anddowns as the need for certain instrument tech-niques frequently follows the changes in thegeneral conditions. The users then utter theirdemand for appropriate measuring techni-ques more or less at the same time and as a re-sult the development activities and the filingof applications for approval on the part of theinstrument manufacturers also show a certainparallelism, leading to the irregular work loadof the approval authority. Examples of this fromthe past few years are, among others, the con-version of the line voltage from 220 V to 230 V(around 1989), the coming into effect of a newfederal electricity tariff system (around 1990),the publication of VDEW specifications for elec-tronic meters (around 1997) and the liberalizati-on of the electricity market (since 1998).
Due to industrial concentration processesin both, the measuring instruments industryand the public supplies sector, i.e. of those bu-ying measuring instruments, the ups anddowns have, however, flattened since the mid-nineties. Large and established meter manuf-acturers have merged into other companiesand numerous companies of the utility sectormerged as a reaction to the changed competi-tive situation on the liberalized electricitymarket. As a result, the diversity of the de-mand for measuring instruments and, conse-quently, the more or less synchronous need ofthe manufacturers for approvals for many dif-ferent variants have decreased.
The total amount of applications for con-formity tests for electricity meters and supple-mentary devices has not, however, decreasedbut increased. This is above all due to twomarket tendencies:
Innovation dynamics: The increasing capacityof electronic circuits as well as the changefrom analog to the considerably more flexible,software-controlled digital technology leadsto ever shorter development cycles for impro-ved or completely new products also as re-gards electronic meters. As a result of this in-novation dynamics, the number of applicati-ons filed with the PTB is increasing, and newchallenges are to be met as regards the qualifi-cation of the approval personnel. The progressachieved in information technology, which isat the origin of the increased number of appli-cations, must be made use of to adjust the ap-proval processes without increasing the costs
inappropriately. Here, the “E-Government Initi-ative” of the Federal Government serves as va-luable guidance in the field of electricity meterapprovals. Essential information and check listswhich are available on the Department’s Inter-net pages (www.ptb.de/de/org/2/23/234), havehad a noticeable rationalization effect both forthe applicants and for the PTB Sections.
Globalization of trade: The requests for appro-val and for conformity tests have noticeably in-creased on the international level as well. Soservices have been rendered to applicants fromAustria, Denmark, Finland, France, Hungary,Morocco, Nepal, Poland, Romania, Slovenia,Sweden and Turkey. In many cases, the firms donot apply for the PTB certificate to get access tothe German market but because metrologicalcertificates of the PTB still facilitate the exportof measuring instruments into many countriesof the world. The European Measuring Instru-ments Directive (MID) will have a considerableinfluence on the approval procedures, as besi-des type approval, which has so far been manda-tory, some other procedures will provide access tothe market whose effects on the activity of the PTBare not yet clearly seen (see section 5).
2.1.3 Tendencies of the technical develop-ment
More than 95 percent of all electricity metersused in Germany for invoicing are inductionmeters. In more than a hundred years, theirtechnique has been perfected so that the num-ber of approval procedures for new or modifiedinstrument types may be neglected as againstthose for electronic devices. As a consequence,the present operative approval business almostexclusively concerns devices with a marketshare below 5 percent. In view of the drop inprices and operating costs due to the increasedreliability of electronic devices and, comparedwith induction meters, the larger spectrum offunctions, it can, however, be expected that theimportance of electronic meters will in futureaugment considerably, also as regards their use.At present, the efforts of the developers of elec-tronic electricity meters and supplementary de-vices are focussed in particular on the reductionof the production costs (simplification and stan-dardization of sub-assemblies and software),development of smaller physical sizes (e.g.“DIN rail meters”), improvement and extensi-on of communication capabilities (interface im-plementations for service and installation bussystems, protocol standardizations etc.). Forsoftware-controlled devices, a general trend to-wards the centralization of functions can be ob-served. With the costs for data communicationdecreasing, the meters and supplementary de-
10 • Special Issue from PTB-Mitteilungen 112 (2002), No. 1 and No. 3
vices increasingly perform functions which can-not be centralized, i.e. they serve above all forthe remote sensing of measurement values,whereas all other process steps of the formationof measurement results for invoicing are perfor-med centrally.
The PTB recognized these development ten-dencies at a very early stage and thus couldtake them into account. So the internationalstandards have been developed with the activecollaboration of the PTB, and technical solutionshave been elaborated in cooperation with manuf-acturers and users. This ensures that also in futurethe experience the PTB has gained in the handlingof type approvals will benefit the developers ofnew device generations and thus have a positiveimpact on the technical progress.
2.2 Instrument transformers for electricitymeters
2.2.1 Requirements for instrument trans-formers as used for invoicing
Instrument transformers are measuring trans-ducers which transform voltage or currentwithin specified error limits and transmit therelevant data to metering systems. Upon appli-cation of a manufacturer, the PTB grants typeapprovals for the following high-voltage, medi-um-voltage and low-voltage instrument types:inductive current transformers, inductive or ca-pacitive voltage transformers and combinedcurrent and voltage transformers. Granting of atype approval for national verification is basedon the Verification Ordinance and its Appendi-ces and on the PTB Requirements [8]. The latterare accepted rules of technology which havebeen adopted by the Plenary Assembly for Veri-fication Matters (representatives from industry,verification authorities and the PTB). Furtherdetails regarding mechanical transformerconstructions, metrological characteristics and
the marking of the measuring instrument aredescribed in the harmonized European Stan-dards EN 60044-1 foll. [9 to 12] published bythe DIN. Essential information about instru-ment transformers is also available on the In-ternet (www.ptb.de/org/2/23/234).
A new development in the field of typeapprovals relates to the non-conventionallyoperating transformers whose principle isdealt with in a separate article [13]. For thisinstrument type, too, requirements have beenlaid down which have been published asDIN, EN or IEC standards.
As for electricity meters, the PTB has alsopublished regulations for the verification ofinstrument transformers for invoicing: thePTB Testing Instructions “Instrument Trans-formers” which provide guidance for the ve-rification authorities and state-approved testcentres [4].
2.2.2 National type approval for instru-ment transformers in the context ofthe economic development in Europe
Due to the cost pressure the manufacturersfeel as a result of the liberalization of the elec-tricity market, established devices are modi-fied to adjust the price/performance ratio tothe market, as an increase in competition isalso expected from European contenders pro-ducing comparable qualities at lower wagelevels. Due to these changes in the generalconditions, the applications vary strongly forsome instrument types. Another possibility ofcounteracting the ever increasing costs andthus the permanent drop in the sales figuresare mergers of companies or cooperations re-gulated by contract between manufacturersof different products who agree to mutuallyexchange their products.
About one third of the applications comesfrom abroad as, for example, from Austria,Belgium, the Czech Republic, Italy, the Ne-therlands, Poland, Spain and Switzerland.Applicants from these countries frequentlyask the PTB to what extent the results obtai-ned in high-power or accredited test labora-tories are recognized within the scope of thetype approval procedure. As bilateral agree-ments do not exist, decisions are to be takenas the case arises. Measurement results of re-nowned laboratories and also investigations
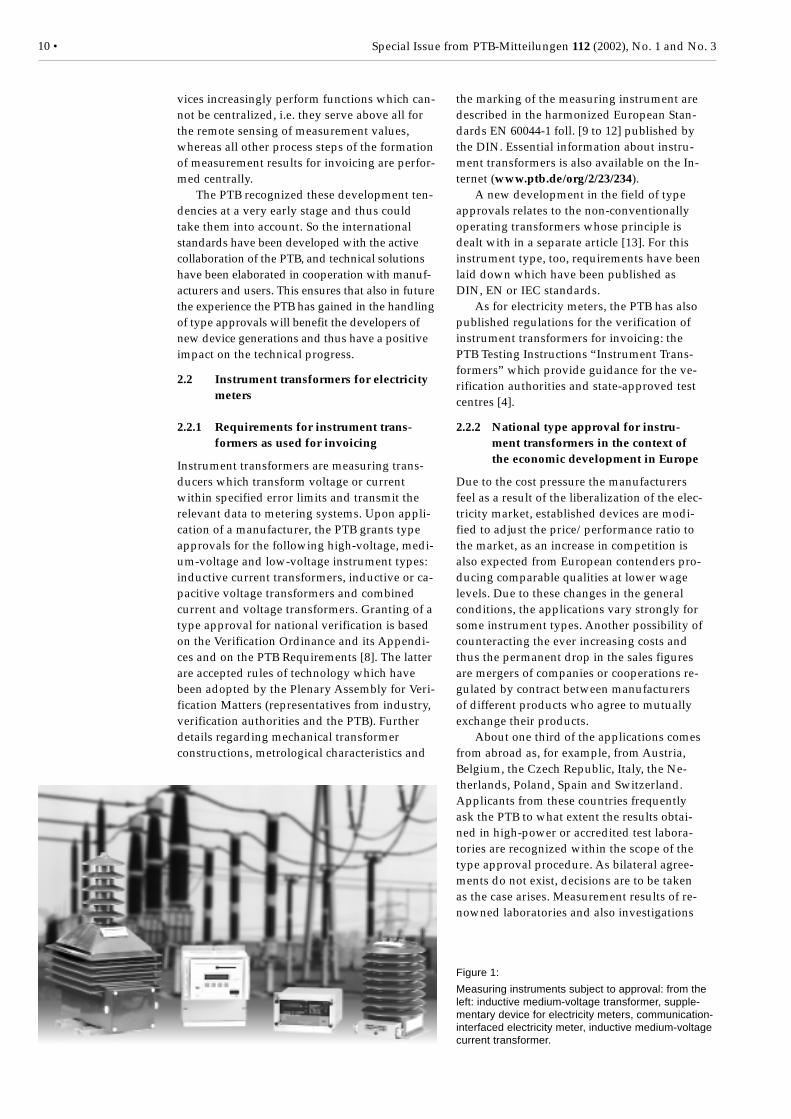
Figure 1:
Measuring instruments subject to approval: from theleft: inductive medium-voltage transformer, supple-mentary device for electricity meters, communication-interfaced electricity meter, inductive medium-voltagecurrent transformer.
Special Issue from PTB-Mitteilungen 112 (2002), No. 1 and No. 3 • 11
by the manufacturer himself, are desirable, asthey provide the confidence in the product to beapproved which is necessary for the evaluation.The communication of test results from accredi-ted foreign laboratories reduces the test effortsof the PTB, provided traceability to the nationalstandard of the Federal Republic of Germany isprovided, for example by intercomparisons.
Others like to make use of the PTB’s reputa-tion as a globally known metrology institute toget access to global markets; this becomes ob-vious when applicants want to get an approvalfor high operating voltages and high currentsthough these are not subject to mandatory veri-fication [2].
The national type approval procedure willprobably be applied also after the EuropeanMeasuring Instruments Directive (MID) has beenintroduced, as the MID draft does not provide anyregulations for instrument transformers.
2.2.3 State of the art and tendencies
Today’s medium and high-voltage instrumenttransformers, for which approvals are appliedfor to the PTB, are insulated with oil-impreg-nated paper, protective gas (SF6) or cast resin.There are no fundamental new developments inthe field of conventional transformers, but in-creased activities to optimize materials and pro-cedures. Automatic or semi-automatic produc-tion is forced up in particular in the range oflow and medium voltage. This allows the pro-duction costs for instrument transformers to beconsiderably reduced while the quality remainsunchanged. Further efforts are made to cut thecosts for verification; fully automatic test standscomplement the automatically operated pro-duction line.
In the field of electric energy measuringtechniques there is a development potentialfor electronic instrument transformers. Litera-ture refers to different measurement principleswhose realization in commercial measuring in-struments does not depend on technical experti-se but rather on the demand of the energy mar-ket. The future will show if the approach ofelectronic acquisition and digital processing upto conceivable online structures can also be rea-lized for invoicing (for instrument transformers,examples exist already in the area of protec-tion). This topic is dealt with in another contri-bution [13].
As in the case of electricity meters (see2.1.3), the PTB also collaborates in drawing upfuture standards for instrument transformersand brings its technical competence to bear inthe development of new devices. At the sametime, the testing technique required for the newdevices is developed so that type approvals canbe immediately handled for the latest technolo-
gy as well.
3 Testing
After type approval has been granted, everysingle electricity meter or instrument transfor-mer for invoicing is to be verified at a state-ap-proved test centre for electricity measuring in-struments. Upon verification, first the externalcharacteristics and the inscriptions are compa-red with the information given in the approvalcertificate (conformity test). Then the metrologi-cal tests are performed in accordance with thePTB Testing Instructions (accuracy test). If therequirements are met and the error limits com-plied with, verification is documented by appli-cation of the principal verification mark. The fa-cilities of the test centre required for the metro-logical tests must comply with the requirementsspecified in the PTB Testing Instructions.
3.1 Meter test
In Germany state-approved test centres for elec-tricity use substandard meters to verify electri-city meters. Whether these devices are suitablefor this purpose is checked by the PTB’s “Powerand Energy, Pattern Approval” Team. Beforethey are used for the first time or after theyhave been opened or repaired, all substandardmeters used in Germany for legal metrologypurposes must be checked for accuracy. Toensure permanent control, the test centres checkthe meters every three months on their own re-sponsibility and record the results. Checks ofthis kind are mainly performed with compara-tors. In contrast to test certificates for substan-dard meters, the validity of test certificates forcomparators, which are also checked at thePTB’s “Electricity Meters” Section, is limited intime. The period of validity depends on the ex-tent to which the device has changed with re-spect to the previous test; it generally variesbetween three and five years. Comparators areinspected by the test centres against chemicalstandard elements or with electronic DC voltagereferences. These devices are also checked bythe PTB.
3.1.1 Substandard meters
In the past decade, decisive changes have takenplace in test equipment technology. The measu-rement uncertainties specified by the manufac-turers have been improved from ± 0,1 % to± 0,02 %. Today, most manufacturers use digitalmeasurement procedures and offer a large num-ber of options, such as harmonics analysis, pha-se angle and phase frequency measurement aswell as a great number of measuring modes(three and four wire active volt-ampere con-sumption as well as different measuring modesfor three and four wire reactive volt-ampere
12 • Special Issue from PTB-Mitteilungen 112 (2002), No. 1 and No. 3
consumption).All substandard meters are provided with at
least one output which emits pulses proportio-nal to the power applied. These pulses are usedfor external, and sometimes also for internal, er-ror calculators determining the measurementdeviations of the test units upon verification. Itis, therefore, of utmost interest to determine themeasurement deviations of the standard metersat the meter pulse output. In this case too acomparison measurement between a referencedevice with known measurement deviationsand one or several test units is carried out.
Modern substandard meters have at leastone interface so that they can be read and con-trolled by a computer. The test quantities simul-taneously available at the reference device andat the test units can also be controlled by com-puter. This allows test sequences to be perfor-med automatically.
The points for testing at the PTB are selectedtaking the requirements of legal metrology intoaccount. Due to this fact and the large diversityof the meters used for invoicing, the number ofpotential test points is very great. For event me-ters, there are up to 160 test points at differentvoltages, currents, power factors and measuringmodes which are automatically checked in suc-cession.
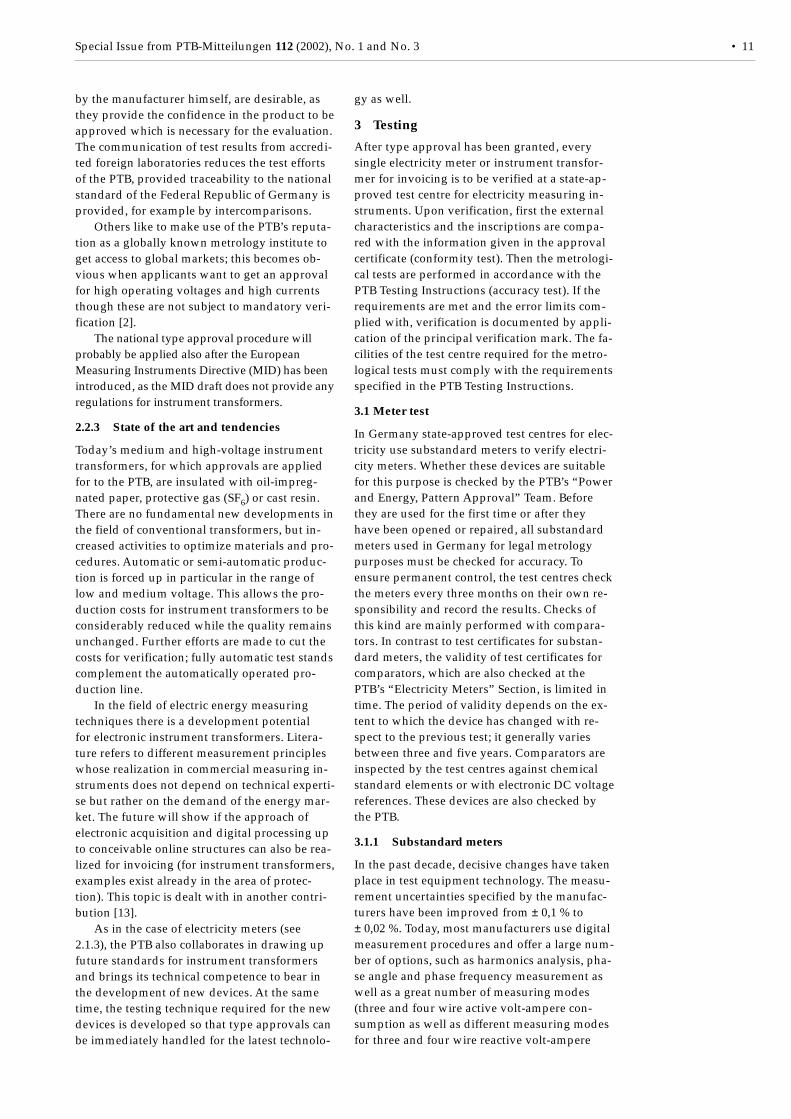
In the course of the test, at least one test unitand the PTB reference device are fed from athree-phase electronic supply unit (Figure 2)which is composed of three current and threevoltage amplifiers triggered by a generator. For
legal metrology, tests are performed almost exclu-sively at 50 Hz. Exceptions are tests at 16 2/3 Hzwhich are performed at some test centres veri-fying energy meters for railway traction current.The adjustment of current and voltage amplitu-des, phase angles and frequency is computer-controlled. Then all devices are set to the cur-rent and voltage ranges, which are optimal forthe load level adjusted, and to the measuringmode. The test program now calculates thenumber of pulses required to guarantee suffi-cient resolution of the measurement results. Theoutput pulses of the standard meter are compa-red with those of the test units via a gate circuit.From several measurement values, mean valuesand standard deviations are formed.
The measuring facility is in a position to ge-nerate and measure voltages from 30 V to 500 Vas well as currents from 3 mA to 125 A at fre-quencies between 15 Hz and 70 Hz.
3.1.2 Comparators
The comparators have also been further devel-oped: in the past, they were single-phase de-vices, whereas they have now three phases andoffer the same options (measuring modes, har-monics analysis etc.) as substandard meters.Their measurement uncertainty lies within± 0,01 %. They are provided with a DC voltageinput for 1,018 75 V to which a standard cell oran electronic voltage standard is connected forself-checking. Modern comparators can also useother voltages. The exactly known magnitude ofthe voltage is entered, and the devices calculate
Figure 2:
Principle of the test cir-cuit for testing or calibra-ting substandard meters:three-phase supply unit(source), test unit andstandard measuring in-strument, multi-channelmeter for determinationof the output pulses oftest units and standardmeasuring instrument aswell as PC with inter-faces.
Special Issue from PTB-Mitteilungen 112 (2002), No. 1 and No. 3 • 13
the deviations from the internally measuredvoltage values. The devices then show theirintrinsic errors for all components to which DCvoltage can be applied as well. Current or volta-ge transformers and low-resistance input modu-les are not taken into account.
The measurement deviations of the powermeasurements are determined by comparisonof measurements with devices whose deviationsare known. These are determined at regular in-tervals by comparison with the national stan-dard of the PTB.
3.2 Instrument transformer test
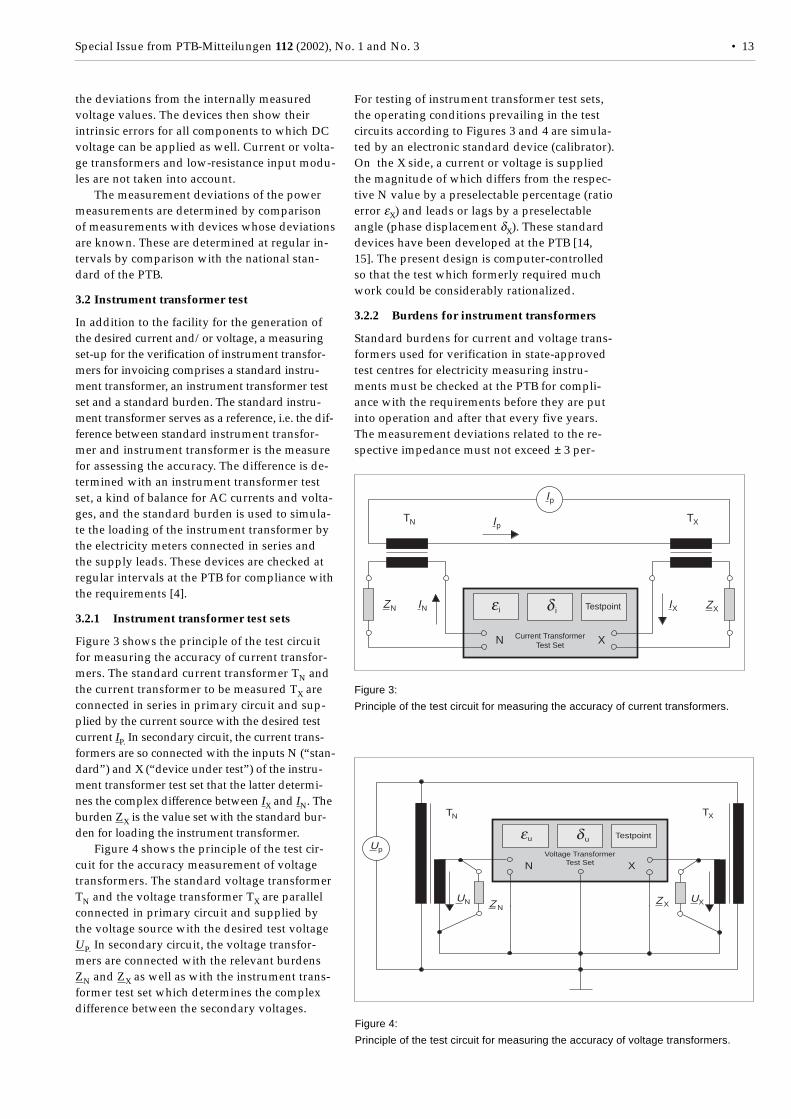
In addition to the facility for the generation ofthe desired current and/or voltage, a measuringset-up for the verification of instrument transfor-mers for invoicing comprises a standard instru-ment transformer, an instrument transformer testset and a standard burden. The standard instru-ment transformer serves as a reference, i.e. the dif-ference between standard instrument transfor-mer and instrument transformer is the measurefor assessing the accuracy. The difference is de-termined with an instrument transformer testset, a kind of balance for AC currents and volta-ges, and the standard burden is used to simula-te the loading of the instrument transformer bythe electricity meters connected in series andthe supply leads. These devices are checked atregular intervals at the PTB for compliance withthe requirements [4].
3.2.1 Instrument transformer test sets
Figure 3 shows the principle of the test circuitfor measuring the accuracy of current transfor-mers. The standard current transformer TN andthe current transformer to be measured TX areconnected in series in primary circuit and sup-plied by the current source with the desired testcurrent IP. In secondary circuit, the current trans-formers are so connected with the inputs N (“stan-dard”) and X (“device under test”) of the instru-ment transformer test set that the latter determi-nes the complex difference between IX and IN. Theburden ZX is the value set with the standard bur-den for loading the instrument transformer.
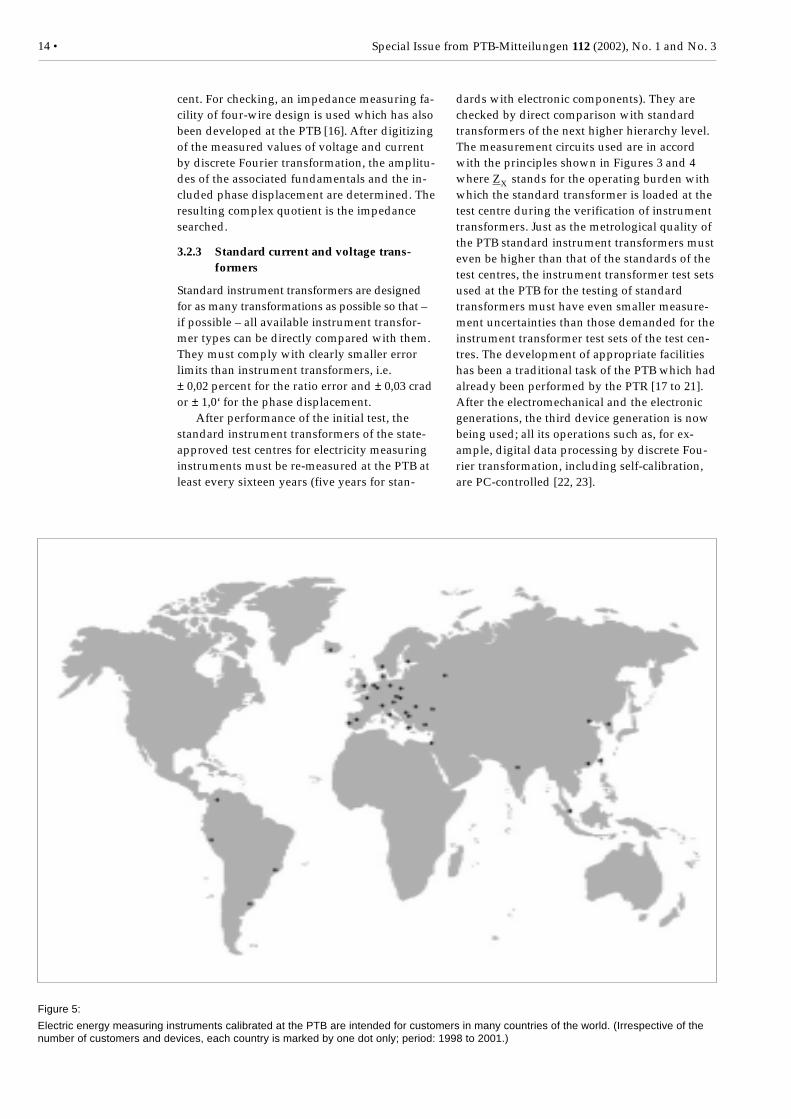
Figure 4 shows the principle of the test cir-cuit for the accuracy measurement of voltagetransformers. The standard voltage transformerTN and the voltage transformer TX are parallelconnected in primary circuit and supplied bythe voltage source with the desired test voltageUP. In secondary circuit, the voltage transfor-mers are connected with the relevant burdensZN and ZX as well as with the instrument trans-former test set which determines the complexdifference between the secondary voltages.
For testing of instrument transformer test sets,the operating conditions prevailing in the testcircuits according to Figures 3 and 4 are simula-ted by an electronic standard device (calibrator).On the X side, a current or voltage is suppliedthe magnitude of which differs from the respec-tive N value by a preselectable percentage (ratioerror εX) and leads or lags by a preselectableangle (phase displacement δX). These standarddevices have been developed at the PTB [14,15]. The present design is computer-controlledso that the test which formerly required muchwork could be considerably rationalized.
3.2.2 Burdens for instrument transformers
Standard burdens for current and voltage trans-formers used for verification in state-approvedtest centres for electricity measuring instru-ments must be checked at the PTB for compli-ance with the requirements before they are putinto operation and after that every five years.The measurement deviations related to the re-spective impedance must not exceed ± 3 per-
ZN IN ZXIX
TXIpTN
Ip
N X
Testpoint
Current TransformerTest Set
εi δ i
N X
Testpoint
Voltage TransformerTest Set
εu δuUp
UN Z NZ X
UX
TN TX
Figure 4:
Principle of the test circuit for measuring the accuracy of voltage transformers.
Figure 3:
Principle of the test circuit for measuring the accuracy of current transformers.
14 • Special Issue from PTB-Mitteilungen 112 (2002), No. 1 and No. 3
cent. For checking, an impedance measuring fa-cility of four-wire design is used which has alsobeen developed at the PTB [16]. After digitizingof the measured values of voltage and currentby discrete Fourier transformation, the amplitu-des of the associated fundamentals and the in-cluded phase displacement are determined. Theresulting complex quotient is the impedancesearched.
3.2.3 Standard current and voltage trans-formers
Standard instrument transformers are designedfor as many transformations as possible so that –if possible – all available instrument transfor-mer types can be directly compared with them.They must comply with clearly smaller errorlimits than instrument transformers, i.e.± 0,02 percent for the ratio error and ± 0,03 crador ± 1,0‘ for the phase displacement.
After performance of the initial test, thestandard instrument transformers of the state-approved test centres for electricity measuringinstruments must be re-measured at the PTB atleast every sixteen years (five years for stan-
dards with electronic components). They arechecked by direct comparison with standardtransformers of the next higher hierarchy level.The measurement circuits used are in accordwith the principles shown in Figures 3 and 4where ZX stands for the operating burden withwhich the standard transformer is loaded at thetest centre during the verification of instrumenttransformers. Just as the metrological quality ofthe PTB standard instrument transformers musteven be higher than that of the standards of thetest centres, the instrument transformer test setsused at the PTB for the testing of standardtransformers must have even smaller measure-ment uncertainties than those demanded for theinstrument transformer test sets of the test cen-tres. The development of appropriate facilitieshas been a traditional task of the PTB which hadalready been performed by the PTR [17 to 21].After the electromechanical and the electronicgenerations, the third device generation is nowbeing used; all its operations such as, for ex-ample, digital data processing by discrete Fou-rier transformation, including self-calibration,are PC-controlled [22, 23].
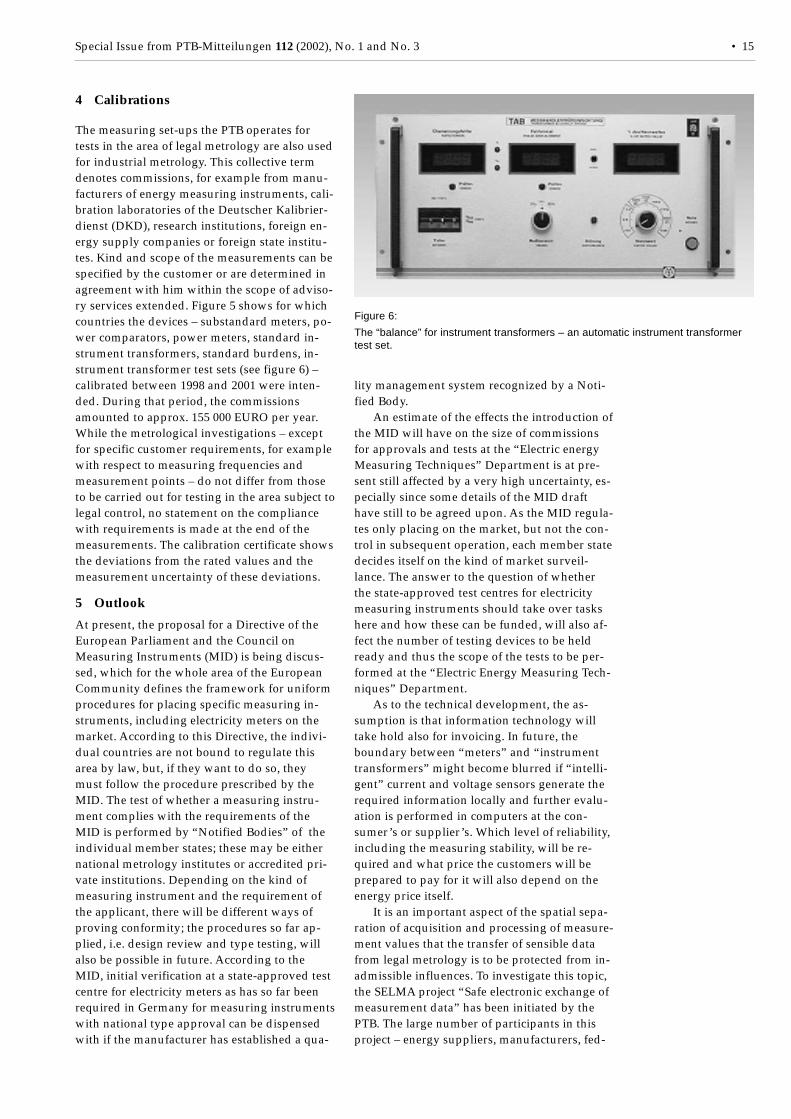
Figure 5:
Electric energy measuring instruments calibrated at the PTB are intended for customers in many countries of the world. (Irrespective of thenumber of customers and devices, each country is marked by one dot only; period: 1998 to 2001.)
Special Issue from PTB-Mitteilungen 112 (2002), No. 1 and No. 3 • 15
4 Calibrations
The measuring set-ups the PTB operates fortests in the area of legal metrology are also usedfor industrial metrology. This collective termdenotes commissions, for example from manu-facturers of energy measuring instruments, cali-bration laboratories of the Deutscher Kalibrier-dienst (DKD), research institutions, foreign en-ergy supply companies or foreign state institu-tes. Kind and scope of the measurements can bespecified by the customer or are determined inagreement with him within the scope of adviso-ry services extended. Figure 5 shows for whichcountries the devices – substandard meters, po-wer comparators, power meters, standard in-strument transformers, standard burdens, in-strument transformer test sets (see figure 6) –calibrated between 1998 and 2001 were inten-ded. During that period, the commissionsamounted to approx. 155 000 EURO per year.While the metrological investigations – exceptfor specific customer requirements, for examplewith respect to measuring frequencies andmeasurement points – do not differ from thoseto be carried out for testing in the area subject tolegal control, no statement on the compliancewith requirements is made at the end of themeasurements. The calibration certificate showsthe deviations from the rated values and themeasurement uncertainty of these deviations.
5 Outlook
At present, the proposal for a Directive of theEuropean Parliament and the Council onMeasuring Instruments (MID) is being discus-sed, which for the whole area of the EuropeanCommunity defines the framework for uniformprocedures for placing specific measuring in-struments, including electricity meters on themarket. According to this Directive, the indivi-dual countries are not bound to regulate thisarea by law, but, if they want to do so, theymust follow the procedure prescribed by theMID. The test of whether a measuring instru-ment complies with the requirements of theMID is performed by “Notified Bodies” of theindividual member states; these may be eithernational metrology institutes or accredited pri-vate institutions. Depending on the kind ofmeasuring instrument and the requirement ofthe applicant, there will be different ways ofproving conformity; the procedures so far ap-plied, i.e. design review and type testing, willalso be possible in future. According to theMID, initial verification at a state-approved testcentre for electricity meters as has so far beenrequired in Germany for measuring instrumentswith national type approval can be dispensedwith if the manufacturer has established a qua-
lity management system recognized by a Noti-fied Body.
An estimate of the effects the introduction ofthe MID will have on the size of commissionsfor approvals and tests at the “Electric energyMeasuring Techniques” Department is at pre-sent still affected by a very high uncertainty, es-pecially since some details of the MID drafthave still to be agreed upon. As the MID regula-tes only placing on the market, but not the con-trol in subsequent operation, each member statedecides itself on the kind of market surveil-lance. The answer to the question of whetherthe state-approved test centres for electricitymeasuring instruments should take over taskshere and how these can be funded, will also af-fect the number of testing devices to be heldready and thus the scope of the tests to be per-formed at the “Electric Energy Measuring Tech-niques” Department.
As to the technical development, the as-sumption is that information technology willtake hold also for invoicing. In future, theboundary between “meters” and “instrumenttransformers” might become blurred if “intelli-gent” current and voltage sensors generate therequired information locally and further evalu-ation is performed in computers at the con-sumer’s or supplier’s. Which level of reliability,including the measuring stability, will be re-quired and what price the customers will beprepared to pay for it will also depend on theenergy price itself.
It is an important aspect of the spatial sepa-ration of acquisition and processing of measure-ment values that the transfer of sensible datafrom legal metrology is to be protected from in-admissible influences. To investigate this topic,the SELMA project “Safe electronic exchange ofmeasurement data” has been initiated by thePTB. The large number of participants in thisproject – energy suppliers, manufacturers, fed-
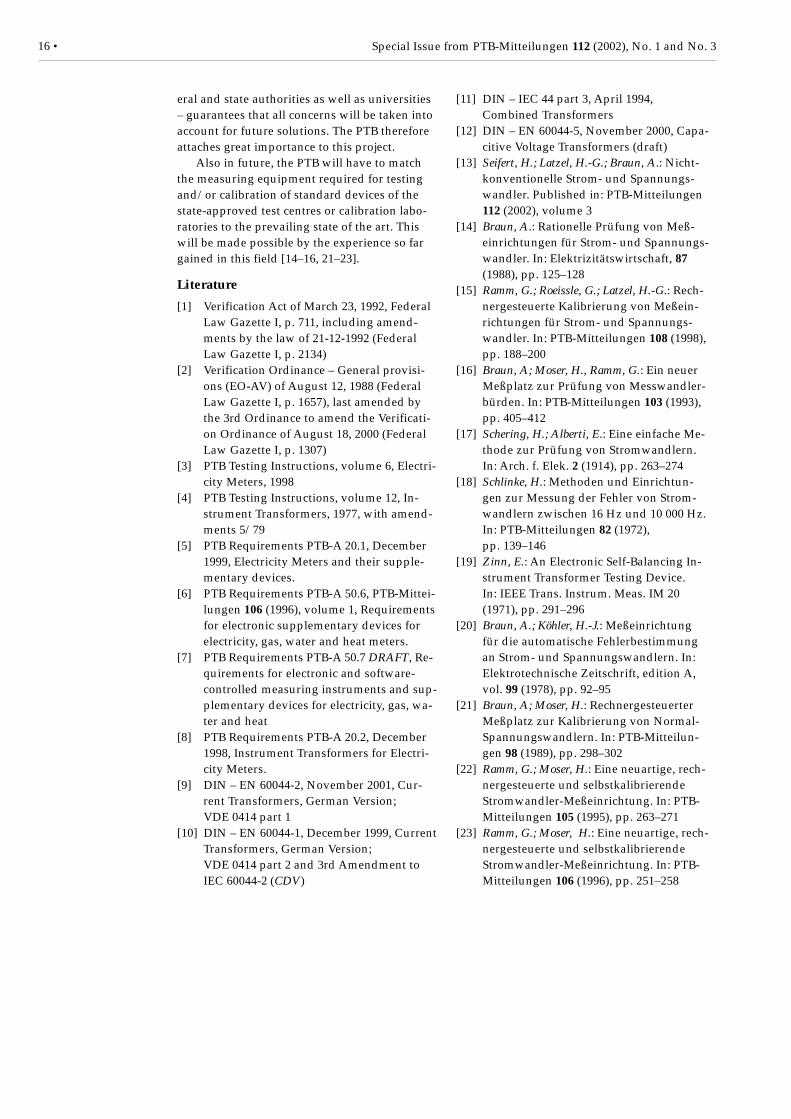
Figure 6:
The “balance” for instrument transformers – an automatic instrument transformertest set.
16 • Special Issue from PTB-Mitteilungen 112 (2002), No. 1 and No. 3
eral and state authorities as well as universities– guarantees that all concerns will be taken intoaccount for future solutions. The PTB thereforeattaches great importance to this project.
Also in future, the PTB will have to matchthe measuring equipment required for testingand/or calibration of standard devices of thestate-approved test centres or calibration labo-ratories to the prevailing state of the art. Thiswill be made possible by the experience so fargained in this field [14–16, 21–23].
Literature
[1] Verification Act of March 23, 1992, FederalLaw Gazette I, p. 711, including amend-ments by the law of 21-12-1992 (FederalLaw Gazette I, p. 2134)
[2] Verification Ordinance – General provisi-ons (EO-AV) of August 12, 1988 (FederalLaw Gazette I, p. 1657), last amended bythe 3rd Ordinance to amend the Verificati-on Ordinance of August 18, 2000 (FederalLaw Gazette I, p. 1307)
[3] PTB Testing Instructions, volume 6, Electri-city Meters, 1998
[4] PTB Testing Instructions, volume 12, In-strument Transformers, 1977, with amend-ments 5/79
[5] PTB Requirements PTB-A 20.1, December1999, Electricity Meters and their supple-mentary devices.
[6] PTB Requirements PTB-A 50.6, PTB-Mittei-lungen 106 (1996), volume 1, Requirementsfor electronic supplementary devices forelectricity, gas, water and heat meters.
[7] PTB Requirements PTB-A 50.7 DRAFT, Re-quirements for electronic and software-controlled measuring instruments and sup-plementary devices for electricity, gas, wa-ter and heat
[8] PTB Requirements PTB-A 20.2, December1998, Instrument Transformers for Electri-city Meters.
[9] DIN – EN 60044-2, November 2001, Cur-rent Transformers, German Version;VDE 0414 part 1
[10] DIN – EN 60044-1, December 1999, CurrentTransformers, German Version;VDE 0414 part 2 and 3rd Amendment toIEC 60044-2 (CDV)
[11] DIN – IEC 44 part 3, April 1994,Combined Transformers
[12] DIN – EN 60044-5, November 2000, Capa-citive Voltage Transformers (draft)
[13] Seifert, H.; Latzel, H.-G.; Braun, A.: Nicht-konventionelle Strom- und Spannungs-wandler. Published in: PTB-Mitteilungen112 (2002), volume 3
[14] Braun, A.: Rationelle Prüfung von Meß-einrichtungen für Strom- und Spannungs-wandler. In: Elektrizitätswirtschaft, 87(1988), pp. 125–128
[15] Ramm, G.; Roeissle, G.; Latzel, H.-G.: Rech-nergesteuerte Kalibrierung von Meßein-richtungen für Strom- und Spannungs-wandler. In: PTB-Mitteilungen 108 (1998),pp. 188–200
[16] Braun, A; Moser, H., Ramm, G.: Ein neuerMeßplatz zur Prüfung von Messwandler-bürden. In: PTB-Mitteilungen 103 (1993),pp. 405–412
[17] Schering, H.; Alberti, E.: Eine einfache Me-thode zur Prüfung von Stromwandlern.In: Arch. f. Elek. 2 (1914), pp. 263–274
[18] Schlinke, H.: Methoden und Einrichtun-gen zur Messung der Fehler von Strom-wandlern zwischen 16 Hz und 10 000 Hz.In: PTB-Mitteilungen 82 (1972),pp. 139–146
[19] Zinn, E.: An Electronic Self-Balancing In-strument Transformer Testing Device.In: IEEE Trans. Instrum. Meas. IM 20(1971), pp. 291–296
[20] Braun, A.; Köhler, H.-J.: Meßeinrichtungfür die automatische Fehlerbestimmungan Strom- und Spannungswandlern. In:Elektrotechnische Zeitschrift, edition A,vol. 99 (1978), pp. 92–95
[21] Braun, A; Moser, H.: RechnergesteuerterMeßplatz zur Kalibrierung von Normal-Spannungswandlern. In: PTB-Mitteilun-gen 98 (1989), pp. 298–302
[22] Ramm, G.; Moser, H.: Eine neuartige, rech-nergesteuerte und selbstkalibrierendeStromwandler-Meßeinrichtung. In: PTB-Mitteilungen 105 (1995), pp. 263–271
[23] Ramm, G.; Moser, H.: Eine neuartige, rech-nergesteuerte und selbstkalibrierendeStromwandler-Meßeinrichtung. In: PTB-Mitteilungen 106 (1996), pp. 251–258
Special Issue from PTB-Mitteilungen 112 (2002), No. 1 and No. 3 • 17
PTB Standard Measuring Devices for Electric AC Power
Günther Ramm1, Harald Moser2, Rainer Bergeest3,Waldemar Guilherme Kürten Ihlenfeld4
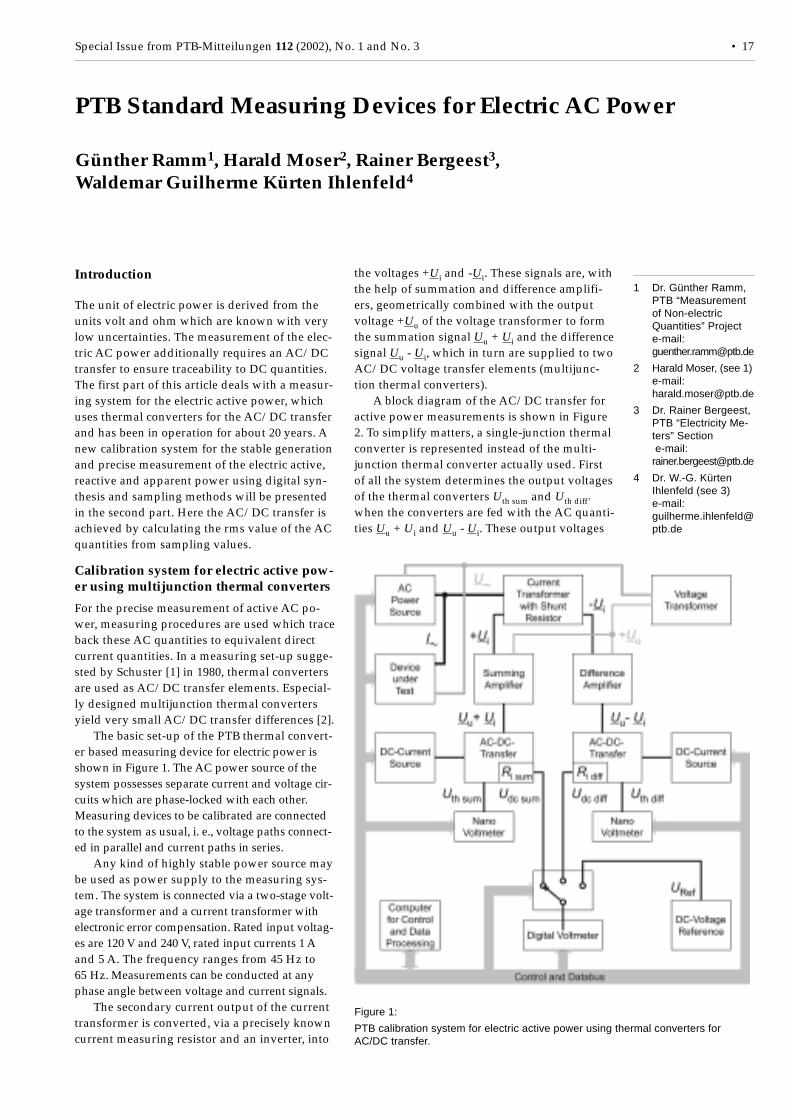
Figure 1:
PTB calibration system for electric active power using thermal converters forAC/DC transfer.
1 Dr. Günther Ramm,PTB “Measurementof Non-electricQuantities” Projecte-mail:[email protected]
2 Harald Moser, (see 1)e-mail:[email protected]
3 Dr. Rainer Bergeest,PTB “Electricity Me-ters” Section e-mail:[email protected]
4 Dr. W.-G. KürtenIhlenfeld (see 3)e-mail:[email protected]
Introduction
The unit of electric power is derived from theunits volt and ohm which are known with verylow uncertainties. The measurement of the elec-tric AC power additionally requires an AC/DCtransfer to ensure traceability to DC quantities.The first part of this article deals with a measur-ing system for the electric active power, whichuses thermal converters for the AC/DC transferand has been in operation for about 20 years. Anew calibration system for the stable generationand precise measurement of the electric active,reactive and apparent power using digital syn-thesis and sampling methods will be presentedin the second part. Here the AC/DC transfer isachieved by calculating the rms value of the ACquantities from sampling values.
Calibration system for electric active pow-er using multijunction thermal converters
For the precise measurement of active AC po-wer, measuring procedures are used which traceback these AC quantities to equivalent directcurrent quantities. In a measuring set-up sugge-sted by Schuster [1] in 1980, thermal convertersare used as AC/DC transfer elements. Especial-ly designed multijunction thermal convertersyield very small AC/DC transfer differences [2].
The basic set-up of the PTB thermal convert-er based measuring device for electric power isshown in Figure 1. The AC power source of thesystem possesses separate current and voltage cir-cuits which are phase-locked with each other.Measuring devices to be calibrated are connectedto the system as usual, i. e., voltage paths connect-ed in parallel and current paths in series.
Any kind of highly stable power source maybe used as power supply to the measuring sys-tem. The system is connected via a two-stage volt-age transformer and a current transformer withelectronic error compensation. Rated input voltag-es are 120 V and 240 V, rated input currents 1 Aand 5 A. The frequency ranges from 45 Hz to65 Hz. Measurements can be conducted at anyphase angle between voltage and current signals.
The secondary current output of the currenttransformer is converted, via a precisely knowncurrent measuring resistor and an inverter, into
the voltages +Ui and -Ui. These signals are, withthe help of summation and difference amplifi-ers, geometrically combined with the outputvoltage +Uu of the voltage transformer to formthe summation signal Uu + Ui and the differencesignal Uu - Ui, which in turn are supplied to twoAC/DC voltage transfer elements (multijunc-tion thermal converters).
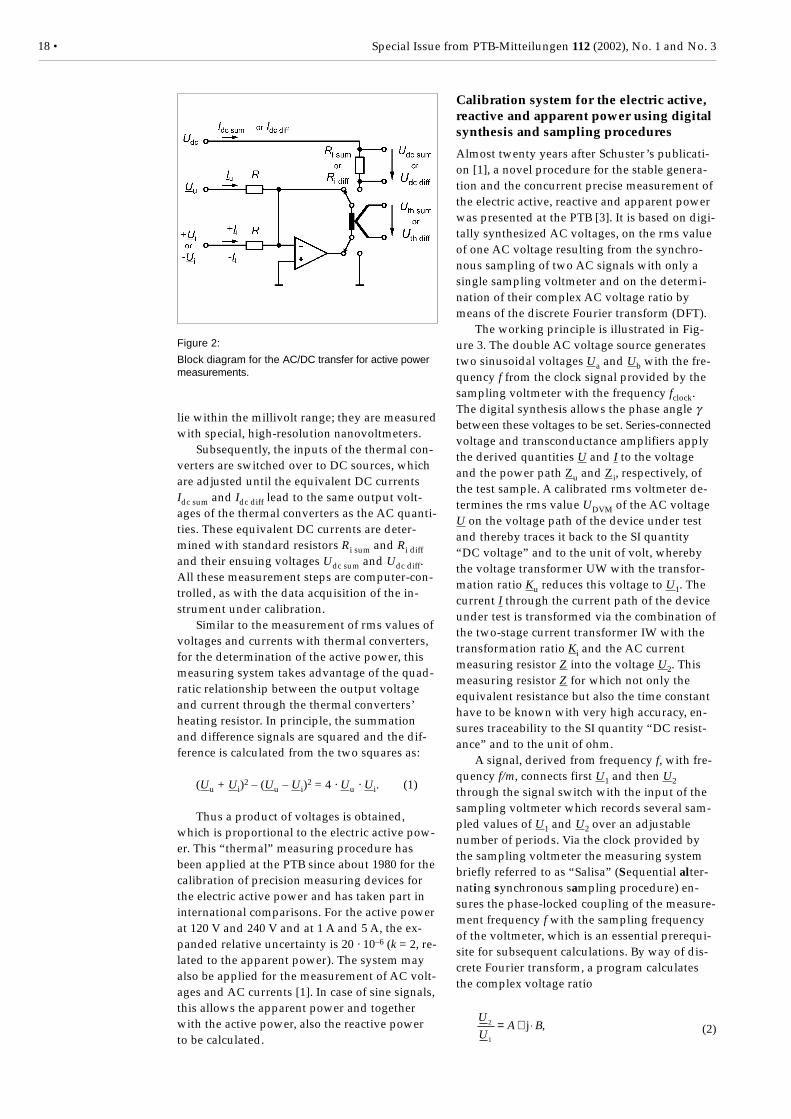
A block diagram of the AC/DC transfer foractive power measurements is shown in Figure2. To simplify matters, a single-junction thermalconverter is represented instead of the multi-junction thermal converter actually used. Firstof all the system determines the output voltagesof the thermal converters Uth sum and Uth diff’when the converters are fed with the AC quanti-ties Uu + Ui and Uu - Ui. These output voltages
18 • Special Issue from PTB-Mitteilungen 112 (2002), No. 1 and No. 3
Figure 2:
Block diagram for the AC/DC transfer for active powermeasurements.
lie within the millivolt range; they are measuredwith special, high-resolution nanovoltmeters.
Subsequently, the inputs of the thermal con-verters are switched over to DC sources, whichare adjusted until the equivalent DC currentsIdc sum and Idc diff lead to the same output volt-ages of the thermal converters as the AC quanti-ties. These equivalent DC currents are deter-mined with standard resistors Ri sum and Ri diffand their ensuing voltages Udc sum and Udc diff.All these measurement steps are computer-con-trolled, as with the data acquisition of the in-strument under calibration.
Similar to the measurement of rms values ofvoltages and currents with thermal converters,for the determination of the active power, thismeasuring system takes advantage of the quad-ratic relationship between the output voltageand current through the thermal converters’heating resistor. In principle, the summationand difference signals are squared and the dif-ference is calculated from the two squares as:
(Uu + Ui)2 – (Uu – Ui)2 = 4 · Uu · Ui. (1)
Thus a product of voltages is obtained,which is proportional to the electric active pow-er. This “thermal” measuring procedure hasbeen applied at the PTB since about 1980 for thecalibration of precision measuring devices forthe electric active power and has taken part ininternational comparisons. For the active powerat 120 V and 240 V and at 1 A and 5 A, the ex-panded relative uncertainty is 20 · 10–6 (k = 2, re-lated to the apparent power). The system mayalso be applied for the measurement of AC volt-ages and AC currents [1]. In case of sine signals,this allows the apparent power and togetherwith the active power, also the reactive powerto be calculated.
Calibration system for the electric active,reactive and apparent power using digitalsynthesis and sampling procedures
Almost twenty years after Schuster’s publicati-on [1], a novel procedure for the stable genera-tion and the concurrent precise measurement ofthe electric active, reactive and apparent powerwas presented at the PTB [3]. It is based on digi-tally synthesized AC voltages, on the rms valueof one AC voltage resulting from the synchro-nous sampling of two AC signals with only asingle sampling voltmeter and on the determi-nation of their complex AC voltage ratio bymeans of the discrete Fourier transform (DFT).
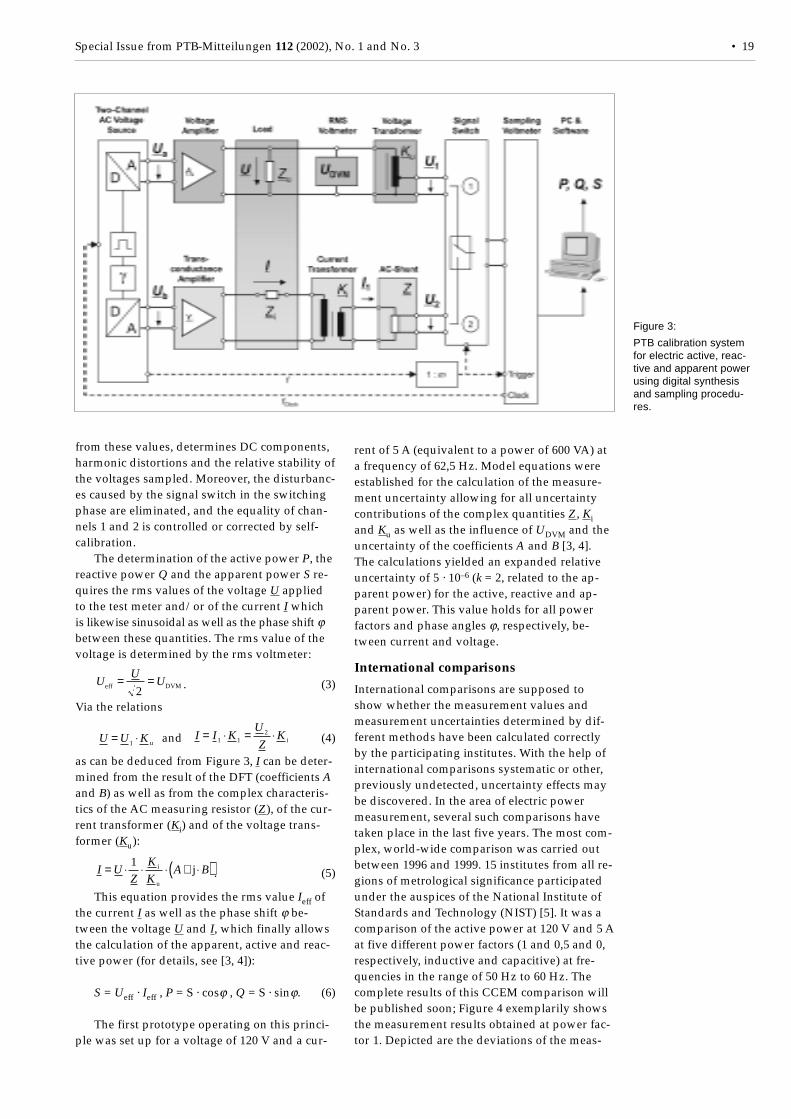
The working principle is illustrated in Fig-ure 3. The double AC voltage source generatestwo sinusoidal voltages Ua and Ub with the fre-quency f from the clock signal provided by thesampling voltmeter with the frequency fclock.The digital synthesis allows the phase angle γbetween these voltages to be set. Series-connectedvoltage and transconductance amplifiers applythe derived quantities U and I to the voltageand the power path Zu and Zi, respectively, ofthe test sample. A calibrated rms voltmeter de-termines the rms value UDVM of the AC voltageU on the voltage path of the device under testand thereby traces it back to the SI quantity“DC voltage” and to the unit of volt, wherebythe voltage transformer UW with the transfor-mation ratio Ku reduces this voltage to U1. Thecurrent I through the current path of the deviceunder test is transformed via the combination ofthe two-stage current transformer IW with thetransformation ratio Ki and the AC currentmeasuring resistor Z into the voltage U2. Thismeasuring resistor Z for which not only theequivalent resistance but also the time constanthave to be known with very high accuracy, en-sures traceability to the SI quantity “DC resist-ance” and to the unit of ohm.
A signal, derived from frequency f, with fre-quency f/m, connects first U1 and then U2through the signal switch with the input of thesampling voltmeter which records several sam-pled values of U1 and U2 over an adjustablenumber of periods. Via the clock provided bythe sampling voltmeter the measuring systembriefly referred to as “Salisa” (Sequential alter-nating synchronous sampling procedure) en-sures the phase-locked coupling of the measure-ment frequency f with the sampling frequencyof the voltmeter, which is an essential prerequi-site for subsequent calculations. By way of dis-crete Fourier transform, a program calculatesthe complex voltage ratio
U
UA B2
1
= + ⋅j , (2)
Special Issue from PTB-Mitteilungen 112 (2002), No. 1 and No. 3 • 19
Figure 3:
PTB calibration systemfor electric active, reac-tive and apparent powerusing digital synthesisand sampling procedu-res.
from these values, determines DC components,harmonic distortions and the relative stability ofthe voltages sampled. Moreover, the disturbanc-es caused by the signal switch in the switchingphase are eliminated, and the equality of chan-nels 1 and 2 is controlled or corrected by self-calibration.
The determination of the active power P, thereactive power Q and the apparent power S re-quires the rms values of the voltage U appliedto the test meter and/or of the current I whichis likewise sinusoidal as well as the phase shift ϕbetween these quantities. The rms value of thevoltage is determined by the rms voltmeter:
U
UUeff DVM= =
2. (3)
Via the relations
U U K= ⋅1 u and I I K
U
ZK= ⋅ = ⋅1 1
2i (4)
as can be deduced from Figure 3, I can be deter-mined from the result of the DFT (coefficients Aand B) as well as from the complex characteris-tics of the AC measuring resistor (Z), of the cur-rent transformer (Ki) and of the voltage trans-former (Ku):
I U
Z
K
KA B= ⋅ ⋅ ⋅ + ⋅( )1 i
u
j . (5)
This equation provides the rms value Ieff ofthe current I as well as the phase shift ϕ be-tween the voltage U and I, which finally allowsthe calculation of the apparent, active and reac-tive power (for details, see [3, 4]):
S = Ueff · Ieff , P = S · cosϕ , Q = S · sinϕ. (6)
The first prototype operating on this princi-ple was set up for a voltage of 120 V and a cur-
rent of 5 A (equivalent to a power of 600 VA) ata frequency of 62,5 Hz. Model equations wereestablished for the calculation of the measure-ment uncertainty allowing for all uncertaintycontributions of the complex quantities Z, Kiand Ku as well as the influence of UDVM and theuncertainty of the coefficients A and B [3, 4].The calculations yielded an expanded relativeuncertainty of 5 · 10–6 (k = 2, related to the ap-parent power) for the active, reactive and ap-parent power. This value holds for all powerfactors and phase angles ϕ, respectively, be-tween current and voltage.
International comparisons
International comparisons are supposed toshow whether the measurement values andmeasurement uncertainties determined by dif-ferent methods have been calculated correctlyby the participating institutes. With the help ofinternational comparisons systematic or other,previously undetected, uncertainty effects maybe discovered. In the area of electric powermeasurement, several such comparisons havetaken place in the last five years. The most com-plex, world-wide comparison was carried outbetween 1996 and 1999. 15 institutes from all re-gions of metrological significance participatedunder the auspices of the National Institute ofStandards and Technology (NIST) [5]. It was acomparison of the active power at 120 V and 5 Aat five different power factors (1 and 0,5 and 0,respectively, inductive and capacitive) at fre-quencies in the range of 50 Hz to 60 Hz. Thecomplete results of this CCEM comparison willbe published soon; Figure 4 exemplarily showsthe measurement results obtained at power fac-tor 1. Depicted are the deviations of the meas-
20 • Special Issue from PTB-Mitteilungen 112 (2002), No. 1 and No. 3
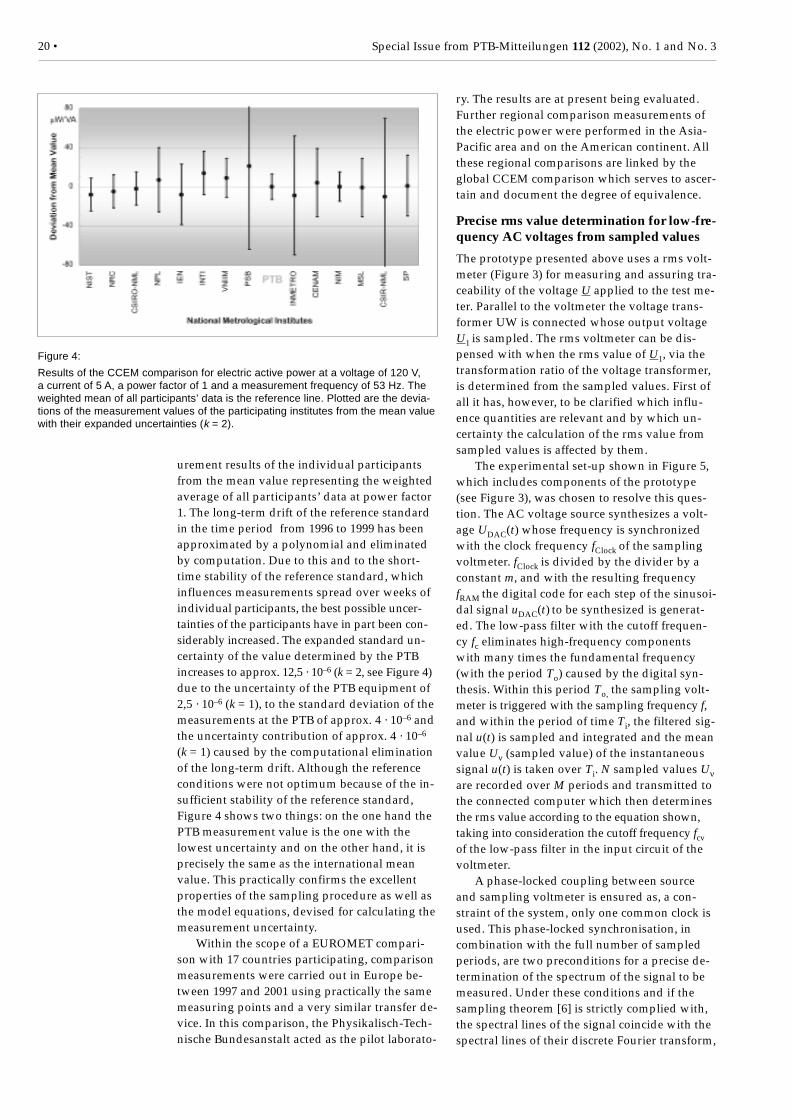
Figure 4:
Results of the CCEM comparison for electric active power at a voltage of 120 V,a current of 5 A, a power factor of 1 and a measurement frequency of 53 Hz. Theweighted mean of all participants’ data is the reference line. Plotted are the devia-tions of the measurement values of the participating institutes from the mean valuewith their expanded uncertainties (k = 2).
urement results of the individual participantsfrom the mean value representing the weightedaverage of all participants’ data at power factor1. The long-term drift of the reference standardin the time period from 1996 to 1999 has beenapproximated by a polynomial and eliminatedby computation. Due to this and to the short-time stability of the reference standard, whichinfluences measurements spread over weeks ofindividual participants, the best possible uncer-tainties of the participants have in part been con-siderably increased. The expanded standard un-certainty of the value determined by the PTBincreases to approx. 12,5 · 10–6 (k = 2, see Figure 4)due to the uncertainty of the PTB equipment of2,5 · 10–6 (k = 1), to the standard deviation of themeasurements at the PTB of approx. 4 · 10–6 andthe uncertainty contribution of approx. 4 · 10–6
(k = 1) caused by the computational eliminationof the long-term drift. Although the referenceconditions were not optimum because of the in-sufficient stability of the reference standard,Figure 4 shows two things: on the one hand thePTB measurement value is the one with thelowest uncertainty and on the other hand, it isprecisely the same as the international meanvalue. This practically confirms the excellentproperties of the sampling procedure as well asthe model equations, devised for calculating themeasurement uncertainty.
Within the scope of a EUROMET compari-son with 17 countries participating, comparisonmeasurements were carried out in Europe be-tween 1997 and 2001 using practically the samemeasuring points and a very similar transfer de-vice. In this comparison, the Physikalisch-Tech-nische Bundesanstalt acted as the pilot laborato-
ry. The results are at present being evaluated.Further regional comparison measurements ofthe electric power were performed in the Asia-Pacific area and on the American continent. Allthese regional comparisons are linked by theglobal CCEM comparison which serves to ascer-tain and document the degree of equivalence.
Precise rms value determination for low-fre-quency AC voltages from sampled values
The prototype presented above uses a rms volt-meter (Figure 3) for measuring and assuring tra-ceability of the voltage U applied to the test me-ter. Parallel to the voltmeter the voltage trans-former UW is connected whose output voltageU1 is sampled. The rms voltmeter can be dis-pensed with when the rms value of U1, via thetransformation ratio of the voltage transformer,is determined from the sampled values. First ofall it has, however, to be clarified which influ-ence quantities are relevant and by which un-certainty the calculation of the rms value fromsampled values is affected by them.
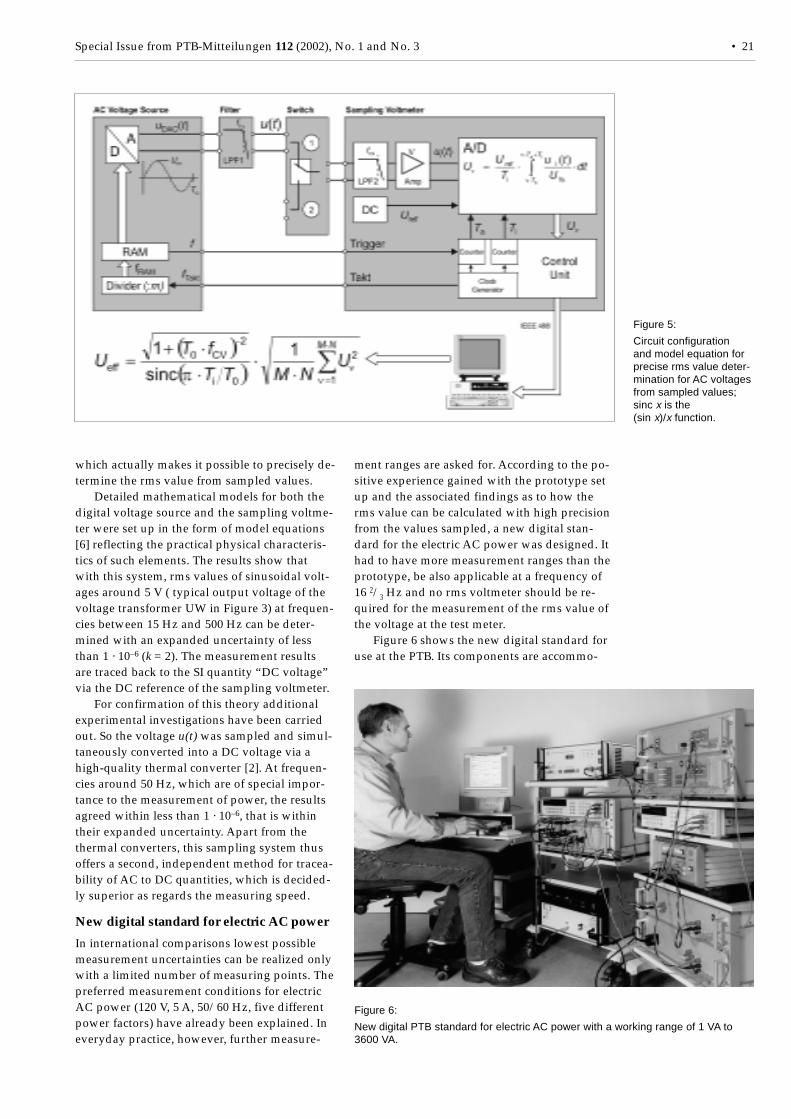
The experimental set-up shown in Figure 5,which includes components of the prototype(see Figure 3), was chosen to resolve this ques-tion. The AC voltage source synthesizes a volt-age UDAC(t) whose frequency is synchronizedwith the clock frequency fClock of the samplingvoltmeter. fClock is divided by the divider by aconstant m, and with the resulting frequencyfRAM the digital code for each step of the sinusoi-dal signal uDAC(t) to be synthesized is generat-ed. The low-pass filter with the cutoff frequen-cy fc eliminates high-frequency componentswith many times the fundamental frequency(with the period To) caused by the digital syn-thesis. Within this period To, the sampling volt-meter is triggered with the sampling frequency f,and within the period of time Ti, the filtered sig-nal u(t) is sampled and integrated and the meanvalue Uν (sampled value) of the instantaneoussignal u(t) is taken over Ti. N sampled values Uνare recorded over M periods and transmitted tothe connected computer which then determinesthe rms value according to the equation shown,taking into consideration the cutoff frequency fcvof the low-pass filter in the input circuit of thevoltmeter.
A phase-locked coupling between sourceand sampling voltmeter is ensured as, a con-straint of the system, only one common clock isused. This phase-locked synchronisation, incombination with the full number of sampledperiods, are two preconditions for a precise de-termination of the spectrum of the signal to bemeasured. Under these conditions and if thesampling theorem [6] is strictly complied with,the spectral lines of the signal coincide with thespectral lines of their discrete Fourier transform,
Special Issue from PTB-Mitteilungen 112 (2002), No. 1 and No. 3 • 21
Figure 5:
Circuit configurationand model equation forprecise rms value deter-mination for AC voltagesfrom sampled values;sinc x is the(sin x)/x function.
Figure 6:
New digital PTB standard for electric AC power with a working range of 1 VA to3600 VA.
which actually makes it possible to precisely de-termine the rms value from sampled values.
Detailed mathematical models for both thedigital voltage source and the sampling voltme-ter were set up in the form of model equations[6] reflecting the practical physical characteris-tics of such elements. The results show thatwith this system, rms values of sinusoidal volt-ages around 5 V ( typical output voltage of thevoltage transformer UW in Figure 3) at frequen-cies between 15 Hz and 500 Hz can be deter-mined with an expanded uncertainty of lessthan 1 · 10–6 (k = 2). The measurement resultsare traced back to the SI quantity “DC voltage”via the DC reference of the sampling voltmeter.
For confirmation of this theory additionalexperimental investigations have been carriedout. So the voltage u(t) was sampled and simul-taneously converted into a DC voltage via ahigh-quality thermal converter [2]. At frequen-cies around 50 Hz, which are of special impor-tance to the measurement of power, the resultsagreed within less than 1 · 10–6, that is withintheir expanded uncertainty. Apart from thethermal converters, this sampling system thusoffers a second, independent method for tracea-bility of AC to DC quantities, which is decided-ly superior as regards the measuring speed.
New digital standard for electric AC power
In international comparisons lowest possiblemeasurement uncertainties can be realized onlywith a limited number of measuring points. Thepreferred measurement conditions for electricAC power (120 V, 5 A, 50/60 Hz, five differentpower factors) have already been explained. Ineveryday practice, however, further measure-
ment ranges are asked for. According to the po-sitive experience gained with the prototype setup and the associated findings as to how therms value can be calculated with high precisionfrom the values sampled, a new digital stan-dard for the electric AC power was designed. Ithad to have more measurement ranges than theprototype, be also applicable at a frequency of16 2/3 Hz and no rms voltmeter should be re-quired for the measurement of the rms value ofthe voltage at the test meter.
Figure 6 shows the new digital standard foruse at the PTB. Its components are accommo-
22 • Special Issue from PTB-Mitteilungen 112 (2002), No. 1 and No. 3
Literature
[1] Schuster, G.: Thermal Instrument forMeasurement of Voltage, Current, Power,and Energy at Power Frequencies. IEEETrans. Instrum. Meas. IM-29, No.3 (1980),pp. 153–157
[2] Klonz, M.: Die Entwicklung von Vielfach-thermokonvertern für die Präzisionsmes-sung des Effektivwerts von Wechselspan-nung und Wechselstromstärke (The Deve-lopment of Multijunction Thermal Conver-ters for the Precise Measurement of the rmsValue of AC Voltage and AC Current). In:PTB-Mitteilungen 112 (2002), Vol. No. 3,pp. 207–213
[3] Ramm, G.; Moser, H; Braun, A.: A New Sche-me for Generating and Measuring Active,Reactive, and Apparent Power at PowerFrequencies with Uncertainties of 2,5 · 10–6.IEEE Trans. Instrum. Meas. IM-48, No. 2(1999), pp. 422–426
[4] Ramm, G.; Moser, H.; Braun, A.: PräziseMessung der elektrischen Wechselleistungmittels Abtastverfahren (Precise Measure-ment of Electric AC Power by SamplingProcedures). VDI Report No. 1530 (2000),pp. 571–580
[5] Oldham, N.; Nelson, T.; Bergeest, R.; Ramm,G.; Carranza, R.; Corney, A. C.; Gibbes, M.;Kyriazis, G.; Laiz, H. M.; Liu, L. X.; Lu, Z.;Pogliano, U.; Rydler, K.-E.; Shapiro, E.; So, E.;Temba, M.; Wright, P.: An InternationalComparison of 50/60 Hz Power (1996–1999). IEEE Trans. Instrum. Meas. IM-50,No. 2 (2001), pp. 356–360
[6] Kürten Ihlenfeld, W. G.: Maintenance andTraceability of AC Voltages by Synchro-nous Digital Synthesis and Sampling, PTBReport E-75, Braunschweig, August 2001
dated in three mobile units. The left unit servesto operate and control the measurement se-quence. The voltages and currents required forthe measurement are generated, amplified andmeasured in the central unit. The transconduct-ance amplifier is placed at the top, below it arethe digital voltmeter used as sampling voltme-ter and the double AC voltage source, and rightat the bottom is the voltage amplifier. In thethird unit, on the right-hand side, the condition-ing of the generated voltage and of the currentto the device under test takes place, as well asthe conversion of the quantities for measure-ment by the sampling voltmeter. Right at thetop the transformer for the generation of differ-ent currents is situated, below it is the two-stagecurrent transformer with the series-connectedAC measuring resistor. In the middle of the uniton the right a power meter is situated which isused as test object and whose output voltage ismeasured by the digital voltmeter placed aboveit. At the bottom is the transformer for the gen-eration of different voltages and the voltagetransformer.
The components voltage transformer, two-stage current transformer and AC measuring re-sistor are most important for achieving low un-certainty [3, 4]. They are not available on themarket but have been completely devised, setup and calibrated at the PTB with the lowestpossible expanded uncertainties around 1 · 10–6
(k = 2). The sampling voltmeter used is commer-cially available. The double AC voltage source,which has to show a relative short-time stabilityof the amplitudes of less than 0,5 · 10–6, and aphase jitter of less than 0,5 µrad with harmonicdistortions below 0,01 % as well as the fast, low-resistance signal switch are also proprietary de-velopments of the PTB.
In contrast to the prototype, in addition to120 V and 5 A, the rated voltages of 60 V and240 V as well as currents from 0,1 A to 10 A canbe selected, which can be varied in the workingrange of 40 % up to 120 % (i. e. from 25 V to 300 Vand from 0,04 A to 12 A corresponding to 1 VAto 3600 VA). Furthermore, the measurement fre-quency at voltages up to 100 V maximum canbe reduced to approx. 16 Hz.
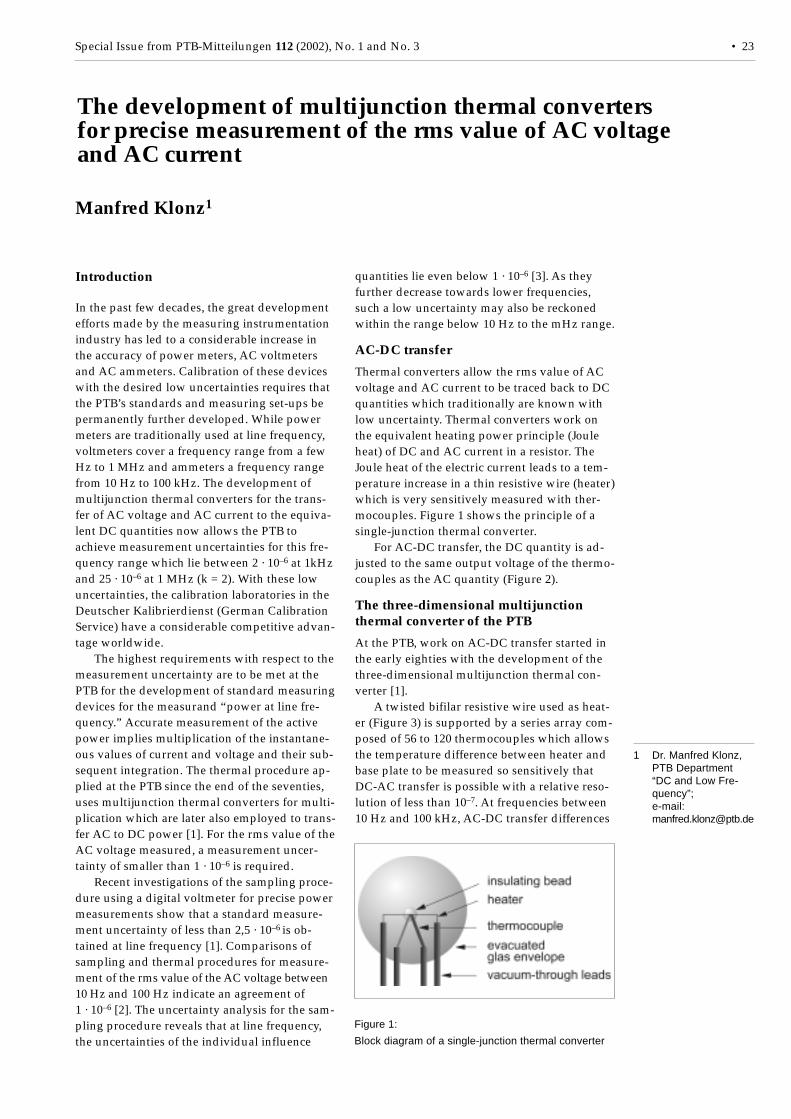
Special Issue from PTB-Mitteilungen 112 (2002), No. 1 and No. 3 • 23
Introduction
In the past few decades, the great developmentefforts made by the measuring instrumentationindustry has led to a considerable increase inthe accuracy of power meters, AC voltmetersand AC ammeters. Calibration of these deviceswith the desired low uncertainties requires thatthe PTB’s standards and measuring set-ups bepermanently further developed. While powermeters are traditionally used at line frequency,voltmeters cover a frequency range from a fewHz to 1 MHz and ammeters a frequency rangefrom 10 Hz to 100 kHz. The development ofmultijunction thermal converters for the trans-fer of AC voltage and AC current to the equiva-lent DC quantities now allows the PTB toachieve measurement uncertainties for this fre-quency range which lie between 2 · 10–6 at 1kHzand 25 · 10–6 at 1 MHz (k = 2). With these lowuncertainties, the calibration laboratories in theDeutscher Kalibrierdienst (German CalibrationService) have a considerable competitive advan-tage worldwide.
The highest requirements with respect to themeasurement uncertainty are to be met at thePTB for the development of standard measuringdevices for the measurand “power at line fre-quency.” Accurate measurement of the activepower implies multiplication of the instantane-ous values of current and voltage and their sub-sequent integration. The thermal procedure ap-plied at the PTB since the end of the seventies,uses multijunction thermal converters for multi-plication which are later also employed to trans-fer AC to DC power [1]. For the rms value of theAC voltage measured, a measurement uncer-tainty of smaller than 1 · 10–6 is required.
Recent investigations of the sampling proce-dure using a digital voltmeter for precise powermeasurements show that a standard measure-ment uncertainty of less than 2,5 · 10–6 is ob-tained at line frequency [1]. Comparisons ofsampling and thermal procedures for measure-ment of the rms value of the AC voltage between10 Hz and 100 Hz indicate an agreement of1 · 10–6 [2]. The uncertainty analysis for the sam-pling procedure reveals that at line frequency,the uncertainties of the individual influence
quantities lie even below 1 · 10–6 [3]. As theyfurther decrease towards lower frequencies,such a low uncertainty may also be reckonedwithin the range below 10 Hz to the mHz range.
AC-DC transfer
Thermal converters allow the rms value of ACvoltage and AC current to be traced back to DCquantities which traditionally are known withlow uncertainty. Thermal converters work onthe equivalent heating power principle (Jouleheat) of DC and AC current in a resistor. TheJoule heat of the electric current leads to a tem-perature increase in a thin resistive wire (heater)which is very sensitively measured with ther-mocouples. Figure 1 shows the principle of asingle-junction thermal converter.
For AC-DC transfer, the DC quantity is ad-justed to the same output voltage of the thermo-couples as the AC quantity (Figure 2).
The three-dimensional multijunctionthermal converter of the PTB
At the PTB, work on AC-DC transfer started inthe early eighties with the development of thethree-dimensional multijunction thermal con-verter [1].
A twisted bifilar resistive wire used as heat-er (Figure 3) is supported by a series array com-posed of 56 to 120 thermocouples which allowsthe temperature difference between heater andbase plate to be measured so sensitively thatDC-AC transfer is possible with a relative reso-lution of less than 10–7. At frequencies between10 Hz and 100 kHz, AC-DC transfer differences
The development of multijunction thermal convertersfor precise measurement of the rms value of AC voltageand AC current
Manfred Klonz1
Figure 1:
Block diagram of a single-junction thermal converter
1 Dr. Manfred Klonz,PTB Department“DC and Low Fre-quency”;e-mail:[email protected]
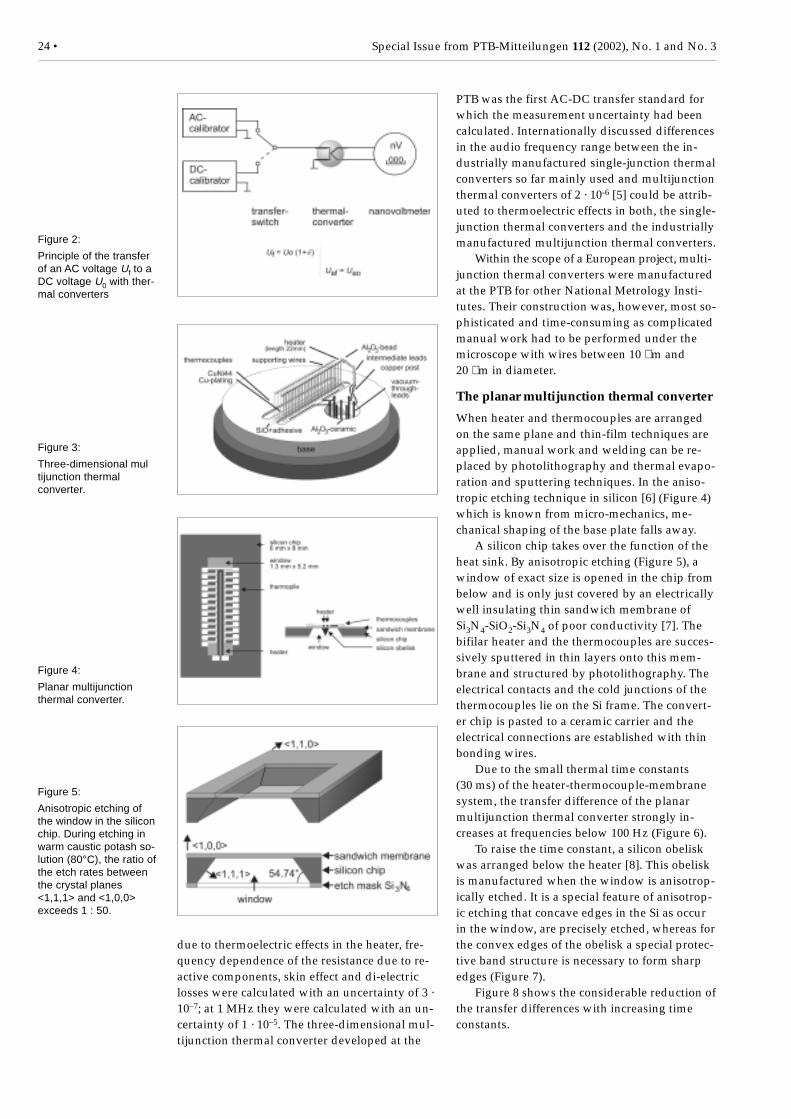
24 • Special Issue from PTB-Mitteilungen 112 (2002), No. 1 and No. 3
due to thermoelectric effects in the heater, fre-quency dependence of the resistance due to re-active components, skin effect and di-electriclosses were calculated with an uncertainty of 3 ·10–7; at 1 MHz they were calculated with an un-certainty of 1 · 10–5. The three-dimensional mul-tijunction thermal converter developed at the
PTB was the first AC-DC transfer standard forwhich the measurement uncertainty had beencalculated. Internationally discussed differencesin the audio frequency range between the in-dustrially manufactured single-junction thermalconverters so far mainly used and multijunctionthermal converters of 2 · 10-6 [5] could be attrib-uted to thermoelectric effects in both, the single-junction thermal converters and the industriallymanufactured multijunction thermal converters.
Within the scope of a European project, multi-junction thermal converters were manufacturedat the PTB for other National Metrology Insti-tutes. Their construction was, however, most so-phisticated and time-consuming as complicatedmanual work had to be performed under themicroscope with wires between 10 µm and20 µm in diameter.
The planar multijunction thermal converter
When heater and thermocouples are arrangedon the same plane and thin-film techniques areapplied, manual work and welding can be re-placed by photolithography and thermal evapo-ration and sputtering techniques. In the aniso-tropic etching technique in silicon [6] (Figure 4)which is known from micro-mechanics, me-chanical shaping of the base plate falls away.
A silicon chip takes over the function of theheat sink. By anisotropic etching (Figure 5), awindow of exact size is opened in the chip frombelow and is only just covered by an electricallywell insulating thin sandwich membrane ofSi3N4-SiO2-Si3N4 of poor conductivity [7]. Thebifilar heater and the thermocouples are succes-sively sputtered in thin layers onto this mem-brane and structured by photolithography. Theelectrical contacts and the cold junctions of thethermocouples lie on the Si frame. The convert-er chip is pasted to a ceramic carrier and theelectrical connections are established with thinbonding wires.
Due to the small thermal time constants(30 ms) of the heater-thermocouple-membranesystem, the transfer difference of the planarmultijunction thermal converter strongly in-creases at frequencies below 100 Hz (Figure 6).
To raise the time constant, a silicon obeliskwas arranged below the heater [8]. This obeliskis manufactured when the window is anisotrop-ically etched. It is a special feature of anisotrop-ic etching that concave edges in the Si as occurin the window, are precisely etched, whereas forthe convex edges of the obelisk a special protec-tive band structure is necessary to form sharpedges (Figure 7).
Figure 8 shows the considerable reduction ofthe transfer differences with increasing timeconstants.
Figure 5:
Anisotropic etching ofthe window in the siliconchip. During etching inwarm caustic potash so-lution (80°C), the ratio ofthe etch rates betweenthe crystal planes<1,1,1> and <1,0,0>exceeds 1 : 50.
Figure 4:
Planar multijunctionthermal converter.
Figure 3:
Three-dimensional multijunction thermalconverter.
Figure 2:
Principle of the transferof an AC voltage Uf to aDC voltage U0 with ther-mal converters
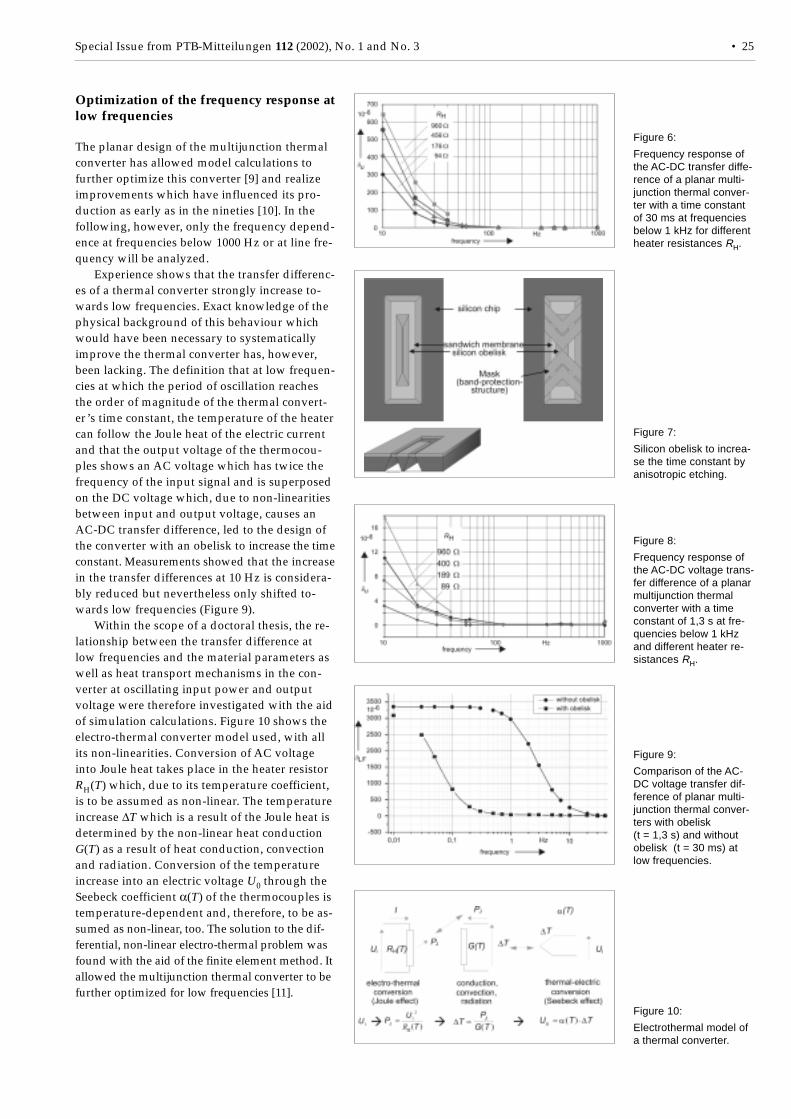
Special Issue from PTB-Mitteilungen 112 (2002), No. 1 and No. 3 • 25
Optimization of the frequency response atlow frequencies
The planar design of the multijunction thermalconverter has allowed model calculations tofurther optimize this converter [9] and realizeimprovements which have influenced its pro-duction as early as in the nineties [10]. In thefollowing, however, only the frequency depend-ence at frequencies below 1000 Hz or at line fre-quency will be analyzed.
Experience shows that the transfer differenc-es of a thermal converter strongly increase to-wards low frequencies. Exact knowledge of thephysical background of this behaviour whichwould have been necessary to systematicallyimprove the thermal converter has, however,been lacking. The definition that at low frequen-cies at which the period of oscillation reachesthe order of magnitude of the thermal convert-er’s time constant, the temperature of the heatercan follow the Joule heat of the electric currentand that the output voltage of the thermocou-ples shows an AC voltage which has twice thefrequency of the input signal and is superposedon the DC voltage which, due to non-linearitiesbetween input and output voltage, causes anAC-DC transfer difference, led to the design ofthe converter with an obelisk to increase the timeconstant. Measurements showed that the increasein the transfer differences at 10 Hz is considera-bly reduced but nevertheless only shifted to-wards low frequencies (Figure 9).
Within the scope of a doctoral thesis, the re-lationship between the transfer difference atlow frequencies and the material parameters aswell as heat transport mechanisms in the con-verter at oscillating input power and outputvoltage were therefore investigated with the aidof simulation calculations. Figure 10 shows theelectro-thermal converter model used, with allits non-linearities. Conversion of AC voltageinto Joule heat takes place in the heater resistorRH(T) which, due to its temperature coefficient,is to be assumed as non-linear. The temperatureincrease ∆T which is a result of the Joule heat isdetermined by the non-linear heat conductionG(T) as a result of heat conduction, convectionand radiation. Conversion of the temperatureincrease into an electric voltage U0 through theSeebeck coefficient α(T) of the thermocouples istemperature-dependent and, therefore, to be as-sumed as non-linear, too. The solution to the dif-ferential, non-linear electro-thermal problem wasfound with the aid of the finite element method. Itallowed the multijunction thermal converter to befurther optimized for low frequencies [11].
Figure 6:
Frequency response ofthe AC-DC transfer diffe-rence of a planar multi-junction thermal conver-ter with a time constantof 30 ms at frequenciesbelow 1 kHz for differentheater resistances RH.
Figure 7:
Silicon obelisk to increa-se the time constant byanisotropic etching.
Figure 8:
Frequency response ofthe AC-DC voltage trans-fer difference of a planarmultijunction thermalconverter with a timeconstant of 1,3 s at fre-quencies below 1 kHzand different heater re-sistances RH.
Figure 9:
Comparison of the AC-DC voltage transfer dif-ference of planar multi-junction thermal conver-ters with obelisk(t = 1,3 s) and withoutobelisk (t = 30 ms) atlow frequencies.
Figure 10:
Electrothermal model ofa thermal converter.
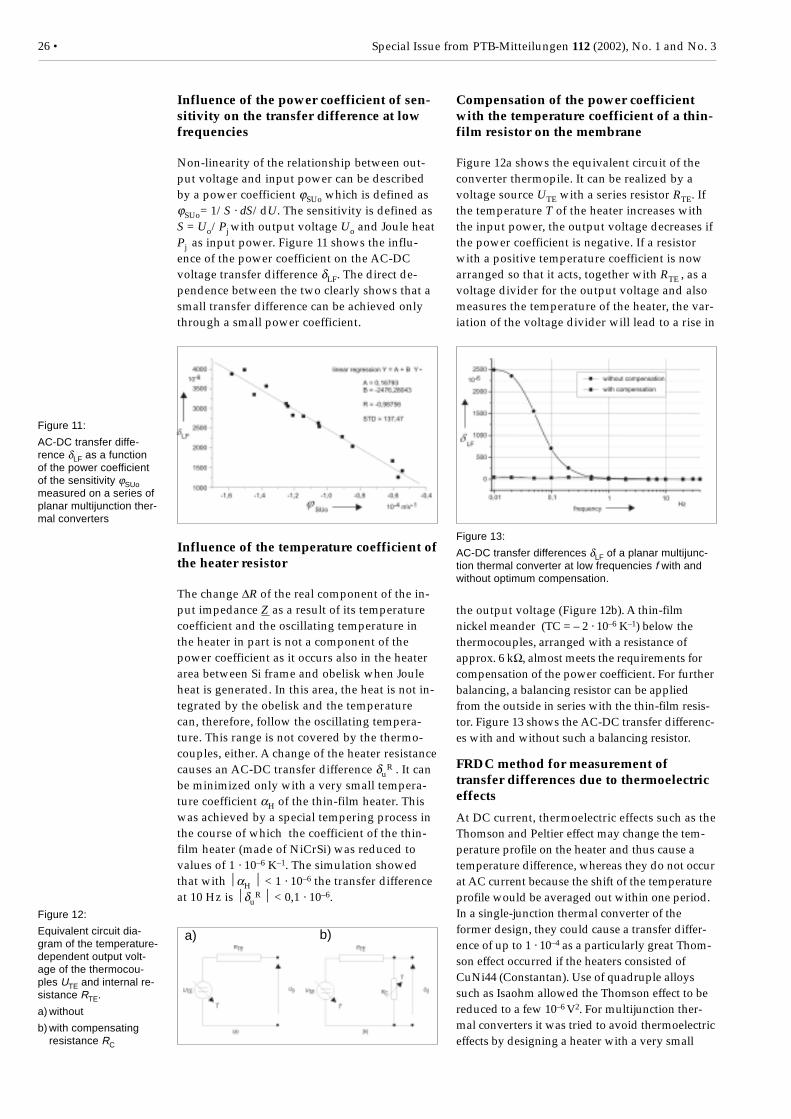
26 • Special Issue from PTB-Mitteilungen 112 (2002), No. 1 and No. 3
Influence of the power coefficient of sen-sitivity on the transfer difference at lowfrequencies
Non-linearity of the relationship between out-put voltage and input power can be describedby a power coefficient ϕSUo which is defined asϕSUo= 1/S · dS/dU. The sensitivity is defined asS = Uo/Pj with output voltage Uo and Joule heatPj as input power. Figure 11 shows the influ-ence of the power coefficient on the AC-DCvoltage transfer difference δLF. The direct de-pendence between the two clearly shows that asmall transfer difference can be achieved onlythrough a small power coefficient.
Compensation of the power coefficientwith the temperature coefficient of a thin-film resistor on the membrane
Figure 12a shows the equivalent circuit of theconverter thermopile. It can be realized by avoltage source UTE with a series resistor RTE. Ifthe temperature T of the heater increases withthe input power, the output voltage decreases ifthe power coefficient is negative. If a resistorwith a positive temperature coefficient is nowarranged so that it acts, together with RTE , as avoltage divider for the output voltage and alsomeasures the temperature of the heater, the var-iation of the voltage divider will lead to a rise in
Influence of the temperature coefficient ofthe heater resistor
The change ∆R of the real component of the in-put impedance Z as a result of its temperaturecoefficient and the oscillating temperature inthe heater in part is not a component of thepower coefficient as it occurs also in the heaterarea between Si frame and obelisk when Jouleheat is generated. In this area, the heat is not in-tegrated by the obelisk and the temperaturecan, therefore, follow the oscillating tempera-ture. This range is not covered by the thermo-couples, either. A change of the heater resistancecauses an AC-DC transfer difference δu
R . It canbe minimized only with a very small tempera-ture coefficient αH of the thin-film heater. Thiswas achieved by a special tempering process inthe course of which the coefficient of the thin-film heater (made of NiCrSi) was reduced tovalues of 1 · 10–6 K–1. The simulation showedthat with αH < 1 · 10–6 the transfer differenceat 10 Hz is δu
R < 0,1 · 10–6.
the output voltage (Figure 12b). A thin-filmnickel meander (TC = – 2 · 10–6 K–1) below thethermocouples, arranged with a resistance ofapprox. 6 kΩ, almost meets the requirements forcompensation of the power coefficient. For furtherbalancing, a balancing resistor can be appliedfrom the outside in series with the thin-film resis-tor. Figure 13 shows the AC-DC transfer differenc-es with and without such a balancing resistor.
FRDC method for measurement oftransfer differences due to thermoelectriceffects
At DC current, thermoelectric effects such as theThomson and Peltier effect may change the tem-perature profile on the heater and thus cause atemperature difference, whereas they do not occurat AC current because the shift of the temperatureprofile would be averaged out within one period.In a single-junction thermal converter of theformer design, they could cause a transfer differ-ence of up to 1 · 10–4 as a particularly great Thom-son effect occurred if the heaters consisted ofCuNi44 (Constantan). Use of quadruple alloyssuch as Isaohm allowed the Thomson effect to bereduced to a few 10–6 V2. For multijunction ther-mal converters it was tried to avoid thermoelectriceffects by designing a heater with a very small
Figure 11:
AC-DC transfer diffe-rence δLF as a functionof the power coefficientof the sensitivity ϕSUomeasured on a series ofplanar multijunction ther-mal converters
Figure 12:
Equivalent circuit dia-gram of the temperature-dependent output volt-age of the thermocou-ples UTE and internal re-sistance RTE.
a) without
b) with compensatingresistance RC
Figure 13:
AC-DC transfer differences δLF of a planar multijunc-tion thermal converter at low frequencies f with andwithout optimum compensation.
a) b)
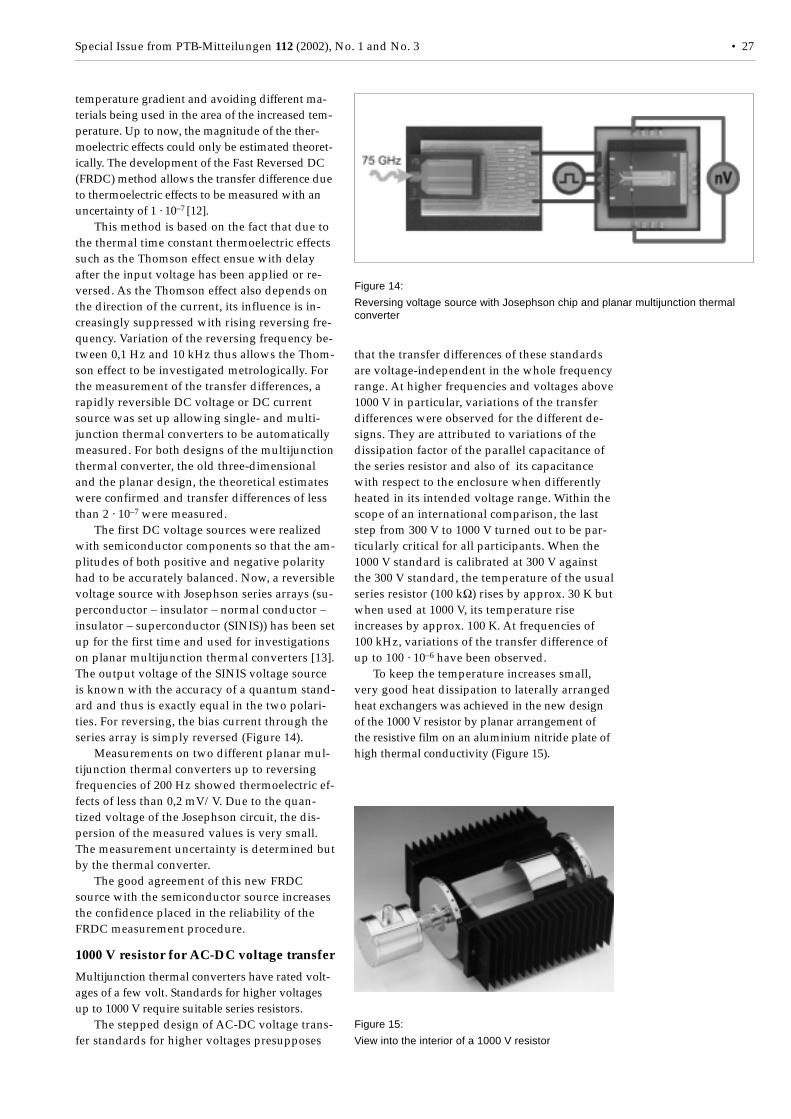
Special Issue from PTB-Mitteilungen 112 (2002), No. 1 and No. 3 • 27
temperature gradient and avoiding different ma-terials being used in the area of the increased tem-perature. Up to now, the magnitude of the ther-moelectric effects could only be estimated theoret-ically. The development of the Fast Reversed DC(FRDC) method allows the transfer difference dueto thermoelectric effects to be measured with anuncertainty of 1 · 10–7
[12].This method is based on the fact that due to
the thermal time constant thermoelectric effectssuch as the Thomson effect ensue with delayafter the input voltage has been applied or re-versed. As the Thomson effect also depends onthe direction of the current, its influence is in-creasingly suppressed with rising reversing fre-quency. Variation of the reversing frequency be-tween 0,1 Hz and 10 kHz thus allows the Thom-son effect to be investigated metrologically. Forthe measurement of the transfer differences, arapidly reversible DC voltage or DC currentsource was set up allowing single- and multi-junction thermal converters to be automaticallymeasured. For both designs of the multijunctionthermal converter, the old three-dimensionaland the planar design, the theoretical estimateswere confirmed and transfer differences of lessthan 2 · 10–7 were measured.
The first DC voltage sources were realizedwith semiconductor components so that the am-plitudes of both positive and negative polarityhad to be accurately balanced. Now, a reversiblevoltage source with Josephson series arrays (su-perconductor – insulator – normal conductor –insulator – superconductor (SINIS)) has been setup for the first time and used for investigationson planar multijunction thermal converters [13].The output voltage of the SINIS voltage sourceis known with the accuracy of a quantum stand-ard and thus is exactly equal in the two polari-ties. For reversing, the bias current through theseries array is simply reversed (Figure 14).
Measurements on two different planar mul-tijunction thermal converters up to reversingfrequencies of 200 Hz showed thermoelectric ef-fects of less than 0,2 mV/V. Due to the quan-tized voltage of the Josephson circuit, the dis-persion of the measured values is very small.The measurement uncertainty is determined butby the thermal converter.
The good agreement of this new FRDCsource with the semiconductor source increasesthe confidence placed in the reliability of theFRDC measurement procedure.
1000 V resistor for AC-DC voltage transfer
Multijunction thermal converters have rated volt-ages of a few volt. Standards for higher voltagesup to 1000 V require suitable series resistors.
The stepped design of AC-DC voltage trans-fer standards for higher voltages presupposes
that the transfer differences of these standardsare voltage-independent in the whole frequencyrange. At higher frequencies and voltages above1000 V in particular, variations of the transferdifferences were observed for the different de-signs. They are attributed to variations of thedissipation factor of the parallel capacitance ofthe series resistor and also of its capacitancewith respect to the enclosure when differentlyheated in its intended voltage range. Within thescope of an international comparison, the laststep from 300 V to 1000 V turned out to be par-ticularly critical for all participants. When the1000 V standard is calibrated at 300 V againstthe 300 V standard, the temperature of the usualseries resistor (100 kΩ) rises by approx. 30 K butwhen used at 1000 V, its temperature riseincreases by approx. 100 K. At frequencies of100 kHz, variations of the transfer difference ofup to 100 · 10–6 have been observed.
To keep the temperature increases small,very good heat dissipation to laterally arrangedheat exchangers was achieved in the new designof the 1000 V resistor by planar arrangement ofthe resistive film on an aluminium nitride plate ofhigh thermal conductivity (Figure 15).
Figure 14:
Reversing voltage source with Josephson chip and planar multijunction thermalconverter
Figure 15:
View into the interior of a 1000 V resistor
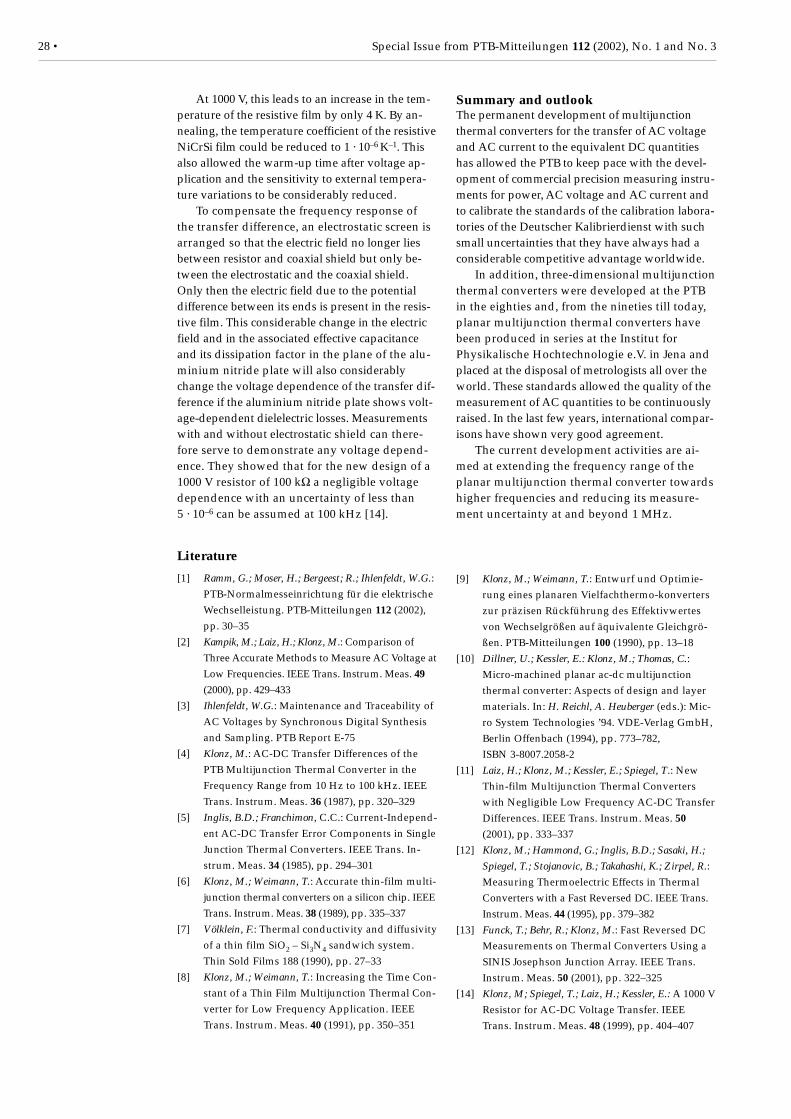
28 • Special Issue from PTB-Mitteilungen 112 (2002), No. 1 and No. 3
At 1000 V, this leads to an increase in the tem-perature of the resistive film by only 4 K. By an-nealing, the temperature coefficient of the resistiveNiCrSi film could be reduced to 1 · 10–6 K–1. Thisalso allowed the warm-up time after voltage ap-plication and the sensitivity to external tempera-ture variations to be considerably reduced.
To compensate the frequency response ofthe transfer difference, an electrostatic screen isarranged so that the electric field no longer liesbetween resistor and coaxial shield but only be-tween the electrostatic and the coaxial shield.Only then the electric field due to the potentialdifference between its ends is present in the resis-tive film. This considerable change in the electricfield and in the associated effective capacitanceand its dissipation factor in the plane of the alu-minium nitride plate will also considerablychange the voltage dependence of the transfer dif-ference if the aluminium nitride plate shows volt-age-dependent dielelectric losses. Measurementswith and without electrostatic shield can there-fore serve to demonstrate any voltage depend-ence. They showed that for the new design of a1000 V resistor of 100 kΩ a negligible voltagedependence with an uncertainty of less than5 · 10–6 can be assumed at 100 kHz [14].
Summary and outlookThe permanent development of multijunctionthermal converters for the transfer of AC voltageand AC current to the equivalent DC quantitieshas allowed the PTB to keep pace with the devel-opment of commercial precision measuring instru-ments for power, AC voltage and AC current andto calibrate the standards of the calibration labora-tories of the Deutscher Kalibrierdienst with suchsmall uncertainties that they have always had aconsiderable competitive advantage worldwide.
In addition, three-dimensional multijunctionthermal converters were developed at the PTBin the eighties and, from the nineties till today,planar multijunction thermal converters havebeen produced in series at the Institut forPhysikalische Hochtechnologie e.V. in Jena andplaced at the disposal of metrologists all over theworld. These standards allowed the quality of themeasurement of AC quantities to be continuouslyraised. In the last few years, international compar-isons have shown very good agreement.
The current development activities are ai-med at extending the frequency range of theplanar multijunction thermal converter towardshigher frequencies and reducing its measure-ment uncertainty at and beyond 1 MHz.
Literature
[1] Ramm, G.; Moser, H.; Bergeest; R.; Ihlenfeldt, W.G.:PTB-Normalmesseinrichtung für die elektrischeWechselleistung. PTB-Mitteilungen 112 (2002),pp. 30–35
[2] Kampik, M.; Laiz, H.; Klonz, M.: Comparison ofThree Accurate Methods to Measure AC Voltage atLow Frequencies. IEEE Trans. Instrum. Meas. 49
(2000), pp. 429–433[3] Ihlenfeldt, W.G.: Maintenance and Traceability of
AC Voltages by Synchronous Digital Synthesisand Sampling. PTB Report E-75
[4] Klonz, M.: AC-DC Transfer Differences of thePTB Multijunction Thermal Converter in theFrequency Range from 10 Hz to 100 kHz. IEEETrans. Instrum. Meas. 36 (1987), pp. 320–329
[5] Inglis, B.D.; Franchimon, C.C.: Current-Independ-ent AC-DC Transfer Error Components in SingleJunction Thermal Converters. IEEE Trans. In-strum. Meas. 34 (1985), pp. 294–301
[6] Klonz, M.; Weimann, T.: Accurate thin-film multi-junction thermal converters on a silicon chip. IEEETrans. Instrum. Meas. 38 (1989), pp. 335–337
[7] Völklein, F.: Thermal conductivity and diffusivityof a thin film SiO2 – Si3N4 sandwich system.Thin Sold Films 188 (1990), pp. 27–33
[8] Klonz, M.; Weimann, T.: Increasing the Time Con-stant of a Thin Film Multijunction Thermal Con-verter for Low Frequency Application. IEEETrans. Instrum. Meas. 40 (1991), pp. 350–351
[9] Klonz, M.; Weimann, T.: Entwurf und Optimie-rung eines planaren Vielfachthermo-konverterszur präzisen Rückführung des Effektivwertesvon Wechselgrößen auf äquivalente Gleichgrö-ßen. PTB-Mitteilungen 100 (1990), pp. 13–18
[10] Dillner, U.; Kessler, E.: Klonz, M.; Thomas, C.:Micro-machined planar ac-dc multijunctionthermal converter: Aspects of design and layermaterials. In: H. Reichl, A. Heuberger (eds.): Mic-ro System Technologies ’94. VDE-Verlag GmbH,Berlin Offenbach (1994), pp. 773–782,ISBN 3-8007.2058-2
[11] Laiz, H.; Klonz, M.; Kessler, E.; Spiegel, T.: NewThin-film Multijunction Thermal Converterswith Negligible Low Frequency AC-DC TransferDifferences. IEEE Trans. Instrum. Meas. 50
(2001), pp. 333–337[12] Klonz, M.; Hammond, G.; Inglis, B.D.; Sasaki, H.;
Spiegel, T.; Stojanovic, B.; Takahashi, K.; Zirpel, R.:Measuring Thermoelectric Effects in ThermalConverters with a Fast Reversed DC. IEEE Trans.Instrum. Meas. 44 (1995), pp. 379–382
[13] Funck, T.; Behr, R.; Klonz, M.: Fast Reversed DCMeasurements on Thermal Converters Using aSINIS Josephson Junction Array. IEEE Trans.Instrum. Meas. 50 (2001), pp. 322–325
[14] Klonz, M; Spiegel, T.; Laiz, H.; Kessler, E.: A 1000 VResistor for AC-DC Voltage Transfer. IEEETrans. Instrum. Meas. 48 (1999), pp. 404–407
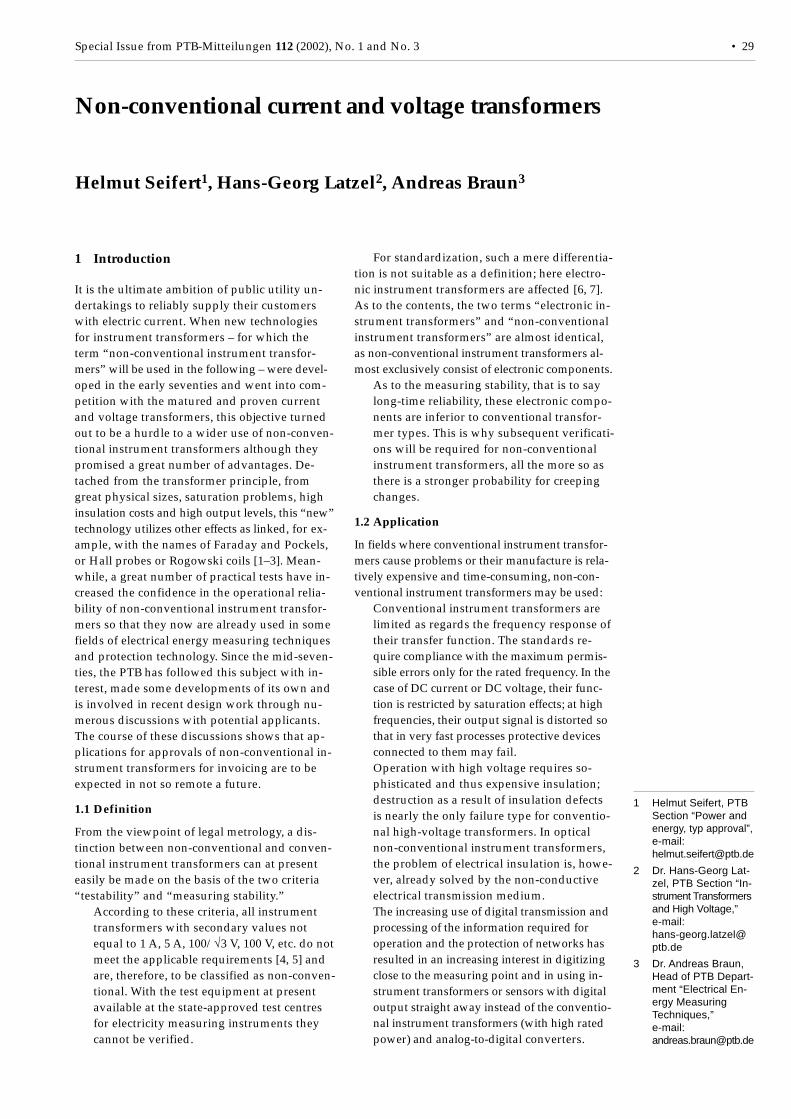
Special Issue from PTB-Mitteilungen 112 (2002), No. 1 and No. 3 • 29
1 Introduction
It is the ultimate ambition of public utility un-dertakings to reliably supply their customerswith electric current. When new technologiesfor instrument transformers – for which theterm “non-conventional instrument transfor-mers” will be used in the following – were devel-oped in the early seventies and went into com-petition with the matured and proven currentand voltage transformers, this objective turnedout to be a hurdle to a wider use of non-conven-tional instrument transformers although theypromised a great number of advantages. De-tached from the transformer principle, fromgreat physical sizes, saturation problems, highinsulation costs and high output levels, this “new”technology utilizes other effects as linked, for ex-ample, with the names of Faraday and Pockels,or Hall probes or Rogowski coils [1–3]. Mean-while, a great number of practical tests have in-creased the confidence in the operational relia-bility of non-conventional instrument transfor-mers so that they now are already used in somefields of electrical energy measuring techniquesand protection technology. Since the mid-seven-ties, the PTB has followed this subject with in-terest, made some developments of its own andis involved in recent design work through nu-merous discussions with potential applicants.The course of these discussions shows that ap-plications for approvals of non-conventional in-strument transformers for invoicing are to beexpected in not so remote a future.
1.1 Definition
From the viewpoint of legal metrology, a dis-tinction between non-conventional and conven-tional instrument transformers can at presenteasily be made on the basis of the two criteria“testability” and “measuring stability.”
According to these criteria, all instrumenttransformers with secondary values notequal to 1 A, 5 A, 100/√3 V, 100 V, etc. do notmeet the applicable requirements [4, 5] andare, therefore, to be classified as non-conven-tional. With the test equipment at presentavailable at the state-approved test centresfor electricity measuring instruments theycannot be verified.
For standardization, such a mere differentia-tion is not suitable as a definition; here electro-nic instrument transformers are affected [6, 7].As to the contents, the two terms “electronic in-strument transformers” and “non-conventionalinstrument transformers” are almost identical,as non-conventional instrument transformers al-most exclusively consist of electronic components.
As to the measuring stability, that is to saylong-time reliability, these electronic compo-nents are inferior to conventional transfor-mer types. This is why subsequent verificati-ons will be required for non-conventionalinstrument transformers, all the more so asthere is a stronger probability for creepingchanges.
1.2 Application
In fields where conventional instrument transfor-mers cause problems or their manufacture is rela-tively expensive and time-consuming, non-con-ventional instrument transformers may be used:• Conventional instrument transformers are
limited as regards the frequency response oftheir transfer function. The standards re-quire compliance with the maximum permis-sible errors only for the rated frequency. In thecase of DC current or DC voltage, their func-tion is restricted by saturation effects; at highfrequencies, their output signal is distorted sothat in very fast processes protective devicesconnected to them may fail.
• Operation with high voltage requires so-phisticated and thus expensive insulation;destruction as a result of insulation defectsis nearly the only failure type for conventio-nal high-voltage transformers. In opticalnon-conventional instrument transformers,the problem of electrical insulation is, howe-ver, already solved by the non-conductiveelectrical transmission medium.
• The increasing use of digital transmission andprocessing of the information required foroperation and the protection of networks hasresulted in an increasing interest in digitizingclose to the measuring point and in using in-strument transformers or sensors with digitaloutput straight away instead of the conventio-nal instrument transformers (with high ratedpower) and analog-to-digital converters.
Non-conventional current and voltage transformers
Helmut Seifert1, Hans-Georg Latzel2, Andreas Braun3
1 Helmut Seifert, PTBSection “Power andenergy, typ approval”,e-mail:[email protected]
2 Dr. Hans-Georg Lat-zel, PTB Section “In-strument Transformersand High Voltage,”e-mail:[email protected]
3 Dr. Andreas Braun,Head of PTB Depart-ment “Electrical En-ergy MeasuringTechniques,”e-mail:[email protected]
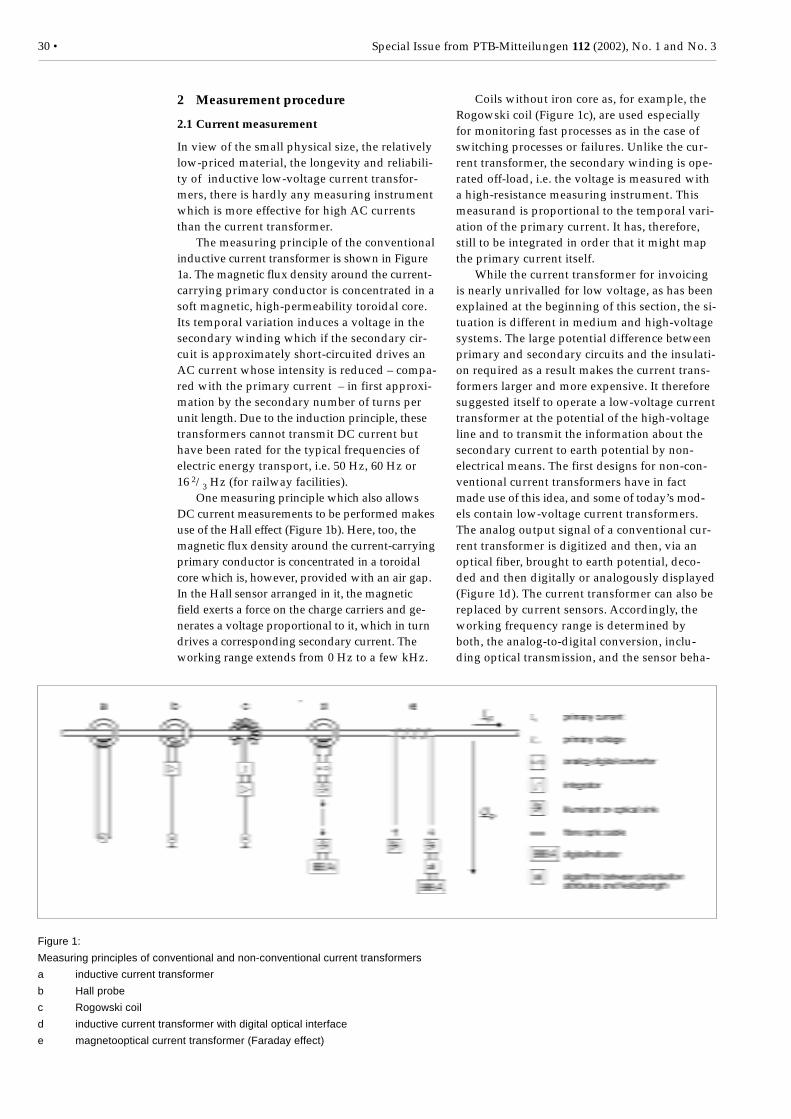
30 • Special Issue from PTB-Mitteilungen 112 (2002), No. 1 and No. 3
2 Measurement procedure
2.1 Current measurement
In view of the small physical size, the relativelylow-priced material, the longevity and reliabili-ty of inductive low-voltage current transfor-mers, there is hardly any measuring instrumentwhich is more effective for high AC currentsthan the current transformer.
The measuring principle of the conventionalinductive current transformer is shown in Figure1a. The magnetic flux density around the current-carrying primary conductor is concentrated in asoft magnetic, high-permeability toroidal core.Its temporal variation induces a voltage in thesecondary winding which if the secondary cir-cuit is approximately short-circuited drives anAC current whose intensity is reduced – compa-red with the primary current – in first approxi-mation by the secondary number of turns perunit length. Due to the induction principle, thesetransformers cannot transmit DC current buthave been rated for the typical frequencies ofelectric energy transport, i.e. 50 Hz, 60 Hz or16 2/3 Hz (for railway facilities).
One measuring principle which also allowsDC current measurements to be performed makesuse of the Hall effect (Figure 1b). Here, too, themagnetic flux density around the current-carryingprimary conductor is concentrated in a toroidalcore which is, however, provided with an air gap.In the Hall sensor arranged in it, the magneticfield exerts a force on the charge carriers and ge-nerates a voltage proportional to it, which in turndrives a corresponding secondary current. Theworking range extends from 0 Hz to a few kHz.
Coils without iron core as, for example, theRogowski coil (Figure 1c), are used especiallyfor monitoring fast processes as in the case ofswitching processes or failures. Unlike the cur-rent transformer, the secondary winding is ope-rated off-load, i.e. the voltage is measured witha high-resistance measuring instrument. Thismeasurand is proportional to the temporal vari-ation of the primary current. It has, therefore,still to be integrated in order that it might mapthe primary current itself.
While the current transformer for invoicingis nearly unrivalled for low voltage, as has beenexplained at the beginning of this section, the si-tuation is different in medium and high-voltagesystems. The large potential difference betweenprimary and secondary circuits and the insulati-on required as a result makes the current trans-formers larger and more expensive. It thereforesuggested itself to operate a low-voltage currenttransformer at the potential of the high-voltageline and to transmit the information about thesecondary current to earth potential by non-electrical means. The first designs for non-con-ventional current transformers have in factmade use of this idea, and some of today’s mod-els contain low-voltage current transformers.The analog output signal of a conventional cur-rent transformer is digitized and then, via anoptical fiber, brought to earth potential, deco-ded and then digitally or analogously displayed(Figure 1d). The current transformer can also bereplaced by current sensors. Accordingly, theworking frequency range is determined byboth, the analog-to-digital conversion, inclu-ding optical transmission, and the sensor beha-
Figure 1:
Measuring principles of conventional and non-conventional current transformers
a inductive current transformer
b Hall probe
c Rogowski coil
d inductive current transformer with digital optical interface
e magnetooptical current transformer (Faraday effect)
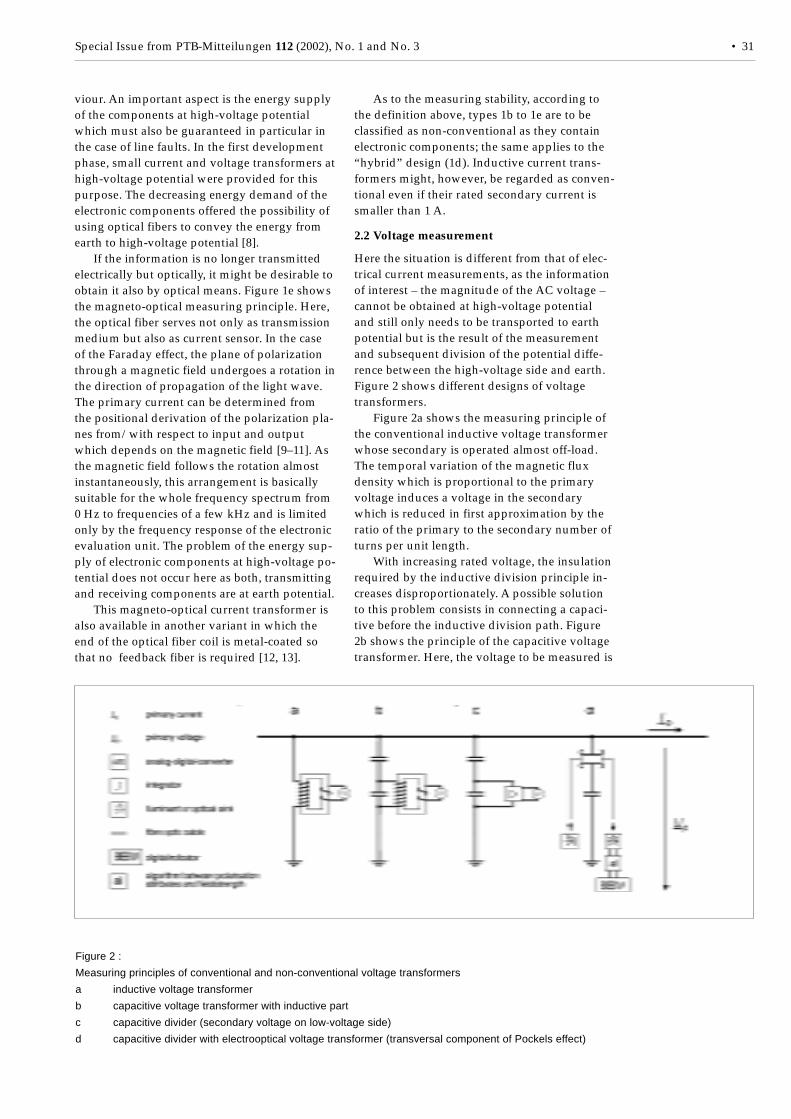
Special Issue from PTB-Mitteilungen 112 (2002), No. 1 and No. 3 • 31
viour. An important aspect is the energy supplyof the components at high-voltage potentialwhich must also be guaranteed in particular inthe case of line faults. In the first developmentphase, small current and voltage transformers athigh-voltage potential were provided for thispurpose. The decreasing energy demand of theelectronic components offered the possibility ofusing optical fibers to convey the energy fromearth to high-voltage potential [8].
If the information is no longer transmittedelectrically but optically, it might be desirable toobtain it also by optical means. Figure 1e showsthe magneto-optical measuring principle. Here,the optical fiber serves not only as transmissionmedium but also as current sensor. In the caseof the Faraday effect, the plane of polarizationthrough a magnetic field undergoes a rotation inthe direction of propagation of the light wave.The primary current can be determined fromthe positional derivation of the polarization pla-nes from/with respect to input and outputwhich depends on the magnetic field [9–11]. Asthe magnetic field follows the rotation almostinstantaneously, this arrangement is basicallysuitable for the whole frequency spectrum from0 Hz to frequencies of a few kHz and is limitedonly by the frequency response of the electronicevaluation unit. The problem of the energy sup-ply of electronic components at high-voltage po-tential does not occur here as both, transmittingand receiving components are at earth potential.
This magneto-optical current transformer isalso available in another variant in which theend of the optical fiber coil is metal-coated sothat no feedback fiber is required [12, 13].
As to the measuring stability, according tothe definition above, types 1b to 1e are to beclassified as non-conventional as they containelectronic components; the same applies to the“hybrid” design (1d). Inductive current trans-formers might, however, be regarded as conven-tional even if their rated secondary current issmaller than 1 A.
2.2 Voltage measurement
Here the situation is different from that of elec-trical current measurements, as the informationof interest – the magnitude of the AC voltage –cannot be obtained at high-voltage potentialand still only needs to be transported to earthpotential but is the result of the measurementand subsequent division of the potential diffe-rence between the high-voltage side and earth.Figure 2 shows different designs of voltagetransformers.
Figure 2a shows the measuring principle ofthe conventional inductive voltage transformerwhose secondary is operated almost off-load.The temporal variation of the magnetic fluxdensity which is proportional to the primaryvoltage induces a voltage in the secondarywhich is reduced in first approximation by theratio of the primary to the secondary number ofturns per unit length.
With increasing rated voltage, the insulationrequired by the inductive division principle in-creases disproportionately. A possible solutionto this problem consists in connecting a capaci-tive before the inductive division path. Figure2b shows the principle of the capacitive voltagetransformer. Here, the voltage to be measured is
Figure 2 :
Measuring principles of conventional and non-conventional voltage transformers
a inductive voltage transformer
b capacitive voltage transformer with inductive part
c capacitive divider (secondary voltage on low-voltage side)
d capacitive divider with electrooptical voltage transformer (transversal component of Pockels effect)
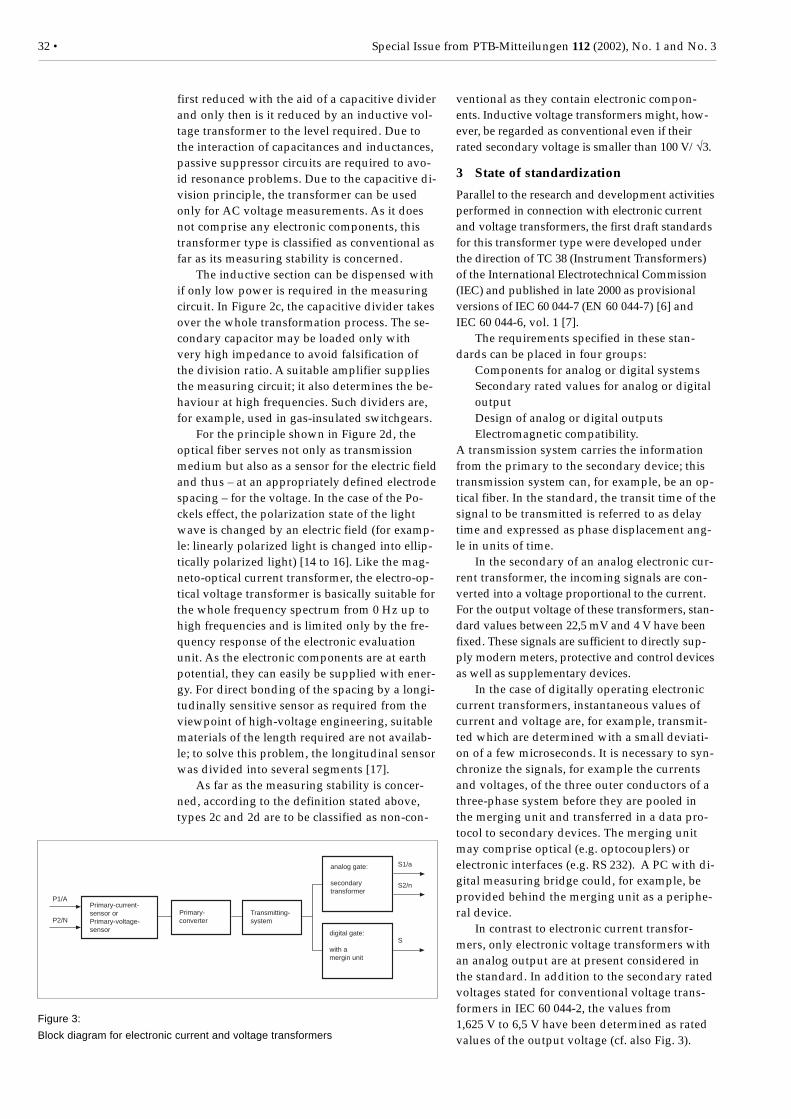
32 • Special Issue from PTB-Mitteilungen 112 (2002), No. 1 and No. 3
first reduced with the aid of a capacitive dividerand only then is it reduced by an inductive vol-tage transformer to the level required. Due tothe interaction of capacitances and inductances,passive suppressor circuits are required to avo-id resonance problems. Due to the capacitive di-vision principle, the transformer can be usedonly for AC voltage measurements. As it doesnot comprise any electronic components, thistransformer type is classified as conventional asfar as its measuring stability is concerned.
The inductive section can be dispensed withif only low power is required in the measuringcircuit. In Figure 2c, the capacitive divider takesover the whole transformation process. The se-condary capacitor may be loaded only withvery high impedance to avoid falsification ofthe division ratio. A suitable amplifier suppliesthe measuring circuit; it also determines the be-haviour at high frequencies. Such dividers are,for example, used in gas-insulated switchgears.
For the principle shown in Figure 2d, theoptical fiber serves not only as transmissionmedium but also as a sensor for the electric fieldand thus – at an appropriately defined electrodespacing – for the voltage. In the case of the Po-ckels effect, the polarization state of the lightwave is changed by an electric field (for examp-le: linearly polarized light is changed into ellip-tically polarized light) [14 to 16]. Like the mag-neto-optical current transformer, the electro-op-tical voltage transformer is basically suitable forthe whole frequency spectrum from 0 Hz up tohigh frequencies and is limited only by the fre-quency response of the electronic evaluationunit. As the electronic components are at earthpotential, they can easily be supplied with ener-gy. For direct bonding of the spacing by a longi-tudinally sensitive sensor as required from theviewpoint of high-voltage engineering, suitablematerials of the length required are not availab-le; to solve this problem, the longitudinal sensorwas divided into several segments [17].
As far as the measuring stability is concer-ned, according to the definition stated above,types 2c and 2d are to be classified as non-con-
ventional as they contain electronic compon-ents. Inductive voltage transformers might, how-ever, be regarded as conventional even if theirrated secondary voltage is smaller than 100 V/√3.
3 State of standardization
Parallel to the research and development activitiesperformed in connection with electronic currentand voltage transformers, the first draft standardsfor this transformer type were developed underthe direction of TC 38 (Instrument Transformers)of the International Electrotechnical Commission(IEC) and published in late 2000 as provisionalversions of IEC 60 044-7 (EN 60 044-7) [6] andIEC 60 044-6, vol. 1 [7].
The requirements specified in these stan-dards can be placed in four groups:• Components for analog or digital systems• Secondary rated values for analog or digital
output• Design of analog or digital outputs• Electromagnetic compatibility.A transmission system carries the informationfrom the primary to the secondary device; thistransmission system can, for example, be an op-tical fiber. In the standard, the transit time of thesignal to be transmitted is referred to as delaytime and expressed as phase displacement ang-le in units of time.
In the secondary of an analog electronic cur-rent transformer, the incoming signals are con-verted into a voltage proportional to the current.For the output voltage of these transformers, stan-dard values between 22,5 mV and 4 V have beenfixed. These signals are sufficient to directly sup-ply modern meters, protective and control devicesas well as supplementary devices.
In the case of digitally operating electroniccurrent transformers, instantaneous values ofcurrent and voltage are, for example, transmit-ted which are determined with a small deviati-on of a few microseconds. It is necessary to syn-chronize the signals, for example the currentsand voltages, of the three outer conductors of athree-phase system before they are pooled inthe merging unit and transferred in a data pro-tocol to secondary devices. The merging unitmay comprise optical (e.g. optocouplers) orelectronic interfaces (e.g. RS 232). A PC with di-gital measuring bridge could, for example, beprovided behind the merging unit as a periphe-ral device.
In contrast to electronic current transfor-mers, only electronic voltage transformers withan analog output are at present considered inthe standard. In addition to the secondary ratedvoltages stated for conventional voltage trans-formers in IEC 60 044-2, the values from1,625 V to 6,5 V have been determined as ratedvalues of the output voltage (cf. also Fig. 3).
Figure 3:
Block diagram for electronic current and voltage transformers
P1/A
P2/N
Primary-current-sensor orPrimary-voltage-sensor
Primary-converter
Transmitting-system
analog gate:
secondarytransformer
digital gate:
with amergin unit
S1/a
S2/n
S
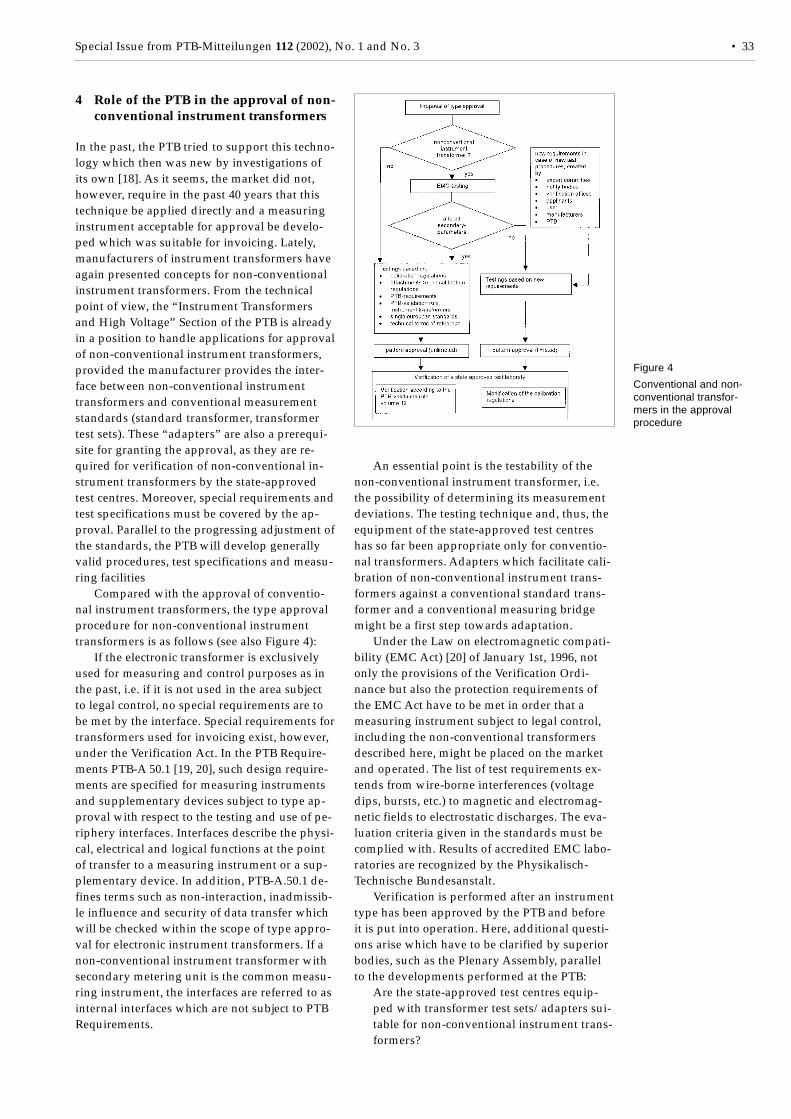
Special Issue from PTB-Mitteilungen 112 (2002), No. 1 and No. 3 • 33
4 Role of the PTB in the approval of non-conventional instrument transformers
In the past, the PTB tried to support this techno-logy which then was new by investigations ofits own [18]. As it seems, the market did not,however, require in the past 40 years that thistechnique be applied directly and a measuringinstrument acceptable for approval be develo-ped which was suitable for invoicing. Lately,manufacturers of instrument transformers haveagain presented concepts for non-conventionalinstrument transformers. From the technicalpoint of view, the “Instrument Transformersand High Voltage” Section of the PTB is alreadyin a position to handle applications for approvalof non-conventional instrument transformers,provided the manufacturer provides the inter-face between non-conventional instrumenttransformers and conventional measurementstandards (standard transformer, transformertest sets). These “adapters” are also a prerequi-site for granting the approval, as they are re-quired for verification of non-conventional in-strument transformers by the state-approvedtest centres. Moreover, special requirements andtest specifications must be covered by the ap-proval. Parallel to the progressing adjustment ofthe standards, the PTB will develop generallyvalid procedures, test specifications and measu-ring facilities
Compared with the approval of conventio-nal instrument transformers, the type approvalprocedure for non-conventional instrumenttransformers is as follows (see also Figure 4):
If the electronic transformer is exclusivelyused for measuring and control purposes as inthe past, i.e. if it is not used in the area subjectto legal control, no special requirements are tobe met by the interface. Special requirements fortransformers used for invoicing exist, however,under the Verification Act. In the PTB Require-ments PTB-A 50.1 [19, 20], such design require-ments are specified for measuring instrumentsand supplementary devices subject to type ap-proval with respect to the testing and use of pe-riphery interfaces. Interfaces describe the physi-cal, electrical and logical functions at the pointof transfer to a measuring instrument or a sup-plementary device. In addition, PTB-A.50.1 de-fines terms such as non-interaction, inadmissib-le influence and security of data transfer whichwill be checked within the scope of type appro-val for electronic instrument transformers. If anon-conventional instrument transformer withsecondary metering unit is the common measu-ring instrument, the interfaces are referred to asinternal interfaces which are not subject to PTBRequirements.
An essential point is the testability of thenon-conventional instrument transformer, i.e.the possibility of determining its measurementdeviations. The testing technique and, thus, theequipment of the state-approved test centreshas so far been appropriate only for conventio-nal transformers. Adapters which facilitate cali-bration of non-conventional instrument trans-formers against a conventional standard trans-former and a conventional measuring bridgemight be a first step towards adaptation.
Under the Law on electromagnetic compati-bility (EMC Act) [20] of January 1st, 1996, notonly the provisions of the Verification Ordi-nance but also the protection requirements ofthe EMC Act have to be met in order that ameasuring instrument subject to legal control,including the non-conventional transformersdescribed here, might be placed on the marketand operated. The list of test requirements ex-tends from wire-borne interferences (voltagedips, bursts, etc.) to magnetic and electromag-netic fields to electrostatic discharges. The eva-luation criteria given in the standards must becomplied with. Results of accredited EMC labo-ratories are recognized by the Physikalisch-Technische Bundesanstalt.
Verification is performed after an instrumenttype has been approved by the PTB and beforeit is put into operation. Here, additional questi-ons arise which have to be clarified by superiorbodies, such as the Plenary Assembly, parallelto the developments performed at the PTB:• Are the state-approved test centres equip-
ped with transformer test sets/adapters sui-table for non-conventional instrument trans-formers?
Figure 4
Conventional and non-conventional transfor-mers in the approvalprocedure
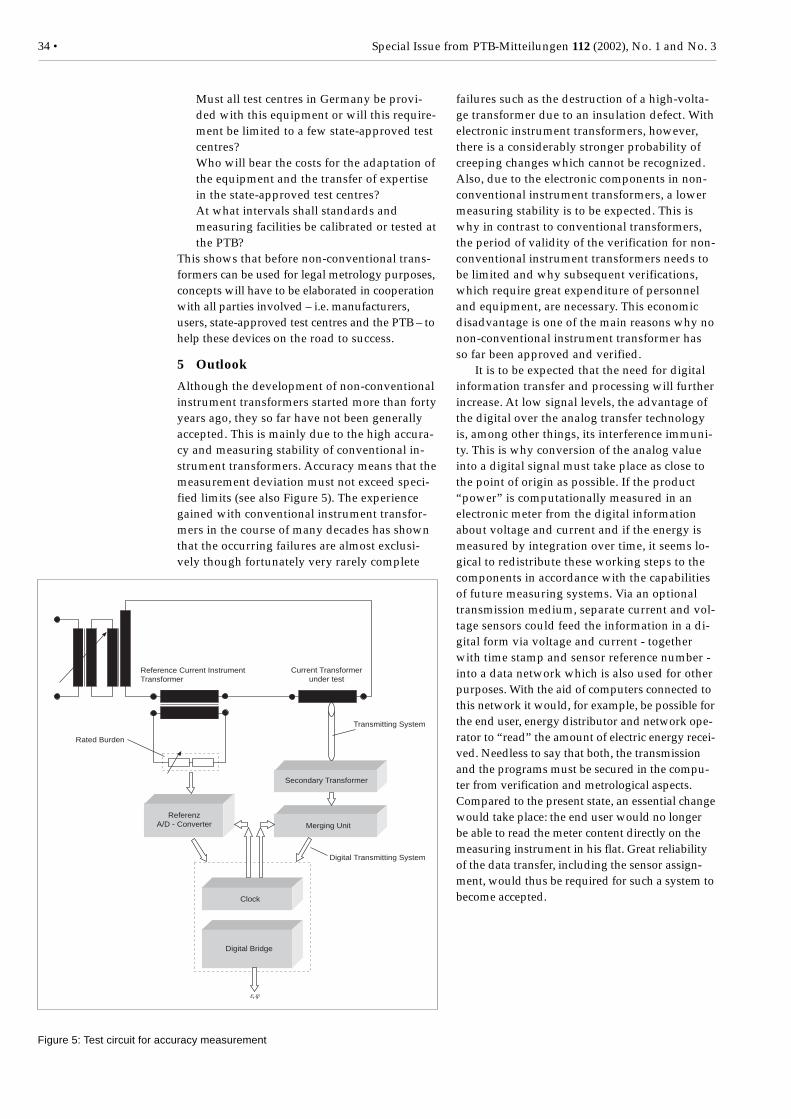
34 • Special Issue from PTB-Mitteilungen 112 (2002), No. 1 and No. 3
• Must all test centres in Germany be provi-ded with this equipment or will this require-ment be limited to a few state-approved testcentres?
• Who will bear the costs for the adaptation ofthe equipment and the transfer of expertisein the state-approved test centres?
• At what intervals shall standards andmeasuring facilities be calibrated or tested atthe PTB?
This shows that before non-conventional trans-formers can be used for legal metrology purposes,concepts will have to be elaborated in cooperationwith all parties involved – i.e. manufacturers,users, state-approved test centres and the PTB – tohelp these devices on the road to success.
5 Outlook
Although the development of non-conventionalinstrument transformers started more than fortyyears ago, they so far have not been generallyaccepted. This is mainly due to the high accura-cy and measuring stability of conventional in-strument transformers. Accuracy means that themeasurement deviation must not exceed speci-fied limits (see also Figure 5). The experiencegained with conventional instrument transfor-mers in the course of many decades has shownthat the occurring failures are almost exclusi-vely though fortunately very rarely complete
failures such as the destruction of a high-volta-ge transformer due to an insulation defect. Withelectronic instrument transformers, however,there is a considerably stronger probability ofcreeping changes which cannot be recognized.Also, due to the electronic components in non-conventional instrument transformers, a lowermeasuring stability is to be expected. This iswhy in contrast to conventional transformers,the period of validity of the verification for non-conventional instrument transformers needs tobe limited and why subsequent verifications,which require great expenditure of personneland equipment, are necessary. This economicdisadvantage is one of the main reasons why nonon-conventional instrument transformer hasso far been approved and verified.
It is to be expected that the need for digitalinformation transfer and processing will furtherincrease. At low signal levels, the advantage ofthe digital over the analog transfer technologyis, among other things, its interference immuni-ty. This is why conversion of the analog valueinto a digital signal must take place as close tothe point of origin as possible. If the product“power” is computationally measured in anelectronic meter from the digital informationabout voltage and current and if the energy ismeasured by integration over time, it seems lo-gical to redistribute these working steps to thecomponents in accordance with the capabilitiesof future measuring systems. Via an optionaltransmission medium, separate current and vol-tage sensors could feed the information in a di-gital form via voltage and current - togetherwith time stamp and sensor reference number -into a data network which is also used for otherpurposes. With the aid of computers connected tothis network it would, for example, be possible forthe end user, energy distributor and network ope-rator to “read” the amount of electric energy recei-ved. Needless to say that both, the transmissionand the programs must be secured in the compu-ter from verification and metrological aspects.Compared to the present state, an essential changewould take place: the end user would no longerbe able to read the meter content directly on themeasuring instrument in his flat. Great reliabilityof the data transfer, including the sensor assign-ment, would thus be required for such a system tobecome accepted.
Figure 5: Test circuit for accuracy measurement
Reference Current InstrumentTransformer
Current Transformerunder test
Transmitting System
Secondary Transformer
Merging Unit
Digital Transmitting System
ReferenzA/D - Converter
Rated Burden
Clock
Digital Bridge
Special Issue from PTB-Mitteilungen 112 (2002), No. 1 and No. 3 • 35
Literature
[1] Mouton, L.; Stalewski, A.; Bullo, P. (eds.):Non Conventional Current and VoltageTransformers. ELECTRA No. 59 (1978), pp.91–122
[2] IEEE Power Systems Instrumentation andMeasurements Committee (ed.): OpticalCurrent Transducers for Power Systems: AReview. IEEE Trans. Power Delivery 9(1994), pp. 1778–1788
[3] Braun, A.: 30 Jahre unkonventionelle Meß-wandler: 1965 bis 1995. PTB-Mitteilungen106, (1996), pp. 193–199
[4] PTB Requirements PTB-A 20.2, December1998
[5] PTB Testing Instructions, volume 12, Mess-wandler (Instrument Transducers), 1977
[6] DIN EN 60 044-7 (VDE 0414, part 44-7),Messwandler – elektronische Spannungs-wandler (Instrument transformers – elec-tronic voltage transformers); November2000; corresponds to IEC 60 044-7
[7] IEC 60 044-8 Ed. 1 CDV, Instrument trans-formers – electrical current transducers
[8] Schwarz, H.; Hudasch, H.: Erste Betriebser-fahrungen mit optischen Stromwandlern.PTB Report PTB-E-46, 1994, pp. 97–112
[9] Saito, S.; Fuiji, Y.; Yokoyama, K.; Hamasaki, J.;Ohno, Y.: The Laser Current Transformatorfor EHV Power Transmission Lines. IEEE J.of Quantum Electronics QE-2 (1966), pp.255–259
[10] Héoin, P.; Benoist, Ch.; Delamare, Y.: Mesured’un courant ampèremètre à effet Faraday.Rev. Gén. de l’Electricité 76 (1967), pp.1045–1054
[11] Pelenc, Y.; Bernard, G.: Prototype industriel
de transformateur de courant à effet mag-néto-optique. Rev. Gén. de l’Electricité 76(1967), pp. 1055–1063
[12] Hirsch, H.; Peier, D.: Prototyp eines faserop-tischen Stromwandlers für die 245-kV-Spannungsebene. Elektrizitätswirt. 90(1991), pp. 378–384
[13] Song, J.; McLaren, P.G.; Thomson, D.J.; Midd-leton, R.L.: A Prototype ClampOn Magneto-Optical Current Transducer for Power Sys-tem Metering and Relaying;. IEEE Trans.Power Delivery 10 (1995), pp. 1764–1771
[14] Kaminow, I.P.; Turner, E.H.: ElectroopticLight Modulators. Proc. IEEE 54 (1966),pp. 1374–1390
[15] Paul, G.; Schröter, H.: Meßwertübertragungüber große Potentialunterschiede. ELEK-TRIE 22 (1968), pp. 261–266
[16] Crepaz, S.; Manigraso, R.: High VoltageMeasurements With Pockels Cells.ISH ZUERICH, 1975, paper 3.1-02, conf.digest pp. 199–204
[17] Santos, J.C.; Taplamacioglu, M.C.; Hidaka, K.:Pockels High-Voltage Measurement Sys-tem. IEEE, Trans. Power Delivery 15 (2000),pp. 8–13
[18] Braun, A. Zinkernagel, J.: OptoelectronicElectricity Meter for High-Voltage Lines.IEEE Trans. Instrum. Meas. IM-22 (1973),pp. 394–399
[19] PTB-A 50.1, Schnittstellen an Messgerätenund Zusatzeinrichtungen, December 1989
[20] Behandlung von Software bei der eichtech-nischen Prüfung, PTB Workshop, Grottker10. 1999
[21] EMC LAW, 9.11.1992
36 • Special Issue from PTB-Mitteilungen 112 (2002), No. 1 and No. 3
Introduction
For reasons of efficiency, the transmission ofelectric energy from the power station to theconsumer takes place at high-voltage potential.In Europe mainly AC voltage and only occasi-onally DC voltage is in demand. The equipmentmust undergo detailed tests with respect to itsoperational reliability at high DC, AC and im-pulse voltages. Similar test requirements mustbe met by the instrument transformers used to-gether with electricity meters for invoicing elec-tric energy. Devices used for other purposesthan energy supply such as power and TV elec-tronics or accelerator technology are also testedat high voltage.
According to the test and quality assurancespecifications, the measuring instruments usedfor testing must be calibrated by a competentbody and have been traced back to national orinternational standards. The PTB has adapteditself in good time to this requirement the high-voltage sector has had to meet for about onedecade so that a large part of the calibrationtasks demanded by industry and calibrationand test laboratories can meanwhile be perfor-med. This task was facilitated by the completionof the Schering Building in 1994, in which thehigh-voltage laboratory is now accommodated insuit-able calibration rooms, by the renovation ofthe high-voltage hall [1, 2] and by intense coo-peration in national and international workinggroups in which the bases of novel high-voltagemeasuring techniques and their standardizationwere investigated and tested in numerous inter-comparisons.
Today, the dissemination of the most impor-tant high-voltage measurands is ensured toge-ther with approximately 20 calibration laborato-ries which have been accredited by the Deut-scher Kalibrierdienst (DKD) and whose stan-dards are controlled by the PTB at regular inter-vals. These calibration laboratories mainly per-form the number of routine calibrations whichincreases permanently and thus make a valua-ble contribution to the quality of industrialproducts. Their range of influence extends farbeyond the frontiers of Germany and Europe.
This article will first give a survey of thePTB’s basic equipment and rooms for highvoltage and then deal with some developmentsand results recently obtained in this field.
1 Rooms and equipment
In 1994, the High-voltage Section of the PTBwas accommodated in a new building [2] whichwas named after the outstanding scientist Ha-rald Schering who at the former PTR between1905 and 1927 developed a number of devicesin the field of instrument transformers andhigh-voltage whose design principles in partare still valid today [1]. The Schering Buildingaccommodates three medium-sized rooms forhigh-voltage measurements, several rooms withelectronics and computer workplaces and theoffices of the employees. One of the measure-ment rooms is shielded and air-conditioned.Within the scope of the construction work, thehigh-voltage hall which had already been putinto service in 1964, was completely overhauledand modernized. The useful area of the shieldedand air-conditioned hall is 20 m × 10 m and themean hall height 11 m. Next to the hall is thecooling tower which is also shielded; it is 6,5 min diameter and has a ceiling height of 11 m. Inaddition to the high-voltage generators andhigh-voltage measuring devices, the laboratoryequipment also comprises facilities for the cur-rent generation and measurement of electriccurrents (Table 1).
The test unit is generally calibrated by acomparison measurement against the respectivePTB standard using specified measuring proce-dures (Figure 1). In the past few years, tight-ened requirements due to new test specificati-ons, incorporation of the DKD calibration labo-ratories into the measurement hierarchy for thedissemination of the units of measurement andthe demand of the manufacturers of high-volta-ge measuring facilities for more exact measure-ment capabilities for their own quality controlhave required special efforts for the measurandsto be disseminated with the uncertainties re-quired [3, 4].
Due to the large dimensions, the transport ofhigh-voltage devices and measuring facilities
Development and calibration of high-voltage andhigh-current measuring devices
Klaus Schon1, Wolfgang Lucas2, Rainer Marx3, Enrico Mohns4,Günter Roeissle5
1 Dr. Klaus Schon,Head of PTB Section“Instrument Transfor-mers and High Volt-age,”e-mail:[email protected]
2 Dr. Wolfgang Lucas,PTB Section “Instru-ment Transformersand High Voltage,”e-mail:[email protected]
3 Rainer Marx, PTBSection “InstrumentTransformers andHigh Voltage,”e-mail:[email protected]
4 Enrico Mohns, PTBSection “ElectricityMeters,”e-mail:[email protected]
5 Günter Roeissle,PTB Section “Instru-ment Transformersand High Voltage,”e-mail:[email protected]
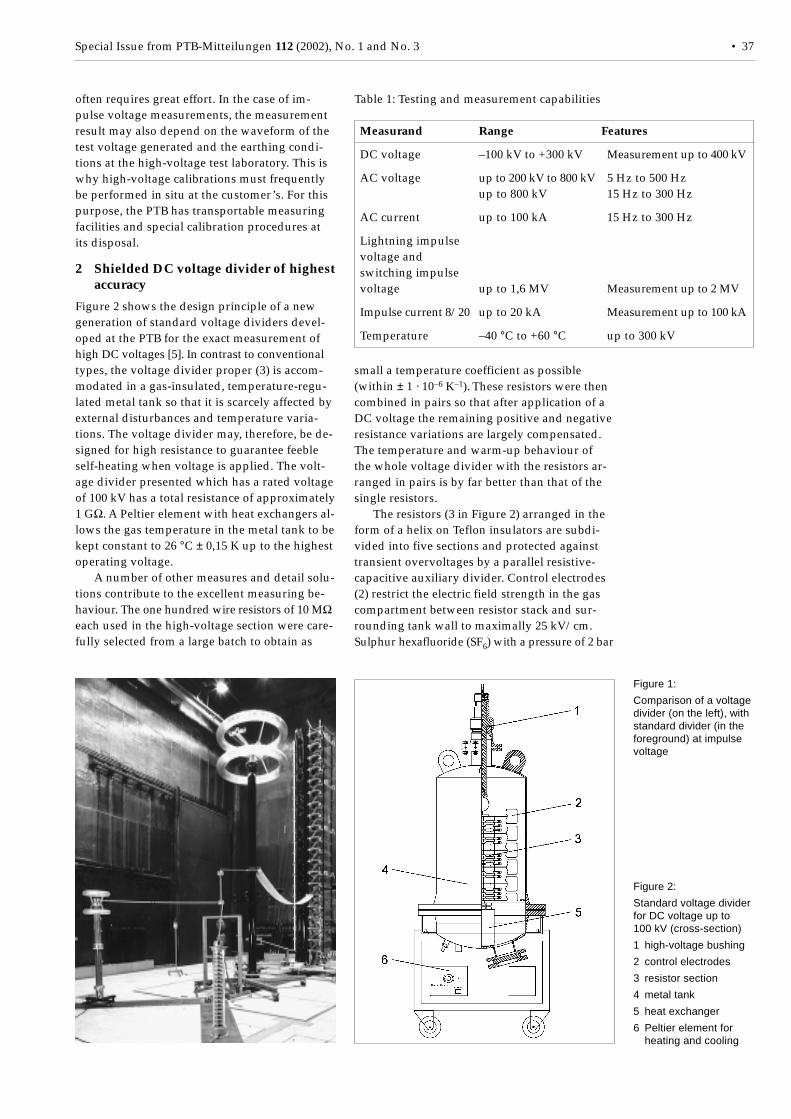
Special Issue from PTB-Mitteilungen 112 (2002), No. 1 and No. 3 • 37
often requires great effort. In the case of im-pulse voltage measurements, the measurementresult may also depend on the waveform of thetest voltage generated and the earthing condi-tions at the high-voltage test laboratory. This iswhy high-voltage calibrations must frequentlybe performed in situ at the customer’s. For thispurpose, the PTB has transportable measuringfacilities and special calibration procedures atits disposal.
2 Shielded DC voltage divider of highestaccuracy
Figure 2 shows the design principle of a newgeneration of standard voltage dividers devel-oped at the PTB for the exact measurement ofhigh DC voltages [5]. In contrast to conventionaltypes, the voltage divider proper (3) is accom-modated in a gas-insulated, temperature-regu-lated metal tank so that it is scarcely affected byexternal disturbances and temperature varia-tions. The voltage divider may, therefore, be de-signed for high resistance to guarantee feebleself-heating when voltage is applied. The volt-age divider presented which has a rated voltageof 100 kV has a total resistance of approximately1 GΩ. A Peltier element with heat exchangers al-lows the gas temperature in the metal tank to bekept constant to 26 °C ± 0,15 K up to the highestoperating voltage.
A number of other measures and detail solu-tions contribute to the excellent measuring be-haviour. The one hundred wire resistors of 10 MΩeach used in the high-voltage section were care-fully selected from a large batch to obtain as
small a temperature coefficient as possible(within ± 1 · 10–6 K–1). These resistors were thencombined in pairs so that after application of aDC voltage the remaining positive and negativeresistance variations are largely compensated.The temperature and warm-up behaviour ofthe whole voltage divider with the resistors ar-ranged in pairs is by far better than that of thesingle resistors.
The resistors (3 in Figure 2) arranged in theform of a helix on Teflon insulators are subdi-vided into five sections and protected againsttransient overvoltages by a parallel resistive-capacitive auxiliary divider. Control electrodes(2) restrict the electric field strength in the gascompartment between resistor stack and sur-rounding tank wall to maximally 25 kV/cm.Sulphur hexafluoride (SF6) with a pressure of 2 bar
Table 1: Testing and measurement capabilities
Measurand Range Features
DC voltage –100 kV to +300 kV Measurement up to 400 kV
AC voltage up to 200 kV to 800 kV 5 Hz to 500 Hzup to 800 kV 15 Hz to 300 Hz
AC current up to 100 kA 15 Hz to 300 Hz
Lightning impulsevoltage andswitching impulsevoltage up to 1,6 MV Measurement up to 2 MV
Impulse current 8/20 up to 20 kA Measurement up to 100 kA
Temperature –40 °C to +60 °C up to 300 kV
Figure 1:
Comparison of a voltagedivider (on the left), withstandard divider (in theforeground) at impulsevoltage
Figure 2:
Standard voltage dividerfor DC voltage up to100 kV (cross-section)
1 high-voltage bushing
2 control electrodes
3 resistor section
4 metal tank
5 heat exchanger
6 Peltier element forheating and cooling
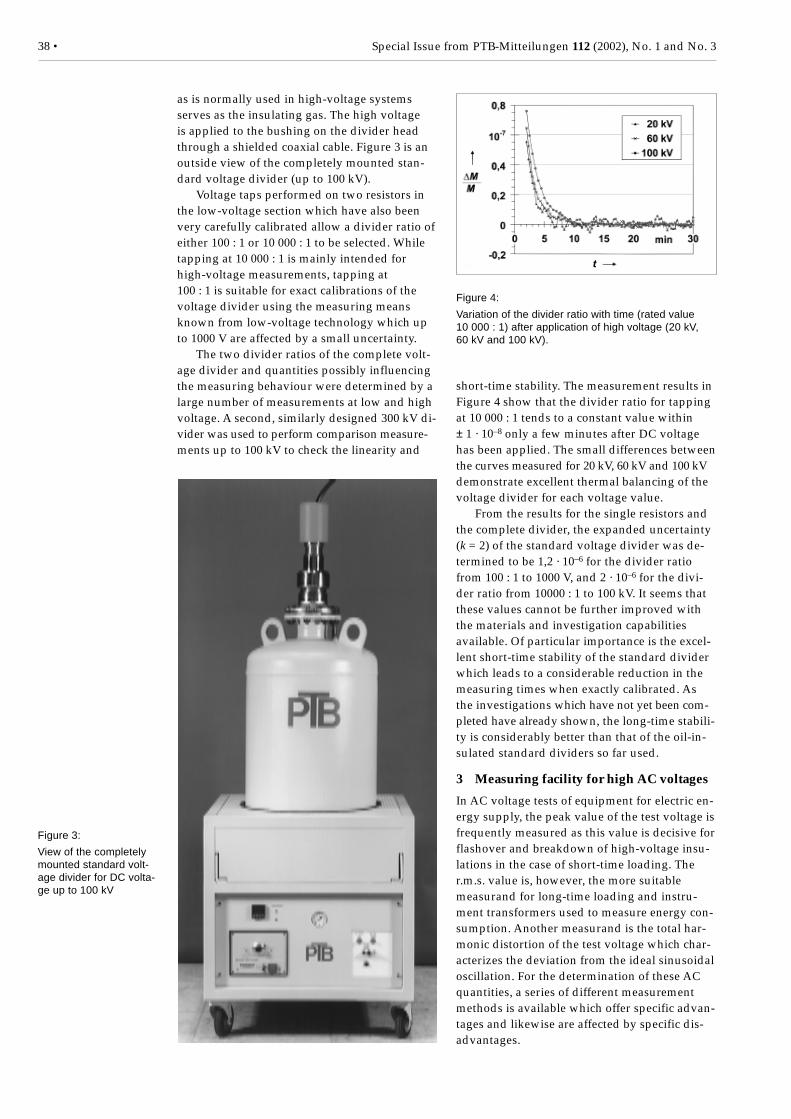
38 • Special Issue from PTB-Mitteilungen 112 (2002), No. 1 and No. 3
as is normally used in high-voltage systemsserves as the insulating gas. The high voltageis applied to the bushing on the divider headthrough a shielded coaxial cable. Figure 3 is anoutside view of the completely mounted stan-dard voltage divider (up to 100 kV).
Voltage taps performed on two resistors inthe low-voltage section which have also beenvery carefully calibrated allow a divider ratio ofeither 100 : 1 or 10 000 : 1 to be selected. Whiletapping at 10 000 : 1 is mainly intended forhigh-voltage measurements, tapping at100 : 1 is suitable for exact calibrations of thevoltage divider using the measuring meansknown from low-voltage technology which upto 1000 V are affected by a small uncertainty.
The two divider ratios of the complete volt-age divider and quantities possibly influencingthe measuring behaviour were determined by alarge number of measurements at low and highvoltage. A second, similarly designed 300 kV di-vider was used to perform comparison measure-ments up to 100 kV to check the linearity and
short-time stability. The measurement results inFigure 4 show that the divider ratio for tappingat 10 000 : 1 tends to a constant value within± 1 · 10–8 only a few minutes after DC voltagehas been applied. The small differences betweenthe curves measured for 20 kV, 60 kV and 100 kVdemonstrate excellent thermal balancing of thevoltage divider for each voltage value.
From the results for the single resistors andthe complete divider, the expanded uncertainty(k = 2) of the standard voltage divider was de-termined to be 1,2 · 10–6 for the divider ratiofrom 100 : 1 to 1000 V, and 2 · 10–6 for the divi-der ratio from 10000 : 1 to 100 kV. It seems thatthese values cannot be further improved withthe materials and investigation capabilitiesavailable. Of particular importance is the excel-lent short-time stability of the standard dividerwhich leads to a considerable reduction in themeasuring times when exactly calibrated. Asthe investigations which have not yet been com-pleted have already shown, the long-time stabili-ty is considerably better than that of the oil-in-sulated standard dividers so far used.
3 Measuring facility for high AC voltages
In AC voltage tests of equipment for electric en-ergy supply, the peak value of the test voltage isfrequently measured as this value is decisive forflashover and breakdown of high-voltage insu-lations in the case of short-time loading. Ther.m.s. value is, however, the more suitablemeasurand for long-time loading and instru-ment transformers used to measure energy con-sumption. Another measurand is the total har-monic distortion of the test voltage which char-acterizes the deviation from the ideal sinusoidaloscillation. For the determination of these ACquantities, a series of different measurementmethods is available which offer specific advan-tages and likewise are affected by specific dis-advantages.
Figure 3:
View of the completelymounted standard volt-age divider for DC volta-ge up to 100 kV
Figure 4:
Variation of the divider ratio with time (rated value10 000 : 1) after application of high voltage (20 kV,60 kV and 100 kV).
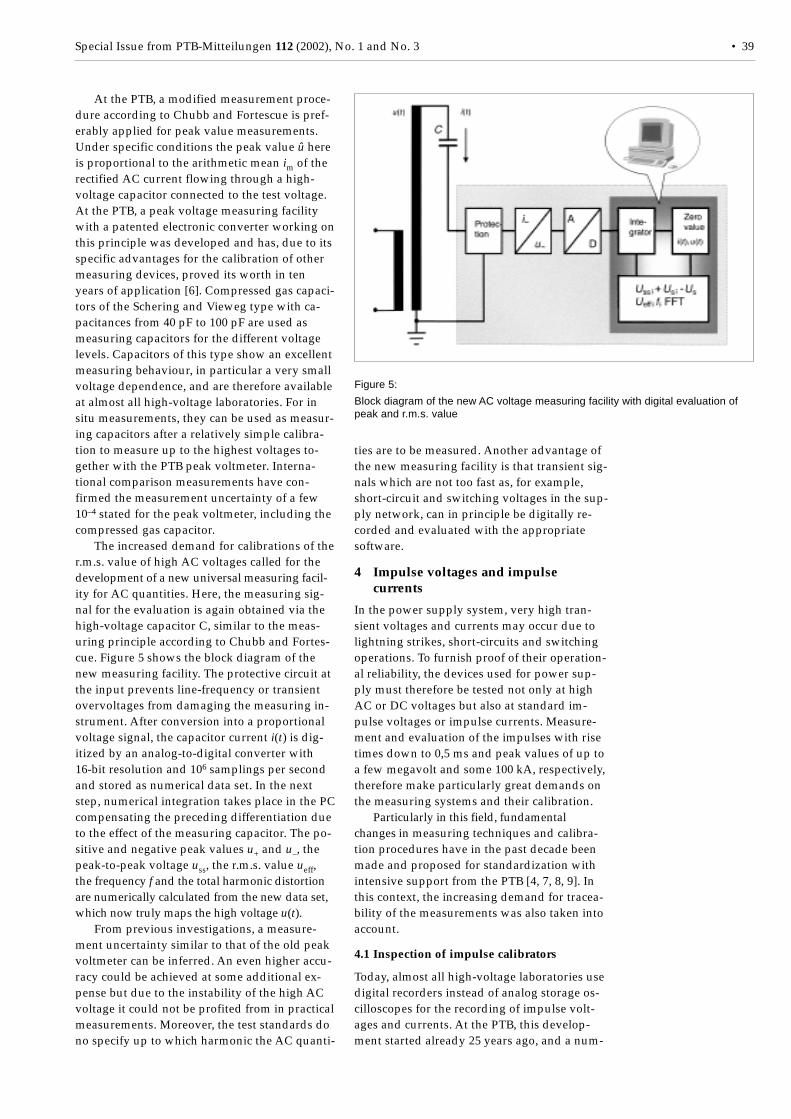
Special Issue from PTB-Mitteilungen 112 (2002), No. 1 and No. 3 • 39
At the PTB, a modified measurement proce-dure according to Chubb and Fortescue is pref-erably applied for peak value measurements.Under specific conditions the peak value û hereis proportional to the arithmetic mean im of therectified AC current flowing through a high-voltage capacitor connected to the test voltage.At the PTB, a peak voltage measuring facilitywith a patented electronic converter working onthis principle was developed and has, due to itsspecific advantages for the calibration of othermeasuring devices, proved its worth in tenyears of application [6]. Compressed gas capaci-tors of the Schering and Vieweg type with ca-pacitances from 40 pF to 100 pF are used asmeasuring capacitors for the different voltagelevels. Capacitors of this type show an excellentmeasuring behaviour, in particular a very smallvoltage dependence, and are therefore availableat almost all high-voltage laboratories. For insitu measurements, they can be used as measur-ing capacitors after a relatively simple calibra-tion to measure up to the highest voltages to-gether with the PTB peak voltmeter. Interna-tional comparison measurements have con-firmed the measurement uncertainty of a few10–4 stated for the peak voltmeter, including thecompressed gas capacitor.
The increased demand for calibrations of ther.m.s. value of high AC voltages called for thedevelopment of a new universal measuring facil-ity for AC quantities. Here, the measuring sig-nal for the evaluation is again obtained via thehigh-voltage capacitor C, similar to the meas-uring principle according to Chubb and Fortes-cue. Figure 5 shows the block diagram of thenew measuring facility. The protective circuit atthe input prevents line-frequency or transientovervoltages from damaging the measuring in-strument. After conversion into a proportionalvoltage signal, the capacitor current i(t) is dig-itized by an analog-to-digital converter with16-bit resolution and 106 samplings per secondand stored as numerical data set. In the nextstep, numerical integration takes place in the PCcompensating the preceding differentiation dueto the effect of the measuring capacitor. The po-sitive and negative peak values u+ and u–, thepeak-to-peak voltage uss, the r.m.s. value ueff,the frequency f and the total harmonic distortionare numerically calculated from the new data set,which now truly maps the high voltage u(t).
From previous investigations, a measure-ment uncertainty similar to that of the old peakvoltmeter can be inferred. An even higher accu-racy could be achieved at some additional ex-pense but due to the instability of the high ACvoltage it could not be profited from in practicalmeasurements. Moreover, the test standards dono specify up to which harmonic the AC quanti-
ties are to be measured. Another advantage ofthe new measuring facility is that transient sig-nals which are not too fast as, for example,short-circuit and switching voltages in the sup-ply network, can in principle be digitally re-corded and evaluated with the appropriatesoftware.
4 Impulse voltages and impulsecurrents
In the power supply system, very high tran-sient voltages and currents may occur due tolightning strikes, short-circuits and switchingoperations. To furnish proof of their operation-al reliability, the devices used for power sup-ply must therefore be tested not only at highAC or DC voltages but also at standard im-pulse voltages or impulse currents. Measure-ment and evaluation of the impulses with risetimes down to 0,5 ms and peak values of up toa few megavolt and some 100 kA, respectively,therefore make particularly great demands onthe measuring systems and their calibration.
Particularly in this field, fundamentalchanges in measuring techniques and calibra-tion procedures have in the past decade beenmade and proposed for standardization withintensive support from the PTB [4, 7, 8, 9]. Inthis context, the increasing demand for tracea-bility of the measurements was also taken intoaccount.
4.1 Inspection of impulse calibrators
Today, almost all high-voltage laboratories usedigital recorders instead of analog storage os-cilloscopes for the recording of impulse volt-ages and currents. At the PTB, this develop-ment started already 25 years ago, and a num-
Figure 5:
Block diagram of the new AC voltage measuring facility with digital evaluation ofpeak and r.m.s. value
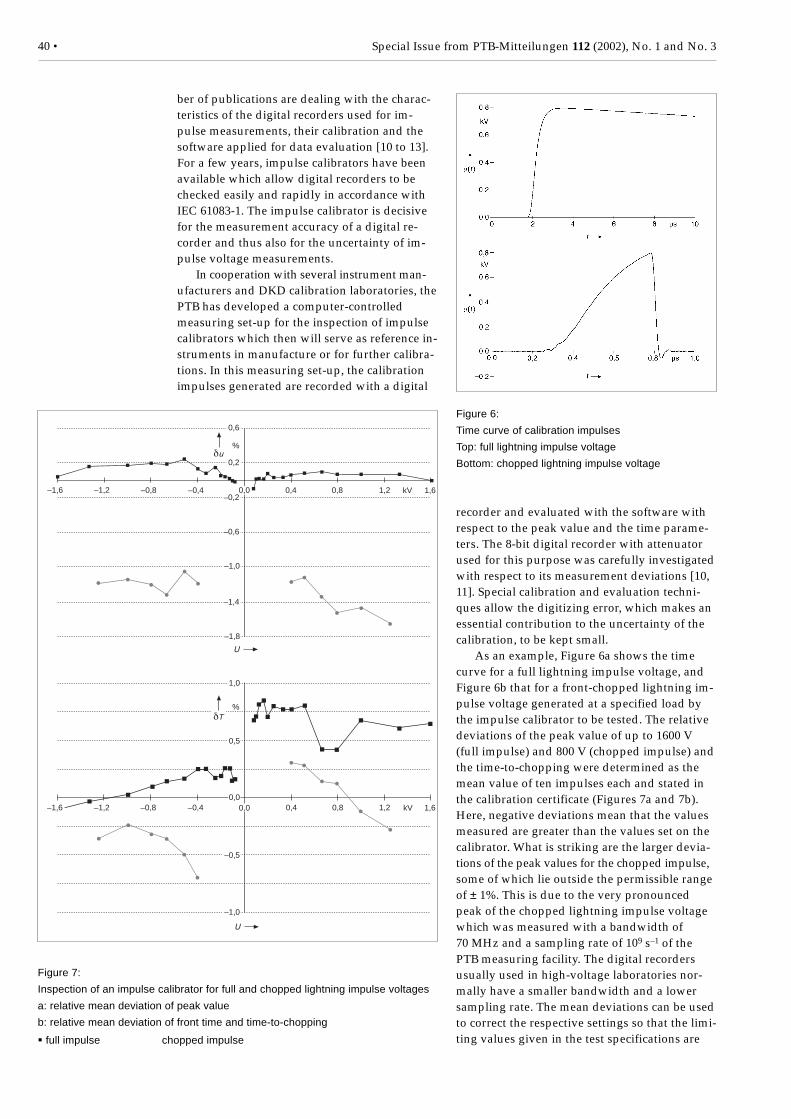
40 • Special Issue from PTB-Mitteilungen 112 (2002), No. 1 and No. 3
ber of publications are dealing with the charac-teristics of the digital recorders used for im-pulse measurements, their calibration and thesoftware applied for data evaluation [10 to 13].For a few years, impulse calibrators have beenavailable which allow digital recorders to bechecked easily and rapidly in accordance withIEC 61083-1. The impulse calibrator is decisivefor the measurement accuracy of a digital re-corder and thus also for the uncertainty of im-pulse voltage measurements.
In cooperation with several instrument man-ufacturers and DKD calibration laboratories, thePTB has developed a computer-controlledmeasuring set-up for the inspection of impulsecalibrators which then will serve as reference in-struments in manufacture or for further calibra-tions. In this measuring set-up, the calibrationimpulses generated are recorded with a digital
recorder and evaluated with the software withrespect to the peak value and the time parame-ters. The 8-bit digital recorder with attenuatorused for this purpose was carefully investigatedwith respect to its measurement deviations [10,11]. Special calibration and evaluation techni-ques allow the digitizing error, which makes anessential contribution to the uncertainty of thecalibration, to be kept small.
As an example, Figure 6a shows the timecurve for a full lightning impulse voltage, andFigure 6b that for a front-chopped lightning im-pulse voltage generated at a specified load bythe impulse calibrator to be tested. The relativedeviations of the peak value of up to 1600 V(full impulse) and 800 V (chopped impulse) andthe time-to-chopping were determined as themean value of ten impulses each and stated inthe calibration certificate (Figures 7a and 7b).Here, negative deviations mean that the valuesmeasured are greater than the values set on thecalibrator. What is striking are the larger devia-tions of the peak values for the chopped impulse,some of which lie outside the permissible rangeof ± 1%. This is due to the very pronouncedpeak of the chopped lightning impulse voltagewhich was measured with a bandwidth of70 MHz and a sampling rate of 109 s–1 of thePTB measuring facility. The digital recordersusually used in high-voltage laboratories nor-mally have a smaller bandwidth and a lowersampling rate. The mean deviations can be usedto correct the respective settings so that the limi-ting values given in the test specifications are
–1,6 –0,8 –0,4 0,0 0,4 0,8 1,2 1,6kV
–1,8
–1,4
–1,0
–0,6
–0,2
0,2
0,6
%
1,0
%
0,5
0,0
–0,5
–1,0
–1,2
–1,2 –0,8 –0,4 0,0 0,4 0,8 1,2 1,6kV
T
–1,6
Figure 7:
Inspection of an impulse calibrator for full and chopped lightning impulse voltages
a: relative mean deviation of peak value
b: relative mean deviation of front time and time-to-chopping
full impulse • chopped impulse
Figure 6:
Time curve of calibration impulses
Top: full lightning impulse voltage
Bottom: chopped lightning impulse voltage
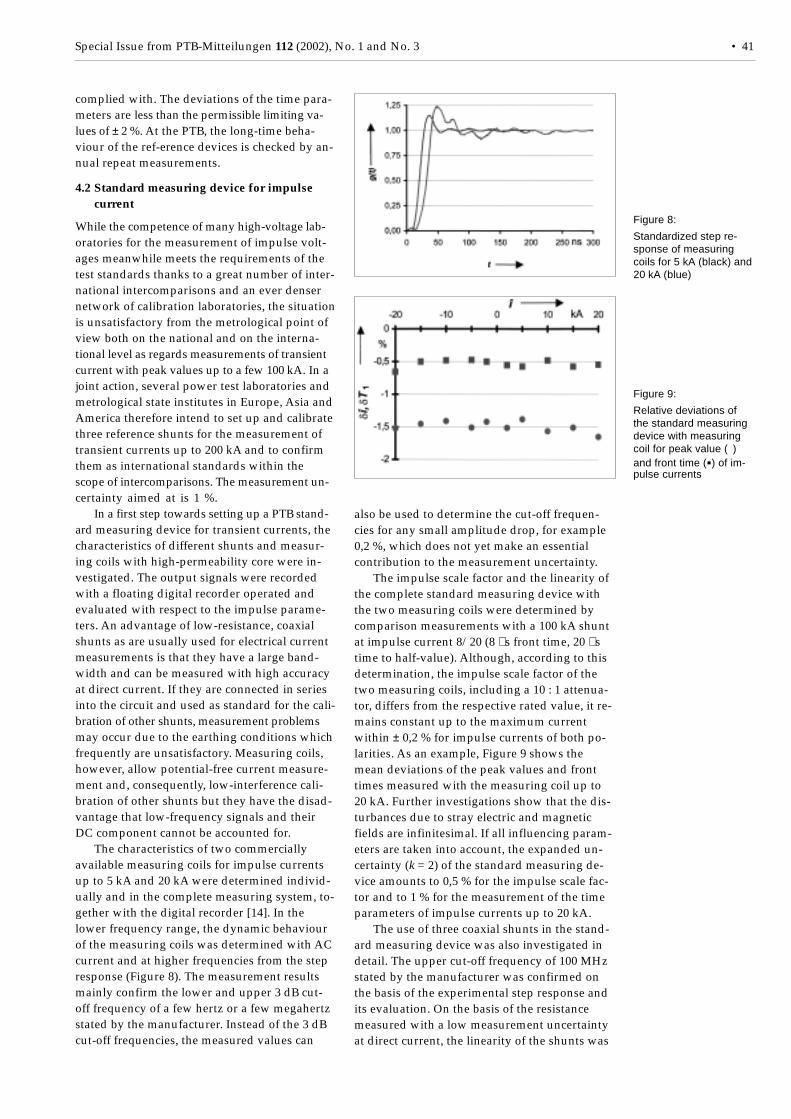
Special Issue from PTB-Mitteilungen 112 (2002), No. 1 and No. 3 • 41
complied with. The deviations of the time para-meters are less than the permissible limiting va-lues of ± 2 %. At the PTB, the long-time beha-viour of the ref-erence devices is checked by an-nual repeat measurements.
4.2 Standard measuring device for impulsecurrent
While the competence of many high-voltage lab-oratories for the measurement of impulse volt-ages meanwhile meets the requirements of thetest standards thanks to a great number of inter-national intercomparisons and an ever densernetwork of calibration laboratories, the situationis unsatisfactory from the metrological point ofview both on the national and on the interna-tional level as regards measurements of transientcurrent with peak values up to a few 100 kA. In ajoint action, several power test laboratories andmetrological state institutes in Europe, Asia andAmerica therefore intend to set up and calibratethree reference shunts for the measurement oftransient currents up to 200 kA and to confirmthem as international standards within thescope of intercomparisons. The measurement un-certainty aimed at is 1 %.
In a first step towards setting up a PTB stand-ard measuring device for transient currents, thecharacteristics of different shunts and measur-ing coils with high-permeability core were in-vestigated. The output signals were recordedwith a floating digital recorder operated andevaluated with respect to the impulse parame-ters. An advantage of low-resistance, coaxialshunts as are usually used for electrical currentmeasurements is that they have a large band-width and can be measured with high accuracyat direct current. If they are connected in seriesinto the circuit and used as standard for the cali-bration of other shunts, measurement problemsmay occur due to the earthing conditions whichfrequently are unsatisfactory. Measuring coils,however, allow potential-free current measure-ment and, consequently, low-interference cali-bration of other shunts but they have the disad-vantage that low-frequency signals and theirDC component cannot be accounted for.
The characteristics of two commerciallyavailable measuring coils for impulse currentsup to 5 kA and 20 kA were determined individ-ually and in the complete measuring system, to-gether with the digital recorder [14]. In thelower frequency range, the dynamic behaviourof the measuring coils was determined with ACcurrent and at higher frequencies from the stepresponse (Figure 8). The measurement resultsmainly confirm the lower and upper 3 dB cut-off frequency of a few hertz or a few megahertzstated by the manufacturer. Instead of the 3 dBcut-off frequencies, the measured values can
also be used to determine the cut-off frequen-cies for any small amplitude drop, for example0,2 %, which does not yet make an essentialcontribution to the measurement uncertainty.
The impulse scale factor and the linearity ofthe complete standard measuring device withthe two measuring coils were determined bycomparison measurements with a 100 kA shuntat impulse current 8/20 (8 µs front time, 20 µstime to half-value). Although, according to thisdetermination, the impulse scale factor of thetwo measuring coils, including a 10 : 1 attenua-tor, differs from the respective rated value, it re-mains constant up to the maximum currentwithin ± 0,2 % for impulse currents of both po-larities. As an example, Figure 9 shows themean deviations of the peak values and fronttimes measured with the measuring coil up to20 kA. Further investigations show that the dis-turbances due to stray electric and magneticfields are infinitesimal. If all influencing param-eters are taken into account, the expanded un-certainty (k = 2) of the standard measuring de-vice amounts to 0,5 % for the impulse scale fac-tor and to 1 % for the measurement of the timeparameters of impulse currents up to 20 kA.
The use of three coaxial shunts in the stand-ard measuring device was also investigated indetail. The upper cut-off frequency of 100 MHzstated by the manufacturer was confirmed onthe basis of the experimental step response andits evaluation. On the basis of the resistancemeasured with a low measurement uncertaintyat direct current, the linearity of the shunts was
Figure 8:
Standardized step re-sponse of measuringcoils for 5 kA (black) and20 kA (blue)
Figure 9:
Relative deviations ofthe standard measuringdevice with measuringcoil for peak value (•)and front time () of im-pulse currents
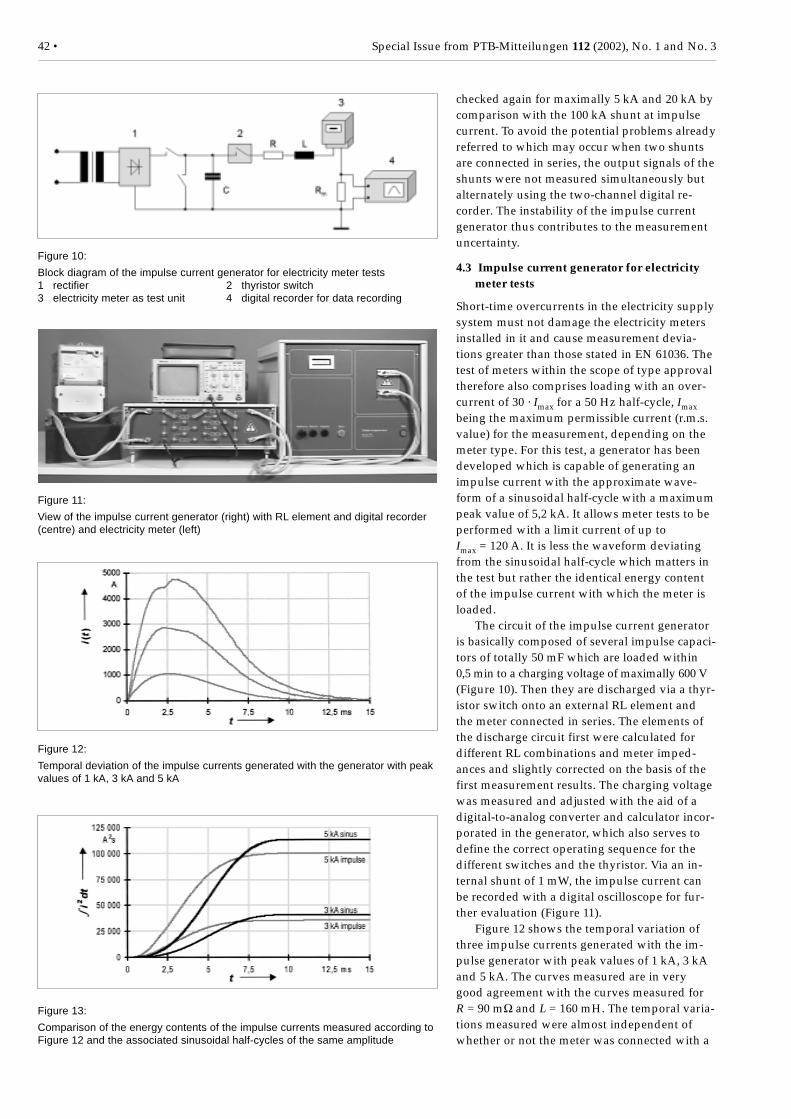
42 • Special Issue from PTB-Mitteilungen 112 (2002), No. 1 and No. 3
Figure 10:
Block diagram of the impulse current generator for electricity meter tests1 rectifier 2 thyristor switch3 electricity meter as test unit 4 digital recorder for data recording
checked again for maximally 5 kA and 20 kA bycomparison with the 100 kA shunt at impulsecurrent. To avoid the potential problems alreadyreferred to which may occur when two shuntsare connected in series, the output signals of theshunts were not measured simultaneously butalternately using the two-channel digital re-corder. The instability of the impulse currentgenerator thus contributes to the measurementuncertainty.
4.3 Impulse current generator for electricitymeter tests
Short-time overcurrents in the electricity supplysystem must not damage the electricity metersinstalled in it and cause measurement devia-tions greater than those stated in EN 61036. Thetest of meters within the scope of type approvaltherefore also comprises loading with an over-current of 30 · Imax for a 50 Hz half-cycle, Imaxbeing the maximum permissible current (r.m.s.value) for the measurement, depending on themeter type. For this test, a generator has beendeveloped which is capable of generating animpulse current with the approximate wave-form of a sinusoidal half-cycle with a maximumpeak value of 5,2 kA. It allows meter tests to beperformed with a limit current of up toImax = 120 A. It is less the waveform deviatingfrom the sinusoidal half-cycle which matters inthe test but rather the identical energy contentof the impulse current with which the meter isloaded.
The circuit of the impulse current generatoris basically composed of several impulse capaci-tors of totally 50 mF which are loaded within0,5 min to a charging voltage of maximally 600 V(Figure 10). Then they are discharged via a thyr-istor switch onto an external RL element andthe meter connected in series. The elements ofthe discharge circuit first were calculated fordifferent RL combinations and meter imped-ances and slightly corrected on the basis of thefirst measurement results. The charging voltagewas measured and adjusted with the aid of adigital-to-analog converter and calculator incor-porated in the generator, which also serves todefine the correct operating sequence for thedifferent switches and the thyristor. Via an in-ternal shunt of 1 mW, the impulse current canbe recorded with a digital oscilloscope for fur-ther evaluation (Figure 11).
Figure 12 shows the temporal variation ofthree impulse currents generated with the im-pulse generator with peak values of 1 kA, 3 kAand 5 kA. The curves measured are in verygood agreement with the curves measured forR = 90 mΩ and L = 160 mH. The temporal varia-tions measured were almost independent ofwhether or not the meter was connected with a
Figure 11:
View of the impulse current generator (right) with RL element and digital recorder(centre) and electricity meter (left)
Figure 12:
Temporal deviation of the impulse currents generated with the generator with peakvalues of 1 kA, 3 kA and 5 kA
Figure 13:
Comparison of the energy contents of the impulse currents measured according toFigure 12 and the associated sinusoidal half-cycles of the same amplitude
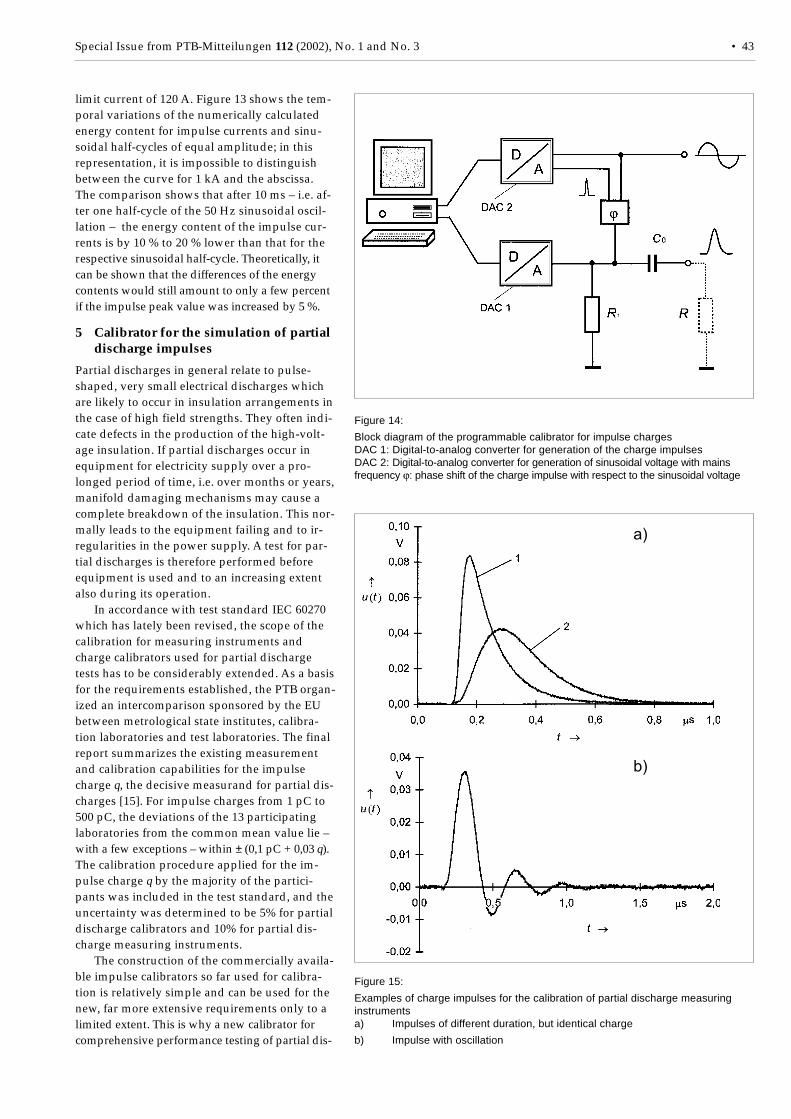
Special Issue from PTB-Mitteilungen 112 (2002), No. 1 and No. 3 • 43
limit current of 120 A. Figure 13 shows the tem-poral variations of the numerically calculatedenergy content for impulse currents and sinu-soidal half-cycles of equal amplitude; in thisrepresentation, it is impossible to distinguishbetween the curve for 1 kA and the abscissa.The comparison shows that after 10 ms – i.e. af-ter one half-cycle of the 50 Hz sinusoidal oscil-lation – the energy content of the impulse cur-rents is by 10 % to 20 % lower than that for therespective sinusoidal half-cycle. Theoretically, itcan be shown that the differences of the energycontents would still amount to only a few percentif the impulse peak value was increased by 5 %.
5 Calibrator for the simulation of partialdischarge impulses
Partial discharges in general relate to pulse-shaped, very small electrical discharges whichare likely to occur in insulation arrangements inthe case of high field strengths. They often indi-cate defects in the production of the high-volt-age insulation. If partial discharges occur inequipment for electricity supply over a pro-longed period of time, i.e. over months or years,manifold damaging mechanisms may cause acomplete breakdown of the insulation. This nor-mally leads to the equipment failing and to ir-regularities in the power supply. A test for par-tial discharges is therefore performed beforeequipment is used and to an increasing extentalso during its operation.
In accordance with test standard IEC 60270which has lately been revised, the scope of thecalibration for measuring instruments andcharge calibrators used for partial dischargetests has to be considerably extended. As a basisfor the requirements established, the PTB organ-ized an intercomparison sponsored by the EUbetween metrological state institutes, calibra-tion laboratories and test laboratories. The finalreport summarizes the existing measurementand calibration capabilities for the impulsecharge q, the decisive measurand for partial dis-charges [15]. For impulse charges from 1 pC to500 pC, the deviations of the 13 participatinglaboratories from the common mean value lie –with a few exceptions – within ± (0,1 pC + 0,03 q).The calibration procedure applied for the im-pulse charge q by the majority of the partici-pants was included in the test standard, and theuncertainty was determined to be 5% for partialdischarge calibrators and 10% for partial dis-charge measuring instruments.
The construction of the commercially availa-ble impulse calibrators so far used for calibra-tion is relatively simple and can be used for thenew, far more extensive requirements only to alimited extent. This is why a new calibrator forcomprehensive performance testing of partial dis-
Figure 15:
Examples of charge impulses for the calibration of partial discharge measuringinstrumentsa) Impulses of different duration, but identical charge
b) Impulse with oscillation
Figure 14:
Block diagram of the programmable calibrator for impulse chargesDAC 1: Digital-to-analog converter for generation of the charge impulsesDAC 2: Digital-to-analog converter for generation of sinusoidal voltage with mainsfrequency ϕ: phase shift of the charge impulse with respect to the sinusoidal voltage
a)
b)
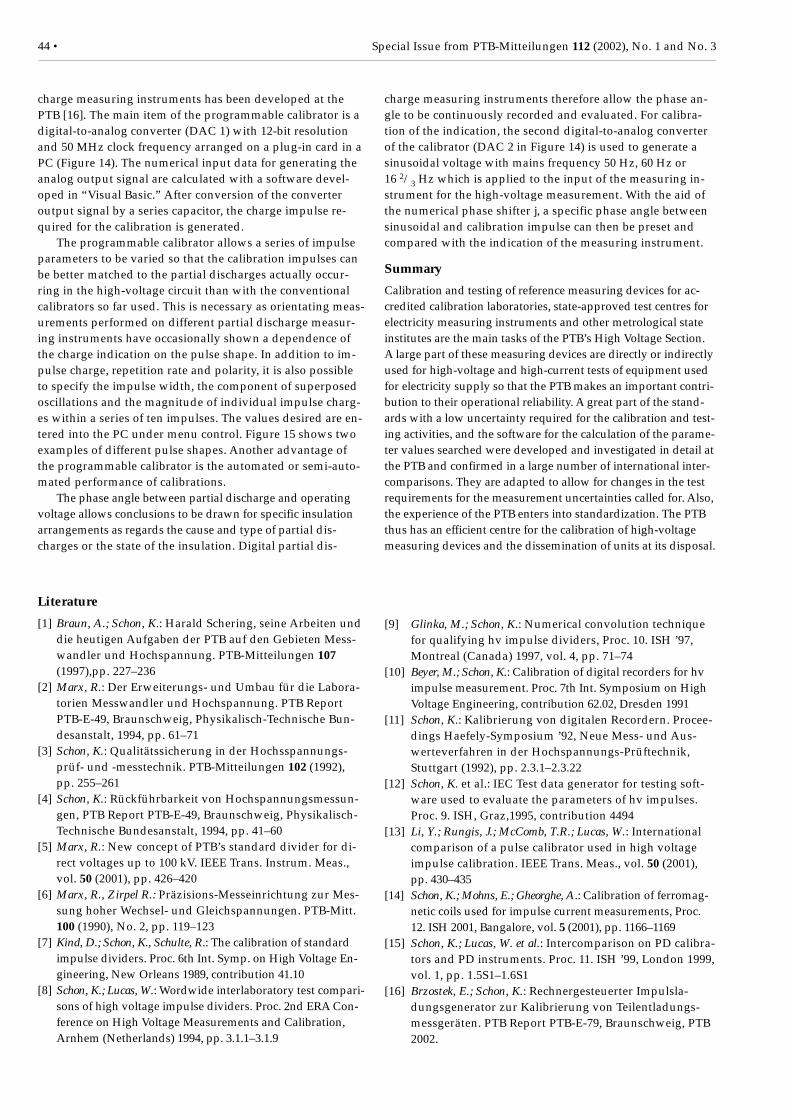
44 • Special Issue from PTB-Mitteilungen 112 (2002), No. 1 and No. 3
charge measuring instruments has been developed at thePTB [16]. The main item of the programmable calibrator is adigital-to-analog converter (DAC 1) with 12-bit resolutionand 50 MHz clock frequency arranged on a plug-in card in aPC (Figure 14). The numerical input data for generating theanalog output signal are calculated with a software devel-oped in “Visual Basic.” After conversion of the converteroutput signal by a series capacitor, the charge impulse re-quired for the calibration is generated.
The programmable calibrator allows a series of impulseparameters to be varied so that the calibration impulses canbe better matched to the partial discharges actually occur-ring in the high-voltage circuit than with the conventionalcalibrators so far used. This is necessary as orientating meas-urements performed on different partial discharge measur-ing instruments have occasionally shown a dependence ofthe charge indication on the pulse shape. In addition to im-pulse charge, repetition rate and polarity, it is also possibleto specify the impulse width, the component of superposedoscillations and the magnitude of individual impulse charg-es within a series of ten impulses. The values desired are en-tered into the PC under menu control. Figure 15 shows twoexamples of different pulse shapes. Another advantage ofthe programmable calibrator is the automated or semi-auto-mated performance of calibrations.
The phase angle between partial discharge and operatingvoltage allows conclusions to be drawn for specific insulationarrangements as regards the cause and type of partial dis-charges or the state of the insulation. Digital partial dis-
charge measuring instruments therefore allow the phase an-gle to be continuously recorded and evaluated. For calibra-tion of the indication, the second digital-to-analog converterof the calibrator (DAC 2 in Figure 14) is used to generate asinusoidal voltage with mains frequency 50 Hz, 60 Hz or16 2/3 Hz which is applied to the input of the measuring in-strument for the high-voltage measurement. With the aid ofthe numerical phase shifter j, a specific phase angle betweensinusoidal and calibration impulse can then be preset andcompared with the indication of the measuring instrument.
Summary
Calibration and testing of reference measuring devices for ac-credited calibration laboratories, state-approved test centres forelectricity measuring instruments and other metrological stateinstitutes are the main tasks of the PTB’s High Voltage Section.A large part of these measuring devices are directly or indirectlyused for high-voltage and high-current tests of equipment usedfor electricity supply so that the PTB makes an important contri-bution to their operational reliability. A great part of the stand-ards with a low uncertainty required for the calibration and test-ing activities, and the software for the calculation of the parame-ter values searched were developed and investigated in detail atthe PTB and confirmed in a large number of international inter-comparisons. They are adapted to allow for changes in the testrequirements for the measurement uncertainties called for. Also,the experience of the PTB enters into standardization. The PTBthus has an efficient centre for the calibration of high-voltagemeasuring devices and the dissemination of units at its disposal.
Literature
[1] Braun, A.; Schon, K.: Harald Schering, seine Arbeiten unddie heutigen Aufgaben der PTB auf den Gebieten Mess-wandler und Hochspannung. PTB-Mitteilungen 107(1997),pp. 227–236
[2] Marx, R.: Der Erweiterungs- und Umbau für die Labora-torien Messwandler und Hochspannung. PTB ReportPTB-E-49, Braunschweig, Physikalisch-Technische Bun-desanstalt, 1994, pp. 61–71
[3] Schon, K.: Qualitätssicherung in der Hochsspannungs-prüf- und -messtechnik. PTB-Mitteilungen 102 (1992),pp. 255–261
[4] Schon, K.: Rückführbarkeit von Hochspannungsmessun-gen, PTB Report PTB-E-49, Braunschweig, Physikalisch-Technische Bundesanstalt, 1994, pp. 41–60
[5] Marx, R.: New concept of PTB’s standard divider for di-rect voltages up to 100 kV. IEEE Trans. Instrum. Meas.,vol. 50 (2001), pp. 426–420
[6] Marx, R., Zirpel R.: Präzisions-Messeinrichtung zur Mes-sung hoher Wechsel- und Gleichspannungen. PTB-Mitt.100 (1990), No. 2, pp. 119–123
[7] Kind, D.; Schon, K., Schulte, R.: The calibration of standardimpulse dividers. Proc. 6th Int. Symp. on High Voltage En-gineering, New Orleans 1989, contribution 41.10
[8] Schon, K.; Lucas, W.: Wordwide interlaboratory test compari-sons of high voltage impulse dividers. Proc. 2nd ERA Con-ference on High Voltage Measurements and Calibration,Arnhem (Netherlands) 1994, pp. 3.1.1–3.1.9
[9] Glinka, M.; Schon, K.: Numerical convolution techniquefor qualifying hv impulse dividers, Proc. 10. ISH ’97,Montreal (Canada) 1997, vol. 4, pp. 71–74
[10] Beyer, M.; Schon, K.: Calibration of digital recorders for hvimpulse measurement. Proc. 7th Int. Symposium on HighVoltage Engineering, contribution 62.02, Dresden 1991
[11] Schon, K.: Kalibrierung von digitalen Recordern. Procee-dings Haefely-Symposium ’92, Neue Mess- und Aus-werteverfahren in der Hochspannungs-Prüftechnik,Stuttgart (1992), pp. 2.3.1–2.3.22
[12] Schon, K. et al.: IEC Test data generator for testing soft-ware used to evaluate the parameters of hv impulses.Proc. 9. ISH, Graz,1995, contribution 4494
[13] Li, Y.; Rungis, J.; McComb, T.R.; Lucas, W.: Internationalcomparison of a pulse calibrator used in high voltageimpulse calibration. IEEE Trans. Meas., vol. 50 (2001),pp. 430–435
[14] Schon, K.; Mohns, E.; Gheorghe, A.: Calibration of ferromag-netic coils used for impulse current measurements, Proc.12. ISH 2001, Bangalore, vol. 5 (2001), pp. 1166–1169
[15] Schon, K.; Lucas, W. et al.: Intercomparison on PD calibra-tors and PD instruments. Proc. 11. ISH ’99, London 1999,vol. 1, pp. 1.5S1–1.6S1
[16] Brzostek, E.; Schon, K.: Rechnergesteuerter Impulsla-dungsgenerator zur Kalibrierung von Teilentladungs-messgeräten. PTB Report PTB-E-79, Braunschweig, PTB2002.
Special Issue from PTB-Mitteilungen 112 (2002), No. 1 and No. 3 • 45
Since April 2002 the PTB has been runningan internet service to assure the reliability ofdigital documents. This service includes the pu-blication of checksums (so-called hash codes) ofdigitized versions of selected documents, thePTB draws up or assesses within the scope of itsofficial tasks. For the time being this service ison offer in the area of type approvals for electri-city meters under the entry “Trust service for
Measures to assure the reliability of digital information
Martin Kahmann*
* Dr. Ing. Martin Kah-mann, PTB „Electri-city Meters“ Sectione-mail:[email protected]
digital information (tsdi).” Two programs forthe calculation of checksums are provided onthe relevant www-pages for downloading.These programs are implementations of thechecksum algorithm RIPEMD-160 [1, 2]. Whe-ther these programs are uncorrupted can bechecked by calculation of their own RIPEMD-160-hash codes. Unaltered or uncorrupted pro-grams lead to the following hash codes:
program RIPEMD-160-Hash-Code
hashtest.exe e4fe9bef70fc0b77dcbc3a93c5ad57ca746ff616
winhash.exe 8921b3c39d8bbfee6870ec112d24251a78af4d7c
Further details concerning tsdi can be found under:www.ptb.de, button “search”, search item “tsdi”
To further increase security, the two programs are provided by different servers. Down-loading is also possible from the following pages:
http://www.sachsen.de/de/bf/verwaltung/eichbehoerde/elt/index.htmlhttp://www.agme.de
Furthermore tsdi is described in the E-Government Manual of the Federal Departmentfor Security in Information Technology (www.bsi.de).
[1] Dobbertin,H.; Bosselaers, A.: Preneel, B.: RIPEMD-160: A Strengthened Version ofRIPEMD Fast Software Encryption, LNCS 1039(ed.: Goldmann, D.), Springer-Verlag, Berlin, Heidelberg etc. 1996
[2] ISO/IEC 10118-3: Information technology – Security techniques – Hash functions –Part 3: Dedicated hash functions, 1998
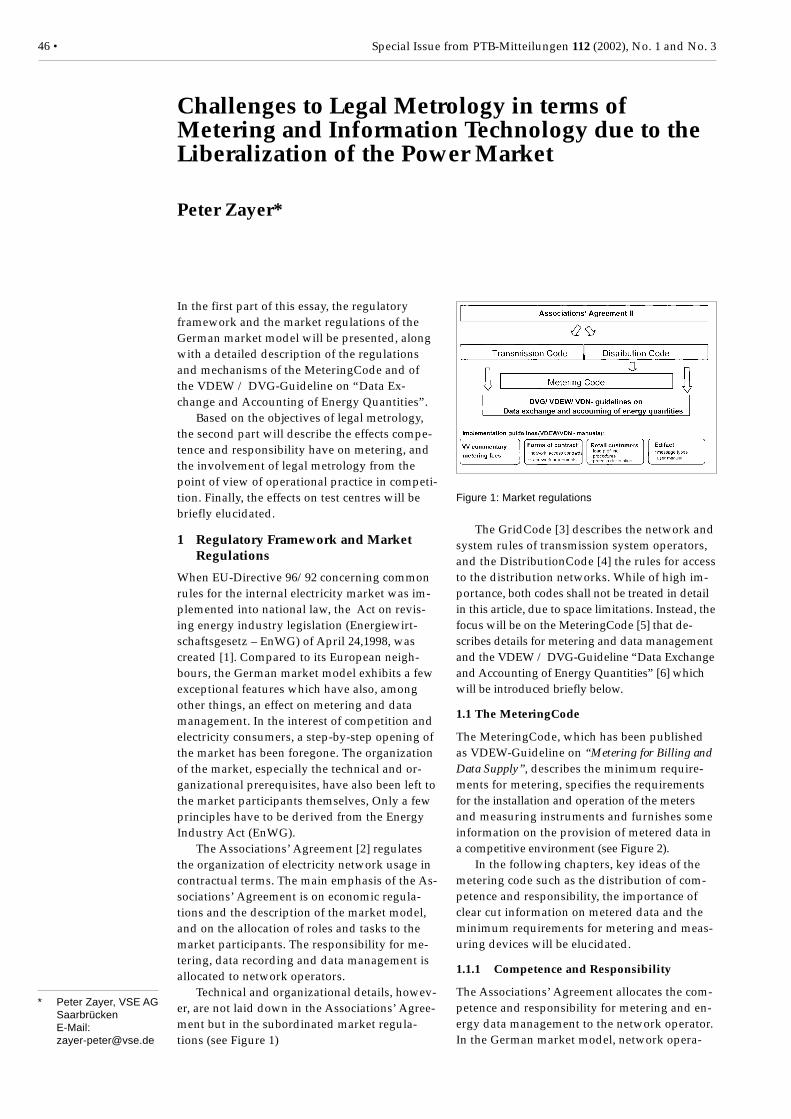
46 • Special Issue from PTB-Mitteilungen 112 (2002), No. 1 and No. 3
In the first part of this essay, the regulatoryframework and the market regulations of theGerman market model will be presented, alongwith a detailed description of the regulationsand mechanisms of the MeteringCode and ofthe VDEW / DVG-Guideline on “Data Ex-change and Accounting of Energy Quantities”.
Based on the objectives of legal metrology,the second part will describe the effects compe-tence and responsibility have on metering, andthe involvement of legal metrology from thepoint of view of operational practice in competi-tion. Finally, the effects on test centres will bebriefly elucidated.
1 Regulatory Framework and MarketRegulations
When EU-Directive 96/92 concerning commonrules for the internal electricity market was im-plemented into national law, the Act on revis-ing energy industry legislation (Energiewirt-schaftsgesetz – EnWG) of April 24,1998, wascreated [1]. Compared to its European neigh-bours, the German market model exhibits a fewexceptional features which have also, amongother things, an effect on metering and datamanagement. In the interest of competition andelectricity consumers, a step-by-step opening ofthe market has been foregone. The organizationof the market, especially the technical and or-ganizational prerequisites, have also been left tothe market participants themselves, Only a fewprinciples have to be derived from the EnergyIndustry Act (EnWG).
The Associations’ Agreement [2] regulatesthe organization of electricity network usage incontractual terms. The main emphasis of the As-sociations’ Agreement is on economic regula-tions and the description of the market model,and on the allocation of roles and tasks to themarket participants. The responsibility for me-tering, data recording and data management isallocated to network operators.
Technical and organizational details, howev-er, are not laid down in the Associations’ Agree-ment but in the subordinated market regula-tions (see Figure 1)
The GridCode [3] describes the network andsystem rules of transmission system operators,and the DistributionCode [4] the rules for accessto the distribution networks. While of high im-portance, both codes shall not be treated in detailin this article, due to space limitations. Instead, thefocus will be on the MeteringCode [5] that de-scribes details for metering and data managementand the VDEW / DVG-Guideline “Data Exchangeand Accounting of Energy Quantities” [6] whichwill be introduced briefly below.
1.1 The MeteringCode
The MeteringCode, which has been publishedas VDEW-Guideline on “Metering for Billing andData Supply”, describes the minimum require-ments for metering, specifies the requirementsfor the installation and operation of the metersand measuring instruments and furnishes someinformation on the provision of metered data ina competitive environment (see Figure 2).
In the following chapters, key ideas of themetering code such as the distribution of com-petence and responsibility, the importance ofclear cut information on metered data and theminimum requirements for metering and meas-uring devices will be elucidated.
1.1.1 Competence and Responsibility
The Associations’ Agreement allocates the com-petence and responsibility for metering and en-ergy data management to the network operator.In the German market model, network opera-
Challenges to Legal Metrology in terms ofMetering and Information Technology due to theLiberalization of the Power Market
Peter Zayer*
Figure 1: Market regulations
* Peter Zayer, VSE AGSaarbrückenE-Mail:[email protected]
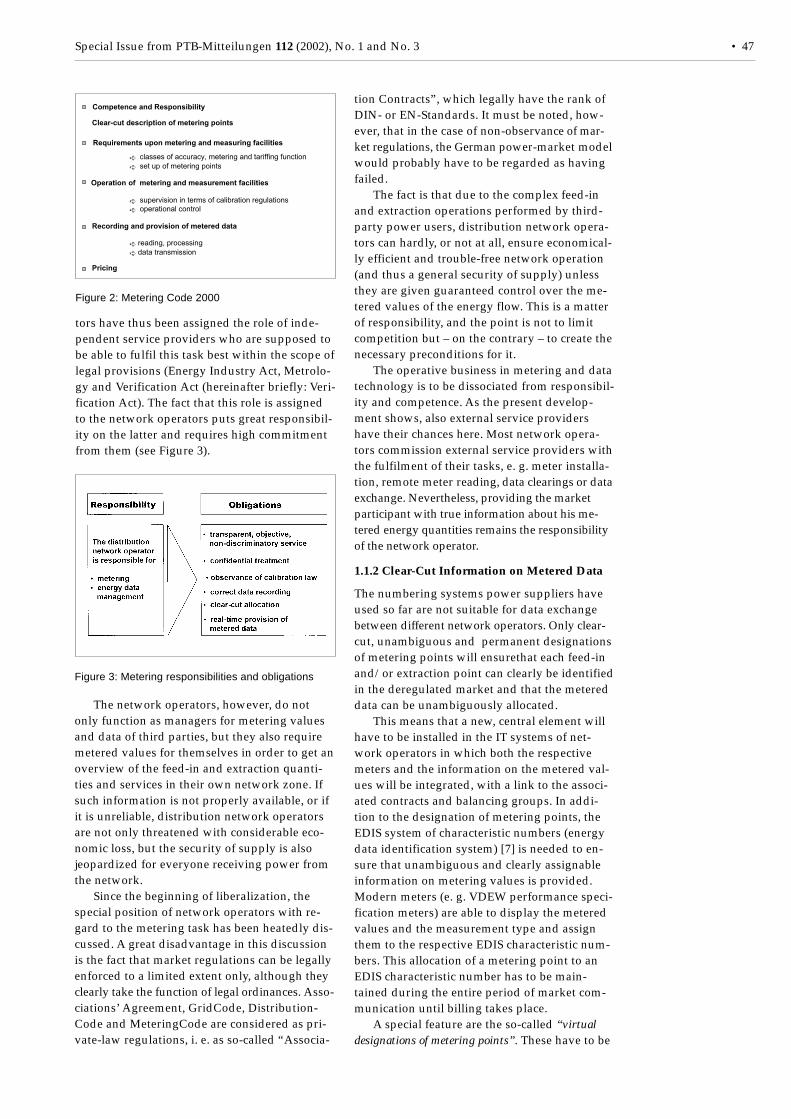
Special Issue from PTB-Mitteilungen 112 (2002), No. 1 and No. 3 • 47
tors have thus been assigned the role of inde-pendent service providers who are supposed tobe able to fulfil this task best within the scope oflegal provisions (Energy Industry Act, Metrolo-gy and Verification Act (hereinafter briefly: Veri-fication Act). The fact that this role is assignedto the network operators puts great responsibil-ity on the latter and requires high commitmentfrom them (see Figure 3).
tion Contracts”, which legally have the rank ofDIN- or EN-Standards. It must be noted, how-ever, that in the case of non-observance of mar-ket regulations, the German power-market modelwould probably have to be regarded as havingfailed.
The fact is that due to the complex feed-inand extraction operations performed by third-party power users, distribution network opera-tors can hardly, or not at all, ensure economical-ly efficient and trouble-free network operation(and thus a general security of supply) unlessthey are given guaranteed control over the me-tered values of the energy flow. This is a matterof responsibility, and the point is not to limitcompetition but – on the contrary – to create thenecessary preconditions for it.
The operative business in metering and datatechnology is to be dissociated from responsibil-ity and competence. As the present develop-ment shows, also external service providershave their chances here. Most network opera-tors commission external service providers withthe fulfilment of their tasks, e. g. meter installa-tion, remote meter reading, data clearings or dataexchange. Nevertheless, providing the marketparticipant with true information about his me-tered energy quantities remains the responsibilityof the network operator.
1.1.2 Clear-Cut Information on Metered Data
The numbering systems power suppliers haveused so far are not suitable for data exchangebetween different network operators. Only clear-cut, unambiguous and permanent designationsof metering points will ensurethat each feed-inand/or extraction point can clearly be identifiedin the deregulated market and that the metereddata can be unambiguously allocated.
This means that a new, central element willhave to be installed in the IT systems of net-work operators in which both the respectivemeters and the information on the metered val-ues will be integrated, with a link to the associ-ated contracts and balancing groups. In addi-tion to the designation of metering points, theEDIS system of characteristic numbers (energydata identification system) [7] is needed to en-sure that unambiguous and clearly assignableinformation on metering values is provided.Modern meters (e. g. VDEW performance speci-fication meters) are able to display the meteredvalues and the measurement type and assignthem to the respective EDIS characteristic num-bers. This allocation of a metering point to anEDIS characteristic number has to be main-tained during the entire period of market com-munication until billing takes place.
A special feature are the so-called “virtualdesignations of metering points”. These have to be
Figure 2: Metering Code 2000
The network operators, however, do notonly function as managers for metering valuesand data of third parties, but they also requiremetered values for themselves in order to get anoverview of the feed-in and extraction quanti-ties and services in their own network zone. Ifsuch information is not properly available, or ifit is unreliable, distribution network operatorsare not only threatened with considerable eco-nomic loss, but the security of supply is alsojeopardized for everyone receiving power fromthe network.
Since the beginning of liberalization, thespecial position of network operators with re-gard to the metering task has been heatedly dis-cussed. A great disadvantage in this discussionis the fact that market regulations can be legallyenforced to a limited extent only, although theyclearly take the function of legal ordinances. Asso-ciations’ Agreement, GridCode, Distribution-Code and MeteringCode are considered as pri-vate-law regulations, i. e. as so-called “Associa-
Figure 3: Metering responsibilities and obligations
Competence and Responsibility
Clear-cut description of metering points
Requirements upon metering and measuring facilities
classes of accuracy, metering and tariffing function
set up of metering points
Operation of metering and measurement facilities
supervision in terms of calibration regulations
operational control
Recording and provision of metered data
reading, processing
data transmission
Pricing
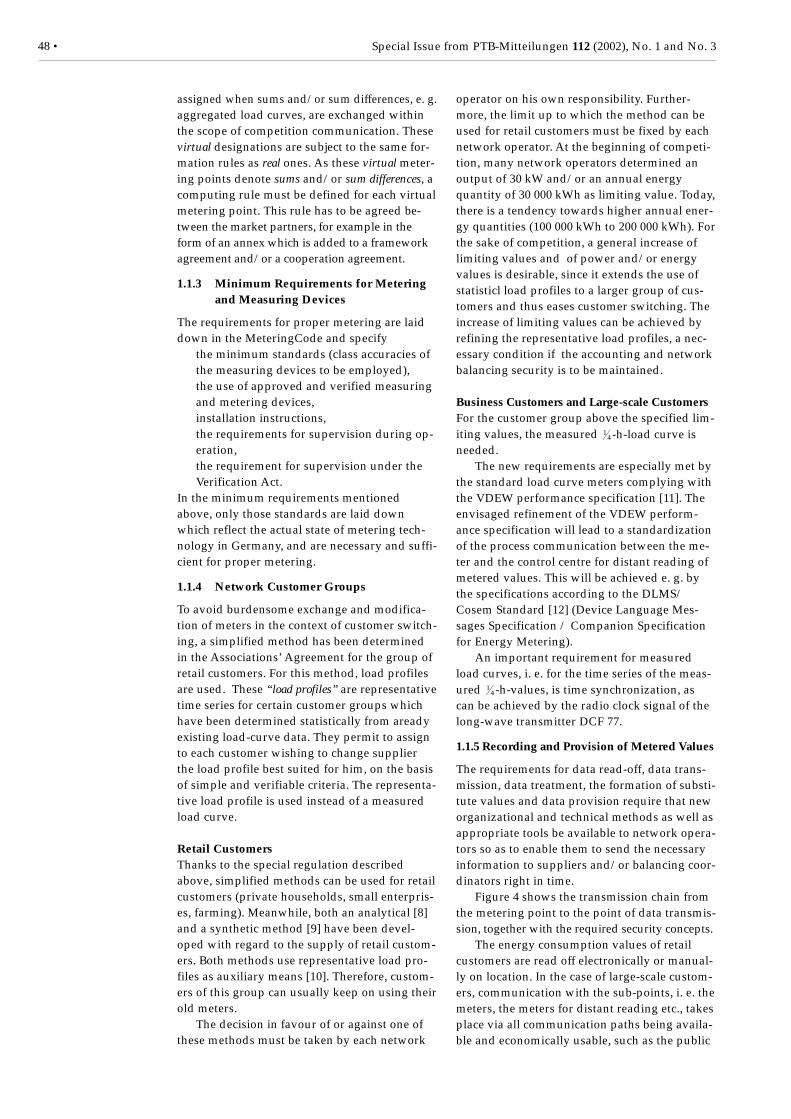
48 • Special Issue from PTB-Mitteilungen 112 (2002), No. 1 and No. 3
assigned when sums and/or sum differences, e. g.aggregated load curves, are exchanged withinthe scope of competition communication. Thesevirtual designations are subject to the same for-mation rules as real ones. As these virtual meter-ing points denote sums and/or sum differences, acomputing rule must be defined for each virtualmetering point. This rule has to be agreed be-tween the market partners, for example in theform of an annex which is added to a frameworkagreement and/or a cooperation agreement.
1.1.3 Minimum Requirements for Meteringand Measuring Devices
The requirements for proper metering are laiddown in the MeteringCode and specify
• the minimum standards (class accuracies ofthe measuring devices to be employed),
• the use of approved and verified measuringand metering devices,
• installation instructions,
• the requirements for supervision during op-eration,
• the requirement for supervision under theVerification Act.
In the minimum requirements mentionedabove, only those standards are laid downwhich reflect the actual state of metering tech-nology in Germany, and are necessary and suffi-cient for proper metering.
1.1.4 Network Customer Groups
To avoid burdensome exchange and modifica-tion of meters in the context of customer switch-ing, a simplified method has been determinedin the Associations’ Agreement for the group ofretail customers. For this method, load profilesare used. These “load profiles” are representativetime series for certain customer groups whichhave been determined statistically from areadyexisting load-curve data. They permit to assignto each customer wishing to change supplierthe load profile best suited for him, on the basisof simple and verifiable criteria. The representa-tive load profile is used instead of a measuredload curve.
Retail CustomersThanks to the special regulation describedabove, simplified methods can be used for retailcustomers (private households, small enterpris-es, farming). Meanwhile, both an analytical [8]and a synthetic method [9] have been devel-oped with regard to the supply of retail custom-ers. Both methods use representative load pro-files as auxiliary means [10]. Therefore, custom-ers of this group can usually keep on using theirold meters.
The decision in favour of or against one ofthese methods must be taken by each network
operator on his own responsibility. Further-more, the limit up to which the method can beused for retail customers must be fixed by eachnetwork operator. At the beginning of competi-tion, many network operators determined anoutput of 30 kW and/or an annual energyquantity of 30 000 kWh as limiting value. Today,there is a tendency towards higher annual ener-gy quantities (100 000 kWh to 200 000 kWh). Forthe sake of competition, a general increase oflimiting values and of power and/or energyvalues is desirable, since it extends the use ofstatisticl load profiles to a larger group of cus-tomers and thus eases customer switching. Theincrease of limiting values can be achieved byrefining the representative load profiles, a nec-essary condition if the accounting and networkbalancing security is to be maintained.
Business Customers and Large-scale CustomersFor the customer group above the specified lim-iting values, the measured
14 -h-load curve is
needed.The new requirements are especially met by
the standard load curve meters complying withthe VDEW performance specification [11]. Theenvisaged refinement of the VDEW perform-ance specification will lead to a standardizationof the process communication between the me-ter and the control centre for distant reading ofmetered values. This will be achieved e. g. bythe specifications according to the DLMS/Cosem Standard [12] (Device Language Mes-sages Specification / Companion Specificationfor Energy Metering).
An important requirement for measuredload curves, i. e. for the time series of the meas-ured
14 -h-values, is time synchronization, as
can be achieved by the radio clock signal of thelong-wave transmitter DCF 77.
1.1.5 Recording and Provision of Metered Values
The requirements for data read-off, data trans-mission, data treatment, the formation of substi-tute values and data provision require that neworganizational and technical methods as well asappropriate tools be available to network opera-tors so as to enable them to send the necessaryinformation to suppliers and/or balancing coor-dinators right in time.
Figure 4 shows the transmission chain fromthe metering point to the point of data transmis-sion, together with the required security concepts.
The energy consumption values of retailcustomers are read off electronically or manual-ly on location. In the case of large-scale custom-ers, communication with the sub-points, i. e. themeters, the meters for distant reading etc., takesplace via all communication paths being availa-ble and economically usable, such as the public
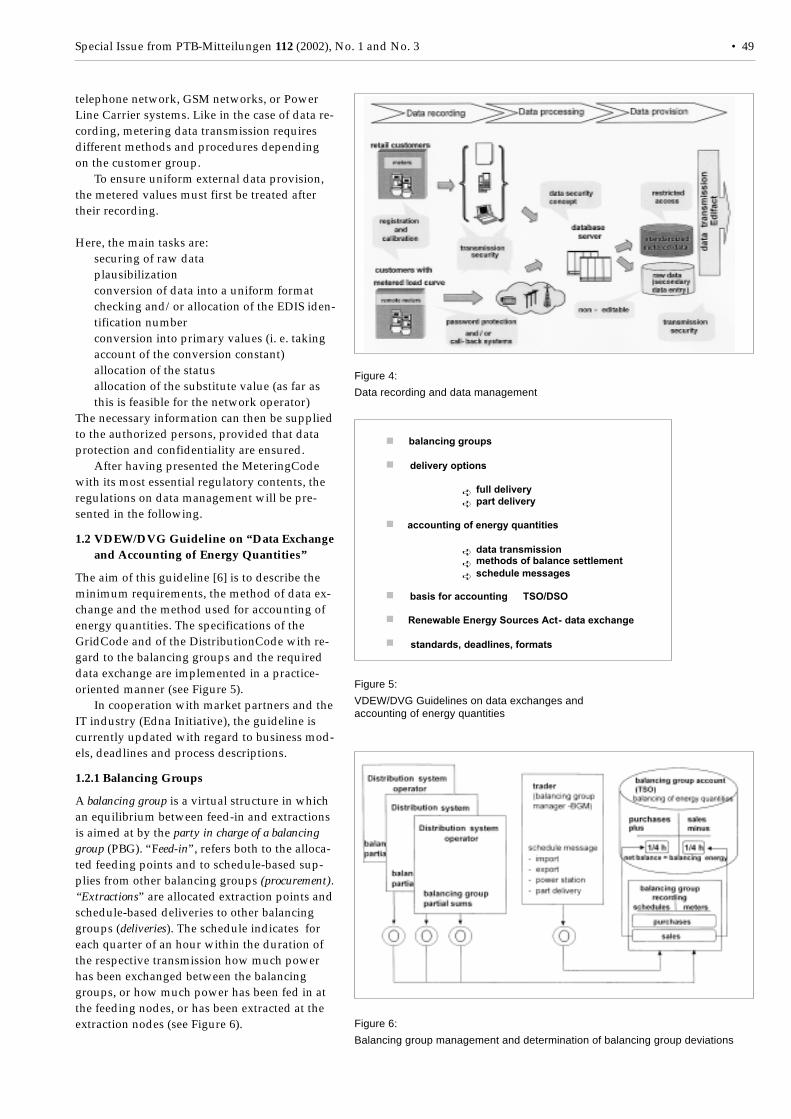
Special Issue from PTB-Mitteilungen 112 (2002), No. 1 and No. 3 • 49
telephone network, GSM networks, or PowerLine Carrier systems. Like in the case of data re-cording, metering data transmission requiresdifferent methods and procedures dependingon the customer group.
To ensure uniform external data provision,the metered values must first be treated aftertheir recording.
Here, the main tasks are:• securing of raw data• plausibilization• conversion of data into a uniform format• checking and/or allocation of the EDIS iden-
tification number• conversion into primary values (i. e. taking
account of the conversion constant)• allocation of the status• allocation of the substitute value (as far as
this is feasible for the network operator)The necessary information can then be suppliedto the authorized persons, provided that dataprotection and confidentiality are ensured.
After having presented the MeteringCodewith its most essential regulatory contents, theregulations on data management will be pre-sented in the following.
1.2 VDEW/DVG Guideline on “Data Exchangeand Accounting of Energy Quantities”
The aim of this guideline [6] is to describe theminimum requirements, the method of data ex-change and the method used for accounting ofenergy quantities. The specifications of theGridCode and of the DistributionCode with re-gard to the balancing groups and the requireddata exchange are implemented in a practice-oriented manner (see Figure 5).
In cooperation with market partners and theIT industry (Edna Initiative), the guideline iscurrently updated with regard to business mod-els, deadlines and process descriptions.
1.2.1 Balancing Groups
A balancing group is a virtual structure in whichan equilibrium between feed-in and extractionsis aimed at by the party in charge of a balancinggroup (PBG). “Feed-in”, refers both to the alloca-ted feeding points and to schedule-based sup-plies from other balancing groups (procurement).“Extractions” are allocated extraction points andschedule-based deliveries to other balancinggroups (deliveries). The schedule indicates foreach quarter of an hour within the duration ofthe respective transmission how much powerhas been exchanged between the balancinggroups, or how much power has been fed in atthe feeding nodes, or has been extracted at theextraction nodes (see Figure 6).
Figure 4:
Data recording and data management
Figure 6:
Balancing group management and determination of balancing group deviations
Figure 5:
VDEW/DVG Guidelines on data exchanges andaccounting of energy quantities
balancing groups
delivery options
full delivery
part delivery
accounting of energy quantities
data transmission
methods of balance settlement
schedule messages
basis for accounting TSO/DSO
Renewable Energy Sources Act - data exchange
standards, deadlines, formats
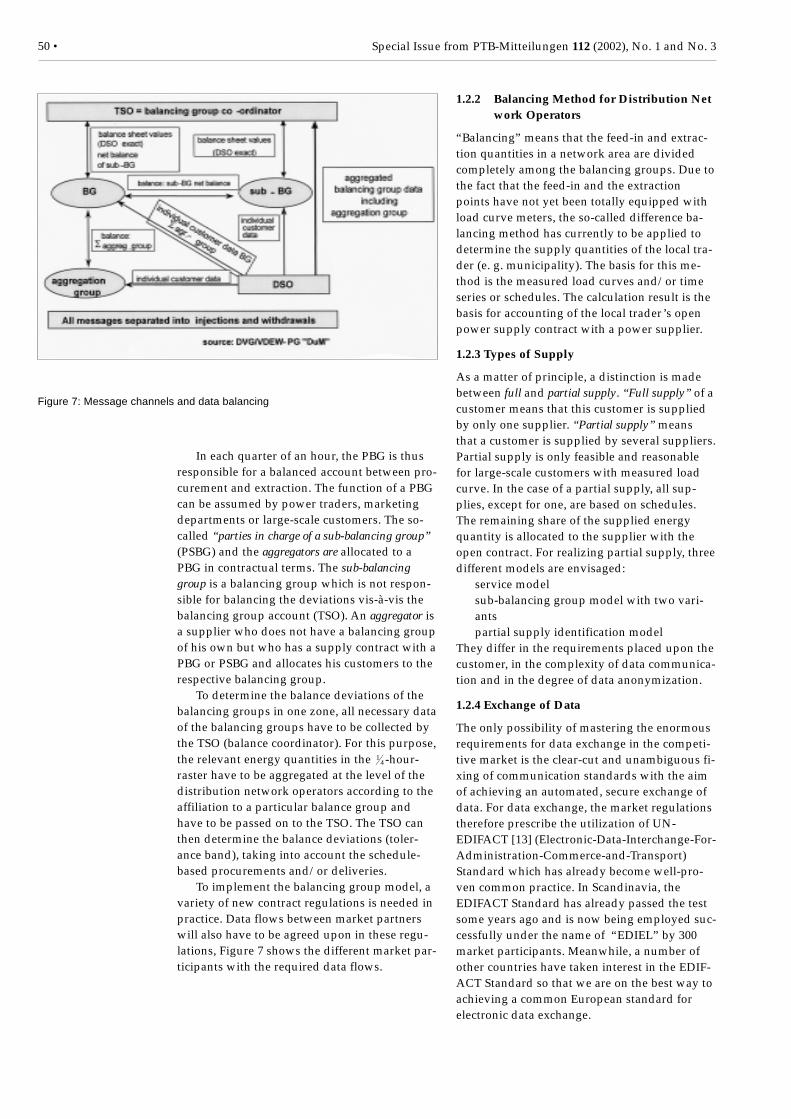
50 • Special Issue from PTB-Mitteilungen 112 (2002), No. 1 and No. 3
In each quarter of an hour, the PBG is thusresponsible for a balanced account between pro-curement and extraction. The function of a PBGcan be assumed by power traders, marketingdepartments or large-scale customers. The so-called “parties in charge of a sub-balancing group”(PSBG) and the aggregators are allocated to aPBG in contractual terms. The sub-balancinggroup is a balancing group which is not respon-sible for balancing the deviations vis-à-vis thebalancing group account (TSO). An aggregator isa supplier who does not have a balancing groupof his own but who has a supply contract with aPBG or PSBG and allocates his customers to therespective balancing group.
To determine the balance deviations of thebalancing groups in one zone, all necessary dataof the balancing groups have to be collected bythe TSO (balance coordinator). For this purpose,the relevant energy quantities in the
14 -hour-
raster have to be aggregated at the level of thedistribution network operators according to theaffiliation to a particular balance group andhave to be passed on to the TSO. The TSO canthen determine the balance deviations (toler-ance band), taking into account the schedule-based procurements and/or deliveries.
To implement the balancing group model, avariety of new contract regulations is needed inpractice. Data flows between market partnerswill also have to be agreed upon in these regu-lations, Figure 7 shows the different market par-ticipants with the required data flows.
1.2.2 Balancing Method for Distribution Network Operators
“Balancing” means that the feed-in and extrac-tion quantities in a network area are dividedcompletely among the balancing groups. Due tothe fact that the feed-in and the extractionpoints have not yet been totally equipped withload curve meters, the so-called difference ba-lancing method has currently to be applied todetermine the supply quantities of the local tra-der (e. g. municipality). The basis for this me-thod is the measured load curves and/or timeseries or schedules. The calculation result is thebasis for accounting of the local trader’s openpower supply contract with a power supplier.
1.2.3 Types of Supply
As a matter of principle, a distinction is madebetween full and partial supply. “Full supply” of acustomer means that this customer is suppliedby only one supplier. “Partial supply” meansthat a customer is supplied by several suppliers.Partial supply is only feasible and reasonablefor large-scale customers with measured loadcurve. In the case of a partial supply, all sup-plies, except for one, are based on schedules.The remaining share of the supplied energyquantity is allocated to the supplier with theopen contract. For realizing partial supply, threedifferent models are envisaged:• service model• sub-balancing group model with two vari-
ants• partial supply identification modelThey differ in the requirements placed upon thecustomer, in the complexity of data communica-tion and in the degree of data anonymization.
1.2.4 Exchange of Data
The only possibility of mastering the enormousrequirements for data exchange in the competi-tive market is the clear-cut and unambiguous fi-xing of communication standards with the aimof achieving an automated, secure exchange ofdata. For data exchange, the market regulationstherefore prescribe the utilization of UN-EDIFACT [13] (Electronic-Data-Interchange-For-Administration-Commerce-and-Transport)Standard which has already become well-pro-ven common practice. In Scandinavia, theEDIFACT Standard has already passed the testsome years ago and is now being employed suc-cessfully under the name of “EDIEL” by 300market participants. Meanwhile, a number ofother countries have taken interest in the EDIF-ACT Standard so that we are on the best way toachieving a common European standard forelectronic data exchange.
Figure 7: Message channels and data balancing
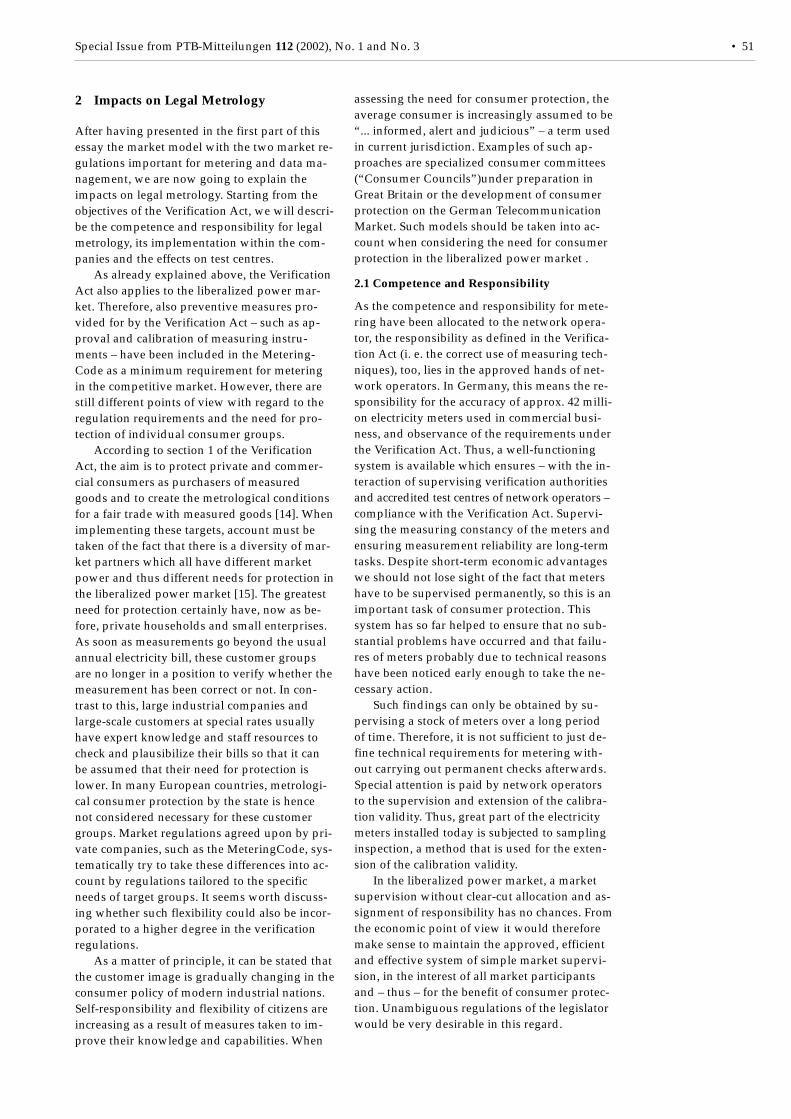
Special Issue from PTB-Mitteilungen 112 (2002), No. 1 and No. 3 • 51
2 Impacts on Legal Metrology
After having presented in the first part of thisessay the market model with the two market re-gulations important for metering and data ma-nagement, we are now going to explain theimpacts on legal metrology. Starting from theobjectives of the Verification Act, we will descri-be the competence and responsibility for legalmetrology, its implementation within the com-panies and the effects on test centres.
As already explained above, the VerificationAct also applies to the liberalized power mar-ket. Therefore, also preventive measures pro-vided for by the Verification Act – such as ap-proval and calibration of measuring instru-ments – have been included in the Metering-Code as a minimum requirement for meteringin the competitive market. However, there arestill different points of view with regard to theregulation requirements and the need for pro-tection of individual consumer groups.
According to section 1 of the VerificationAct, the aim is to protect private and commer-cial consumers as purchasers of measuredgoods and to create the metrological conditionsfor a fair trade with measured goods [14]. Whenimplementing these targets, account must betaken of the fact that there is a diversity of mar-ket partners which all have different marketpower and thus different needs for protection inthe liberalized power market [15]. The greatestneed for protection certainly have, now as be-fore, private households and small enterprises.As soon as measurements go beyond the usualannual electricity bill, these customer groupsare no longer in a position to verify whether themeasurement has been correct or not. In con-trast to this, large industrial companies andlarge-scale customers at special rates usuallyhave expert knowledge and staff resources tocheck and plausibilize their bills so that it canbe assumed that their need for protection islower. In many European countries, metrologi-cal consumer protection by the state is hencenot considered necessary for these customergroups. Market regulations agreed upon by pri-vate companies, such as the MeteringCode, sys-tematically try to take these differences into ac-count by regulations tailored to the specificneeds of target groups. It seems worth discuss-ing whether such flexibility could also be incor-porated to a higher degree in the verificationregulations.
As a matter of principle, it can be stated thatthe customer image is gradually changing in theconsumer policy of modern industrial nations.Self-responsibility and flexibility of citizens areincreasing as a result of measures taken to im-prove their knowledge and capabilities. When
assessing the need for consumer protection, theaverage consumer is increasingly assumed to be“... informed, alert and judicious” – a term usedin current jurisdiction. Examples of such ap-proaches are specialized consumer committees(“Consumer Councils”)under preparation inGreat Britain or the development of consumerprotection on the German TelecommunicationMarket. Such models should be taken into ac-count when considering the need for consumerprotection in the liberalized power market .
2.1 Competence and Responsibility
As the competence and responsibility for mete-ring have been allocated to the network opera-tor, the responsibility as defined in the Verifica-tion Act (i. e. the correct use of measuring tech-niques), too, lies in the approved hands of net-work operators. In Germany, this means the re-sponsibility for the accuracy of approx. 42 milli-on electricity meters used in commercial busi-ness, and observance of the requirements underthe Verification Act. Thus, a well-functioningsystem is available which ensures – with the in-teraction of supervising verification authoritiesand accredited test centres of network operators –compliance with the Verification Act. Supervi-sing the measuring constancy of the meters andensuring measurement reliability are long-termtasks. Despite short-term economic advantageswe should not lose sight of the fact that metershave to be supervised permanently, so this is animportant task of consumer protection. Thissystem has so far helped to ensure that no sub-stantial problems have occurred and that failu-res of meters probably due to technical reasonshave been noticed early enough to take the ne-cessary action.
Such findings can only be obtained by su-pervising a stock of meters over a long periodof time. Therefore, it is not sufficient to just de-fine technical requirements for metering with-out carrying out permanent checks afterwards.Special attention is paid by network operatorsto the supervision and extension of the calibra-tion validity. Thus, great part of the electricitymeters installed today is subjected to samplinginspection, a method that is used for the exten-sion of the calibration validity.
In the liberalized power market, a marketsupervision without clear-cut allocation and as-signment of responsibility has no chances. Fromthe economic point of view it would thereforemake sense to maintain the approved, efficientand effective system of simple market supervi-sion, in the interest of all market participantsand – thus – for the benefit of consumer protec-tion. Unambiguous regulations of the legislatorwould be very desirable in this regard.
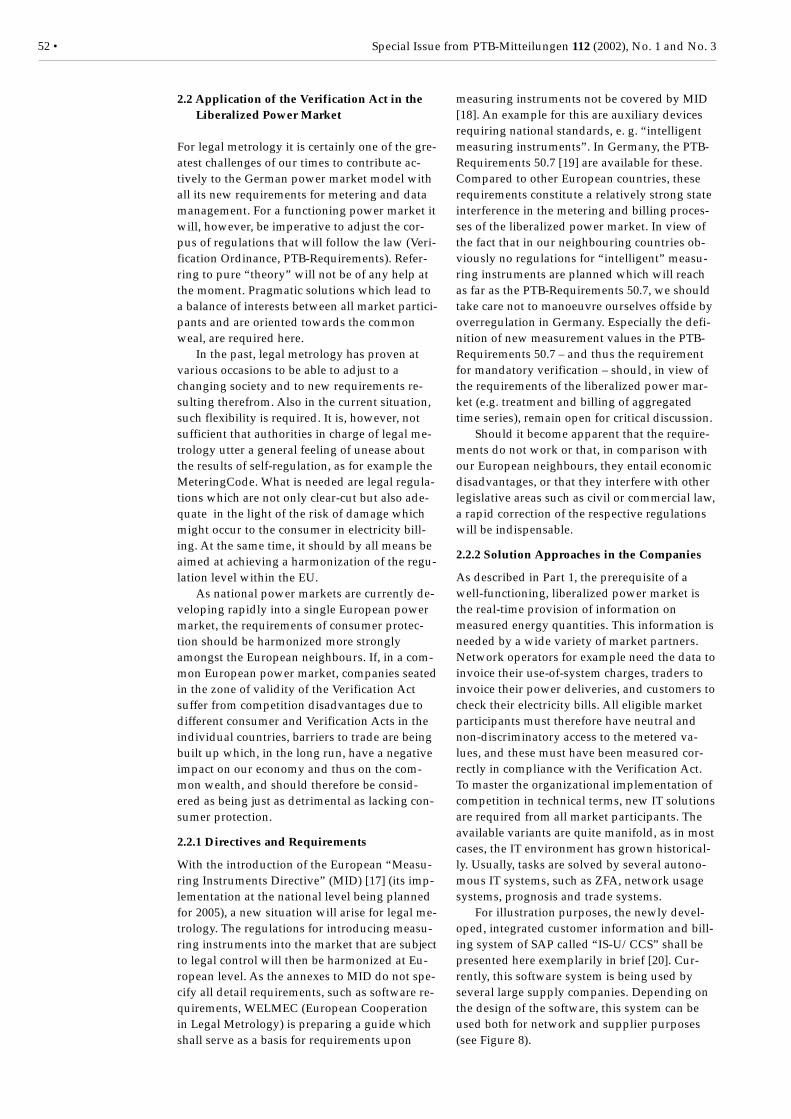
52 • Special Issue from PTB-Mitteilungen 112 (2002), No. 1 and No. 3
2.2 Application of the Verification Act in theLiberalized Power Market
For legal metrology it is certainly one of the gre-atest challenges of our times to contribute ac-tively to the German power market model withall its new requirements for metering and datamanagement. For a functioning power market itwill, however, be imperative to adjust the cor-pus of regulations that will follow the law (Veri-fication Ordinance, PTB-Requirements). Refer-ring to pure “theory” will not be of any help atthe moment. Pragmatic solutions which lead toa balance of interests between all market partici-pants and are oriented towards the commonweal, are required here.
In the past, legal metrology has proven atvarious occasions to be able to adjust to achanging society and to new requirements re-sulting therefrom. Also in the current situation,such flexibility is required. It is, however, notsufficient that authorities in charge of legal me-trology utter a general feeling of unease aboutthe results of self-regulation, as for example theMeteringCode. What is needed are legal regula-tions which are not only clear-cut but also ade-quate in the light of the risk of damage whichmight occur to the consumer in electricity bill-ing. At the same time, it should by all means beaimed at achieving a harmonization of the regu-lation level within the EU.
As national power markets are currently de-veloping rapidly into a single European powermarket, the requirements of consumer protec-tion should be harmonized more stronglyamongst the European neighbours. If, in a com-mon European power market, companies seatedin the zone of validity of the Verification Actsuffer from competition disadvantages due todifferent consumer and Verification Acts in theindividual countries, barriers to trade are beingbuilt up which, in the long run, have a negativeimpact on our economy and thus on the com-mon wealth, and should therefore be consid-ered as being just as detrimental as lacking con-sumer protection.
2.2.1 Directives and Requirements
With the introduction of the European “Measu-ring Instruments Directive” (MID) [17] (its imp-lementation at the national level being plannedfor 2005), a new situation will arise for legal me-trology. The regulations for introducing measu-ring instruments into the market that are subjectto legal control will then be harmonized at Eu-ropean level. As the annexes to MID do not spe-cify all detail requirements, such as software re-quirements, WELMEC (European Cooperationin Legal Metrology) is preparing a guide whichshall serve as a basis for requirements upon
measuring instruments not be covered by MID[18]. An example for this are auxiliary devicesrequiring national standards, e. g. “intelligentmeasuring instruments”. In Germany, the PTB-Requirements 50.7 [19] are available for these.Compared to other European countries, theserequirements constitute a relatively strong stateinterference in the metering and billing proces-ses of the liberalized power market. In view ofthe fact that in our neighbouring countries ob-viously no regulations for “intelligent” measu-ring instruments are planned which will reachas far as the PTB-Requirements 50.7, we shouldtake care not to manoeuvre ourselves offside byoverregulation in Germany. Especially the defi-nition of new measurement values in the PTB-Requirements 50.7 – and thus the requirementfor mandatory verification – should, in view ofthe requirements of the liberalized power mar-ket (e.g. treatment and billing of aggregatedtime series), remain open for critical discussion.
Should it become apparent that the require-ments do not work or that, in comparison withour European neighbours, they entail economicdisadvantages, or that they interfere with otherlegislative areas such as civil or commercial law,a rapid correction of the respective regulationswill be indispensable.
2.2.2 Solution Approaches in the Companies
As described in Part 1, the prerequisite of awell-functioning, liberalized power market isthe real-time provision of information onmeasured energy quantities. This information isneeded by a wide variety of market partners.Network operators for example need the data toinvoice their use-of-system charges, traders toinvoice their power deliveries, and customers tocheck their electricity bills. All eligible marketparticipants must therefore have neutral andnon-discriminatory access to the metered va-lues, and these must have been measured cor-rectly in compliance with the Verification Act.To master the organizational implementation ofcompetition in technical terms, new IT solutionsare required from all market participants. Theavailable variants are quite manifold, as in mostcases, the IT environment has grown historical-ly. Usually, tasks are solved by several autono-mous IT systems, such as ZFA, network usagesystems, prognosis and trade systems.
For illustration purposes, the newly devel-oped, integrated customer information and bill-ing system of SAP called “IS-U/CCS” shall bepresented here exemplarily in brief [20]. Cur-rently, this software system is being used byseveral large supply companies. Depending onthe design of the software, this system can beused both for network and supplier purposes(see Figure 8).
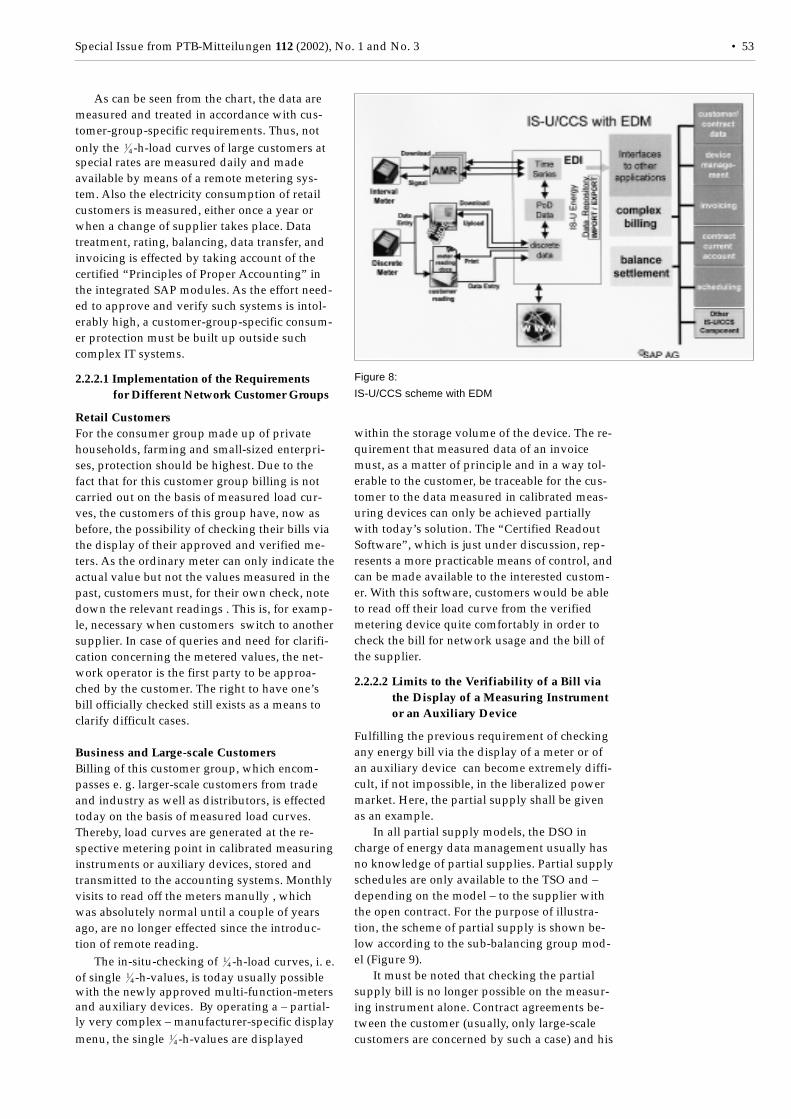
Special Issue from PTB-Mitteilungen 112 (2002), No. 1 and No. 3 • 53
As can be seen from the chart, the data aremeasured and treated in accordance with cus-tomer-group-specific requirements. Thus, notonly the
14 -h-load curves of large customers at
special rates are measured daily and madeavailable by means of a remote metering sys-tem. Also the electricity consumption of retailcustomers is measured, either once a year orwhen a change of supplier takes place. Datatreatment, rating, balancing, data transfer, andinvoicing is effected by taking account of thecertified “Principles of Proper Accounting” inthe integrated SAP modules. As the effort need-ed to approve and verify such systems is intol-erably high, a customer-group-specific consum-er protection must be built up outside suchcomplex IT systems.
2.2.2.1 Implementation of the Requirementsfor Different Network Customer Groups
Retail CustomersFor the consumer group made up of privatehouseholds, farming and small-sized enterpri-ses, protection should be highest. Due to thefact that for this customer group billing is notcarried out on the basis of measured load cur-ves, the customers of this group have, now asbefore, the possibility of checking their bills viathe display of their approved and verified me-ters. As the ordinary meter can only indicate theactual value but not the values measured in thepast, customers must, for their own check, notedown the relevant readings . This is, for examp-le, necessary when customers switch to anothersupplier. In case of queries and need for clarifi-cation concerning the metered values, the net-work operator is the first party to be approa-ched by the customer. The right to have one’sbill officially checked still exists as a means toclarify difficult cases.
Business and Large-scale CustomersBilling of this customer group, which encom-passes e. g. larger-scale customers from tradeand industry as well as distributors, is effectedtoday on the basis of measured load curves.Thereby, load curves are generated at the re-spective metering point in calibrated measuringinstruments or auxiliary devices, stored andtransmitted to the accounting systems. Monthlyvisits to read off the meters manully , whichwas absolutely normal until a couple of yearsago, are no longer effected since the introduc-tion of remote reading.
The in-situ-checking of 1
4 -h-load curves, i. e.of single
14 -h-values, is today usually possible
with the newly approved multi-function-metersand auxiliary devices. By operating a – partial-ly very complex – manufacturer-specific displaymenu, the single
14 -h-values are displayed
within the storage volume of the device. The re-quirement that measured data of an invoicemust, as a matter of principle and in a way tol-erable to the customer, be traceable for the cus-tomer to the data measured in calibrated meas-uring devices can only be achieved partiallywith today’s solution. The “Certified ReadoutSoftware”, which is just under discussion, rep-resents a more practicable means of control, andcan be made available to the interested custom-er. With this software, customers would be ableto read off their load curve from the verifiedmetering device quite comfortably in order tocheck the bill for network usage and the bill ofthe supplier.
2.2.2.2 Limits to the Verifiability of a Bill viathe Display of a Measuring Instrumentor an Auxiliary Device
Fulfilling the previous requirement of checkingany energy bill via the display of a meter or ofan auxiliary device can become extremely diffi-cult, if not impossible, in the liberalized powermarket. Here, the partial supply shall be givenas an example.
In all partial supply models, the DSO incharge of energy data management usually hasno knowledge of partial supplies. Partial supplyschedules are only available to the TSO and –depending on the model – to the supplier withthe open contract. For the purpose of illustra-tion, the scheme of partial supply is shown be-low according to the sub-balancing group mod-el (Figure 9).
It must be noted that checking the partialsupply bill is no longer possible on the measur-ing instrument alone. Contract agreements be-tween the customer (usually, only large-scalecustomers are concerned by such a case) and his
Figure 8:
IS-U/CCS scheme with EDM
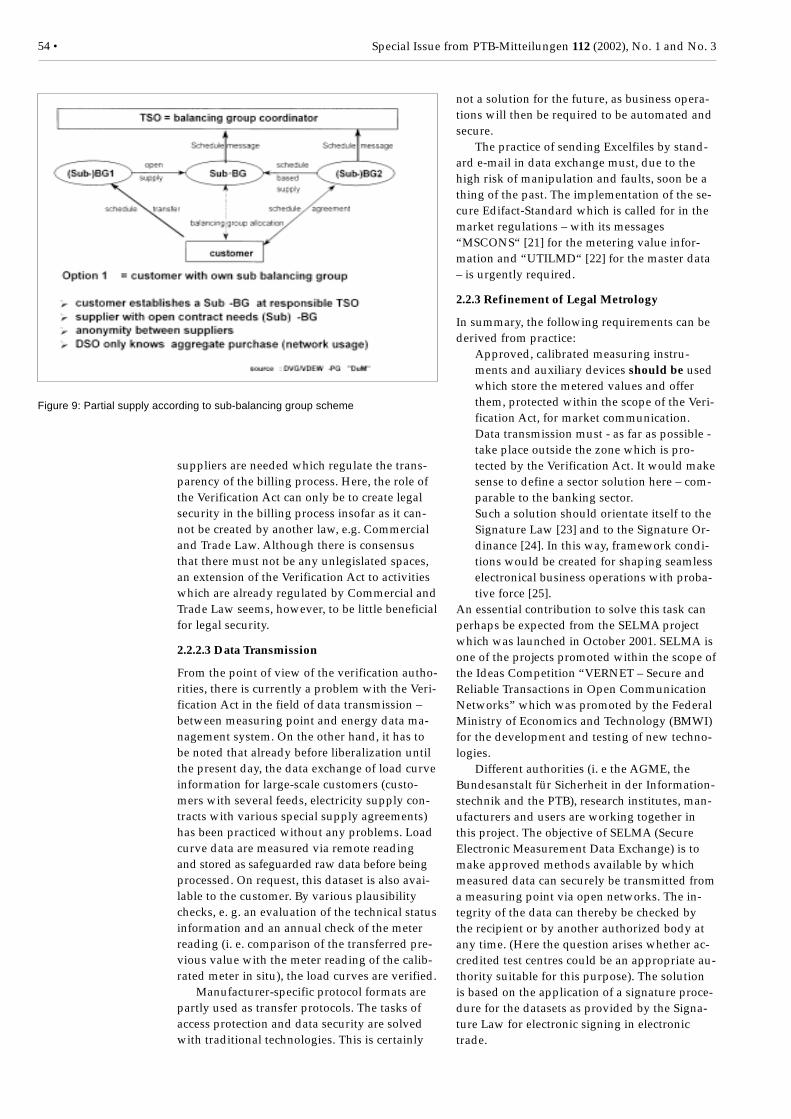
54 • Special Issue from PTB-Mitteilungen 112 (2002), No. 1 and No. 3
suppliers are needed which regulate the trans-parency of the billing process. Here, the role ofthe Verification Act can only be to create legalsecurity in the billing process insofar as it can-not be created by another law, e.g. Commercialand Trade Law. Although there is consensusthat there must not be any unlegislated spaces,an extension of the Verification Act to activitieswhich are already regulated by Commercial andTrade Law seems, however, to be little beneficialfor legal security.
2.2.2.3 Data Transmission
From the point of view of the verification autho-rities, there is currently a problem with the Veri-fication Act in the field of data transmission –between measuring point and energy data ma-nagement system. On the other hand, it has tobe noted that already before liberalization untilthe present day, the data exchange of load curveinformation for large-scale customers (custo-mers with several feeds, electricity supply con-tracts with various special supply agreements)has been practiced without any problems. Loadcurve data are measured via remote readingand stored as safeguarded raw data before beingprocessed. On request, this dataset is also avai-lable to the customer. By various plausibilitychecks, e. g. an evaluation of the technical statusinformation and an annual check of the meterreading (i. e. comparison of the transferred pre-vious value with the meter reading of the calib-rated meter in situ), the load curves are verified.
Manufacturer-specific protocol formats arepartly used as transfer protocols. The tasks ofaccess protection and data security are solvedwith traditional technologies. This is certainly
not a solution for the future, as business opera-tions will then be required to be automated andsecure.
The practice of sending Excelfiles by stand-ard e-mail in data exchange must, due to thehigh risk of manipulation and faults, soon be athing of the past. The implementation of the se-cure Edifact-Standard which is called for in themarket regulations – with its messages“MSCONS“ [21] for the metering value infor-mation and “UTILMD“ [22] for the master data– is urgently required.
2.2.3 Refinement of Legal Metrology
In summary, the following requirements can bederived from practice:• Approved, calibrated measuring instru-
ments and auxiliary devices should be usedwhich store the metered values and offerthem, protected within the scope of the Veri-fication Act, for market communication.
• Data transmission must - as far as possible -take place outside the zone which is pro-tected by the Verification Act. It would makesense to define a sector solution here – com-parable to the banking sector.
• Such a solution should orientate itself to theSignature Law [23] and to the Signature Or-dinance [24]. In this way, framework condi-tions would be created for shaping seamlesselectronical business operations with proba-tive force [25].
An essential contribution to solve this task canperhaps be expected from the SELMA projectwhich was launched in October 2001. SELMA isone of the projects promoted within the scope ofthe Ideas Competition “VERNET – Secure andReliable Transactions in Open CommunicationNetworks” which was promoted by the FederalMinistry of Economics and Technology (BMWI)for the development and testing of new techno-logies.
Different authorities (i. e the AGME, theBundesanstalt für Sicherheit in der Information-stechnik and the PTB), research institutes, man-ufacturers and users are working together inthis project. The objective of SELMA (SecureElectronic Measurement Data Exchange) is tomake approved methods available by whichmeasured data can securely be transmitted froma measuring point via open networks. The in-tegrity of the data can thereby be checked bythe recipient or by another authorized body atany time. (Here the question arises whether ac-credited test centres could be an appropriate au-thority suitable for this purpose). The solutionis based on the application of a signature proce-dure for the datasets as provided by the Signa-ture Law for electronic signing in electronictrade.
Figure 9: Partial supply according to sub-balancing group scheme
Special Issue from PTB-Mitteilungen 112 (2002), No. 1 and No. 3 • 55
The secure access to data via open networks(Internet) is a vision for the future which might,however, be simple to realize one day with theexperience of the SELMA project.
2.3 Test Centres in the Competitive Market
As a result of competition, many accredited testcentres have come under pressure, and theirright of existence is put into question by theirholders. Due to this, the interaction between thestate and private test centres, which so far hasworked well, is threatened to break up. The re-asons for this are manifold. First of all, econo-mic reasons must be mentioned. The holdercompanies are under massive pressure to createpositive economic returns and “shareholder va-lue” and thus are compelled to make full use in-ternally of all cost reduction and profit potenti-als. There are no longer Taboo-Areas! Valuessuch as trustworthiness and metrological com-petence, built up by the test centres in long ye-ars of work, lose importance relative to econo-mic considerations.
Another reason for test centres to be jeop-ardized is the Manufacturer’s Initial Verificationwhich will – once the European Measuring In-struments Directive (MID) will have been is-sued in the foreseeable future – reduce thenumber of initial verifications carried out at testcentres, especially as far as meters are con-cerned which are connected directly in largenumbers. It will then become increasingly diffi-cult for the test centres to recover their cost bymeans of the verification fees. As already men-tioned above, clear signals on behalf of the leg-islator have unfortunately been missing so faras to whether the system of independent, sover-eign test centres – which, by nature, undisputa-bly serve the common wealth – will be main-tained or will be sacrificed to an ever increasedcompetition in the field of metrological services.For the approx. 215 accredited test centres stillexisting, this strained situation means in anycase that, in agreement with the holding enter-prises, they will have to re-orientate themselvesin a difficult environment.
Re-orientation means orientation towardscosts and new tasks. This may imply activitieslike• cost saving, staff adaptations• cooperation between test centres• establishment of economically stable regio-
nal and communal test centres• application of higher-quality and more effi-
cient testing techniques,• extension of the quality assurance system
between the different operators, comprisinge. g. acceptance tests, network supervision,systems for the supervision of the verificati-on validity, contact point for all market par-
ticipants in questions concerning the correct-ness of the invoiced values or time series,
• opening up of new fields of work in agree-ment with the legislator, e.g. by extendingcompetences for activities and tasks withinthe scope of market surveillance.
In the course of such a re-orientation, the accre-dited test centres must present themselves asstable, competent and modern providers of me-trological services. A fast implementation of theabove-mentioned tasks and cost-saving measu-res is therefore mandatory and must be carriedout without delay.
3 Summary and Conclusion
A liberalized power market - and this applies inthe same way to the emerging liberalized gasmarket – is unthinkable without legal metrolo-gy. End customers – especially retail customers -must be sure that the applied measuring instru-ments function correctly, and they must be ableto compare their energy bills with the base dataprovided by the verified measuring instru-ments. The more customers move in a competi-tive environment, the more they must endea-vour to find their own checking mechanisms.This should be taken into consideration whenadapting the verification legislation.
A practice-oriented European solution has tofound which meets not only the requirements ofconsumer protection – taking due account of thetechnical progress in measuring and safety tech-niques – but also those of the free market.
Author’s Remarks in August 2004 Since the initial publication ofthis article in 2002, the regulatory framework has been in a contin-uous process of change. Although the new energy legislation(EnWG) with its manifold sub-regulations is still being discussedin German legislative bodies (i. e. the German Parliament), theframework is adapting continuously in anticipation of this newlaw. One of the coming key innovations could be the installation ofa regulatory body (Regulierungsbehörde) as early as in the begin-ning of 2005. Envisioned is a small and efficient body, that willdrive and further develop the market liberalization. In conse-quence of the organic development of market conditions, details ofthe market regulations have been overhauled repeatedly and wererepublished by the newly created VDN, the network operators as-sociation (www.vdn-berlin.de). Readers should note that only de-tails have been changed, while the general market model as de-scribed in this article remained unchanged. Further, the inaction ofthe European Measuring Instruments Directive (MID) in spring2004, which was still in planning in 2002 (see chapter 2.2.1), re-quires an adaptation of the German verification act by 2006. Simul-taneously, other regulations in the German verification act that arenot touched by the MID act will be updated. While it is too early tospeculate about specific details of the new act, it is well possible(and desirable), that some ideas presented in this article (e. g. newtasks for test centers) will find their way into the new verificationact. First drafts however should not be expected before 2006.