Embed Size (px)
Citation preview
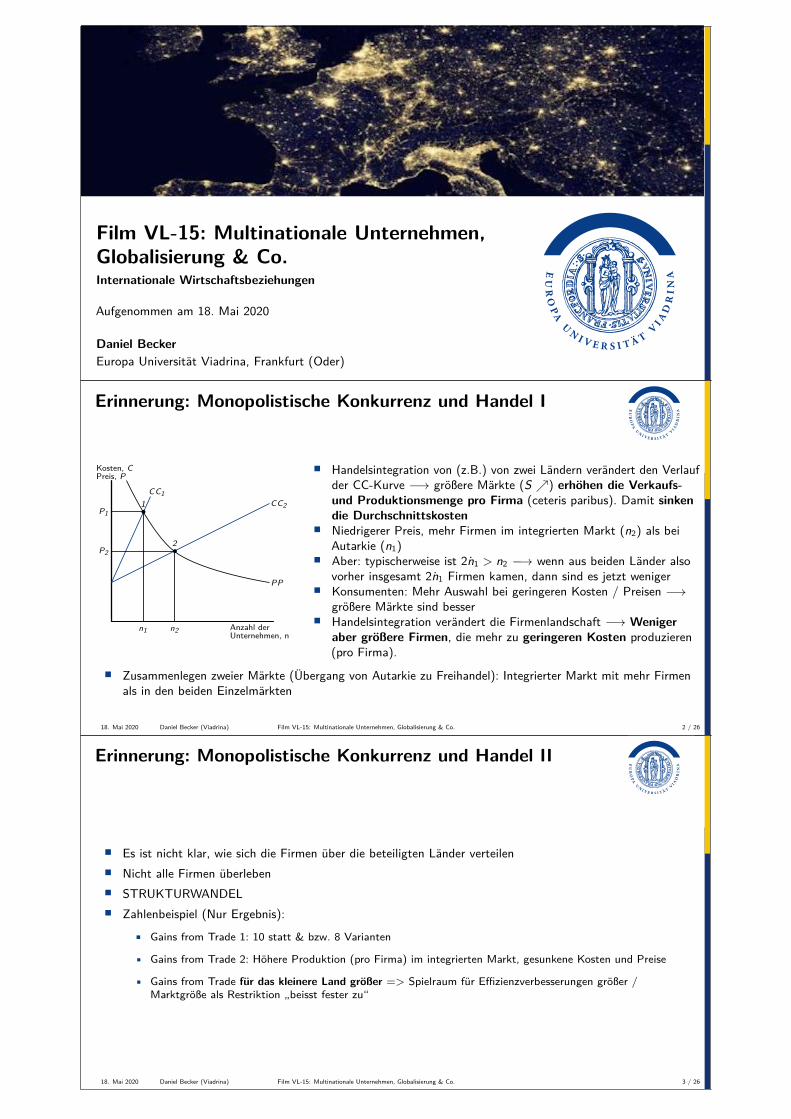
Film VL-15: Multinationale Unternehmen,Globalisierung & Co.Internationale Wirtschaftsbeziehungen
Aufgenommen am 18. Mai 2020
Daniel BeckerEuropa Universität Viadrina, Frankfurt (Oder)
Erinnerung: Monopolistische Konkurrenz und Handel I
Kosten, CPreis, P
Anzahl derUnternehmen, n
PP
CC1
b1 CC2
n1
P1
n2
P2 b2
• Handelsintegration von (z.B.) von zwei Ländern verändert den Verlaufder CC-Kurve −→ größere Märkte (S ↗) erhöhen die Verkaufs-und Produktionsmenge pro Firma (ceteris paribus). Damit sinkendie Durchschnittskosten
• Niedrigerer Preis, mehr Firmen im integrierten Markt (n2) als beiAutarkie (n1)• Aber: typischerweise ist 2n1 > n2 −→ wenn aus beiden Länder alsovorher insgesamt 2n1 Firmen kamen, dann sind es jetzt weniger
• Konsumenten: Mehr Auswahl bei geringeren Kosten / Preisen −→größere Märkte sind besser
• Handelsintegration verändert die Firmenlandschaft −→ Wenigeraber größere Firmen, die mehr zu geringeren Kosten produzieren(pro Firma).
• Zusammenlegen zweier Märkte (Übergang von Autarkie zu Freihandel): Integrierter Markt mit mehr Firmenals in den beiden Einzelmärkten
18. Mai 2020 Daniel Becker (Viadrina) Film VL-15: Multinationale Unternehmen, Globalisierung & Co. 2 / 26
Erinnerung: Monopolistische Konkurrenz und Handel II
• Es ist nicht klar, wie sich die Firmen über die beteiligten Länder verteilen• Nicht alle Firmen überleben• STRUKTURWANDEL• Zahlenbeispiel (Nur Ergebnis):
• Gains from Trade 1: 10 statt & bzw. 8 Varianten
• Gains from Trade 2: Höhere Produktion (pro Firma) im integrierten Markt, gesunkene Kosten und Preise
• Gains from Trade für das kleinere Land größer => Spielraum für Effizienzverbesserungen größer /Marktgröße als Restriktion „beisst fester zu“
18. Mai 2020 Daniel Becker (Viadrina) Film VL-15: Multinationale Unternehmen, Globalisierung & Co. 3 / 26
Themen heute:
1. Strukturwandel
2. heterogene Firmen
3. Moderne Begründung positiver Wohlfahrtswirkungen von Handel
4. Multinationale Unternehmen
18. Mai 2020 Daniel Becker (Viadrina) Film VL-15: Multinationale Unternehmen, Globalisierung & Co. 4 / 26
Strukturwandel: Gewinner + Verlierer I
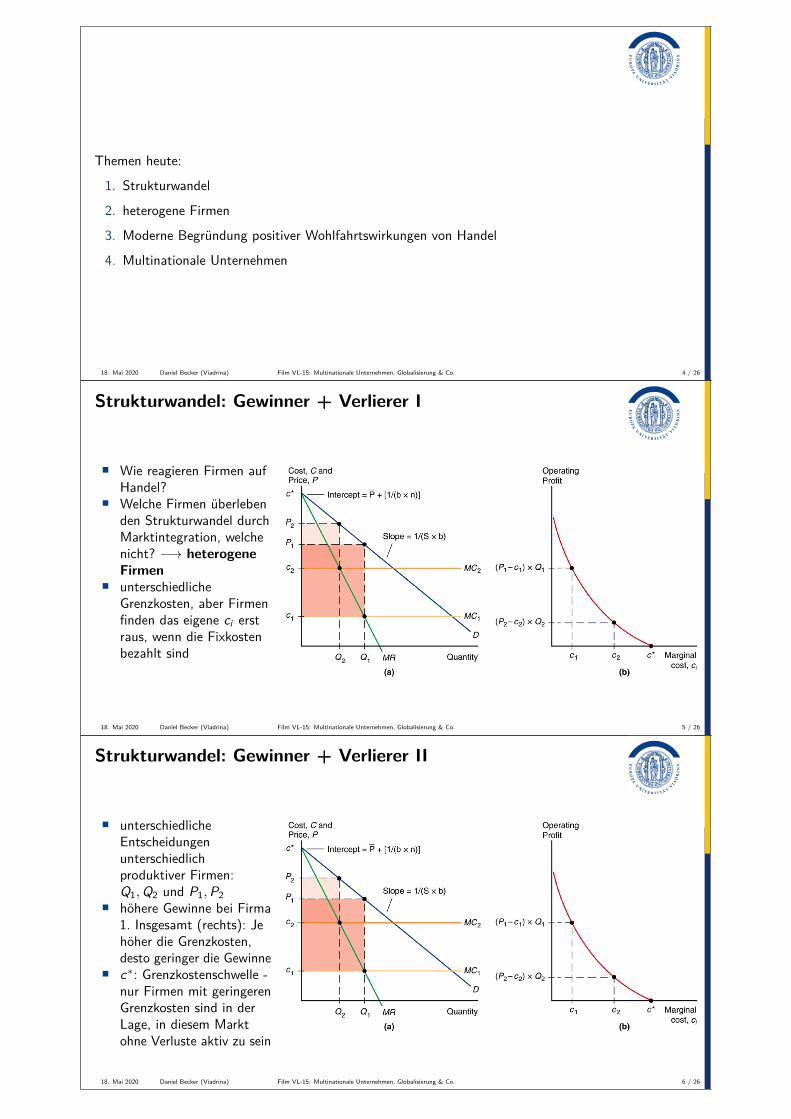
• Wie reagieren Firmen aufHandel?
• Welche Firmen überlebenden Strukturwandel durchMarktintegration, welchenicht? −→ heterogeneFirmen
• unterschiedlicheGrenzkosten, aber Firmenfinden das eigene ci erstraus, wenn die Fixkostenbezahlt sind
18. Mai 2020 Daniel Becker (Viadrina) Film VL-15: Multinationale Unternehmen, Globalisierung & Co. 5 / 26
Strukturwandel: Gewinner + Verlierer II
• unterschiedlicheEntscheidungenunterschiedlichproduktiver Firmen:Q1, Q2 und P1, P2• höhere Gewinne bei Firma1. Insgesamt (rechts): Jehöher die Grenzkosten,desto geringer die Gewinne
• c∗: Grenzkostenschwelle -nur Firmen mit geringerenGrenzkosten sind in derLage, in diesem Marktohne Verluste aktiv zu sein
18. Mai 2020 Daniel Becker (Viadrina) Film VL-15: Multinationale Unternehmen, Globalisierung & Co. 6 / 26
Strukturwandel: Gewinner + Verlierer III
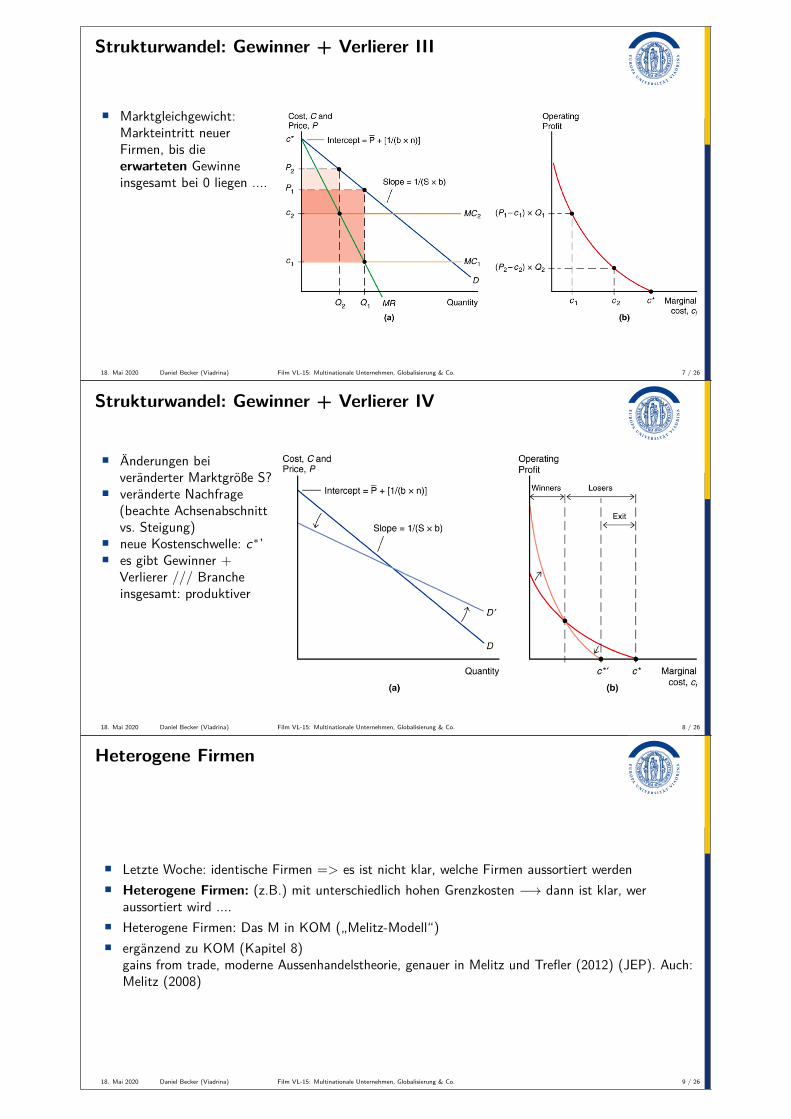
• Marktgleichgewicht:Markteintritt neuerFirmen, bis dieerwarteten Gewinneinsgesamt bei 0 liegen ....
18. Mai 2020 Daniel Becker (Viadrina) Film VL-15: Multinationale Unternehmen, Globalisierung & Co. 7 / 26
Strukturwandel: Gewinner + Verlierer IV
• Änderungen beiveränderter Marktgröße S?
• veränderte Nachfrage(beachte Achsenabschnittvs. Steigung)
• neue Kostenschwelle: c∗’• es gibt Gewinner +
Verlierer /// Brancheinsgesamt: produktiver
18. Mai 2020 Daniel Becker (Viadrina) Film VL-15: Multinationale Unternehmen, Globalisierung & Co. 8 / 26
Heterogene Firmen
• Letzte Woche: identische Firmen => es ist nicht klar, welche Firmen aussortiert werden• Heterogene Firmen: (z.B.) mit unterschiedlich hohen Grenzkosten −→ dann ist klar, wer
aussortiert wird ....• Heterogene Firmen: Das M in KOM („Melitz-Modell“)• ergänzend zu KOM (Kapitel 8)
gains from trade, moderne Aussenhandelstheorie, genauer in Melitz und Trefler (2012) (JEP). Auch:Melitz (2008)
18. Mai 2020 Daniel Becker (Viadrina) Film VL-15: Multinationale Unternehmen, Globalisierung & Co. 9 / 26
Gains from Trade, moderne Variante I
• Genereller Punkt: Moderne Aussenhandelstheorie liefert drei zusätzliche Erklärungen dafür, dassFreihandel Freihandelsgewinne mit sich bringt
• intra-industrieller Handel, auch zwischen identischen Ländern, in Kombination mit steigendenSkalenerträgen (economies of scale)
1. love-of-variety gains: Konsumenten schätzen es, wenn Ihre ganz speziellen Vorlieben bedientwerden. Freihandel ermöglicht eine Firmenlandschaft, die mehr Varianten produziert
• Beispiele: USA-Kanada (seit 1964); EEC (aka heute EU, seit 1957)2. Heterogene Firmen & bessere Allokation von Ressourcen im Produktionsprozess
• weg von kleinen, unproduktiven Firmen hin zu großen, produktiven (Industrie als Ganzes wirdproduktiver)
• Wieso? Profit (und Produktionsmenge) produktiverer Firmen wird größer, für unproduktivere Firmenumgekehrt bis hin zur Pleite. Insgesamt: Durchschnittsproduktivität steigt
• Handelsliberalisierung meistens nicht Autarkie −→ Freihandel, sondern Handelskosten ↘.
18. Mai 2020 Daniel Becker (Viadrina) Film VL-15: Multinationale Unternehmen, Globalisierung & Co. 10 / 26
Gains from Trade, moderne Variante II
• produktivere Firmen exportieren, unproduktive Firmen gehen durch Konkurrenz aus dem Ausland pleite
• Handelskosten: Nur die Firmen, die diese Kosten tragen können, treten als Exporteure auf - das sindwirklich nicht alle:
18. Mai 2020 Daniel Becker (Viadrina) Film VL-15: Multinationale Unternehmen, Globalisierung & Co. 11 / 26
Gains from Trade, moderne Variante III
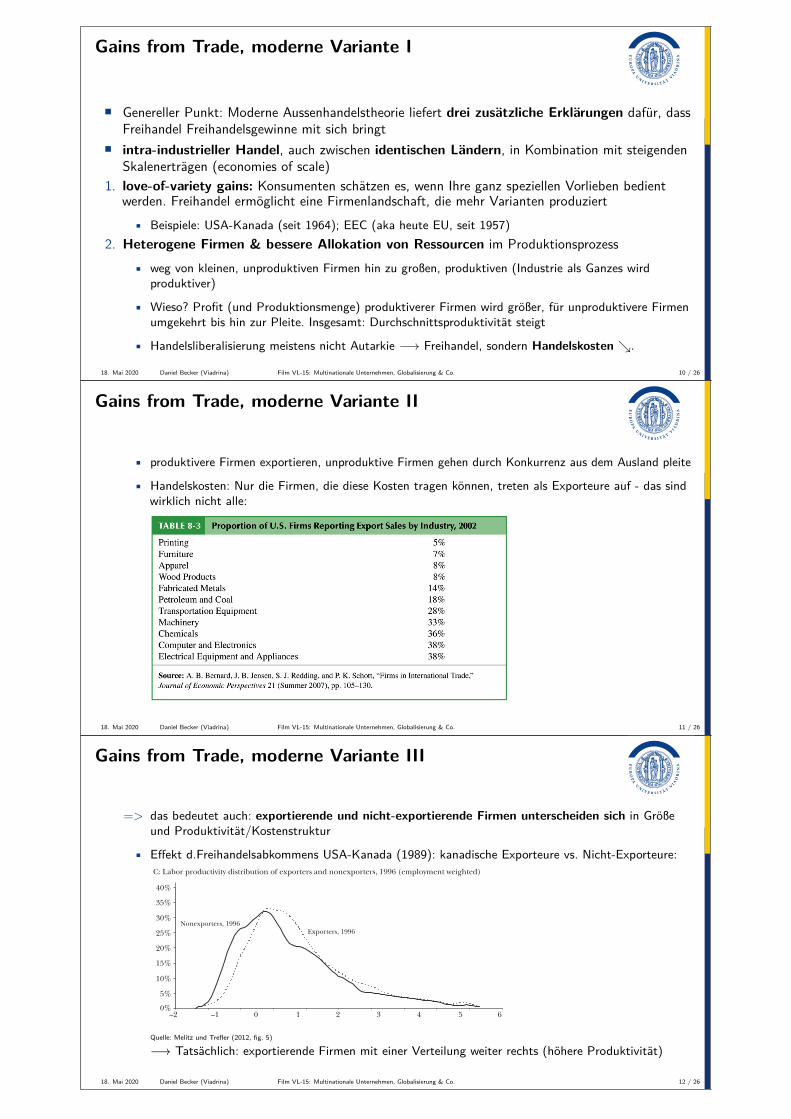
=> das bedeutet auch: exportierende und nicht-exportierende Firmen unterscheiden sich in Größeund Produktivität/Kostenstruktur
• Effekt d.Freihandelsabkommens USA-Kanada (1989): kanadische Exporteure vs. Nicht-Exporteure:
Gains from Trade when Firms Matter 107
Figure 5 Distribution of Productivity across Canadian Manufacturing Plants before and after the Canada–U.S. Free Trade Agreement
Source: Authors’ calculations using data from the Canadian Annual Survey of Manufactures.Notes: The horizontal axes are based on a measure of the log of labor productivity. However, to ensure that dispersion is driven by within-industry rather than between-industry differences in labor productivity, we scale each plant’s log productivity by subtracting from it the median log productivity of the plant’s four-digit SIC industry. Thus, the median plant in each industry has a score of zero on the horizontal axis. The vertical axis shows the share of plants with the indicated level of productivity. These frequencies are weighted by plant employment; otherwise, tiny plants that account for only a tiny fraction of total employment would dominate the ! gure.
40%
30%
20%
10%
0%
Pre-FTA: Entrants during 1980–88
FTA: Entrants during 1988–96
–2 –1 0 1 2 3 4 5 6
B: Labor productivity distribution of entering Canadian manufacturing plants 1980–1988 and 1988–1996 (employment weighted)
A: Labor productivity distribution of all Canadian manufacturing plants 1988 and 1996 (employment weighted)
40%
30%
20%
10%
0%
1988
1996
–2 –1 0 1 2 3 4 5 6
–2 –1 0 1 2 3 4 5 6
Exporters, 1996
C: Labor productivity distribution of exporters and nonexporters, 1996 (employment weighted)
Nonexporters, 1996
40%
30%
20%
10%
0%
35%
25%
15%
5%
Quelle: Melitz und Trefler (2012, fig. 5)
−→ Tatsächlich: exportierende Firmen mit einer Verteilung weiter rechts (höhere Produktivität)
18. Mai 2020 Daniel Becker (Viadrina) Film VL-15: Multinationale Unternehmen, Globalisierung & Co. 12 / 26
Gains from Trade, moderne Variante IV
Gains from Trade when Firms Matter 107
Figure 5 Distribution of Productivity across Canadian Manufacturing Plants before and after the Canada–U.S. Free Trade Agreement
Source: Authors’ calculations using data from the Canadian Annual Survey of Manufactures.Notes: The horizontal axes are based on a measure of the log of labor productivity. However, to ensure that dispersion is driven by within-industry rather than between-industry differences in labor productivity, we scale each plant’s log productivity by subtracting from it the median log productivity of the plant’s four-digit SIC industry. Thus, the median plant in each industry has a score of zero on the horizontal axis. The vertical axis shows the share of plants with the indicated level of productivity. These frequencies are weighted by plant employment; otherwise, tiny plants that account for only a tiny fraction of total employment would dominate the ! gure.
40%
30%
20%
10%
0%
Pre-FTA: Entrants during 1980–88
FTA: Entrants during 1988–96
–2 –1 0 1 2 3 4 5 6
B: Labor productivity distribution of entering Canadian manufacturing plants 1980–1988 and 1988–1996 (employment weighted)
A: Labor productivity distribution of all Canadian manufacturing plants 1988 and 1996 (employment weighted)
40%
30%
20%
10%
0%
1988
1996
–2 –1 0 1 2 3 4 5 6
–2 –1 0 1 2 3 4 5 6
Exporters, 1996
C: Labor productivity distribution of exporters and nonexporters, 1996 (employment weighted)
Nonexporters, 1996
40%
30%
20%
10%
0%
35%
25%
15%
5%
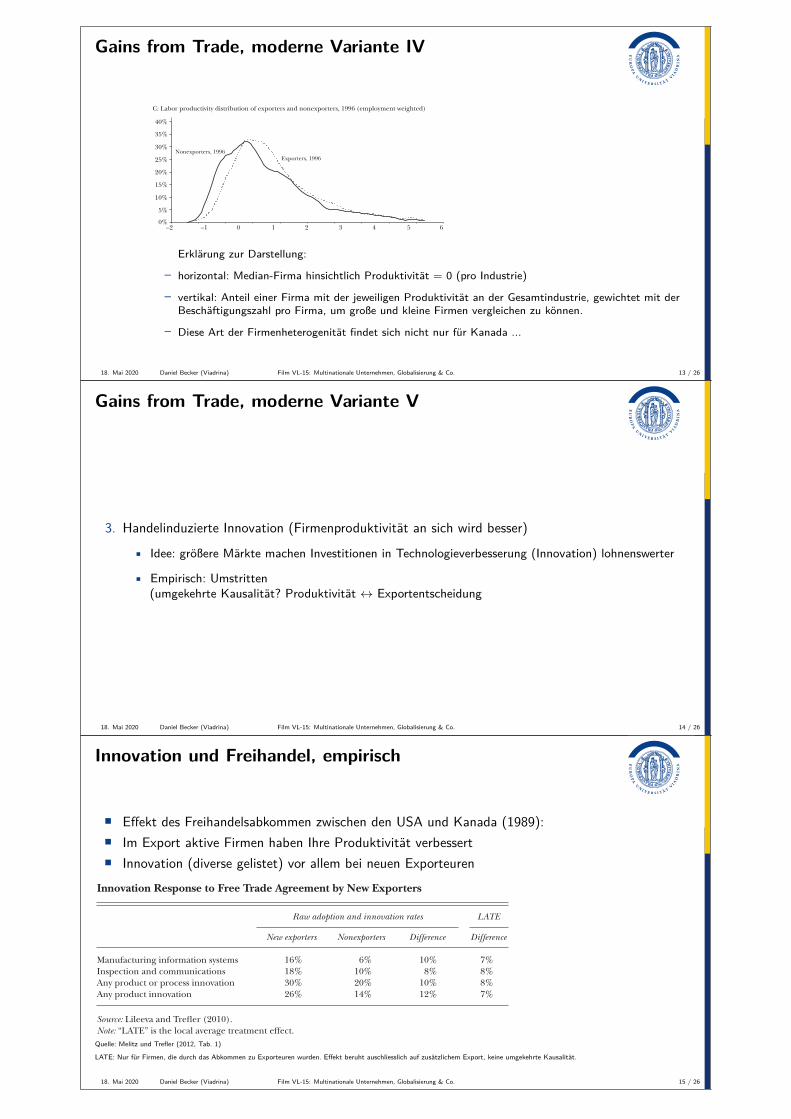
Erklärung zur Darstellung:
– horizontal: Median-Firma hinsichtlich Produktivität = 0 (pro Industrie)
– vertikal: Anteil einer Firma mit der jeweiligen Produktivität an der Gesamtindustrie, gewichtet mit derBeschäftigungszahl pro Firma, um große und kleine Firmen vergleichen zu können.
– Diese Art der Firmenheterogenität findet sich nicht nur für Kanada ...
18. Mai 2020 Daniel Becker (Viadrina) Film VL-15: Multinationale Unternehmen, Globalisierung & Co. 13 / 26
Gains from Trade, moderne Variante V
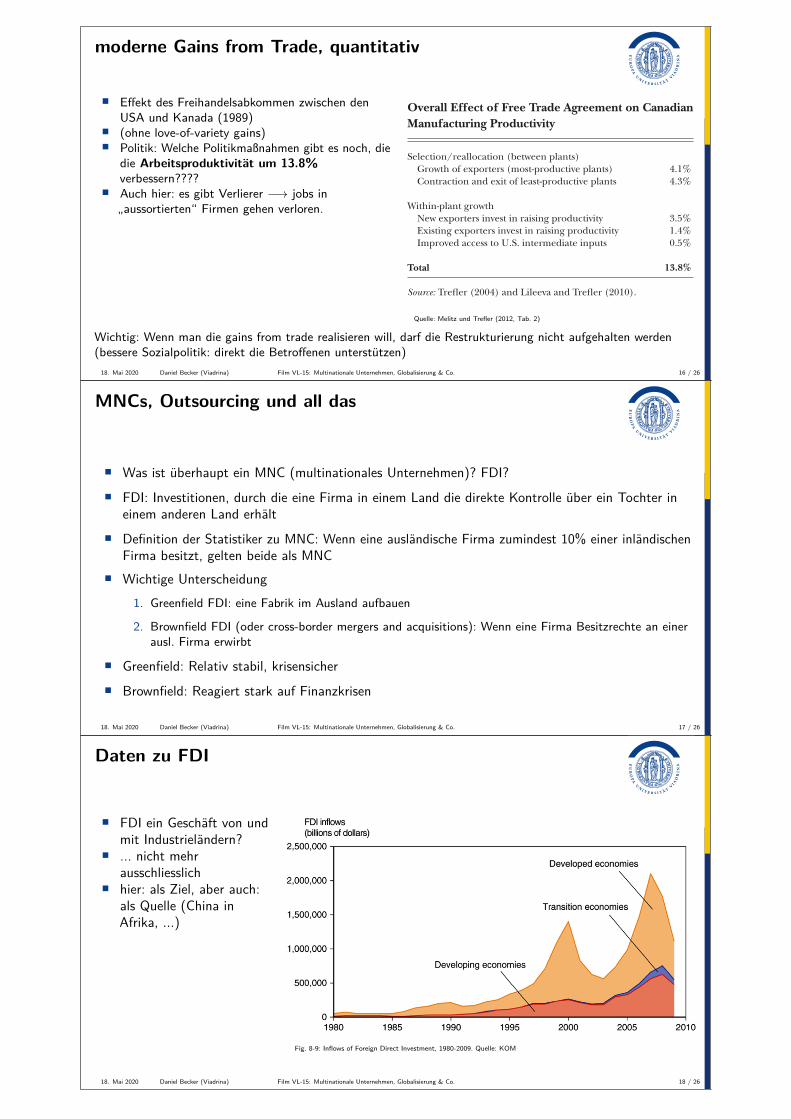
3. Handelinduzierte Innovation (Firmenproduktivität an sich wird besser)
• Idee: größere Märkte machen Investitionen in Technologieverbesserung (Innovation) lohnenswerter
• Empirisch: Umstritten(umgekehrte Kausalität? Produktivität ↔ Exportentscheidung
18. Mai 2020 Daniel Becker (Viadrina) Film VL-15: Multinationale Unternehmen, Globalisierung & Co. 14 / 26
Innovation und Freihandel, empirisch
• Effekt des Freihandelsabkommen zwischen den USA und Kanada (1989):• Im Export aktive Firmen haben Ihre Produktivität verbessert• Innovation (diverse gelistet) vor allem bei neuen Exporteuren
Marc J. Melitz and Daniel Tre! er 113
What has recently buttressed the minority view that a rise in exporting can What has recently buttressed the minority view that a rise in exporting can lead to a rise in productivity is a spate of papers isolating the causal mechanisms lead to a rise in productivity is a spate of papers isolating the causal mechanisms through which exporting affects productivity. We have already seen the market-size through which exporting affects productivity. We have already seen the market-size mechanism of Lileeva and Tre! er (2010). Bustos (2011a, b) develops a related mechanism of Lileeva and Tre! er (2010). Bustos (2011a, b) develops a related model of scale-biased technology choice, which she takes to Argentinean " rm-level model of scale-biased technology choice, which she takes to Argentinean " rm-level data for the 1992–1996 period. Bustos (2011b, table 6) shows that " rms that began data for the 1992–1996 period. Bustos (2011b, table 6) shows that " rms that began exporting between 1992 and 1996 also increased their technology spending. Bustos exporting between 1992 and 1996 also increased their technology spending. Bustos (2011a) shows that technology spending increased most in sectors that experi-(2011a) shows that technology spending increased most in sectors that experi-enced improved access to Brazilian product markets (through the tariff cuts in the enced improved access to Brazilian product markets (through the tariff cuts in the Mercosur regional trade agreement). In a series of studies of Taiwanese electronics Mercosur regional trade agreement). In a series of studies of Taiwanese electronics exporters, Aw, Roberts, and Winston (2007) and Aw, Roberts, and Xu (2008, 2011) exporters, Aw, Roberts, and Winston (2007) and Aw, Roberts, and Xu (2008, 2011) show empirically that there is a complex dynamic interplay between the decisions show empirically that there is a complex dynamic interplay between the decisions to export and conduct research and development, with today’s decisions about to export and conduct research and development, with today’s decisions about one affecting tomorrow’s decisions about the other—and both affecting future one affecting tomorrow’s decisions about the other—and both affecting future productivity. Extending this dynamic methodology to general equilibrium, Shen productivity. Extending this dynamic methodology to general equilibrium, Shen (2011) also " nds strong complementarities between exporting and productivity-(2011) also " nds strong complementarities between exporting and productivity-enhancing investments among Spanish " rms. Bloom, Draca, and Van Reenen enhancing investments among Spanish " rms. Bloom, Draca, and Van Reenen (2011) show that import competition from China has led to increases in R&D, (2011) show that import competition from China has led to increases in R&D, patenting, information technology, and total factor productivity among more tech-patenting, information technology, and total factor productivity among more tech-nologically advanced European " rms. Atkeson and Burstein (2010) are the only nologically advanced European " rms. Atkeson and Burstein (2010) are the only ones to examine exporting and investing in productivity within a full-blown general ones to examine exporting and investing in productivity within a full-blown general equilibrium analysis. They " nd the general equilibrium feedbacks are important.equilibrium analysis. They " nd the general equilibrium feedbacks are important.
A New Dimension of HeterogeneityIn our theoretical model above, " rms below a certain productivity threshold In our theoretical model above, " rms below a certain productivity threshold
should not be exporting. Yet in the empirical work reviewed above, we saw that should not be exporting. Yet in the empirical work reviewed above, we saw that many low-productivity Canadian plants started exporting in response to U.S. tariff many low-productivity Canadian plants started exporting in response to U.S. tariff cuts. There is a second puzzle that we have not yet noted: Lileeva and Tre! er (2010, cuts. There is a second puzzle that we have not yet noted: Lileeva and Tre! er (2010, table 3) report that the plants that gained most from starting to export (both in table 3) report that the plants that gained most from starting to export (both in terms of productivity gains and increased innovation) were primarily plants that terms of productivity gains and increased innovation) were primarily plants that
Table 1Innovation Response to Free Trade Agreement by New Exporters
Raw adoption and innovation rates LATE
New exporters Nonexporters Difference Difference
Manufacturing information systems 16% 6% 10% 7%Inspection and communications 18% 10% 8% 8%Any product or process innovation 30% 20% 10% 8%Any product innovation 26% 14% 12% 7%
Source: Lileeva and Tre! er (2010).Note: “LATE” is the local average treatment effect.Quelle: Melitz und Trefler (2012, Tab. 1)
LATE: Nur für Firmen, die durch das Abkommen zu Exporteuren wurden. Effekt beruht auschliesslich auf zusätzlichem Export, keine umgekehrte Kausalität.
18. Mai 2020 Daniel Becker (Viadrina) Film VL-15: Multinationale Unternehmen, Globalisierung & Co. 15 / 26
moderne Gains from Trade, quantitativ
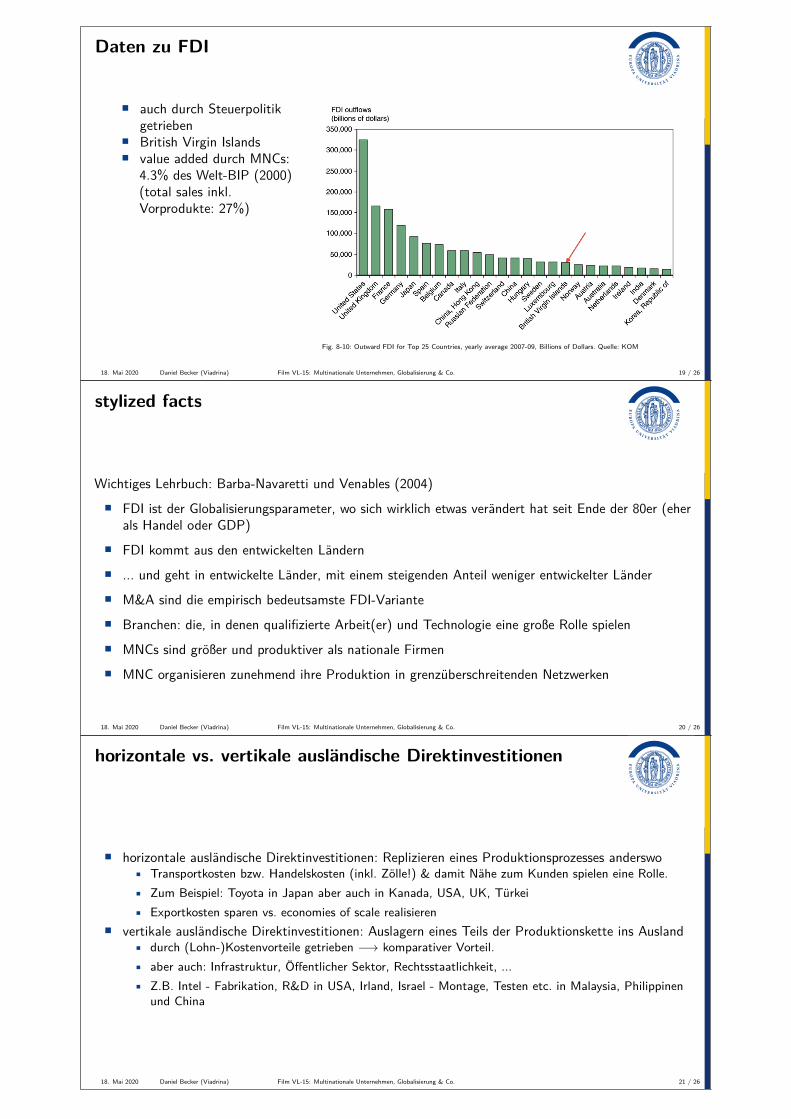
• Effekt des Freihandelsabkommen zwischen denUSA und Kanada (1989)
• (ohne love-of-variety gains)• Politik: Welche Politikmaßnahmen gibt es noch, die
die Arbeitsproduktivität um 13.8%verbessern????
• Auch hier: es gibt Verlierer −→ jobs in„aussortierten“ Firmen gehen verloren.
Gains from Trade when Firms Matter 115
reallocation process by making ! rm contractions and expansions costlier would also reallocation process by making ! rm contractions and expansions costlier would also reduce the potential gains to ! rm innovation and hence lead to less innovation and reduce the potential gains to ! rm innovation and hence lead to less innovation and further depress the potential long-run gains from trade. Nonetheless, it is important further depress the potential long-run gains from trade. Nonetheless, it is important to remember that there are winners and losers from trade liberalization not just to remember that there are winners and losers from trade liberalization not just among ! rms, but also among their employees.among ! rms, but also among their employees.
■ Tre! er gratefully acknowledges funding from the Social Sciences and Humanities Research Council of Canada (SSHRC) and the Canadian Institute for Advanced Research (CIFAR). His research would not have been possible without the tremendous support of John Baldwin and Alla Lileeva. We thank the editors (David Autor, Chad Jones, John List, and Timothy Taylor) for their invaluable comments.
References
Table 2Overall Effect of Free Trade Agreement on Canadian Manufacturing Productivity
Selection/reallocation (between plants) Growth of exporters (most-productive plants) 4.1% Contraction and exit of least-productive plants 4.3%
Within-plant growth New exporters invest in raising productivity 3.5% Existing exporters invest in raising productivity 1.4% Improved access to U.S. intermediate inputs 0.5%
Total 13.8%
Source: Tre" er (2004) and Lileeva and Tre" er (2010).
Abraham, Filip, Jozef Konings, and Stijn Vanormelingen. 2009. “The Effect of Global-ization on Union Bargaining and Price-Cost Margins of Firms.” Review of World Economics (Weltwirtschaftliches Archiv) 145(1): 13–36.
Amiti, Mary, and Jozef Konings. 2007. “Trade Liberalization, Intermediate Inputs, and Produc-tivity: Evidence from Indonesia.” American Economic Review 97(5): 1611–38.
Antràs, Pol., and Esteban Rossi-Hansberg. 2009. “Organizations and Trade.” Annual Review of Economics 1(1): 43–64.
Atkeson, Andrew, and Ariel Tomás Burstein. 2010. “Innovation, Firm Dynamics, and Interna-tional Trade.” Journal of Political Economy 118(3): 433–84.
Autor, David H., David Dorn, and Gordon H. Hanson. 2011. “The China Syndrome: Local
Quelle: Melitz und Trefler (2012, Tab. 2)
Wichtig: Wenn man die gains from trade realisieren will, darf die Restrukturierung nicht aufgehalten werden(bessere Sozialpolitik: direkt die Betroffenen unterstützen)18. Mai 2020 Daniel Becker (Viadrina) Film VL-15: Multinationale Unternehmen, Globalisierung & Co. 16 / 26
MNCs, Outsourcing und all das
• Was ist überhaupt ein MNC (multinationales Unternehmen)? FDI?
• FDI: Investitionen, durch die eine Firma in einem Land die direkte Kontrolle über ein Tochter ineinem anderen Land erhält
• Definition der Statistiker zu MNC: Wenn eine ausländische Firma zumindest 10% einer inländischenFirma besitzt, gelten beide als MNC
• Wichtige Unterscheidung1. Greenfield FDI: eine Fabrik im Ausland aufbauen
2. Brownfield FDI (oder cross-border mergers and acquisitions): Wenn eine Firma Besitzrechte an einerausl. Firma erwirbt
• Greenfield: Relativ stabil, krisensicher
• Brownfield: Reagiert stark auf Finanzkrisen
18. Mai 2020 Daniel Becker (Viadrina) Film VL-15: Multinationale Unternehmen, Globalisierung & Co. 17 / 26
Daten zu FDI
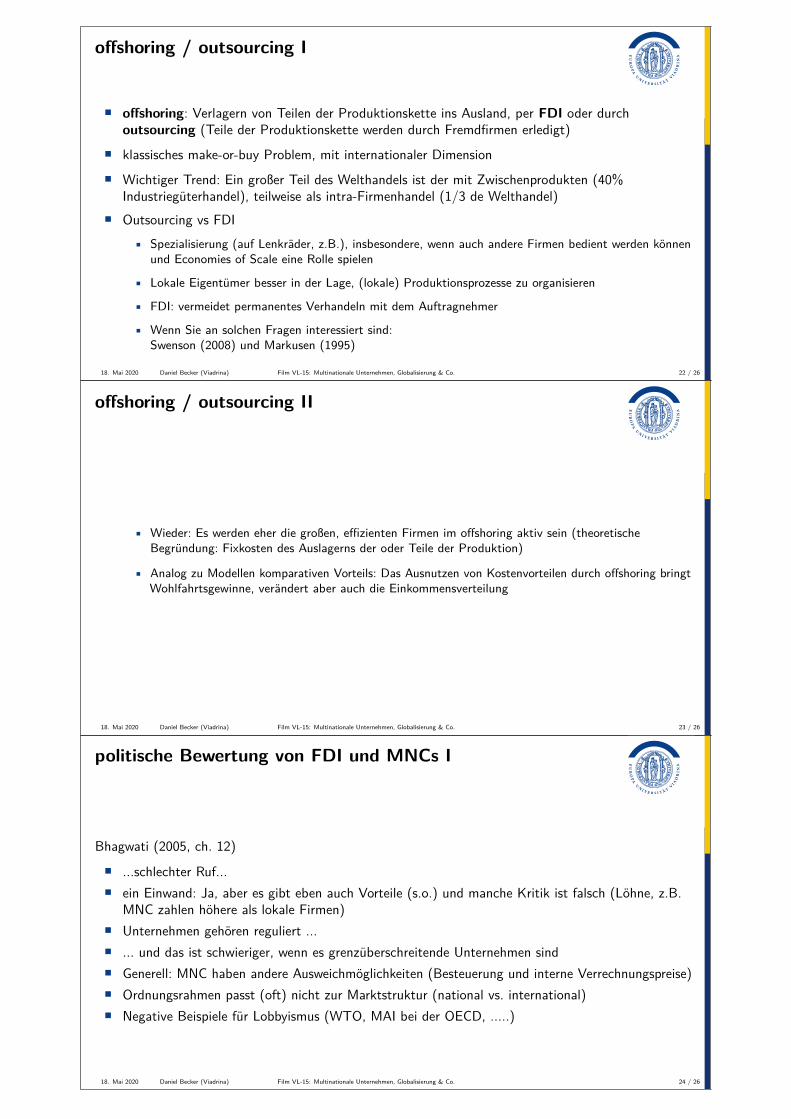
• FDI ein Geschäft von undmit Industrieländern?
• ... nicht mehrausschliesslich
• hier: als Ziel, aber auch:als Quelle (China inAfrika, ...)
Fig. 8-9: Inflows of Foreign Direct Investment, 1980-2009. Quelle: KOM
18. Mai 2020 Daniel Becker (Viadrina) Film VL-15: Multinationale Unternehmen, Globalisierung & Co. 18 / 26
Daten zu FDI
• auch durch Steuerpolitikgetrieben
• British Virgin Islands• value added durch MNCs:
4.3% des Welt-BIP (2000)(total sales inkl.Vorprodukte: 27%)
Fig. 8-10: Outward FDI for Top 25 Countries, yearly average 2007-09, Billions of Dollars. Quelle: KOM
18. Mai 2020 Daniel Becker (Viadrina) Film VL-15: Multinationale Unternehmen, Globalisierung & Co. 19 / 26
stylized facts
Wichtiges Lehrbuch: Barba-Navaretti und Venables (2004)
• FDI ist der Globalisierungsparameter, wo sich wirklich etwas verändert hat seit Ende der 80er (eherals Handel oder GDP)
• FDI kommt aus den entwickelten Ländern
• ... und geht in entwickelte Länder, mit einem steigenden Anteil weniger entwickelter Länder
• M&A sind die empirisch bedeutsamste FDI-Variante
• Branchen: die, in denen qualifizierte Arbeit(er) und Technologie eine große Rolle spielen
• MNCs sind größer und produktiver als nationale Firmen
• MNC organisieren zunehmend ihre Produktion in grenzüberschreitenden Netzwerken
18. Mai 2020 Daniel Becker (Viadrina) Film VL-15: Multinationale Unternehmen, Globalisierung & Co. 20 / 26
horizontale vs. vertikale ausländische Direktinvestitionen
• horizontale ausländische Direktinvestitionen: Replizieren eines Produktionsprozesses anderswo• Transportkosten bzw. Handelskosten (inkl. Zölle!) & damit Nähe zum Kunden spielen eine Rolle.• Zum Beispiel: Toyota in Japan aber auch in Kanada, USA, UK, Türkei• Exportkosten sparen vs. economies of scale realisieren
• vertikale ausländische Direktinvestitionen: Auslagern eines Teils der Produktionskette ins Ausland• durch (Lohn-)Kostenvorteile getrieben −→ komparativer Vorteil.• aber auch: Infrastruktur, Öffentlicher Sektor, Rechtsstaatlichkeit, ...• Z.B. Intel - Fabrikation, R&D in USA, Irland, Israel - Montage, Testen etc. in Malaysia, Philippinen
und China
18. Mai 2020 Daniel Becker (Viadrina) Film VL-15: Multinationale Unternehmen, Globalisierung & Co. 21 / 26
offshoring / outsourcing I
• offshoring: Verlagern von Teilen der Produktionskette ins Ausland, per FDI oder durchoutsourcing (Teile der Produktionskette werden durch Fremdfirmen erledigt)
• klassisches make-or-buy Problem, mit internationaler Dimension
• Wichtiger Trend: Ein großer Teil des Welthandels ist der mit Zwischenprodukten (40%Industriegüterhandel), teilweise als intra-Firmenhandel (1/3 de Welthandel)
• Outsourcing vs FDI• Spezialisierung (auf Lenkräder, z.B.), insbesondere, wenn auch andere Firmen bedient werden können
und Economies of Scale eine Rolle spielen
• Lokale Eigentümer besser in der Lage, (lokale) Produktionsprozesse zu organisieren
• FDI: vermeidet permanentes Verhandeln mit dem Auftragnehmer
• Wenn Sie an solchen Fragen interessiert sind:Swenson (2008) und Markusen (1995)
18. Mai 2020 Daniel Becker (Viadrina) Film VL-15: Multinationale Unternehmen, Globalisierung & Co. 22 / 26
offshoring / outsourcing II
• Wieder: Es werden eher die großen, effizienten Firmen im offshoring aktiv sein (theoretischeBegründung: Fixkosten des Auslagerns der oder Teile der Produktion)
• Analog zu Modellen komparativen Vorteils: Das Ausnutzen von Kostenvorteilen durch offshoring bringtWohlfahrtsgewinne, verändert aber auch die Einkommensverteilung
18. Mai 2020 Daniel Becker (Viadrina) Film VL-15: Multinationale Unternehmen, Globalisierung & Co. 23 / 26
politische Bewertung von FDI und MNCs I
Bhagwati (2005, ch. 12)
• ...schlechter Ruf...• ein Einwand: Ja, aber es gibt eben auch Vorteile (s.o.) und manche Kritik ist falsch (Löhne, z.B.
MNC zahlen höhere als lokale Firmen)• Unternehmen gehören reguliert ...• ... und das ist schwieriger, wenn es grenzüberschreitende Unternehmen sind• Generell: MNC haben andere Ausweichmöglichkeiten (Besteuerung und interne Verrechnungspreise)• Ordnungsrahmen passt (oft) nicht zur Marktstruktur (national vs. international)• Negative Beispiele für Lobbyismus (WTO, MAI bei der OECD, .....)
18. Mai 2020 Daniel Becker (Viadrina) Film VL-15: Multinationale Unternehmen, Globalisierung & Co. 24 / 26
politische Bewertung von FDI und MNCs II
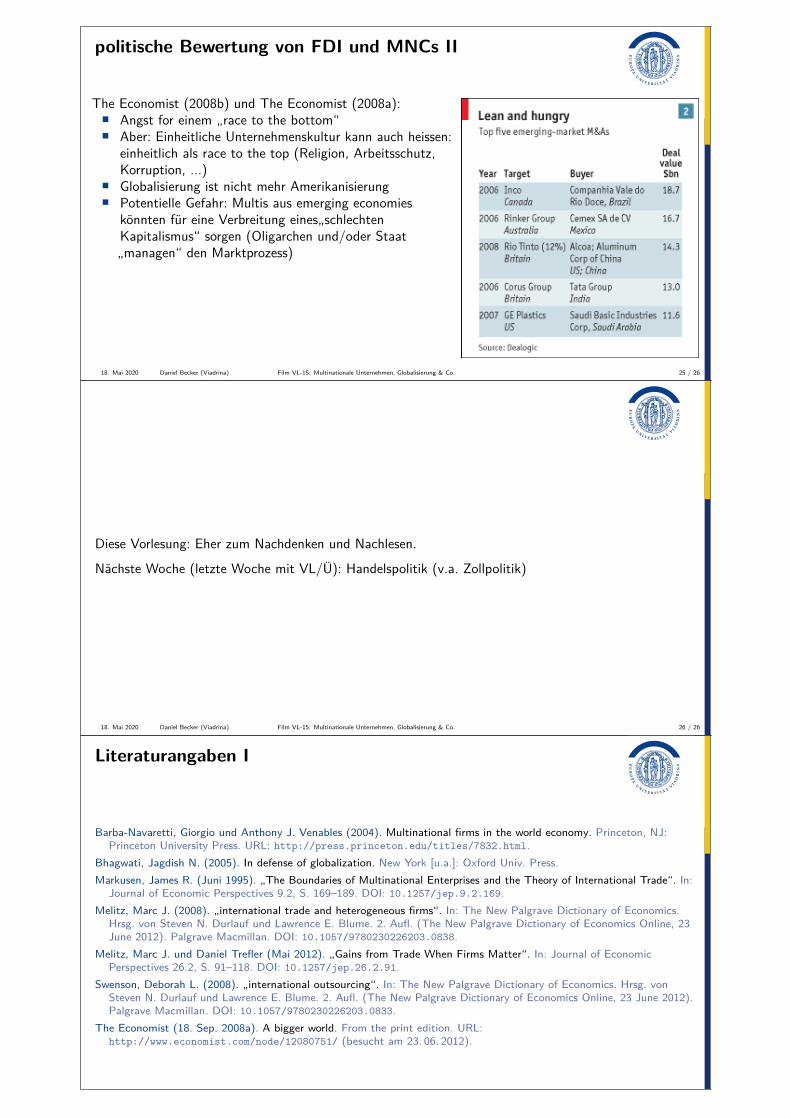
The Economist (2008b) und The Economist (2008a):• Angst for einem „race to the bottom“• Aber: Einheitliche Unternehmenskultur kann auch heissen:
einheitlich als race to the top (Religion, Arbeitsschutz,Korruption, ...)
• Globalisierung ist nicht mehr Amerikanisierung• Potentielle Gefahr: Multis aus emerging economies
könnten für eine Verbreitung eines„schlechtenKapitalismus“ sorgen (Oligarchen und/oder Staat„managen“ den Marktprozess)
18. Mai 2020 Daniel Becker (Viadrina) Film VL-15: Multinationale Unternehmen, Globalisierung & Co. 25 / 26
Diese Vorlesung: Eher zum Nachdenken und Nachlesen.
Nächste Woche (letzte Woche mit VL/Ü): Handelspolitik (v.a. Zollpolitik)
18. Mai 2020 Daniel Becker (Viadrina) Film VL-15: Multinationale Unternehmen, Globalisierung & Co. 26 / 26
Literaturangaben I
Barba-Navaretti, Giorgio und Anthony J. Venables (2004). Multinational firms in the world economy. Princeton, NJ:Princeton University Press. URL: http://press.princeton.edu/titles/7832.html.
Bhagwati, Jagdish N. (2005). In defense of globalization. New York [u.a.]: Oxford Univ. Press.Markusen, James R. (Juni 1995). „The Boundaries of Multinational Enterprises and the Theory of International Trade“. In:
Journal of Economic Perspectives 9.2, S. 169–189. DOI: 10.1257/jep.9.2.169.Melitz, Marc J. (2008). „international trade and heterogeneous firms“. In: The New Palgrave Dictionary of Economics.
Hrsg. von Steven N. Durlauf und Lawrence E. Blume. 2. Aufl. (The New Palgrave Dictionary of Economics Online, 23June 2012). Palgrave Macmillan. DOI: 10.1057/9780230226203.0838.
Melitz, Marc J. und Daniel Trefler (Mai 2012). „Gains from Trade When Firms Matter“. In: Journal of EconomicPerspectives 26.2, S. 91–118. DOI: 10.1257/jep.26.2.91.
Swenson, Deborah L. (2008). „international outsourcing“. In: The New Palgrave Dictionary of Economics. Hrsg. vonSteven N. Durlauf und Lawrence E. Blume. 2. Aufl. (The New Palgrave Dictionary of Economics Online, 23 June 2012).Palgrave Macmillan. DOI: 10.1057/9780230226203.0833.
The Economist (18. Sep. 2008a). A bigger world. From the print edition. URL:http://www.economist.com/node/12080751/ (besucht am 23. 06. 2012).

Literaturangaben II
The Economist (18. Sep. 2008b). In praise of the stateless multinational. From the print edition. URL:http://www.economist.com/node/12263150 (besucht am 23. 06. 2012).