Embed Size (px)
Citation preview
Geomorphology 135 (2011) 108–116
Contents lists available at SciVerse ScienceDirect
Geomorphology
j ourna l homepage: www.e lsev ie r.com/ locate /geomorph
Formation of the highest sand dunes on Earth
Xiaoping Yang a,⁎, Louis Scuderi b, Tao Liu a, Philippe Paillou c, Hongwei Li a, Jufeng Dong a, Bingqi Zhu a,Weiwei Jiang d, Andrew Jochems b, Gary Weissmann b
a CAS (Chinese Academy of Sciences) Key Laboratory of Cenozoic Geology and Environment, Institute of Geology and Geophysics, CAS, P.O. Box 9825, Beijing 100029, Chinab Department of Earth and Planetary Sciences, University of New Mexico, MSC03 2040, Albuquerque, NM 87131-1111, USAc Université de Bordeaux, Observatoire Aquitain des Sciences de l'Univers, UMR 5804, LAB/UMR 5218, IMS, 2 rue de l'Observatoire, 33271 Floirac, Franced CAS Key Laboratory of Petroleum Geophysics, Institute of Geology and Geophysics, CAS, P.O. Box 9825, Beijing 100029, China
⁎ Corresponding author. Tel.: +86 10 8299 8387.E-mail addresses: [email protected], xpyang@mail
0169-555X/$ – see front matter © 2011 Elsevier B.V. Adoi:10.1016/j.geomorph.2011.08.008
a b s t r a c t
a r t i c l e i n f oArticle history:Received 13 April 2011Received in revised form 5 August 2011Accepted 8 August 2011Available online 16 August 2011
Keywords:Dune formationAeolian processGravity methodRemote sensingClimate changeChina
Characterization of dune morphology has historically been based on relationships between dune forms andwind regimes with dune height shown to be sensitive to atmospheric boundary layer depth, sand availabilityand sediment properties. While these parameters have been used in numerical simulations to model theoccurrences of some types of dunes, they cannot alone explain the great diversity in form and size seen onEarth and on other solar system bodies. Here we present results from our studies of dune formation in theBadain Jaran Desert in western China, where Earth's tallest dunes occur. We measured the variability of thedune morphology in this desert on the basis of LANDSAT ETM+ data, and we detected the bedrock landformsbeneath the aeolian sands by applying gravity methods. Wind records from stations at the periphery of thedesert and SRTM topographical data were examined also to augment the interpretation. Our studiesdemonstrate that in addition to average wind parameters, dune height is highly sensitive to local geology,subsurface characteristics, and topography, and interactions between changing climate conditions andaeolian and fluvial processes. These additional factors need to be considered in the interpretation andsimulation of dunes on Earth. We anticipate that analysis of anomalous dune heights like those seen in theBadain Jaran may also provide critical information on subsurface characteristics and environmentalconditions on Earth and on other planetary bodies.
.igcas.ac.cn (X. Yang).
ll rights reserved.
© 2011 Elsevier B.V. All rights reserved.
1. Introduction
Dune form and size vary greatly globally and often differsignificantly within a single desert (e.g., Fryberger and Dean, 1979;Lancaster, 1995; Goudie, 2002). Our understanding of dune morphol-ogy has largely been based on relationships between dune morphol-ogy andwind regimes (e.g., Bagnold, 1941; Fryberger and Dean, 1979;Zhu et al., 1981; Lancaster, 1995; Livingstone et al., 2006; Bullard andLivingstone, 2010). Dune height has been shown to be sensitive toatmospheric boundary layer depth (Andreotti et al., 2009), sedimentavailability (Kocurek and Lancaster, 1999), and sediment properties(Rubin and Hesp, 2009). While these parameters have been used innumerical simulations to model the occurrences of some types ofdunes (e.g., Narteau et al., 2009; Parteli et al., 2009; Zhang et al., 2010;Delgado-Fernandez, 2011), the great diversity in dune form and sizeseen on Earth and on other solar system bodies remains poorlyunderstood.
China's Badain Jaran Desert (Fig. 1) covers an area of ~49,000 km2
and is characterized in its southern and southeastern parts by the
occurrence of densely distributed giant dunes with heights commonlybetween 200 and 300 mwith a maximum of 460 m. The mean annualprecipitation decreases from ca. 120 mm in the southeast to ca.40 mm in the northwestern margin of the desert. The mean annualevaporation is just ~1000 mm from the lake surface and ~100 mmfrom the land surface in the southeastern part of the sand seaaccording to more recent studies (Yang et al., 2010a), although muchlarge values were reported earlier (e.g., Zhu et al., 1980). On the duneslopes there is a spare vegetation cover consisting of xerophilousgrasses and shrubs with some plants like Artemisia, Agriophyllum andAchnatherum occurring even close to the ridges of the high dunes.Around the lakes and springs in the inter-dune depressions there areabundant grasses and shrubs used for animal grazing and for cookingfuel by the local residents.
The dunes in the Badain Jaran are mainly compound forms anddune chains, consisting of multiple dune generations arising fromQuaternary climate changes (Yang et al., 2003), although simple giantdunes with obvious steep lees and relatively steep windward slopesoccur as well (Yang, 1991). On the southeastern margin of the sandsea typical pyramid dunes are not rare (Zhu et al., 1980). The giantdunes, named also as compound, crescentic ridges (Breed and Grow,1979), are the tallest dunes on Earth (e.g., Fryberger and Dean, 1979;Zhu et al., 1980; Yang, 1991; Jäkel, 1996; Yang et al., 2003, 2010a) and
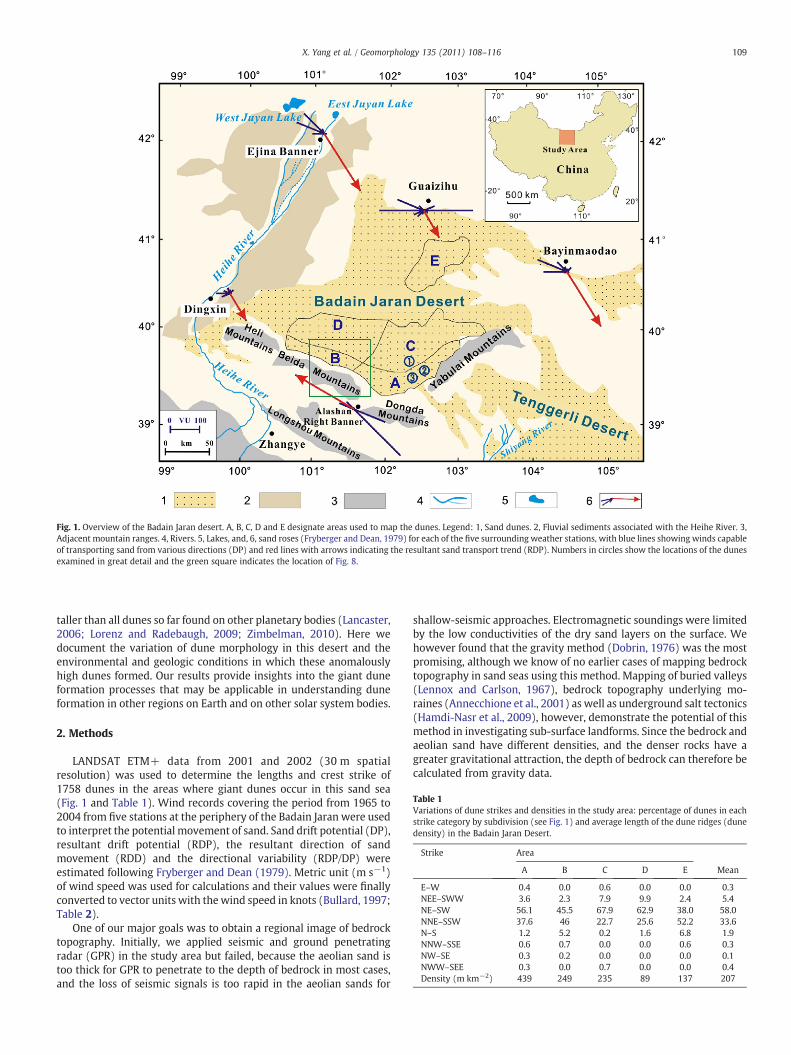
Fig. 1. Overview of the Badain Jaran desert. A, B, C, D and E designate areas used to map the dunes. Legend: 1, Sand dunes. 2, Fluvial sediments associated with the Heihe River. 3,Adjacent mountain ranges. 4, Rivers. 5, Lakes, and, 6, sand roses (Fryberger and Dean, 1979) for each of the five surrounding weather stations, with blue lines showing winds capableof transporting sand from various directions (DP) and red lines with arrows indicating the resultant sand transport trend (RDP). Numbers in circles show the locations of the dunesexamined in great detail and the green square indicates the location of Fig. 8.
Table 1Variations of dune strikes and densities in the study area: percentage of dunes in eachstrike category by subdivision (see Fig. 1) and average length of the dune ridges (dunedensity) in the Badain Jaran Desert.
Strike Area
A B C D E Mean
E–W 0.4 0.0 0.6 0.0 0.0 0.3NEE–SWW 3.6 2.3 7.9 9.9 2.4 5.4NE–SW 56.1 45.5 67.9 62.9 38.0 58.0NNE–SSW 37.6 46 22.7 25.6 52.2 33.6N–S 1.2 5.2 0.2 1.6 6.8 1.9NNW–SSE 0.6 0.7 0.0 0.0 0.6 0.3NW–SE 0.3 0.2 0.0 0.0 0.0 0.1NWW–SEE 0.3 0.0 0.7 0.0 0.0 0.4Density (m km−2) 439 249 235 89 137 207
109X. Yang et al. / Geomorphology 135 (2011) 108–116
taller than all dunes so far found on other planetary bodies (Lancaster,2006; Lorenz and Radebaugh, 2009; Zimbelman, 2010). Here wedocument the variation of dune morphology in this desert and theenvironmental and geologic conditions in which these anomalouslyhigh dunes formed. Our results provide insights into the giant duneformation processes that may be applicable in understanding duneformation in other regions on Earth and on other solar system bodies.
2. Methods
LANDSAT ETM+ data from 2001 and 2002 (30 m spatialresolution) was used to determine the lengths and crest strike of1758 dunes in the areas where giant dunes occur in this sand sea(Fig. 1 and Table 1). Wind records covering the period from 1965 to2004 from five stations at the periphery of the Badain Jaran were usedto interpret the potential movement of sand. Sand drift potential (DP),resultant drift potential (RDP), the resultant direction of sandmovement (RDD) and the directional variability (RDP/DP) wereestimated following Fryberger and Dean (1979). Metric unit (m s−1)of wind speed was used for calculations and their values were finallyconverted to vector units with thewind speed in knots (Bullard, 1997;Table 2).
One of our major goals was to obtain a regional image of bedrocktopography. Initially, we applied seismic and ground penetratingradar (GPR) in the study area but failed, because the aeolian sand istoo thick for GPR to penetrate to the depth of bedrock in most cases,and the loss of seismic signals is too rapid in the aeolian sands for
shallow-seismic approaches. Electromagnetic soundings were limitedby the low conductivities of the dry sand layers on the surface. Wehowever found that the gravity method (Dobrin, 1976) was the mostpromising, although we know of no earlier cases of mapping bedrocktopography in sand seas using this method. Mapping of buried valleys(Lennox and Carlson, 1967), bedrock topography underlying mo-raines (Annecchione et al., 2001) as well as underground salt tectonics(Hamdi-Nasr et al., 2009), however, demonstrate the potential of thismethod in investigating sub-surface landforms. Since the bedrock andaeolian sand have different densities, and the denser rocks have agreater gravitational attraction, the depth of bedrock can therefore becalculated from gravity data.
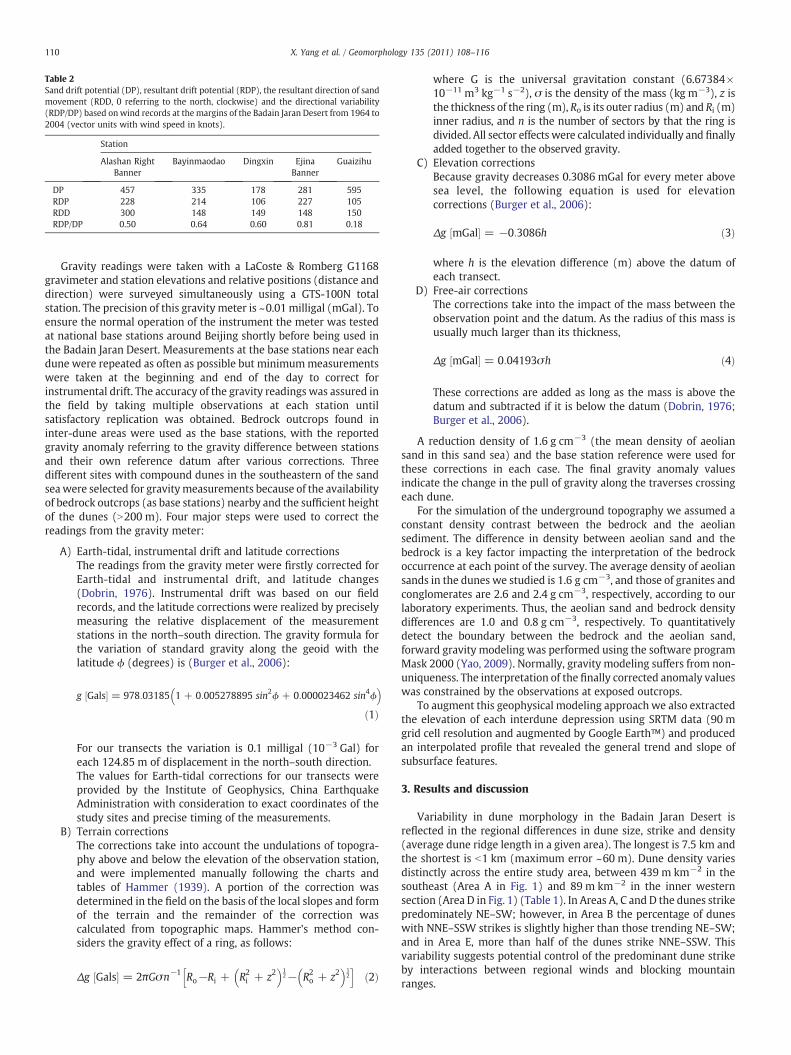
Table 2Sand drift potential (DP), resultant drift potential (RDP), the resultant direction of sandmovement (RDD, 0 referring to the north, clockwise) and the directional variability(RDP/DP) based onwind records at themargins of the Badain Jaran Desert from 1964 to2004 (vector units with wind speed in knots).
Station
Alashan RightBanner
Bayinmaodao Dingxin EjinaBanner
Guaizihu
DP 457 335 178 281 595RDP 228 214 106 227 105RDD 300 148 149 148 150RDP/DP 0.50 0.64 0.60 0.81 0.18
110 X. Yang et al. / Geomorphology 135 (2011) 108–116
Gravity readings were taken with a LaCoste & Romberg G1168gravimeter and station elevations and relative positions (distance anddirection) were surveyed simultaneously using a GTS-100N totalstation. The precision of this gravity meter is ~0.01 milligal (mGal). Toensure the normal operation of the instrument the meter was testedat national base stations around Beijing shortly before being used inthe Badain Jaran Desert. Measurements at the base stations near eachdune were repeated as often as possible but minimummeasurementswere taken at the beginning and end of the day to correct forinstrumental drift. The accuracy of the gravity readings was assured inthe field by taking multiple observations at each station untilsatisfactory replication was obtained. Bedrock outcrops found ininter-dune areas were used as the base stations, with the reportedgravity anomaly referring to the gravity difference between stationsand their own reference datum after various corrections. Threedifferent sites with compound dunes in the southeastern of the sandseawere selected for gravitymeasurements because of the availabilityof bedrock outcrops (as base stations) nearby and the sufficient heightof the dunes (N200 m). Four major steps were used to correct thereadings from the gravity meter:
A) Earth-tidal, instrumental drift and latitude correctionsThe readings from the gravity meter were firstly corrected forEarth-tidal and instrumental drift, and latitude changes(Dobrin, 1976). Instrumental drift was based on our fieldrecords, and the latitude corrections were realized by preciselymeasuring the relative displacement of the measurementstations in the north–south direction. The gravity formula forthe variation of standard gravity along the geoid with thelatitude ϕ (degrees) is (Burger et al., 2006):
g Gals½ � = 978:03185 1 + 0:005278895 sin2ϕ + 0:000023462 sin4ϕ� �
ð1Þ
For our transects the variation is 0.1 milligal (10−3 Gal) foreach 124.85 m of displacement in the north–south direction.The values for Earth-tidal corrections for our transects wereprovided by the Institute of Geophysics, China EarthquakeAdministration with consideration to exact coordinates of thestudy sites and precise timing of the measurements.
B) Terrain correctionsThe corrections take into account the undulations of topogra-phy above and below the elevation of the observation station,and were implemented manually following the charts andtables of Hammer (1939). A portion of the correction wasdetermined in the field on the basis of the local slopes and formof the terrain and the remainder of the correction wascalculated from topographic maps. Hammer's method con-siders the gravity effect of a ring, as follows:
Δg Gals½ � = 2πGσn−1 Ro−Ri + R2i + z2
� �12− R2
o + z2� �1
2
h ið2Þ
where G is the universal gravitation constant (6.67384×10⁻¹¹ m3 kg−1 s−2), σ is the density of the mass (kg m−3), z isthe thickness of the ring (m), Ro is its outer radius (m) and Ri (m)inner radius, and n is the number of sectors by that the ring isdivided. All sector effects were calculated individually and finallyadded together to the observed gravity.
C) Elevation correctionsBecause gravity decreases 0.3086 mGal for every meter abovesea level, the following equation is used for elevationcorrections (Burger et al., 2006):
Δg mGal½ � = −0:3086h ð3Þ
where h is the elevation difference (m) above the datum ofeach transect.
D) Free-air correctionsThe corrections take into the impact of the mass between theobservation point and the datum. As the radius of this mass isusually much larger than its thickness,
Δg mGal½ � = 0:04193σh ð4Þ
These corrections are added as long as the mass is above thedatum and subtracted if it is below the datum (Dobrin, 1976;Burger et al., 2006).
A reduction density of 1.6 g cm−3 (the mean density of aeoliansand in this sand sea) and the base station reference were used forthese corrections in each case. The final gravity anomaly valuesindicate the change in the pull of gravity along the traverses crossingeach dune.
For the simulation of the underground topography we assumed aconstant density contrast between the bedrock and the aeoliansediment. The difference in density between aeolian sand and thebedrock is a key factor impacting the interpretation of the bedrockoccurrence at each point of the survey. The average density of aeoliansands in the dunes we studied is 1.6 g cm−3, and those of granites andconglomerates are 2.6 and 2.4 g cm−3, respectively, according to ourlaboratory experiments. Thus, the aeolian sand and bedrock densitydifferences are 1.0 and 0.8 g cm−3, respectively. To quantitativelydetect the boundary between the bedrock and the aeolian sand,forward gravity modeling was performed using the software programMask 2000 (Yao, 2009). Normally, gravity modeling suffers from non-uniqueness. The interpretation of the finally corrected anomaly valueswas constrained by the observations at exposed outcrops.
To augment this geophysical modeling approach we also extractedthe elevation of each interdune depression using SRTM data (90 mgrid cell resolution and augmented by Google Earth™) and producedan interpolated profile that revealed the general trend and slope ofsubsurface features.
3. Results and discussion
Variability in dune morphology in the Badain Jaran Desert isreflected in the regional differences in dune size, strike and density(average dune ridge length in a given area). The longest is 7.5 km andthe shortest is b1 km (maximum error ~60 m). Dune density variesdistinctly across the entire study area, between 439 m km−2 in thesoutheast (Area A in Fig. 1) and 89 m km−2 in the inner westernsection (Area D in Fig. 1) (Table 1). In Areas A, C and D the dunes strikepredominately NE–SW; however, in Area B the percentage of duneswith NNE–SSW strikes is slightly higher than those trending NE–SW;and in Area E, more than half of the dunes strike NNE–SSW. Thisvariability suggests potential control of the predominant dune strikeby interactions between regional winds and blocking mountainranges.
111X. Yang et al. / Geomorphology 135 (2011) 108–116
Sand roses (Fig. 1) show that directional variability differs greatlyon the margins of the Badain Jaran, indicating the impact of regionaltopography and suggesting that the areas in the north (Guaizihu) andsouthwest (Alashan Right Banner) are high-energy environmentswhile the west margin (Dingxin) is a low-energy environment. Underthe control of the East Asian winter monsoon, northwest winds wouldbe predominant without the strong impact of these local mountainranges. Among the five stations, Guaizihu, which exhibits frequentchanges in wind direction, is the site with the highest total DP and thelowest resultant RDP (Table 2). The directional variability, RDP/DP, isclassified as follows: low in Guaizihu, high in Ejina, and intermediatein other stations. Low RDP/DP is associated with complex windregimes while high values are indicative of wide and narrowunimodal wind regimes (Table 2).
Changes in the simple Bouguer gravity anomaly (Dobrin, 1976)along dune crossing traverses (Figs. 2 to 5) indicate that bedrocklandforms form a basement under all four dunes surveyed with onlyone dune having a bedrock core directly under its ridge (Fig. 3). Ourresults suggest that giant dunes were built up when aeolian sandsaccumulated and grew on these gently sloping bedrock hills. A 250 mhigh dune located north of the bedrock hill in Fig. 2 (top) forms on thewindward slope of the hill, and the form of the dune is similar to thebedrock relief. At most sites along the traverses the thickness of theaeolian sands reaches a maximum of ~200 m on the dune ridges. Onthe lower portions of the dune slopes, the thickness of aeolian sands isoften less than 10 to 20 m.
The mapping of dune sand thickness via gravity methods issupported by our mapping of interdune elevations that are indicativeof the groundwater table associated with the occurrence of interdunelakes (Yang et al., 2003, 2010a). The height distribution of interdunedepressions should reflect the minimal elevations of the water tableassociated with the underlying bedrock (Fig. 6). This surface wassubtracted from the surface DEM to estimate total sand depth and itsdistribution across the region containing the giant dunes (Fig. 7). Weinterpret this as representing the gently sloping surface of a formerDistributive Fluvial System (DFS, Craddock et al., 2010; Weissmannet al., 2010) emanating from the southeast that was subsequentlyeroded into low rolling hills.
Fig. 2. Subsurface topography of location 1 in Fig. 1, interpreted from the gravity data, indicaconsisting of conglomerates is still visible. Dots are the field measurements after correction
Earlier studies have attempted to explain the genesis of theseglobally tallest dunes from various perspectives. Chen et al. (2004)reported that the giant dunes were maintained by subsurface flow ofgroundwater from mountains of the northeastern Tibetan Plateau.Yang (1991) and Jäkel (1996) assumed that some dunes might have abedrock core with the top of these bedrock hills often just beneath thedune ridges. The subsurface landforms, visualized for the first time onthe basis of our gravity data and regional mapping of interduneelevations using SRTM data, suggest that a small percentage of thedunes have a bedrock hill directly beneath their ridgelines and thatthe subsurface is a subdued and dissected low-relief erosional surface(maximum relief ~100 m) sloping at a low angle towards thenorthwest. Compared with the elevation of the inter-dune de-pressions, the surface of this hilly bedrock raises the relative heightof the dunes considerably (Figs. 2 and 3). In fact, the giant dunes onlyoccur in the southeastern parts where the effects of the subsurfaceactually come into play. The dunes in the central and northern portionof the sand sea are subdued and somewhat disorganized probably dueto locations distant from the mountain ranges (Fig. 1 and Table 1) andsand thickness decreases also (Fig. 7). This general trend of the sandthickness variation (Fig. 7) suggests that the seasonal changes of winddirections (Fig. 1) do not have an obvious impact on the size of thedunes, because tall dunes are not located in areas with large variabilityof wind directions, such as in Guaizihu.
Sand availability is another key component of the aeolian systemin the Badain Jaran Desert. In addition to sand provided by the HeheiRiver in the northwest (Fig. 1), we have also found that the alluvialsediments deposited on the south and southeast margins of the desertare significant sand sources. Although the desert region is generallyunder the impact of prevailing northwest winds related to the EastAsian monsoon system, precisely measured profiles crossing thedunes (Figs. 2 to 4) and wind data from local weather stations (Fig. 1)suggest that southeast winds are also important in shaping the dunes.The steep slopes in the northwestern side of the dunes (Figs. 2 to 4)demonstrate strong impact of southern and southeastern winds,meaning that the seasonal variation of winds plays a role in the shapesof dunes, even though there is no wind record directly from the duneareas (Fig. 1).
ting an earlier stage of the formation of a tall dune. The bedrock hill (local name Aobao)s and the lines represent the results of the forward modeling.
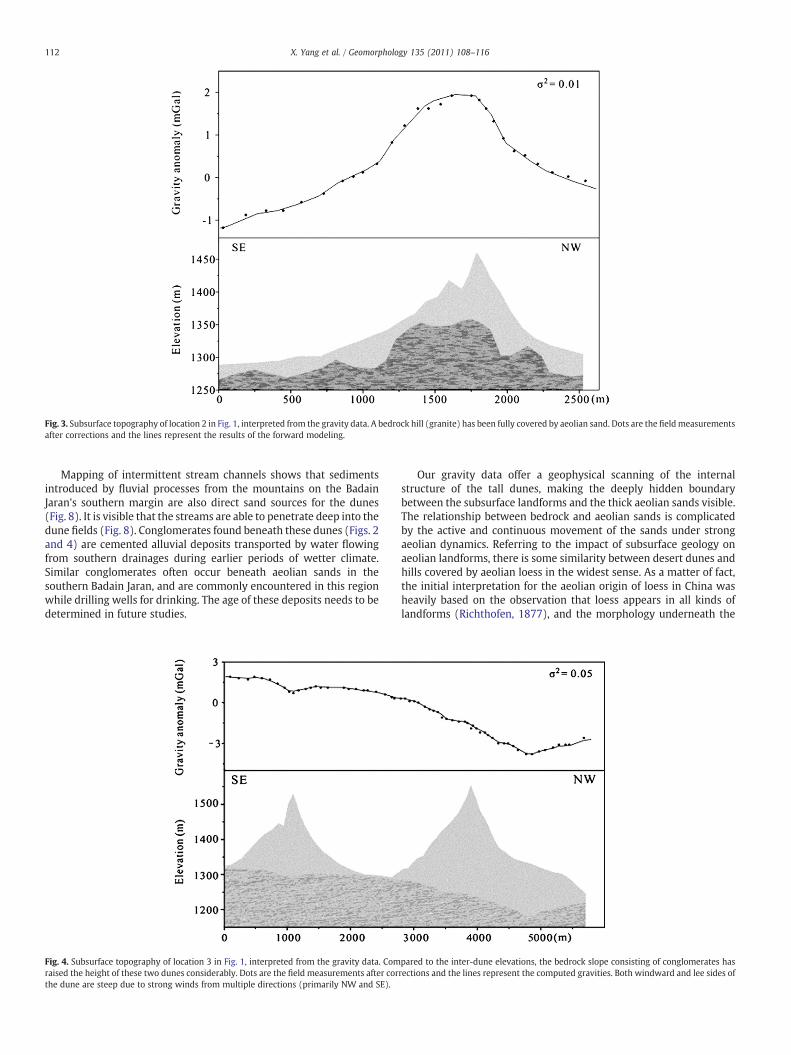
Fig. 3. Subsurface topography of location 2 in Fig. 1, interpreted from the gravity data. A bedrock hill (granite) has been fully covered by aeolian sand. Dots are the fieldmeasurementsafter corrections and the lines represent the results of the forward modeling.
112 X. Yang et al. / Geomorphology 135 (2011) 108–116
Mapping of intermittent stream channels shows that sedimentsintroduced by fluvial processes from the mountains on the BadainJaran's southern margin are also direct sand sources for the dunes(Fig. 8). It is visible that the streams are able to penetrate deep into thedune fields (Fig. 8). Conglomerates found beneath these dunes (Figs. 2and 4) are cemented alluvial deposits transported by water flowingfrom southern drainages during earlier periods of wetter climate.Similar conglomerates often occur beneath aeolian sands in thesouthern Badain Jaran, and are commonly encountered in this regionwhile drilling wells for drinking. The age of these deposits needs to bedetermined in future studies.
Fig. 4. Subsurface topography of location 3 in Fig. 1, interpreted from the gravity data. Comraised the height of these two dunes considerably. Dots are the field measurements after corthe dune are steep due to strong winds from multiple directions (primarily NW and SE).
Our gravity data offer a geophysical scanning of the internalstructure of the tall dunes, making the deeply hidden boundarybetween the subsurface landforms and the thick aeolian sands visible.The relationship between bedrock and aeolian sands is complicatedby the active and continuous movement of the sands under strongaeolian dynamics. Referring to the impact of subsurface geology onaeolian landforms, there is some similarity between desert dunes andhills covered by aeolian loess in the widest sense. As a matter of fact,the initial interpretation for the aeolian origin of loess in China washeavily based on the observation that loess appears in all kinds oflandforms (Richthofen, 1877), and the morphology underneath the
pared to the inter-dune elevations, the bedrock slope consisting of conglomerates hasrections and the lines represent the computed gravities. Both windward and lee sides of
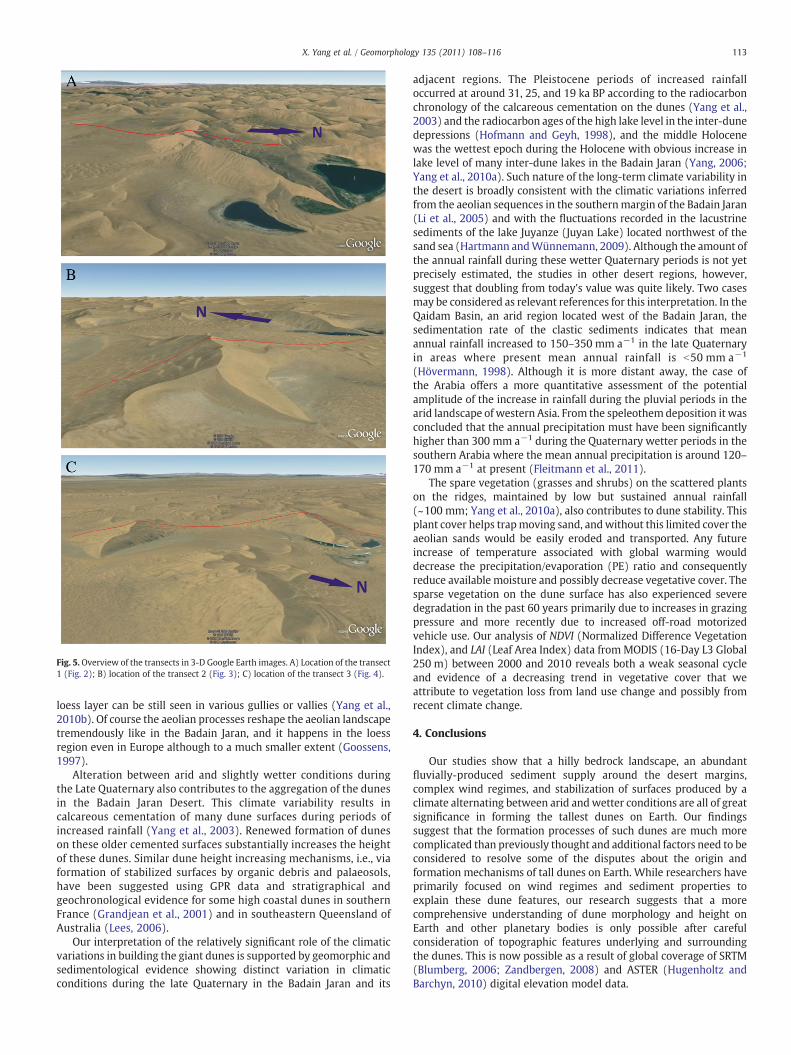
Fig. 5. Overview of the transects in 3-D Google Earth images. A) Location of the transect1 (Fig. 2); B) location of the transect 2 (Fig. 3); C) location of the transect 3 (Fig. 4).
113X. Yang et al. / Geomorphology 135 (2011) 108–116
loess layer can be still seen in various gullies or vallies (Yang et al.,2010b). Of course the aeolian processes reshape the aeolian landscapetremendously like in the Badain Jaran, and it happens in the loessregion even in Europe although to a much smaller extent (Goossens,1997).
Alteration between arid and slightly wetter conditions duringthe Late Quaternary also contributes to the aggregation of the dunesin the Badain Jaran Desert. This climate variability results incalcareous cementation of many dune surfaces during periods ofincreased rainfall (Yang et al., 2003). Renewed formation of duneson these older cemented surfaces substantially increases the heightof these dunes. Similar dune height increasing mechanisms, i.e., viaformation of stabilized surfaces by organic debris and palaeosols,have been suggested using GPR data and stratigraphical andgeochronological evidence for some high coastal dunes in southernFrance (Grandjean et al., 2001) and in southeastern Queensland ofAustralia (Lees, 2006).
Our interpretation of the relatively significant role of the climaticvariations in building the giant dunes is supported by geomorphic andsedimentological evidence showing distinct variation in climaticconditions during the late Quaternary in the Badain Jaran and its
adjacent regions. The Pleistocene periods of increased rainfalloccurred at around 31, 25, and 19 ka BP according to the radiocarbonchronology of the calcareous cementation on the dunes (Yang et al.,2003) and the radiocarbon ages of the high lake level in the inter-dunedepressions (Hofmann and Geyh, 1998), and the middle Holocenewas the wettest epoch during the Holocene with obvious increase inlake level of many inter-dune lakes in the Badain Jaran (Yang, 2006;Yang et al., 2010a). Such nature of the long-term climate variability inthe desert is broadly consistent with the climatic variations inferredfrom the aeolian sequences in the southernmargin of the Badain Jaran(Li et al., 2005) and with the fluctuations recorded in the lacustrinesediments of the lake Juyanze (Juyan Lake) located northwest of thesand sea (Hartmann andWünnemann, 2009). Although the amount ofthe annual rainfall during these wetter Quaternary periods is not yetprecisely estimated, the studies in other desert regions, however,suggest that doubling from today's value was quite likely. Two casesmay be considered as relevant references for this interpretation. In theQaidam Basin, an arid region located west of the Badain Jaran, thesedimentation rate of the clastic sediments indicates that meanannual rainfall increased to 150–350 mm a−1 in the late Quaternaryin areas where present mean annual rainfall is b50 mm a−1
(Hövermann, 1998). Although it is more distant away, the case ofthe Arabia offers a more quantitative assessment of the potentialamplitude of the increase in rainfall during the pluvial periods in thearid landscape of western Asia. From the speleothemdeposition it wasconcluded that the annual precipitation must have been significantlyhigher than 300 mm a−1 during the Quaternary wetter periods in thesouthern Arabia where the mean annual precipitation is around 120–170 mm a−1 at present (Fleitmann et al., 2011).
The spare vegetation (grasses and shrubs) on the scattered plantson the ridges, maintained by low but sustained annual rainfall(~100 mm; Yang et al., 2010a), also contributes to dune stability. Thisplant cover helps trapmoving sand, andwithout this limited cover theaeolian sands would be easily eroded and transported. Any futureincrease of temperature associated with global warming woulddecrease the precipitation/evaporation (PE) ratio and consequentlyreduce available moisture and possibly decrease vegetative cover. Thesparse vegetation on the dune surface has also experienced severedegradation in the past 60 years primarily due to increases in grazingpressure and more recently due to increased off-road motorizedvehicle use. Our analysis of NDVI (Normalized Difference VegetationIndex), and LAI (Leaf Area Index) data from MODIS (16-Day L3 Global250 m) between 2000 and 2010 reveals both a weak seasonal cycleand evidence of a decreasing trend in vegetative cover that weattribute to vegetation loss from land use change and possibly fromrecent climate change.
4. Conclusions
Our studies show that a hilly bedrock landscape, an abundantfluvially-produced sediment supply around the desert margins,complex wind regimes, and stabilization of surfaces produced by aclimate alternating between arid andwetter conditions are all of greatsignificance in forming the tallest dunes on Earth. Our findingssuggest that the formation processes of such dunes are much morecomplicated than previously thought and additional factors need to beconsidered to resolve some of the disputes about the origin andformation mechanisms of tall dunes on Earth. While researchers haveprimarily focused on wind regimes and sediment properties toexplain these dune features, our research suggests that a morecomprehensive understanding of dune morphology and height onEarth and other planetary bodies is only possible after carefulconsideration of topographic features underlying and surroundingthe dunes. This is now possible as a result of global coverage of SRTM(Blumberg, 2006; Zandbergen, 2008) and ASTER (Hugenholtz andBarchyn, 2010) digital elevation model data.
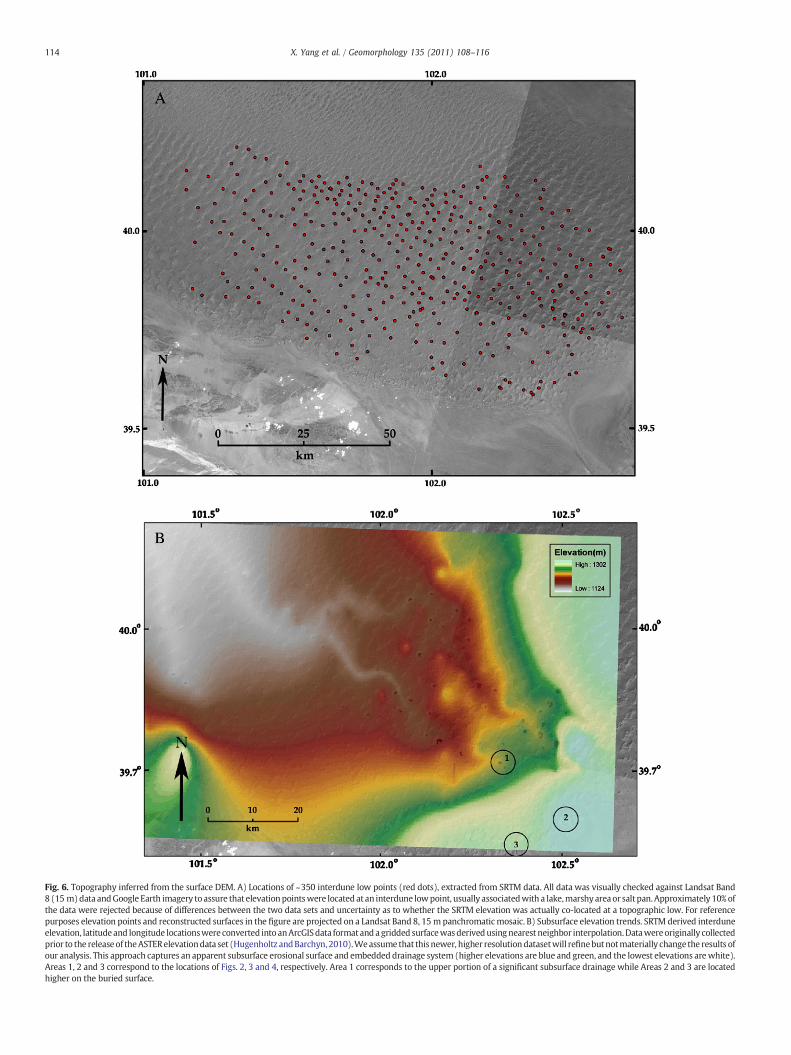
Fig. 6. Topography inferred from the surface DEM. A) Locations of ~350 interdune low points (red dots), extracted from SRTM data. All data was visually checked against Landsat Band8 (15 m)data andGoogle Earth imagery toassure that elevationpointswere located at an interdune lowpoint, usually associatedwith a lake,marshyareaor salt pan.Approximately 10%ofthe data were rejected because of differences between the two data sets and uncertainty as to whether the SRTM elevation was actually co-located at a topographic low. For referencepurposes elevation points and reconstructed surfaces in the figure are projected on a Landsat Band 8, 15 m panchromaticmosaic. B) Subsurface elevation trends. SRTM derived interduneelevation, latitude and longitude locationswere converted intoanArcGISdata format and agridded surfacewasderivedusingnearest neighbor interpolation.Datawereoriginally collectedprior to the releaseof theASTERelevationdata set (Hugenholtz andBarchyn,2010).Weassume that this newer, higher resolutiondatasetwill refinebutnotmaterially change the results ofour analysis. This approach captures an apparent subsurface erosional surface and embedded drainage system (higher elevations are blue and green, and the lowest elevations arewhite).Areas 1, 2 and 3 correspond to the locations of Figs. 2, 3 and 4, respectively. Area 1 corresponds to the upper portion of a significant subsurface drainage while Areas 2 and 3 are locatedhigher on the buried surface.
114 X. Yang et al. / Geomorphology 135 (2011) 108–116
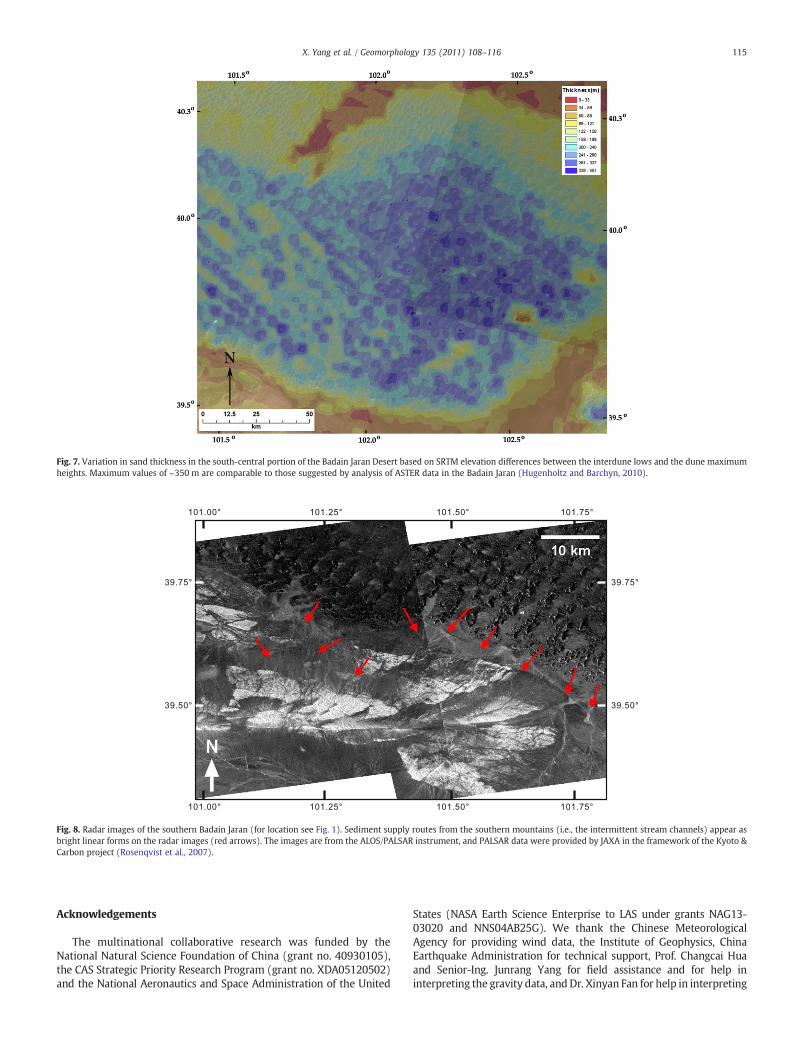
Fig. 7. Variation in sand thickness in the south-central portion of the Badain Jaran Desert based on SRTM elevation differences between the interdune lows and the dune maximumheights. Maximum values of ~350 m are comparable to those suggested by analysis of ASTER data in the Badain Jaran (Hugenholtz and Barchyn, 2010).
Fig. 8. Radar images of the southern Badain Jaran (for location see Fig. 1). Sediment supply routes from the southern mountains (i.e., the intermittent stream channels) appear asbright linear forms on the radar images (red arrows). The images are from the ALOS/PALSAR instrument, and PALSAR data were provided by JAXA in the framework of the Kyoto &Carbon project (Rosenqvist et al., 2007).
115X. Yang et al. / Geomorphology 135 (2011) 108–116
Acknowledgements
The multinational collaborative research was funded by theNational Natural Science Foundation of China (grant no. 40930105),the CAS Strategic Priority Research Program (grant no. XDA05120502)and the National Aeronautics and Space Administration of the United
States (NASA Earth Science Enterprise to LAS under grants NAG13-03020 and NNS04AB25G). We thank the Chinese MeteorologicalAgency for providing wind data, the Institute of Geophysics, ChinaEarthquake Administration for technical support, Prof. Changcai Huaand Senior-Ing. Junrang Yang for field assistance and for help ininterpreting the gravity data, and Dr. Xinyan Fan for help in interpreting
116 X. Yang et al. / Geomorphology 135 (2011) 108–116
the wind data. We are very grateful to Prof. Zhenxing Yao andProf. Tianyao Hao for scientific advices about geophysical methods.Sincere thanks are extended to Prof. Nick Lancaster, Prof. Dirk Goossens,an anonymous reviewer and Editor Prof. Takashi Oguchi for theirconstructive comments on earlier drafts of this manuscript and foreditorial help.
References
Andreotti, B., Fourrière, A., Ould-Kaddour, F., Murray, B., Claudin, P., 2009. Giant aeoliandune size determined by the average depth of the atmospheric boundary layer.Nature 457, 1120–1123.
Annecchione, M., Chouteau, M., Keating, P., 2001. Gravity interpretation of bedrocktopography: the case of the Oak Ridges Moraine, southern Ontario, Canada. Journalof Applied Geophysics 47, 63–81.
Bagnold, R., 1941. Physics of Wind-Blown Sand and Desert Dunes. Methuen, London.Blumberg, D., 2006. Analysis of large aeolian (wind-blown) bedforms using the Shuttle
Radar Topography Mission (SRTM) digital elevation data. Remote Sensing ofEnvironment 100, 179–189.
Breed, C.S., Grow, T., 1979. Morphology and distribution of dunes in sand seas observedby remote sensing. In: McKee, E.D. (Ed.), A Study of Global Sand Seas. : GeologicalSurvey Professional Paper, Vol. 1052. U.S. Government Printing Office, Washington,pp. 253–302.
Bullard, J., 1997. A note on the use of the “Fryberger method” for evaluating potentialsand transport by wind. Journal of Sedimentary Research 67, 499–501.
Bullard, J., Livingstone, I., 2010. Classics in physical geography revisited — Wasson RJand Hyde R (1983) Factors determining desert dune types. Nature 304: 337–339.Progress in Physical Geography 34, 857–862.
Burger, H., Sheehan, A., Jones, C., 2006. Introduction to Applied Geophysics: Exploringthe Shallow Subsurface. Norton & Company Inc., New York.
Chen, J., Li, L., Wang, J., Barry, D., Sheng, X., Gu, W., Zhao, X., Chen, L., 2004. Groundwatermaintains dune landscape. Nature 432, 459–460.
Craddock, R., Hutchinson, M., Stein, J., 2010. Topographical data reveal a buried fluviallandscape in the Simpson Desert, Australia. Australian Journal of Earth Sciences 57,141–149.
Delgado-Fernandez, I., 2011. Meso-scale modelling of aeolian sediment input to coastaldunes. Geomorphology 130, 230–243.
Dobrin, M.B., 1976. Introduction to Geophysical Prospecting, 3rd ed. McGraw-Hill, NewYork.
Fleitmann, D., Burns, S., Pekala, M., Mangini, A., Al-Subbary, A., Al-Aowah, M., Kramers,J., Matter, A., 2011. Holocene and Pleistocene pluvial periods in Yemen, southernArabia. Quaternary Science Reviews 30, 783–787.
Fryberger, S., Dean, G., 1979. Dune forms and wind regime. In: McKee, E. (Ed.), A Studyof Global Sand Seas: United States Geological Survey Professional Paper, 1052, pp.137–169. Washington.
Goossens, D., 1997. Long-term aeolian loess accumulationmodelled in the wind tunnel:the Molenberg case (central loess belt, Belgium). Zeitschrift für Geomorphologie41, 115–129.
Goudie, A., 2002. Great Warm Deserts of the World. Oxford University Press Inc., NewYork.
Grandjean,G., Paillou, P., Dubois-Fernandez, P., August-Bernex, T., Baghdadi, N., Achache, J.,2001. Subsurface structures detection by combining L-bandpolarimetric SAR andGPRdata: example of thePylaDune (France). IEEETransactions onGeoscience andRemoteSensing 39, 1245–1258.
Hamdi-Nasr, I., Inoubli, M., Salem, A., Tlig, S., Mansouri, A., 2009. Gravity contributionsto the understanding of salt tectonics from the Jebel Cheid area (dome zone,Northern Tunisia). Geophysical Prospecting 57, 719–728.
Hammer, S., 1939. Terrain corrections for gravimeter stations. Geophysics 4, 184–194.Hartmann, K., Wünnemann, B., 2009. Hydrological changes and Holocene climate
variations in NW China, inferred from lake sediments of Juyanze palaeolake byfactor analyses. Quaternary International 194, 28–44.
Hofmann, J., Geyh, M.A., 1998. Untersuchungen zum 14C-Reservoir Effekt an rezentenund fossilen lakustrinen Sedimenten aus dem Südosten der Badain Jaran Wüste(Innere Mongolei/VR China). Berliner Geographische Abhandlungen 63, 83–98.
Hövermann, J., 1998. Zur Paläoklimatologie Zentralasiens – quantitative Bestimmungvon Paläoniederschlag und -temperatur. Petermanns Geographische Mitteilungen142, 251–257.
Hugenholtz, C., Barchyn, T., 2010. Spatial analysis of sand dunes with a new globaltopographic dataset: new approaches and opportunities. Earth Surface Processesand Landforms 35, 986–992.
Jäkel, D., 1996. The Badain Jaran Desert: its origin and development. Geowissenschaften14, 272–274.
Kocurek, G., Lancaster, N., 1999. Aeolian system sediment state: theory and MojaveDesert Kelso dune field example. Sedimentology 46, 505–515.
Lancaster, N., 1995. Geomorphology of Desert Dunes. Routledge, London.Lancaster, N., 2006. Linear dunes on Titan. Science 312, 702–703.Lees, B., 2006. Timing and formation of coastal dunes in northern and eastern Australia.
Journal of Coastal Research 22, 78–89.Lennox, D., Carlson, V., 1967. Geophysical exploration for buried valleys in an area north
of two hills Alberta. Geophysics 32, 331–362.Li, B., Gao, Q., Yan, M., Li, Y., Zhong, G., Wen, X., 2005. A recent study on sedimentary
sequence of southeastern Badain Jaran Desert since 150 ka BP. Journal of DesertResearch 25, 457–465 (in Chinese with English Abstract).
Livingstone, I., Wiggs, G., Weaver, C., 2006. Geomorphology of desert sand dunes: areview of recent progress. Earth-Science Reviews 80, 239–257.
Lorenz, R.D., Radebaugh, J., 2009. Global pattern of Titan's dunes: radar survey from theCassini prime mission. Geophysical Research Letters 36, L03202.
Narteau, C., Zhang, D., Rozier, O., Claudin, P., 2009. Setting the length and time scales ofa cellular automaton dune model from the analysis of superimposed bed forms.Journal of Geophysical Research 114, F03006.
Parteli, E.J.R., Durán, O., Tsoar, H., Schwämmle, V., Hermann, H., 2009. Dune formationunder bimodal winds. PNAS 106, 22,085–22,089.
Richthofen, F., 1877. China: Ergebnisse Eigener Reisen und darauf Gegründeter Studien.Erster Band. Reimer, Berlin.
Rosenqvist, A., Shimada, M., Ito, N., Watanabe, M., 2007. ALOS PALSAR: a pathfindermission for global-scale monitoring of the environment. IEEE Transactions onGeoscience and Remote Sensing 45, 3307–3316.
Rubin, D.M., Hesp, P.A., 2009. Multiple origins of linear dunes on Earth and Titan. NatureGeoscience 2, 653–658.
Weissmann, G.S., Hartley, A.J., Nichols, G., Scuderi, L.A., Olson, M., Buehler, H., Banteah,R., 2010. Fluvial form in modern continental sedimentary basins: DistributiveFluvial System. Geology 38, 39–42.
Yang, X., 1991. Geomorphologische Untersuchungen in Trockenräumen NW-Chinasunter besonderer Berücksichtigung von Badanjilin und Takelamagan. GöttingerGeographische Abhandlungen 96, 1–124.
Yang, X., 2006. Chemistry and late Quaternary evolution of ground and surface watersin the area of Yabulai Mountains, western Inner Mongolia, China. Catena 66,135–144.
Yang, X., Liu, T., Xiao, H., 2003. Evolution of megadunes and lakes in the Badain JaranDesert, Inner Mongolia, China during the last 31000 years. Quaternary Interna-tional 104, 99–112.
Yang, X., Ma, N., Dong, J., Zhu, B., Xu, B., Ma, Z., Liu, J., 2010a. Recharge to the inter-dunelakes and Holocene climatic changes in the Badain Jaran Desert, western China.Quaternary Research 73, 10–19.
Yang, X., Liu, T., Yuan, B., 2010b. The Loess Plateau of China: aeolian sedimentation andfluvial erosion, both with superlative rates. In: Migon, P. (Ed.), GeomorphologicalLandscapes of the World. Springer, Dordrecht, pp. 275–282.
Yao, C., 2009. MASK 2000 — A Computer Program for Geophysical Modeling (RevisedVersion). China University of Geosciences, Beijing.
Zandbergen, P., 2008. Applications of Shuttle Radar Topography Mission elevation data.Geography Compass 2 (5), 1404–1431.
Zhang, D., Narteau, C., Rozier, O., 2010. Morphodynamics of barchan and transversedunes using a cellular automaton model. Journal of Geophysical Research 115,F03041.
Zhu, Z., Wu, Z., Liu, S., Di, X., 1980. An Outline of Chinese Deserts. Science Press, Beijing.(in Chinese).
Zhu, Z., Chen, Z., Wu, Z., Li, J., Li, B., Wu, G., 1981. Study on the Geomorphology of Wind-drift Sands in the Taklamakan Desert. Science Press, Beijing. (in Chinese).
Zimbelman, J., 2010. Transverse aeolian ridges on Mars: first results from HiRISEimages. Geomorphology 121, 22–29.

![Eureka Dunes [Death Valley National Park] · 2018-12-20 · Tag 270 - 12.12.18 - Mittwoch: Eureka Dunes [10 km, 340 Hm] Seite 60 Die Eureka Dunes liegen im Norden des Death Valley](https://img.pdfslide.org/doc/110x75/5e6119ddfde06e479b68cb3c/eureka-dunes-death-valley-national-park-2018-12-20-tag-270-121218-mittwoch.jpg)