Embed Size (px)
Citation preview
Integ
rated
Food
Scien
ce
Glycemic Index and Microstructure Evaluation ofFour Cereal Grain FoodsMookambika RamyaBai, Nicole M. Wedick, Shobana Shanmugam, Kokila Arumugam, Lakshmipriya Nagarajan,Kavitha Vasudevan, Geetha Gunasekaran, Gayathri Rajagopal, Donna Spiegelman, Vasanti Malik, Ranjit Mohan Anjana,Frank B. Hu, Ranjit Unnikrishnan, Walter Willett, Nagappa Malleshi, Marina A. Njelekela, Dorothy Gimbi,Kamala Krishnaswamy, CJK Henry , Viswanathan Mohan, and Vasudevan Sudha
Abstract: To determine the glycemic index (GI) of selected cereals and association with their microstructure. The GIof whole grain pilaf (WGP), instant brown rice (IBR), whole maize ugali (MWU), and refined maize ugali (RMU) wasassessed in a randomized trial. Fourteen healthy participants with mean age of 25 years were administered 50 g portionsof available carbohydrates from glucose and various test foods after an overnight fast on separate occasions. Capillaryblood samples of participants were used to measure blood glucose over 2 hr. The GI was calculated as per standardprotocol. The microstructure of test foods, determined by scanning electron microscopy was evaluated to understand themeasured GI values. The GI (mean ± standard error) of IBR was the highest (87.8 ± 6.8) followed by RMU (74.7 ± 6.5)and WMU (71.4 ± 5.1). WGP had medium GI (58.9 ± 5.1; P < 0.01 vs. IBR). Microstructure examination of IBRrevealed disruption of bran layer and presence of fissures indicating loss of intactness of bran. Stereozoom images for WGPrevealed intact bran and germ. For RMU and WMU, the grain was milled leading to loss of integrity. IBR, RMU, andWMU have high GI values, which is likely due to disruption of bran layer, endosperm modification (IBR), and loss ofgrain matrix (WMU, RMU). WGP has medium GI probably due to fairly intact bran and germ.
Keywords: food processing, grain matrix, microstructure, refined flour, stereozoom, whole grains
Practical Application: Wholegrain or whole meal flour may not necessarily be low in glycemic index (GI; low GI < 55;medium 55 to 69 and high GI �70). “Ugali” a commonly consumed cereal staple food in Tanzania made from eitherrefined or whole meal maize flour was found to be a high GI food. Intact whole grain foods, such as whole grain pilaf(mixed intact whole grains) is a healthier alternative to milled whole grains such as whole meal maize flour. Instant quickcooking brown rice exhibited a high GI, due to the processing method, suggesting that regular brown rice may be ahealthier option.
IntroductionDietary carbohydrates are the primary source of blood glucose.
The concept of the glycemic index (GI), introduced by Jenkinset al. (1981), is established as a useful tool to assess the quality ofcarbohydrates in foods. Foods with high GI values elicit a higherpeak in postprandial blood glucose during the first 2 hr afterconsumption of a meal (Foster-Powell, Holt, & Brand-Miller,2002). Studies have shown a positive association between high GIand glycemic load (GL) diets and the risk of chronic diseases such as
JFDS-2019-0581 Submitted 5/17/2019, Accepted 10/14/2019. Authors are withRamyaBai, Shanmugam, Arumugam, Nagarajan, Vasudevan, Gunasekaran, Ra-jagopal, Anjana, Unnikrishnan, Malleshi, Anjana, Unnikrishnan, Malleshi, Krish-naswamy, Mohan, Sudha are with Madras Diabetes Research Foundation, Dr. Mohan’sDiabetes Specialities Centre, WHO Collaborating Centre for Non-Communicable Dis-eases, Gopalapuram, Chennai, India. Author Spiegelman is with Dept. of Biostatistics,Harvard T.H. Chan School of Public Health, Boston, MA, USA. Authors Spiegel-man, Hu, and Willett are with Dept. of Epidemiology, Harvard T.H. Chan Schoolof Public Health, Boston, MA, USA. Authors are with Wedick, Malik, Hu, andWillett are with Dept. of Nutrition, Harvard T.H. Chan School of Public Health,Boston, MA, USA. Author Njelekela is with Dept. of Physiology, Muhimbili Univ. ofHealth and Allied Sciences, Dar es Salaam, Tanzania. Author Gimbi is with Dept. ofFood Science and Nutrition, Sokoine Univ. of Agriculture, Morogoro, Tanzania. Au-thor Henry is with Clinical Nutritional Sciences, Singapore Inst. for Clinical Sciences,Brenner Centre for Molecular Medicine, Medical Drive, Singapore. Direct inquiries toauthor Sudha (Email: [email protected]).
type 2 diabetes (T2DM) and cardiovascular disease (Bhupathirajuet al., 2014; Liu et al., 2000). A meta-analysis on low GI diets inthe management of diabetes showed that replacing conventionalor high GI foods with low GI foods could have clinical advantageon glycemic control (Brand-Miller, Hayne, Petocz, & Colagiuri,2003).
Cereals form the main staple of diets in most parts of theworld, contributing more than 50% of daily dietary calories(Awika, 2011). Refined cereals such as white rice tend to exhibithigh GI values compared with whole grains such as brown rice(Shobana et al., 2011, 2017), which are associated with a lowerrisk of T2DM (Sun et al., 2010). A healthier approach wouldbe to replace refined carbohydrates (refined grains) with intactwholegrains to reduce the GI and GL of the food/meal/diet(Augustin et al., 2015; Jenkins et al., 2014). Intactness of thenatural grains matrix and the change in the microstructure createdduring processing (disruption) can be evaluated by microscopictechnique (Parada & Santos, 2016) to better understand themeasured GI of various grains. Implementing a diet that is rich inwhole grains (preferably intact) in place of refined grains could bea cost-effective, feasible, and a sustainable approach for diabetesprevention, especially in low- and middle-income countriesundergoing epidemiological transition (Malik et al., 2019; Matteiet al., 2015; Augustin et al., 2015; Mohan et al., 2014; Hu, Pan,Malik, & Sun, 2012).
C© 2019 Institute of Food Technologists R©doi: 10.1111/1750-3841.14945 Vol. 84, Iss. 12, 2019 � Journal of Food Science 3373Further reproduction without permission is prohibited
IntegratedFoodScience
GI of multigrain pilaf, brown rice, and ugali . . .
This premise led to the development of the Global Nutritionand Epidemiology Transition (GNET) initiative, a collaborativeresearch project launched by researchers from the Departments ofEpidemiology and Nutrition at the Harvard T.H. Chan Schoolof Public Health along with nutrition and diabetes investigatorsacross the globe, with the ultimate goal of helping prevent theglobal diabetes epidemic by improving the carbohydrate quality ofstaple foods. Hence, low- and middle-income countries with earlyand ongoing epidemiological transition such as Africa (Tanzania,Nigeria, Kenya), Costa Rica, Puerto Rico, Mexico, Brazil, Iran,India, and Malaysia, were included in the GNET countries. As partof the GNET initiative, to understand the glycemic propertiesof the local traditional cereal staples choices in these countriesand also the contemporary newer whole grain products in themarket, the four cereal grains were chosen-“Ugali” with refinedand whole grain maize flour, multigrain whole grain “KhashiPilaf” and “Instant Brown Rice.” Determining the glycemic indexof these grains will enable us to plan subsequent proof-of-conceptdietary intervention studies by replacing refined grains with wholegrains and foods with reduced glycemic index and glycemic loadfor prevention of diabetes. This study focuses on the estimationof GI of selected cereal staples of interest to the GNET countries;and microscopy evaluation was further considered to understandthe relation between GI and food microstructure.
Materials and Methods
SubjectsHealthy participants ages 18 to 45 years were recruited from
the volunteer registry of the Glycemic Index Testing Centre atthe Madras Diabetes Research Foundation (MDRF) in Chen-nai, India. Overweight and obesity [body mass index (BMI)�23.0 kg/m2 as per the Asia Pacific guidelines (WHO, 2000), useof any special diets for therapeutic or other purposes, family historyof diabetes, chronic illnesses like CVD, hypertension, cancer, etc.,pregnancy and lactation, history of food allergy, concurrent use ofany medications (Ranawana, Henry, 2011; Radhika et al., 2010)and fasting blood glucose value >5.6 mmol/L (100 mg/dL) wereconsidered as the exclusion criteria (Alberti & Zimmet, 1998). Atotal of 15 participants meeting the inclusion criteria volunteeredto participate in the study.
Anthropometric measurements including height, weight, andwaist circumference were taken in the fasting state using stan-dardized techniques (Deepa et al., 2003). The study was con-ducted according to the guidelines outlined in the Declaration ofHelsinki, and was approved by the Ethics Committee of MadrasDiabetes Research Foundation (MDRF). All subjects gave writ-ten informed consent before participation. The study has beenregistered in the Clinical Trial Registry of India (CTRI) and thereference number is REF/2016/11/012671.
Test foodsFour foods were selected for this study: (1) Kashi 7 whole grain
pilaf (WGP, a blend of minimally processed whole grains which in-clude oats, long grain brown rice, rye, hard red winter wheat, trit-icale, buckwheat, barley and sesame seeds cooked to a semi-solidsofter texture porridge; commercial market sample); (2) instantbrown rice (IBR, Uncle Ben’s Whole Grain Fast & Natural In-stant Brown Rice [commercial market sample]); (3) refined maizeugali (RMU, stiff porridge made from refined maize flour andconsumed as a staple in Tanzania and many other parts of EastAfrica); (4) and whole maize ugali (WMU, a whole grain version
of the typically consumed staple made from whole maize milledflour). The available carbohydrate contents of these food sampleswere determined using an enzymatic kit (Megazyme Limited, Ire-land which adopts AOAC 2017.16 method for dietary fiber andAOAC 999.03 for sucrose) (AOAC, 2016). The macronutrientcompositions were determined by standard American Associationof Cereal Chemists methods (AACC 2000). Dietary fiber con-tent was analyzed as per the method of Asp, Johansson, Hallmer,and Siljestroem (1983), and amylose concentration was estimatedusing the methods of Sowbhagya and Bhattacharya (1979). Theamount of available carbohydrate was standardized in all test foods.Participants were provided with a standard portion of test foodscontaining 50 g of available carbohydrate. The available carbohy-drate content (per 100 g) of WMU, RMU, IBR, and WGP were72, 79, 68, and 65 g, respectively (Table 1). WMU and RMUwere prepared using standard cooking methods whereas IBR andWGP were prepared using the cooking instructions provided onthe food label as shown in Table 2.
Experimental protocolIt is a randomized control study, where the participants were ran-
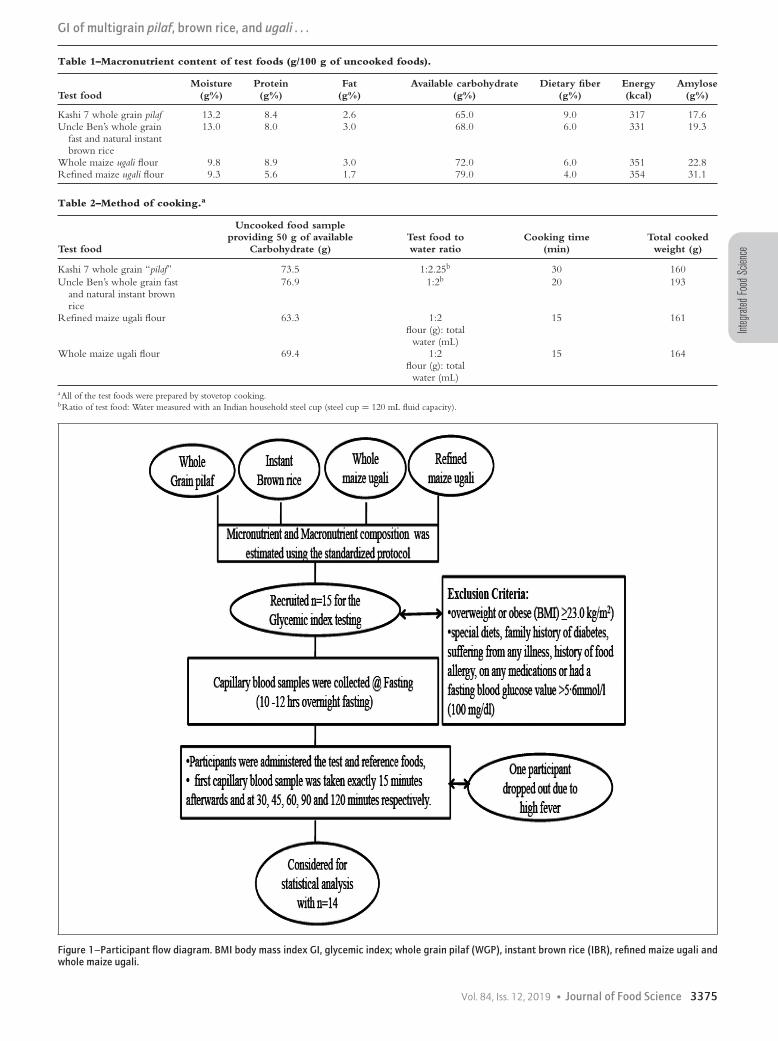
domized using computer-generated randomized tables and weregiven the test food accordingly. The reference food trial was per-formed at the first, last, and middle of the sequence of the testfoods. The GI protocol was adopted from Brouns et al. (2005)and is in agreement with the procedure recommended by theFAO/WHO. (1998). The protocol was validated with an inter-national laboratory that was involved in an inter laboratory study(Wolever et al., 2008) reported elsewhere (Henry et al., 2008). Par-ticipants visited the GI testing centre each day in the morning aftera 10- to 12-hr overnight fast. An interviewer-administered ques-tionnaire with details on the previous day’s meals (24-hr dietaryrecall), physical activity, smoking, and consumption of alcoholand caffeine-containing drinks was administered to the partici-pants. Participants were instructed to adhere to their habitual mealpattern on the days prior to the administration of the test foods,and to refrain from any intense physical activity, smoking and con-sumption of alcohol during the entire period of the study. Fastingcapillary blood glucose was estimated twice at an interval of lessthan 5 min before consumption of the test foods, and the meanof these values served as the baseline value. A Hemocue 201+glucose analyzer (Hemocue Ltd., Sweden) was used for the mea-surement of blood glucose. It has been previously validated withthe YSI Stat 2300 glucose analyzer, which is considered the goldstandard and a reliable method for the measurement of blood glu-cose (Ranawana, Henry, 2011). Once the fasting blood glucosewas estimated, the participants were administered the test food(with the time of first bite considered as 0 min), and the firstcapillary blood sample was taken exactly 15 min afterwards. Cap-illary blood samples were further collected at 30, 45, 60, 90, and120 min. Participants were provided with 200 mL of water alongwith the test food and an additional 200 mL of water was givenduring the subsequent 2 hr (Figure 1).
Reference foodThe reference food was 55 g of dextrose (glucose monohydrate-
Glucon-D glucose powder, Heinz India (P) Ltd., Mumbai, India)dissolved in 200 mL of water. The reference food was consumedat the beginning, middle, and end of the test food testing pe-riod (three visits: days 1, 4, 7). The four test foods (four visits:days 2, 3, 5, 6) were consumed in random order with at least a
3374 Journal of Food Science � Vol. 84, Iss. 12, 2019
Integ
rated
Food
Scien
ce
GI of multigrain pilaf, brown rice, and ugali . . .
Table 1–Macronutrient content of test foods (g/100 g of uncooked foods).
Moisture Protein Fat Available carbohydrate Dietary fiber Energy AmyloseTest food (g%) (g%) (g%) (g%) (g%) (kcal) (g%)
Kashi 7 whole grain pilaf 13.2 8.4 2.6 65.0 9.0 317 17.6Uncle Ben’s whole grain
fast and natural instantbrown rice
13.0 8.0 3.0 68.0 6.0 331 19.3
Whole maize ugali flour 9.8 8.9 3.0 72.0 6.0 351 22.8Refined maize ugali flour 9.3 5.6 1.7 79.0 4.0 354 31.1
Table 2–Method of cooking.a
Test food
Uncooked food sampleproviding 50 g of available
Carbohydrate (g)Test food towater ratio
Cooking time(min)
Total cookedweight (g)
Kashi 7 whole grain “pilaf” 73.5 1:2.25b 30 160Uncle Ben’s whole grain fast
and natural instant brownrice
76.9 1:2b 20 193
Refined maize ugali flour 63.3 1:2flour (g): total
water (mL)
15 161
Whole maize ugali flour 69.4 1:2flour (g): total
water (mL)
15 164
aAll of the test foods were prepared by stovetop cooking.bRatio of test food: Water measured with an Indian household steel cup (steel cup = 120 mL fluid capacity).
Figure 1–Participant flow diagram. BMI body mass index GI, glycemic index; whole grain pilaf (WGP), instant brown rice (IBR), refined maize ugali andwhole maize ugali.
Vol. 84, Iss. 12, 2019 � Journal of Food Science 3375
IntegratedFoodScience
GI of multigrain pilaf, brown rice, and ugali . . .
2-day interval between measurements to reduce potential carry-over effects (Brouns et al., 2005).
Calculation of the GIThe incremental area under the blood glucose response curves
(IAUC) of the test and reference foods were calculated geometri-cally using the trapezoid rule ignoring the area beneath baseline(Brouns et al., 2005). The GI was calculated as the IAUC of a50 g available carbohydrate portion of the test food expressed as apercent of the response to the same amount of carbohydrate fromthe reference food taken by the same volunteer.
Microscopic examinationThe IBR kernels were broken open to expose the inner anatom-
ical parts of the grain, mounted on metallic stubs with the aid ofa double-sided scotch tape and gold coated (about 100Ao) in aKSE 2 AM evaporation Seevac gold sputter (Polaron SEM Sput-ter Coating System, Hertfordshire, UK). To compare the mor-phological features, parboiled brown rice (BPT variety, paddysoaked overnight in cold water, steamed at atmospheric pressurefor 10 min, dried to 12% moisture, shelled in a rubber roll sheller)was also examined by microscopy as a reference. The samples werescanned using the Carl Zeiss MA15/EVO 18 Scanning ElectronMicroscope. The bran, aleurone layer of the endosperm, the innerendosperm with special reference to the granular organization ofthe starch, and the topography of the rice kernels were examinedand photographed at different magnifications. Similarly, WMUand RMU flour samples were sprinkled and mounted on metallicstubs and observed using microscopy for the nature of starch andpresence or absence of the maize seed coat matter.
All samples were viewed by both scanning electron microscopeand stereozoom microscope (Optika, Italy) to study the structuralfeatures under high and lower magnifications. However, it wasnot possible to view WGP by scanning electron microscope dueto the mixture of multi whole grains. The microscope analysiswas included in this study to enhance the interpretation of the GIvalues of the test foods.
Statistical analysisOf the 15 participants recruited, one dropped out due to un-
related health issues and thus data from 14 participants were con-sidered for the GI estimation and analysis. Descriptive character-istics of the study participants were calculated as mean ± standarddeviation for continuous variables and percentages for categoricalvariables. The GI values were calculated using an in-house GI soft-ware based on the method recommended by FAO/WHO (1998).The IAUC mean ± standard error for the reference and four testfoods were calculated. Mean differences between the GI of testfoods were tested using one-way analysis of variance as the datawas normally distributed. Differences in GI between WGP ver-sus IBR/WMU/RMU; IBR versus WMU/RMU; WMU versusRMU were evaluated using paired t-tests. Statistical significancewas determined at an alpha level of 0.05. Statistical analysis wasperformed with SAS software (version 9.1; SAS Inst., Cary, NC,USA).
ResultsThe RMU contained the highest amount of available carbohy-
drate (79 g%) followed by WMU (72 g%), IBR (68 g%), and WGP(65 g%). The reverse order was observed for unavailable carbohy-drate or dietary fiber with WGP containing 9 g%, whereas bothIBR and WMU contained 6 g% of fiber and RMU, only 4 g%.
Table 3–Demographic and clinical characteristics of the studyparticipants
Characteristics Mean
Age (years)a 24.6 ± 0.7Male (n%)b 64Female (n%) b 36Height (cm) b 164 ± 2.6Weight (kg) b 55.3 ± 1.7Body mass index (kg/m2)a 20.3 ± 0.4Body fat (%) b 20.64 ± 7.94Waist circumference (cm) b 73.36 ± 8.36Blood pressure systolic (mmHg) b 111.1 ± 12.6Diastolic (mmHg) b 66.1 ± 8.2Fasting blood glucose mmol/Lb 87.0 ± 8.0
aStandard deviation.bStandard error.
Table 4–Mean IAUC and GI of the test foods (n = 14)
Test foods
IAUC mmol/min mean
(SEM)GIa mean
(SEM)GI
classificationb
Kashi 7 whole grainpilaf
181.5 ± 20.8 58.9 ± 5.1 Medium
Uncle Ben’s wholegrain fast andnatural instantbrown rice
266.3 ± 25.6 87.8 ± 6.8 High
Whole maize ugaliflour
212.5 ± 16.7 71.4 ± 5.1 High
Refined maize ugaliflour
221.3 ± 20.2 74.7 ± 6.5 High
IAUC, incremental area under the curve; GI, glycemic index.aReference GI (Glucose) = 100.bGI classification: Low GI � 55; medium GI = 56–69; high GI �70, P value fromanalysis of variance 0.012.
The amylose content was highest in RMU (31.1%) compared toWMU (22.8%), IBR (19.3%), and WGP (17.6%; Table 1).
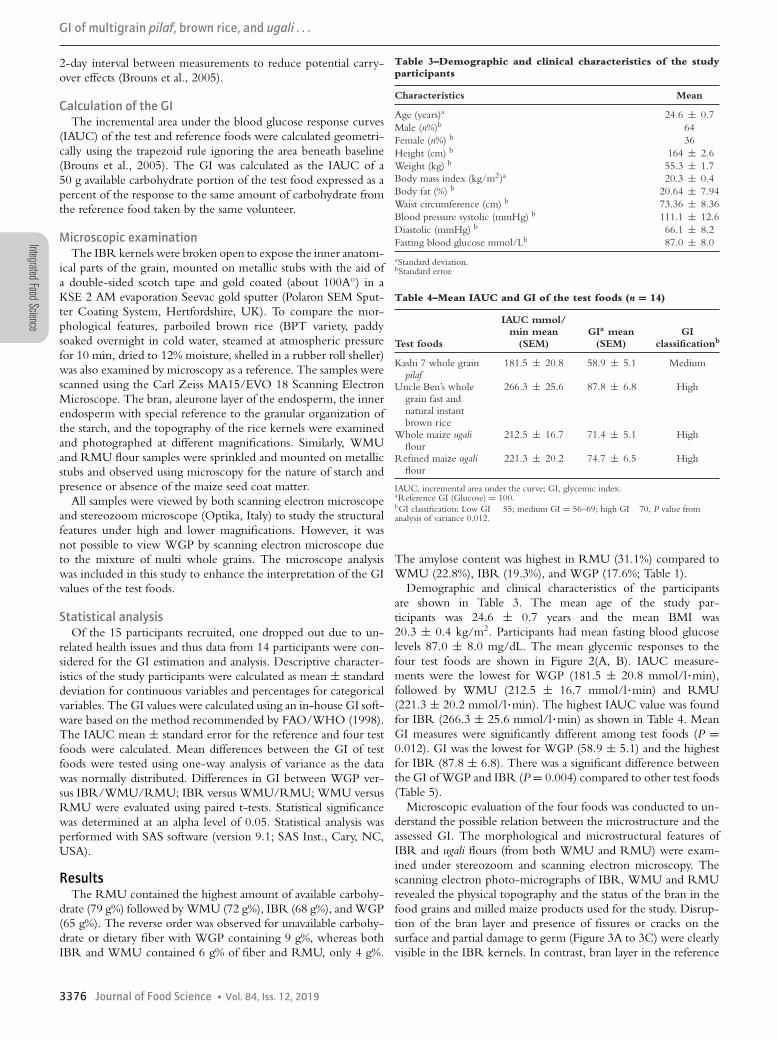
Demographic and clinical characteristics of the participantsare shown in Table 3. The mean age of the study par-ticipants was 24.6 ± 0.7 years and the mean BMI was20.3 ± 0.4 kg/m2. Participants had mean fasting blood glucoselevels 87.0 ± 8.0 mg/dL. The mean glycemic responses to thefour test foods are shown in Figure 2(A, B). IAUC measure-ments were the lowest for WGP (181.5 ± 20.8 mmol/l�min),followed by WMU (212.5 ± 16.7 mmol/l�min) and RMU(221.3 ± 20.2 mmol/l�min). The highest IAUC value was foundfor IBR (266.3 ± 25.6 mmol/l�min) as shown in Table 4. MeanGI measures were significantly different among test foods (P =0.012). GI was the lowest for WGP (58.9 ± 5.1) and the highestfor IBR (87.8 ± 6.8). There was a significant difference betweenthe GI of WGP and IBR (P = 0.004) compared to other test foods(Table 5).
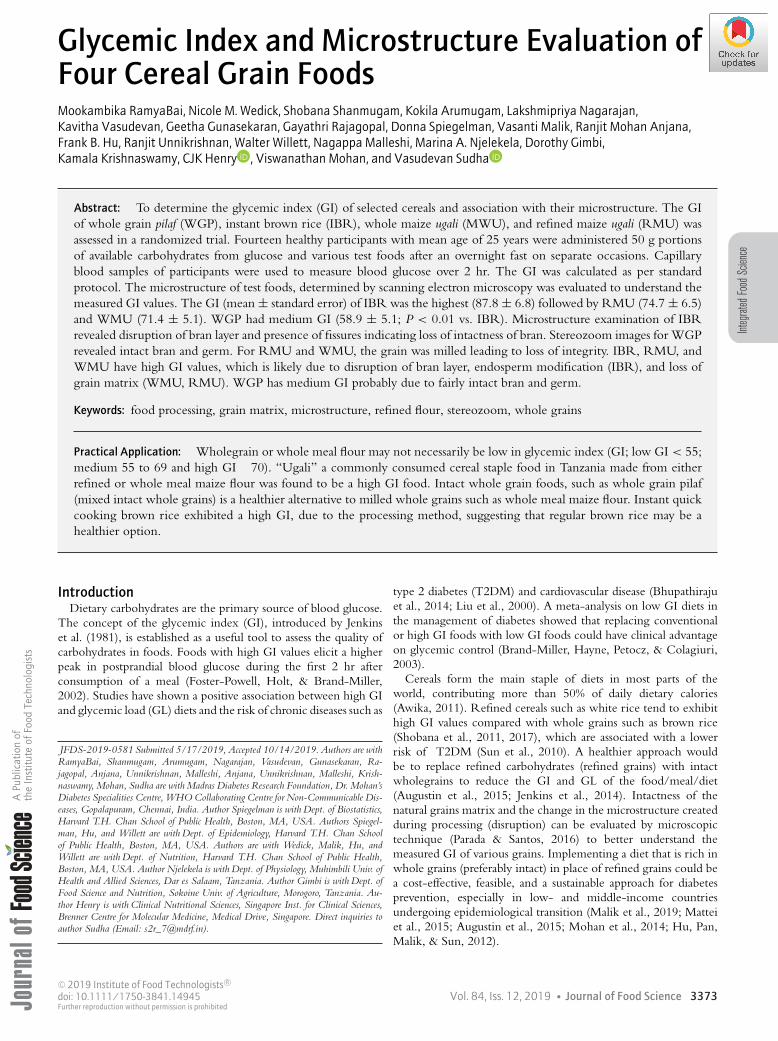
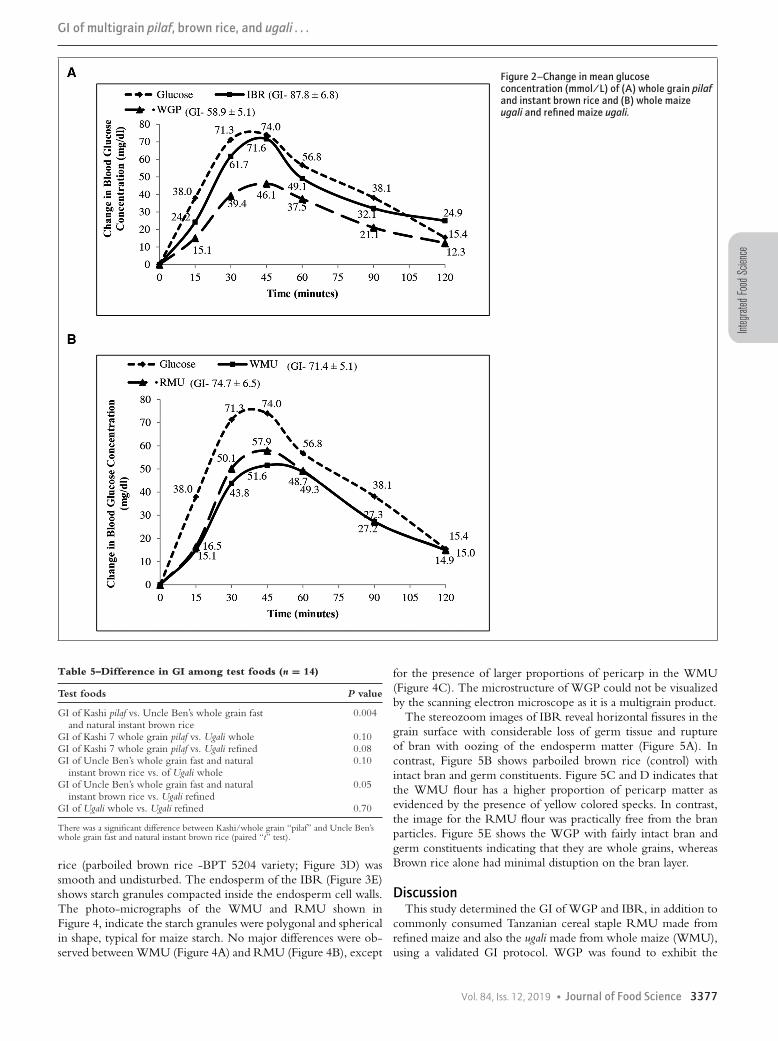
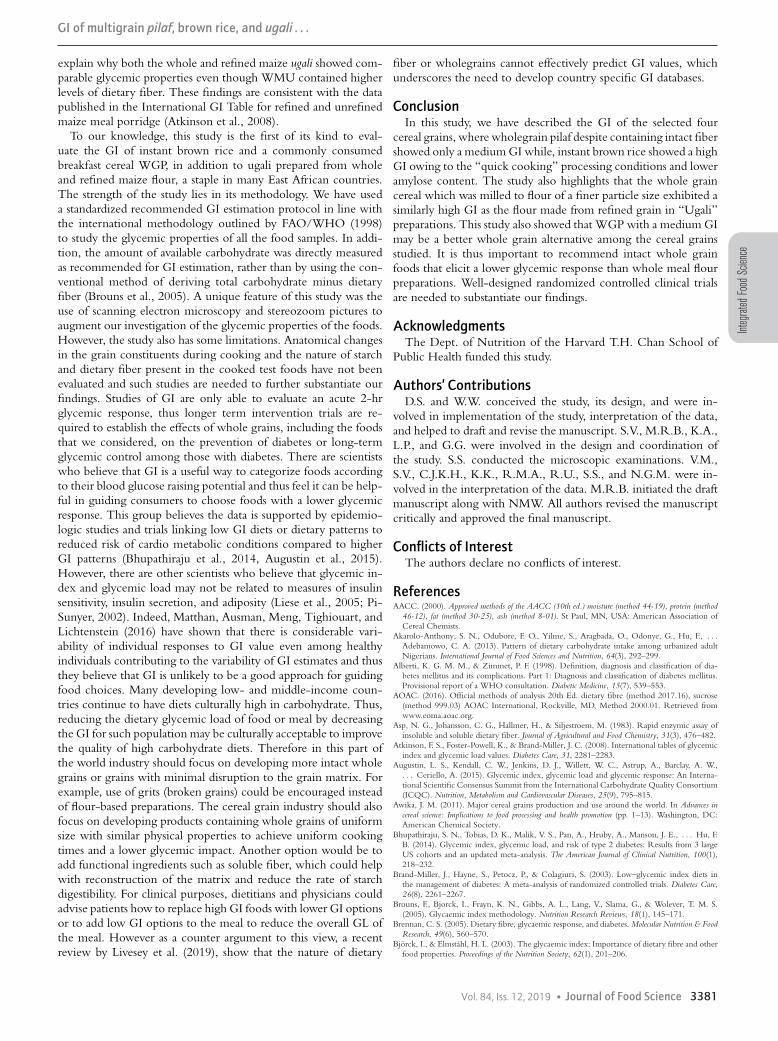
Microscopic evaluation of the four foods was conducted to un-derstand the possible relation between the microstructure and theassessed GI. The morphological and microstructural features ofIBR and ugali flours (from both WMU and RMU) were exam-ined under stereozoom and scanning electron microscopy. Thescanning electron photo-micrographs of IBR, WMU and RMUrevealed the physical topography and the status of the bran in thefood grains and milled maize products used for the study. Disrup-tion of the bran layer and presence of fissures or cracks on thesurface and partial damage to germ (Figure 3A to 3C) were clearlyvisible in the IBR kernels. In contrast, bran layer in the reference
3376 Journal of Food Science � Vol. 84, Iss. 12, 2019
Integ
rated
Food
Scien
ce
GI of multigrain pilaf, brown rice, and ugali . . .
Figure 2–Change in mean glucoseconcentration (mmol/L) of (A) whole grain pilafand instant brown rice and (B) whole maizeugali and refined maize ugali.
Table 5–Difference in GI among test foods (n = 14)
Test foods P value
GI of Kashi pilaf vs. Uncle Ben’s whole grain fastand natural instant brown rice
0.004
GI of Kashi 7 whole grain pilaf vs. Ugali whole 0.10GI of Kashi 7 whole grain pilaf vs. Ugali refined 0.08GI of Uncle Ben’s whole grain fast and natural
instant brown rice vs. of Ugali whole0.10
GI of Uncle Ben’s whole grain fast and naturalinstant brown rice vs. Ugali refined
0.05
GI of Ugali whole vs. Ugali refined 0.70
There was a significant difference between Kashi/whole grain “pilaf” and Uncle Ben’swhole grain fast and natural instant brown rice (paired “t” test).
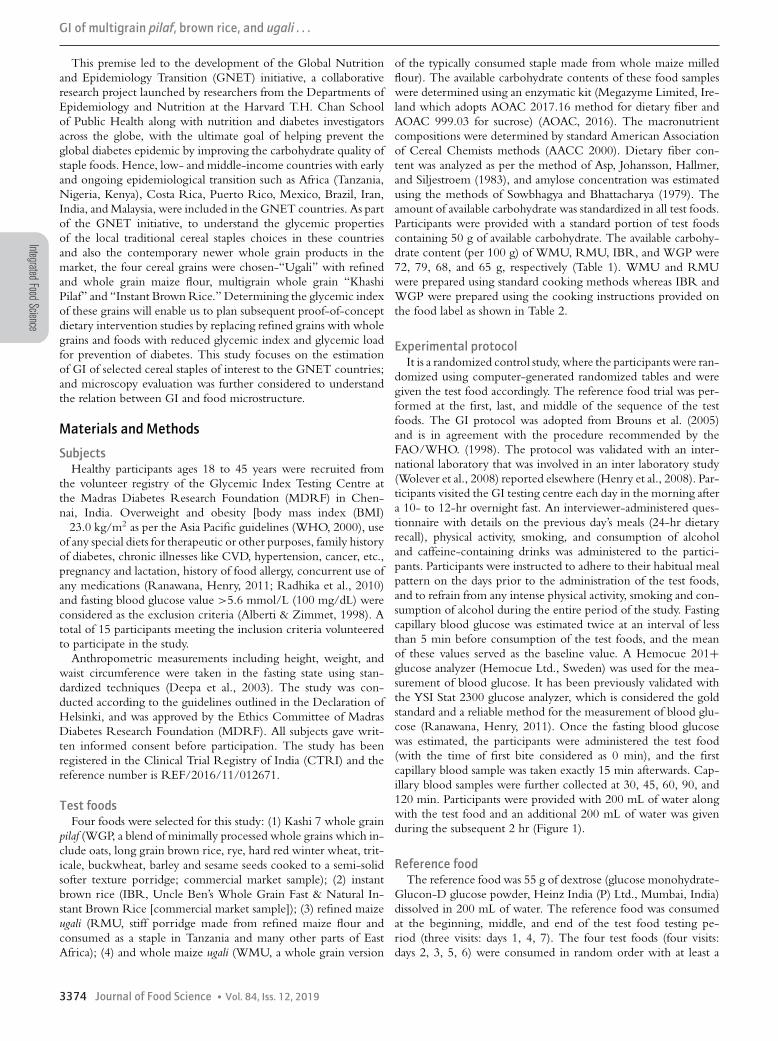
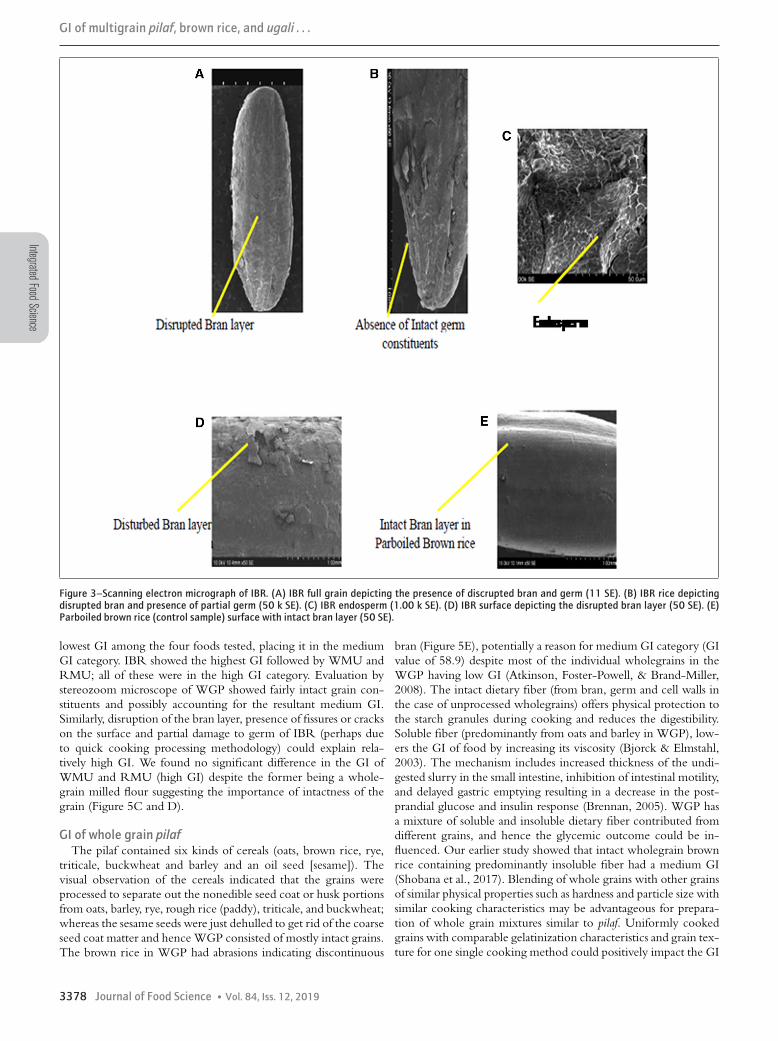
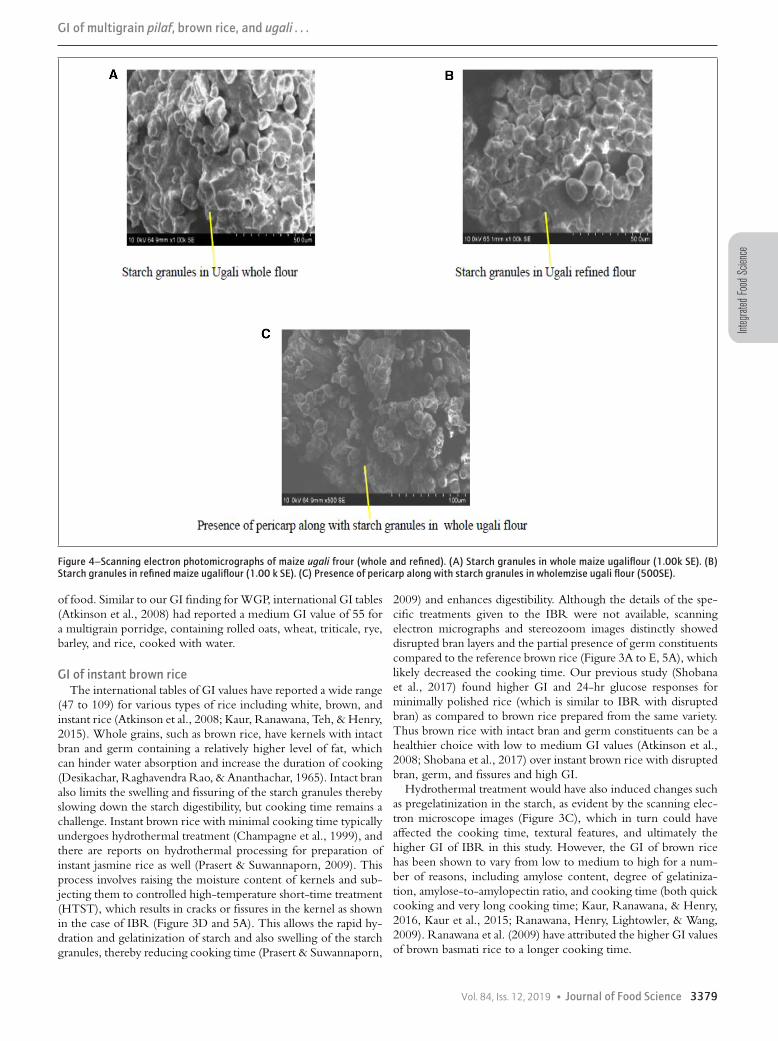
rice (parboiled brown rice -BPT 5204 variety; Figure 3D) wassmooth and undisturbed. The endosperm of the IBR (Figure 3E)shows starch granules compacted inside the endosperm cell walls.The photo-micrographs of the WMU and RMU shown inFigure 4, indicate the starch granules were polygonal and sphericalin shape, typical for maize starch. No major differences were ob-served between WMU (Figure 4A) and RMU (Figure 4B), except
for the presence of larger proportions of pericarp in the WMU(Figure 4C). The microstructure of WGP could not be visualizedby the scanning electron microscope as it is a multigrain product.
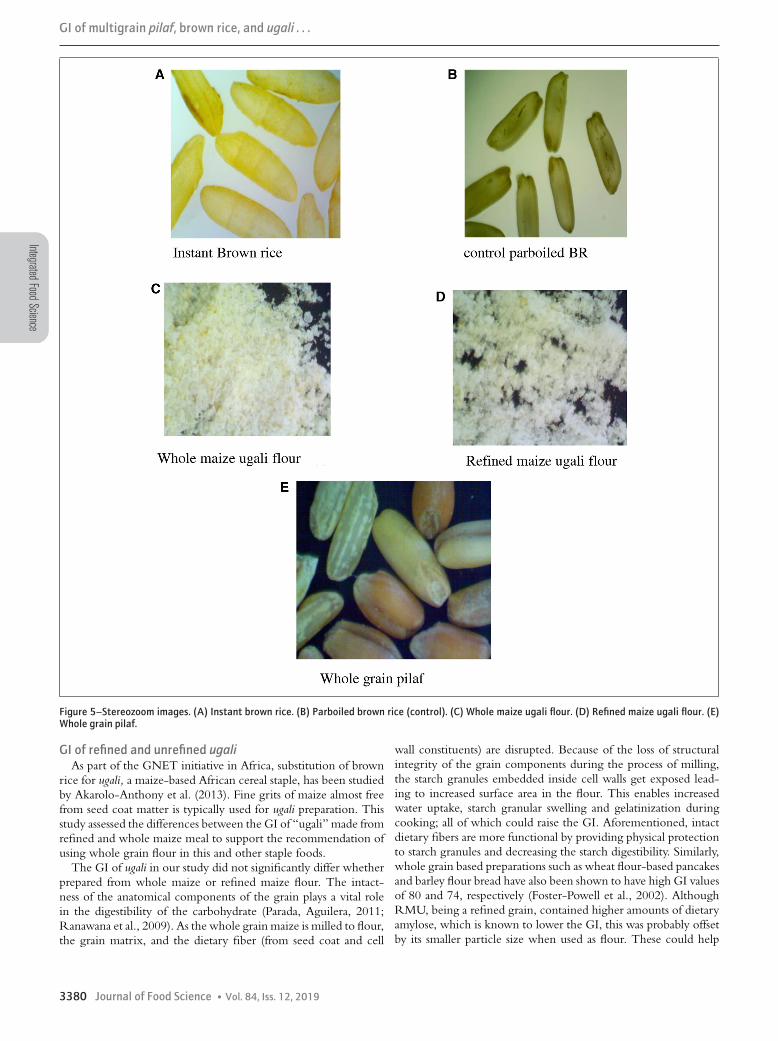
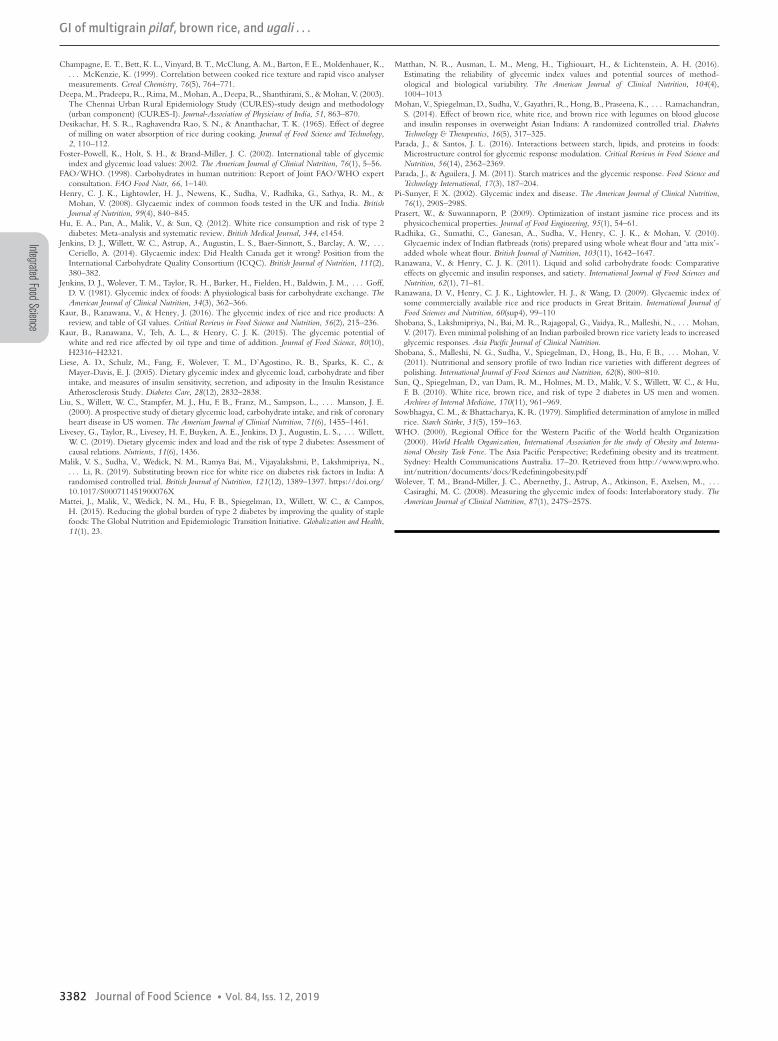
The stereozoom images of IBR reveal horizontal fissures in thegrain surface with considerable loss of germ tissue and ruptureof bran with oozing of the endosperm matter (Figure 5A). Incontrast, Figure 5B shows parboiled brown rice (control) withintact bran and germ constituents. Figure 5C and D indicates thatthe WMU flour has a higher proportion of pericarp matter asevidenced by the presence of yellow colored specks. In contrast,the image for the RMU flour was practically free from the branparticles. Figure 5E shows the WGP with fairly intact bran andgerm constituents indicating that they are whole grains, whereasBrown rice alone had minimal distuption on the bran layer.
DiscussionThis study determined the GI of WGP and IBR, in addition to
commonly consumed Tanzanian cereal staple RMU made fromrefined maize and also the ugali made from whole maize (WMU),using a validated GI protocol. WGP was found to exhibit the
Vol. 84, Iss. 12, 2019 � Journal of Food Science 3377
IntegratedFoodScience
GI of multigrain pilaf, brown rice, and ugali . . .
Figure 3–Scanning electron micrograph of IBR. (A) IBR full grain depicting the presence of discrupted bran and germ (11 SE). (B) IBR rice depictingdisrupted bran and presence of partial germ (50 k SE). (C) IBR endosperm (1.00 k SE). (D) IBR surface depicting the disrupted bran layer (50 SE). (E)Parboiled brown rice (control sample) surface with intact bran layer (50 SE).
lowest GI among the four foods tested, placing it in the mediumGI category. IBR showed the highest GI followed by WMU andRMU; all of these were in the high GI category. Evaluation bystereozoom microscope of WGP showed fairly intact grain con-stituents and possibly accounting for the resultant medium GI.Similarly, disruption of the bran layer, presence of fissures or crackson the surface and partial damage to germ of IBR (perhaps dueto quick cooking processing methodology) could explain rela-tively high GI. We found no significant difference in the GI ofWMU and RMU (high GI) despite the former being a whole-grain milled flour suggesting the importance of intactness of thegrain (Figure 5C and D).
GI of whole grain pilafThe pilaf contained six kinds of cereals (oats, brown rice, rye,
triticale, buckwheat and barley and an oil seed [sesame]). Thevisual observation of the cereals indicated that the grains wereprocessed to separate out the nonedible seed coat or husk portionsfrom oats, barley, rye, rough rice (paddy), triticale, and buckwheat;whereas the sesame seeds were just dehulled to get rid of the coarseseed coat matter and hence WGP consisted of mostly intact grains.The brown rice in WGP had abrasions indicating discontinuous
bran (Figure 5E), potentially a reason for medium GI category (GIvalue of 58.9) despite most of the individual wholegrains in theWGP having low GI (Atkinson, Foster-Powell, & Brand-Miller,2008). The intact dietary fiber (from bran, germ and cell walls inthe case of unprocessed wholegrains) offers physical protection tothe starch granules during cooking and reduces the digestibility.Soluble fiber (predominantly from oats and barley in WGP), low-ers the GI of food by increasing its viscosity (Bjorck & Elmstahl,2003). The mechanism includes increased thickness of the undi-gested slurry in the small intestine, inhibition of intestinal motility,and delayed gastric emptying resulting in a decrease in the post-prandial glucose and insulin response (Brennan, 2005). WGP hasa mixture of soluble and insoluble dietary fiber contributed fromdifferent grains, and hence the glycemic outcome could be in-fluenced. Our earlier study showed that intact wholegrain brownrice containing predominantly insoluble fiber had a medium GI(Shobana et al., 2017). Blending of whole grains with other grainsof similar physical properties such as hardness and particle size withsimilar cooking characteristics may be advantageous for prepara-tion of whole grain mixtures similar to pilaf. Uniformly cookedgrains with comparable gelatinization characteristics and grain tex-ture for one single cooking method could positively impact the GI
3378 Journal of Food Science � Vol. 84, Iss. 12, 2019
Integ
rated
Food
Scien
ce
GI of multigrain pilaf, brown rice, and ugali . . .
Figure 4–Scanning electron photomicrographs of maize ugali frour (whole and refined). (A) Starch granules in whole maize ugaliflour (1.00k SE). (B)Starch granules in refined maize ugaliflour (1.00 k SE). (C) Presence of pericarp along with starch granules in wholemzise ugali flour (500SE).
of food. Similar to our GI finding for WGP, international GI tables(Atkinson et al., 2008) had reported a medium GI value of 55 fora multigrain porridge, containing rolled oats, wheat, triticale, rye,barley, and rice, cooked with water.
GI of instant brown riceThe international tables of GI values have reported a wide range
(47 to 109) for various types of rice including white, brown, andinstant rice (Atkinson et al., 2008; Kaur, Ranawana, Teh, & Henry,2015). Whole grains, such as brown rice, have kernels with intactbran and germ containing a relatively higher level of fat, whichcan hinder water absorption and increase the duration of cooking(Desikachar, Raghavendra Rao, & Ananthachar, 1965). Intact branalso limits the swelling and fissuring of the starch granules therebyslowing down the starch digestibility, but cooking time remains achallenge. Instant brown rice with minimal cooking time typicallyundergoes hydrothermal treatment (Champagne et al., 1999), andthere are reports on hydrothermal processing for preparation ofinstant jasmine rice as well (Prasert & Suwannaporn, 2009). Thisprocess involves raising the moisture content of kernels and sub-jecting them to controlled high-temperature short-time treatment(HTST), which results in cracks or fissures in the kernel as shownin the case of IBR (Figure 3D and 5A). This allows the rapid hy-dration and gelatinization of starch and also swelling of the starchgranules, thereby reducing cooking time (Prasert & Suwannaporn,
2009) and enhances digestibility. Although the details of the spe-cific treatments given to the IBR were not available, scanningelectron micrographs and stereozoom images distinctly showeddisrupted bran layers and the partial presence of germ constituentscompared to the reference brown rice (Figure 3A to E, 5A), whichlikely decreased the cooking time. Our previous study (Shobanaet al., 2017) found higher GI and 24-hr glucose responses forminimally polished rice (which is similar to IBR with disruptedbran) as compared to brown rice prepared from the same variety.Thus brown rice with intact bran and germ constituents can be ahealthier choice with low to medium GI values (Atkinson et al.,2008; Shobana et al., 2017) over instant brown rice with disruptedbran, germ, and fissures and high GI.
Hydrothermal treatment would have also induced changes suchas pregelatinization in the starch, as evident by the scanning elec-tron microscope images (Figure 3C), which in turn could haveaffected the cooking time, textural features, and ultimately thehigher GI of IBR in this study. However, the GI of brown ricehas been shown to vary from low to medium to high for a num-ber of reasons, including amylose content, degree of gelatiniza-tion, amylose-to-amylopectin ratio, and cooking time (both quickcooking and very long cooking time; Kaur, Ranawana, & Henry,2016, Kaur et al., 2015; Ranawana, Henry, Lightowler, & Wang,2009). Ranawana et al. (2009) have attributed the higher GI valuesof brown basmati rice to a longer cooking time.
Vol. 84, Iss. 12, 2019 � Journal of Food Science 3379
IntegratedFoodScience
GI of multigrain pilaf, brown rice, and ugali . . .
Figure 5–Stereozoom images. (A) Instant brown rice. (B) Parboiled brown rice (control). (C) Whole maize ugali flour. (D) Refined maize ugali flour. (E)Whole grain pilaf.
GI of refined and unrefined ugaliAs part of the GNET initiative in Africa, substitution of brown
rice for ugali, a maize-based African cereal staple, has been studiedby Akarolo-Anthony et al. (2013). Fine grits of maize almost freefrom seed coat matter is typically used for ugali preparation. Thisstudy assessed the differences between the GI of “ugali” made fromrefined and whole maize meal to support the recommendation ofusing whole grain flour in this and other staple foods.
The GI of ugali in our study did not significantly differ whetherprepared from whole maize or refined maize flour. The intact-ness of the anatomical components of the grain plays a vital rolein the digestibility of the carbohydrate (Parada, Aguilera, 2011;Ranawana et al., 2009). As the whole grain maize is milled to flour,the grain matrix, and the dietary fiber (from seed coat and cell
wall constituents) are disrupted. Because of the loss of structuralintegrity of the grain components during the process of milling,the starch granules embedded inside cell walls get exposed lead-ing to increased surface area in the flour. This enables increasedwater uptake, starch granular swelling and gelatinization duringcooking; all of which could raise the GI. Aforementioned, intactdietary fibers are more functional by providing physical protectionto starch granules and decreasing the starch digestibility. Similarly,whole grain based preparations such as wheat flour-based pancakesand barley flour bread have also been shown to have high GI valuesof 80 and 74, respectively (Foster-Powell et al., 2002). AlthoughRMU, being a refined grain, contained higher amounts of dietaryamylose, which is known to lower the GI, this was probably offsetby its smaller particle size when used as flour. These could help
3380 Journal of Food Science � Vol. 84, Iss. 12, 2019
Integ
rated
Food
Scien
ce
GI of multigrain pilaf, brown rice, and ugali . . .
explain why both the whole and refined maize ugali showed com-parable glycemic properties even though WMU contained higherlevels of dietary fiber. These findings are consistent with the datapublished in the International GI Table for refined and unrefinedmaize meal porridge (Atkinson et al., 2008).
To our knowledge, this study is the first of its kind to eval-uate the GI of instant brown rice and a commonly consumedbreakfast cereal WGP, in addition to ugali prepared from wholeand refined maize flour, a staple in many East African countries.The strength of the study lies in its methodology. We have useda standardized recommended GI estimation protocol in line withthe international methodology outlined by FAO/WHO (1998)to study the glycemic properties of all the food samples. In addi-tion, the amount of available carbohydrate was directly measuredas recommended for GI estimation, rather than by using the con-ventional method of deriving total carbohydrate minus dietaryfiber (Brouns et al., 2005). A unique feature of this study was theuse of scanning electron microscopy and stereozoom pictures toaugment our investigation of the glycemic properties of the foods.However, the study also has some limitations. Anatomical changesin the grain constituents during cooking and the nature of starchand dietary fiber present in the cooked test foods have not beenevaluated and such studies are needed to further substantiate ourfindings. Studies of GI are only able to evaluate an acute 2-hrglycemic response, thus longer term intervention trials are re-quired to establish the effects of whole grains, including the foodsthat we considered, on the prevention of diabetes or long-termglycemic control among those with diabetes. There are scientistswho believe that GI is a useful way to categorize foods accordingto their blood glucose raising potential and thus feel it can be help-ful in guiding consumers to choose foods with a lower glycemicresponse. This group believes the data is supported by epidemio-logic studies and trials linking low GI diets or dietary patterns toreduced risk of cardio metabolic conditions compared to higherGI patterns (Bhupathiraju et al., 2014, Augustin et al., 2015).However, there are other scientists who believe that glycemic in-dex and glycemic load may not be related to measures of insulinsensitivity, insulin secretion, and adiposity (Liese et al., 2005; Pi-Sunyer, 2002). Indeed, Matthan, Ausman, Meng, Tighiouart, andLichtenstein (2016) have shown that there is considerable vari-ability of individual responses to GI value even among healthyindividuals contributing to the variability of GI estimates and thusthey believe that GI is unlikely to be a good approach for guidingfood choices. Many developing low- and middle-income coun-tries continue to have diets culturally high in carbohydrate. Thus,reducing the dietary glycemic load of food or meal by decreasingthe GI for such population may be culturally acceptable to improvethe quality of high carbohydrate diets. Therefore in this part ofthe world industry should focus on developing more intact wholegrains or grains with minimal disruption to the grain matrix. Forexample, use of grits (broken grains) could be encouraged insteadof flour-based preparations. The cereal grain industry should alsofocus on developing products containing whole grains of uniformsize with similar physical properties to achieve uniform cookingtimes and a lower glycemic impact. Another option would be toadd functional ingredients such as soluble fiber, which could helpwith reconstruction of the matrix and reduce the rate of starchdigestibility. For clinical purposes, dietitians and physicians couldadvise patients how to replace high GI foods with lower GI optionsor to add low GI options to the meal to reduce the overall GL ofthe meal. However as a counter argument to this view, a recentreview by Livesey et al. (2019), show that the nature of dietary
fiber or wholegrains cannot effectively predict GI values, whichunderscores the need to develop country specific GI databases.
ConclusionIn this study, we have described the GI of the selected four
cereal grains, where wholegrain pilaf despite containing intact fibershowed only a medium GI while, instant brown rice showed a highGI owing to the “quick cooking” processing conditions and loweramylose content. The study also highlights that the whole graincereal which was milled to flour of a finer particle size exhibited asimilarly high GI as the flour made from refined grain in “Ugali”preparations. This study also showed that WGP with a medium GImay be a better whole grain alternative among the cereal grainsstudied. It is thus important to recommend intact whole grainfoods that elicit a lower glycemic response than whole meal flourpreparations. Well-designed randomized controlled clinical trialsare needed to substantiate our findings.
AcknowledgmentsThe Dept. of Nutrition of the Harvard T.H. Chan School of
Public Health funded this study.
Authors’ ContributionsD.S. and W.W. conceived the study, its design, and were in-
volved in implementation of the study, interpretation of the data,and helped to draft and revise the manuscript. S.V., M.R.B., K.A.,L.P., and G.G. were involved in the design and coordination ofthe study. S.S. conducted the microscopic examinations. V.M.,S.V., C.J.K.H., K.K., R.M.A., R.U., S.S., and N.G.M. were in-volved in the interpretation of the data. M.R.B. initiated the draftmanuscript along with NMW. All authors revised the manuscriptcritically and approved the final manuscript.
Conflicts of InterestThe authors declare no conflicts of interest.
ReferencesAACC. (2000). Approved methods of the AACC (10th ed.) moisture (method 44-19), protein (method
46-12), fat (method 30-25), ash (method 8-01). St Paul, MN, USA: American Association ofCereal Chemists.
Akarolo-Anthony, S. N., Odubore, F. O., Yilme, S., Aragbada, O., Odonye, G., Hu, F., . . .Adebamowo, C. A. (2013). Pattern of dietary carbohydrate intake among urbanized adultNigerians. International Journal of Food Sciences and Nutrition, 64(3), 292–299.
Alberti, K. G. M. M., & Zimmet, P. F. (1998). Definition, diagnosis and classification of dia-betes mellitus and its complications. Part 1: Diagnosis and classification of diabetes mellitus.Provisional report of a WHO consultation. Diabetic Medicine, 15(7), 539–553.
AOAC. (2016). Official methods of analysis 20th Ed. dietary fibre (method 2017.16), sucrose(method 999.03) AOAC International, Rockville, MD, Method 2000.01. Retrieved fromwww.eoma.aoac.org.
Asp, N. G., Johansson, C. G., Hallmer, H., & Siljestroem, M. (1983). Rapid enzymic assay ofinsoluble and soluble dietary fiber. Journal of Agricultural and Food Chemistry, 31(3), 476–482.
Atkinson, F. S., Foster-Powell, K., & Brand-Miller, J. C. (2008). International tables of glycemicindex and glycemic load values. Diabetes Care, 31, 2281–2283.
Augustin, L. S., Kendall, C. W., Jenkins, D. J., Willett, W. C., Astrup, A., Barclay, A. W.,. . . Ceriello, A. (2015). Glycemic index, glycemic load and glycemic response: An Interna-tional Scientific Consensus Summit from the International Carbohydrate Quality Consortium(ICQC). Nutrition, Metabolism and Cardiovascular Diseases, 25(9), 795–815.
Awika, J. M. (2011). Major cereal grains production and use around the world. In Advances incereal science: Implications to food processing and health promotion (pp. 1–13). Washington, DC:American Chemical Society.
Bhupathiraju, S. N., Tobias, D. K., Malik, V. S., Pan, A., Hruby, A., Manson, J. E., . . . Hu, F.B. (2014). Glycemic index, glycemic load, and risk of type 2 diabetes: Results from 3 largeUS cohorts and an updated meta-analysis. The American Journal of Clinical Nutrition, 100(1),218–232.
Brand-Miller, J., Hayne, S., Petocz, P., & Colagiuri, S. (2003). Low–glycemic index diets inthe management of diabetes: A meta-analysis of randomized controlled trials. Diabetes Care,26(8), 2261–2267.
Brouns, F., Bjorck, I., Frayn, K. N., Gibbs, A. L., Lang, V., Slama, G., & Wolever, T. M. S.(2005). Glycaemic index methodology. Nutrition Research Reviews, 18(1), 145–171.
Brennan, C. S. (2005). Dietary fibre, glycaemic response, and diabetes. Molecular Nutrition & FoodResearch, 49(6), 560–570.
Bjorck, I., & Elmstahl, H. L. (2003). The glycaemic index: Importance of dietary fibre and otherfood properties. Proceedings of the Nutrition Society, 62(1), 201–206.
Vol. 84, Iss. 12, 2019 � Journal of Food Science 3381
IntegratedFoodScience
GI of multigrain pilaf, brown rice, and ugali . . .
Champagne, E. T., Bett, K. L., Vinyard, B. T., McClung, A. M., Barton, F. E., Moldenhauer, K.,. . . McKenzie, K. (1999). Correlation between cooked rice texture and rapid visco analysermeasurements. Cereal Chemistry, 76(5), 764–771.
Deepa, M., Pradeepa, R., Rima, M., Mohan, A., Deepa, R., Shanthirani, S., & Mohan, V. (2003).The Chennai Urban Rural Epidemiology Study (CURES)-study design and methodology(urban component) (CURES-I). Journal-Association of Physicians of India, 51, 863–870.
Desikachar, H. S. R., Raghavendra Rao, S. N., & Ananthachar, T. K. (1965). Effect of degreeof milling on water absorption of rice during cooking. Journal of Food Science and Technology,2, 110–112.
Foster-Powell, K., Holt, S. H., & Brand-Miller, J. C. (2002). International table of glycemicindex and glycemic load values: 2002. The American Journal of Clinical Nutrition, 76(1), 5–56.
FAO/WHO. (1998). Carbohydrates in human nutrition: Report of Joint FAO/WHO expertconsultation. FAO Food Nutr, 66, 1–140.
Henry, C. J. K., Lightowler, H. J., Newens, K., Sudha, V., Radhika, G., Sathya, R. M., &Mohan, V. (2008). Glycaemic index of common foods tested in the UK and India. BritishJournal of Nutrition, 99(4), 840–845.
Hu, E. A., Pan, A., Malik, V., & Sun, Q. (2012). White rice consumption and risk of type 2diabetes: Meta-analysis and systematic review. British Medical Journal, 344, e1454.
Jenkins, D. J., Willett, W. C., Astrup, A., Augustin, L. S., Baer-Sinnott, S., Barclay, A. W., . . .Ceriello, A. (2014). Glycaemic index: Did Health Canada get it wrong? Position from theInternational Carbohydrate Quality Consortium (ICQC). British Journal of Nutrition, 111(2),380–382.
Jenkins, D. J., Wolever, T. M., Taylor, R. H., Barker, H., Fielden, H., Baldwin, J. M., . . . Goff,D. V. (1981). Glycemic index of foods: A physiological basis for carbohydrate exchange. TheAmerican Journal of Clinical Nutrition, 34(3), 362–366.
Kaur, B., Ranawana, V., & Henry, J. (2016). The glycemic index of rice and rice products: Areview, and table of GI values. Critical Reviews in Food Science and Nutrition, 56(2), 215–236.
Kaur, B., Ranawana, V., Teh, A. L., & Henry, C. J. K. (2015). The glycemic potential ofwhite and red rice affected by oil type and time of addition. Journal of Food Science, 80(10),H2316–H2321.
Liese, A. D., Schulz, M., Fang, F., Wolever, T. M., D’Agostino, R. B., Sparks, K. C., &Mayer-Davis, E. J. (2005). Dietary glycemic index and glycemic load, carbohydrate and fiberintake, and measures of insulin sensitivity, secretion, and adiposity in the Insulin ResistanceAtherosclerosis Study. Diabetes Care, 28(12), 2832–2838.
Liu, S., Willett, W. C., Stampfer, M. J., Hu, F. B., Franz, M., Sampson, L., . . . Manson, J. E.(2000). A prospective study of dietary glycemic load, carbohydrate intake, and risk of coronaryheart disease in US women. The American Journal of Clinical Nutrition, 71(6), 1455–1461.
Livesey, G., Taylor, R., Livesey, H. F., Buyken, A. E., Jenkins, D. J., Augustin, L. S., . . . Willett,W. C. (2019). Dietary glycemic index and load and the risk of type 2 diabetes: Assessment ofcausal relations. Nutrients, 11(6), 1436.
Malik, V. S., Sudha, V., Wedick, N. M., Ramya Bai, M., Vijayalakshmi, P., Lakshmipriya, N.,. . . Li, R. (2019). Substituting brown rice for white rice on diabetes risk factors in India: Arandomised controlled trial. British Journal of Nutrition, 121(12), 1389–1397. https://doi.org/10.1017/S000711451900076X
Mattei, J., Malik, V., Wedick, N. M., Hu, F. B., Spiegelman, D., Willett, W. C., & Campos,H. (2015). Reducing the global burden of type 2 diabetes by improving the quality of staplefoods: The Global Nutrition and Epidemiologic Transition Initiative. Globalization and Health,11(1), 23.
Matthan, N. R., Ausman, L. M., Meng, H., Tighiouart, H., & Lichtenstein, A. H. (2016).Estimating the reliability of glycemic index values and potential sources of method-ological and biological variability. The American Journal of Clinical Nutrition, 104(4),1004–1013
Mohan, V., Spiegelman, D., Sudha, V., Gayathri, R., Hong, B., Praseena, K., . . . Ramachandran,S. (2014). Effect of brown rice, white rice, and brown rice with legumes on blood glucoseand insulin responses in overweight Asian Indians: A randomized controlled trial. DiabetesTechnology & Therapeutics, 16(5), 317–325.
Parada, J., & Santos, J. L. (2016). Interactions between starch, lipids, and proteins in foods:Microstructure control for glycemic response modulation. Critical Reviews in Food Science andNutrition, 56(14), 2362–2369.
Parada, J., & Aguilera, J. M. (2011). Starch matrices and the glycemic response. Food Science andTechnology International, 17(3), 187–204.
Pi-Sunyer, F. X. (2002). Glycemic index and disease. The American Journal of Clinical Nutrition,76(1), 290S–298S.
Prasert, W., & Suwannaporn, P. (2009). Optimization of instant jasmine rice process and itsphysicochemical properties. Journal of Food Engineering, 95(1), 54–61.
Radhika, G., Sumathi, C., Ganesan, A., Sudha, V., Henry, C. J. K., & Mohan, V. (2010).Glycaemic index of Indian flatbreads (rotis) prepared using whole wheat flour and ‘atta mix’-added whole wheat flour. British Journal of Nutrition, 103(11), 1642–1647.
Ranawana, V., & Henry, C. J. K. (2011). Liquid and solid carbohydrate foods: Comparativeeffects on glycemic and insulin responses, and satiety. International Journal of Food Sciences andNutrition, 62(1), 71–81.
Ranawana, D. V., Henry, C. J. K., Lightowler, H. J., & Wang, D. (2009). Glycaemic index ofsome commercially available rice and rice products in Great Britain. International Journal ofFood Sciences and Nutrition, 60(sup4), 99–110
Shobana, S., Lakshmipriya, N., Bai, M. R., Rajagopal, G., Vaidya, R., Malleshi, N., . . . Mohan,V. (2017). Even minimal polishing of an Indian parboiled brown rice variety leads to increasedglycemic responses. Asia Pacific Journal of Clinical Nutrition.
Shobana, S., Malleshi, N. G., Sudha, V., Spiegelman, D., Hong, B., Hu, F. B., . . . Mohan, V.(2011). Nutritional and sensory profile of two Indian rice varieties with different degrees ofpolishing. International Journal of Food Sciences and Nutrition, 62(8), 800–810.
Sun, Q., Spiegelman, D., van Dam, R. M., Holmes, M. D., Malik, V. S., Willett, W. C., & Hu,F. B. (2010). White rice, brown rice, and risk of type 2 diabetes in US men and women.Archives of Internal Medicine, 170(11), 961–969.
Sowbhagya, C. M., & Bhattacharya, K. R. (1979). Simplified determination of amylose in milledrice. Starch Starke, 31(5), 159–163.
WHO. (2000). Regional Office for the Western Pacific of the World health Organization(2000). World Health Organization, International Association for the study of Obesity and Interna-tional Obesity Task Force. The Asia Pacific Perspective; Redefining obesity and its treatment.Sydney: Health Communications Australia. 17–20. Retrieved from http://www.wpro.who.int/nutrition/documents/docs/Redefiningobesity.pdf
Wolever, T. M., Brand-Miller, J. C., Abernethy, J., Astrup, A., Atkinson, F., Axelsen, M., . . .Casiraghi, M. C. (2008). Measuring the glycemic index of foods: Interlaboratory study. TheAmerican Journal of Clinical Nutrition, 87(1), 247S–257S.
3382 Journal of Food Science � Vol. 84, Iss. 12, 2019