Embed Size (px)
Citation preview
DE GRUYTER MOUTONDOi 10.1515/cog-2013-0018 Cognitive Linguistics 2013; 24(3): 531-577
Hans-Jörg Schmid and Helmut Küchenhoff
Collostructíonal analysis and other ways ofmeasuring lexicogrammatical attraction:Theoretical premises, practical problemsand cognitive underpinnings
Abstract: Collostructional analysis is a corpus-based quantitative method of mea-suring the mutual attraction of lexemes and constructions (cf. Stefanowitsch andGries 2003) which has gained considerable popularity among corpus linguistsand especially cognitive linguists with a statistical bent. For many less statisti-cally minded linguists, it has proven rather difficult to evaluate the theoreticalbackground assumptions and cognitive underpinnings of collostructional analy-sis and to compare them to alternative ways of modelling lexicogrammatical at-traction phenomena. This paper aims to spell out these premises and founda-tions in terms comprehensible to a wider audience. It begins with a concise surveyof how collostructional analysis works and then reports on a number of practical,theoretical and statistical issues of which both practitioners of the method andthose who try to appreciate results of its application should be aware. With theseissues in mind we then discuss alternative ways of calculating and interpretinglexicogrammatical attraction. The advantages and disadvantages of the differentmethods are discussed, also against the background of the results of studies thathave tried to evaluate the measures by means of external evidence from psycho-linguistic experiments. Finally, cognitive underpinnings of lexicogrammaticalassociations and imphcations for the different approaches are discussed. It isargued that at present we lack adequate knowledge about the ways in which dis-course frequencies affect entrenchment. We conclude that the complexities of therelation between corpus frequencies and degrees of entrenchment are still ratherpoorly understood, and make suggestions for future work.
Keywords: collostructional analysis, lexicogrammatical associations, quantita-tive linguistics. Fisher Exact test, p-value, odds ratio, attraction and reliance,entrenchment
Hans-Jörg Schmld: Ludwig Maximilians University. E-mail: hans-jó[email protected] KUchenhoff: Ludwig Maximilians Universität
532 H.-j. Schmid&H. KUchenhoff DE GRUYTER MOUTON
1 Introduction
It has been a long-standing aim of corpus linguistics to measure the degree ofmutual attraction between lexical elements in text. One particularly active decadewith regard to this endeavour was the 1990s, when corpora exploded in size andreliable tailor-made statistical tools were in high demand. Classic statistical pro-cedures proposed during that period include t-score, mutual information indexand log-likelihood ratio (cf. e.g. Church and Hanks 1990; Clear 1993; Stubbs 1995;Manning and Schütze 2001; see also Evert and Krenn 2001; Evert 2004). Themutual associations between lexemes and grammatical constructions (ratherthan other lexical elements) came into the focus of attention at the end of thatperiod (cf. e.g. Hunston and Francis 2000; Schmid 2000), mainly because the in-sight was gaining ground that grammar and the lexicon are not such strictly sep-arated modules after all. This development coincided with the first attemptswithin usage-based frameworks to interpret corpus-based statistical measures ofassociations between lexemes and patterns as reflecting degrees of cognitive as-sociations in the minds of language users (e.g. Schmid 2000; see the survey inGlynn 2010). Descriptive measures of associations between linguistic elementsthus gradually changed their theoretical status and were turned into measures oflanguage-based associations in the minds of language users.
In 2003, Anatol Stefanowitsch and Stefan Th. Gries (henceforth S & G) intro-duced a set of pioneering methods subsumed under the term coUostructionalanalysis (cf. S & G 2003; Gries and Stefanowitsch 2004). The major goal of thesecorpus-based methods is to develop improved tools for investigating interactionsbetween lexemes and grammatical patterns. More precisely, coUostructionalanalysis gauges the associational strength between constructions and the lexicalelements filling certain slots in these constructions (S & G 2003), and unravels thesemantic differences between apparently synonymous constructions ('alterna-tions') by comparing the collostruction strength of manifestations and lexicalvariants in actual use as documented in corpora (Gries and Stefanowitsch 2004;see also Gries et al. 2005, 2010; Gries and Stefanowitsch 2010).
These tools have been welcomed quite enthusiastically by many members ofthe corpus-linguistic and cognitive-linguistic communities. Usage-based, cor-pus-driven, quantitative and mathematically sophisticated, coUostructionalanalysis seems to offer a maximally objective and rigorous way of investigatingnot only the use of language, but also, at least if we accept the goals of usage-basedapproaches, degrees of entrenchment in the cognitive systems informing andguiding actual usage.
In view of the rapid spread of the coUostructional methods (cf. e.g. CoUeman2009a, 2009b, 2010; Mukherjee and Gries 2009; Hilpert 2010; Hampe 2011) and
DE GRUYTER MOUTON Measuring lexicogrammatical attraction 533
the claims derived from investigations applying them, it seems important for re-searchers interested in the linguistic and cognitive associations of lexemes andconstructions to understand the fundamental assumptions behind the method.The first aim of this paper, co-authored by a linguist and a statistician, is thereforeto explain these assumptions in simple terms comprehensible to the statisticallayperson. In the course of this we will point to some theoretical and practicalpuzzles which have so far not been brought to the attention of the wider corpus-and cognitive-linguistic community, and introduce alternative ways of measuringlexicogrammatical associations. While other researchers - e.g. Kflgarriff (2005);Divjak (2008); Ellis and Ferreira-Junior (2009); Bybee (2010); Schmid (2010);Baayen (2011); and also Gries (2005), and Gries and Stefanowitsch (2010) - havealready drawn attention to some of these issues, this is the first paper to collectthem in a systematic survey and to relate them to the cognitive underpinnings ofmeasuring lexicogrammatical associations by means of collostructional analysisand other tests. The focus will be on the basic technique first introduced in S & G(2003), referred to as collexeme analysis, since the proposals for so-called distinc-tive-collexeme analysis made in Gries and Stefanowitsch (2004, 2010) as well asthe extension proposed, for example, in Stefanowitsch and Gries (2008) largelybuild on the first method.
In the next section we will give a brief outline of collostructional analysis andits major premises. This will be followed by a critical appreciation of challengesfaced by collostructional analysis (Section 3). In Section 4, a dataset on theN-i-tftat-clause construction (e.g. the fact that...) wiU be introduced to serve as abasis for concise accounts of alternative ways of measuring the mutual attractionof lexemes and constructions. Section 5 will review attempts to evaluate cor-pus-based data and different statistical tools for measuring them against evi-dence obtained from psycholinguistic experiments. Section 6 will provide a theo-retical discussion of how corpus frequencies as such and the measures discussedrelate to degrees of entrenchment of lexicogrammatical associations in the mindsof speakers.
2 Collostructional analysis
As mentioned above, collostructional analysis investigates the lexicogrammati-cal associations between constructions and lexical elements. It is situated in thelarger theoretical framework of Construction Grammar, which claims that gram-matical constructions are pairings of forms and meanings, thus opposing gener-ative models that consider grammar as a set of rules. The sizes of constructionsrange from individual morphemes to large-scale grammatical structures includ-
534 H.-J. Schmid & H. KUchenhoff DE GRUYTER MOUTON
ing clause-level argument-structure constructions (cf. Goldberg 1995) and gram-matically exotic and lexically specific constructions such as the let-alone con-struction (Fillmore et al. 1988) or the what's X doing Y construction (Kay andFillmore 1999).
The constructions investigated in coUostructional analysis are typically ofthe syntactic type and open grammatically defined slots for lexemes to occur.
Collostructional analysis always starts with a particular construction and investigateswhich lexemes are strongly attracted or repelled by a particular slot in the construction (i.e.occur more frequently or less frequently than expected). (S & G 2003:214)
Examples studied by S & G include the ditransitive construction with a focus onthe slot for the verb, the two constructions making up the so-called dative alter-nation (she gave him the book vs. she gave the book to him), and, illustrating themore specific type, the N waiting to happen construction with a focus on the nom-inal slot.
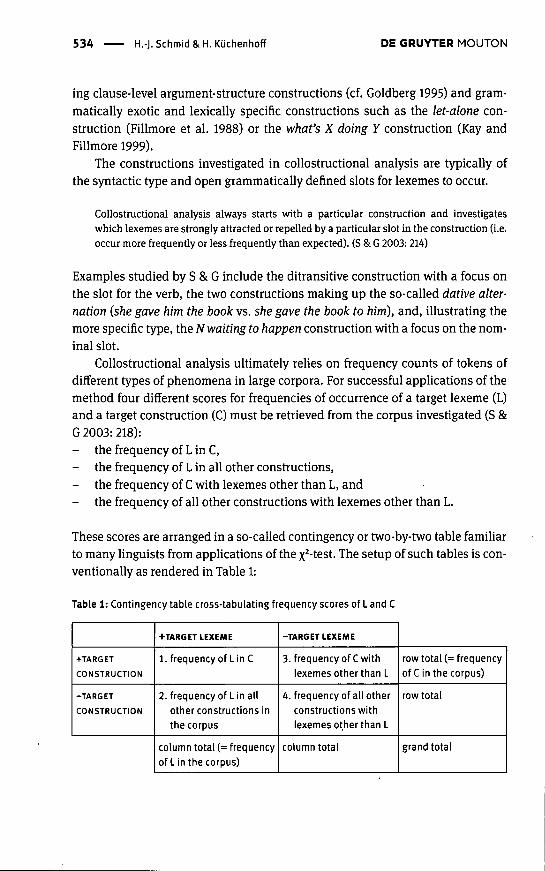
Collostructional analysis ultimately relies on frequency counts of tokens ofdifferent types of phenomena in large corpora. For successful applications of themethod four different scores for frequencies of occurrence of a target lexeme (L)and a target construction (C) must be retrieved from the corpus investigated (S &G 2003: 218):- the frequency of L in C,- the frequency of L in all other constructions,- the frequency of C with lexemes other than L, and- the frequency of all other constructions with lexemes other than L.
These scores are arranged in a so-called contingency or two-by-two table familiarto many linguists from applications of the x^-test. The setup of such tables is con-ventionally as rendered in Table 1:
Table 1: Contingency table cross-tabulating frequency scores of L and C
+rARGET
CONSTRUCTION
-TARGET
CONSTRUCTION
•••TARGET LEXEME
1. frequency of Lin C
2. frequency of Lin allother constructions inthe corpus
column total (= frequencyof L in the corpus)
-TARGET LEXEME
3. frequency of C withlexemes other than L
4. frequency of all otherconstructions withlexemes other than L
column total
row total (= frequencyof C in the corpus)
row total
grand total
DE GRUYTER MOUTON iVleasuring lexicogrammatical attraction 535
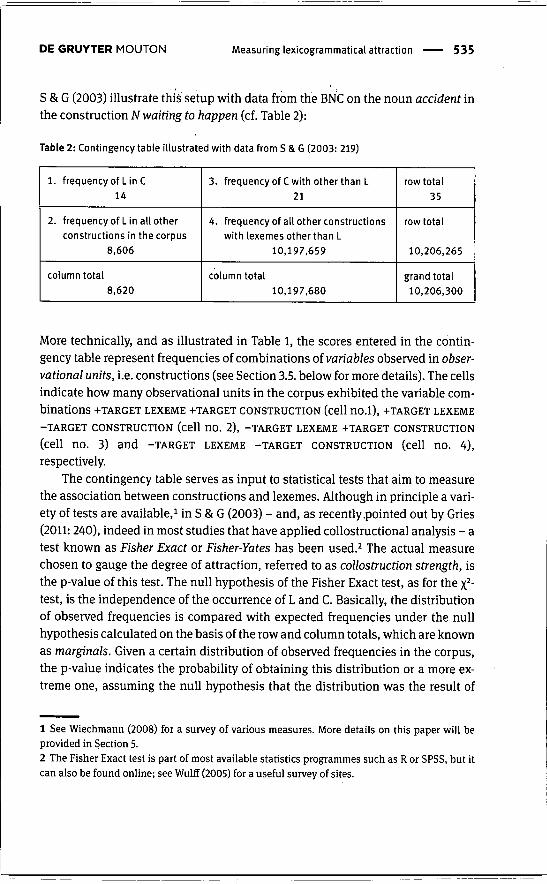
S & G (2003) illustrate this setup with data from the BNC on the noun accident inthe construction AT waíííng to happen (cf. Table 2):
Table 2: Contingency table illustrated with data from S & G (2003: 219)
1. frequency of Lin c14
2. frequencyof Lin all otherconstructions in the corpus
8,606
column total8,620
3. frequencyof C with other than L21
4. frequency of all other constructionswith lexemes other than L
10,197,659
column total10,197,680
row total35
row total
10,206,265
grand total10,206,300
More technically, and as illustrated in Table 1, the scores entered in the contin-gency table represent frequencies of combinations oí variables observed in obser-vational units, i.e. constructions (see Section 3.5. below for more details). The cellsindicate how many observational units in the corpus exhibited the variable com-binations -fTARGET LEXEME -I-TARGET CONSTRUCTION (cell nO.l), -̂ TARGET LEXEME-TARGET CONSTRUCTION (cell nO. 2), -TARGET LEXEME -^TARGET CONSTRUCTION
(cell no. 3) and -TARGET LEXEME -TARGET CONSTRUCTION (cell no. 4),respectively.
The contingency table serves as input to statistical tests that aim to measurethe association between constructions and lexemes. Although in principle a vari-ety of tests are available,^ in S & G (2003) - and, as recently .pointed out by Gries(2011:240), indeed in most studies that have applied coUostructional analysis - atest known as Eisher Exact or Eisher-Yates has been used.^ The actual measurechosen to gauge the degree of attraction, referred to as collostruction strength, isthe p-value of this test. The null hypothesis of the Fisher Exact test, as for the x̂ -test, is the independence of the occurrence of L and C. Basically, the distributionof observed frequencies is compared with expected frequencies under the nullhypothesis calculated on the basis of the row and column totals, which are knownas marginals. Given a certain distribution of observed frequencies in the corpus,the p-value indicates the probability of obtaining this distribution or a more ex-treme one, assuming the null hypothesis that the distribution was the result of
1 See Wiechmann (2008) for a survey of various measures. More details on this paper will beprovided in Section 5.2 The Fisher Exact test is part of most available statistics programmes such as R or SPSS, but itcan also be found online; see Wulff (2005) for a useful survey of sites.
536 H..-J. Schmid & H. KUchenhoff DE GRUYTER MOUTON
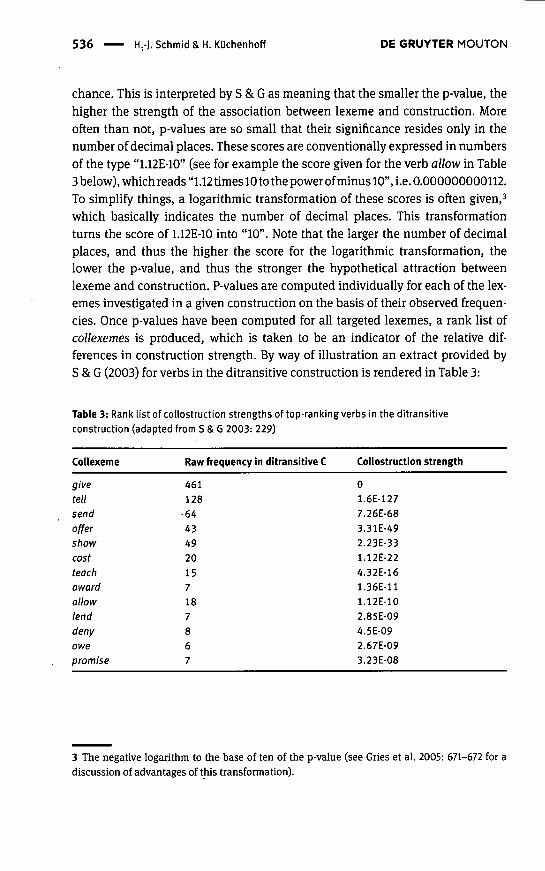
chance. This is interpreted by S & G as meaning that the smaller the p-value, thehigher the strength of the association between lexeme and construction. Moreoften than not, p-values are so small that their significance resides only in thenumber of decimal places. These scores are conventionally expressed in numbersof the type "1.12E-10" (see for example the score given for the verb allow in Table3 below), which reads "1.12 times 10 to the power of minus 10", i.e. 0.000000000112.To simplify things, a logarithmic transformation of these scores is often given,^which basically indicates the number of decimal places. This transformationturns the score of 1.12E-10 into "10". Note that the larger the number of decimalplaces, and thus the higher the score for the logarithmic transformation, thelower the p-value, and thus the stronger the hypothetical attraction betweenlexeme and construction. P-values are computed individually for each of the lex-emes investigated in a given construction on the basis of their observed frequen-cies. Once p-values have been computed for all targeted lexemes, a rank list ofcollexemes is produced, which is taken to be an indicator of the relative dif-ferences in construction strength. By way of illustration an extract provided byS & G (2003) for verbs in the ditransitive construction is rendered in Table 3;
Table 3: Rank list of collostruction strengths of top-ranking verbs in the ditransitiveconstruction (adapted from S & G 2003: 229)
Collexeme Raw frequency In ditransitive C Collostruction strength
01.6E-1277.26E-683.31E-492.23E-331.12E-224.32E-161.36E-111.12E-102.85E-O94.5E-092.67E-093.23E-08
givetellsendoffershowcostteachawardallowlenddenyowepromise
461128
-64434920157187867
3 The negative logarithm to the base of ten of the p-value (see Gries et al. 2005: 671-672 for adiscussion of advantages of this transformation).
DE GRUYTER MOUTON Measuring lexicogrammatical attraction 537
The Fisher Exact test relates the observed 'raw' frequency of occurrence of alexeme in a construction to the column and row totals. Therefore, lexemes foundto occur less frequently than others in a given construction may still be found toyield a smaller p-value (and thus be more strongly attracted than more frequentlyfound ones) if they occur less often in the corpus altogether. For example, theverb award ranks higher with regard to collostruction strength in the ditransitiveconstruction than the verb allow, even though the latter verb occurs 18 times inthe construction in the BNC, and the former no more than 7 times (S & G 2003:229). This is because award is less frequent than allow in the whole corpus.
Table 3 also illustrates that, as is the case for the verb give, p-values can be sosmall that the computer carrying out the fairly capacity-consuming computationdoes not manage to give the precise score, but instead produces an output of 0.This can only be interpreted as representing a maximum degree of collostructionstrength which could only be rendered more precise by using a more powerfulcomputer.
S & G conclude their 2003 article by highlighting the major strengths of theirproposal. According to them, the model increases the descriptive adequacy ofgrammatical description by focusing on the grammatical structures in which lex-emes are embedded and by means of "the quantification of the degrees of attrac-tion/repulsion" the method offers (2003: 236). This is seen as having positive ef-fects on applied disciplines such as lexicography and language teaching. Asecond major advantage resides in the empirical support that coUostructionalanalysis gives to construction-based syntactic theories. S & G do not fail to pointout possible options for future refinements of their method, some of which havealready been implemented in later papers, for example S & G (2008), Gries andStefanowitsch (2004, 2010) as well as Gries (2006, 2011).
After this brief summary of collostructional analysis, we are now in a positionto appraise the method and point to some open questions pertaining to both the-oretical issues and problems arising in practical applications.
3 Critical appreciation
3.1 Null hypothesis testing and the randomness assumption
The first fundamental issue relating to the statistical side was raised by Kilgarriff(2005) in a paper emphatically entitled "Language is never, ever, ever, random".As is indicated by the title of his paper, Kilgarriff's main concern is the issue ofrandomness in linguistic data. Essentially, a random sample is a set of data in
538 H.-J. Schmid & H. Küchenhoff DE GRUYTER MOUTON
which all values are independent observations. Since there can be no doubt thatall languages show distributional patterning, it is clearly problematic if we pro-ceed from the assumption - as applications of the null hypotheses ultimately do- that the values to be observed, in our case occurrences of lexemes and construc-tions, are unrelated. Investigations of distributional patterns were part and parcelof behaviourist approaches in the tradition of American Structuralism (cf. e.g.Fries' [1952] method of determining word-classes), and the notions oí collocationand colligation proposed by Firth, as well as Sinclair's (1991: 110) well-knownidiom principle, precisely capture the insight that lexemes and constructions arenot distributed in a random fashion (cf. Stubbs 1995:31 et passim).
A second type of randomness problem, not addressed by Kilgarriff, resides inthe composition of the corpora which inevitably make up the raw data of all fre-quency-related statistical tools. This issue can be exemplified with an analogyfrom the social sciences: imagine that you read the results of an opinion poll col-lecting 2,000 opinions on whether a given political decision was good or bad.Assessing the outcome, you would presumably be rather disappointed if youfound out that the pollsters were short of informants and therefore allowed 500persons to give four judgments each, since you would expect that each of themcame to the same decision four times. Now in a way, this is almost precisely whatwe inevitably get in corpora: apparently, each of the language producers sampleddoes not contribute one datum only, for example one word, as we would expectfrom a proper opinion poll, but a whole stretch, or often several samples, of text.This practice, unavoidable as it clearly is, adds the problem that the observationscollected in a corpus, i.e. the corpus data, are not randomly sampled. Speakersand v̂ nriters have their favourite ways of putting things, habitually resort to thesame fixed phrase and collocations and frequently reproduce identical chunks oftext very much in the fashion of ready-made building-blocks (cf. again Sinclair'sidiom principle, 1991:110, as well as Szmrecsanyi 2005). As a result, the phenom-ena collected in a corpus can never be 'independent observations'. To be fair, itmust be emphasized that this problem is by no means specific to collostructionalanalysis, but affects corpus-linguistic practice and theory per se. It is aggravated,however, if statistical tests are used which start out from a null hypothesis andare therefore based on the assumption of independent observations.''
4 In principle, statistical methods for getting away from the assumption of independence couldbe used, for example, mixed models including random effects, e.g. for speakers and sources, butit is not clear how these could be applied in order to improve measures of lexicogrammaticalassociations.
DE GRUYTER MOUTON Measuring lexicogrammatical attraction 539
3.2 P-value of a significance test as a measure ofcollostruction strength and resulting problems with theinterpretability of scores
The output of collostructional analysis consists of lexemes ranked according top-values, which are interpreted as indicating different degrees of collostructionstrength. As explained in Section 2, the rationale behind this is essentially thatthe Fisher Exact test measures, in the form of the p-value, the probability that thedistribution actually observed, or a more extreme one, occurs if there is no attrac-tion between the lexeme and the construction. It is important to understand whatthis means. The p-value is a measure of the evidence of a set of data with regardto a certain hypothesis. The lower the p-value, the stronger the evidence againstthe null hypothesis. What the p-value does not do, however, is measure thestrength of a relation, be it lexicogrammatical or other. As Baayen (2011:16) ob-serves with reference to collostructional analysis: "From a statistical perspective,it is somewhat odd to derive a measure from a p-value".' S & G are of course alsoaware of the difference between p-values and effect sizes and explicitly note that"ranking the lexemes [...] would normally have to be done using effect sizes"(S & G 2003: 239). Justifying their choice of p-values to measure collostructionstrength, they add that
the advantage of the Fisher exact p-value is that in addition to incorporating the size of theeffect observed in any particular cross-tabulation (as, e.g., O, MI or the odd's ratio wouldalso do), it also weighs the effect on the basis of the observed frequencies such that a partic-ular attraction (or repulsion, for that matter) is considered more noteworthy if it is observedfor a greater number of occurrences of the lexeme in the N slot. (S & G 2003: 239)
While it is not quite clear in which way the Fisher Exact p-value indeed, as S & Gput it, "incorporat[es] the size of the effect", in a later publication the authorspoint out that "alternative measures such as effect sizes [...] could also be used"(S & G 2009:943). What this shows, and what should be kept in mind in interpret-ing rank lists of lexemes ordered according to p-values, is that p-values do not,strictly speaking, measure the strength of the association between lexemes andconstructions, but rather the likelihood with which the assumption that there is
5 In the statistical literature it is widely accepted that p-values must not be seen as an effectmeasure, see e.g. Goodman (2002: 593): "Because the p value is calculated only with respect toone hypothesis, and has no information, by itself, of the magnitude of the observed effect (orequivalently of power), it implicitly excludes the magnitude of effect from the definition of'evidence'."
540 H.-J. Schmid & H. Küchenhoff DE GRUYTER MOUTON
no attraction, i.e. the null hypothesis, can be rejected. As a consequence of thisway of operationalizing the measure of collostruction strength, the interpretabil-ity - in a technical, statistical sense - of rank orders is more restrained and lesstransparent than that of actual effect sizes.
3.3 Sample size
The next issue is the dependence of the p-value of the Fisher Exact test on thesample size, which is also mentioned in the quotation from S & G (2003) renderedin the preceding section. Theoretically, of course, it is clearly reasonable toassume that observed frequencies in very large corpora are treated as being moreinformative than data collected from smaller corpora. An observed frequency of,say, 10 records of a phenomenon in a corpus of 1 million words is clearly a lessreliable datum than an observed frequency of 1,000 in 100 million words, eventhough the relative frequency is 10 per million words in each case. However,simply due to their sheer size, the large corpora available today have an in-builtpotential to reject the null hypotheses more or less automatically. Kilgarriff givesan interesting quote from a statistics textbook from the 1970s:
None of the null hypotheses we have considered with respect to goodness of fit can be ex-actly true, so if we increase the sample size (and hence the value of x̂ ) we would ultimatelyreach the point when all null hypotheses would be rejected. All that the x̂ test can tell us,then, is that the sample size is too small to reject the null hypotheses! (Owen and Jones 1977:359, quoted from Kilgarriff 2005: 266)'
If the sample size increases, then the p-value decreases, even if the internal struc-ture of the dataset remains unchanged. For example, when the numbers in thetwo-by-two contingency table are all doubled, then the p-value decreases, eventhough one would assume that the attraction strength remains constant, as theproportions between the numbers remain constant, too. Well aware of this, Gries(2005) emphasizes that comparisons of p-values must always be based on identi-cal corpus sizes. One way to react to the sample size problem, which is alsopointed out by S & G (2009: 943), would be to replace the Fisher Exact test by adifferent distributional statistic that is not affected by sample sizes, e.g. the OddsRatio measure, which will be explained in section 4.3 below.
6 This danger has been acknowledged in a reply to Kilgarriif's paper by Gries (2005), who addsa substantial list of further warnings related to the frequency effects of null hypothesis testing.
DE GRUYTER MOUTON Measuring lexicogrammatical attraction 541
3.4 The challenge of filling cell no. 4 (as well as the otherthree cells)
As explained in Section 2, like most statistical computations, collostructionalanalysis compares observed frequencies of occurrence in a corpus with frequencydistributions that would be expected by chance, i.e. when the null hypothesis iscorrect. Expected frequencies are calculated on the basis of the row and columntotals as illustrated in Table 1. These totals, as well as the grand total, can ofcourse only be calculated if all four cells of the contingency table are filled. How-ever, retrieving the scores needed to fill all four cells is by no means a trivial task.The challenges facing researchers here are definitorial ones. From a statisticalpoint of view, they concern the definitions of the observational unit under exam-ination and of the variables to be investigated as well as their values. As men-tioned in Section 2, in collostructional analysis, the variables are represented bythe target lexemes and the target construction, both of which are binary variablesand thus have two values (-I-TARGET LEXEME VS. -TARGET LEXEME and -̂ TARGETCONSTRUCTION VS. -TARGET CONSTRUCTION). The observational unit under exam-ination is commonly formulated by selecting a more schematic construction. Allof these definitions and choices deserve closer examination.
Firstly, a clear definition of the given target lexeme, with regard to both itsform(s) and its meaning(s), is a prerequisite for collecting the scores for the cellsnumbered 1 and 2 in Table 1. This definition is the basis for counting the frequencyof occurrence of the target lexeme in the target construction (cell no. 1) and thefrequency of the same lexeme in all other constructions (cell no. 2), or, put moretechnically, the number of constructions {qua observational units) that containthe target lexeme and contain or represent the target construction (cell no. 1) andthe number of constructions that contain the lexeme but do not contain or repre-sent the target construction (cell no. 2). Decisions that have to be made in thecourse of this firstly relate to the question as to whether all morphological vari-ants of a lexeme are included in the count or whether they are counted separately(cf. Gries 2011). Furthermore, one should be aware that, strictly speaking, it is notforms that enter into lexicogrammatical associations, but lexemes {qua abstractbundles of meanings), or even more precisely lexical units {qua associations offorms and senses; cf. Lipka 2002:150 for these terms). It is important to empha-size this, since what all corpus linguists - not only those applying collostruc-tional analysis - usually do when filling cell no. 2 is count forms. The reason forthis lies in the amount of material to be processed and the effort required in orderto handle it properly. While it is time-consuming enough to check individualtokens manually when it comes to filling cell no. 1, a semantically informed wayof filling cell no. 2 would go way beyond that in terms of time and effort, as it
542 H.-J. Schmid&H. Küchenhoff DE GRUYTER MOUTON
would entail a manual inspection of cdl tokens of all coUexemes of a construc-tion. Most linguists will certainly agree that this does not seem to be feasible inmost studies for practical reasons (cf. Stefanowitsch and Gries 2008:149). Never-theless, it would not be unproblematic from a semantic (and also cognitive) pointof view if, for example, light-verb uses of give (e.g. give sb responsibility, give sb asmile, give sb confidence, etc.) were included in the count of all uses of give in thecorpus when investigating the ditransitive construction, or if uses of/see in dis-course marker function ('I understand') were included in the count of all uses ofsee in a corpus when investigating the as-predicative construction (e.g. regard as,view as, etc., Gries et al. 2005; see Section 5 for more details).
Secondly, the score to be inserted in cell no. 1 of course also depends on thedefinition of the second variable, the construction under examination. This defi-nition is also necessary for cell no. 3, which represents the number of construc-tions containing or representing the target construction but not the target lexeme(-I-TARGET CONSTRUCTION, -TARGET LEXEME). As in the case of the target lexemes,an exact definition of the target construction with regard to its formal and seman-tic properties is required, which is often even more difficult to work out sinceconstructions are even messier and more flexible than individual lexemes. Theformal description includes a precise account of the forms and functions of fixedlexical and grammatical elements that define the construction. The semantic de-scription must detail the meaning of the target construction. Once a definition isin place, its application to the corpus data will usually have to be carried outmanually or semi-manually, depending on the amount of annotation added tothe corpus. Again, this is a problem that all attempts to measure lexicogrammati-cal attraction phenomena have to grapple with. The corpus analysis can turn outto be particularly difficult for potentially polysemous constructions such as theas-predicative construction investigated by Gries et al. (2005,2010; cf. Section 5).For example, while regard as, see as and view as seem to be representatives of thecore meaning of this construction, use as and offer as are both grammatically andsemantically fairly distinct: the verbs use and offer can be used perfectly wellwithout an object complement and do not seem to have the epistemic meaningassociated with the core sense of the construction. In order to work out how to fillcell no. 3, a decision has to be made as to whether the latter group of verbs in factinstantiate the construction and are thus to be included in the count, or are to betreated as a separate sense of the target construction or even a semantically dis-tinct homonymous construction, which may only be related to the target con-struction on a much higher level of schematicity.
Thirdly, the cell which is the most difficult one to fill is the one numbered 4 inTable 1 above. Defined rather loosely as rendering "the frequency of all other con-structions with lexemes other than L", i.e. the target lexeme (S & G 2003:218), cell
DE GRUYTER MOUTON Measuring lexicogrammatical attraction 543
no. 4 actually brings to thé fore thé knotty question of how to define the statisticalor observational unit under examination. S & G explicitly state how they dealwith this question in connection with the construction JVwaíííng to happen (2003:218):
the total number of constructions was arrived at by counting the total number of verb tagsin the BNC, as we are dealing with a clause-level construction centering around the verbwait.
As is implied in the second part of this quotation,' the score in cell no. 4 shouldmeet two criteria: it must render the number of constructions in the corpus whichfeature the value intersection -TARGET LEXEME and -TARGET CONSTRUCTION, andit should also be derived from the total number of constructions which are de-fined in such a way that they are somehow comparable to the target construc-tion. In technical parlance, comparability is among the key inclusion criteria inthe definition of the observational unit, which also determine the size of the totalpopulation studied. More specifically, if the scores in the two-by-two contingencytable and the application of the Fisher Exact - or any other statistic based on thetable - are to make sense both mathematically and linguistically, the target con-struction investigated, i.e. N waiting to happen, should be a subset of the set ofconstructions defined as observational units under examination, i.e. all verbs, or,more precisely, all verbal constructions. This implies that the two should be par-adigmatically related in terms of their forms, functions and meanings (see Sec-tion 6 for more details). S & G's choice of "verb tags" to select the paradigmaticcompetitors of the N waiting to happen construction seems plausible enough, butit is of course not uncontroversial (cf. Bybee 2010:98). One could argue, for exam-ple, that the construction is lexically so specific, including as it does the verbswait and happen, that it seems unfair, so to speak, to relate it paradigmatically toall main-verb constructions. In addition, or alternatively, one could point to thefact that the verb waif invariably occurs in the progressive form and conclude thatonly progressive verb phrases should be taken into consideration (cf. Gries 2011).A similar argument could be constructed for the infinitival form to happen, whichwould lead to an even smaller score for cell no. 4.
Note that the decisions to take when filling cell no. 4 are not just practicalones, but rather pertain to very fundamental questions of construction grammar.
7 Cf. also Gries et al. (2005: 645): "Fourth, one estimates the number of constructions in thecorpus [...]. For the analysis of argument structure constructions we have adopted the strategyadvocated in the first works on collostructional analysis, namely to approximate this frequencyby using the token frequency of all verbs."
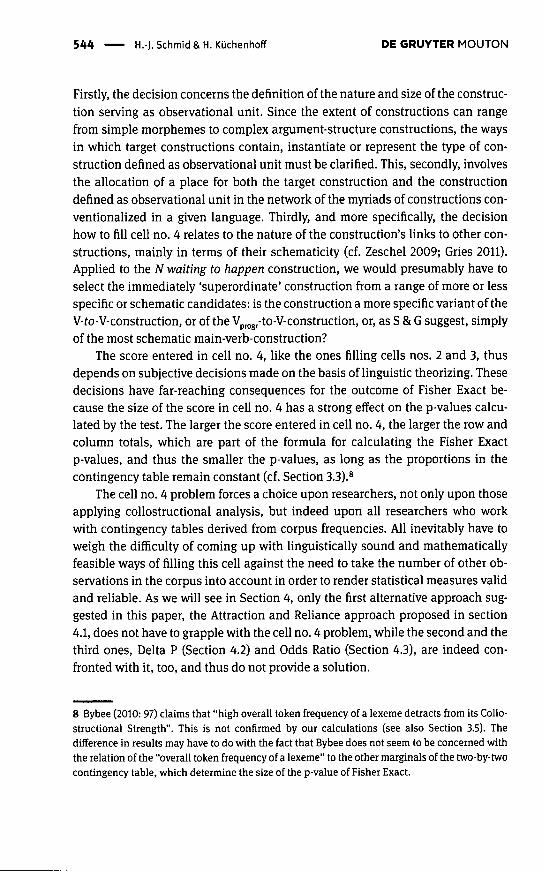
544 H.-J. Schmid&H. Küchenhoff DE GRUYTER MOUTON
Firstly, the decision concerns the definition of the nature and size of the construc-tion serving as observational unit. Since the extent of constructions can rangefrom simple morphemes to complex argument-structure constructions, the waysin which target constructions contain, instantiate or represent the type of con-struction defined as observational unit must be clarified. This, secondly, involvesthe allocation of a place for both the target construction and the constructiondefined as observational unit in the network of the myriads of constructions con-ventionalized in a given language. Thirdly, and more specifically, the decisionhow to fill cell no. 4 relates to the nature of the construction's links to other con-structions, mainly in terms of their schematicity (cf. Zeschel 2009; Gries 2011).Applied to the N waiting to happen construction, we would presumably have toselect the immediately 'superordinate' construction from a range of more or lessspecific or schematic candidates: is the construction a more specific variant of theV-fo-V-construction, or of the Vp^^g -̂to-V-construction, or, as S & G suggest, simplyof the most schematic main-verb-construction?
The score entered in cell no. 4, like the ones filling cells nos. 2 and 3, thusdepends on subjective decisions made on the basis of linguistic theorizing. Thesedecisions have far-reaching consequences for the outcome of Fisher Exact be-cause the size of the score in cell no. 4 has a strong effect on the p-values calcu-lated by the test. The larger the score entered in cell no. 4, the larger the row andcolumn totals, which are part of the formula for calculating the Fisher Exactp-values, and thus the smaller the p-values, as long as the proportions in thecontingency table remain constant (cf. Section 3.3).*
The cell no. 4 problem forces a choice upon researchers, not only upon thoseapplying collostructional analysis, but indeed upon all researchers who workwith contingency tables derived from corpus frequencies. All inevitably have toweigh the difficulty of coming up with linguistically sound and mathematicallyfeasible ways of filling this cell against the need to take the number of other ob-servations in the corpus into account in order to render statistical measures validand reliable. As we will see in Section 4, only the first alternative approach sug-gested in this paper, the Attraction and Reliance approach proposed in section4.1, does not have to grapple with the cell no. 4 problem, while the second and thethird ones. Delta P (Section 4.2) and Odds Ratio (Section 4.3), are indeed con-fronted with it, too, and thus do not provide a solution.
8 Bybee (2010: 97) claims that "high overall token frequency of a lexeme detracts from its Collo-structional Strength". This is not confirmed by our calculations (see also Section 3.5). Thedifference in results may have to do with the fact that Bybee does not seem to be concerned withthe relation of the "overall token frequency of a lexeme" to the other marginals of the two-by-twocontingency table, which determine the size of the p-value of Fisher Exact.
DE GRUYTER MOUTON Measuring lexicogrammatical attraction 545
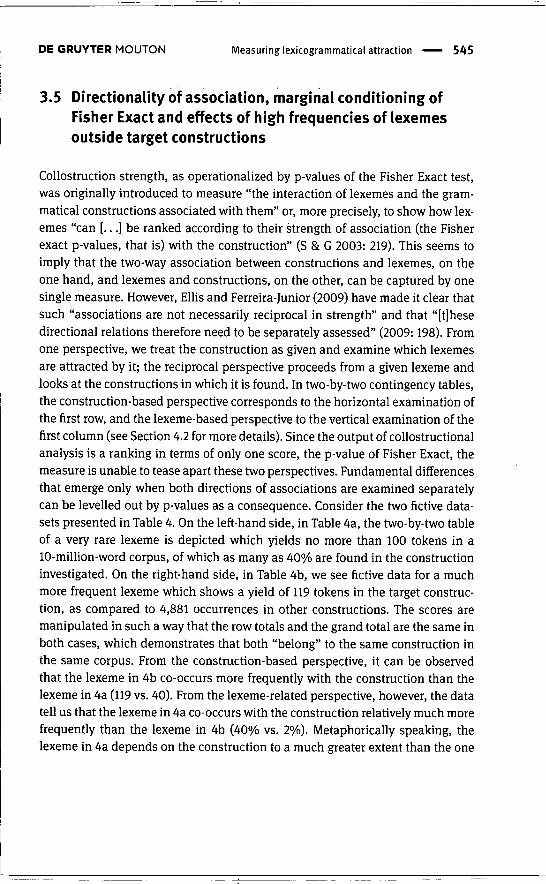
3.5 Directionality of association, marginal conditioning ofFisher Exact and effects of high frequencies of lexemesoutside target constructions
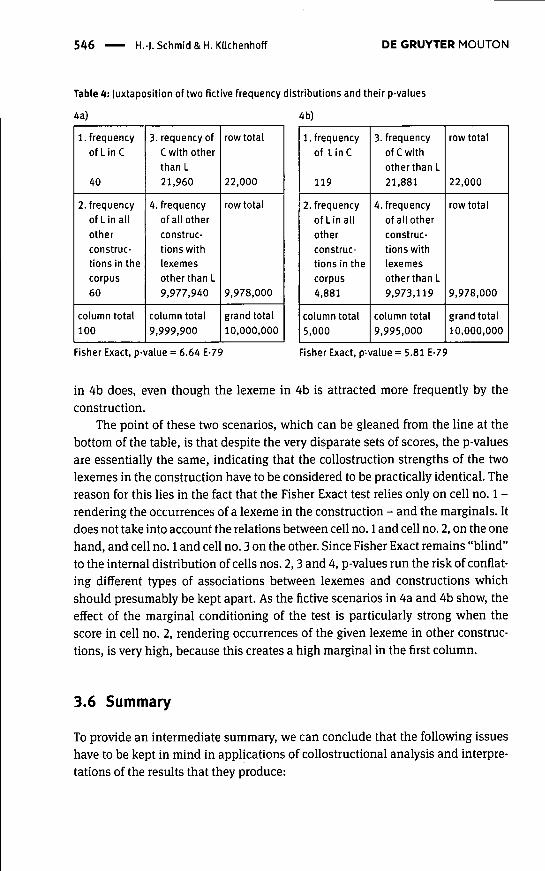
Collostruction strength, as operationalized by p-values of the Fisher Exact test,was originally introduced to measure "the interaction of lexemes and the gram-matical constructions associated with them" or, more precisely, to show how lex-emes "can [...] be ranked according to their strength of association (the Fisherexact p-values, that is) with the construction" (S & G 2003: 219). This seems toimply that the two-way association between constructions and lexemes, on theone hand, and lexemes and constructions, on the other, can be captured by onesingle measure. However, Ellis and Ferreira-Junior (2009) have made it clear thatsuch "associations are not necessarily reciprocal in strength" and that "[t]hesedirectional relations therefore need to be separately assessed" (2009:198). Fromone perspective, we treat the construction as given and examine which lexemesare attracted by it; the reciprocal perspective proceeds from a given lexeme andlooks at the constructions in which it is found. In two-by-two contingency tables,the construction-based perspective corresponds to the horizontal examination ofthe first row, and the lexeme-based perspective to the vertical examination of thefirst column (see Section 4.2 for more details). Since the output of coUostructionalanalysis is a ranking in terms of only one score, the p-value of Fisher Exact, themeasure is unable to tease apart these two perspectives. Fundamental differencesthat emerge only when both directions of associations are examined separatelycan be levelled out by p-values as a consequence. Consider the two fictive data-sets presented in Table 4. On the left-hand side, in Table 4a, the two-by-two tableof a very rare lexeme is depicted which yields no more than 100 tokens in a10-million-word corpus, of which as many as 40% are found in the constructioninvestigated. On the right-hand side, in Table 4b, we see fictive data for a muchmore frequent lexeme which shows a yield of 119 tokens in the target construc-tion, as compared to 4,881 occurrences in other constructions. The scores aremanipulated in such a way that the row totals and the grand total are the same inboth cases, which demonstrates that both "belong" to the same construction inthe same corpus. From the construction-based perspective, it can be observedthat the lexeme in 4b co-occurs more frequently with the construction than thelexeme in 4a (119 vs. 40). From the lexeme-related perspective, however, the datatell us that the lexeme in 4a co-occurs with the construction relatively much morefrequently than the lexeme in 4b (40% vs. 2%). Metaphorically speaking, thelexeme in 4a depends on the construction to a much greater extent than the one
546 H.-). Schmid & H. Küchenhoff DE GRUYTER MOUTON
Table 4: Juxtaposition of two fíctive frequency distributions and their p-values
4a)
1. frequencyofLinC
40
2. frequencyof Lin allotherconstruc-tions in thecorpus60
column total100
3. requency ofC with otherthan L21,960
4. frequencyof all otherconstruc-tions withlexemesother than L9,977,940
column total9,999,900
row total
22,000
row total
9,978,000
grand total10,000,000
4b)
1. frequencyof Line
119
2. frequencyof Lin allotherconstruc-tions in thecorpus4,881
column total5,000
3. frequencyof C withother than L21,881
4. frequencyof all otherconstruc-tions withlexemesother than L9,973,119
column total9,995,000
row total
22,000
row total
9,978,000
grand total10,000,000
Fisher Exact, p-value = 6.64 E-79 Fisher Exact, p-value = 5.81 E-79
in 4b does, even though the lexeme in 4b is attracted more frequently by theconstruction.
The point of these two scenarios, which can be gleaned from the line at thebottom of the table, is that despite the very disparate sets of scores, the p-valuesare essentially the same, indicating that the collostruction strengths of the twolexemes in the construction have to be considered to be practically identical. Thereason for this lies in the fact that the Fisher Exact test relies only on cell no. 1 -rendering the occurrences of a lexeme in the construction - and the marginals. Itdoes not take into account the relations between cell no. 1 and cell no. 2, on the onehand, and cell no. 1 and cell no. 3 on the other. Since Fisher Exact remains "blind"to the internal distribution of cells nos. 2,3 and 4, p-values run the risk of conflat-ing different types of associations between lexemes and constructions whichshould presumably be kept apart. As the fictive scenarios in 4a and 4b show, theeffect of the marginal conditioning of the test is particularly strong when thescore in cell no. 2, rendering occurrences of the given lexeme in other construc-tions, is very high, because this creates a high marginal in the first column.
3.6 Summary
To provide an intermediate summary, we can conclude that the following issueshave to be kept in mind in applications of collostructional analysis and interpre-tations of the results that they produce;
DE GRUYTER MOUTON Measuring lexicogrammatical attraction 547
1. Null-hypothesis testing is based on the assumption that the data are distrib-uted randomly, which is presumably not the case for corpus data.
2. The observations in a corpus do not meet the requirements of random datasampling.
3. The use of a significance measure (the p-value of the Fisher Exact test) as ameasure of collostruction strength causes problems for interpretability.
4. Larger samples reduce p-values as compared to smaller samples with thesame internal distribution.
5. A range of theoretical and practical issues have to be taken into considerationwhen determining the scores to be entered in contingency tables, especiallythe score filling cell no. 4.
6. The directionality - from construction to lexeme vs. lexeme to construction- should be kept in mind.
7. The Fisher-Exact test is conditioned on the marginal distributions in the con-tingency table.
8. High absolute frequencies of lexemes outside the target construction affectp-values.
It should be emphasized that the first and the second points are by no meansspecific to collostructional analysis, but rather are shared by a wide range ofwell-established corpus-linguistic statistics. S & G themselves have stressed thatthe use of the Fisher Exact test and its p-values is not the only option, though ithas clearly been used most frequently in existing apphcations of collostructionalanalysis. One further point of criticism, levelled by Bybee (2010: 98), is that "[p]roponents of Collostructional Analysis hope to arrive at a semantic analysis, butdo not include any semantic factors in their method". Although we are not surewhether Bybee's additional claim that "[s]ince no semantic considerations gointo the analysis, it seems plausible that no semantic analysis can emerge from it"is actually correct, we will come back to this issue in Section 6.
In the next section, we will discuss three alternative approaches to measur-ing the mutual attraction of constructions and lexemes and assess them withregard to their potential to tackle the challenges faced by collostructionalanalysis.
4 Alternative approaches
To be able to illustrate the following discussion with examples, we introduce adataset on a nominal construction, the N-Fiftaf-clause construction (e.g. the factthat ...,the news that... ; cf. Schmid 2000). The data are extracted from the In-
548 H.-J. Schmid & H. Küchenhoff DE GRUYTER MOUTON
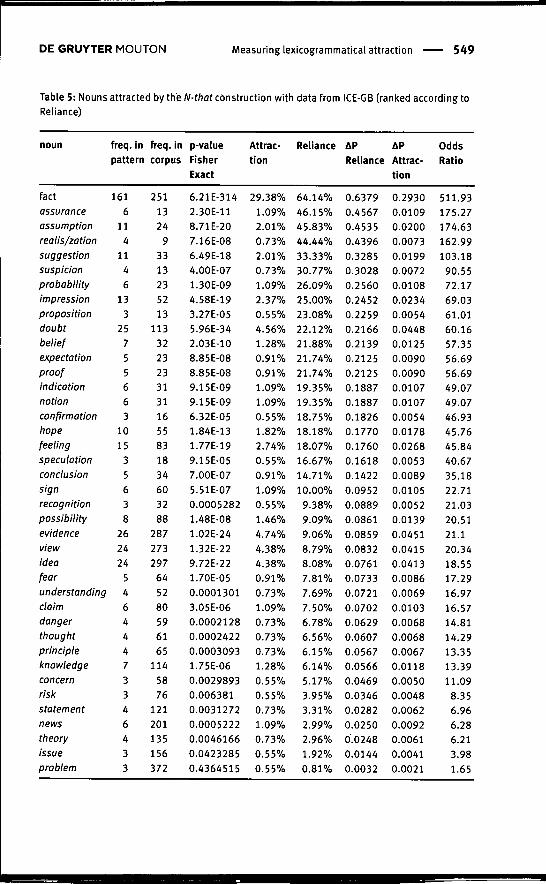
ternational Corpus of English - Great Britain (ICE-GB), which contains only onemillion words and thus avoids the problem of infinite, i.e. zero, scores for collo-struction strength encountered by Schmid (2010). A second advantage of ICE-GBis that it is fully parsed and therefore allows data retrieval with a good ratio ofrecall and precision. Since the data is mainly used for illustrative purposes, onlythe 40 nouns occurring most frequently in the construction will be listed (cf.Table 5). These 40 types account for approximately 83% of all valid tokens of theconstruction. The query <N(com,sing)> that-KCONJUNC> yielded 1,149 hits;manual post-processing identified 601 unwanted hits, leaving us with 548 validhits. Table 5 lists the scores related to this dataset for p-values of the Fisher Exacttest as well as the three measures discussed in this section - Attraction and Reli-ance (Section 4.1), Delta P (AP; Section 4.2) and Odds Ratio (Section 4.3). For thosetests that require cell no. 4 in the contingency table to be filled, it should beknown that the set of singular nouns was chosen as the observational unit underexamination, amounting to 111,387 tokens in the BNC.
4.1 Attraction and Reliance
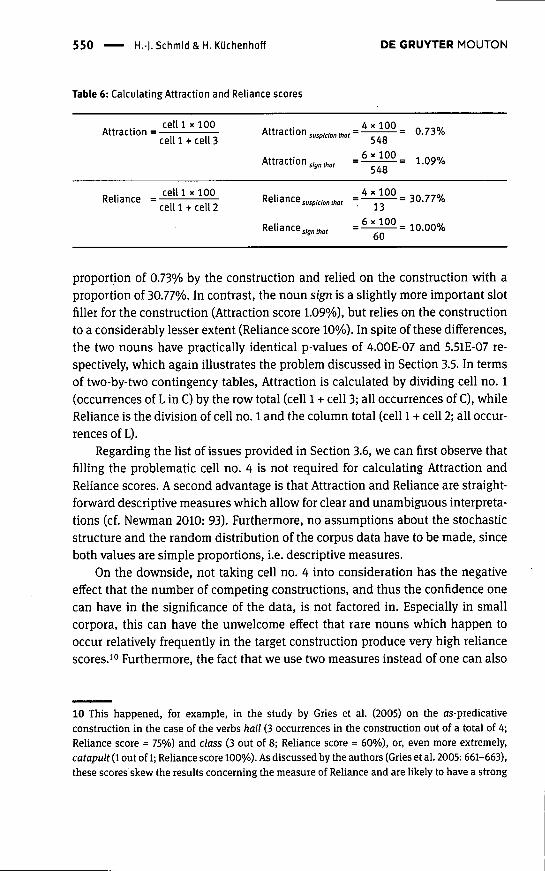
The measures of Attraction and Reliance were proposed prior to the advent ofcollostructional analysis by Schmid (2000: 54-55). The idea of the two measuresis to do justice to the directionality issue (see Section 3.5) by separating the pro-portion with which a grammatical construction is filled by a given lexeme fromthe proportion with which a lexeme occurs in a given construction. The formerproportion is interpreted metaphorically as reflecting the Attraction exerted bythe construction on the lexeme, the latter as reflecting the Reliance of the lexemeon the construction. Attraction is calculated by dividing the frequency of occur-rence of a noun in a construction by the frequency of the construction in thecorpus; Reliance is calculated by dividing the frequency of occurrence of a nounin a construction by its frequency of occurrence in the whole corpus.' To be ableto render the scores as percentages, the dividend is multiplied by 100 in both di-visions. The calculation is shown in Table 6 and illustrated using the scores forthe nouns suspicion and sign given in Table 5:
The scores indicate that the noun suspicion accounted for 0.73% of the usesof the N-that construction in the ICE-GB, and that 30.77% of the uses of the samenoun were found in the N-that construction. The noun was thus attracted with a
9 The measure of Attraction thus corresponds to relative frequency in the construction. What iscaptured by the measure of Reliance has been referred to as Faith in later publications by Griesand others (see Section 5)
DE GRUYTER MOUTON Measuring lexicogrammatical attraction 549
Table 5: Nouns attracted bytheW-fhof construction with data from ICE-GB (ranked according toReliance)
noun
factassuranceassumptionreatis/zationsuggestionsuspicionprobabilityimpressionpropositiondoubtbeliefexpectationproofindicationnotionconfirmationhopefeelingspeculationconclusionsignrecognitionpossibilityevidenceviewideafearunderstandingclaimdangerthoughtprincipleknowledgeconcernriskstatementnewstheoryissueproblem
freq. inpattern
1616
11
411
4
6
133
25755663
10
153
5638
26
2424
5464447
3346433
freq. incorpus
2511324
933132352
13113
32
232331311655831834603288
287273297
645280
5961
65114
5876
121201
135156372
p-valueFisherExact
6.21E-3142.30E-118.71E-207.16E-086.49E-184.00E-071.30E-094.58E-193.27E-055.96E-342.O3E-1O8.85E-088.85E-089.15E-099.15E-O96.32E-051.84E-131.77E-199.15E-057.00E-075.51E-070.00052821.48E-081.02E-241.32E-229.72E-221.70E-050.00013013.05E-060.00021280.00024220.00030931.75E-060.00298930.0063810.00312720.00052220.00461660.04232850.4364515
Attrac-tion
29.38%1.09%2.01%0.73%2.01%0.73%1.09%2.37%0.55%4.56%1.28%0.91%0.91%1.09%1.09%0.55%1.82%2.74%0.55%0.91%1.09%0.55%1.46%4.74%4.38%4.38%0.91%0.73%1.09%0.73%0.73%0.73%1.28%0.55%0.55%0.73%1.09%0.73%0.55%0.55%
Reliance
64.14%46.15%45.83%44.44%33.33%30.77%26.09%25.00%23.08%22.12%21.88%21.74%21.74%,19.35%19.35%18.75%18.18%18.07%16.67%14.71%10.00%
9.38%9.09%9.06%8.79%8.08%7.81%7.69%7.50%6.78%6.56%6.15%6.14%5.17%3.95%3.31%2.99%2.96%1.92%0.81%
AP
Reliance
0.63790.45670.45350.43960.32850.30280.25600.24520.22590.21660.21390.21250.21250.18870.18870.18260.17700.17600.16180.14220.09520.08890.08610.08590.08320.07610.07330.07210.07020.06290.06070.05670.05660.04690.03460.02820.02500.02480.01440.0032
AP
Attrac-tion
0.29300.01090.02000.00730.01990.00720.01080.02340.00540.04480.01250.00900.00900.01070.01070.00540.01780.02680.00530.00890.01050.00520.01390.04510.04150.04130.00860.00690.01030.00680.00680.00670.01180.00500.00480.00620.00920.00610.00410.0021
OddsRatio
511.93175.27174.63162.99103.18
90.5572.1769.0361.0160.1657.3556.6956.6949.0749.0746.9345.7645.8440.6735.1822.7121.0320.5121.120.3418.5517.2916.9716.5714.8114.2913.3513.3911.09
8.356.966.286.213.981.65
550 H.-J. Schmid & H. Küchenhoff DE GRUYTER MOUTON
Table 6: Calculating Attraction and Reliance scores
Attraction ,
= 30.77%
Reliance ,„„„„ , = ̂ JLlOO = io.oo%oU
proportion of 0.73% by the construction and relied on the construction with aproportion of 30.77%. In contrast, the noun sign is a slightly more important slotfiller for the construction (Attraction score 1.09%), but relies on the constructionto a considerably lesser extent (ReHance score 10%). In spite of these differences,the two nouns have practically identical p-values of 4.00E-07 and 5.51E-O7 re-spectively, which again illustrates the problem discussed in Section 3.5. In termsof two-by-two contingency tables. Attraction is calculated by dividing cell no. 1(occurrences of L in C) by the row total (cell 1 -K cell 3; all occurrences of C), whileReliance is the division of cell no. 1 and the column total (cell 1 -i- cell 2; all occur-rences of L).
Regarding the list of issues provided in Section 3.6, we can first observe thatfilling the problematic cell no. 4 is not required for calculating Attraction andReliance scores. A second advantage is that Attraction and Reliance are straight-forward descriptive measures which allow for clear and unambiguous interpreta-tions (cf. Newman 2010: 93). Furthermore, no assumptions about the stochasticstructure and the random distribution of the corpus data have to be made, sinceboth values are simple proportions, i.e. descriptive measures.
On the downside, not taking cell no. 4 into consideration has the negativeeffect that the number of competing constructions, and thus the confidence onecan have in the significance of the data, is not factored in. Especially in smallcorpora, this can have the unwelcome effect that rare nouns which happen tooccur relatively frequently in the target construction produce very high reliancescores. 1° Furthermore, the fact that we use two measures instead of one can also
10 This happened, for example, in the study by Gries et al. (2005) on the as-predicativeconstruction in the case of the verbs hail (3 occurrences in the construction out of a total of 4;Reliance score = 75%) and class (3 out of 8; Reliance score = 60%), or, even more extremely,catapult (1 out of 1; Reliance score 100%). As discussed by the authors (Gries et al. 2005:661-663),these scores skew the results concerning the measure of Reliance and are likely to have a strong
DE GRUYTER MOUTON Measuring lexicogrammatical attraction 551
be seen as a disadvantage of this proposal, as a simple rank ordering is of courseimpossible. Attempts to conflate the values in one commonly used statisticalmeasure such as Mutual Information or the Jaccard distance run into interpreta-tive problems, largely caused by the very fact that the phenomenon we want tomeasure may in fact be two-dimensional.
4.2 Delta P(AP)
As has been noted, one drawback of the measures of Attraction and Reliance isthat they do not take the observation concerning the number of other lexemes inother constructions rendered in cell no. 4 into account. This shortcoming is atleast potentially redressed by the measure of Delta P (AP), which is suggested byEllis and Ferreira-Junior (2009). As noted in Section 3.5, Ellis and Ferreira-Junioralso emphasize that two reciprocal rather than one unifying measure may be re-quired to assess the association between constructions and lexemes, on the onehand, and lexemes and constructions, on the other, and therefore recommendthe use of two scores.
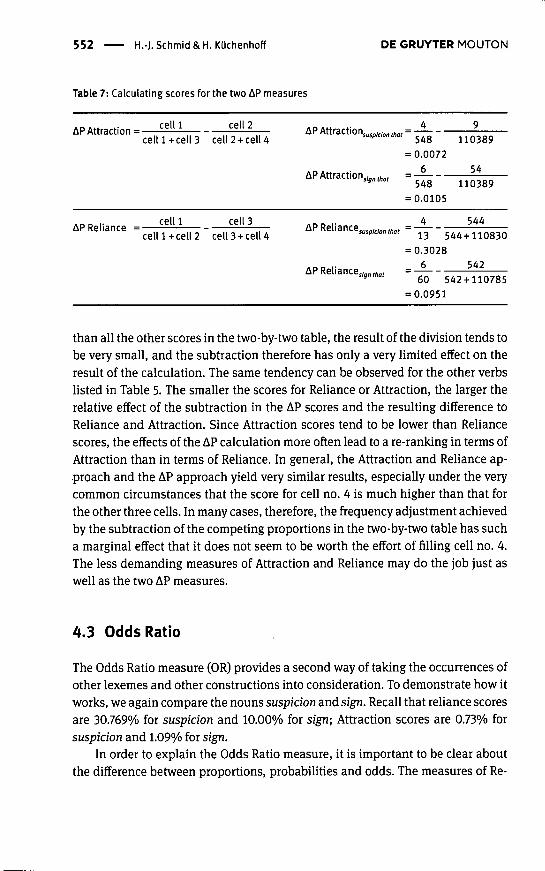
Technically, AP measures the contingent probability of a given constructionattracting a given lexeme (AP construction -^ word; henceforth "AP Attraction")and of a given lexeme relying on a given construction (AP word -> construction;henceforth "AP Reliance"). In order to do so, it goes beyond Reliance and Attrac-tion as such and takes into account additional information related to other prob-,abilities. The calculation of AP Attraction starts out from the score for Attractionbut subtracts from this score the division of cell 2 by the row total of cells 2 and 4,which relates the occurrences of other lexemes in the construction to the occur-rences of all other lexemes in other constructions. Analogously, the calculation ofAP Reliance starts out from Reliance but subtracts the division of cell 3 by thecolumn total of cells 3 and 4. (cf. Table 7), thus taking into account the relationbetween the occurrences of the construction with other lexemes and the occur-rences of other constructions with other lexemes.
Comparing the two AP scores to the Attraction and Rehance scores renderedfor suspicion and sign in Table 6, one immediately notices that the correspondingscores are almost identical (if one neglects the fact that Attraction and Relianceare given as percentages). The reason for this is that the score for cell no. 4 is partof the denominator of the second division. Since this score is usually much larger
negative effect on the predictive power of Reliance (see Section 5 for more details). Effects likethese can only be avoided by using larger corpora.
552 H.-J. Schmid&H. KUchenhoff DE GRUYTER MOUTON
Table 7: Calculating scores for the two AP measures
c e l l l + c e l l 3 cell2 + cel l4
cell 1+cel l 2 cell 3 +cell 4
APAttraction,„,,„,„„„„,
APArae >on^ig„a,ct
APReliance,„,p,„„„,ft„,
APReliancej,g„,ft„,
4
548= 0.0072
6548
= 0.0105
13 5'= 0.3028
6
9110389
54110389
54444 + 110830
54260 542 + 110785
= 0.0951
than all the other scores in the two-by-two table, the result of the division tends tobe very small, and the subtraction therefore has only a very limited effect on theresult of the calculation. The same tendency can be observed for the other verbslisted in Table 5. The smaller the scores for Reliance or Attraction, the larger therelative effect of the subtraction in the AP scores and the resulting difference toReliance and Attraction. Since Attraction scores tend to be lower than Reliancescores, the effects of the AP calculation more often lead to a re-ranking in terms ofAttraction than in terms of Reliance. In general, the Attraction and Reliance ap-proach and the AP approach yield very similar results, especially under the verycommon circumstances that the score for cell no. 4 is much higher than that forthe other three cells. In many cases, therefore, the frequency adjustment achievedby the subtraction of the competing proportions in the two-by-two table has sucha marginal effect that it does not seem to be worth the effort of filling cell no. 4.The less demanding measures of Attraction and Reliance may do the job just aswell as the two AP measures.
4.3 Odds Ratio
The Odds Ratio measure (OR) provides a second way of taking the occurrences ofother lexemes and other constructions into consideration. To demonstrate how itworks, we again compare the nouns suspicion and sign. Recall that reliance scoresare 30.769% for suspicion and 10.00% for sign; Attraction scores are 0.73% forsuspicion and 1.09% for sign.
In order to explain the Odds Ratio measure, it is important to be clear aboutthe difference between proportions, probabilities and odds. The measures of Re-
DE GRUYTER MOUTON Measuring lexicogrammatical attraction 553
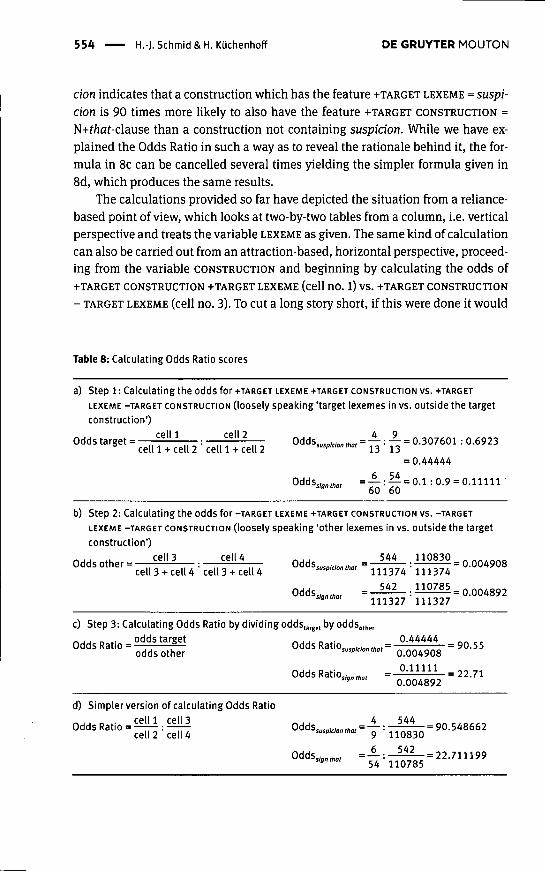
liance and Attraction reflect proportions in the observed data relating the fre-quency of the tokens of a target lexeme in a construction to either the total of thetokens of the lexeme in the corpus (Reliance), or to the total of the tokens of theconstruction in the corpus (Attraction). If one has sufficient trust in the dataset,one can interpret observed proportions as providing information about the prob-ability that a certain event will happen again, in our case the probability that agiven noun will occur in a construction or, more precisely, that a construction willhave the values -I-TARGET LEXEME and -fTARGET CONSTRUCTION. From the perspec-tive of the lexeme, loosely speaking, the probability that sign occurs in the N-t-that-clause construction is 10% or 0.1, and that of suspicion 30.769% or 0.30769. Thenotion of odds refers to a simple transformation or function of the probability. Itrelates the probability which is based on what has been observed to the probabil-ity of what could also have happened given the full set of possibilities. Odds thusrelate probabilities to converse probabilities. Focusing first on the variableLEXEME, the converse probability can be expressed as the number of construc-tions featuring the values -I-TARGET LEXEME and -TARGET CONSTRUCTION, or, inother words, the proportion of the tokens of the target lexemes in other construc-tions out of all tokens of the lexeme, yielding (60 - 6) : 60 = 0.9 for sign and (13 -4) : 13 = 0.6923 for suspicion. The odds of the occurrence of the lexeme in theconstruction are then calculated by dividing the probability of their occurrence inthe construction by the converse probability (cf. Table 8a). Transforming Reliancescores into fractions, these calculations can be rendered as 0.1: 0.9 = 0.11111 forsign and 0.30769:0.6923 = 0.44444 for suspicion.^^ The resulting scores expressthe chance that any construction in the corpus which contains the nouns sign orsuspicion respectively also contains or represents the N-i-that-clause construction.The Odds Ratio, however, as is indicated by the term Ratio, goes one step furtherthan that and relates the odds of constructions containing the noun (i.e. featuringthe value -f TARGET LEXEME) to the odds of constructions not containing the noun,that is, the odds of the sets of constructions featuring the values -TARGET LEXEME
-I-TARGET CONSTRUCTION VS. -TARGET LEXEME -TARGET CONSTRUCTION. This Cal-culation is analogous to the earlier one, but it does not operate on cells nos. 1 and2 in the contingency table, but rather on cells nos. 3 and 4 (see Table 8b). Onceboth odds are known, the ratio between them can be calculated by dividing theodds for constructions with the feature -I-LEXEME by the odds for the construc-tions with the feature -LEXEME (see Table 8c). The resulting Odds Ratio scores areimmediately interpretable in such a way that the Odds Ratio of 90 given for suspi-
11 Note that the converse probability can also be worked out by subtracting the probability (orReliance) score from 1. For sign the subtraction of 0.1 from 1 yields 0.9, and for suspicion, thesubtraction of 0.30769 from 1 yields 0.6923.
554 H.-J. Schmid&H. Küchenhoff DE GRUYTER MOUTON
cion indicates that a construction which has the feature -I-TARGET LEXEME = suspi-cion is 90 times more likely to also have the feature -I-TARGET CONSTRUCTION =N-1-fftaí-clause than a construction not containing suspicion. While we have ex-plained the Odds Ratio in such a way as to reveal the rationale behind it, the for-mula in 8c can be cancelled several times yielding the simpler formula given in8d, which produces the same results.
The calculations provided so far have depicted the situation from a reliance-based point of view, which looks at two-by-two tables from a column, i.e. verticalperspective and treats the variable LEXEME as given. The same kind of calculationcan also be carried out from an attraction-based, horizontal perspective, proceed-ing from the variable CONSTRUCTION and beginning by calculating the odds of-I-TARGET CONSTRUCTION -(-TARGET LEXEME (cell nO. 1) VS. -I-TARGET CONSTRUCTION
- TARGET LEXEME (cell no. 3). To cut a long story short, if this were done it would
Table 8: Calculating Odds Ratio scores
a) Step 1: Calculatingtheoddsfor+TARGEr LEXEME-HARGETCONsrRucTioN vs. +TARGEr
LEXEME -rARGET CONSTRUCTION (loosely Speaking'target lexemes in vs. outside the target
construction')
ñ ñ ^ ^:^=0.307601:0.6923
=0.44444
b) Step 2: Calculating the odds for -TARGET LEXEME -^TARGET CONSTRUCTION VS. -TARGET
LEXEME -TARGET CONSTRUCTION (loosely Speaking 'other lexemes in vs. outside the target
construction')
c) step 3: Calculating Odds Ratio by dividing odds^^^,
OddsRatio„,„„„, = -2 :1111^ = 22.71' """"" 0.004892
d) Simpler version of calculating Odds Ratio
Odds Ratio = g i l : i f i i l Odds.„.,,„„„ = f : ̂ = 90.548662
DE GRUYTER MOUTON Measuring lexicogrammatical attraction 555
eventually turn out that, for siniple mathematical reasons, reHance-based andattraction-based Odds Ratio scores are in fact invariably identical. The attraction-based formula - (cell 1: cell 3):(cell 2: cell 4) - corresponding to the reliance-basedone given in Table 8d would yield the same result. This mathematical propertymakes the use of the Odds Ratio quite attractive in our view because it can be in-terpreted as an overall frequency-adjusted measure for both reliance and attrac-tion which can be used if one insists on keeping available the option of rankinglexemes on one scale in order to be able to compare them on one dimension.
Odds Ratio scores can be related to the Fisher Exact by recognizing that anOdds Ratio of 1 corresponds to the null hypothesis that there is no attraction.Small p-values of the order mentioned in earlier sections of this paper correspondto very high Odds Ratio scores, as is exemplified by the Odds Ratio score for factin Table 5. However, as has been shown, identical p-values, like those renderedfor suspicion and sign in Table 5, can correspond to substantially different OddsRatio scores (22.7 as opposed to 90.5) if Reliance scores differ significantly.
Odds Ratio is superior to the Attraction and Reliance approach in that it isboth frequency-adjusted and bi-directional. Like AP, it is superior to Fisher Exactin yielding effect sizes rather than p-values as measures of attraction, and in notrelying on the stochastic nature of the data and the randomness assumption. LikeAP and Fisher Exact, however, it does not solve the cell no. 4 problem.
4.4 Discussion
What, in summary, are the differences between the tests presented? Before wereturn to the list of issues provided in section 3.6, it will be illuminating to high-light quantitative similarities and differences in the outcomes of the four tests.This can be done by comparing the different rankings of the nouns as rendered bythe scores. As already mentioned above. Reliance and AP Reliance yield identicalrankings. In terms of ranks. Odds Ratio is also almost identical to Reliance, eventhough Odds Ratio is frequency-adjusted. AP Attraction and Attraction rank thecollexemes in the same order, which is also very similar to that in terms of FisherExact. These similarities are reflected in the Spearman correlation matrix given inTable 9.
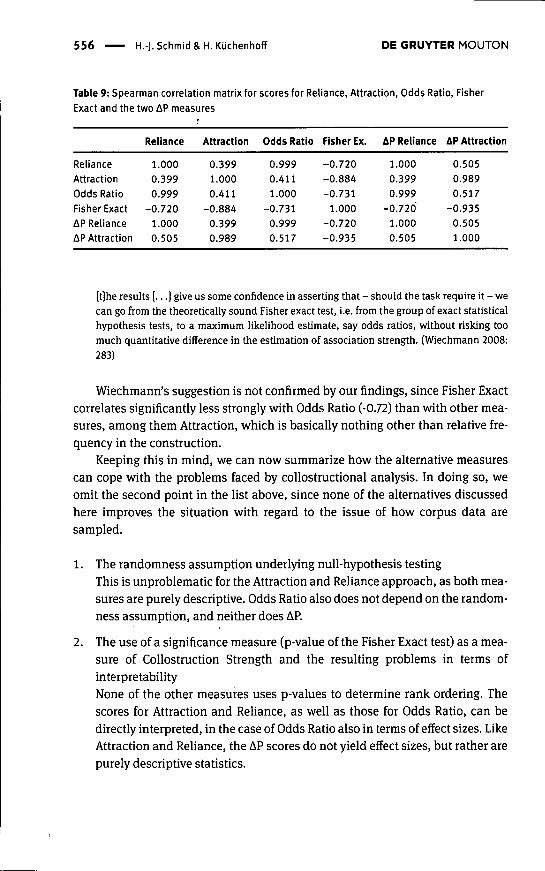
A significant but considerably weaker correlation can be observed betweenAttraction and especially AP Attraction, on the one hand, and Fisher Exact, onthe other. What is remarkable here is that Odds Ratio, which is a bi-directionalmeasure, sides with the ReHance perspective, rather than with Fisher Exact andthe Attraction perspective. This is particularly interesting if we consider the fol-lowing claim by Wiechmann (2008):
5 5 6 H.-J. Schmid & H. KUchenhoff DE GRUYTER MOUTON
Table 9: Spearman.correlation matrix for scores for Reliance, Attraction, Odds Ratio, Fisher
Exact and the two AP measures
RelianceAttraction
Odds RatioFisher Exact
AP RelianceAP Attraction
Reliance
1.0000.3990.999
-0.7201.0000.505
Attraction
0.3991.0000.411
-0.8840.3990.989
Odds Ratio
0.9990.4111.000
-0.7310.9990.517
Fisher Ex.
-0.720-0.884-0.731
1.000-0.720-0.935
AP Reliance
1.0000.3990.999
-0.7201.0000.505
AP Attraction
0.5050.9890.517
-0.9350.5051.000
[t]he results [...] give us some confidence in asserting that - should the task require it - wecan go from the theoretically sound Fisher exact test, i.e. from the group of exact statisticalhypothesis tests, to a maximum likelihood estimate, say odds ratios, without risking toomuch quantitative difference in the estimation of association strength. (Wiechmann 2008:283)
Wiechmann's suggestion is not confirmed by our findings, since Fisher Exactcorrelates significantly less strongly with Odds Ratio (-0.72) than with other mea-sures, among them Attraction, which is basically nothing other than relative fre-quency in the construction.
Keeping this in mind, we can now summarize how the alternative measurescan cope with the problems faced by collostructional analysis. In doing so, weomit the second point in the list above, since none of the alternatives discussedhere improves the situation with regard to the issue of how corpus data aresampled.
1. The randomness assumption underlying null-hypothesis testingThis is unproblematic for the Attraction and Reliance approach, as both mea-sures are purely descriptive. Odds Ratio also does not depend on the random-ness assumption, and neither does AP.
2. The use of a significance measure (p-value of the Fisher Exact test) as a mea-sure of Collostruction Strength and the resulting problems in terms ofinterpretabilityNone of the other measures uses p-values to determine rank ordering. Thescores for Attraction and Reliance, as well as those for Odds Ratio, can bedirectly interpreted, in the case of Odds Ratio also in terms of effect sizes. LikeAttraction and Reliance, the AP scores do not yield effect sizes, but rather arepurely descriptive statistics.
DE GRUYTER MOUTON Measuring lexicogrammatical attraction —— 557
3. The effect of sample sizes on p-valuesSince none of the other measures uses p-values to measure associationstrength, this issue is not a problem for them.
4. The theoretical rationale behind and practical feasibility of filling cell no. 4The calculation of Attraction and Reliance does not require researchers to fillcell no. 4, but the price for this is that the two measures are not frequency-adjusted. In order to calculate AP and Odds Ratio scores the cell must befilled; thus they do not overcome this problem, which remains perhaps themost serious challenge. The frequency adjustment achieved by the AP scoresin comparison with Attraction and Reliance seems negligible.
5. The problem of directionality - from construction to lexeme vs. lexeme toconstructionThe Attraction and Reliance approach and the AP test yield two different mea-sures reflecting the two directions of association. Like CollostructionStrength, Odds Ratio provides one measure, which is, however, mathemati-cally bi-directional, yielding identical results for the Reliance and the Attrac-tion perspectives. Interestingly, the two bi-directional measures highlightdifferent aspects of the data: Odds Ratio is more in line with Reliance, FisherExact more similar to the Attraction perspective.
6. The fact that the Fisher Exact test is conditioned on the marginal distribu-tions in the contingency tableSince they do not test for statistical significance, none of the other four mea-sures is subject to the same restrictions.
7. The potential effects of high absolute frequencies of lexemes outside thetarget constructionThe effect observed in the calculation of Fisher Exact arises from the fact thatp-values are strongly determined by the marginals. A similar effect occurs forAttraction and AP Attraction. Reliance, AP Reliance and Odds Ratio do notaward high ranks to lexemes with high absolute frequencies but compara-tively low Reliance scores.
A candidate for an ideal measure does not emerge from this methodological dis-cussion. The key question to be discussed in the remainder of this paper concernsthe way in which and the extent of confidence with which these different mea-sures of quantitative data retrieved from corpora can in fact be used to modellexicogrammatical associations in the minds of speakers. To discuss this ques-tion, we will first look at external experimental evidence (Section 5) and then
558 H.-J. Schmid & H. Küchenhoff DE GRUYTER MOUTON
discuss the cognitive underpinnings of representations of lexicogrammatical as-sociations in the minds of speakers (Section 6).
5 External experimental evidence
To date, very few studies have tried explicitly to relate corpus results and mea-surements of lexicogrammatical associations to behavioural data elicited in asystematic and controlled way in experimental settings. Four studies stand outand win be reviewed in some detail here: Gries et al. (2005, 2010), Wiechmann(2008) and Ellis and Ferreira-Junior (2009)."
In a series of two papers, Gries et al. (2005, 2010) have attempted to test thepsychological plausibility of collostructional analysis and to demonstrate its pre-dictive superiority over less sophisticated ways of counting frequencies in cor-pora, such as relative token frequencies (cf. Bybee and Eddington 2006, andBybee 2010: 98 for a discussion). Their test case is the as-predicative constructionalready mentioned in Section 3.3, which can be exemphfied by utterances such asHe regarded him as stupid (Gries et al. 2005: 636). As the example indicates, theconstruction consists of complex-transitive verbs complemented by objects andobject complements that are introduced by as. What the authors essentially do iscompare two types of indicators for the association strength between verbs andthe construction derived from corpus data - collostruction strength as measuredby Fisher Exact p-values and relative frequency counts of observed occunences,i.e. basically Attraction - with the results of a sentence-completion task intendedto investigate important aspects of the processing of the construction. The stimulifor the sentence-completion task were active and passive sentence beginnings ofthe type illustrated in 1 (Gries et al. 2005: 658). Informants were asked to provideplausible continuations.
(1) a. The biographer depicted the young philosopherb. The young philosopher was depicted
12 Another relevant publication, which will be mentioned below, is Divjak (2008) on Polisht/iai-constructions. Further studies that correlate behavioural data or semantic interpretationswith the results of collostructional analyses but do not attempt to provide external experimentalevidence, including, for example, Szmrecsanyi (2005), Gilquin (2006), CoUeman (2009a and2009b), Gries and Wulff (2009), Backus and Mos (2011) and Höche (2011), wUl not be discussedhere.
DE GRUYTER MOUTON Measuring lexicogrammatical attraction 559
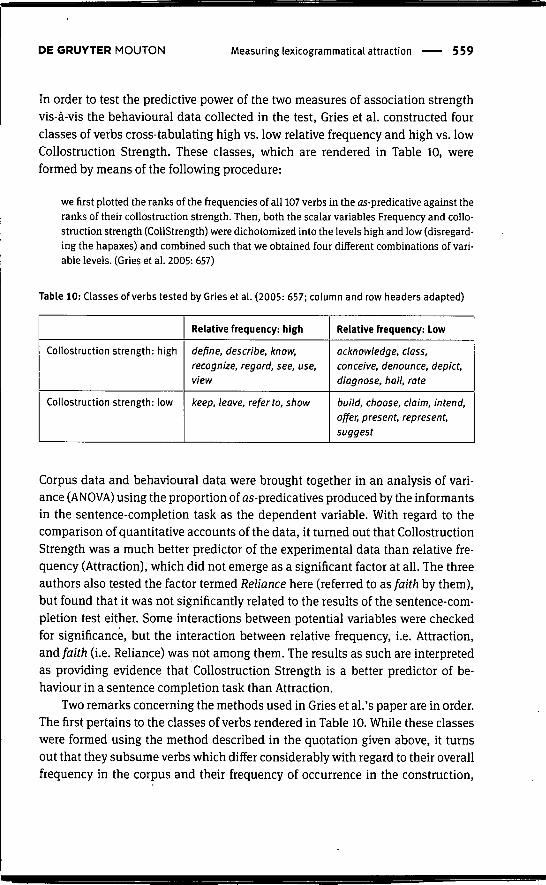
In order to test the predictive power of the two measures of association strengthvis-à-vis the behavioural data collected in the test, Gries et al. constructed fourclasses of verbs cross-tabulating high vs. low relative frequency and high vs. lowCollostruction Strength. These classes, which are rendered in Table 10, wereformed by means of the following procedure:
we nrst plotted the ranks of the frequencies of all 107 verbs in the as-predicative against theranks of their collostruction strength. Then, both the scalar variables Frequency and collo-struction strength (CoUStrength) were dichotomized into the levels high and low (disregard-ing the hapaxes) and combined such that we obtained four different combinations of vari-able levels. (Gries et al. 2005: 657)
Table 10: Classes of verbs tested by Gries et al. (2005: 657; column and row headers adapted)
Collostruction strength: high
Collostruction strength: low
Relative frequency: high
define, describe, know,recognize, regard, see, use,view
keep, leave, refer to, show
Relative frequency: Low
acknowledge, class,conceive, denounce, depict,diagnose, halt, rate
build, choose, claim, intend,offer, present, represent,suggest
Corpus data and behavioural data were brought together in an analysis of vari-ance (ANOVA) using the proportion of as-predicatives produced by the informantsin the sentence-completion task as the dependent variable. With regard to thecomparison of quantitative accounts of the data, it turned out that CollostructionStrength was a much better predictor of the experimental data than relative fre-quency (Attraction), which did not emerge as a significant factor at all. The threeauthors also tested the factor termed Reliance here (referred to as faith by them),but found that it was not significantly related to the results of the sentence-com-pletion test either. Some interactions between potential variables were checkedfor significance, but the interaction between relative frequency, i.e. Attraction,and faith (i.e. Reliance) was not among them. The results as such are interpretedas providing evidence that Collostruction Strength is a better predictor of be-haviour in a sentence completion task than Attraction.
Two remarks concerning the methods used in Gries et al.'s paper are in order.The first pertains to the classes of verbs rendered in Table 10. While these classeswere formed using the method described in the quotation given above, it turnsout that they subsume verbs which differ considerably with regard to their overallfrequency in the corpus and their frequency of occurrence in the construction.
560 H.-J. Schmid & H. Küchenhoff DE GRUYTER MOUTON
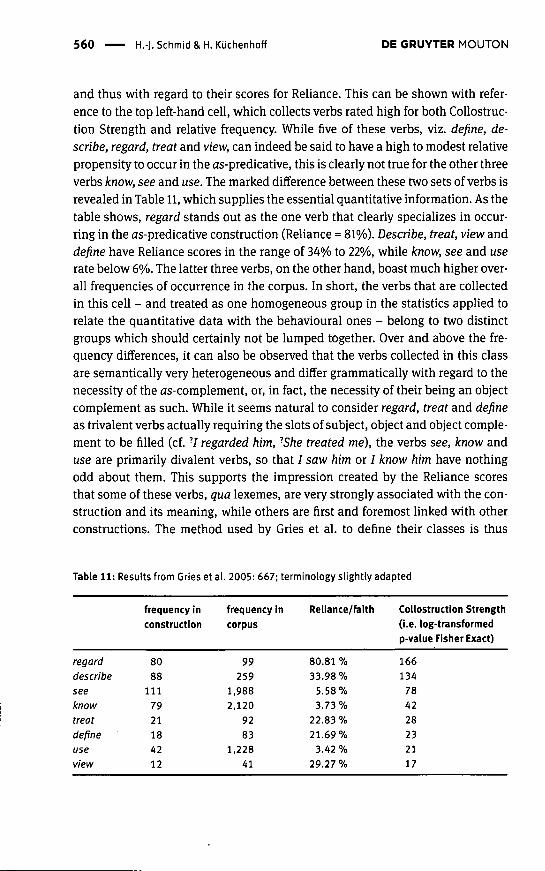
and thus with regard to their scores for Reliance. This can be shown with refer-ence to the top left-hand cell, which collects verbs rated high for both Collostruc-tion Strength and relative frequency. While five of these verbs, viz. define, de-scribe, regard, treat and view, can indeed be said to have a high to modest relativepropensity to occur in the as-predicative, this is clearly not true for the other threeverbs know, see and use. The marked difference between these two sets of verbs isrevealed in Table 11, which supplies the essential quantitative information. As thetable shows, regard stands out as the one verb that clearly specializes in occur-ring in the as-predicative construction (Reliance = 81%). Describe, treat, view anddefine have Reliance scores in the range of 34% to 22%, while know, see and userate below 6%. The latter three verbs, on the other hand, boast much higher over-all frequencies of occurrence in the corpus. In short, the verbs that are collectedin this cell - and treated as one homogeneous group in the statistics applied torelate the quantitative data with the behavioural ones - belong to two distinctgroups which should certainly not be lumped together. Over and above the fre-quency differences, it can also be observed that the verbs collected in this classare semantically very heterogeneous and differ grammatically with regard to thenecessity of the as-complement, or, in fact, the necessity of their being an objectcomplement as such. While it seems natural to consider regard, treat and defineas trivalent verbs actually requiring the slots of subject, object and object comple-ment to be filled (cf. '7 regarded him, ^She treated me), the verbs see, know anduse are primarily divalent verbs, so that / saw him or / know him have nothingodd about them. This supports the impression created by the Reliance scoresthat some of these verbs, qua lexemes, are very strongly associated with the con-struction and its meaning, while others are first and foremost linked with otherconstructions. The method used by Gries et al. to define their classes is thus
Table 11: Results from Gries et al. 2005: 667; terminology slightly adapted
regarddescribeseeknowtreatdefineuseview
frequency inconstruction
8088
1117921184212
frequency incorpus
99259
1,9882,120
9283
1,22841
Reliance/faith
80.81 %33.98 %
5.58%3.73 %
22.83 %21.69%
3.42 %29.27 %
Collostruction Strength(i.e. log-transformedp-value Fisher Exact)
166134784228232117
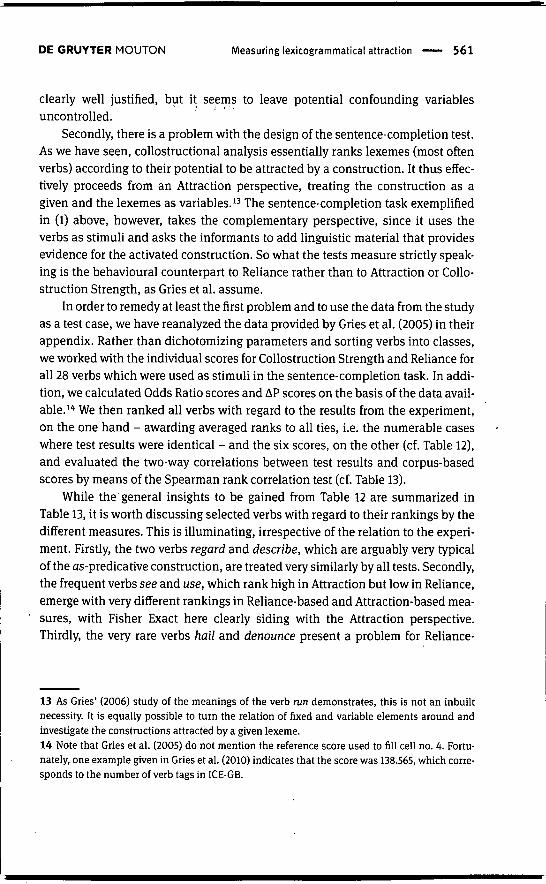
DE GRUYTER MOUTON Measuring lexicogrammatical attraction — 561
clearly well justified, but it seems to leave potential confounding variablesuncontrolled.
Secondly, there is a problem with the design of the sentence-completion test.As we have seen, collostructional analysis essentially ranks lexemes (most oftenverbs) according to their potential to be attracted by a construction. It thus effec-tively proceeds from an Attraction perspective, treating the construction as agiven and the lexemes as variables." The sentence-completion task exemplifiedin (1) above, however, takes the complementary perspective, since it uses theverbs as stimuli and asks the informants to add linguistic material that providesevidence for the activated construction. So what the tests measure strictly speak-ing is the behavioural counterpart to Reliance rather than to Attraction or Collo-struction Strength, as Gries et al. assume.
In order to remedy at least the first problem and to use the data from the studyas a test case, we have reanalyzed the data provided by Gries et al. (2005) in theirappendix. Rather than dichotomizing parameters and sorting verbs into classes,we worked with the individual scores for Collostruction Strength and Reliance forall 28 verbs which were used as stimuli in the sentence-completion task. In addi-tion, we calculated Odds Ratio scores and AP scores on the basis of the data avail-able, i'' We then ranked all verbs with regard to the results from the experiment,on the one hand - awarding averaged ranks to all ties, i.e. the numerable caseswhere test results were identical - and the six scores, on the other (cf. Table 12),and evaluated the two-way correlations between test results and corpus-basedscores by means of the Spearman rank correlation test (cf. Table 13).
While the general insights to be gained from Table 12 are summarized inTable 13, it is worth discussing selected verbs with regard to their rankings by thedifferent measures. This is illuminating, irrespective of the relation to the experi-ment. Firstly, the two verbs regard and describe, which are arguably very typicalof the as-predicative construction, are treated very similarly by all tests. Secondly,the frequent verbs see and use, which rank high in Attraction but low in Reliance,emerge \nth very different rankings in Reliance-based and Attraction-based mea-sures, with Fisher Exact here clearly siding with the Attraction perspective.Thirdly, the very rare verbs hail and denounce present a problem for Reliance-
13 As Gries' (2006) study of the meanings of the verb run demonstrates, this is not an inbuiltnecessity. It is equally possible to turn the relation of fixed and variable elements around andinvestigate the constructions attracted by a given lexeme.14 Note that Gries et al. (2005) do not mention the reference score used to fill cell no. 4. Fortu-nately, one example given in Gries et al. (2010) indicates that the score was 138.565, which corre-sponds to the number of verb tags in ICE-GB.
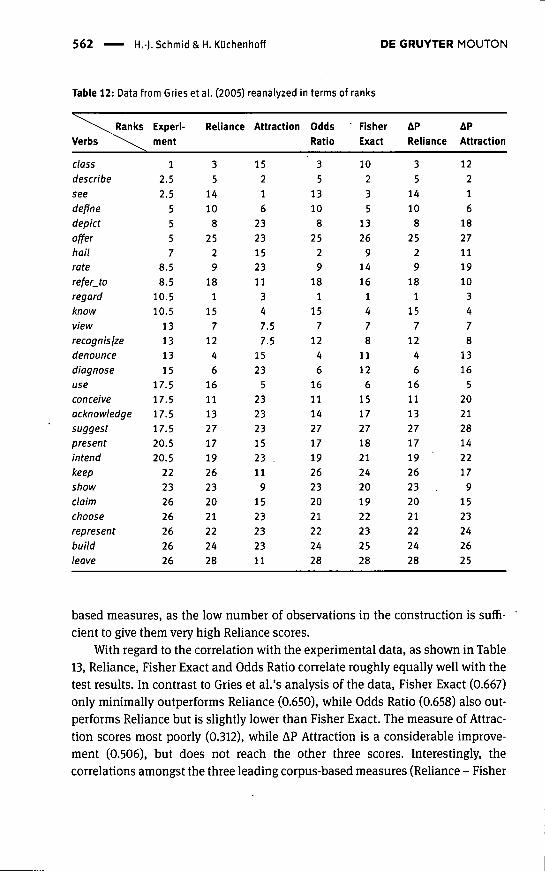
562 H.-J. Schmid&H. Küchenhoff DE GRUYTER MOUTON
Table 12: Data from Gries et al. (2005) reanalyzed in terms of ranks
^ • ^ ^ Ranks
Verbs ^ ^ ^
classdescribeseedefinedepictofferhailraterefer_toregardknowviewrecognisizedenouncediagnoseuseconceiveacknowledgesuggestpresentintendkeepshowdaimchooserepresentbuildleave
; Experi-ment
1
2.52.5
5557
8.58.5
10.510.5
13131315
17.517.517.517.520.520.5
22232626262626
Reliance
35
1410
825
29
181
157
1246
16111327171926232021222428
Attraction
15216
2323152311
347.57.5
1523
5232323152311
91523232311
OddsRatio
35
1310
825
29
181
157
1246
16111427171926232021222428
' FisherExact
10235
1326
91416
1478
1112
6151727182124201922232528
APReliance
35
1410
825
29
181
157
1246
1611132717192623 .2021222428
APAttraction
12216
1827111910
3478
1316
5202128142217
91523242625
based measures, as the low number of observations in the construction is suffi-cient to give them very high Reliance scores.
With regard to the correlation with the experimental data, as shown in Table13, Reliance, Fisher Exact and Odds Ratio correlate roughly equally well with thetest results. In contrast to Gries et al.'s analysis of the data. Fisher Exact (0.667)only minimally outperforms Reliance (0.650), while Odds Ratio (0.658) also out-performs Reliance but is slightly lower than Fisher Exact. The measure of Attrac-tion scores most poorly (0.312), while AP Attraction is a considerable improve-ment (0.506), but does not reach the other three scores. Interestingly, thecorrelations amongst the three leading corpus-based measures (Reliance - Fisher
DE GRUYTER MOUTON Measuring lexicogrammatical attraction 563
Table 13: Spearman correlation matrix
ExperimentRelianceAttraction
Odds RatioAP RelianceAP AttractionFisher Exact
Experi-ment
1.0000.6500.3360.6580.6500.5180.667
Reliance
0.6501.0000.2420.9991.0000.5750.813
Attraction
0.3360.2421.0000.2540.2420.8820.674
OddsRatio
0.6580.9990.2541.0000.9990.5860.820
APReliance
0.6501.0000.2420.9991.0000.5750.813
APAttraction
0.5180.5750.8820.5860.5751.0000.895
FisherExact
0.6670.8130.6740.8200.8130.8951.000
Exact: 0.813; Odds Ratio - Fisher Exact: 0.820; Reliance - Odds Ratio: 0.999) areconsiderably higher than those between the individual corpus-based measuresand the experimental data. Despite considerable internal differences with regardto the actual ranking of verbs, the results of the corpus-based measures seem tobe more similar to each other than to the data from the experiment. This is quitea disappointing outcome." Taking further into consideration the fact that theverb regard, which scores the top rank in all corpus-based measures except At-traction and AP Attraction, is only found at position 11 in the rank hst for the ex-perimental data, we are tempted to conclude that the relation between the datafrom the experiment and those from the corpus is very difficult to interpret, andthat this raises some doubts concerning the reliability of the experimental data asan external benchmark.
This conclusion seems to be supported by the findings from a follow-up studyon the same construction (Gries et al. 2010). In this study, the authors extendedthe corpus basis for the quantitative part, improved the data retrieval method andused a reading-time paradigm to produce the experimental benchmark. WhileCollostruction Strength had only a marginally significant effect, its effect size wasnevertheless twice as high as that of relative frequency, which was still not signif-icant (Gries et al. 2010: 69-79). None of the tested interactions was found to besignificant. Reliance/faith was not taken into consideration here.
A third promising attempt to relate statistical measures of associations be-tween lexemes and constructions to experimental psychological data was made
15 The outcome of the study by Divjak (2008), who compared the predictions of different quan-titative corpus-based measures of data on the thai-construction in Polish - among themAttraction, Reliance and Collostruction Strength - to the results of an acceptabihty rating, wassimilarly disappointing: "[I]t has beome clear that none of the measures has high predictiveaccuracy" (2008:230). Interestingly, for Divjak's dataset, which contained many combinations ofverbs and constructions which were unacceptable, the measure of Reliance performed best.
564 H.-J. Schmid&H. KUchenhoff DE GRUYTER MOUTON
by Wiechmann (2008). Wiechmann tested a wide range of association measurescollected in Evert (2004), including Fisher Exact and other exact hypothesis tests,as well as likelihood measures (e.g. binomial likelihood), asymptotic hypothesistests (e.g. z-score and t-score), point or maximum likelihood estimates of associa-tion strength (including Odds Ratio) and measures from information theorybased on mutual information. Unlike Gries et al., Wiechmann did not carry outhis own psycholinguistic experiments but compared the predictions of the statis-tical measures to the results of an eye-tracking and reading-time study publishedby Kennison (2001), who investigated the lexical effects of verbs on online com-prehension. Specifically, Kennison looked at monotransitive verbs that preferredeither NP objects (e.g. the journalist revealed the problem ...) or íftaí-clause ob-jects (e.g. the journalist admitted that the problem worried him), but could occur ineither pattern. She found that the verbs' preference for NP or f/iaf-clause comple-ments was not a significant indicator of reading times. Instead, sentences withsentential complements tended to require more reading time irrespective of thepreference of the verb. So the psycholinguistic benchmark used to assess the sta-tistical tests is not very reliable, and Wiechmann (2008: 279) himself does nothesitate to mention several caveats that cast some doubt on his results having todo with statistical and behavioural uncertainties and limitations of scope. Whathis regression models bringing together corpus and experimental evidence indi-cate is that the most adequate measure is a test called minimum sensitivity belong-ing to the group of point or maximum likelihood estimates of association strength.Minimum sensitivity is a fairly simple concept, basically instructing us to com-pare the Reliance and Attraction scores for a given lexeme and to select thesmaller of the two as a measure of the lexeme's association with the target con-struction. The test thus at least theoretically includes both perspectives. In addi-tion, it has the appeal that it does not require cell no. 4 to be filled, and, like OddsRatio, is "free from underlying distributional assumptions that are not met bynatural language data" (Wiechmann 2008: 282), which remedies the problemsmentioned in Section 3.1 above. However, since the test only selects one of the twomeasures - i.e. either Reliance or Attraction - which can usually be obtainedcomparatively easily, we have the impression that it loses information that isavailable and could be potentially important. What is more, scores for Attractionin general tend to be lower than those for Reliance, so that the ranking for Mini-mum Sensitivity is usually identical to that for Attraction.
Fourthly, the study by Ellis and Ferreira-Junior (2009) on constructions andtheir acquisition deserves further mention, although it does not supply data fromexperimental studies, but only corpus data of different provenance. It is in thispaper that the two AP measures discussed in section 4.2 are introduced and ap-plied. The authors compare several statistical tests vnth regard to their predictive
DE GRUYTER MOUTON Measuring lexicogrammatical attraction — 565
power vis-à-vis the use of certain verbs in given constructions by second-lan-guage learners, which they take as an indicator of the mastery of a constructionand the association to lexemes. The frequency of verbs in three target construc-tions in a learner corpus of seven non-native speakers was compared to the rawfrequency of verbs in the same constructions in the output of their native speakerconversation partners. The frequency lists of these two corpora were compared tothe scores produced by three measures: Collostruction Strength (Fisher Exact),AP Attraction and AP Reliance. Ellis and Ferreira-Junior interpret their findings ascorroborating the hypothesis that "[t]he first-learned verbs in each constructionwill be those which are more distinctively associated with that construction in theinput" (2009: 202). With regard to how this association is to be measured, theyobserve that the rank order for Collostruction Strength of native speaker data "isa very strong predictor of [non-native speaker] acquisition, as is AP (Construction-» Word). What is less predictive is AP (Word -^ Construction)" (2009: 203). Inevaluating these results one should keep in mind, however, that both the targetmeasures and the benchmark measure are corpus-based and that both corporaare rather small and consist of contributions by a fairly limited number ofspeakers.
Regarding the differences between the scores arrived at, Ellis and Ferreira-Ju-nior add an important remark concerning the two directions of associations, fre-quency and semantic generity:
When a construction cues a particular word, that word occurs very often in that construc-tion and it tends to be very generic. When a word cues a particular construction, it may be alower frequency word, quite specific in its [...] semantics and thus very selective of thatconstruction (Ellis and Ferreira-Junior 2009: 203).
This Statement describes what seems to be a general pattern in many studies oflexicogrammatical association: lists of scores reflecting associations from con-struction to lexeme (i.e. Fisher Exact, Attraction, and AP Attraction) are typicallyheaded by frequent and semantically comparatively unspecific lexemes with as-sociations to rather wide ranges of different constructions; in the reciprocal listsof scores depicting associations from lexemes to constructions (i.e. Reliance, APReliance and also Odds Ratio), top ranks are typically occupied by less frequentor rare lexemes with fairly specific meanings. If lexemes manage to reach topranks from both perspectives, as is the case for fact in the N-i-ihaf-clause construc-tion, we can be fairly confident that the association between lexeme and con-struction is indeed very strong.
566 H.-J. Schmid & H. Küchenhoff DE GRUYTER MOUTON
6 Cognitive underpinnings
The cognitive underpinnings of the preceding considerations will be - and in facthave to be, if they are to make sense - discussed within the scope of a usage-basedframework which assumes that the frequencies of repeated linguistic processingevents translate into different strengths of associations in the network represent-ing linguistic knowledge (cf. e.g. Langacker 2000; Barlow and Kemmer 2000;Bybee 2010). The more frequently a given linguistic stimulus has been processedby a speaker, the more routinized the corresponding association becomes in hisor her mind. Different strengths of associations can be understood as represent-ing different degrees of entrenchment in the network. More deeply entrenchedassociations are reflected behaviourally in higher degrees of routinization andautomatization and lower levels of cognitive effort required for processing (cf.Schmid 2007, forthcoming and Blumenthal-Dramé 2012 for more details).i^
While all this seems to be fairly straightforward and in line with the well-attested frequency effect in language and elsewhere (cf. e.g. Diessel 2007; Knobelet al. 2008), the complexity of the multifarious ways in which repeated exposureto linguistic structures affects the network has arguably been underestimated sofar (cf. Schmid 2010). The main reason for this is that the network consists of dif-ferent types of associations that constantly and simultaneously conspire andcompete with each other to set up connections and affect degrees of entrench-ment. Therefore, if one wishes to understand the ways in which frequency of pro-cessing may have an efFect on lexicogrammatical attraction phenomena, it is cru-cial to differentiate these associations and to reflect on their interactions.
To begin with, the communicative potential of language is based on symbolicassociations (Saussure 1916; 98) which connect the forms and meanings ofsigns and constructions of different types of complexity. These range fromindividual words or even morphemes {table, come, un-), to compositional andnon-compositional lexically-filled patterns {join the army, shoot the breeze),partly-filled schémas {the X-er the Y-er; Fillmore et al. 1988; 506) and fullyschematic argument-structure constructions (e.g. the ditransitive, resultative,caused-motion construction; Goldberg 1995). Looking at symbolic associations inisolation, the picture seems to be as simple as explained above; the more fre-,quently we associate the form of a word or construction with a given meaning, the
16 Blumenthal-Dramé (2012) reports on studies applying a range of psycholinguistic and neuro-linguistic tests to measuring entrenchment. This work is not reviewed in greater detail here as itdeals with entrenchment on the level of derivational morphology rather than the lexicogram-matical level.
DE GRUYTER MOUTON Measuring lexicogrammatical attraction 567
Stronger the symbolic association between the form and the meaning. Uponseeing or hearing the foi:m, we immediately and effortlessly activate the meaningin comprehension, and vice versa in production. This frequency effect treats lexi-cal items and constructions, somewhat naively, out of cotext and context, as ifthey occurred in isolation. The corresponding type of entrenchment can thereforebe referred to as cotext-free entrenchment (Schmid 2010:120). If one is willing toaccept corpus data and the data in two-by-two contingency tables as proxies forfrequency of occurrence in language use," the total number of occurrences of atarget lexeme - i.e. the column total of the first column - can be regarded as arough indicator of its degree of cotext-free entrenchment, and the total number ofoccurrences of the target construction - i.e. the row total of the upper row - as arough indicator of the cotext-free entrenchment of the construction.
As hinted at in the previous paragraph, cotext-free entrenchment should infact rather not be seen as being directly reflected in absolute frequencies in thecorpus as such. This warning is important. The degree of entrenchment of alexeme or construction is inevitably linked to degrees of entrenchment of otherlexemes or constructions that potentially compete for the encoding of a givenidea. Even cotext-free entrenchment is never entrenchment as such, but has aninbuilt paradigmatic component and rests on a second type of association in thenetwork: paradigmatic associations. From the speaker's perspective, given a cer-tain idea to be encoded, cotext-free entrenchment captures the likelihood withwhich a given lexeme or construction is selected in tacit and unconscious com-parison with other lexemes and constructions that are potentially activated bythe target idea as well. This means that cotext-free entrenchment must be opera-tionahzed from an onomasiological point of view (Geeraerts 2006: 85) as "con-ceptual frequency" (Hoffmann 2005: 107-110) or "paradigmatic relative fre-quency" (Schmid forthcoming), taking into account "paradigmatic salience"(Blumenthal-Drame 2012: 191). These notions essentially capture the cell no. 4
17 Note that the link between corpus data, which represent frequency of usage and degrees ofentrenchment, is much less direct than is often suggested (cf. Blumenthal-Dramé 2012: 28-33,44-65). On the one hand, corpus data can do no more than serve as a proxy of frequency of usein the speech community or the sections thereof captured in the corpus. Entrenchment, on theother hand, is an individual cognitive phenomenon. Interpreting corpus data as evidence fordegrees of entrenchment thus means building a rather shaky bridge across the gap between theusage of, ideally, thousands of different speakers whose output is collected in a corpus, and thecognitive system of an idealized speaker-hearer not at all unlike the one envisaged by Chomsky.Recent studies on individual differences by Dqbrowska and others (cf. e.g. Dqbrowska 2008;Street and Dabrowska 2010) have begun to explore the gap between conventionalized grammarand individual entrenchment.
568 H.-J. Schmid & H. Küchenhoff DE GRUYTER MOUTON
problem discussed in Section 3.4. The score to be inserted in this cell is defined asreflecting the number of all other lexemes in all other constructions. As was em-phasized in Section 3.4, this should be interpreted as involving the paradigmaticcompetitors of the target lexeme and the target construction.
Symbolic associations thus inevitably interact with paradigmatic associa-tions in bringing about different degrees of cotext-free entrenchment. In order toquantify the cotext-free entrenchment of symbolic associations, the total num-bers of occurrences of the target lexeme and the target construction have to berelated to the total number of occurrences of paradigmatically competing lex-emes and constructions. As indicated by the dashed arrows in Figure 1 below, toachieve this using the scores available in two-by-two contingency tables, thecolumn total of the first column and the row total of the first row have to be relatedto the score in cell no. 4.
When it comes to measuring lexicogrammatical attraction phenomena, athird type of association in the network, syntagmatic associations, must be takeninto consideration in addition to symbolic and paradigmatic associations. Syn-tagmatic associations link symbolic associations to linguistic forms and mean-ings which co-occur in linear sequence in usage. They are invariably activated inall linguistic processing events, as the computation of sentence and discoursemeanings requires the binding of sequentially presented information. For exam-ple, clause subjects have to be brought together grammatically and semanticallywith predicates, modifiers with heads, and so on. The combined processing cre-ates syntagmatic associations between the symbolic associations activated by theindividual elements. More importantly, especially in the present context, re-peated identical or similar syntagmatic associations routinize in such a way thatthey become the cognitive substrate of syntagmatic attraction phenomena suchas collocations and collostructions. One part of a collocation, say commit, canprime (cf. Hoey 2005) the activation of other parts of the larger structure (e.g.crime, murder, suicide, etc.) as a result of the routinized syntagmatic associationresulting from prior repeated co-processing. Likewise, one part of a collostructionhas the potential to cue the activation of the other part. Because of the linearnature of language, linguistic elements thus never cue only symbolic associationslinking forms and meanings, but invariably also syntagmatic associations linkingthem to other linguistic elements and constructions frequently co-occurring inthe immediate cotext. A good example of how symbolic and syntagmatic associa-tions interact and even compete is the comprehension of non-compositionalchunks such as idioms, in which the symbolic associations activated by individ-ual forms (e.g. shoot 'shoot' and breeze 'breeze') are largely inhibited by the syn-tagmatic associations between the elements in the chunk [shoot -> breeze), whichresults in the activation of a second-order symbolic association connecting the
DE GRUYTER MOUTON Measuring lexicogrammatical attraction 569
whole chunk shoot the breeze to the idiomatic meaning 'engage in casualThe cotext-free entrenchment of the lexemes shoot and breeze is overruled hereby the strong cotextual entrenchment of the syntagmatic association between thetwo words and the cotext-free entrenchment of the fixed phrase (cf. Schmid 2010:120-125, and Schmid forthcoming for more details).
In the two-by-two contingency table, hypothetical strengths of syntagmaticassociations are first and foremost refiected in the scores for Attraction and Reli-ance, i.e. the relations between cell no. 1 (lexeme in construction) and all occur-rences of the lexeme (column total of first column) and the relation between cellno. 1 and all occurrences of the construction (row total of first row). In Figure 1below, these relations are indicated by dotted arrows and boxes. Crucially, how-ever, paradigmatic competitors have to be taken into account with regard to co-textual entrenchment as well, since the target construction potentially activatesother, paradigmatically related lexemes, and the target lexeme activates otherconstructions paradigmatically related to the target construction. Of course, theoverall amount of these paradigmatic competitors is factored in by relating theoccurrences of the lexeme in the construction (cell no. 1) to the occurrences ofother lexemes in the construction (cell no. 3), on the one hand, and to the occur-rences of the lexeme in other constructions (cell no. 2), on the other. But thesenumbers arguably do not tell the whole story. The extra effect we see at work herecan be explained with an analogy to the stock market: if only one single powerfulinvestor holds, say, 45% of the shares of a company in his portfolio, while the restof the shares are scattered among thousands of private shareholders, their weightin the company will be stronger than if there are other bigger players controlling,for example, 35% or 30% of the shares. The significance of one portfolio is thusnot only determined by the simple proportion of shares, but also by both thenumber of other shareholders and the sizes of their portfolios. Likewise, the sig-nificance of the association of a given lexeme to a given construction depends notonly on its Reliance score, but also on the number of other constructions in whichit can occur and on the lexeme's Reliance scores to these. In short, the dispersionprofile of the lexeme plays a role. If a lexeme occurs reasonably frequently in agiven construction but does not rely on it to a great extent - as was the case, forinstance, for the noun sign in the N-ff/iat-clause construction or the verb see inthe as-predicative construction - then the lexeme's strength of association to thisconstruction will depend on whether its other uses are consolidated or stronglydispersed, in particular on whether or not it relies on some other constructions
18 Cf. Blumenthal-Dramé (2012: 76-80) on gestalt-psychologlcal foundations of chunking andthe so-called "top-down coercion" of chunks to their parts.
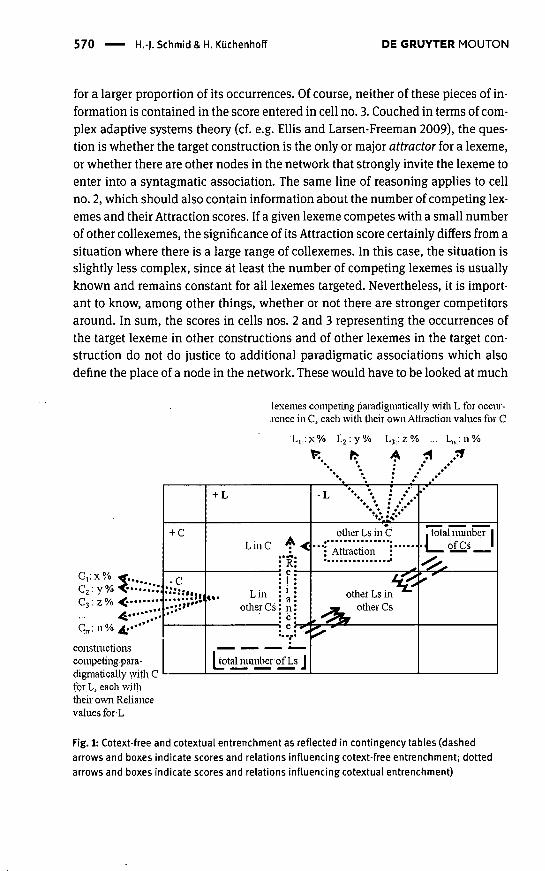
570 H.-J. Schmid & H. Küchenhoff DE GRUYTER MOUTON
for a larger proportion of its occurrences. Of course, neither of these pieces of in-formation is contained in the score entered in cell no. 3. Couched in terms of com-plex adaptive systems theory (cf. e.g. Ellis and Larsen-Freeman 2009), the ques-tion is whether the target construction is the only or major attractor for a lexeme,or whether there are other nodes in the network that strongly invite the lexeme toenter into a syntagmatic association. The same line of reasoning applies to cellno. 2, which should also contain information about the number of competing lex-emes and their Attraction scores. If a given lexeme competes with a small numberof other collexemes, the significance of its Attraction score certainly differs from asituation where there is a large range of collexemes. In this case, the situation isslightly less complex, since at least the number of competing lexemes is usuallyknown and remains constant for all lexemes targeted. Nevertheless, it is import-ant to know, among other things, whether or not there are stronger competitorsaround. In sum, the scores in cells nos. 2 and 3 representing the occurrences ofthe target lexeme in other constructions and of other lexemes in the target con-struction do not do justice to additional paradigmatic associations which alsodefine the place of a node in the network. These would have to be looked at much
le.xemes conipetijig pai-adiginatically witii L fôi' occiu-leiice in C, each vvitli tlieir own Atti action values for C
L,.:x% L2.:y% L3.:z% ... L,,.:n%
-I-C
^;C
+ L
Line
««• Linother Cs
[total munber c
A
• Re1iance
•V
• ^
fL
<
otlier Ls in C
'"•Attraction •
otlier Ls in-m Otlier Cs
• '
1 total number 1•J ofÇs 1
<••—;.-
constiTicüonscompeting pai'a-digniaücally \vitli Ctor.L, each withtheii' owi Reliancevalues for'L
Fig. 1: Cotext-free and cotextual entrenchment as reflected in contingency tables (dashedarrows and boxes indicate scores and relations influencing cotext-free entrenchment; dottedarrows and boxes indicate scores and relations influencing cotextual entrenchment)
DE GRUYTER MOUTON Measuring lexicogrammatical attraction 571
more closely with the aim of factoring in the precise distributional properties un-derlying these scores, including the numbers and Reliance scores of other con-structions in which the lexeme occurs and the numbers and Attraction scores ofother lexemes that occur in the construction. This is represented in Figure 1 bymeans of the dotted arrows pointing outwards from cells nos. 2 and 3.
From a cognitive perspective, then, hypothetical strengths of lexicogrammat-ical attraction phenomena are determined by a very complex interaction of differ-ent strengths of the symbolic associations of the lexemes and constructions in-volved, of the syntagmatic associations between lexemes and constructions, andof no less than four types of paradigmatic associations. The interaction of theseassociations produces a complex interplay of cotext-free and cotextual entrench-ment which so far has not been understood in any detail. What these interactionsmean in terms of the data represented in two-by-two contingency tables, and towhat extent they go beyond the scope of these datasets, is summarized in Figure1. Here, the scores and relations influencing cotext-free entrenchment are indi-cated by dashed lines, and the scores and relations influencing cotextual en-trenchment by dotted ones.
Hints to some of these complications can be found in the literature.'' In iden-tifying the meaning of the most dominant lexical anchor of the as-predicativeconstruction, Gries et al. (2005; 652-654) draw on the degree to which a targetlexeme relies on other constructions as an argument. They observe that the verbssee and consider are more strongly associated with other constructions and there-fore do not qualify as well as regard does. See is attracted by the monotransitiveand other constructions, and consider mainly by the complex-transitive construc-tion without as, cf. their example He considered his marriage indissoluble (2005;637). While the authors are thus clearly aware of the challenge theoretically, theirclaim that collostructional analysis can handle the problem is only plausible forconsider but certainly not for see, which ranks third with regard to collostructionstrength because of its high Attraction value and its high overall frequency in thecorpus. This rank does not reflect the fact that the verb see is associated withother attractor constructions that presumably exert stronger forces than theas-predicative. The paradigmatic information that would be required here doesnot come forward as some kind of automatic by-product of calculating Collostruc-tion Strength. It is perhaps more revealing here to include the Reliance perspec-tive, as both verbs indeed score low results according to the data provided byGries et al., with Rehance scores of 5.58% for see and 3.41% for consider, as com-
19 Cf. Blumenthal-Dramé (2012: 191 et passim) on paradigmatic aspects relevant for theentrenchment of suffix-derivations.
572 H.-). Schmid&H. KUchenhoff DE GRUYTER MOUTON
pared to 80.01% for regard. What must be added, however, is that none of themeasures discussed in the present paper alone does an adequate job of takinginto account other constructions which strongly attract a target lexeme.
Arguably, it is precisely the complexity sketched out in this section that hasconstituted the major challenge for the statistical tests discussed in this paper.^"The Reliance and Attraction approach falls short of taking cotext-free entrench-ment into account, since it does not take cell no. 4 into consideration and thusmisses out on integrating cotext-free entrenchment and its paradigmatic aspects.In principle, the two AP scores do take this information into consideration, butthe mathematical effects of this extra step and the theoretical gain are very lim-ited. While scores for AP Attraction can indeed diverge from Attraction and im-prove results, as we have seen in Section 5, those for Reliance and AP Reliancetend to be almost identical. Fisher Exact does integrate information on cotext-freeentrenchment, but seems, at least in comparison with Odds Ratio, to give far toomuch weight to it while strongly neglecting key aspects of cotextual entrench-ment. As a result, lexemes which presumably reach high levels of cotext-free en-trenchment because of their high frequency of occurrence tend to emerge as beingstrongly associated with constructions, even though their uses in the construc-tion do not account for a large proportion of their uses in the corpus, and eventhough they are more strongly associated with other constructions. As shown inSection 3.5, Fisher Exact also suggests that the strength of syntagmatic associa-tions can be the same for combinations of high cotext-free and low cotextual en-trenchment (the scenario in Table 4b), on the one hand, and for combinations oflow cotext-free and high cotextual entrenchment (the scenario in Table 4a), onthe other. Odds Ratio takes cotext-free entrenchment into account, but propelsrarer lexemes with hypothetically lower degrees of cotext-free entrenchment (e.g.suspicion) into fairly high ranks. Whether either of these two tests, which, as wehave seen, produce rather divergent results, indeed manages to capture themutual attraction of lexemes and construction in one measure must presumablyremain an open question for as long as we remain unable to produce adequateexternal evidence to properly assess their predictive power. This conclusionwould suggest that, as argued by Ellis and Feneira-Junior (2009) and Schmid(2010), it might be wise to keep the two directions of association apart and workwith two reciprocal measures in the meantime. What has become clear is thatnone of the measures manages to include information on the paradigmatic di-
20 As discussed in Schmid (forthcoming) the interaction of entrenchment, frequency andsalience is even more complex as, in addition to the types of associations and salience discussedin the text here, pragmatic associations and their salience, i.e. pragmatic salience, have to betaken into consideration.
DE GRUYTER MOUTON iVleasuring lexicogrammatical attraction 573
mension of cotextual entrenchment represented by the dotted arrows pointingoutside the contingency table in Figure 1, since all of them are unable to integratedata on the numbers and Reliance scores of paradigmatically competing con-structions and the numbers and Attraction scores of paradigmatically competinglexemes.
7 Conclusion and outlooic
In light of the considerable imponderables that have come to the surface in theprevious section, the critical discussion of collostructional analysis and othermeasures of lexicogrammatical associations presented earher in this paper mayseem rather petty, even insignificant perhaps. What, one may well ask, is thepoint of engaging in quibbles about details of statistical tests and tools if the cog-nitive underpinnings of what their results are supposed to model or predict arefar from clear anyway? Our discussion of cognitive underpinnings of lexicogram-matical associations suggests that at present we do not seem to know enoughabout how frequency of usage affects different types of associations and deter-mines the entrenchment of syntagmatic associations between constructions andlexemes in order to adequately assess the measures discussed in this paper froman Archimedean, i.e. noncorpus-based, vantage point. Wiechmann's caveat that"there is still a strong need for empirical evaluations of competing measures ofcollocativity (or collostruction strength for that matter)" (2008: 283) remains asvalid today as it was in 2008. Linguists are presumably well advised to refrainfrom being overly enthusiastic about their capability to actually model cognitivephenomena with the help of quantitative evidence gleaned from corpora.
While it has become obvious that the path pioneered by Gries et al. (2005,2010), Divjak (2008) and Wiechmann (2008) - as well as Blumenthal-Dramé(2012) in the field of derivational morphology - in their search for converging ev-idence is a very promising one, experimental methods have to be improved con-siderably before we can have more confidence in assessing the validity of researchfindings based on corpus data. We hope that our paper has demonstrated whatdifferent corpus-based measures can do, but also what they are so far unable todo. To conclude with concrete recommendations, if one insists on producing asingle rank order of collexemes for a given construction, then one should beaware that Fisher Exact mainly looks at the association from the perspective ofconstructions to lexemes, tends to highlight the role of frequent collexemes at thecost of specific ones, and does not provide an effect size measure. Odds Ratio,which also produces one single rank order, manages to produce effect sizes, butemphasizes the Rehance of lexemes on constructions. Both measures require a
574 H.-J. Schmid&H. Küchenhoff DE GRUYTER MOUTON
score for cell no. 4, but this comes with the advantage that they take competingprobabilities into account. If one decides that the cognitive implications are notyet sufficiently well understood to warrant the use of a single measure, then werecommend working either directly with Attraction and Reliance scores or withthe two reciprocal Delta P measures, which take sample size into considerationbut of course also have the concomitant drawback that cell no. 4 must be filled.
Acknowledgements
We would like to thank Susanne Grandmontagne, Franziska Günther, DaphneKerremans and three anonymous reviewers for their invaluable comments on anearlier version of this paper and their extremely helpful suggestions.
References
Baayen, Harald. 2011. Corpus linguistics and naive discriminative learning. Brazilian Journal ofApplied Linguistics 11, 295-328.
Backus, Ad & IVlaria Mos. 2011. Islands of (im)productivity in corpus data and acceptabilityjudgements: Contrasting two potentiality constructions in Dutch. In D. Schönefeld (ed.).Converging evidence, 165-192, Amsterdam: Benjamins.
Barlow, Michael & Suzanne Kemmer (eds.). 2000. Usage-Based Models of Language. Stanford,CA: CSLI Publications.
Blumenthal-Dramé, Alice. 2012. Entrenchment in usage-based theories. What corpus data doand do not reveal about the mind. Berlin: Walter de Gruyter.
Bybee, Joan. 2010. Language, usage and cognition. Cambridge/New York: CambridgetJniversity Press.
Bybee, Joan & David Eddington. 2006. A usage-based approach to Spanish verbs of'becoming'.ionpuoge 82(2), 323-355.
Church, Kenneth W. & Patrick Hanks. 1990. Word association norms, mutual information &lexicography. Computational Linguistics 16(1), 22-29.
Clear, Jeremy. 1993. From Firth principles. Computational tools for the study of collocation. InM. Baker, G. Francis & E. Tognini-Bonelli (eds.). Text and technology. In honour of JohnSinclair, 271-292. Philadelphia/Amsterdam: Benjamins.
CoUeman, Timothy. 2009a. Verb disposition in argument structure alternations: A corpus studyof the Dutch dative alternation. Language Sciences 31, 593-611.
CoUeman, Timothy. 2009b. The semantic rangeof the Dutch double object construction. Acollostructional perspective. Constructions and Frames 1,190-220.
CoUeman, Timothy. 2010. Beyond the dative alternation: The semantics of Dutch oon-Dative. InD. Glynn & K. Fischer (eds.). Quantitative methods in cognitive semantics: Corpus-drivenapproaches, 271-303. Berlin: Mouton de Gruyter.
Dqbrowska, Ewa. 2008. The later development of an early-emerging system: The curious caseof the Polish genitive. Linguistics 46, 629-650.
DE GRUYTER MOUTON Measuring lexicogrammatical attraction — 575
Diessel, Holger. 2007. Frequency effects in language acquisition, language use, and diachronicchange. Weiv Ideas in Psychology 25,108-127.
Divjai<, Dagmar. 2008. On (in)frequency and (un)acceptability. In Barbara Lewandowsl<a-Tomaszczyi< (ed.). Corpus linguistics, computer tools and applications - state of the
art, 213-233. Franl<furt: Peter Lang.Ellis, Nici< C. & Diane Larsen-Freeman (eds.). 2009. Language as a Complex Adaptive System.
Chichester: Wiley-Blackwell.Ellis, Nici<& Fernando Ferreira-Junior. 2009. Construction learning as a function of frequency,
frequency distribution, and function. The Modern Language Journal 93(3), 370-385.Evert, Stefan. 2004. The statistics of word cooccurrences: Word pairs and collocations.
Unpublished doctoral dissertation, institut für maschinelle Sprachverarbeitung, Universityof Stuttgart.
Evert, Stefan & Brigitte Krenn. 2001. Methods for the qualitative evaluation of lexicalassociation measures. In Proceedings of the 39th Annual Meeting of the Association for
Computational Linguistics, Toulouse, France, 188-195.
Fillmore, Charles J., Paul Kay, & M. Catherine O'Connor. 1988. Regularity and idiomaticity ingrammatical constructions: The case of let alone. Language 64, 501-538.
Fries, Charles C. 1952. The structure of English. London: Longmans, Green and Company.Geeraerts, Diri<. 2006. Words and other wonders: Papers on lexical and semantic topics. Berlin/
NewYorl<: Walter de Gruyter.Gilquin, Gaëtanelle. 2006. The verb slot in causative constructions. Finding the best fit.
Constructions, http://elanguage.net/journals/index.php/constructions/article/view/18/23 [Accessed March 2013].
Glynn, Dylan. 2010. Corpus-driven cognitive semantics, introduction to the field. In D. Glynn &K. Fischer (eds.). Quantitative methods in cognitive semantics: Corpus-driven approaches,
1-41. Berlin etc.: de Gruyter Mouton.Goldberg, Adele E. 1995. Constructions. A construction grammar approach to argument
structure. Chicago: University of Chicago Press.Goodman, Steven N. 2002. P value, in R. C. Elston, J. M. Olson & L. Palmer, (eds.), Biostatistical
genetics and genetic epidemiology, 591-594. Chichester: John Wiley and Sons.Gries, Stefan Th. 2005. Null-hypothesis significance testing of word frequencies: a follow-up on
Kilgarriff. Corpus Linguistics and Linguistic Theory 1{2), 277-94.
Gries, Stefan Th. 2006. Corpus-based methods and cognitive semantics: The many meanings ofto run. in S. Th. Gries & A. Stefanowitsch (eds.). Corpora in cognitive linguistics: Corpus-
based approaches to syntax and lexis, 57-99. Berlin/New York: Mouton de Gruyter.
Gries, Stefan Th. 2011. Corpus data in usage-based linguistics: What's the right degree ofgranularity for the analysis of argument structure constructions? in Mario Brdar, Stefan Th.Gries & Milena Zie Fuchs (eds.). Cognitive linguistics: Convergence and expansion,
237-256. Amsterdam/Philadelphia: John Benjamins.Gries, Stefan Th. & Anatol Stefanowitsch. 2004. Extending coUostructional analysis: A
corpus-based perspective on 'alternations'. International Journal of Corpus Linguistics 9,
97-129.Gries, Stefan Th. & Anatol Stefanowitsch. 2010. Cluster analysis and the identification of
collexeme classes, in J. Newman & S. Rice (eds.). Experimental and empirical methods inthe study of conceptual structure, discourse, and language, 73-90. Stanford: CSLi.
576 H.-). Schmida H. Küchenhoff DE GRUYTER MOUTON
Gries, Stefan Th., Beate Hampe, & Doris Schönefeld. 2005. Converging evidence: Bringingtogether experimental and corpus data on the associations of verbs and constructions.Cognitive Linguistics 16, 635-676.
Gries, Stefan Th., Beate Hampe, & Doris Schönefeld. 2010. Converging evidence II: More on theassociation ofverbs and constructions. In j . Newman &S. R\ce (eds.), Experimental andempirical methods in the study of conceptual structure, discourse, and language (eds.),59-72. Stanford: CSU.
GrIes, Stefan Th. & Stefanie Wulff. 2009. Psycholingulstic and corpus linguistic evidence for L2constructions. Annual Review of Cognitive Linguistics 7,163-186.
Hampe, Beate. 2011. Discovering constructions by means of collostruction analysis: The Englishdenominative construction. Cognitive Linguistics 22(2), 211-245.
Hilpert, Martin. 2006. Distinctive collexeme analysis and diachrony. Corpus Linguistics andLinguistic Theory 2(2), 243-256.
Hilpert, Martin. 2010. The force dynamics of English complement clauses: A collostructionalanalysis. In D. Glynn & K. Fischer (eds.). Quantitative methods in cognitive semantics:Corpus-driven approaches, 155-178. Berlin: Mouton de Gruyter.
Höche, Silke. 2011. / am about to die vs / am going to die: A usage-based comparison betweentwo future-indicating constructions. In Doris Schönefeld (ed.). Converging evidence,115-142. Amsterdam: Benjamins.
Hoey, Michael. 2005. Lexical priming. A new theory of words and language. London/New York:Routledge/Taytor& Francis.
Hoffmann, Sebastian. 2005. Grammaticalization and English complex prepositions: A corpus-based study. New York: Routledge.
Hunston, Susan & Gill Francis. 2000. Pattern grammar: A corpus-driven approach to the lexicalgrammar of English, Amsterdam/Philadelphia: Benjamins.
Kay, Paul & Charles J. Fillmore. 1999. Grammatical constructions and linguistic generalizations:The What's X doing Y? construction. Language 75,1-33.
Kennison, Sheila M. 2001. Limitations on the use of verb information during sentencecomprehension. Psychonomic Bulletin & Review 8(1), 132-138.
Kilgarriff, Adam. 2005. Language is never, ever, ever, random. Corpus Linguistics and LinguisticTheory 1/2, 263-276.
Knobel, Mark, Matthew Finkbeiner & Alfonso Caramazza. 2008. The many places of frequency:Evidence fora novel locus of the lexicalfrequency effect in word production. CognitiveNeuropsychology 25(2), 256-286.
Langacker, Ronald W. 2000. A dynamic usage-based model. In M. Barlow & S. Kemmer (eds.).Usage-based models of language, 1-63. Stanford: CSLI Publications.
Lipka, Leonhard. 2002. An outline of English lexicology. Lexical structure, word semantics &word-formation. Tübingen: Narr.
Manning, Chris, & Hinrich Schütze. 2001. Foundations of statistical natural languageprocessing. Cambridge: MIT Press.
Mukherjee, Joybrato & Stefan Th. Gries. 2009. Collostructional nativisation in New Englishes.Verb-construction associations in the International Corpus of English. English World-Wide30(1), 27-51.
Newman, John. 2010. Balancing acts: Empirical pursuits in Cognitive Linguistics. Dylan Glynn &Kerstin Fischer (eds.). Quantitative methods in cognitive semantics: Corpus-drivenapproaches, 79-99. Berlin: de Gruyter Mouton.
Owen Frank & Ronald jones. 1977 Statistics. Stockport: Polytech Publishers.
DE GRUYTER MOUTON Measuring lexicogrammatical attraction 577
Saussure, Ferdinand de. 1916. Cours de linguistique générale. Paris: Payot.Schmid, Hans-Jörg. 2000. English abstract nouns as conceptual shells. From corpus to
cognition, Berlin/New York: Moutori de Gruyter.Schmid, Hans-Jörg. 2007. Non-compositionality and emergent meaning of lexico-grammatical
chunks: A corpus study of noun phrases with sentential complements as constructions.Zeitschrift für Anglistik und Amerikanistik, 3(3), 313-340.
Schmid, Hans-Jörg. 2010. Does frequency in text really instantiate entrenchment in thecognitive system? In D. Glynn & K. Fischer (eds.). Quantitative methods in cognitivesemantics: Corpus-driven approaches, 101-133. Berlin etc: de Gruyter Mouton.
Schmid, Hans-Jörg, forthcoming. Lexico-grammatical patterns, pragmatic associations anddiscourse frequency, in T. Herbst, H.-J. Schmid & S. Faulhaber (eds.). Constructions -collocations -patterns. Berlin: Mouton de Gruyter.
Sinclair, John M. 1991. Corpus, concordance, collocation, Oxford: Oxford University Press.Stefanowitsch, Anatol, & Stefan Th. Gries. 2003. Collostructions: investigating the interaction
of words and constructions. International Journal of Corpus Linguistics 8(2), 209-243.Stefanowitsch, Anatol & Stefan Th. Gries. 2008. Channel and constructional meaning: A
collostructional case study. In G. Kristiansen & R. Dirven (eds.). Cognitive sociolinguistics,129-152. Berlin/New York: Mouton de Gruyter.
Stefanowitsch, Anatol & Stefan Th. Gries. 2009. Corpora and grammar. In A. Liideling & M. Kytö(eds.). Corpus linguistics: An international handbook. Volume 2, 933-951. Berlin/NewYork: Mouton de Gruyter.
Street, James & Ewa Dqbrowska. 2010. More individual differences in Language Attainment:How much do adult native speakers of English know about passives and quantifiers?Lingua 120, 2080-2094.
Stubbs, Michael. 1995. Collocations and semantic profiles. On the cause of the trouble withquantitative studies. Functions of Language 2, 23-55.
Szmrecsanyi, Benedikt. 2005. Language users as creatures of habit: A corpus-based analysis ofpersistence in spoken English, Corpus Linguistics and Linguistic Theoryl{i), 113-150.
Wiechmann, Daniel. 2008. On the computation of collostruction strength: Testing measures ofassociation as expressions of lexical bias. Corpus Linguistics and Linguistic Theory 4(2),253-290.
Wulff, Stefanie. 2005. Online statistics labs. Corpus Linguistics and Linguistic Theoryl{2),303-308.
Zeschel, Arne. 2009. What's (in) a construction? In V. Evans & S. Pourcel (eds.). New Directionsin Cognitive Linguistics, 185-200. Amsterdam/Philadelphia: Benjamins.

Copyright of Cognitive Linguistics is the property of De Gruyter and its content may not becopied or emailed to multiple sites or posted to a listserv without the copyright holder'sexpress written permission. However, users may print, download, or email articles forindividual use.