Embed Size (px)
Citation preview
High Resolution in Mass and Space: AP-MALDI Imaging Using Orbitrap-based InstrumentationBernhard Spengler1,3, Andreas Römpp1, Sabine Günther1, Oliver Schulz1, Klaus-Peter Hinz1, Alfons Hester1, Christian Schinz1, Christian Lotze1, Jörg-Ulrich Pötzl1, Kerstin Strupat2
1Institute of Inorganic and Analytical Chemistry, Justus Liebig University Giessen, Germany; 2Thermo Fisher Scientific (Bremen) GmbH, Germany; 3TransMIT GmbH, Giessen, Germany
2 High Resolution in Mass and Space: AP-MALDI Imaging Using Orbitrap-based Instrumentation
laser beam path = ion trajectory =observation path =base plate =
CCD Camera
mirror(centrally bored)
objective lens(centrally bored)
movable sample stage (x, y, z)
observation mirror(off axis)
aperture
lens mirror
static and variable attenuator
N2 Laser
Thermo ScientificQ ExactiveTM
mirror
Performance of AP-SMALDI MSImaging imagine10Spatial Resolution
ConclusionThe methods applied to Orbitrap-based instrumentation shows high reliability, validity and performance for routine histological analysis.
Imaging selectivity, dynamic range are significantly improved upon combining high spatial resolution (here down to 3 µm, typically 10 um) with high mass resolution and high mass accuracy obtained with Orbitrap-based instrumentation.
Such highly spatially resolved, high mass resolution MS/MS data are shown for the first time.
References[1] Spengler B, Hubert M, Kaufmann R, MALDI Ion Imaging and Biological Ion Imaging with a new Scanning UV-Laser
Microprobe, Proceedings of the 42nd Annual Conference on Mass Spectrometry and Allied Topics, Chicago, IL, May 29 - June 3, 1994, pp 1041.
[2] Römpp, A., S. Guenther, Y. Schober, O. Schulz, Z. Takats, W. Kummer, and B. Spengler (2010), Histology by Mass Spectrometry: Label-Free Tissue Characterization Obtained from High-Accuracy Bioanalytical Imaging. Angewandte ChemieInternational Edition. 49(22): p. 3834-3838.
[3] Guenther, S., Römpp, A., Kummer, W., Spengler B. (2011), AP-MALDI Imaging of neuropeptides in mouse pituitary gland with 5 µm spatial resolution and high mass accuracy. Int. J. Mass Spectrom. 305, 228-237.
[4] Römpp, A., Guenther, S., Takats, Z., Spengler, B. (2011), Mass spectrometry imaging with high resolution in mass and space (HR² MSI) for reliable investigation of drug compound distributions on the cellular level. Analytical and Bioanalytical Chemistry 401, 65-73.
[5] Schober, Y., Schramm, T., Spengler, B., Römpp, A. (2011), Protein identification by accurate mass MALDI imaging of trypticpeptides. Rapid Communications in Mass Spectrometry 25, 2475-2483.
AcknowledgementsThe authors acknowledge financial support by the Hessian Ministry of Science and Arts (HMWK) through LOEWE focus “AmbiProbe“.
imagine10 is trademark of TransMIT GmbH, Giessen, Germany. Orbitrap, Exactive and Q Exactive are trademarks of Thermo Fisher Scientific and its subsidiaries. Not all products are available in all countries. This information is not intended to encourage use of these products in any manners that might infringe the intellectual property rights of others. Presented at ASMS2012 (T436) Vancouver, Canada
OverviewPurpose: Short synopsis about the research approach.
Methods: Short synopsis of the experimental methods.
Results: Short synopsis of the results.
IntroductionMALDI Mass Spectrometry Imaging (MSI), 17 years after its first announcement [1], has turned into a routine method of highest performance for the molecular histology of biological tissue [2]. The method, providing high resolution and accuracy in mass and space, has been developed for a reliable identification and localization of individual tissue components, and has been applied recently to a number of research areas in pathology, cancer diagnostics, metabolic pathway analysis and plant research [2-5]. Targeted compound classes included phospholipids, peptides, proteins, drug compounds and metabolites. An atmospheric pressure (AP) ion source has been developed for these studies, based on a dedicated microoptical setup that provides highest spatial resolution of 3 to 5 micrometer on tissue in imaging mode on Orbitrap-based instrumentation.The advantages of Orbitrap detection are given here:1. High mass resolution allows to analyze complex tissue samples, sample complexity2. High mass accuracy enables for straightforward sum formula assignments and facilitates
substance identification, substance identificationAccurate MS and MS/MS imaging data allow to align images, confirmation
3. Irrelevance of sample morphology/flatness, ease of sample / matrix preparation4. Convenience of AP interface, compatibility to ambient analysis
High Resolution in Mass and Space: AP-MALDI Imaging using Orbitrap-based InstrumentationBernhard Spengler1,3, Andreas Römpp1, Sabine Günther1, Oliver Schulz1, Klaus-Peter Hinz1, Alfons Hester1, Christian Schinz1, Christian Lotze1, Jörg-Ulrich Pötzl1, Kerstin Strupat2
1Institute of Inorganic and Analytical Chemistry, Justus Liebig University Giessen, Germany *[email protected] Fisher Scientific (Bremen) GmbH, Germany, [email protected], 3TransMIT GmbH, Giessen, Germany, [email protected]
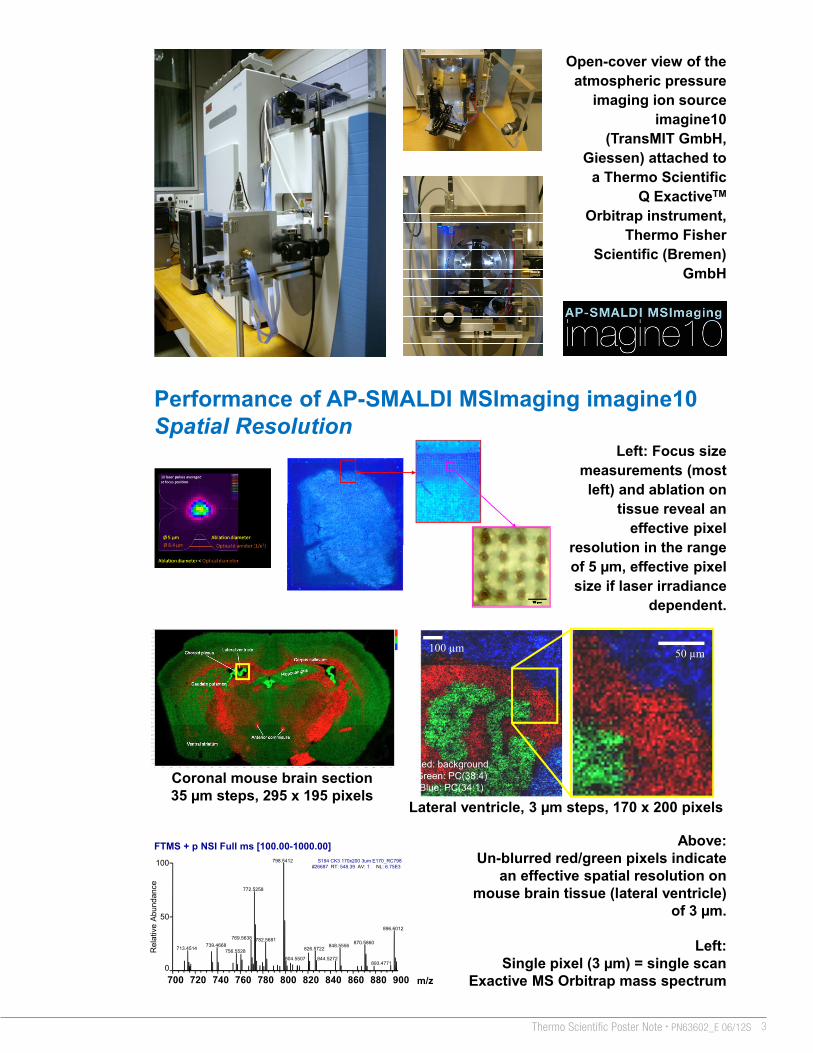
Open-cover view of the atmospheric pressure
imaging ion sourceimagine10
(TransMIT GmbH, Giessen) attached to
a Thermo Scientific Q ExactiveTM
Orbitrap instrument, Thermo Fisher
Scientific (Bremen) GmbH
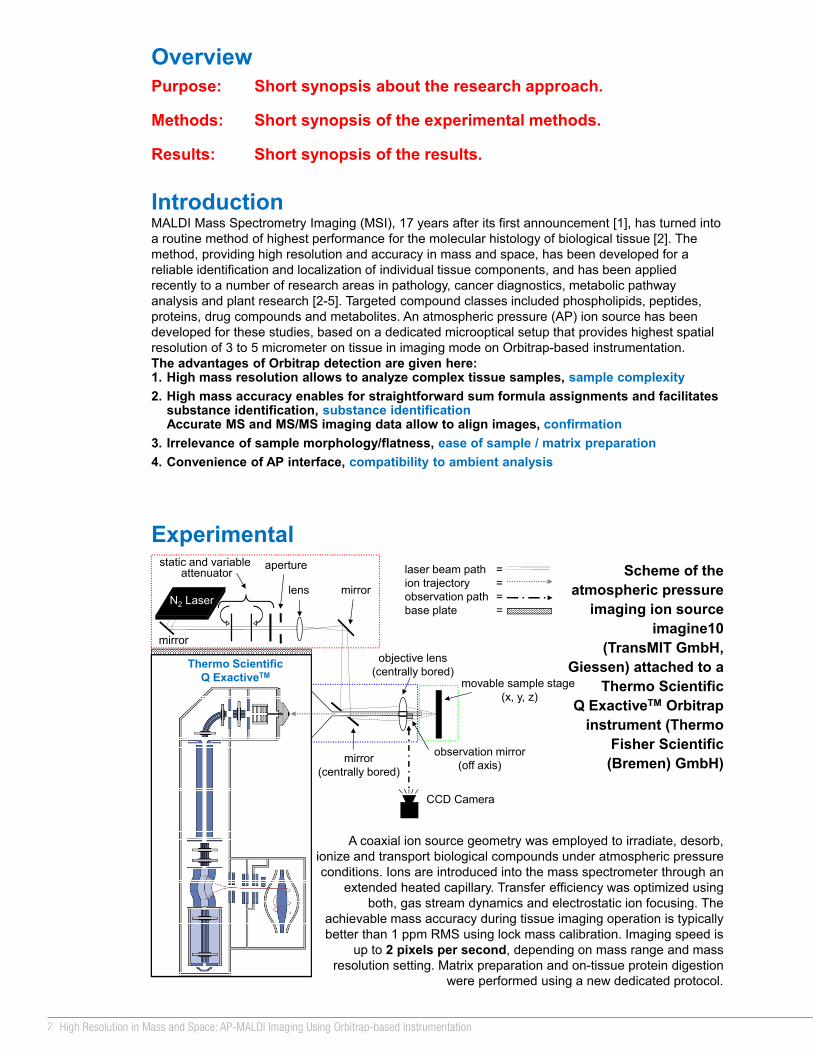
Scheme of the atmospheric pressure
imaging ion sourceimagine10
(TransMIT GmbH, Giessen) attached to a
Thermo Scientific Q ExactiveTM Orbitrap
instrument (Thermo Fisher Scientific (Bremen) GmbH) Coronal mouse brain section
35 µm steps, 295 x 195 pixels
Left: Focus size measurements (most left) and ablation on
tissue reveal an effective pixel
resolution in the range of 5 µm, effective pixel size if laser irradiance
dependent.
Above: Un-blurred red/green pixels indicate
an effective spatial resolution on mouse brain tissue (lateral ventricle)
of 3 µm.
Left:Single pixel (3 µm) = single scan
Exactive MS Orbitrap mass spectrum
Lateral ventricle, 3 µm steps, 170 x 200 pixels
Experimental
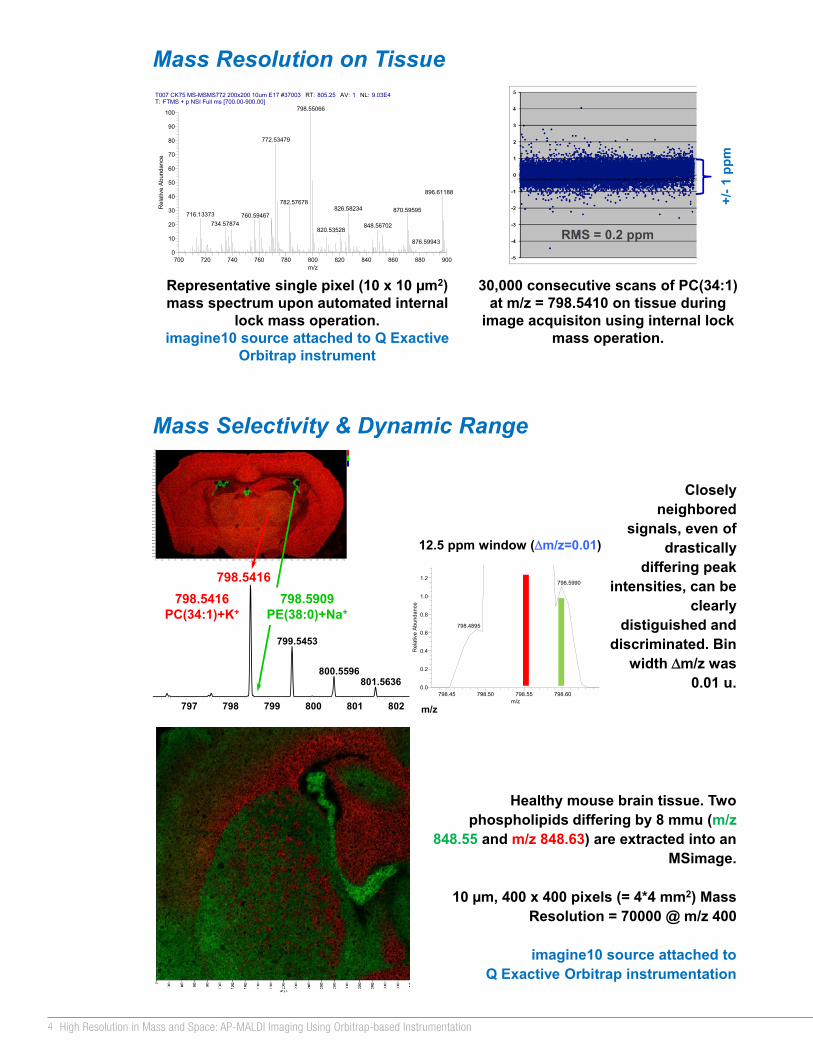
RMS = 0.2 ppm
+/-1
ppm
30,000 consecutive scans of PC(34:1) at m/z = 798.5410 on tissue during
image acquisiton using internal lock mass operation.
Representative single pixel (10 x 10 µm2) mass spectrum upon automated internal
lock mass operation. imagine10 source attached to Q Exactive
Orbitrap instrument
MS and MS/MS Imaging
A coaxial ion source geometry was employed to irradiate, desorb, ionize and transport biological compounds under atmospheric pressure conditions. Ions are introduced into the mass spectrometer through an
extended heated capillary. Transfer efficiency was optimized using both, gas stream dynamics and electrostatic ion focusing. The
achievable mass accuracy during tissue imaging operation is typically better than 1 ppm RMS using lock mass calibration. Imaging speed is
up to 2 pixels per second, depending on mass range and mass resolution setting. Matrix preparation and on-tissue protein digestion
were performed using a new dedicated protocol.
50 µm100 µm
Red: backgroundGreen: PC(38:4)Blue: PC(34:1)
Healthy mouse brain tissue. Two phospholipids differing by 8 mmu (m/z
848.55 and m/z 848.63) are extracted into an MSimage.
10 µm, 400 x 400 pixels (= 4*4 mm2) Mass Resolution = 70000 @ m/z 400
imagine10 source attached to Q Exactive Orbitrap instrumentation
T007 CK75 MS-MSMS772 200x200 10um E17 #37003 RT: 805.25 AV: 1 NL: 9.03E4T: FTMS + p NSI Full ms [700.00-900.00]
700 720 740 760 780 800 820 840 860 880 900m/z
0
10
20
30
40
50
60
70
80
90
100
Rel
ativ
e A
bund
ance
798.55066
772.53479
896.61188
782.57678826.58234 870.59595
716.13373 760.59467734.57874 848.56702
820.53528
876.59943
S194 CK3 170x200 3um E170_RC798#26687 RT: 548.39 AV: 1 NL: 6.75E3
FTMS + p NSI Full ms [100.00-1000.00]
700 720 740 760 780 800 820 840 860 880 900 m/z0
50
100
Rel
ativ
e Ab
unda
nce
798.5412
772.5258
896.6012
769.5638 782.5681 870.5860739.4668 848.5556713.4514 826.5722756.5528844.5272804.5507
893.4771
Mass Resolution on Tissue
Mass Selectivity & Dynamic Range
Closely neighbored
signals, even of drastically
differing peak intensities, can be
clearly distiguished and
discriminated. Bin width Δm/z was
0.01 u.
798.5416PC(34:1)+K+
798.5909PE(38:0)+Na+
797 798 799 800 801 802
798.5416
799.5453
800.5596801.5636
798.45 798.50 798.55 798.60m/z
0.0
0.2
0.4
0.6
0.8
1.0
1.2
Rel
ativ
e A
bund
ance
798.5990
798.4895
12.5 ppm window (Δm/z=0.01)
m/z
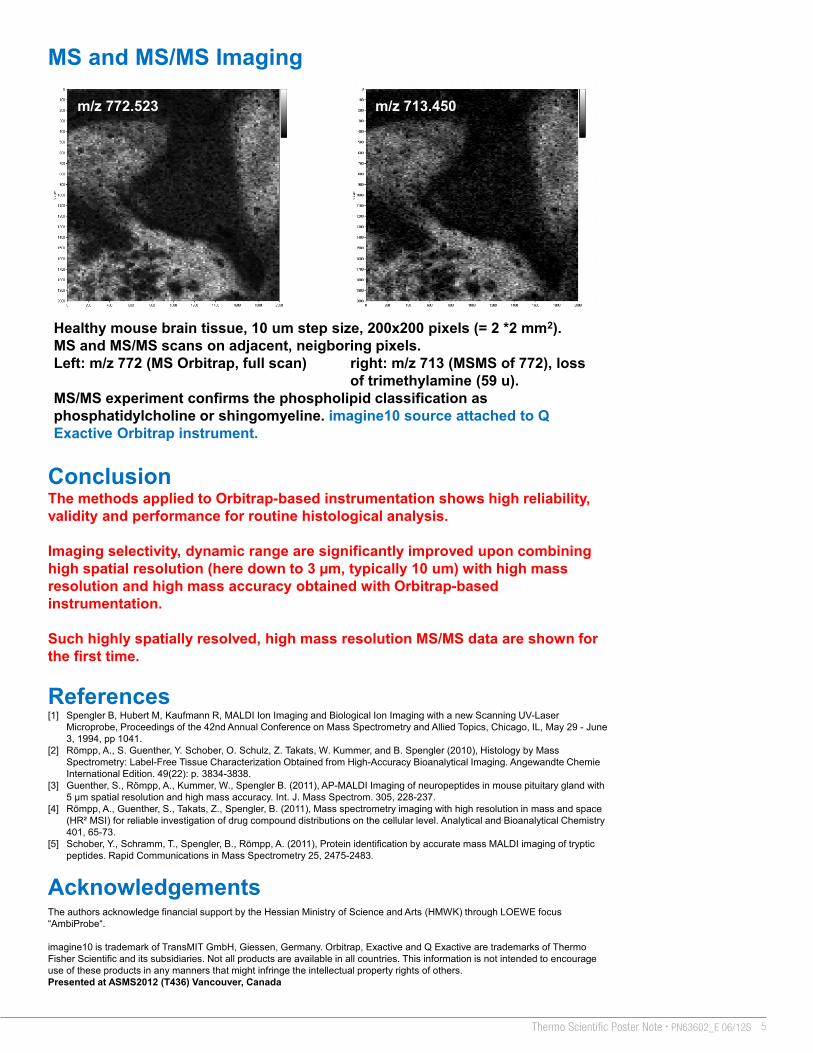
Healthy mouse brain tissue, 10 um step size, 200x200 pixels (= 2 *2 mm2). MS and MS/MS scans on adjacent, neigboring pixels.Left: m/z 772 (MS Orbitrap, full scan) right: m/z 713 (MSMS of 772), loss
of trimethylamine (59 u).MS/MS experiment confirms the phospholipid classification as phosphatidylcholine or shingomyeline. imagine10 source attached to Q Exactive Orbitrap instrument.
m/z 772.523 m/z 713.450
3Thermo Scientific Poster Note • PN63602_E 06/12S
laser beam path = ion trajectory =observation path =base plate =
CCD Camera
mirror(centrally bored)
objective lens(centrally bored)
movable sample stage (x, y, z)
observation mirror(off axis)
aperture
lens mirror
static and variable attenuator
N2 Laser
Thermo ScientificQ ExactiveTM
mirror
Performance of AP-SMALDI MSImaging imagine10Spatial Resolution
ConclusionThe methods applied to Orbitrap-based instrumentation shows high reliability, validity and performance for routine histological analysis.
Imaging selectivity, dynamic range are significantly improved upon combining high spatial resolution (here down to 3 µm, typically 10 um) with high mass resolution and high mass accuracy obtained with Orbitrap-based instrumentation.
Such highly spatially resolved, high mass resolution MS/MS data are shown for the first time.
References[1] Spengler B, Hubert M, Kaufmann R, MALDI Ion Imaging and Biological Ion Imaging with a new Scanning UV-Laser
Microprobe, Proceedings of the 42nd Annual Conference on Mass Spectrometry and Allied Topics, Chicago, IL, May 29 - June 3, 1994, pp 1041.
[2] Römpp, A., S. Guenther, Y. Schober, O. Schulz, Z. Takats, W. Kummer, and B. Spengler (2010), Histology by Mass Spectrometry: Label-Free Tissue Characterization Obtained from High-Accuracy Bioanalytical Imaging. Angewandte ChemieInternational Edition. 49(22): p. 3834-3838.
[3] Guenther, S., Römpp, A., Kummer, W., Spengler B. (2011), AP-MALDI Imaging of neuropeptides in mouse pituitary gland with 5 µm spatial resolution and high mass accuracy. Int. J. Mass Spectrom. 305, 228-237.
[4] Römpp, A., Guenther, S., Takats, Z., Spengler, B. (2011), Mass spectrometry imaging with high resolution in mass and space (HR² MSI) for reliable investigation of drug compound distributions on the cellular level. Analytical and Bioanalytical Chemistry 401, 65-73.
[5] Schober, Y., Schramm, T., Spengler, B., Römpp, A. (2011), Protein identification by accurate mass MALDI imaging of trypticpeptides. Rapid Communications in Mass Spectrometry 25, 2475-2483.
AcknowledgementsThe authors acknowledge financial support by the Hessian Ministry of Science and Arts (HMWK) through LOEWE focus “AmbiProbe“.
imagine10 is trademark of TransMIT GmbH, Giessen, Germany. Orbitrap, Exactive and Q Exactive are trademarks of Thermo Fisher Scientific and its subsidiaries. Not all products are available in all countries. This information is not intended to encourage use of these products in any manners that might infringe the intellectual property rights of others. Presented at ASMS2012 (T436) Vancouver, Canada
OverviewPurpose: Short synopsis about the research approach.
Methods: Short synopsis of the experimental methods.
Results: Short synopsis of the results.
IntroductionMALDI Mass Spectrometry Imaging (MSI), 17 years after its first announcement [1], has turned into a routine method of highest performance for the molecular histology of biological tissue [2]. The method, providing high resolution and accuracy in mass and space, has been developed for a reliable identification and localization of individual tissue components, and has been applied recently to a number of research areas in pathology, cancer diagnostics, metabolic pathway analysis and plant research [2-5]. Targeted compound classes included phospholipids, peptides, proteins, drug compounds and metabolites. An atmospheric pressure (AP) ion source has been developed for these studies, based on a dedicated microoptical setup that provides highest spatial resolution of 3 to 5 micrometer on tissue in imaging mode on Orbitrap-based instrumentation.The advantages of Orbitrap detection are given here:1. High mass resolution allows to analyze complex tissue samples, sample complexity2. High mass accuracy enables for straightforward sum formula assignments and facilitates
substance identification, substance identificationAccurate MS and MS/MS imaging data allow to align images, confirmation
3. Irrelevance of sample morphology/flatness, ease of sample / matrix preparation4. Convenience of AP interface, compatibility to ambient analysis
High Resolution in Mass and Space: AP-MALDI Imaging using Orbitrap-based InstrumentationBernhard Spengler1,3, Andreas Römpp1, Sabine Günther1, Oliver Schulz1, Klaus-Peter Hinz1, Alfons Hester1, Christian Schinz1, Christian Lotze1, Jörg-Ulrich Pötzl1, Kerstin Strupat2
1Institute of Inorganic and Analytical Chemistry, Justus Liebig University Giessen, Germany *[email protected] Fisher Scientific (Bremen) GmbH, Germany, [email protected], 3TransMIT GmbH, Giessen, Germany, [email protected]
Open-cover view of the atmospheric pressure
imaging ion sourceimagine10
(TransMIT GmbH, Giessen) attached to
a Thermo Scientific Q ExactiveTM
Orbitrap instrument, Thermo Fisher
Scientific (Bremen) GmbH
Scheme of the atmospheric pressure
imaging ion sourceimagine10
(TransMIT GmbH, Giessen) attached to a
Thermo Scientific Q ExactiveTM Orbitrap
instrument (Thermo Fisher Scientific (Bremen) GmbH) Coronal mouse brain section
35 µm steps, 295 x 195 pixels
Left: Focus size measurements (most left) and ablation on
tissue reveal an effective pixel
resolution in the range of 5 µm, effective pixel size if laser irradiance
dependent.
Above: Un-blurred red/green pixels indicate
an effective spatial resolution on mouse brain tissue (lateral ventricle)
of 3 µm.
Left:Single pixel (3 µm) = single scan
Exactive MS Orbitrap mass spectrum
Lateral ventricle, 3 µm steps, 170 x 200 pixels
Experimental
RMS = 0.2 ppm
+/-1
ppm
30,000 consecutive scans of PC(34:1) at m/z = 798.5410 on tissue during
image acquisiton using internal lock mass operation.
Representative single pixel (10 x 10 µm2) mass spectrum upon automated internal
lock mass operation. imagine10 source attached to Q Exactive
Orbitrap instrument
MS and MS/MS Imaging
A coaxial ion source geometry was employed to irradiate, desorb, ionize and transport biological compounds under atmospheric pressure conditions. Ions are introduced into the mass spectrometer through an
extended heated capillary. Transfer efficiency was optimized using both, gas stream dynamics and electrostatic ion focusing. The
achievable mass accuracy during tissue imaging operation is typically better than 1 ppm RMS using lock mass calibration. Imaging speed is
up to 2 pixels per second, depending on mass range and mass resolution setting. Matrix preparation and on-tissue protein digestion
were performed using a new dedicated protocol.
50 µm100 µm
Red: backgroundGreen: PC(38:4)Blue: PC(34:1)
Healthy mouse brain tissue. Two phospholipids differing by 8 mmu (m/z
848.55 and m/z 848.63) are extracted into an MSimage.
10 µm, 400 x 400 pixels (= 4*4 mm2) Mass Resolution = 70000 @ m/z 400
imagine10 source attached to Q Exactive Orbitrap instrumentation
T007 CK75 MS-MSMS772 200x200 10um E17 #37003 RT: 805.25 AV: 1 NL: 9.03E4T: FTMS + p NSI Full ms [700.00-900.00]
700 720 740 760 780 800 820 840 860 880 900m/z
0
10
20
30
40
50
60
70
80
90
100
Rel
ativ
e A
bund
ance
798.55066
772.53479
896.61188
782.57678826.58234 870.59595
716.13373 760.59467734.57874 848.56702
820.53528
876.59943
S194 CK3 170x200 3um E170_RC798#26687 RT: 548.39 AV: 1 NL: 6.75E3
FTMS + p NSI Full ms [100.00-1000.00]
700 720 740 760 780 800 820 840 860 880 900 m/z0
50
100
Rel
ativ
e Ab
unda
nce
798.5412
772.5258
896.6012
769.5638 782.5681 870.5860739.4668 848.5556713.4514 826.5722756.5528844.5272804.5507
893.4771
Mass Resolution on Tissue
Mass Selectivity & Dynamic Range
Closely neighbored
signals, even of drastically
differing peak intensities, can be
clearly distiguished and
discriminated. Bin width Δm/z was
0.01 u.
798.5416PC(34:1)+K+
798.5909PE(38:0)+Na+
797 798 799 800 801 802
798.5416
799.5453
800.5596801.5636
798.45 798.50 798.55 798.60m/z
0.0
0.2
0.4
0.6
0.8
1.0
1.2
Rel
ativ
e A
bund
ance
798.5990
798.4895
12.5 ppm window (Δm/z=0.01)
m/z
Healthy mouse brain tissue, 10 um step size, 200x200 pixels (= 2 *2 mm2). MS and MS/MS scans on adjacent, neigboring pixels.Left: m/z 772 (MS Orbitrap, full scan) right: m/z 713 (MSMS of 772), loss
of trimethylamine (59 u).MS/MS experiment confirms the phospholipid classification as phosphatidylcholine or shingomyeline. imagine10 source attached to Q Exactive Orbitrap instrument.
m/z 772.523 m/z 713.450
4 High Resolution in Mass and Space: AP-MALDI Imaging Using Orbitrap-based Instrumentation
laser beam path = ion trajectory =observation path =base plate =
CCD Camera
mirror(centrally bored)
objective lens(centrally bored)
movable sample stage (x, y, z)
observation mirror(off axis)
aperture
lens mirror
static and variable attenuator
N2 Laser
Thermo ScientificQ ExactiveTM
mirror
Performance of AP-SMALDI MSImaging imagine10Spatial Resolution
ConclusionThe methods applied to Orbitrap-based instrumentation shows high reliability, validity and performance for routine histological analysis.
Imaging selectivity, dynamic range are significantly improved upon combining high spatial resolution (here down to 3 µm, typically 10 um) with high mass resolution and high mass accuracy obtained with Orbitrap-based instrumentation.
Such highly spatially resolved, high mass resolution MS/MS data are shown for the first time.
References[1] Spengler B, Hubert M, Kaufmann R, MALDI Ion Imaging and Biological Ion Imaging with a new Scanning UV-Laser
Microprobe, Proceedings of the 42nd Annual Conference on Mass Spectrometry and Allied Topics, Chicago, IL, May 29 - June 3, 1994, pp 1041.
[2] Römpp, A., S. Guenther, Y. Schober, O. Schulz, Z. Takats, W. Kummer, and B. Spengler (2010), Histology by Mass Spectrometry: Label-Free Tissue Characterization Obtained from High-Accuracy Bioanalytical Imaging. Angewandte ChemieInternational Edition. 49(22): p. 3834-3838.
[3] Guenther, S., Römpp, A., Kummer, W., Spengler B. (2011), AP-MALDI Imaging of neuropeptides in mouse pituitary gland with 5 µm spatial resolution and high mass accuracy. Int. J. Mass Spectrom. 305, 228-237.
[4] Römpp, A., Guenther, S., Takats, Z., Spengler, B. (2011), Mass spectrometry imaging with high resolution in mass and space (HR² MSI) for reliable investigation of drug compound distributions on the cellular level. Analytical and Bioanalytical Chemistry 401, 65-73.
[5] Schober, Y., Schramm, T., Spengler, B., Römpp, A. (2011), Protein identification by accurate mass MALDI imaging of trypticpeptides. Rapid Communications in Mass Spectrometry 25, 2475-2483.
AcknowledgementsThe authors acknowledge financial support by the Hessian Ministry of Science and Arts (HMWK) through LOEWE focus “AmbiProbe“.
imagine10 is trademark of TransMIT GmbH, Giessen, Germany. Orbitrap, Exactive and Q Exactive are trademarks of Thermo Fisher Scientific and its subsidiaries. Not all products are available in all countries. This information is not intended to encourage use of these products in any manners that might infringe the intellectual property rights of others. Presented at ASMS2012 (T436) Vancouver, Canada
OverviewPurpose: Short synopsis about the research approach.
Methods: Short synopsis of the experimental methods.
Results: Short synopsis of the results.
IntroductionMALDI Mass Spectrometry Imaging (MSI), 17 years after its first announcement [1], has turned into a routine method of highest performance for the molecular histology of biological tissue [2]. The method, providing high resolution and accuracy in mass and space, has been developed for a reliable identification and localization of individual tissue components, and has been applied recently to a number of research areas in pathology, cancer diagnostics, metabolic pathway analysis and plant research [2-5]. Targeted compound classes included phospholipids, peptides, proteins, drug compounds and metabolites. An atmospheric pressure (AP) ion source has been developed for these studies, based on a dedicated microoptical setup that provides highest spatial resolution of 3 to 5 micrometer on tissue in imaging mode on Orbitrap-based instrumentation.The advantages of Orbitrap detection are given here:1. High mass resolution allows to analyze complex tissue samples, sample complexity2. High mass accuracy enables for straightforward sum formula assignments and facilitates
substance identification, substance identificationAccurate MS and MS/MS imaging data allow to align images, confirmation
3. Irrelevance of sample morphology/flatness, ease of sample / matrix preparation4. Convenience of AP interface, compatibility to ambient analysis
High Resolution in Mass and Space: AP-MALDI Imaging using Orbitrap-based InstrumentationBernhard Spengler1,3, Andreas Römpp1, Sabine Günther1, Oliver Schulz1, Klaus-Peter Hinz1, Alfons Hester1, Christian Schinz1, Christian Lotze1, Jörg-Ulrich Pötzl1, Kerstin Strupat2
1Institute of Inorganic and Analytical Chemistry, Justus Liebig University Giessen, Germany *[email protected] Fisher Scientific (Bremen) GmbH, Germany, [email protected], 3TransMIT GmbH, Giessen, Germany, [email protected]
Open-cover view of the atmospheric pressure
imaging ion sourceimagine10
(TransMIT GmbH, Giessen) attached to
a Thermo Scientific Q ExactiveTM
Orbitrap instrument, Thermo Fisher
Scientific (Bremen) GmbH
Scheme of the atmospheric pressure
imaging ion sourceimagine10
(TransMIT GmbH, Giessen) attached to a
Thermo Scientific Q ExactiveTM Orbitrap
instrument (Thermo Fisher Scientific (Bremen) GmbH) Coronal mouse brain section
35 µm steps, 295 x 195 pixels
Left: Focus size measurements (most left) and ablation on
tissue reveal an effective pixel
resolution in the range of 5 µm, effective pixel size if laser irradiance
dependent.
Above: Un-blurred red/green pixels indicate
an effective spatial resolution on mouse brain tissue (lateral ventricle)
of 3 µm.
Left:Single pixel (3 µm) = single scan
Exactive MS Orbitrap mass spectrum
Lateral ventricle, 3 µm steps, 170 x 200 pixels
Experimental
RMS = 0.2 ppm
+/-1
ppm
30,000 consecutive scans of PC(34:1) at m/z = 798.5410 on tissue during
image acquisiton using internal lock mass operation.
Representative single pixel (10 x 10 µm2) mass spectrum upon automated internal
lock mass operation. imagine10 source attached to Q Exactive
Orbitrap instrument
MS and MS/MS Imaging
A coaxial ion source geometry was employed to irradiate, desorb, ionize and transport biological compounds under atmospheric pressure conditions. Ions are introduced into the mass spectrometer through an
extended heated capillary. Transfer efficiency was optimized using both, gas stream dynamics and electrostatic ion focusing. The
achievable mass accuracy during tissue imaging operation is typically better than 1 ppm RMS using lock mass calibration. Imaging speed is
up to 2 pixels per second, depending on mass range and mass resolution setting. Matrix preparation and on-tissue protein digestion
were performed using a new dedicated protocol.
50 µm100 µm
Red: backgroundGreen: PC(38:4)Blue: PC(34:1)
Healthy mouse brain tissue. Two phospholipids differing by 8 mmu (m/z
848.55 and m/z 848.63) are extracted into an MSimage.
10 µm, 400 x 400 pixels (= 4*4 mm2) Mass Resolution = 70000 @ m/z 400
imagine10 source attached to Q Exactive Orbitrap instrumentation
T007 CK75 MS-MSMS772 200x200 10um E17 #37003 RT: 805.25 AV: 1 NL: 9.03E4T: FTMS + p NSI Full ms [700.00-900.00]
700 720 740 760 780 800 820 840 860 880 900m/z
0
10
20
30
40
50
60
70
80
90
100
Rel
ativ
e A
bund
ance
798.55066
772.53479
896.61188
782.57678826.58234 870.59595
716.13373 760.59467734.57874 848.56702
820.53528
876.59943
S194 CK3 170x200 3um E170_RC798#26687 RT: 548.39 AV: 1 NL: 6.75E3
FTMS + p NSI Full ms [100.00-1000.00]
700 720 740 760 780 800 820 840 860 880 900 m/z0
50
100
Rel
ativ
e Ab
unda
nce
798.5412
772.5258
896.6012
769.5638 782.5681 870.5860739.4668 848.5556713.4514 826.5722756.5528844.5272804.5507
893.4771
Mass Resolution on Tissue
Mass Selectivity & Dynamic Range
Closely neighbored
signals, even of drastically
differing peak intensities, can be
clearly distiguished and
discriminated. Bin width Δm/z was
0.01 u.
798.5416PC(34:1)+K+
798.5909PE(38:0)+Na+
797 798 799 800 801 802
798.5416
799.5453
800.5596801.5636
798.45 798.50 798.55 798.60m/z
0.0
0.2
0.4
0.6
0.8
1.0
1.2
Rel
ativ
e A
bund
ance
798.5990
798.4895
12.5 ppm window (Δm/z=0.01)
m/z
Healthy mouse brain tissue, 10 um step size, 200x200 pixels (= 2 *2 mm2). MS and MS/MS scans on adjacent, neigboring pixels.Left: m/z 772 (MS Orbitrap, full scan) right: m/z 713 (MSMS of 772), loss
of trimethylamine (59 u).MS/MS experiment confirms the phospholipid classification as phosphatidylcholine or shingomyeline. imagine10 source attached to Q Exactive Orbitrap instrument.
m/z 772.523 m/z 713.450
5Thermo Scientific Poster Note • PN63602_E 06/12S
laser beam path = ion trajectory =observation path =base plate =
CCD Camera
mirror(centrally bored)
objective lens(centrally bored)
movable sample stage (x, y, z)
observation mirror(off axis)
aperture
lens mirror
static and variable attenuator
N2 Laser
Thermo ScientificQ ExactiveTM
mirror
Performance of AP-SMALDI MSImaging imagine10Spatial Resolution
ConclusionThe methods applied to Orbitrap-based instrumentation shows high reliability, validity and performance for routine histological analysis.
Imaging selectivity, dynamic range are significantly improved upon combining high spatial resolution (here down to 3 µm, typically 10 um) with high mass resolution and high mass accuracy obtained with Orbitrap-based instrumentation.
Such highly spatially resolved, high mass resolution MS/MS data are shown for the first time.
References[1] Spengler B, Hubert M, Kaufmann R, MALDI Ion Imaging and Biological Ion Imaging with a new Scanning UV-Laser
Microprobe, Proceedings of the 42nd Annual Conference on Mass Spectrometry and Allied Topics, Chicago, IL, May 29 - June 3, 1994, pp 1041.
[2] Römpp, A., S. Guenther, Y. Schober, O. Schulz, Z. Takats, W. Kummer, and B. Spengler (2010), Histology by Mass Spectrometry: Label-Free Tissue Characterization Obtained from High-Accuracy Bioanalytical Imaging. Angewandte ChemieInternational Edition. 49(22): p. 3834-3838.
[3] Guenther, S., Römpp, A., Kummer, W., Spengler B. (2011), AP-MALDI Imaging of neuropeptides in mouse pituitary gland with 5 µm spatial resolution and high mass accuracy. Int. J. Mass Spectrom. 305, 228-237.
[4] Römpp, A., Guenther, S., Takats, Z., Spengler, B. (2011), Mass spectrometry imaging with high resolution in mass and space (HR² MSI) for reliable investigation of drug compound distributions on the cellular level. Analytical and Bioanalytical Chemistry 401, 65-73.
[5] Schober, Y., Schramm, T., Spengler, B., Römpp, A. (2011), Protein identification by accurate mass MALDI imaging of trypticpeptides. Rapid Communications in Mass Spectrometry 25, 2475-2483.
AcknowledgementsThe authors acknowledge financial support by the Hessian Ministry of Science and Arts (HMWK) through LOEWE focus “AmbiProbe“.
imagine10 is trademark of TransMIT GmbH, Giessen, Germany. Orbitrap, Exactive and Q Exactive are trademarks of Thermo Fisher Scientific and its subsidiaries. Not all products are available in all countries. This information is not intended to encourage use of these products in any manners that might infringe the intellectual property rights of others. Presented at ASMS2012 (T436) Vancouver, Canada
OverviewPurpose: Short synopsis about the research approach.
Methods: Short synopsis of the experimental methods.
Results: Short synopsis of the results.
IntroductionMALDI Mass Spectrometry Imaging (MSI), 17 years after its first announcement [1], has turned into a routine method of highest performance for the molecular histology of biological tissue [2]. The method, providing high resolution and accuracy in mass and space, has been developed for a reliable identification and localization of individual tissue components, and has been applied recently to a number of research areas in pathology, cancer diagnostics, metabolic pathway analysis and plant research [2-5]. Targeted compound classes included phospholipids, peptides, proteins, drug compounds and metabolites. An atmospheric pressure (AP) ion source has been developed for these studies, based on a dedicated microoptical setup that provides highest spatial resolution of 3 to 5 micrometer on tissue in imaging mode on Orbitrap-based instrumentation.The advantages of Orbitrap detection are given here:1. High mass resolution allows to analyze complex tissue samples, sample complexity2. High mass accuracy enables for straightforward sum formula assignments and facilitates
substance identification, substance identificationAccurate MS and MS/MS imaging data allow to align images, confirmation
3. Irrelevance of sample morphology/flatness, ease of sample / matrix preparation4. Convenience of AP interface, compatibility to ambient analysis
High Resolution in Mass and Space: AP-MALDI Imaging using Orbitrap-based InstrumentationBernhard Spengler1,3, Andreas Römpp1, Sabine Günther1, Oliver Schulz1, Klaus-Peter Hinz1, Alfons Hester1, Christian Schinz1, Christian Lotze1, Jörg-Ulrich Pötzl1, Kerstin Strupat2
1Institute of Inorganic and Analytical Chemistry, Justus Liebig University Giessen, Germany *[email protected] Fisher Scientific (Bremen) GmbH, Germany, [email protected], 3TransMIT GmbH, Giessen, Germany, [email protected]
Open-cover view of the atmospheric pressure
imaging ion sourceimagine10
(TransMIT GmbH, Giessen) attached to
a Thermo Scientific Q ExactiveTM
Orbitrap instrument, Thermo Fisher
Scientific (Bremen) GmbH
Scheme of the atmospheric pressure
imaging ion sourceimagine10
(TransMIT GmbH, Giessen) attached to a
Thermo Scientific Q ExactiveTM Orbitrap
instrument (Thermo Fisher Scientific (Bremen) GmbH) Coronal mouse brain section
35 µm steps, 295 x 195 pixels
Left: Focus size measurements (most left) and ablation on
tissue reveal an effective pixel
resolution in the range of 5 µm, effective pixel size if laser irradiance
dependent.
Above: Un-blurred red/green pixels indicate
an effective spatial resolution on mouse brain tissue (lateral ventricle)
of 3 µm.
Left:Single pixel (3 µm) = single scan
Exactive MS Orbitrap mass spectrum
Lateral ventricle, 3 µm steps, 170 x 200 pixels
Experimental
RMS = 0.2 ppm
+/-1
ppm
30,000 consecutive scans of PC(34:1) at m/z = 798.5410 on tissue during
image acquisiton using internal lock mass operation.
Representative single pixel (10 x 10 µm2) mass spectrum upon automated internal
lock mass operation. imagine10 source attached to Q Exactive
Orbitrap instrument
MS and MS/MS Imaging
A coaxial ion source geometry was employed to irradiate, desorb, ionize and transport biological compounds under atmospheric pressure conditions. Ions are introduced into the mass spectrometer through an
extended heated capillary. Transfer efficiency was optimized using both, gas stream dynamics and electrostatic ion focusing. The
achievable mass accuracy during tissue imaging operation is typically better than 1 ppm RMS using lock mass calibration. Imaging speed is
up to 2 pixels per second, depending on mass range and mass resolution setting. Matrix preparation and on-tissue protein digestion
were performed using a new dedicated protocol.
50 µm100 µm
Red: backgroundGreen: PC(38:4)Blue: PC(34:1)
Healthy mouse brain tissue. Two phospholipids differing by 8 mmu (m/z
848.55 and m/z 848.63) are extracted into an MSimage.
10 µm, 400 x 400 pixels (= 4*4 mm2) Mass Resolution = 70000 @ m/z 400
imagine10 source attached to Q Exactive Orbitrap instrumentation
T007 CK75 MS-MSMS772 200x200 10um E17 #37003 RT: 805.25 AV: 1 NL: 9.03E4T: FTMS + p NSI Full ms [700.00-900.00]
700 720 740 760 780 800 820 840 860 880 900m/z
0
10
20
30
40
50
60
70
80
90
100
Rel
ativ
e A
bund
ance
798.55066
772.53479
896.61188
782.57678826.58234 870.59595
716.13373 760.59467734.57874 848.56702
820.53528
876.59943
S194 CK3 170x200 3um E170_RC798#26687 RT: 548.39 AV: 1 NL: 6.75E3
FTMS + p NSI Full ms [100.00-1000.00]
700 720 740 760 780 800 820 840 860 880 900 m/z0
50
100
Rel
ativ
e Ab
unda
nce
798.5412
772.5258
896.6012
769.5638 782.5681 870.5860739.4668 848.5556713.4514 826.5722756.5528844.5272804.5507
893.4771
Mass Resolution on Tissue
Mass Selectivity & Dynamic Range
Closely neighbored
signals, even of drastically
differing peak intensities, can be
clearly distiguished and
discriminated. Bin width Δm/z was
0.01 u.
798.5416PC(34:1)+K+
798.5909PE(38:0)+Na+
797 798 799 800 801 802
798.5416
799.5453
800.5596801.5636
798.45 798.50 798.55 798.60m/z
0.0
0.2
0.4
0.6
0.8
1.0
1.2
Rel
ativ
e A
bund
ance
798.5990
798.4895
12.5 ppm window (Δm/z=0.01)
m/z
Healthy mouse brain tissue, 10 um step size, 200x200 pixels (= 2 *2 mm2). MS and MS/MS scans on adjacent, neigboring pixels.Left: m/z 772 (MS Orbitrap, full scan) right: m/z 713 (MSMS of 772), loss
of trimethylamine (59 u).MS/MS experiment confirms the phospholipid classification as phosphatidylcholine or shingomyeline. imagine10 source attached to Q Exactive Orbitrap instrument.
m/z 772.523 m/z 713.450

PN63602_E 06/12S
Africa-Other +27 11 570 1840Australia +61 3 9757 4300Austria +43 1 333 50 34 0Belgium +32 53 73 42 41Canada +1 800 530 8447China +86 10 8419 3588Denmark +45 70 23 62 60
Europe-Other +43 1 333 50 34 0Finland/Norway/Sweden +46 8 556 468 00France +33 1 60 92 48 00Germany +49 6103 408 1014India +91 22 6742 9434Italy +39 02 950 591
Japan +81 45 453 9100Latin America +1 561 688 8700Middle East +43 1 333 50 34 0Netherlands +31 76 579 55 55New Zealand +64 9 980 6700Russia/CIS +43 1 333 50 34 0South Africa +27 11 570 1840
Spain +34 914 845 965Switzerland +41 61 716 77 00UK +44 1442 233555USA +1 800 532 4752
www.thermoscientific.com©2012 Thermo Fisher Scientific Inc. All rights reserved. ISO is a trademark of the International Standards Organization. All other trademarks are the property of Thermo Fisher Scientific Inc. and its subsidiaries. This information is presented as an example of the capabilities of Thermo Fisher Scientific Inc. products. It is not intended to encourage use of these products in any manners that might infringe the intellectual property rights of others. Specifications, terms and pricing are subject to change. Not all products are available in all countries. Please consult your local sales representative for details.
![High Spatial Resolution Ambient Ionization Mass ...MSI is its spatial resolving power.[29–32] To visualize fine chemical details of the sample surface in its intact state comparable](https://img.pdfslide.org/doc/110x75/5f10fbcb37d4cd09bc5f54b7/high-spatial-resolution-ambient-ionization-mass-msi-is-its-spatial-resolving.jpg)