Embed Size (px)
Citation preview
Identification and characterization of causative
variants of periodontitis in the gene ST8SIA1
vorgelegt von
M. Sc.Avneesh Chopra
an der Fakultät III - Prozesswissenschaften
der Technischen Universität Berlin
zur Erlangung des akademischen Grades
Doktor der Naturwissenschaften
- Dr. rer. nat. -
genehmigte Dissertation
Promotionsausschuss:
Vorsitzende: Prof. Dr.-Ing. Claudia Fleck
Gutachter: Prof. Dr. Roland Lauster
Gutachter: Prof. Dr. Arne Schäfer
Gutachterin: Prof. Dr. Elisabeth Grohmann
Tag der wissenschaftlichen Aussprache: 04. August 2021
Berlin 2021
TABLE OF CONTENTS
I. ACKNOWLEDGEMENTS ............................................................................................... 4 II. STATUTORY DECLARATION ...................................................................................... 5 III. LIST OF ABBREVIATIONS ............................................................................................ 7 IV. LIST OF FIGURES ......................................................................................................... 12 V. LIST OF TABLES ........................................................................................................... 13 VI. ABSTRACT ...................................................................................................................... 14 VII. ZUSAMMENFASSUNG ............................................................................................ 15 1 CHAPTER: INTRODUCTION ...................................................................................... 16
1.1 Complex Disease ...................................................................................................... 16 1.2 Single nucleotide polymorphism (SNP) ................................................................... 16
1.2.1 Expression quantitative trait loci (eQTL) ............................................................. 18 1.3 Genetic association studies ....................................................................................... 19
1.3.1 Methods to identify causal variants and their target gene(s) ................................ 19 1.3.2 Specific research area: ST8SIA1 is a genetic risk factor of periodontitis ............. 25
1.4 Periodontitis .............................................................................................................. 27 1.5 Aims of the thesis ..................................................................................................... 29
2 CHAPTER: MATERIALS .............................................................................................. 30 2.1 Chemicals and solutions ........................................................................................... 30 2.2 Devices and consumables ......................................................................................... 31 2.3 Enzymes ................................................................................................................... 32 2.4 Media, buffers and kits ............................................................................................. 33 2.5 Software and databases ............................................................................................ 34 2.6 Plasmids .................................................................................................................... 34 2.7 Oligonucleotides ....................................................................................................... 35
3 CHAPTER: METHODS ................................................................................................. 38 3.1 Development of the barcoded reporter gene system ................................................ 38
3.1.1 Cloning of reporter gene plasmids ....................................................................... 39 3.1.2 Preparation and induction of input library for parallel reporter genes ................. 45 3.1.3 Determination of primer specificity and efficiency ............................................. 45 3.1.4 Analysis of reporter genes .................................................................................... 46 3.1.5 Validation of reporter gene activity by firefly luminescence ............................... 46
3.2 In silico identification of putative causal variants .................................................... 47 3.3 Electrophoretic mobility shift assay ......................................................................... 48 3.4 Protein extraction from cell cultures ........................................................................ 49
3.4.1 Quantitative protein determination ....................................................................... 50 3.5 CRISPR-mediated gene activation ........................................................................... 51
3.5.1 sgRNA design ....................................................................................................... 51 3.5.2 Generation of sgRNA plasmids ............................................................................ 52 3.5.3 CRISPRa induction and analysis .......................................................................... 53
3.6 RNA-Sequencing ...................................................................................................... 53 3.7 Cell culture ............................................................................................................... 54
3.7.1 Determination of cell number and viability.......................................................... 55 3.7.2 Transfection .......................................................................................................... 55
3.8 Preparation and induction of cigarette smoke extract .............................................. 56 3.9 Quantitative real-time PCR ...................................................................................... 57
3.9.1 Total RNA extraction and isolation ...................................................................... 59 3.9.2 RNA Purification .................................................................................................. 60 3.9.3 cDNA synthesis .................................................................................................... 61
ACKNOWLEDGEMENTS
3
4 CHAPTER: RESULTS .................................................................................................... 63 4.1 Development of the barcoded reporter gene system ................................................ 64
4.1.1 Determination of specificity, cross-reactivity and efficiency of barcodes ........... 64 4.1.2 Sensitivity analysis of the RNA-barcode reporter gene system ........................... 66 4.1.3 Proof of principle .................................................................................................. 67 4.1.4 The barcoded reporter gene plasmids can detect regulatory effects of environmental factors ....................................................................................................... 67 4.1.5 The barcoded reporter gene system is scalable .................................................... 68
4.2 Identification and characterization of the causal variant of the G×S association at ST8SIA1 ................................................................................................................................ 70
4.2.1 In silico identification of putative causal variants ................................................ 70 4.2.2 The associated haplotype block contains two putative regulatory regions at ST8SIA1 ............................................................................................................................ 71 4.2.3 In silico effects of the associated LD-SNPs on transcription factor binding affinity .............................................................................................................................. 73 4.2.4 The periodontitis-associated chromatin elements at ST8SIA1 are transcriptional repressors .......................................................................................................................... 74 4.2.5 BACH1 binding is reduced at the putative causal T-allele of rs2012722 ............ 76 4.2.6 The disease-associated haplotype block contains multiple BACH1 binding sites ... .............................................................................................................................. 77 4.2.7 The disease-associated repressor elements regulate ST8SIA1 expression in -cis . 79 4.2.8 Overexpression of ST8SIA1 upregulates ABCA1 and the ‘cell cycle arrest’ and ‘integrin cell surface’ signaling ........................................................................................ 79 4.2.9 Gene set enrichment analysis ............................................................................... 80
5 CHAPTER: DISCUSSION ............................................................................................. 82 6 APPENDIX ....................................................................................................................... 88 7 REFERENCES ................................................................................................................. 98

ACKNOWLEDGEMENTS
4
I. ACKNOWLEDGEMENTS
This doctoral dissertation was carried out during 2019 to 2021 in a collaborative project with the Charité - Universitätsmedizin Berlin (Department of Periodontology, Oral Medicine and Oral Surgery, Institute for Dental and Craniofacial Sciences, Prof. Dr. Arne Schäfer) and the Beuth Hochschule für Technik Berlin (Department of Microbiology, Faculty of Life Sciences and Technology, Prof. Dr. Elisabeth Grohmann). University supervision was supported by Prof. Dr. Roland Lauster, Department of Medical Biotechnology, Institute of Biotechnology, Technische Universität Berlin.
I would like to express my heartfelt appreciation to Prof. Dr. Arne Schäfer for providing the exciting topic as well as his critical and helpful suggestions during my entire doctoral study period. I would like to exhibit gratitude to Prof. Dr. Elisabeth Grohmann for her very friendly supervision and her constant willingness to discuss and help. I am extremely grateful to Prof. Dr. Roland Lauster for his inclination to take over the university supervision and support. Many thanks for the very pleasant and collegial cooperation.
For the friendly working atmosphere and the many valuable suggestions, I would like to credit all members of the research group ‘Genetics of Oral Inflammatory Diseases’. My special thanks go to Ricarda Müller, Xin Bao, Gesa Richter, Laura Jasmin Herrmann, Themistoklis Kotanidis, Zhihui Chen, Jia-Hui Song and Luyang Zheng. I would sincerely acknowledge Dr.-Ing. Jennifer Rosowski (Technische Universität Berlin) for her valuable support in the final phase of my thesis.
I would take this opportunity to recognize Prof. Dr. Herbert Wank (FH Campus Wien) and Prof. Dr.-Ing. Joachim Große Wiesmann (Beuth Hochschule für Technik Berlin) for their constant support throughout my academic and professional career. I am greatly indebted to Swinsheel Kaur for her support and diligent proofreading of this thesis.
Finally, my heartfelt thanks go to my family, friends and especially my first mentors Nirankari Baba Hardev Singh Ji and Nirankari Mata Savinder Hardev Ji for all their support, motivation, and guidance.
Thank you very much!

STATUTORY DECLARATION
5
II. STATUTORY DECLARATION
I, Avneesh Chopra, by personally signing this document in lieu of an oath, hereby affirm that I prepared the submitted dissertation on the topic ‘Identification and characterization of causative variants of periodontitis in the gene ST8SIA1’, independently and without the support of third parties, and that I used no other sources and aids than those stated.
All parts, which are based on the publications or presentations of other authors, either in letter or in spirit, are specified as such in accordance with the citing guidelines. The sections on methodology (in particular regarding practical work, laboratory regulations, statistical processing) and results (in particular regarding figures, charts and tables) are exclusively my responsibility.
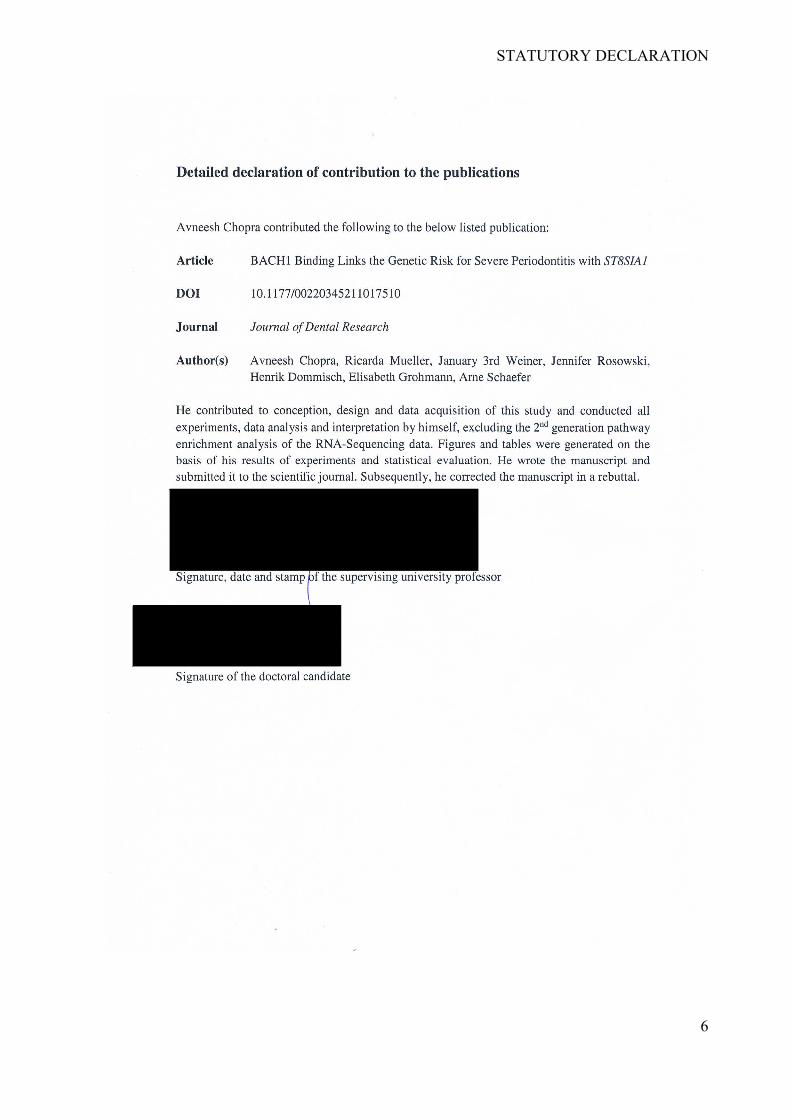
My contributions to any publications to this dissertation correspond to those stated in the below joint declaration made together with the supervisor. All publications created within the scope of the dissertation comply with the guidelines of the ICMJE (International Committee of Medical Journal Editors; www.icmje.org) on authorship. In addition, I declare that I have not yet submitted this dissertation in identical or similar form to another faculty or university for examination.
The significance of this statutory declaration and the consequences of a false statutory declaration under criminal law (Sections 156, 161 of the German Criminal Code) are known to me.
.………………………. .………………………. Place and date Signature
STATUTORY DECLARATION
6
LIST OF ABBREVIATIONS
7
III. LIST OF ABBREVIATIONS
1000 Genomes Project Consortium 1000g
75 cm2 cell culture flask T-75
8-sialyltransferase ST8 alpha-N-acetyl-neuraminide
alpha-2,8-sialyltransferase 1 ST8SIA1
Aggressive periodontitis AgP
Ammonium Persulfate APS
and others (et alii/aliae/alia) et al.
Antibody AB
Area under the curve AUC
Aryl-Hydrocarbon Receptor Repressor AHRR
ATP Binding Cassette Subfamily A Member 1 ABCA1
ATP-binding cassette ABC
Base pair(s) bp
Bone morphogenetic protein 7 BMP7
Bovine serum albumin BSA
British in England and Scotland GBR
BTB and CNC homology 1 BACH1
Calcium chloride CaCl2
Calf Intestinal, Alkaline Phosphatase CIP
Carbon dioxide CO2
Celsius °C
chromatin immunoprecipitation followed by sequencing ChIP-Seq
Cigarette smoke extract CSE
Clustered Regularly Interspaced Short Palindromic Repeats CRISPR
Coding SNP cSNP
Complementary DNA cDNA
Core Facility Genomics and the Core Unit Bioinformatics CUBI
CRISPR RNA crRNA
CRISPR/dCas9 activation CRISPRa
CRISPR-associated Cas
Cytochrome P450 1B1 CYP1B1
DeadCas9 dCas9
Deoxynucleotide dNTP
Deoxyribonuclease I DNAse I
LIST OF ABBREVIATIONS
8
Deoxyribonucleic acid DNA
Detergent-compatible DC
Diethyl pyrocarbonate DEPC
Dimethyl sulfoxide DMSO
DNAse I hypersensitivity DHS
Double-strand break(s) DBS
Dulbecco's Modified Eagle Medium DMEM
Efficacy E
Electrophoretic mobility shift assay EMSA
Elution buffer EB
Encyclopedia of noncoding DNA elements ENCODE
Epigenome-wide association study EWAS
Escherichia coli E. coli
Ethidium bromide EtBr
Ethylenediaminetetraacetic acid EDTA
Expression quantitative trait loci eQTL
Extracellular matrix ECM
False discovery rate FDR
Fetal Bovine Serum FBS
for example (exempli gratia) e.g.
Ganglioside(s) GD
Gene Expression Omnibus GEO
Genome Reference Consortium Human Build 37 (GRCh37) hg19
Genome-wide association studies GWAS
Genomic DNA gDNA
genotype–smoking G×S
Gingival fibroblasts GF
Glyceraldehyde-3-phosphate dehydrogenase GAPDH
Gram g
Gravity constant g
Guanine-allele G-allele
Henrietta Lacks (uterine cell variety; named for deceased patient) HeLa cells
Hertz Hz
Hidden Markov Model HMM
High-density lipoprotein HDL
Histone H3 acetylated at lysine 27 H3K27Ac
LIST OF ABBREVIATIONS
9
Histone H3 monomethylated at lysine 4 H3K4Me1
Homology-directed repair HR
Immortalized human gingival fibroblasts ihGFs
Insertion–deletion variation Indel
International Genome Sample Resource IGSR
Kilobase kb
Linkage disequilibrium LD
Liter L
Massively parallel reporter assay MPRA
Matrix metallopeptidase 9 MMP9
Melting temperature(s) Tm
Messenger RNA mRNA
Microgram µg
Microliter µL
Micromolar mM
MicroRNA miRNA
Milligram mg
Milliliter mL
Minor allele frequency MAF
Minute(s) min
miRNA hsa-miR-374b-5p on chromosome X miRNA X
Molar M
Multiple cloning site MCS
Nanogram ng
Nanometer nm
Next generation sequencing NGS
Non-coding RNA ncRNA
non-essential amino acids NEAA
Non-homologous end joining NHEJ
Nucleic acids NS
Nucleotide nt
Open reading frame ORF
Overnight culture(s) OC
Penicillin/Streptomycin P/S
Percentage %
Phosphate Buffered Saline PBS
LIST OF ABBREVIATIONS
10
Polyacrylamide gel electrophoresis PAGE
Polyethyleneimine PEI
Polymerase chain reaction PCR
Position weight matrices PWM
Potential of hydrogen pH
Probability value P value
Protospacer adjacent motif PAM
Quality control QC
Quantitative real-time PCR qRT-PCR
Regulatory SNP rSNP
Reverse transcriptase RT
Ribonuclease RNase
Ribonucleic acid RNA
Ribosomal RNA rRNA
RNA integrity numbers RIN
RNA polymerase RNAP
RNA-Sequencing RNA-Seq
Sclerostin SOST
Second(s) sec
Single nucleotide polymorphism SNP
Single-guide RNA sgRNA
Slingshot Protein Phosphatase 1 SSH1
Small interfering RNA siRNA
Sodium chloride NaCl
Sodium dodecyl sulfate SDS
Standard deviation SD
Super Optimal Broth S.O.C.
Synergistic Activation Mediator SAM
T4 Polynucleotide Kinase T4 PNK
Tetramethylethylenediamine TEMED
that is (id est) i.e.
Threshold cycle Ct
Thymine-allele T-allele
Trans-activating CRISPR RNA tracrRNA
Transcription factor TF
Transcription factor binding site(s) TFBS
LIST OF ABBREVIATIONS
11
Transfer-RNA tRNA
Tris(hydroxymethyl)aminomethane Hydrochloride Tris-HCl
Tris(hydroxymethyl)aminomethane Tris
Tris-acetate-EDTA TAE
Tris-borate-EDTA TBE
Tris-EDTA TE
Tumor necrosis factor alpha TNF-alpha
Ultraviolet UV
Units U
Untranslated region UTR
Uracil-N-glycosylase UNG
Utah Residents CEPH
Utah Residents from North and West Europe CEU
Volt V
volume/volume v/v
weight/volume w/v
with w
without w/o
Yeast Extract Tryptone YT
LIST OF FIGURES
12
IV. LIST OF FIGURES
Figure 1. An illustration of the concept of regulation for specific gene expression by non-coding DNA elements (modified after Acharya et al. (2016)). .................................................................................................................. 18 Figure 2. Disease-associated genetic variation at transcription factor binding sites can modulate gene transcription by effecting chromatin looping (modified after Acharya et al. (2016)). ........................................... 20 Figure 3. Principle of a single reporter gene assay. .............................................................................................. 21 Figure 4. CRISPR/Cas9-mediated genome editing (Image taken with permission from Tian et al. (2017)). ....... 23 Figure 5. Principle of an electrophoretic mobility shift assay (EMSA). ............................................................... 24 Figure 6. A haplotype block at ST8SIA1 showed significant genotype–smoking (G×S) interaction (Freitag-Wolf et al. 2019). ............................................................................................................................................................ 26 Figure 7. ST8SIA1 is upregulated by cigarette smoke extract (CSE) (Freitag-Wolf et al. 2019). ......................... 26 Figure 8. Schematic illustration: Healthy periodontium, gingivitis, and periodontitis (modified after Hajishengallis (2015). ............................................................................................................................................ 27 Figure 9. Principle and workflow of the barcoded reporter gene system. ............................................................. 39 Figure 10. Apparatus for the preparation of liquid cigarette smoke extract. ......................................................... 57 Figure 11. Workflow of the experiments. The shaded fields describe the methods. The material used is given in brackets. The dotted fields indicate relevant results. ............................................................................................. 63 Figure 12. cDNAs of the barcoded input library (n = 4 barcodes, Table 18, Barcode No 1-4) for the reporter gene system showed no barcode plasmid DNA contamination by PCR. ............................................................... 66 Figure 13. Luciferase activity and transcript quantification from the multiplexed 3’UTR barcoded reporter gene plasmids with the AHRR and CYP1B1 enhancer sequences showed equal fold changes. ..................................... 67 Figure 14. 24 hours CSE exposure increased the expression of the CYP1B1-enhancer reporter gene 10-fold (barcode expression = 8.7 ± 0.9). T-Test: **, P = 0.002........................................................................................ 68 Figure 15. Different barcoded plasmid sets containing the same AHRR-enhancer sequence (Stueve et al. 2017) showed similar activation of reporter gene activity with no statistical difference. T-Test: ns, P > 0.05. .............. 69 Figure 16. Proxy SNPs for rs2728821 in CEU and GBR populations. LD Plot was assessed using LDproxy Tool (Machiela and Chanock 2015). .............................................................................................................................. 70 Figure 17. GWAS-nominated LD-SNPs locate at two putative regulatory regions within intron 2 of ST8SIA1 (taken from Chopra et al. (2021)). ......................................................................................................................... 72 Figure 18. Position weight matrix plot of BACH1 motif (taken from Jaspar). ..................................................... 73 Figure 19. Functional effect of the SNP-associated regions at ST8SIA1 by barcoded reporter gene system in immortalized human gingival fibroblasts. Data are shown as mean ± SD (taken from Chopra et al. (2021)). ...... 76 Figure 20. BACH1 binding at the disease-associated regulatory elements within the introns of ST8SIA1 was demonstrated by EMSA (taken from Chopra et al. (2021)). .................................................................................. 78 Figure 21. The periodontitis-associated DNA elements at Region 1 (tagged by rs3819872) and -2 (tagged by rs2012722) that showed BACH1 binding regulate ST8SIA1 expression in HeLa cells. Data are given as mean ± SD. **: P = 0.002; ***: P = 0.0002 (taken from Chopra et al. (2021)). ................................................................ 79 Figure 22. Gene set enrichment analysis of CRISPRa induced ST8SIA1 expression in HeLa cells (taken from Chopra et al. (2021)). ............................................................................................................................................. 81
LIST OF TABLES
13
V. LIST OF TABLES
Table 1: Chemicals and solutions. ........................................................................................................................ 30 Table 2: Devices and consumables. ...................................................................................................................... 31 Table 3: Enzymes. ................................................................................................................................................ 32 Table 4: Media, buffers and kits. .......................................................................................................................... 33 Table 5: Software and databases. .......................................................................................................................... 34 Table 6: Plasmids. ................................................................................................................................................. 34 Table 7: PCR and cloning primers used for reporter gene assays. ........................................................................ 35 Table 8: Oligonucleotides of the ST8SIA1 EMSA probes. ................................................................................... 36 Table 9: Oligonucleotides of the CRISPRa sgRNA probes. ................................................................................. 37 Table 10: Primers used for qRT-PCR. .................................................................................................................. 37 Table 11. PCR protocol with Taq DNA polymerase............................................................................................. 41 Table 12. PCR program for Taq DNA polymerase with temperature cycles and duration. .................................. 41 Table 13. PCR protocol with Phusion polymerase. .............................................................................................. 41 Table 14. PCR program for Phusion polymerase with temperature cycles and duration. ..................................... 42 Table 15. EMSA binding reaction. ....................................................................................................................... 49 Table 16. qRT-PCR protocol with the temperature cycles and the respective duration. ....................................... 59 Table 17. cDNA synthesis reaction. ...................................................................................................................... 62 Table 18. qRT-PCR detectable barcodes of the reporter gene system. ................................................................. 64 Table 19. qRT-PCR program of the barcoded reporter gene system. ................................................................... 64 Table 20. Amplification efficiencies of the qRT-PCR detectable barcodes of the reporter gene system. ............ 65 Table 21. r2 proxy SNPs of rs2728821 in Europe (1000 Genomes). The effect allele of the G×S association was rs2728821-A (highlighted in bold) (Freitag-Wolf et al. 2019). ............................................................................. 71 Table 22. Analysis of binding of transcription factors to ST8SIA1 lead SNP rs2728821 and LD proxy SNPs. ... 74 Table 23. Top up-and down-regulated genes (P < 10-3) following CRISPRa of ST8SIA1 in HeLa cells (taken from Chopra et al. (2021)). .................................................................................................................................... 80
ABSTRACT
14
VI. ABSTRACT
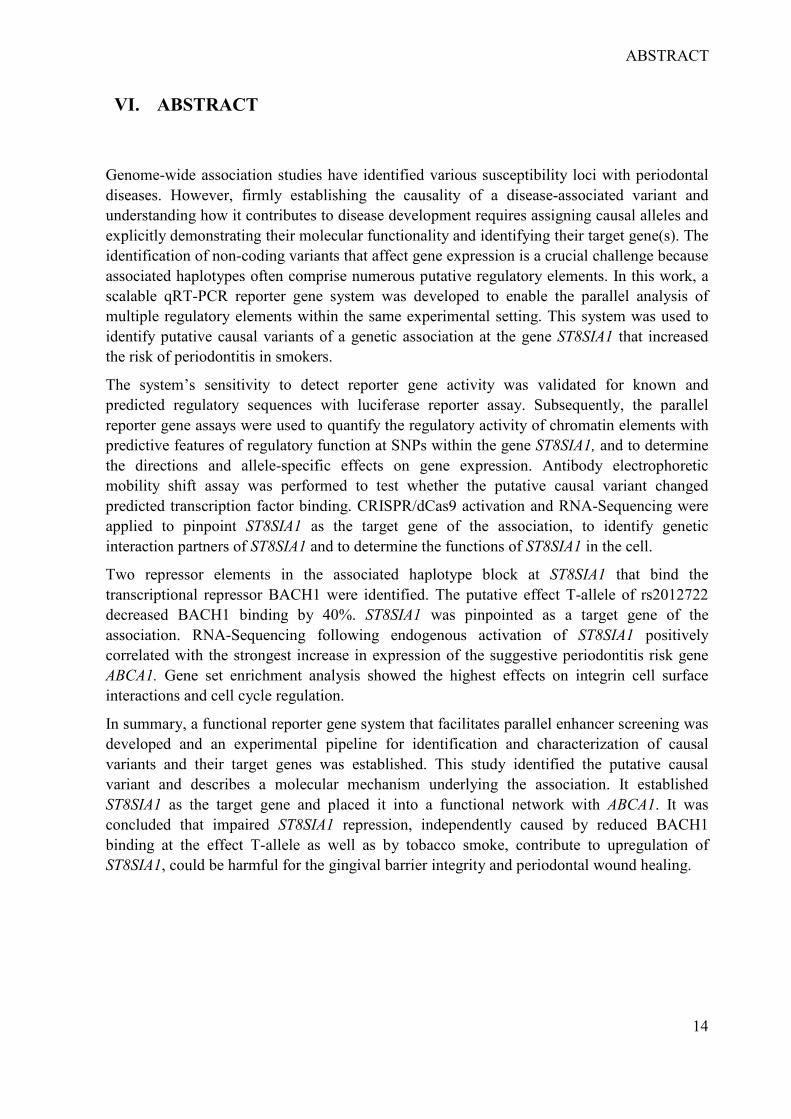
Genome-wide association studies have identified various susceptibility loci with periodontal diseases. However, firmly establishing the causality of a disease-associated variant and understanding how it contributes to disease development requires assigning causal alleles and explicitly demonstrating their molecular functionality and identifying their target gene(s). The identification of non-coding variants that affect gene expression is a crucial challenge because associated haplotypes often comprise numerous putative regulatory elements. In this work, a scalable qRT-PCR reporter gene system was developed to enable the parallel analysis of multiple regulatory elements within the same experimental setting. This system was used to identify putative causal variants of a genetic association at the gene ST8SIA1 that increased the risk of periodontitis in smokers.
The system’s sensitivity to detect reporter gene activity was validated for known and predicted regulatory sequences with luciferase reporter assay. Subsequently, the parallel reporter gene assays were used to quantify the regulatory activity of chromatin elements with predictive features of regulatory function at SNPs within the gene ST8SIA1, and to determine the directions and allele-specific effects on gene expression. Antibody electrophoretic mobility shift assay was performed to test whether the putative causal variant changed predicted transcription factor binding. CRISPR/dCas9 activation and RNA-Sequencing were applied to pinpoint ST8SIA1 as the target gene of the association, to identify genetic interaction partners of ST8SIA1 and to determine the functions of ST8SIA1 in the cell.
Two repressor elements in the associated haplotype block at ST8SIA1 that bind the transcriptional repressor BACH1 were identified. The putative effect T-allele of rs2012722 decreased BACH1 binding by 40%. ST8SIA1 was pinpointed as a target gene of the association. RNA-Sequencing following endogenous activation of ST8SIA1 positively correlated with the strongest increase in expression of the suggestive periodontitis risk gene ABCA1. Gene set enrichment analysis showed the highest effects on integrin cell surface interactions and cell cycle regulation.
In summary, a functional reporter gene system that facilitates parallel enhancer screening was developed and an experimental pipeline for identification and characterization of causal variants and their target genes was established. This study identified the putative causal variant and describes a molecular mechanism underlying the association. It established ST8SIA1 as the target gene and placed it into a functional network with ABCA1. It was concluded that impaired ST8SIA1 repression, independently caused by reduced BACH1 binding at the effect T-allele as well as by tobacco smoke, contribute to upregulation of ST8SIA1, could be harmful for the gingival barrier integrity and periodontal wound healing.
ZUSAMMENFASSUNG
15
VII. ZUSAMMENFASSUNG
Genomweite Assoziationsstudien haben verschiedene Suszeptibilitätsloci mit parodontalen Erkrankungen identifiziert. Um jedoch die Kausalität einer krankheitsassoziierten Variante festzustellen und zu verstehen, wie sie zur Krankheitsentwicklung beiträgt, ist es erforderlich, die kausalen Allele zuzuordnen und ihre molekulare Funktionalität explizit nachzuweisen sowie ihre Zielgene zu bestimmen. Die Identifizierung von nicht-kodierenden Varianten, die die Genexpression beeinflussen, ist eine wesentliche Herausforderung, da assoziierte Haplotypen oftmals zahlreiche putative regulatorische Elemente umfassen. Daher wurde ein skalierbares qRT-PCR-Reportergen System zur parallelen Quantifizierung regulatorischer Elemente entwickelt und zur Charakterisierung einer angezeigten Assoziation im Gen ST8SIA1, welche das Risiko für Parodontitis bei Rauchern erhöht, verwendet.
Die Detektionssensitivität der Reportergenaktivität wurde für bekannte und vorhergesagte regulatorische Sequenzen mit dem Luciferase-Reportergen Assay validiert. Nachfolgend wurden die entwickelten parallelen Reportergen-Assays verwendet, um regulatorische DNA-Elemente an den ST8SIA1-assoziierten SNPs zu identifizieren, deren Chromatin Modifikationen regulatorische Funktionen vermuten ließen. Mit den Reportergen Assays konnte die Wirkungsrichtung und allel-spezifische Effekte auf die Transkription dargestellt und quantifiziert werden. Ein Antikörper-Electrophoretic Mobility Shift Assay wurde durchgeführt, um zu testen, ob die putative kausale Variante die vorhergesagte Transkriptionsfaktor-Bindung verändert. Die CRISPR/dCas9-Aktivierung und RNA-Sequenzierung wurden angewandt, um ST8SIA1 als Zielgen der Assoziation festzulegen und genetische Interaktionspartner von ST8SIA1 sowie die Funktionen von ST8SIA1 in der Zelle zu identifizieren.
Zwei Repressorelemente im assoziierten Haplotyp-Block bei ST8SIA1, die den transkriptionellen Repressor BACH1 binden, wurden identifiziert. Das putative Effektallel T von rs2012722 reduzierte die BACH1-Bindung um 40%. ST8SIA1 wurde als ein Zielgen der Assoziation identifiziert. Die RNA-Sequenzierung nach endogener Aktivierung von ST8SIA1 korrelierte positiv mit dem stärksten Anstieg der Expression des angezeigten Parodontitis-Risikogens ABCA1. Die Gen-Set-Anreicherungsanalyse zeigte die stärksten Effekte auf Integrin-Zelloberflächeninteraktionen und Zellzyklusregulation.
Zusammenfassend wurde ein Reportergen System entwickelt, das ein paralleles Enhancer-Screening ermöglicht, und eine experimentelle Pipeline zur Identifizierung und Charakterisierung von kausalen Varianten und ihren Zielgenen etabliert. Diese Studie identifizierte die putative kausale Variante und beschreibt einen molekularen Mechanismus, der der Assoziation zugrunde liegt. Sie stellte ST8SIA1 als Zielgen fest und brachte es in ein funktionelles Netzwerk mit ABCA1 zusammen. Die gewonnenen Ergebnisse erlaubten die Schlussfolgerung, dass eine reduzierte BACH1-Bindung am Effektallel T die Expression von ST8SIA1 erhöht. Die dadurch verstärkte Expression ist additiv zu den Effekten von Tabakrauch, der unmittelbar zu einer Hochregulation von ST8SIA1 beiträgt. Diese additive Verstärkung der ST8SIA1 Expression kann die Integrität der gingivalen Barriere und der parodontalen Wundheilung beeinträchtigen.
CHAPTER: INTRODUCTION
16
1 CHAPTER: INTRODUCTION
1.1 Complex Disease
Complex diseases are caused by environmental and lifestyle factors as well as a genetic
predisposition, that shape the development and progression of the disease pattern. In contrast
to monogenic diseases, wherein the disease outbreak is caused solely by the phenomenon of
the causative allele in a single gene, the causes of complex diseases do not lie in just one gene
or factor (Risch 2000). The development of a complex disease is usually caused by different
genetic risk variants, whereby the effect size of each variant often has only a minor influence
on the pathogenesis. The risk variants are also found in healthy individuals and only
contribute to the disease risk through a specific combination of several risk variants in
conjunction with internal and external factors like age, smoking, malnutrition and emotional
stress (Kinane et al. 2006; Page et al. 2003). Accordingly, a complex disease such as
periodontitis is the sum of genetic and environmental effects. Genetic research offers the
identification of DNA sequence variants that contribute to disease susceptibility and
pathogenesis in specific situations (Timpson et al. 2018; Yong et al. 2020). Thus, it allows
improving our understanding of the pathogenic mechanisms underlying the disease.
1.2 Single nucleotide polymorphism (SNP)
SNPs are the most common form of human genetic variation. These are point mutations of
individual base pairs (bp) in the DNA strand. SNPs are therefore single positions in the
genome at which alternative nucleotides (alleles) can occur in individuals of a population
(Taillon-Miller et al. 1998). The initial definition of SNPs required that the frequency for the
rare allele should be at least 1 % (minor allele frequency, MAF) in the population in order to
distinguish SNPs from mutations (Brookes 1999). At present, if the MAF is > 0.01, the SNP
is now referred to as a frequent SNP, and if the MAF is < 0.01, the SNP is referred to as rare
(http://hapmap.ncbi.nlm.nih.gov/; (Karki et al. 2015)). SNPs are mostly bi-allelic and
consequently well suited for genotyping (Brookes 1999; Monteiro and Freedman 2013). SNPs
occur, on average, at a frequency of once every 300 bp in the human genome (Cox and Kraft
2006; Koboldt et al. 2006; Sainudiin et al. 2007). A typical genome differs from the reference
human genome at up to 5.0 million sites according to the 1000 Genomes Project Consortium
CHAPTER: INTRODUCTION
17
(1000g) (Consortium 2015). Of these, 99.9% of variants consist of common SNPs and short
Indels. These variants are mostly intergenic. 1000g also estimated that a typical genome
contains 149–182 sites with protein truncating variants, 10,000 to 12,000 sites with
nonsynonymous, peptide sequence altering variants and 24–30 variants per genome
implicated in rare disease through ClinVar (https://www.ncbi.nlm.nih.gov/clinvar/).
SNPs can influence our health. However, unlike certain rare mutations that may have strong
deleterious effects, common variants have low penetrance, i.e. there are many carriers without
expression of a phenotype or disease. Accordingly, SNPs are not solely responsible for the
development of a complex disease but affect a phenotype only through specific combinations
with other gene variants or environmental factors (Page et al. 2003). If an allele has a direct
influence on the pathogenesis of a genetic disease (direct association), then this is called a
causal SNP. The causal SNP can occur either in the coding or in the non-coding region. The
type and localization of the SNP is decisive because it influences the DNA strain and the
nature of the possible effect. If the SNP is located in the coding region of a gene, then this is
referred to as coding SNP (cSNP). This can lead to the exchange of an amino acid and thus to
a modified protein through the change of the base (non-synonymous). However, if the base
exchange changes the information of the codon, but the triplet continues to code for the same
amino acid, then it has no influence on the translated protein (synonymous) (Brieuc and Naish
2011). If the causal SNP is located in the non-coding region of a gene and influences gene
regulation, then this is referred to as regulatory SNP (rSNP). Here, the SNP can be at the
promoter or enhancers and have effects on gene regulation, which can affect the concentration
of the corresponding gene transcript (Cunnington et al. 2010; Libioulle et al. 2007). Within an
intron, the SNP can lead to alternative splicing of the messenger RNA (mRNA), thereby
increasing the risk of a disease-specific phenotype (Valentonyte et al. 2005). Furthermore,
SNPs in the untranslated regions (UTRs) can interfere with mRNA stability and translation
(Nicoloso et al. 2010).
In addition to these causative SNPs, there are also neutral disease-associated SNPs. These
disease-associated SNPs have no direct influence on the phenotype but are in linkage
disequilibrium (LD) with the actual disease-causing gene variant. LD occurs when the alleles
of two different gene loci are close together on a chromosome, appear more frequently
together in a growing population than would be expected if randomly distributed. Such a
chromosomal segment is called a LD block and a particular allele combination from a group
of SNPs within the LD block is called a haplotype (Slatkin 2008). The LD blocks are
CHAPTER: INTRODUCTION
18
inherited to the offspring until recombined. Many SNPs can be present in a LD block, but
because there is no recombination within a LD block, a single representative SNP (tagging
SNP) is sufficient to identify the haplotype of a single LD block (Kwok and Gu 1999).
1.2.1 Expression quantitative trait loci (eQTL)
eQTL mapping helps to understand the functional effects of disease-associated SNPs. eQTL
mapping involves determining the correlation between a genotype of a SNP and gene
transcript levels. In an eQTL mapping study, genetic variation are identified that cause
variations in the expression of genes. The expression profile of a gene is considered a
quantitative feature. Because of that, the effects of SNPs on gene expression are defined as
eQTLs. An identified eQTL contains a specific regulator that influences gene expression
(Jansen and Nap 2001). Potentially, eQTLs can be located in regulatory domains such as
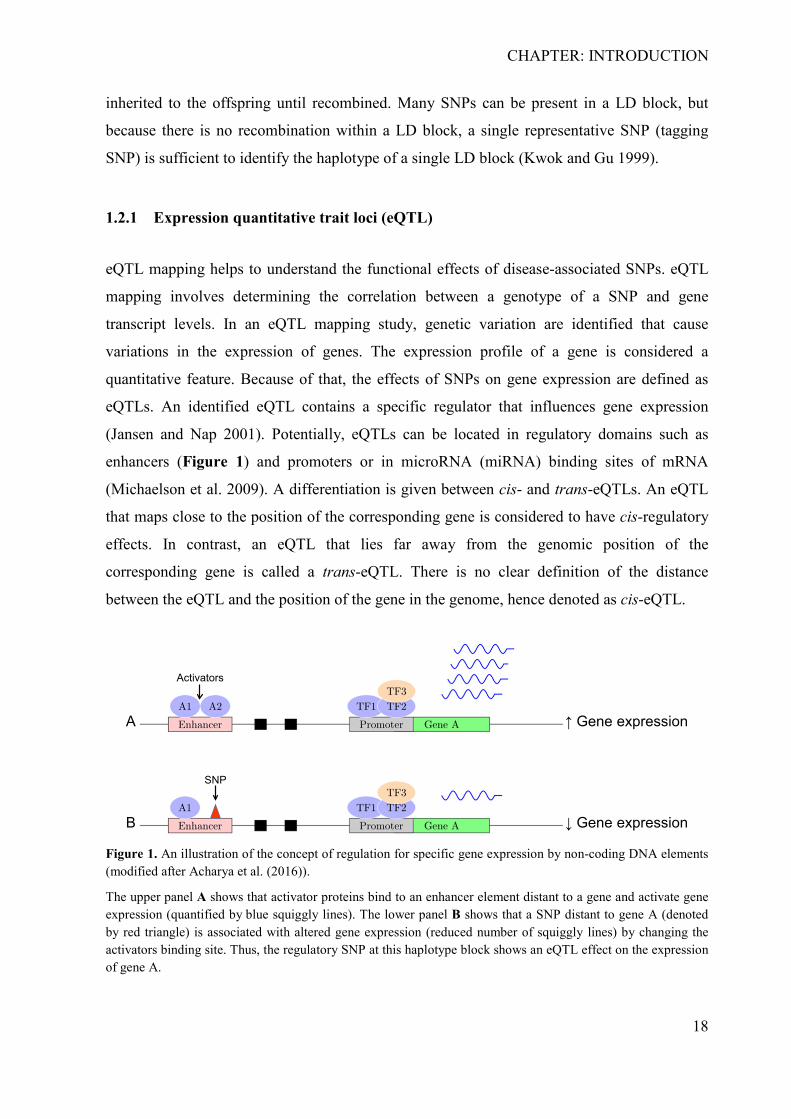
enhancers (Figure 1) and promoters or in microRNA (miRNA) binding sites of mRNA
(Michaelson et al. 2009). A differentiation is given between cis- and trans-eQTLs. An eQTL
that maps close to the position of the corresponding gene is considered to have cis-regulatory
effects. In contrast, an eQTL that lies far away from the genomic position of the
corresponding gene is called a trans-eQTL. There is no clear definition of the distance
between the eQTL and the position of the gene in the genome, hence denoted as cis-eQTL.
Figure 1. An illustration of the concept of regulation for specific gene expression by non-coding DNA elements (modified after Acharya et al. (2016)).
The upper panel A shows that activator proteins bind to an enhancer element distant to a gene and activate gene expression (quantified by blue squiggly lines). The lower panel B shows that a SNP distant to gene A (denoted by red triangle) is associated with altered gene expression (reduced number of squiggly lines) by changing the activators binding site. Thus, the regulatory SNP at this haplotype block shows an eQTL effect on the expression of gene A.
A
B
Activators
SNP
↑ Gene expression
↓ Gene expression
CHAPTER: INTRODUCTION
19
1.3 Genetic association studies
Genome-wide association studies (GWAS) successfully identified associations between
common genetic variants and human diseases (Buniello et al. 2019). In GWAS, haplotype
tagging SNPs are usually tested (Collins et al. 1997; Visscher et al. 2012). Accordingly, the
disease-associated variant that is found in a GWAS, called the GWAS lead SNP or sentinel
variant, usually is a tagging SNP in strong LD with many co-inherited variants comprising an
associated haplotype block and not the causal SNPs. Correspondingly, the GWAS says
nothing about possible causality between the tagging SNP and the disease. GWAS
associations directly point to the chromosomal region where the disease susceptibility resides.
Consequently, because the GWAS does not specify which of the linked variants at that locus
is causing the association, the identification of variants that affect causality is a main
challenge. In order to identify the causal risk variant, the associated gene region requires to be
examined in more detail (Collins et al. 1997). The analysis of the possible causal gene
variants should help to determine their contribution to the disease predisposition and to clarify
their molecular role, e.g. in regulating gene signaling pathways. However, several factors
make it difficult to leverage the GWAS-implicated disease risk loci to biological meaning.
1.3.1 Methods to identify causal variants and their target gene(s)
The vast majority of the GWAS-associated haplotypes contain non-coding variants,
suggesting that the putative causative variants may alter the regulation of gene transcription.
Although gene transcription starts at promoters, which are the sites where the transcription
machinery assembles, the core promoters typically only support low-level basal transcription.
In contrast, enhancers carry most of the regulatory information in gene expression and like
promoters they act as binding platforms for transcription factors (TFs) and co-factors, which
together activate productive transcription. Genes are often regulated in a modular fashion via
multiple enhancers or repressors that contribute individual signals additively or
synergistically. Correspondingly, the deletion or disruption of a single enhancer can cause
domain-specific loss of gene expression. Genetic variation in regulators has an important role
in disease pathogenesis. However, associated haplotypes often comprise numerous putative
regulatory elements (Figure 2).
CHAPTER: INTRODUCTION
20
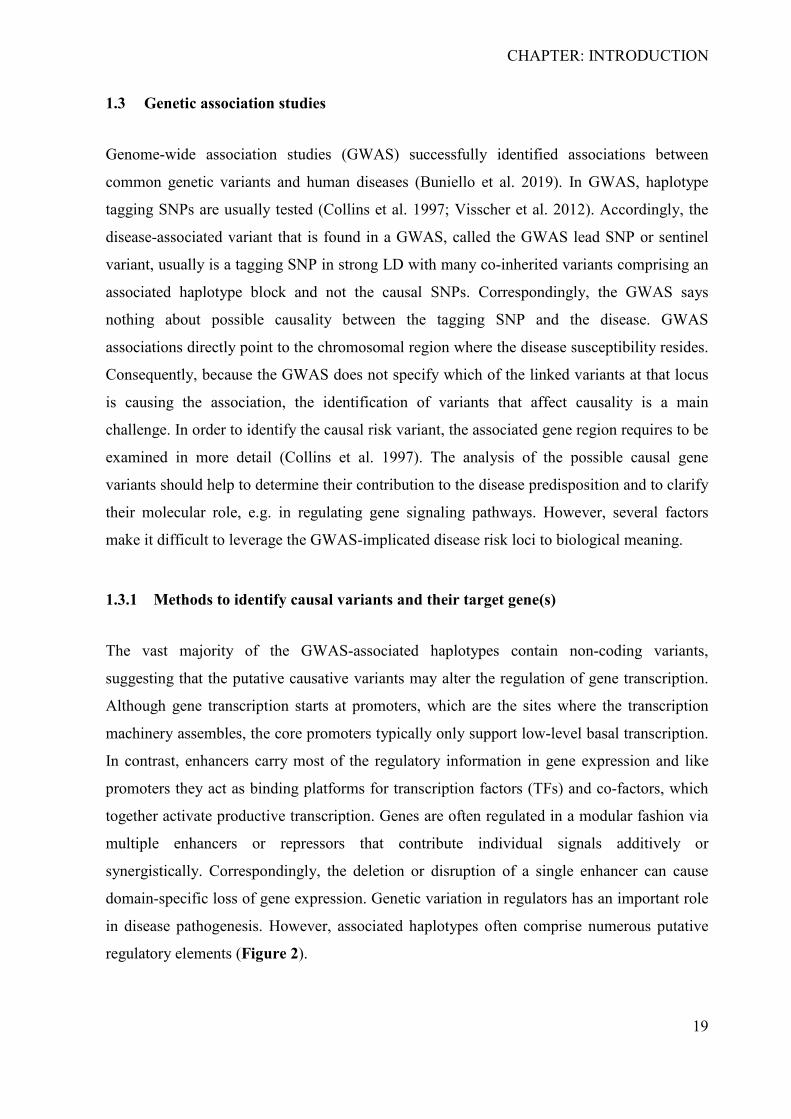
Figure 2. Disease-associated genetic variation at transcription factor binding sites can modulate gene transcription by effecting chromatin looping (modified after Acharya et al. (2016)).
The associated SNPs are located in several putative regulatory elements, but it is unknown, which SNP is causal for the association (indicated by question marks). The putative causative variant(s) may reside in an enhancer that can mediate the binding of transcription factors (TFs), which in turn results in changes in target gene expression by direct physical interaction of the enhancer-TF complex with the promoter through chromatin looping.
Thus, it is important to systematically analyze all associated SNPs to determine their potential
effects, e.g. whether they are located in regulatory elements. It has been reported that the
identified causative SNPs primarily locate within features relating to transcription factor
binding sites (TFBS), histone marks and chromatin accessibility (Kheradpour et al. 2013;
Kreimer et al. 2017; Tewhey et al. 2016). The most predictive features for effects on
expression levels are those related together to TFBS, chromatin accessibility, and H3K4Me1
and H3K27Ac histone modifications. Consequently, the integration of data generated by large
genomics projects such as the Encyclopedia of noncoding DNA elements (ENCODE) Project
(Consortium 2012) into lists of associated linked variants provides clues for causal variants
and is an efficient “filtering’’ approach to reduce the number of putative functional SNPs to
the most likely candidates to be tested in downstream experiments. However, because these
features do not provide functional or quantitative evidence of enhancer activity, downstream
experiments are necessary to validate regulator activity and strength.
REPORTER GENE ASSAY
Reporter genes directly test whether an associated variant locates in a regulatory sequence and
allow testing the impact of individual alleles on gene expression. This can demonstrate the
molecular functionality of the associated region. Reporter genes are genes or gene fragments
that allow investigating whether regulatory elements of a gene, the promoter and/or genomic
sequences exert an influence on the expression of the used reporter gene. The element of
interest is usually cloned into a plasmid upstream of the reporter gene. This active element
CHAPTER: INTRODUCTION
21
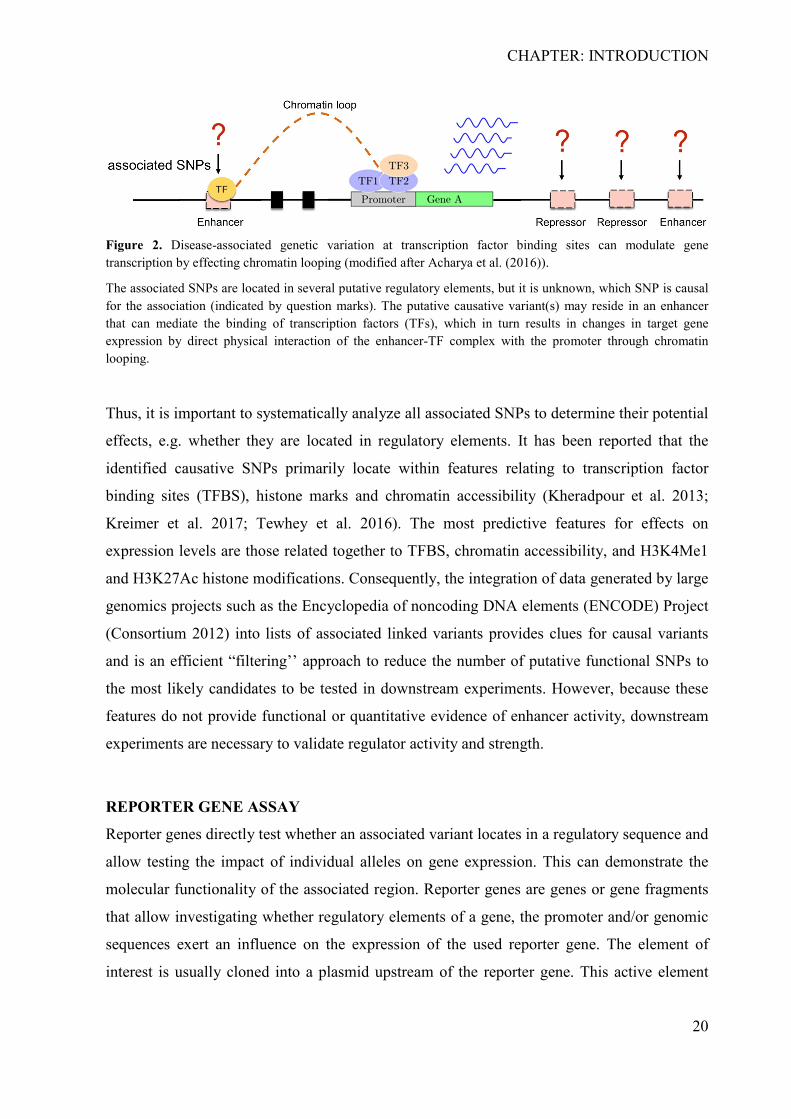
regulates the promoter of the reporter gene, thereby changing its transcription efficiency
(Figure 3).
Figure 3. Principle of a single reporter gene assay.
The regulatory DNA sequence to be studied is usually inserted into a plasmid containing a reporter gene downstream of the minimal promoter. After plasmid transfection into a recombinant cell system, the promoter is regulated by the DNA sequence and activation of the promoter results in transcription of a reporter gene.
Detection of the reporter gene expression can determine the activity and dimension of the
effect of the element under investigation. There are several reporter gene assays. The reporter
gene sequence is transcribed into pre-mRNA, processed into mature mRNA, and then
transported to the cytosol where it is translated into a protein via transfer-RNAs (tRNAs) and
the ribosomes (Gambhir et al. 1999). The translated reporter gene can be detected in different
ways. A detection method is the determination of the reporter protein by bioluminescence
emission. Luciferase is a reporter protein that converts D-luciferin with the cofactor adenosine
triphosphate into adenosine monophosphate, oxyluciferin, pyrophosphate, carbon dioxide, and
light. The more luciferin is converted, the more light is released and the higher the measured
values, so that a quantitative analysis is possible. However, a single reporter gene assay
measures the effect of a single DNA element, which is sensitive but low throughput. Because
associated LD blocks often cover thousands of bp and include numerous predicted regulatory
elements, massively parallel reporter assays (MPRAs) were recently developed to allow large-
scale testing of regulatory elements on gene expression (Tewhey et al. 2016). MPRAs aim at
directly testing all variants of one or more disease-associated haplotype blocks for putative
regulatory effects but require substantial laboratory and analytical resources that are not on
hand for many laboratories. Further major limitations are that MPRAs have low accuracy and
sensitivity. In MPRAs, thousands of DNA sequences are co-transfected into the nucleus that
can lead to disrupt the normal processes of the cell and thus the detected signals are prone to
provide false-positive results due to positional effects of the plasmids. Consequently, MPRAs
may not be applicable to detect causal alleles of weak effects (Tewhey et al. 2016). Although
the size of haplotype blocks can vary from a few kilobase (kb) to more than 100 kb (Slatkin
CHAPTER: INTRODUCTION
22
2008) with an average around 10-20 kb (Uitterlinden et al. 2005), the GWAS-nominated LD
blocks such as in Freitag-Wolf et al. (2019) are often not long. Therefore, the performance of
MPRAs would not be required to test the impact of only a few associated regulatory regions.
A specific aim of this thesis was to develop a quantitative real-time PCR (qRT-PCR) based
parallel reporter gene system that is scalable and gives a highly sensitive readout of regulator
activity for a limited set of regulators.
The target gene of an association is often unclear because the regulatory sequences may
influence the expression of either nearby (cis) or distal (trans) genes (Bryois et al. 2014).
Thus, an experimental approach is required that allows determination of the target gene(s).
The CRISPR/dCas9 activation (CRISPRa) can be utilized to validate the physical interaction
between a putative regulator and a candidate gene promoter and thus, to determine the target
gene of the association.
CLUSTERED REGULARLY INTERSPACED SHORT PALINDROMIC REPEATS
(CRISPR)
In recent years, the applications of CRISPR and their specific CRISPR-associated (Cas)
protein complex systems in editing the human genome have evolved significantly. There are
three distinct types of CRISPR/Cas systems, each with a signature protein: type I with Cas3,
type II with Cas9, and type III with Cas10. In the following, only the type II system is
described. Cas9 is alone sufficient to eliminate a genomic sequence. Its specificity is defined
by an RNA duplex of CRISPR RNA (crRNA) and tracrRNA (trans-activating CRISPR
RNA). The small non-coding crRNA has a spacer segment that is complementary to the target
sequence. Interaction of the mature crRNA with Cas9 is facilitated by tracrRNA, which acts
as a binding scaffold. The fused RNA duplex forms the single guide RNA (sgRNA), which
directs the non-specific endonuclease Cas9 to a target locus to mediate genome editing. For
its functionality, Cas9 also requires a protospacer adjacent motif (PAM) of 5′-NGG-3′ directly
flanking the target sequence, which serves as a binding signal. Thus, Cas9 is an endonuclease
programmable by sgRNA that causes double-strand breaks (DBS) at a specific target DNA
sequence. This occurs with the endonuclease domains RuvC and HNH, each of which causes
a single-strand break. Subsequently, cellular repair mechanisms are utilized to achieve
targeted changes in genomic DNA (Figure 4 A).
By mutating the nuclease domains, the Cas9 can be engineered into a DNA-binding platform
that can be utilized to control transcription in a sequence-specific manner (Figure 4 B). Point
CHAPTER: INTRODUCTION
23
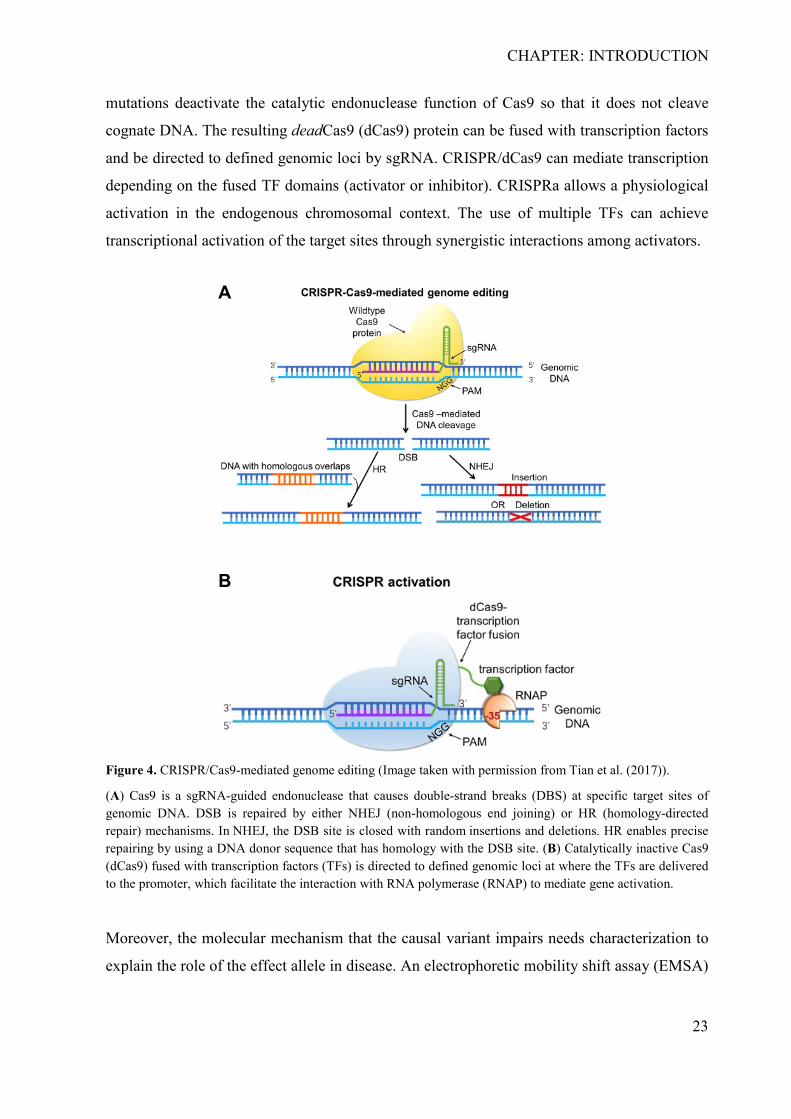
mutations deactivate the catalytic endonuclease function of Cas9 so that it does not cleave
cognate DNA. The resulting deadCas9 (dCas9) protein can be fused with transcription factors
and be directed to defined genomic loci by sgRNA. CRISPR/dCas9 can mediate transcription
depending on the fused TF domains (activator or inhibitor). CRISPRa allows a physiological
activation in the endogenous chromosomal context. The use of multiple TFs can achieve
transcriptional activation of the target sites through synergistic interactions among activators.
Figure 4. CRISPR/Cas9-mediated genome editing (Image taken with permission from Tian et al. (2017)).
(A) Cas9 is a sgRNA-guided endonuclease that causes double-strand breaks (DBS) at specific target sites of genomic DNA. DSB is repaired by either NHEJ (non-homologous end joining) or HR (homology-directed repair) mechanisms. In NHEJ, the DSB site is closed with random insertions and deletions. HR enables precise repairing by using a DNA donor sequence that has homology with the DSB site. (B) Catalytically inactive Cas9 (dCas9) fused with transcription factors (TFs) is directed to defined genomic loci at where the TFs are delivered to the promoter, which facilitate the interaction with RNA polymerase (RNAP) to mediate gene activation.
Moreover, the molecular mechanism that the causal variant impairs needs characterization to
explain the role of the effect allele in disease. An electrophoretic mobility shift assay (EMSA)
A
B
CHAPTER: INTRODUCTION
24
allows the elucidation of the binding affinities of a transcription factor in the presence of
either the effect allele or the non-effect allele.
ELECTROPHORETIC MOBILITY SHIFT ASSAY
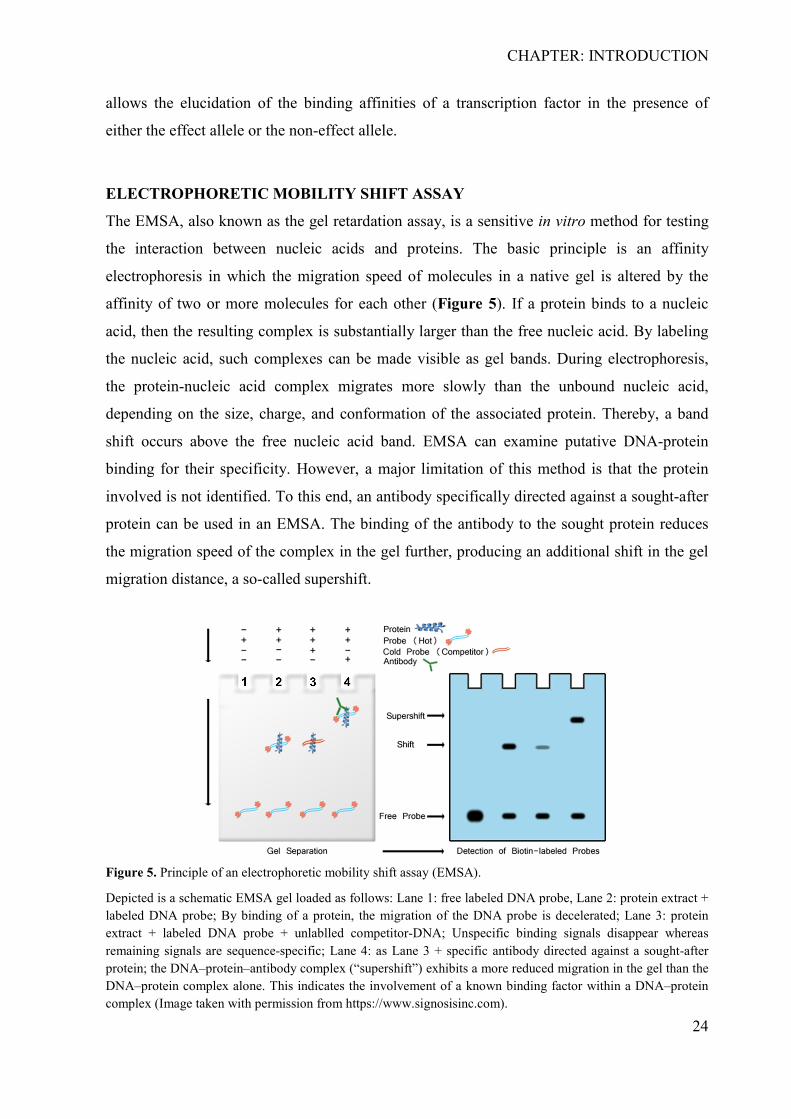
The EMSA, also known as the gel retardation assay, is a sensitive in vitro method for testing
the interaction between nucleic acids and proteins. The basic principle is an affinity
electrophoresis in which the migration speed of molecules in a native gel is altered by the
affinity of two or more molecules for each other (Figure 5). If a protein binds to a nucleic
acid, then the resulting complex is substantially larger than the free nucleic acid. By labeling
the nucleic acid, such complexes can be made visible as gel bands. During electrophoresis,
the protein-nucleic acid complex migrates more slowly than the unbound nucleic acid,
depending on the size, charge, and conformation of the associated protein. Thereby, a band
shift occurs above the free nucleic acid band. EMSA can examine putative DNA-protein
binding for their specificity. However, a major limitation of this method is that the protein
involved is not identified. To this end, an antibody specifically directed against a sought-after
protein can be used in an EMSA. The binding of the antibody to the sought protein reduces
the migration speed of the complex in the gel further, producing an additional shift in the gel
migration distance, a so-called supershift.
Figure 5. Principle of an electrophoretic mobility shift assay (EMSA).
Depicted is a schematic EMSA gel loaded as follows: Lane 1: free labeled DNA probe, Lane 2: protein extract + labeled DNA probe; By binding of a protein, the migration of the DNA probe is decelerated; Lane 3: protein extract + labeled DNA probe + unlablled competitor-DNA; Unspecific binding signals disappear whereas remaining signals are sequence-specific; Lane 4: as Lane 3 + specific antibody directed against a sought-after protein; the DNA–protein–antibody complex (“supershift”) exhibits a more reduced migration in the gel than the DNA–protein complex alone. This indicates the involvement of a known binding factor within a DNA–protein complex (Image taken with permission from https://www.signosisinc.com).
CHAPTER: INTRODUCTION
25
Answering these problems allows us to connect the disease with an impaired molecular
mechanism and points to a regulatory genetic pathway, improving our understanding of the
disease's etiology and leading to new treatment options.
1.3.2 Specific research area: ST8SIA1 is a genetic risk factor of periodontitis
Different genotypes can respond in different ways to exposure to environmental risk factors.
Smoking is a well-established environmental risk factor for various diseases that has direct
toxic effects on the metabolism of the organism. Howerver, the reaction of the body to
smoking is also partly determined by the individual genetic constitution. Correspondingly, the
inherited sensitivity to an environmental risk factor like smoking also contributes to increased
disease risk rather than an inherited susceptibility to the disease itself. Thus, understanding
genotype–smoking (G×S) interactions is a prerequisite to improve our understanding of the
disease mechanisms and for the identification of specific risk groups.
Smoking is the strongest environmental risk factor of the oral inflammatory disease
periodontitis (Eke et al. 2015; Nociti Jr et al. 2015). Freitag-Wolf et al. (2019) investigated
whether the relative risk of smokers for periodontitis grade III-IV, stage C (herein referred as
‘aggressive periodontitis, AgP’ according to the 1999 classification) is modified by genetic
variants. To this end, G×S interactions were analyzed using imputed genotype data from a
GWAS (Munz et al. 2017). A main result of this study was the identification of a haplotype
spanning the gene ST8SIA1 (8-sialyltransferase ST8 alpha-N-acetyl-neuraminide alpha-2,8-
sialyltransferase 1) that showed G×S association with P < 5×10⁻⁵ (Figure 6). For these
variants, genome-wide significant regulatory cis-effects on the expression of ST8SIA1 were
reported (P = 3.1×10⁻¹⁵; https://gtexportal.org/home) from the ENCODE Project (Consortium
2012), pointing to ST8SIA1 as the likely target gene of the association. Furthermore, it was
shown that exposure of cigarette smoke extract (CSE) to gingival fibroblasts (GFs)
significantly increased the expression of ST8SIA1 (P = 0.005; Figure 7) (Freitag-Wolf et al.
2019). ST8SIA1 is a member of the glycosyltransferase family 29 and encodes an 8-
sialyltransferase. It was reported that overexpression of ST8SIA1 inhibited TNF-alpha induced
expression of MMP9, a matrix metallopeptidase with a well-documented function in
activating the innate immune response (Opdenakker et al. 2001), epithelial wound repair
(Buisson et al. 1996), and ossification of hypertrophic chondrocytes (Vu et al. 1998). These
are considered physiological processes involved in the etiology of periodontitis.
CHAPTER: INTRODUCTION
26
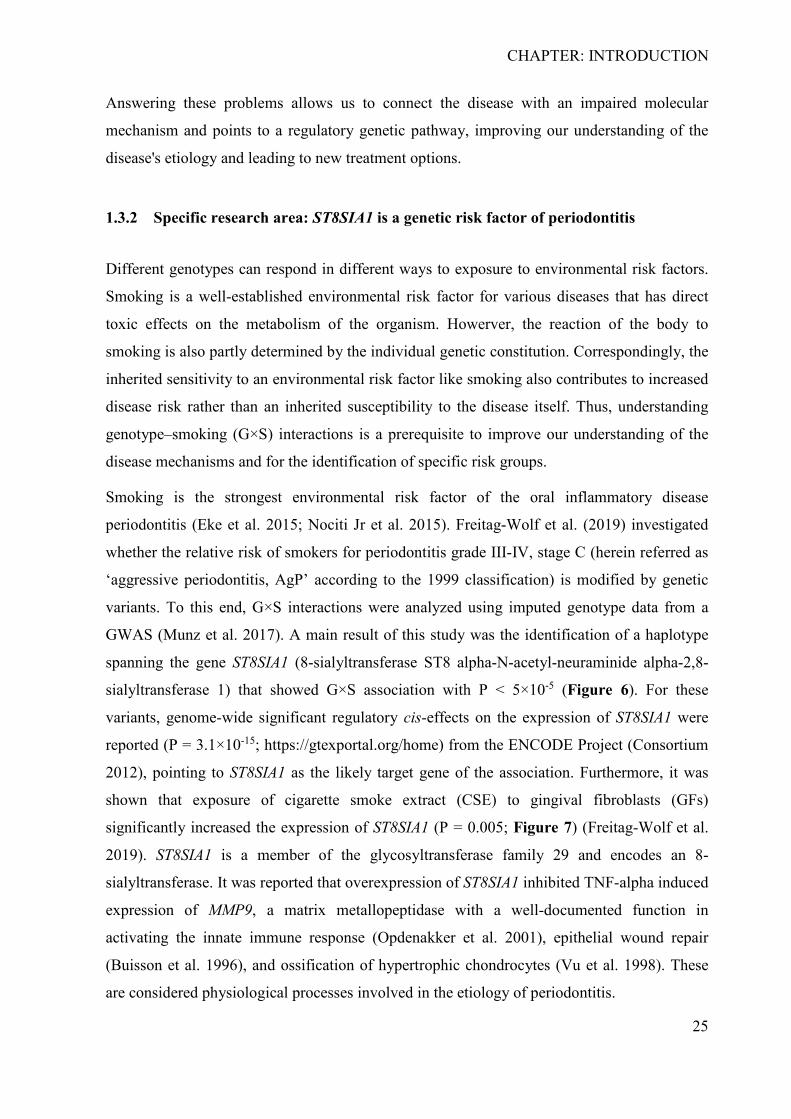
Figure 6. A haplotype block at ST8SIA1 showed significant genotype–smoking (G×S) interaction (Freitag-Wolf et al. 2019).
The association indicates that smokers who carry a haplotype at the introns 1-2 of ST8SIA1 have an increased risk of developing aggressive periodontitis (AgP) compared to non-smokers. The SNPs of the associated haplotype show genome-wide cis-eQTLs on the expression of ST8SIA1. The dots represent SNPs aligned to their chromosomal location (x-axis). The y-axis shows the -log P-value of the association. SNPs above the horizontal line are associated with the gene x smoking case-only analysis with P < 1×10⁻⁴ in a clinical analysis sample of 896 AgP cases and 7,104 control. SNPs labeled with red color are in strong LD (r2 > 0.8) (Freitag-Wolf et al. 2019). The same genetic region was reported to be associated in a G×S interaction study that searched for variants predisposing to airflow obstruction (Lutz et al. 2015).
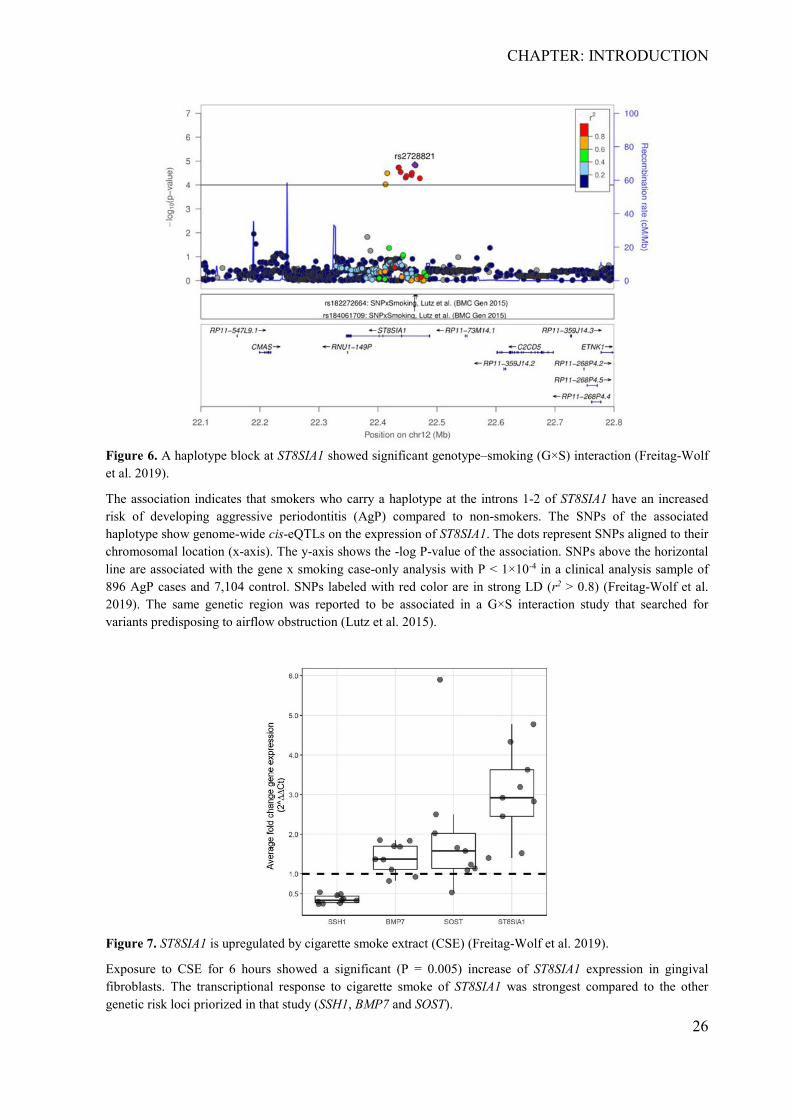
Figure 7. ST8SIA1 is upregulated by cigarette smoke extract (CSE) (Freitag-Wolf et al. 2019).
Exposure to CSE for 6 hours showed a significant (P = 0.005) increase of ST8SIA1 expression in gingival fibroblasts. The transcriptional response to cigarette smoke of ST8SIA1 was strongest compared to the other genetic risk loci priorized in that study (SSH1, BMP7 and SOST).
CHAPTER: INTRODUCTION
27
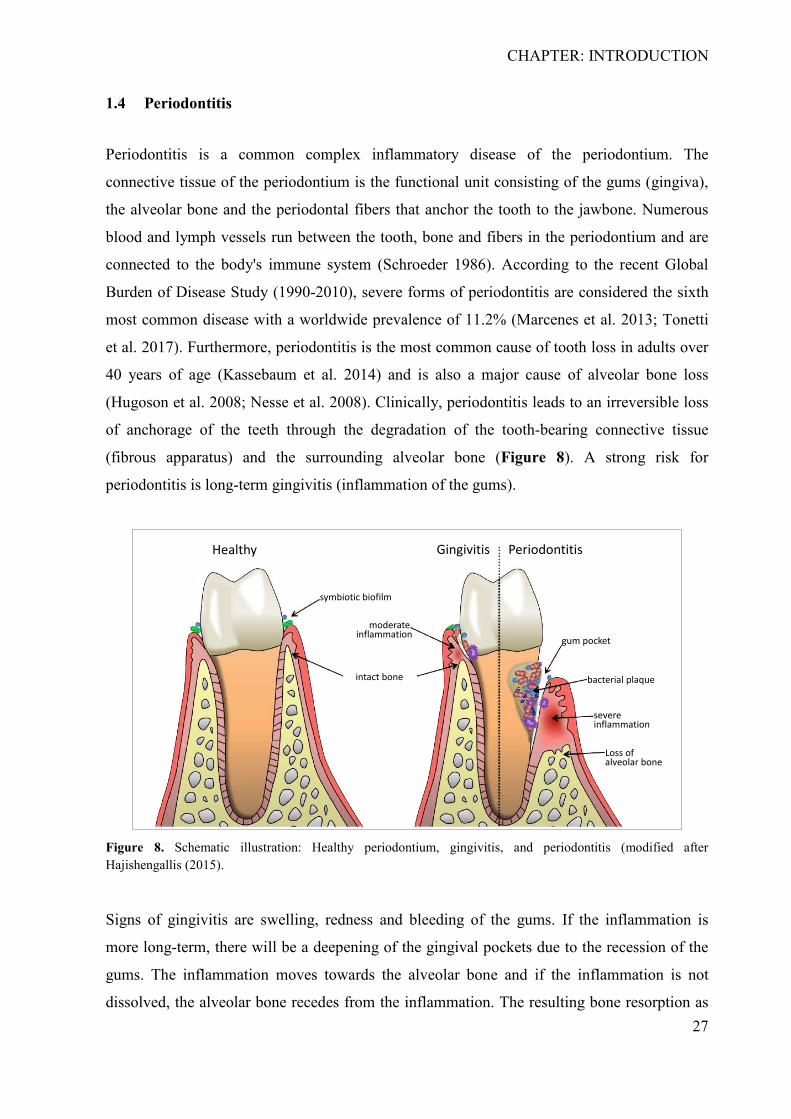
1.4 Periodontitis
Periodontitis is a common complex inflammatory disease of the periodontium. The
connective tissue of the periodontium is the functional unit consisting of the gums (gingiva),
the alveolar bone and the periodontal fibers that anchor the tooth to the jawbone. Numerous
blood and lymph vessels run between the tooth, bone and fibers in the periodontium and are
connected to the body's immune system (Schroeder 1986). According to the recent Global
Burden of Disease Study (1990-2010), severe forms of periodontitis are considered the sixth
most common disease with a worldwide prevalence of 11.2% (Marcenes et al. 2013; Tonetti
et al. 2017). Furthermore, periodontitis is the most common cause of tooth loss in adults over
40 years of age (Kassebaum et al. 2014) and is also a major cause of alveolar bone loss
(Hugoson et al. 2008; Nesse et al. 2008). Clinically, periodontitis leads to an irreversible loss
of anchorage of the teeth through the degradation of the tooth-bearing connective tissue
(fibrous apparatus) and the surrounding alveolar bone (Figure 8). A strong risk for
periodontitis is long-term gingivitis (inflammation of the gums).
Figure 8. Schematic illustration: Healthy periodontium, gingivitis, and periodontitis (modified after Hajishengallis (2015).
Signs of gingivitis are swelling, redness and bleeding of the gums. If the inflammation is
more long-term, there will be a deepening of the gingival pockets due to the recession of the
gums. The inflammation moves towards the alveolar bone and if the inflammation is not
dissolved, the alveolar bone recedes from the inflammation. The resulting bone resorption as
Healthy Gingivitis Periodontitis
symbiotic biofilm
intact bone
moderate inflammation gum pocket
Loss ofalveolar bone
severe inflammation
bacterial plaque
CHAPTER: INTRODUCTION
28
a consequence of chronic oral inflammation defines the disease periodontitis clinically. If
untreated, periodontitis leads to loosening and shifting of single or several teeths. In addition
to this local inflammatory response in the oral cavity, periodontitis is also a risk factor for
other systemic inflammatory diseases such as type 2 diabetes mellitus (Jepsen et al. 2011;
Salvi et al. 1998) rheumatoid arthritis (Maresz et al. 2013) and cardiovascular disease (e.g.
atherosclerosis or coronary heart disease) (Beck et al. 1996; Blaizot et al. 2009; Humphrey et
al. 2008; Scannapieco et al. 2003). It is assumed that these secondary diseases (comorbidity)
result from invasion of microorganisms into the blood circulation during periodontitis.
However, the causal relationships have not yet been fully understood. The etiology of
periodontitis is not fully comprehended, too. Currently, periodontitis is acknowledged as a
complex multifactorial inflammatory disease. In the development and progression of
periodontitis, the adaptive immune system competently interacts with microorganisms in the
dental biofilm. The severity and progression of periodontitis are also substantially influenced
by various environmental factors, lifestyle factors (such as smoking, oral hygiene and diet),
and general systemic diseases. Smoking is the major preventable risk factor for periodontitis
(Albandar 2002; Burt 2005; Pindborg 1947). Oxidative stress due to cigarette smoking
impairs gingival epithelial barrier function and intercellular contact recovery with the
extracellular matrix (ECM) of the connective tissue (Semlali et al. 2011a). The gingival
epithelium serves critical functions such as maintaining a physical barrier (mediated by
adherence and tight junctions) against environmental insults (e.g. pathogens, toxins). Loss of
barrier integrity leads to increased permeability of the barrier, which might facilitate the
entrance of foreign substances and microbial invasion that initiate the inflammatory response
and tissue remodeling (Semlali et al. 2011b). Susceptibility to these risk factors is defined by
the individual genetic constitution (Loos et al. 2015; Nibali et al. 2017). The involvement of
genetic factors in the etiology of periodontitis is estimated to be as high as 50% (Michalowicz
et al. 2000). In medical terms, the identification of risk genes that promote the clinical pattern
of periodontitis is therefore very relevant.
CHAPTER: INTRODUCTION
29
1.5 Aims of the thesis
The present thesis had two objectives. The first aim was to develop reporter gene plasmids
based on barcoded qRT-PCR for the simultaneous transfection and parallel quantification of
the activity of regulators to combine the throughput of MPRAs with the specificity of testing
alleles individually. The second aim was to identify the putative causal variants of the G×S
associated haplotype block at ST8SIA1 and to functionally characterize the utility of this
system. Specifically, the aims of this research project were:
1. Development of a qRT-PCR based parallel reporter gene system
2. Identification and characterization of G×S associated functional regulator(s) at ST8SIA1
3. Identification of the putative causative variant(s) of the GWAS-nominated haplotype block
4. Validation of ST8SIA1 as the target gene of the association
5. Identification and characterization of the genes and gene networks that respond to increased
expression of ST8SIA1
CHAPTER: MATERIALS
30
2 CHAPTER: MATERIALS
All utilized materials in this thesis are catalogued in tables 1-6 and the availed
oligonucleotides are listed in tables 7-10, which were synthesized at the metabion
international AG, Germany.
2.1 Chemicals and solutions
Table 1: Chemicals and solutions. Chemicals and solutions Manufacturer 10,000 I.U./mL Penicillin/ 10,000 (μg/mL) Streptomycin (P/S)
Biochrom
3 M, pH 5.2 Sodium acetate Sigma Aldrich Acrylamide mixture (30 %) SERVA Electrophoresis Agar AppliChem Agarose SERVA Electrophoresis Ammonium Persulfate (APS) Amresco Bacto Tryptone BD Bacto Bacto Yeast extract BD Bacto Bovine serum albumin (BSA) SERVA Electrophoresis Calcium chloride (CaCl2) Merck Carbenicillin Carl Roth Chloroform:Isoamylalkohol, 24:1 Sigma-Aldrich Deoxynucleotide (dNTP) Set (100 mM) Thermo Fisher Scientific Diethyl pyrocarbonate (DEPC)-treated water Ambion Dimethyl sulfoxide (DMSO), 100% Thermo Fisher Scientific Ethanol (70%, dehydrated) Carl Roth Ethanol (99.9 %) Merck Ethidium bromide (EtBr) Carl Roth Ethylenediaminetetraacetic acid (EDTA) Sigma-Aldrich Fetal Bovine Serum (FBS) Gibco by life technologies GeneRuler 1 kb DNA Ladder Thermo Fisher Scientific Gentamycin (10 mg/mL) Biochrom Isopropanol Sigma Aldrich jetPEI Polyplus-transfection L-Glutamine (200 mM) Biochrom Lipofectamine 2000 Thermo Fisher Scientific NaCl solution (150 mM) for jetPEI Polyplus-transfection non-essential amino acids (NEAA) (100x) PAN-Biotech O’Range Ruler 50 bp Ladder Thermo Fisher Scientific Petroleum jelly Peter Ernst Sodium acetate Carl Roth
CHAPTER: MATERIALS
31
Table 1 continued. Sodium chloride (NaCl) Carl Roth Tetramethylethylenediamine (TEMED) Sigma-Aldrich Tris(hydroxymethyl)aminomethane (Tris) Sigma-Aldrich Tris(hydroxymethyl)aminomethane Hydrochloride (Tris-HCl)
Sigma-Aldrich
Trypan blue Biochrom Ultrapure water Biochrom β-Mercaptoethanol Carl Roth
2.2 Devices and consumables
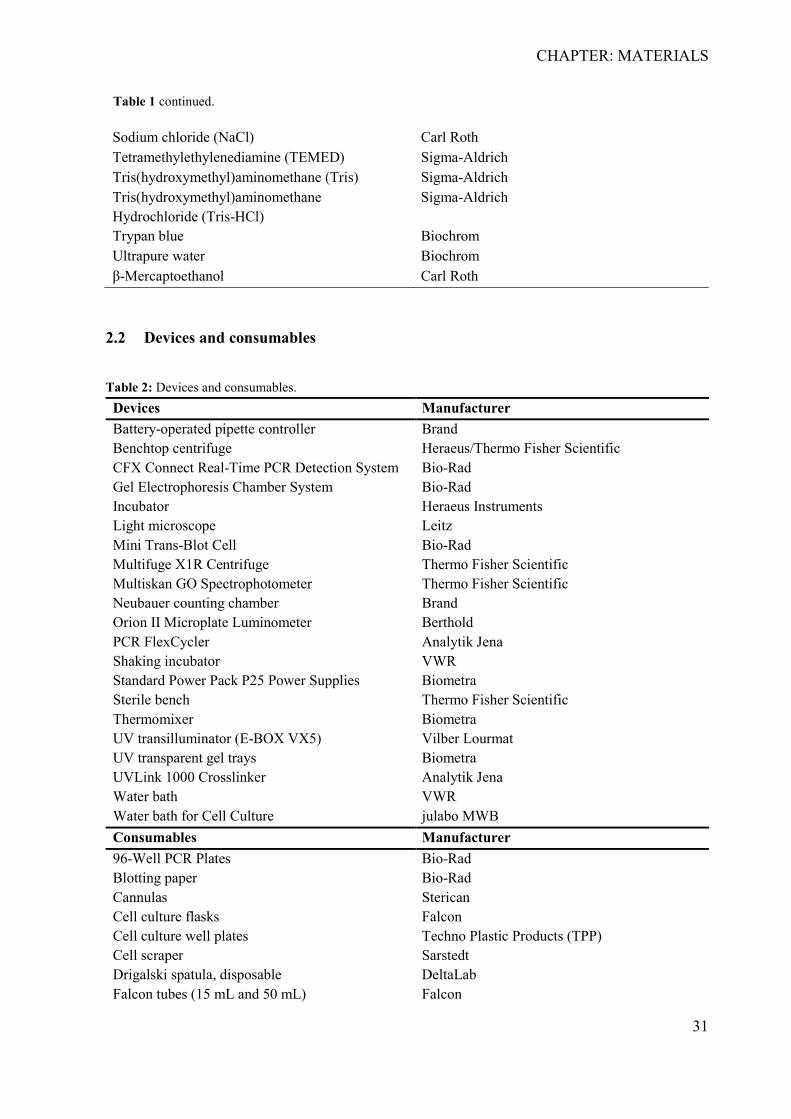
Table 2: Devices and consumables. Devices Manufacturer Battery-operated pipette controller Brand Benchtop centrifuge Heraeus/Thermo Fisher Scientific CFX Connect Real-Time PCR Detection System Bio-Rad Gel Electrophoresis Chamber System Bio-Rad Incubator Heraeus Instruments Light microscope Leitz Mini Trans-Blot Cell Bio-Rad Multifuge X1R Centrifuge Thermo Fisher Scientific Multiskan GO Spectrophotometer Thermo Fisher Scientific Neubauer counting chamber Brand Orion II Microplate Luminometer Berthold PCR FlexCycler Analytik Jena Shaking incubator VWR Standard Power Pack P25 Power Supplies Biometra Sterile bench Thermo Fisher Scientific Thermomixer Biometra UV transilluminator (E-BOX VX5) Vilber Lourmat UV transparent gel trays Biometra UVLink 1000 Crosslinker Analytik Jena Water bath VWR Water bath for Cell Culture julabo MWB Consumables Manufacturer 96-Well PCR Plates Bio-Rad Blotting paper Bio-Rad Cannulas Sterican Cell culture flasks Falcon Cell culture well plates Techno Plastic Products (TPP) Cell scraper Sarstedt Drigalski spatula, disposable DeltaLab Falcon tubes (15 mL and 50 mL) Falcon
CHAPTER: MATERIALS
32
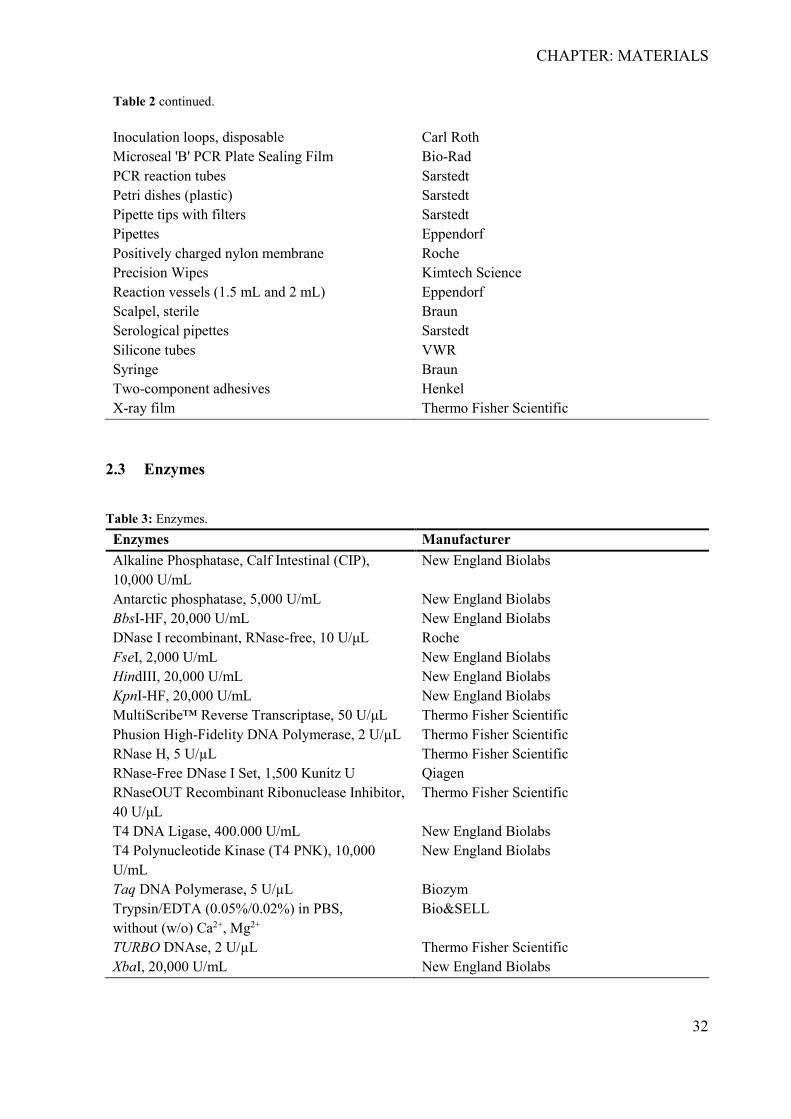
Table 2 continued. Inoculation loops, disposable Carl Roth Microseal 'B' PCR Plate Sealing Film Bio-Rad PCR reaction tubes Sarstedt Petri dishes (plastic) Sarstedt Pipette tips with filters Sarstedt Pipettes Eppendorf Positively charged nylon membrane Roche Precision Wipes Kimtech Science Reaction vessels (1.5 mL and 2 mL) Eppendorf Scalpel, sterile Braun Serological pipettes Sarstedt Silicone tubes VWR Syringe Braun Two-component adhesives Henkel X-ray film Thermo Fisher Scientific
2.3 Enzymes
Table 3: Enzymes. Enzymes Manufacturer Alkaline Phosphatase, Calf Intestinal (CIP), 10,000 U/mL
New England Biolabs
Antarctic phosphatase, 5,000 U/mL New England Biolabs BbsI-HF, 20,000 U/mL New England Biolabs DNase I recombinant, RNase-free, 10 U/μL Roche FseI, 2,000 U/mL New England Biolabs HindIII, 20,000 U/mL New England Biolabs KpnI-HF, 20,000 U/mL New England Biolabs MultiScribe™ Reverse Transcriptase, 50 U/μL Thermo Fisher Scientific Phusion High-Fidelity DNA Polymerase, 2 U/µL Thermo Fisher Scientific RNase H, 5 U/µL Thermo Fisher Scientific RNase-Free DNase I Set, 1,500 Kunitz U Qiagen RNaseOUT Recombinant Ribonuclease Inhibitor, 40 U/μL
Thermo Fisher Scientific
T4 DNA Ligase, 400.000 U/mL New England Biolabs T4 Polynucleotide Kinase (T4 PNK), 10,000 U/mL
New England Biolabs
Taq DNA Polymerase, 5 U/µL Biozym Trypsin/EDTA (0.05%/0.02%) in PBS, without (w/o) Ca2+, Mg2+
Bio&SELL
TURBO DNAse, 2 U/µL Thermo Fisher Scientific XbaI, 20,000 U/mL New England Biolabs
CHAPTER: MATERIALS
33
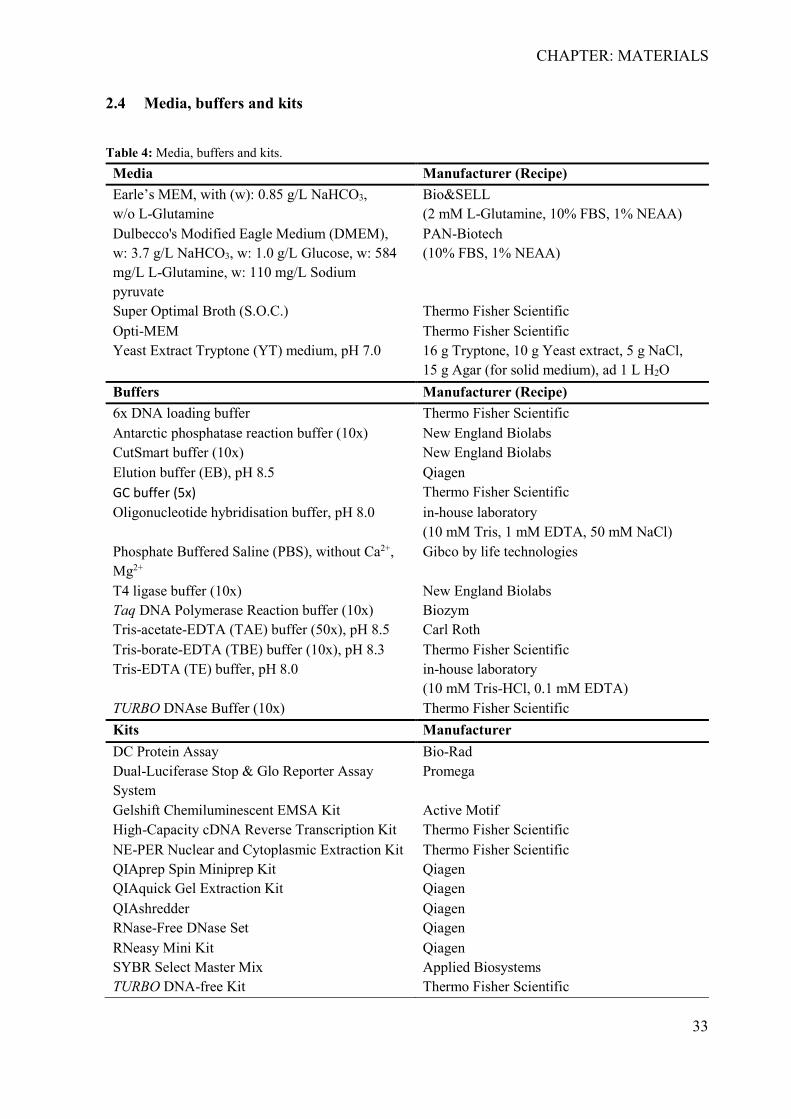
2.4 Media, buffers and kits
Table 4: Media, buffers and kits. Media Manufacturer (Recipe) Earle’s MEM, with (w): 0.85 g/L NaHCO3, w/o L-Glutamine
Bio&SELL (2 mM L-Glutamine, 10% FBS, 1% NEAA)
Dulbecco's Modified Eagle Medium (DMEM), w: 3.7 g/L NaHCO3, w: 1.0 g/L Glucose, w: 584 mg/L L-Glutamine, w: 110 mg/L Sodium pyruvate
PAN-Biotech (10% FBS, 1% NEAA)
Super Optimal Broth (S.O.C.) Thermo Fisher Scientific Opti-MEM Thermo Fisher Scientific Yeast Extract Tryptone (YT) medium, pH 7.0 16 g Tryptone, 10 g Yeast extract, 5 g NaCl,
15 g Agar (for solid medium), ad 1 L H2O Buffers Manufacturer (Recipe) 6x DNA loading buffer Thermo Fisher Scientific Antarctic phosphatase reaction buffer (10x) New England Biolabs CutSmart buffer (10x) New England Biolabs Elution buffer (EB), pH 8.5 Qiagen GC buffer (5x) Thermo Fisher Scientific Oligonucleotide hybridisation buffer, pH 8.0 in-house laboratory
(10 mM Tris, 1 mM EDTA, 50 mM NaCl) Phosphate Buffered Saline (PBS), without Ca2+, Mg2+
Gibco by life technologies
T4 ligase buffer (10x) New England Biolabs Taq DNA Polymerase Reaction buffer (10x) Biozym Tris-acetate-EDTA (TAE) buffer (50x), pH 8.5 Carl Roth Tris-borate-EDTA (TBE) buffer (10x), pH 8.3 Thermo Fisher Scientific Tris-EDTA (TE) buffer, pH 8.0 in-house laboratory
(10 mM Tris-HCl, 0.1 mM EDTA) TURBO DNAse Buffer (10x) Thermo Fisher Scientific Kits Manufacturer DC Protein Assay Bio-Rad Dual-Luciferase Stop & Glo Reporter Assay System
Promega
Gelshift Chemiluminescent EMSA Kit Active Motif High-Capacity cDNA Reverse Transcription Kit Thermo Fisher Scientific NE-PER Nuclear and Cytoplasmic Extraction Kit Thermo Fisher Scientific QIAprep Spin Miniprep Kit Qiagen QIAquick Gel Extraction Kit Qiagen QIAshredder Qiagen RNase-Free DNase Set Qiagen RNeasy Mini Kit Qiagen SYBR Select Master Mix Applied Biosystems TURBO DNA-free Kit Thermo Fisher Scientific
CHAPTER: MATERIALS
34
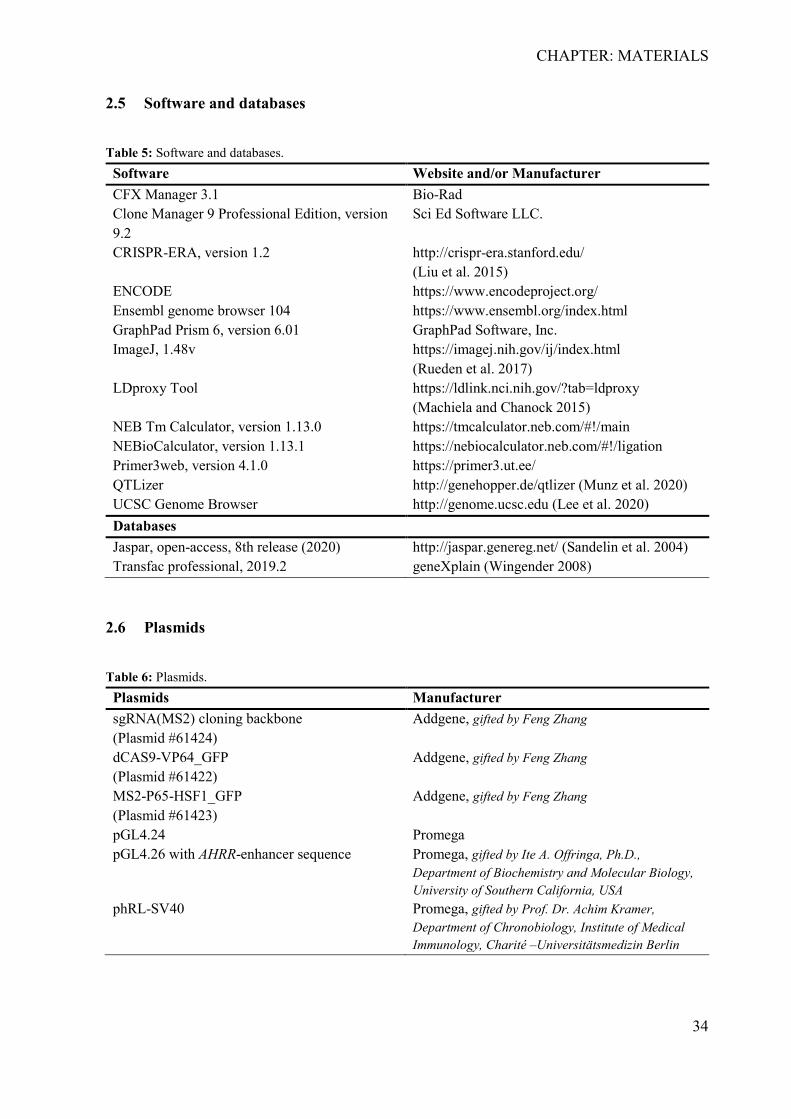
2.5 Software and databases
Table 5: Software and databases. Software Website and/or Manufacturer CFX Manager 3.1 Bio-Rad Clone Manager 9 Professional Edition, version 9.2
Sci Ed Software LLC.
CRISPR-ERA, version 1.2 http://crispr-era.stanford.edu/ (Liu et al. 2015)
ENCODE https://www.encodeproject.org/ Ensembl genome browser 104 https://www.ensembl.org/index.html GraphPad Prism 6, version 6.01 GraphPad Software, Inc. ImageJ, 1.48v https://imagej.nih.gov/ij/index.html
(Rueden et al. 2017) LDproxy Tool https://ldlink.nci.nih.gov/?tab=ldproxy
(Machiela and Chanock 2015) NEB Tm Calculator, version 1.13.0 https://tmcalculator.neb.com/#!/main NEBioCalculator, version 1.13.1 https://nebiocalculator.neb.com/#!/ligation Primer3web, version 4.1.0 https://primer3.ut.ee/ QTLizer http://genehopper.de/qtlizer (Munz et al. 2020) UCSC Genome Browser http://genome.ucsc.edu (Lee et al. 2020) Databases Jaspar, open-access, 8th release (2020) http://jaspar.genereg.net/ (Sandelin et al. 2004) Transfac professional, 2019.2 geneXplain (Wingender 2008)
2.6 Plasmids
Table 6: Plasmids. Plasmids Manufacturer sgRNA(MS2) cloning backbone (Plasmid #61424)
Addgene, gifted by Feng Zhang
dCAS9-VP64_GFP (Plasmid #61422)
Addgene, gifted by Feng Zhang
MS2-P65-HSF1_GFP (Plasmid #61423)
Addgene, gifted by Feng Zhang
pGL4.24 Promega pGL4.26 with AHRR-enhancer sequence Promega, gifted by Ite A. Offringa, Ph.D.,
Department of Biochemistry and Molecular Biology, University of Southern California, USA
phRL-SV40 Promega, gifted by Prof. Dr. Achim Kramer, Department of Chronobiology, Institute of Medical Immunology, Charité –Universitätsmedizin Berlin
CHAPTER: MATERIALS
35
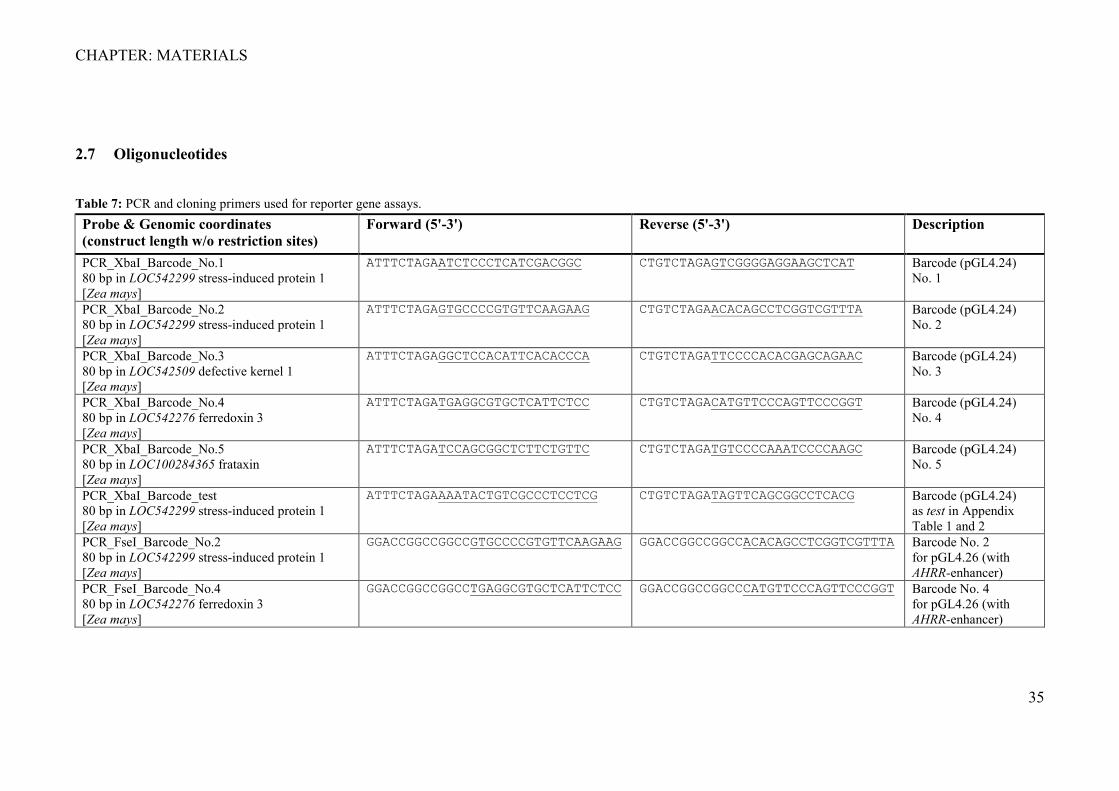
2.7 Oligonucleotides
Table 7: PCR and cloning primers used for reporter gene assays. Probe & Genomic coordinates (construct length w/o restriction sites)
Forward (5'-3') Reverse (5'-3') Description
PCR_XbaI_Barcode_No.1 80 bp in LOC542299 stress-induced protein 1 [Zea mays]
ATTTCTAGAATCTCCCTCATCGACGGC CTGTCTAGAGTCGGGGAGGAAGCTCAT Barcode (pGL4.24) No. 1
PCR_XbaI_Barcode_No.2 80 bp in LOC542299 stress-induced protein 1 [Zea mays]
ATTTCTAGAGTGCCCCGTGTTCAAGAAG CTGTCTAGAACACAGCCTCGGTCGTTTA
Barcode (pGL4.24) No. 2
PCR_XbaI_Barcode_No.3 80 bp in LOC542509 defective kernel 1 [Zea mays]
ATTTCTAGAGGCTCCACATTCACACCCA CTGTCTAGATTCCCCACACGAGCAGAAC Barcode (pGL4.24) No. 3
PCR_XbaI_Barcode_No.4 80 bp in LOC542276 ferredoxin 3 [Zea mays]
ATTTCTAGATGAGGCGTGCTCATTCTCC CTGTCTAGACATGTTCCCAGTTCCCGGT Barcode (pGL4.24) No. 4
PCR_XbaI_Barcode_No.5 80 bp in LOC100284365 frataxin [Zea mays]
ATTTCTAGATCCAGCGGCTCTTCTGTTC CTGTCTAGATGTCCCCAAATCCCCAAGC Barcode (pGL4.24) No. 5
PCR_XbaI_Barcode_test 80 bp in LOC542299 stress-induced protein 1 [Zea mays]
ATTTCTAGAAAATACTGTCGCCCTCCTCG CTGTCTAGATAGTTCAGCGGCCTCACG Barcode (pGL4.24) as test in Appendix Table 1 and 2
PCR_FseI_Barcode_No.2 80 bp in LOC542299 stress-induced protein 1 [Zea mays]
GGACCGGCCGGCCGTGCCCCGTGTTCAAGAAG GGACCGGCCGGCCACACAGCCTCGGTCGTTTA Barcode No. 2 for pGL4.26 (with AHRR-enhancer)
PCR_FseI_Barcode_No.4 80 bp in LOC542276 ferredoxin 3 [Zea mays]
GGACCGGCCGGCCTGAGGCGTGCTCATTCTCC GGACCGGCCGGCCCATGTTCCCAGTTCCCGGT Barcode No. 4 for pGL4.26 (with AHRR-enhancer)
CHAPTER: MATERIALS
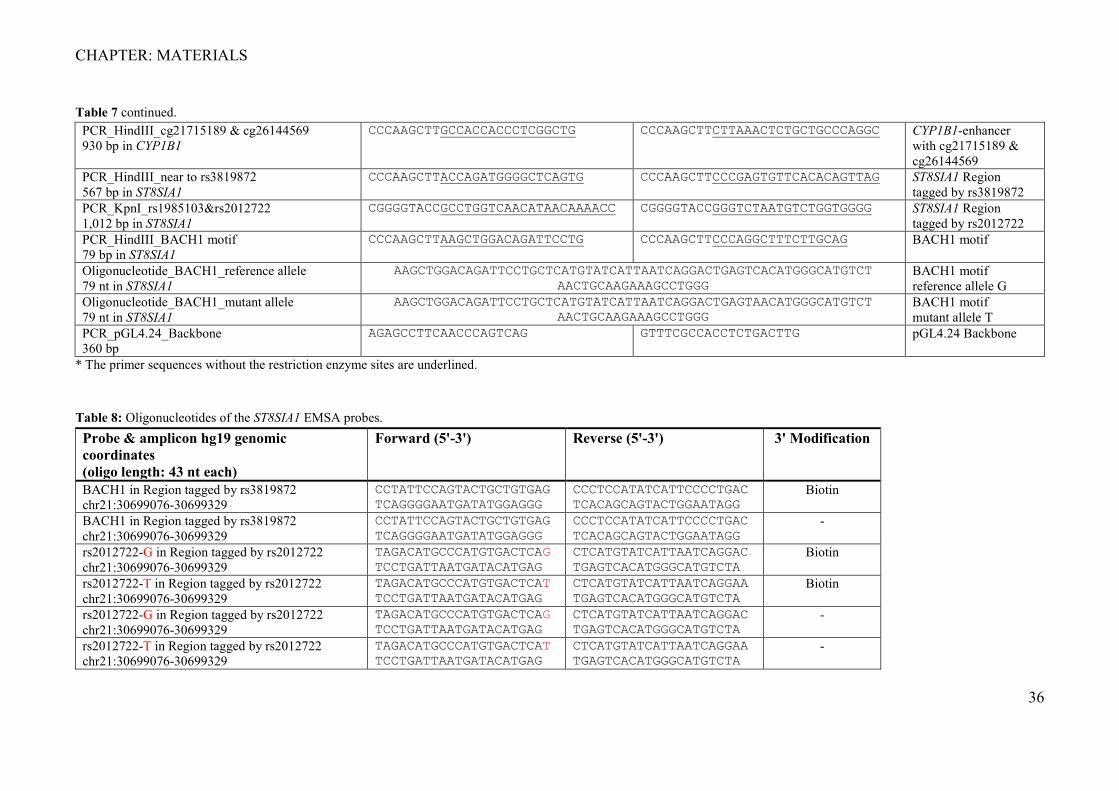
36
Table 7 continued. PCR_HindIII_cg21715189 & cg26144569 930 bp in CYP1B1
CCCAAGCTTGCCACCACCCTCGGCTG CCCAAGCTTCTTAAACTCTGCTGCCCAGGC CYP1B1-enhancer with cg21715189 & cg26144569
PCR_HindIII_near to rs3819872 567 bp in ST8SIA1
CCCAAGCTTACCAGATGGGGCTCAGTG CCCAAGCTTCCCGAGTGTTCACACAGTTAG ST8SIA1 Region tagged by rs3819872
PCR_KpnI_rs1985103&rs2012722 1,012 bp in ST8SIA1
CGGGGTACCGCCTGGTCAACATAACAAAACC CGGGGTACCGGGTCTAATGTCTGGTGGGG ST8SIA1 Region tagged by rs2012722
PCR_HindIII_BACH1 motif 79 bp in ST8SIA1
CCCAAGCTTAAGCTGGACAGATTCCTG CCCAAGCTTCCCAGGCTTTCTTGCAG BACH1 motif
Oligonucleotide_BACH1_reference allele 79 nt in ST8SIA1
AAGCTGGACAGATTCCTGCTCATGTATCATTAATCAGGACTGAGTCACATGGGCATGTCT AACTGCAAGAAAGCCTGGG
BACH1 motif reference allele G
Oligonucleotide_BACH1_mutant allele 79 nt in ST8SIA1
AAGCTGGACAGATTCCTGCTCATGTATCATTAATCAGGACTGAGTAACATGGGCATGTCT AACTGCAAGAAAGCCTGGG
BACH1 motif mutant allele T
PCR_pGL4.24_Backbone 360 bp
AGAGCCTTCAACCCAGTCAG GTTTCGCCACCTCTGACTTG pGL4.24 Backbone
* The primer sequences without the restriction enzyme sites are underlined.
Table 8: Oligonucleotides of the ST8SIA1 EMSA probes. Probe & amplicon hg19 genomic coordinates (oligo length: 43 nt each)
Forward (5'-3') Reverse (5'-3') 3' Modification
BACH1 in Region tagged by rs3819872 chr21:30699076-30699329
CCTATTCCAGTACTGCTGTGAG TCAGGGGAATGATATGGAGGG
CCCTCCATATCATTCCCCTGAC TCACAGCAGTACTGGAATAGG
Biotin
BACH1 in Region tagged by rs3819872 chr21:30699076-30699329
CCTATTCCAGTACTGCTGTGAG TCAGGGGAATGATATGGAGGG
CCCTCCATATCATTCCCCTGAC TCACAGCAGTACTGGAATAGG
-
rs2012722-G in Region tagged by rs2012722 chr21:30699076-30699329
TAGACATGCCCATGTGACTCAG TCCTGATTAATGATACATGAG
CTCATGTATCATTAATCAGGAC TGAGTCACATGGGCATGTCTA
Biotin
rs2012722-T in Region tagged by rs2012722 chr21:30699076-30699329
TAGACATGCCCATGTGACTCAT TCCTGATTAATGATACATGAG
CTCATGTATCATTAATCAGGAA TGAGTCACATGGGCATGTCTA
Biotin
rs2012722-G in Region tagged by rs2012722 chr21:30699076-30699329
TAGACATGCCCATGTGACTCAG TCCTGATTAATGATACATGAG
CTCATGTATCATTAATCAGGAC TGAGTCACATGGGCATGTCTA
-
rs2012722-T in Region tagged by rs2012722 chr21:30699076-30699329
TAGACATGCCCATGTGACTCAT TCCTGATTAATGATACATGAG
CTCATGTATCATTAATCAGGAA TGAGTCACATGGGCATGTCTA
-
CHAPTER: MATERIALS
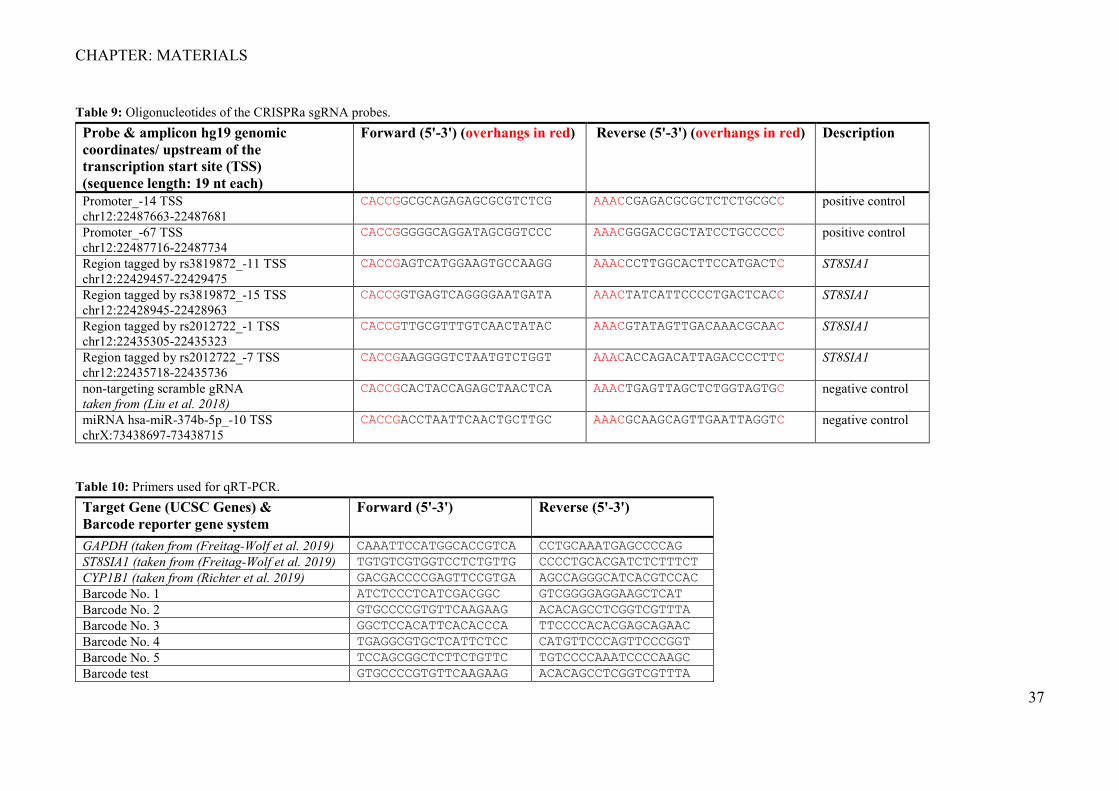
37
Table 9: Oligonucleotides of the CRISPRa sgRNA probes. Probe & amplicon hg19 genomic coordinates/ upstream of the transcription start site (TSS) (sequence length: 19 nt each)
Forward (5'-3') (overhangs in red) Reverse (5'-3') (overhangs in red) Description
Promoter_-14 TSS chr12:22487663-22487681
CACCGGCGCAGAGAGCGCGTCTCG AAACCGAGACGCGCTCTCTGCGCC positive control
Promoter_-67 TSS chr12:22487716-22487734
CACCGGGGGCAGGATAGCGGTCCC AAACGGGACCGCTATCCTGCCCCC positive control
Region tagged by rs3819872_-11 TSS chr12:22429457-22429475
CACCGAGTCATGGAAGTGCCAAGG AAACCCTTGGCACTTCCATGACTC ST8SIA1
Region tagged by rs3819872_-15 TSS chr12:22428945-22428963
CACCGGTGAGTCAGGGGAATGATA AAACTATCATTCCCCTGACTCACC ST8SIA1
Region tagged by rs2012722_-1 TSS chr12:22435305-22435323
CACCGTTGCGTTTGTCAACTATAC AAACGTATAGTTGACAAACGCAAC ST8SIA1
Region tagged by rs2012722_-7 TSS chr12:22435718-22435736
CACCGAAGGGGTCTAATGTCTGGT AAACACCAGACATTAGACCCCTTC ST8SIA1
non-targeting scramble gRNA taken from (Liu et al. 2018)
CACCGCACTACCAGAGCTAACTCA AAACTGAGTTAGCTCTGGTAGTGC negative control
miRNA hsa-miR-374b-5p_-10 TSS chrX:73438697-73438715
CACCGACCTAATTCAACTGCTTGC AAACGCAAGCAGTTGAATTAGGTC negative control
Table 10: Primers used for qRT-PCR. Target Gene (UCSC Genes) & Barcode reporter gene system
Forward (5'-3') Reverse (5'-3')
GAPDH (taken from (Freitag-Wolf et al. 2019) CAAATTCCATGGCACCGTCA CCTGCAAATGAGCCCCAG ST8SIA1 (taken from (Freitag-Wolf et al. 2019) TGTGTCGTGGTCCTCTGTTG CCCCTGCACGATCTCTTTCT CYP1B1 (taken from (Richter et al. 2019) GACGACCCCGAGTTCCGTGA AGCCAGGGCATCACGTCCAC Barcode No. 1 ATCTCCCTCATCGACGGC GTCGGGGAGGAAGCTCAT Barcode No. 2 GTGCCCCGTGTTCAAGAAG ACACAGCCTCGGTCGTTTA Barcode No. 3 GGCTCCACATTCACACCCA TTCCCCACACGAGCAGAAC Barcode No. 4 TGAGGCGTGCTCATTCTCC CATGTTCCCAGTTCCCGGT Barcode No. 5 TCCAGCGGCTCTTCTGTTC TGTCCCCAAATCCCCAAGC Barcode test GTGCCCCGTGTTCAAGAAG ACACAGCCTCGGTCGTTTA
CHAPTER: METHODS
38
3 CHAPTER: METHODS
3.1 Development of the barcoded reporter gene system
Summary:
A qRT-PCR based barcoded reporter gene system that allows parallel screening of multiple
regulatory sequences in a single experiment was developed and established.
• Short unique identification sequences (barcodes) were availed as reporter genes. These
barcode sequences were originated from the plant Zea mays and do not occur in the
human genome. The combination of several specific barcodes should enable the
simultaneous analysis of different reporter gene plasmids with or without regulatory
sequences.
• For sensitivity and robust analysis, four barcoded reporter gene plasmids were
combined. Two barcoded plasmids were inserted with regulatory sequences. Two
barcoded plasmids were not modified and served as internal reference controls to
normalize for basal expression of the reporter gene and to control for variation in
transfection efficiency and cell death. Altogether, the plasmids contained the same
plasmid backbone but differed in the barcode sequence.
• Following transfection of equimolar pools of the barcoded reporter gene plasmids as
an input library, Deoxyribonuclease I (DNAse I) treatment and reverse transcription,
the barcode sequences served as templates of qRT-PCR primers of comparable
efficiency and allowed parallel detection of individual reporter genes in a single
experiment (Figure 9).
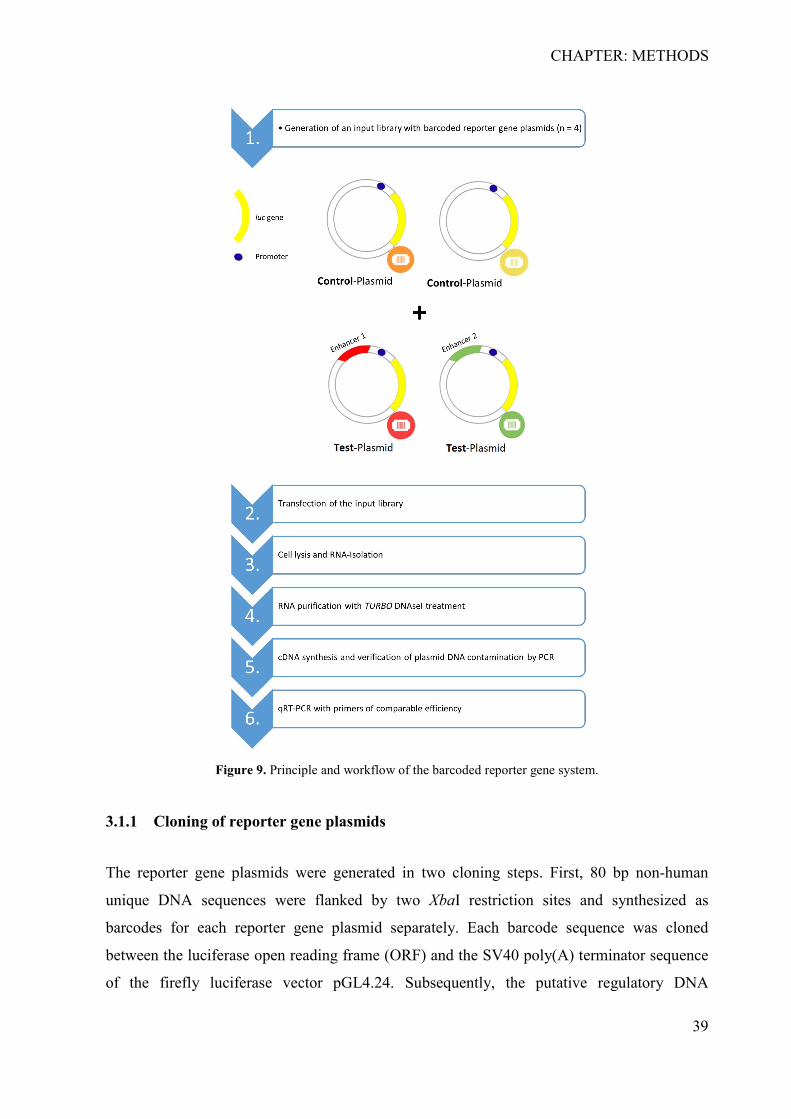
CHAPTER: METHODS
39
Figure 9. Principle and workflow of the barcoded reporter gene system.
3.1.1 Cloning of reporter gene plasmids
The reporter gene plasmids were generated in two cloning steps. First, 80 bp non-human
unique DNA sequences were flanked by two XbaI restriction sites and synthesized as
barcodes for each reporter gene plasmid separately. Each barcode sequence was cloned
between the luciferase open reading frame (ORF) and the SV40 poly(A) terminator sequence
of the firefly luciferase vector pGL4.24. Subsequently, the putative regulatory DNA
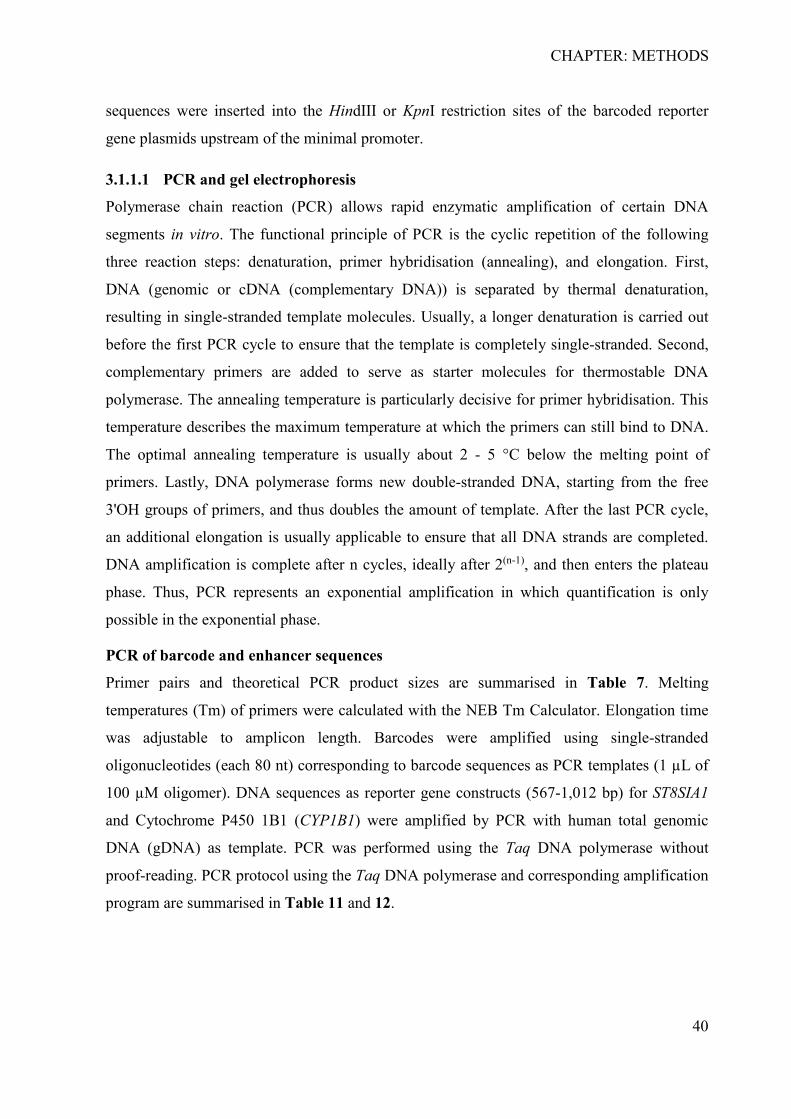
CHAPTER: METHODS
40
sequences were inserted into the HindIII or KpnI restriction sites of the barcoded reporter
gene plasmids upstream of the minimal promoter.
3.1.1.1 PCR and gel electrophoresis
Polymerase chain reaction (PCR) allows rapid enzymatic amplification of certain DNA
segments in vitro. The functional principle of PCR is the cyclic repetition of the following
three reaction steps: denaturation, primer hybridisation (annealing), and elongation. First,
DNA (genomic or cDNA (complementary DNA)) is separated by thermal denaturation,
resulting in single-stranded template molecules. Usually, a longer denaturation is carried out
before the first PCR cycle to ensure that the template is completely single-stranded. Second,
complementary primers are added to serve as starter molecules for thermostable DNA
polymerase. The annealing temperature is particularly decisive for primer hybridisation. This
temperature describes the maximum temperature at which the primers can still bind to DNA.
The optimal annealing temperature is usually about 2 - 5 °C below the melting point of
primers. Lastly, DNA polymerase forms new double-stranded DNA, starting from the free
3'OH groups of primers, and thus doubles the amount of template. After the last PCR cycle,
an additional elongation is usually applicable to ensure that all DNA strands are completed.
DNA amplification is complete after n cycles, ideally after 2(n-1), and then enters the plateau
phase. Thus, PCR represents an exponential amplification in which quantification is only
possible in the exponential phase.
PCR of barcode and enhancer sequences
Primer pairs and theoretical PCR product sizes are summarised in Table 7. Melting
temperatures (Tm) of primers were calculated with the NEB Tm Calculator. Elongation time
was adjustable to amplicon length. Barcodes were amplified using single-stranded
oligonucleotides (each 80 nt) corresponding to barcode sequences as PCR templates (1 µL of
100 µM oligomer). DNA sequences as reporter gene constructs (567-1,012 bp) for ST8SIA1
and Cytochrome P450 1B1 (CYP1B1) were amplified by PCR with human total genomic
DNA (gDNA) as template. PCR was performed using the Taq DNA polymerase without
proof-reading. PCR protocol using the Taq DNA polymerase and corresponding amplification
program are summarised in Table 11 and 12.
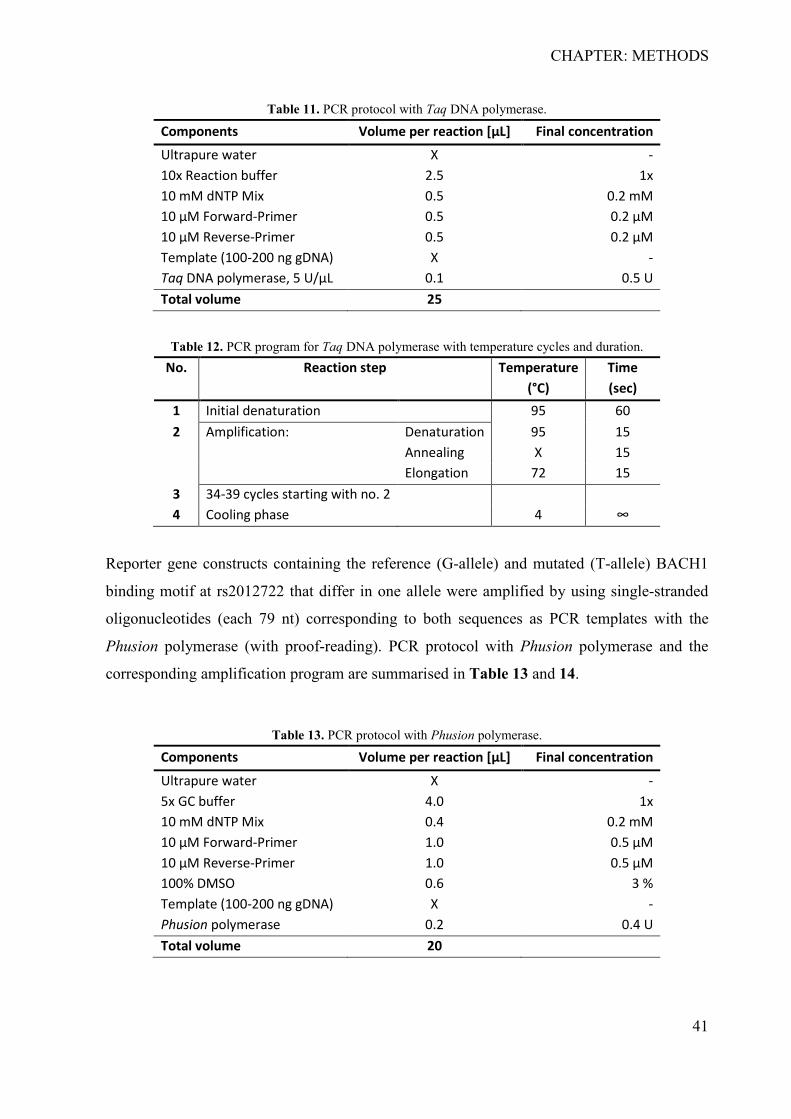
CHAPTER: METHODS
41
Table 11. PCR protocol with Taq DNA polymerase.
Components Volume per reaction [µL] Final concentration
Ultrapure water X - 10x Reaction buffer 2.5 1x 10 mM dNTP Mix 0.5 0.2 mM 10 µM Forward-Primer 0.5 0.2 µM 10 µM Reverse-Primer 0.5 0.2 µM Template (100-200 ng gDNA) X - Taq DNA polymerase, 5 U/µL 0.1 0.5 U Total volume 25
Table 12. PCR program for Taq DNA polymerase with temperature cycles and duration.
No. Reaction step Temperature (°C)
Time (sec)
1 Initial denaturation 95 60 2 Amplification: Denaturation 95 15 Annealing X 15 Elongation 72 15
3 34-39 cycles starting with no. 2 4 Cooling phase 4 ∞
Reporter gene constructs containing the reference (G-allele) and mutated (T-allele) BACH1
binding motif at rs2012722 that differ in one allele were amplified by using single-stranded
oligonucleotides (each 79 nt) corresponding to both sequences as PCR templates with the
Phusion polymerase (with proof-reading). PCR protocol with Phusion polymerase and the
corresponding amplification program are summarised in Table 13 and 14.
Table 13. PCR protocol with Phusion polymerase.
Components Volume per reaction [µL] Final concentration
Ultrapure water X - 5x GC buffer 4.0 1x 10 mM dNTP Mix 0.4 0.2 mM 10 µM Forward-Primer 1.0 0.5 µM 10 µM Reverse-Primer 1.0 0.5 µM 100% DMSO 0.6 3 % Template (100-200 ng gDNA) X - Phusion polymerase 0.2 0.4 U Total volume 20
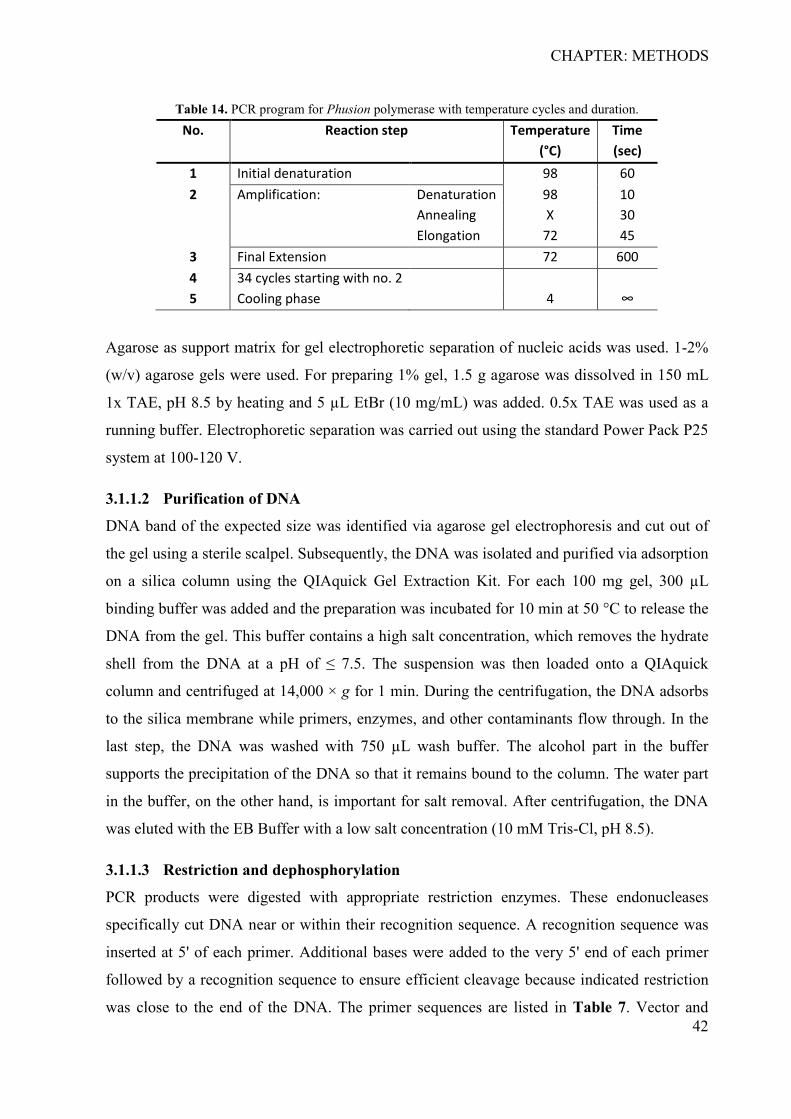
CHAPTER: METHODS
42
Table 14. PCR program for Phusion polymerase with temperature cycles and duration. No. Reaction step Temperature
(°C) Time (sec)
1 Initial denaturation 98 60 2 Amplification: Denaturation 98 10 Annealing X 30 Elongation 72 45
3 Final Extension 72 600 4 34 cycles starting with no. 2 5 Cooling phase 4 ∞
Agarose as support matrix for gel electrophoretic separation of nucleic acids was used. 1-2%
(w/v) agarose gels were used. For preparing 1% gel, 1.5 g agarose was dissolved in 150 mL
1x TAE, pH 8.5 by heating and 5 µL EtBr (10 mg/mL) was added. 0.5x TAE was used as a
running buffer. Electrophoretic separation was carried out using the standard Power Pack P25
system at 100-120 V.
3.1.1.2 Purification of DNA
DNA band of the expected size was identified via agarose gel electrophoresis and cut out of
the gel using a sterile scalpel. Subsequently, the DNA was isolated and purified via adsorption
on a silica column using the QIAquick Gel Extraction Kit. For each 100 mg gel, 300 µL
binding buffer was added and the preparation was incubated for 10 min at 50 °C to release the
DNA from the gel. This buffer contains a high salt concentration, which removes the hydrate
shell from the DNA at a pH of ≤ 7.5. The suspension was then loaded onto a QIAquick
column and centrifuged at 14,000 × g for 1 min. During the centrifugation, the DNA adsorbs
to the silica membrane while primers, enzymes, and other contaminants flow through. In the
last step, the DNA was washed with 750 µL wash buffer. The alcohol part in the buffer
supports the precipitation of the DNA so that it remains bound to the column. The water part
in the buffer, on the other hand, is important for salt removal. After centrifugation, the DNA
was eluted with the EB Buffer with a low salt concentration (10 mM Tris-Cl, pH 8.5).
3.1.1.3 Restriction and dephosphorylation
PCR products were digested with appropriate restriction enzymes. These endonucleases
specifically cut DNA near or within their recognition sequence. A recognition sequence was
inserted at 5' of each primer. Additional bases were added to the very 5' end of each primer
followed by a recognition sequence to ensure efficient cleavage because indicated restriction
was close to the end of the DNA. The primer sequences are listed in Table 7. Vector and
CHAPTER: METHODS
43
insert were digested with the same enzyme to produce the same sticky overhangs for ligation.
PCR products with barcode sequences were cut with XbaI (pGL4.24) or FseI (pGL4.26). PCR
products with enhancer sequences were cut with HindIII or KpnI for cloning into the multiple
cloning site (MCS) of barcoded reporter plasmids upstream of the minimal promoter
(pGL4.24). Restriction reaction (each 50 µL) consisted of x µL DNA (up to 1 µg), 5 µL 10x
CutSmart buffer, 1 µL of a restriction enzyme (HindIII (10 U), KpnI (4 U) XbaI (3 U) or FseI
(0.1 U)) and x µL ultrapure water. The restriction was conducted overnight at 37 °C. The
enzyme reaction was stopped by heat inactivation. Digested DNA was electrophoretically
separated and specific bands were purified according to Chapter 3.1.1.2. To prevent self-
ligation of linearised vector, dephosphorylation of 5` ends was performed. 20 µL preparation
consisting of x µL (up to 1 µg) digested plasmid DNA, 2 µL Antarctic phosphatase reaction
buffer (10x), and 2 U Antarctic phosphatase was used. The enzymatic reaction was performed
at 37 °C for 1 hour. Subsequently, heat inactivation at 80 °C for 2 min stopped the procedure.
Dephosphorylated vector was purified according to Chapter 3.1.1.2.
3.1.1.4 Ligation and bacterial transformation
Ligation of the digested insert with the linearised vector was carried out via T4 DNA ligase at
16 °C overnight. The online tool NEBioCalculator was used to calculate the ratios of vector
and insert. Preparations in 20 μL total volumes in ratios ranging from 1:1 to 7:1, with 50-100
ng vector, were prepared. 20 U of T4 DNA Ligase in 2 μL 10x T4 ligase buffer were used.
The introduction of foreign DNA into prokaryotic cells was carried out by transformation.
Chemically competent DH5α Escherichia coli (E. coli) cells (New England Biolabs),
previously treated with CaCl2 to make the cell membrane semi-permeable, were used. E. coli
cells (each 100 μL) were first thawed on ice for 15 min. Then, 10-12 µL of the ligation
preparation was added to the cell suspension, mixed by pipetting, and left on ice for 10 min.
To increase transformation efficiency, heat shock at 42 °C for 50 seconds was applied
afterward. Transformants were then immediately cooled on ice for at least 2 min before 300-
500 μL of S.O.C. medium was added. After 1 hour incubation at 37 °C under shaking,
transformants were plated onto YT agar plates containing 50 μg/mL carbenicillin. This
antibiotic served to select cells containing the transformed plasmid. Carbenicillin targets
gram-positive bacteria, allowing E. coli to grow on plates without restriction. Plates were
incubated overnight at 37 °C.
CHAPTER: METHODS
44
3.1.1.5 Selection of positive clones
Overnight cultures (OC) were prepared from transformants. Suitable colonies were picked
and cultivated in 8 mL YT medium. The selection was carried out by adding 50 μg/mL
carbenicillin. On the next day, positive clones were selected by PCR. 5 μL of OC were used
as a template for PCR with Taq DNA polymerase (without proof-reading). PCR was carried
out according to Chapter 3.1.1.1 with an increased duration of initial denaturation of 10 min
to ensure cell disruption (Table 12). After identifying positive clones, the remaining OC was
pelleted (3 min at 6800 × g) and used to isolate the plasmid DNA.
3.1.1.6 Plasmid isolation and verification
According to the manufacturer's instructions, isolation of plasmid DNA from transformants
was carried out using QIAprep Spin Miniprep Kit. In this single-column method, plasmid
DNA is bound to the silica membrane. After centrifugation at 6800 × g, cell lysis was
performed with Sodium dodecyl sulfate (SDS)-containing buffer and alkaline lysis. Thus, the
membrane would disrupt by anionic surfactant SDS. Lysis was stopped by pH shift from the
alkaline with an acetic acid buffer. Subsequently, cell fragments were pelleted to release DNA
into the supernatant, later transferred to the QIAprep 2.0 spin column. This allowed plasmid
DNA to bind to the column matrix at a high concentration of guanidinium hydrochloride.
Elution of plasmid DNA was carried out using EB buffer with a low salt concentration. For
verification of successful cloning of the barcodes into pGL4.24, PCR with primers for the
insert was performed according to Chapter 3.1.1.1 (Table 11). 20 ng purified plasmid served
as a template. PCR preparation was electrophoretically separated. Under UV light, the insert
was controlled for its specific band size. Insertion of enhancer sequences into barcoded
reporter gene plasmids was validated via a control restriction in which fragment length of the
insert was visualised by gel electrophoresis. In addition, the insert sequence was analyzed by
DNA sequencing, if necessary.
3.1.1.7 DNA-Sequencing
Sanger sequencing was performed at LGC Genomics GmbH, Berlin. Sequence alignments
were created using Clone Manager 9.
CHAPTER: METHODS
45
3.1.2 Preparation and induction of input library for parallel reporter genes
To ensure equal ratios and concentrations of each reporter gene plasmid, which is a requisite
for parallel transfection and quantification of the reporter gene activity, an input library was
generated. After amplification of the reporter gene plasmids in DH5α E. coli bacteria
according to Chapter 3.1.1.4, and subsequent plasmid purification after Chapter 3.1.1.6,
they were pooled at equal concentrations determined by a spectrophotometer. Three aliquots
(each 50 μl) of electrocompetent E. coli DH5α bacteria were transformed separately with the
pooled plasmids. After 1 hour recovery at 37 °C, the three transformation reactions were
pooled as suggested by Arnold et al. (2013), transferred to 100 mL YT medium with 50
μg/mL carbenicillin, and grown at 37 °C overnight. This procedure ensured that after isolation
of the plasmid library, each plasmid existed in identical concentrations. This guaranteed that
each plasmid construct was transformed in identical numbers into the cells. Subsequently, the
bacterial culture was harvested, and the input library was extracted after Chapter 3.1.1.6.
3.1.3 Determination of primer specificity and efficiency
The efficacy (E) of PCR amplification is largely determined by the sequence and secondary
structure of primers. The specificity, efficiency (i.e. yield), and fidelity is influenced by
various parameters, including the buffer conditions and the PCR cycling regime (i.e.,
temperature and duration of each step). For the barcoded reporter gene system, an ideal set of
barcode primers that anneal efficiently to the target sequence with no hybridization to other
related sequences in the same sample was examined with different PCR conditions.
Specificity of barcode primers was verified by qRT-PCR with 1 µL human cDNA (of fixed
input concentration of 250 or 500 ng total RNA) under particular annealing temperature and
PCR cycle number. Furthermore, cross-reactivity of barcode primers was tested by qRT-PCR
using 1 pg barcoded plasmid DNA. The amplification efficiency of primers was calculated by
standard curve, using barcoded plasmid DNA as a template. Standard plots were made from
5-fold dilution series of plasmid DNA (1 ng - 1 pg) for each barcoded plasmid, to compare the
amplification rates with different template concentrations. Threshold cycle (Ct) values
measured via qRT-PCR were plotted against the logarithmic DNA quantity. Linear regression
was used to define the slope. Determination of the calculated efficiency values occurred from
the slope according to the following equations (Schmittgen and Livak 2008).
CHAPTER: METHODS
46
E = 10 −1
slope
E = �10 −1
slope − 1� × 100 in [%]
3.1.4 Analysis of reporter genes
Gene expression levels of barcoded reporter genes were normalized to the expression of the
internal reference control (empty vector) by the 2-ΔCt method (Equations (1) and (2)). The
base in equation (1), given here as 2, was replaced by the determined amplification factor of
1.9. This correction factor was investigated by calculating the efficiency of the used barcode
primers (Chapter Results, Table 20).
ΔCt = 𝐶𝐶𝐶𝐶 (sample)− 𝐶𝐶𝐶𝐶 (reference control) (1)
Ratio = 2−ΔCt (2)
3.1.5 Validation of reporter gene activity by firefly luminescence
This system is based on bioluminescence detection. The firefly and renilla luciferases are
required for the dual reporter gene assay. Both enzymes have different substrates that they
process, allowing them to be detected in parallel. The firefly luciferase is derived from the
firefly Photinus pyralis and the renilla luciferase is derived from Renilla reniformis, the sea
pansy, belonging to the phylum Cnidaria. Here, the renilla luciferase serves as an exogenous
control for normalization. The emitted light in this process can be detected by a luminometer.
First, the emitted light of the firefly luciferase is measured, which is quenched by up to more
than 105 relative light U after only one second, intending that subsequent measurement of the
renilla luciferase is not affected. Renilla luciferase reaches the maximum of its luminescence
very quickly. Firefly luciferase reaches this state a few milliseconds later. However, the
luminescence of the firefly luciferase decreases more slowly and therefore remains longer
stable. Renilla luciferase decreases luminescence intensity after only a few milliseconds
(Sherf et al. 1996).
pGL4.24 was used for the predicted regulatory sequence at CYP1B1. The published Aryl-
Hydrocarbon Receptor Repressor (AHRR)-enhancer (chr5:373004-374928) and the reporter
CHAPTER: METHODS
47
gene plasmid (pGL4.26) that include this sequence were kindly provided by Ite A. Offringa,
Ph.D., Department of Biochemistry and Molecular Biology, University of Southern
California, USA and was published in Stueve et al. (2017). HeLa cells were co-transfected
with 2.7 μg firefly luciferase reporter gene plasmid together with 0.3 μg renilla luciferase
reporter vector (phRL-SV40) in 6-well plates for 48 hours. Firefly and renilla luciferase
activities were quantified using the Dual-Luciferase Stop & Glo Reporter Assay System with
the Orion II Microplate Luminometer. First, the cells were lysed with 500 µL 1x Passive
Lysis Buffer (PLB) for 15 min at room temperature. 5 µL of each resulting lysate was
analyzed directly or stored at -80 °C for a few days. The luminometer with two injectors was
set to dispense 25 µL of LAR II and Stop & Glo Reagent, respectively. For both
measurements, a 2-second delay and a 10-second read time were used. LAR II solution
contained the substrate for firefly luciferase. 25 µL of it was applied to the sample and
directly measured. Subsequently, the firefly luciferase was quenched by the addition of Stop
& Glo Reagent, which simultaneously also provided the renilla luciferase substrate for
measurement. The relative light units were the ratio of firefly luciferase activity to renilla
luciferase activity. Relative fold changes in activities were normalized to the activity of the
empty vector, resulting in the luciferase Δ fold activity. Statistical differences of reporter gene
activities were calculated using a T-Test.
3.2 In silico identification of putative causal variants
For investigating patterns of LD between the ST8SIA1 lead-SNP rs2728821 and other
common SNPs of this haplotype block, the LDproxy Tool (Machiela and Chanock 2015) with
the International Genome Sample Resource (IGSR) populations CEPH (Utah Residents from
North and West Europe; code CEU) and British (British in England and Scotland; GBR) was
assessed.
To define enhancer/repressor elements and to narrow down the association to putative causal
variant(s), data from ENCODE with the SNP locations were integrated and analyzed, if the
associated SNPs mapped to DNA elements with predictive features of regulatory function on
gene expression shared by several cell types. Selection criteria for follow-up of putative
causal variants were: (1) TFBS that were experimentally confirmed by ChIP-Seq, (2) open
chromatin as determined by DNAse I hypersensitivity (DHS), (3) H3K4Me1 and H3K27Ac
CHAPTER: METHODS
48
histone modifications, and (4) chromatin state segmentation, that merges epigenomic data into
a sequence of functional chromatin states (Mammana and Chung 2015).
To investigate whether the nucleotide variants of the associated SNPs changed predicted
TFBS, an in silico analysis using the database Transfac professional (geneXplain) (Wingender
2008), which provides data on eukaryotic transcription factors, their experimentally-proven
binding sites, consensus binding sequences (position weight matrices, PWM) and regulated
genes (> 80 million ChIP-seq sites available) was carried out. Additionally, the putative
TF binding motif was validated with the motif collection of the open-access database Jaspar
(Sandelin et al. 2004). To search for eQTL effects of the associated SNPs, the software tool
QTLizer (Munz et al. 2020) was utilized.
3.3 Electrophoretic mobility shift assay
Allele-specific oligonucleotide probes were designed to determine allele specificity of protein
binding by EMSA. The double-stranded oligonucleotides corresponding to both alleles of
rs2012722 flanked by 21 bp in both cold (unlabelled) and 3′-biotinylated forms were obtained
by annealing with their respective complementary primers (Table 8). For this, two
complementary oligonucleotides were first diluted to 1 µM with hybridisation buffer, then
denatured for 5 min at 95 °C in a thermomixer and lastly cooled down to room temperature
for at least 3 hours in the thermomixer. During the cooling phase, the oligonucleotides
hybridise. Annealed oligonucleotides were stored at 4 °C for a maximum of 2 weeks.
DNA-protein binding was determined using the Gelshift Chemiluminescent EMSA Kit.
Protein extract was prepared from immortalized human gingival fibroblasts (ihGFs, purchased
from Applied Biological Materials Inc. [ABM]) following the protocol from Chapter 3.4. For
electrophoresis, a 5% (v/v) native polyacrylamide gel electrophoresis (PAGE) was used from
the following components: 4.2 mL of ultrapure water, 600 µL of 5x TBE, pH 8.3, 60 µL of
50% (v/v) glycerol and 1 mL of 30% (v/v) polyacrylamide solution. As a radical initiator, 40
µL of 10% (w/v) APS was added. To catalyze polymerization, 10 µL of TEMED was added.
Prior to gel loading, pre-electrophoresis with 0.5x TBE was performed (for 1-2 hours) to
avoid binding of unpolymerised acrylamide to the proteins. During the pre-electrophoresis,
the binding reaction was prepared according to Table 15 and incubated for 20 min at room
temperature.
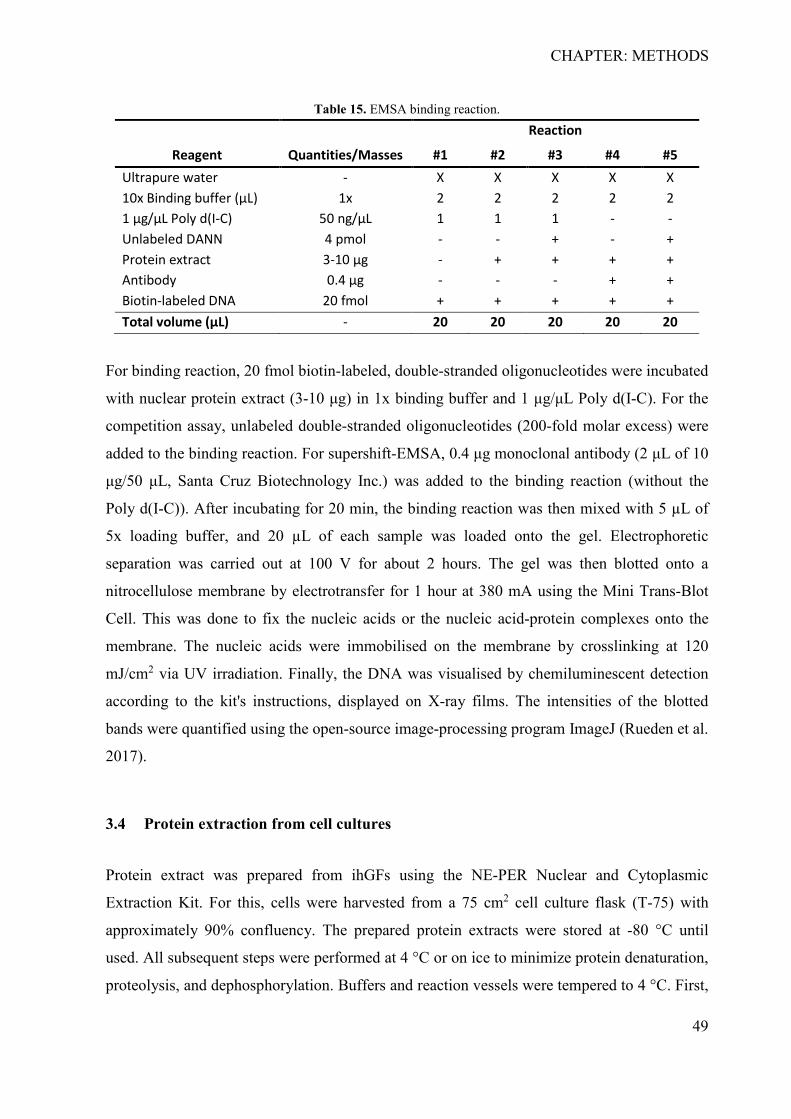
CHAPTER: METHODS
49
Table 15. EMSA binding reaction.
Reagent
Quantities/Masses
Reaction
#1 #2 #3 #4 #5 Ultrapure water - X X X X X 10x Binding buffer (µL) 1x 2 2 2 2 2 1 μg/μL Poly d(I-C) 50 ng/μL 1 1 1 - - Unlabeled DANN 4 pmol - - + - + Protein extract 3-10 µg - + + + + Antibody 0.4 µg - - - + + Biotin-labeled DNA 20 fmol + + + + + Total volume (µL) - 20 20 20 20 20
For binding reaction, 20 fmol biotin-labeled, double-stranded oligonucleotides were incubated
with nuclear protein extract (3-10 μg) in 1x binding buffer and 1 μg/μL Poly d(I-C). For the
competition assay, unlabeled double-stranded oligonucleotides (200-fold molar excess) were
added to the binding reaction. For supershift-EMSA, 0.4 μg monoclonal antibody (2 μL of 10
μg/50 μL, Santa Cruz Biotechnology Inc.) was added to the binding reaction (without the
Poly d(I-C)). After incubating for 20 min, the binding reaction was then mixed with 5 µL of
5x loading buffer, and 20 µL of each sample was loaded onto the gel. Electrophoretic
separation was carried out at 100 V for about 2 hours. The gel was then blotted onto a
nitrocellulose membrane by electrotransfer for 1 hour at 380 mA using the Mini Trans-Blot
Cell. This was done to fix the nucleic acids or the nucleic acid-protein complexes onto the
membrane. The nucleic acids were immobilised on the membrane by crosslinking at 120
mJ/cm2 via UV irradiation. Finally, the DNA was visualised by chemiluminescent detection
according to the kit's instructions, displayed on X-ray films. The intensities of the blotted
bands were quantified using the open-source image-processing program ImageJ (Rueden et al.
2017).
3.4 Protein extraction from cell cultures
Protein extract was prepared from ihGFs using the NE-PER Nuclear and Cytoplasmic
Extraction Kit. For this, cells were harvested from a 75 cm2 cell culture flask (T-75) with
approximately 90% confluency. The prepared protein extracts were stored at -80 °C until
used. All subsequent steps were performed at 4 °C or on ice to minimize protein denaturation,
proteolysis, and dephosphorylation. Buffers and reaction vessels were tempered to 4 °C. First,
CHAPTER: METHODS
50
adherent cells were trypsinized and centrifuged at 500 × g for 5 min. The pellet was then
washed with 1 mL of 1x PBS, centrifuged at 500 × g for 3 min, and then placed on ice. To
secure the cytoplasmic protein fraction, the cell pellet was resuspended in hypertonic buffer
(200 µL of cytoplasmic extraction reagent I (CER I)) and vortexed for 15 seconds at
maximum speed. Subsequent incubation on ice for 10 min swelled the cells. Next, 11 µL of
the cytoplasmic extraction reagent II (CER II) containing a detergent was added, vortexed for
five seconds at maximum speed and left on ice for 1 min. Subsequently, the sample mixture
was homogenized for five seconds and then centrifuged at 14,000 × g for 10 min. The
resulting supernatant was collected and corresponded to the cytoplasmic extract. The cell
pellet was kept on ice. To obtain the nuclear protein fraction, the cell pellet was lysed. For
this, 100 µL of the nuclear extraction reagent (NER) was added, vortexed for 15 seconds at
maximum speed, and then placed on ice for 50 min. During the incubation, the sample was
vortexed every 10 min for 15 seconds at maximal speed. Finally, the sample was centrifuged
at 14,000 × g for 10 min and the supernatant corresponded to the nuclear protein extract
fraction.
3.4.1 Quantitative protein determination
The protein concentration was determined using the colorimetric detergent-compatible (DC)
protein assay. The decisive advantage over other protein determination methods is that this
assay is predominantly insensitive to larger amounts of detergent. According to Lowry
(1951), the principle of this method is based on protein determination by two chemical
reactions. During the first reaction (Biuret reaction), blue-violet complexes are formed
between the peptide bonds of the protein and Cu2+ ions in an alkaline environment. In the
second reaction, Cu2+ is reduced to Cu+ by oxidation of aromatic amino acids, which reduces
the yellow Folin-Ciocalteau reagent (molybdophosphoric and tungstophosphoric acid) to
molybdenum blue. The resulting colour change from yellow to blue can be measured
photometrically at 500-800 nm. The DC protein assay was performed according to the
manufacturer's instructions. A BSA dilution of ascending concentration series (0-1 mg/mL)
was used to create a standard curve from which the concentration of the protein samples was
determined. 5 µL of each sample was mixed with 25 µL of solution A' and 200 µL of solution
B. Solutions A' and B are from the kit and not further described in the manufacturer's
CHAPTER: METHODS
51
instructions. After 15 min incubation at room temperature, the absorbance at 750 nm was
measured.
3.5 CRISPR-mediated gene activation
The CRISPR Synergistic Activation Mediator (SAM) system was applied. This variant of
CRISPRa allows enhancement of endogenous gene expression at specific sgRNA target sites.
SAM is a protein complex consisting of three components: the sgRNA/MS2 expression
vector, the MS2/P65/HSF1 helper vector, and the dCas9/VP64 helper vector. The sgRNA
backbone vector incorporates two hairpin MS2 RNA aptamers at the tetraloop and stemloop 2
as secondary anchoring sites to facilitate the efficient recruitment of MS2-fusion proteins. The
MS2/P65/HSF1 vector consists of the domain fusion proteins of p65 (the trans-activation
subunit of NF-kB), and HSF1 (the activation domain of human heat shock factor 1). VP64 is
also a transactivation domain that interacts with the dCas9 protein. The use of multiple TFs
can achieve transcriptional activation of the target sites through synergistic interactions
among the activators VP64, p65, and HSF1.
3.5.1 sgRNA design
CRISPRa sgRNAs were designed with the online tool CRISPR-ERA (Liu et al. 2015). This
web-based tool provides the user to design sgRNAs for genome editing, as well as gene
regulation (repression and activation). It indicates suitable target sites for each intended target
gene or genomic sequence of interest and computationally predicts sgRNA efficiency (on-
target activity) and off-target effects. For CRISPRa, short sgRNAs that contained a 19-nt
guide sequence complementary to a target site were designed. The genomic recognition site
immediately preceded a PAM sequence with a canonical sequence "NGG" where “N” was
any nucleotide for the CRISPR/Cas9 system. The flanking PAM sequence at the end of the
DNA target site was validated manually using the Ensembl genome browser 104. Identical or
near-identical genomic matches were avoided to reduce the risk of off-target effects. Two
sgRNAs for each target site were designed to increase activation efficiency. For each sgRNA,
19-mer oligos and their associated reverse complement including the overhang sequences for
cloning (into BbsI site) were synthezised.
CHAPTER: METHODS
52
3.5.1.1 Preparation of Insert
Preparation of sgRNA as an insert for cloning was performed according to the protocol of
Zhang lab (Ran et al. 2013). The sgRNAs primers were synthesized and the respective primer
pair was annealed (Table 9). First, the primers were adjusted to 100 µM with ultrapure water.
Then the reaction mixture of 15.5 µL ultrapure water, 2 µL 10x T4 ligase buffer, 1 µL of the
respective forward and reverse primer, and 0.5 µL of the T4 PNK (1.25 U) was prepared. The
mixture was first denatured at 37 °C for 30 min, then at 95 °C for 5 min, and then the
thermoblock was switched off. The samples were not removed but left in the thermoblock for
another 3 hours to cool down to room temperature. Within the cooling time, each primer pair
hybridized at its required annealing temperature. The resulting double-stranded oligomers
were used as inserts for cloning.
3.5.1.2 Preparation of Vector
sgRNA(MS2) backbone vector was used as a cloning plasmid. The restriction enzyme BbsI
was used to digest the vector. The restriction reaction (60 µL) consisted of x µL ultrapure
water, 2-3 µg plasmid DNA, 6 µL of CutSmart buffer, and 4.5 µL (6.75 U) of BbsI enzyme.
The reaction was incubated at 37 °C. To prevent vector self-ligation, 2 µL (2 U) of CIP was
added after an incubation time of 1.5 hours and the reaction was incubated for another 30 min.
Finally, the dephosphorylated plasmid was purified using the QIAquick Gel Extraction Kit
after Chapter 3.1.1.2.
3.5.2 Generation of sgRNA plasmids
sgRNAs were ligated into the BbsI digested sgRNA(MS2) vector. The ligation mixture (20
µL) consisted of 50 ng plasmid, 1.5 µL annealed oligonucleotides (undiluted), 2 µL 10x T4
ligase buffer, 1 µL T4 ligase (100 U) and x µL ultrapure water, which was incubated for 2
hours at room temperature. Afterward, transformation into E. coli was carried out according
to Chapter 3.1.1.4. sgRNA cloning showed a very high transformation efficiency with
positive clones. Therefore, one clone of each sgRNA was directly transferred to overnight
bacterial culture (8 mL) and plasmid isolation was performed after Chapter 3.1.1.6.
Successful cloning of sgRNA was verified by DNA sequencing with the universal primer
hU6-F (metabion international AG, Germany).
CHAPTER: METHODS
53
3.5.3 CRISPRa induction and analysis
CRISPRa SAM system was employed to test the potential cis-effect of the two identified
repressors on the gene expression of ST8SIA1 and to upregulate ST8SIA1 for subsequent
RNA-Sequencing (RNA-Seq). Two individual sgRNAs were tiled at each selected SNP-
associated region and two sgRNAs at the promoter of ST8SIA1 as positive controls. A non-
targeting scrambled (random) sgRNA from Liu et al. (2018) and a sgRNA, located at the
miRNA hsa-miR-374b-5p on chromosome X (miRNA X), which did not affect ST8SIA1
expression, were used as negative controls. HeLa cells were co-transfected with two sgRNAs
targeting either the regulatory region tagged by rs3819872 or rs2012722 and two sgRNAs for
the ST8SIA1 promoter in triplicates. Here, 1 μg sgRNA cocktail consisting of four sgRNAs
with each 250 ng was used. Multiple sgRNAs were pooled to ensure that at least one had an
activating effect. For the positive control, each 250 ng of two ST8SIA1 promoter sgRNAs was
pooled with 500 ng sgRNA miRNA X (negative control) to set an equivalent quantity of 1 μg.
The two negative control sgRNAs (each 1 μg) were separately transfected. For the CRISPRa
induction, each 6-well was co-transfected with 1 μg of equimolar sgRNAs pools, 1 μg
dCAS9-VP64_GFP, and MS2-P65-HSF1_GFP according to Chapter 3.7.2. 44 hours after
transfection, the total RNA was extracted and quantified as cDNA via qRT-PCR by the 2-ΔΔCt
method. All sample Ct values were first normalized to their GAPDH (glyceraldehyde-3-
phosphate dehydrogenase) Ct values (1). After that, the normalized ΔCt sample values were
divided by the ΔCt values of the negative control samples (2) to calculate the relative fold
change (3) increase in transcript levels. The formulas for these calculations are depicted
below.
ΔCt = 𝐶𝐶𝐶𝐶 (sample)− 𝐶𝐶𝐶𝐶 (reference control) (1)
ΔΔCt = ΔCt (sample) − ΔCt (negative control) (2)
Ratio = 2−ΔΔCt (3)
3.6 RNA-Sequencing
Total RNA of the six independent CRISPR-activated HeLa cell cultures with sgRNAs that
targeted the ST8SIA1 promoter and regulatory region tagged by rs2012722 was extracted
according to Chapter 3.9.1. RNA integrity was measured by calculating RNA integrity
CHAPTER: METHODS
54
numbers (RIN) on a 2100 Bioanalyzer (Agilent) according to the manufacturer’s instructions.
RNA-Seq and analysis were conducted at the Core Facility Genomics and the Core Unit
Bioinformatics (CUBI), Berlin Institute of Health). 500-1000 ng of total RNA was sequenced
with 16 million reads (75 bp single-end) on a NextSeq 500 using the NextSeq 500/550 High
Output Kit v2.5 (75 Cycles). The output reads were aligned to the Genome Reference
Consortium Human Build 38 patch release 7 (GRCh38.p7) genome using the STAR aligner v.
2.7.5a (Dobin et al. 2013). Quality control (QC) of the reads was inspected using the multiqc
reporting tool (Ewels et al. 2016) summarizing on several approaches, including fastqc
(available online at: http://www.bioinformatics.babraham.ac.uk/projects/fastqc), dupradar
(Sayols et al. 2016), qualimap (Garcia-Alcalde et al. 2012) and RNA-SeqC (DeLuca et al.
2012). Raw counts were extracted using the STAR program. For differential gene expression,
utilization occurred via the R package DESeq2 (Love et al. 2014) version 1.26. The only
contrast fitted was the comparison between the ST8SIA1 induction and scramble controls.
Gene set enrichment was performed using the CERNO test from the tmod package (Zyla et al.
2019) version 0.46.2 using the gene expression profiling-based gene set included in the
package along with the MSigDB (Liberzon et al. 2015). For hypergeometric test and the Gene
Ontology gene sets, the goseq package (Young et al. 2010) version 1.38 was employed. The
raw P values of the differently expressed genes were corrected for multiply testing using
Benjamini-Hochberg correction. The adjusted P values are given as q values (false discovery
rate, FDR). The RNA-seq output reads, raw counts and results of differential expression
analysis have been submitted to the Short Read Archive via Gene Expression Omnibus (GEO
accession GSE160672).
3.7 Cell culture
Cultivation of adherent cells took place in T-75 at 37 °C in a water-saturated atmosphere with
5% CO2. Subcultivation was carried out every 3 to 4 days until the cells reached a confluency
of 90-95%. For this, the old culture medium was removed and the cells were washed twice
with 1x PBS. Subsequently, the cells were proteolytically solubilised with 3 mL
Trypsin/EDTA from the bottom of the culture flask for 10 min. The enzyme reaction was
stopped using an appropriate volume of complete culture medium and the cell suspension was
centrifuged at 300 × g for 5 min. Depending on the cell coherence, they were seeded in a ratio
of 1:2 to 1:5 into a new T-75 flask. For the barcoded reporter gene assays, ihGFs were
CHAPTER: METHODS
55
cultured in DMEM supplemented with 10% (v/v) FBS and 1% (v/v) P/S. For the single and
parallel reporter gene assays and CRISPRa, HeLa cells were cultured in a growth medium of
Earle’s MEM, containing 10% FBS, 2 mM L-Glutamine, 1% (v/v) NEAA, and 1% P/S.
3.7.1 Determination of cell number and viability
The calculation of cell concentration and viability was performed using the Neubauer
counting chamber. The counting network consists of nine large squares. The counting was
carried out in the four outer large squares. If a large square with an area of 1 mm2 is counted,
then a volume over this area (at 0.1 mm chamber depth) of 0.1 mm3 or 104 cells/mL results.
Trypan blue was used to stain monolayer cells. The following formulae were applied to
calculate the cell concentration, total cell count, and viability. Here, n was the mean value of
counted cells from four large squares.
Cell concentration: = n × 104 × dilution factor = c
Total cell count: = c × total volume
Viability: = unstained cells unstained cells+stained cells
× 100 in [%]
3.7.2 Transfection
The choice of the transfection method depends not only on the type and size of cells under
investigation but also on whether temporary (transient) or permanent (stable) integration is to
be performed. In transient transfection of genetic material into eukaryotic cells, no genomic
integration occurs, but only time-conditioned transcription is induced.
For the barcoded reporter gene assays, ihGFs were seeded at 180,000 cells per 6-well prior to
transfection with Lipofectamine 2000. The principle of this technique is a liposome
transfection using cationic lipid subunits that form liposomes in an aqueous environment,
which interact with the negatively charged phosphate of the nucleic acid and form a complex
that allows entering cell membrane through endocytosis (Felgner et al. 1993). In this
transfection, it is crucial to use a serum-free medium or one with a debase concentration so
that complex formation of the Lipofectamine reagent with the nucleic acids can occur.
Therefore, DNA and Lipofectamine reagent were first diluted with serum-reduced medium
CHAPTER: METHODS
56
Opti-MEM. 3.5 µg of DNA was diluted to 150 µL with Opti-MEM. The lipofectamine
mixture consisted of 8 µL of Lipofectamine reagent in 142 µL Opti-MEM and was incubated
for 5 min at room temperature. The transfection complex was then formed. For this, 150 µL
of Lipofectamine mixture was added to the DNA, mixed, and incubated for 20 min at room
temperature. Subsequently, 250 µL of transfection complex mixture was distributed dropwise
onto the cells. After incubation at 37 °C for 4 hours, the culture medium was changed with a
complete medium to remove the transfection complex.
For the single and parallel reporter gene assays and CRISPRa, HeLa cells were seeded at
70,000-80,000 cells per well in 6-well plates and left overnight to reach around 50-60%
confluence. HeLa cells were transfected using the polymer-mediated jetPEI transfection
reagent according to the manufacturer’s instructions. This method is based on
polyethyleneimine (PEI), which is a cationic polymer that complexes with DNA and interacts
with the anionic proteoglycans of the cell surface, thereby introducing the DNA by
endocytosis (Boussif et al. 1995). In the endosome, the jetPEI acts like a “proton sponge” so
that pH within the endosome does not degrade the foreign DNA. Here, it induces the
disruption of the endosomal membrane through which the foreign DNA is released into the
cytosol and reaches the nucleus via nucleotransporters. jetPEI with the optimal jetPEI/DNA
ratio of 2:1 was used to ensure high transfection efficiency. For every 1 µg of DNA, 2 µL of
jetPEI were used. First, the DNA mixture was prepared. 3 µg of DNA was included in 100 µL
of 150 mM NaCl solution. Then, the jetPEI mixture, consisting of 6 µL jetPEI reagent and 94
µL of 150 mM NaCl solution, was prepared. Both mixtures were carefully homogenized
using a vortexer. Then, the complete jetPEI mixture was added to the DNA mixture,
homogenized, and allowed to stand at room temperature for 25 min. During this process, the
jetPEI-DNA complex was built up. After incubation, the transfection complex was transferred
dropwise and homogeneously onto the cells. Subsequently, the transfection complex was
removed by medium change. After 24-48 hours, the transfection process was terminated by
cell lysis.
3.8 Preparation and induction of cigarette smoke extract
CSE was prepared as recently described in Freitag-Wolf et al. (2019). Liquid CSE was
prepared using the apparatus shown in Figure 10.
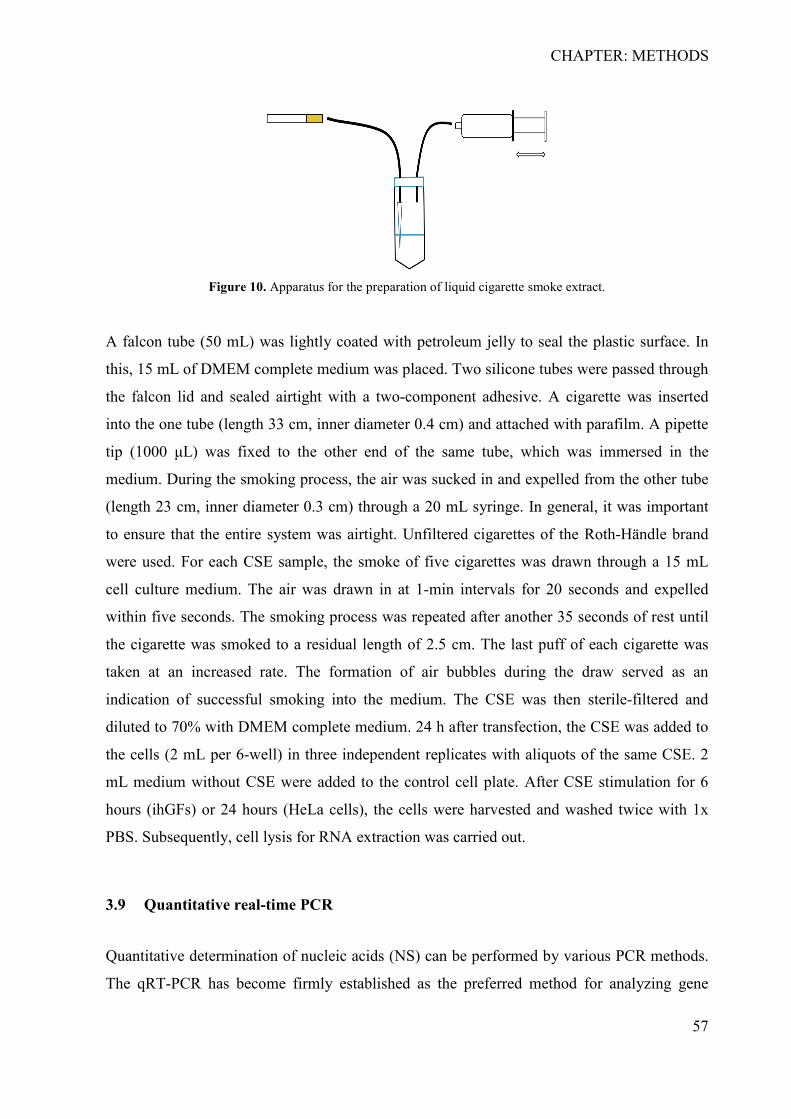
CHAPTER: METHODS
57
Figure 10. Apparatus for the preparation of liquid cigarette smoke extract.
A falcon tube (50 mL) was lightly coated with petroleum jelly to seal the plastic surface. In
this, 15 mL of DMEM complete medium was placed. Two silicone tubes were passed through
the falcon lid and sealed airtight with a two-component adhesive. A cigarette was inserted
into the one tube (length 33 cm, inner diameter 0.4 cm) and attached with parafilm. A pipette
tip (1000 μL) was fixed to the other end of the same tube, which was immersed in the
medium. During the smoking process, the air was sucked in and expelled from the other tube
(length 23 cm, inner diameter 0.3 cm) through a 20 mL syringe. In general, it was important
to ensure that the entire system was airtight. Unfiltered cigarettes of the Roth-Händle brand
were used. For each CSE sample, the smoke of five cigarettes was drawn through a 15 mL
cell culture medium. The air was drawn in at 1-min intervals for 20 seconds and expelled
within five seconds. The smoking process was repeated after another 35 seconds of rest until
the cigarette was smoked to a residual length of 2.5 cm. The last puff of each cigarette was
taken at an increased rate. The formation of air bubbles during the draw served as an
indication of successful smoking into the medium. The CSE was then sterile-filtered and
diluted to 70% with DMEM complete medium. 24 h after transfection, the CSE was added to
the cells (2 mL per 6-well) in three independent replicates with aliquots of the same CSE. 2
mL medium without CSE were added to the control cell plate. After CSE stimulation for 6
hours (ihGFs) or 24 hours (HeLa cells), the cells were harvested and washed twice with 1x
PBS. Subsequently, cell lysis for RNA extraction was carried out.
3.9 Quantitative real-time PCR
Quantitative determination of nucleic acids (NS) can be performed by various PCR methods.
The qRT-PCR has become firmly established as the preferred method for analyzing gene
CHAPTER: METHODS
58
expression patterns. In qRT-PCR, the degree of amplification is determined in real-time with
each PCR cycle by fluorescent dye. The fluorescence measured increases proportionally with
the amplification. For analysis, the exponential phase is applicable, because here no factor is
limiting, and the PCR products accumulate at a steady rate. Therefore, maximum PCR
efficiency can be determined in this phase. Various fluorescent dyes are available on the
market to date. Besides hydrolysis (TaqMan) and hybridisation probes (Beacons), the DNA-
binding agent SYBR Green I is the simplest and most cost-effective variant. This dye binds
sequence-nonspecifically in the minor groove of double-stranded DNA, which has an
emission maximum at 520 nm. A relative quantification can be carried out with a reference
gene. However, this endogenous control must not be subject to gene regulation in a
predefined system. Furthermore, the amplification efficiency of reference and target genes
should be similar. GAPDH and β-actin are such reference genes. The amount of input target
can be determined by the Ct value of the sample. The Ct value is the point at which
fluorescence is detected significantly above the background signal. In general, the higher the
amount of the input DNA, the sooner the PCR product is detected by fluorescence, and the
lower the Ct value. The ΔCt method can be applied to determine the relative quantification.
Here, the Ct value of the target gene is normalized to the reference gene. If an additional
relation to a co-measured control is made, then it is referred to as the ΔΔCt method. By
including a standard series with known concentrations of the NS, an absolute quantification
can also be determined. The specificity of qRT-PCR products can be verified by melt or
dissociation curves at the end of the PCR. In this process, the temperature is continuously
increased until the DNA is completely denatured. This results in a specific melting
temperature plot for each PCR product.
qRT-PCR was performed using the CFX Connect Real-Time PCR Detection System. SYBR
Select Master Mix was utilized as a fluorescent dye. The applied primers are listed in Table
10. The SYBR Green Master Mix was composed of the fluorescent dye, dNTP's with dUTP's,
the thermally activatable AmpliTaq Gold Polymerase, and the buffer for optimal reaction
conditions. The qRT-PCR reaction mixture of 10 µL consisted of 50% SYBR Select Master
Mix, 40% primer mix (with a final concentration of 400 nM), and 10% cDNA template. The
amplification protocol is reflected in Table 16 below.
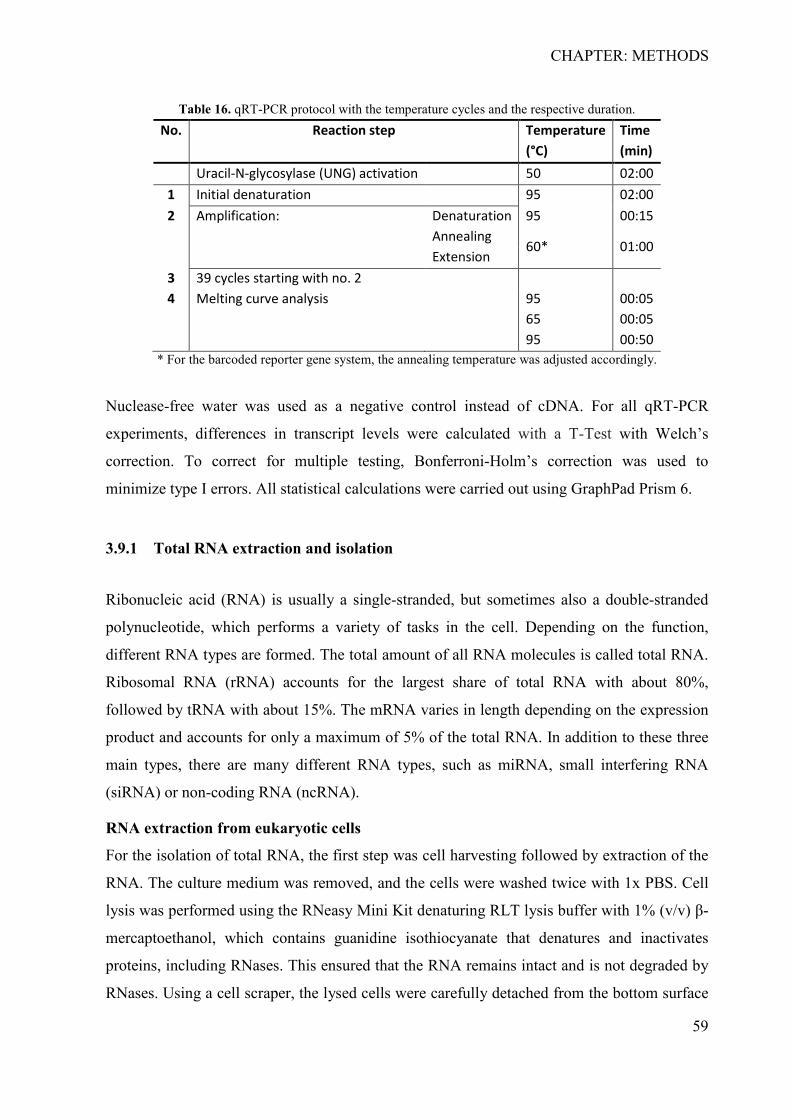
CHAPTER: METHODS
59
Table 16. qRT-PCR protocol with the temperature cycles and the respective duration. No. Reaction step Temperature
(°C) Time (min)
Uracil-N-glycosylase (UNG) activation 50 02:00 1 Initial denaturation 95 02:00 2 Amplification: Denaturation 95 00:15 Annealing
Extension 60* 01:00
3 39 cycles starting with no. 2 4 Melting curve analysis 95
65 95
00:05 00:05 00:50
* For the barcoded reporter gene system, the annealing temperature was adjusted accordingly.
Nuclease-free water was used as a negative control instead of cDNA. For all qRT-PCR
experiments, differences in transcript levels were calculated with a T-Test with Welch’s
correction. To correct for multiple testing, Bonferroni-Holm’s correction was used to
minimize type I errors. All statistical calculations were carried out using GraphPad Prism 6.
3.9.1 Total RNA extraction and isolation
Ribonucleic acid (RNA) is usually a single-stranded, but sometimes also a double-stranded
polynucleotide, which performs a variety of tasks in the cell. Depending on the function,
different RNA types are formed. The total amount of all RNA molecules is called total RNA.
Ribosomal RNA (rRNA) accounts for the largest share of total RNA with about 80%,
followed by tRNA with about 15%. The mRNA varies in length depending on the expression
product and accounts for only a maximum of 5% of the total RNA. In addition to these three
main types, there are many different RNA types, such as miRNA, small interfering RNA
(siRNA) or non-coding RNA (ncRNA).
RNA extraction from eukaryotic cells
For the isolation of total RNA, the first step was cell harvesting followed by extraction of the
RNA. The culture medium was removed, and the cells were washed twice with 1x PBS. Cell
lysis was performed using the RNeasy Mini Kit denaturing RLT lysis buffer with 1% (v/v) β-
mercaptoethanol, which contains guanidine isothiocyanate that denatures and inactivates
proteins, including RNases. This ensured that the RNA remains intact and is not degraded by
RNases. Using a cell scraper, the lysed cells were carefully detached from the bottom surface
CHAPTER: METHODS
60
of the culture flask. The cell lysate was transferred onto a QIAshredder column and
centrifuged for 3 min at 14,000 × g to retain proteins, polysaccharides, and other cell
components. The flow-through with the homogenised cell lysate was directly used for RNA
isolation or frozen at -80 °C for intermediate storage.
Isolation of total RNA
According to the manufacturer’s instructions, human cells were harvested and total RNA was
isolated from the cells using the RNeasy Mini Kit. This method is designed to isolate all RNA
molecules longer than 200 nucleotides. The basic principle of the modus operandi is a
column-based nucleic acid binding in the presence of chaotropic salts. The extracted cell
lysate was mixed with 70% ethanol (1:1) to create the necessary environment for RNA
binding to the column matrix. The mixture was then applied to a RNeasy spin column and
centrifuged. In this step, the RNA bound to the RNA-selective silicate membrane, while all
remaining cell components were filtered out. Afterward, a DNAse I treatment with RNase-
Free DNase Set was performed directly on the column membrane to remove possible genomic
DNA contamination. Subsequently, the column was first washed with a salt-containing buffer
and then with an ethanol-containing buffer. The alcohol part in the buffer lead to precipitate
RNA by removing the water from the hydrate shell of nucleic acids. The water content in the
buffer was needed for salt removal. Finally, after dry centrifugation, the RNA was eluted with
RNase-free water.
3.9.2 RNA Purification
The RNAs of the barcoded reporter assays were subsequently cleaned with an additional
DNAse I digestion to remove any traces of DNA. DNAse I is an endonuclease that
unspecifically digests single- and double-stranded DNA molecules along with chromatin. The
activity of DNAse I depends on certain cations and the pH value. In the presence of Mg2+ or
Ca2+ ions, the two DNA strands are cleaved at different sites. In the presence of Mn2+ ions,
the enzyme preferentially cleaves both DNA strands at the same site. The DNAse I treatment
was performed with the TURBO DNA-free Kit according to the manufacturer’s instructions.
The TURBO DNAse is capable of digesting with 350% greater catalytic efficiency than with
wild-type DNAse I, thus making it more effective in removing trace quantities of DNA
contamination from RNA preparations. Another advantage is that the TURBO Inactivation
Reagent subsequently removes the TURBO DNAse and divalent cations from the sample
CHAPTER: METHODS
61
using a novel method, which does not require phenol/chloroform extraction, alcohol
precipitation, heating, or the addition of EDTA.
For RNA preparation from a 6-well, the two-step TURBO rigorous DNAse treatment was
performed. The reaction consisted of 50 µL total RNA (unmeasured from a 6-well), 5 µL of
10X TURBO DNAse Buffer, and 2 μL (4 U) of TURBO DNAse. First, the mixture was
incubated for 30 min at 37 °C, and then an additional 1 μL (2 U) of TURBO DNAse was
added to the sample and incubated for a further 30 min. The reaction was stopped by using 10
µL TURBO Inactivation Reagent for 5 min at room temperature. Afterward, the sample was
centrifuged at 10,000 × g for 1.5 min and the supernatant was carefully transferred to a new
tube. The purified RNA was used for reverse transcription. After the cDNA synthesis,
complete removal of DNA was verified by PCR after Chapter 3.1.1.1 using plasmid
backbone primers (Table 7) and a pGL4.24 DNA template as a positive control.
3.9.3 cDNA synthesis
Reverse transcription allows RNA to be transcribed into its cDNA sequence with reverse
transcriptase (RT). cDNAs can be applied to study gene expression patterns via PCR
techniques. To initiate cDNA synthesis, RT requires an oligonucleotide as a starting point. To
specifically transcribe mRNA into cDNA, oligo(dT) nucleotides are used as primers.
Oligo(dT) primer binds complementary to poly-A tail of eukaryotic mRNAs. Complete
reverse transcription can be generated by using random and oligo(dT) primers together. The
first-strand cDNA was synthesized using the High-Capacity cDNA Reverse Transcription Kit.
For the barcoded reporter gene assays, 250 ng TURBO DNA-free total RNA was employed
for cDNA synthesis. For the CRISPRa, 500 ng purified total RNA was reverse-transcribed.
The corresponding cDNA protocol is summarized in Table 17.
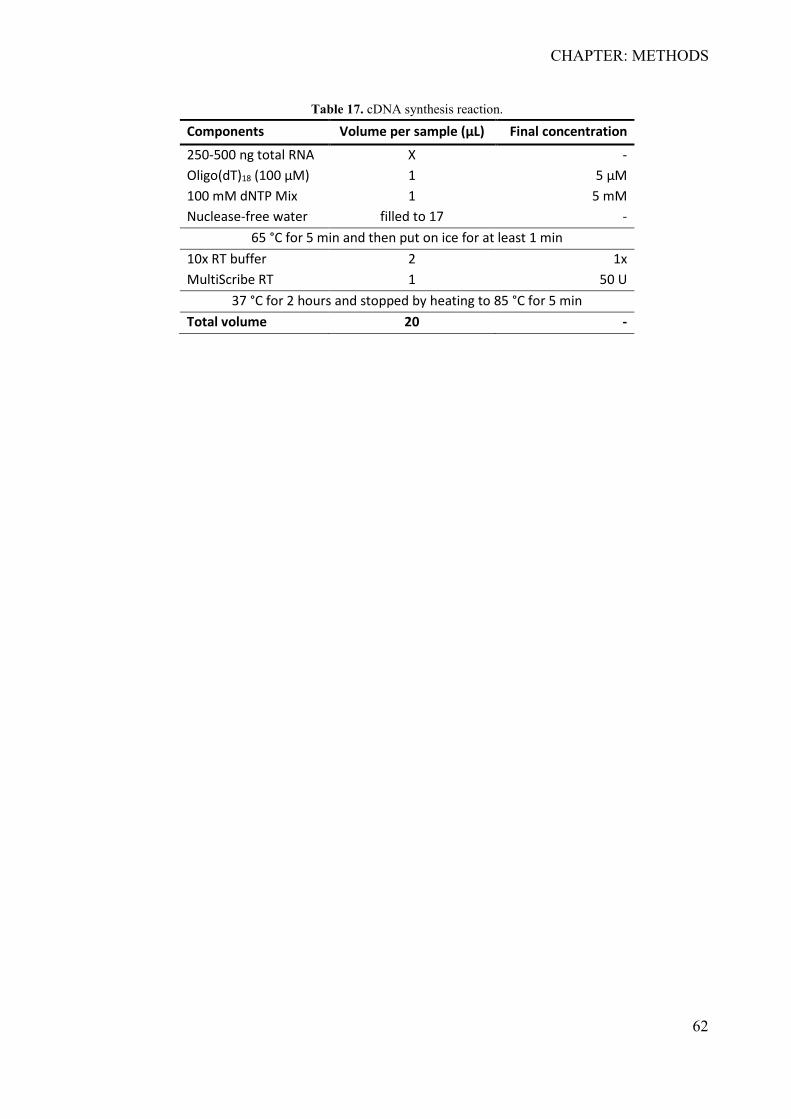
CHAPTER: METHODS
62
Table 17. cDNA synthesis reaction.
Components Volume per sample (µL) Final concentration
250-500 ng total RNA X - Oligo(dT)18 (100 µM) 1 5 µM 100 mM dNTP Mix 1 5 mM Nuclease-free water filled to 17 -
65 °C for 5 min and then put on ice for at least 1 min 10x RT buffer 2 1x MultiScribe RT 1 50 U
37 °C for 2 hours and stopped by heating to 85 °C for 5 min Total volume 20 -
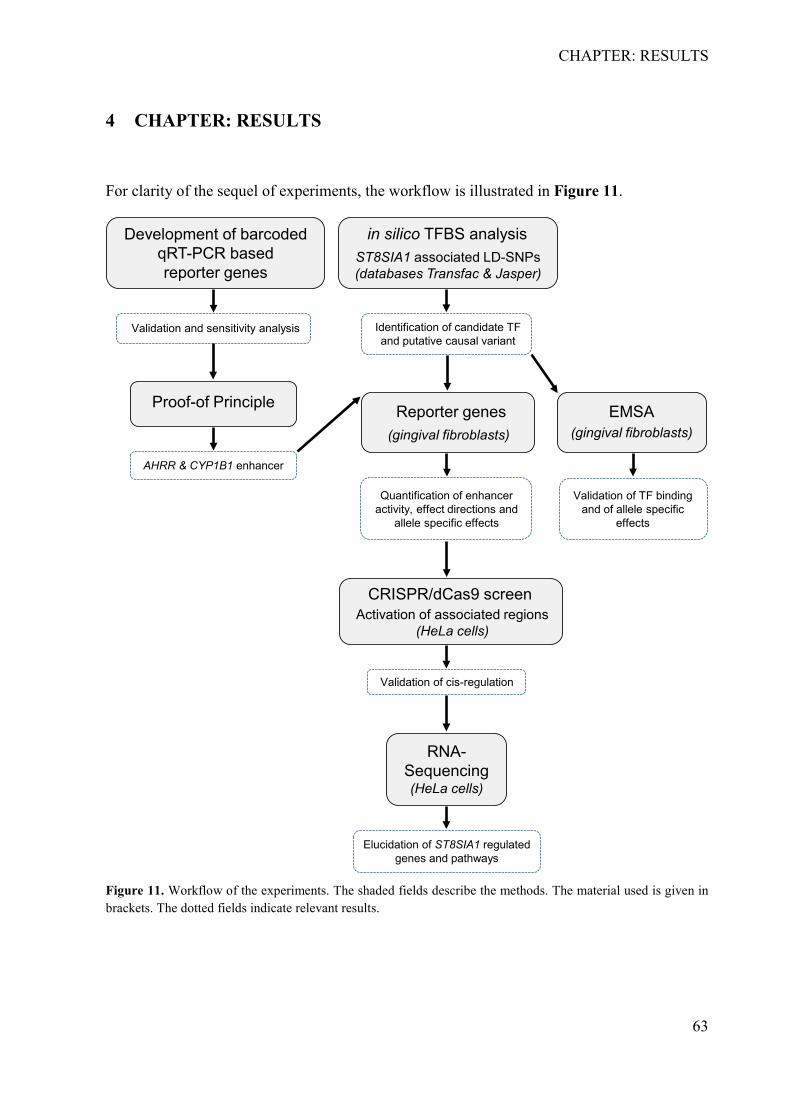
CHAPTER: RESULTS
63
4 CHAPTER: RESULTS
For clarity of the sequel of experiments, the workflow is illustrated in Figure 11.
Figure 11. Workflow of the experiments. The shaded fields describe the methods. The material used is given in brackets. The dotted fields indicate relevant results.
Validation and sensitivity analysis
Proof-of Principle
Identification of candidate TF and putative causal variant
EMSA(gingival fibroblasts)
Validation of TF bindingand of allele specific
effects
Quantification of enhanceractivity, effect directions and
allele specific effects
Reporter genes(gingival fibroblasts)
Development of barcoded qRT-PCR based reporter genes
in silico TFBS analysisST8SIA1 associated LD-SNPs (databases Transfac & Jasper)
Elucidation of ST8SIA1 regulated genes and pathways
Validation of cis-regulation
RNA-Sequencing(HeLa cells)
CRISPR/dCas9 screenActivation of associated regions
(HeLa cells)
AHRR & CYP1B1 enhancer
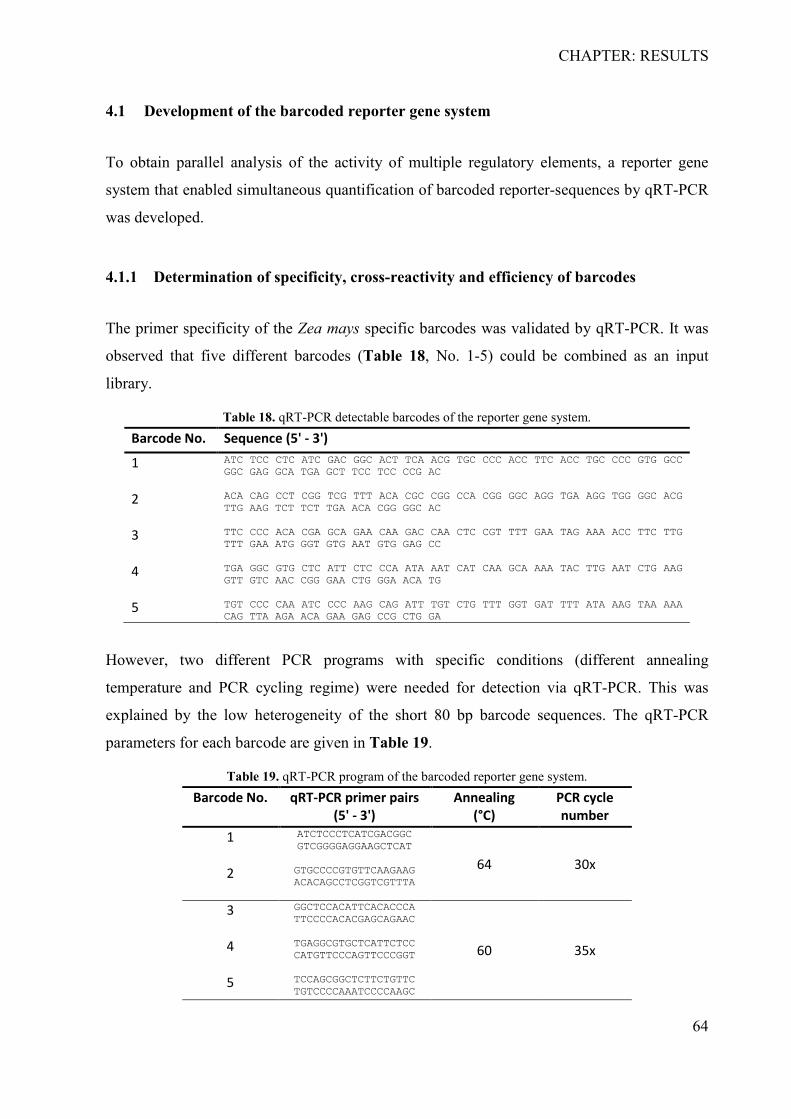
CHAPTER: RESULTS
64
4.1 Development of the barcoded reporter gene system
To obtain parallel analysis of the activity of multiple regulatory elements, a reporter gene
system that enabled simultaneous quantification of barcoded reporter-sequences by qRT-PCR
was developed.
4.1.1 Determination of specificity, cross-reactivity and efficiency of barcodes
The primer specificity of the Zea mays specific barcodes was validated by qRT-PCR. It was
observed that five different barcodes (Table 18, No. 1-5) could be combined as an input
library.
Table 18. qRT-PCR detectable barcodes of the reporter gene system. Barcode No. Sequence (5' - 3')
1 ATC TCC CTC ATC GAC GGC ACT TCA ACG TGC CCC ACC TTC ACC TGC CCC GTG GCC GGC GAG GCA TGA GCT TCC TCC CCG AC
2 ACA CAG CCT CGG TCG TTT ACA CGC CGG CCA CGG GGC AGG TGA AGG TGG GGC ACG TTG AAG TCT TCT TGA ACA CGG GGC AC
3 TTC CCC ACA CGA GCA GAA CAA GAC CAA CTC CGT TTT GAA TAG AAA ACC TTC TTG TTT GAA ATG GGT GTG AAT GTG GAG CC
4 TGA GGC GTG CTC ATT CTC CCA ATA AAT CAT CAA GCA AAA TAC TTG AAT CTG AAG GTT GTC AAC CGG GAA CTG GGA ACA TG
5 TGT CCC CAA ATC CCC AAG CAG ATT TGT CTG TTT GGT GAT TTT ATA AAG TAA AAA CAG TTA AGA ACA GAA GAG CCG CTG GA
However, two different PCR programs with specific conditions (different annealing
temperature and PCR cycling regime) were needed for detection via qRT-PCR. This was
explained by the low heterogeneity of the short 80 bp barcode sequences. The qRT-PCR
parameters for each barcode are given in Table 19.
Table 19. qRT-PCR program of the barcoded reporter gene system. Barcode No. qRT-PCR primer pairs
(5' - 3') Annealing
(°C) PCR cycle number
1 ATCTCCCTCATCGACGGC GTCGGGGAGGAAGCTCAT
64 30x 2 GTGCCCCGTGTTCAAGAAG ACACAGCCTCGGTCGTTTA
3 GGCTCCACATTCACACCCA TTCCCCACACGAGCAGAAC
60 35x 4 TGAGGCGTGCTCATTCTCC CATGTTCCCAGTTCCCGGT
5 TCCAGCGGCTCTTCTGTTC TGTCCCCAAATCCCCAAGC
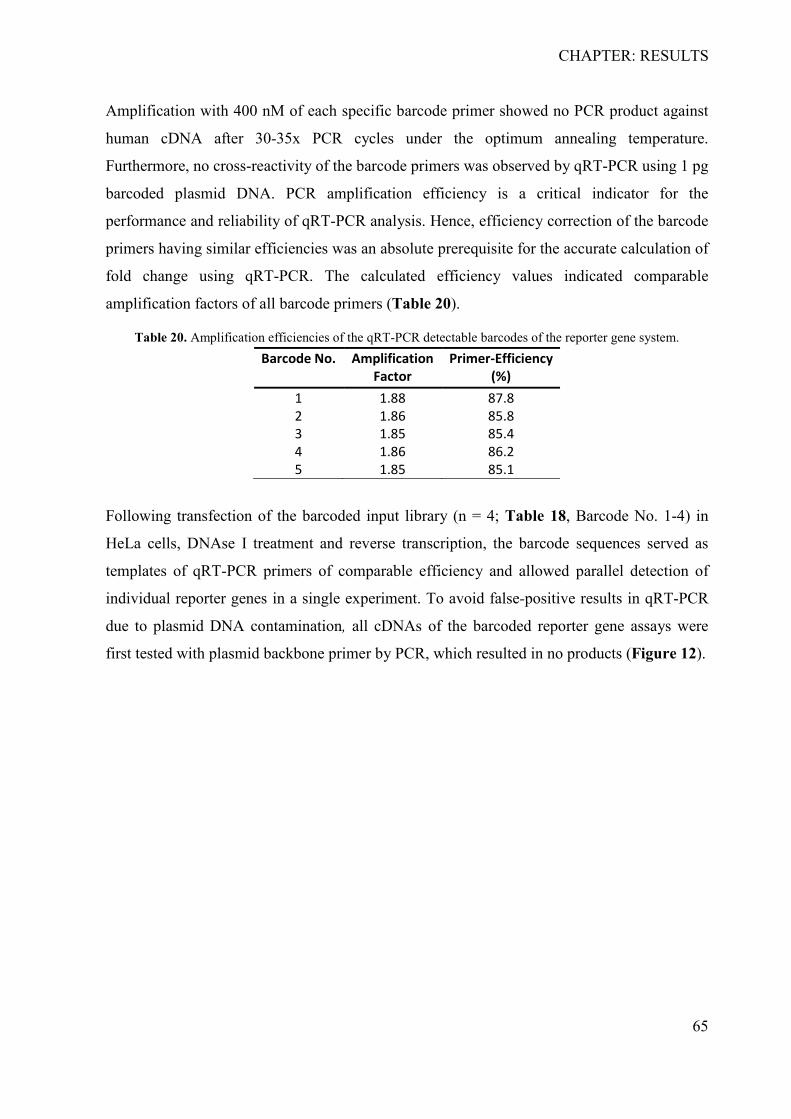
CHAPTER: RESULTS
65
Amplification with 400 nM of each specific barcode primer showed no PCR product against
human cDNA after 30-35x PCR cycles under the optimum annealing temperature.
Furthermore, no cross-reactivity of the barcode primers was observed by qRT-PCR using 1 pg
barcoded plasmid DNA. PCR amplification efficiency is a critical indicator for the
performance and reliability of qRT-PCR analysis. Hence, efficiency correction of the barcode
primers having similar efficiencies was an absolute prerequisite for the accurate calculation of
fold change using qRT-PCR. The calculated efficiency values indicated comparable
amplification factors of all barcode primers (Table 20).
Table 20. Amplification efficiencies of the qRT-PCR detectable barcodes of the reporter gene system. Barcode No. Amplification
Factor Primer-Efficiency
(%) 1 1.88 87.8 2 1.86 85.8 3 1.85 85.4 4 1.86 86.2 5 1.85 85.1
Following transfection of the barcoded input library (n = 4; Table 18, Barcode No. 1-4) in
HeLa cells, DNAse I treatment and reverse transcription, the barcode sequences served as
templates of qRT-PCR primers of comparable efficiency and allowed parallel detection of
individual reporter genes in a single experiment. To avoid false-positive results in qRT-PCR
due to plasmid DNA contamination, all cDNAs of the barcoded reporter gene assays were
first tested with plasmid backbone primer by PCR, which resulted in no products (Figure 12).
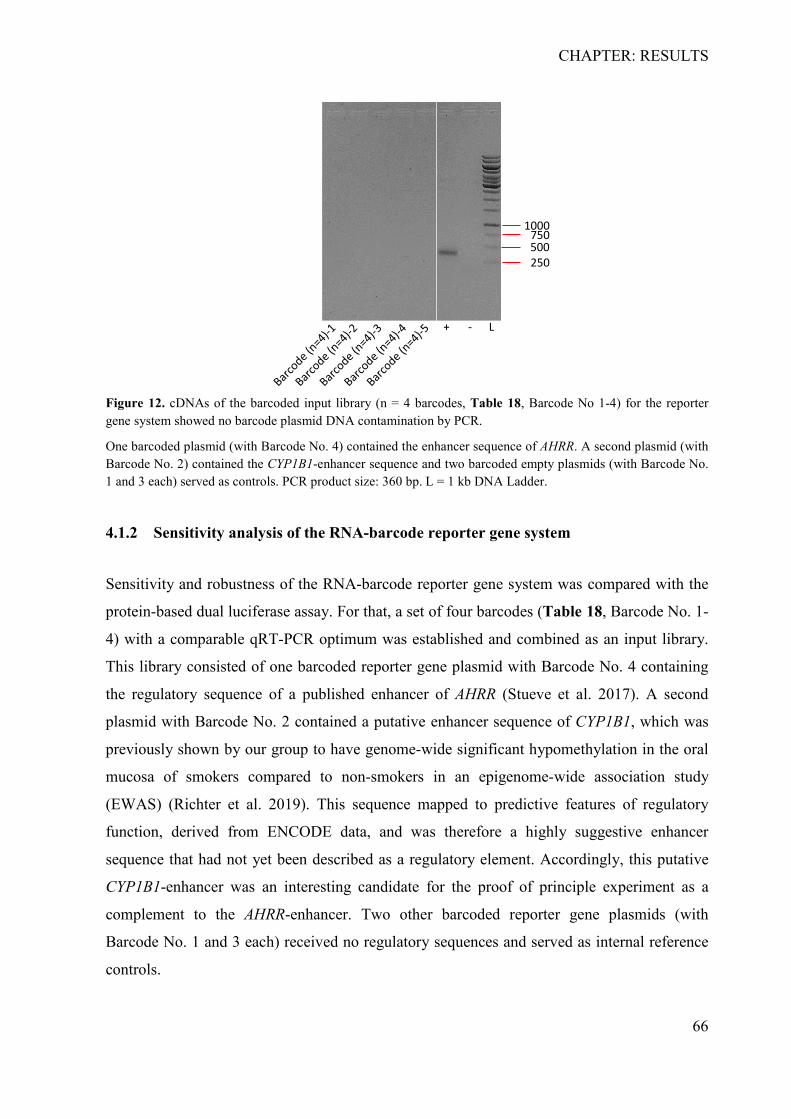
CHAPTER: RESULTS
66
Figure 12. cDNAs of the barcoded input library (n = 4 barcodes, Table 18, Barcode No 1-4) for the reporter gene system showed no barcode plasmid DNA contamination by PCR.
One barcoded plasmid (with Barcode No. 4) contained the enhancer sequence of AHRR. A second plasmid (with Barcode No. 2) contained the CYP1B1-enhancer sequence and two barcoded empty plasmids (with Barcode No. 1 and 3 each) served as controls. PCR product size: 360 bp. L = 1 kb DNA Ladder.
4.1.2 Sensitivity analysis of the RNA-barcode reporter gene system
Sensitivity and robustness of the RNA-barcode reporter gene system was compared with the
protein-based dual luciferase assay. For that, a set of four barcodes (Table 18, Barcode No. 1-
4) with a comparable qRT-PCR optimum was established and combined as an input library.
This library consisted of one barcoded reporter gene plasmid with Barcode No. 4 containing
the regulatory sequence of a published enhancer of AHRR (Stueve et al. 2017). A second
plasmid with Barcode No. 2 contained a putative enhancer sequence of CYP1B1, which was
previously shown by our group to have genome-wide significant hypomethylation in the oral
mucosa of smokers compared to non-smokers in an epigenome-wide association study
(EWAS) (Richter et al. 2019). This sequence mapped to predictive features of regulatory
function, derived from ENCODE data, and was therefore a highly suggestive enhancer
sequence that had not yet been described as a regulatory element. Accordingly, this putative
CYP1B1-enhancer was an interesting candidate for the proof of principle experiment as a
complement to the AHRR-enhancer. Two other barcoded reporter gene plasmids (with
Barcode No. 1 and 3 each) received no regulatory sequences and served as internal reference
controls.
500250
7501000
+ - L
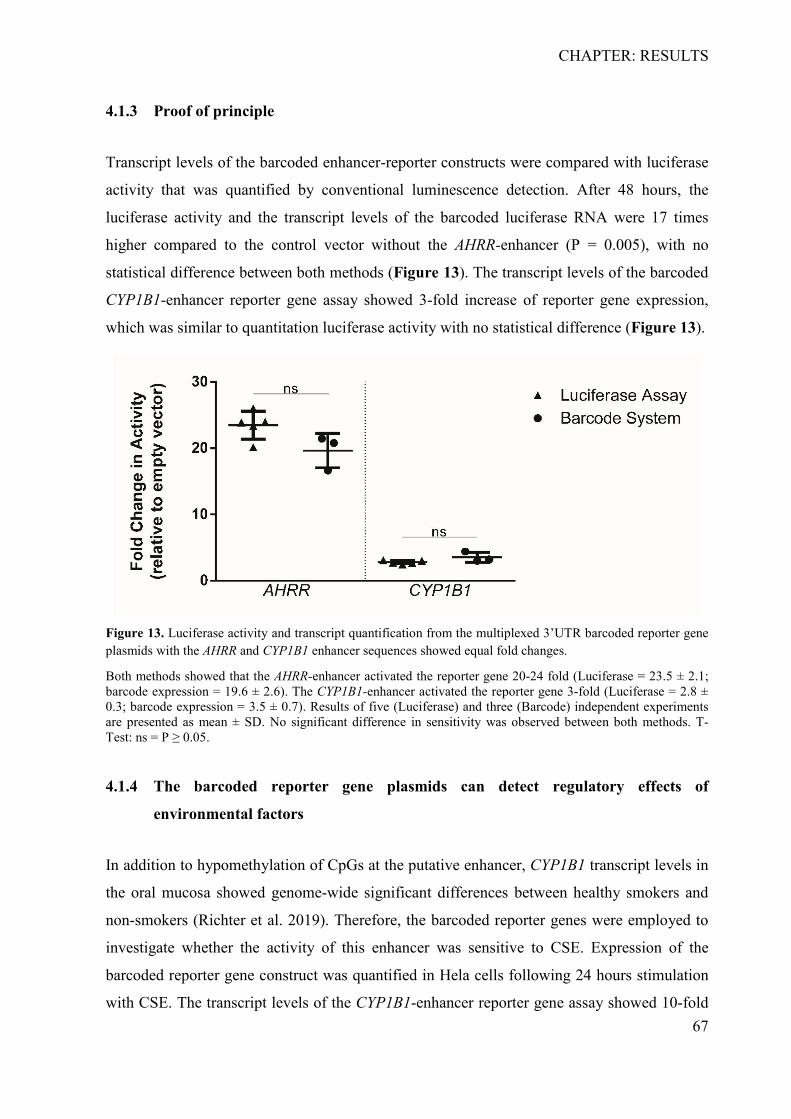
CHAPTER: RESULTS
67
4.1.3 Proof of principle
Transcript levels of the barcoded enhancer-reporter constructs were compared with luciferase
activity that was quantified by conventional luminescence detection. After 48 hours, the
luciferase activity and the transcript levels of the barcoded luciferase RNA were 17 times
higher compared to the control vector without the AHRR-enhancer (P = 0.005), with no
statistical difference between both methods (Figure 13). The transcript levels of the barcoded
CYP1B1-enhancer reporter gene assay showed 3-fold increase of reporter gene expression,
which was similar to quantitation luciferase activity with no statistical difference (Figure 13).
Figure 13. Luciferase activity and transcript quantification from the multiplexed 3’UTR barcoded reporter gene plasmids with the AHRR and CYP1B1 enhancer sequences showed equal fold changes.
Both methods showed that the AHRR-enhancer activated the reporter gene 20-24 fold (Luciferase = 23.5 ± 2.1; barcode expression = 19.6 ± 2.6). The CYP1B1-enhancer activated the reporter gene 3-fold (Luciferase = 2.8 ± 0.3; barcode expression = 3.5 ± 0.7). Results of five (Luciferase) and three (Barcode) independent experiments are presented as mean ± SD. No significant difference in sensitivity was observed between both methods. T-Test: ns = P ≥ 0.05.
4.1.4 The barcoded reporter gene plasmids can detect regulatory effects of
environmental factors
In addition to hypomethylation of CpGs at the putative enhancer, CYP1B1 transcript levels in
the oral mucosa showed genome-wide significant differences between healthy smokers and
non-smokers (Richter et al. 2019). Therefore, the barcoded reporter genes were employed to
investigate whether the activity of this enhancer was sensitive to CSE. Expression of the
barcoded reporter gene construct was quantified in Hela cells following 24 hours stimulation
with CSE. The transcript levels of the CYP1B1-enhancer reporter gene assay showed 10-fold
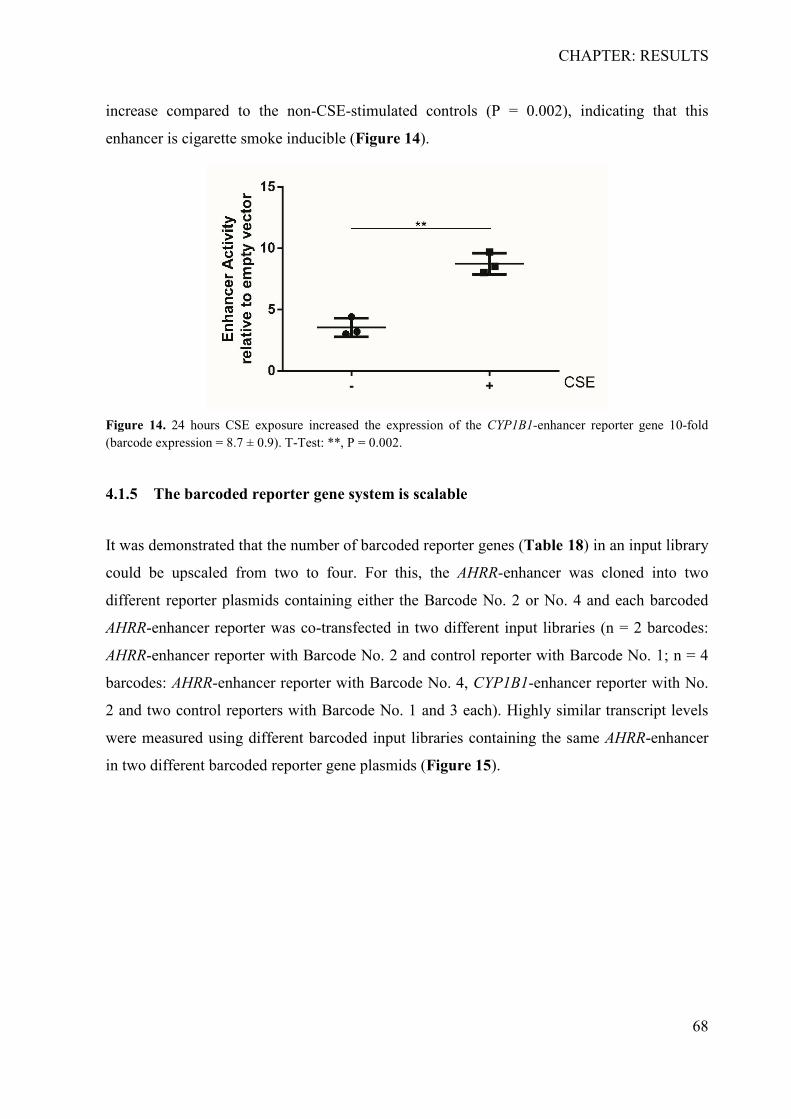
CHAPTER: RESULTS
68
increase compared to the non-CSE-stimulated controls (P = 0.002), indicating that this
enhancer is cigarette smoke inducible (Figure 14).
Figure 14. 24 hours CSE exposure increased the expression of the CYP1B1-enhancer reporter gene 10-fold (barcode expression = 8.7 ± 0.9). T-Test: **, P = 0.002.
4.1.5 The barcoded reporter gene system is scalable
It was demonstrated that the number of barcoded reporter genes (Table 18) in an input library
could be upscaled from two to four. For this, the AHRR-enhancer was cloned into two
different reporter plasmids containing either the Barcode No. 2 or No. 4 and each barcoded
AHRR-enhancer reporter was co-transfected in two different input libraries (n = 2 barcodes:
AHRR-enhancer reporter with Barcode No. 2 and control reporter with Barcode No. 1; n = 4
barcodes: AHRR-enhancer reporter with Barcode No. 4, CYP1B1-enhancer reporter with No.
2 and two control reporters with Barcode No. 1 and 3 each). Highly similar transcript levels
were measured using different barcoded input libraries containing the same AHRR-enhancer
in two different barcoded reporter gene plasmids (Figure 15).
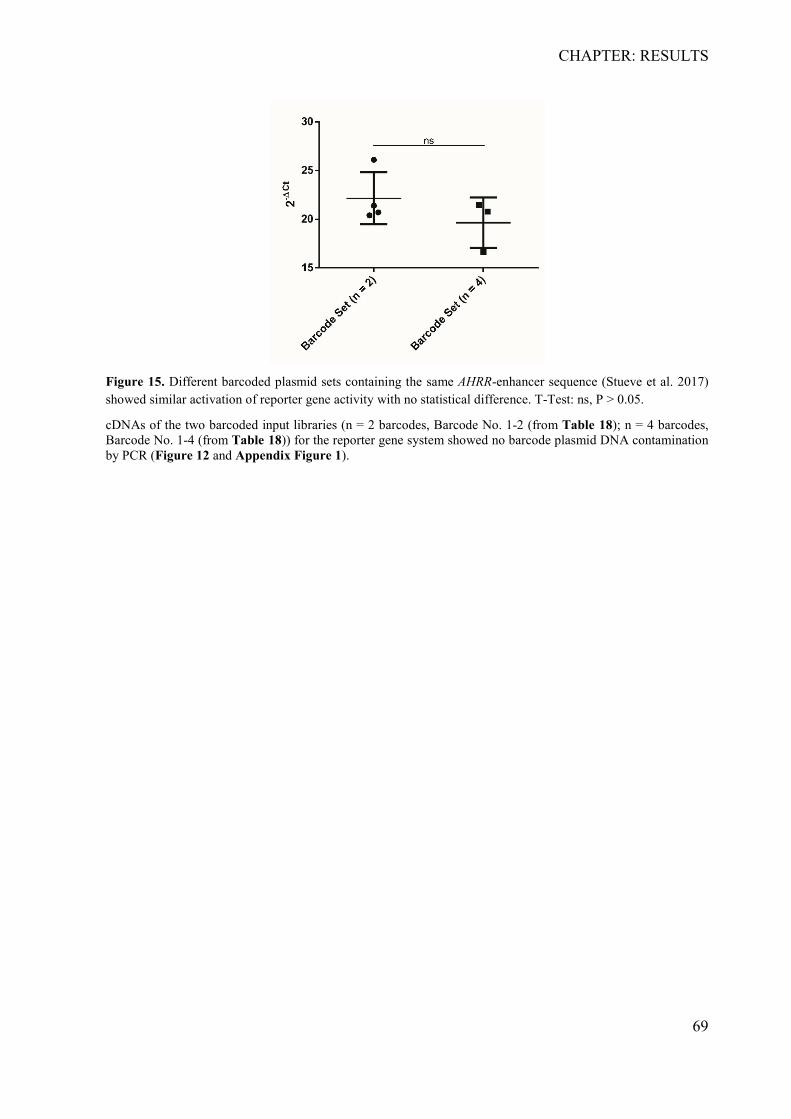
CHAPTER: RESULTS
69
Figure 15. Different barcoded plasmid sets containing the same AHRR-enhancer sequence (Stueve et al. 2017) showed similar activation of reporter gene activity with no statistical difference. T-Test: ns, P > 0.05.
cDNAs of the two barcoded input libraries (n = 2 barcodes, Barcode No. 1-2 (from Table 18); n = 4 barcodes, Barcode No. 1-4 (from Table 18)) for the reporter gene system showed no barcode plasmid DNA contamination by PCR (Figure 12 and Appendix Figure 1).
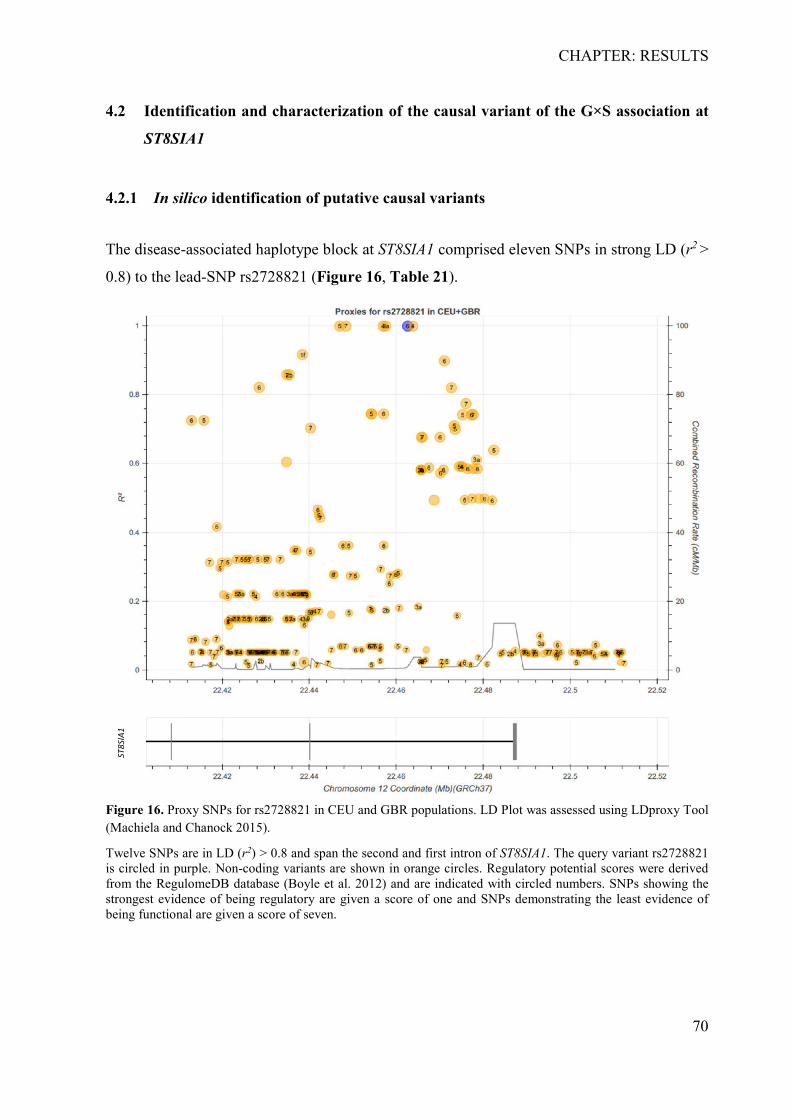
CHAPTER: RESULTS
70
4.2 Identification and characterization of the causal variant of the G×S association at
ST8SIA1
4.2.1 In silico identification of putative causal variants
The disease-associated haplotype block at ST8SIA1 comprised eleven SNPs in strong LD (r2 >
0.8) to the lead-SNP rs2728821 (Figure 16, Table 21).
Figure 16. Proxy SNPs for rs2728821 in CEU and GBR populations. LD Plot was assessed using LDproxy Tool (Machiela and Chanock 2015).
Twelve SNPs are in LD (r2) > 0.8 and span the second and first intron of ST8SIA1. The query variant rs2728821 is circled in purple. Non-coding variants are shown in orange circles. Regulatory potential scores were derived from the RegulomeDB database (Boyle et al. 2012) and are indicated with circled numbers. SNPs showing the strongest evidence of being regulatory are given a score of one and SNPs demonstrating the least evidence of being functional are given a score of seven.
ST8S
IA1
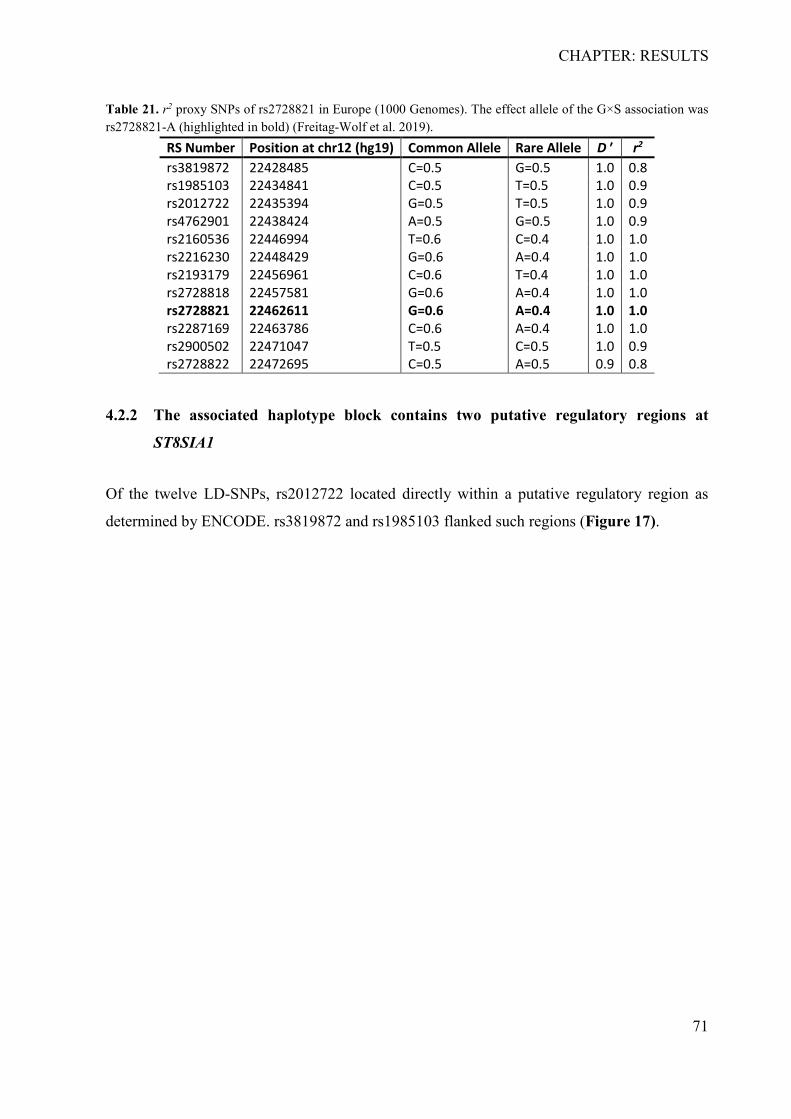
CHAPTER: RESULTS
71
Table 21. r2 proxy SNPs of rs2728821 in Europe (1000 Genomes). The effect allele of the G×S association was rs2728821-A (highlighted in bold) (Freitag-Wolf et al. 2019).
RS Number Position at chr12 (hg19) Common Allele Rare Allele D ′ r2 rs3819872 22428485 C=0.5 G=0.5 1.0 0.8 rs1985103 22434841 C=0.5 T=0.5 1.0 0.9 rs2012722 22435394 G=0.5 T=0.5 1.0 0.9 rs4762901 22438424 A=0.5 G=0.5 1.0 0.9 rs2160536 22446994 T=0.6 C=0.4 1.0 1.0 rs2216230 22448429 G=0.6 A=0.4 1.0 1.0 rs2193179 22456961 C=0.6 T=0.4 1.0 1.0 rs2728818 22457581 G=0.6 A=0.4 1.0 1.0 rs2728821 22462611 G=0.6 A=0.4 1.0 1.0 rs2287169 22463786 C=0.6 A=0.4 1.0 1.0 rs2900502 22471047 T=0.5 C=0.5 1.0 0.9 rs2728822 22472695 C=0.5 A=0.5 0.9 0.8
4.2.2 The associated haplotype block contains two putative regulatory regions at
ST8SIA1
Of the twelve LD-SNPs, rs2012722 located directly within a putative regulatory region as
determined by ENCODE. rs3819872 and rs1985103 flanked such regions (Figure 17).
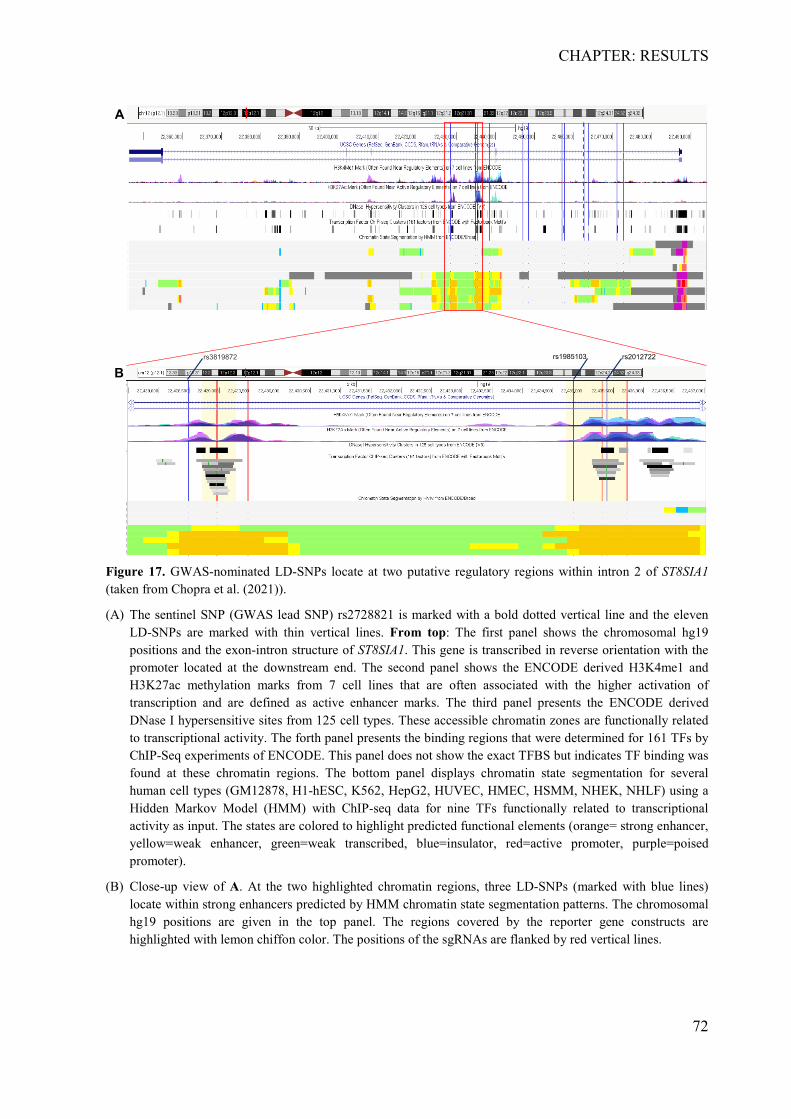
CHAPTER: RESULTS
72
Figure 17. GWAS-nominated LD-SNPs locate at two putative regulatory regions within intron 2 of ST8SIA1 (taken from Chopra et al. (2021)).
(A) The sentinel SNP (GWAS lead SNP) rs2728821 is marked with a bold dotted vertical line and the eleven LD-SNPs are marked with thin vertical lines. From top: The first panel shows the chromosomal hg19 positions and the exon-intron structure of ST8SIA1. This gene is transcribed in reverse orientation with the promoter located at the downstream end. The second panel shows the ENCODE derived H3K4me1 and H3K27ac methylation marks from 7 cell lines that are often associated with the higher activation of transcription and are defined as active enhancer marks. The third panel presents the ENCODE derived DNase I hypersensitive sites from 125 cell types. These accessible chromatin zones are functionally related to transcriptional activity. The forth panel presents the binding regions that were determined for 161 TFs by ChIP-Seq experiments of ENCODE. This panel does not show the exact TFBS but indicates TF binding was found at these chromatin regions. The bottom panel displays chromatin state segmentation for several human cell types (GM12878, H1-hESC, K562, HepG2, HUVEC, HMEC, HSMM, NHEK, NHLF) using a Hidden Markov Model (HMM) with ChIP-seq data for nine TFs functionally related to transcriptional activity as input. The states are colored to highlight predicted functional elements (orange= strong enhancer, yellow=weak enhancer, green=weak transcribed, blue=insulator, red=active promoter, purple=poised promoter).
(B) Close-up view of A. At the two highlighted chromatin regions, three LD-SNPs (marked with blue lines) locate within strong enhancers predicted by HMM chromatin state segmentation patterns. The chromosomal hg19 positions are given in the top panel. The regions covered by the reporter gene constructs are highlighted with lemon chiffon color. The positions of the sgRNAs are flanked by red vertical lines.
Brs2012722rs1985103 rs3819872
A
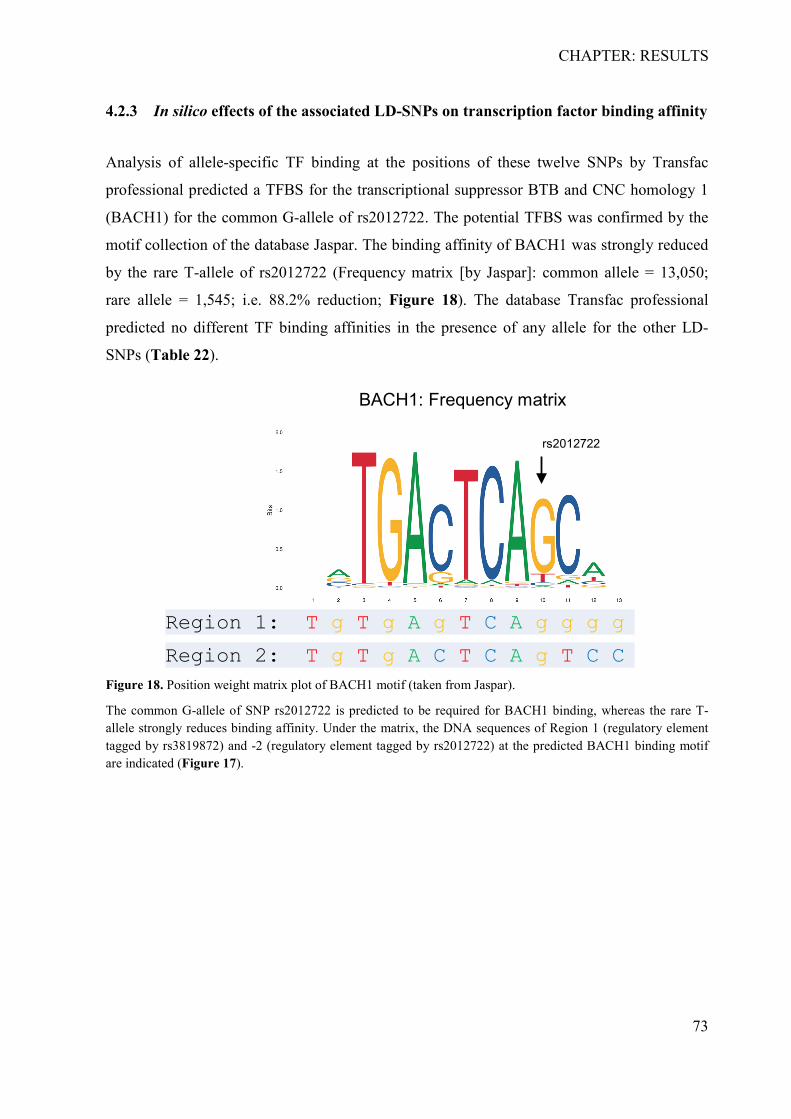
CHAPTER: RESULTS
73
4.2.3 In silico effects of the associated LD-SNPs on transcription factor binding affinity
Analysis of allele-specific TF binding at the positions of these twelve SNPs by Transfac
professional predicted a TFBS for the transcriptional suppressor BTB and CNC homology 1
(BACH1) for the common G-allele of rs2012722. The potential TFBS was confirmed by the
motif collection of the database Jaspar. The binding affinity of BACH1 was strongly reduced
by the rare T-allele of rs2012722 (Frequency matrix [by Jaspar]: common allele = 13,050;
rare allele = 1,545; i.e. 88.2% reduction; Figure 18). The database Transfac professional
predicted no different TF binding affinities in the presence of any allele for the other LD-
SNPs (Table 22).
Figure 18. Position weight matrix plot of BACH1 motif (taken from Jaspar).
The common G-allele of SNP rs2012722 is predicted to be required for BACH1 binding, whereas the rare T-allele strongly reduces binding affinity. Under the matrix, the DNA sequences of Region 1 (regulatory element tagged by rs3819872) and -2 (regulatory element tagged by rs2012722) at the predicted BACH1 binding motif are indicated (Figure 17).
BACH1: Frequency matrix
Region 1: T g T g A g T C A g g g g
Region 2: T g T g A C T C A g T C C
rs2012722
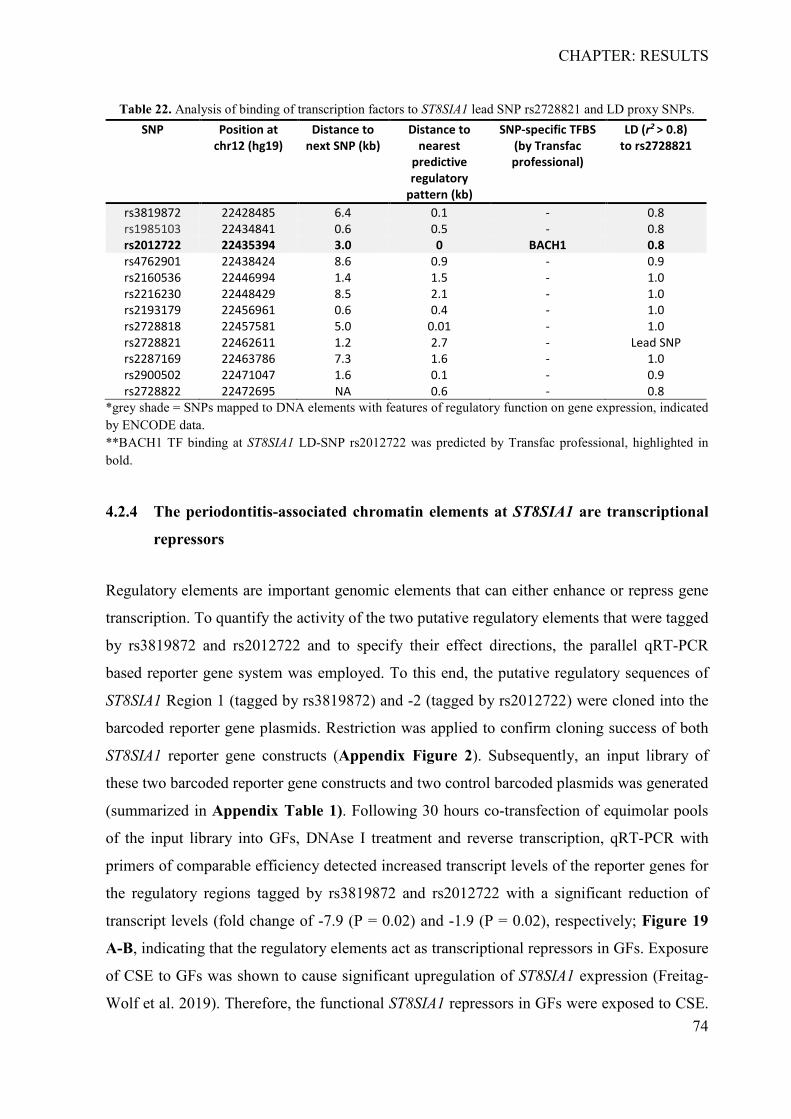
CHAPTER: RESULTS
74
Table 22. Analysis of binding of transcription factors to ST8SIA1 lead SNP rs2728821 and LD proxy SNPs. SNP Position at
chr12 (hg19) Distance to
next SNP (kb) Distance to
nearest predictive regulatory
pattern (kb)
SNP-specific TFBS (by Transfac professional)
LD (r2 > 0.8) to rs2728821
rs3819872 22428485 6.4 0.1 - 0.8 rs1985103 22434841 0.6 0.5 - 0.8 rs2012722 22435394 3.0 0 BACH1 0.8 rs4762901 22438424 8.6 0.9 - 0.9 rs2160536 22446994 1.4 1.5 - 1.0 rs2216230 22448429 8.5 2.1 - 1.0 rs2193179 22456961 0.6 0.4 - 1.0 rs2728818 22457581 5.0 0.01 - 1.0 rs2728821 22462611 1.2 2.7 - Lead SNP rs2287169 22463786 7.3 1.6 - 1.0 rs2900502 22471047 1.6 0.1 - 0.9 rs2728822 22472695 NA 0.6 - 0.8
*grey shade = SNPs mapped to DNA elements with features of regulatory function on gene expression, indicated by ENCODE data. **BACH1 TF binding at ST8SIA1 LD-SNP rs2012722 was predicted by Transfac professional, highlighted in bold.
4.2.4 The periodontitis-associated chromatin elements at ST8SIA1 are transcriptional
repressors
Regulatory elements are important genomic elements that can either enhance or repress gene
transcription. To quantify the activity of the two putative regulatory elements that were tagged
by rs3819872 and rs2012722 and to specify their effect directions, the parallel qRT-PCR
based reporter gene system was employed. To this end, the putative regulatory sequences of
ST8SIA1 Region 1 (tagged by rs3819872) and -2 (tagged by rs2012722) were cloned into the
barcoded reporter gene plasmids. Restriction was applied to confirm cloning success of both
ST8SIA1 reporter gene constructs (Appendix Figure 2). Subsequently, an input library of
these two barcoded reporter gene constructs and two control barcoded plasmids was generated
(summarized in Appendix Table 1). Following 30 hours co-transfection of equimolar pools
of the input library into GFs, DNAse I treatment and reverse transcription, qRT-PCR with
primers of comparable efficiency detected increased transcript levels of the reporter genes for
the regulatory regions tagged by rs3819872 and rs2012722 with a significant reduction of
transcript levels (fold change of -7.9 (P = 0.02) and -1.9 (P = 0.02), respectively; Figure 19
A-B, indicating that the regulatory elements act as transcriptional repressors in GFs. Exposure
of CSE to GFs was shown to cause significant upregulation of ST8SIA1 expression (Freitag-
Wolf et al. 2019). Therefore, the functional ST8SIA1 repressors in GFs were exposed to CSE.
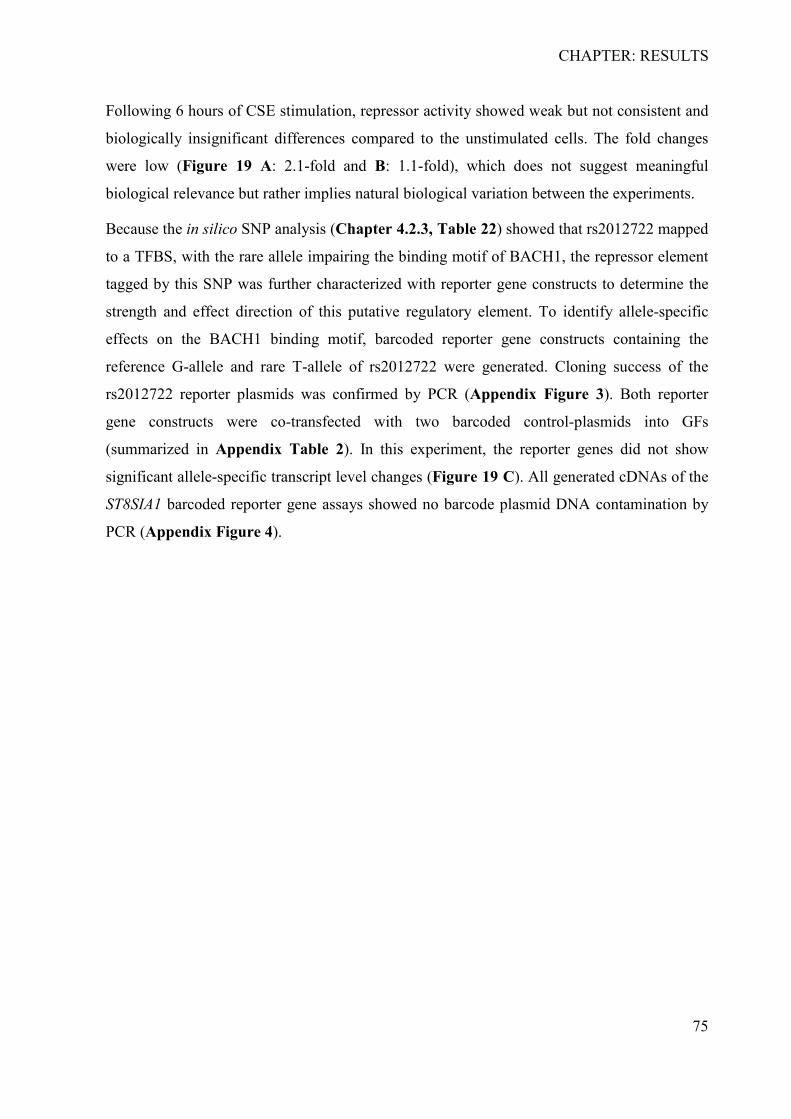
CHAPTER: RESULTS
75
Following 6 hours of CSE stimulation, repressor activity showed weak but not consistent and
biologically insignificant differences compared to the unstimulated cells. The fold changes
were low (Figure 19 A: 2.1-fold and B: 1.1-fold), which does not suggest meaningful
biological relevance but rather implies natural biological variation between the experiments.
Because the in silico SNP analysis (Chapter 4.2.3, Table 22) showed that rs2012722 mapped
to a TFBS, with the rare allele impairing the binding motif of BACH1, the repressor element
tagged by this SNP was further characterized with reporter gene constructs to determine the
strength and effect direction of this putative regulatory element. To identify allele-specific
effects on the BACH1 binding motif, barcoded reporter gene constructs containing the
reference G-allele and rare T-allele of rs2012722 were generated. Cloning success of the
rs2012722 reporter plasmids was confirmed by PCR (Appendix Figure 3). Both reporter
gene constructs were co-transfected with two barcoded control-plasmids into GFs
(summarized in Appendix Table 2). In this experiment, the reporter genes did not show
significant allele-specific transcript level changes (Figure 19 C). All generated cDNAs of the
ST8SIA1 barcoded reporter gene assays showed no barcode plasmid DNA contamination by
PCR (Appendix Figure 4).
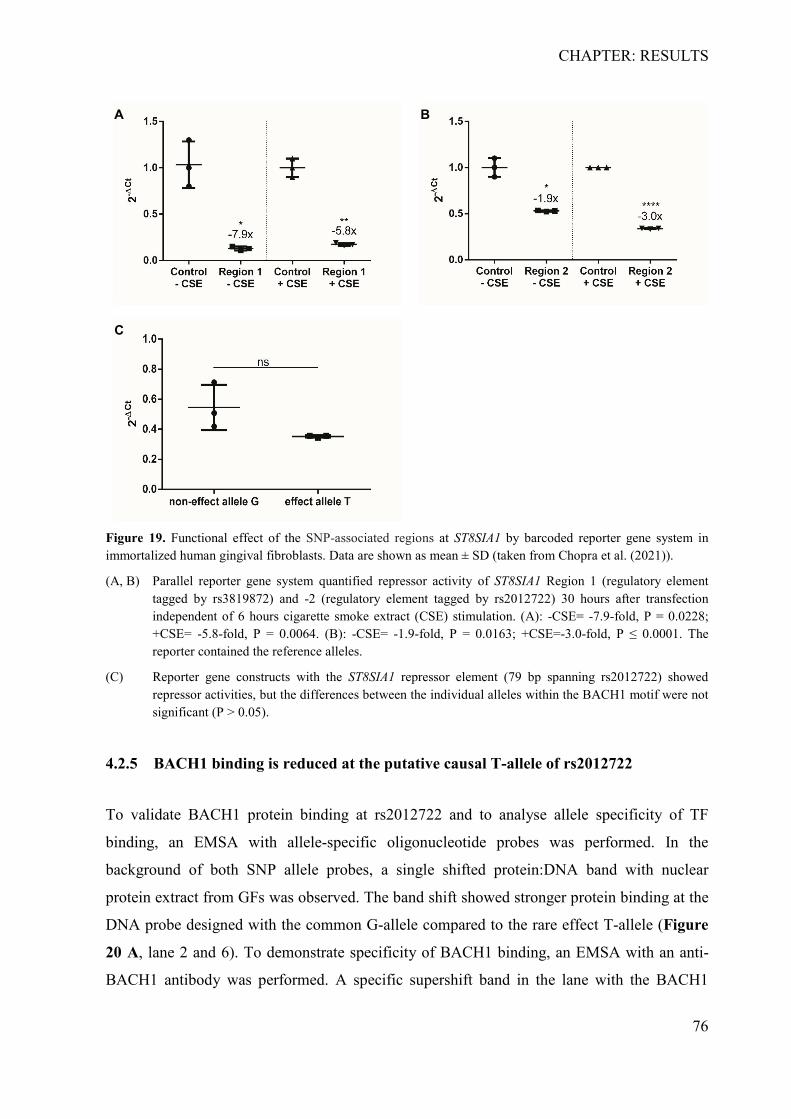
CHAPTER: RESULTS
76
Figure 19. Functional effect of the SNP-associated regions at ST8SIA1 by barcoded reporter gene system in immortalized human gingival fibroblasts. Data are shown as mean ± SD (taken from Chopra et al. (2021)).
(A, B) Parallel reporter gene system quantified repressor activity of ST8SIA1 Region 1 (regulatory element tagged by rs3819872) and -2 (regulatory element tagged by rs2012722) 30 hours after transfection independent of 6 hours cigarette smoke extract (CSE) stimulation. (A): -CSE= -7.9-fold, P = 0.0228; +CSE= -5.8-fold, P = 0.0064. (B): -CSE= -1.9-fold, P = 0.0163; +CSE=-3.0-fold, P ≤ 0.0001. The reporter contained the reference alleles.
(C) Reporter gene constructs with the ST8SIA1 repressor element (79 bp spanning rs2012722) showed repressor activities, but the differences between the individual alleles within the BACH1 motif were not significant (P > 0.05).
4.2.5 BACH1 binding is reduced at the putative causal T-allele of rs2012722
To validate BACH1 protein binding at rs2012722 and to analyse allele specificity of TF
binding, an EMSA with allele-specific oligonucleotide probes was performed. In the
background of both SNP allele probes, a single shifted protein:DNA band with nuclear
protein extract from GFs was observed. The band shift showed stronger protein binding at the
DNA probe designed with the common G-allele compared to the rare effect T-allele (Figure
20 A, lane 2 and 6). To demonstrate specificity of BACH1 binding, an EMSA with an anti-
BACH1 antibody was performed. A specific supershift band in the lane with the BACH1
A
C
B
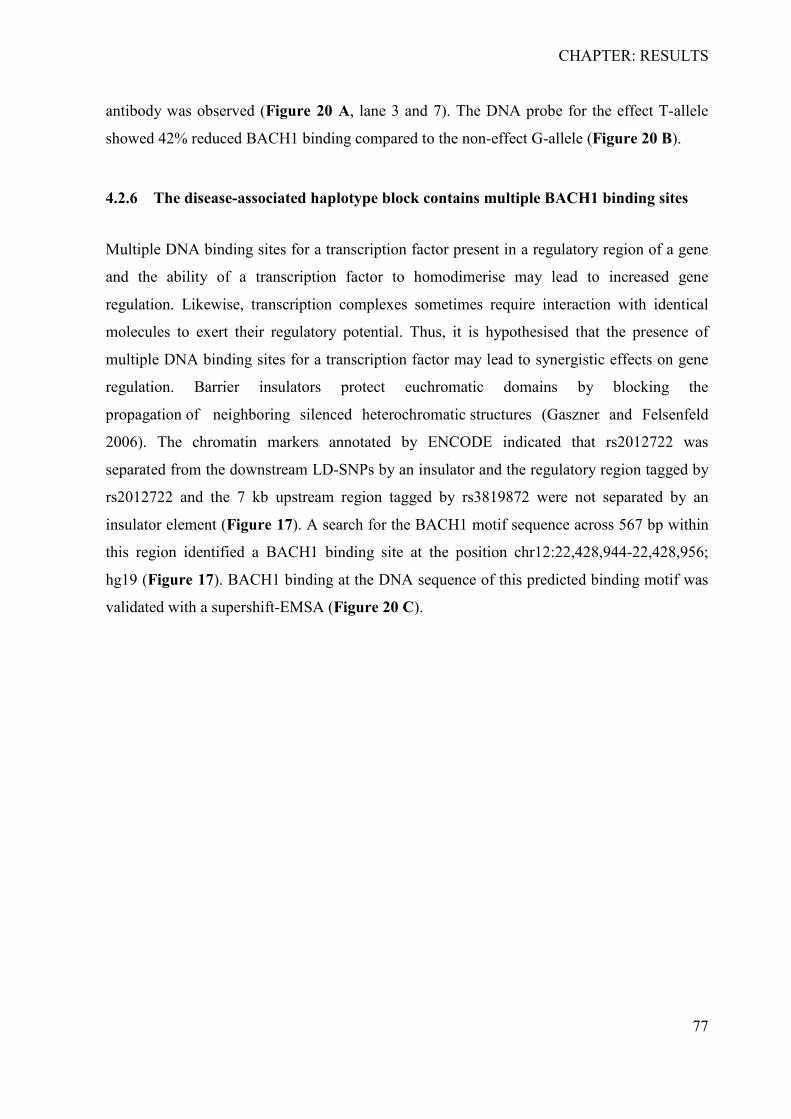
CHAPTER: RESULTS
77
antibody was observed (Figure 20 A, lane 3 and 7). The DNA probe for the effect T-allele
showed 42% reduced BACH1 binding compared to the non-effect G-allele (Figure 20 B).
4.2.6 The disease-associated haplotype block contains multiple BACH1 binding sites
Multiple DNA binding sites for a transcription factor present in a regulatory region of a gene
and the ability of a transcription factor to homodimerise may lead to increased gene
regulation. Likewise, transcription complexes sometimes require interaction with identical
molecules to exert their regulatory potential. Thus, it is hypothesised that the presence of
multiple DNA binding sites for a transcription factor may lead to synergistic effects on gene
regulation. Barrier insulators protect euchromatic domains by blocking the
propagation of neighboring silenced heterochromatic structures (Gaszner and Felsenfeld
2006). The chromatin markers annotated by ENCODE indicated that rs2012722 was
separated from the downstream LD-SNPs by an insulator and the regulatory region tagged by
rs2012722 and the 7 kb upstream region tagged by rs3819872 were not separated by an
insulator element (Figure 17). A search for the BACH1 motif sequence across 567 bp within
this region identified a BACH1 binding site at the position chr12:22,428,944-22,428,956;
hg19 (Figure 17). BACH1 binding at the DNA sequence of this predicted binding motif was
validated with a supershift-EMSA (Figure 20 C).
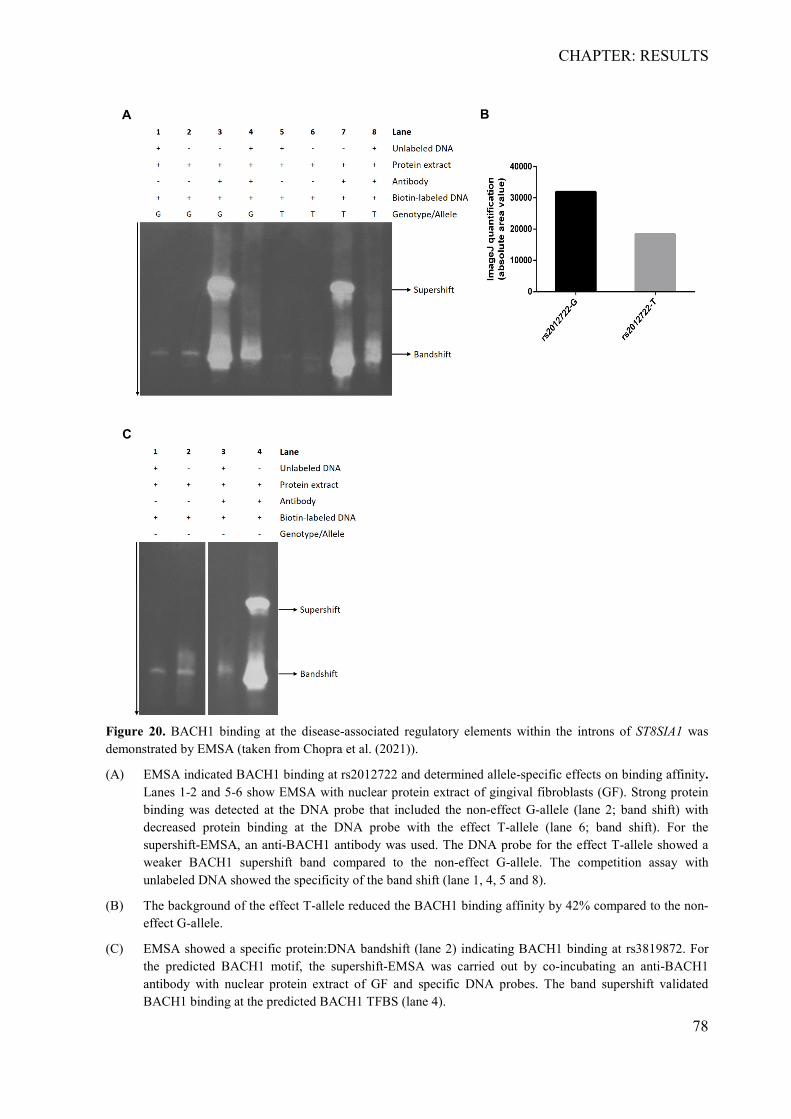
CHAPTER: RESULTS
78
Figure 20. BACH1 binding at the disease-associated regulatory elements within the introns of ST8SIA1 was demonstrated by EMSA (taken from Chopra et al. (2021)).
(A) EMSA indicated BACH1 binding at rs2012722 and determined allele-specific effects on binding affinity. Lanes 1-2 and 5-6 show EMSA with nuclear protein extract of gingival fibroblasts (GF). Strong protein binding was detected at the DNA probe that included the non-effect G-allele (lane 2; band shift) with decreased protein binding at the DNA probe with the effect T-allele (lane 6; band shift). For the supershift-EMSA, an anti-BACH1 antibody was used. The DNA probe for the effect T-allele showed a weaker BACH1 supershift band compared to the non-effect G-allele. The competition assay with unlabeled DNA showed the specificity of the band shift (lane 1, 4, 5 and 8).
(B) The background of the effect T-allele reduced the BACH1 binding affinity by 42% compared to the non-effect G-allele.
(C) EMSA showed a specific protein:DNA bandshift (lane 2) indicating BACH1 binding at rs3819872. For the predicted BACH1 motif, the supershift-EMSA was carried out by co-incubating an anti-BACH1 antibody with nuclear protein extract of GF and specific DNA probes. The band supershift validated BACH1 binding at the predicted BACH1 TFBS (lane 4).
A B
C
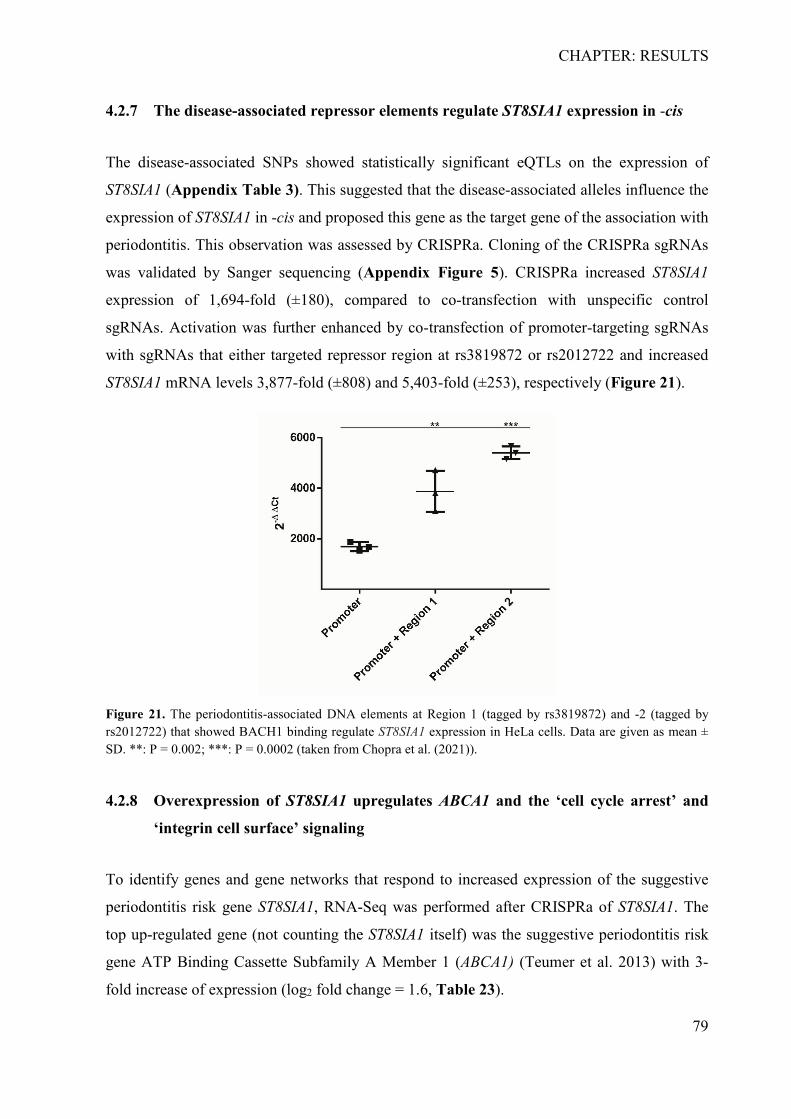
CHAPTER: RESULTS
79
4.2.7 The disease-associated repressor elements regulate ST8SIA1 expression in -cis
The disease-associated SNPs showed statistically significant eQTLs on the expression of
ST8SIA1 (Appendix Table 3). This suggested that the disease-associated alleles influence the
expression of ST8SIA1 in -cis and proposed this gene as the target gene of the association with
periodontitis. This observation was assessed by CRISPRa. Cloning of the CRISPRa sgRNAs
was validated by Sanger sequencing (Appendix Figure 5). CRISPRa increased ST8SIA1
expression of 1,694-fold (±180), compared to co-transfection with unspecific control
sgRNAs. Activation was further enhanced by co-transfection of promoter-targeting sgRNAs
with sgRNAs that either targeted repressor region at rs3819872 or rs2012722 and increased
ST8SIA1 mRNA levels 3,877-fold (±808) and 5,403-fold (±253), respectively (Figure 21).
Figure 21. The periodontitis-associated DNA elements at Region 1 (tagged by rs3819872) and -2 (tagged by rs2012722) that showed BACH1 binding regulate ST8SIA1 expression in HeLa cells. Data are given as mean ± SD. **: P = 0.002; ***: P = 0.0002 (taken from Chopra et al. (2021)).
4.2.8 Overexpression of ST8SIA1 upregulates ABCA1 and the ‘cell cycle arrest’ and
‘integrin cell surface’ signaling
To identify genes and gene networks that respond to increased expression of the suggestive
periodontitis risk gene ST8SIA1, RNA-Seq was performed after CRISPRa of ST8SIA1. The
top up-regulated gene (not counting the ST8SIA1 itself) was the suggestive periodontitis risk
gene ATP Binding Cassette Subfamily A Member 1 (ABCA1) (Teumer et al. 2013) with 3-
fold increase of expression (log2 fold change = 1.6, Table 23).
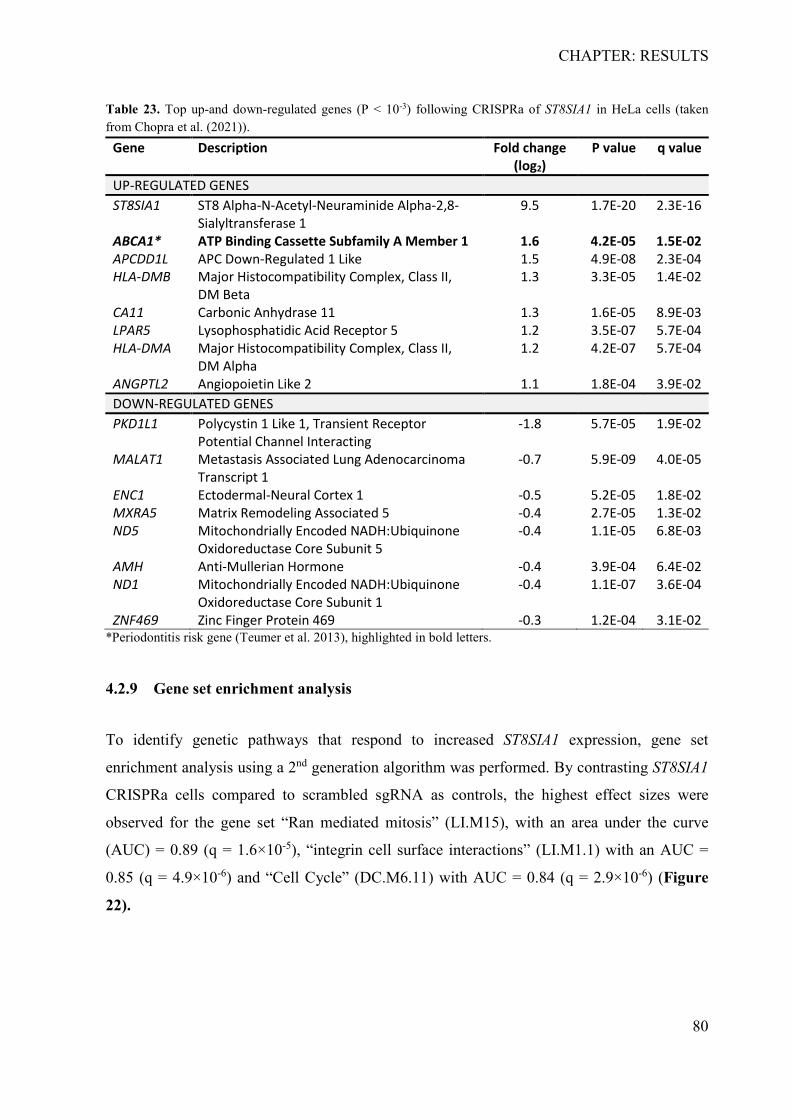
CHAPTER: RESULTS
80
Table 23. Top up-and down-regulated genes (P < 10-3) following CRISPRa of ST8SIA1 in HeLa cells (taken from Chopra et al. (2021)).
Gene Description Fold change (log2)
P value q value
UP-REGULATED GENES ST8SIA1 ST8 Alpha-N-Acetyl-Neuraminide Alpha-2,8-
Sialyltransferase 1 9.5 1.7E-20 2.3E-16
ABCA1* ATP Binding Cassette Subfamily A Member 1 1.6 4.2E-05 1.5E-02 APCDD1L APC Down-Regulated 1 Like 1.5 4.9E-08 2.3E-04 HLA-DMB Major Histocompatibility Complex, Class II,
DM Beta 1.3 3.3E-05 1.4E-02
CA11 Carbonic Anhydrase 11 1.3 1.6E-05 8.9E-03 LPAR5 Lysophosphatidic Acid Receptor 5 1.2 3.5E-07 5.7E-04 HLA-DMA Major Histocompatibility Complex, Class II,
DM Alpha 1.2 4.2E-07 5.7E-04
ANGPTL2 Angiopoietin Like 2 1.1 1.8E-04 3.9E-02 DOWN-REGULATED GENES PKD1L1 Polycystin 1 Like 1, Transient Receptor
Potential Channel Interacting -1.8 5.7E-05 1.9E-02
MALAT1 Metastasis Associated Lung Adenocarcinoma Transcript 1
-0.7 5.9E-09 4.0E-05
ENC1 Ectodermal-Neural Cortex 1 -0.5 5.2E-05 1.8E-02 MXRA5 Matrix Remodeling Associated 5 -0.4 2.7E-05 1.3E-02 ND5 Mitochondrially Encoded NADH:Ubiquinone
Oxidoreductase Core Subunit 5 -0.4 1.1E-05 6.8E-03
AMH Anti-Mullerian Hormone -0.4 3.9E-04 6.4E-02 ND1 Mitochondrially Encoded NADH:Ubiquinone
Oxidoreductase Core Subunit 1 -0.4 1.1E-07 3.6E-04
ZNF469 Zinc Finger Protein 469 -0.3 1.2E-04 3.1E-02 *Periodontitis risk gene (Teumer et al. 2013), highlighted in bold letters.
4.2.9 Gene set enrichment analysis
To identify genetic pathways that respond to increased ST8SIA1 expression, gene set
enrichment analysis using a 2nd generation algorithm was performed. By contrasting ST8SIA1
CRISPRa cells compared to scrambled sgRNA as controls, the highest effect sizes were
observed for the gene set “Ran mediated mitosis” (LI.M15), with an area under the curve
(AUC) = 0.89 (q = 1.6×10⁻⁵), “integrin cell surface interactions” (LI.M1.1) with an AUC =
0.85 (q = 4.9×10⁻⁶) and “Cell Cycle” (DC.M6.11) with AUC = 0.84 (q = 2.9×10⁻⁶) (Figure
22).
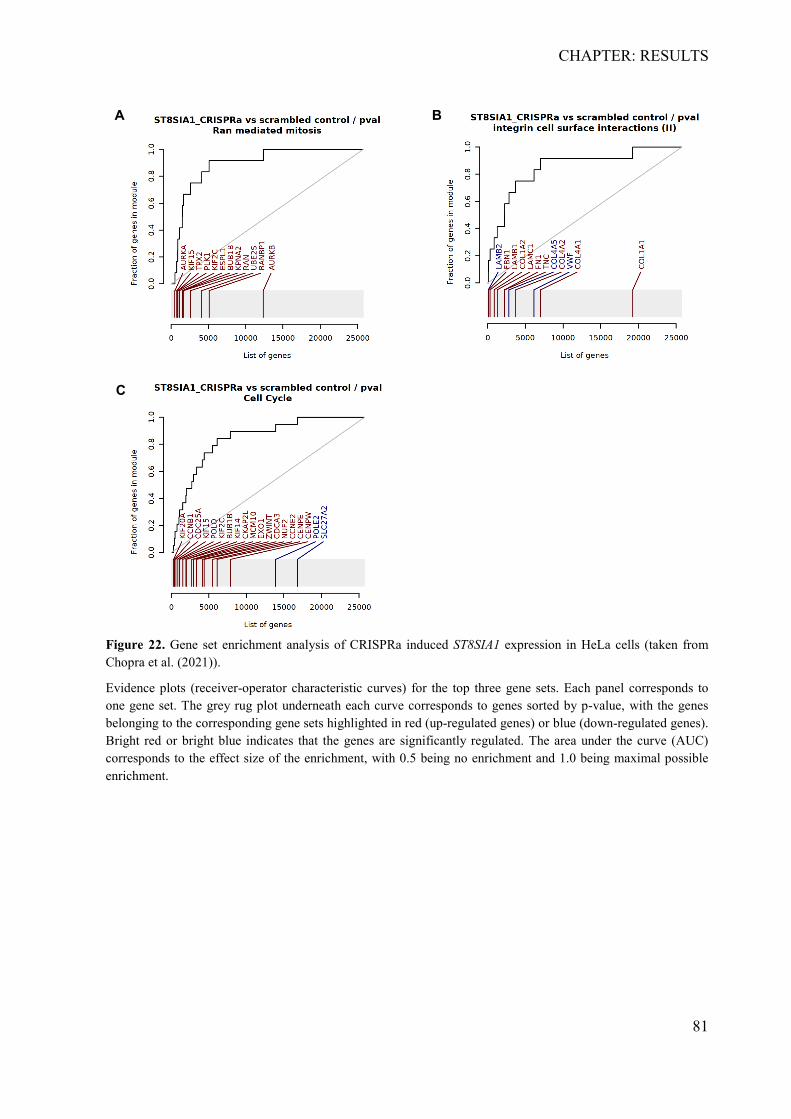
CHAPTER: RESULTS
81
Figure 22. Gene set enrichment analysis of CRISPRa induced ST8SIA1 expression in HeLa cells (taken from Chopra et al. (2021)).
Evidence plots (receiver-operator characteristic curves) for the top three gene sets. Each panel corresponds to one gene set. The grey rug plot underneath each curve corresponds to genes sorted by p-value, with the genes belonging to the corresponding gene sets highlighted in red (up-regulated genes) or blue (down-regulated genes). Bright red or bright blue indicates that the genes are significantly regulated. The area under the curve (AUC) corresponds to the effect size of the enrichment, with 0.5 being no enrichment and 1.0 being maximal possible enrichment.
A
C
B
CHAPTER: DISCUSSION
82
5 CHAPTER: DISCUSSION
In this thesis, a novel parallel reporter gene system was introduced. To quantify reporter gene
activity, this innovative system was based on qRT-PCR as an alternative to next generation
sequencing (NGS), which current MPRAs approaches use. This system may be advantageous
for many laboratories who have no direct access to an NGS and bioinformatics platform but
have interest in validating predicted regulatory elements. To prove the sensitivity of the
mRNA-based reporter gene system, it was compared to the established protein-based dual
luciferase reporter system that quantifies regulator activity with firefly luminescence.
Quantification of reporter activity of a known enhancer that regulates the activity of the gene
AHRR and of a predicted enhancer at the gene CYP1B1 showed no statistical differences in
the sensitivity between both methods. These data demonstrated the efficiency of the novel
reporter gene system. An advantage of the qRT-PCR based system compared to luminescence
detection is the scalability, allowing the parallel analysis of a precise number of multiple
candidate regulators in a time efficient way. Parallel quantification of the activity of multiple
regulatory elements would also be advantageous, if it were of interest to compare different
regulatory elements in response to an external factor. This is, because the activities of
multiple regulators are quantified in the same biological experiment, which excludes the risk
of confounding by technical and biological variation of independent experiments. An
advantage compared to MPRAs, apart from the lower costs in terms of time and funding, as
well as the simplicity of the method, is the higher sensitivity. For high-throughput MPRAs,
the positives that are correctly identified was estimated to 34-68%, corresponding to > 13 to 1
2
of the library not detected due to a low abundance of the plasmids in the pool (Tewhey et al.
2016). However, the qRT-PCR based method presented here requires complete removal of
DNA by rigorous DNAse treatment prior to RNA extraction and cDNA synthesis, which
complicates the method by increasing the risk of RNA degradation. In conclusion, a
practicable scalable parallel reporter gene system that requires not more than standard
laboratory infrastructure and has the same sensitivity as the luciferase-based reporter gene
assays was developed.
Another major objective of this thesis was to leverage biological meaning to a statistical
association of a haplotype block at the gene ST8SIA1 that was suggested to increase the risk
for the oral inflammatory disease periodontitis in smokers (Freitag-Wolf et al. 2019). An in
CHAPTER: DISCUSSION
83
silico TFBS for the transcriptional repressor BACH1 at the associated ST8SIA1 SNP
rs2012722 was identified and evidence for an allele-specific effect on the TF binding affinity
was demonstrated using a BACH1 antibody in a supershift-EMSA. It could be shown that
BACH1 binding was significantly impaired by the rare T-allele of rs2012722, indicating this
SNP as a causal variant of the association with periodontitis. To discriminate the effect
direction of the two predicted associated regulatory elements at ST8SIA1, the barcoded
reporter gene system was applied. These experiments showed significant reduction of reporter
gene activity for both BACH1 binding elements. However, unlike the supershift-EMSA with
the BACH1 antibody, the qRT-PCR based reporter genes did not show allele-specific
transcriptional effects of rs2012722 in GFs. This result could suggest that the effect size of the
causal T-allele of rs2012722 was below the level of detection. A detection limit below the
high sensitivity of a supershift-EMSA might be an inherent property of the barcoded reporter
gene system. Regardless of this, it could also be due to the different length of the DNA
probes. The DNA probe for the EMSA was 43 bp in length, whereas the sequences of the
reporter gene assays comprised 79 bp. It is likely that the effect of the causal T-allele on
BACH1 binding could not be measured via the reporter gene assay because the reduced
binding affinity conferred by the risk allele was compensated by additional TFs that may bind
at this larger DNA element compared to the EMSA probe, stabilizing BACH1 binding. In
conclusion, supershift-EMSA with the short DNA probe was better able to demonstrate allele-
specific effect of the putative causal T-allele of rs2012722, but the sensitivity of the barcoded
reporter gene system was adequate to identify the directional effect of the regulators.
BACH1 binding at the putative causative variant implies a functional role of BACH1 in the
regulation of ST8SIA1 with putative causality for the association with periodontitis in
smokers. BACH1 is widely expressed in several different tissue types and functions primarily
as a transcriptional repressor. It regulates genes involved in apoptosis, the oxidative stress
response, mitotic chromatin dynamics, and the cell-cycle progression (Wang et al. 2016).
BACH1 also impairs cell proliferation and promotes apoptosis by disrupting the Wnt/β-
catenin signaling pathway (Zhang et al. 2018). Based on these known functions, BACH1 is a
plausible TF for being involved in the etiology of periodontitis. However, the in vitro EMSA
only confirmed BACH1 binding at the predicted BACH1 motif. Nevertheless, this does not
prove in vivo binding of BACH1 at that motif within the context of the native chromatin.
Demonstrating that BACH1 binds at the specific chromatin region tagged by rs2012722 in
vivo required capturing BACH1 bound to that motif in the native chromatin within the cellular
CHAPTER: DISCUSSION
84
context. This can be achieved by chromatin immunoprecipitation followed by sequencing
(ChIP-Seq). It allows to investigate DNA-protein interactions in vivo by crosslinking TFs at
the sites of their binding to DNA in order to stabilize the interactions for downstream
detection, e.g. by direct sequencing of the DNA fragments captured by
the immunoprecipitated protein. However, conventional ChIP technologies typically involve
several preamplification steps (i.e. cross-linking, lysis, fragmentation, immunoprecipitation,
end repair, and adapter ligation), which need to be adjusted to the studies’ properties.
Consequently, many technical optimizations are necessary to obtain high-quality, unbiased
and reasonable data (Dainese et al. 2020). One limitation is the need of a ChIP-grade antibody
that can affect the quality of the obtained results. The major limitation of ChIP technologies is
that genomic interactions are considered as qualitative, rather than quantitative, despite their
dynamic nature (Nakato and Sakata 2020). The presence and concentration of each locus-
specific protein−DNA interaction in each cell is highly time-dependent on the binding
constants. Thereby, the capture and detection of TF binding is problematic because it cannot
be determined whether the time point at which the TF binds to the DNA is always present
during cross-linking. Accordingly, a negative ChIP result would not be an evidence that the
specific TF does not bind the cognate DNA. Therefore, to exclude false-negative results, the
EMSA was applied to verify whether BACH1 was present in the cell extract and was actually
bound to the specific DNA sequence.
Using CRISPRa, it was shown that the repressor elements that bind BACH1 directly regulate
ST8SIA1 expression, implying ST8SIA1 as a target gene of the association. ST8SIA1, also
referred to as GD3 synthase, is a membrane protein involved in the production of gangliosides
(GD). These are sialic acid-containing glycosphingolipids enriched on cell surfaces that play
important roles in cell signaling and cell-to-cell communication (Ramos et al. 2020; Sipione
et al. 2020). ST8SIA1 is the key enzyme for GD3 expression, which has a special role in cell
adhesion and growth (Sasaki et al. 1994). In the performed RNA-Seq experiments following
endogenous ST8SIA1 activation by CRISPRa, the gene sets with the highest significant effect
sizes were ‘Mitosis’, ‘Integrin Cell Surface Interactions’ and ‘Cell Cycle’. These findings
were concordant with another study, in which overexpression of ST8SIA1 in pancreatic cancer
cells induced disruption of integrin-mediated cell adhesion with extracellular matrix proteins
and cell cycle arrest as well as enhanced apoptosis (Mandal et al. 2014). Taken together, these
findings imply a function of ST8SIA1 in regulation of integrin-mediated cell adhesion in
formation and remodeling of ECM. Although the CRISPRa experiments were developed in
CHAPTER: DISCUSSION
85
HeLa cells instead of gingival cells, the RNA-Seq findings were similar to the reported
functions of ST8SIA1, indicating validity of the results. HeLa cells were used for these
experiments, because after transfection of the CRISPRa plasmids into GFs the cell survival
rate was less than 10%, probably because of DNA toxicity. In contrast, HeLa cells that are
highly malignant, showed high survival after transfection of the CRISPRa system. It is
possible that the considerable malignancy provided resistance to the toxic effects of the
transfection. In general, functional enhancer studies are limited to the subset of enhancers that
are active in the particular cellular context being studied. However, Simeonov et al. (2017)
showed that recruitment of a strong transcriptional activator to an enhancer using CRISPRa is
sufficient to drive target gene expression, even if that enhancer was not currently active in the
assayed cells. Thus, HeLa cells were considered as an appropriate cell model for the
performed CRISPRa experiments.
The G×S association identified risk alleles of the associated haplotype block at ST8SIA1 that
increased the risk of periodontitis in smokers. Correspondingly, ST8SIA1 showed strong
upregulation in GFs upon exposure to CSE in vitro (Freitag-Wolf et al. 2019). Therefore, this
made it an interesting candidate gene because, on a molecular level, it might link the
susceptibility to periodontitis with the deleterious effects of tobacco smoke. However, CSE
exposure had no significant effect on the activity of the reporter gene construct that included
the sequence at the rs2012722 BACH1 binding site. This implies that the effects of tobacco
smoking on ST8SIA1 expression are independent of the effects of the risk T-allele of
rs2012722. In this case, the effects of smoking and of the risk T-allele to unlock ST8SIA1
repression would be additive.
In the context of the function of ST8SIA1 indicated by the RNA-Seq data, dysregulation of
ST8SIA1 by tobacco smoke exposure could impair gingival tissue integrity and wound healing
(Mandal et al. 2014). For example, CSE exposure to GFs induced significant inhibition of cell
adhesion, decreased numbers of β1-integrin-positive cells and reduced growth (Semlali et al.
2011a). After CSE exposure, GFs were not able to contract collagen gel matrix and migrate,
which may negatively affect periodontal wound healing (Semlali et al. 2011b). These effects
of tobacco smoking and dysregulation of ST8SIA1 activity may be additive and damaging to
the gingival epithelial barrier. Taken together, it can be speculated that the effects of tobacco
smoking in carriers of the risk T-allele are additive.
CHAPTER: DISCUSSION
86
Interestingly, the most highly up-regulated gene after CRISPR-mediated gene activation of
ST8SIA1 was the gene ABCA1. It encodes a transmembrane protein of the superfamily of
ATP-binding cassette (ABC) transporters that functions as a cholesterol efflux pump in the
cellular lipid removal pathway and high-density lipoprotein (HDL) metabolism. Accordingly,
ABCA1 modulates the lipid architecture at the cell membrane and its physicochemical
properties by acting as a lipid translocator in order to maintain regular membrane functioning
both as a physical barrier and as a signaling device (Zarubica et al. 2007). Furthermore,
studies with ABCA1 knockout mice demonstrated anti-inflammatory roles for this transporter
(Tang et al. 2009; Zhu et al. 2008). A GWAS on periodontitis identified ABCA1 as a
suggestive risk gene of periodontitis, with rs4149263-A associated with P = 7×10⁻⁶, odds ratio
= 0.8 (95% confidence interval = 0.03-0.08) (Teumer et al. 2013). The rediscovery of ABCA1
in the context of ST8SIA1 upregulation implies that both genes are members of the same
transcriptional regulatory cascade. This gene network may play a relevant role in the etiology
of periodontitis and the context of barrier integrity.
A challengeable limitation of this thesis was that the in silico TF binding prediction may have
missed other potential TFs because of the limited availability of TF binding data. Databases
only provide the currently known and experimentally validated motifs of TF binding matrices.
These can be limited and may not comprise all TF motifs present in nature. Notably, the
resulting computational analyses have different performances because of different database
algorithms. The coverage and quality of the PWMs for TFBSs is another main limitation
since the analysis of specificity of protein-DNA binding also depends on the 3D structure of
DNA and TF protein macromolecules and not only on the DNA sequence (Rohs et al. 2010).
In addition, TF binding motifs are not strictly conserved. This results in different motif
sequences and limited predictive accuracy of PWMs (Weirauch et al. 2013). Thus, the major
problems of in silico TFBS analysis methods reside in high false-positive rates, high
variability, and insufficient knowledge of the exact in vivo binding sites (Hombach et al.
2016).
Another limitation of the thesis was that only SNPs in strong linkage (r2 > 0.8) were analyzed.
However, measuring LD with the r2 coefficient possesses several advantages over D ′. While
D ′ is biased upward in small sample sizes and for low allele frequencies, r2 exhibits more
reliable allele properties at low allele frequencies, has the strongest relationship with
population genetics theory, and has a simple linear relationship with sample size (Pescatello
and Roth 2011; Shifman et al. 2003). Accordingly, measuring LD by D ′ would include alleles
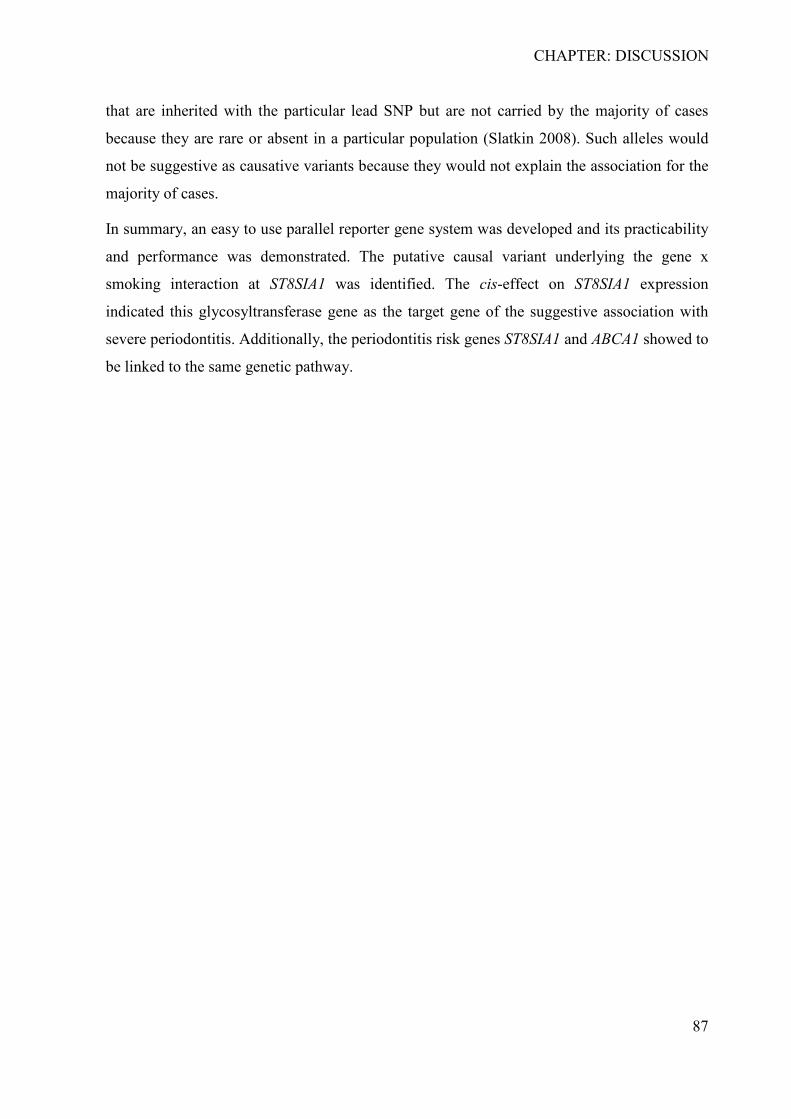
CHAPTER: DISCUSSION
87
that are inherited with the particular lead SNP but are not carried by the majority of cases
because they are rare or absent in a particular population (Slatkin 2008). Such alleles would
not be suggestive as causative variants because they would not explain the association for the
majority of cases.
In summary, an easy to use parallel reporter gene system was developed and its practicability
and performance was demonstrated. The putative causal variant underlying the gene x
smoking interaction at ST8SIA1 was identified. The cis-effect on ST8SIA1 expression
indicated this glycosyltransferase gene as the target gene of the suggestive association with
severe periodontitis. Additionally, the periodontitis risk genes ST8SIA1 and ABCA1 showed to
be linked to the same genetic pathway.
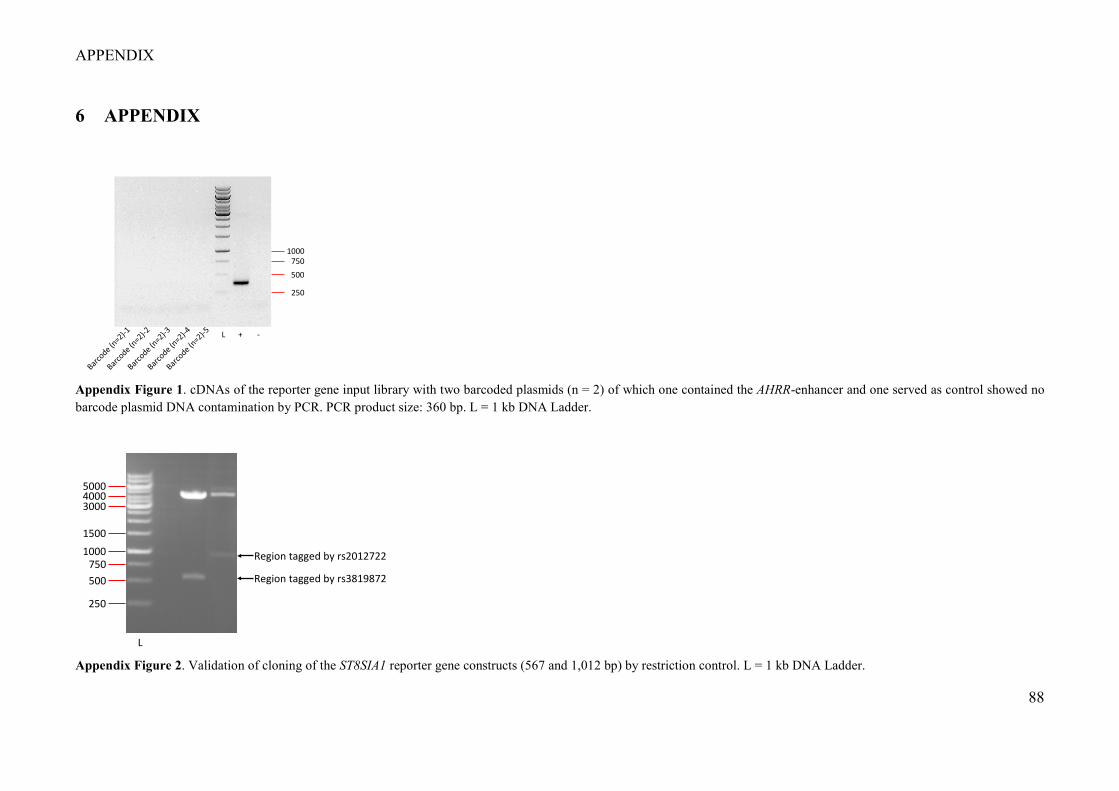
APPENDIX
88
6 APPENDIX
Appendix Figure 1. cDNAs of the reporter gene input library with two barcoded plasmids (n = 2) of which one contained the AHRR-enhancer and one served as control showed no barcode plasmid DNA contamination by PCR. PCR product size: 360 bp. L = 1 kb DNA Ladder.
Appendix Figure 2. Validation of cloning of the ST8SIA1 reporter gene constructs (567 and 1,012 bp) by restriction control. L = 1 kb DNA Ladder.
500
250
7501000
+ -L
5000
750500
250
1000
4000
1500
3000
Region tagged by rs2012722
Region tagged by rs3819872
L
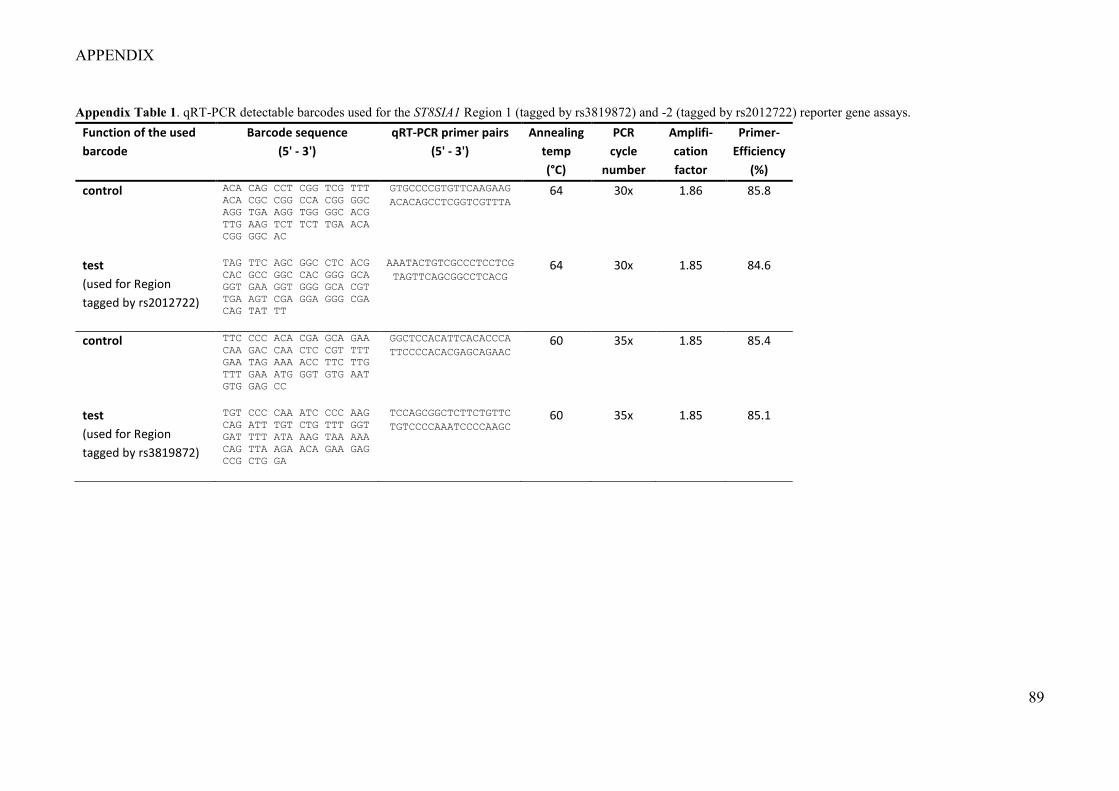
APPENDIX
89
Appendix Table 1. qRT-PCR detectable barcodes used for the ST8SIA1 Region 1 (tagged by rs3819872) and -2 (tagged by rs2012722) reporter gene assays. Function of the used barcode
Barcode sequence (5' - 3')
qRT-PCR primer pairs (5' - 3')
Annealing temp (°C)
PCR cycle
number
Amplifi-cation factor
Primer-Efficiency
(%) control
ACA CAG CCT CGG TCG TTT ACA CGC CGG CCA CGG GGC AGG TGA AGG TGG GGC ACG TTG AAG TCT TCT TGA ACA CGG GGC AC
GTGCCCCGTGTTCAAGAAG ACACAGCCTCGGTCGTTTA
64 30x 1.86 85.8
test (used for Region tagged by rs2012722)
TAG TTC AGC GGC CTC ACG CAC GCC GGC CAC GGG GCA GGT GAA GGT GGG GCA CGT TGA AGT CGA GGA GGG CGA CAG TAT TT
AAATACTGTCGCCCTCCTCG TAGTTCAGCGGCCTCACG
64 30x 1.85 84.6
control
TTC CCC ACA CGA GCA GAA CAA GAC CAA CTC CGT TTT GAA TAG AAA ACC TTC TTG TTT GAA ATG GGT GTG AAT GTG GAG CC
GGCTCCACATTCACACCCA TTCCCCACACGAGCAGAAC
60 35x 1.85 85.4
test (used for Region tagged by rs3819872)
TGT CCC CAA ATC CCC AAG CAG ATT TGT CTG TTT GGT GAT TTT ATA AAG TAA AAA CAG TTA AGA ACA GAA GAG CCG CTG GA
TCCAGCGGCTCTTCTGTTC TGTCCCCAAATCCCCAAGC
60 35x 1.85 85.1
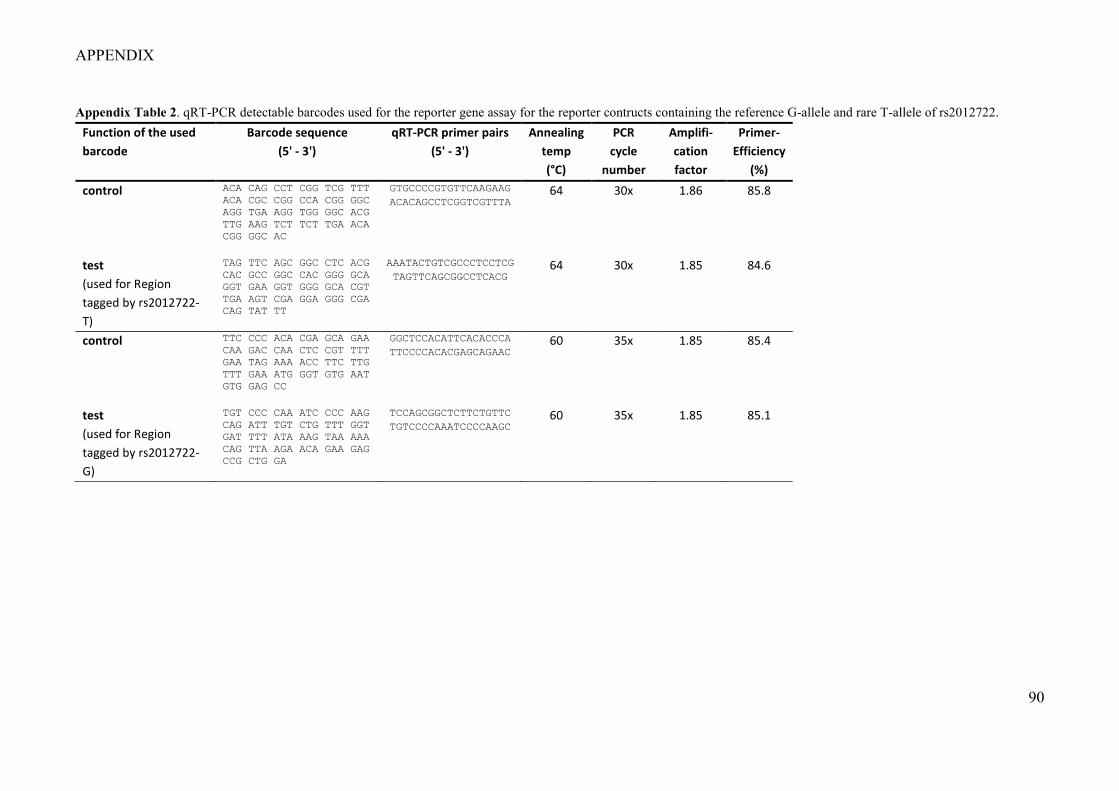
APPENDIX
90
Appendix Table 2. qRT-PCR detectable barcodes used for the reporter gene assay for the reporter contructs containing the reference G-allele and rare T-allele of rs2012722. Function of the used barcode
Barcode sequence (5' - 3')
qRT-PCR primer pairs (5' - 3')
Annealing temp (°C)
PCR cycle
number
Amplifi-cation factor
Primer-Efficiency
(%) control
ACA CAG CCT CGG TCG TTT ACA CGC CGG CCA CGG GGC AGG TGA AGG TGG GGC ACG TTG AAG TCT TCT TGA ACA CGG GGC AC
GTGCCCCGTGTTCAAGAAG ACACAGCCTCGGTCGTTTA
64 30x 1.86 85.8
test (used for Region tagged by rs2012722-T)
TAG TTC AGC GGC CTC ACG CAC GCC GGC CAC GGG GCA GGT GAA GGT GGG GCA CGT TGA AGT CGA GGA GGG CGA CAG TAT TT
AAATACTGTCGCCCTCCTCG TAGTTCAGCGGCCTCACG
64 30x 1.85 84.6
control
TTC CCC ACA CGA GCA GAA CAA GAC CAA CTC CGT TTT GAA TAG AAA ACC TTC TTG TTT GAA ATG GGT GTG AAT GTG GAG CC
GGCTCCACATTCACACCCA TTCCCCACACGAGCAGAAC
60 35x 1.85 85.4
test (used for Region tagged by rs2012722-G)
TGT CCC CAA ATC CCC AAG CAG ATT TGT CTG TTT GGT GAT TTT ATA AAG TAA AAA CAG TTA AGA ACA GAA GAG CCG CTG GA
TCCAGCGGCTCTTCTGTTC TGTCCCCAAATCCCCAAGC
60 35x 1.85 85.1
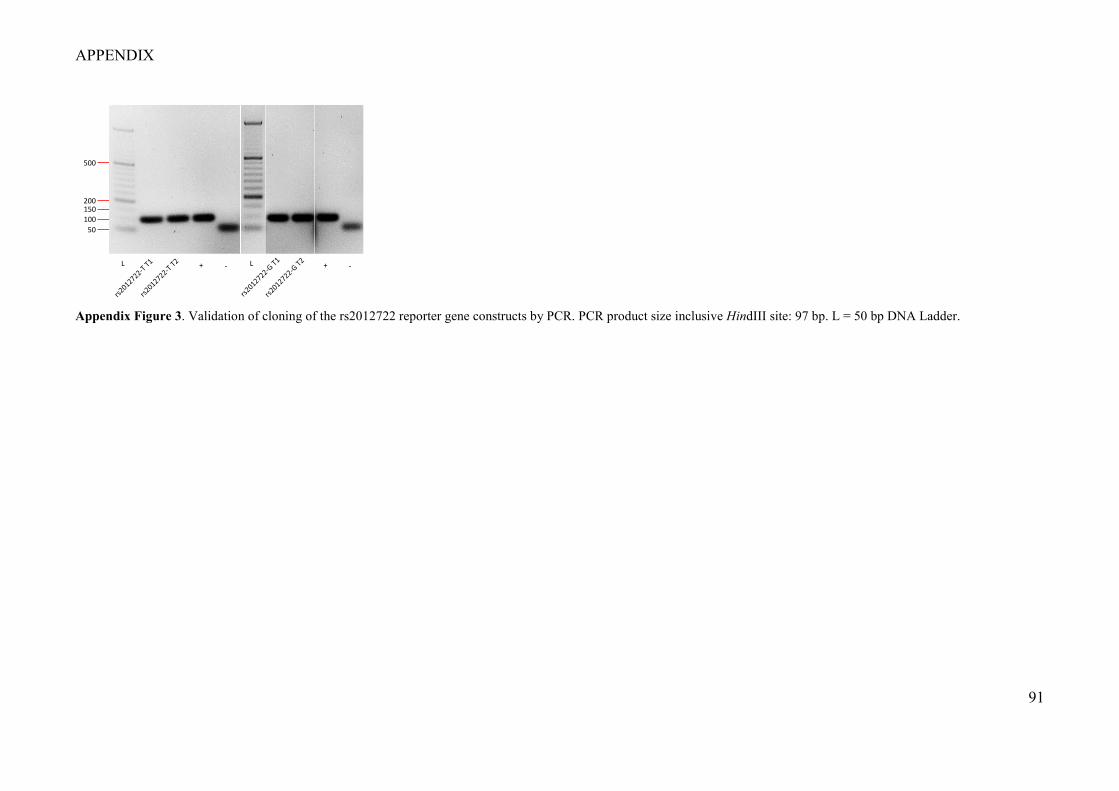
APPENDIX
91
Appendix Figure 3. Validation of cloning of the rs2012722 reporter gene constructs by PCR. PCR product size inclusive HindIII site: 97 bp. L = 50 bp DNA Ladder.
150100
50
200
500
+ - + -L L
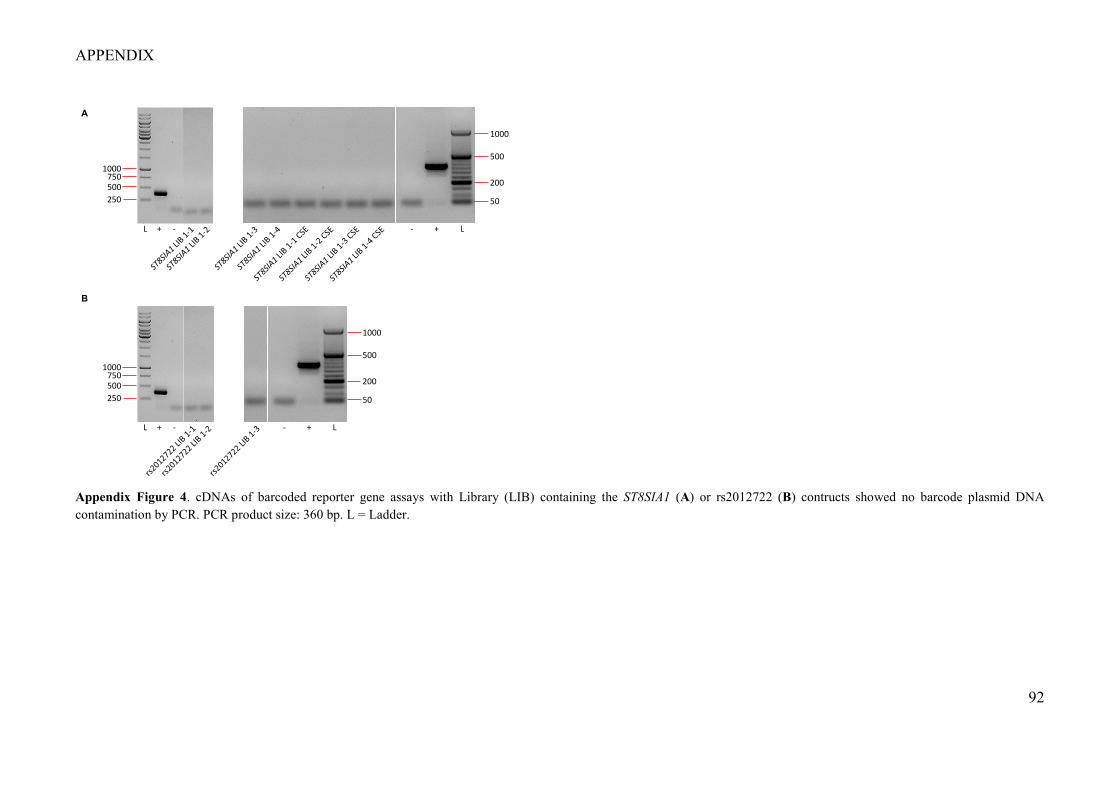
APPENDIX
92
Appendix Figure 4. cDNAs of barcoded reporter gene assays with Library (LIB) containing the ST8SIA1 (A) or rs2012722 (B) contructs showed no barcode plasmid DNA contamination by PCR. PCR product size: 360 bp. L = Ladder.
750500250
1000
+ -L
200
50
500
1000
+- L
200
50
500
1000
+- L
750500250
1000
+ -L
A
B
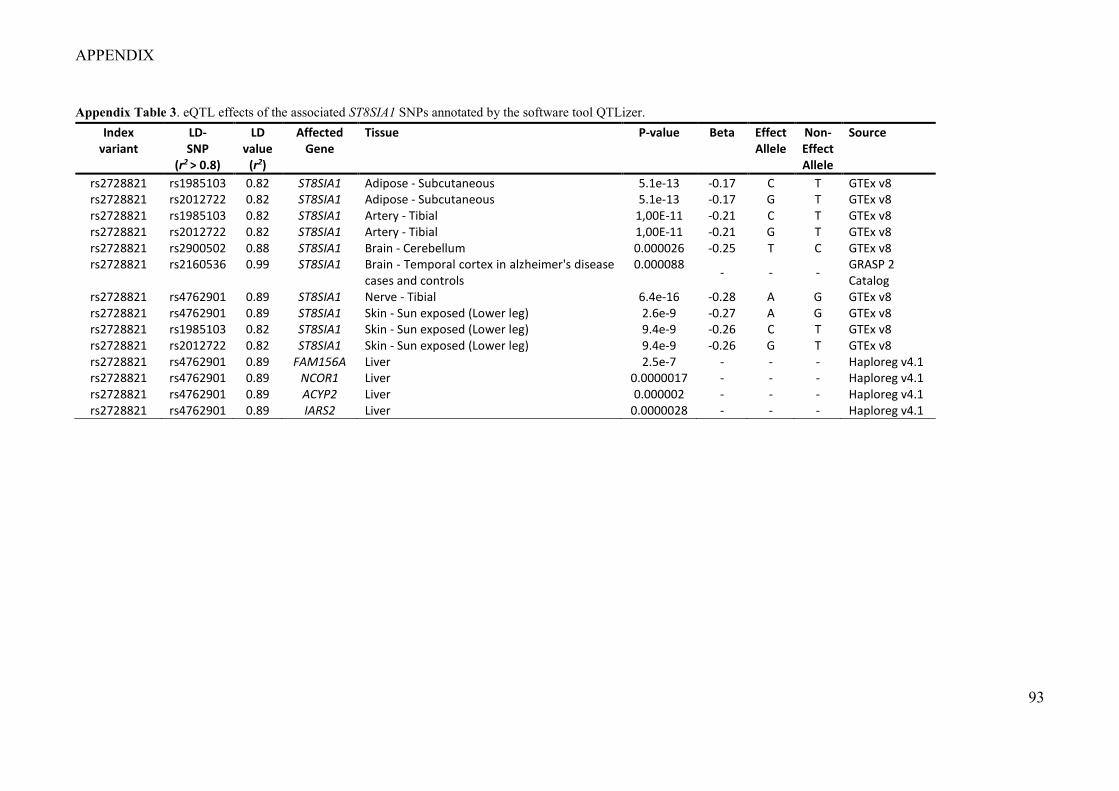
APPENDIX
93
Appendix Table 3. eQTL effects of the associated ST8SIA1 SNPs annotated by the software tool QTLizer. Index
variant LD- SNP
(r2 > 0.8)
LD value
(r2)
Affected Gene
Tissue P-value Beta Effect Allele
Non-Effect Allele
Source
rs2728821 rs1985103 0.82 ST8SIA1 Adipose - Subcutaneous 5.1e-13 -0.17 C T GTEx v8 rs2728821 rs2012722 0.82 ST8SIA1 Adipose - Subcutaneous 5.1e-13 -0.17 G T GTEx v8 rs2728821 rs1985103 0.82 ST8SIA1 Artery - Tibial 1,00E-11 -0.21 C T GTEx v8 rs2728821 rs2012722 0.82 ST8SIA1 Artery - Tibial 1,00E-11 -0.21 G T GTEx v8 rs2728821 rs2900502 0.88 ST8SIA1 Brain - Cerebellum 0.000026 -0.25 T C GTEx v8 rs2728821 rs2160536 0.99 ST8SIA1 Brain - Temporal cortex in alzheimer's disease
cases and controls 0.000088 - - - GRASP 2
Catalog rs2728821 rs4762901 0.89 ST8SIA1 Nerve - Tibial 6.4e-16 -0.28 A G GTEx v8 rs2728821 rs4762901 0.89 ST8SIA1 Skin - Sun exposed (Lower leg) 2.6e-9 -0.27 A G GTEx v8 rs2728821 rs1985103 0.82 ST8SIA1 Skin - Sun exposed (Lower leg) 9.4e-9 -0.26 C T GTEx v8 rs2728821 rs2012722 0.82 ST8SIA1 Skin - Sun exposed (Lower leg) 9.4e-9 -0.26 G T GTEx v8 rs2728821 rs4762901 0.89 FAM156A Liver 2.5e-7 - - - Haploreg v4.1 rs2728821 rs4762901 0.89 NCOR1 Liver 0.0000017 - - - Haploreg v4.1 rs2728821 rs4762901 0.89 ACYP2 Liver 0.000002 - - - Haploreg v4.1 rs2728821 rs4762901 0.89 IARS2 Liver 0.0000028 - - - Haploreg v4.1
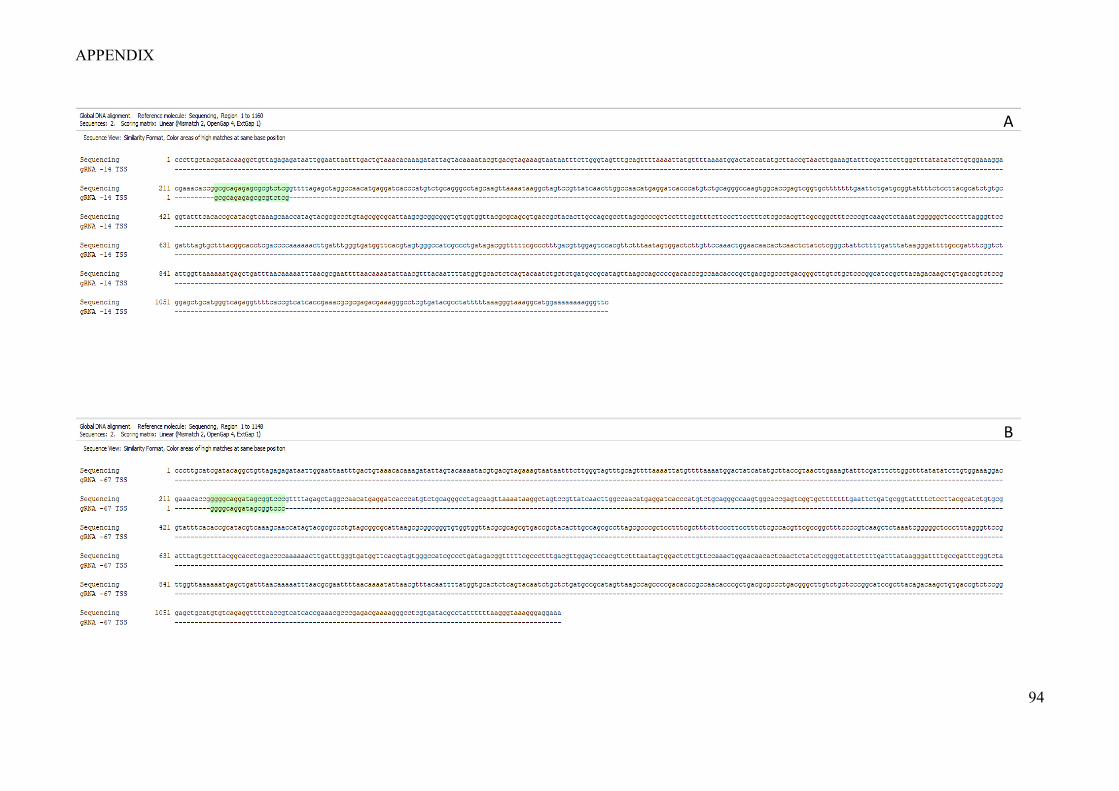
APPENDIX
94
A
B
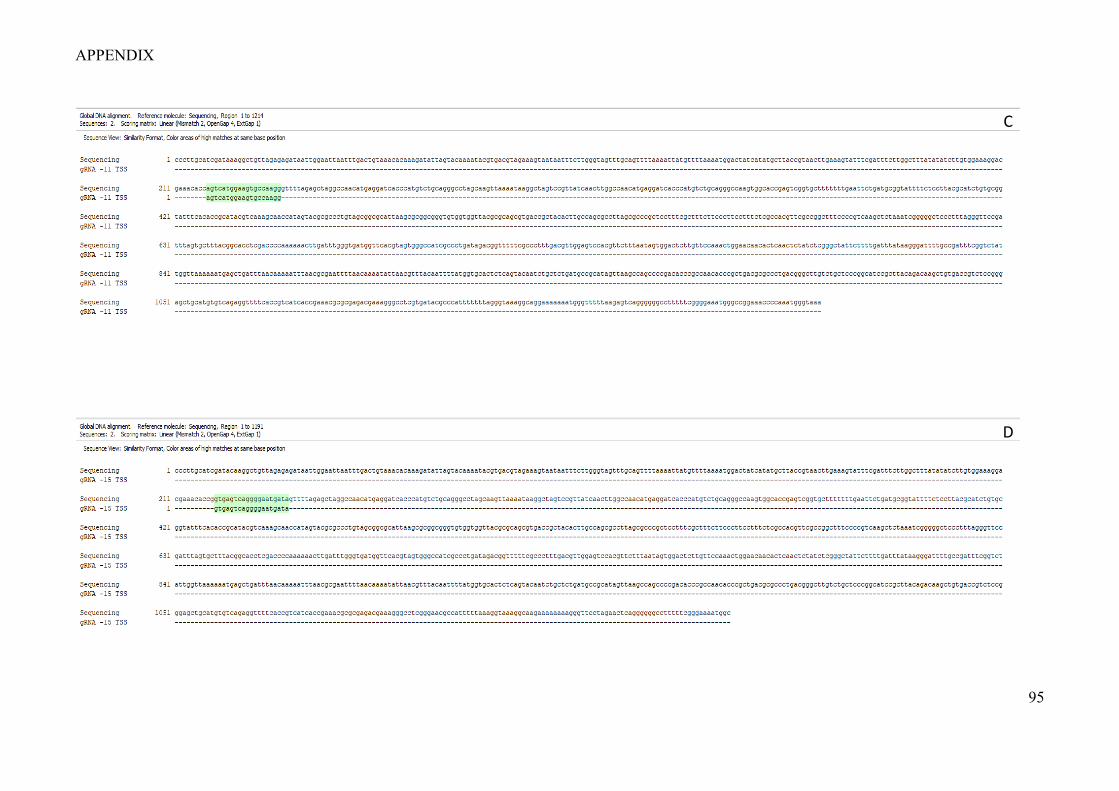
APPENDIX
95
C
D
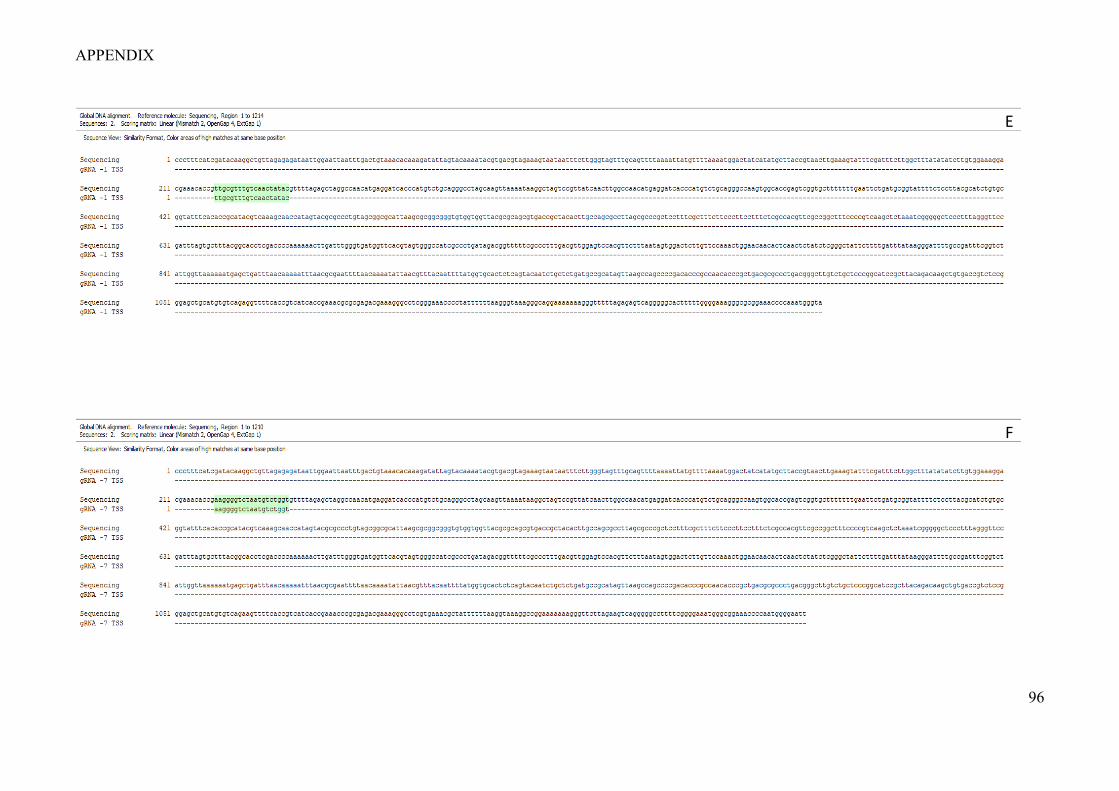
APPENDIX
96
E
F
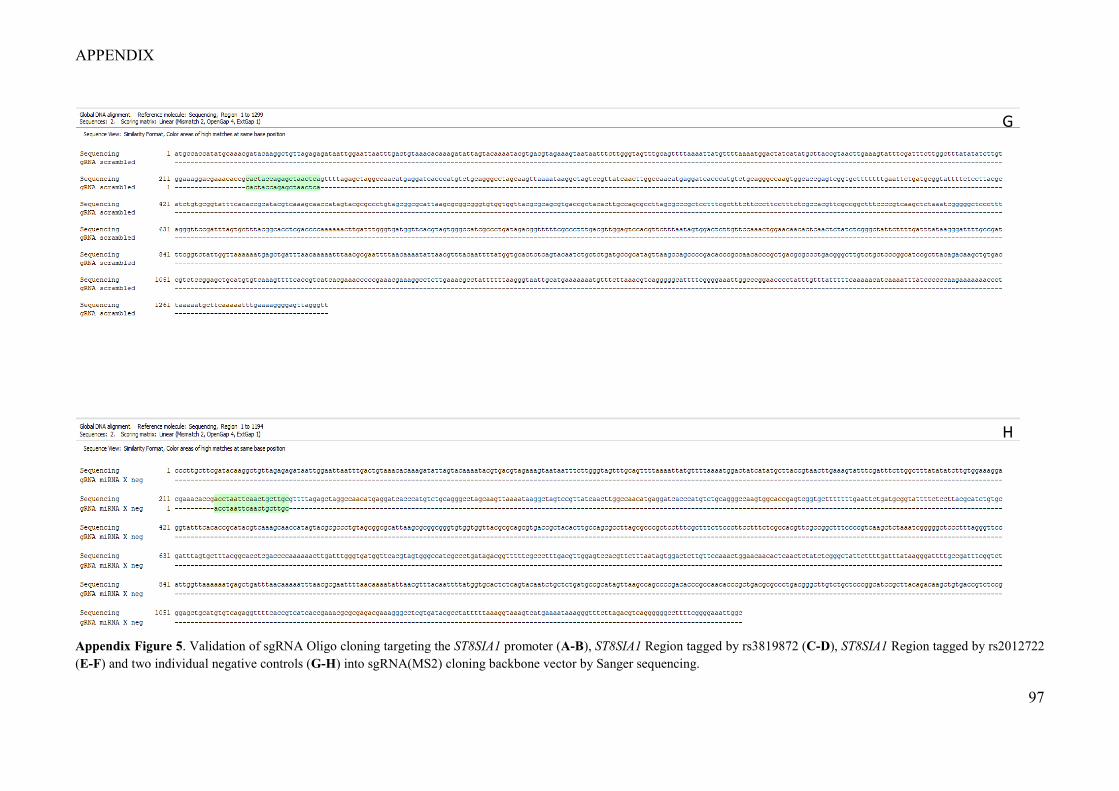
APPENDIX
97
Appendix Figure 5. Validation of sgRNA Oligo cloning targeting the ST8SIA1 promoter (A-B), ST8SIA1 Region tagged by rs3819872 (C-D), ST8SIA1 Region tagged by rs2012722 (E-F) and two individual negative controls (G-H) into sgRNA(MS2) cloning backbone vector by Sanger sequencing.
G
H
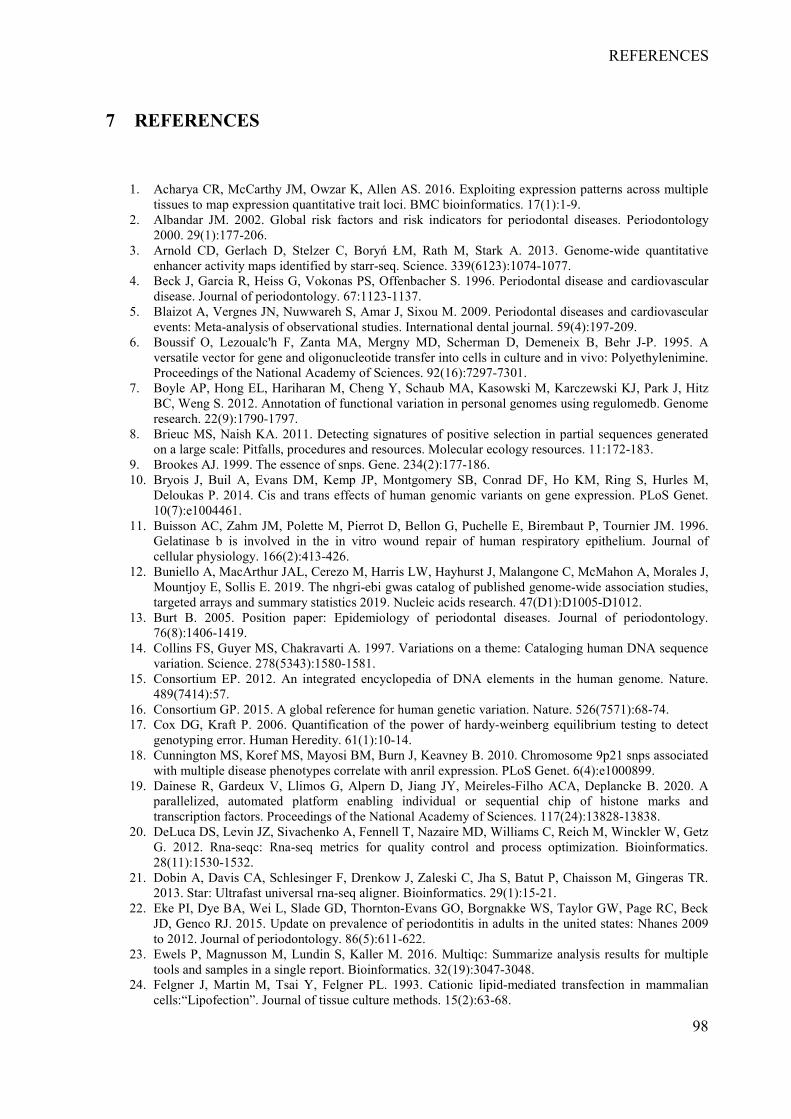
REFERENCES
98
7 REFERENCES
1. Acharya CR, McCarthy JM, Owzar K, Allen AS. 2016. Exploiting expression patterns across multiple tissues to map expression quantitative trait loci. BMC bioinformatics. 17(1):1-9.
2. Albandar JM. 2002. Global risk factors and risk indicators for periodontal diseases. Periodontology 2000. 29(1):177-206.
3. Arnold CD, Gerlach D, Stelzer C, Boryń ŁM, Rath M, Stark A. 2013. Genome-wide quantitative enhancer activity maps identified by starr-seq. Science. 339(6123):1074-1077.
4. Beck J, Garcia R, Heiss G, Vokonas PS, Offenbacher S. 1996. Periodontal disease and cardiovascular disease. Journal of periodontology. 67:1123-1137.
5. Blaizot A, Vergnes JN, Nuwwareh S, Amar J, Sixou M. 2009. Periodontal diseases and cardiovascular events: Meta-analysis of observational studies. International dental journal. 59(4):197-209.
6. Boussif O, Lezoualc'h F, Zanta MA, Mergny MD, Scherman D, Demeneix B, Behr J-P. 1995. A versatile vector for gene and oligonucleotide transfer into cells in culture and in vivo: Polyethylenimine. Proceedings of the National Academy of Sciences. 92(16):7297-7301.
7. Boyle AP, Hong EL, Hariharan M, Cheng Y, Schaub MA, Kasowski M, Karczewski KJ, Park J, Hitz BC, Weng S. 2012. Annotation of functional variation in personal genomes using regulomedb. Genome research. 22(9):1790-1797.
8. Brieuc MS, Naish KA. 2011. Detecting signatures of positive selection in partial sequences generated on a large scale: Pitfalls, procedures and resources. Molecular ecology resources. 11:172-183.
9. Brookes AJ. 1999. The essence of snps. Gene. 234(2):177-186. 10. Bryois J, Buil A, Evans DM, Kemp JP, Montgomery SB, Conrad DF, Ho KM, Ring S, Hurles M,
Deloukas P. 2014. Cis and trans effects of human genomic variants on gene expression. PLoS Genet. 10(7):e1004461.
11. Buisson AC, Zahm JM, Polette M, Pierrot D, Bellon G, Puchelle E, Birembaut P, Tournier JM. 1996. Gelatinase b is involved in the in vitro wound repair of human respiratory epithelium. Journal of cellular physiology. 166(2):413-426.
12. Buniello A, MacArthur JAL, Cerezo M, Harris LW, Hayhurst J, Malangone C, McMahon A, Morales J, Mountjoy E, Sollis E. 2019. The nhgri-ebi gwas catalog of published genome-wide association studies, targeted arrays and summary statistics 2019. Nucleic acids research. 47(D1):D1005-D1012.
13. Burt B. 2005. Position paper: Epidemiology of periodontal diseases. Journal of periodontology. 76(8):1406-1419.
14. Collins FS, Guyer MS, Chakravarti A. 1997. Variations on a theme: Cataloging human DNA sequence variation. Science. 278(5343):1580-1581.
15. Consortium EP. 2012. An integrated encyclopedia of DNA elements in the human genome. Nature. 489(7414):57.
16. Consortium GP. 2015. A global reference for human genetic variation. Nature. 526(7571):68-74. 17. Cox DG, Kraft P. 2006. Quantification of the power of hardy-weinberg equilibrium testing to detect
genotyping error. Human Heredity. 61(1):10-14. 18. Cunnington MS, Koref MS, Mayosi BM, Burn J, Keavney B. 2010. Chromosome 9p21 snps associated
with multiple disease phenotypes correlate with anril expression. PLoS Genet. 6(4):e1000899. 19. Dainese R, Gardeux V, Llimos G, Alpern D, Jiang JY, Meireles-Filho ACA, Deplancke B. 2020. A
parallelized, automated platform enabling individual or sequential chip of histone marks and transcription factors. Proceedings of the National Academy of Sciences. 117(24):13828-13838.
20. DeLuca DS, Levin JZ, Sivachenko A, Fennell T, Nazaire MD, Williams C, Reich M, Winckler W, Getz G. 2012. Rna-seqc: Rna-seq metrics for quality control and process optimization. Bioinformatics. 28(11):1530-1532.
21. Dobin A, Davis CA, Schlesinger F, Drenkow J, Zaleski C, Jha S, Batut P, Chaisson M, Gingeras TR. 2013. Star: Ultrafast universal rna-seq aligner. Bioinformatics. 29(1):15-21.
22. Eke PI, Dye BA, Wei L, Slade GD, Thornton‐Evans GO, Borgnakke WS, Taylor GW, Page RC, Beck JD, Genco RJ. 2015. Update on prevalence of periodontitis in adults in the united states: Nhanes 2009 to 2012. Journal of periodontology. 86(5):611-622.
23. Ewels P, Magnusson M, Lundin S, Kaller M. 2016. Multiqc: Summarize analysis results for multiple tools and samples in a single report. Bioinformatics. 32(19):3047-3048.
24. Felgner J, Martin M, Tsai Y, Felgner PL. 1993. Cationic lipid-mediated transfection in mammalian cells:“Lipofection”. Journal of tissue culture methods. 15(2):63-68.
REFERENCES
99
25. Freitag-Wolf S, Munz M, Wiehe R, Junge O, Graetz C, Jockel-Schneider Y, Staufenbiel I, Bruckmann C, Lieb W, Franke A. 2019. Smoking modifies the genetic risk for early-onset periodontitis. Journal of dental research. 98(12):1332-1339.
26. Gambhir S, Barrio J, Herschman H, Phelps M. 1999. Assays for noninvasive imaging of reporter gene expression. Nuclear medicine and biology. 26(5):481-490.
27. Garcia-Alcalde F, Okonechnikov K, Carbonell J, Cruz LM, Gotz S, Tarazona S, Dopazo J, Meyer TF, Conesa A. 2012. Qualimap: Evaluating next-generation sequencing alignment data. Bioinformatics. 28(20):2678-2679.
28. Gaszner M, Felsenfeld G. 2006. Insulators: Exploiting transcriptional and epigenetic mechanisms. Nat Rev Genet. 7(9):703-713.
29. Hajishengallis G. 2015. Periodontitis: From microbial immune subversion to systemic inflammation. Nat Rev Immunol. 15(1):30-44.
30. Hombach D, Schwarz JM, Robinson PN, Schuelke M, Seelow D. 2016. A systematic, large-scale comparison of transcription factor binding site models. BMC genomics. 17(1):1-10.
31. Hugoson A, Sjodin B, Norderyd O. 2008. Trends over 30 years, 1973-2003, in the prevalence and severity of periodontal disease. J Clin Periodontol. 35(5):405-414.
32. Humphrey LL, Fu R, Buckley DI, Freeman M, Helfand M. 2008. Periodontal disease and coronary heart disease incidence: A systematic review and meta-analysis. J Gen Intern Med. 23(12):2079-2086.
33. Jansen RC, Nap J-P. 2001. Genetical genomics: The added value from segregation. TRENDS in Genetics. 17(7):388-391.
34. Jepsen S, Kebschull M, Deschner J. 2011. Wechselwirkungen zwischen parodontitis und systemischen erkrankungen. Bundesgesundheitsblatt-Gesundheitsforschung-Gesundheitsschutz. 54(9-10):1089-1096.
35. Karki R, Pandya D, Elston RC, Ferlini C. 2015. Defining “mutation” and “polymorphism” in the era of personal genomics. BMC medical genomics. 8(1):1-7.
36. Kassebaum NJ, Bernabe E, Dahiya M, Bhandari B, Murray CJ, Marcenes W. 2014. Global burden of severe periodontitis in 1990-2010: A systematic review and meta-regression. J Dent Res. 93(11):1045-1053.
37. Kheradpour P, Ernst J, Melnikov A, Rogov P, Wang L, Zhang X, Alston J, Mikkelsen TS, Kellis M. 2013. Systematic dissection of regulatory motifs in 2000 predicted human enhancers using a massively parallel reporter assay. Genome research. 23(5):800-811.
38. Kinane DF, Peterson M, Stathopoulou PG. 2006. Environmental and other modifying factors of the periodontal diseases. Periodontology 2000. 40(1):107-119.
39. Koboldt DC, Miller RD, Kwok PY. 2006. Distribution of human snps and its effect on high‐throughput genotyping. Human mutation. 27(3):249-254.
40. Kreimer A, Zeng H, Edwards MD, Guo Y, Tian K, Shin S, Welch R, Wainberg M, Mohan R, Sinnott‐Armstrong NA. 2017. Predicting gene expression in massively parallel reporter assays: A comparative study. Human mutation. 38(9):1240-1250.
41. Kwok P-Y, Gu Z. 1999. Single nucleotide polymorphism libraries: Why and how are we building them? Molecular medicine today. 5(12):538-543.
42. Lee CM, Barber GP, Casper J, Clawson H, Diekhans M, Gonzalez JN, Hinrichs AS, Lee BT, Nassar LR, Powell CC. 2020. Ucsc genome browser enters 20th year. Nucleic acids research. 48(D1):D756-D761.
43. Liberzon A, Birger C, Thorvaldsdottir H, Ghandi M, Mesirov JP, Tamayo P. 2015. The molecular signatures database (msigdb) hallmark gene set collection. Cell Syst. 1(6):417-425.
44. Libioulle C, Louis E, Hansoul S, Sandor C, Farnir F, Franchimont D, Vermeire S, Dewit O, De Vos M, Dixon A. 2007. Novel crohn disease locus identified by genome-wide association maps to a gene desert on 5p13. 1 and modulates expression of ptger4. PLoS Genet. 3(4):e58.
45. Liu H, Wei Z, Dominguez A, Li Y, Wang X, Qi LS. 2015. Crispr-era: A comprehensive design tool for crispr-mediated gene editing, repression and activation. Bioinformatics. 31(22):3676-3678.
46. Liu Y, Zhao G, Xu C-F, Luo Y-L, Lu Z-D, Wang J. 2018. Systemic delivery of crispr/cas9 with peg-plga nanoparticles for chronic myeloid leukemia targeted therapy. Biomaterials science. 6(6):1592-1603.
47. Loos BG, Papantonopoulos G, Jepsen S, Laine ML. 2015. What is the contribution of genetics to periodontal risk? Dental Clinics. 59(4):761-780.
48. Love MI, Huber W, Anders S. 2014. Moderated estimation of fold change and dispersion for rna-seq data with deseq2. Genome Biol. 15(12):550.
49. Lutz SM, Cho MH, Young K, Hersh CP, Castaldi PJ, McDonald M-L, Regan E, Mattheisen M, DeMeo DL, Parker M. 2015. A genome-wide association study identifies risk loci for spirometric measures among smokers of european and african ancestry. BMC genetics. 16(1):1-11.
REFERENCES
100
50. Machiela MJ, Chanock SJ. 2015. Ldlink: A web-based application for exploring population-specific haplotype structure and linking correlated alleles of possible functional variants. Bioinformatics. 31(21):3555-3557.
51. Mammana A, Chung HR. 2015. Chromatin segmentation based on a probabilistic model for read counts explains a large portion of the epigenome. Genome Biol. 16:151.
52. Mandal C, Sarkar S, Chatterjee U, Schwartz-Albiez R, Mandal C. 2014. Disialoganglioside gd3-synthase over expression inhibits survival and angiogenesis of pancreatic cancer cells through cell cycle arrest at s-phase and disruption of integrin-beta1-mediated anchorage. Int J Biochem Cell Biol. 53:162-173.
53. Marcenes W, Kassebaum NJ, Bernabe E, Flaxman A, Naghavi M, Lopez A, Murray CJ. 2013. Global burden of oral conditions in 1990-2010: A systematic analysis. J Dent Res. 92(7):592-597.
54. Maresz KJ, Hellvard A, Sroka A, Adamowicz K, Bielecka E, Koziel J, Gawron K, Mizgalska D, Marcinska KA, Benedyk M et al. 2013. Porphyromonas gingivalis facilitates the development and progression of destructive arthritis through its unique bacterial peptidylarginine deiminase (pad). PLoS Pathog. 9(9):e1003627.
55. Michaelson JJ, Loguercio S, Beyer A. 2009. Detection and interpretation of expression quantitative trait loci (eqtl). Methods. 48(3):265-276.
56. Michalowicz BS, Diehl SR, Gunsolley JC, Sparks BS, Brooks CN, Koertge TE, Califano JV, Burmeister JA, Schenkein HA. 2000. Evidence of a substantial genetic basis for risk of adult periodontitis. Journal of periodontology. 71(11):1699-1707.
57. Monteiro AN, Freedman ML. 2013. Lessons from postgenome‐wide association studies: Functional analysis of cancer predisposition loci. Journal of internal medicine. 274(5):414-424.
58. Munz M, Willenborg C, Richter GM, Jockel-Schneider Y, Graetz C, Staufenbiel I, Wellmann J, Berger K, Krone B, Hoffmann P. 2017. A genome-wide association study identifies nucleotide variants at siglec5 and defa1a3 as risk loci for periodontitis. Human molecular genetics. 26(13):2577-2588.
59. Munz M, Wohlers I, Simon E, Reinberger T, Busch H, Schaefer AS, Erdmann J. 2020. Qtlizer: Comprehensive qtl annotation of gwas results. Sci Rep. 10(1):20417.
60. Nakato R, Sakata T. 2020. Methods for chip-seq analysis: A practical workflow and advanced applications. Methods.
61. Nesse W, Abbas F, van der Ploeg I, Spijkervet FK, Dijkstra PU, Vissink A. 2008. Periodontal inflamed surface area: Quantifying inflammatory burden. J Clin Periodontol. 35(8):668-673.
62. Nibali L, Di Iorio A, Tu YK, Vieira AR. 2017. Host genetics role in the pathogenesis of periodontal disease and caries. Journal of clinical periodontology. 44:S52-S78.
63. Nicoloso MS, Sun H, Spizzo R, Kim H, Wickramasinghe P, Shimizu M, Wojcik SE, Ferdin J, Kunej T, Xiao L. 2010. Single-nucleotide polymorphisms inside microrna target sites influence tumor susceptibility. Cancer research. 70(7):2789-2798.
64. Nociti Jr FH, Casati MZ, Duarte PM. 2015. Current perspective of the impact of smoking on the progression and treatment of periodontitis. Periodontology 2000. 67(1):187-210.
65. Opdenakker G, Van den Steen PE, Dubois B, Nelissen I, Van Coillie E, Masure S, Proost P, Van Damme J. 2001. Gelatinase b functions as regulator and effector in leukocyte biology. Journal of leukocyte biology. 69(6):851-859.
66. Page GP, George V, Go RC, Page PZ, Allison DB. 2003. "Are we there yet?": Deciding when one has demonstrated specific genetic causation in complex diseases and quantitative traits. Am J Hum Genet. 73(4):711-719.
67. Pescatello LS, Roth SM. 2011. Exercise genomics. Springer Science & Business Media. 68. Pindborg J. 1947. Tobacco and gingivitis: Statistical examination of the significance of tobacco in the
development of ulceromembranous gingivitis and in the formation of calculus. Journal of Dental Research. 26(3):261-264.
69. Ramos RI, Bustos MA, Wu J, Jones P, Chang SC, Kiyohara E, Tran K, Zhang X, Stern SL, Izraely S. 2020. Upregulation of cell surface gd3 ganglioside phenotype is associated with human melanoma brain metastasis. Molecular oncology. 14(8):1760-1778.
70. Ran FA, Hsu PD, Wright J, Agarwala V, Scott DA, Zhang F. 2013. Genome engineering using the crispr-cas9 system. Nat Protoc. 8(11):2281-2308.
71. Richter GM, Kruppa J, Munz M, Wiehe R, Häsler R, Franke A, Martins O, Jockel-Schneider Y, Bruckmann C, Dommisch H. 2019. A combined epigenome-and transcriptome-wide association study of the oral masticatory mucosa assigns cyp1b1 a central role for epithelial health in smokers. Clinical epigenetics. 11(1):1-18.
72. Risch NJ. 2000. Searching for genetic determinants in the new millennium. Nature. 405(6788):847-856.
REFERENCES
101
73. Rohs R, Jin X, West SM, Joshi R, Honig B, Mann RS. 2010. Origins of specificity in protein-DNA recognition. Annu Rev Biochem. 79:233-269.
74. Rueden CT, Schindelin J, Hiner MC, DeZonia BE, Walter AE, Arena ET, Eliceiri KW. 2017. Imagej2: Imagej for the next generation of scientific image data. BMC bioinformatics. 18(1):1-26.
75. Sainudiin R, Clark AG, Durrett RT. 2007. Simple models of genomic variation in human snp density. BMC genomics. 8(1):1-7.
76. Salvi GE, Beck JD, Offenbacher S. 1998. Pge2, il-1 beta, and tnf-alpha responses in diabetics as modifiers of periodontal disease expression. Ann Periodontol. 3(1):40-50.
77. Sandelin A, Alkema W, Engstrom P, Wasserman WW, Lenhard B. 2004. Jaspar: An open-access database for eukaryotic transcription factor binding profiles. Nucleic Acids Res. 32(Database issue):D91-94.
78. Sasaki K, Kurata K, Kojima N, Kurosawa N, Ohta S, Hanai N, Tsuji S, Nishi T. 1994. Expression cloning of a gm3-specific alpha-2,8-sialyltransferase (gd3 synthase). J Biol Chem. 269(22):15950-15956.
79. Sayols S, Scherzinger D, Klein H. 2016. Dupradar: A bioconductor package for the assessment of pcr artifacts in rna-seq data. BMC Bioinformatics. 17(1):428.
80. Scannapieco FA, Bush RB, Paju S. 2003. Associations between periodontal disease and risk for atherosclerosis, cardiovascular disease, and stroke. A systematic review. Annals of Periodontology. 8(1):38-53.
81. Schmittgen TD, Livak KJ. 2008. Analyzing real-time pcr data by the comparative c t method. Nature protocols. 3(6):1101.
82. Schroeder HE. 1986. Development, structure, and function of periodontal tissues. The periodontium. Springer. p. 23-323.
83. Semlali A, Chakir J, Goulet JP, Chmielewski W, Rouabhia M. 2011a. Whole cigarette smoke promotes human gingival epithelial cell apoptosis and inhibits cell repair processes. J Periodontal Res. 46(5):533-541.
84. Semlali A, Chakir J, Rouabhia M. 2011b. Effects of whole cigarette smoke on human gingival fibroblast adhesion, growth, and migration. J Toxicol Environ Health A. 74(13):848-862.
85. Sherf BA, Navarro SL, Hannah RR, Wood KV. 1996. Dual-luciferase reporter assay: An advanced co-reporter technology integrating firefly and renilla luciferase assays. Promega Notes. 57(2):2-8.
86. Shifman S, Kuypers J, Kokoris M, Yakir B, Darvasi A. 2003. Linkage disequilibrium patterns of the human genome across populations. Human molecular genetics. 12(7):771-776.
87. Simeonov DR, Gowen BG, Boontanrart M, Roth TL, Gagnon JD, Mumbach MR, Satpathy AT, Lee Y, Bray NL, Chan AY et al. 2017. Discovery of stimulation-responsive immune enhancers with crispr activation. Nature. 549(7670):111-115.
88. Sipione S, Monyror J, Galleguillos D, Steinberg N, Kadam V. 2020. Gangliosides in the brain: Physiology, pathophysiology and therapeutic applications. Frontiers in neuroscience. 14.
89. Slatkin M. 2008. Linkage disequilibrium--understanding the evolutionary past and mapping the medical future. Nat Rev Genet. 9(6):477-485.
90. Stueve TR, Li W-Q, Shi J, Marconett CN, Zhang T, Yang C, Mullen D, Yan C, Wheeler W, Hua X. 2017. Epigenome-wide analysis of DNA methylation in lung tissue shows concordance with blood studies and identifies tobacco smoke-inducible enhancers. Human molecular genetics. 26(15):3014-3027.
91. Taillon-Miller P, Gu Z, Li Q, Hillier L, Kwok P-Y. 1998. Overlapping genomic sequences: A treasure trove of single-nucleotide polymorphisms. Genome research. 8(7):748-754.
92. Tang C, Liu Y, Kessler PS, Vaughan AM, Oram JF. 2009. The macrophage cholesterol exporter abca1 functions as an anti-inflammatory receptor. J Biol Chem. 284(47):32336-32343.
93. Teumer A, Holtfreter B, Volker U, Petersmann A, Nauck M, Biffar R, Volzke H, Kroemer HK, Meisel P, Homuth G et al. 2013. Genome-wide association study of chronic periodontitis in a general german population. J Clin Periodontol. 40(11):977-985.
94. Tewhey R, Kotliar D, Park DS, Liu B, Winnicki S, Reilly SK, Andersen KG, Mikkelsen TS, Lander ES, Schaffner SF. 2016. Direct identification of hundreds of expression-modulating variants using a multiplexed reporter assay. Cell. 165(6):1519-1529.
95. Tian P, Wang J, Shen X, Rey JF, Yuan Q, Yan Y. 2017. Fundamental crispr-cas9 tools and current applications in microbial systems. Synthetic and systems biotechnology. 2(3):219-225.
96. Timpson NJ, Greenwood CM, Soranzo N, Lawson DJ, Richards JB. 2018. Genetic architecture: The shape of the genetic contribution to human traits and disease. Nature Reviews Genetics. 19(2):110.
REFERENCES
102
97. Tonetti MS, Jepsen S, Jin L, Otomo-Corgel J. 2017. Impact of the global burden of periodontal diseases on health, nutrition and wellbeing of mankind: A call for global action. J Clin Periodontol. 44(5):456-462.
98. Uitterlinden AG, FANG Y, VAN MEURS JB, POLS HA. 2005. Genetic vitamin d receptor polymorphisms and risk of disease. Vitamin d. Elsevier. p. 1121-1157.
99. Valentonyte R, Hampe J, Huse K, Rosenstiel P, Albrecht M, Stenzel A, Nagy M, Gaede KI, Franke A, Haesler R. 2005. Sarcoidosis is associated with a truncating splice site mutation in btnl2. Nature genetics. 37(4):357-364.
100. Visscher PM, Brown MA, McCarthy MI, Yang J. 2012. Five years of gwas discovery. The American Journal of Human Genetics. 90(1):7-24.
101. Vu TH, Shipley JM, Bergers G, Berger JE, Helms JA, Hanahan D, Shapiro SD, Senior RM, Werb Z. 1998. Mmp-9/gelatinase b is a key regulator of growth plate angiogenesis and apoptosis of hypertrophic chondrocytes. Cell. 93(3):411-422.
102. Wang X, Liu J, Jiang L, Wei X, Niu C, Wang R, Zhang J, Meng D, Yao K. 2016. Bach1 induces endothelial cell apoptosis and cell-cycle arrest through ros generation. Oxidative Medicine and Cellular Longevity. 2016.
103. Weirauch MT, Cote A, Norel R, Annala M, Zhao Y, Riley TR, Saez-Rodriguez J, Cokelaer T, Vedenko A, Talukder S et al. 2013. Evaluation of methods for modeling transcription factor sequence specificity. Nat Biotechnol. 31(2):126-134.
104. Wingender E. 2008. The transfac project as an example of framework technology that supports the analysis of genomic regulation. Brief Bioinform. 9(4):326-332.
105. Yong SY, Raben TG, Lello L, Hsu SD. 2020. Genetic architecture of complex traits and disease risk predictors. Scientific reports. 10(1):1-14.
106. Young MD, Wakefield MJ, Smyth GK, Oshlack A. 2010. Gene ontology analysis for rna-seq: Accounting for selection bias. Genome Biol. 11(2):R14.
107. Zarubica A, Trompier D, Chimini G. 2007. Abca1, from pathology to membrane function. Pflügers Archiv-European Journal of Physiology. 453(5):569-579.
108. Zhang X, Guo J, Wei X, Niu C, Jia M, Li Q, Meng D. 2018. Bach1: Function, regulation, and involvement in disease. Oxid Med Cell Longev. 2018:1347969.
109. Zhu X, Lee JY, Timmins JM, Brown JM, Boudyguina E, Mulya A, Gebre AK, Willingham MC, Hiltbold EM, Mishra N et al. 2008. Increased cellular free cholesterol in macrophage-specific abca1 knock-out mice enhances pro-inflammatory response of macrophages. J Biol Chem. 283(34):22930-22941.
110. Zyla J, Marczyk M, Domaszewska T, Kaufmann SHE, Polanska J, Weiner J. 2019. Gene set enrichment for reproducible science: Comparison of cerno and eight other algorithms. Bioinformatics. 35(24):5146-5154.