Embed Size (px)
Citation preview

19.04.2015
1
Agrarfinanztagung 2015des Deutschen Bauernverbandes
und der Landwirtschaftlichen Rentenbank – 4/ 2015
Konkurrenzfähigkeit der deutschen Milch-viehhalter im internationalen Vergleich
Dr. Torsten Hemme, Managing Director
IFCN Dairy Research Network at University Kiel,
Email: [email protected]
© IFCN 2015
Agenda
1. IFCN Methodik
2. Milchpreise
3. Kosten
4. IFCN Outlook 2024
5. Fazit
19.04.2015
2
© IFCN 2015
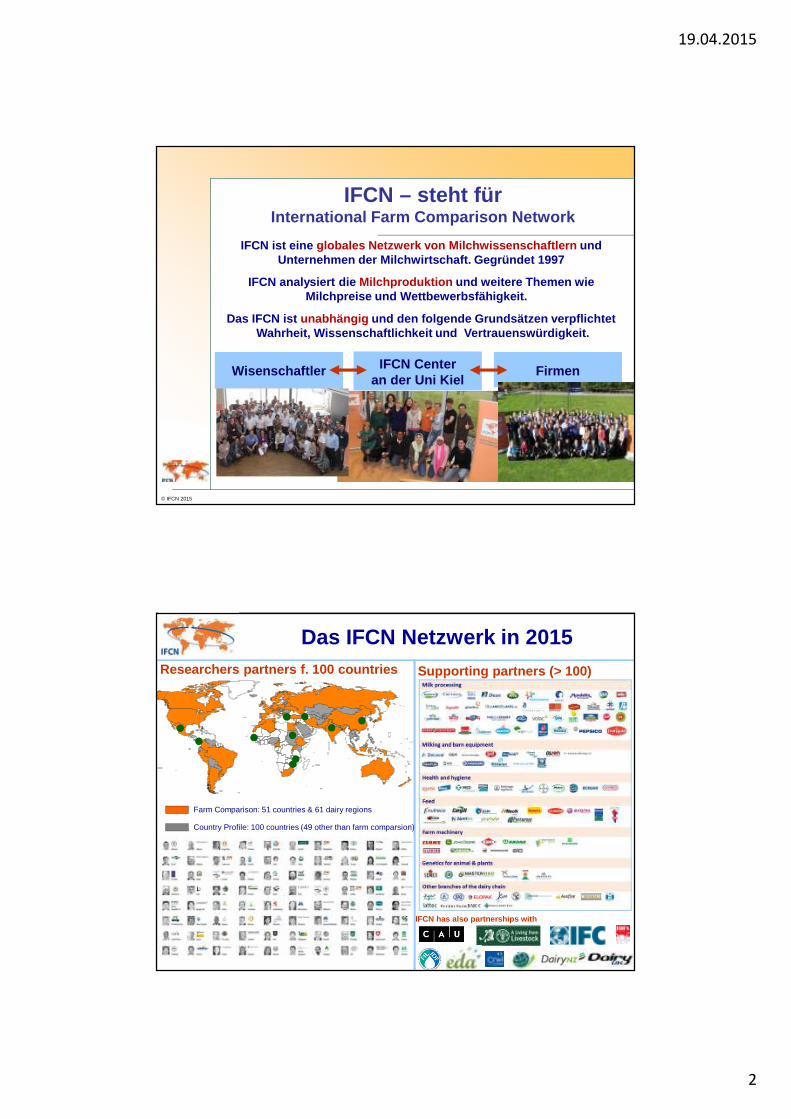
IFCN – steht fürInternational Farm Comparison Network
IFCN ist eine globales Netzwerk von Milchwissenschaftlern und Unternehmen der Milchwirtschaft. Gegründet 1997
IFCN analysiert die Milchproduktion und weitere Themen wie Milchpreise und Wettbewerbsfähigkeit.
Das IFCN ist unabhängig und den folgende Grundsätzen verpflichtetWahrheit, Wissenschaftlichkeit und Vertrauenswürdi gkeit.
IFCN Centeran der Uni Kiel
Wisenschaftler Firmen
© IFCN 2015
Researchers partners f. 100 countries Supporting partners (> 100)
Farm Comparison: 51 countries & 61 dairy regions
Country Profile: 100 countries (49 other than farm comparsion)
IFCN has also partnerships with
Das IFCN Netzwerk in 2015

19.04.2015
3
© IFCN 2015
IFCN Dairy Conference für Wissenschaftler
2014 held in Asiago, Italy hosted by
2015 planned in Kiel, Germnay hosted by
© IFCN 2015
Agenda
1. IFCN Methodik
2. Milchpreise
3. Kosten
4. IFCN Outlook 2024
5. Fazit

19.04.2015
4
© IFCN 2015
0
5
10
15
20
25
30
35
40
1982
1984
1986
1988
1990
1992
1994
1996
1998
2000
2002
2004
2006
2008
2010
2012
US
-$ /
100
kg fe
ed
0
10
20
30
40
50
60
70
80
90
100
110
12019
8219
8419
8619
8819
9019
9219
9419
9619
9820
0020
0220
0420
0620
0820
1020
12
Eur
ope
Spo
t Bre
nt P
rice
FO
B (
US
-$/b
bl)
Weltmerktpreise für Öl, Futter, Milch1981 – 2014 in US-$
Rohöl Futter
IFCN feed price indicator basedon corn and soybean meal
0
5
10
15
20
25
30
35
40
45
50
55
1982
1984
1986
1988
1990
1992
1994
1996
1998
2000
2002
2004
2006
2008
2010
2012
US
-$ /
100
kg m
ilk E
CM
Milch
IFCN milk price indicator based on a basket of dairy products
= 2013 / 2014 high
= 2013 / 2014 low
Ca. 30 euro
© IFCN 2015
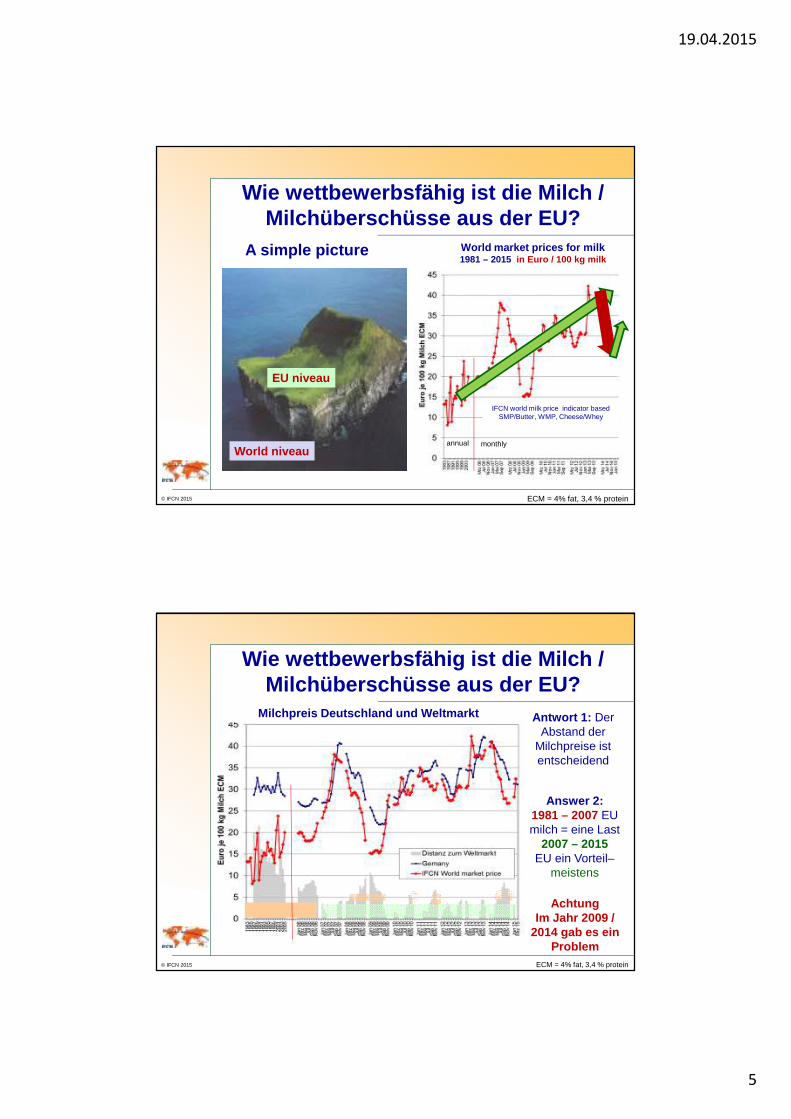
World market prices for milk 1981 – 2015 in Euro / 100 kg milk
monthlyannual
IFCN world milk price indicator basedSMP/Butter, WMP, Cheese/Whey
EU niveau
World niveau
A simple picture
ECM = 4% fat, 3,4 % protein
Wie wettbewerbsfähig ist die Milch / Milchüberschüsse aus der EU?
19.04.2015
5
© IFCN 2015
World market prices for milk 1981 – 2015 in Euro / 100 kg milk
monthlyannual
IFCN world milk price indicator basedSMP/Butter, WMP, Cheese/Whey
EU niveau
World niveau
A simple picture
ECM = 4% fat, 3,4 % protein
Wie wettbewerbsfähig ist die Milch / Milchüberschüsse aus der EU?
© IFCN 2015
Milchpreis Deutschland und Weltmarkt Antwort 1: Der Abstand der
Milchpreise istentscheidend
Answer 2: 1981 – 2007 EU milch = eine Last
2007 – 2015 EU ein Vorteil–
meistens
AchtungIm Jahr 2009 /
2014 gab es einProblem
ECM = 4% fat, 3,4 % protein
Wie wettbewerbsfähig ist die Milch / Milchüberschüsse aus der EU?

19.04.2015
6
© IFCN 2015
Was treibt den Weltmarktpreis für Milch?3. Antworten
Source: IFCN Dairy Research Center
© IFCN 2015
EU-27
17.8
-0.02
3.3
2.7
-4.1
-5.8
-2.5
12.8
-0.4
1.8
2.8
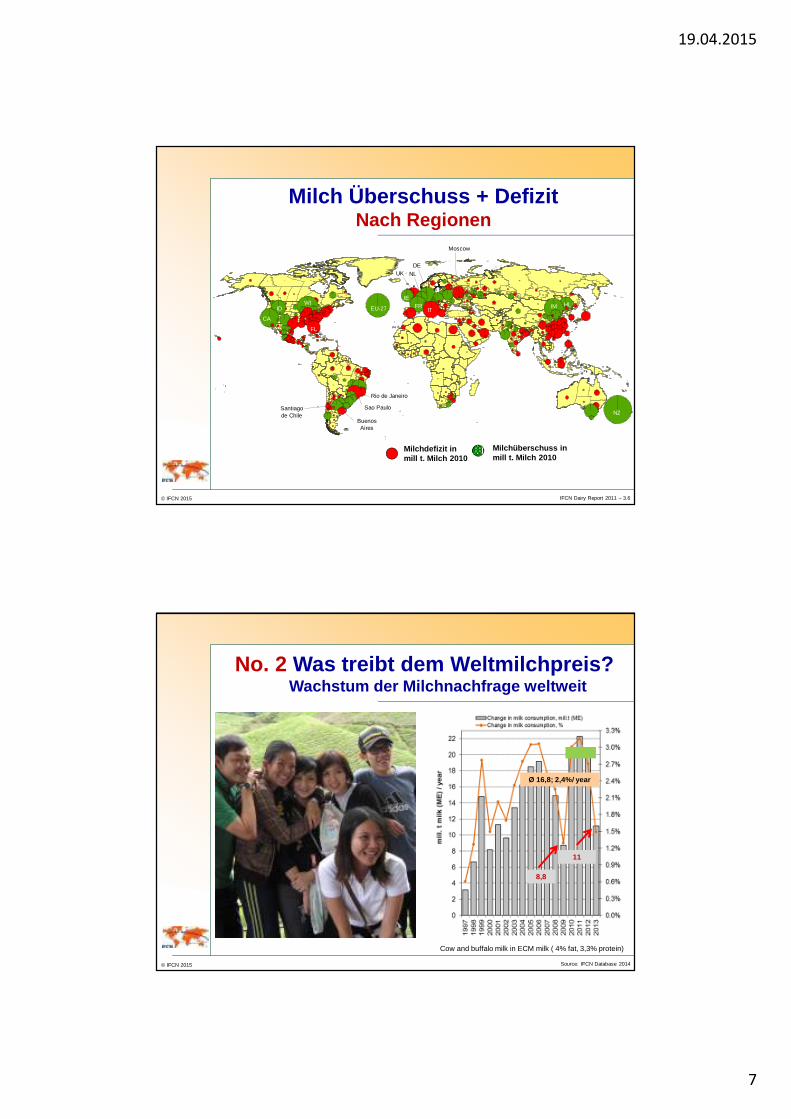
No. 1 Milch Überschuss + DefizitNach Ländern
Source: IFCN Dairy Research Center
Method: Country milk surplus or deficit = dairy exports (in ME) – dairy imports (in ME) +/- dairy stock changes (in ME; if available). ME: milk equivalent (4% fat, 3.3% protein).
Milchdefizit in mill t. Milch
Milchüberschuss in mill t. Milch
19.04.2015
7
© IFCN 2015
Surplus in mill tons
Def icit in mill tons
EU-27
CA
NZ
10.4
IMIT
FL
Santiagode Chile
Rio de Janeiro
Sao Paulo
Moscow
ID FRIE
UK NL
DE
WI HL
BuenosAires
IFCN Dairy Report 2011 – 3.6
Milch Überschuss + DefizitNach Regionen
Milchdefizit in mill t. Milch 2010
Milchüberschuss in mill t. Milch 2010
© IFCN 2015
No. 2 Was treibt dem Weltmilchpreis?Wachstum der Milchnachfrage weltweit
Source: IFCN Database 2014
Cow and buffalo milk in ECM milk ( 4% fat, 3,3% protein)
Ø 16,8; 2,4%/ year
8,8
11

19.04.2015
8
© IFCN 2015 IFCN Dairy Report 2013 – estimates for the year 2013
Milk production decreased (inill tons/year)
Milk production increased (in mill tons/year)
EU
No. 2: Was treibt dem Weltmilchpreis?Wachstum der Milchmenge 2006 – 2013 / Jahr
© IFCN 2015
60 countries analysed (p = milk production, d = milk delivery): EU-28: (d), CIS: Armenia (p), Azerbaijan (p), Belarus (p), Kazakhstan (p), Kyrgyzstan (p), Moldova(p), Russia (p), Tajikistan (p), Ukraine (p), Uzbekistan (p),USA & Canada: Canada (d), USA (p), Latin America: Argentina (p), Brazil (d), Chile (d), Colombia (d), Mexico (p), Peru (d), Uruguay (d), Oceania: Australia (p), New Zealand (p), Asia: Bangladesh (p), China (p), India (p), Indonesia (d), Japan (p), Pakistan (p), Africa: Egypt (d), South Africa (p). Other: Switzerland (d), Turkey (d), Iran (p). Countries included represent 92% of world milk production. Data is preliminary or estimated.
Increase
Decrease
Worldca. + 3%
EU +4,4%USA +4,2%
World milk production – August 2014 vs. 2013
19.04.2015
9
© IFCN 2015
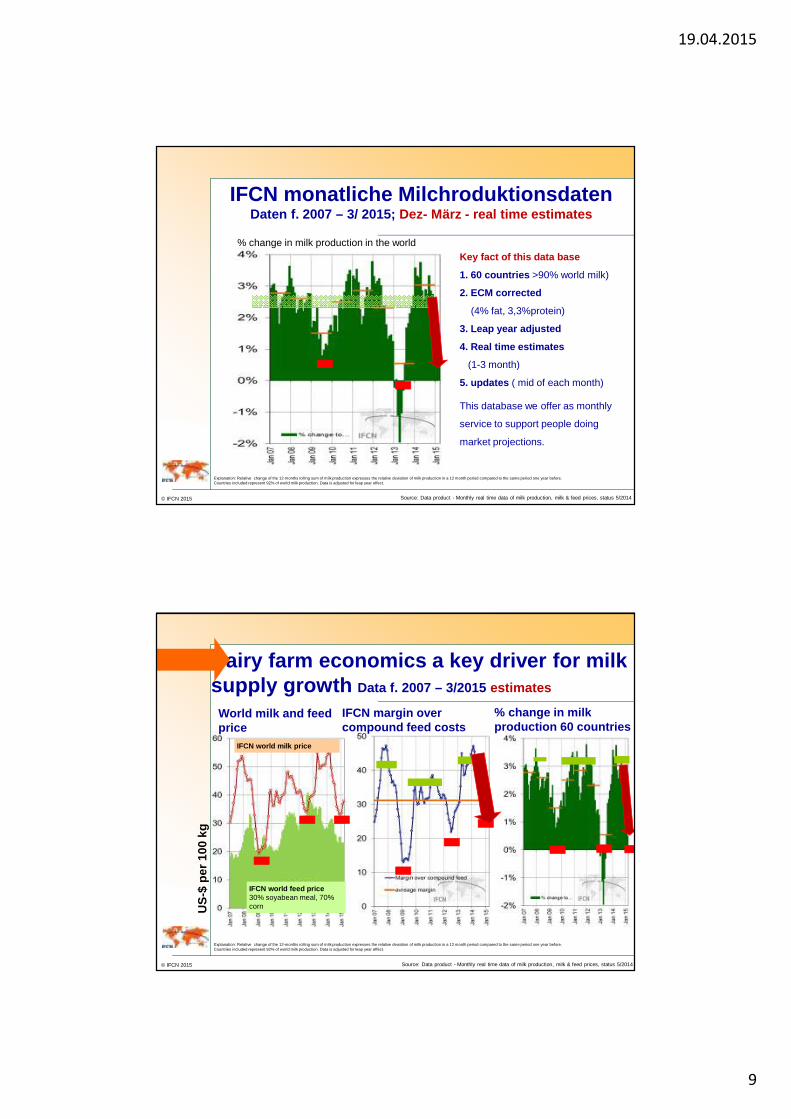
IFCN monatliche MilchroduktionsdatenDaten f. 2007 – 3/ 2015; Dez- März - real time estimates
Source: Data product - Monthly real time data of milk production, milk & feed prices, status 5/2014
Explanation: Relative change of the 12-months rolling sum of milk production expresses the relative deviation of milk production in a 12 month period compared to the same period one year before. Countries included represent 92% of world milk production. Data is adjusted for leap year effect.
Key fact of this data base
1. 60 countries >90% world milk)
2. ECM corrected
(4% fat, 3,3%protein)
3. Leap year adjusted
4. Real time estimates
(1-3 month)
5. updates ( mid of each month)
This database we offer as monthly
service to support people doing
market projections.
% change in milk production in the world
© IFCN 2015
World milk and feed price
IFCN margin over compound feed costs
IFCN world feed price30% soyabean meal, 70% corn
IFCN world milk price
US
-$ p
er 1
00 k
g
Dairy farm economics a key driver for milk supply growth Data f. 2007 – 3/2015 estimates
Source: Data product - Monthly real time data of milk production, milk & feed prices, status 5/2014
Explanation: Relative change of the 12-months rolling sum of milk production expresses the relative deviation of milk production in a 12 month period compared to the same period one year before. Countries included represent 92% of world milk production. Data is adjusted for leap year effect.
% change in milk production 60 countries

19.04.2015
10
© IFCN 2015
Agenda
1. IFCN Methodik
2. Milchpreise
3. Kosten
4. IFCN Outlook 2024
5. Fazit
© IFCN 2015
Milk animals per farm 2012cow & buffalo, incl. IFCN est.
<= 10
> 10 <= 30
> 30 <= 50
> 50 <= 100
> 100
no data
Struktur der Milchproduktion weltweitØ Betriebsgröße in 2012, Kühe und / oder Büffel pro Betrieb
160
77
241
393
147
22
2
3
4
EU-2716
Ø farm size world: 3 cows
13 countries with Ø farm size >100
Countries with Ø farm size >100: DK, GB, CZ, CY, AR, UY, US, AU, NZ, SA, IL, ZA, TW.
238
Sources: Dairy sector database product, IFCN Dairy Research Center
Deutschland Ø farm size 51

19.04.2015
11
© IFCN 2015
Wo stehen wir im weltweiten Vergleich?“Ø große” Betriebe, Milchproduktionskosten in 2012 für 51 Länder
Comment: Average sized farms in the countries, analysed year: 2012 ECM: energy corrected milk (4% fat, 3.3% protein). For the conversion on the left hand side exchange rate used : 1€ = 1.324 US-$.
US
-$ /
100
kg m
ilk (
EC
M)
Source: IFCN Dairy Research Center, Dairy Report 2013
Irland
Ozeanien
AR/UY/CL
„Afrika“
Schweiz, JapanDeutschland
SüdOpportunitätskosten (eigene Arbeit, Boden, Kapital)
Kosten der Gewinn und Verlustrechung - Nebenerlöse
Quotenkosten DK/NL
UK
ChinaDeutschland
Ost, Nord
US
30.2
€/100 kg
45.3
€/100 kg
© IFCN 2015 Source: IFCN Dairy Research Center
Milchproduktionskosten 2000 – 2012Schätzungen für typische Betriebe
USA, Germany, PolandUSA, Germany, Poland
30.2 €/100 kg
Fazit:Kosten anderer Länder bewegensich auf “deutsches” Niveau zu Fazit: Abstand verringert sich

19.04.2015
12
© IFCN 2015 Source: IFCN Dairy Research Center
Produktionskosten Deutschland und USA 2000 – 2015 (Data for typical dairy farms (est. 2014/15)
Cost of milk productionExchange rate US-$/Euro
© IFCN 2015
Agenda
1. IFCN Methodik
2. Milchpreise
3. Kosten
4. IFCN Outlook 2024
5. Fazit

19.04.2015
13
© IFCN 2015
2011 1. Step 900 mill t in 2025 - qualitative work
2013 2. Step: Quantitative work + mile stone in IFCN dev elopment analysis and database for 1996 – 2023globally consistent and comparable
2014 3. Step: Refine, improve and deepen feedback receiv ed in 03/2014 new IFCN Baseline 2024
2015 4. Step: Improvement outlook 2015
IFCN Global Dairy Outlook Methodische Schritte seit 2011
© IFCN 2015
Supply & demand balance Milk supply, demand, Imports/export Self sufficiency
Milk demand details% growth / yearPopulationPer capita consumption
Milk supply details% growth / yearCows & milk yieldFarm number and size
China
Country fact sheets 1996 - 2024

19.04.2015
14
© IFCN 2015 Sources: Dairy sector database and baseline projection product, IFCN Dairy Research Center
+ 2,5%/year
China – Milchentwicklungen bis 2024= Milchproduktion + 4 mill t nachfrage +3%/year , import + 10 mill t
-13%
+ 4 mill t
+ 10 mill t milk
70%
© IFCN 2015 Sources: Dairy sector database and baseline projection product, IFCN Dairy Research Center
EU – Milchentwicklungen bis 2024 => Milchproduktion + 12%, Nachfrage moderate , export + 13 mill t
+ 1%/year
+12 % + 13 million t milk
18% of EU milk to be exported

19.04.2015
15
© IFCN 2015
North Sea coastal regions(DK, DE, BE, NL, FR-North)
sum +0.47 mill t per year
Azores (Portugal): -0.03 mill t per year
FR-Westsum +0.04 mill t per year
Wo in Europa wächst die Milchproduktion?
Milk production decreased in mill t
Milk production increased in mill t
Änderung 2007 - 2012 (partly est.)Änderung 2005 - 2008
North Sea coastal regions(DK, DE, BE, NL, FR-North)
sum +0.55 mill t per year
Azores (Portugal): -0.01 mill t per year
FR-Westsum +0.26 mill t per year
Sources: Dairy sector database, IFCN Dairy Research Center
© IFCN 2015
cow
s pe
r he
rd s
ize
clas
s in
1,0
00’s
size classes, cows per farm: size classes, cows per farm: size classes, cows per farm:
Ø herd size change 1996-2012 2 to 6 30 to 51 47 to 147
Ø change in farm no. -78% -53% -74%
Sources: Dairy sector database product, IFCN Dairy Research Center
Cows move Kriterien für Milchwachstumsregionen 1. Dynamik der Agrarstruktur 1996 – 2012
Polen Frankreich Dänemark

19.04.2015
16
© IFCN 2015
Fazit
Milchangebot: Milchproduktion kann so schnell wachsen wenn Milch/Futterpreis passt, + Wetter + Politik
Source: IFCN Dairy Research Center
Nachfrage: Wir brauchen ca. 20 mill t mehr Milch/ Jahr
Milchpreisniveau: Ca. 45$/ 34€ 100 kg (für das def. Futterpreisniveau)
Zukunft der Milchwirtschaft in der EU/Deutschland: - Deutschland ist international wettbewerbsfähig (generell)
- EU = Weltmilchexporteur No.1 in 2024 ?- Wettbewerbsfähigkeit der Milchproduktion ist eine
Herausforderung überall auf der Welt !!!!- Volatilität von Milch/Futterpreis sind eine
Herausforderung überall auf der Welt.
© IFCN 2015
This presentation is the result of
a large number of people working together
since 2000
Dairy Research Center
Network of companies
Network of researchers
Event hosts 2014
2014 Event hosts