Embed Size (px)
Citation preview
Deutsche Gesellschaft fürTechnische Zusammenarbeit (GTZ) GmbH
SUTP GTZKantor DLLAJ Kota SurabayaJl. Arif Rahman Hakim 131
Telp.+031-9982484Fax: (031) 5996937Email: [email protected]
Internet: http://www.sutp.org
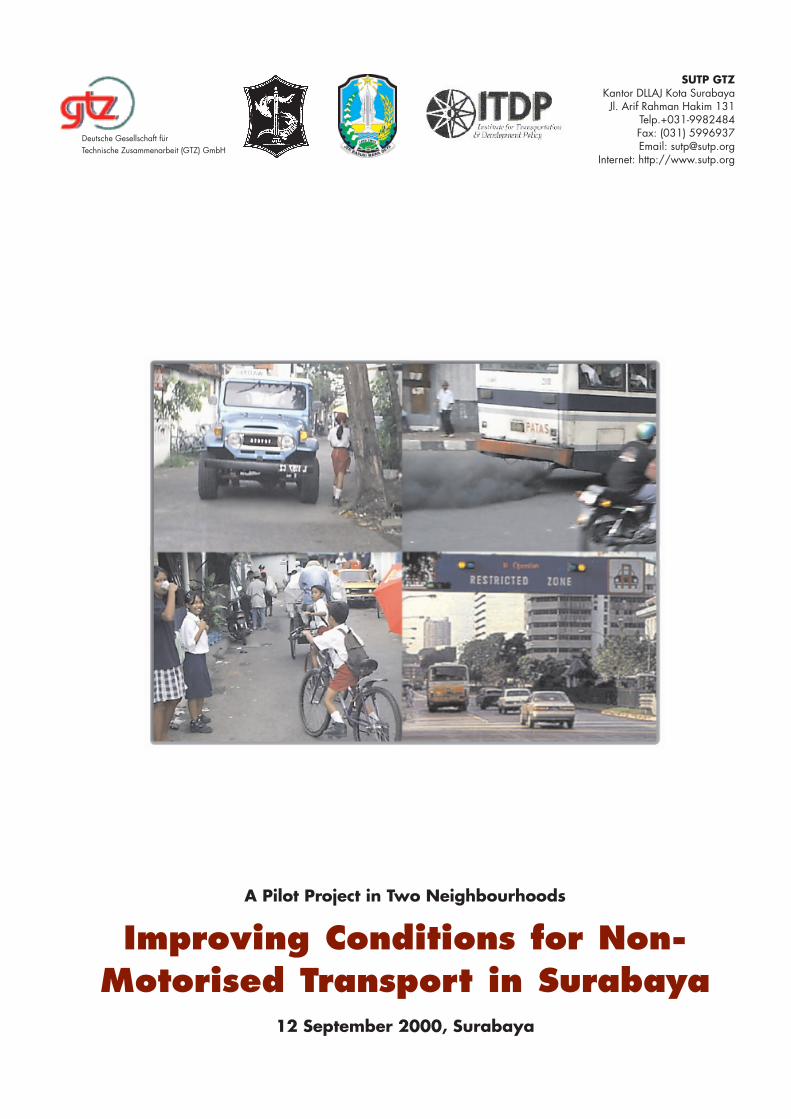
A Pilot Project in Two Neighbourhoods
Improving Conditions for Non-Motorised Transport in Surabaya
12 September 2000, Surabaya
GTZ’s Sustainable Urban Transportation Project (SUTP) in Surabaya aims to work with related agencies and the people of Surabaya to devise and implement policies to establish a
sustainable urban transportation system.
This will result in a broad range of “local” economic, social and environmental benefi ts, and will also contribute to a stabilisation of “global” carbon dioxide emissions from Surabaya’s transport
sector. The project is expected to provide a model of how to reduce such emissions from the transport sector in large cities in
developing countries.
GTZ SUTP has embarked on an ambitious and multifaceted program, including development of sustainable transport policies in intensive consultation with counterparts, design
and implementation of a public awareness campaign, technical measures to reduce vehicle emissions, enhanced air quality management capability, adoption of appropriate fi scal
instruments, improvement of conditions for non-motorized transport and pedestrians, strong promotion of the use of CNG, a public
transport improvements pilot including regulatory and institutional reforms to be applied nationally if successful, and thorough
dissemination of international experiences.
GTZ SUTP commenced in Surabaya in 1998.
Sustainable Urban Transportation ProjectKantor DLLAJ Kota Surabaya
Jl. Arif Rahman Hakim No. 131Telp.+62-31-9982484Fax: +62-31-5996937Email: [email protected]
Internet: http://www.sutp.org
A Pilot Project in Two Neighbourhoods
Improving Conditions for Non-Motorised Transport in Surabaya
12 September 2000, Surabaya
The fi ndings, interpretations and conclusions expressed in this report are based on information gathered by GTZ SUTP and its consultants from reliable sources. GTZ does not, however, guarantee the accuracy or completeness of information in this report, and GTZ cannot be held
responsible for any errors, omissions or losses which emerge from the use of this information.
For further information:
Deutsche Gesellschaft fur Technische Zusammenarbeit (GTZ)
With additional support from
The Changing Horizons Fund of the Tides Foundation
Improving conditions for non-motorized transport: a pilot project in two neighbourhoods
i
CONTENTS
Foreword 1 Executive Summary 2 1. Background on Surabaya and Justification for the Project 3 2. International Agreements and Existing National Standards and
Regulations 5 3. Background on the Surabaya Traffic System and Survey Data
from the Two Study Areas 6 3.1 Modal Split 6 3.2 Vehicle Ownership, Motorized and Non-Motorized 7 3.3 Trip Distances 8
4. Characteristics of Non-Motorized Travel 11 4.1 Non-Motorized Travel and Gender 11 4.2 Non-Motorized Travel and Age 11 4.3 Non-Motorized Travel and Trip Purpose 12 4.4 Non-Motorized Travel and Employment 14 4.5 Implications for the Prioritization of Non-Motorized Infrastructure Improvements 15
5. Characteristics of the Road System and Existing Traffic in the Two Study Areas 15 5.1 Peculiarities of the Surabaya Road Classification System 15 5.2 Sub-Local or Access Roads 19 5.3 Collector and Local Roads 19 5.4 Secondary Arterials 21 5.5 Existing and Planned Primary Arterials 22
6. The Traffic Congestion Impacts of Non-Motorized Travel 23 7. The Economic and Environmental Costs of High Detour-Factors
in the Study Area 26 8. Safety Conditions for Non-Motorized Travel in the Two Study
Areas 29 9. Status of Current Bike and Pedestrian Facilities in the Two
Study Areas 31 10. Proposed Non-Motorized Transport Network and Preliminary
Suggestions for Non-Motorized Vehicle Design Standards 33 11. Concluding Comments and Next Steps 38 SOURCES 41
Improving conditions for non-motorized transport: a pilot project in two neighbourhoods
ii
Annexes • Annex I: Table of Proposed Improvements • Annex II: Arial Intersection and Road Segment Designs, Cross-Sections of
Proposals, • and Visual Representation of Two Pilot Improvements • Annex III: Avoiding Social Conflict with Becak Operators and Vendors:
Lessons from • Jakarta • Annex IV: Minutes of Project Workshop, May 27, 2000 • Annex V: Minutes of Non-Motorized Task Force Meeting, May 2, 2000 • Annex VI: Minutes of Introductory Workshop, April 25, 2000 • Annex VII: Preliminary Project Cost Estimates
Graphs, tables, and maps
Graphs • Graph I: Modal Split of Surabaya, the Two Study Areas, Compared to Tokyo
and Manila • Graph II: Bicycle Ownership Per Capita, Surabaya, Study Areas, Tokyo • Graph III: Trip Lengths by Mode, Surabaya • Graph IV: Average Bicycle Trip Lengths, Surabaya and International
Comparisons • Graph V: Trip Lengths, Two Study Areas • Graph VI: Modal Split by Trip Distance, Kedungdoro Area • Graph VII: Modal Split by Trip Distance, Jemur Sari Area • Graph VIII: Modal Split for Trips Under 3km; Surabaya and Germany
Compared • Graph IX: Gender of Bicyclists, Two Study Areas • Graph X: Gender of Becak Passengers, Two Study Areas • Graph XI: Age of Bicyclists, Two Study Areas • Graph XII: Age of Becak Passengers, Two Study Areas • Graph XIII: Trip Purpose, Pedestrian, Two Study Areas • Graph XIV: Trip Purpose, Becak, Two Study Areas • Graph XV: Trip Purpose, Bicycle, Two Study Areas • Graph XVI: Employment of Bicyclists, Two Study Areas • Graph XVII: Employment of Becak Passengers, Two Study Areas • Graph XVIII: Traffic Fatalities Per Passenger Kilometer Traveled, Surabaya and • International Comparisons • Graph XIX: Traffic Fatalities by Mode of Victim
Improving conditions for non-motorized transport: a pilot project in two neighbourhoods
iii
Tables • Table I: Pedestrian Facility Standards • Table II: Road Classification System, Indonesia • Table III: Lane capacity estimates (by PCUs) • Table IV: Traffic Flow Characteristics by Mode • Table V: Lane Capacity Relative to Needs for Existing Traffic: Project Area • Table VI: Suggested Lane Widths for Different Traffic Mixes: Project Area
Maps • Map I: Road Classification, Kedungdoro Area • Map II: Road Classification, Jemursari Area • Map III: Major Origins and Destinations for Trips Under 3km, Motorized and
Non- • Motorized, Kedungdoro Area • Map IV: Major Origins and Destinations for Trips Under 3km, Motorized and
Non- • Motorized, Jemursari Area • Map V: Traffic Counts, Motorized and Non-Motorized, Kedungdoro Area • Map VI: Traffic Counts, Motorized and Non-Motorized, Jemursari Area • Map VII: Streets where Becaks are Banned, Kedungdoro Area • Map VIII: Streets where Becaks are Banned, Jemursari Area • Map IX: Existing Non-Motorized Transport Facilities, Kedungdoro Area • Map X: Existing Non-Motorized Transport Facilities, Jemursari Area • Map XI: Black Spot Analysis, Kedungdoro Area • Map XII: Black Spot Analysis, Jemursari Area • Map XIII: Proposed Non-Motorized Transport Improvements, Kedungdoro
Area • Map XIV: Proposed Non-Motorized Transport Improvements, Jemursari Area
Improving conditions for non-motorized transport: a pilot project in two neighbourhoods
1
FOREWORD The proposals made in this report were developed through consultations between the Project Team (Dr. Walter Hook of ITDP, Darmaningtyas, Abdul Hakim, and Erlin of LPIST, and Dino Teddyputra, Karl Fjellstrom, and others from GTZ), and a Non-Motorized Transport Task Force initiated by the project among the relevant government ministries, NGOs, and stakeholders. The project was primarily funded by GTZ, but additional support to ITDP was also provided by a grant from the Changing Horizons Fund of the Tides Foundation.
The contents of this document are the views of the individual authors alone, and do not necessarily reflect the views of GTZ, ITDP, LPIST, the Tides Foundation, or the Municipality of Surabaya. Any factual errors are the fault of the authors alone.
Ultimately, the further development and implementation of these proposals will be the responsibility of the intergovernmental Task Force. This Task Force has met three times. The first meeting, held on April 25, discussed the intentions of the pilot project, and the results of the household and roadside surveys and non-motorized traffic counts. The second meeting was held on May 2, 2000, where initial interventions and target locations were discussed. The third meeting was held on May 26, 2000, where a non-motorized transport network was proposed for the two areas, and initial design conceptions were displayed and discussed. The minutes of these meetings are included as annexes.
Improving conditions for non-motorized transport: a pilot project in two neighbourhoods
2
EXECUTIVE SUMMARY By international standards, Surabaya has an extremely high mode share of private motorized trips (predominantly motorcycle) relative to per capita incomes, despite the fact that average trip distances “as the crow flies” are extremely short. Non-motorized trips are nonetheless a critical part of the transportation system, while collective forms of transport are much less important than in other regional cities of similar income and density. Motorized travel speeds are currently high for a central urban area, indicating a relatively efficient long distance travel system. Short distance travel, by contrast, is quite inefficient, as indicated by exceptionally high detour factors for short urban trips (under 3km). This is due primarily to the one-way traffic system, but complicated by the weak secondary street network, safety problems on the main arterials, and lack of infrastructure for non-motorized traffic. Access problems resulting from inhibited short to medium distance trips are addressed somewhat by the presence of vendors along major arterials, greatly improving access for small commodities, but creating conflicts with both motorized and non-motorized traffic flow in some locations. However, even low income people are forced to use motorized travel even for extremely short trips, leading to conditions where the working poor spend an estimated 20% of their household income on transport. Improved conditions for non-motorized travel in the study area would yield $250,000 in benefits to these low income families each year. The vehicles they rely on, predominantly two-stroke engine motorcycles, are also extremely polluting. If the modal split for trips under 3km just in the two study areas in Surabaya were brought to the same level of non-motorized trips as in Germany, CO2 emissions could be reduced by 680 tons per year. Reducing the reliance of the poor on motorized travel, meanwhile, would reduce political resistance to tighter tailpipe emission standards and the removal of oil subsidies.
Finally, even with available data, Surabaya has one of the most unsafe traffic systems in the world, and the data is underestimating deaths and dramatically underestimating accidents. The one-way system creates extremely wide roads with no traffic islands, making it extremely difficult for pedestrians to cross safely. Heavily obstructed sidewalks or lack of sidewalks, very poor visibility at night, the absence of any traffic calming measures, the lack of traffic lights particularly for left-turning vehicles, and the high traffic speeds also contribute to extremely unsafe conditions which are inhibiting travel.
Design features of a non-motorized transportation network in the two pilot areas are suggested and partially developed. These design features would facilititate safe non-motorized trips in two-directions on both sides of one-way arterials, greatly reducing detour factors and hence vehicle kilometers traveled between short to medium distance origins and destinations. Extremely modest widening of some kampung streets in some strategic locations would also make possible the reduction of detour factors and the bypassing of major arterials for some trips. These interventions would also encourage a shift from motorized trips with low capacity/flow ratios and high levels of emissions to pedestrian and bicycle trips with much higher capacity flow ratios and no emissions. Measures to improve pedestrian and non-motorized vehicle (NMV) users safety are also proposed. If the one-way system is to be retained, traffic islands for pedestrian protection are necessary both at intersections and points of heavy NMT crossing activity mid-block. Increasing the number of signalized intersections, and introducing a phase which stops left-turning vehicles to allow NMT to cross is also critical. Improving street lighting at pedestrian crossings, and raising the pedestrian cross-walks is also suggested.
Improving conditions for non-motorized transport: a pilot project in two neighbourhoods
3
1. BACKGROUND ON SURABAYA AND JUSTIFICATION FOR THE PROJECT
Surabaya is a city with a 1990 population of 2,473,722 people, some 374 square kilometers in area, on the East coast of the island of Java. It is some 17 km North to South, and some 22 km East to West. Like elsewhere in Indonesia, per capita incomes declined sharply with the economic crisis in 1997, from around $1200 to $400 per year, with minimum salaries now around $300 per year.
While traffic engineers have developed a one-way traffic system which has maintained relatively high traffic speeds, around 40 kph along the major arterials, these traffic speeds have been achieved to a certain extend at the expense of the directness of the route network. The impact of the one-way system on motorized vehicles alone is to increase daily passenger car unit kilometers traveled by 7,015km, and increase travel times by 265 hours per peak hour on an average day. (SITNP II) This one-way system has particularly serious consequences for slow-moving vulnerable road users, as the detours it causes are magnified in terms of time by the slow speeds. Little attention has been paid by traffic planners to the needs of public transportation passengers or non-motorized road users. Many sidewalks in the two study areas are either non-existent, poorly designed and badly maintained, or obstructed by trees, pedestrian overpasses, telephone booths, or vendors. While bicycles and pedestrians are legally allowed to operate on all urban roads except toll roads, non-motorized pedicabs (becaks) are not allowed on 25 major urban arterials, according to a Municipal Decree (226/1993), though the law is currently not tightly enforced. Becaks are also selectively banned on other streets by the request of local communities. Non-motorized passengers generally find the physical environment hostile, and their needs ignored, despite the fact that these modes are generally the least polluting, and are relatively efficient users of scarce road space.
The number of motor vehicles in Surabaya has grown with extraordinary speed. The vehicle fleet has increased 7% annually over the last decade, and the growth rate continued despite the economic crisis. This rapid motorization threatens the future of the city's mobility, and is damaging public health. The SITNP II, Report B3, has estimated that by 2010, more than 50% of the main road network in Surabaya will operate at traffic volumes above the capacity of the road system, at speeds of under 10km/hour. To simply maintain current levels of congestion through new road construction would cost an estimated US$3.2 billion. (based on 1996 costs). SITNP I study has estimated that without a significant change in public policy there will be an increase in the volume of private car trips of as much as 77% by 2010, whereas public transportation trips will only increase by 23%. While data on non-motorized trips is difficult to compare, this project’s survey results, compared to earlier surveys (SITNP II; Kuranami, 1994) indicate that non-motorized trips are falling as a share of total trips.
The health impacts of this rapid motorization are serious. While the availability of accurate air quality data in Surabaya is severely limited by broken, misplaced or misused monitoring equipment, tests of blood lead levels in Surabaya indicated some of the highest levels of lead poisoning, presumably largely from motor vehicle exhaust, observed anywhere in the world. The likely impact of such high lead levels in children is retarded mental development. NOx, and particulates are also well above WHO air quality guidelines, causing numerous premature deaths due to upper respiratory illness. Existing research is unequivocal about the decreasing air quality in Surabaya due to the growing dominance of motor vehicles.
Traffic safety is also a serious problem. Surabaya is one of the most dangerous cities in the world by some indicators, even based on existing data, which greatly under-reports accident victims. Vulnerable road users constitute 27% of reported accident victims, and motorcyclists account for another 46% of the victims.
Improving conditions for non-motorized transport: a pilot project in two neighbourhoods
4
The declining number of trips by non-motorized modes is not a result of increasing wealth and economic development. In the last two decades, as a share of total trips, trips by bicycle increased by 50% in the U.S., (though from a very low base line), increased from 26% to 27% of the mode share in the Netherlands, and increased from 7% to 12% of the mode share in Germany. (Pucher and Dijkstra, 2000; Replogle, 1994) This contrasts dramatically with declining bike and other non-motorized travel in Surabaya. Clearly, increasing wealth is not the issue. Rather, it is related more to government restrictions on non-motorized travel, and deteriorating safety and environmental conditions faced acutely by non-motorized travelers.
The one-way system, the lack of functioning traffic lights, the poor conditions or lack of sidewalks in many areas, and many measures to speed up motorized traffic have created an unsafe environment for cyclists and pedestrians. Due to the lack of an interconnected secondary street network, non-motorized passengers rely on the major avenues for parts of most trips, even short distance trips. Lack of special facilities for non-motorized traffic along the major roads makes even these relatively short trips difficult and dangerous. Most cyclists willing to brave the major avenues are street vendors, while students, civil servants, private employees, and other citizens restrict their bicycle trips to local shops and schools and avoid the main avenues when they can. Parking lots also do not provide secure facilities for bicycles.
The deteriorating quality of life in downtown Surabaya has for many years been driving businesses to relocate to more remote locations where the air is cleaner and there is less noise and congestion. As a result, many of the shops downtown, which closed during the economic crisis, have still not re-opened. Despite the considerable privileges allowed to private motorists, motor vehicle parking is severely constrained by high population densities, which is a primary reason why many families rely on highly polluting, noisy, and unsafe motorcycles.
The impact of constrained non-motorized travel on the poor is also particularly severe. The study data indicates that roughly 25% of household income among the working poor is spent on transport, despite heavily subsidized fuel costs. The prevalence of bicycle trip lengths greater than 15 kilometers in cities like Berlin, New York, Beijing, New Delhi, and Shanghai indicates that virtually all origins and destinations within Surabaya would be accessible by bicycle at much lower cost to the poor, were the cycling environment safe and pleasant. The fact that motorcycle ownership even among low income families is actually higher than much less expensive bicycles, show that ownership costs of the vehicle are not a significant obstacle to bicycle travel in Surabaya. Thus, disposable household incomes and family savings and asset accumulation among the working poor could be increased dramatically were non-motorized trips possible. The importance of employment as becak drivers, bemo, angkot, and microlet drivers should also not be underestimated, as attempts to curtail any of these modes have led to violent social upheavals in other parts of Indonesia.
Residents cite many obstacles to increasing non-motorized travel in Surabaya. Climate is the most frequently cited, referring mainly to the heat. Average temperatures are indeed high, but similar temperatures are also sometimes seen in Europe in the summer, without substantial decreases in the mode share of cycling. Even higher temperatures are typical in India, where the mode share for bicycles is much higher. Southern China and Vietnam also have much higher bicycle use, and similar temperatures. The terrain is Surabaya is flat, facilitating bike use. Communities still hold a high regard for intimate neighborhoods and familiarity; cultural attributes which should be conducive to traffic calmed communities and safer, quieter, bicycle use.
There is, of course, cultural resistance to bicycling, as cyclists are associated with lower income, lower status populations. The importance of social status should not be underestimated, and traffic planners concerned about the environment should do what they can to elevate the status of this modern, clean form of transportation. It should be pointed out, however, that in other
Improving conditions for non-motorized transport: a pilot project in two neighbourhoods
5
Indonesian cities, such as Jogjakarta, there is little or no stigma associated with cycling. Drivers, often feeling pedestrians, cyclists, and becaks are of lower status, do not yield to these modes, creating unsafe conditions. Bicycle riders, especially older ones, often feel unsafe and uncomfortable during a ride, and are often harassed by motorists. Pedestrians, generally without comfortable sidewalks, and few good road-crossings, also face a hostile environment. Such cultural attitudes are also familiar in the West, but traffic planners have developed methods of dealing with these problems, such as pedestrian islands and other traffic calming measures.
2. INTERNATIONAL AGREEMENTS AND EXISTING NATIONAL STANDARDS AND REGULATIONS
Indonesia is a signatory to several international agreements which mention non-motorized transport. As a signatory of Agenda 21 at the Earth Summit in Rio de Janeiro, Indonesia agreed to Article 7.53 (c) which commits them to:
7.53. (c) Encourage non-motorized modes of transport by providing safe cycle-ways and foot-ways in urban and suburban centers in countries, as appropriate.
As a signatory of the Global Plan of Action at the Habitat II Conference in Istanbul, the Indonesian Government also agreed to Article 150, which reads:
150. Non-motorized transport is a major mode of mobility, particularly for low-income, vulnerable and disadvantaged groups. One structural measure to counteract the socio-economic marginalization of these groups is to foster their mobility by promoting these affordable, efficient and energy-saving modes of transport.
Further, in Article 151, the Indonesian Government agreed to:
(c) Encourage the use of optimal modal composition of transport including walking, cycling, and private and public means of transportation, through appropriate pricing, spatial settlements policies and regulatory measures; [and to...]
(d) Promote and implement disincentive measures that discourage the increasing growth of private motorized traffic and reduce congestion which is damaging environmentally, economically, socially and to human health and safety, through pricing, traffic regulation, parking, and land-use planning, traffic calming methods, and by providing or encouraging effective alternative transport methods, particularly to the most congested areas.
At the national level, the Department of Public Works has recently established a set of standards for pedestrian facilities.(Pedoman Teknis: Perekayasaan Fasilitas Pejalan Kaki Diwilayah Kota, 1997) In most places they have yet to be implemented. The new pedestrian standards state that any road 8 meters in width or greater with a road classification of Local (IIIC) or above (as explained below) must have sidewalks on both sides of the street. The only exception to this is in residential areas, where a sidewalk is only required on one side of the street on a Local road. Within certain minimum standards (listed in Table I) the width of the sidewalk is then determined based on the flow of pedestrians and the flow of motor vehicles on the road, and the land use around the sidewalk. Further, the guidelines indicate that the pedestrian routes should be a) continuous and direct, b) safe, c) comfortable, flat, not slippery, and sufficiently wide, d) visible and clear of obstacles.
In preparing our recommendations below, we have followed these sidewalk standards. No similar standards have yet been established for non-motorized vehicles, but some tentative guidelines are suggested below.
Improving conditions for non-motorized transport: a pilot project in two neighbourhoods
6
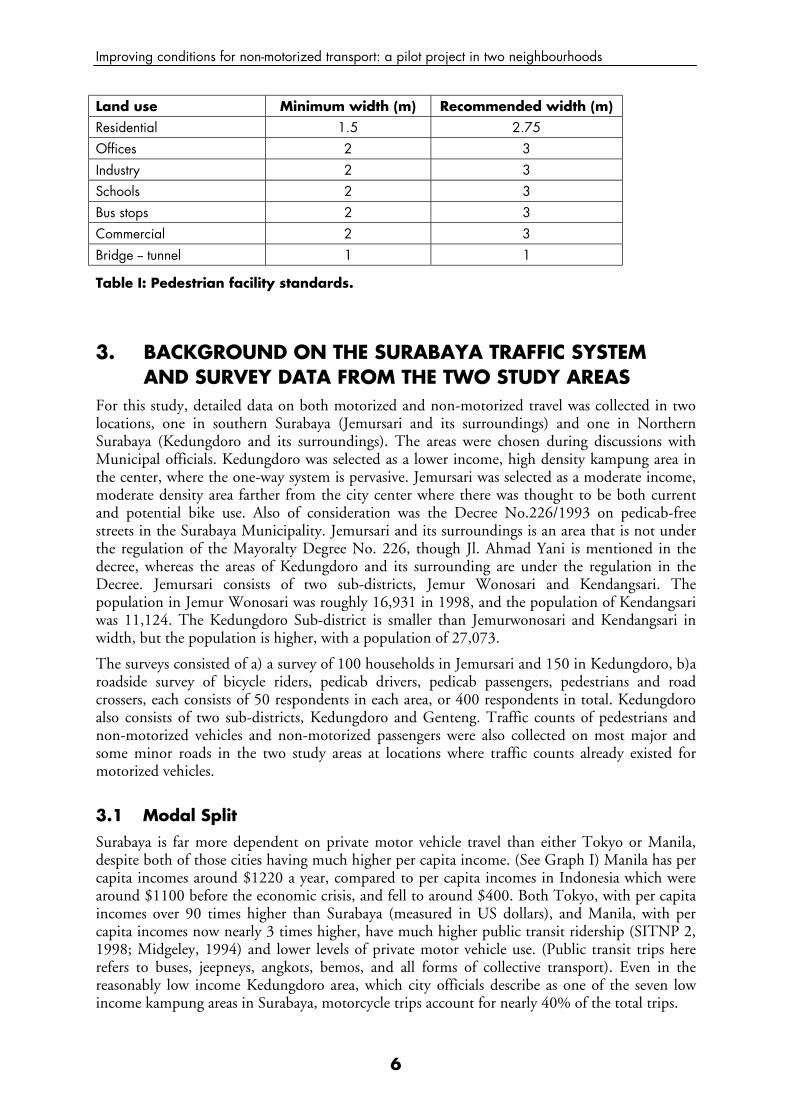
Land use Minimum width (m) Recommended width (m) Residential 1.5 2.75 Offices 2 3 Industry 2 3 Schools 2 3 Bus stops 2 3 Commercial 2 3 Bridge -- tunnel 1 1
Table I: Pedestrian facility standards.
3. BACKGROUND ON THE SURABAYA TRAFFIC SYSTEM AND SURVEY DATA FROM THE TWO STUDY AREAS
For this study, detailed data on both motorized and non-motorized travel was collected in two locations, one in southern Surabaya (Jemursari and its surroundings) and one in Northern Surabaya (Kedungdoro and its surroundings). The areas were chosen during discussions with Municipal officials. Kedungdoro was selected as a lower income, high density kampung area in the center, where the one-way system is pervasive. Jemursari was selected as a moderate income, moderate density area farther from the city center where there was thought to be both current and potential bike use. Also of consideration was the Decree No.226/1993 on pedicab-free streets in the Surabaya Municipality. Jemursari and its surroundings is an area that is not under the regulation of the Mayoralty Degree No. 226, though Jl. Ahmad Yani is mentioned in the decree, whereas the areas of Kedungdoro and its surrounding are under the regulation in the Decree. Jemursari consists of two sub-districts, Jemur Wonosari and Kendangsari. The population in Jemur Wonosari was roughly 16,931 in 1998, and the population of Kendangsari was 11,124. The Kedungdoro Sub-district is smaller than Jemurwonosari and Kendangsari in width, but the population is higher, with a population of 27,073.
The surveys consisted of a) a survey of 100 households in Jemursari and 150 in Kedungdoro, b)a roadside survey of bicycle riders, pedicab drivers, pedicab passengers, pedestrians and road crossers, each consists of 50 respondents in each area, or 400 respondents in total. Kedungdoro also consists of two sub-districts, Kedungdoro and Genteng. Traffic counts of pedestrians and non-motorized vehicles and non-motorized passengers were also collected on most major and some minor roads in the two study areas at locations where traffic counts already existed for motorized vehicles.
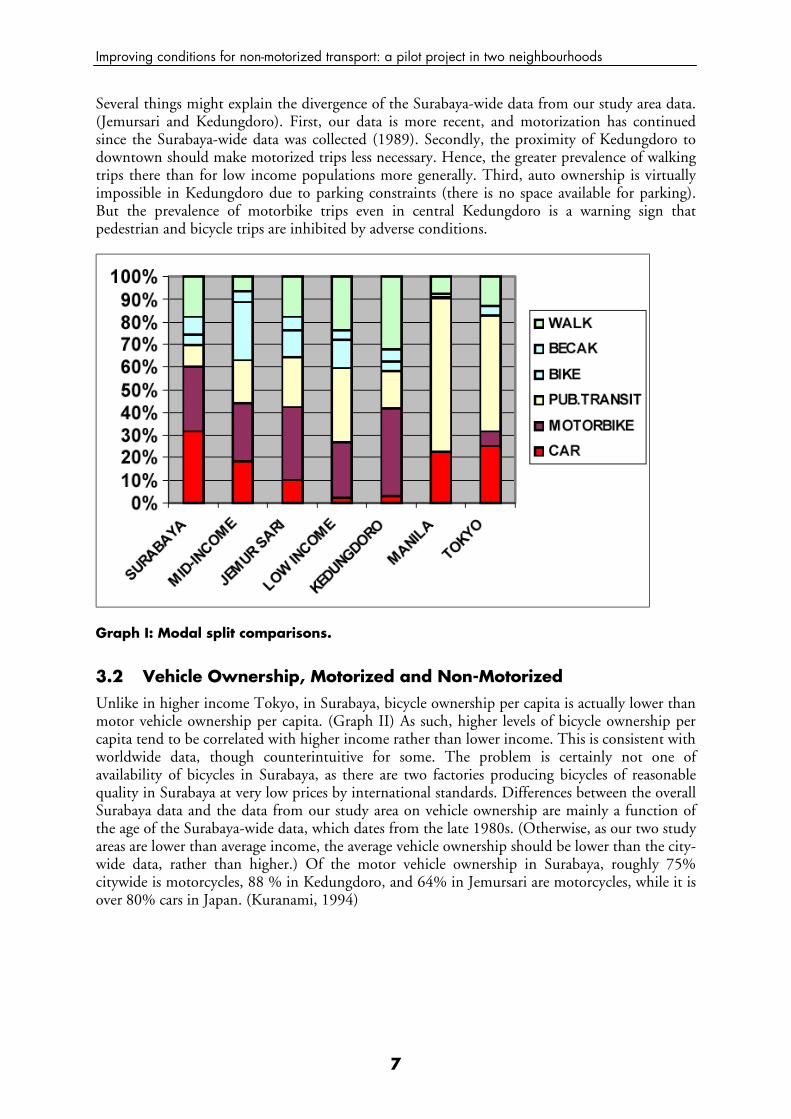
3.1 Modal Split Surabaya is far more dependent on private motor vehicle travel than either Tokyo or Manila, despite both of those cities having much higher per capita income. (See Graph I) Manila has per capita incomes around $1220 a year, compared to per capita incomes in Indonesia which were around $1100 before the economic crisis, and fell to around $400. Both Tokyo, with per capita incomes over 90 times higher than Surabaya (measured in US dollars), and Manila, with per capita incomes now nearly 3 times higher, have much higher public transit ridership (SITNP 2, 1998; Midgeley, 1994) and lower levels of private motor vehicle use. (Public transit trips here refers to buses, jeepneys, angkots, bemos, and all forms of collective transport). Even in the reasonably low income Kedungdoro area, which city officials describe as one of the seven low income kampung areas in Surabaya, motorcycle trips account for nearly 40% of the total trips.
Improving conditions for non-motorized transport: a pilot project in two neighbourhoods
7
Several things might explain the divergence of the Surabaya-wide data from our study area data. (Jemursari and Kedungdoro). First, our data is more recent, and motorization has continued since the Surabaya-wide data was collected (1989). Secondly, the proximity of Kedungdoro to downtown should make motorized trips less necessary. Hence, the greater prevalence of walking trips there than for low income populations more generally. Third, auto ownership is virtually impossible in Kedungdoro due to parking constraints (there is no space available for parking). But the prevalence of motorbike trips even in central Kedungdoro is a warning sign that pedestrian and bicycle trips are inhibited by adverse conditions.
Graph I: Modal split comparisons.
3.2 Vehicle Ownership, Motorized and Non-Motorized Unlike in higher income Tokyo, in Surabaya, bicycle ownership per capita is actually lower than motor vehicle ownership per capita. (Graph II) As such, higher levels of bicycle ownership per capita tend to be correlated with higher income rather than lower income. This is consistent with worldwide data, though counterintuitive for some. The problem is certainly not one of availability of bicycles in Surabaya, as there are two factories producing bicycles of reasonable quality in Surabaya at very low prices by international standards. Differences between the overall Surabaya data and the data from our study area on vehicle ownership are mainly a function of the age of the Surabaya-wide data, which dates from the late 1980s. (Otherwise, as our two study areas are lower than average income, the average vehicle ownership should be lower than the city-wide data, rather than higher.) Of the motor vehicle ownership in Surabaya, roughly 75% citywide is motorcycles, 88 % in Kedungdoro, and 64% in Jemursari are motorcycles, while it is over 80% cars in Japan. (Kuranami, 1994)
Improving conditions for non-motorized transport: a pilot project in two neighbourhoods
8
Graph II: Vehicles per 1000 population.
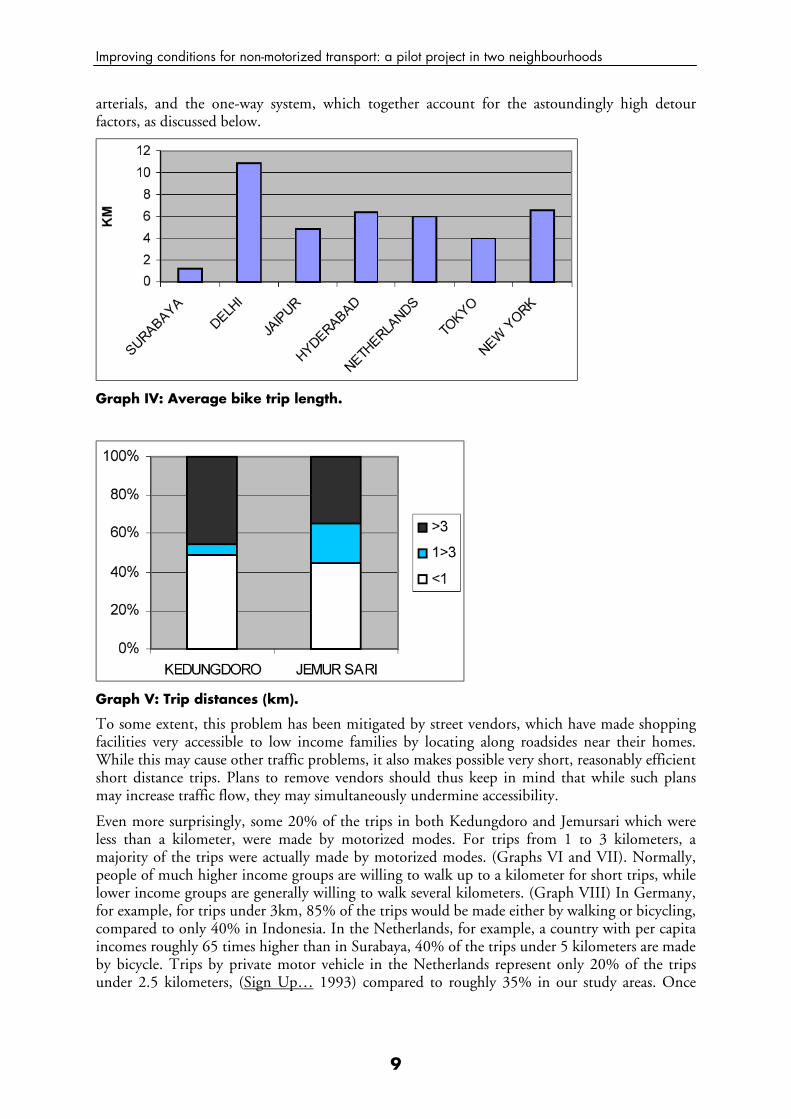
3.3 Trip Distances Non-motorized trip lengths in Surabaya are remarkably short, if measured 'as the crow flies.' (Graph III) There is a remarkable drop in average trip length between the motorized and the non-motorized modes. The high 'detour factors' discussed at length below will make actual trip distances for non-motorized trips much longer. Nonetheless, the breadth of the difference is marked. In Dutch and US cities, with incomes 30 to 40 times income levels in Surabaya, average bike trip lengths tend to be much longer than in Surabaya. If income were a factor, one would expect that the lower income country would have the longer average cycling distances. (See Graph IV). In Delhi, with average temperatures considerably higher than in Surabaya, average bicycle trip distances are over 10 kilometers. Climate, therefore, cannot be said to explain the difference.
Graph III: Average trip length in Surabaya.
In Surabaya, which is only some 17 kilometers North to South, and about 22 kilometers East to West, virtually all trips within the city are within feasible cycling range. Average trip lengths in aggregate for the two study areas are extremely short, with 50% of trips less than 3 km. (Graph V) This is not entirely surprising in Kedungdoro, near the town center, but even in moderate-income Jemursari, 65% of trips were less than 3km. In fact, some who have cycled and taken taxis for similar routes have found travel speeds to be higher on bicycle during periods of congestion. Thus, far more trips could be made by non-motorized means than are currently were conditions improved. While cultural factors may be an issue, the severe constraints on non-motorized vehicle travel in Surabaya, are largely the result of poor safety conditions on the major
Improving conditions for non-motorized transport: a pilot project in two neighbourhoods
9
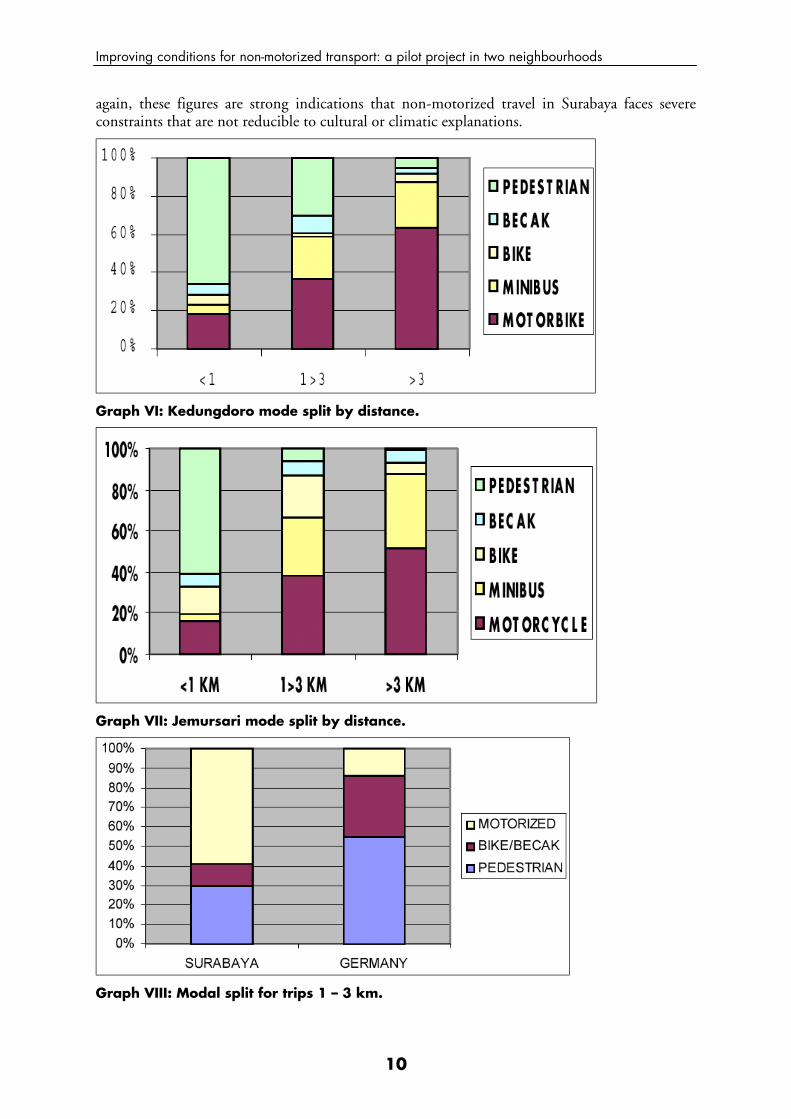
arterials, and the one-way system, which together account for the astoundingly high detour factors, as discussed below.
Graph IV: Average bike trip length.
Graph V: Trip distances (km).
To some extent, this problem has been mitigated by street vendors, which have made shopping facilities very accessible to low income families by locating along roadsides near their homes. While this may cause other traffic problems, it also makes possible very short, reasonably efficient short distance trips. Plans to remove vendors should thus keep in mind that while such plans may increase traffic flow, they may simultaneously undermine accessibility.
Even more surprisingly, some 20% of the trips in both Kedungdoro and Jemursari which were less than a kilometer, were made by motorized modes. For trips from 1 to 3 kilometers, a majority of the trips were actually made by motorized modes. (Graphs VI and VII). Normally, people of much higher income groups are willing to walk up to a kilometer for short trips, while lower income groups are generally willing to walk several kilometers. (Graph VIII) In Germany, for example, for trips under 3km, 85% of the trips would be made either by walking or bicycling, compared to only 40% in Indonesia. In the Netherlands, for example, a country with per capita incomes roughly 65 times higher than in Surabaya, 40% of the trips under 5 kilometers are made by bicycle. Trips by private motor vehicle in the Netherlands represent only 20% of the trips under 2.5 kilometers, (Sign Up… 1993) compared to roughly 35% in our study areas. Once
Improving conditions for non-motorized transport: a pilot project in two neighbourhoods
10
again, these figures are strong indications that non-motorized travel in Surabaya faces severe constraints that are not reducible to cultural or climatic explanations.
Graph VI: Kedungdoro mode split by distance.
Graph VII: Jemursari mode split by distance.
Graph VIII: Modal split for trips 1 – 3 km.
Improving conditions for non-motorized transport: a pilot project in two neighbourhoods
11
4. CHARACTERISTICS OF NON-MOTORIZED TRAVEL Before suggesting how conditions for non-motorized travel might be improved, more must be said of the function of these modes in the overall transportation system. As little information had been collected in Surabaya or Indonesia on the characteristics of non-motorized travelers, this study collected some baseline information.
4.1 Non-Motorized Travel and Gender Perhaps the most notable finding of the survey was that while most bicyclists are men, most becak passengers were women. (Graphs IX and X) This is consistent with patterns in most of the world. Women, generally responsible for the shopping, are more dependent on becaks (or cycle rickshaws) for their household travel needs than are men. While some countries have strong restrictions against women riding bicycles, this does not seem to be true in Surabaya, where a significant number of bicyclists were indeed women. The maximum age of women cyclists observed, however, was 38, indicating that either it was not as culturally accepted for women to bicycle in the past, or it is not as acceptable for middle-aged and older women to bicycle, or women above that age are making fewer trips.
Graph IX: NMT trips by gender, Kedungdoro.
Graph X: NMT trips by gender, Jemursari.
4.2 Non-Motorized Travel and Age In terms of the age of typical bicyclists and becak passengers, most bicyclists tend to be teenagers and young and middle-aged adults, and there are very few bicyclists over the age of 50. (Graphs XI and XII). Becak passengers, by contrast, also tend to be adults, but they are older. There are virtually no teenagers riding in becaks, and there are a significant number of elderly people even in their 70s and 80s that are becak passengers. Again, the population that depends on becaks for
Improving conditions for non-motorized transport: a pilot project in two neighbourhoods
12
their basic mobility tends to be women, the elderly, and the disabled. Restrictions on their use, then, are restrictions on the basic mobility of women and the aged of moderate and lower income groups. As virtually all people have to walk for at least part of their trip, the age and gender breakdown for pedestrians was, as expected, more or less randomly distributed.
Graph XI: Age of cyclists.
Graph XII: Age of becak passengers.
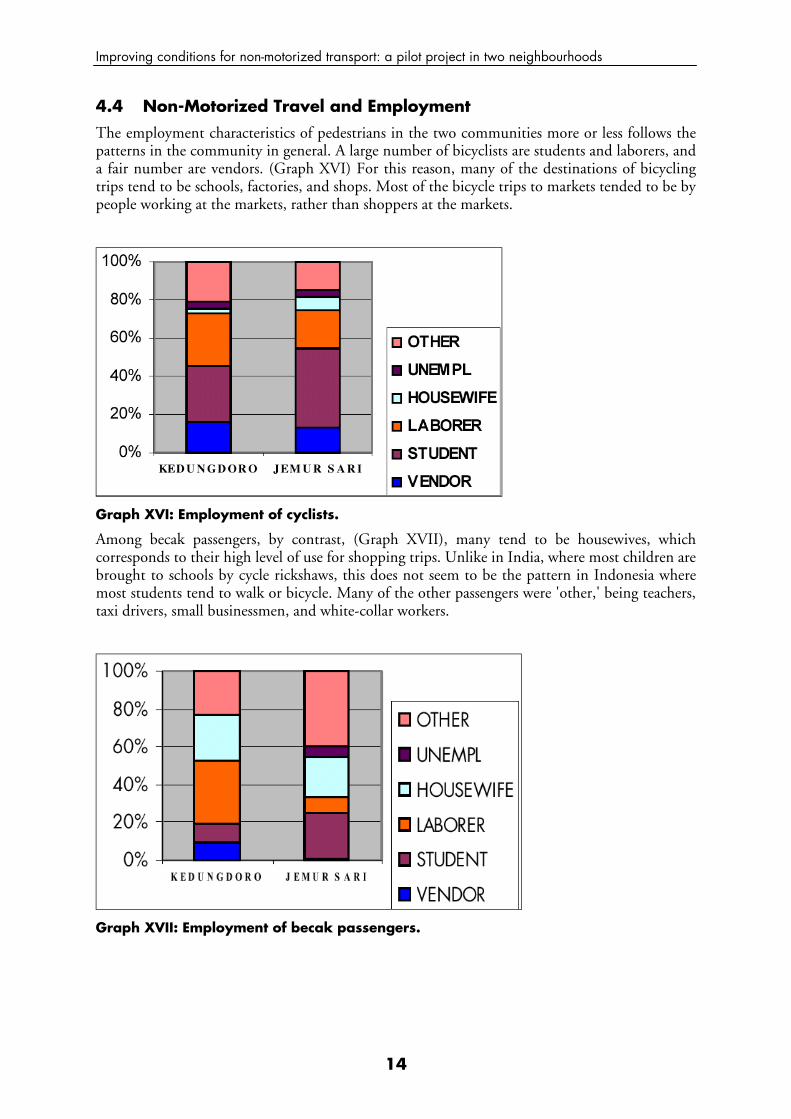
4.3 Non-Motorized Travel and Trip Purpose In terms of trip purpose, (Graphs XIII - XV), pedestrian trips are fairly diverse, but tend to be concentrated on work trips, shopping trips, and school trips. Trips to mosques were also fairly significant in number, as people tend to walk to mosques and these trips are made frequently by more devout people. Becak trips, by contrast, are heavily dominated by shopping trips, and trips to medical facilities. The importance of becaks for moving people who are ill out of inaccessible kampungs to medical facilities should not be underestimated. Given the infrequency of medical trips per se, the number of medical trips by becak is very high. Bicycle trips, by contrast, tend to be dominated by school trips and work trips. While the surveys did not collect information on the reasons, it is perhaps related to concerns about safe parking facilities for bicycles at markets.
Improving conditions for non-motorized transport: a pilot project in two neighbourhoods
13
Graph XIII: Trip purpose, pedestrian.
Graph XIV: Becak trip purpose.
Graph XV: Bicycling trip purpose.
Improving conditions for non-motorized transport: a pilot project in two neighbourhoods
14
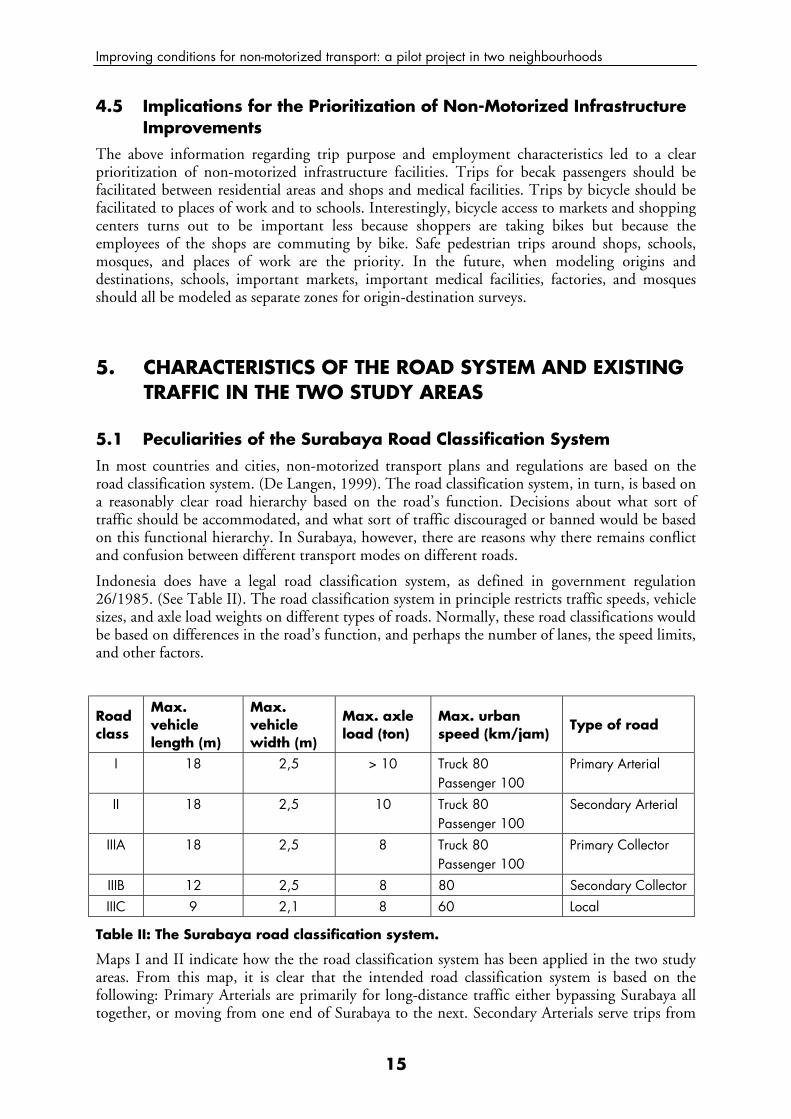
4.4 Non-Motorized Travel and Employment The employment characteristics of pedestrians in the two communities more or less follows the patterns in the community in general. A large number of bicyclists are students and laborers, and a fair number are vendors. (Graph XVI) For this reason, many of the destinations of bicycling trips tend to be schools, factories, and shops. Most of the bicycle trips to markets tended to be by people working at the markets, rather than shoppers at the markets.
Graph XVI: Employment of cyclists.
Among becak passengers, by contrast, (Graph XVII), many tend to be housewives, which corresponds to their high level of use for shopping trips. Unlike in India, where most children are brought to schools by cycle rickshaws, this does not seem to be the pattern in Indonesia where most students tend to walk or bicycle. Many of the other passengers were 'other,' being teachers, taxi drivers, small businessmen, and white-collar workers.
Graph XVII: Employment of becak passengers.
Improving conditions for non-motorized transport: a pilot project in two neighbourhoods
15
4.5 Implications for the Prioritization of Non-Motorized Infrastructure Improvements
The above information regarding trip purpose and employment characteristics led to a clear prioritization of non-motorized infrastructure facilities. Trips for becak passengers should be facilitated between residential areas and shops and medical facilities. Trips by bicycle should be facilitated to places of work and to schools. Interestingly, bicycle access to markets and shopping centers turns out to be important less because shoppers are taking bikes but because the employees of the shops are commuting by bike. Safe pedestrian trips around shops, schools, mosques, and places of work are the priority. In the future, when modeling origins and destinations, schools, important markets, important medical facilities, factories, and mosques should all be modeled as separate zones for origin-destination surveys.
5. CHARACTERISTICS OF THE ROAD SYSTEM AND EXISTING TRAFFIC IN THE TWO STUDY AREAS
5.1 Peculiarities of the Surabaya Road Classification System In most countries and cities, non-motorized transport plans and regulations are based on the road classification system. (De Langen, 1999). The road classification system, in turn, is based on a reasonably clear road hierarchy based on the road’s function. Decisions about what sort of traffic should be accommodated, and what sort of traffic discouraged or banned would be based on this functional hierarchy. In Surabaya, however, there are reasons why there remains conflict and confusion between different transport modes on different roads.
Indonesia does have a legal road classification system, as defined in government regulation 26/1985. (See Table II). The road classification system in principle restricts traffic speeds, vehicle sizes, and axle load weights on different types of roads. Normally, these road classifications would be based on differences in the road’s function, and perhaps the number of lanes, the speed limits, and other factors.
Road class
Max. vehicle length (m)
Max. vehicle width (m)
Max. axle load (ton)
Max. urban speed (km/jam)
Type of road
I 18 2,5 > 10 Truck 80 Passenger 100
Primary Arterial
II 18 2,5 10 Truck 80 Passenger 100
Secondary Arterial
IIIA 18 2,5 8 Truck 80 Passenger 100
Primary Collector
IIIB 12 2,5 8 80 Secondary Collector IIIC 9 2,1 8 60 Local
Table II: The Surabaya road classification system.
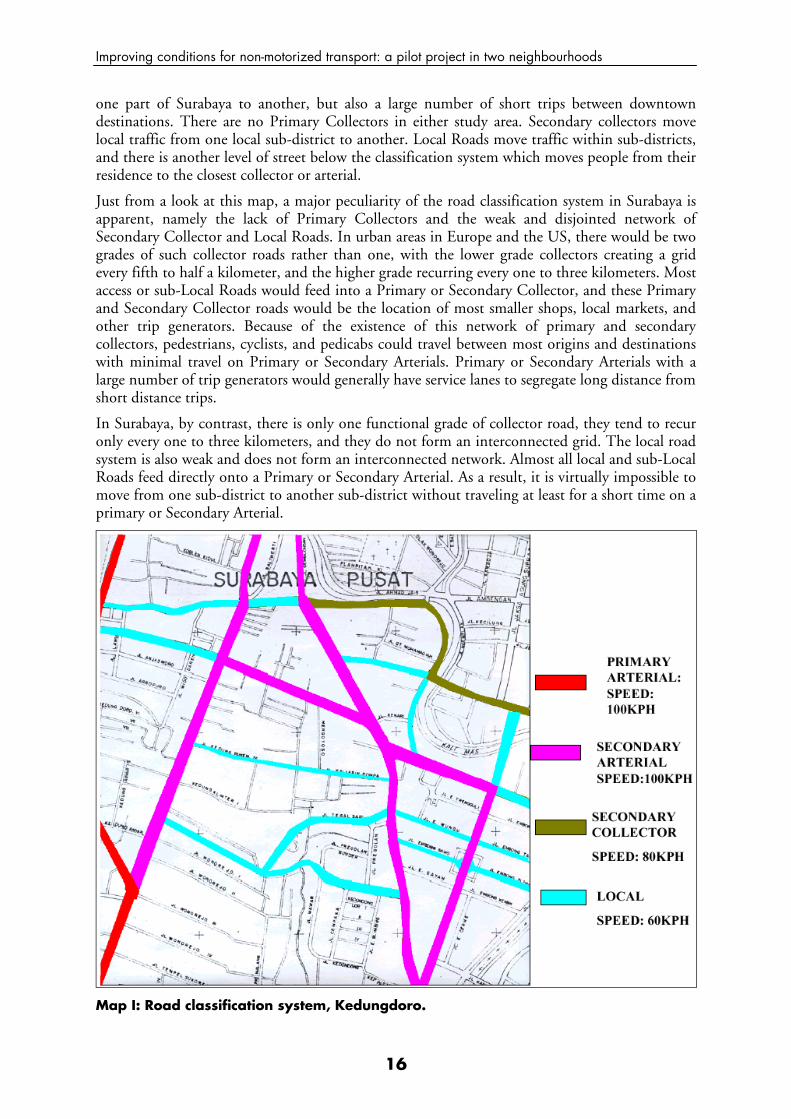
Maps I and II indicate how the the road classification system has been applied in the two study areas. From this map, it is clear that the intended road classification system is based on the following: Primary Arterials are primarily for long-distance traffic either bypassing Surabaya all together, or moving from one end of Surabaya to the next. Secondary Arterials serve trips from
Improving conditions for non-motorized transport: a pilot project in two neighbourhoods
16
one part of Surabaya to another, but also a large number of short trips between downtown destinations. There are no Primary Collectors in either study area. Secondary collectors move local traffic from one local sub-district to another. Local Roads move traffic within sub-districts, and there is another level of street below the classification system which moves people from their residence to the closest collector or arterial.
Just from a look at this map, a major peculiarity of the road classification system in Surabaya is apparent, namely the lack of Primary Collectors and the weak and disjointed network of Secondary Collector and Local Roads. In urban areas in Europe and the US, there would be two grades of such collector roads rather than one, with the lower grade collectors creating a grid every fifth to half a kilometer, and the higher grade recurring every one to three kilometers. Most access or sub-Local Roads would feed into a Primary or Secondary Collector, and these Primary and Secondary Collector roads would be the location of most smaller shops, local markets, and other trip generators. Because of the existence of this network of primary and secondary collectors, pedestrians, cyclists, and pedicabs could travel between most origins and destinations with minimal travel on Primary or Secondary Arterials. Primary or Secondary Arterials with a large number of trip generators would generally have service lanes to segregate long distance from short distance trips.
In Surabaya, by contrast, there is only one functional grade of collector road, they tend to recur only every one to three kilometers, and they do not form an interconnected grid. The local road system is also weak and does not form an interconnected network. Almost all local and sub-Local Roads feed directly onto a Primary or Secondary Arterial. As a result, it is virtually impossible to move from one sub-district to another sub-district without traveling at least for a short time on a primary or Secondary Arterial.
Map I: Road classification system, Kedungdoro.
Improving conditions for non-motorized transport: a pilot project in two neighbourhoods
17
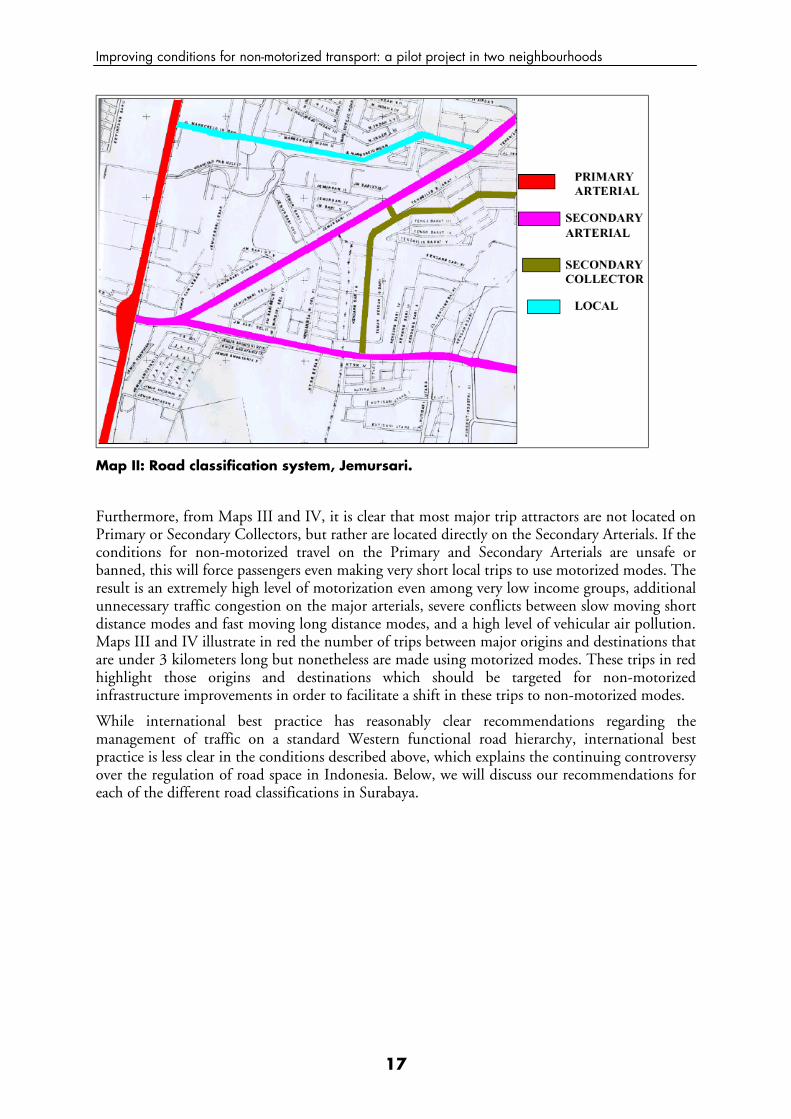
Map II: Road classification system, Jemursari.
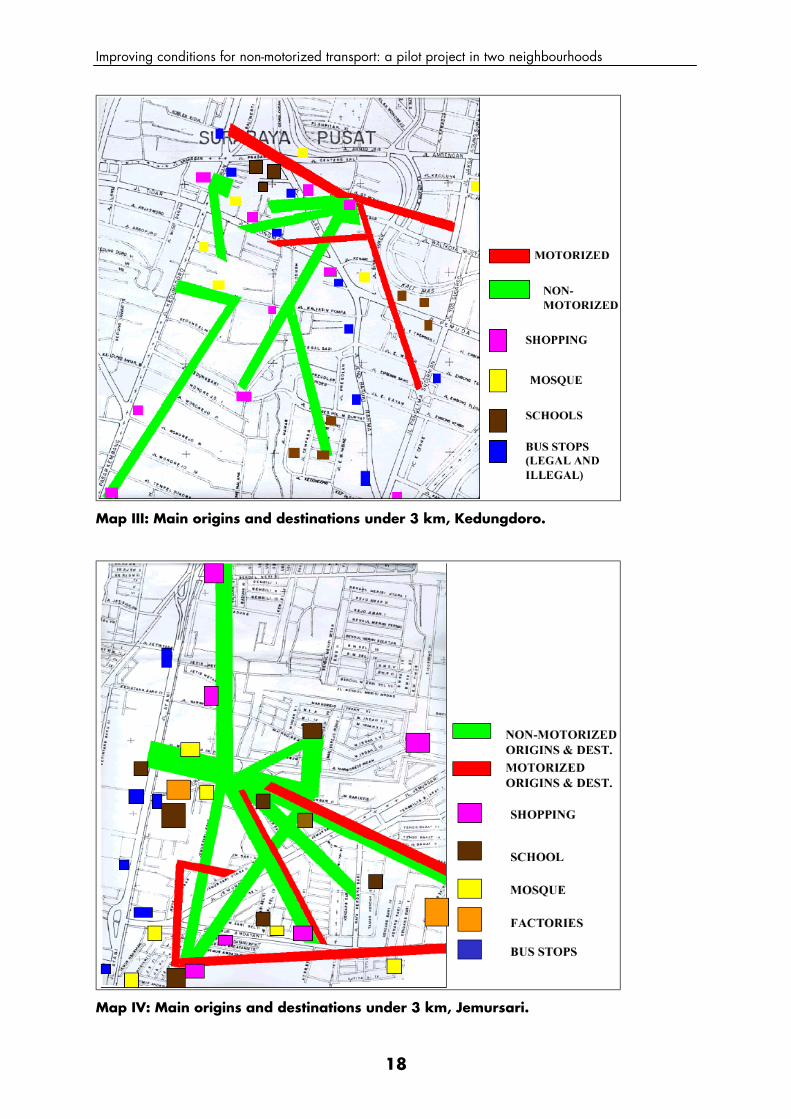
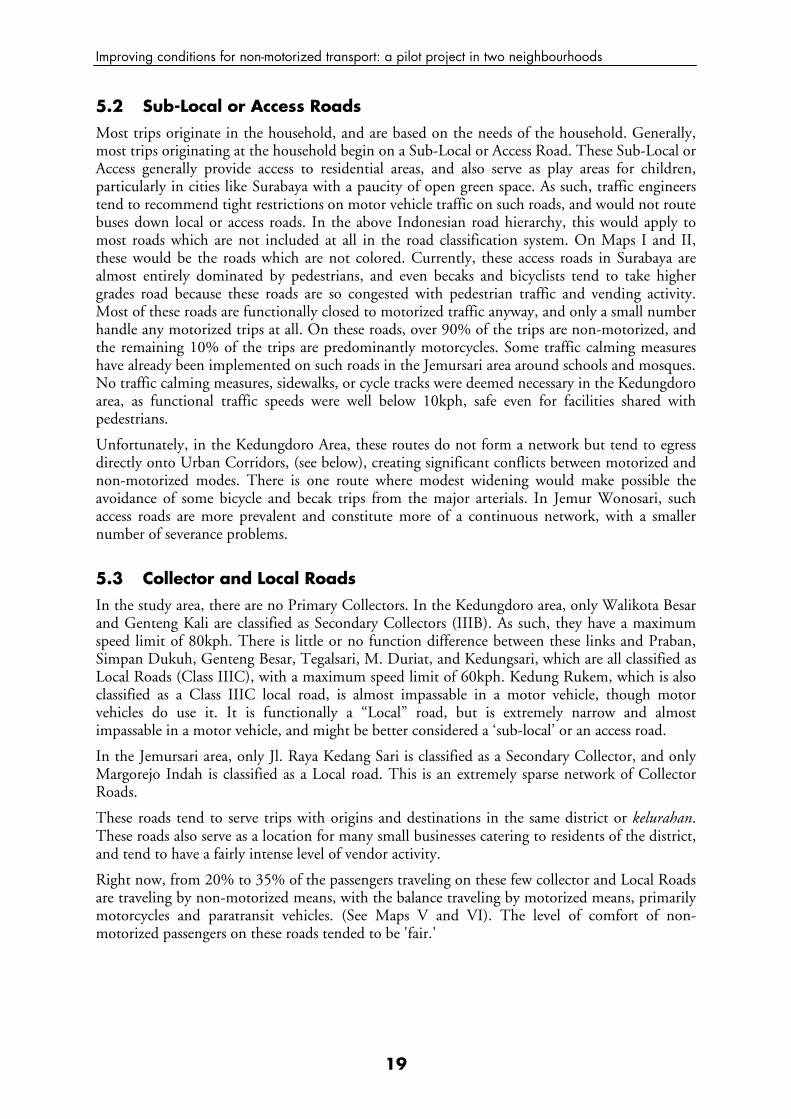
Furthermore, from Maps III and IV, it is clear that most major trip attractors are not located on Primary or Secondary Collectors, but rather are located directly on the Secondary Arterials. If the conditions for non-motorized travel on the Primary and Secondary Arterials are unsafe or banned, this will force passengers even making very short local trips to use motorized modes. The result is an extremely high level of motorization even among very low income groups, additional unnecessary traffic congestion on the major arterials, severe conflicts between slow moving short distance modes and fast moving long distance modes, and a high level of vehicular air pollution. Maps III and IV illustrate in red the number of trips between major origins and destinations that are under 3 kilometers long but nonetheless are made using motorized modes. These trips in red highlight those origins and destinations which should be targeted for non-motorized infrastructure improvements in order to facilitate a shift in these trips to non-motorized modes.
While international best practice has reasonably clear recommendations regarding the management of traffic on a standard Western functional road hierarchy, international best practice is less clear in the conditions described above, which explains the continuing controversy over the regulation of road space in Indonesia. Below, we will discuss our recommendations for each of the different road classifications in Surabaya.
Improving conditions for non-motorized transport: a pilot project in two neighbourhoods
18
Map III: Main origins and destinations under 3 km, Kedungdoro.
Map IV: Main origins and destinations under 3 km, Jemursari.
Improving conditions for non-motorized transport: a pilot project in two neighbourhoods
19
5.2 Sub-Local or Access Roads Most trips originate in the household, and are based on the needs of the household. Generally, most trips originating at the household begin on a Sub-Local or Access Road. These Sub-Local or Access generally provide access to residential areas, and also serve as play areas for children, particularly in cities like Surabaya with a paucity of open green space. As such, traffic engineers tend to recommend tight restrictions on motor vehicle traffic on such roads, and would not route buses down local or access roads. In the above Indonesian road hierarchy, this would apply to most roads which are not included at all in the road classification system. On Maps I and II, these would be the roads which are not colored. Currently, these access roads in Surabaya are almost entirely dominated by pedestrians, and even becaks and bicyclists tend to take higher grades road because these roads are so congested with pedestrian traffic and vending activity. Most of these roads are functionally closed to motorized traffic anyway, and only a small number handle any motorized trips at all. On these roads, over 90% of the trips are non-motorized, and the remaining 10% of the trips are predominantly motorcycles. Some traffic calming measures have already been implemented on such roads in the Jemursari area around schools and mosques. No traffic calming measures, sidewalks, or cycle tracks were deemed necessary in the Kedungdoro area, as functional traffic speeds were well below 10kph, safe even for facilities shared with pedestrians.
Unfortunately, in the Kedungdoro Area, these routes do not form a network but tend to egress directly onto Urban Corridors, (see below), creating significant conflicts between motorized and non-motorized modes. There is one route where modest widening would make possible the avoidance of some bicycle and becak trips from the major arterials. In Jemur Wonosari, such access roads are more prevalent and constitute more of a continuous network, with a smaller number of severance problems.
5.3 Collector and Local Roads In the study area, there are no Primary Collectors. In the Kedungdoro area, only Walikota Besar and Genteng Kali are classified as Secondary Collectors (IIIB). As such, they have a maximum speed limit of 80kph. There is little or no function difference between these links and Praban, Simpan Dukuh, Genteng Besar, Tegalsari, M. Duriat, and Kedungsari, which are all classified as Local Roads (Class IIIC), with a maximum speed limit of 60kph. Kedung Rukem, which is also classified as a Class IIIC local road, is almost impassable in a motor vehicle, though motor vehicles do use it. It is functionally a “Local” road, but is extremely narrow and almost impassable in a motor vehicle, and might be better considered a ‘sub-local’ or an access road.
In the Jemursari area, only Jl. Raya Kedang Sari is classified as a Secondary Collector, and only Margorejo Indah is classified as a Local road. This is an extremely sparse network of Collector Roads.
These roads tend to serve trips with origins and destinations in the same district or kelurahan. These roads also serve as a location for many small businesses catering to residents of the district, and tend to have a fairly intense level of vendor activity.
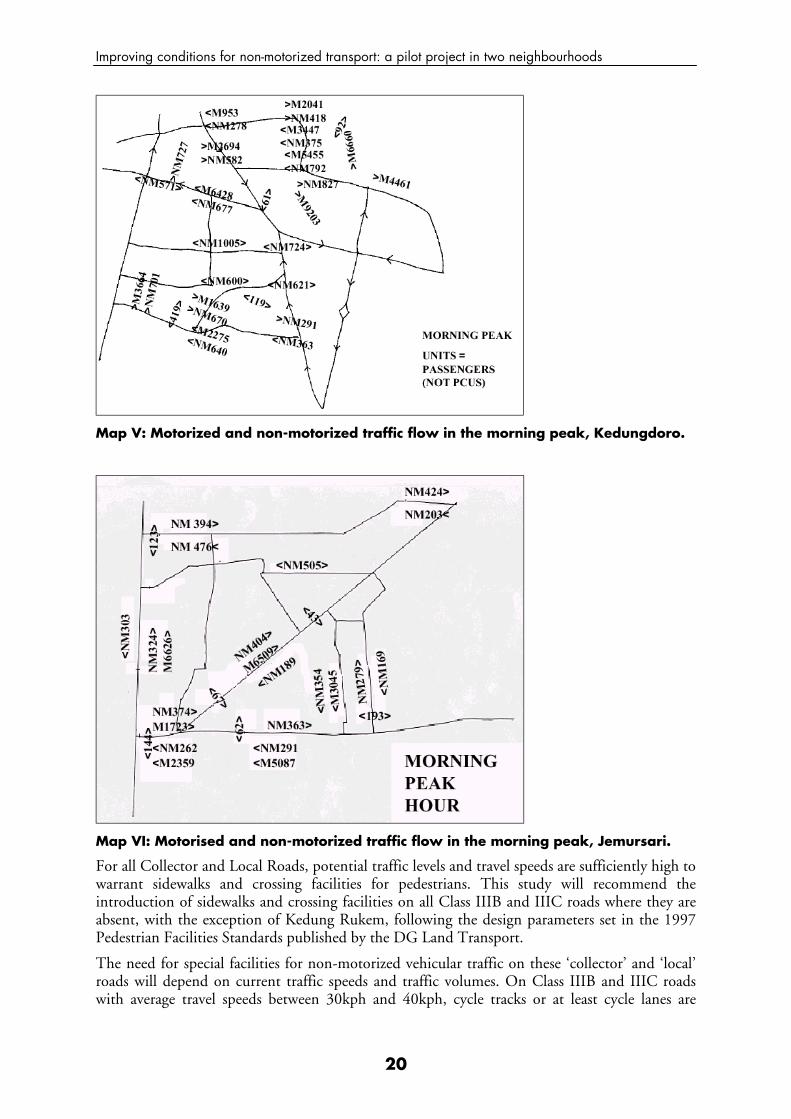
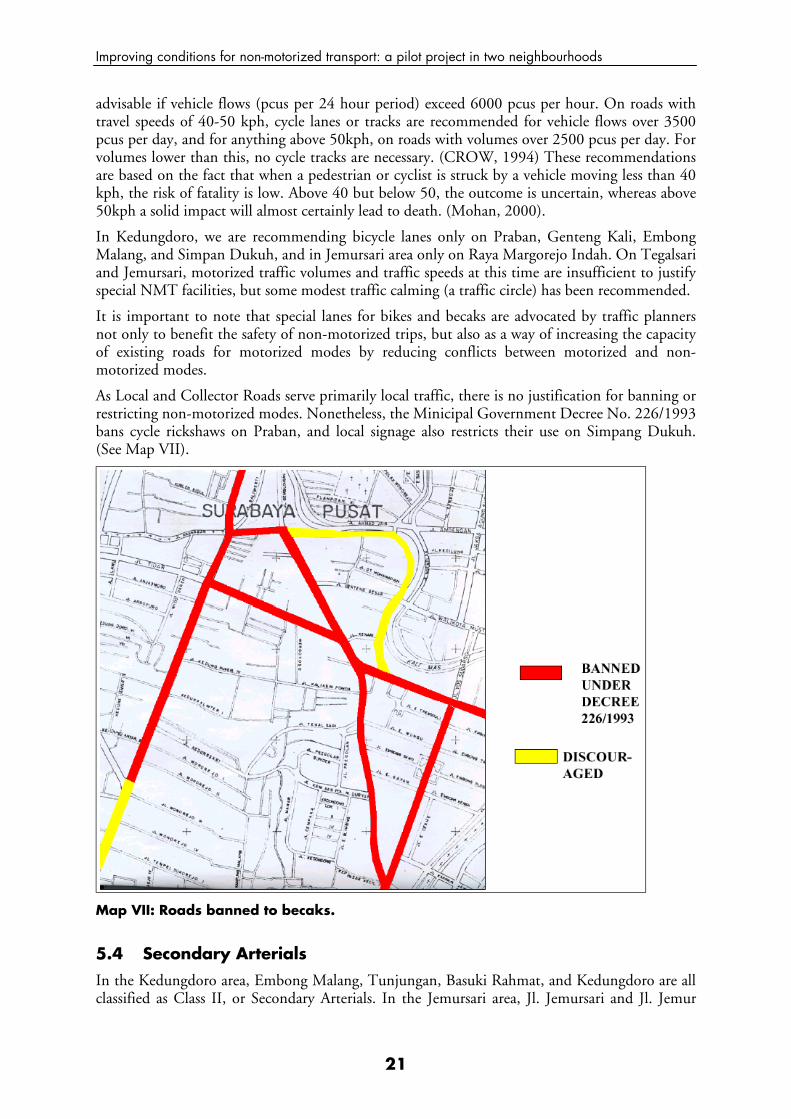
Right now, from 20% to 35% of the passengers traveling on these few collector and Local Roads are traveling by non-motorized means, with the balance traveling by motorized means, primarily motorcycles and paratransit vehicles. (See Maps V and VI). The level of comfort of non-motorized passengers on these roads tended to be 'fair.'
Improving conditions for non-motorized transport: a pilot project in two neighbourhoods
20
Map V: Motorized and non-motorized traffic flow in the morning peak, Kedungdoro.
Map VI: Motorised and non-motorized traffic flow in the morning peak, Jemursari.
For all Collector and Local Roads, potential traffic levels and travel speeds are sufficiently high to warrant sidewalks and crossing facilities for pedestrians. This study will recommend the introduction of sidewalks and crossing facilities on all Class IIIB and IIIC roads where they are absent, with the exception of Kedung Rukem, following the design parameters set in the 1997 Pedestrian Facilities Standards published by the DG Land Transport.
The need for special facilities for non-motorized vehicular traffic on these ‘collector’ and ‘local’ roads will depend on current traffic speeds and traffic volumes. On Class IIIB and IIIC roads with average travel speeds between 30kph and 40kph, cycle tracks or at least cycle lanes are
Improving conditions for non-motorized transport: a pilot project in two neighbourhoods
21
advisable if vehicle flows (pcus per 24 hour period) exceed 6000 pcus per hour. On roads with travel speeds of 40-50 kph, cycle lanes or tracks are recommended for vehicle flows over 3500 pcus per day, and for anything above 50kph, on roads with volumes over 2500 pcus per day. For volumes lower than this, no cycle tracks are necessary. (CROW, 1994) These recommendations are based on the fact that when a pedestrian or cyclist is struck by a vehicle moving less than 40 kph, the risk of fatality is low. Above 40 but below 50, the outcome is uncertain, whereas above 50kph a solid impact will almost certainly lead to death. (Mohan, 2000).
In Kedungdoro, we are recommending bicycle lanes only on Praban, Genteng Kali, Embong Malang, and Simpan Dukuh, and in Jemursari area only on Raya Margorejo Indah. On Tegalsari and Jemursari, motorized traffic volumes and traffic speeds at this time are insufficient to justify special NMT facilities, but some modest traffic calming (a traffic circle) has been recommended.
It is important to note that special lanes for bikes and becaks are advocated by traffic planners not only to benefit the safety of non-motorized trips, but also as a way of increasing the capacity of existing roads for motorized modes by reducing conflicts between motorized and non-motorized modes.
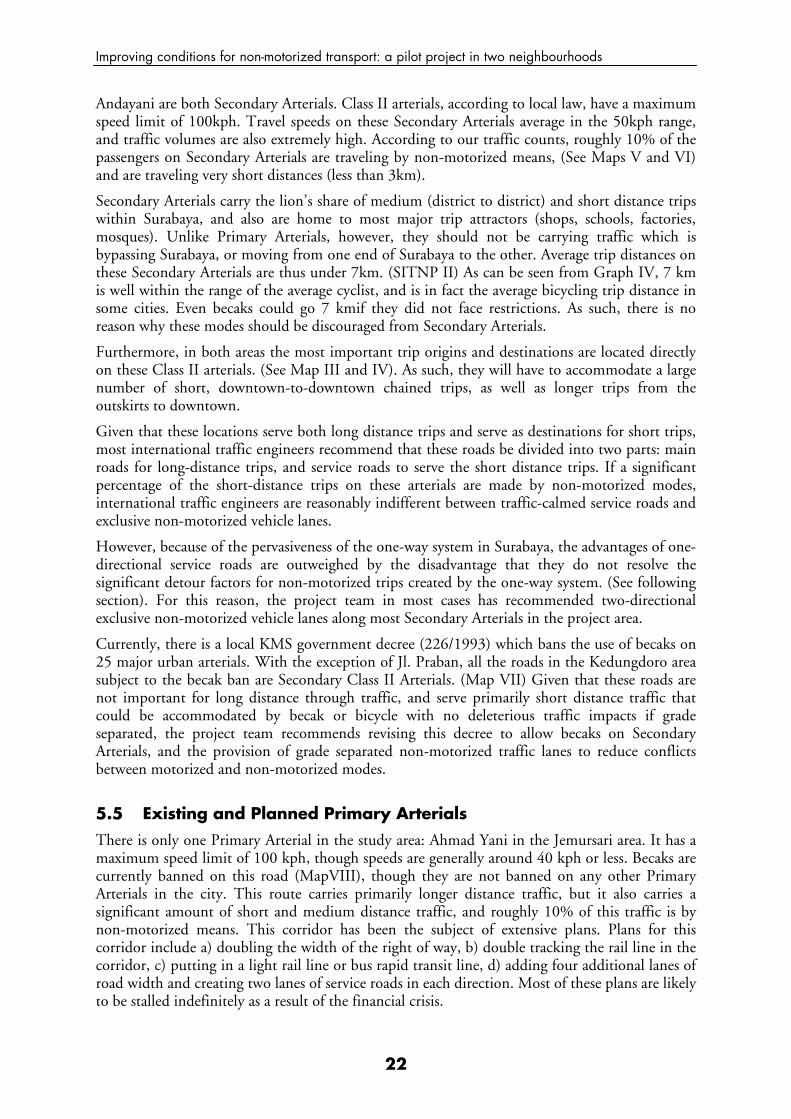
As Local and Collector Roads serve primarily local traffic, there is no justification for banning or restricting non-motorized modes. Nonetheless, the Minicipal Government Decree No. 226/1993 bans cycle rickshaws on Praban, and local signage also restricts their use on Simpang Dukuh. (See Map VII).
Map VII: Roads banned to becaks.
5.4 Secondary Arterials In the Kedungdoro area, Embong Malang, Tunjungan, Basuki Rahmat, and Kedungdoro are all classified as Class II, or Secondary Arterials. In the Jemursari area, Jl. Jemursari and Jl. Jemur
Improving conditions for non-motorized transport: a pilot project in two neighbourhoods
22
Andayani are both Secondary Arterials. Class II arterials, according to local law, have a maximum speed limit of 100kph. Travel speeds on these Secondary Arterials average in the 50kph range, and traffic volumes are also extremely high. According to our traffic counts, roughly 10% of the passengers on Secondary Arterials are traveling by non-motorized means, (See Maps V and VI) and are traveling very short distances (less than 3km).
Secondary Arterials carry the lion’s share of medium (district to district) and short distance trips within Surabaya, and also are home to most major trip attractors (shops, schools, factories, mosques). Unlike Primary Arterials, however, they should not be carrying traffic which is bypassing Surabaya, or moving from one end of Surabaya to the other. Average trip distances on these Secondary Arterials are thus under 7km. (SITNP II) As can be seen from Graph IV, 7 km is well within the range of the average cyclist, and is in fact the average bicycling trip distance in some cities. Even becaks could go 7 kmif they did not face restrictions. As such, there is no reason why these modes should be discouraged from Secondary Arterials.
Furthermore, in both areas the most important trip origins and destinations are located directly on these Class II arterials. (See Map III and IV). As such, they will have to accommodate a large number of short, downtown-to-downtown chained trips, as well as longer trips from the outskirts to downtown.
Given that these locations serve both long distance trips and serve as destinations for short trips, most international traffic engineers recommend that these roads be divided into two parts: main roads for long-distance trips, and service roads to serve the short distance trips. If a significant percentage of the short-distance trips on these arterials are made by non-motorized modes, international traffic engineers are reasonably indifferent between traffic-calmed service roads and exclusive non-motorized vehicle lanes.
However, because of the pervasiveness of the one-way system in Surabaya, the advantages of one-directional service roads are outweighed by the disadvantage that they do not resolve the significant detour factors for non-motorized trips created by the one-way system. (See following section). For this reason, the project team in most cases has recommended two-directional exclusive non-motorized vehicle lanes along most Secondary Arterials in the project area.
Currently, there is a local KMS government decree (226/1993) which bans the use of becaks on 25 major urban arterials. With the exception of Jl. Praban, all the roads in the Kedungdoro area subject to the becak ban are Secondary Class II Arterials. (Map VII) Given that these roads are not important for long distance through traffic, and serve primarily short distance traffic that could be accommodated by becak or bicycle with no deleterious traffic impacts if grade separated, the project team recommends revising this decree to allow becaks on Secondary Arterials, and the provision of grade separated non-motorized traffic lanes to reduce conflicts between motorized and non-motorized modes.
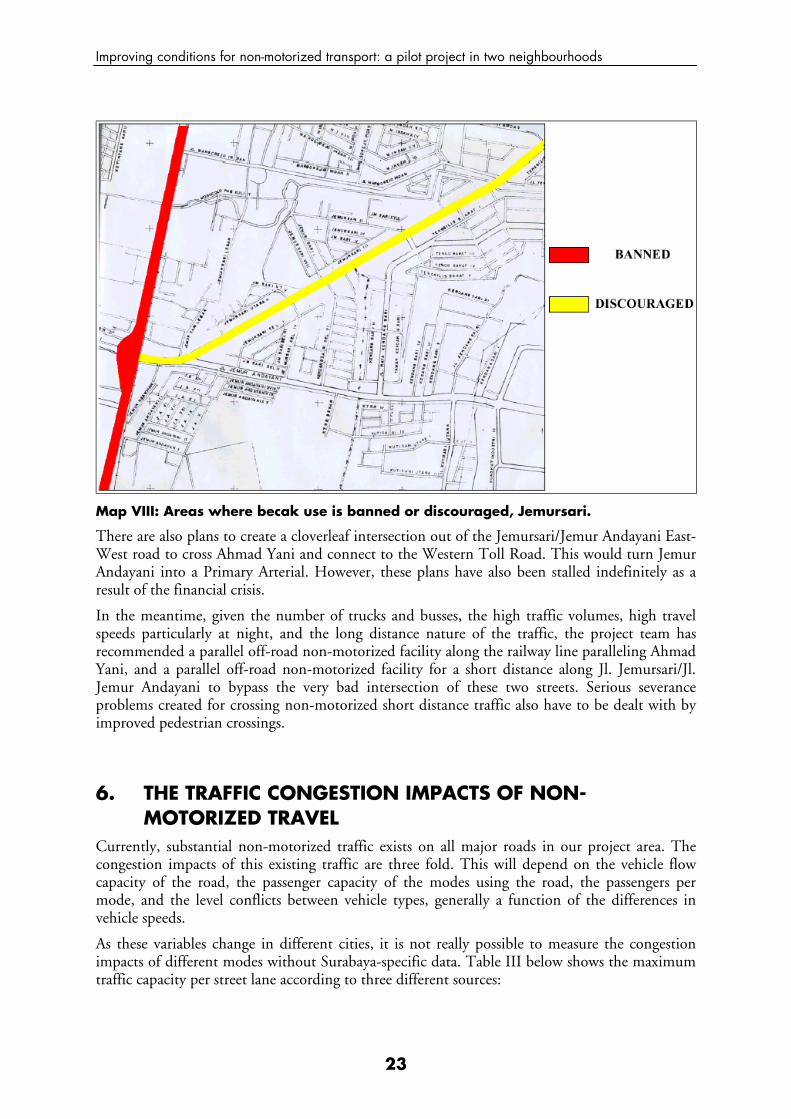
5.5 Existing and Planned Primary Arterials There is only one Primary Arterial in the study area: Ahmad Yani in the Jemursari area. It has a maximum speed limit of 100 kph, though speeds are generally around 40 kph or less. Becaks are currently banned on this road (MapVIII), though they are not banned on any other Primary Arterials in the city. This route carries primarily longer distance traffic, but it also carries a significant amount of short and medium distance traffic, and roughly 10% of this traffic is by non-motorized means. This corridor has been the subject of extensive plans. Plans for this corridor include a) doubling the width of the right of way, b) double tracking the rail line in the corridor, c) putting in a light rail line or bus rapid transit line, d) adding four additional lanes of road width and creating two lanes of service roads in each direction. Most of these plans are likely to be stalled indefinitely as a result of the financial crisis.
Improving conditions for non-motorized transport: a pilot project in two neighbourhoods
23
Map VIII: Areas where becak use is banned or discouraged, Jemursari.
There are also plans to create a cloverleaf intersection out of the Jemursari/Jemur Andayani East-West road to cross Ahmad Yani and connect to the Western Toll Road. This would turn Jemur Andayani into a Primary Arterial. However, these plans have also been stalled indefinitely as a result of the financial crisis.
In the meantime, given the number of trucks and busses, the high traffic volumes, high travel speeds particularly at night, and the long distance nature of the traffic, the project team has recommended a parallel off-road non-motorized facility along the railway line paralleling Ahmad Yani, and a parallel off-road non-motorized facility for a short distance along Jl. Jemursari/Jl. Jemur Andayani to bypass the very bad intersection of these two streets. Serious severance problems created for crossing non-motorized short distance traffic also have to be dealt with by improved pedestrian crossings.
6. THE TRAFFIC CONGESTION IMPACTS OF NON-MOTORIZED TRAVEL
Currently, substantial non-motorized traffic exists on all major roads in our project area. The congestion impacts of this existing traffic are three fold. This will depend on the vehicle flow capacity of the road, the passenger capacity of the modes using the road, the passengers per mode, and the level conflicts between vehicle types, generally a function of the differences in vehicle speeds.
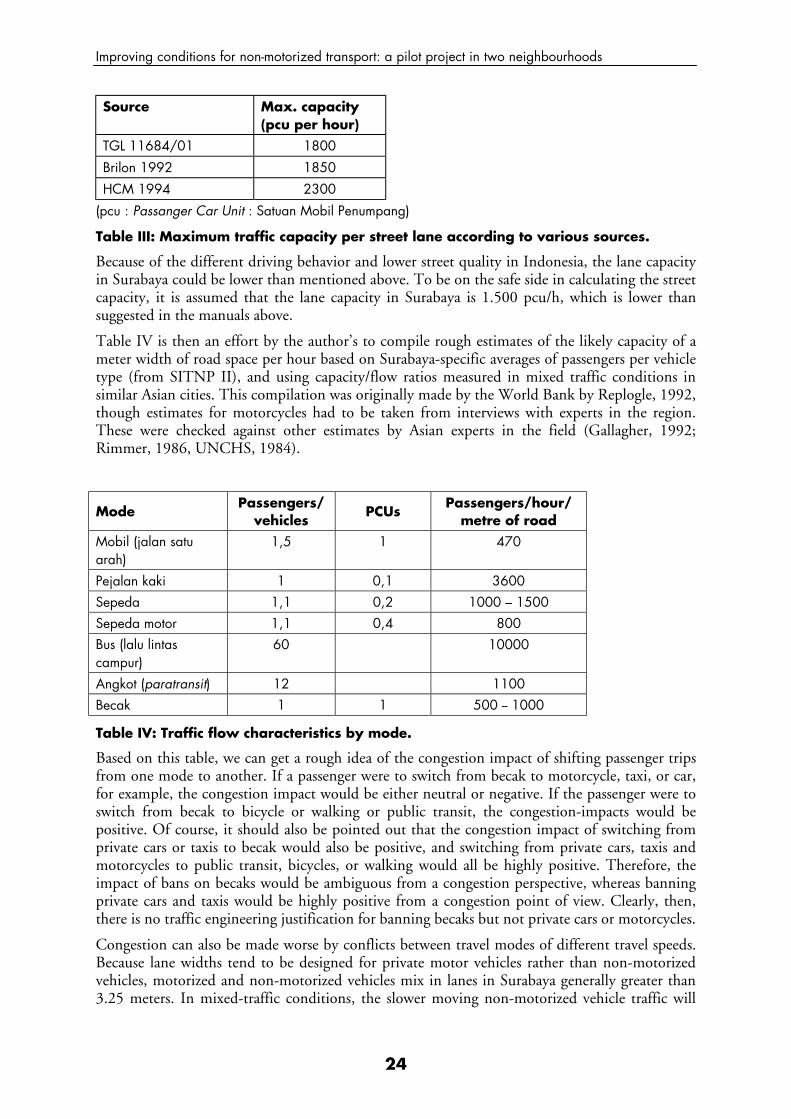
As these variables change in different cities, it is not really possible to measure the congestion impacts of different modes without Surabaya-specific data. Table III below shows the maximum traffic capacity per street lane according to three different sources:
Improving conditions for non-motorized transport: a pilot project in two neighbourhoods
24
Source Max. capacity (pcu per hour)
TGL 11684/01 1800
Brilon 1992 1850
HCM 1994 2300
(pcu : Passanger Car Unit : Satuan Mobil Penumpang)
Table III: Maximum traffic capacity per street lane according to various sources.
Because of the different driving behavior and lower street quality in Indonesia, the lane capacity in Surabaya could be lower than mentioned above. To be on the safe side in calculating the street capacity, it is assumed that the lane capacity in Surabaya is 1.500 pcu/h, which is lower than suggested in the manuals above.
Table IV is then an effort by the author’s to compile rough estimates of the likely capacity of a meter width of road space per hour based on Surabaya-specific averages of passengers per vehicle type (from SITNP II), and using capacity/flow ratios measured in mixed traffic conditions in similar Asian cities. This compilation was originally made by the World Bank by Replogle, 1992, though estimates for motorcycles had to be taken from interviews with experts in the region. These were checked against other estimates by Asian experts in the field (Gallagher, 1992; Rimmer, 1986, UNCHS, 1984).
Mode Passengers/
vehicles PCUs
Passengers/hour/ metre of road
Mobil (jalan satu arah)
1,5 1 470
Pejalan kaki 1 0,1 3600 Sepeda 1,1 0,2 1000 – 1500 Sepeda motor 1,1 0,4 800 Bus (lalu lintas campur)
60 10000
Angkot (paratransit) 12 1100 Becak 1 1 500 -- 1000
Table IV: Traffic flow characteristics by mode.
Based on this table, we can get a rough idea of the congestion impact of shifting passenger trips from one mode to another. If a passenger were to switch from becak to motorcycle, taxi, or car, for example, the congestion impact would be either neutral or negative. If the passenger were to switch from becak to bicycle or walking or public transit, the congestion-impacts would be positive. Of course, it should also be pointed out that the congestion impact of switching from private cars or taxis to becak would also be positive, and switching from private cars, taxis and motorcycles to public transit, bicycles, or walking would all be highly positive. Therefore, the impact of bans on becaks would be ambiguous from a congestion perspective, whereas banning private cars and taxis would be highly positive from a congestion point of view. Clearly, then, there is no traffic engineering justification for banning becaks but not private cars or motorcycles.
Congestion can also be made worse by conflicts between travel modes of different travel speeds. Because lane widths tend to be designed for private motor vehicles rather than non-motorized vehicles, motorized and non-motorized vehicles mix in lanes in Surabaya generally greater than 3.25 meters. In mixed-traffic conditions, the slower moving non-motorized vehicle traffic will
Improving conditions for non-motorized transport: a pilot project in two neighbourhoods
25
effectively block the entire 3.25 meter lane, while it only needed a minimum of 1.2 meters of lane width in each direction. In these conditions, as exist in Surabaya, the road’s total capacity can be increased by segregating this traffic into non-motorized vehicle lanes, better sidewalks, and somewhat narrowed lane widths. A study of three lane roads in Delhi indicated that the construction of a 2.5 meter cycle track increased the road capacity for motorized vehicles by 19% to 23% (Tiwari, 2000). The segregation of the traffic increases the flow quality of the motorized traffic, which makes the lane-use more efficient, and in turn makes it possible to reduce the number of lanes. The higher flow quality will also increase the steadiness of cruising speed, which in turn will lead to more efficient fuel usage. The space gained is then used in our proposals for dedicated NMT (pedestrians and NMV) facilities. For the slow-moving NMT, physical separation is also useful because it protects them from the faster-moving MT and from the parking activities.
Conflicts between motorized and non-motorized traffic is not only with the traffic, but also across the traffic. The current lack of pedestrian-friendly crossing facilities has also contributed to traffic congestion in Surabaya. Without traffic lights, pedestrians are forced to cross the street in heavy traffic, disrupting traffic flow for both the motorized vehicles and the pedestrians. This is observed on Jl. Tunjungan (in front of Siola Shopping Center), the crossing in front of Tunjungan Plaza, and at the intersection of Jl. Pemuda and Jl. Sudirman. It is recommended to provide pedestrians a traffic light if there are more than 50 crossing pedestrians per hour and if the traffic is more than 300 pcu/h. If the traffic to be crossed is less than 300 pcu/h it would be sufficient to provide a pedestrian island. If there are more than 100 pedestrians per hour it is suggested to provide a pedestrian oriented crossing signalization (red-on-demand). The crossing light would totally block the motorized traffic if it is green for pedestrians, but it would open the whole capacity of the street for the motorized traffic if it is red for the pedestrians. In the end, this will increase the total traffic capacity of the street at the pedestrian crossing area and thus reduce this type of congestion.
Another peculiar characteristic of the Surabaya road network is that road widths change significantly between links. The same road may carry the same level of traffic along different links, but the available lanes may vary widely. Jl. Embong Malang, Jl. Genteng Besar, Jl. Tunjungan, Jl. Jemur Andayani, and other roads, for example, have far more lanes than they need to handle existing traffic flow, largely because there are bottlenecks that exist in other parts of the traffic system. For example, some segments of road are simply wider than other, adjacent segments of the same road. This is the case along Jl. Embong Malang, where there are two lanes coming from Jl. Basuki Rahmat and 1-2 lanes coming from Jl. Tunjungan. In this case, 3 lanes would be sufficient for Jl. Embong Malang to accommodate the incoming traffic from both Jl. Basukirachmat and Jl. Tunjungan. Some intersections have much lower capacity than the road links that lead up to them. This is the case at the signalized intersections at the Jl. A. Yani, Wonokromo-market-intersection, for example. It is advisable not to provide more capacity in the street segments than the corresponding intersections can accommodate, as the result leads to accordion-action and highly varied travel speeds which reduce capacity and safety, while increasing fuel consumption. In other areas congestion is caused by illogical definition of lanes, e.g. if some lanes suddenly become waiting lanes for turning traffic without giving continuity for the straight-ahead moving traffic. Often in this case, the turning traffic will block the straight-ahead moving traffic, as the straight-ahead traffic has to wait in the lane behind the turning traffic. This can be observed in some locations on Jl. A. Yani. It is recommended here to constantly keep the same number of lanes with continuity for the straight-ahead moving traffic and to provide an extra waiting lane for the turning traffic.
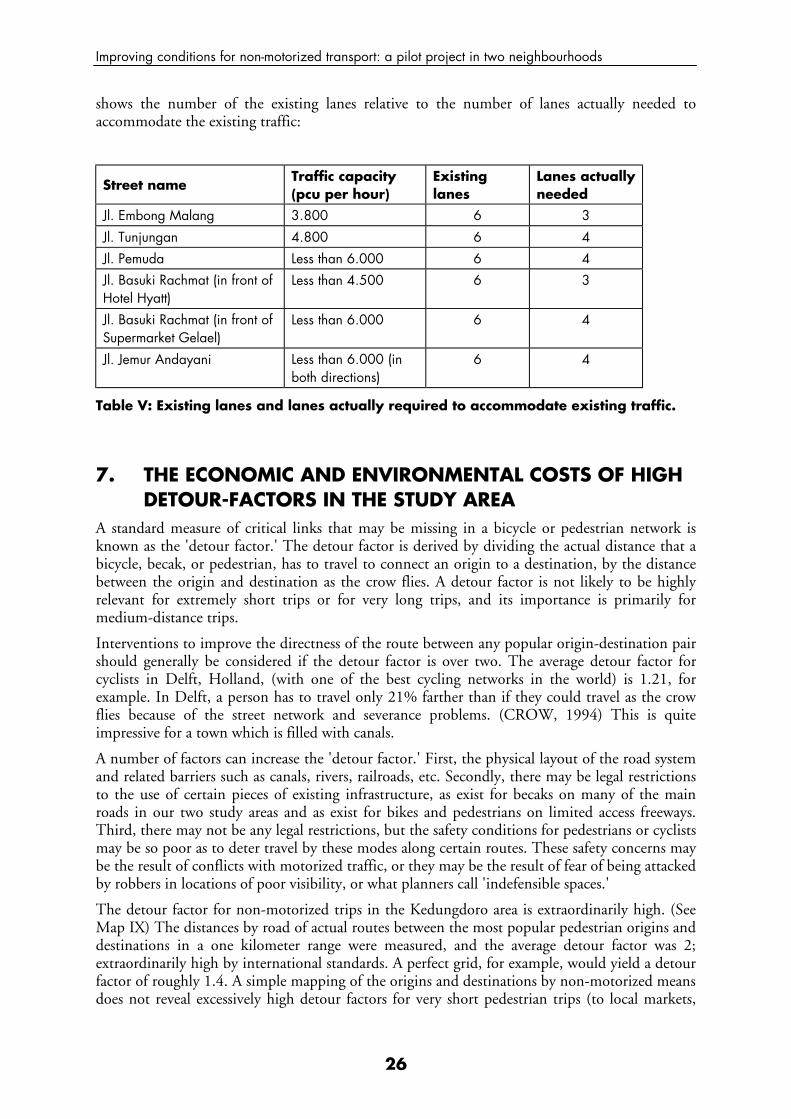
If the motorized and non-motorized traffic were segregated on the existing roads, and the improvement of non-motorized vehicle facilities did not change the modal split, Table V below
Improving conditions for non-motorized transport: a pilot project in two neighbourhoods
26
shows the number of the existing lanes relative to the number of lanes actually needed to accommodate the existing traffic:
Street name Traffic capacity (pcu per hour)
Existing lanes
Lanes actually needed
Jl. Embong Malang 3.800 6 3
Jl. Tunjungan 4.800 6 4
Jl. Pemuda Less than 6.000 6 4 Jl. Basuki Rachmat (in front of Hotel Hyatt)
Less than 4.500 6 3
Jl. Basuki Rachmat (in front of Supermarket Gelael)
Less than 6.000 6 4
Jl. Jemur Andayani Less than 6.000 (in both directions)
6 4
Table V: Existing lanes and lanes actually required to accommodate existing traffic.
7. THE ECONOMIC AND ENVIRONMENTAL COSTS OF HIGH DETOUR-FACTORS IN THE STUDY AREA
A standard measure of critical links that may be missing in a bicycle or pedestrian network is known as the 'detour factor.' The detour factor is derived by dividing the actual distance that a bicycle, becak, or pedestrian, has to travel to connect an origin to a destination, by the distance between the origin and destination as the crow flies. A detour factor is not likely to be highly relevant for extremely short trips or for very long trips, and its importance is primarily for medium-distance trips.
Interventions to improve the directness of the route between any popular origin-destination pair should generally be considered if the detour factor is over two. The average detour factor for cyclists in Delft, Holland, (with one of the best cycling networks in the world) is 1.21, for example. In Delft, a person has to travel only 21% farther than if they could travel as the crow flies because of the street network and severance problems. (CROW, 1994) This is quite impressive for a town which is filled with canals.
A number of factors can increase the 'detour factor.' First, the physical layout of the road system and related barriers such as canals, rivers, railroads, etc. Secondly, there may be legal restrictions to the use of certain pieces of existing infrastructure, as exist for becaks on many of the main roads in our two study areas and as exist for bikes and pedestrians on limited access freeways. Third, there may not be any legal restrictions, but the safety conditions for pedestrians or cyclists may be so poor as to deter travel by these modes along certain routes. These safety concerns may be the result of conflicts with motorized traffic, or they may be the result of fear of being attacked by robbers in locations of poor visibility, or what planners call 'indefensible spaces.'
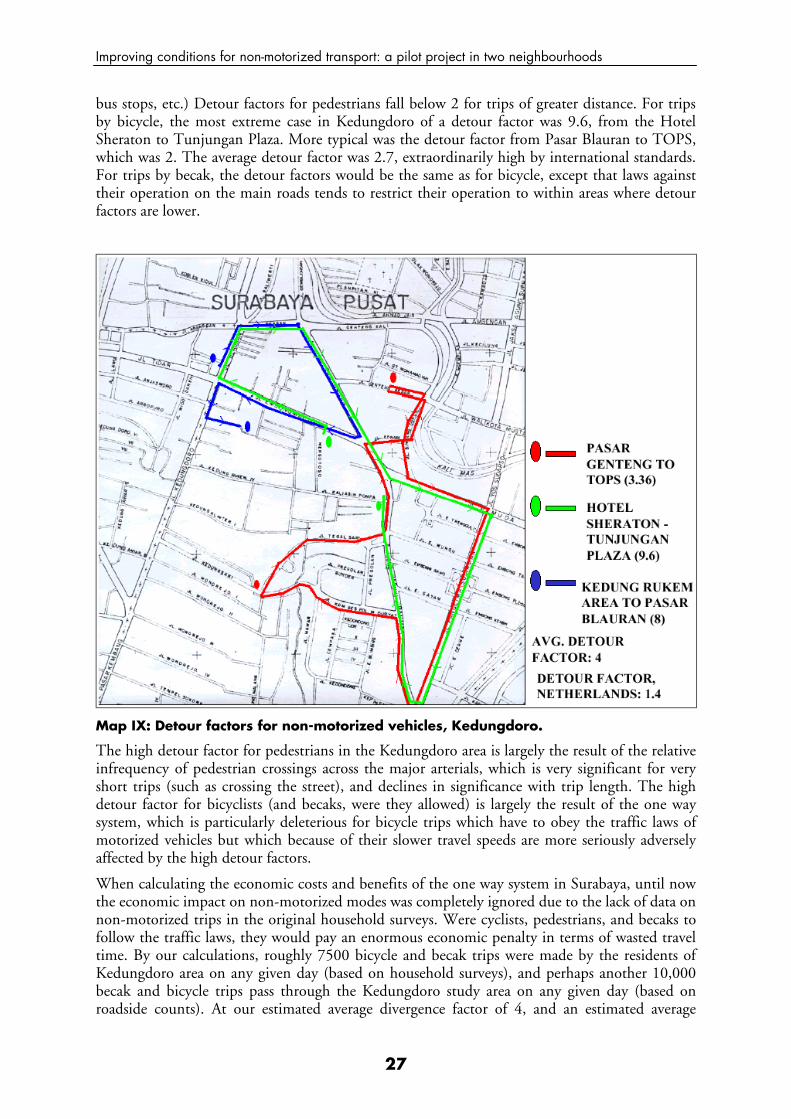
The detour factor for non-motorized trips in the Kedungdoro area is extraordinarily high. (See Map IX) The distances by road of actual routes between the most popular pedestrian origins and destinations in a one kilometer range were measured, and the average detour factor was 2; extraordinarily high by international standards. A perfect grid, for example, would yield a detour factor of roughly 1.4. A simple mapping of the origins and destinations by non-motorized means does not reveal excessively high detour factors for very short pedestrian trips (to local markets,
Improving conditions for non-motorized transport: a pilot project in two neighbourhoods
27
bus stops, etc.) Detour factors for pedestrians fall below 2 for trips of greater distance. For trips by bicycle, the most extreme case in Kedungdoro of a detour factor was 9.6, from the Hotel Sheraton to Tunjungan Plaza. More typical was the detour factor from Pasar Blauran to TOPS, which was 2. The average detour factor was 2.7, extraordinarily high by international standards. For trips by becak, the detour factors would be the same as for bicycle, except that laws against their operation on the main roads tends to restrict their operation to within areas where detour factors are lower.
Map IX: Detour factors for non-motorized vehicles, Kedungdoro.
The high detour factor for pedestrians in the Kedungdoro area is largely the result of the relative infrequency of pedestrian crossings across the major arterials, which is very significant for very short trips (such as crossing the street), and declines in significance with trip length. The high detour factor for bicyclists (and becaks, were they allowed) is largely the result of the one way system, which is particularly deleterious for bicycle trips which have to obey the traffic laws of motorized vehicles but which because of their slower travel speeds are more seriously adversely affected by the high detour factors.
When calculating the economic costs and benefits of the one way system in Surabaya, until now the economic impact on non-motorized modes was completely ignored due to the lack of data on non-motorized trips in the original household surveys. Were cyclists, pedestrians, and becaks to follow the traffic laws, they would pay an enormous economic penalty in terms of wasted travel time. By our calculations, roughly 7500 bicycle and becak trips were made by the residents of Kedungdoro area on any given day (based on household surveys), and perhaps another 10,000 becak and bicycle trips pass through the Kedungdoro study area on any given day (based on roadside counts). At our estimated average divergence factor of 4, and an estimated average
Improving conditions for non-motorized transport: a pilot project in two neighbourhoods
28
divergence factor of 2 were it not for the one-way system (the divergence factor in Jemursari area where there is no one-way system), then we can assume that travel time and vehicle kilometers traveled are doubled for the average trip if they following the existing traffic laws. It is therefore not surprising that many non-motorized transport passengers choose to violate the law rather than paying the economic penalty that following the law would imply. For a cyclist or becak passenger who follows the rules and makes an average of 3 round-trip 1 km trips per day (roughly the average based on our surveys), they are traveling an additional 3 km per day just to comply with the laws. At an average travel speed of 6 kilometers per hour, this would be a loss of a half hour per day per person who follows the rules. At 1/3 of the average hourly wage ($0.35), or $0.12 per day, or $30 per year, this is a big penalty to a low income family.
In addition, residents make many trips by motorbike, bemo, and angkot which they could otherwise make by much less costly bike, becak, and walking trips. If it were possible for people to walk and bike safely, roughly 10,500 trips within the study area could be converted from motorized to non-motorized trips. This would save each trip roughly Rp.700, or $1000 a day, or $250,000 per year. The Municipality of Surabaya should thus be willing to spend as much as $250,000 per year to mitigate the adverse effects of the one-way system on non-motorized vehicle trips in the area.
Finally, by segregating the traffic between motorized and non-motorized vehicles, the travel speeds of motorized vehicles could also increase, depending on the design characteristics. To some extent these effects can be modeled using the World Bank’s new HDM Version IV, but this has not been done for this project.
These high detour factors also generate significant additional vehicle emissions. They not only generate additional motorcycle trips that otherwise could be made by walking, cycling, or taking a becak, they also increase the vehicle kilometers traveled by motorized modes. Concrete estimates of the emissions impacts of the one way system can be calculated using the traffic models if they were re-calibrated to include non-motorized trips and if the average emissions per vehicle kilometer traveled and per cold start for each vehicle type prevalent in the area were measured. For CO2, it can be calibrated rather easily. If we assume that 2 of every 4 km are the result of the one-way system, and the average trip length less than 3 km as the crow flies is 2 km as the crow flies, then 2 km could be reduced off every trip by both creating two-way cycling lanes and making NMT trips easier. If these measures were only able to allow the same number of trips under 3km to be made by non-motorized modes as are currently made for such trips in Germany, this would be a reduction of 10,000 motorized trips, each 2 kilometers long. This would be a reduction of roughly 20,000 vehicle kilometers traveled. If we assume the average motor vehicle per passenger goes roughly 25km per litre (based on averages listed in Urban Air…, p. 184), and CO2 emissions per litre are 2.33 kg, then 1,864 kg of CO2 per day, or 680 tons per year of CO2 could be reduced.
In the Jemur Wonosari areas, the average detour factors were lower, in the 1.7 to 2 range. This is largely because of a large number of smaller streets. Nonetheless, these detour factors could be reduced considerably for certain key trips (like to Wonokromo market) if the bike lane paralleling the railroad tracks were completed.
Improving conditions for non-motorized transport: a pilot project in two neighbourhoods
29
8. SAFETY CONDITIONS FOR NON-MOTORIZED TRAVEL IN THE TWO STUDY AREAS
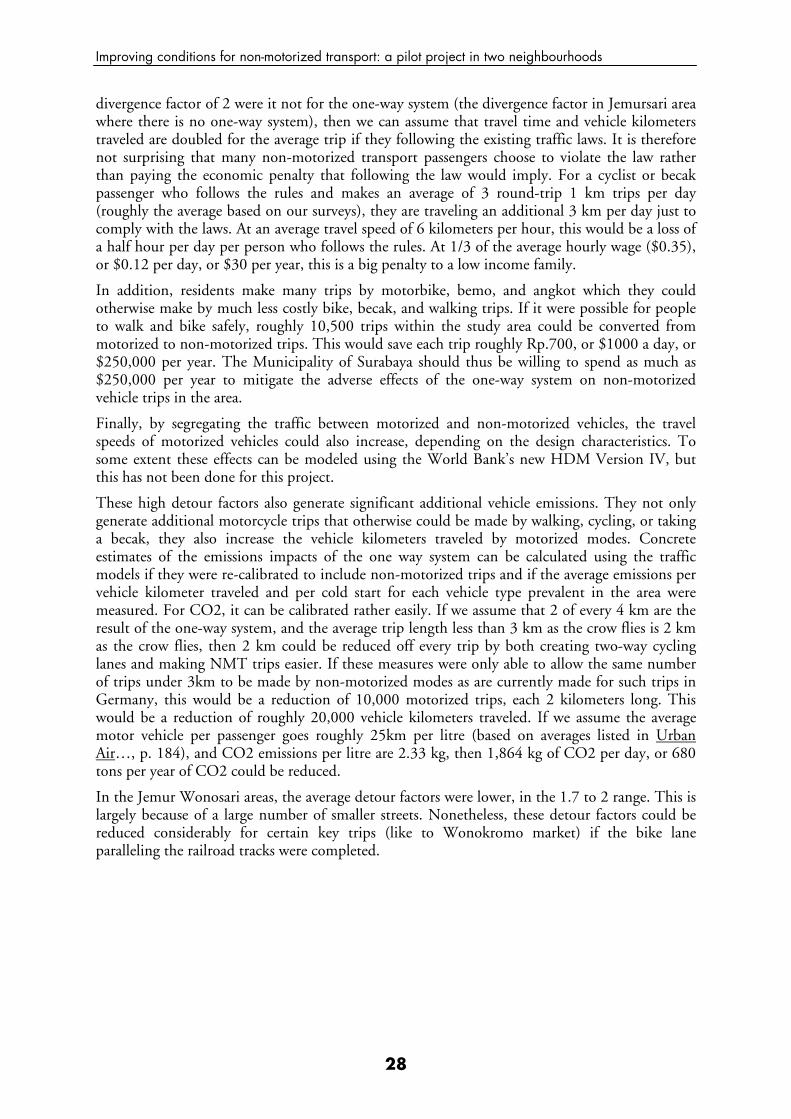
Traffic safety information in Surabaya is difficult to obtain. In most countries, this data is collected by traffic police and hospitals. In terms of calculating the total number of traffic fatalities and accidents, hospital records tend to be more accurate indicators, as not all people killed in a traffic accident die immediately, and not all fatalities are necessarily reported to the police or reported by the police. Using some indicators, based on hospital data, Surabaya has the worst traffic safety record in the region, and a much worse traffic safety record than Western countries. (Graph XVIII), (Barter, 2000). Comparing fatalities per billion kilometers traveled is a reasonably fair indicator, but tends to be biased against cities where average trip distances are quite short, as in Surabaya. Nonetheless, there is a clear indication of a safety problem.
Graph XVIII: Traffic deaths per billion km travelled.
Over the last decade, according to police records, total fatalities per year in Surabaya ranged from under 50 to over 200 per year. The average is around 100 victims per year, in a city with a population of around 2.47 million, or 4 fatalities per 10,000 population. While this is high by international standards, it represents a significant under-reporting. The main reason for the difference is no doubt the fact that deaths are underreported to the police in Surabaya. Police are only notified if there is a dispute between the two parties involved in the accident which is severe enough to make it worth the while of one of the parties to turn to the police. Random interviews suggest that often both the perpetrators and the families of the victims do not want to involve the police for various reasons. Police officials also told of stories where they were notified of fatal accidents but they did not have a functioning vehicle to visit the scene of the accident and therefore did not file a report.
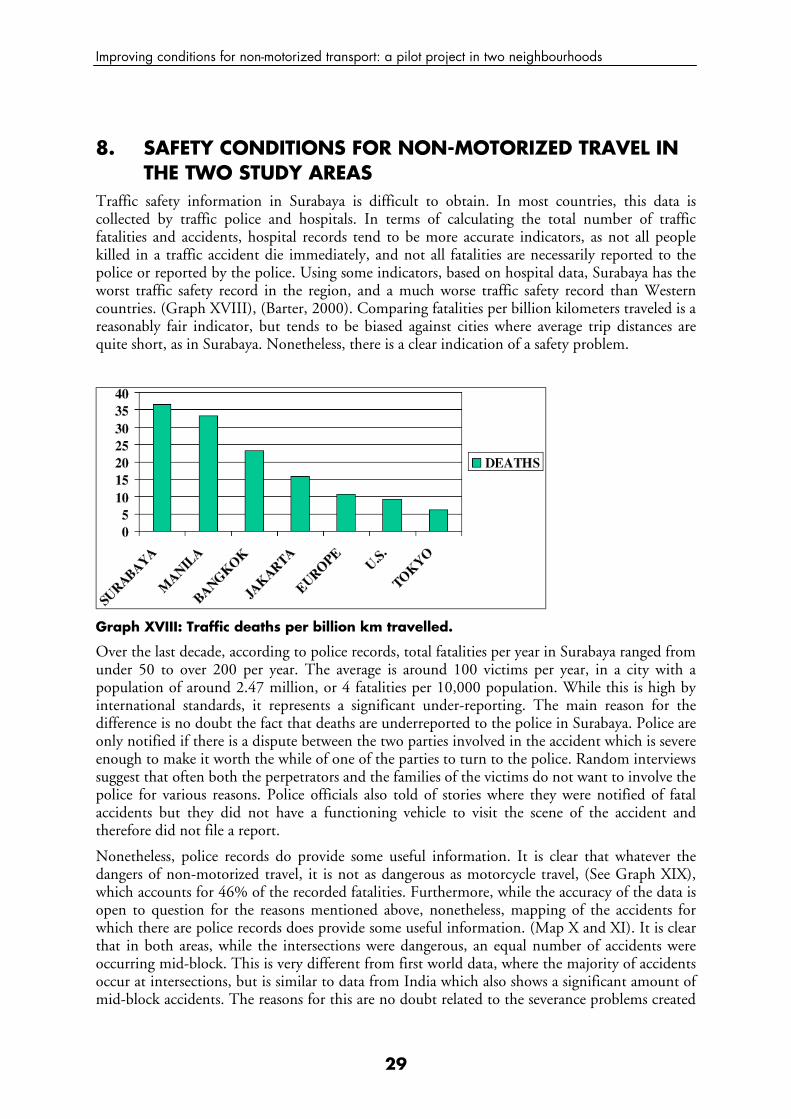
Nonetheless, police records do provide some useful information. It is clear that whatever the dangers of non-motorized travel, it is not as dangerous as motorcycle travel, (See Graph XIX), which accounts for 46% of the recorded fatalities. Furthermore, while the accuracy of the data is open to question for the reasons mentioned above, nonetheless, mapping of the accidents for which there are police records does provide some useful information. (Map X and XI). It is clear that in both areas, while the intersections were dangerous, an equal number of accidents were occurring mid-block. This is very different from first world data, where the majority of accidents occur at intersections, but is similar to data from India which also shows a significant amount of mid-block accidents. The reasons for this are no doubt related to the severance problems created
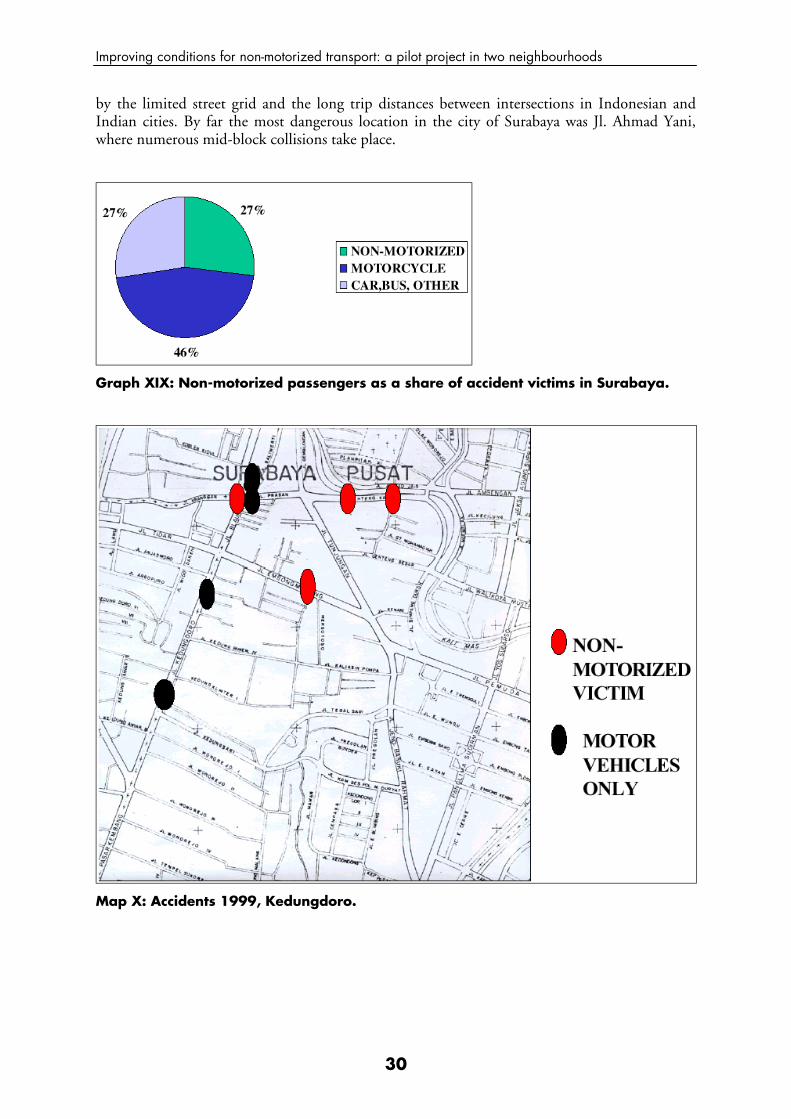
Improving conditions for non-motorized transport: a pilot project in two neighbourhoods
30
by the limited street grid and the long trip distances between intersections in Indonesian and Indian cities. By far the most dangerous location in the city of Surabaya was Jl. Ahmad Yani, where numerous mid-block collisions take place.
Graph XIX: Non-motorized passengers as a share of accident victims in Surabaya.
Map X: Accidents 1999, Kedungdoro.
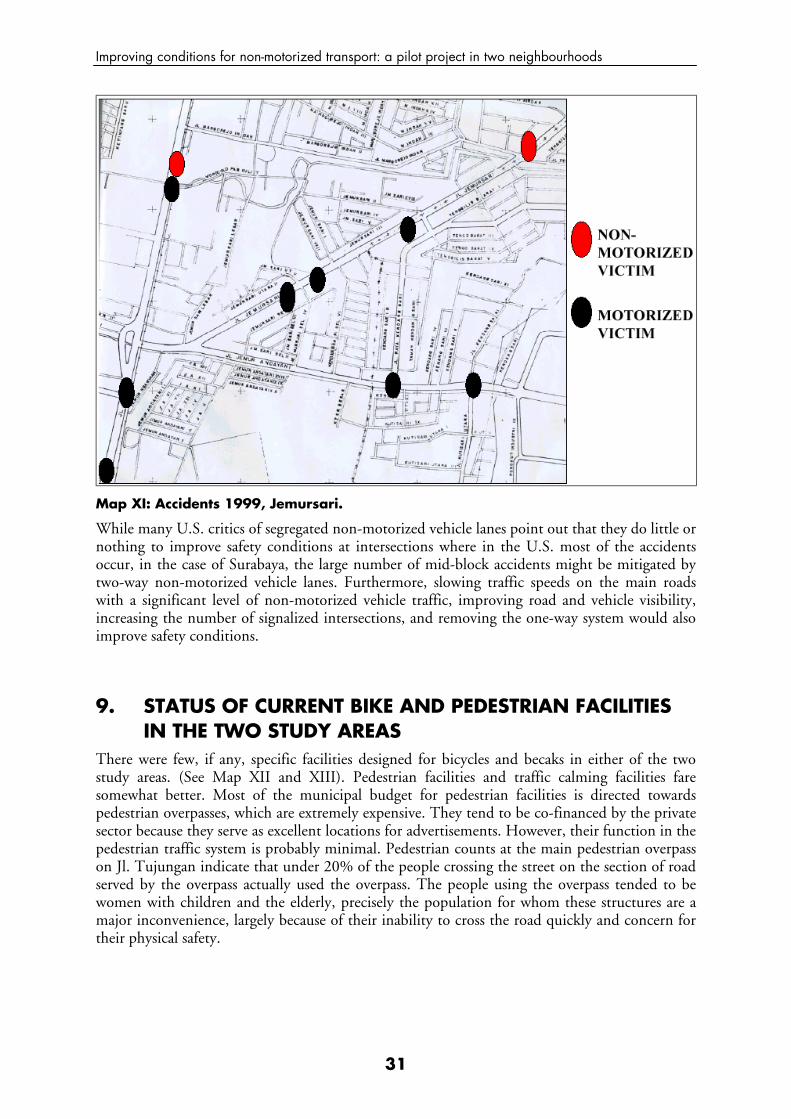
Improving conditions for non-motorized transport: a pilot project in two neighbourhoods
31
Map XI: Accidents 1999, Jemursari.
While many U.S. critics of segregated non-motorized vehicle lanes point out that they do little or nothing to improve safety conditions at intersections where in the U.S. most of the accidents occur, in the case of Surabaya, the large number of mid-block accidents might be mitigated by two-way non-motorized vehicle lanes. Furthermore, slowing traffic speeds on the main roads with a significant level of non-motorized vehicle traffic, improving road and vehicle visibility, increasing the number of signalized intersections, and removing the one-way system would also improve safety conditions.
9. STATUS OF CURRENT BIKE AND PEDESTRIAN FACILITIES IN THE TWO STUDY AREAS
There were few, if any, specific facilities designed for bicycles and becaks in either of the two study areas. (See Map XII and XIII). Pedestrian facilities and traffic calming facilities fare somewhat better. Most of the municipal budget for pedestrian facilities is directed towards pedestrian overpasses, which are extremely expensive. They tend to be co-financed by the private sector because they serve as excellent locations for advertisements. However, their function in the pedestrian traffic system is probably minimal. Pedestrian counts at the main pedestrian overpass on Jl. Tujungan indicate that under 20% of the people crossing the street on the section of road served by the overpass actually used the overpass. The people using the overpass tended to be women with children and the elderly, precisely the population for whom these structures are a major inconvenience, largely because of their inability to cross the road quickly and concern for their physical safety.
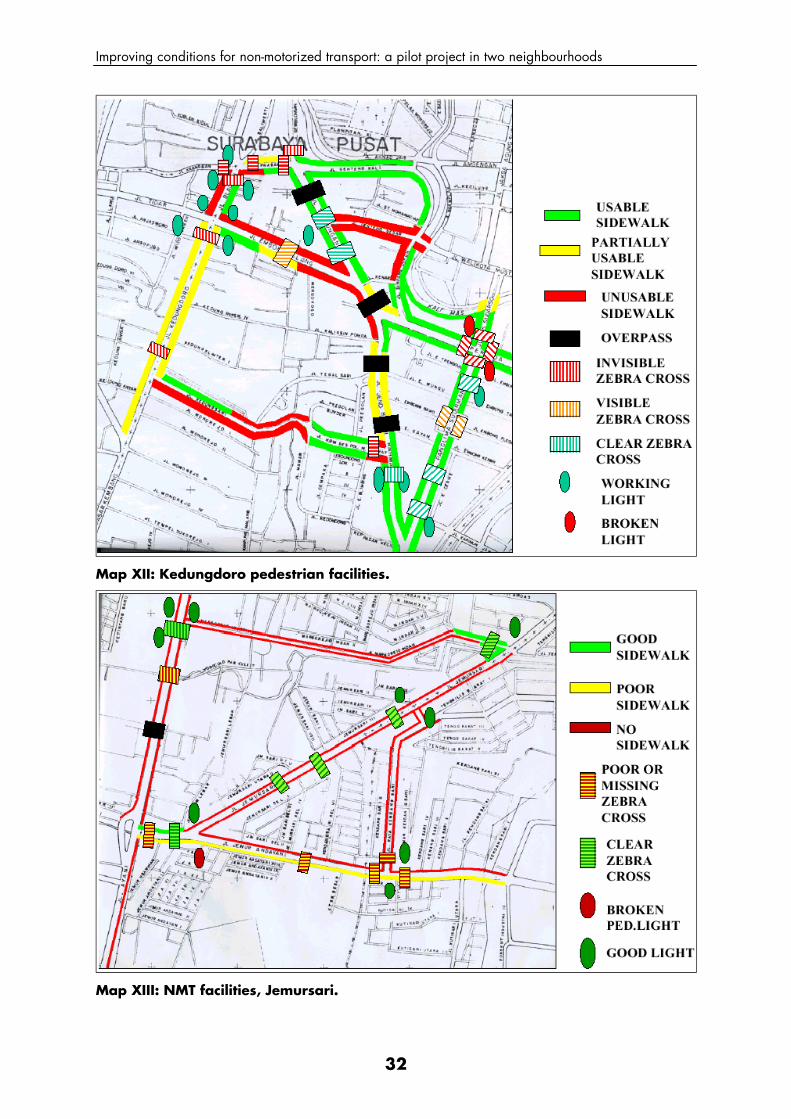
Improving conditions for non-motorized transport: a pilot project in two neighbourhoods
32
Map XII: Kedungdoro pedestrian facilities.
Map XIII: NMT facilities, Jemursari.
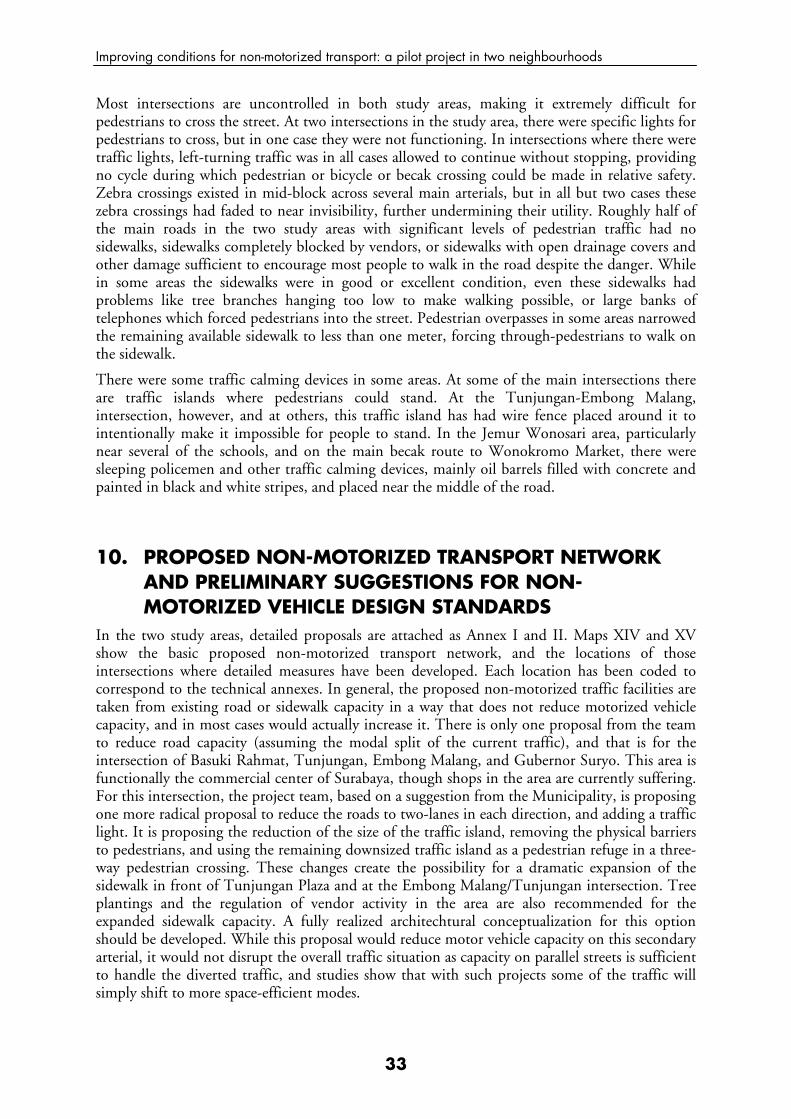
Improving conditions for non-motorized transport: a pilot project in two neighbourhoods
33
Most intersections are uncontrolled in both study areas, making it extremely difficult for pedestrians to cross the street. At two intersections in the study area, there were specific lights for pedestrians to cross, but in one case they were not functioning. In intersections where there were traffic lights, left-turning traffic was in all cases allowed to continue without stopping, providing no cycle during which pedestrian or bicycle or becak crossing could be made in relative safety. Zebra crossings existed in mid-block across several main arterials, but in all but two cases these zebra crossings had faded to near invisibility, further undermining their utility. Roughly half of the main roads in the two study areas with significant levels of pedestrian traffic had no sidewalks, sidewalks completely blocked by vendors, or sidewalks with open drainage covers and other damage sufficient to encourage most people to walk in the road despite the danger. While in some areas the sidewalks were in good or excellent condition, even these sidewalks had problems like tree branches hanging too low to make walking possible, or large banks of telephones which forced pedestrians into the street. Pedestrian overpasses in some areas narrowed the remaining available sidewalk to less than one meter, forcing through-pedestrians to walk on the sidewalk.
There were some traffic calming devices in some areas. At some of the main intersections there are traffic islands where pedestrians could stand. At the Tunjungan-Embong Malang, intersection, however, and at others, this traffic island has had wire fence placed around it to intentionally make it impossible for people to stand. In the Jemur Wonosari area, particularly near several of the schools, and on the main becak route to Wonokromo Market, there were sleeping policemen and other traffic calming devices, mainly oil barrels filled with concrete and painted in black and white stripes, and placed near the middle of the road.
10. PROPOSED NON-MOTORIZED TRANSPORT NETWORK AND PRELIMINARY SUGGESTIONS FOR NON-MOTORIZED VEHICLE DESIGN STANDARDS
In the two study areas, detailed proposals are attached as Annex I and II. Maps XIV and XV show the basic proposed non-motorized transport network, and the locations of those intersections where detailed measures have been developed. Each location has been coded to correspond to the technical annexes. In general, the proposed non-motorized traffic facilities are taken from existing road or sidewalk capacity in a way that does not reduce motorized vehicle capacity, and in most cases would actually increase it. There is only one proposal from the team to reduce road capacity (assuming the modal split of the current traffic), and that is for the intersection of Basuki Rahmat, Tunjungan, Embong Malang, and Gubernor Suryo. This area is functionally the commercial center of Surabaya, though shops in the area are currently suffering. For this intersection, the project team, based on a suggestion from the Municipality, is proposing one more radical proposal to reduce the roads to two-lanes in each direction, and adding a traffic light. It is proposing the reduction of the size of the traffic island, removing the physical barriers to pedestrians, and using the remaining downsized traffic island as a pedestrian refuge in a three-way pedestrian crossing. These changes create the possibility for a dramatic expansion of the sidewalk in front of Tunjungan Plaza and at the Embong Malang/Tunjungan intersection. Tree plantings and the regulation of vendor activity in the area are also recommended for the expanded sidewalk capacity. A fully realized architechtural conceptualization for this option should be developed. While this proposal would reduce motor vehicle capacity on this secondary arterial, it would not disrupt the overall traffic situation as capacity on parallel streets is sufficient to handle the diverted traffic, and studies show that with such projects some of the traffic will simply shift to more space-efficient modes.
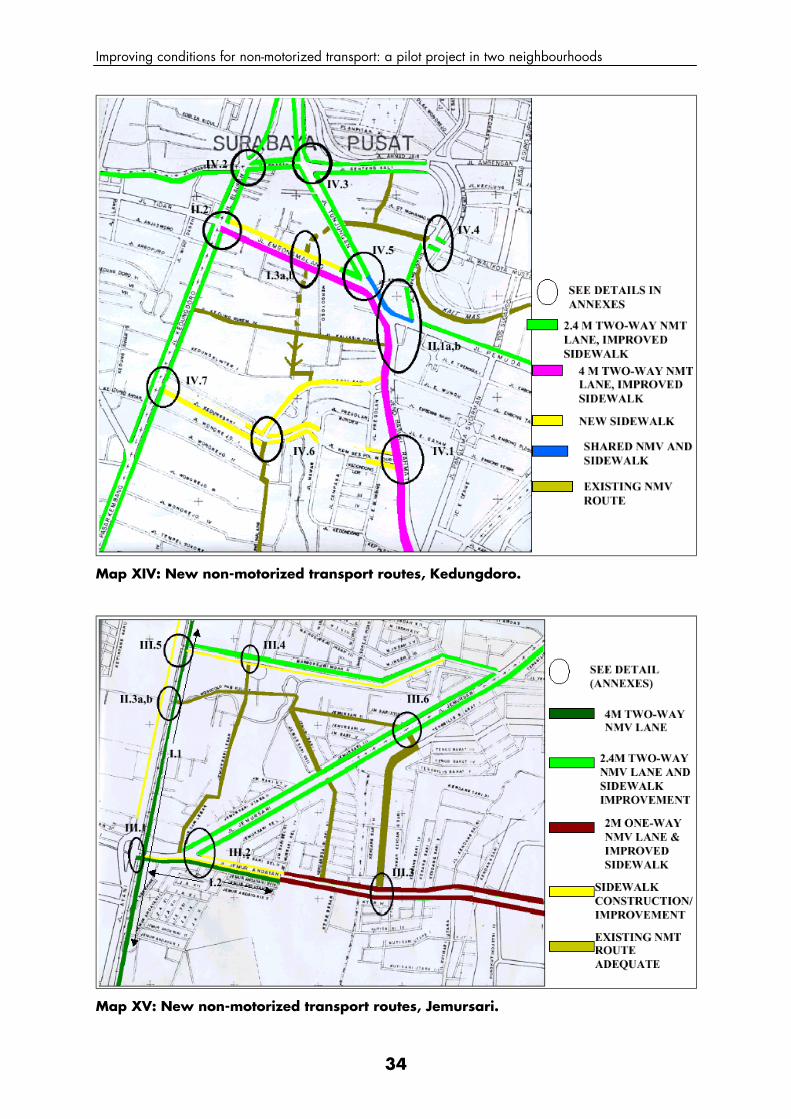
Improving conditions for non-motorized transport: a pilot project in two neighbourhoods
34
Map XIV: New non-motorized transport routes, Kedungdoro.
Map XV: New non-motorized transport routes, Jemursari.
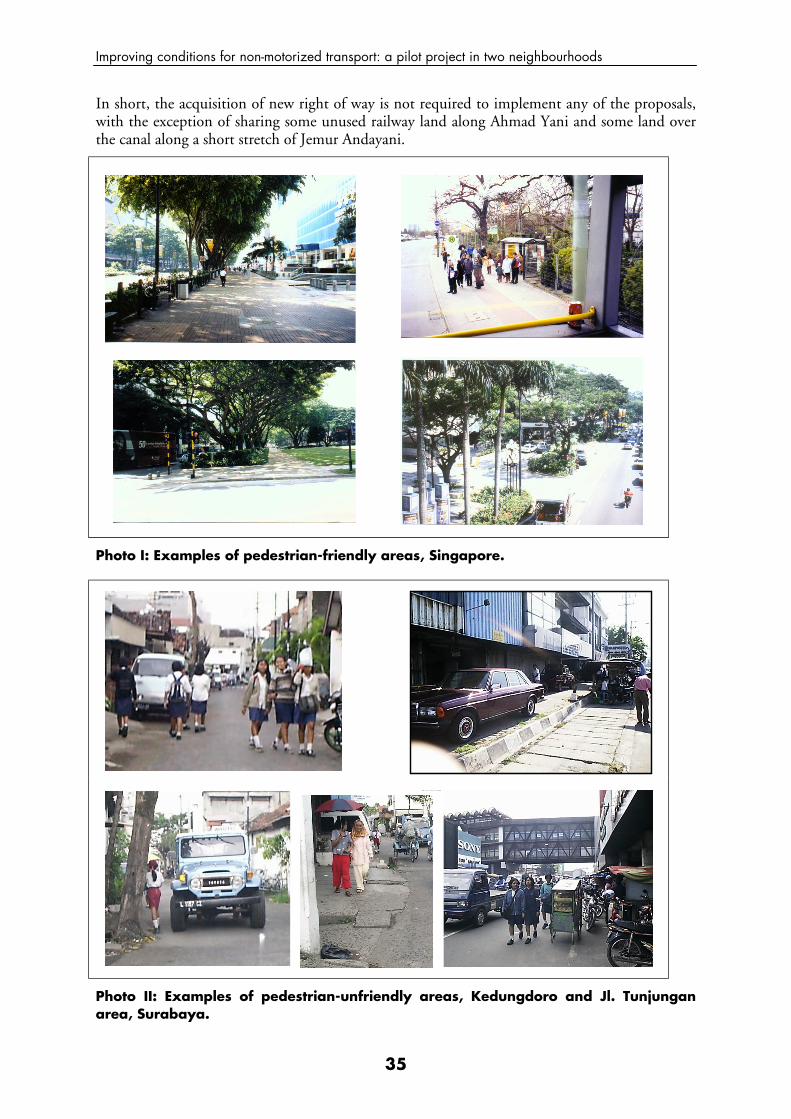
Improving conditions for non-motorized transport: a pilot project in two neighbourhoods
35
In short, the acquisition of new right of way is not required to implement any of the proposals, with the exception of sharing some unused railway land along Ahmad Yani and some land over the canal along a short stretch of Jemur Andayani.
Photo I: Examples of pedestrian-friendly areas, Singapore.
Photo II: Examples of pedestrian-unfriendly areas, Kedungdoro and Jl. Tunjungan area, Surabaya.
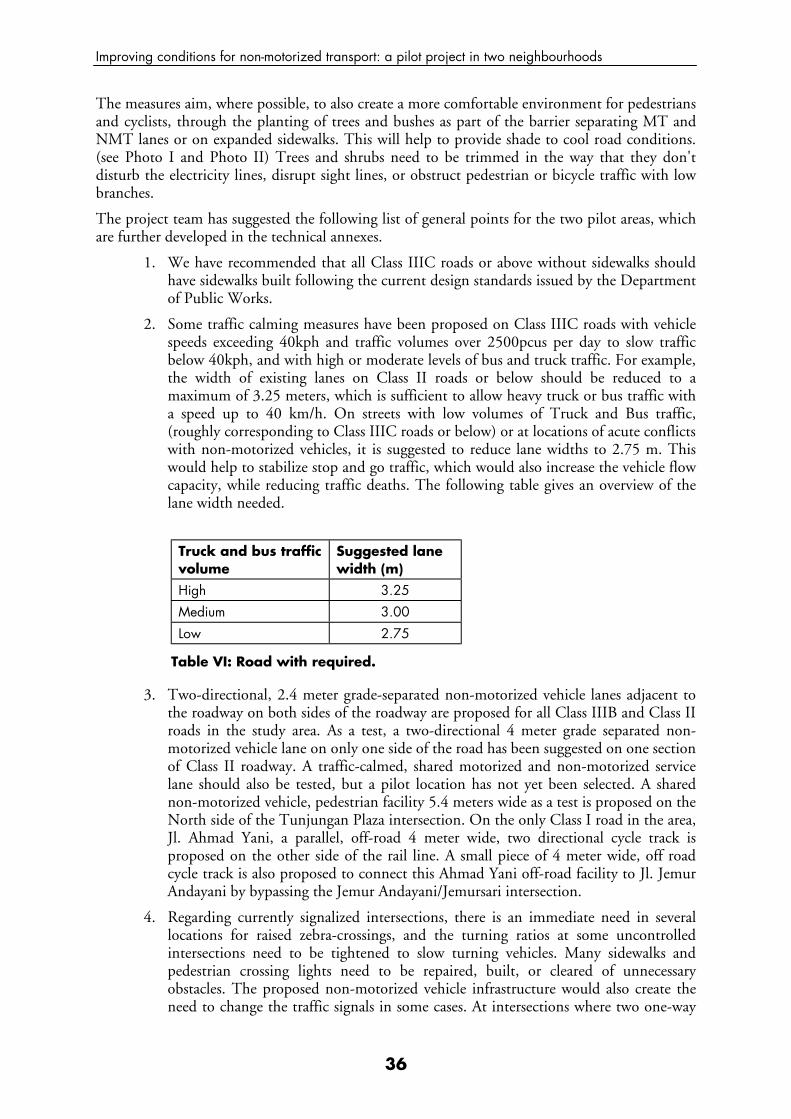
Improving conditions for non-motorized transport: a pilot project in two neighbourhoods
36
The measures aim, where possible, to also create a more comfortable environment for pedestrians and cyclists, through the planting of trees and bushes as part of the barrier separating MT and NMT lanes or on expanded sidewalks. This will help to provide shade to cool road conditions. (see Photo I and Photo II) Trees and shrubs need to be trimmed in the way that they don't disturb the electricity lines, disrupt sight lines, or obstruct pedestrian or bicycle traffic with low branches.
The project team has suggested the following list of general points for the two pilot areas, which are further developed in the technical annexes.
1. We have recommended that all Class IIIC roads or above without sidewalks should have sidewalks built following the current design standards issued by the Department of Public Works.
2. Some traffic calming measures have been proposed on Class IIIC roads with vehicle speeds exceeding 40kph and traffic volumes over 2500pcus per day to slow traffic below 40kph, and with high or moderate levels of bus and truck traffic. For example, the width of existing lanes on Class II roads or below should be reduced to a maximum of 3.25 meters, which is sufficient to allow heavy truck or bus traffic with a speed up to 40 km/h. On streets with low volumes of Truck and Bus traffic, (roughly corresponding to Class IIIC roads or below) or at locations of acute conflicts with non-motorized vehicles, it is suggested to reduce lane widths to 2.75 m. This would help to stabilize stop and go traffic, which would also increase the vehicle flow capacity, while reducing traffic deaths. The following table gives an overview of the lane width needed.
Truck and bus traffic volume
Suggested lane width (m)
High 3.25
Medium 3.00
Low 2.75
Table VI: Road with required.
3. Two-directional, 2.4 meter grade-separated non-motorized vehicle lanes adjacent to the roadway on both sides of the roadway are proposed for all Class IIIB and Class II roads in the study area. As a test, a two-directional 4 meter grade separated non-motorized vehicle lane on only one side of the road has been suggested on one section of Class II roadway. A traffic-calmed, shared motorized and non-motorized service lane should also be tested, but a pilot location has not yet been selected. A shared non-motorized vehicle, pedestrian facility 5.4 meters wide as a test is proposed on the North side of the Tunjungan Plaza intersection. On the only Class I road in the area, Jl. Ahmad Yani, a parallel, off-road 4 meter wide, two directional cycle track is proposed on the other side of the rail line. A small piece of 4 meter wide, off road cycle track is also proposed to connect this Ahmad Yani off-road facility to Jl. Jemur Andayani by bypassing the Jemur Andayani/Jemursari intersection.
4. Regarding currently signalized intersections, there is an immediate need in several locations for raised zebra-crossings, and the turning ratios at some uncontrolled intersections need to be tightened to slow turning vehicles. Many sidewalks and pedestrian crossing lights need to be repaired, built, or cleared of unnecessary obstacles. The proposed non-motorized vehicle infrastructure would also create the need to change the traffic signals in some cases. At intersections where two one-way
Improving conditions for non-motorized transport: a pilot project in two neighbourhoods
37
streets intersect, shifting from two-phases to three phases should reduce most motorized-non-motorized conflicts with no additional infrastructure costs.
5. At some locations, new traffic lights are recommended to smooth traffic flow and give non-motorized traffic a safe phase to cross roads. Funds for many of these were included in a World Bank loan that is about to expire, but the procurement never occurred. If new traffic signals are purchased, they should provide a cycle where left-turning vehicles are forced to stop, giving pedestrians and other non-motorized vehicles a chance to cross in safety.
6. In addition to traffic signals, an array of traffic calming measures at intersections are also recommended to improve safety conditions for non-motorized traffic. These measures would be effective whether or not new traffic signals are acquired. These measures include one to two-meter wide traffic islands between each traffic lane, space permitting; (well marked with reflective materials and signage) raised zebra crossings; and neck-downs to tighten turning ratios. These measures are proposed at several particularly dangerous crossings and intersections. The traffic islands create the possibility for pedestrians and NMVs to cross only part of the road at any one time, reducing their waiting time and giving them a safe place to wait mid-crossing. They also serve the function of slowing down vehicle speeds at these locations. The traffic islands will need to be well marked and publicized so that motorists understand their purpose and how to behave.
7. Bus stops need to be built, particularly along Ahmad Yani, in several locations, that would give people a safe place to wait. The project team proposes that these be built into the road in order to narrow lane widths at these points to slow traffic, while allowing bus traffic to re-enter the traffic stream uninhibited.
8. No new pedestrian bridges should be built, as they create ground-level obstructions of the sidewalk, are inconvenient, particularly for the elderly, for children, and for women, create a place where pedestrians are vulnerable to crime, and surveys indicate that people do not use them anyway.
9. Several bridges, currently closed or hostile to non-motorized traffic, should either add a bike lane or build a parallel non-motorized bridge to end severance problems.
Furthermore, the proposal should be integrated with plans to develop a bus-rapid transit system on this route, and with plans to modernize the Wonocromo Market. With the implementation of a bus rapid transit or light rail route through the central area, the total passenger capacity of this artery would actually be increased over its current level, to the considerable benefit of downtown merchants.
While in the long run, the one-way street system should probably be abolished, the implementation of above recommendations would dramatically reduce the need to remove the one-way system. In fact, if the one-way system remained in place, it would create a strong encouragement for passengers to switch to non-motorized modes, which would then enjoy a considerable advantage in terms of detour-factors over motorized modes. Furthermore, the one-way system simplifies the conflicts at intersections between motorized and non-motorized modes.
Finally, the Municipality should consider changing regulations banning the becak from Class II roads and below. Conflicts with this mode should be resolved instead through their requirement to use new special facilities for non-motorized vehicles. Such measures would increase the capacity of the road system as a whole, while avoiding the current social conflicts that have arisen with becak operators in other locations. (See Annex III)
Improving conditions for non-motorized transport: a pilot project in two neighbourhoods
38
11. CONCLUDING COMMENTS AND NEXT STEPS Non-motorized transportation and the efficiency of short-distance travel in Surabaya has long been ignored, to the detriment of the environment, the incomes of the poor, the road safety situation, and social harmony. Household survey data was never collected for non-motorized trips, so the origins and destinations of these trips were not known. As a result, traffic management decisions and new infrastructure investment decisions were made with no knowledge of the impact of these decisions on non-motorized modes, and these impacts were frequently negative.
Much can be done to remedy the situation. First, the proposals developed here must be further developed by DLLAJ KS (Level II) and the Municipal Public Works Office (Dinas PU, Level II) under the supervision of a Non-Motorized Task Force which was initiated as part of this project. While these proposals were developed through collaboration between international experts, local experts and Municipal officials, affected people, and NGOs, ultimately the best designs for improving conditions for non-motorized transport in Surabaya will not be known until the array of suggestions in this report are implemented and tested and the appropriateness of each design element assessed and modified to better meet local needs. Only after this process should well-developed designs be disseminated or applied to other areas in Surabaya, or to other cities with similar conditions, and some guidelines or regulations be proposed.
The implementation should begin in locations with the highest urgency, where the chance of success is the highest, where political resistance is the lowest, and at locations for which the improvement plan is the most developed. Annex I lists the proposed intervention in an order which reflects the project teams initial prioritization. While the report documents proposals for some 20 locations identified by the Task Force in the two pilot areas, only a few interventions were discussed in detail with the stakeholders, at a workshop held on May 27, 2000. The results of these discussions are included in Annex IV.
First, a proposed off-road non-motorized vehicle lanes along Jl. Ahmad Yani connecting Jl. Jemursari to Wonokromo Market, and another off-road non-motorized vehicle lane circumventing the Jl. Jemursari and Jl. Jemur Andayani intersection were discussed. As these proposals were off road, and much of the lanes are already built, they met with few objections, but it was pointed out that it would require the approval of the Minister of Transport, facilitated by a letter from the Governor, in order to convince the rail authority to allow the use of some railway land. More detailed design work is needed for these facilities, but it should be a top priority due to the positive impact, the role it could serve in a city-wide network, and the lack of clear political resistance.
More in-depth designs and discussions were held for Jl. Embong Malang and the Embong Malang/Kedungdoro intersections. Detailed plans for the Jl. Embong Malang area were made (top-view in the scale of 1:1.000, cross-section at the bus stop location, and a 3D-illustration), as well as cross sections and a visual representation. Most proposed improvements were accepted by stakeholders participating in the May 27 workshop, though there was some reluctance regarding the pedestrian island.
Changing the intersection in front of Tunjungan Plaza was also discussed in depth and two alternatives presented. As this is the commercial center of the city, and the one way system in this area creates enormous detour factors for non-motorized vehicles, all agreed this area should be a priority. Most accepted non-motorized vehicle lanes in the area and the need for a traffic light. However, the complexity of the Tunjungan Plaza intersection, disagreement over two differing options, and some disagreements among stakeholders indicate that further design work based on further consultations with relevant stakeholders is required before implementation of these designs can realistically proceed.
Improving conditions for non-motorized transport: a pilot project in two neighbourhoods
39
The next most important priority should be a pilot project at the intersection of Jl. Ahmad Yani and the leather factory (Jl. Pabrik Kulit). Jl. Ahmad Yani has more traffic deaths than any other location in the city, and bus passengers are waiting in the road, creating dangerous conflicts between motorized and non-motorized vehicles. This intervention is also critical to the success of the bus corridor project also supported by GTZ. Successful interventions to reduce traffic deaths along this road could be easily replicated all along this very dangerous road.
Many of the other suggestions listed in the appendix might also be considered for priority implementation by the Task Force, as many of them, being lower profile, may attract less opposition.
Winning the political support of the Mayor and Governor and the affected communities is ultimately important to project success and to securing the support of DLLAJ Level II and Dinas PU Level II, which are needed to implement the project. DLLAJ and DPU have already requested more detailed analysis of the traffic impact of the proposed interventions. Traffic modeling using the SITNP database and a reasonable traffic demand model that can accommodate non-motorized trips (EMME/2, TransCad, etc.) is likely to be expensive, inaccurate, and is not really necessary except for the more radical Tunjungan Plaza proposal and perhaps some of the traffic signal changes. For all other interventions, traffic flow impacts should not be very disruptive, and given the inability of even the best traffic demand models to model non-motorized modes, it would be more fruitful to implement some sections of the proposed overall plan and then test empirically the traffic impacts.
The implementation phase needs to begin with detailed construction, top-view drawings in the scale of 1:500, or preferably 1:250, for the priority areas identified in Annex I. It is useful to consider flexible, but robust building materials or elements since the design may still need to be changed during the test phase. New signalization programs that consider NMT phases especially for the traffic light at the intersection of Jl. Embong Malang and Jl. Kedungdoro also needs to be developed.
While preliminary cost estimates are included in Annex VII, further costing of the priority interventions needs to be further developed. The measures then need to be included in the budgets of the relevant implementing agencies (DPU and DLLAJ), and support from any international funding agencies can then be sought, if necessary. Realistically, NGOs outside the government and project patrons inside the government will both have to work hard to mobilize the necessary political support for these measures to get them accepted by the communities, the agencies, and the City Council. The Task Force initiated by the project could play this role to the extent that its members strongly support the project. Without these efforts, it is unlikely that any of the proposals will be implemented or implemented properly.
If the implementation is successful, a public relations effort explaining the new facilities to the public and winning their support will be critical. A ribbon-cutting ceremony should be held where key public officials would receive the positive publicity they deserve for supporting the project. By riding bicycles on this day, public officials could demonstrate to the public that these modes are high-status rather than low status. The inauguration of the facilities could also involve a bicycle-to-work day. A public awareness campaign should accompany the inauguration of the new facilities, in order to build public support for the program, and to help the public understand and learn how to use the new facilities. This is particularly important because some facilities are new for Surabaya, and many residents may initially be confused about their purpose, which could lead to negative public reactions.
The pilot interventions should then be monitored for their impacts on safety, on pollution, on modal split, on retail activity downtown, and on traffic congestion, as these impacts in the Surabaya context cannot be fully anticipated in advance. These pilot interventions should then be modified based on the impacts of the facilities.
Improving conditions for non-motorized transport: a pilot project in two neighbourhoods
40
At this point, a city-wide non-motorized transport master plan should be developed, and non-motorized transport design standards developed. This would begin with further household and roadside surveys and traffic counts in the rest of the city which include non-motorized trips. While this step could feasibly be avoided by simply using the origin-destination matrixes of trips under 5 kilometers, and assuming that the potential non-motorized trips should be the same trips, it would lose information about trips currently made primarily by non-motorized modes. Based on this information, a city-wide non-motorized transport network and improvement plan should be developed under the auspices of the Task Force initiated to implement this pilot project.
All of these measures are extremely modest in cost relative to their benefits. Lack of availability of funding would hardly seem a relevant consideration given that far more expensive projects with far fewer beneficiaries and lower cost-benefit ratios will continue to be funded.
Improving conditions for non-motorized transport: a pilot project in two neighbourhoods
41
SOURCES Barter, P. 1999. An International Comparative Perspective on Urban Transport and Urban Form in Pacific Asia: The Challenge of Rapid Motorization in Dense Cities (Perth: Murdoch University, PhD Thesis).
De Langen, M. 1999 [draft]. Liveable African Cities: A Guideline for Urban Pedestrian and Bicycle Traffic in Africa. (Washington, D.C.: World Bank Sub-Saharan Africa Transport Program).
Gallagher, D. 1992. The Rickshaws of Bangladesh. (Dhaka: University Press).
Kuranami, 1994. Non-Motorized Transport in Ten Asian Cities. (Washington D.C.: The World Bank)
Midgeley, P. 1994. Urban Transport in Asia (Washington D.C.: The World Bank)
Mohan, D. 2000. “Measures to Improve Road Safety of Vulnerable Road Users.” Presented at the International Conference on Sustainable Transportation and Clean Air, Jakarta, May 29 – 31, 2000.
Pedoman Teknis Perekayasaan Fasilitas Pejalan Kaki Diwilayah Kota. 1999. Departemen Perhubungan, Direktorat Jenderal Perhubungan Darat.
Pucher, J. and L. Dijkstra, 2000. “Making Walking and Cycling Safer: Lessons from Europe,” Transportation Quarterly. Vol 54, No. 3.
Replogle, 1992. Non-Motorized Transport in Asian Cities. (Washington D.C.: The World Bank)
Rimmer, P. 1986. Rickshaw to Rapid Transit: Urban Public Transport Systems and Public Policy in Southeast Asia (New York: Pergamon Press).
Sign Up for the Bike: Design Manual for a Cycle-Friendly Infrastructure. 1994. (The Netherlands: Centre for Research and Contract Standardization in Civil and Traffic Engineering).
SITNP II. 1998. Government of the Republic of Indonesia, Ministry of Communications, Directorate General of Land Transport Urban Transport Improvement Project, Surabaya Integrated Transport Network Planning Project Phase II.
Tiwari, G. 2000. “Socio-Economic Impacts of Mobility, Safety, and Environmental Policies,” Paper Presented at the International Conference on Sustainable Transportation and Air Pollution, Jakarta, May 29 – 31, 2000.
Transportation Strategies for Human Settlements in Developing Countries. 1984. (Nairobi, Kenya: UNCHS).
Urban Air Quality Management Strategy in Asia: Jakarta Report. 1997. (Washington D.C.: The World Bank Technical Paper No. 379.)
Urban Air Quality Management Strategy in Asia: Greater Mumbai Report. 1997. (Washington D.C.: The World Bank Technical Paper No. 381.)