Embed Size (px)
Citation preview
Volkswirtschaftliche Gesamtrechnungen
InlandsproduktsberechnungVierteljahresergebnisse
3. Vierteljahr 2012
Erscheinungsfolge: vierteljährlichStand: November 2012Erschienen am 23.11.2012Artikelnummer: 2180120123234
Weitere Informationen zur Thematik dieser Publikation unter:Telefon: +49 (0) 611 / 75 26 26; Fax: +49 (0) 611 / 75 39 52;E-Mail: [email protected]
© Statistisches Bundesamt, Wiesbaden 2012Vervielfältigung und Verbreitung, auch auszugsweise, mit Quellenangabe gestattet.
Statistisches Bundesamt
Fachserie 18 Reihe 1.2

INHALT
Vorbemerkung, Gebietsstand, Zeichenerklärung
Tabellenteil
1 Tabellen für die Gesamtwirtschaft
1.1 Bruttoinlandsprodukt
1.2 Bruttoinlandsprodukt und Nationaleinkommen
1.3 Volkseinkommen und verfügbares Einkommen der Volkswirtschaft
1.4 Bruttoinlandsprodukt, Bruttonationaleinkommen, Volkseinkommen (Pro-Kopf-Angaben)
1.5 Verfügbares Einkommen, Sparen und Finanzierungssaldo der Volkswirtschaft
1.6 Realeinkommen (Realwerte) der Volkswirtschaft
1.7 Verfügbares Einkommen der privaten Haushalte und seine Verwendung
1.8 Arbeitnehmerentgelt, Löhne und Gehälter (Inländer)
1.9 Masseneinkommen und verfügbares Einkommen der privaten Haushalte
1.10 Bevölkerung und Erwerbsbeteiligung
1.11 Erwerbstätige, Arbeitnehmer und geleistete Arbeitsstunden im Inland
1.12 Arbeitsproduktivität, Durchschnittslöhne und Lohnstückkosten
1.13 Bruttoinlandsprodukt und Bruttowertschöpfung
2 Tabellen für Wirtschaftsbereiche
2.1 Bruttowertschöpfung in jeweiligen Preisen
2.2 Bruttowertschöpfung, preisbereinigt
2.3 Arbeitnehmerentgelt
2.4 Bruttolöhne und -gehälter
2.5 Erwerbstätige
2.6 Arbeitnehmer
2.7 Geleistete Arbeitsstunden der Erwerbstätigen
2.8 Geleistete Arbeitsstunden je Erwerbstätigen
2.9 Geleistete Arbeitsstunden der Arbeitnehmer
2.10 Geleistete Arbeitsstunden je Arbeitnehmer
2.11 Bruttoinlandsprodukt bzw. Bruttowertschöpfung in jeweiligen Preisen je Erwerbstätigen
2.12 Bruttoinlandsprodukt bzw. Bruttowertschöpfung in jeweiligen Preisen je geleisteter Erwerbstätigenstunde
2.13 Arbeitsproduktivität je Erwerbstätigen
2.14 Arbeitsproduktivität je geleisteter Erwerbstätigenstunde
2.15 Arbeitnehmerentgelt je Arbeitnehmer
2.16 Arbeitnehmerentgelt je geleisteter Arbeitnehmerstunde
2.17 Bruttolöhne und -gehälter je Arbeitnehmer
2.18 Bruttolöhne und -gehälter je geleisteter Arbeitnehmerstunde
2.19 Lohnstückkosten (Personenkonzept)
2.20 Lohnstückkosten (Stundenkonzept)
3 Tabellen zur Verwendung des Bruttoinlandsprodukts
3.1 Verwendung des Bruttoinlandsprodukts in jeweiligen Preisen
3.2 Verwendung des Bruttoinlandsprodukts, preisbereinigt
3.3 Verwendung des Bruttoinlandsprodukts, Preisentwicklung
3.4 Konsum in jeweiligen Preisen
3.5 Konsum, preisbereinigt
3.6 Konsumausgaben der privaten Haushalte im Inland nach Verwendungszwecken in jeweiligen Preisen
3.7 Konsumausgaben der privaten Haushalte im Inland nach Verwendungszwecken, preisbereinigt
3.8 Konsumausgaben des Staates in jeweiligen Preisen
3.9 Bruttoanlageinvestitionen in jeweiligen Preisen
3.10 Bruttoanlageinvestitionen, preisbereinigt
3.11 Bruttoanlageinvestitionen des Staates und der nichtstaatlichen Sektoren in jeweiligen Preisen
3.12 Bruttoanlageinvestitionen des Staates und der nichtstaatlichen Sektoren, preisbereinigt
3.13 Bauinvestitionen nach Bauarten in jeweiligen Preisen
3.14 Bauinvestitionen nach Bauarten, preisbereinigt
3.15 Exporte und Importe in jeweiligen Preisen
3.16 Exporte und Importe, preisbereinigt
4 Arbeitstage
Anhang
Veröffentlichungstermine der Volkswirtschaftlichen Gesamtrechnungen (VGR) im Jahr 2012

Vorbemerkung
� Erstmals nachgewiesen werden in dieser Ausgabe die Ergebnisse für das dritte Vierteljahr 2012. Die Ergebnisse für das erste und zweite
Vierteljahr 2012 wurden überarbeitet und � soweit erforderlich � revidiert.
� in der Tabelle 3.12 "Bruttoanageinvestitionen des Staates und der nichtstaatlichen Sektoren, preisbereinigt" wurden die Ergebnisse ab
dem Zeitraum 2008 korrigiert.
� Saisonbereinigte Ergebnisse finden Sie in der zeitgleich bereitgestellten Reihe 1.3 "Saisonbereinigte Vierteljahresergebnisse nach Census
X-12-ARIMA und BV4.1".
� Termine für das 4. Vierteljahr 2012: BIP-Schnellmeldung: 14.02.2013, tiefer gegliederte Ergebnisse: 22.02.2013
Für die dargestellten Ergebnisse gelten die folgenden allgemeinen Hinweise, ohne dass diese jeweils wiederholt werden:
� Rechenstand dieser Ergebnisse ist November 2012.
� Die nicht sichtbaren Ergebnisse für den Zeitraum zurück bis 1991 können in der Excel-Datei von jedem Nutzer selbst eingeblendet werden.
� Einen ausführlichen Qualitätsbericht über die Volkswirtschaftlichen Gesamtrechnungen (VGR) finden Sie in unserem Internetangebot
unter www.destatis.de > Publikationen > Qualitätsberichte > Volkswirtschaftliche Gesamtrechnungen.
� Die Ergebnisse in der Gliederung nach Wirtschaftsbereichen werden nach der Klassifikation der Wirtschaftszweige (WZ 2008) dargestellt.
� Die Ergebnisse in jeweiligen Preisen werden in der Regel in Milliarden Euro (Mrd. EUR) mit zwei Nachkommastellen dargestellt. Daraus
kann nicht auf die inhaltliche Genauigkeit geschlossen werden. Bei der Addition von Ergebnissen können Abweichungen durch Run-
dungen entstehen.
� Die Angaben je Einwohner, je Erwerbstätigen und je Arbeitnehmer werden auf 1 Euro gerundet, die Angaben je Stunde auf 1 Euro-Cent gerundet nachgewiesen.
� Die preisbereinigten Ergebnisse werden entsprechend internationaler Konventionen und verbindlicher europäischer Rechtsvorschriften
auf der Grundlage einer jährlich wechselnden Preisbasis (Vorjahrespreisbasis) nachgewiesen. Dadurch werden immer die aktuellen
Preisrelationen in der Rechnung berücksichtigt, was eine genauere Berechnung der "realen" Veränderungsraten gewährleistet. Rechen-
technisch werden bei der Methode der Vorjahrespreisbasis zunächst Jahresergebnisse in Preisen des Vorjahres als Messzahlen ermittelt,
die durch Verkettung ("Chain-linking") jedes einzelnen Merkmals vergleichbare Zeitreihen bilden. Zur Berechnung der vierteljährlichen
Daten auf Vorjahrespreisbasis (Verkettung) wird die sog. Annual-Overlap-Methode verwendet.
� Die Darstellung der preisbereinigten Ergebnisse erfolgt i.d.R. in Form von verketteten Indizes (sog. Kettenindizes) mit dem Referenzjahr
2005=100. Kettenindizes werden auf zwei Stellen nach dem Komma gerundet.
� Die Veränderungsraten werden von den gerundeten Werten errechnet.
� Die Veränderung der Ergebnisse gegenüber dem entsprechenden Zeitraum des Vorjahres wird in Prozent, in Mrd. EUR oder als Wachs-
tumsbeitrag zum Bruttoinlandsprodukt (BIP) in Prozent-Punkten ausgedrückt. Bei den saisonbereinigten Ergebnissen in der Tabelle 1.1
wird die Veränderung in Prozent gegenüber dem Vorquartal sowie gegenüber dem entsprechenden Quartal des Vorjahres angegeben. Der
Unterschied zwischen der Vorjahresveränderung der unbereinigten und der Vorjahresveränderung der saison- und kalenderbereinigten
Ergebnisse zeigt weitgehend den Kalendereffekt.
� Die abgeleiteten Kennziffern wie Arbeitsproduktivität, Lohnkosten, Verdienst und Lohnstückkosten sind teilweise nur eingeschränkt
aussagefähig und unsicherer als die ihnen zugrundeliegenden Ausgangsgrößen. Dies betrifft besonders die Darstellung nach Wirtschafts-
bereichen und Vierteljahren.
� Die Zeitreihe zur Erwerbslosigkeit entspricht der Definition der Internationalen Arbeitsorganisation (Labour-Force-Konzept). Dargestellt
werden Ergebnisse der Arbeitskräfteerhebung, die sich auf Personen in Privathaushalten im Alter von 15 bis 74 Jahren beziehen.
Methodische Hinweise finden sich unter www.destatis.de > Arbeitsmarkt > ILO-Arbeitsmarktstatistik.
Gebietsstand
Alle Angaben beziehen sich auf die Bundesrepublik Deutschland nach dem Gebietsstand seit dem 3.10.1990.
Zeichenerklärung
� = nichts vorhanden oder weniger als die Hälfte von 1 in der letzten besetzten Stelle
/ = keine Angaben, da Zahlenwert nicht sicher genug
. = Zahlenwert unbekannt oder geheimzuhalten
... = Angabe fällt später an
x = Tabellenfach gesperrt, weil Aussage nicht sinnvoll
1 Tabellen für die Gesamtwirtschaft
1.1 Bruttoinlandsprodukt
Werte nach Census X-12-ARIMA
Kalender-faktoren 1)
Kalender-einfluss 2)
kalenderbereinigt 3)saison- und
kalenderbereinigt
1 2 3 4 5 6 7 8 9 10 11 12
Mrd. EUR % 4) Mrd. EUR % 5) 2005=100 % 4) % 4) 2005=100 % 4) 2005=100 % 5)
2007 2 428,50 5,0 2 432,20 5,1 107,09 3,3 99,85 – 0,1 107,26 3,4 107,26 3,4
2008 2 473,80 1,9 2 470,73 1,6 108,25 1,1 100,12 0,3 108,12 0,8 108,12 0,8
2009 2 374,50 – 4,0 2 372,85 – 4,0 102,70 – 5,1 100,06 – 0,1 102,63 – 5,1 102,63 – 5,1
2010 2 496,20 5,1 2 491,25 5,0 106,97 4,2 100,19 0,1 106,76 4,0 106,76 4,0
2011 2 592,60 3,9 2 589,26 3,9 110,21 3,0 100,13 – 0,1 110,07 3,1 110,07 3,1
2008 1.Vj 608,52 2,9 622,33 1,2 107,17 2,1 99,56 – 0,8 107,64 2,9 109,24 1,0 2.Vj 618,08 4,0 621,27 – 0,2 109,22 3,1 101,00 1,3 108,14 1,8 108,76 – 0,4 3.Vj 631,67 1,8 619,05 – 0,4 110,58 1,1 100,12 0,5 110,45 0,5 108,33 – 0,4 4.Vj 615,53 – 1,1 608,08 – 1,8 106,04 – 1,9 99,82 0,1 106,23 – 1,9 106,13 – 2,0
2009 1.Vj 573,67 – 5,7 584,72 – 3,8 100,23 – 6,5 99,83 0,3 100,40 – 6,7 101,80 – 4,1 2.Vj 577,74 – 6,5 588,52 0,6 101,14 – 7,4 99,71 – 1,3 101,43 – 6,2 102,05 0,2 3.Vj 608,81 – 3,6 596,44 1,3 105,05 – 5,0 100,18 0,1 104,86 – 5,1 102,86 0,8 4.Vj 614,28 – 0,2 603,17 1,1 104,37 – 1,6 100,52 0,7 103,83 – 2,3 103,80 0,9
2010 1.Vj 598,33 4,3 608,73 0,9 103,07 2,8 99,94 0,1 103,13 2,7 104,49 0,7 2.Vj 612,66 6,0 621,88 2,2 106,21 5,0 100,08 0,4 106,12 4,6 106,80 2,2 3.Vj 640,71 5,2 627,76 0,9 109,81 4,5 100,16 – 0,0 109,63 4,5 107,55 0,7 4.Vj 644,50 4,9 632,88 0,8 108,79 4,2 100,58 0,1 108,16 4,2 108,20 0,6
2011 1.Vj 633,01 5,8 641,73 1,4 108,42 5,2 100,22 0,3 108,18 4,9 109,53 1,2 2.Vj 637,56 4,1 646,75 0,8 109,49 3,1 100,17 0,1 109,31 3,0 110,03 0,5 3.Vj 663,12 3,5 650,28 0,5 112,64 2,6 100,07 – 0,1 112,56 2,7 110,43 0,4 4.Vj 658,91 2,2 650,50 0,0 110,28 1,4 100,07 – 0,5 110,21 1,9 110,27 – 0,1
2012 1.Vj 651,25 2,9 656,89 1,0 110,26 1,7 100,69 0,5 109,51 1,2 110,82 0,5 2.Vj 648,60 1,7 661,07 0,6 110,04 0,5 99,68 – 0,5 110,39 1,0 111,12 0,3 3.Vj 674,85 1,8 664,88 0,6 113,08 0,4 99,61 – 0,5 113,53 0,9 111,38 0,2
1) Quelle: Deutsche Bundesbank. � 2) Veränderung der Kalenderfaktoren gegenüber dem Vorjahr bzw. dem Vorjahresquartal. � 3) Ursprungswerte dividiert durch Kalenderfaktoren. Für Jahre entsprechen die kalenderbereinigten Werte gleich den saison- und kalenderbereinigten Werten (ausgenommen Rundungs-differenzen). � 4) Veränderung gegenüber dem Vorjahr bzw. dem Vorjahresquartal. � 5) Veränderung gegenüber dem Vorjahr bzw. dem Vorquartal.
saison- und kalenderbereinigte
Werte nachCensus X-12-ARIMA
Jahr,Vierteljahr
In jeweiligen Preisen Preisbereinigt, verkettet
Ursprungswerte Ursprungswerte
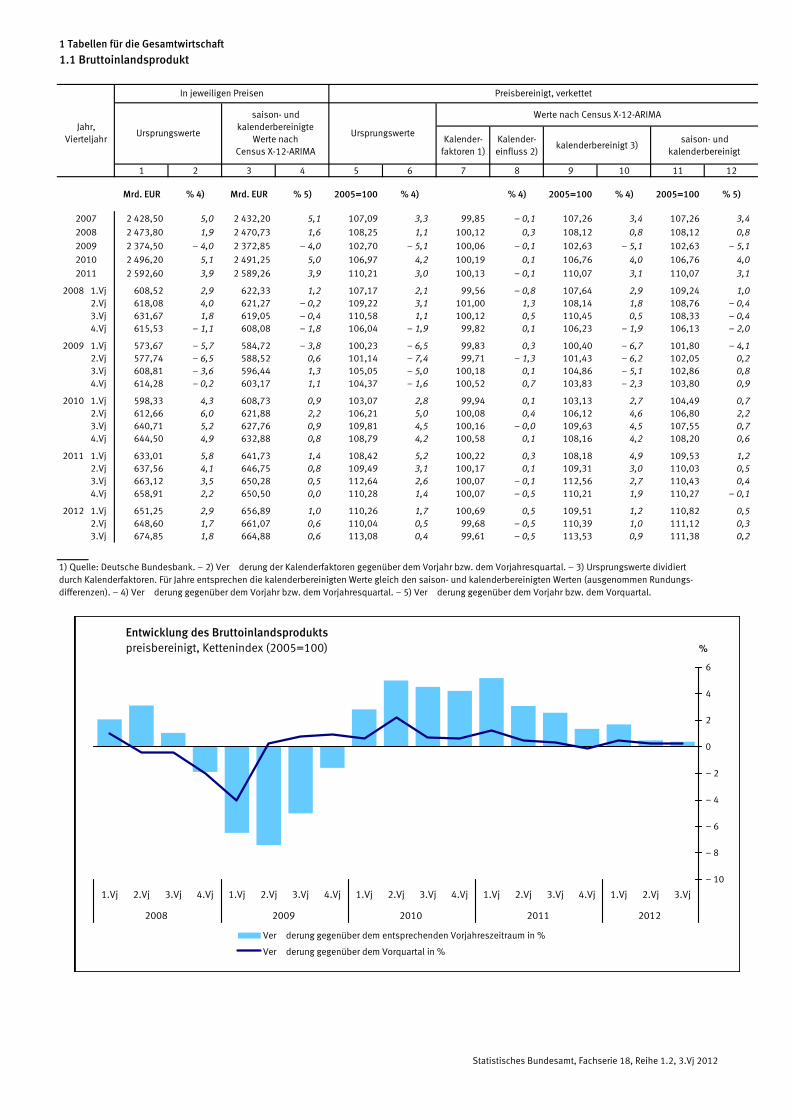
Entwicklung des Bruttoinlandsproduktspreisbereinigt, Kettenindex (2005=100)
1.Vj 2.Vj 3.Vj 4.Vj 1.Vj 2.Vj 3.Vj 4.Vj 1.Vj 2.Vj 3.Vj 4.Vj 1.Vj 2.Vj 3.Vj 4.Vj 1.Vj 2.Vj 3.Vj
2008 2009 2010 2011 2012
%
� 10
� 8
� 6
� 4
� 2
0
2
4
6
Veränderung gegenüber dem entsprechenden Vorjahreszeitraum in %
Veränderung gegenüber dem Vorquartal in %
Statistisches Bundesamt, Fachserie 18, Reihe 1.2, 3.Vj 2012

1.2 Bruttoinlandsprodukt und Nationaleinkommen
Saldo(Sp. 3�4)
aus derübrigen Welt
an dieübrige Welt
1 2 3 4 5 6 7
Mrd. EUR
2007 2 428,50 41,83 248,15 206,32 2 470,33 352,33 2 118,00
2008 2 473,80 28,83 198,20 169,37 2 502,63 366,50 2 136,13
2009 2 374,50 57,97 186,83 128,86 2 432,47 374,54 2 057,93
2010 2 496,20 50,46 193,18 142,72 2 546,66 379,53 2 167,13
2011 2 592,60 48,31 208,58 160,27 2 640,91 390,22 2 250,69
2008 1.Vj 608,52 8,38 52,60 44,22 616,90 90,58 526,32 2.Vj 618,08 � 3,27 50,85 54,12 614,81 91,85 522,96 3.Vj 631,67 9,02 45,52 36,50 640,69 92,20 548,49 4.Vj 615,53 14,70 49,23 34,53 630,23 91,87 538,36
2009 1.Vj 573,67 13,03 43,60 30,57 586,70 93,57 493,13 2.Vj 577,74 6,35 46,12 39,77 584,09 93,98 490,11 3.Vj 608,81 17,46 45,00 27,54 626,27 93,60 532,67 4.Vj 614,28 21,13 52,11 30,98 635,41 93,39 542,02
2010 1.Vj 598,33 11,82 43,84 32,02 610,15 94,45 515,70 2.Vj 612,66 2,32 47,20 44,88 614,98 95,27 519,71 3.Vj 640,71 13,26 46,33 33,07 653,97 94,94 559,03 4.Vj 644,50 23,06 55,81 32,75 667,56 94,87 572,69
2011 1.Vj 633,01 11,75 47,00 35,25 644,76 96,84 547,92 2.Vj 637,56 � 1,02 50,49 51,51 636,54 97,77 538,77 3.Vj 663,12 15,02 51,43 36,41 678,14 97,69 580,45 4.Vj 658,91 22,56 59,66 37,10 681,47 97,92 583,55
2012 1.Vj 651,25 13,78 52,19 38,41 665,03 99,20 565,83 2.Vj 648,60 4,33 51,89 47,56 652,93 100,19 552,74 3.Vj 674,85 13,70 47,28 33,58 688,55 100,28 588,27
in % in Mrd. EUR
2007 5,0 � 5,30 16,6 24,5 4,6 4,9 4,6
2008 1,9 � 13,00 – 20,1 – 17,9 1,3 4,0 0,9
2009 – 4,0 29,14 – 5,7 – 23,9 – 2,8 2,2 – 3,7
2010 5,1 � 7,51 3,4 10,8 4,7 1,3 5,3
2011 3,9 � 2,15 8,0 12,3 3,7 2,8 3,9
2008 1.Vj 2,9 � 4,50 – 14,4 – 8,9 2,1 3,6 1,8 2.Vj 4,0 � 4,02 – 20,2 – 14,1 3,3 4,0 3,2 3.Vj 1,8 � 1,47 – 22,9 – 24,8 1,5 4,5 1,0 4.Vj – 1,1 � 3,01 – 23,0 – 25,3 – 1,5 4,1 – 2,4
2009 1.Vj – 5,7 4,65 – 17,1 – 30,9 – 4,9 3,3 – 6,3 2.Vj – 6,5 9,62 – 9,3 – 26,5 – 5,0 2,3 – 6,3 3.Vj – 3,6 8,44 – 1,1 – 24,5 – 2,3 1,5 – 2,9 4.Vj – 0,2 6,43 5,9 – 10,3 0,8 1,7 0,7
2010 1.Vj 4,3 � 1,21 0,6 4,7 4,0 0,9 4,6 2.Vj 6,0 � 4,03 2,3 12,8 5,3 1,4 6,0 3.Vj 5,2 � 4,20 3,0 20,1 4,4 1,4 4,9 4.Vj 4,9 1,93 7,1 5,7 5,1 1,6 5,7
2011 1.Vj 5,8 � 0,07 7,2 10,1 5,7 2,5 6,2 2.Vj 4,1 � 3,34 7,0 14,8 3,5 2,6 3,7 3.Vj 3,5 1,76 11,0 10,1 3,7 2,9 3,8 4.Vj 2,2 � 0,50 6,9 13,3 2,1 3,2 1,9
2012 1.Vj 2,9 2,03 11,0 9,0 3,1 2,4 3,3 2.Vj 1,7 5,35 2,8 – 7,7 2,6 2,5 2,6 3.Vj 1,8 � 1,32 – 8,1 – 7,8 1,5 2,7 1,3
in %
Veränderung gegenüber dem entsprechenden Vorjahreszeitraum
Jahr,Vierteljahr
Brutto-inlands-produkt
Brutto-national-
einkommen(Sp.1+2)
Abschreibungen
Netto-national-
einkommen(Sp.5�6)
Primäreinkommen
Statistisches Bundesamt, Fachserie 18, Reihe 1.2, 3.Vj 2012
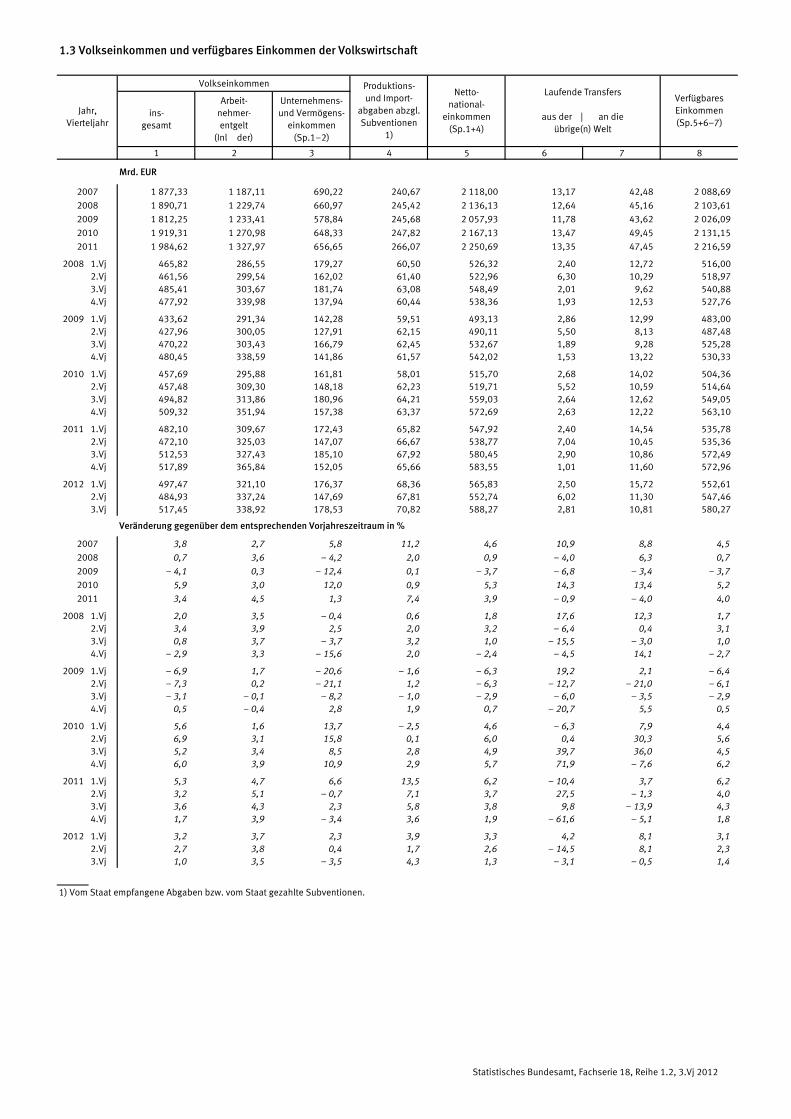
1.3 Volkseinkommen und verfügbares Einkommen der Volkswirtschaft
Volkseinkommen
ins-gesamt
Arbeit-nehmer-entgelt
(Inländer)
Unternehmens-und Vermögens-
einkommen(Sp.1�2)
1 2 3 4 5 6 7 8
Mrd. EUR
2007 1 877,33 1 187,11 690,22 240,67 2 118,00 13,17 42,48 2 088,69
2008 1 890,71 1 229,74 660,97 245,42 2 136,13 12,64 45,16 2 103,61
2009 1 812,25 1 233,41 578,84 245,68 2 057,93 11,78 43,62 2 026,09
2010 1 919,31 1 270,98 648,33 247,82 2 167,13 13,47 49,45 2 131,15
2011 1 984,62 1 327,97 656,65 266,07 2 250,69 13,35 47,45 2 216,59
2008 1.Vj 465,82 286,55 179,27 60,50 526,32 2,40 12,72 516,00 2.Vj 461,56 299,54 162,02 61,40 522,96 6,30 10,29 518,97 3.Vj 485,41 303,67 181,74 63,08 548,49 2,01 9,62 540,88 4.Vj 477,92 339,98 137,94 60,44 538,36 1,93 12,53 527,76
2009 1.Vj 433,62 291,34 142,28 59,51 493,13 2,86 12,99 483,00 2.Vj 427,96 300,05 127,91 62,15 490,11 5,50 8,13 487,48 3.Vj 470,22 303,43 166,79 62,45 532,67 1,89 9,28 525,28 4.Vj 480,45 338,59 141,86 61,57 542,02 1,53 13,22 530,33
2010 1.Vj 457,69 295,88 161,81 58,01 515,70 2,68 14,02 504,36 2.Vj 457,48 309,30 148,18 62,23 519,71 5,52 10,59 514,64 3.Vj 494,82 313,86 180,96 64,21 559,03 2,64 12,62 549,05 4.Vj 509,32 351,94 157,38 63,37 572,69 2,63 12,22 563,10
2011 1.Vj 482,10 309,67 172,43 65,82 547,92 2,40 14,54 535,78 2.Vj 472,10 325,03 147,07 66,67 538,77 7,04 10,45 535,36 3.Vj 512,53 327,43 185,10 67,92 580,45 2,90 10,86 572,49 4.Vj 517,89 365,84 152,05 65,66 583,55 1,01 11,60 572,96
2012 1.Vj 497,47 321,10 176,37 68,36 565,83 2,50 15,72 552,61 2.Vj 484,93 337,24 147,69 67,81 552,74 6,02 11,30 547,46 3.Vj 517,45 338,92 178,53 70,82 588,27 2,81 10,81 580,27
2007 3,8 2,7 5,8 11,2 4,6 10,9 8,8 4,5
2008 0,7 3,6 – 4,2 2,0 0,9 – 4,0 6,3 0,7
2009 – 4,1 0,3 – 12,4 0,1 – 3,7 – 6,8 – 3,4 – 3,7
2010 5,9 3,0 12,0 0,9 5,3 14,3 13,4 5,2
2011 3,4 4,5 1,3 7,4 3,9 – 0,9 – 4,0 4,0
2008 1.Vj 2,0 3,5 – 0,4 0,6 1,8 17,6 12,3 1,7 2.Vj 3,4 3,9 2,5 2,0 3,2 – 6,4 0,4 3,1 3.Vj 0,8 3,7 – 3,7 3,2 1,0 – 15,5 – 3,0 1,0 4.Vj – 2,9 3,3 – 15,6 2,0 – 2,4 – 4,5 14,1 – 2,7
2009 1.Vj – 6,9 1,7 – 20,6 – 1,6 – 6,3 19,2 2,1 – 6,4 2.Vj – 7,3 0,2 – 21,1 1,2 – 6,3 – 12,7 – 21,0 – 6,1 3.Vj – 3,1 – 0,1 – 8,2 – 1,0 – 2,9 – 6,0 – 3,5 – 2,9 4.Vj 0,5 – 0,4 2,8 1,9 0,7 – 20,7 5,5 0,5
2010 1.Vj 5,6 1,6 13,7 – 2,5 4,6 – 6,3 7,9 4,4 2.Vj 6,9 3,1 15,8 0,1 6,0 0,4 30,3 5,6 3.Vj 5,2 3,4 8,5 2,8 4,9 39,7 36,0 4,5 4.Vj 6,0 3,9 10,9 2,9 5,7 71,9 – 7,6 6,2
2011 1.Vj 5,3 4,7 6,6 13,5 6,2 – 10,4 3,7 6,2 2.Vj 3,2 5,1 – 0,7 7,1 3,7 27,5 – 1,3 4,0 3.Vj 3,6 4,3 2,3 5,8 3,8 9,8 – 13,9 4,3 4.Vj 1,7 3,9 – 3,4 3,6 1,9 – 61,6 – 5,1 1,8
2012 1.Vj 3,2 3,7 2,3 3,9 3,3 4,2 8,1 3,1 2.Vj 2,7 3,8 0,4 1,7 2,6 – 14,5 8,1 2,3 3.Vj 1,0 3,5 – 3,5 4,3 1,3 – 3,1 – 0,5 1,4
1) Vom Staat empfangene Abgaben bzw. vom Staat gezahlte Subventionen.
Jahr,Vierteljahr
VerfügbaresEinkommen(Sp.5+6�7)
Veränderung gegenüber dem entsprechenden Vorjahreszeitraum in %
Netto-national-
einkommen(Sp.1+4)
Produktions-und Import-
abgaben abzgl.Subventionen
1)
Laufende Transfers
aus der | an dieübrige(n) Welt
Statistisches Bundesamt, Fachserie 18, Reihe 1.2, 3.Vj 2012

1.4 Bruttoinlandsprodukt, Bruttonationaleinkommen, Volkseinkommen (Pro-Kopf-Angaben)
BruttoinlandsproduktBrutto-
nationaleinkommen
insgesamtje Erwerbs-
tätigenje
Einwohnerinsgesamt,Kettenindex
je Erwerbs-tätigen
jeEinwohner
insgesamtje
Einwohnerinsgesamt
jeEinwohner
1 2 3 4 5 6 7 8 9 10
Mrd. EUR EUR Mrd. EUR EUR Mrd. EUR EUR
2007 2 428,50 60 930 29 521 107,09 104,72 107,35 2 470,33 30 030 1 877,33 22 821
2008 2 473,80 61 312 30 124 108,25 104,57 108,71 2 502,63 30 475 1 890,71 23 024
2009 2 374,50 58 818 29 002 102,70 99,15 103,43 2 432,47 29 710 1 812,25 22 134
2010 2 496,20 61 478 30 532 106,97 102,69 107,90 2 546,66 31 149 1 919,31 23 476
2011 2 592,60 62 982 31 703 110,21 104,36 111,13 2 640,91 32 293 1 984,62 24 268
2008 1.Vj 608,52 15 250 7 405 107,17 104,68 107,54 616,90 7 507 465,82 5 668 2.Vj 618,08 15 356 7 525 109,22 105,76 109,66 614,81 7 486 461,56 5 620 3.Vj 631,67 15 591 7 693 110,58 106,38 111,06 640,69 7 803 485,41 5 912 4.Vj 615,53 15 115 7 501 106,04 101,49 106,56 630,23 7 680 477,92 5 824
2009 1.Vj 573,67 14 301 7 001 100,23 97,39 100,87 586,70 7 160 433,62 5 292 2.Vj 577,74 14 331 7 057 101,14 97,79 101,87 584,09 7 135 427,96 5 227 3.Vj 608,81 15 058 7 438 105,05 101,27 105,83 626,27 7 651 470,22 5 745 4.Vj 614,28 15 122 7 506 104,37 100,14 105,17 635,41 7 764 480,45 5 871
2010 1.Vj 598,33 14 949 7 317 103,07 100,37 103,94 610,15 7 462 457,69 5 597 2.Vj 612,66 15 123 7 495 106,21 102,18 107,14 614,98 7 523 457,48 5 596 3.Vj 640,71 15 704 7 838 109,81 104,90 110,77 653,97 8 000 494,82 6 053 4.Vj 644,50 15 691 7 882 108,79 103,24 109,71 667,56 8 164 509,32 6 229
2011 1.Vj 633,01 15 586 7 745 108,42 104,05 109,39 644,76 7 889 482,10 5 899 2.Vj 637,56 15 523 7 800 109,49 103,90 110,46 636,54 7 787 472,10 5 776 3.Vj 663,12 16 038 8 107 112,64 106,18 113,56 678,14 8 291 512,53 6 266 4.Vj 658,91 15 830 8 050 110,28 103,27 111,10 681,47 8 326 517,89 6 327
2012 1.Vj 651,25 15 821 7 958 110,26 104,40 111,10 665,03 8 126 497,47 6 079 2.Vj 648,60 15 621 7 922 110,04 103,29 110,84 652,93 7 975 484,93 5 923 3.Vj 674,85 16 181 8 236 113,08 105,68 113,81 688,55 8 403 517,45 6 315
2007 5,0 3,2 5,1 3,3 1,5 3,4 4,6 4,8 3,8 3,9
2008 1,9 0,6 2,0 1,1 – 0,1 1,3 1,3 1,5 0,7 0,9
2009 – 4,0 – 4,1 – 3,7 – 5,1 – 5,2 – 4,9 – 2,8 – 2,5 – 4,1 – 3,9
2010 5,1 4,5 5,3 4,2 3,6 4,3 4,7 4,8 5,9 6,1
2011 3,9 2,4 3,8 3,0 1,6 3,0 3,7 3,7 3,4 3,4
2008 1.Vj 2,9 1,4 3,0 2,1 0,6 2,2 2,1 2,2 2,0 2,1 2.Vj 4,0 2,7 4,2 3,1 1,8 3,3 3,3 3,5 3,4 3,6 3.Vj 1,8 0,5 2,0 1,1 – 0,2 1,2 1,5 1,7 0,8 0,9 4.Vj – 1,1 – 2,0 – 0,8 – 1,9 – 2,8 – 1,6 – 1,5 – 1,3 – 2,9 – 2,7
2009 1.Vj – 5,7 – 6,2 – 5,5 – 6,5 – 7,0 – 6,2 – 4,9 – 4,6 – 6,9 – 6,6 2.Vj – 6,5 – 6,7 – 6,2 – 7,4 – 7,5 – 7,1 – 5,0 – 4,7 – 7,3 – 7,0 3.Vj – 3,6 – 3,4 – 3,3 – 5,0 – 4,8 – 4,7 – 2,3 – 1,9 – 3,1 – 2,8 4.Vj – 0,2 0,0 0,1 – 1,6 – 1,3 – 1,3 0,8 1,1 0,5 0,8
2010 1.Vj 4,3 4,5 4,5 2,8 3,1 3,0 4,0 4,2 5,6 5,8 2.Vj 6,0 5,5 6,2 5,0 4,5 5,2 5,3 5,4 6,9 7,1 3.Vj 5,2 4,3 5,4 4,5 3,6 4,7 4,4 4,6 5,2 5,4 4.Vj 4,9 3,8 5,0 4,2 3,1 4,3 5,1 5,2 6,0 6,1
2011 1.Vj 5,8 4,3 5,8 5,2 3,7 5,2 5,7 5,7 5,3 5,4 2.Vj 4,1 2,6 4,1 3,1 1,7 3,1 3,5 3,5 3,2 3,2 3.Vj 3,5 2,1 3,4 2,6 1,2 2,5 3,7 3,6 3,6 3,5 4.Vj 2,2 0,9 2,1 1,4 0,0 1,3 2,1 2,0 1,7 1,6
2012 1.Vj 2,9 1,5 2,8 1,7 0,3 1,6 3,1 3,0 3,2 3,1 2.Vj 1,7 0,6 1,6 0,5 – 0,6 0,3 2,6 2,4 2,7 2,5 3.Vj 1,8 0,9 1,6 0,4 – 0,5 0,2 1,5 1,4 1,0 0,8
Veränderung gegenüber dem entsprechenden Vorjahreszeitraum in %
Jahr,Vierteljahr
in jeweiligen Preisen preisbereinigt
Volkseinkommen
in jeweiligen Preisen
Index (2005 = 100)
Statistisches Bundesamt, Fachserie 18, Reihe 1.2, 3.Vj 2012
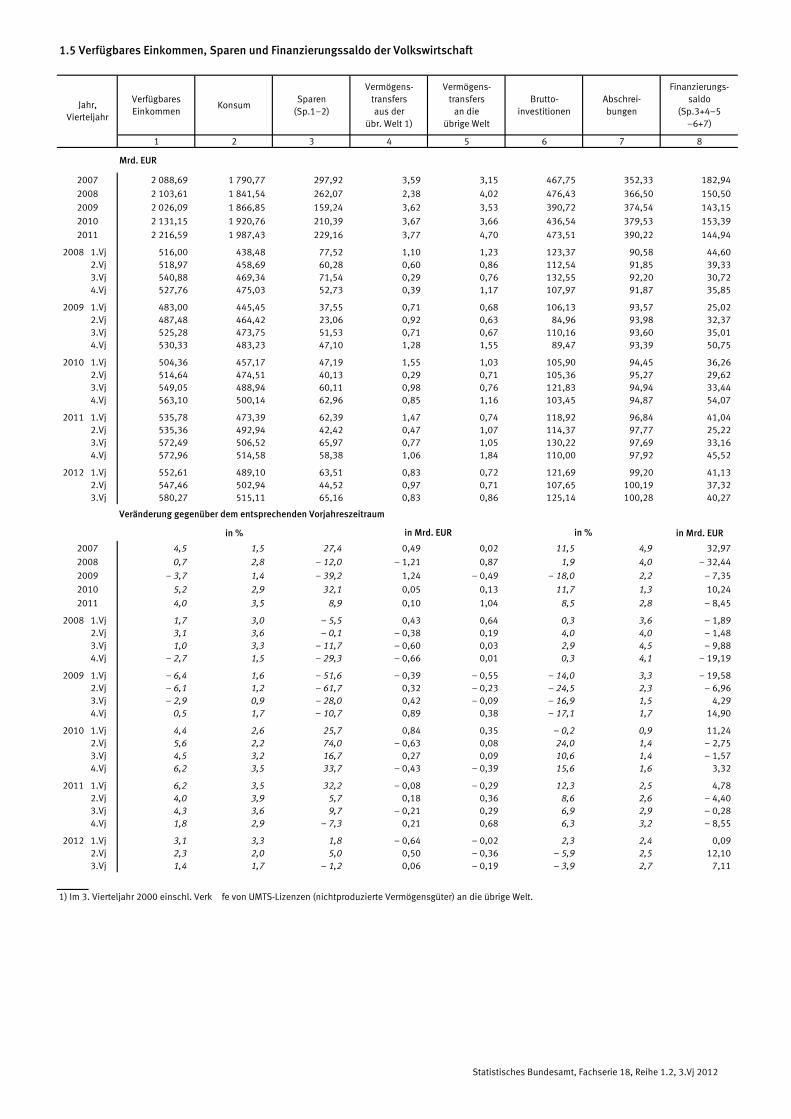
1.5 Verfügbares Einkommen, Sparen und Finanzierungssaldo der Volkswirtschaft
VerfügbaresEinkommen
KonsumSparen
(Sp.1�2)
Vermögens-transfersaus der
übr. Welt 1)
Vermögens-transfers
an dieübrige Welt
Brutto-investitionen
Abschrei-bungen
Finanzierungs-saldo
(Sp.3+4�5�6+7)
1 2 3 4 5 6 7 8
Mrd. EUR
2007 2 088,69 1 790,77 297,92 3,59 3,15 467,75 352,33 182,94
2008 2 103,61 1 841,54 262,07 2,38 4,02 476,43 366,50 150,50
2009 2 026,09 1 866,85 159,24 3,62 3,53 390,72 374,54 143,15
2010 2 131,15 1 920,76 210,39 3,67 3,66 436,54 379,53 153,39
2011 2 216,59 1 987,43 229,16 3,77 4,70 473,51 390,22 144,94
2008 1.Vj 516,00 438,48 77,52 1,10 1,23 123,37 90,58 44,60 2.Vj 518,97 458,69 60,28 0,60 0,86 112,54 91,85 39,33 3.Vj 540,88 469,34 71,54 0,29 0,76 132,55 92,20 30,72 4.Vj 527,76 475,03 52,73 0,39 1,17 107,97 91,87 35,85
2009 1.Vj 483,00 445,45 37,55 0,71 0,68 106,13 93,57 25,02 2.Vj 487,48 464,42 23,06 0,92 0,63 84,96 93,98 32,37 3.Vj 525,28 473,75 51,53 0,71 0,67 110,16 93,60 35,01 4.Vj 530,33 483,23 47,10 1,28 1,55 89,47 93,39 50,75
2010 1.Vj 504,36 457,17 47,19 1,55 1,03 105,90 94,45 36,26 2.Vj 514,64 474,51 40,13 0,29 0,71 105,36 95,27 29,62 3.Vj 549,05 488,94 60,11 0,98 0,76 121,83 94,94 33,44 4.Vj 563,10 500,14 62,96 0,85 1,16 103,45 94,87 54,07
2011 1.Vj 535,78 473,39 62,39 1,47 0,74 118,92 96,84 41,04 2.Vj 535,36 492,94 42,42 0,47 1,07 114,37 97,77 25,22 3.Vj 572,49 506,52 65,97 0,77 1,05 130,22 97,69 33,16 4.Vj 572,96 514,58 58,38 1,06 1,84 110,00 97,92 45,52
2012 1.Vj 552,61 489,10 63,51 0,83 0,72 121,69 99,20 41,13 2.Vj 547,46 502,94 44,52 0,97 0,71 107,65 100,19 37,32 3.Vj 580,27 515,11 65,16 0,83 0,86 125,14 100,28 40,27
in % in Mrd. EUR
2007 4,5 1,5 27,4 0,49 0,02 11,5 4,9 32,97
2008 0,7 2,8 – 12,0 � 1,21 0,87 1,9 4,0 � 32,44
2009 – 3,7 1,4 – 39,2 1,24 � 0,49 – 18,0 2,2 � 7,35
2010 5,2 2,9 32,1 0,05 0,13 11,7 1,3 10,24
2011 4,0 3,5 8,9 0,10 1,04 8,5 2,8 � 8,45
2008 1.Vj 1,7 3,0 – 5,5 0,43 0,64 0,3 3,6 � 1,89 2.Vj 3,1 3,6 – 0,1 � 0,38 0,19 4,0 4,0 � 1,48 3.Vj 1,0 3,3 – 11,7 � 0,60 0,03 2,9 4,5 � 9,88 4.Vj – 2,7 1,5 – 29,3 � 0,66 0,01 0,3 4,1 � 19,19
2009 1.Vj – 6,4 1,6 – 51,6 � 0,39 � 0,55 – 14,0 3,3 � 19,58 2.Vj – 6,1 1,2 – 61,7 0,32 � 0,23 – 24,5 2,3 � 6,96 3.Vj – 2,9 0,9 – 28,0 0,42 � 0,09 – 16,9 1,5 4,29 4.Vj 0,5 1,7 – 10,7 0,89 0,38 – 17,1 1,7 14,90
2010 1.Vj 4,4 2,6 25,7 0,84 0,35 – 0,2 0,9 11,24 2.Vj 5,6 2,2 74,0 � 0,63 0,08 24,0 1,4 � 2,75 3.Vj 4,5 3,2 16,7 0,27 0,09 10,6 1,4 � 1,57 4.Vj 6,2 3,5 33,7 � 0,43 � 0,39 15,6 1,6 3,32
2011 1.Vj 6,2 3,5 32,2 � 0,08 � 0,29 12,3 2,5 4,78 2.Vj 4,0 3,9 5,7 0,18 0,36 8,6 2,6 � 4,40 3.Vj 4,3 3,6 9,7 � 0,21 0,29 6,9 2,9 � 0,28 4.Vj 1,8 2,9 – 7,3 0,21 0,68 6,3 3,2 � 8,55
2012 1.Vj 3,1 3,3 1,8 � 0,64 � 0,02 2,3 2,4 0,09 2.Vj 2,3 2,0 5,0 0,50 � 0,36 – 5,9 2,5 12,10 3.Vj 1,4 1,7 – 1,2 0,06 � 0,19 – 3,9 2,7 7,11
1) Im 3. Vierteljahr 2000 einschl. Verkäufe von UMTS-Lizenzen (nichtproduzierte Vermögensgüter) an die übrige Welt.
Jahr,Vierteljahr
in Mrd. EUR in %
Veränderung gegenüber dem entsprechenden Vorjahreszeitraum
Statistisches Bundesamt, Fachserie 18, Reihe 1.2, 3.Vj 2012
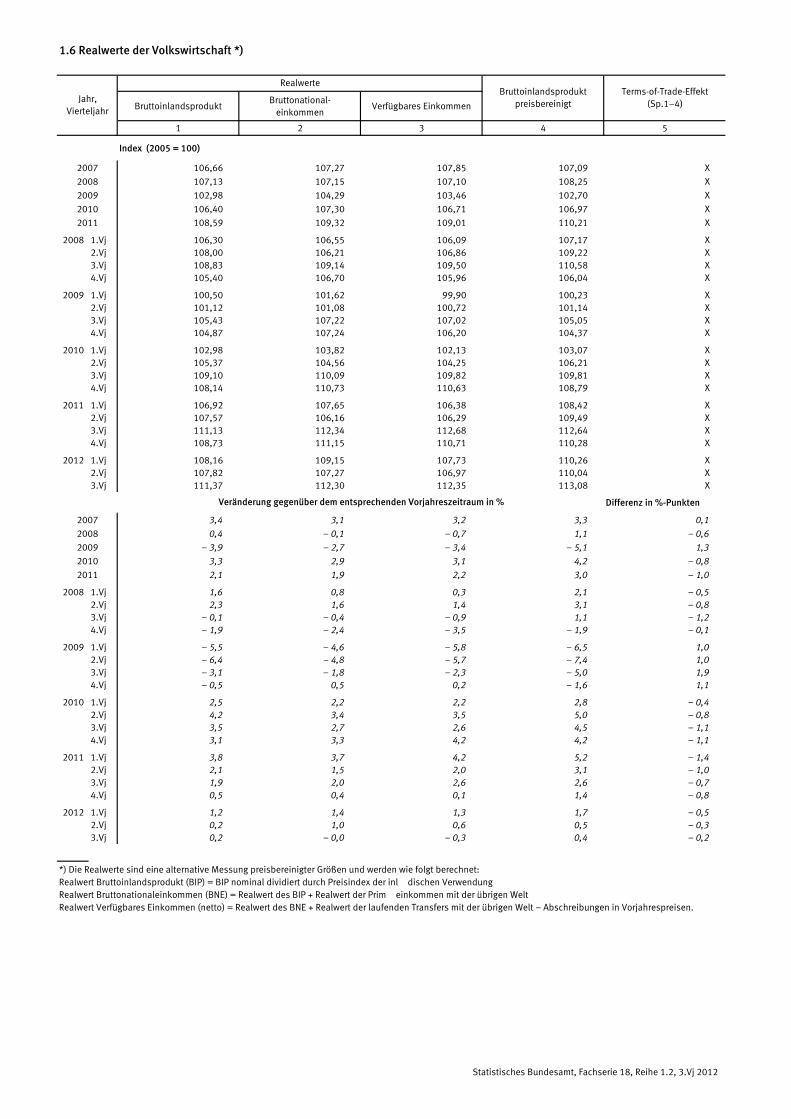
1.6 Realwerte der Volkswirtschaft *)
BruttoinlandsproduktBruttonational-
einkommenVerfügbares Einkommen
1 2 3 4 5
Index (2005 = 100)
2007 106,66 107,27 107,85 107,09 X
2008 107,13 107,15 107,10 108,25 X
2009 102,98 104,29 103,46 102,70 X
2010 106,40 107,30 106,71 106,97 X
2011 108,59 109,32 109,01 110,21 X
2008 1.Vj 106,30 106,55 106,09 107,17 X 2.Vj 108,00 106,21 106,86 109,22 X 3.Vj 108,83 109,14 109,50 110,58 X 4.Vj 105,40 106,70 105,96 106,04 X
2009 1.Vj 100,50 101,62 99,90 100,23 X 2.Vj 101,12 101,08 100,72 101,14 X 3.Vj 105,43 107,22 107,02 105,05 X 4.Vj 104,87 107,24 106,20 104,37 X
2010 1.Vj 102,98 103,82 102,13 103,07 X 2.Vj 105,37 104,56 104,25 106,21 X 3.Vj 109,10 110,09 109,82 109,81 X 4.Vj 108,14 110,73 110,63 108,79 X
2011 1.Vj 106,92 107,65 106,38 108,42 X 2.Vj 107,57 106,16 106,29 109,49 X 3.Vj 111,13 112,34 112,68 112,64 X 4.Vj 108,73 111,15 110,71 110,28 X
2012 1.Vj 108,16 109,15 107,73 110,26 X 2.Vj 107,82 107,27 106,97 110,04 X 3.Vj 111,37 112,30 112,35 113,08 X
Differenz in %-Punkten
2007 3,4 3,1 3,2 3,3 0,1
2008 0,4 – 0,1 – 0,7 1,1 – 0,6
2009 – 3,9 – 2,7 – 3,4 – 5,1 1,3
2010 3,3 2,9 3,1 4,2 – 0,8
2011 2,1 1,9 2,2 3,0 – 1,0
2008 1.Vj 1,6 0,8 0,3 2,1 – 0,5 2.Vj 2,3 1,6 1,4 3,1 – 0,8 3.Vj – 0,1 – 0,4 – 0,9 1,1 – 1,2 4.Vj – 1,9 – 2,4 – 3,5 – 1,9 – 0,1
2009 1.Vj – 5,5 – 4,6 – 5,8 – 6,5 1,0 2.Vj – 6,4 – 4,8 – 5,7 – 7,4 1,0 3.Vj – 3,1 – 1,8 – 2,3 – 5,0 1,9 4.Vj – 0,5 0,5 0,2 – 1,6 1,1
2010 1.Vj 2,5 2,2 2,2 2,8 – 0,4 2.Vj 4,2 3,4 3,5 5,0 – 0,8 3.Vj 3,5 2,7 2,6 4,5 – 1,1 4.Vj 3,1 3,3 4,2 4,2 – 1,1
2011 1.Vj 3,8 3,7 4,2 5,2 – 1,4 2.Vj 2,1 1,5 2,0 3,1 – 1,0 3.Vj 1,9 2,0 2,6 2,6 – 0,7 4.Vj 0,5 0,4 0,1 1,4 – 0,8
2012 1.Vj 1,2 1,4 1,3 1,7 – 0,5 2.Vj 0,2 1,0 0,6 0,5 – 0,3 3.Vj 0,2 – 0,0 – 0,3 0,4 – 0,2
*) Die Realwerte sind eine alternative Messung preisbereinigter Größen und werden wie folgt berechnet:Realwert Bruttoinlandsprodukt (BIP) = BIP nominal dividiert durch Preisindex der inländischen VerwendungRealwert Bruttonationaleinkommen (BNE) = Realwert des BIP + Realwert der Primäreinkommen mit der übrigen Welt Realwert Verfügbares Einkommen (netto) = Realwert des BNE + Realwert der laufenden Transfers mit der übrigen Welt � Abschreibungen in Vorjahrespreisen.
Jahr,Vierteljahr
Veränderung gegenüber dem entsprechenden Vorjahreszeitraum in %
Terms-of-Trade-Effekt(Sp.1�4)
RealwerteBruttoinlandsprodukt
preisbereinigt
Statistisches Bundesamt, Fachserie 18, Reihe 1.2, 3.Vj 2012

1.7 Verfügbares Einkommen der privaten Haushalte *) und seine Verwendung
Ausgabenkonzept Verbrauchskonzept
VerfügbaresEinkommen
PrivateKonsum-
ausgaben
VerfügbaresEinkommen
1)
Individual-konsum
2)
1 2 3 4 5 6 7 8 9
% EUR
2007 1 502,37 1 356,73 1 778,77 1 633,13 22,43 1 524,80 168,07 11,0 18 263
2008 1 541,25 1 389,62 1 828,36 1 676,73 28,64 1 569,89 180,27 11,5 18 768
2009 1 533,14 1 391,55 1 836,66 1 695,07 28,51 1 561,65 170,10 10,9 18 725
2010 1 578,89 1 433,16 1 890,99 1 745,26 29,01 1 607,90 174,74 10,9 19 312
2011 1 630,14 1 487,66 1 949,14 1 806,66 30,10 1 660,24 172,58 10,4 19 933
2008 1.Vj 381,40 330,43 450,47 399,50 6,71 388,11 57,68 14,9 4 641 2.Vj 385,53 348,68 456,50 419,65 6,99 392,52 43,84 11,2 4 694 3.Vj 390,80 358,91 461,35 429,46 7,14 397,94 39,03 9,8 4 760 4.Vj 383,52 351,60 460,04 428,12 7,80 391,32 39,72 10,2 4 674
2009 1.Vj 380,69 330,97 453,96 404,24 6,87 387,56 56,59 14,6 4 646 2.Vj 382,40 349,17 456,96 423,73 7,05 389,45 40,28 10,3 4 671 3.Vj 386,00 356,65 461,16 431,81 7,05 393,05 36,40 9,3 4 716 4.Vj 384,05 354,76 464,58 435,29 7,54 391,59 36,83 9,4 4 693
2010 1.Vj 388,65 337,82 465,32 414,49 6,93 395,58 57,76 14,6 4 753 2.Vj 391,07 356,65 467,77 433,35 7,23 398,30 41,65 10,5 4 784 3.Vj 400,13 369,71 477,11 446,69 7,18 407,31 37,60 9,2 4 895 4.Vj 399,04 368,98 480,79 450,73 7,67 406,71 37,73 9,3 4 880
2011 1.Vj 401,04 352,38 479,16 430,50 7,31 408,35 55,97 13,7 4 907 2.Vj 404,66 370,96 483,59 449,89 7,55 412,21 41,25 10,0 4 951 3.Vj 414,18 384,49 492,68 462,99 7,47 421,65 37,16 8,8 5 064 4.Vj 410,26 379,83 493,71 463,28 7,77 418,03 38,20 9,1 5 012
2012 1.Vj 414,51 364,27 495,08 444,84 7,51 422,02 57,75 13,7 5 065 2.Vj 412,28 377,86 493,06 458,64 7,73 420,01 42,15 10,0 5 036 3.Vj 419,53 389,53 500,07 470,07 7,65 427,18 37,65 8,8 5 120
2007 1,5 1,3 1,8 1,6 4,3 1,5 3,4 X 1,6
2008 2,6 2,4 2,8 2,7 27,7 3,0 7,3 X 2,8
2009 – 0,5 0,1 0,5 1,1 – 0,5 – 0,5 – 5,6 X – 0,2
2010 3,0 3,0 3,0 3,0 1,8 3,0 2,7 X 3,1
2011 3,2 3,8 3,1 3,5 3,8 3,3 – 1,2 X 3,2
2008 1.Vj 2,8 2,8 2,8 2,9 31,6 3,2 5,3 X 2,9 2.Vj 3,6 3,2 3,9 3,5 29,0 4,0 10,7 X 3,8 3.Vj 3,0 3,0 3,2 3,1 26,8 3,4 7,2 X 3,2 4.Vj 0,9 0,8 1,3 1,2 24,2 1,3 6,5 X 1,2
2009 1.Vj – 0,2 0,2 0,8 1,2 2,4 – 0,1 – 1,9 X 0,1 2.Vj – 0,8 0,1 0,1 1,0 0,9 – 0,8 – 8,1 X – 0,5 3.Vj – 1,2 – 0,6 – 0,0 0,5 – 1,3 – 1,2 – 6,7 X – 0,9 4.Vj 0,1 0,9 1,0 1,7 – 3,3 0,1 – 7,3 X 0,4
2010 1.Vj 2,1 2,1 2,5 2,5 0,9 2,1 2,1 X 2,3 2.Vj 2,3 2,1 2,4 2,3 2,6 2,3 3,4 X 2,4 3.Vj 3,7 3,7 3,5 3,4 1,8 3,6 3,3 X 3,8 4.Vj 3,9 4,0 3,5 3,5 1,7 3,9 2,4 X 4,0
2011 1.Vj 3,2 4,3 3,0 3,9 5,5 3,2 – 3,1 X 3,2 2.Vj 3,5 4,0 3,4 3,8 4,4 3,5 – 1,0 X 3,5 3.Vj 3,5 4,0 3,3 3,6 4,0 3,5 – 1,2 X 3,5 4.Vj 2,8 2,9 2,7 2,8 1,3 2,8 1,2 X 2,7
2012 1.Vj 3,4 3,4 3,3 3,3 2,7 3,3 3,2 X 3,2 2.Vj 1,9 1,9 2,0 1,9 2,4 1,9 2,2 X 1,7 3.Vj 1,3 1,3 1,5 1,5 2,4 1,3 1,3 X 1,1
*) Einschl. privater Organisationen ohne Erwerbszweck. � 1) Verfügbares Einkommen (Ausgabenkonzept) zuzüglich soziale Sachtransfers des Staates (entsprechen den Konsumausgaben des Staates für den Individualverbrauch). � 2) Private Konsumausgaben zuzüglich der Konsumausgaben des Staates für den Individualverbrauch.
Jahr,Vierteljahr
Mrd. EUR
Veränderung gegenüber dem entsprechenden Vorjahreszeitraum in %
VerfügbaresEinkommen(Ausgaben-konzept) jeEinwohner
Sparquote
(Sp.7 in %von 6)
Bezugsgrößefür die
Sparquote(Sp.1+5)
Sparen
(Sp.6�2oder 3�4+5)
ZunahmebetrieblicherVersorgungs-
ansprüche
Statistisches Bundesamt, Fachserie 18, Reihe 1.2, 3.Vj 2012
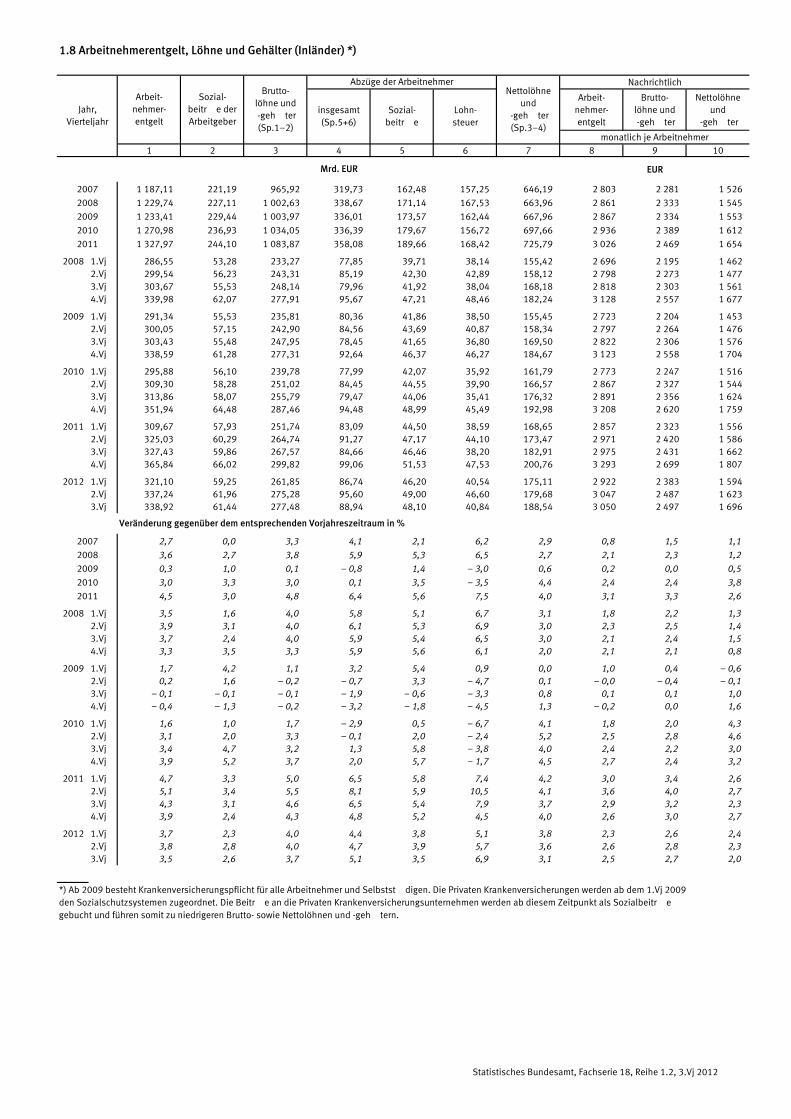
1.8 Arbeitnehmerentgelt, Löhne und Gehälter (Inländer) *)
Nachrichtlich
Arbeit-nehmer-entgelt
Brutto-löhne und-gehälter
Nettolöhneund
-gehälter
monatlich je Arbeitnehmer1 2 3 4 5 6 7 8 9 10
EUR
2007 1 187,11 221,19 965,92 319,73 162,48 157,25 646,19 2 803 2 281 1 526
2008 1 229,74 227,11 1 002,63 338,67 171,14 167,53 663,96 2 861 2 333 1 545
2009 1 233,41 229,44 1 003,97 336,01 173,57 162,44 667,96 2 867 2 334 1 553
2010 1 270,98 236,93 1 034,05 336,39 179,67 156,72 697,66 2 936 2 389 1 612
2011 1 327,97 244,10 1 083,87 358,08 189,66 168,42 725,79 3 026 2 469 1 654
2008 1.Vj 286,55 53,28 233,27 77,85 39,71 38,14 155,42 2 696 2 195 1 462 2.Vj 299,54 56,23 243,31 85,19 42,30 42,89 158,12 2 798 2 273 1 477 3.Vj 303,67 55,53 248,14 79,96 41,92 38,04 168,18 2 818 2 303 1 561 4.Vj 339,98 62,07 277,91 95,67 47,21 48,46 182,24 3 128 2 557 1 677
2009 1.Vj 291,34 55,53 235,81 80,36 41,86 38,50 155,45 2 723 2 204 1 453 2.Vj 300,05 57,15 242,90 84,56 43,69 40,87 158,34 2 797 2 264 1 476 3.Vj 303,43 55,48 247,95 78,45 41,65 36,80 169,50 2 822 2 306 1 576 4.Vj 338,59 61,28 277,31 92,64 46,37 46,27 184,67 3 123 2 558 1 704
2010 1.Vj 295,88 56,10 239,78 77,99 42,07 35,92 161,79 2 773 2 247 1 516 2.Vj 309,30 58,28 251,02 84,45 44,55 39,90 166,57 2 867 2 327 1 544 3.Vj 313,86 58,07 255,79 79,47 44,06 35,41 176,32 2 891 2 356 1 624 4.Vj 351,94 64,48 287,46 94,48 48,99 45,49 192,98 3 208 2 620 1 759
2011 1.Vj 309,67 57,93 251,74 83,09 44,50 38,59 168,65 2 857 2 323 1 556 2.Vj 325,03 60,29 264,74 91,27 47,17 44,10 173,47 2 971 2 420 1 586 3.Vj 327,43 59,86 267,57 84,66 46,46 38,20 182,91 2 975 2 431 1 662 4.Vj 365,84 66,02 299,82 99,06 51,53 47,53 200,76 3 293 2 699 1 807
2012 1.Vj 321,10 59,25 261,85 86,74 46,20 40,54 175,11 2 922 2 383 1 594 2.Vj 337,24 61,96 275,28 95,60 49,00 46,60 179,68 3 047 2 487 1 623 3.Vj 338,92 61,44 277,48 88,94 48,10 40,84 188,54 3 050 2 497 1 696
2007 2,7 0,0 3,3 4,1 2,1 6,2 2,9 0,8 1,5 1,1
2008 3,6 2,7 3,8 5,9 5,3 6,5 2,7 2,1 2,3 1,2
2009 0,3 1,0 0,1 – 0,8 1,4 – 3,0 0,6 0,2 0,0 0,5
2010 3,0 3,3 3,0 0,1 3,5 – 3,5 4,4 2,4 2,4 3,8
2011 4,5 3,0 4,8 6,4 5,6 7,5 4,0 3,1 3,3 2,6
2008 1.Vj 3,5 1,6 4,0 5,8 5,1 6,7 3,1 1,8 2,2 1,3 2.Vj 3,9 3,1 4,0 6,1 5,3 6,9 3,0 2,3 2,5 1,4 3.Vj 3,7 2,4 4,0 5,9 5,4 6,5 3,0 2,1 2,4 1,5 4.Vj 3,3 3,5 3,3 5,9 5,6 6,1 2,0 2,1 2,1 0,8
2009 1.Vj 1,7 4,2 1,1 3,2 5,4 0,9 0,0 1,0 0,4 – 0,6 2.Vj 0,2 1,6 – 0,2 – 0,7 3,3 – 4,7 0,1 – 0,0 – 0,4 – 0,1 3.Vj – 0,1 – 0,1 – 0,1 – 1,9 – 0,6 – 3,3 0,8 0,1 0,1 1,0 4.Vj – 0,4 – 1,3 – 0,2 – 3,2 – 1,8 – 4,5 1,3 – 0,2 0,0 1,6
2010 1.Vj 1,6 1,0 1,7 – 2,9 0,5 – 6,7 4,1 1,8 2,0 4,3 2.Vj 3,1 2,0 3,3 – 0,1 2,0 – 2,4 5,2 2,5 2,8 4,6 3.Vj 3,4 4,7 3,2 1,3 5,8 – 3,8 4,0 2,4 2,2 3,0 4.Vj 3,9 5,2 3,7 2,0 5,7 – 1,7 4,5 2,7 2,4 3,2
2011 1.Vj 4,7 3,3 5,0 6,5 5,8 7,4 4,2 3,0 3,4 2,6 2.Vj 5,1 3,4 5,5 8,1 5,9 10,5 4,1 3,6 4,0 2,7 3.Vj 4,3 3,1 4,6 6,5 5,4 7,9 3,7 2,9 3,2 2,3 4.Vj 3,9 2,4 4,3 4,8 5,2 4,5 4,0 2,6 3,0 2,7
2012 1.Vj 3,7 2,3 4,0 4,4 3,8 5,1 3,8 2,3 2,6 2,4 2.Vj 3,8 2,8 4,0 4,7 3,9 5,7 3,6 2,6 2,8 2,3 3.Vj 3,5 2,6 3,7 5,1 3,5 6,9 3,1 2,5 2,7 2,0
*) Ab 2009 besteht Krankenversicherungspflicht für alle Arbeitnehmer und Selbstständigen. Die Privaten Krankenversicherungen werden ab dem 1.Vj 2009 den Sozialschutzsystemen zugeordnet. Die Beiträge an die Privaten Krankenversicherungsunternehmen werden ab diesem Zeitpunkt als Sozialbeiträge gebucht und führen somit zu niedrigeren Brutto- sowie Nettolöhnen und -gehältern.
Jahr,Vierteljahr
Arbeit-nehmer-entgelt
Sozial-beiträge derArbeitgeber
Sozial-beiträge
Veränderung gegenüber dem entsprechenden Vorjahreszeitraum in %
Lohn-steuer
Brutto-löhne und-gehälter(Sp.1�2)
Nettolöhneund
-gehälter(Sp.3�4)
Abzüge der Arbeitnehmer
insgesamt(Sp.5+6)
Mrd. EUR
Statistisches Bundesamt, Fachserie 18, Reihe 1.2, 3.Vj 2012

1.9 Masseneinkommen und verfügbares Einkommen der privaten Haushalte *)
derSozial-
versicherung
derGebiets-körper-
schaften 1)
derArbeitgeberund privaterSicherungs-
systeme
1 2 3 4 5 6 7 8 9
Mrd. EUR
2007 646,19 274,44 73,05 83,44 77,34 999,78 562,22 � 59,63 1 502,37
2008 663,96 275,61 72,86 86,89 79,18 1 020,14 584,18 � 63,07 1 541,25
2009 667,96 289,63 77,83 104,35 88,38 1 051,39 539,35 � 57,60 1 533,14
2010 697,66 290,53 78,88 106,95 89,23 1 084,79 550,96 � 56,86 1 578,89
2011 725,79 287,79 76,17 109,25 89,19 1 109,81 575,68 � 55,35 1 630,14
2008 1.Vj 155,42 69,23 19,00 21,49 19,60 245,54 152,73 � 16,87 381,40 2.Vj 158,12 68,64 18,39 21,45 19,66 246,94 154,85 � 16,26 385,53 3.Vj 168,18 68,85 17,95 21,71 19,66 257,03 148,51 � 14,74 390,80 4.Vj 182,24 68,89 17,52 22,24 20,26 270,63 128,09 � 15,20 383,52
2009 1.Vj 155,45 70,93 19,72 25,97 21,57 250,50 147,16 � 16,97 380,69 2.Vj 158,34 71,96 20,33 25,74 22,27 254,10 143,24 � 14,94 382,40 3.Vj 169,50 73,44 19,36 26,26 22,03 266,53 131,26 � 11,79 386,00 4.Vj 184,67 73,30 18,42 26,38 22,51 280,26 117,69 � 13,90 384,05
2010 1.Vj 161,79 74,24 21,09 26,58 22,77 260,93 142,69 � 14,97 388,65 2.Vj 166,57 72,94 19,92 26,39 22,54 263,28 142,47 � 14,68 391,07 3.Vj 176,32 71,77 19,32 26,76 21,77 272,40 139,69 � 11,96 400,13 4.Vj 192,98 71,58 18,55 27,22 22,15 288,18 126,11 � 15,25 399,04
2011 1.Vj 168,65 72,95 19,88 27,14 22,57 266,05 149,12 � 14,13 401,04 2.Vj 173,47 71,55 19,21 26,81 22,30 268,74 149,97 � 14,05 404,66 3.Vj 182,91 71,60 18,76 27,39 21,97 278,69 147,20 � 11,71 414,18 4.Vj 200,76 71,69 18,32 27,91 22,35 296,33 129,39 � 15,46 410,26
2012 1.Vj 175,11 73,06 19,64 27,64 22,55 272,90 158,96 � 17,35 414,51 2.Vj 179,68 72,24 19,04 27,41 22,04 276,33 150,40 � 14,45 412,28 3.Vj 188,54 72,95 18,59 28,30 22,08 286,30 149,25 � 16,02 419,53
in % in Mrd. EUR in %
2007 2,9 – 1,9 – 4,6 1,2 – 3,7 1,4 3,6 � 10,98 1,5
2008 2,7 0,4 – 0,3 4,1 2,4 2,0 3,9 � 3,44 2,6
2009 0,6 5,1 6,8 20,1 11,6 3,1 – 7,7 5,47 – 0,5
2010 4,4 0,3 1,3 2,5 1,0 3,2 2,2 0,74 3,0
2011 4,0 – 0,9 – 3,4 2,2 – 0,0 2,3 4,5 1,51 3,2
2008 1.Vj 3,1 – 0,4 – 1,3 3,3 – 1,3 2,1 5,1 � 2,16 2,8 2.Vj 3,0 0,0 – 0,3 4,6 1,5 2,1 6,8 � 1,55 3,6 3.Vj 3,0 0,7 0,6 4,3 4,6 2,2 5,8 � 2,20 3,0 4.Vj 2,0 1,4 0,0 4,4 4,8 1,7 – 2,6 2,47 0,9
2009 1.Vj 0,0 2,5 3,8 20,8 10,1 2,0 – 3,6 � 0,10 – 0,2 2.Vj 0,1 4,8 10,5 20,0 13,3 2,9 – 7,5 1,32 – 0,8 3.Vj 0,8 6,7 7,9 21,0 12,1 3,7 – 11,6 2,95 – 1,2 4.Vj 1,3 6,4 5,1 18,6 11,1 3,6 – 8,1 1,30 0,1
2010 1.Vj 4,1 4,7 6,9 2,3 5,6 4,2 – 3,0 2,00 2,1 2.Vj 5,2 1,4 – 2,0 2,5 1,2 3,6 – 0,5 0,26 2,3 3.Vj 4,0 – 2,3 – 0,2 1,9 – 1,2 2,2 6,4 � 0,17 3,7 4.Vj 4,5 – 2,3 0,7 3,2 – 1,6 2,8 7,2 � 1,35 3,9
2011 1.Vj 4,2 – 1,7 – 5,7 2,1 – 0,9 2,0 4,5 0,84 3,2 2.Vj 4,1 – 1,9 – 3,6 1,6 – 1,1 2,1 5,3 0,63 3,5 3.Vj 3,7 – 0,2 – 2,9 2,4 0,9 2,3 5,4 0,25 3,5 4.Vj 4,0 0,2 – 1,2 2,5 0,9 2,8 2,6 � 0,21 2,8
2012 1.Vj 3,8 0,2 – 1,2 1,8 – 0,1 2,6 6,6 � 3,22 3,4 2.Vj 3,6 1,0 – 0,9 2,2 – 1,2 2,8 0,3 � 0,40 1,9 3.Vj 3,1 1,9 – 0,9 3,3 0,5 2,7 1,4 � 4,31 1,3
*) Einschl. privater Organisationen ohne Erwerbszweck. � 1) Einschl. der übrigen Welt.
Veränderung gegenüber dem entsprechenden Vorjahreszeitraum
Jahr,Vierteljahr
Monetäre Sozialleistungen Betriebs-überschuss /
Selbst-ständigen-
einkommen,Vermögens-einkommen
Abgaben aufsoziale
Leistungen,verbrauchs-
nahe Steuern
Massen-einkommen(Sp.1+2+3
+4�5)
Weitereempfangene
abzüglichgeleisteteTransfers
VerfügbaresEinkommen(Sp.6+7+8)
Nettolöhneund
-gehälter
Statistisches Bundesamt, Fachserie 18, Reihe 1.2, 3.Vj 2012

1.10 Bevölkerung und Erwerbsbeteiligung
Erwerbstätige Inländer
insgesamt ArbeitnehmerSelbstständige
2)
1 2 3 4 5 6 7 8
2007 82 263 43 392 3 601 39 791 35 293 4 498 52,7 8,3
2008 82 120 43 433 3 136 40 297 35 817 4 480 52,9 7,2
2009 81 875 43 551 3 228 40 323 35 853 4 470 53,2 7,4
2010 81 757 43 512 2 946 40 566 36 073 4 493 53,2 6,8
2011 81 779 43 618 2 502 41 116 36 577 4 539 53,3 5,7
2008 1.Vj 82 180 43 314 3 404 39 910 35 431 4 479 52,7 7,9 2.Vj 82 132 43 403 3 221 40 182 35 687 4 495 52,8 7,4 3.Vj 82 109 43 399 2 996 40 403 35 922 4 481 52,9 6,9 4.Vj 82 058 43 612 2 923 40 689 36 226 4 463 53,1 6,7
2009 1.Vj 81 943 43 473 3 346 40 127 35 665 4 462 53,1 7,7 2.Vj 81 868 43 483 3 239 40 244 35 762 4 482 53,1 7,4 3.Vj 81 851 43 583 3 264 40 319 35 846 4 473 53,2 7,5 4.Vj 81 838 43 664 3 064 40 600 36 135 4 465 53,4 7,0
2010 1.Vj 81 770 43 386 3 338 40 048 35 573 4 475 53,1 7,7 2.Vj 81 744 43 376 2 919 40 457 35 957 4 500 53,1 6,7 3.Vj 81 747 43 490 2 797 40 693 36 194 4 499 53,2 6,4 4.Vj 81 768 43 794 2 729 41 065 36 566 4 499 53,6 6,2
2011 1.Vj 81 732 43 447 2 803 40 644 36 127 4 517 53,2 6,5 2.Vj 81 740 43 487 2 472 41 015 36 467 4 548 53,2 5,7 3.Vj 81 794 43 671 2 441 41 230 36 682 4 548 53,4 5,6 4.Vj 81 851 43 866 2 290 41 576 37 034 4 542 53,6 5,2
2012 1.Vj 81 839 43 660 2 488 41 172 36 624 4 548 53,3 5,7 2.Vj 81 869 43 726 2 268 41 458 36 896 4 562 53,4 5,2 3.Vj 81 937 43 911 2 320 41 591 37 046 4 545 53,6 5,3
Veränderung gegenüber dem entsprechenden Vorjahreszeitraum
2007 – 0,1 0,1 – 15,2 1,7 1,8 0,9 0,1 – 1,5
2008 – 0,2 0,1 – 12,9 1,3 1,5 – 0,4 0,2 – 1,1
2009 – 0,3 0,3 2,9 0,1 0,1 – 0,2 0,3 0,2
2010 – 0,1 – 0,1 – 8,7 0,6 0,6 0,5 0,0 – 0,6
2011 0,0 0,2 – 15,1 1,4 1,4 1,0 0,1 – 1,1
2008 1.Vj – 0,1 0,2 – 12,9 1,5 1,7 – 0,1 0,2 – 1,1 2.Vj – 0,2 0,4 – 9,4 1,3 1,5 – 0,5 0,3 – 0,8 3.Vj – 0,2 – 0,0 – 15,0 1,3 1,5 – 0,6 0,1 – 1,2 4.Vj – 0,2 – 0,2 – 14,5 1,0 1,2 – 0,5 0,0 – 1,1
2009 1.Vj – 0,3 0,4 – 1,7 0,5 0,7 – 0,4 0,4 – 0,2 2.Vj – 0,3 0,2 0,6 0,2 0,2 – 0,3 0,3 0,0 3.Vj – 0,3 0,4 8,9 – 0,2 – 0,2 – 0,2 0,3 0,6 4.Vj – 0,3 0,1 4,8 – 0,2 – 0,3 0,0 0,3 0,3
2010 1.Vj – 0,2 – 0,2 – 0,2 – 0,2 – 0,3 0,3 0,0 0,0 2.Vj – 0,2 – 0,2 – 9,9 0,5 0,5 0,4 0,0 – 0,7 3.Vj – 0,1 – 0,2 – 14,3 0,9 1,0 0,6 0,0 – 1,1 4.Vj – 0,1 0,3 – 10,9 1,1 1,2 0,8 0,2 – 0,8
2011 1.Vj – 0,0 0,1 – 16,0 1,5 1,6 0,9 0,1 – 1,2 2.Vj – 0,0 0,3 – 15,3 1,4 1,4 1,1 0,1 – 1,0 3.Vj 0,1 0,4 – 12,7 1,3 1,3 1,1 0,2 – 0,8 4.Vj 0,1 0,2 – 16,1 1,2 1,3 1,0 0,0 – 1,0
2012 1.Vj 0,1 0,5 – 11,2 1,3 1,4 0,7 0,1 – 0,8 2.Vj 0,2 0,5 – 8,3 1,1 1,2 0,3 0,2 – 0,5 3.Vj 0,2 0,5 – 5,0 0,9 1,0 – 0,1 0,2 – 0,3
1) Ergebnisse der Arbeitskräfteerhebung; Personen in Privathaushalten im Alter von 15 bis 74 Jahren. � 2) Einschl. mithelfende Familienangehörige.
Erwerbslosein % derErwerbs-personen
(Erwerbslosen-quote)
in %-Punktenin %
Jahr,Vierteljahr
Bevölkerung(Einwohner)
Erwerbs-personen
Erwerbslose1)
%1 000 Personen
Erwerbs-personenin % der
Bevölkerung(Erwerbs-
quote)
Statistisches Bundesamt, Fachserie 18, Reihe 1.2, 3.Vj 2012

1.11 Erwerbstätige, Arbeitnehmer und geleistete Arbeitsstunden im Inland *)
Geleistete Arbeitsstunden Geleistete Arbeitsstunden
der Erwerbs-tätigen
je Erwerbs-tätigen
der Arbeit-nehmer
je Arbeit-nehmer
1 2 3 4 5 6
1 000 Personen Mill. Stunden Stunden 1 000 Personen Mill. Stunden Stunden
2007 39 857 56 679 1 422,0 35 359 47 363 1 339,5
2008 40 348 57 362 1 421,7 35 868 48 030 1 339,1
2009 40 370 55 826 1 382,9 35 900 46 515 1 295,7
2010 40 603 57 110 1 406,6 36 110 47 791 1 323,5
2011 41 164 57 887 1 406,2 36 625 48 530 1 325,0
2008 1.Vj 39 903 14 449 362,1 35 424 12 155 343,1 2.Vj 40 250 13 900 345,3 35 755 11 553 323,1 3.Vj 40 515 14 653 361,7 36 034 12 233 339,5 4.Vj 40 723 14 360 352,6 36 260 12 089 333,4
2009 1.Vj 40 115 14 143 352,6 35 653 11 830 331,8 2.Vj 40 314 13 111 325,2 35 832 10 882 303,7 3.Vj 40 431 14 151 350,0 35 958 11 728 326,2 4.Vj 40 621 14 422 355,0 36 156 12 075 334,0
2010 1.Vj 40 026 14 250 356,0 35 551 11 949 336,1 2.Vj 40 513 13 486 332,9 36 013 11 236 312,0 3.Vj 40 799 14 578 357,3 36 300 12 168 335,2 4.Vj 41 074 14 797 360,3 36 575 12 438 340,1
2011 1.Vj 40 613 14 663 361,0 36 096 12 317 341,2 2.Vj 41 073 13 668 332,8 36 525 11 407 312,3 3.Vj 41 346 14 741 356,5 36 798 12 320 334,8 4.Vj 41 623 14 815 355,9 37 081 12 486 336,7
2012 1.Vj 41 164 14 956 363,3 36 616 12 565 343,1 2.Vj 41 521 13 742 331,0 36 959 11 508 311,4 3.Vj 41 706 14 678 351,9 37 161 12 259 329,9
2007 1,7 1,6 – 0,1 1,8 1,9 0,1
2008 1,2 1,2 – 0,0 1,4 1,4 – 0,0
2009 0,1 – 2,7 – 2,7 0,1 – 3,2 – 3,2
2010 0,6 2,3 1,7 0,6 2,7 2,1
2011 1,4 1,4 – 0,0 1,4 1,5 0,1
2008 1.Vj 1,5 0,1 – 1,4 1,7 0,5 – 1,2 2.Vj 1,3 3,6 2,3 1,5 3,6 2,1 3.Vj 1,2 1,6 0,4 1,5 2,2 0,7 4.Vj 0,9 – 0,3 – 1,3 1,1 – 0,4 – 1,5
2009 1.Vj 0,5 – 2,1 – 2,6 0,6 – 2,7 – 3,3 2.Vj 0,2 – 5,7 – 5,8 0,2 – 5,8 – 6,0 3.Vj – 0,2 – 3,4 – 3,2 – 0,2 – 4,1 – 3,9 4.Vj – 0,3 0,4 0,7 – 0,3 – 0,1 0,2
2010 1.Vj – 0,2 0,8 1,0 – 0,3 1,0 1,3 2.Vj 0,5 2,9 2,4 0,5 3,3 2,7 3.Vj 0,9 3,0 2,1 1,0 3,8 2,8 4.Vj 1,1 2,6 1,5 1,2 3,0 1,8
2011 1.Vj 1,5 2,9 1,4 1,5 3,1 1,5 2.Vj 1,4 1,3 – 0,0 1,4 1,5 0,1 3.Vj 1,3 1,1 – 0,2 1,4 1,2 – 0,1 4.Vj 1,3 0,1 – 1,2 1,4 0,4 – 1,0
2012 1.Vj 1,4 2,0 0,6 1,4 2,0 0,6 2.Vj 1,1 0,5 – 0,5 1,2 0,9 – 0,3 3.Vj 0,9 – 0,4 – 1,3 1,0 – 0,5 – 1,5
*) Quelle für geleistete Arbeitsstunden: Institut für Arbeitsmarkt- und Berufsforschung (IAB) der Bundesagentur für Arbeit (BA), Nürnberg.
Veränderung gegenüber dem entsprechenden Vorjahreszeitraum in %
ArbeitnehmerJahr,Vierteljahr
Erwerbstätige
Statistisches Bundesamt, Fachserie 18, Reihe 1.2, 3.Vj 2012

1.12 Arbeitsproduktivität, Durchschnittslöhne und Lohnstückkosten *)
Arbeitsproduktivität 1) Arbeitnehmerentgelt
je Erwerbs-tätigen
je Erwerbs-tätigen-stunde
jeArbeitnehmer
monatlich
jeArbeitnehmer-
stunde
jeArbeitnehmer
monatlich
jeArbeitnehmer-
stunde
Personen-konzept
Stunden-konzept
1 2 3 4 5 6 7 8
2007 104,72 105,38 2 797 25,06 2 276 20,39 97,23 96,69
2008 104,57 105,25 2 856 25,60 2 328 20,86 99,42 98,88
2009 99,15 102,61 2 861 26,50 2 328 21,56 105,01 104,98
2010 102,69 104,47 2 929 26,56 2 382 21,60 103,82 103,37
2011 104,36 106,19 3 018 27,33 2 462 22,29 105,24 104,63
2008 1.Vj 104,68 103,43 2 691 23,53 2 190 19,15 93,57 92,49 2.Vj 105,76 109,56 2 793 25,93 2 268 21,06 96,11 96,22 3.Vj 106,38 105,22 2 813 24,86 2 298 20,31 96,25 96,06 4.Vj 101,49 102,96 3 123 28,10 2 552 22,96 111,99 110,97
2009 1.Vj 97,39 98,82 2 717 24,57 2 198 19,88 101,55 101,07 2.Vj 97,79 107,56 2 791 27,57 2 258 22,31 103,87 104,20 3.Vj 101,27 103,51 2 816 25,90 2 300 21,16 101,20 101,73 4.Vj 100,14 100,91 3 116 28,00 2 551 22,92 113,27 112,79
2010 1.Vj 100,37 100,85 2 766 24,69 2 240 20,00 100,30 99,52 2.Vj 102,18 109,81 2 860 27,50 2 321 22,31 101,89 101,83 3.Vj 104,90 105,03 2 884 25,81 2 349 21,03 100,07 99,91 4.Vj 103,24 102,52 3 200 28,23 2 613 23,05 112,83 111,97
2011 1.Vj 104,05 103,10 2 850 25,06 2 316 20,36 99,69 98,82 2.Vj 103,90 111,70 2 963 28,46 2 412 23,17 103,80 103,61 3.Vj 106,18 106,55 2 968 26,60 2 424 21,72 101,74 101,48 4.Vj 103,27 103,79 3 284 29,26 2 690 23,96 115,74 114,61
2012 1.Vj 104,40 102,80 2 915 25,48 2 375 20,77 101,61 100,77 2.Vj 103,29 111,66 3 038 29,27 2 479 23,88 107,07 106,59 3.Vj 105,68 107,42 3 042 27,66 2 489 22,64 104,74 104,68
2007 1,5 1,7 0,8 0,7 1,4 1,3 – 0,7 – 1,0
2008 – 0,1 – 0,1 2,1 2,2 2,3 2,3 2,3 2,3
2009 – 5,2 – 2,5 0,2 3,5 – 0,0 3,4 5,6 6,2
2010 3,6 1,8 2,4 0,2 2,3 0,2 – 1,1 – 1,5
2011 1,6 1,6 3,0 2,9 3,3 3,2 1,4 1,2
2008 1.Vj 0,6 2,0 1,8 3,0 2,2 3,5 1,2 1,0 2.Vj 1,8 – 0,5 2,3 0,3 2,5 0,4 0,5 0,8 3.Vj – 0,2 – 0,5 2,1 1,4 2,4 1,8 2,3 2,0 4.Vj – 2,8 – 1,5 2,2 3,8 2,1 3,8 5,1 5,4
2009 1.Vj – 7,0 – 4,5 1,0 4,4 0,4 3,8 8,5 9,3 2.Vj – 7,5 – 1,8 – 0,1 6,3 – 0,4 5,9 8,1 8,3 3.Vj – 4,8 – 1,6 0,1 4,2 0,1 4,2 5,1 5,9 4.Vj – 1,3 – 2,0 – 0,2 – 0,4 – 0,0 – 0,2 1,1 1,6
2010 1.Vj 3,1 2,1 1,8 0,5 1,9 0,6 – 1,2 – 1,5 2.Vj 4,5 2,1 2,5 – 0,3 2,8 0,0 – 1,9 – 2,3 3.Vj 3,6 1,5 2,4 – 0,3 2,1 – 0,6 – 1,1 – 1,8 4.Vj 3,1 1,6 2,7 0,8 2,4 0,6 – 0,4 – 0,7
2011 1.Vj 3,7 2,2 3,0 1,5 3,4 1,8 – 0,6 – 0,7 2.Vj 1,7 1,7 3,6 3,5 4,0 3,9 1,9 1,7 3.Vj 1,2 1,4 2,9 3,1 3,2 3,3 1,7 1,6 4.Vj 0,0 1,2 2,6 3,6 2,9 3,9 2,6 2,4
2012 1.Vj 0,3 – 0,3 2,3 1,7 2,6 2,0 1,9 2,0 2.Vj – 0,6 – 0,0 2,5 2,8 2,8 3,1 3,2 2,9 3.Vj – 0,5 0,8 2,5 4,0 2,7 4,2 2,9 3,2
*) Quelle für geleistete Arbeitsstunden: Institut für Arbeitsmarkt- und Berufsforschung (IAB) der Bundesagentur für Arbeit (BA), Nürnberg. � 1) Bruttoinlandsprodukt (preisbereinigt, Kettenindex 2005=100) je Erwerbstätigen bzw. je geleisteter Erwerbstätigenstunde (jeweils umgerechnet aufMesszahlen 2005=100). � 2) Arbeitnehmerentgelt je Arbeitnehmer bzw. je geleisteter Arbeitnehmerstunde (jeweils umgerechnet auf Messzahlen2005=100) in Relation zur Arbeitsproduktivität (je Erwerbstätigen bzw. je geleisteter Erwerbstätigenstunde).
Veränderung gegenüber dem entsprechenden Vorjahreszeitraum in %
Index (2005 = 100)
Jahr,Vierteljahr
Bruttolöhne und -gehälter Lohnstückkosten 2)
Index (2005 = 100) EUR
Statistisches Bundesamt, Fachserie 18, Reihe 1.2, 3.Vj 2012
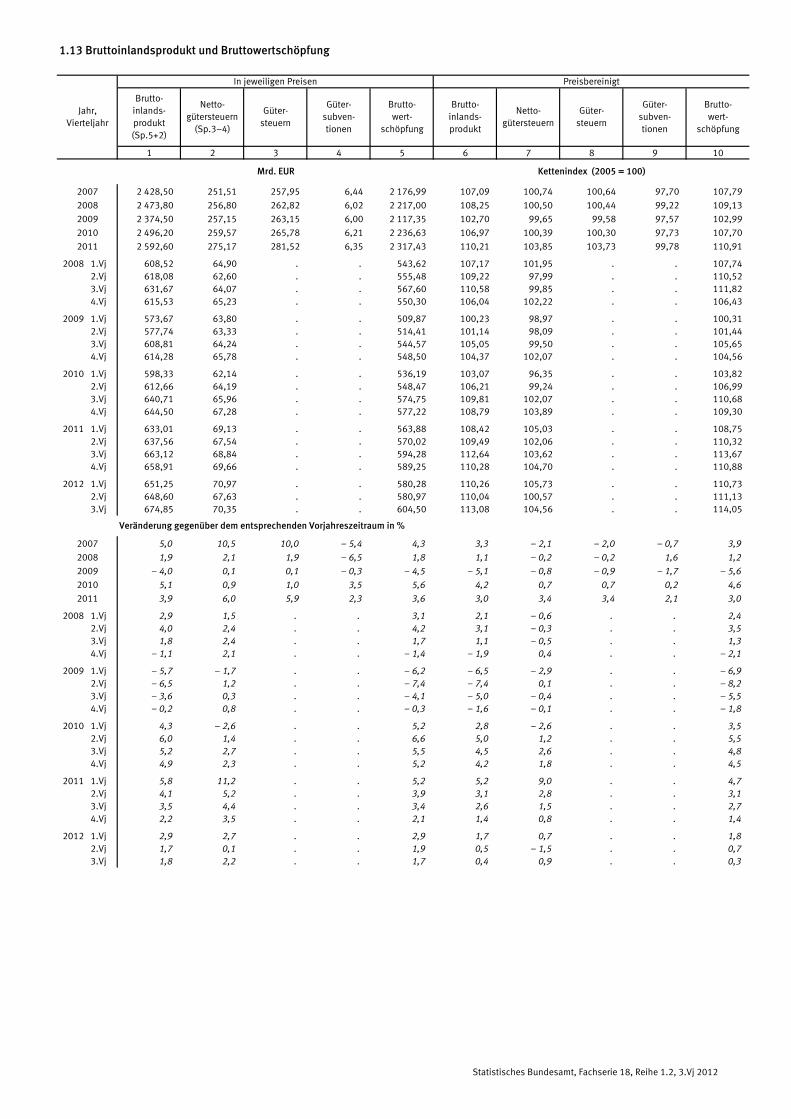
1.13 Bruttoinlandsprodukt und Bruttowertschöpfung
1 2 3 4 5 6 7 8 9 10
2007 2 428,50 251,51 257,95 6,44 2 176,99 107,09 100,74 100,64 97,70 107,79
2008 2 473,80 256,80 262,82 6,02 2 217,00 108,25 100,50 100,44 99,22 109,13
2009 2 374,50 257,15 263,15 6,00 2 117,35 102,70 99,65 99,58 97,57 102,99
2010 2 496,20 259,57 265,78 6,21 2 236,63 106,97 100,39 100,30 97,73 107,70
2011 2 592,60 275,17 281,52 6,35 2 317,43 110,21 103,85 103,73 99,78 110,91
2008 1.Vj 608,52 64,90 . . 543,62 107,17 101,95 . . 107,74 2.Vj 618,08 62,60 . . 555,48 109,22 97,99 . . 110,52 3.Vj 631,67 64,07 . . 567,60 110,58 99,85 . . 111,82 4.Vj 615,53 65,23 . . 550,30 106,04 102,22 . . 106,43
2009 1.Vj 573,67 63,80 . . 509,87 100,23 98,97 . . 100,31 2.Vj 577,74 63,33 . . 514,41 101,14 98,09 . . 101,44 3.Vj 608,81 64,24 . . 544,57 105,05 99,50 . . 105,65 4.Vj 614,28 65,78 . . 548,50 104,37 102,07 . . 104,56
2010 1.Vj 598,33 62,14 . . 536,19 103,07 96,35 . . 103,82 2.Vj 612,66 64,19 . . 548,47 106,21 99,24 . . 106,99 3.Vj 640,71 65,96 . . 574,75 109,81 102,07 . . 110,68 4.Vj 644,50 67,28 . . 577,22 108,79 103,89 . . 109,30
2011 1.Vj 633,01 69,13 . . 563,88 108,42 105,03 . . 108,75 2.Vj 637,56 67,54 . . 570,02 109,49 102,06 . . 110,32 3.Vj 663,12 68,84 . . 594,28 112,64 103,62 . . 113,67 4.Vj 658,91 69,66 . . 589,25 110,28 104,70 . . 110,88
2012 1.Vj 651,25 70,97 . . 580,28 110,26 105,73 . . 110,73 2.Vj 648,60 67,63 . . 580,97 110,04 100,57 . . 111,13 3.Vj 674,85 70,35 . . 604,50 113,08 104,56 . . 114,05
2007 5,0 10,5 10,0 – 5,4 4,3 3,3 – 2,1 – 2,0 – 0,7 3,9
2008 1,9 2,1 1,9 – 6,5 1,8 1,1 – 0,2 – 0,2 1,6 1,2
2009 – 4,0 0,1 0,1 – 0,3 – 4,5 – 5,1 – 0,8 – 0,9 – 1,7 – 5,6
2010 5,1 0,9 1,0 3,5 5,6 4,2 0,7 0,7 0,2 4,6
2011 3,9 6,0 5,9 2,3 3,6 3,0 3,4 3,4 2,1 3,0
2008 1.Vj 2,9 1,5 . . 3,1 2,1 – 0,6 . . 2,4 2.Vj 4,0 2,4 . . 4,2 3,1 – 0,3 . . 3,5 3.Vj 1,8 2,4 . . 1,7 1,1 – 0,5 . . 1,3 4.Vj – 1,1 2,1 . . – 1,4 – 1,9 0,4 . . – 2,1
2009 1.Vj – 5,7 – 1,7 . . – 6,2 – 6,5 – 2,9 . . – 6,9 2.Vj – 6,5 1,2 . . – 7,4 – 7,4 0,1 . . – 8,2 3.Vj – 3,6 0,3 . . – 4,1 – 5,0 – 0,4 . . – 5,5 4.Vj – 0,2 0,8 . . – 0,3 – 1,6 – 0,1 . . – 1,8
2010 1.Vj 4,3 – 2,6 . . 5,2 2,8 – 2,6 . . 3,5 2.Vj 6,0 1,4 . . 6,6 5,0 1,2 . . 5,5 3.Vj 5,2 2,7 . . 5,5 4,5 2,6 . . 4,8 4.Vj 4,9 2,3 . . 5,2 4,2 1,8 . . 4,5
2011 1.Vj 5,8 11,2 . . 5,2 5,2 9,0 . . 4,7 2.Vj 4,1 5,2 . . 3,9 3,1 2,8 . . 3,1 3.Vj 3,5 4,4 . . 3,4 2,6 1,5 . . 2,7 4.Vj 2,2 3,5 . . 2,1 1,4 0,8 . . 1,4
2012 1.Vj 2,9 2,7 . . 2,9 1,7 0,7 . . 1,8 2.Vj 1,7 0,1 . . 1,9 0,5 – 1,5 . . 0,7 3.Vj 1,8 2,2 . . 1,7 0,4 0,9 . . 0,3
Jahr,Vierteljahr
Brutto-inlands-produkt
Güter-subven-tionen
Veränderung gegenüber dem entsprechenden Vorjahreszeitraum in %
In jeweiligen Preisen Preisbereinigt
Mrd. EUR Kettenindex (2005 = 100)
Netto-gütersteuern
(Sp.3�4)
Güter-steuern
Güter-subven-tionen
Brutto-wert-
schöpfung
Brutto-inlands-produkt(Sp.5+2)
Brutto-wert-
schöpfung
Netto-gütersteuern
Güter-steuern
Statistisches Bundesamt, Fachserie 18, Reihe 1.2, 3.Vj 2012
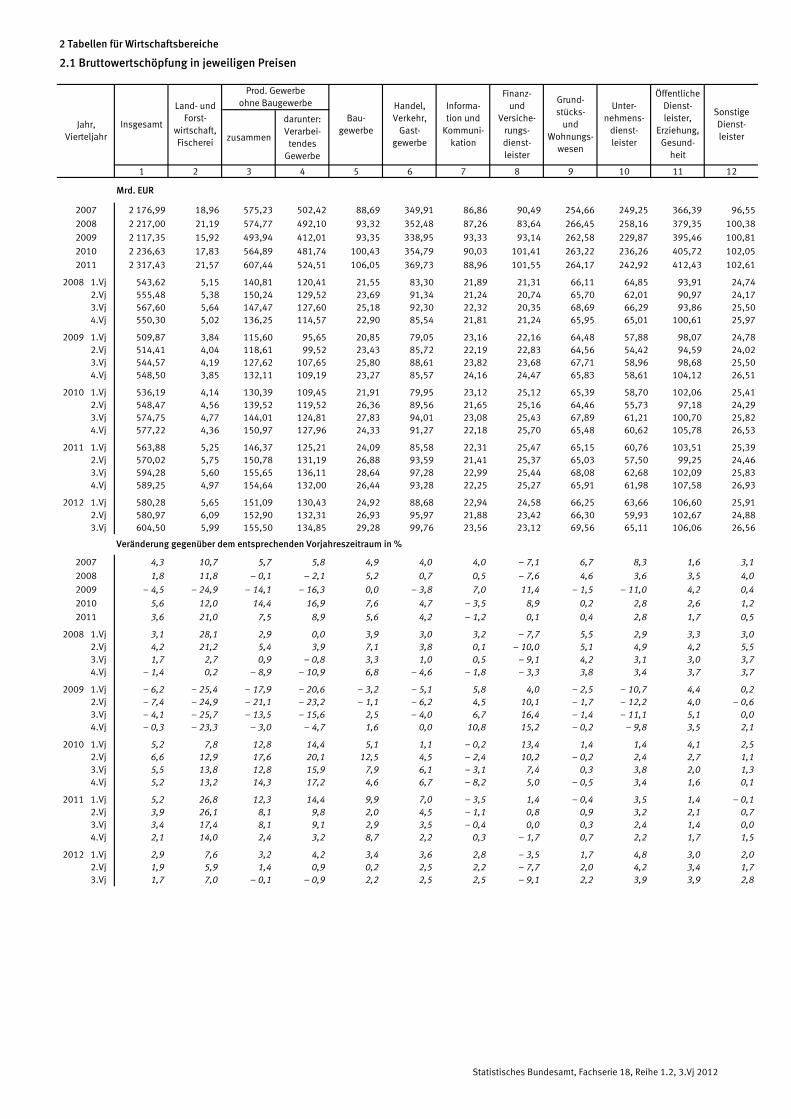
2 Tabellen für Wirtschaftsbereiche
2.1 Bruttowertschöpfung in jeweiligen Preisen
zusammen
darunter:Verarbei-
tendesGewerbe
1 2 3 4 5 6 7 8 9 10 11 12
Mrd. EUR
2007 2 176,99 18,96 575,23 502,42 88,69 349,91 86,86 90,49 254,66 249,25 366,39 96,55
2008 2 217,00 21,19 574,77 492,10 93,32 352,48 87,26 83,64 266,45 258,16 379,35 100,38
2009 2 117,35 15,92 493,94 412,01 93,35 338,95 93,33 93,14 262,58 229,87 395,46 100,81
2010 2 236,63 17,83 564,89 481,74 100,43 354,79 90,03 101,41 263,22 236,26 405,72 102,05
2011 2 317,43 21,57 607,44 524,51 106,05 369,73 88,96 101,55 264,17 242,92 412,43 102,61
2008 1.Vj 543,62 5,15 140,81 120,41 21,55 83,30 21,89 21,31 66,11 64,85 93,91 24,742.Vj 555,48 5,38 150,24 129,52 23,69 91,34 21,24 20,74 65,70 62,01 90,97 24,173.Vj 567,60 5,64 147,47 127,60 25,18 92,30 22,32 20,35 68,69 66,29 93,86 25,504.Vj 550,30 5,02 136,25 114,57 22,90 85,54 21,81 21,24 65,95 65,01 100,61 25,97
2009 1.Vj 509,87 3,84 115,60 95,65 20,85 79,05 23,16 22,16 64,48 57,88 98,07 24,782.Vj 514,41 4,04 118,61 99,52 23,43 85,72 22,19 22,83 64,56 54,42 94,59 24,023.Vj 544,57 4,19 127,62 107,65 25,80 88,61 23,82 23,68 67,71 58,96 98,68 25,504.Vj 548,50 3,85 132,11 109,19 23,27 85,57 24,16 24,47 65,83 58,61 104,12 26,51
2010 1.Vj 536,19 4,14 130,39 109,45 21,91 79,95 23,12 25,12 65,39 58,70 102,06 25,412.Vj 548,47 4,56 139,52 119,52 26,36 89,56 21,65 25,16 64,46 55,73 97,18 24,293.Vj 574,75 4,77 144,01 124,81 27,83 94,01 23,08 25,43 67,89 61,21 100,70 25,824.Vj 577,22 4,36 150,97 127,96 24,33 91,27 22,18 25,70 65,48 60,62 105,78 26,53
2011 1.Vj 563,88 5,25 146,37 125,21 24,09 85,58 22,31 25,47 65,15 60,76 103,51 25,392.Vj 570,02 5,75 150,78 131,19 26,88 93,59 21,41 25,37 65,03 57,50 99,25 24,463.Vj 594,28 5,60 155,65 136,11 28,64 97,28 22,99 25,44 68,08 62,68 102,09 25,834.Vj 589,25 4,97 154,64 132,00 26,44 93,28 22,25 25,27 65,91 61,98 107,58 26,93
2012 1.Vj 580,28 5,65 151,09 130,43 24,92 88,68 22,94 24,58 66,25 63,66 106,60 25,912.Vj 580,97 6,09 152,90 132,31 26,93 95,97 21,88 23,42 66,30 59,93 102,67 24,883.Vj 604,50 5,99 155,50 134,85 29,28 99,76 23,56 23,12 69,56 65,11 106,06 26,56
2007 4,3 10,7 5,7 5,8 4,9 4,0 4,0 – 7,1 6,7 8,3 1,6 3,1
2008 1,8 11,8 – 0,1 – 2,1 5,2 0,7 0,5 – 7,6 4,6 3,6 3,5 4,0
2009 – 4,5 – 24,9 – 14,1 – 16,3 0,0 – 3,8 7,0 11,4 – 1,5 – 11,0 4,2 0,4
2010 5,6 12,0 14,4 16,9 7,6 4,7 – 3,5 8,9 0,2 2,8 2,6 1,2
2011 3,6 21,0 7,5 8,9 5,6 4,2 – 1,2 0,1 0,4 2,8 1,7 0,5
2008 1.Vj 3,1 28,1 2,9 0,0 3,9 3,0 3,2 – 7,7 5,5 2,9 3,3 3,02.Vj 4,2 21,2 5,4 3,9 7,1 3,8 0,1 – 10,0 5,1 4,9 4,2 5,53.Vj 1,7 2,7 0,9 – 0,8 3,3 1,0 0,5 – 9,1 4,2 3,1 3,0 3,74.Vj – 1,4 0,2 – 8,9 – 10,9 6,8 – 4,6 – 1,8 – 3,3 3,8 3,4 3,7 3,7
2009 1.Vj – 6,2 – 25,4 – 17,9 – 20,6 – 3,2 – 5,1 5,8 4,0 – 2,5 – 10,7 4,4 0,22.Vj – 7,4 – 24,9 – 21,1 – 23,2 – 1,1 – 6,2 4,5 10,1 – 1,7 – 12,2 4,0 – 0,63.Vj – 4,1 – 25,7 – 13,5 – 15,6 2,5 – 4,0 6,7 16,4 – 1,4 – 11,1 5,1 0,04.Vj – 0,3 – 23,3 – 3,0 – 4,7 1,6 0,0 10,8 15,2 – 0,2 – 9,8 3,5 2,1
2010 1.Vj 5,2 7,8 12,8 14,4 5,1 1,1 – 0,2 13,4 1,4 1,4 4,1 2,52.Vj 6,6 12,9 17,6 20,1 12,5 4,5 – 2,4 10,2 – 0,2 2,4 2,7 1,13.Vj 5,5 13,8 12,8 15,9 7,9 6,1 – 3,1 7,4 0,3 3,8 2,0 1,34.Vj 5,2 13,2 14,3 17,2 4,6 6,7 – 8,2 5,0 – 0,5 3,4 1,6 0,1
2011 1.Vj 5,2 26,8 12,3 14,4 9,9 7,0 – 3,5 1,4 – 0,4 3,5 1,4 – 0,12.Vj 3,9 26,1 8,1 9,8 2,0 4,5 – 1,1 0,8 0,9 3,2 2,1 0,73.Vj 3,4 17,4 8,1 9,1 2,9 3,5 – 0,4 0,0 0,3 2,4 1,4 0,04.Vj 2,1 14,0 2,4 3,2 8,7 2,2 0,3 – 1,7 0,7 2,2 1,7 1,5
2012 1.Vj 2,9 7,6 3,2 4,2 3,4 3,6 2,8 – 3,5 1,7 4,8 3,0 2,02.Vj 1,9 5,9 1,4 0,9 0,2 2,5 2,2 – 7,7 2,0 4,2 3,4 1,73.Vj 1,7 7,0 – 0,1 – 0,9 2,2 2,5 2,5 – 9,1 2,2 3,9 3,9 2,8
Jahr,Vierteljahr
Insgesamt
Handel,Verkehr,
Gast-gewerbe
Informa-tion und
Kommuni-kation
Bau-gewerbe
Prod. Gewerbeohne BaugewerbeLand- und
Forst-wirtschaft,Fischerei
Finanz-und
Versiche-rungs-dienst-leister
Grund-stücks-
undWohnungs-
wesen
Unter-nehmens-
dienst-leister
ÖffentlicheDienst-leister,
Erziehung,Gesund-
heit
SonstigeDienst-leister
Veränderung gegenüber dem entsprechenden Vorjahreszeitraum in %
Statistisches Bundesamt, Fachserie 18, Reihe 1.2, 3.Vj 2012

2.2 Bruttowertschöpfung, preisbereinigt
zusammen
darunter:Verarbei-
tendesGewerbe
1 2 3 4 5 6 7 8 9 10 11 12
Kettenindex (2005 = 100)
2007 107,79 128,53 112,15 114,46 99,32 106,65 118,03 112,82 103,72 110,11 102,01 103,93
2008 109,13 136,66 110,02 111,43 99,15 109,19 123,67 115,85 105,38 112,01 105,23 106,09
2009 102,99 142,14 90,58 86,78 92,69 108,77 135,93 113,87 107,03 98,23 106,69 104,49
2010 107,70 121,16 104,89 103,70 99,04 110,61 135,65 115,52 105,25 100,79 108,48 104,01
2011 110,91 110,02 111,40 112,34 103,63 113,99 138,20 117,14 105,87 105,00 109,45 103,46
2008 1.Vj 107,74 129,89 108,94 110,26 91,78 103,73 125,50 114,80 105,06 112,16 105,99 106,272.Vj 110,52 139,11 115,61 117,64 102,49 113,53 123,00 116,55 104,98 107,91 103,46 104,333.Vj 111,82 145,07 111,43 113,96 107,19 113,14 128,44 116,20 107,69 116,18 106,58 108,384.Vj 106,43 132,60 104,11 103,83 95,14 106,35 117,73 115,85 103,78 111,77 104,91 105,40
2009 1.Vj 100,31 134,14 86,45 81,85 82,58 101,15 137,76 115,68 105,44 99,06 107,05 105,142.Vj 101,44 144,98 88,28 85,19 94,43 110,88 131,98 114,85 106,29 92,68 104,33 101,123.Vj 105,65 151,17 92,27 89,63 102,51 113,46 139,17 112,75 109,49 100,97 107,77 106,204.Vj 104,56 138,27 95,33 90,42 91,25 109,60 134,81 112,19 106,88 100,21 107,62 105,52
2010 1.Vj 103,82 112,85 97,76 95,06 85,47 100,57 137,90 114,97 105,18 99,69 109,90 105,472.Vj 106,99 123,93 104,70 103,84 105,61 112,92 132,19 117,71 104,43 95,07 106,19 100,793.Vj 110,68 128,93 106,24 106,64 110,45 116,33 138,89 114,63 107,67 105,33 109,57 105,764.Vj 109,30 118,93 110,87 109,25 94,65 112,62 133,64 114,77 103,71 103,09 108,25 104,02
2011 1.Vj 108,75 106,55 109,05 108,65 94,43 105,91 140,25 115,96 105,08 104,77 110,69 104,612.Vj 110,32 115,25 112,20 113,85 107,10 116,29 134,52 117,70 105,31 99,43 107,26 99,923.Vj 113,67 114,70 112,75 115,23 111,99 119,13 141,87 118,52 108,22 109,21 110,44 105,024.Vj 110,88 103,56 111,61 111,63 100,98 114,64 136,15 116,37 104,87 106,60 109,41 104,29
2012 1.Vj 110,73 109,56 110,35 111,13 95,45 108,57 145,10 118,07 106,86 109,08 111,68 105,872.Vj 111,13 114,87 111,22 112,50 104,52 117,40 138,08 120,24 107,04 102,39 108,38 100,713.Vj 114,05 117,93 110,32 112,21 111,44 119,96 146,34 120,61 109,83 111,79 111,18 105,63
2007 3,9 35,4 5,0 5,0 – 0,8 1,8 10,5 5,9 3,1 6,6 0,8 2,0
2008 1,2 6,3 – 1,9 – 2,6 – 0,2 2,4 4,8 2,7 1,6 1,7 3,2 2,1
2009 – 5,6 4,0 – 17,7 – 22,1 – 6,5 – 0,4 9,9 – 1,7 1,6 – 12,3 1,4 – 1,5
2010 4,6 – 14,8 15,8 19,5 6,9 1,7 – 0,2 1,4 – 1,7 2,6 1,7 – 0,5
2011 3,0 – 9,2 6,2 8,3 4,6 3,1 1,9 1,4 0,6 4,2 0,9 – 0,5
2008 1.Vj 2,4 7,0 0,7 – 0,4 – 0,8 5,2 6,1 3,4 2,2 1,9 2,4 1,42.Vj 3,5 6,6 3,5 3,0 2,8 5,0 5,2 2,8 1,9 3,7 2,9 3,73.Vj 1,3 5,3 – 1,5 – 2,0 – 0,8 2,1 5,8 2,6 1,3 1,5 3,3 2,14.Vj – 2,1 6,7 – 10,0 – 11,1 – 2,0 – 2,5 2,0 2,0 1,0 0,0 4,0 1,2
2009 1.Vj – 6,9 3,3 – 20,6 – 25,8 – 10,0 – 2,5 9,8 0,8 0,4 – 11,7 1,0 – 1,12.Vj – 8,2 4,2 – 23,6 – 27,6 – 7,9 – 2,3 7,3 – 1,5 1,2 – 14,1 0,8 – 3,13.Vj – 5,5 4,2 – 17,2 – 21,3 – 4,4 0,3 8,4 – 3,0 1,7 – 13,1 1,1 – 2,04.Vj – 1,8 4,3 – 8,4 – 12,9 – 4,1 3,1 14,5 – 3,2 3,0 – 10,3 2,6 0,1
2010 1.Vj 3,5 – 15,9 13,1 16,1 3,5 – 0,6 0,1 – 0,6 – 0,2 0,6 2,7 0,32.Vj 5,5 – 14,5 18,6 21,9 11,8 1,8 0,2 2,5 – 1,7 2,6 1,8 – 0,33.Vj 4,8 – 14,7 15,1 19,0 7,7 2,5 – 0,2 1,7 – 1,7 4,3 1,7 – 0,44.Vj 4,5 – 14,0 16,3 20,8 3,7 2,8 – 0,9 2,3 – 3,0 2,9 0,6 – 1,4
2011 1.Vj 4,7 – 5,6 11,5 14,3 10,5 5,3 1,7 0,9 – 0,1 5,1 0,7 – 0,82.Vj 3,1 – 7,0 7,2 9,6 1,4 3,0 1,8 – 0,0 0,8 4,6 1,0 – 0,93.Vj 2,7 – 11,0 6,1 8,1 1,4 2,4 2,1 3,4 0,5 3,7 0,8 – 0,74.Vj 1,4 – 12,9 0,7 2,2 6,7 1,8 1,9 1,4 1,1 3,4 1,1 0,3
2012 1.Vj 1,8 2,8 1,2 2,3 1,1 2,5 3,5 1,8 1,7 4,1 0,9 1,22.Vj 0,7 – 0,3 – 0,9 – 1,2 – 2,4 1,0 2,6 2,2 1,6 3,0 1,0 0,83.Vj 0,3 2,8 – 2,2 – 2,6 – 0,5 0,7 3,2 1,8 1,5 2,4 0,7 0,6
Unter-nehmens-
dienst-leister
ÖffentlicheDienst-leister,
Erziehung,Gesund-
heit
SonstigeDienst-leister
Finanz-und
Versiche-rungs-dienst-leister
Grund-stücks-
undWohnungs-
wesen
Jahr,Vierteljahr
Insgesamt
Handel,Verkehr,
Gast-gewerbe
Veränderung gegenüber dem entsprechenden Vorjahreszeitraum in %
Informa-tion und
Kommuni-kation
Prod. Gewerbeohne BaugewerbeLand- und
Forst-wirtschaft,Fischerei
Bau-gewerbe
Statistisches Bundesamt, Fachserie 18, Reihe 1.2, 3.Vj 2012
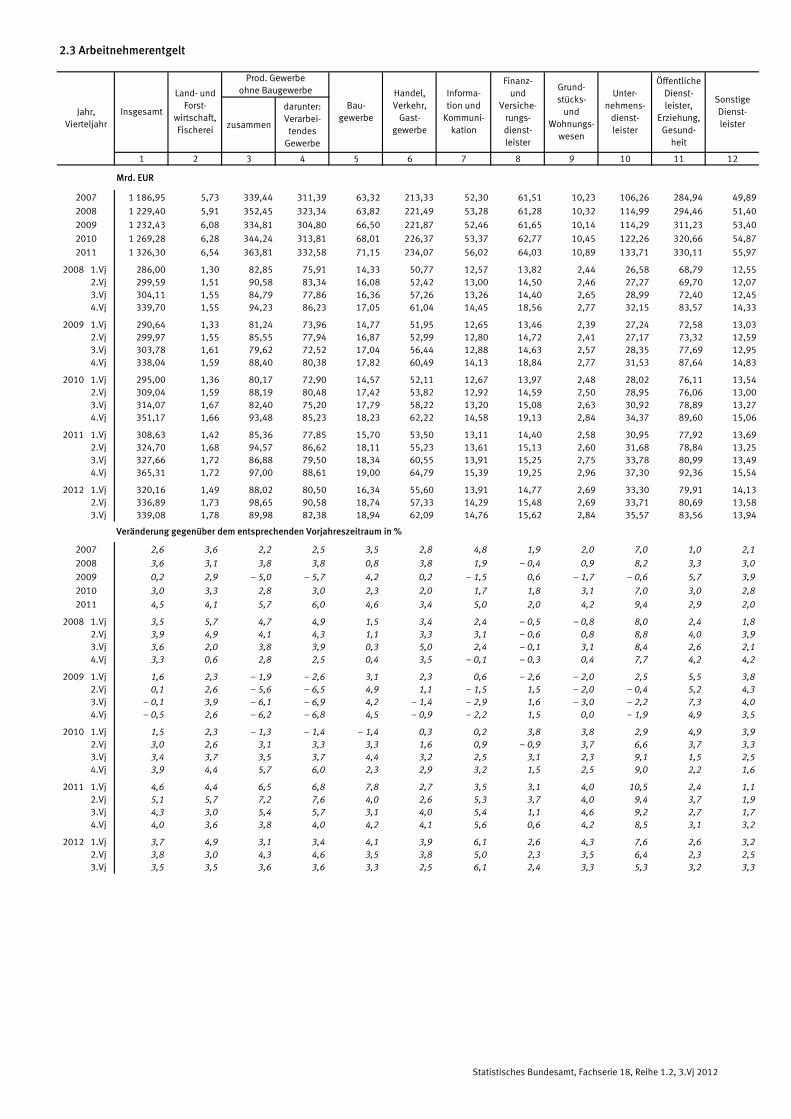
2.3 Arbeitnehmerentgelt
zusammen
darunter:Verarbei-
tendesGewerbe
1 2 3 4 5 6 7 8 9 10 11 12
Mrd. EUR
2007 1 186,95 5,73 339,44 311,39 63,32 213,33 52,30 61,51 10,23 106,26 284,94 49,89
2008 1 229,40 5,91 352,45 323,34 63,82 221,49 53,28 61,28 10,32 114,99 294,46 51,40
2009 1 232,43 6,08 334,81 304,80 66,50 221,87 52,46 61,65 10,14 114,29 311,23 53,40
2010 1 269,28 6,28 344,24 313,81 68,01 226,37 53,37 62,77 10,45 122,26 320,66 54,87
2011 1 326,30 6,54 363,81 332,58 71,15 234,07 56,02 64,03 10,89 133,71 330,11 55,97
2008 1.Vj 286,00 1,30 82,85 75,91 14,33 50,77 12,57 13,82 2,44 26,58 68,79 12,552.Vj 299,59 1,51 90,58 83,34 16,08 52,42 13,00 14,50 2,46 27,27 69,70 12,073.Vj 304,11 1,55 84,79 77,86 16,36 57,26 13,26 14,40 2,65 28,99 72,40 12,454.Vj 339,70 1,55 94,23 86,23 17,05 61,04 14,45 18,56 2,77 32,15 83,57 14,33
2009 1.Vj 290,64 1,33 81,24 73,96 14,77 51,95 12,65 13,46 2,39 27,24 72,58 13,032.Vj 299,97 1,55 85,55 77,94 16,87 52,99 12,80 14,72 2,41 27,17 73,32 12,593.Vj 303,78 1,61 79,62 72,52 17,04 56,44 12,88 14,63 2,57 28,35 77,69 12,954.Vj 338,04 1,59 88,40 80,38 17,82 60,49 14,13 18,84 2,77 31,53 87,64 14,83
2010 1.Vj 295,00 1,36 80,17 72,90 14,57 52,11 12,67 13,97 2,48 28,02 76,11 13,542.Vj 309,04 1,59 88,19 80,48 17,42 53,82 12,92 14,59 2,50 28,95 76,06 13,003.Vj 314,07 1,67 82,40 75,20 17,79 58,22 13,20 15,08 2,63 30,92 78,89 13,274.Vj 351,17 1,66 93,48 85,23 18,23 62,22 14,58 19,13 2,84 34,37 89,60 15,06
2011 1.Vj 308,63 1,42 85,36 77,85 15,70 53,50 13,11 14,40 2,58 30,95 77,92 13,692.Vj 324,70 1,68 94,57 86,62 18,11 55,23 13,61 15,13 2,60 31,68 78,84 13,253.Vj 327,66 1,72 86,88 79,50 18,34 60,55 13,91 15,25 2,75 33,78 80,99 13,494.Vj 365,31 1,72 97,00 88,61 19,00 64,79 15,39 19,25 2,96 37,30 92,36 15,54
2012 1.Vj 320,16 1,49 88,02 80,50 16,34 55,60 13,91 14,77 2,69 33,30 79,91 14,132.Vj 336,89 1,73 98,65 90,58 18,74 57,33 14,29 15,48 2,69 33,71 80,69 13,583.Vj 339,08 1,78 89,98 82,38 18,94 62,09 14,76 15,62 2,84 35,57 83,56 13,94
2007 2,6 3,6 2,2 2,5 3,5 2,8 4,8 1,9 2,0 7,0 1,0 2,1
2008 3,6 3,1 3,8 3,8 0,8 3,8 1,9 – 0,4 0,9 8,2 3,3 3,0
2009 0,2 2,9 – 5,0 – 5,7 4,2 0,2 – 1,5 0,6 – 1,7 – 0,6 5,7 3,9
2010 3,0 3,3 2,8 3,0 2,3 2,0 1,7 1,8 3,1 7,0 3,0 2,8
2011 4,5 4,1 5,7 6,0 4,6 3,4 5,0 2,0 4,2 9,4 2,9 2,0
2008 1.Vj 3,5 5,7 4,7 4,9 1,5 3,4 2,4 – 0,5 – 0,8 8,0 2,4 1,82.Vj 3,9 4,9 4,1 4,3 1,1 3,3 3,1 – 0,6 0,8 8,8 4,0 3,93.Vj 3,6 2,0 3,8 3,9 0,3 5,0 2,4 – 0,1 3,1 8,4 2,6 2,14.Vj 3,3 0,6 2,8 2,5 0,4 3,5 – 0,1 – 0,3 0,4 7,7 4,2 4,2
2009 1.Vj 1,6 2,3 – 1,9 – 2,6 3,1 2,3 0,6 – 2,6 – 2,0 2,5 5,5 3,82.Vj 0,1 2,6 – 5,6 – 6,5 4,9 1,1 – 1,5 1,5 – 2,0 – 0,4 5,2 4,33.Vj – 0,1 3,9 – 6,1 – 6,9 4,2 – 1,4 – 2,9 1,6 – 3,0 – 2,2 7,3 4,04.Vj – 0,5 2,6 – 6,2 – 6,8 4,5 – 0,9 – 2,2 1,5 0,0 – 1,9 4,9 3,5
2010 1.Vj 1,5 2,3 – 1,3 – 1,4 – 1,4 0,3 0,2 3,8 3,8 2,9 4,9 3,92.Vj 3,0 2,6 3,1 3,3 3,3 1,6 0,9 – 0,9 3,7 6,6 3,7 3,33.Vj 3,4 3,7 3,5 3,7 4,4 3,2 2,5 3,1 2,3 9,1 1,5 2,54.Vj 3,9 4,4 5,7 6,0 2,3 2,9 3,2 1,5 2,5 9,0 2,2 1,6
2011 1.Vj 4,6 4,4 6,5 6,8 7,8 2,7 3,5 3,1 4,0 10,5 2,4 1,12.Vj 5,1 5,7 7,2 7,6 4,0 2,6 5,3 3,7 4,0 9,4 3,7 1,93.Vj 4,3 3,0 5,4 5,7 3,1 4,0 5,4 1,1 4,6 9,2 2,7 1,74.Vj 4,0 3,6 3,8 4,0 4,2 4,1 5,6 0,6 4,2 8,5 3,1 3,2
2012 1.Vj 3,7 4,9 3,1 3,4 4,1 3,9 6,1 2,6 4,3 7,6 2,6 3,22.Vj 3,8 3,0 4,3 4,6 3,5 3,8 5,0 2,3 3,5 6,4 2,3 2,53.Vj 3,5 3,5 3,6 3,6 3,3 2,5 6,1 2,4 3,3 5,3 3,2 3,3
Unter-nehmens-
dienst-leister
ÖffentlicheDienst-leister,
Erziehung,Gesund-
heit
SonstigeDienst-leister
Finanz-und
Versiche-rungs-dienst-leister
Grund-stücks-
undWohnungs-
wesen
Jahr,Vierteljahr
Insgesamt
Handel,Verkehr,
Gast-gewerbe
Veränderung gegenüber dem entsprechenden Vorjahreszeitraum in %
Informa-tion und
Kommuni-kation
Prod. Gewerbeohne BaugewerbeLand- und
Forst-wirtschaft,Fischerei
Bau-gewerbe
Statistisches Bundesamt, Fachserie 18, Reihe 1.2, 3.Vj 2012
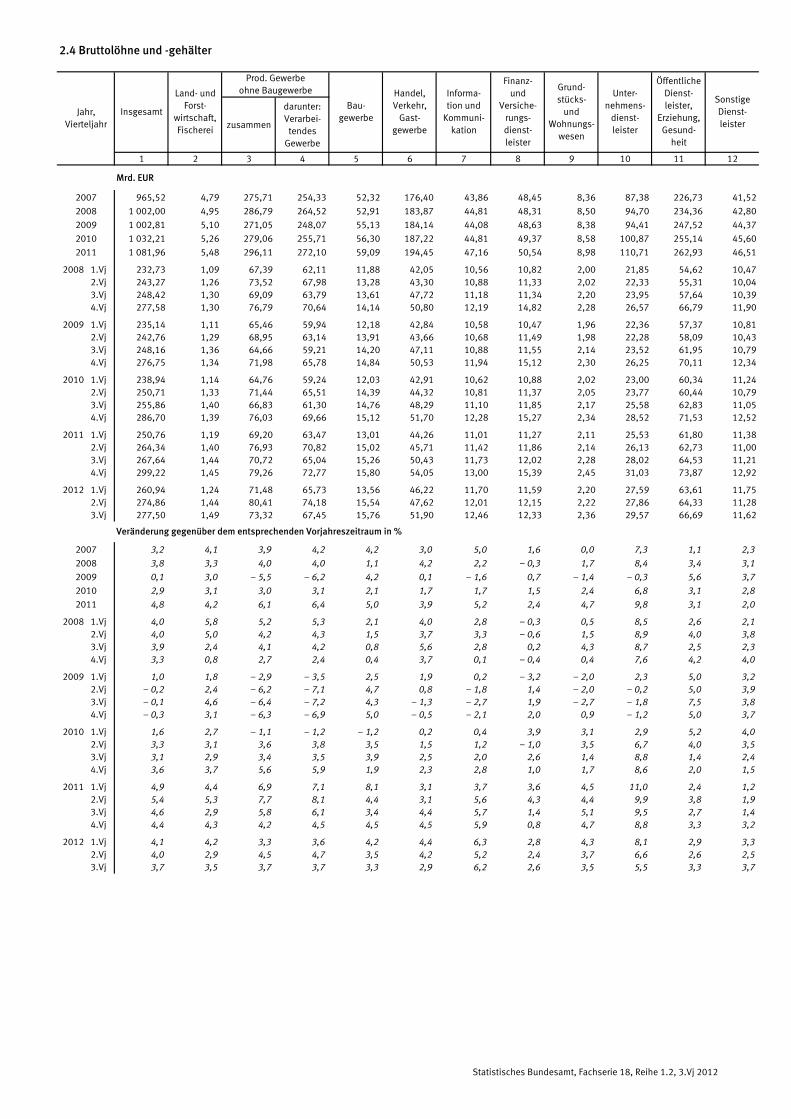
2.4 Bruttolöhne und -gehälter
zusammen
darunter:Verarbei-
tendesGewerbe
1 2 3 4 5 6 7 8 9 10 11 12
Mrd. EUR
2007 965,52 4,79 275,71 254,33 52,32 176,40 43,86 48,45 8,36 87,38 226,73 41,52
2008 1 002,00 4,95 286,79 264,52 52,91 183,87 44,81 48,31 8,50 94,70 234,36 42,80
2009 1 002,81 5,10 271,05 248,07 55,13 184,14 44,08 48,63 8,38 94,41 247,52 44,37
2010 1 032,21 5,26 279,06 255,71 56,30 187,22 44,81 49,37 8,58 100,87 255,14 45,60
2011 1 081,96 5,48 296,11 272,10 59,09 194,45 47,16 50,54 8,98 110,71 262,93 46,51
2008 1.Vj 232,73 1,09 67,39 62,11 11,88 42,05 10,56 10,82 2,00 21,85 54,62 10,472.Vj 243,27 1,26 73,52 67,98 13,28 43,30 10,88 11,33 2,02 22,33 55,31 10,043.Vj 248,42 1,30 69,09 63,79 13,61 47,72 11,18 11,34 2,20 23,95 57,64 10,394.Vj 277,58 1,30 76,79 70,64 14,14 50,80 12,19 14,82 2,28 26,57 66,79 11,90
2009 1.Vj 235,14 1,11 65,46 59,94 12,18 42,84 10,58 10,47 1,96 22,36 57,37 10,812.Vj 242,76 1,29 68,95 63,14 13,91 43,66 10,68 11,49 1,98 22,28 58,09 10,433.Vj 248,16 1,36 64,66 59,21 14,20 47,11 10,88 11,55 2,14 23,52 61,95 10,794.Vj 276,75 1,34 71,98 65,78 14,84 50,53 11,94 15,12 2,30 26,25 70,11 12,34
2010 1.Vj 238,94 1,14 64,76 59,24 12,03 42,91 10,62 10,88 2,02 23,00 60,34 11,242.Vj 250,71 1,33 71,44 65,51 14,39 44,32 10,81 11,37 2,05 23,77 60,44 10,793.Vj 255,86 1,40 66,83 61,30 14,76 48,29 11,10 11,85 2,17 25,58 62,83 11,054.Vj 286,70 1,39 76,03 69,66 15,12 51,70 12,28 15,27 2,34 28,52 71,53 12,52
2011 1.Vj 250,76 1,19 69,20 63,47 13,01 44,26 11,01 11,27 2,11 25,53 61,80 11,382.Vj 264,34 1,40 76,93 70,82 15,02 45,71 11,42 11,86 2,14 26,13 62,73 11,003.Vj 267,64 1,44 70,72 65,04 15,26 50,43 11,73 12,02 2,28 28,02 64,53 11,214.Vj 299,22 1,45 79,26 72,77 15,80 54,05 13,00 15,39 2,45 31,03 73,87 12,92
2012 1.Vj 260,94 1,24 71,48 65,73 13,56 46,22 11,70 11,59 2,20 27,59 63,61 11,752.Vj 274,86 1,44 80,41 74,18 15,54 47,62 12,01 12,15 2,22 27,86 64,33 11,283.Vj 277,50 1,49 73,32 67,45 15,76 51,90 12,46 12,33 2,36 29,57 66,69 11,62
2007 3,2 4,1 3,9 4,2 4,2 3,0 5,0 1,6 0,0 7,3 1,1 2,3
2008 3,8 3,3 4,0 4,0 1,1 4,2 2,2 – 0,3 1,7 8,4 3,4 3,1
2009 0,1 3,0 – 5,5 – 6,2 4,2 0,1 – 1,6 0,7 – 1,4 – 0,3 5,6 3,7
2010 2,9 3,1 3,0 3,1 2,1 1,7 1,7 1,5 2,4 6,8 3,1 2,8
2011 4,8 4,2 6,1 6,4 5,0 3,9 5,2 2,4 4,7 9,8 3,1 2,0
2008 1.Vj 4,0 5,8 5,2 5,3 2,1 4,0 2,8 – 0,3 0,5 8,5 2,6 2,12.Vj 4,0 5,0 4,2 4,3 1,5 3,7 3,3 – 0,6 1,5 8,9 4,0 3,83.Vj 3,9 2,4 4,1 4,2 0,8 5,6 2,8 0,2 4,3 8,7 2,5 2,34.Vj 3,3 0,8 2,7 2,4 0,4 3,7 0,1 – 0,4 0,4 7,6 4,2 4,0
2009 1.Vj 1,0 1,8 – 2,9 – 3,5 2,5 1,9 0,2 – 3,2 – 2,0 2,3 5,0 3,22.Vj – 0,2 2,4 – 6,2 – 7,1 4,7 0,8 – 1,8 1,4 – 2,0 – 0,2 5,0 3,93.Vj – 0,1 4,6 – 6,4 – 7,2 4,3 – 1,3 – 2,7 1,9 – 2,7 – 1,8 7,5 3,84.Vj – 0,3 3,1 – 6,3 – 6,9 5,0 – 0,5 – 2,1 2,0 0,9 – 1,2 5,0 3,7
2010 1.Vj 1,6 2,7 – 1,1 – 1,2 – 1,2 0,2 0,4 3,9 3,1 2,9 5,2 4,02.Vj 3,3 3,1 3,6 3,8 3,5 1,5 1,2 – 1,0 3,5 6,7 4,0 3,53.Vj 3,1 2,9 3,4 3,5 3,9 2,5 2,0 2,6 1,4 8,8 1,4 2,44.Vj 3,6 3,7 5,6 5,9 1,9 2,3 2,8 1,0 1,7 8,6 2,0 1,5
2011 1.Vj 4,9 4,4 6,9 7,1 8,1 3,1 3,7 3,6 4,5 11,0 2,4 1,22.Vj 5,4 5,3 7,7 8,1 4,4 3,1 5,6 4,3 4,4 9,9 3,8 1,93.Vj 4,6 2,9 5,8 6,1 3,4 4,4 5,7 1,4 5,1 9,5 2,7 1,44.Vj 4,4 4,3 4,2 4,5 4,5 4,5 5,9 0,8 4,7 8,8 3,3 3,2
2012 1.Vj 4,1 4,2 3,3 3,6 4,2 4,4 6,3 2,8 4,3 8,1 2,9 3,32.Vj 4,0 2,9 4,5 4,7 3,5 4,2 5,2 2,4 3,7 6,6 2,6 2,53.Vj 3,7 3,5 3,7 3,7 3,3 2,9 6,2 2,6 3,5 5,5 3,3 3,7
Jahr,Vierteljahr
Insgesamt
Handel,Verkehr,
Gast-gewerbe
Informa-tion und
Kommuni-kation
Bau-gewerbe
Prod. Gewerbeohne BaugewerbeLand- und
Forst-wirtschaft,Fischerei
Finanz-und
Versiche-rungs-dienst-leister
Grund-stücks-
undWohnungs-
wesen
Unter-nehmens-
dienst-leister
ÖffentlicheDienst-leister,
Erziehung,Gesund-
heit
SonstigeDienst-leister
Veränderung gegenüber dem entsprechenden Vorjahreszeitraum in %
Statistisches Bundesamt, Fachserie 18, Reihe 1.2, 3.Vj 2012

2.5 Erwerbstätige
zusammen
darunter:Verarbei-
tendesGewerbe
1 2 3 4 5 6 7 8 9 10 11 12
1000 Personen
2007 39 857 662 7 776 7 212 2 359 9 278 1 275 1 225 443 4 763 9 096 2 980
2008 40 348 667 7 926 7 361 2 346 9 358 1 258 1 202 441 4 950 9 207 2 993
2009 40 370 669 7 726 7 161 2 355 9 378 1 236 1 212 435 4 923 9 413 3 023
2010 40 603 663 7 604 7 042 2 383 9 360 1 219 1 213 440 5 135 9 553 3 033
2011 41 164 667 7 739 7 175 2 424 9 494 1 236 1 207 446 5 368 9 557 3 026
2008 1.Vj 39 903 632 7 856 7 298 2 282 9 270 1 259 1 204 441 4 842 9 145 2 9722.Vj 40 250 703 7 890 7 329 2 333 9 333 1 263 1 196 443 4 918 9 171 3 0003.Vj 40 515 685 7 983 7 417 2 380 9 383 1 262 1 199 446 5 015 9 164 2 9984.Vj 40 723 646 7 965 7 395 2 387 9 453 1 252 1 211 434 5 021 9 349 3 005
2009 1.Vj 40 115 631 7 829 7 265 2 277 9 317 1 243 1 205 426 4 863 9 327 2 9972.Vj 40 314 712 7 728 7 163 2 341 9 389 1 237 1 207 432 4 861 9 376 3 0313.Vj 40 431 689 7 683 7 118 2 396 9 409 1 232 1 214 440 4 957 9 389 3 0224.Vj 40 621 643 7 660 7 091 2 405 9 409 1 230 1 223 441 5 009 9 558 3 043
2010 1.Vj 40 026 625 7 536 6 980 2 282 9 233 1 226 1 212 437 4 945 9 510 3 0202.Vj 40 513 704 7 557 6 998 2 373 9 338 1 219 1 208 438 5 089 9 541 3 0463.Vj 40 799 683 7 633 7 071 2 436 9 406 1 215 1 211 442 5 234 9 510 3 0294.Vj 41 074 637 7 677 7 113 2 445 9 477 1 218 1 219 443 5 279 9 645 3 034
2011 1.Vj 40 613 627 7 645 7 085 2 343 9 341 1 225 1 209 442 5 232 9 544 3 0052.Vj 41 073 716 7 694 7 132 2 417 9 468 1 232 1 204 445 5 327 9 538 3 0323.Vj 41 346 687 7 792 7 227 2 465 9 553 1 236 1 205 449 5 439 9 504 3 0164.Vj 41 623 640 7 823 7 256 2 474 9 617 1 248 1 213 450 5 477 9 640 3 041
2012 1.Vj 41 164 630 7 778 7 219 2 380 9 481 1 256 1 205 449 5 377 9 585 3 0232.Vj 41 521 714 7 796 7 234 2 449 9 551 1 264 1 199 451 5 434 9 618 3 0453.Vj 41 706 685 7 863 7 302 2 495 9 584 1 272 1 199 455 5 508 9 622 3 023
2007 1,7 3,4 1,3 1,4 1,5 1,4 2,0 – 2,2 0,0 5,3 0,9 2,0
2008 1,2 0,8 1,9 2,1 – 0,6 0,9 – 1,3 – 1,9 – 0,5 3,9 1,2 0,4
2009 0,1 0,3 – 2,5 – 2,7 0,4 0,2 – 1,7 0,8 – 1,4 – 0,5 2,2 1,0
2010 0,6 – 0,9 – 1,6 – 1,7 1,2 – 0,2 – 1,4 0,1 1,1 4,3 1,5 0,3
2011 1,4 0,6 1,8 1,9 1,7 1,4 1,4 – 0,5 1,4 4,5 0,0 – 0,2
2008 1.Vj 1,5 2,6 2,2 2,5 – 0,6 1,5 – 0,2 – 2,4 – 0,2 4,4 0,9 0,82.Vj 1,3 0,6 2,2 2,4 – 0,9 1,0 – 0,6 – 2,3 0,7 4,0 1,1 0,43.Vj 1,2 – 0,1 2,0 2,2 – 0,8 0,6 – 1,2 – 1,4 0,5 4,0 1,3 0,64.Vj 0,9 – 0,5 1,3 1,3 – 0,3 0,6 – 2,9 – 0,9 – 2,3 3,1 1,6 0,0
2009 1.Vj 0,5 – 0,2 – 0,3 – 0,5 – 0,2 0,5 – 1,3 0,1 – 3,4 0,4 2,0 0,82.Vj 0,2 1,3 – 2,1 – 2,3 0,3 0,6 – 2,1 0,9 – 2,5 – 1,2 2,2 1,03.Vj – 0,2 0,6 – 3,8 – 4,0 0,7 0,3 – 2,4 1,3 – 1,3 – 1,2 2,5 0,84.Vj – 0,3 – 0,5 – 3,8 – 4,1 0,8 – 0,5 – 1,8 1,0 1,6 – 0,2 2,2 1,3
2010 1.Vj – 0,2 – 1,0 – 3,7 – 3,9 0,2 – 0,9 – 1,4 0,6 2,6 1,7 2,0 0,82.Vj 0,5 – 1,1 – 2,2 – 2,3 1,4 – 0,5 – 1,5 0,1 1,4 4,7 1,8 0,53.Vj 0,9 – 0,9 – 0,7 – 0,7 1,7 – 0,0 – 1,4 – 0,2 0,5 5,6 1,3 0,24.Vj 1,1 – 0,9 0,2 0,3 1,7 0,7 – 1,0 – 0,3 0,5 5,4 0,9 – 0,3
2011 1.Vj 1,5 0,3 1,4 1,5 2,7 1,2 – 0,1 – 0,2 1,1 5,8 0,4 – 0,52.Vj 1,4 1,7 1,8 1,9 1,9 1,4 1,1 – 0,3 1,6 4,7 – 0,0 – 0,53.Vj 1,3 0,6 2,1 2,2 1,2 1,6 1,7 – 0,5 1,6 3,9 – 0,1 – 0,44.Vj 1,3 0,5 1,9 2,0 1,2 1,5 2,5 – 0,5 1,6 3,8 – 0,1 0,2
2012 1.Vj 1,4 0,5 1,7 1,9 1,6 1,5 2,5 – 0,3 1,6 2,8 0,4 0,62.Vj 1,1 – 0,3 1,3 1,4 1,3 0,9 2,6 – 0,4 1,3 2,0 0,8 0,43.Vj 0,9 – 0,3 0,9 1,0 1,2 0,3 2,9 – 0,5 1,3 1,3 1,2 0,2
Jahr,Vierteljahr
Insgesamt
Handel,Verkehr,
Gast-gewerbe
Veränderung gegenüber dem entsprechenden Vorjahreszeitraum in %
Informa-tion und
Kommuni-kation
Prod. Gewerbeohne BaugewerbeLand- und
Forst-wirtschaft,Fischerei
Bau-gewerbe
Unter-nehmens-
dienst-leister
ÖffentlicheDienst-leister,
Erziehung,Gesund-
heit
SonstigeDienst-leister
Finanz-und
Versiche-rungs-dienst-leister
Grund-stücks-
undWohnungs-
wesen
Statistisches Bundesamt, Fachserie 18, Reihe 1.2, 3.Vj 2012

2.6 Arbeitnehmer
zusammen
darunter:Verarbei-
tendesGewerbe
1 2 3 4 5 6 7 8 9 10 11 12
1000 Personen
2007 35 359 300 7 489 6 932 1 894 8 113 1 095 1 070 387 4 000 8 500 2 511
2008 35 868 302 7 643 7 085 1 884 8 211 1 080 1 051 385 4 180 8 615 2 517
2009 35 900 310 7 451 6 893 1 892 8 263 1 054 1 056 374 4 123 8 813 2 564
2010 36 110 311 7 330 6 776 1 914 8 258 1 037 1 059 375 4 301 8 947 2 578
2011 36 625 321 7 465 6 909 1 951 8 391 1 052 1 056 376 4 507 8 941 2 565
2008 1.Vj 35 424 267 7 571 7 020 1 824 8 117 1 081 1 054 385 4 076 8 551 2 4982.Vj 35 755 326 7 605 7 051 1 872 8 182 1 085 1 046 387 4 151 8 579 2 5223.Vj 36 034 320 7 702 7 143 1 917 8 236 1 082 1 048 390 4 247 8 573 2 5194.Vj 36 260 292 7 689 7 126 1 922 8 314 1 072 1 059 377 4 246 8 756 2 533
2009 1.Vj 35 653 269 7 555 6 998 1 817 8 189 1 062 1 051 368 4 078 8 731 2 5332.Vj 35 832 340 7 455 6 897 1 879 8 265 1 056 1 051 372 4 066 8 776 2 5723.Vj 35 958 332 7 413 6 855 1 932 8 292 1 049 1 056 378 4 152 8 788 2 5664.Vj 36 156 299 7 389 6 827 1 938 8 302 1 047 1 066 378 4 193 8 955 2 589
2010 1.Vj 35 551 271 7 266 6 717 1 818 8 127 1 043 1 057 373 4 123 8 907 2 5662.Vj 36 013 340 7 284 6 732 1 904 8 231 1 037 1 054 373 4 259 8 937 2 5943.Vj 36 300 333 7 359 6 805 1 964 8 304 1 033 1 058 376 4 394 8 905 2 5744.Vj 36 575 299 7 402 6 846 1 972 8 376 1 037 1 067 376 4 433 9 036 2 577
2011 1.Vj 36 096 279 7 370 6 818 1 874 8 240 1 043 1 057 373 4 381 8 932 2 5472.Vj 36 525 357 7 419 6 865 1 944 8 365 1 049 1 053 375 4 469 8 922 2 5723.Vj 36 798 342 7 518 6 961 1 989 8 447 1 052 1 054 379 4 575 8 887 2 5554.Vj 37 081 307 7 551 6 992 1 997 8 516 1 063 1 063 379 4 606 9 019 2 580
2012 1.Vj 36 616 286 7 506 6 955 1 905 8 388 1 069 1 056 378 4 503 8 965 2 5602.Vj 36 959 359 7 524 6 970 1 965 8 463 1 074 1 052 380 4 561 8 999 2 5823.Vj 37 161 344 7 589 7 036 2 004 8 507 1 080 1 053 383 4 636 9 005 2 560
2007 1,8 2,7 1,5 1,6 1,7 1,6 2,8 – 1,7 – 0,5 5,7 0,8 2,3
2008 1,4 0,7 2,1 2,2 – 0,5 1,2 – 1,4 – 1,8 – 0,5 4,5 1,4 0,2
2009 0,1 2,6 – 2,5 – 2,7 0,4 0,6 – 2,4 0,5 – 2,9 – 1,4 2,3 1,9
2010 0,6 0,3 – 1,6 – 1,7 1,2 – 0,1 – 1,6 0,3 0,3 4,3 1,5 0,5
2011 1,4 3,2 1,8 2,0 1,9 1,6 1,4 – 0,3 0,3 4,8 – 0,1 – 0,5
2008 1.Vj 1,7 1,9 2,3 2,6 – 0,4 1,8 0,3 – 2,0 – 0,3 5,0 1,0 0,72.Vj 1,5 0,0 2,3 2,6 – 0,7 1,3 – 0,4 – 2,1 0,8 4,7 1,2 0,13.Vj 1,5 – 0,3 2,2 2,3 – 0,6 0,9 – 1,5 – 1,4 0,5 4,7 1,4 0,34.Vj 1,1 – 0,3 1,4 1,5 – 0,4 0,9 – 3,6 – 1,1 – 2,8 3,4 1,8 0,0
2009 1.Vj 0,6 0,7 – 0,2 – 0,3 – 0,4 0,9 – 1,8 – 0,3 – 4,4 0,0 2,1 1,42.Vj 0,2 4,3 – 2,0 – 2,2 0,4 1,0 – 2,7 0,5 – 3,9 – 2,0 2,3 2,03.Vj – 0,2 3,8 – 3,8 – 4,0 0,8 0,7 – 3,0 0,8 – 3,1 – 2,2 2,5 1,94.Vj – 0,3 2,4 – 3,9 – 4,2 0,8 – 0,1 – 2,3 0,7 0,3 – 1,2 2,3 2,2
2010 1.Vj – 0,3 0,7 – 3,8 – 4,0 0,1 – 0,8 – 1,8 0,6 1,4 1,1 2,0 1,32.Vj 0,5 0,0 – 2,3 – 2,4 1,3 – 0,4 – 1,8 0,3 0,3 4,7 1,8 0,93.Vj 1,0 0,3 – 0,7 – 0,7 1,7 0,1 – 1,5 0,2 – 0,5 5,8 1,3 0,34.Vj 1,2 0,0 0,2 0,3 1,8 0,9 – 1,0 0,1 – 0,5 5,7 0,9 – 0,5
2011 1.Vj 1,5 3,0 1,4 1,5 3,1 1,4 0,0 0,0 0,0 6,3 0,3 – 0,72.Vj 1,4 5,0 1,9 2,0 2,1 1,6 1,2 – 0,1 0,5 4,9 – 0,2 – 0,83.Vj 1,4 2,7 2,2 2,3 1,3 1,7 1,8 – 0,4 0,8 4,1 – 0,2 – 0,74.Vj 1,4 2,7 2,0 2,1 1,3 1,7 2,5 – 0,4 0,8 3,9 – 0,2 0,1
2012 1.Vj 1,4 2,5 1,8 2,0 1,7 1,8 2,5 – 0,1 1,3 2,8 0,4 0,52.Vj 1,2 0,6 1,4 1,5 1,1 1,2 2,4 – 0,1 1,3 2,1 0,9 0,43.Vj 1,0 0,6 0,9 1,1 0,8 0,7 2,7 – 0,1 1,1 1,3 1,3 0,2
Finanz-und
Versiche-rungs-dienst-leister
Grund-stücks-
undWohnungs-
wesen
Unter-nehmens-
dienst-leister
ÖffentlicheDienst-leister,
Erziehung,Gesund-
heit
SonstigeDienst-leister
Veränderung gegenüber dem entsprechenden Vorjahreszeitraum in %
Jahr,Vierteljahr
Insgesamt
Handel,Verkehr,
Gast-gewerbe
Informa-tion und
Kommuni-kation
Bau-gewerbe
Prod. Gewerbeohne BaugewerbeLand- und
Forst-wirtschaft,Fischerei
Statistisches Bundesamt, Fachserie 18, Reihe 1.2, 3.Vj 2012
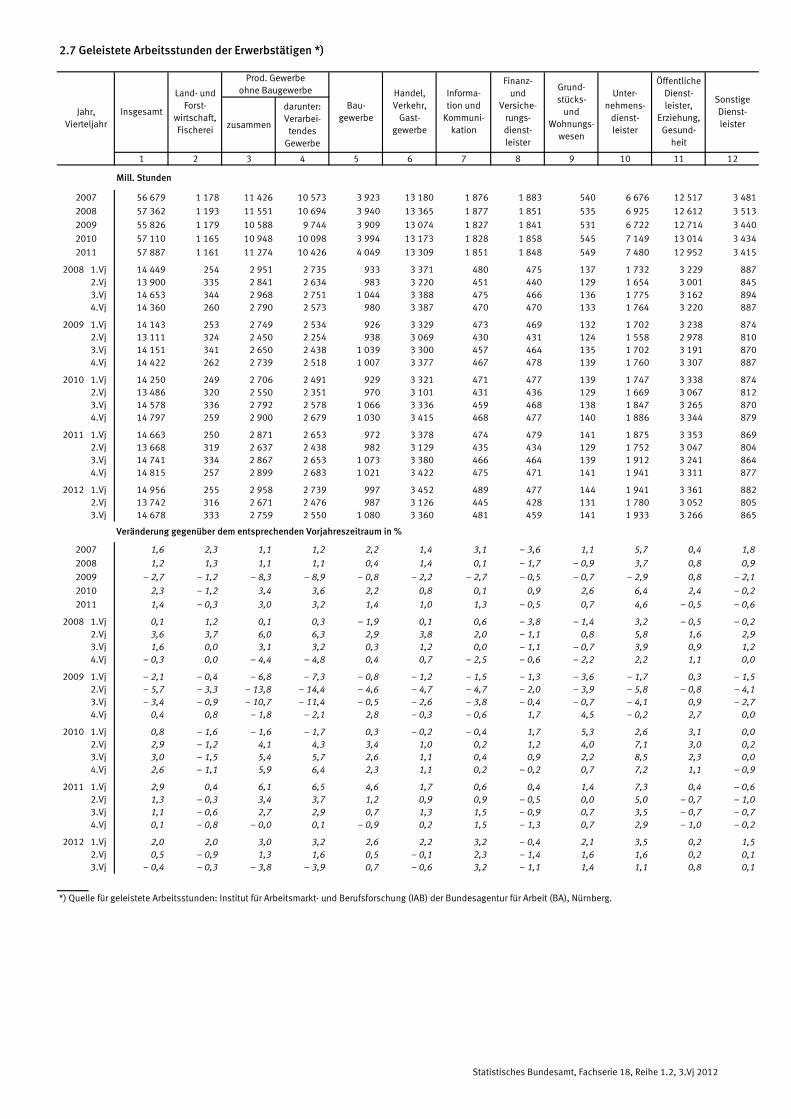
2.7 Geleistete Arbeitsstunden der Erwerbstätigen *)
zusammen
darunter:Verarbei-
tendesGewerbe
1 2 3 4 5 6 7 8 9 10 11 12
Mill. Stunden
2007 56 679 1 178 11 426 10 573 3 923 13 180 1 876 1 883 540 6 676 12 517 3 481
2008 57 362 1 193 11 551 10 694 3 940 13 365 1 877 1 851 535 6 925 12 612 3 513
2009 55 826 1 179 10 588 9 744 3 909 13 074 1 827 1 841 531 6 722 12 714 3 440
2010 57 110 1 165 10 948 10 098 3 994 13 173 1 828 1 858 545 7 149 13 014 3 434
2011 57 887 1 161 11 274 10 426 4 049 13 309 1 851 1 848 549 7 480 12 952 3 415
2008 1.Vj 14 449 254 2 951 2 735 933 3 371 480 475 137 1 732 3 229 8872.Vj 13 900 335 2 841 2 634 983 3 220 451 440 129 1 654 3 001 8453.Vj 14 653 344 2 968 2 751 1 044 3 388 475 466 136 1 775 3 162 8944.Vj 14 360 260 2 790 2 573 980 3 387 470 470 133 1 764 3 220 887
2009 1.Vj 14 143 253 2 749 2 534 926 3 329 473 469 132 1 702 3 238 8742.Vj 13 111 324 2 450 2 254 938 3 069 430 431 124 1 558 2 978 8103.Vj 14 151 341 2 650 2 438 1 039 3 300 457 464 135 1 702 3 191 8704.Vj 14 422 262 2 739 2 518 1 007 3 377 467 478 139 1 760 3 307 887
2010 1.Vj 14 250 249 2 706 2 491 929 3 321 471 477 139 1 747 3 338 8742.Vj 13 486 320 2 550 2 351 970 3 101 431 436 129 1 669 3 067 8123.Vj 14 578 336 2 792 2 578 1 066 3 336 459 468 138 1 847 3 265 8704.Vj 14 797 259 2 900 2 679 1 030 3 415 468 477 140 1 886 3 344 879
2011 1.Vj 14 663 250 2 871 2 653 972 3 378 474 479 141 1 875 3 353 8692.Vj 13 668 319 2 637 2 438 982 3 129 435 434 129 1 752 3 047 8043.Vj 14 741 334 2 867 2 653 1 073 3 380 466 464 139 1 912 3 241 8644.Vj 14 815 257 2 899 2 683 1 021 3 422 475 471 141 1 941 3 311 877
2012 1.Vj 14 956 255 2 958 2 739 997 3 452 489 477 144 1 941 3 361 8822.Vj 13 742 316 2 671 2 476 987 3 126 445 428 131 1 780 3 052 8053.Vj 14 678 333 2 759 2 550 1 080 3 360 481 459 141 1 933 3 266 865
2007 1,6 2,3 1,1 1,2 2,2 1,4 3,1 – 3,6 1,1 5,7 0,4 1,8
2008 1,2 1,3 1,1 1,1 0,4 1,4 0,1 – 1,7 – 0,9 3,7 0,8 0,9
2009 – 2,7 – 1,2 – 8,3 – 8,9 – 0,8 – 2,2 – 2,7 – 0,5 – 0,7 – 2,9 0,8 – 2,1
2010 2,3 – 1,2 3,4 3,6 2,2 0,8 0,1 0,9 2,6 6,4 2,4 – 0,2
2011 1,4 – 0,3 3,0 3,2 1,4 1,0 1,3 – 0,5 0,7 4,6 – 0,5 – 0,6
2008 1.Vj 0,1 1,2 0,1 0,3 – 1,9 0,1 0,6 – 3,8 – 1,4 3,2 – 0,5 – 0,22.Vj 3,6 3,7 6,0 6,3 2,9 3,8 2,0 – 1,1 0,8 5,8 1,6 2,93.Vj 1,6 0,0 3,1 3,2 0,3 1,2 0,0 – 1,1 – 0,7 3,9 0,9 1,24.Vj – 0,3 0,0 – 4,4 – 4,8 0,4 0,7 – 2,5 – 0,6 – 2,2 2,2 1,1 0,0
2009 1.Vj – 2,1 – 0,4 – 6,8 – 7,3 – 0,8 – 1,2 – 1,5 – 1,3 – 3,6 – 1,7 0,3 – 1,52.Vj – 5,7 – 3,3 – 13,8 – 14,4 – 4,6 – 4,7 – 4,7 – 2,0 – 3,9 – 5,8 – 0,8 – 4,13.Vj – 3,4 – 0,9 – 10,7 – 11,4 – 0,5 – 2,6 – 3,8 – 0,4 – 0,7 – 4,1 0,9 – 2,74.Vj 0,4 0,8 – 1,8 – 2,1 2,8 – 0,3 – 0,6 1,7 4,5 – 0,2 2,7 0,0
2010 1.Vj 0,8 – 1,6 – 1,6 – 1,7 0,3 – 0,2 – 0,4 1,7 5,3 2,6 3,1 0,02.Vj 2,9 – 1,2 4,1 4,3 3,4 1,0 0,2 1,2 4,0 7,1 3,0 0,23.Vj 3,0 – 1,5 5,4 5,7 2,6 1,1 0,4 0,9 2,2 8,5 2,3 0,04.Vj 2,6 – 1,1 5,9 6,4 2,3 1,1 0,2 – 0,2 0,7 7,2 1,1 – 0,9
2011 1.Vj 2,9 0,4 6,1 6,5 4,6 1,7 0,6 0,4 1,4 7,3 0,4 – 0,62.Vj 1,3 – 0,3 3,4 3,7 1,2 0,9 0,9 – 0,5 0,0 5,0 – 0,7 – 1,03.Vj 1,1 – 0,6 2,7 2,9 0,7 1,3 1,5 – 0,9 0,7 3,5 – 0,7 – 0,74.Vj 0,1 – 0,8 – 0,0 0,1 – 0,9 0,2 1,5 – 1,3 0,7 2,9 – 1,0 – 0,2
2012 1.Vj 2,0 2,0 3,0 3,2 2,6 2,2 3,2 – 0,4 2,1 3,5 0,2 1,52.Vj 0,5 – 0,9 1,3 1,6 0,5 – 0,1 2,3 – 1,4 1,6 1,6 0,2 0,13.Vj – 0,4 – 0,3 – 3,8 – 3,9 0,7 – 0,6 3,2 – 1,1 1,4 1,1 0,8 0,1
*) Quelle für geleistete Arbeitsstunden: Institut für Arbeitsmarkt- und Berufsforschung (IAB) der Bundesagentur für Arbeit (BA), Nürnberg.
Unter-nehmens-
dienst-leister
ÖffentlicheDienst-leister,
Erziehung,Gesund-
heit
SonstigeDienst-leister
Finanz-und
Versiche-rungs-dienst-leister
Grund-stücks-
undWohnungs-
wesen
Jahr,Vierteljahr
Insgesamt
Handel,Verkehr,
Gast-gewerbe
Veränderung gegenüber dem entsprechenden Vorjahreszeitraum in %
Informa-tion und
Kommuni-kation
Prod. Gewerbeohne BaugewerbeLand- und
Forst-wirtschaft,Fischerei
Bau-gewerbe
Statistisches Bundesamt, Fachserie 18, Reihe 1.2, 3.Vj 2012

2.8 Geleistete Arbeitsstunden je Erwerbstätigen *)
zusammen
darunter:Verarbei-
tendesGewerbe
1 2 3 4 5 6 7 8 9 10 11 12
Stunden
2007 1 422,0 1 778,9 1 469,3 1 466,1 1 663,2 1 420,5 1 471,2 1 537,4 1 218,2 1 401,6 1 376,1 1 168,2
2008 1 421,7 1 788,8 1 457,3 1 452,7 1 679,5 1 428,2 1 491,7 1 540,2 1 212,9 1 398,9 1 369,8 1 173,8
2009 1 382,9 1 761,7 1 370,5 1 360,8 1 660,0 1 394,2 1 478,0 1 519,2 1 220,3 1 365,5 1 350,7 1 138,0
2010 1 406,6 1 757,6 1 439,8 1 434,0 1 676,0 1 407,4 1 500,0 1 532,0 1 238,5 1 392,3 1 362,3 1 132,3
2011 1 406,2 1 740,2 1 456,8 1 453,1 1 670,3 1 401,8 1 497,2 1 530,9 1 231,5 1 393,4 1 355,2 1 128,6
2008 1.Vj 362,1 402,6 375,7 374,7 408,7 363,6 381,3 394,9 310,8 357,7 353,1 298,3 2.Vj 345,3 476,4 360,1 359,5 421,5 345,0 357,0 368,3 290,9 336,3 327,2 281,8 3.Vj 361,7 501,7 371,8 371,0 438,5 361,1 376,7 388,6 305,8 353,9 345,0 298,3 4.Vj 352,6 402,7 350,3 347,9 410,7 358,3 375,6 387,7 305,4 351,4 344,4 295,1
2009 1.Vj 352,6 400,6 351,1 348,8 406,5 357,3 380,2 388,8 310,9 350,0 347,1 291,5 2.Vj 325,2 454,4 317,0 314,6 400,7 326,8 347,7 356,9 287,0 320,6 317,6 267,1 3.Vj 350,0 494,4 344,9 342,6 433,5 350,7 371,2 382,5 307,7 343,4 339,9 288,0 4.Vj 355,0 406,8 357,6 355,1 418,7 358,9 379,5 390,5 315,2 351,4 346,0 291,4
2010 1.Vj 356,0 398,9 359,0 356,9 406,9 359,7 384,0 393,4 318,0 353,3 351,0 289,3 2.Vj 332,9 455,2 337,5 335,9 408,6 332,1 353,4 361,2 293,9 328,1 321,5 266,4 3.Vj 357,3 492,2 365,8 364,5 437,6 354,7 378,1 386,4 311,5 352,9 343,3 287,3 4.Vj 360,3 407,1 377,8 376,6 421,2 360,3 383,8 391,5 315,1 357,2 346,7 289,7
2011 1.Vj 361,0 399,5 375,6 374,4 414,9 361,6 387,0 396,0 318,1 358,4 351,3 289,3 2.Vj 332,8 445,6 342,7 341,8 406,4 330,4 353,1 360,4 289,9 328,8 319,5 265,3 3.Vj 356,5 486,2 368,0 367,1 435,3 353,8 377,3 385,2 309,1 351,6 341,0 286,5 4.Vj 355,9 401,8 370,5 369,7 412,8 355,9 380,6 388,3 313,0 354,4 343,4 288,4
2012 1.Vj 363,3 405,0 380,3 379,4 419,0 364,1 389,1 395,9 321,1 361,0 350,6 291,9 2.Vj 331,0 442,6 342,7 342,2 403,1 327,3 352,1 357,2 290,1 327,6 317,3 264,5 3.Vj 351,9 486,0 350,9 349,2 433,0 350,6 378,0 383,1 311,0 350,9 339,4 286,1
2007 – 0,1 – 1,1 – 0,2 – 0,2 0,7 – 0,1 1,0 – 1,4 1,1 0,3 – 0,6 – 0,1
2008 – 0,0 0,6 – 0,8 – 0,9 1,0 0,5 1,4 0,2 – 0,4 – 0,2 – 0,5 0,5
2009 – 2,7 – 1,5 – 6,0 – 6,3 – 1,2 – 2,4 – 0,9 – 1,4 0,6 – 2,4 – 1,4 – 3,0
2010 1,7 – 0,2 5,1 5,4 1,0 0,9 1,5 0,8 1,5 2,0 0,9 – 0,5
2011 – 0,0 – 1,0 1,2 1,3 – 0,3 – 0,4 – 0,2 – 0,1 – 0,6 0,1 – 0,5 – 0,3
2008 1.Vj – 1,4 – 1,1 – 2,0 – 2,1 – 1,3 – 1,4 0,8 – 1,4 – 1,4 – 1,1 – 1,4 – 1,1 2.Vj 2,3 3,0 3,7 3,8 3,9 2,8 2,7 1,2 0,2 1,7 0,6 2,5 3.Vj 0,4 0,1 1,0 1,0 1,0 0,6 1,3 0,4 – 0,6 – 0,1 – 0,3 0,6 4.Vj – 1,3 0,5 – 5,6 – 6,0 0,7 0,1 0,5 0,1 – 0,4 – 0,8 – 0,5 – 0,0
2009 1.Vj – 2,6 – 0,5 – 6,5 – 6,9 – 0,5 – 1,7 – 0,3 – 1,5 0,0 – 2,2 – 1,7 – 2,3 2.Vj – 5,8 – 4,6 – 12,0 – 12,5 – 4,9 – 5,3 – 2,6 – 3,1 – 1,3 – 4,7 – 2,9 – 5,2 3.Vj – 3,2 – 1,5 – 7,2 – 7,7 – 1,1 – 2,9 – 1,5 – 1,6 0,6 – 3,0 – 1,5 – 3,5 4.Vj 0,7 1,0 2,1 2,1 1,9 0,2 1,0 0,7 3,2 0,0 0,5 – 1,3
2010 1.Vj 1,0 – 0,4 2,3 2,3 0,1 0,7 1,0 1,2 2,3 0,9 1,1 – 0,8 2.Vj 2,4 0,2 6,5 6,8 2,0 1,6 1,6 1,2 2,4 2,3 1,2 – 0,3 3.Vj 2,1 – 0,4 6,1 6,4 0,9 1,1 1,9 1,0 1,2 2,8 1,0 – 0,2 4.Vj 1,5 0,1 5,6 6,1 0,6 0,4 1,1 0,3 – 0,0 1,7 0,2 – 0,6
2011 1.Vj 1,4 0,2 4,6 4,9 2,0 0,5 0,8 0,7 0,0 1,4 0,1 0,0 2.Vj – 0,0 – 2,1 1,5 1,8 – 0,5 – 0,5 – 0,1 – 0,2 – 1,4 0,2 – 0,6 – 0,4 3.Vj – 0,2 – 1,2 0,6 0,7 – 0,5 – 0,3 – 0,2 – 0,3 – 0,8 – 0,4 – 0,7 – 0,3 4.Vj – 1,2 – 1,3 – 1,9 – 1,8 – 2,0 – 1,2 – 0,8 – 0,8 – 0,7 – 0,8 – 1,0 – 0,4
2012 1.Vj 0,6 1,4 1,3 1,3 1,0 0,7 0,5 – 0,0 0,9 0,7 – 0,2 0,9 2.Vj – 0,5 – 0,7 0,0 0,1 – 0,8 – 0,9 – 0,3 – 0,9 0,1 – 0,4 – 0,7 – 0,3 3.Vj – 1,3 – 0,0 – 4,6 – 4,9 – 0,5 – 0,9 0,2 – 0,5 0,6 – 0,2 – 0,5 – 0,1
*) Quelle für geleistete Arbeitsstunden: Institut für Arbeitsmarkt- und Berufsforschung (IAB) der Bundesagentur für Arbeit (BA), Nürnberg.
Jahr,Vierteljahr
Insgesamt
Handel,Verkehr,
Gast-gewerbe
Veränderung gegenüber dem entsprechenden Vorjahreszeitraum in %
Informa-tion und
Kommuni-kation
Prod. Gewerbeohne BaugewerbeLand- und
Forst-wirtschaft,Fischerei
Bau-gewerbe
Unter-nehmens-
dienst-leister
ÖffentlicheDienst-leister,
Erziehung,Gesund-
heit
SonstigeDienst-leister
Finanz-und
Versiche-rungs-dienst-leister
Grund-stücks-
undWohnungs-
wesen
Statistisches Bundesamt, Fachserie 18, Reihe 1.2, 3.Vj 2012
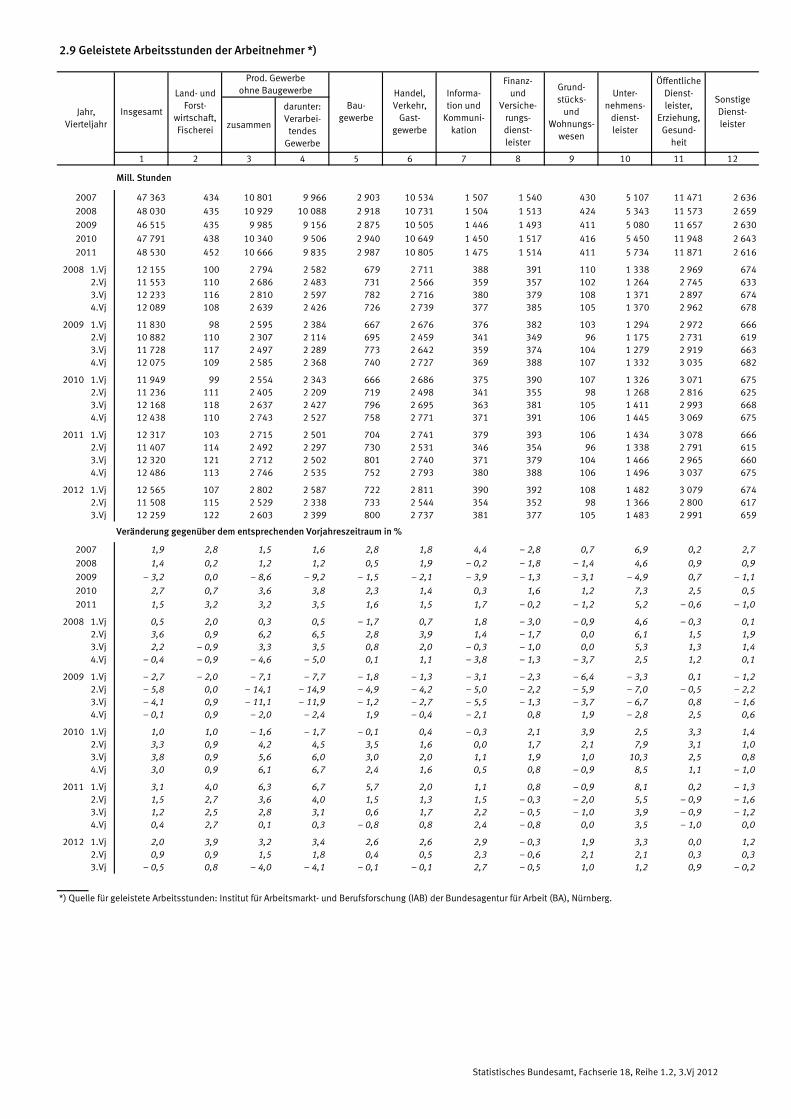
2.9 Geleistete Arbeitsstunden der Arbeitnehmer *)
zusammen
darunter:Verarbei-
tendesGewerbe
1 2 3 4 5 6 7 8 9 10 11 12
Mill. Stunden
2007 47 363 434 10 801 9 966 2 903 10 534 1 507 1 540 430 5 107 11 471 2 636
2008 48 030 435 10 929 10 088 2 918 10 731 1 504 1 513 424 5 343 11 573 2 659
2009 46 515 435 9 985 9 156 2 875 10 505 1 446 1 493 411 5 080 11 657 2 630
2010 47 791 438 10 340 9 506 2 940 10 649 1 450 1 517 416 5 450 11 948 2 643
2011 48 530 452 10 666 9 835 2 987 10 805 1 475 1 514 411 5 734 11 871 2 616
2008 1.Vj 12 155 100 2 794 2 582 679 2 711 388 391 110 1 338 2 969 6742.Vj 11 553 110 2 686 2 483 731 2 566 359 357 102 1 264 2 745 6333.Vj 12 233 116 2 810 2 597 782 2 716 380 379 108 1 371 2 897 6744.Vj 12 089 108 2 639 2 426 726 2 739 377 385 105 1 370 2 962 678
2009 1.Vj 11 830 98 2 595 2 384 667 2 676 376 382 103 1 294 2 972 6662.Vj 10 882 110 2 307 2 114 695 2 459 341 349 96 1 175 2 731 6193.Vj 11 728 117 2 497 2 289 773 2 642 359 374 104 1 279 2 919 6634.Vj 12 075 109 2 585 2 368 740 2 727 369 388 107 1 332 3 035 682
2010 1.Vj 11 949 99 2 554 2 343 666 2 686 375 390 107 1 326 3 071 6752.Vj 11 236 111 2 405 2 209 719 2 498 341 355 98 1 268 2 816 6253.Vj 12 168 118 2 637 2 427 796 2 695 363 381 105 1 411 2 993 6684.Vj 12 438 110 2 743 2 527 758 2 771 371 391 106 1 445 3 069 675
2011 1.Vj 12 317 103 2 715 2 501 704 2 741 379 393 106 1 434 3 078 6662.Vj 11 407 114 2 492 2 297 730 2 531 346 354 96 1 338 2 791 6153.Vj 12 320 121 2 712 2 502 801 2 740 371 379 104 1 466 2 965 6604.Vj 12 486 113 2 746 2 535 752 2 793 380 388 106 1 496 3 037 675
2012 1.Vj 12 565 107 2 802 2 587 722 2 811 390 392 108 1 482 3 079 6742.Vj 11 508 115 2 529 2 338 733 2 544 354 352 98 1 366 2 800 6173.Vj 12 259 122 2 603 2 399 800 2 737 381 377 105 1 483 2 991 659
2007 1,9 2,8 1,5 1,6 2,8 1,8 4,4 – 2,8 0,7 6,9 0,2 2,7
2008 1,4 0,2 1,2 1,2 0,5 1,9 – 0,2 – 1,8 – 1,4 4,6 0,9 0,9
2009 – 3,2 0,0 – 8,6 – 9,2 – 1,5 – 2,1 – 3,9 – 1,3 – 3,1 – 4,9 0,7 – 1,1
2010 2,7 0,7 3,6 3,8 2,3 1,4 0,3 1,6 1,2 7,3 2,5 0,5
2011 1,5 3,2 3,2 3,5 1,6 1,5 1,7 – 0,2 – 1,2 5,2 – 0,6 – 1,0
2008 1.Vj 0,5 2,0 0,3 0,5 – 1,7 0,7 1,8 – 3,0 – 0,9 4,6 – 0,3 0,12.Vj 3,6 0,9 6,2 6,5 2,8 3,9 1,4 – 1,7 0,0 6,1 1,5 1,93.Vj 2,2 – 0,9 3,3 3,5 0,8 2,0 – 0,3 – 1,0 0,0 5,3 1,3 1,44.Vj – 0,4 – 0,9 – 4,6 – 5,0 0,1 1,1 – 3,8 – 1,3 – 3,7 2,5 1,2 0,1
2009 1.Vj – 2,7 – 2,0 – 7,1 – 7,7 – 1,8 – 1,3 – 3,1 – 2,3 – 6,4 – 3,3 0,1 – 1,22.Vj – 5,8 0,0 – 14,1 – 14,9 – 4,9 – 4,2 – 5,0 – 2,2 – 5,9 – 7,0 – 0,5 – 2,23.Vj – 4,1 0,9 – 11,1 – 11,9 – 1,2 – 2,7 – 5,5 – 1,3 – 3,7 – 6,7 0,8 – 1,64.Vj – 0,1 0,9 – 2,0 – 2,4 1,9 – 0,4 – 2,1 0,8 1,9 – 2,8 2,5 0,6
2010 1.Vj 1,0 1,0 – 1,6 – 1,7 – 0,1 0,4 – 0,3 2,1 3,9 2,5 3,3 1,42.Vj 3,3 0,9 4,2 4,5 3,5 1,6 0,0 1,7 2,1 7,9 3,1 1,03.Vj 3,8 0,9 5,6 6,0 3,0 2,0 1,1 1,9 1,0 10,3 2,5 0,84.Vj 3,0 0,9 6,1 6,7 2,4 1,6 0,5 0,8 – 0,9 8,5 1,1 – 1,0
2011 1.Vj 3,1 4,0 6,3 6,7 5,7 2,0 1,1 0,8 – 0,9 8,1 0,2 – 1,32.Vj 1,5 2,7 3,6 4,0 1,5 1,3 1,5 – 0,3 – 2,0 5,5 – 0,9 – 1,63.Vj 1,2 2,5 2,8 3,1 0,6 1,7 2,2 – 0,5 – 1,0 3,9 – 0,9 – 1,24.Vj 0,4 2,7 0,1 0,3 – 0,8 0,8 2,4 – 0,8 0,0 3,5 – 1,0 0,0
2012 1.Vj 2,0 3,9 3,2 3,4 2,6 2,6 2,9 – 0,3 1,9 3,3 0,0 1,22.Vj 0,9 0,9 1,5 1,8 0,4 0,5 2,3 – 0,6 2,1 2,1 0,3 0,33.Vj – 0,5 0,8 – 4,0 – 4,1 – 0,1 – 0,1 2,7 – 0,5 1,0 1,2 0,9 – 0,2
*) Quelle für geleistete Arbeitsstunden: Institut für Arbeitsmarkt- und Berufsforschung (IAB) der Bundesagentur für Arbeit (BA), Nürnberg.
Jahr,Vierteljahr
Insgesamt
Handel,Verkehr,
Gast-gewerbe
Veränderung gegenüber dem entsprechenden Vorjahreszeitraum in %
Informa-tion und
Kommuni-kation
Prod. Gewerbeohne BaugewerbeLand- und
Forst-wirtschaft,Fischerei
Bau-gewerbe
Unter-nehmens-
dienst-leister
ÖffentlicheDienst-leister,
Erziehung,Gesund-
heit
SonstigeDienst-leister
Finanz-und
Versiche-rungs-dienst-leister
Grund-stücks-
undWohnungs-
wesen
Statistisches Bundesamt, Fachserie 18, Reihe 1.2, 3.Vj 2012
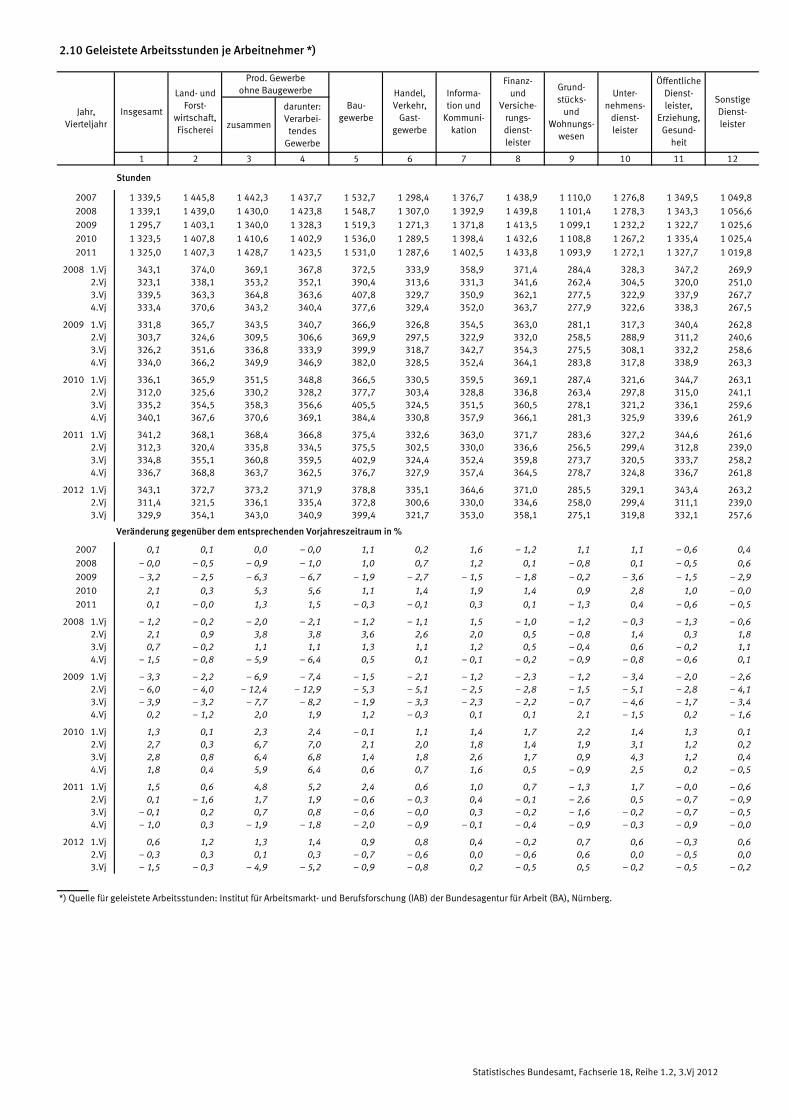
2.10 Geleistete Arbeitsstunden je Arbeitnehmer *)
zusammen
darunter:Verarbei-
tendesGewerbe
1 2 3 4 5 6 7 8 9 10 11 12
Stunden
2007 1 339,5 1 445,8 1 442,3 1 437,7 1 532,7 1 298,4 1 376,7 1 438,9 1 110,0 1 276,8 1 349,5 1 049,8
2008 1 339,1 1 439,0 1 430,0 1 423,8 1 548,7 1 307,0 1 392,9 1 439,8 1 101,4 1 278,3 1 343,3 1 056,6
2009 1 295,7 1 403,1 1 340,0 1 328,3 1 519,3 1 271,3 1 371,8 1 413,5 1 099,1 1 232,2 1 322,7 1 025,6
2010 1 323,5 1 407,8 1 410,6 1 402,9 1 536,0 1 289,5 1 398,4 1 432,6 1 108,8 1 267,2 1 335,4 1 025,4
2011 1 325,0 1 407,3 1 428,7 1 423,5 1 531,0 1 287,6 1 402,5 1 433,8 1 093,9 1 272,1 1 327,7 1 019,8
2008 1.Vj 343,1 374,0 369,1 367,8 372,5 333,9 358,9 371,4 284,4 328,3 347,2 269,9 2.Vj 323,1 338,1 353,2 352,1 390,4 313,6 331,3 341,6 262,4 304,5 320,0 251,0 3.Vj 339,5 363,3 364,8 363,6 407,8 329,7 350,9 362,1 277,5 322,9 337,9 267,7 4.Vj 333,4 370,6 343,2 340,4 377,6 329,4 352,0 363,7 277,9 322,6 338,3 267,5
2009 1.Vj 331,8 365,7 343,5 340,7 366,9 326,8 354,5 363,0 281,1 317,3 340,4 262,8 2.Vj 303,7 324,6 309,5 306,6 369,9 297,5 322,9 332,0 258,5 288,9 311,2 240,6 3.Vj 326,2 351,6 336,8 333,9 399,9 318,7 342,7 354,3 275,5 308,1 332,2 258,6 4.Vj 334,0 366,2 349,9 346,9 382,0 328,5 352,4 364,1 283,8 317,8 338,9 263,3
2010 1.Vj 336,1 365,9 351,5 348,8 366,5 330,5 359,5 369,1 287,4 321,6 344,7 263,1 2.Vj 312,0 325,6 330,2 328,2 377,7 303,4 328,8 336,8 263,4 297,8 315,0 241,1 3.Vj 335,2 354,5 358,3 356,6 405,5 324,5 351,5 360,5 278,1 321,2 336,1 259,6 4.Vj 340,1 367,6 370,6 369,1 384,4 330,8 357,9 366,1 281,3 325,9 339,6 261,9
2011 1.Vj 341,2 368,1 368,4 366,8 375,4 332,6 363,0 371,7 283,6 327,2 344,6 261,6 2.Vj 312,3 320,4 335,8 334,5 375,5 302,5 330,0 336,6 256,5 299,4 312,8 239,0 3.Vj 334,8 355,1 360,8 359,5 402,9 324,4 352,4 359,8 273,7 320,5 333,7 258,2 4.Vj 336,7 368,8 363,7 362,5 376,7 327,9 357,4 364,5 278,7 324,8 336,7 261,8
2012 1.Vj 343,1 372,7 373,2 371,9 378,8 335,1 364,6 371,0 285,5 329,1 343,4 263,2 2.Vj 311,4 321,5 336,1 335,4 372,8 300,6 330,0 334,6 258,0 299,4 311,1 239,0 3.Vj 329,9 354,1 343,0 340,9 399,4 321,7 353,0 358,1 275,1 319,8 332,1 257,6
2007 0,1 0,1 0,0 – 0,0 1,1 0,2 1,6 – 1,2 1,1 1,1 – 0,6 0,4
2008 – 0,0 – 0,5 – 0,9 – 1,0 1,0 0,7 1,2 0,1 – 0,8 0,1 – 0,5 0,6
2009 – 3,2 – 2,5 – 6,3 – 6,7 – 1,9 – 2,7 – 1,5 – 1,8 – 0,2 – 3,6 – 1,5 – 2,9
2010 2,1 0,3 5,3 5,6 1,1 1,4 1,9 1,4 0,9 2,8 1,0 – 0,0
2011 0,1 – 0,0 1,3 1,5 – 0,3 – 0,1 0,3 0,1 – 1,3 0,4 – 0,6 – 0,5
2008 1.Vj – 1,2 – 0,2 – 2,0 – 2,1 – 1,2 – 1,1 1,5 – 1,0 – 1,2 – 0,3 – 1,3 – 0,6 2.Vj 2,1 0,9 3,8 3,8 3,6 2,6 2,0 0,5 – 0,8 1,4 0,3 1,8 3.Vj 0,7 – 0,2 1,1 1,1 1,3 1,1 1,2 0,5 – 0,4 0,6 – 0,2 1,1 4.Vj – 1,5 – 0,8 – 5,9 – 6,4 0,5 0,1 – 0,1 – 0,2 – 0,9 – 0,8 – 0,6 0,1
2009 1.Vj – 3,3 – 2,2 – 6,9 – 7,4 – 1,5 – 2,1 – 1,2 – 2,3 – 1,2 – 3,4 – 2,0 – 2,6 2.Vj – 6,0 – 4,0 – 12,4 – 12,9 – 5,3 – 5,1 – 2,5 – 2,8 – 1,5 – 5,1 – 2,8 – 4,1 3.Vj – 3,9 – 3,2 – 7,7 – 8,2 – 1,9 – 3,3 – 2,3 – 2,2 – 0,7 – 4,6 – 1,7 – 3,4 4.Vj 0,2 – 1,2 2,0 1,9 1,2 – 0,3 0,1 0,1 2,1 – 1,5 0,2 – 1,6
2010 1.Vj 1,3 0,1 2,3 2,4 – 0,1 1,1 1,4 1,7 2,2 1,4 1,3 0,1 2.Vj 2,7 0,3 6,7 7,0 2,1 2,0 1,8 1,4 1,9 3,1 1,2 0,2 3.Vj 2,8 0,8 6,4 6,8 1,4 1,8 2,6 1,7 0,9 4,3 1,2 0,4 4.Vj 1,8 0,4 5,9 6,4 0,6 0,7 1,6 0,5 – 0,9 2,5 0,2 – 0,5
2011 1.Vj 1,5 0,6 4,8 5,2 2,4 0,6 1,0 0,7 – 1,3 1,7 – 0,0 – 0,6 2.Vj 0,1 – 1,6 1,7 1,9 – 0,6 – 0,3 0,4 – 0,1 – 2,6 0,5 – 0,7 – 0,9 3.Vj – 0,1 0,2 0,7 0,8 – 0,6 – 0,0 0,3 – 0,2 – 1,6 – 0,2 – 0,7 – 0,5 4.Vj – 1,0 0,3 – 1,9 – 1,8 – 2,0 – 0,9 – 0,1 – 0,4 – 0,9 – 0,3 – 0,9 – 0,0
2012 1.Vj 0,6 1,2 1,3 1,4 0,9 0,8 0,4 – 0,2 0,7 0,6 – 0,3 0,6 2.Vj – 0,3 0,3 0,1 0,3 – 0,7 – 0,6 0,0 – 0,6 0,6 0,0 – 0,5 0,0 3.Vj – 1,5 – 0,3 – 4,9 – 5,2 – 0,9 – 0,8 0,2 – 0,5 0,5 – 0,2 – 0,5 – 0,2
*) Quelle für geleistete Arbeitsstunden: Institut für Arbeitsmarkt- und Berufsforschung (IAB) der Bundesagentur für Arbeit (BA), Nürnberg.
Unter-nehmens-
dienst-leister
ÖffentlicheDienst-leister,
Erziehung,Gesund-
heit
SonstigeDienst-leister
Finanz-und
Versiche-rungs-dienst-leister
Grund-stücks-
undWohnungs-
wesen
Jahr,Vierteljahr
Insgesamt
Handel,Verkehr,
Gast-gewerbe
Veränderung gegenüber dem entsprechenden Vorjahreszeitraum in %
Informa-tion und
Kommuni-kation
Prod. Gewerbeohne BaugewerbeLand- und
Forst-wirtschaft,Fischerei
Bau-gewerbe
Statistisches Bundesamt, Fachserie 18, Reihe 1.2, 3.Vj 2012
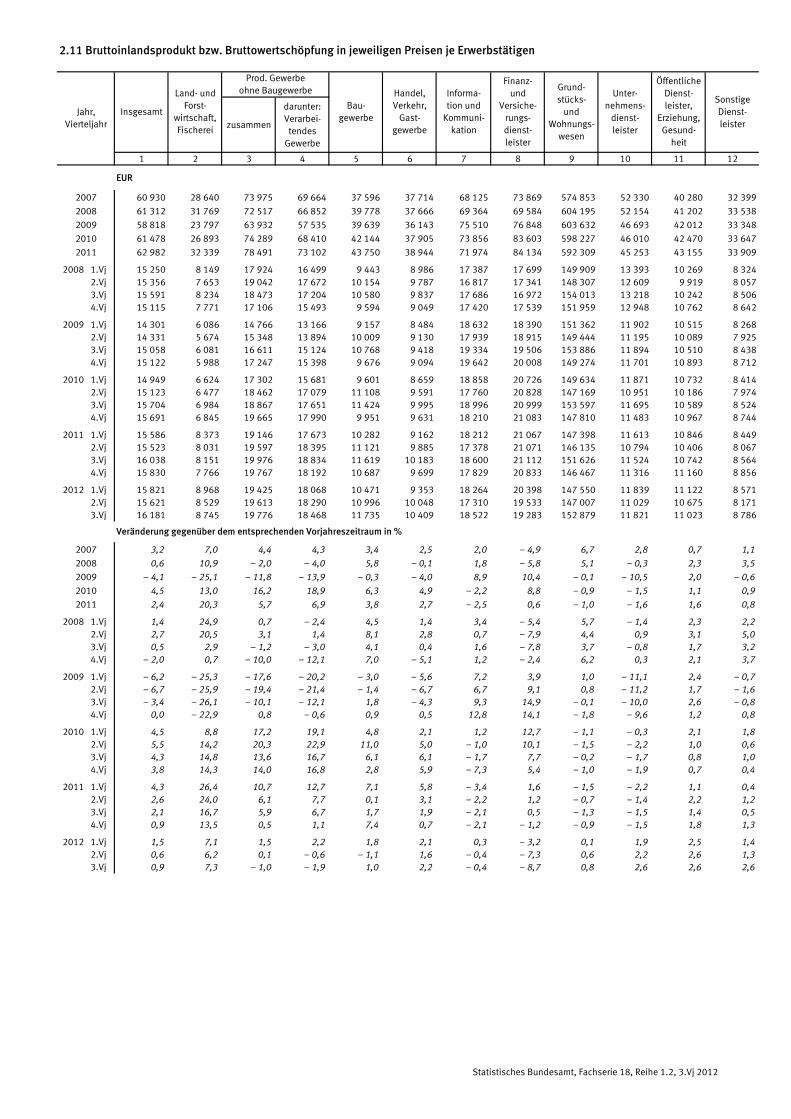
2.11 Bruttoinlandsprodukt bzw. Bruttowertschöpfung in jeweiligen Preisen je Erwerbstätigen
zusammen
darunter:Verarbei-
tendesGewerbe
1 2 3 4 5 6 7 8 9 10 11 12
EUR
2007 60 930 28 640 73 975 69 664 37 596 37 714 68 125 73 869 574 853 52 330 40 280 32 399
2008 61 312 31 769 72 517 66 852 39 778 37 666 69 364 69 584 604 195 52 154 41 202 33 538
2009 58 818 23 797 63 932 57 535 39 639 36 143 75 510 76 848 603 632 46 693 42 012 33 348
2010 61 478 26 893 74 289 68 410 42 144 37 905 73 856 83 603 598 227 46 010 42 470 33 647
2011 62 982 32 339 78 491 73 102 43 750 38 944 71 974 84 134 592 309 45 253 43 155 33 909
2008 1.Vj 15 250 8 149 17 924 16 499 9 443 8 986 17 387 17 699 149 909 13 393 10 269 8 3242.Vj 15 356 7 653 19 042 17 672 10 154 9 787 16 817 17 341 148 307 12 609 9 919 8 0573.Vj 15 591 8 234 18 473 17 204 10 580 9 837 17 686 16 972 154 013 13 218 10 242 8 5064.Vj 15 115 7 771 17 106 15 493 9 594 9 049 17 420 17 539 151 959 12 948 10 762 8 642
2009 1.Vj 14 301 6 086 14 766 13 166 9 157 8 484 18 632 18 390 151 362 11 902 10 515 8 2682.Vj 14 331 5 674 15 348 13 894 10 009 9 130 17 939 18 915 149 444 11 195 10 089 7 9253.Vj 15 058 6 081 16 611 15 124 10 768 9 418 19 334 19 506 153 886 11 894 10 510 8 4384.Vj 15 122 5 988 17 247 15 398 9 676 9 094 19 642 20 008 149 274 11 701 10 893 8 712
2010 1.Vj 14 949 6 624 17 302 15 681 9 601 8 659 18 858 20 726 149 634 11 871 10 732 8 4142.Vj 15 123 6 477 18 462 17 079 11 108 9 591 17 760 20 828 147 169 10 951 10 186 7 9743.Vj 15 704 6 984 18 867 17 651 11 424 9 995 18 996 20 999 153 597 11 695 10 589 8 5244.Vj 15 691 6 845 19 665 17 990 9 951 9 631 18 210 21 083 147 810 11 483 10 967 8 744
2011 1.Vj 15 586 8 373 19 146 17 673 10 282 9 162 18 212 21 067 147 398 11 613 10 846 8 4492.Vj 15 523 8 031 19 597 18 395 11 121 9 885 17 378 21 071 146 135 10 794 10 406 8 0673.Vj 16 038 8 151 19 976 18 834 11 619 10 183 18 600 21 112 151 626 11 524 10 742 8 5644.Vj 15 830 7 766 19 767 18 192 10 687 9 699 17 829 20 833 146 467 11 316 11 160 8 856
2012 1.Vj 15 821 8 968 19 425 18 068 10 471 9 353 18 264 20 398 147 550 11 839 11 122 8 5712.Vj 15 621 8 529 19 613 18 290 10 996 10 048 17 310 19 533 147 007 11 029 10 675 8 1713.Vj 16 181 8 745 19 776 18 468 11 735 10 409 18 522 19 283 152 879 11 821 11 023 8 786
2007 3,2 7,0 4,4 4,3 3,4 2,5 2,0 – 4,9 6,7 2,8 0,7 1,1
2008 0,6 10,9 – 2,0 – 4,0 5,8 – 0,1 1,8 – 5,8 5,1 – 0,3 2,3 3,5
2009 – 4,1 – 25,1 – 11,8 – 13,9 – 0,3 – 4,0 8,9 10,4 – 0,1 – 10,5 2,0 – 0,6
2010 4,5 13,0 16,2 18,9 6,3 4,9 – 2,2 8,8 – 0,9 – 1,5 1,1 0,9
2011 2,4 20,3 5,7 6,9 3,8 2,7 – 2,5 0,6 – 1,0 – 1,6 1,6 0,8
2008 1.Vj 1,4 24,9 0,7 – 2,4 4,5 1,4 3,4 – 5,4 5,7 – 1,4 2,3 2,22.Vj 2,7 20,5 3,1 1,4 8,1 2,8 0,7 – 7,9 4,4 0,9 3,1 5,03.Vj 0,5 2,9 – 1,2 – 3,0 4,1 0,4 1,6 – 7,8 3,7 – 0,8 1,7 3,24.Vj – 2,0 0,7 – 10,0 – 12,1 7,0 – 5,1 1,2 – 2,4 6,2 0,3 2,1 3,7
2009 1.Vj – 6,2 – 25,3 – 17,6 – 20,2 – 3,0 – 5,6 7,2 3,9 1,0 – 11,1 2,4 – 0,72.Vj – 6,7 – 25,9 – 19,4 – 21,4 – 1,4 – 6,7 6,7 9,1 0,8 – 11,2 1,7 – 1,63.Vj – 3,4 – 26,1 – 10,1 – 12,1 1,8 – 4,3 9,3 14,9 – 0,1 – 10,0 2,6 – 0,84.Vj 0,0 – 22,9 0,8 – 0,6 0,9 0,5 12,8 14,1 – 1,8 – 9,6 1,2 0,8
2010 1.Vj 4,5 8,8 17,2 19,1 4,8 2,1 1,2 12,7 – 1,1 – 0,3 2,1 1,82.Vj 5,5 14,2 20,3 22,9 11,0 5,0 – 1,0 10,1 – 1,5 – 2,2 1,0 0,63.Vj 4,3 14,8 13,6 16,7 6,1 6,1 – 1,7 7,7 – 0,2 – 1,7 0,8 1,04.Vj 3,8 14,3 14,0 16,8 2,8 5,9 – 7,3 5,4 – 1,0 – 1,9 0,7 0,4
2011 1.Vj 4,3 26,4 10,7 12,7 7,1 5,8 – 3,4 1,6 – 1,5 – 2,2 1,1 0,42.Vj 2,6 24,0 6,1 7,7 0,1 3,1 – 2,2 1,2 – 0,7 – 1,4 2,2 1,23.Vj 2,1 16,7 5,9 6,7 1,7 1,9 – 2,1 0,5 – 1,3 – 1,5 1,4 0,54.Vj 0,9 13,5 0,5 1,1 7,4 0,7 – 2,1 – 1,2 – 0,9 – 1,5 1,8 1,3
2012 1.Vj 1,5 7,1 1,5 2,2 1,8 2,1 0,3 – 3,2 0,1 1,9 2,5 1,42.Vj 0,6 6,2 0,1 – 0,6 – 1,1 1,6 – 0,4 – 7,3 0,6 2,2 2,6 1,33.Vj 0,9 7,3 – 1,0 – 1,9 1,0 2,2 – 0,4 – 8,7 0,8 2,6 2,6 2,6
Unter-nehmens-
dienst-leister
ÖffentlicheDienst-leister,
Erziehung,Gesund-
heit
SonstigeDienst-leister
Finanz-und
Versiche-rungs-dienst-leister
Grund-stücks-
undWohnungs-
wesen
Jahr,Vierteljahr
Insgesamt
Handel,Verkehr,
Gast-gewerbe
Veränderung gegenüber dem entsprechenden Vorjahreszeitraum in %
Informa-tion und
Kommuni-kation
Prod. Gewerbeohne BaugewerbeLand- und
Forst-wirtschaft,Fischerei
Bau-gewerbe
Statistisches Bundesamt, Fachserie 18, Reihe 1.2, 3.Vj 2012

2.12 Bruttoinlandsprodukt bzw. Bruttowertschöpfung in jeweiligen Preisen je geleisteter Erwerbstätigenstunde *)
zusammen
darunter:Verarbei-
tendesGewerbe
1 2 3 4 5 6 7 8 9 10 11 12
EUR
2007 42,85 16,10 50,34 47,52 22,61 26,55 46,30 48,06 471,59 37,34 29,27 27,74
2008 43,13 17,76 49,76 46,02 23,69 26,37 46,49 45,19 498,04 37,28 30,08 28,57
2009 42,53 13,50 46,65 42,28 23,88 25,93 51,08 50,59 494,50 34,20 31,10 29,31
2010 43,71 15,30 51,60 47,71 25,15 26,93 49,25 54,58 482,97 33,05 31,18 29,72
2011 44,79 18,58 53,88 50,31 26,19 27,78 48,06 54,95 481,18 32,48 31,84 30,05
2008 1.Vj 42,12 20,28 47,72 44,03 23,10 24,71 45,60 44,86 482,55 37,44 29,08 27,892.Vj 44,47 16,06 52,88 49,17 24,10 28,37 47,10 47,14 509,30 37,49 30,31 28,603.Vj 43,11 16,40 49,69 46,38 24,12 27,24 46,99 43,67 505,07 37,35 29,68 28,524.Vj 42,86 19,31 48,84 44,53 23,37 25,26 46,40 45,19 495,86 36,85 31,25 29,28
2009 1.Vj 40,56 15,18 42,05 37,75 22,52 23,75 48,96 47,25 488,48 34,01 30,29 28,352.Vj 44,07 12,47 48,41 44,15 24,98 27,93 51,60 52,97 520,65 34,93 31,76 29,653.Vj 43,02 12,29 48,16 44,16 24,83 26,85 52,12 51,03 501,56 34,64 30,92 29,314.Vj 42,59 14,69 48,23 43,36 23,11 25,34 51,73 51,19 473,60 33,30 31,48 29,89
2010 1.Vj 41,99 16,63 48,19 43,94 23,58 24,07 49,09 52,66 470,43 33,60 30,58 29,072.Vj 45,43 14,25 54,71 50,84 27,18 28,88 50,23 57,71 499,69 33,39 31,69 29,913.Vj 43,95 14,20 51,58 48,41 26,11 28,18 50,28 54,34 491,96 33,14 30,84 29,684.Vj 43,56 16,83 52,06 47,76 23,62 26,73 47,39 53,88 467,71 32,14 31,63 30,18
2011 1.Vj 43,17 21,00 50,98 47,20 24,78 25,33 47,07 53,17 462,06 32,41 30,87 29,222.Vj 46,65 18,03 57,18 53,81 27,37 29,91 49,22 58,46 504,11 32,82 32,57 30,423.Vj 44,98 16,77 54,29 51,30 26,69 28,78 49,33 54,83 489,78 32,78 31,50 29,904.Vj 44,48 19,34 53,34 49,20 25,90 27,26 46,84 53,65 467,45 31,93 32,49 30,71
2012 1.Vj 43,54 22,16 51,08 47,62 24,99 25,69 46,91 51,53 460,07 32,80 31,72 29,382.Vj 47,20 19,27 57,24 53,44 27,28 30,70 49,17 54,72 506,11 33,67 33,64 30,913.Vj 45,98 17,99 56,36 52,88 27,11 29,69 48,98 50,37 493,33 33,68 32,47 30,71
2007 3,4 8,2 4,5 4,5 2,6 2,6 0,9 – 3,6 5,5 2,5 1,3 1,2
2008 0,7 10,3 – 1,2 – 3,2 4,8 – 0,7 0,4 – 6,0 5,6 – 0,2 2,8 3,0
2009 – 1,4 – 24,0 – 6,3 – 8,1 0,8 – 1,7 9,9 11,9 – 0,7 – 8,3 3,4 2,6
2010 2,8 13,3 10,6 12,8 5,3 3,9 – 3,6 7,9 – 2,3 – 3,4 0,3 1,4
2011 2,5 21,4 4,4 5,4 4,1 3,2 – 2,4 0,7 – 0,4 – 1,7 2,1 1,1
2008 1.Vj 2,8 26,6 2,8 – 0,3 5,9 2,8 2,5 – 4,0 7,0 – 0,3 3,7 3,22.Vj 0,4 16,8 – 0,6 – 2,3 4,1 0,0 – 1,9 – 9,0 4,3 – 0,8 2,5 2,53.Vj 0,2 2,8 – 2,1 – 4,0 3,0 – 0,3 0,4 – 8,1 4,9 – 0,7 2,0 2,44.Vj – 0,7 0,2 – 4,7 – 6,4 6,3 – 5,2 0,7 – 2,7 6,1 1,2 2,7 3,7
2009 1.Vj – 3,7 – 25,1 – 11,9 – 14,3 – 2,5 – 3,9 7,4 5,3 1,2 – 9,2 4,2 1,62.Vj – 0,9 – 22,4 – 8,5 – 10,2 3,7 – 1,6 9,6 12,4 2,2 – 6,8 4,8 3,73.Vj – 0,2 – 25,1 – 3,1 – 4,8 2,9 – 1,4 10,9 16,9 – 0,7 – 7,3 4,2 2,84.Vj – 0,6 – 23,9 – 1,2 – 2,6 – 1,1 0,3 11,5 13,3 – 4,5 – 9,6 0,7 2,1
2010 1.Vj 3,5 9,6 14,6 16,4 4,7 1,3 0,3 11,4 – 3,7 – 1,2 1,0 2,52.Vj 3,1 14,3 13,0 15,2 8,8 3,4 – 2,7 8,9 – 4,0 – 4,4 – 0,2 0,93.Vj 2,2 15,5 7,1 9,6 5,2 5,0 – 3,5 6,5 – 1,9 – 4,3 – 0,3 1,34.Vj 2,3 14,6 7,9 10,1 2,2 5,5 – 8,4 5,3 – 1,2 – 3,5 0,5 1,0
2011 1.Vj 2,8 26,3 5,8 7,4 5,1 5,2 – 4,1 1,0 – 1,8 – 3,5 0,9 0,52.Vj 2,7 26,5 4,5 5,8 0,7 3,6 – 2,0 1,3 0,9 – 1,7 2,8 1,73.Vj 2,3 18,1 5,3 6,0 2,2 2,1 – 1,9 0,9 – 0,4 – 1,1 2,1 0,74.Vj 2,1 14,9 2,5 3,0 9,7 2,0 – 1,2 – 0,4 – 0,1 – 0,7 2,7 1,8
2012 1.Vj 0,9 5,5 0,2 0,9 0,8 1,4 – 0,3 – 3,1 – 0,4 1,2 2,8 0,52.Vj 1,2 6,9 0,1 – 0,7 – 0,3 2,6 – 0,1 – 6,4 0,4 2,6 3,3 1,63.Vj 2,2 7,3 3,8 3,1 1,6 3,2 – 0,7 – 8,1 0,7 2,7 3,1 2,7
*) Quelle für geleistete Arbeitsstunden: Institut für Arbeitsmarkt- und Berufsforschung (IAB) der Bundesagentur für Arbeit (BA), Nürnberg.
Jahr,Vierteljahr
Insgesamt
Handel,Verkehr,
Gast-gewerbe
Veränderung gegenüber dem entsprechenden Vorjahreszeitraum in %
Informa-tion und
Kommuni-kation
Prod. Gewerbeohne BaugewerbeLand- und
Forst-wirtschaft,Fischerei
Bau-gewerbe
Unter-nehmens-
dienst-leister
ÖffentlicheDienst-leister,
Erziehung,Gesund-
heit
SonstigeDienst-leister
Finanz-und
Versiche-rungs-dienst-leister
Grund-stücks-
undWohnungs-
wesen
Statistisches Bundesamt, Fachserie 18, Reihe 1.2, 3.Vj 2012

2.13 Arbeitsproduktivität je Erwerbstätigen *)
zusammen
darunter:Verarbei-
tendesGewerbe
1 2 3 4 5 6 7 8 9 10 11 12
Index (2005 = 100)
2007 104,72 131,25 111,65 113,74 98,10 104,84 114,41 115,77 102,08 99,80 100,47 101,28
2008 104,57 138,50 107,45 108,49 98,47 106,41 121,51 121,16 104,18 97,69 102,39 102,94
2009 99,15 143,63 90,75 86,85 91,71 105,78 135,93 118,10 107,28 86,14 101,54 100,37
2010 102,69 123,53 106,78 105,54 96,84 107,78 137,55 119,71 104,29 84,73 101,73 99,59
2011 104,36 111,50 111,43 112,22 99,62 109,50 138,20 122,00 103,50 84,44 102,61 99,29
2008 1.Vj 104,68 138,93 107,34 108,28 93,71 102,06 123,21 119,86 103,87 100,00 103,83 103,842.Vj 105,76 133,77 113,43 115,04 102,36 110,93 120,38 122,49 103,32 94,72 101,06 100,993.Vj 106,38 143,17 108,05 110,12 104,93 109,97 125,80 121,82 105,28 100,01 104,19 104,984.Vj 101,49 138,76 101,19 100,63 92,86 102,60 116,23 120,25 104,26 96,10 100,54 101,86
2009 1.Vj 97,39 143,71 85,48 80,74 84,50 99,01 136,98 120,68 107,91 87,94 102,82 101,882.Vj 97,79 137,64 88,43 85,24 93,99 107,70 131,87 119,61 107,28 82,31 99,69 96,893.Vj 101,27 148,32 92,97 90,24 99,69 109,97 139,62 116,74 108,49 87,93 102,83 102,064.Vj 100,14 145,36 96,34 91,39 88,40 106,23 135,47 115,30 105,66 86,37 100,87 100,70
2010 1.Vj 100,37 122,05 100,42 97,61 87,27 99,34 139,03 119,24 104,94 87,03 103,53 101,422.Vj 102,18 119,00 107,25 106,35 103,69 110,28 134,04 122,49 103,95 80,65 99,71 96,093.Vj 104,90 127,60 107,75 108,09 105,64 112,79 141,29 118,98 106,20 86,88 103,22 101,404.Vj 103,24 126,21 111,80 110,08 90,19 108,38 135,62 118,34 102,07 84,31 100,55 99,56
2011 1.Vj 104,05 114,88 110,42 109,90 93,90 103,41 141,51 120,57 103,65 86,44 103,91 101,092.Vj 103,90 108,81 112,89 114,41 103,25 112,01 134,95 122,89 103,18 80,58 100,75 95,703.Vj 106,18 112,86 112,01 114,27 105,86 113,73 141,87 123,64 105,09 86,68 104,11 101,124.Vj 103,27 109,39 110,44 110,26 95,10 108,72 134,84 120,59 101,61 84,02 101,68 99,59
2012 1.Vj 104,40 117,55 109,82 110,32 93,44 104,43 142,79 123,17 103,77 87,58 104,38 101,702.Vj 103,29 108,76 110,44 111,46 99,44 112,10 135,02 126,05 103,48 81,35 100,95 96,043.Vj 105,68 116,38 108,60 110,14 104,07 114,15 142,20 126,44 105,24 87,62 103,52 101,47
2007 1,5 30,9 3,7 3,5 – 2,3 0,4 8,3 8,3 3,1 1,2 – 0,2 0,0
2008 – 0,1 5,5 – 3,8 – 4,6 0,4 1,5 6,2 4,7 2,1 – 2,1 1,9 1,6
2009 – 5,2 3,7 – 15,5 – 19,9 – 6,9 – 0,6 11,9 – 2,5 3,0 – 11,8 – 0,8 – 2,5
2010 3,6 – 14,0 17,7 21,5 5,6 1,9 1,2 1,4 – 2,8 – 1,6 0,2 – 0,8
2011 1,6 – 9,7 4,4 6,3 2,9 1,6 0,5 1,9 – 0,8 – 0,3 0,9 – 0,3
2008 1.Vj 0,6 4,2 – 1,4 – 2,7 – 0,2 3,6 6,3 6,0 2,5 – 2,4 1,5 0,62.Vj 1,8 6,0 1,3 0,6 3,8 4,0 5,8 5,2 1,2 – 0,3 1,8 3,23.Vj – 0,2 5,4 – 3,4 – 4,1 – 0,0 1,5 7,0 4,0 0,9 – 2,5 2,0 1,64.Vj – 2,8 7,2 – 11,1 – 12,2 – 1,8 – 3,1 5,1 2,9 3,3 – 3,0 2,4 1,2
2009 1.Vj – 7,0 3,4 – 20,4 – 25,4 – 9,8 – 3,0 11,2 0,7 3,9 – 12,1 – 1,0 – 1,92.Vj – 7,5 2,9 – 22,0 – 25,9 – 8,2 – 2,9 9,5 – 2,4 3,8 – 13,1 – 1,4 – 4,13.Vj – 4,8 3,6 – 14,0 – 18,1 – 5,0 0,0 11,0 – 4,2 3,0 – 12,1 – 1,3 – 2,84.Vj – 1,3 4,8 – 4,8 – 9,2 – 4,8 3,5 16,6 – 4,1 1,3 – 10,1 0,3 – 1,1
2010 1.Vj 3,1 – 15,1 17,5 20,9 3,3 0,3 1,5 – 1,2 – 2,8 – 1,0 0,7 – 0,52.Vj 4,5 – 13,5 21,3 24,8 10,3 2,4 1,6 2,4 – 3,1 – 2,0 0,0 – 0,83.Vj 3,6 – 14,0 15,9 19,8 6,0 2,6 1,2 1,9 – 2,1 – 1,2 0,4 – 0,64.Vj 3,1 – 13,2 16,0 20,5 2,0 2,0 0,1 2,6 – 3,4 – 2,4 – 0,3 – 1,1
2011 1.Vj 3,7 – 5,9 10,0 12,6 7,6 4,1 1,8 1,1 – 1,2 – 0,7 0,4 – 0,32.Vj 1,7 – 8,6 5,3 7,6 – 0,4 1,6 0,7 0,3 – 0,7 – 0,1 1,0 – 0,43.Vj 1,2 – 11,6 4,0 5,7 0,2 0,8 0,4 3,9 – 1,0 – 0,2 0,9 – 0,34.Vj 0,0 – 13,3 – 1,2 0,2 5,4 0,3 – 0,6 1,9 – 0,5 – 0,3 1,1 0,0
2012 1.Vj 0,3 2,3 – 0,5 0,4 – 0,5 1,0 0,9 2,2 0,1 1,3 0,5 0,62.Vj – 0,6 – 0,0 – 2,2 – 2,6 – 3,7 0,1 0,1 2,6 0,3 1,0 0,2 0,43.Vj – 0,5 3,1 – 3,0 – 3,6 – 1,7 0,4 0,2 2,3 0,1 1,1 – 0,6 0,3
*) Bruttoinlandsprodukt bzw. Bruttowertschöpfung (preisbereinigt, Kettenindex 2005=100) je Erwerbstätigen (umgerechnet auf Messzahlen 2005=100).
Unter-nehmens-
dienst-leister
ÖffentlicheDienst-leister,
Erziehung,Gesund-
heit
SonstigeDienst-leister
Finanz-und
Versiche-rungs-dienst-leister
Grund-stücks-
undWohnungs-
wesen
Jahr,Vierteljahr
Insgesamt
Handel,Verkehr,
Gast-gewerbe
Veränderung gegenüber dem entsprechenden Vorjahreszeitraum in %
Informa-tion und
Kommuni-kation
Prod. Gewerbeohne BaugewerbeLand- und
Forst-wirtschaft,Fischerei
Bau-gewerbe
Statistisches Bundesamt, Fachserie 18, Reihe 1.2, 3.Vj 2012
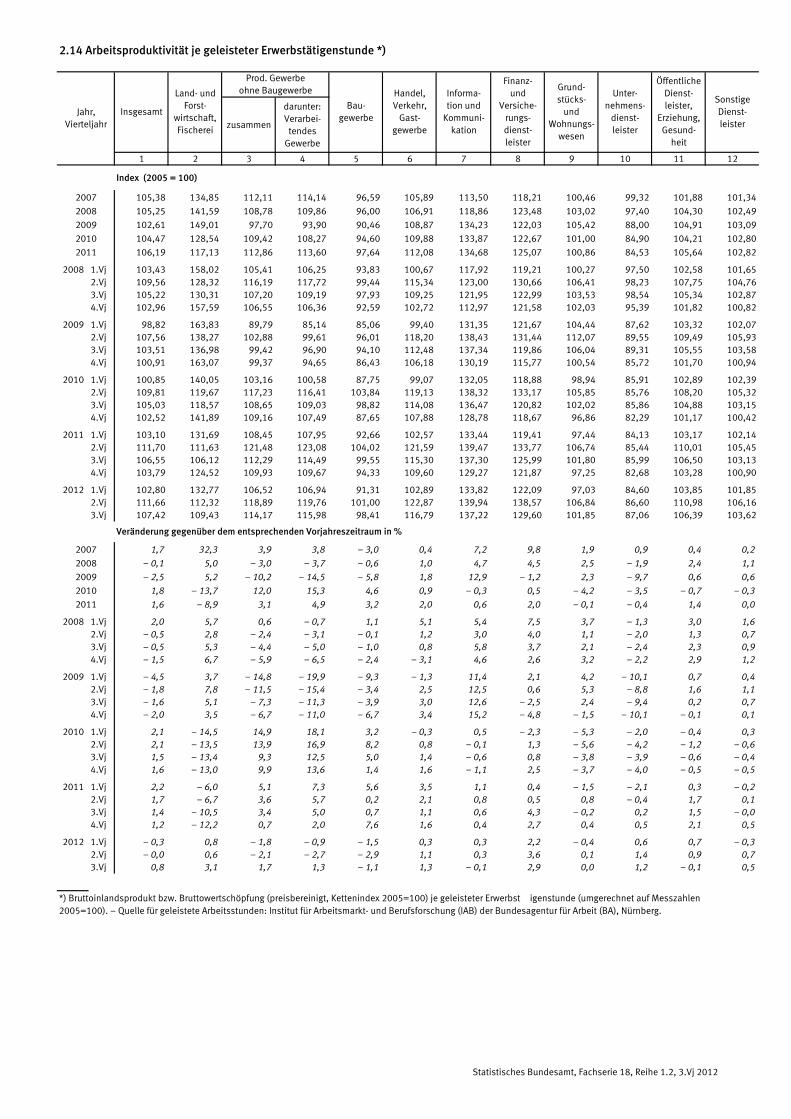
2.14 Arbeitsproduktivität je geleisteter Erwerbstätigenstunde *)
zusammen
darunter:Verarbei-
tendesGewerbe
1 2 3 4 5 6 7 8 9 10 11 12
Index (2005 = 100)
2007 105,38 134,85 112,11 114,14 96,59 105,89 113,50 118,21 100,46 99,32 101,88 101,34
2008 105,25 141,59 108,78 109,86 96,00 106,91 118,86 123,48 103,02 97,40 104,30 102,49
2009 102,61 149,01 97,70 93,90 90,46 108,87 134,23 122,03 105,42 88,00 104,91 103,09
2010 104,47 128,54 109,42 108,27 94,60 109,88 133,87 122,67 101,00 84,90 104,21 102,80
2011 106,19 117,13 112,86 113,60 97,64 112,08 134,68 125,07 100,86 84,53 105,64 102,82
2008 1.Vj 103,43 158,02 105,41 106,25 93,83 100,67 117,92 119,21 100,27 97,50 102,58 101,652.Vj 109,56 128,32 116,19 117,72 99,44 115,34 123,00 130,66 106,41 98,23 107,75 104,763.Vj 105,22 130,31 107,20 109,19 97,93 109,25 121,95 122,99 103,53 98,54 105,34 102,874.Vj 102,96 157,59 106,55 106,36 92,59 102,72 112,97 121,58 102,03 95,39 101,82 100,82
2009 1.Vj 98,82 163,83 89,79 85,14 85,06 99,40 131,35 121,67 104,44 87,62 103,32 102,072.Vj 107,56 138,27 102,88 99,61 96,01 118,20 138,43 131,44 112,07 89,55 109,49 105,933.Vj 103,51 136,98 99,42 96,90 94,10 112,48 137,34 119,86 106,04 89,31 105,55 103,584.Vj 100,91 163,07 99,37 94,65 86,43 106,18 130,19 115,77 100,54 85,72 101,70 100,94
2010 1.Vj 100,85 140,05 103,16 100,58 87,75 99,07 132,05 118,88 98,94 85,91 102,89 102,392.Vj 109,81 119,67 117,23 116,41 103,84 119,13 138,32 133,17 105,85 85,76 108,20 105,323.Vj 105,03 118,57 108,65 109,03 98,82 114,08 136,47 120,82 102,02 85,86 104,88 103,154.Vj 102,52 141,89 109,16 107,49 87,65 107,88 128,78 118,67 96,86 82,29 101,17 100,42
2011 1.Vj 103,10 131,69 108,45 107,95 92,66 102,57 133,44 119,41 97,44 84,13 103,17 102,142.Vj 111,70 111,63 121,48 123,08 104,02 121,59 139,47 133,77 106,74 85,44 110,01 105,453.Vj 106,55 106,12 112,29 114,49 99,55 115,30 137,30 125,99 101,80 85,99 106,50 103,134.Vj 103,79 124,52 109,93 109,67 94,33 109,60 129,27 121,87 97,25 82,68 103,28 100,90
2012 1.Vj 102,80 132,77 106,52 106,94 91,31 102,89 133,82 122,09 97,03 84,60 103,85 101,852.Vj 111,66 112,32 118,89 119,76 101,00 122,87 139,94 138,57 106,84 86,60 110,98 106,163.Vj 107,42 109,43 114,17 115,98 98,41 116,79 137,22 129,60 101,85 87,06 106,39 103,62
2007 1,7 32,3 3,9 3,8 – 3,0 0,4 7,2 9,8 1,9 0,9 0,4 0,2
2008 – 0,1 5,0 – 3,0 – 3,7 – 0,6 1,0 4,7 4,5 2,5 – 1,9 2,4 1,1
2009 – 2,5 5,2 – 10,2 – 14,5 – 5,8 1,8 12,9 – 1,2 2,3 – 9,7 0,6 0,6
2010 1,8 – 13,7 12,0 15,3 4,6 0,9 – 0,3 0,5 – 4,2 – 3,5 – 0,7 – 0,3
2011 1,6 – 8,9 3,1 4,9 3,2 2,0 0,6 2,0 – 0,1 – 0,4 1,4 0,0
2008 1.Vj 2,0 5,7 0,6 – 0,7 1,1 5,1 5,4 7,5 3,7 – 1,3 3,0 1,62.Vj – 0,5 2,8 – 2,4 – 3,1 – 0,1 1,2 3,0 4,0 1,1 – 2,0 1,3 0,73.Vj – 0,5 5,3 – 4,4 – 5,0 – 1,0 0,8 5,8 3,7 2,1 – 2,4 2,3 0,94.Vj – 1,5 6,7 – 5,9 – 6,5 – 2,4 – 3,1 4,6 2,6 3,2 – 2,2 2,9 1,2
2009 1.Vj – 4,5 3,7 – 14,8 – 19,9 – 9,3 – 1,3 11,4 2,1 4,2 – 10,1 0,7 0,42.Vj – 1,8 7,8 – 11,5 – 15,4 – 3,4 2,5 12,5 0,6 5,3 – 8,8 1,6 1,13.Vj – 1,6 5,1 – 7,3 – 11,3 – 3,9 3,0 12,6 – 2,5 2,4 – 9,4 0,2 0,74.Vj – 2,0 3,5 – 6,7 – 11,0 – 6,7 3,4 15,2 – 4,8 – 1,5 – 10,1 – 0,1 0,1
2010 1.Vj 2,1 – 14,5 14,9 18,1 3,2 – 0,3 0,5 – 2,3 – 5,3 – 2,0 – 0,4 0,32.Vj 2,1 – 13,5 13,9 16,9 8,2 0,8 – 0,1 1,3 – 5,6 – 4,2 – 1,2 – 0,63.Vj 1,5 – 13,4 9,3 12,5 5,0 1,4 – 0,6 0,8 – 3,8 – 3,9 – 0,6 – 0,44.Vj 1,6 – 13,0 9,9 13,6 1,4 1,6 – 1,1 2,5 – 3,7 – 4,0 – 0,5 – 0,5
2011 1.Vj 2,2 – 6,0 5,1 7,3 5,6 3,5 1,1 0,4 – 1,5 – 2,1 0,3 – 0,22.Vj 1,7 – 6,7 3,6 5,7 0,2 2,1 0,8 0,5 0,8 – 0,4 1,7 0,13.Vj 1,4 – 10,5 3,4 5,0 0,7 1,1 0,6 4,3 – 0,2 0,2 1,5 – 0,04.Vj 1,2 – 12,2 0,7 2,0 7,6 1,6 0,4 2,7 0,4 0,5 2,1 0,5
2012 1.Vj – 0,3 0,8 – 1,8 – 0,9 – 1,5 0,3 0,3 2,2 – 0,4 0,6 0,7 – 0,32.Vj – 0,0 0,6 – 2,1 – 2,7 – 2,9 1,1 0,3 3,6 0,1 1,4 0,9 0,73.Vj 0,8 3,1 1,7 1,3 – 1,1 1,3 – 0,1 2,9 0,0 1,2 – 0,1 0,5
*) Bruttoinlandsprodukt bzw. Bruttowertschöpfung (preisbereinigt, Kettenindex 2005=100) je geleisteter Erwerbstätigenstunde (umgerechnet auf Messzahlen2005=100). � Quelle für geleistete Arbeitsstunden: Institut für Arbeitsmarkt- und Berufsforschung (IAB) der Bundesagentur für Arbeit (BA), Nürnberg.
Jahr,Vierteljahr
Insgesamt
Handel,Verkehr,
Gast-gewerbe
Veränderung gegenüber dem entsprechenden Vorjahreszeitraum in %
Informa-tion und
Kommuni-kation
Prod. Gewerbeohne BaugewerbeLand- und
Forst-wirtschaft,Fischerei
Bau-gewerbe
Unter-nehmens-
dienst-leister
ÖffentlicheDienst-leister,
Erziehung,Gesund-
heit
SonstigeDienst-leister
Finanz-und
Versiche-rungs-dienst-leister
Grund-stücks-
undWohnungs-
wesen
Statistisches Bundesamt, Fachserie 18, Reihe 1.2, 3.Vj 2012

2.15 Arbeitnehmerentgelt je Arbeitnehmer
zusammen
darunter:Verarbei-
tendesGewerbe
1 2 3 4 5 6 7 8 9 10 11 12
EUR
2007 33 569 19 100 45 325 44 921 33 432 26 295 47 763 57 486 26 434 26 565 33 522 19 869
2008 34 276 19 570 46 114 45 637 33 875 26 975 49 333 58 306 26 805 27 510 34 180 20 421
2009 34 330 19 613 44 935 44 219 35 148 26 851 49 772 58 381 27 112 27 720 35 315 20 827
2010 35 150 20 193 46 963 46 312 35 533 27 412 51 466 59 273 27 867 28 426 35 840 21 284
2011 36 213 20 374 48 735 48 137 36 468 27 895 53 251 60 634 28 963 29 667 36 921 21 821
2008 1.Vj 8 074 4 869 10 943 10 813 7 856 6 255 11 628 13 112 6 338 6 521 8 045 5 0242.Vj 8 379 4 632 11 911 11 820 8 590 6 407 11 982 13 862 6 357 6 570 8 124 4 7863.Vj 8 440 4 844 11 009 10 900 8 534 6 952 12 255 13 740 6 795 6 826 8 445 4 9424.Vj 9 368 5 308 12 255 12 101 8 871 7 342 13 479 17 526 7 347 7 572 9 544 5 657
2009 1.Vj 8 152 4 944 10 753 10 569 8 129 6 344 11 911 12 807 6 495 6 680 8 313 5 1442.Vj 8 372 4 559 11 476 11 301 8 978 6 411 12 121 14 006 6 478 6 682 8 355 4 8953.Vj 8 448 4 849 10 741 10 579 8 820 6 807 12 278 13 854 6 799 6 828 8 840 5 0474.Vj 9 349 5 318 11 964 11 774 9 195 7 286 13 496 17 674 7 328 7 520 9 787 5 728
2010 1.Vj 8 298 5 018 11 034 10 853 8 014 6 412 12 148 13 217 6 649 6 796 8 545 5 2772.Vj 8 581 4 676 12 107 11 955 9 149 6 539 12 459 13 843 6 702 6 797 8 511 5 0123.Vj 8 652 5 015 11 197 11 051 9 058 7 011 12 778 14 253 6 995 7 037 8 859 5 1554.Vj 9 601 5 552 12 629 12 450 9 244 7 428 14 060 17 929 7 553 7 753 9 916 5 844
2011 1.Vj 8 550 5 090 11 582 11 418 8 378 6 493 12 570 13 623 6 917 7 065 8 724 5 3752.Vj 8 890 4 706 12 747 12 618 9 316 6 603 12 974 14 368 6 933 7 089 8 837 5 1523.Vj 8 904 5 029 11 556 11 421 9 221 7 168 13 222 14 469 7 256 7 384 9 113 5 2804.Vj 9 852 5 603 12 846 12 673 9 514 7 608 14 478 18 109 7 810 8 098 10 241 6 023
2012 1.Vj 8 744 5 210 11 727 11 574 8 577 6 629 13 012 13 987 7 116 7 395 8 914 5 5202.Vj 9 115 4 819 13 111 12 996 9 537 6 774 13 305 14 715 7 079 7 391 8 967 5 2593.Vj 9 125 5 174 11 857 11 708 9 451 7 299 13 667 14 834 7 415 7 673 9 279 5 445
2007 0,8 0,9 0,7 0,9 1,8 1,1 1,9 3,6 2,5 1,2 0,3 – 0,2
2008 2,1 2,5 1,7 1,6 1,3 2,6 3,3 1,4 1,4 3,6 2,0 2,8
2009 0,2 0,2 – 2,6 – 3,1 3,8 – 0,5 0,9 0,1 1,1 0,8 3,3 2,0
2010 2,4 3,0 4,5 4,7 1,1 2,1 3,4 1,5 2,8 2,5 1,5 2,2
2011 3,0 0,9 3,8 3,9 2,6 1,8 3,5 2,3 3,9 4,4 3,0 2,5
2008 1.Vj 1,8 3,7 2,3 2,2 1,9 1,5 2,1 1,5 – 0,5 2,9 1,4 1,12.Vj 2,3 4,9 1,7 1,7 1,9 2,0 3,5 1,5 0,0 3,9 2,8 3,83.Vj 2,1 2,3 1,6 1,6 0,9 4,1 3,9 1,4 2,6 3,5 1,1 1,84.Vj 2,2 1,0 1,4 1,0 0,7 2,6 3,7 0,8 3,3 4,2 2,4 4,2
2009 1.Vj 1,0 1,5 – 1,7 – 2,3 3,5 1,4 2,4 – 2,3 2,5 2,4 3,3 2,42.Vj – 0,1 – 1,6 – 3,7 – 4,4 4,5 0,1 1,2 1,0 1,9 1,7 2,8 2,33.Vj 0,1 0,1 – 2,4 – 2,9 3,4 – 2,1 0,2 0,8 0,1 0,0 4,7 2,14.Vj – 0,2 0,2 – 2,4 – 2,7 3,7 – 0,8 0,1 0,8 – 0,3 – 0,7 2,5 1,3
2010 1.Vj 1,8 1,5 2,6 2,7 – 1,4 1,1 2,0 3,2 2,4 1,7 2,8 2,62.Vj 2,5 2,6 5,5 5,8 1,9 2,0 2,8 – 1,2 3,5 1,7 1,9 2,43.Vj 2,4 3,4 4,2 4,5 2,7 3,0 4,1 2,9 2,9 3,1 0,2 2,14.Vj 2,7 4,4 5,6 5,7 0,5 1,9 4,2 1,4 3,1 3,1 1,3 2,0
2011 1.Vj 3,0 1,4 5,0 5,2 4,5 1,3 3,5 3,1 4,0 4,0 2,1 1,92.Vj 3,6 0,6 5,3 5,5 1,8 1,0 4,1 3,8 3,4 4,3 3,8 2,83.Vj 2,9 0,3 3,2 3,3 1,8 2,2 3,5 1,5 3,7 4,9 2,9 2,44.Vj 2,6 0,9 1,7 1,8 2,9 2,4 3,0 1,0 3,4 4,4 3,3 3,1
2012 1.Vj 2,3 2,4 1,3 1,4 2,4 2,1 3,5 2,7 2,9 4,7 2,2 2,72.Vj 2,5 2,4 2,9 3,0 2,4 2,6 2,6 2,4 2,1 4,3 1,5 2,13.Vj 2,5 2,9 2,6 2,5 2,5 1,8 3,4 2,5 2,2 3,9 1,8 3,1
Jahr,Vierteljahr
Insgesamt
Handel,Verkehr,
Gast-gewerbe
Veränderung gegenüber dem entsprechenden Vorjahreszeitraum in %
Informa-tion und
Kommuni-kation
Prod. Gewerbeohne BaugewerbeLand- und
Forst-wirtschaft,Fischerei
Bau-gewerbe
Unter-nehmens-
dienst-leister
ÖffentlicheDienst-leister,
Erziehung,Gesund-
heit
SonstigeDienst-leister
Finanz-und
Versiche-rungs-dienst-leister
Grund-stücks-
undWohnungs-
wesen
Statistisches Bundesamt, Fachserie 18, Reihe 1.2, 3.Vj 2012

2.16 Arbeitnehmerentgelt je geleisteter Arbeitnehmerstunde *)
zusammen
darunter:Verarbei-
tendesGewerbe
1 2 3 4 5 6 7 8 9 10 11 12
EUR
2007 25,06 13,20 31,43 31,25 21,81 20,25 34,70 39,94 23,79 20,81 24,84 18,93
2008 25,60 13,59 32,25 32,05 21,87 20,64 35,43 40,50 24,34 21,52 25,44 19,33
2009 26,50 13,98 33,53 33,29 23,13 21,12 36,28 41,29 24,67 22,50 26,70 20,30
2010 26,56 14,34 33,29 33,01 23,13 21,26 36,81 41,38 25,12 22,43 26,84 20,76
2011 27,33 14,47 34,11 33,82 23,82 21,66 37,98 42,29 26,50 23,32 27,81 21,40
2008 1.Vj 23,53 13,00 29,65 29,40 21,10 18,73 32,40 35,35 22,18 19,87 23,17 18,622.Vj 25,93 13,73 33,72 33,56 22,00 20,43 36,21 40,62 24,12 21,57 25,39 19,073.Vj 24,86 13,36 30,17 29,98 20,92 21,08 34,89 37,99 24,54 21,15 24,99 18,474.Vj 28,10 14,35 35,71 35,54 23,48 22,29 38,33 48,21 26,38 23,47 28,21 21,14
2009 1.Vj 24,57 13,57 31,31 31,02 22,14 19,41 33,64 35,24 23,20 21,05 24,42 19,562.Vj 27,57 14,09 37,08 36,87 24,27 21,55 37,54 42,18 25,10 23,12 26,85 20,343.Vj 25,90 13,76 31,89 31,68 22,04 21,36 35,88 39,12 24,71 22,17 26,62 19,534.Vj 28,00 14,59 34,20 33,94 24,08 22,18 38,29 48,56 25,89 23,67 28,88 21,74
2010 1.Vj 24,69 13,74 31,39 31,11 21,88 19,40 33,79 35,82 23,18 21,13 24,78 20,062.Vj 27,50 14,32 36,67 36,43 24,23 21,55 37,89 41,10 25,51 22,83 27,01 20,803.Vj 25,81 14,15 31,25 30,98 22,35 21,60 36,36 39,58 25,05 21,91 26,36 19,874.Vj 28,23 15,09 34,08 33,73 24,05 22,45 39,30 48,93 26,79 23,79 29,20 22,31
2011 1.Vj 25,06 13,79 31,44 31,13 22,30 19,52 34,59 36,64 24,34 21,58 25,32 20,562.Vj 28,46 14,74 37,95 37,71 24,81 21,82 39,34 42,74 27,08 23,68 28,25 21,543.Vj 26,60 14,21 32,04 31,77 22,90 22,10 37,49 40,24 26,44 23,04 27,32 20,444.Vj 29,26 15,22 35,32 34,95 25,27 23,20 40,50 49,61 27,92 24,93 30,41 23,02
2012 1.Vj 25,48 13,93 31,41 31,12 22,63 19,78 35,67 37,68 24,91 22,47 25,95 20,962.Vj 29,27 15,04 39,01 38,74 25,57 22,54 40,37 43,98 27,45 24,68 28,82 22,013.Vj 27,66 14,59 34,57 34,34 23,68 22,69 38,74 41,43 27,05 23,99 27,94 21,15
2007 0,7 0,8 0,7 0,9 0,7 1,0 0,4 4,8 1,3 0,1 0,9 – 0,6
2008 2,2 3,0 2,6 2,6 0,3 1,9 2,1 1,4 2,3 3,4 2,4 2,1
2009 3,5 2,9 4,0 3,9 5,8 2,3 2,4 2,0 1,4 4,6 5,0 5,0
2010 0,2 2,6 – 0,7 – 0,8 0,0 0,7 1,5 0,2 1,8 – 0,3 0,5 2,3
2011 2,9 0,9 2,5 2,5 3,0 1,9 3,2 2,2 5,5 4,0 3,6 3,1
2008 1.Vj 3,0 3,6 4,4 4,4 3,3 2,7 0,5 2,6 0,1 3,3 2,7 1,62.Vj 0,3 3,9 – 2,0 – 2,1 – 1,6 – 0,6 1,7 1,1 0,8 2,5 2,5 1,93.Vj 1,4 2,8 0,5 0,4 – 0,5 2,9 2,6 1,0 3,1 2,9 1,3 0,84.Vj 3,8 1,6 7,7 7,9 0,2 2,5 3,9 1,0 4,2 5,1 3,0 4,1
2009 1.Vj 4,4 4,4 5,6 5,5 4,9 3,6 3,8 – 0,3 4,6 5,9 5,4 5,02.Vj 6,3 2,6 10,0 9,9 10,3 5,5 3,7 3,8 4,1 7,2 5,8 6,73.Vj 4,2 3,0 5,7 5,7 5,4 1,3 2,8 3,0 0,7 4,8 6,5 5,74.Vj – 0,4 1,7 – 4,2 – 4,5 2,6 – 0,5 – 0,1 0,7 – 1,9 0,9 2,4 2,8
2010 1.Vj 0,5 1,3 0,3 0,3 – 1,2 – 0,1 0,4 1,6 – 0,1 0,4 1,5 2,62.Vj – 0,3 1,6 – 1,1 – 1,2 – 0,2 0,0 0,9 – 2,6 1,6 – 1,3 0,6 2,33.Vj – 0,3 2,8 – 2,0 – 2,2 1,4 1,1 1,3 1,2 1,4 – 1,2 – 1,0 1,74.Vj 0,8 3,4 – 0,4 – 0,6 – 0,1 1,2 2,6 0,8 3,5 0,5 1,1 2,6
2011 1.Vj 1,5 0,4 0,2 0,1 1,9 0,6 2,4 2,3 5,0 2,1 2,2 2,52.Vj 3,5 2,9 3,5 3,5 2,4 1,3 3,8 4,0 6,2 3,7 4,6 3,63.Vj 3,1 0,4 2,5 2,6 2,5 2,3 3,1 1,7 5,5 5,2 3,6 2,94.Vj 3,6 0,9 3,6 3,6 5,1 3,3 3,1 1,4 4,2 4,8 4,1 3,2
2012 1.Vj 1,7 1,0 – 0,1 – 0,0 1,5 1,3 3,1 2,8 2,3 4,1 2,5 1,92.Vj 2,8 2,0 2,8 2,7 3,1 3,3 2,6 2,9 1,4 4,2 2,0 2,23.Vj 4,0 2,7 7,9 8,1 3,4 2,7 3,3 3,0 2,3 4,1 2,3 3,5
*) Quelle für geleistete Arbeitsstunden: Institut für Arbeitsmarkt- und Berufsforschung (IAB) der Bundesagentur für Arbeit (BA), Nürnberg.
Jahr,Vierteljahr
Insgesamt
Handel,Verkehr,
Gast-gewerbe
Veränderung gegenüber dem entsprechenden Vorjahreszeitraum in %
Informa-tion und
Kommuni-kation
Prod. Gewerbeohne BaugewerbeLand- und
Forst-wirtschaft,Fischerei
Bau-gewerbe
Unter-nehmens-
dienst-leister
ÖffentlicheDienst-leister,
Erziehung,Gesund-
heit
SonstigeDienst-leister
Finanz-und
Versiche-rungs-dienst-leister
Grund-stücks-
undWohnungs-
wesen
Statistisches Bundesamt, Fachserie 18, Reihe 1.2, 3.Vj 2012

2.17 Bruttolöhne und -gehälter je Arbeitnehmer
zusammen
darunter:Verarbei-
tendesGewerbe
1 2 3 4 5 6 7 8 9 10 11 12
EUR
2007 27 306 15 967 36 815 36 689 27 624 21 743 40 055 45 280 21 602 21 845 26 674 16 535
2008 27 936 16 391 37 523 37 335 28 084 22 393 41 491 45 966 22 078 22 656 27 204 17 004
2009 27 933 16 452 36 378 35 989 29 138 22 285 41 822 46 051 22 406 22 898 28 086 17 305
2010 28 585 16 913 38 071 37 738 29 415 22 671 43 211 46 619 22 880 23 453 28 517 17 688
2011 29 542 17 072 39 666 39 383 30 287 23 174 44 829 47 860 23 883 24 564 29 407 18 133
2008 1.Vj 6 570 4 082 8 901 8 848 6 513 5 180 9 769 10 266 5 195 5 361 6 388 4 1912.Vj 6 804 3 865 9 667 9 641 7 094 5 292 10 028 10 832 5 220 5 379 6 447 3 9813.Vj 6 894 4 063 8 970 8 930 7 100 5 794 10 333 10 821 5 641 5 639 6 723 4 1254.Vj 7 655 4 452 9 987 9 913 7 357 6 110 11 371 13 994 6 048 6 258 7 628 4 698
2009 1.Vj 6 595 4 126 8 664 8 565 6 703 5 231 9 962 9 962 5 326 5 483 6 571 4 2682.Vj 6 775 3 794 9 249 9 155 7 403 5 283 10 114 10 932 5 323 5 480 6 619 4 0553.Vj 6 901 4 096 8 723 8 637 7 350 5 681 10 372 10 938 5 661 5 665 7 049 4 2054.Vj 7 654 4 482 9 742 9 635 7 657 6 086 11 404 14 184 6 085 6 260 7 829 4 766
2010 1.Vj 6 721 4 207 8 913 8 819 6 617 5 280 10 182 10 293 5 416 5 578 6 774 4 3802.Vj 6 962 3 912 9 808 9 731 7 558 5 385 10 424 10 787 5 496 5 581 6 763 4 1603.Vj 7 048 4 204 9 081 9 008 7 515 5 815 10 745 11 200 5 771 5 822 7 056 4 2934.Vj 7 839 4 649 10 272 10 175 7 667 6 172 11 842 14 311 6 223 6 434 7 916 4 858
2011 1.Vj 6 947 4 265 9 389 9 309 6 942 5 371 10 556 10 662 5 657 5 827 6 919 4 4682.Vj 7 237 3 922 10 369 10 316 7 726 5 464 10 887 11 263 5 707 5 847 7 031 4 2773.Vj 7 273 4 211 9 407 9 343 7 672 5 970 11 150 11 404 6 016 6 125 7 261 4 3874.Vj 8 069 4 723 10 497 10 408 7 912 6 347 12 230 14 478 6 464 6 737 8 190 5 008
2012 1.Vj 7 126 4 336 9 523 9 451 7 118 5 510 10 945 10 975 5 820 6 127 7 095 4 5902.Vj 7 437 4 011 10 687 10 643 7 908 5 627 11 182 11 549 5 842 6 108 7 149 4 3693.Vj 7 468 4 331 9 661 9 586 7 864 6 101 11 537 11 709 6 162 6 378 7 406 4 539
2007 1,4 1,4 2,4 2,6 2,5 1,3 2,2 3,3 0,5 1,5 0,4 – 0,0
2008 2,3 2,7 1,9 1,8 1,7 3,0 3,6 1,5 2,2 3,7 2,0 2,8
2009 – 0,0 0,4 – 3,1 – 3,6 3,8 – 0,5 0,8 0,2 1,5 1,1 3,2 1,8
2010 2,3 2,8 4,7 4,9 1,0 1,7 3,3 1,2 2,1 2,4 1,5 2,2
2011 3,3 0,9 4,2 4,4 3,0 2,2 3,7 2,7 4,4 4,7 3,1 2,5
2008 1.Vj 2,2 3,8 2,9 2,6 2,5 2,2 2,5 1,7 0,8 3,3 1,6 1,52.Vj 2,5 5,0 1,8 1,7 2,2 2,3 3,7 1,5 0,7 4,0 2,8 3,83.Vj 2,4 2,7 1,9 1,8 1,5 4,6 4,3 1,6 3,7 3,8 1,1 2,04.Vj 2,1 1,1 1,3 0,9 0,7 2,7 3,8 0,7 3,4 4,1 2,4 4,0
2009 1.Vj 0,4 1,1 – 2,7 – 3,2 2,9 1,0 2,0 – 3,0 2,5 2,3 2,9 1,82.Vj – 0,4 – 1,8 – 4,3 – 5,0 4,4 – 0,2 0,9 0,9 2,0 1,9 2,7 1,93.Vj 0,1 0,8 – 2,8 – 3,3 3,5 – 2,0 0,4 1,1 0,4 0,5 4,8 1,94.Vj – 0,0 0,7 – 2,5 – 2,8 4,1 – 0,4 0,3 1,4 0,6 0,0 2,6 1,4
2010 1.Vj 1,9 2,0 2,9 3,0 – 1,3 0,9 2,2 3,3 1,7 1,7 3,1 2,62.Vj 2,8 3,1 6,0 6,3 2,1 1,9 3,1 – 1,3 3,3 1,8 2,2 2,63.Vj 2,1 2,6 4,1 4,3 2,2 2,4 3,6 2,4 1,9 2,8 0,1 2,14.Vj 2,4 3,7 5,4 5,6 0,1 1,4 3,8 0,9 2,3 2,8 1,1 1,9
2011 1.Vj 3,4 1,4 5,3 5,6 4,9 1,7 3,7 3,6 4,4 4,5 2,1 2,02.Vj 4,0 0,3 5,7 6,0 2,2 1,5 4,4 4,4 3,8 4,8 4,0 2,83.Vj 3,2 0,2 3,6 3,7 2,1 2,7 3,8 1,8 4,2 5,2 2,9 2,24.Vj 2,9 1,6 2,2 2,3 3,2 2,8 3,3 1,2 3,9 4,7 3,5 3,1
2012 1.Vj 2,6 1,7 1,4 1,5 2,5 2,6 3,7 2,9 2,9 5,1 2,5 2,72.Vj 2,8 2,3 3,1 3,2 2,4 3,0 2,7 2,5 2,4 4,5 1,7 2,23.Vj 2,7 2,8 2,7 2,6 2,5 2,2 3,5 2,7 2,4 4,1 2,0 3,5
Unter-nehmens-
dienst-leister
ÖffentlicheDienst-leister,
Erziehung,Gesund-
heit
SonstigeDienst-leister
Finanz-und
Versiche-rungs-dienst-leister
Grund-stücks-
undWohnungs-
wesen
Jahr,Vierteljahr
Insgesamt
Handel,Verkehr,
Gast-gewerbe
Veränderung gegenüber dem entsprechenden Vorjahreszeitraum in %
Informa-tion und
Kommuni-kation
Prod. Gewerbeohne BaugewerbeLand- und
Forst-wirtschaft,Fischerei
Bau-gewerbe
Statistisches Bundesamt, Fachserie 18, Reihe 1.2, 3.Vj 2012
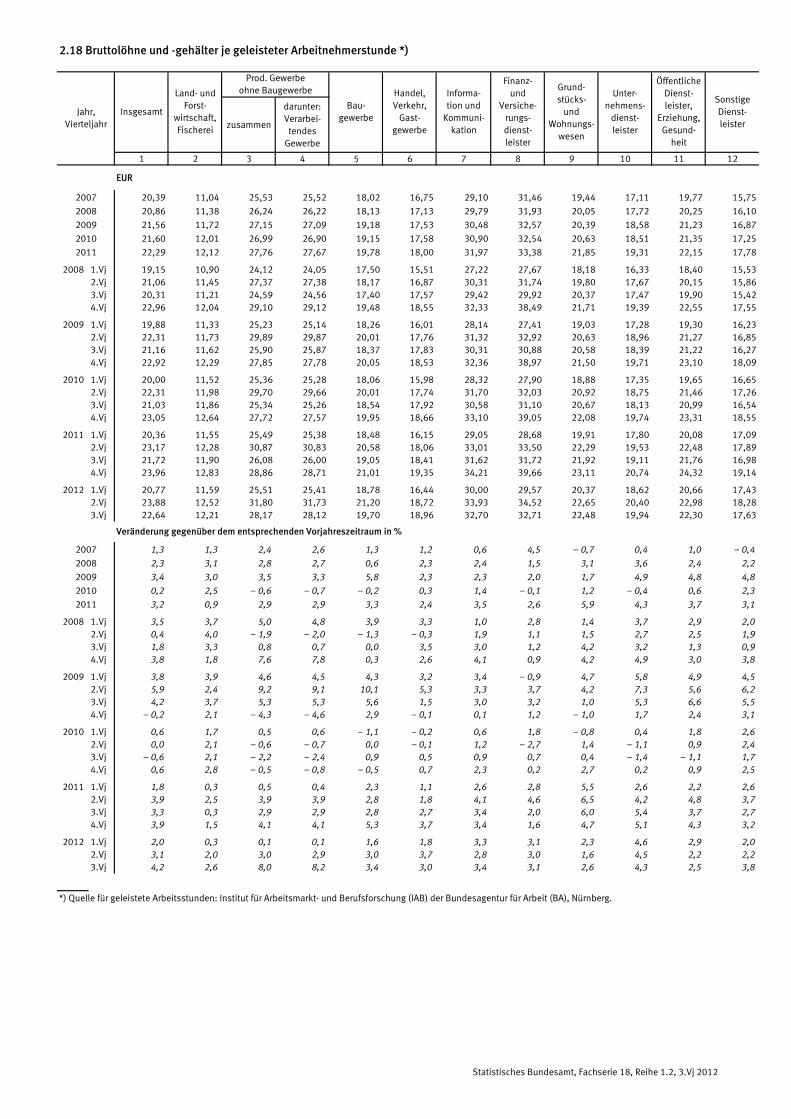
2.18 Bruttolöhne und -gehälter je geleisteter Arbeitnehmerstunde *)
zusammen
darunter:Verarbei-
tendesGewerbe
1 2 3 4 5 6 7 8 9 10 11 12
EUR
2007 20,39 11,04 25,53 25,52 18,02 16,75 29,10 31,46 19,44 17,11 19,77 15,75
2008 20,86 11,38 26,24 26,22 18,13 17,13 29,79 31,93 20,05 17,72 20,25 16,10
2009 21,56 11,72 27,15 27,09 19,18 17,53 30,48 32,57 20,39 18,58 21,23 16,87
2010 21,60 12,01 26,99 26,90 19,15 17,58 30,90 32,54 20,63 18,51 21,35 17,25
2011 22,29 12,12 27,76 27,67 19,78 18,00 31,97 33,38 21,85 19,31 22,15 17,78
2008 1.Vj 19,15 10,90 24,12 24,05 17,50 15,51 27,22 27,67 18,18 16,33 18,40 15,532.Vj 21,06 11,45 27,37 27,38 18,17 16,87 30,31 31,74 19,80 17,67 20,15 15,863.Vj 20,31 11,21 24,59 24,56 17,40 17,57 29,42 29,92 20,37 17,47 19,90 15,424.Vj 22,96 12,04 29,10 29,12 19,48 18,55 32,33 38,49 21,71 19,39 22,55 17,55
2009 1.Vj 19,88 11,33 25,23 25,14 18,26 16,01 28,14 27,41 19,03 17,28 19,30 16,232.Vj 22,31 11,73 29,89 29,87 20,01 17,76 31,32 32,92 20,63 18,96 21,27 16,853.Vj 21,16 11,62 25,90 25,87 18,37 17,83 30,31 30,88 20,58 18,39 21,22 16,274.Vj 22,92 12,29 27,85 27,78 20,05 18,53 32,36 38,97 21,50 19,71 23,10 18,09
2010 1.Vj 20,00 11,52 25,36 25,28 18,06 15,98 28,32 27,90 18,88 17,35 19,65 16,652.Vj 22,31 11,98 29,70 29,66 20,01 17,74 31,70 32,03 20,92 18,75 21,46 17,263.Vj 21,03 11,86 25,34 25,26 18,54 17,92 30,58 31,10 20,67 18,13 20,99 16,544.Vj 23,05 12,64 27,72 27,57 19,95 18,66 33,10 39,05 22,08 19,74 23,31 18,55
2011 1.Vj 20,36 11,55 25,49 25,38 18,48 16,15 29,05 28,68 19,91 17,80 20,08 17,092.Vj 23,17 12,28 30,87 30,83 20,58 18,06 33,01 33,50 22,29 19,53 22,48 17,893.Vj 21,72 11,90 26,08 26,00 19,05 18,41 31,62 31,72 21,92 19,11 21,76 16,984.Vj 23,96 12,83 28,86 28,71 21,01 19,35 34,21 39,66 23,11 20,74 24,32 19,14
2012 1.Vj 20,77 11,59 25,51 25,41 18,78 16,44 30,00 29,57 20,37 18,62 20,66 17,432.Vj 23,88 12,52 31,80 31,73 21,20 18,72 33,93 34,52 22,65 20,40 22,98 18,283.Vj 22,64 12,21 28,17 28,12 19,70 18,96 32,70 32,71 22,48 19,94 22,30 17,63
2007 1,3 1,3 2,4 2,6 1,3 1,2 0,6 4,5 – 0,7 0,4 1,0 – 0,4
2008 2,3 3,1 2,8 2,7 0,6 2,3 2,4 1,5 3,1 3,6 2,4 2,2
2009 3,4 3,0 3,5 3,3 5,8 2,3 2,3 2,0 1,7 4,9 4,8 4,8
2010 0,2 2,5 – 0,6 – 0,7 – 0,2 0,3 1,4 – 0,1 1,2 – 0,4 0,6 2,3
2011 3,2 0,9 2,9 2,9 3,3 2,4 3,5 2,6 5,9 4,3 3,7 3,1
2008 1.Vj 3,5 3,7 5,0 4,8 3,9 3,3 1,0 2,8 1,4 3,7 2,9 2,02.Vj 0,4 4,0 – 1,9 – 2,0 – 1,3 – 0,3 1,9 1,1 1,5 2,7 2,5 1,93.Vj 1,8 3,3 0,8 0,7 0,0 3,5 3,0 1,2 4,2 3,2 1,3 0,94.Vj 3,8 1,8 7,6 7,8 0,3 2,6 4,1 0,9 4,2 4,9 3,0 3,8
2009 1.Vj 3,8 3,9 4,6 4,5 4,3 3,2 3,4 – 0,9 4,7 5,8 4,9 4,52.Vj 5,9 2,4 9,2 9,1 10,1 5,3 3,3 3,7 4,2 7,3 5,6 6,23.Vj 4,2 3,7 5,3 5,3 5,6 1,5 3,0 3,2 1,0 5,3 6,6 5,54.Vj – 0,2 2,1 – 4,3 – 4,6 2,9 – 0,1 0,1 1,2 – 1,0 1,7 2,4 3,1
2010 1.Vj 0,6 1,7 0,5 0,6 – 1,1 – 0,2 0,6 1,8 – 0,8 0,4 1,8 2,62.Vj 0,0 2,1 – 0,6 – 0,7 0,0 – 0,1 1,2 – 2,7 1,4 – 1,1 0,9 2,43.Vj – 0,6 2,1 – 2,2 – 2,4 0,9 0,5 0,9 0,7 0,4 – 1,4 – 1,1 1,74.Vj 0,6 2,8 – 0,5 – 0,8 – 0,5 0,7 2,3 0,2 2,7 0,2 0,9 2,5
2011 1.Vj 1,8 0,3 0,5 0,4 2,3 1,1 2,6 2,8 5,5 2,6 2,2 2,62.Vj 3,9 2,5 3,9 3,9 2,8 1,8 4,1 4,6 6,5 4,2 4,8 3,73.Vj 3,3 0,3 2,9 2,9 2,8 2,7 3,4 2,0 6,0 5,4 3,7 2,74.Vj 3,9 1,5 4,1 4,1 5,3 3,7 3,4 1,6 4,7 5,1 4,3 3,2
2012 1.Vj 2,0 0,3 0,1 0,1 1,6 1,8 3,3 3,1 2,3 4,6 2,9 2,02.Vj 3,1 2,0 3,0 2,9 3,0 3,7 2,8 3,0 1,6 4,5 2,2 2,23.Vj 4,2 2,6 8,0 8,2 3,4 3,0 3,4 3,1 2,6 4,3 2,5 3,8
*) Quelle für geleistete Arbeitsstunden: Institut für Arbeitsmarkt- und Berufsforschung (IAB) der Bundesagentur für Arbeit (BA), Nürnberg.
Unter-nehmens-
dienst-leister
ÖffentlicheDienst-leister,
Erziehung,Gesund-
heit
SonstigeDienst-leister
Finanz-und
Versiche-rungs-dienst-leister
Grund-stücks-
undWohnungs-
wesen
Jahr,Vierteljahr
Insgesamt
Handel,Verkehr,
Gast-gewerbe
Veränderung gegenüber dem entsprechenden Vorjahreszeitraum in %
Informa-tion und
Kommuni-kation
Prod. Gewerbeohne BaugewerbeLand- und
Forst-wirtschaft,Fischerei
Bau-gewerbe
Statistisches Bundesamt, Fachserie 18, Reihe 1.2, 3.Vj 2012
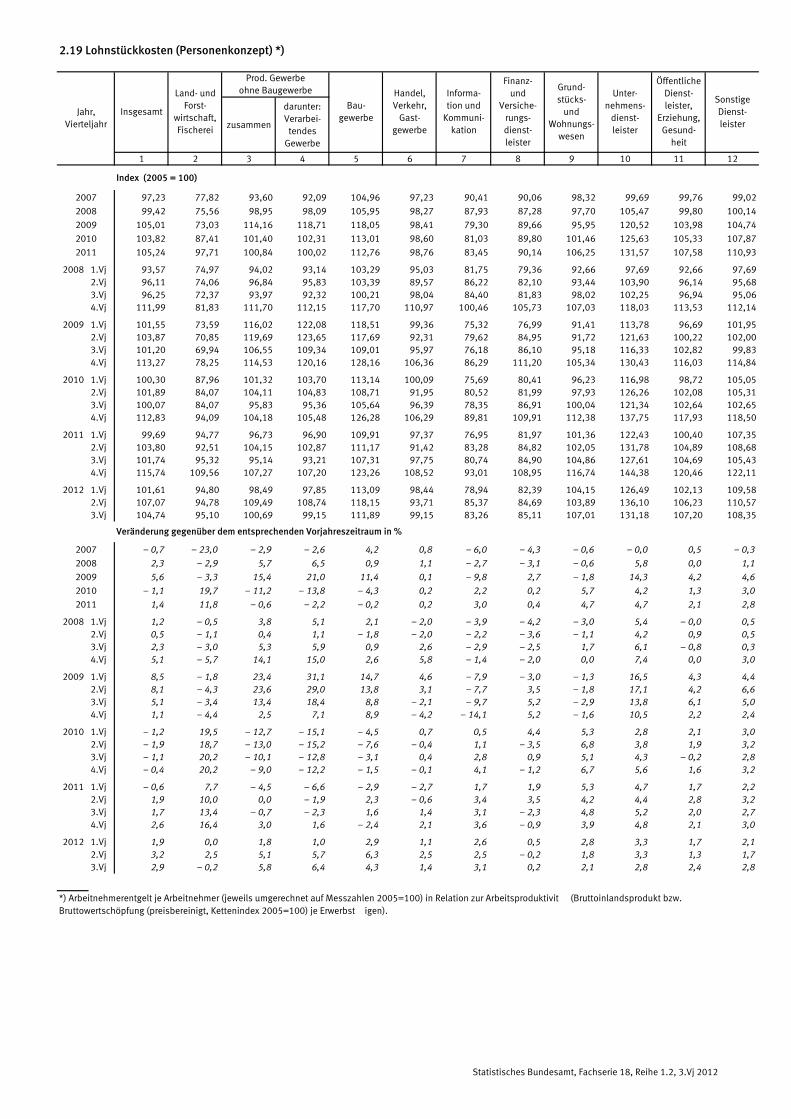
2.19 Lohnstückkosten (Personenkonzept) *)
zusammen
darunter:Verarbei-
tendesGewerbe
1 2 3 4 5 6 7 8 9 10 11 12
Index (2005 = 100)
2007 97,23 77,82 93,60 92,09 104,96 97,23 90,41 90,06 98,32 99,69 99,76 99,02
2008 99,42 75,56 98,95 98,09 105,95 98,27 87,93 87,28 97,70 105,47 99,80 100,14
2009 105,01 73,03 114,16 118,71 118,05 98,41 79,30 89,66 95,95 120,52 103,98 104,74
2010 103,82 87,41 101,40 102,31 113,01 98,60 81,03 89,80 101,46 125,63 105,33 107,87
2011 105,24 97,71 100,84 100,02 112,76 98,76 83,45 90,14 106,25 131,57 107,58 110,93
2008 1.Vj 93,57 74,97 94,02 93,14 103,29 95,03 81,75 79,36 92,66 97,69 92,66 97,692.Vj 96,11 74,06 96,84 95,83 103,39 89,57 86,22 82,10 93,44 103,90 96,14 95,683.Vj 96,25 72,37 93,97 92,32 100,21 98,04 84,40 81,83 98,02 102,25 96,94 95,064.Vj 111,99 81,83 111,70 112,15 117,70 110,97 100,46 105,73 107,03 118,03 113,53 112,14
2009 1.Vj 101,55 73,59 116,02 122,08 118,51 99,36 75,32 76,99 91,41 113,78 96,69 101,952.Vj 103,87 70,85 119,69 123,65 117,69 92,31 79,62 84,95 91,72 121,63 100,22 102,003.Vj 101,20 69,94 106,55 109,34 109,01 95,97 76,18 86,10 95,18 116,33 102,82 99,834.Vj 113,27 78,25 114,53 120,16 128,16 106,36 86,29 111,20 105,34 130,43 116,03 114,84
2010 1.Vj 100,30 87,96 101,32 103,70 113,14 100,09 75,69 80,41 96,23 116,98 98,72 105,052.Vj 101,89 84,07 104,11 104,83 108,71 91,95 80,52 81,99 97,93 126,26 102,08 105,313.Vj 100,07 84,07 95,83 95,36 105,64 96,39 78,35 86,91 100,04 121,34 102,64 102,654.Vj 112,83 94,09 104,18 105,48 126,28 106,29 89,81 109,91 112,38 137,75 117,93 118,50
2011 1.Vj 99,69 94,77 96,73 96,90 109,91 97,37 76,95 81,97 101,36 122,43 100,40 107,352.Vj 103,80 92,51 104,15 102,87 111,17 91,42 83,28 84,82 102,05 131,78 104,89 108,683.Vj 101,74 95,32 95,14 93,21 107,31 97,75 80,74 84,90 104,86 127,61 104,69 105,434.Vj 115,74 109,56 107,27 107,20 123,26 108,52 93,01 108,95 116,74 144,38 120,46 122,11
2012 1.Vj 101,61 94,80 98,49 97,85 113,09 98,44 78,94 82,39 104,15 126,49 102,13 109,582.Vj 107,07 94,78 109,49 108,74 118,15 93,71 85,37 84,69 103,89 136,10 106,23 110,573.Vj 104,74 95,10 100,69 99,15 111,89 99,15 83,26 85,11 107,01 131,18 107,20 108,35
2007 – 0,7 – 23,0 – 2,9 – 2,6 4,2 0,8 – 6,0 – 4,3 – 0,6 – 0,0 0,5 – 0,3
2008 2,3 – 2,9 5,7 6,5 0,9 1,1 – 2,7 – 3,1 – 0,6 5,8 0,0 1,1
2009 5,6 – 3,3 15,4 21,0 11,4 0,1 – 9,8 2,7 – 1,8 14,3 4,2 4,6
2010 – 1,1 19,7 – 11,2 – 13,8 – 4,3 0,2 2,2 0,2 5,7 4,2 1,3 3,0
2011 1,4 11,8 – 0,6 – 2,2 – 0,2 0,2 3,0 0,4 4,7 4,7 2,1 2,8
2008 1.Vj 1,2 – 0,5 3,8 5,1 2,1 – 2,0 – 3,9 – 4,2 – 3,0 5,4 – 0,0 0,52.Vj 0,5 – 1,1 0,4 1,1 – 1,8 – 2,0 – 2,2 – 3,6 – 1,1 4,2 0,9 0,53.Vj 2,3 – 3,0 5,3 5,9 0,9 2,6 – 2,9 – 2,5 1,7 6,1 – 0,8 0,34.Vj 5,1 – 5,7 14,1 15,0 2,6 5,8 – 1,4 – 2,0 0,0 7,4 0,0 3,0
2009 1.Vj 8,5 – 1,8 23,4 31,1 14,7 4,6 – 7,9 – 3,0 – 1,3 16,5 4,3 4,42.Vj 8,1 – 4,3 23,6 29,0 13,8 3,1 – 7,7 3,5 – 1,8 17,1 4,2 6,63.Vj 5,1 – 3,4 13,4 18,4 8,8 – 2,1 – 9,7 5,2 – 2,9 13,8 6,1 5,04.Vj 1,1 – 4,4 2,5 7,1 8,9 – 4,2 – 14,1 5,2 – 1,6 10,5 2,2 2,4
2010 1.Vj – 1,2 19,5 – 12,7 – 15,1 – 4,5 0,7 0,5 4,4 5,3 2,8 2,1 3,02.Vj – 1,9 18,7 – 13,0 – 15,2 – 7,6 – 0,4 1,1 – 3,5 6,8 3,8 1,9 3,23.Vj – 1,1 20,2 – 10,1 – 12,8 – 3,1 0,4 2,8 0,9 5,1 4,3 – 0,2 2,84.Vj – 0,4 20,2 – 9,0 – 12,2 – 1,5 – 0,1 4,1 – 1,2 6,7 5,6 1,6 3,2
2011 1.Vj – 0,6 7,7 – 4,5 – 6,6 – 2,9 – 2,7 1,7 1,9 5,3 4,7 1,7 2,22.Vj 1,9 10,0 0,0 – 1,9 2,3 – 0,6 3,4 3,5 4,2 4,4 2,8 3,23.Vj 1,7 13,4 – 0,7 – 2,3 1,6 1,4 3,1 – 2,3 4,8 5,2 2,0 2,74.Vj 2,6 16,4 3,0 1,6 – 2,4 2,1 3,6 – 0,9 3,9 4,8 2,1 3,0
2012 1.Vj 1,9 0,0 1,8 1,0 2,9 1,1 2,6 0,5 2,8 3,3 1,7 2,12.Vj 3,2 2,5 5,1 5,7 6,3 2,5 2,5 – 0,2 1,8 3,3 1,3 1,73.Vj 2,9 – 0,2 5,8 6,4 4,3 1,4 3,1 0,2 2,1 2,8 2,4 2,8
*) Arbeitnehmerentgelt je Arbeitnehmer (jeweils umgerechnet auf Messzahlen 2005=100) in Relation zur Arbeitsproduktivität (Bruttoinlandsprodukt bzw. Bruttowertschöpfung (preisbereinigt, Kettenindex 2005=100) je Erwerbstätigen).
Unter-nehmens-
dienst-leister
ÖffentlicheDienst-leister,
Erziehung,Gesund-
heit
SonstigeDienst-leister
Finanz-und
Versiche-rungs-dienst-leister
Grund-stücks-
undWohnungs-
wesen
Jahr,Vierteljahr
Insgesamt
Handel,Verkehr,
Gast-gewerbe
Veränderung gegenüber dem entsprechenden Vorjahreszeitraum in %
Informa-tion und
Kommuni-kation
Prod. Gewerbeohne BaugewerbeLand- und
Forst-wirtschaft,Fischerei
Bau-gewerbe
Statistisches Bundesamt, Fachserie 18, Reihe 1.2, 3.Vj 2012

2.20 Lohnstückkosten (Stundenkonzept) *)
zusammen
darunter:Verarbei-
tendesGewerbe
1 2 3 4 5 6 7 8 9 10 11 12
Index (2005 = 100)
2007 96,69 74,17 93,35 91,90 104,05 96,61 89,98 90,13 98,09 97,84 99,63 97,90
2008 98,88 72,70 98,72 97,95 104,97 97,52 87,72 87,50 97,86 103,19 99,68 98,87
2009 104,98 71,06 114,29 119,02 117,82 98,00 79,54 90,26 96,94 119,40 103,98 103,23
2010 103,37 84,50 101,33 102,36 112,66 97,72 80,91 89,98 103,02 123,38 105,23 105,86
2011 104,63 93,59 100,65 99,94 112,41 97,63 82,99 90,20 108,81 128,83 107,56 109,07
2008 1.Vj 92,49 62,32 93,68 92,89 103,63 93,97 80,86 79,10 91,63 95,15 92,30 96,022.Vj 96,22 81,04 96,65 95,73 101,93 89,47 86,64 82,93 93,88 102,57 96,29 95,413.Vj 96,06 77,68 93,73 92,19 98,44 97,48 84,21 82,41 98,16 100,21 96,94 94,124.Vj 110,97 69,00 111,60 112,19 116,88 109,59 99,85 105,77 107,10 114,90 113,22 109,89
2009 1.Vj 101,07 62,75 116,10 122,33 119,96 98,65 75,38 77,26 92,02 112,20 96,58 100,472.Vj 104,20 77,20 120,03 124,27 116,50 92,09 79,80 85,61 92,78 120,58 100,19 100,643.Vj 101,73 76,11 106,80 109,76 107,94 95,94 76,88 87,06 96,52 115,91 103,04 98,844.Vj 112,79 67,77 114,60 120,40 128,38 105,53 86,56 111,89 106,65 128,95 116,02 112,92
2010 1.Vj 99,52 74,31 101,33 103,85 114,87 98,91 75,30 80,38 97,04 114,88 98,43 102,702.Vj 101,83 90,68 104,16 105,06 107,51 91,36 80,62 82,32 99,83 124,32 102,01 103,523.Vj 99,91 90,42 95,78 95,41 104,21 95,66 78,43 87,39 101,70 119,19 102,69 100,954.Vj 111,97 80,57 103,97 105,34 126,42 105,14 89,82 109,99 114,58 134,99 117,91 116,46
2011 1.Vj 98,82 79,32 96,54 96,80 110,90 96,12 76,30 81,85 103,47 119,80 100,27 105,482.Vj 103,61 100,02 104,03 102,87 109,89 90,67 83,00 85,24 105,09 129,41 104,92 107,093.Vj 101,48 101,48 95,00 93,17 105,98 96,82 80,37 85,20 107,58 125,13 104,81 103,894.Vj 114,61 92,61 107,00 107,00 123,43 106,91 92,20 108,60 118,94 140,82 120,32 119,60
2012 1.Vj 100,77 79,45 98,21 97,68 114,20 97,11 78,44 82,32 106,32 124,03 102,12 107,892.Vj 106,59 101,46 109,27 108,60 116,63 92,64 84,89 84,66 106,41 133,07 106,10 108,683.Vj 104,68 101,01 100,83 99,40 110,84 98,12 83,09 85,29 110,00 128,66 107,29 107,02
2007 – 1,0 – 23,9 – 3,1 – 2,8 3,8 0,6 – 6,4 – 4,5 – 0,7 – 0,8 0,5 – 0,8
2008 2,3 – 2,0 5,8 6,6 0,9 0,9 – 2,5 – 2,9 – 0,2 5,5 0,1 1,0
2009 6,2 – 2,3 15,8 21,5 12,2 0,5 – 9,3 3,2 – 0,9 15,7 4,3 4,4
2010 – 1,5 18,9 – 11,3 – 14,0 – 4,4 – 0,3 1,7 – 0,3 6,3 3,3 1,2 2,5
2011 1,2 10,8 – 0,7 – 2,4 – 0,2 – 0,1 2,6 0,2 5,6 4,4 2,2 3,0
2008 1.Vj 1,0 – 2,0 3,8 5,1 2,1 – 2,2 – 4,6 – 4,6 – 3,5 4,6 – 0,2 0,12.Vj 0,8 1,1 0,4 1,1 – 1,5 – 1,8 – 1,4 – 2,8 – 0,2 4,6 1,2 1,23.Vj 2,0 – 2,3 5,1 5,8 0,6 2,1 – 2,9 – 2,6 1,0 5,4 – 1,0 – 0,14.Vj 5,4 – 4,7 14,4 15,4 2,7 5,8 – 0,7 – 1,6 0,9 7,4 0,1 2,8
2009 1.Vj 9,3 0,7 23,9 31,7 15,8 5,0 – 6,8 – 2,3 0,4 17,9 4,6 4,62.Vj 8,3 – 4,7 24,2 29,8 14,3 2,9 – 7,9 3,2 – 1,2 17,6 4,1 5,53.Vj 5,9 – 2,0 13,9 19,1 9,7 – 1,6 – 8,7 5,6 – 1,7 15,7 6,3 5,04.Vj 1,6 – 1,8 2,7 7,3 9,8 – 3,7 – 13,3 5,8 – 0,4 12,2 2,5 2,8
2010 1.Vj – 1,5 18,4 – 12,7 – 15,1 – 4,2 0,3 – 0,1 4,0 5,5 2,4 1,9 2,22.Vj – 2,3 17,5 – 13,2 – 15,5 – 7,7 – 0,8 1,0 – 3,8 7,6 3,1 1,8 2,93.Vj – 1,8 18,8 – 10,3 – 13,1 – 3,5 – 0,3 2,0 0,4 5,4 2,8 – 0,3 2,14.Vj – 0,7 18,9 – 9,3 – 12,5 – 1,5 – 0,4 3,8 – 1,7 7,4 4,7 1,6 3,1
2011 1.Vj – 0,7 6,7 – 4,7 – 6,8 – 3,5 – 2,8 1,3 1,8 6,6 4,3 1,9 2,72.Vj 1,7 10,3 – 0,1 – 2,1 2,2 – 0,8 3,0 3,5 5,3 4,1 2,9 3,43.Vj 1,6 12,2 – 0,8 – 2,3 1,7 1,2 2,5 – 2,5 5,8 5,0 2,1 2,94.Vj 2,4 14,9 2,9 1,6 – 2,4 1,7 2,6 – 1,3 3,8 4,3 2,0 2,7
2012 1.Vj 2,0 0,2 1,7 0,9 3,0 1,0 2,8 0,6 2,8 3,5 1,8 2,32.Vj 2,9 1,4 5,0 5,6 6,1 2,2 2,3 – 0,7 1,3 2,8 1,1 1,53.Vj 3,2 – 0,5 6,1 6,7 4,6 1,3 3,4 0,1 2,2 2,8 2,4 3,0
*) Arbeitnehmerentgelt je geleisteter Arbeitnehmerstunde (jeweils umgerechnet auf Messzahlen 2005=100) in Relation zur Arbeitsproduktivität (Bruttoinlands-produkt bzw. Bruttowertschöpfung (preisbereinigt, Kettenindex 2005=100) je geleisteter Erwerbstätigenstunde). � Quelle für geleistete Arbeitsstunden: Institutfür Arbeitsmarkt- und Berufsforschung (IAB) der Bundesagentur für Arbeit (BA), Nürnberg.
Jahr,Vierteljahr
Insgesamt
Handel,Verkehr,
Gast-gewerbe
Veränderung gegenüber dem entsprechenden Vorjahreszeitraum in %
Informa-tion und
Kommuni-kation
Prod. Gewerbeohne BaugewerbeLand- und
Forst-wirtschaft,Fischerei
Bau-gewerbe
Unter-nehmens-
dienst-leister
ÖffentlicheDienst-leister,
Erziehung,Gesund-
heit
SonstigeDienst-leister
Finanz-und
Versiche-rungs-dienst-leister
Grund-stücks-
undWohnungs-
wesen
Statistisches Bundesamt, Fachserie 18, Reihe 1.2, 3.Vj 2012
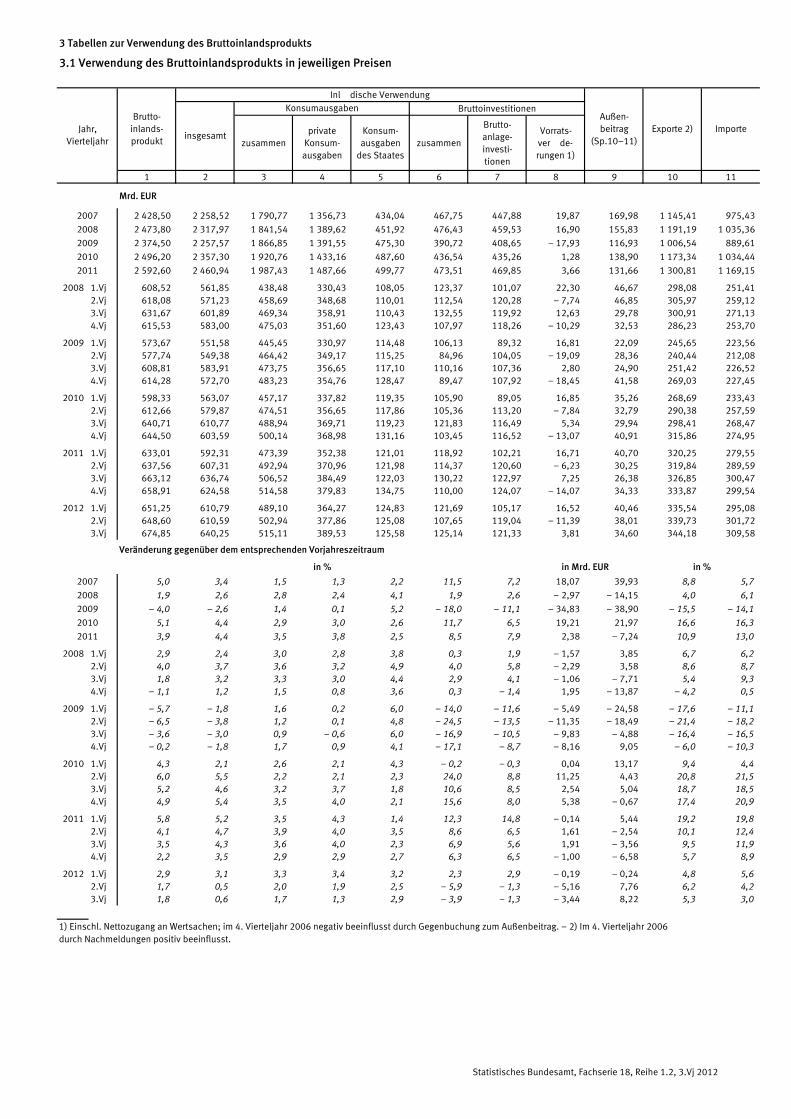
3 Tabellen zur Verwendung des Bruttoinlandsprodukts
3.1 Verwendung des Bruttoinlandsprodukts in jeweiligen Preisen
Inländische Verwendung
Bruttoinvestitionen
zusammenprivate
Konsum-ausgaben
Konsum-ausgaben
des Staateszusammen
Brutto-anlage-investi-tionen
Vorrats-verände-rungen 1)
1 2 3 4 5 6 7 8 9 10 11
Mrd. EUR
2007 2 428,50 2 258,52 1 790,77 1 356,73 434,04 467,75 447,88 19,87 169,98 1 145,41 975,43
2008 2 473,80 2 317,97 1 841,54 1 389,62 451,92 476,43 459,53 16,90 155,83 1 191,19 1 035,36
2009 2 374,50 2 257,57 1 866,85 1 391,55 475,30 390,72 408,65 � 17,93 116,93 1 006,54 889,61
2010 2 496,20 2 357,30 1 920,76 1 433,16 487,60 436,54 435,26 1,28 138,90 1 173,34 1 034,44
2011 2 592,60 2 460,94 1 987,43 1 487,66 499,77 473,51 469,85 3,66 131,66 1 300,81 1 169,15
2008 1.Vj 608,52 561,85 438,48 330,43 108,05 123,37 101,07 22,30 46,67 298,08 251,41 2.Vj 618,08 571,23 458,69 348,68 110,01 112,54 120,28 � 7,74 46,85 305,97 259,12 3.Vj 631,67 601,89 469,34 358,91 110,43 132,55 119,92 12,63 29,78 300,91 271,13 4.Vj 615,53 583,00 475,03 351,60 123,43 107,97 118,26 � 10,29 32,53 286,23 253,70
2009 1.Vj 573,67 551,58 445,45 330,97 114,48 106,13 89,32 16,81 22,09 245,65 223,56 2.Vj 577,74 549,38 464,42 349,17 115,25 84,96 104,05 � 19,09 28,36 240,44 212,08 3.Vj 608,81 583,91 473,75 356,65 117,10 110,16 107,36 2,80 24,90 251,42 226,52 4.Vj 614,28 572,70 483,23 354,76 128,47 89,47 107,92 � 18,45 41,58 269,03 227,45
2010 1.Vj 598,33 563,07 457,17 337,82 119,35 105,90 89,05 16,85 35,26 268,69 233,43 2.Vj 612,66 579,87 474,51 356,65 117,86 105,36 113,20 � 7,84 32,79 290,38 257,59 3.Vj 640,71 610,77 488,94 369,71 119,23 121,83 116,49 5,34 29,94 298,41 268,47 4.Vj 644,50 603,59 500,14 368,98 131,16 103,45 116,52 � 13,07 40,91 315,86 274,95
2011 1.Vj 633,01 592,31 473,39 352,38 121,01 118,92 102,21 16,71 40,70 320,25 279,55 2.Vj 637,56 607,31 492,94 370,96 121,98 114,37 120,60 � 6,23 30,25 319,84 289,59 3.Vj 663,12 636,74 506,52 384,49 122,03 130,22 122,97 7,25 26,38 326,85 300,47 4.Vj 658,91 624,58 514,58 379,83 134,75 110,00 124,07 � 14,07 34,33 333,87 299,54
2012 1.Vj 651,25 610,79 489,10 364,27 124,83 121,69 105,17 16,52 40,46 335,54 295,08 2.Vj 648,60 610,59 502,94 377,86 125,08 107,65 119,04 � 11,39 38,01 339,73 301,72 3.Vj 674,85 640,25 515,11 389,53 125,58 125,14 121,33 3,81 34,60 344,18 309,58
2007 5,0 3,4 1,5 1,3 2,2 11,5 7,2 18,07 39,93 8,8 5,7
2008 1,9 2,6 2,8 2,4 4,1 1,9 2,6 � 2,97 � 14,15 4,0 6,1
2009 – 4,0 – 2,6 1,4 0,1 5,2 – 18,0 – 11,1 � 34,83 � 38,90 – 15,5 – 14,1
2010 5,1 4,4 2,9 3,0 2,6 11,7 6,5 19,21 21,97 16,6 16,3
2011 3,9 4,4 3,5 3,8 2,5 8,5 7,9 2,38 � 7,24 10,9 13,0
2008 1.Vj 2,9 2,4 3,0 2,8 3,8 0,3 1,9 � 1,57 3,85 6,7 6,2 2.Vj 4,0 3,7 3,6 3,2 4,9 4,0 5,8 � 2,29 3,58 8,6 8,7 3.Vj 1,8 3,2 3,3 3,0 4,4 2,9 4,1 � 1,06 � 7,71 5,4 9,3 4.Vj – 1,1 1,2 1,5 0,8 3,6 0,3 – 1,4 1,95 � 13,87 – 4,2 0,5
2009 1.Vj – 5,7 – 1,8 1,6 0,2 6,0 – 14,0 – 11,6 � 5,49 � 24,58 – 17,6 – 11,1 2.Vj – 6,5 – 3,8 1,2 0,1 4,8 – 24,5 – 13,5 � 11,35 � 18,49 – 21,4 – 18,2 3.Vj – 3,6 – 3,0 0,9 – 0,6 6,0 – 16,9 – 10,5 � 9,83 � 4,88 – 16,4 – 16,5 4.Vj – 0,2 – 1,8 1,7 0,9 4,1 – 17,1 – 8,7 � 8,16 9,05 – 6,0 – 10,3
2010 1.Vj 4,3 2,1 2,6 2,1 4,3 – 0,2 – 0,3 0,04 13,17 9,4 4,4 2.Vj 6,0 5,5 2,2 2,1 2,3 24,0 8,8 11,25 4,43 20,8 21,5 3.Vj 5,2 4,6 3,2 3,7 1,8 10,6 8,5 2,54 5,04 18,7 18,5 4.Vj 4,9 5,4 3,5 4,0 2,1 15,6 8,0 5,38 � 0,67 17,4 20,9
2011 1.Vj 5,8 5,2 3,5 4,3 1,4 12,3 14,8 � 0,14 5,44 19,2 19,8 2.Vj 4,1 4,7 3,9 4,0 3,5 8,6 6,5 1,61 � 2,54 10,1 12,4 3.Vj 3,5 4,3 3,6 4,0 2,3 6,9 5,6 1,91 � 3,56 9,5 11,9 4.Vj 2,2 3,5 2,9 2,9 2,7 6,3 6,5 � 1,00 � 6,58 5,7 8,9
2012 1.Vj 2,9 3,1 3,3 3,4 3,2 2,3 2,9 � 0,19 � 0,24 4,8 5,6 2.Vj 1,7 0,5 2,0 1,9 2,5 – 5,9 – 1,3 � 5,16 7,76 6,2 4,2 3.Vj 1,8 0,6 1,7 1,3 2,9 – 3,9 – 1,3 � 3,44 8,22 5,3 3,0
1) Einschl. Nettozugang an Wertsachen; im 4. Vierteljahr 2006 negativ beeinflusst durch Gegenbuchung zum Außenbeitrag. � 2) Im 4. Vierteljahr 2006 durch Nachmeldungen positiv beeinflusst.
Veränderung gegenüber dem entsprechenden Vorjahreszeitraum
in % in Mrd. EUR in %
ImporteAußen-beitrag
(Sp.10�11)Exporte 2)Jahr,
Vierteljahr
Brutto-inlands-produkt
insgesamt
Konsumausgaben
Statistisches Bundesamt, Fachserie 18, Reihe 1.2, 3.Vj 2012
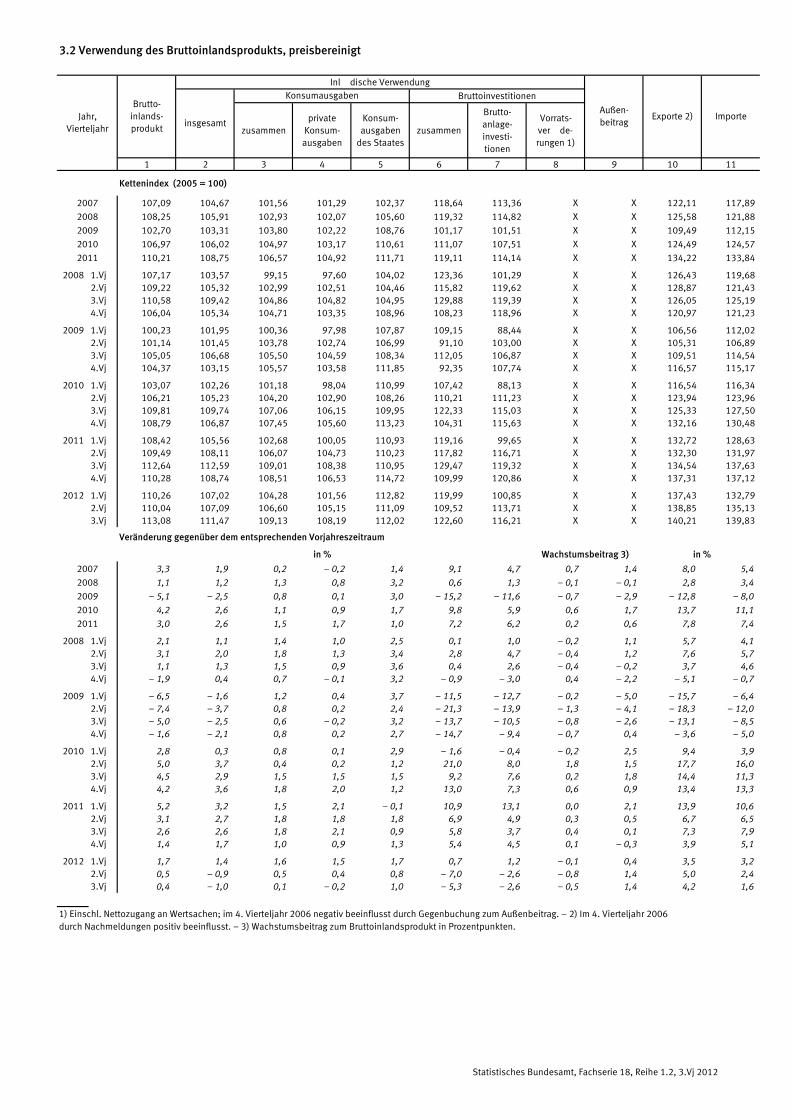
3.2 Verwendung des Bruttoinlandsprodukts, preisbereinigt
Inländische Verwendung
Bruttoinvestitionen
zusammenprivate
Konsum-ausgaben
Konsum-ausgaben
des Staateszusammen
Brutto-anlage-investi-tionen
Vorrats-verände-rungen 1)
1 2 3 4 5 6 7 8 9 10 11
Kettenindex (2005 = 100)
2007 107,09 104,67 101,56 101,29 102,37 118,64 113,36 X X 122,11 117,89
2008 108,25 105,91 102,93 102,07 105,60 119,32 114,82 X X 125,58 121,88
2009 102,70 103,31 103,80 102,22 108,76 101,17 101,51 X X 109,49 112,15
2010 106,97 106,02 104,97 103,17 110,61 111,07 107,51 X X 124,49 124,57
2011 110,21 108,75 106,57 104,92 111,71 119,11 114,14 X X 134,22 133,84
2008 1.Vj 107,17 103,57 99,15 97,60 104,02 123,36 101,29 X X 126,43 119,68 2.Vj 109,22 105,32 102,99 102,51 104,46 115,82 119,62 X X 128,87 121,43 3.Vj 110,58 109,42 104,86 104,82 104,95 129,88 119,39 X X 126,05 125,19 4.Vj 106,04 105,34 104,71 103,35 108,96 108,23 118,96 X X 120,97 121,23
2009 1.Vj 100,23 101,95 100,36 97,98 107,87 109,15 88,44 X X 106,56 112,02 2.Vj 101,14 101,45 103,78 102,74 106,99 91,10 103,00 X X 105,31 106,89 3.Vj 105,05 106,68 105,50 104,59 108,34 112,05 106,87 X X 109,51 114,54 4.Vj 104,37 103,15 105,57 103,58 111,85 92,35 107,74 X X 116,57 115,17
2010 1.Vj 103,07 102,26 101,18 98,04 110,99 107,42 88,13 X X 116,54 116,34 2.Vj 106,21 105,23 104,20 102,90 108,26 110,21 111,23 X X 123,94 123,96 3.Vj 109,81 109,74 107,06 106,15 109,95 122,33 115,03 X X 125,33 127,50 4.Vj 108,79 106,87 107,45 105,60 113,23 104,31 115,63 X X 132,16 130,48
2011 1.Vj 108,42 105,56 102,68 100,05 110,93 119,16 99,65 X X 132,72 128,63 2.Vj 109,49 108,11 106,07 104,73 110,23 117,82 116,71 X X 132,30 131,97 3.Vj 112,64 112,59 109,01 108,38 110,95 129,47 119,32 X X 134,54 137,63 4.Vj 110,28 108,74 108,51 106,53 114,72 109,99 120,86 X X 137,31 137,12
2012 1.Vj 110,26 107,02 104,28 101,56 112,82 119,99 100,85 X X 137,43 132,79 2.Vj 110,04 107,09 106,60 105,15 111,09 109,52 113,71 X X 138,85 135,13 3.Vj 113,08 111,47 109,13 108,19 112,02 122,60 116,21 X X 140,21 139,83
2007 3,3 1,9 0,2 – 0,2 1,4 9,1 4,7 0,7 1,4 8,0 5,4
2008 1,1 1,2 1,3 0,8 3,2 0,6 1,3 – 0,1 – 0,1 2,8 3,4
2009 – 5,1 – 2,5 0,8 0,1 3,0 – 15,2 – 11,6 – 0,7 – 2,9 – 12,8 – 8,0
2010 4,2 2,6 1,1 0,9 1,7 9,8 5,9 0,6 1,7 13,7 11,1
2011 3,0 2,6 1,5 1,7 1,0 7,2 6,2 0,2 0,6 7,8 7,4
2008 1.Vj 2,1 1,1 1,4 1,0 2,5 0,1 1,0 – 0,2 1,1 5,7 4,1 2.Vj 3,1 2,0 1,8 1,3 3,4 2,8 4,7 – 0,4 1,2 7,6 5,7 3.Vj 1,1 1,3 1,5 0,9 3,6 0,4 2,6 – 0,4 – 0,2 3,7 4,6 4.Vj – 1,9 0,4 0,7 – 0,1 3,2 – 0,9 – 3,0 0,4 – 2,2 – 5,1 – 0,7
2009 1.Vj – 6,5 – 1,6 1,2 0,4 3,7 – 11,5 – 12,7 – 0,2 – 5,0 – 15,7 – 6,4 2.Vj – 7,4 – 3,7 0,8 0,2 2,4 – 21,3 – 13,9 – 1,3 – 4,1 – 18,3 – 12,0 3.Vj – 5,0 – 2,5 0,6 – 0,2 3,2 – 13,7 – 10,5 – 0,8 – 2,6 – 13,1 – 8,5 4.Vj – 1,6 – 2,1 0,8 0,2 2,7 – 14,7 – 9,4 – 0,7 0,4 – 3,6 – 5,0
2010 1.Vj 2,8 0,3 0,8 0,1 2,9 – 1,6 – 0,4 – 0,2 2,5 9,4 3,9 2.Vj 5,0 3,7 0,4 0,2 1,2 21,0 8,0 1,8 1,5 17,7 16,0 3.Vj 4,5 2,9 1,5 1,5 1,5 9,2 7,6 0,2 1,8 14,4 11,3 4.Vj 4,2 3,6 1,8 2,0 1,2 13,0 7,3 0,6 0,9 13,4 13,3
2011 1.Vj 5,2 3,2 1,5 2,1 – 0,1 10,9 13,1 0,0 2,1 13,9 10,6 2.Vj 3,1 2,7 1,8 1,8 1,8 6,9 4,9 0,3 0,5 6,7 6,5 3.Vj 2,6 2,6 1,8 2,1 0,9 5,8 3,7 0,4 0,1 7,3 7,9 4.Vj 1,4 1,7 1,0 0,9 1,3 5,4 4,5 0,1 – 0,3 3,9 5,1
2012 1.Vj 1,7 1,4 1,6 1,5 1,7 0,7 1,2 – 0,1 0,4 3,5 3,2 2.Vj 0,5 – 0,9 0,5 0,4 0,8 – 7,0 – 2,6 – 0,8 1,4 5,0 2,4 3.Vj 0,4 – 1,0 0,1 – 0,2 1,0 – 5,3 – 2,6 – 0,5 1,4 4,2 1,6
1) Einschl. Nettozugang an Wertsachen; im 4. Vierteljahr 2006 negativ beeinflusst durch Gegenbuchung zum Außenbeitrag. � 2) Im 4. Vierteljahr 2006 durch Nachmeldungen positiv beeinflusst. � 3) Wachstumsbeitrag zum Bruttoinlandsprodukt in Prozentpunkten.
Jahr,Vierteljahr
Brutto-inlands-produkt
insgesamt
Konsumausgaben
in % Wachstumsbeitrag 3) in %
Außen-beitrag
Exporte 2)
Veränderung gegenüber dem entsprechenden Vorjahreszeitraum
Importe
Statistisches Bundesamt, Fachserie 18, Reihe 1.2, 3.Vj 2012
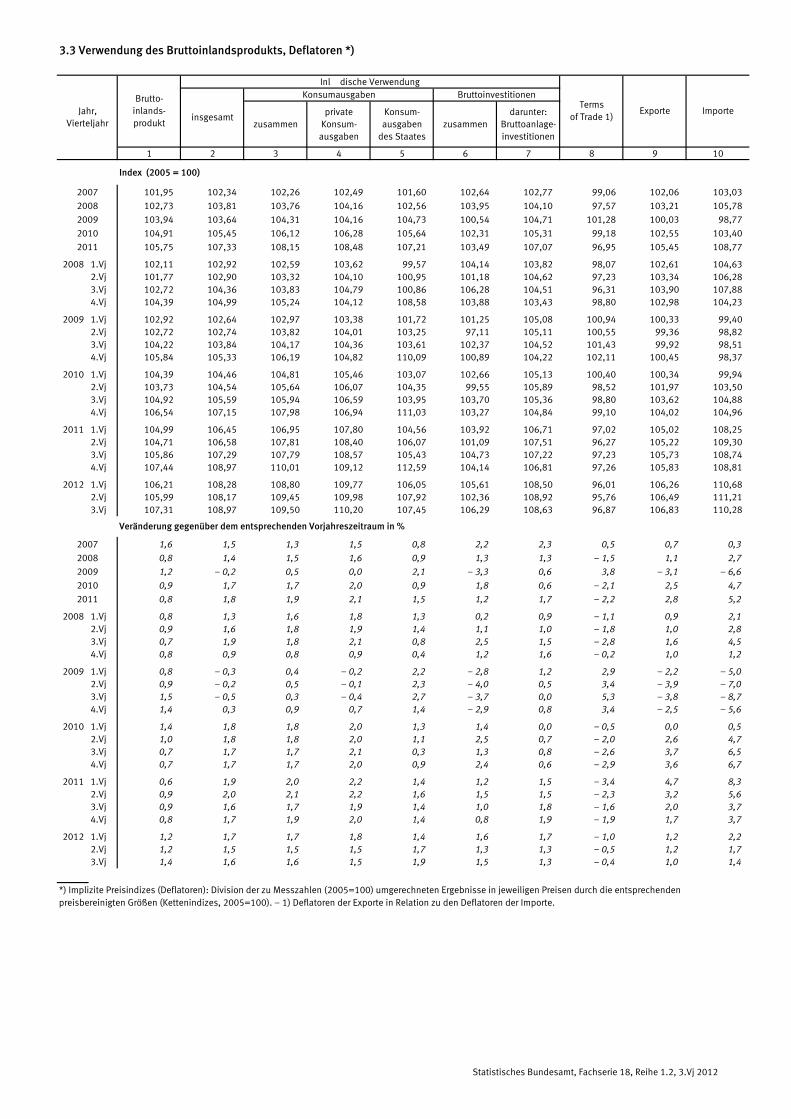
3.3 Verwendung des Bruttoinlandsprodukts, Deflatoren *)
Inländische VerwendungKonsumausgaben Bruttoinvestitionen
zusammenprivate
Konsum-ausgaben
Konsum-ausgaben
des Staateszusammen
darunter:Bruttoanlage-investitionen
1 2 3 4 5 6 7 8 9 10
Index (2005 = 100)
2007 101,95 102,34 102,26 102,49 101,60 102,64 102,77 99,06 102,06 103,03
2008 102,73 103,81 103,76 104,16 102,56 103,95 104,10 97,57 103,21 105,78
2009 103,94 103,64 104,31 104,16 104,73 100,54 104,71 101,28 100,03 98,77
2010 104,91 105,45 106,12 106,28 105,64 102,31 105,31 99,18 102,55 103,40
2011 105,75 107,33 108,15 108,48 107,21 103,49 107,07 96,95 105,45 108,77
2008 1.Vj 102,11 102,92 102,59 103,62 99,57 104,14 103,82 98,07 102,61 104,63 2.Vj 101,77 102,90 103,32 104,10 100,95 101,18 104,62 97,23 103,34 106,28 3.Vj 102,72 104,36 103,83 104,79 100,86 106,28 104,51 96,31 103,90 107,88 4.Vj 104,39 104,99 105,24 104,12 108,58 103,88 103,43 98,80 102,98 104,23
2009 1.Vj 102,92 102,64 102,97 103,38 101,72 101,25 105,08 100,94 100,33 99,40 2.Vj 102,72 102,74 103,82 104,01 103,25 97,11 105,11 100,55 99,36 98,82 3.Vj 104,22 103,84 104,17 104,36 103,61 102,37 104,52 101,43 99,92 98,51 4.Vj 105,84 105,33 106,19 104,82 110,09 100,89 104,22 102,11 100,45 98,37
2010 1.Vj 104,39 104,46 104,81 105,46 103,07 102,66 105,13 100,40 100,34 99,94 2.Vj 103,73 104,54 105,64 106,07 104,35 99,55 105,89 98,52 101,97 103,50 3.Vj 104,92 105,59 105,94 106,59 103,95 103,70 105,36 98,80 103,62 104,88 4.Vj 106,54 107,15 107,98 106,94 111,03 103,27 104,84 99,10 104,02 104,96
2011 1.Vj 104,99 106,45 106,95 107,80 104,56 103,92 106,71 97,02 105,02 108,25 2.Vj 104,71 106,58 107,81 108,40 106,07 101,09 107,51 96,27 105,22 109,30 3.Vj 105,86 107,29 107,79 108,57 105,43 104,73 107,22 97,23 105,73 108,74 4.Vj 107,44 108,97 110,01 109,12 112,59 104,14 106,81 97,26 105,83 108,81
2012 1.Vj 106,21 108,28 108,80 109,77 106,05 105,61 108,50 96,01 106,26 110,68 2.Vj 105,99 108,17 109,45 109,98 107,92 102,36 108,92 95,76 106,49 111,21 3.Vj 107,31 108,97 109,50 110,20 107,45 106,29 108,63 96,87 106,83 110,28
2007 1,6 1,5 1,3 1,5 0,8 2,2 2,3 0,5 0,7 0,3
2008 0,8 1,4 1,5 1,6 0,9 1,3 1,3 – 1,5 1,1 2,7
2009 1,2 – 0,2 0,5 0,0 2,1 – 3,3 0,6 3,8 – 3,1 – 6,6
2010 0,9 1,7 1,7 2,0 0,9 1,8 0,6 – 2,1 2,5 4,7
2011 0,8 1,8 1,9 2,1 1,5 1,2 1,7 – 2,2 2,8 5,2
2008 1.Vj 0,8 1,3 1,6 1,8 1,3 0,2 0,9 – 1,1 0,9 2,1 2.Vj 0,9 1,6 1,8 1,9 1,4 1,1 1,0 – 1,8 1,0 2,8 3.Vj 0,7 1,9 1,8 2,1 0,8 2,5 1,5 – 2,8 1,6 4,5 4.Vj 0,8 0,9 0,8 0,9 0,4 1,2 1,6 – 0,2 1,0 1,2
2009 1.Vj 0,8 – 0,3 0,4 – 0,2 2,2 – 2,8 1,2 2,9 – 2,2 – 5,0 2.Vj 0,9 – 0,2 0,5 – 0,1 2,3 – 4,0 0,5 3,4 – 3,9 – 7,0 3.Vj 1,5 – 0,5 0,3 – 0,4 2,7 – 3,7 0,0 5,3 – 3,8 – 8,7 4.Vj 1,4 0,3 0,9 0,7 1,4 – 2,9 0,8 3,4 – 2,5 – 5,6
2010 1.Vj 1,4 1,8 1,8 2,0 1,3 1,4 0,0 – 0,5 0,0 0,5 2.Vj 1,0 1,8 1,8 2,0 1,1 2,5 0,7 – 2,0 2,6 4,7 3.Vj 0,7 1,7 1,7 2,1 0,3 1,3 0,8 – 2,6 3,7 6,5 4.Vj 0,7 1,7 1,7 2,0 0,9 2,4 0,6 – 2,9 3,6 6,7
2011 1.Vj 0,6 1,9 2,0 2,2 1,4 1,2 1,5 – 3,4 4,7 8,3 2.Vj 0,9 2,0 2,1 2,2 1,6 1,5 1,5 – 2,3 3,2 5,6 3.Vj 0,9 1,6 1,7 1,9 1,4 1,0 1,8 – 1,6 2,0 3,7 4.Vj 0,8 1,7 1,9 2,0 1,4 0,8 1,9 – 1,9 1,7 3,7
2012 1.Vj 1,2 1,7 1,7 1,8 1,4 1,6 1,7 – 1,0 1,2 2,2 2.Vj 1,2 1,5 1,5 1,5 1,7 1,3 1,3 – 0,5 1,2 1,7 3.Vj 1,4 1,6 1,6 1,5 1,9 1,5 1,3 – 0,4 1,0 1,4
*) Implizite Preisindizes (Deflatoren): Division der zu Messzahlen (2005=100) umgerechneten Ergebnisse in jeweiligen Preisen durch die entsprechenden preisbereinigten Größen (Kettenindizes, 2005=100). � 1) Deflatoren der Exporte in Relation zu den Deflatoren der Importe.
Veränderung gegenüber dem entsprechenden Vorjahreszeitraum in %
Terms of Trade 1)
ExporteJahr,Vierteljahr
insgesamt
Brutto-inlands-produkt
Importe
Statistisches Bundesamt, Fachserie 18, Reihe 1.2, 3.Vj 2012

3.4 Konsum in jeweiligen Preisen
Konsumausgaben (Ausgabenkonzept) Konsum (Verbrauchskonzept) Nachrichtlich
zusammendarunter:
privateHaushalte
zusammendarunter:
Individual-konsum
1 2 3 4 5 6 7 8
EUR
2007 1 790,77 1 356,73 1 322,22 434,04 276,40 1 633,13 157,64 16 493
2008 1 841,54 1 389,62 1 354,40 451,92 287,11 1 676,73 164,81 16 922
2009 1 866,85 1 391,55 1 354,13 475,30 303,52 1 695,07 171,78 16 996
2010 1 920,76 1 433,16 1 393,77 487,60 312,10 1 745,26 175,50 17 530
2011 1 987,43 1 487,66 1 445,70 499,77 319,00 1 806,66 180,77 18 191
2008 1.Vj 438,48 330,43 321,72 108,05 69,07 399,50 38,98 4 021 2.Vj 458,69 348,68 340,38 110,01 70,97 419,65 39,04 4 245 3.Vj 469,34 358,91 350,15 110,43 70,55 429,46 39,88 4 371 4.Vj 475,03 351,60 342,15 123,43 76,52 428,12 46,91 4 285
2009 1.Vj 445,45 330,97 321,74 114,48 73,27 404,24 41,21 4 039 2.Vj 464,42 349,17 340,31 115,25 74,56 423,73 40,69 4 265 3.Vj 473,75 356,65 347,34 117,10 75,16 431,81 41,94 4 357 4.Vj 483,23 354,76 344,74 128,47 80,53 435,29 47,94 4 335
2010 1.Vj 457,17 337,82 327,90 119,35 76,67 414,49 42,68 4 131 2.Vj 474,51 356,65 347,31 117,86 76,70 433,35 41,16 4 363 3.Vj 488,94 369,71 359,91 119,23 76,98 446,69 42,25 4 523 4.Vj 500,14 368,98 358,65 131,16 81,75 450,73 49,41 4 513
2011 1.Vj 473,39 352,38 341,95 121,01 78,12 430,50 42,89 4 311 2.Vj 492,94 370,96 360,76 121,98 78,93 449,89 43,05 4 538 3.Vj 506,52 384,49 374,12 122,03 78,50 462,99 43,53 4 701 4.Vj 514,58 379,83 368,87 134,75 83,45 463,28 51,30 4 641
2012 1.Vj 489,10 364,27 353,38 124,83 80,57 444,84 44,26 4 451 2.Vj 502,94 377,86 367,71 125,08 80,78 458,64 44,30 4 615 3.Vj 515,11 389,53 378,74 125,58 80,54 470,07 45,04 4 754
2007 1,5 1,3 1,3 2,2 3,3 1,6 0,3 1,4
2008 2,8 2,4 2,4 4,1 3,9 2,7 4,5 2,6
2009 1,4 0,1 – 0,0 5,2 5,7 1,1 4,2 0,4
2010 2,9 3,0 2,9 2,6 2,8 3,0 2,2 3,1
2011 3,5 3,8 3,7 2,5 2,2 3,5 3,0 3,8
2008 1.Vj 3,0 2,8 2,9 3,8 3,2 2,9 4,8 2,9 2.Vj 3,6 3,2 3,2 4,9 5,1 3,5 4,4 3,3 3.Vj 3,3 3,0 3,1 4,4 3,9 3,1 5,2 3,2 4.Vj 1,5 0,8 0,7 3,6 3,3 1,2 4,0 1,0
2009 1.Vj 1,6 0,2 0,0 6,0 6,1 1,2 5,7 0,4 2.Vj 1,2 0,1 – 0,0 4,8 5,1 1,0 4,2 0,5 3.Vj 0,9 – 0,6 – 0,8 6,0 6,5 0,5 5,2 – 0,3 4.Vj 1,7 0,9 0,8 4,1 5,2 1,7 2,2 1,2
2010 1.Vj 2,6 2,1 1,9 4,3 4,6 2,5 3,6 2,3 2.Vj 2,2 2,1 2,1 2,3 2,9 2,3 1,2 2,3 3.Vj 3,2 3,7 3,6 1,8 2,4 3,4 0,7 3,8 4.Vj 3,5 4,0 4,0 2,1 1,5 3,5 3,1 4,1
2011 1.Vj 3,5 4,3 4,3 1,4 1,9 3,9 0,5 4,4 2.Vj 3,9 4,0 3,9 3,5 2,9 3,8 4,6 4,0 3.Vj 3,6 4,0 3,9 2,3 2,0 3,6 3,0 3,9 4.Vj 2,9 2,9 2,8 2,7 2,1 2,8 3,8 2,8
2012 1.Vj 3,3 3,4 3,3 3,2 3,1 3,3 3,2 3,2 2.Vj 2,0 1,9 1,9 2,5 2,3 1,9 2,9 1,7 3.Vj 1,7 1,3 1,2 2,9 2,6 1,5 3,5 1,1
PrivateKonsum-ausgaben
je Einwohner
Veränderung gegenüber dem entsprechenden Vorjahreszeitraum in %
Private KonsumausgabenJahr,
Vierteljahr
Individual-konsum(Sp.2+5)
Kollektiv-konsum(Sp.4�5)
Insgesamt(Sp.2+4
oder 6+7)
Konsumausgaben des Staates
Mrd. EUR
Statistisches Bundesamt, Fachserie 18, Reihe 1.2, 3.Vj 2012

3.5 Konsum, preisbereinigt
Konsumausgaben (Ausgabenkonzept) Konsum (Verbrauchskonzept)
zusammendarunter:
privateHaushalte
zusammendarunter:
Individual-konsum
1 2 3 4 5 6 7
Kettenindex (2005 = 100)
2007 101,56 101,29 101,29 102,37 103,47 101,66 100,49
2008 102,93 102,07 102,06 105,60 106,93 102,89 103,33
2009 103,80 102,22 102,08 108,76 110,20 103,56 106,31
2010 104,97 103,17 103,00 110,61 112,32 104,71 107,70
2011 106,57 104,92 104,73 111,71 113,74 106,41 108,25
2008 1.Vj 99,15 97,60 97,53 104,02 106,79 99,13 99,29 2.Vj 102,99 102,51 102,51 104,46 107,32 103,32 99,60 3.Vj 104,86 104,82 104,87 104,95 107,27 105,24 101,00 4.Vj 104,71 103,35 103,31 108,96 106,33 103,86 113,42
2009 1.Vj 100,36 97,98 97,77 107,87 110,35 100,03 103,67 2.Vj 103,78 102,74 102,62 106,99 110,02 103,96 101,87 3.Vj 105,50 104,59 104,50 108,34 110,20 105,53 105,18 4.Vj 105,57 103,58 103,42 111,85 110,24 104,70 114,53
2010 1.Vj 101,18 98,04 97,77 110,99 113,71 100,68 106,35 2.Vj 104,20 102,90 102,72 108,26 111,80 104,40 102,24 3.Vj 107,06 106,15 106,05 109,95 112,33 107,19 105,90 4.Vj 107,45 105,60 105,46 113,23 111,42 106,58 116,32
2011 1.Vj 102,68 100,05 99,76 110,93 114,26 102,43 105,26 2.Vj 106,07 104,73 104,54 110,23 114,20 106,33 103,47 3.Vj 109,01 108,38 108,28 110,95 114,23 109,37 105,38 4.Vj 108,51 106,53 106,33 114,72 112,27 107,50 118,91
2012 1.Vj 104,28 101,56 101,32 112,82 116,81 104,11 106,06 2.Vj 106,60 105,15 104,96 111,09 114,71 106,76 104,96 3.Vj 109,13 108,19 108,08 112,02 115,47 109,43 106,18
2007 0,2 – 0,2 – 0,2 1,4 2,5 0,3 – 0,5
2008 1,3 0,8 0,8 3,2 3,3 1,2 2,8
2009 0,8 0,1 0,0 3,0 3,1 0,7 2,9
2010 1,1 0,9 0,9 1,7 1,9 1,1 1,3
2011 1,5 1,7 1,7 1,0 1,3 1,6 0,5
2008 1.Vj 1,4 1,0 1,0 2,5 2,9 1,4 1,6 2.Vj 1,8 1,3 1,3 3,4 3,6 1,7 3,1 3.Vj 1,5 0,9 0,9 3,6 4,1 1,4 2,7 4.Vj 0,7 – 0,1 – 0,2 3,2 2,7 0,4 3,9
2009 1.Vj 1,2 0,4 0,2 3,7 3,3 0,9 4,4 2.Vj 0,8 0,2 0,1 2,4 2,5 0,6 2,3 3.Vj 0,6 – 0,2 – 0,4 3,2 2,7 0,3 4,1 4.Vj 0,8 0,2 0,1 2,7 3,7 0,8 1,0
2010 1.Vj 0,8 0,1 0,0 2,9 3,0 0,6 2,6 2.Vj 0,4 0,2 0,1 1,2 1,6 0,4 0,4 3.Vj 1,5 1,5 1,5 1,5 1,9 1,6 0,7 4.Vj 1,8 2,0 2,0 1,2 1,1 1,8 1,6
2011 1.Vj 1,5 2,1 2,0 – 0,1 0,5 1,7 – 1,0 2.Vj 1,8 1,8 1,8 1,8 2,1 1,8 1,2 3.Vj 1,8 2,1 2,1 0,9 1,7 2,0 – 0,5 4.Vj 1,0 0,9 0,8 1,3 0,8 0,9 2,2
2012 1.Vj 1,6 1,5 1,6 1,7 2,2 1,6 0,8 2.Vj 0,5 0,4 0,4 0,8 0,4 0,4 1,4 3.Vj 0,1 – 0,2 – 0,2 1,0 1,1 0,1 0,8
Veränderung gegenüber dem entsprechenden Vorjahreszeitraum in %
Private KonsumausgabenJahr,
VierteljahrIndividual-
konsumKollektiv-konsum
InsgesamtKonsumausgaben des Staates
Statistisches Bundesamt, Fachserie 18, Reihe 1.2, 3.Vj 2012

3.6 Konsumausgaben der privaten Haushalte im Inland nach Verwendungszwecken in jeweiligen Preisen
Insgesamt
Nahrungs-mittel,
Getränke,Tabakwaren
Bekleidungund
Schuhe
Wohnung,Wasser,
Strom, Gasu.a. Brenn-
stoffe
Einrichtungs-gegenstände,Geräte für den
Haushalt
Verkehr,Nachrichten-übermittlung
Freizeit,Unterhaltung
und Kultur
Beherber-gungs- und
Gaststätten-dienst-
leistungen
Übrige Ver-wendungs-zwecke 1)
1 2 3 4 5 6 7 8 9
Mrd. EUR
2007 1 287,38 183,96 66,43 309,08 83,17 216,17 120,68 73,94 233,95
2008 1 317,31 191,45 67,14 325,75 82,92 219,11 121,86 76,14 232,94
2009 1 319,23 194,42 62,09 328,25 80,76 223,28 121,18 75,46 233,79
2010 1 359,45 198,66 66,29 337,87 83,77 217,26 123,57 78,81 253,22
2011 1 409,83 207,36 68,38 343,91 87,59 234,56 126,02 83,27 258,74
2008 1.Vj 315,33 45,55 15,01 81,61 19,81 52,10 29,06 14,73 57,46 2.Vj 331,12 48,45 16,67 78,59 20,33 59,14 30,16 19,93 57,85 3.Vj 334,62 47,95 16,73 80,54 20,12 56,08 30,16 24,92 58,12 4.Vj 336,24 49,50 18,73 85,01 22,66 51,79 32,48 16,56 59,51
2009 1.Vj 315,93 45,63 13,67 85,76 19,12 52,54 28,97 14,33 55,91 2.Vj 331,80 50,13 15,42 79,28 19,66 60,96 29,61 19,68 57,06 3.Vj 333,02 48,24 15,18 79,33 19,69 56,97 29,80 25,18 58,63 4.Vj 338,48 50,42 17,82 83,88 22,29 52,81 32,80 16,27 62,19
2010 1.Vj 322,66 46,72 14,65 86,27 19,67 49,48 29,23 14,81 61,83 2.Vj 338,69 49,99 16,08 82,11 20,50 57,09 30,19 20,50 62,23 3.Vj 345,69 49,86 16,56 81,85 20,57 55,97 30,78 26,39 63,71 4.Vj 352,41 52,09 19,00 87,64 23,03 54,72 33,37 17,11 65,45
2011 1.Vj 336,31 48,40 15,05 87,99 20,72 55,05 29,91 15,68 63,51 2.Vj 352,07 52,35 17,23 83,28 21,29 61,05 30,81 21,92 64,14 3.Vj 358,65 52,24 16,67 83,82 21,48 60,50 31,35 27,68 64,91 4.Vj 362,80 54,37 19,43 88,82 24,10 57,96 33,95 17,99 66,18
2012 1.Vj 347,58 50,45 15,90 89,81 21,43 58,26 30,61 16,66 64,46 2.Vj 359,30 54,04 17,02 85,96 21,61 62,37 31,32 22,74 64,24 3.Vj 363,35 53,23 16,83 85,11 21,57 61,41 31,52 28,71 64,97
2007 1,2 1,5 3,5 0,4 – 0,9 – 2,1 2,5 5,6 3,3
2008 2,3 4,1 1,1 5,4 – 0,3 1,4 1,0 3,0 – 0,4
2009 0,1 1,6 – 7,5 0,8 – 2,6 1,9 – 0,6 – 0,9 0,4
2010 3,0 2,2 6,8 2,9 3,7 – 2,7 2,0 4,4 8,3
2011 3,7 4,4 3,2 1,8 4,6 8,0 2,0 5,7 2,2
2008 1.Vj 2,7 2,5 0,9 4,6 – 0,4 5,3 1,4 3,7 – 0,1 2.Vj 3,1 4,1 0,4 5,4 0,2 4,2 2,4 2,6 0,3 3.Vj 2,9 6,1 2,5 6,3 0,0 1,2 0,9 3,9 – 0,4 4.Vj 0,7 3,5 0,5 5,2 – 1,0 – 5,0 – 0,6 1,5 – 1,5
2009 1.Vj 0,2 0,2 – 8,9 5,1 – 3,5 0,8 – 0,3 – 2,7 – 2,7 2.Vj 0,2 3,5 – 7,5 0,9 – 3,3 3,1 – 1,8 – 1,3 – 1,4 3.Vj – 0,5 0,6 – 9,3 – 1,5 – 2,1 1,6 – 1,2 1,0 0,9 4.Vj 0,7 1,9 – 4,9 – 1,3 – 1,6 2,0 1,0 – 1,8 4,5
2010 1.Vj 2,1 2,4 7,2 0,6 2,9 – 5,8 0,9 3,3 10,6 2.Vj 2,1 – 0,3 4,3 3,6 4,3 – 6,3 2,0 4,2 9,1 3.Vj 3,8 3,4 9,1 3,2 4,5 – 1,8 3,3 4,8 8,7 4.Vj 4,1 3,3 6,6 4,5 3,3 3,6 1,7 5,2 5,2
2011 1.Vj 4,2 3,6 2,7 2,0 5,3 11,3 2,3 5,9 2,7 2.Vj 4,0 4,7 7,2 1,4 3,9 6,9 2,1 6,9 3,1 3.Vj 3,7 4,8 0,7 2,4 4,4 8,1 1,9 4,9 1,9 4.Vj 2,9 4,4 2,3 1,3 4,6 5,9 1,7 5,1 1,1
2012 1.Vj 3,4 4,2 5,6 2,1 3,4 5,8 2,3 6,3 1,5 2.Vj 2,1 3,2 – 1,2 3,2 1,5 2,2 1,7 3,7 0,2 3.Vj 1,3 1,9 1,0 1,5 0,4 1,5 0,5 3,7 0,1
1) Gesundheitspflege, Bildungswesen, Körperpflege, persönliche Gebrauchsgegenstände, Dienstleistungen sozialer Einrichtungen, Versicherungs- und Finanzdienstleistungen, sonstige Dienstleistungen.
Jahr,Vierteljahr
Veränderung gegenüber dem entsprechenden Vorjahreszeitraum in %
Statistisches Bundesamt, Fachserie 18, Reihe 1.2, 3.Vj 2012

3.7 Konsumausgaben der privaten Haushalte im Inland nach Verwendungszwecken, preisbereinigt
Insgesamt
Nahrungs-mittel,
Getränke,Tabakwaren
Bekleidungund
Schuhe
Wohnung,Wasser,
Strom, Gasu.a. Brenn-
stoffe
Einrichtungs-gegenstände,Geräte für den
Haushalt
Verkehr,Nachrichten-übermittlung
Freizeit,Unterhaltung
und Kultur
Beherber-gungs- und
Gaststätten-dienst-
leistungen
Übrige Ver-wendungs-zwecke 1)
1 2 3 4 5 6 7 8 9
Kettenindex (2005 = 100)
2007 101,40 97,24 103,88 99,11 100,20 98,35 106,38 106,06 106,66
2008 102,08 96,15 104,22 101,36 98,45 97,50 108,95 106,61 108,26
2009 102,30 98,03 95,14 101,77 94,01 101,20 107,82 103,52 109,45
2010 103,53 99,05 100,72 103,61 96,91 96,43 110,14 106,91 112,83
2011 105,19 100,70 101,94 102,78 100,61 100,78 112,60 111,40 113,41
2008 1.Vj 98,26 92,23 93,76 102,74 94,60 93,47 103,63 83,25 106,26 2.Vj 102,52 97,07 103,58 98,30 96,67 104,50 107,79 112,40 106,94 3.Vj 103,11 96,18 105,33 99,48 95,71 97,80 107,61 138,85 107,72 4.Vj 104,44 99,12 114,22 104,91 106,84 94,23 116,75 91,92 112,10
2009 1.Vj 98,76 91,26 84,51 106,49 89,81 96,38 103,32 79,19 107,71 2.Vj 102,96 100,71 94,38 98,25 91,47 110,36 105,14 108,26 107,66 3.Vj 103,06 97,79 94,56 98,14 91,47 102,70 105,89 137,78 108,88 4.Vj 104,42 102,37 107,11 104,20 103,29 95,37 116,94 88,83 113,53
2010 1.Vj 99,03 93,64 90,04 106,91 91,40 88,53 104,28 80,61 111,36 2.Vj 103,24 99,57 97,64 100,77 94,43 101,42 107,52 111,72 111,42 3.Vj 105,07 99,35 102,30 99,82 95,03 99,17 109,47 142,84 113,13 4.Vj 106,78 103,63 112,90 106,94 106,77 96,61 119,30 92,46 115,41
2011 1.Vj 101,10 95,13 91,71 105,82 95,56 95,96 106,71 84,65 111,56 2.Vj 105,08 101,61 102,71 99,93 97,64 104,96 110,27 117,80 111,86 3.Vj 106,86 101,23 100,95 100,07 98,61 103,11 112,02 147,43 113,85 4.Vj 107,71 104,82 112,37 105,28 110,64 99,07 121,40 95,72 116,39
2012 1.Vj 102,70 95,77 93,80 105,84 98,69 98,58 109,47 88,03 113,31 2.Vj 105,74 101,63 98,63 101,30 97,82 105,23 111,33 119,71 113,37 3.Vj 106,71 100,27 100,06 99,94 97,45 102,53 111,80 149,84 114,68
2007 – 0,3 – 2,0 2,3 – 1,4 – 2,1 – 4,7 3,3 2,7 3,7
2008 0,7 – 1,1 0,3 2,3 – 1,7 – 0,9 2,4 0,5 1,5
2009 0,2 2,0 – 8,7 0,4 – 4,5 3,8 – 1,0 – 2,9 1,1
2010 1,2 1,0 5,9 1,8 3,1 – 4,7 2,2 3,3 3,1
2011 1,6 1,7 1,2 – 0,8 3,8 4,5 2,2 4,2 0,5
2008 1.Vj 0,9 – 3,3 0,0 2,2 – 2,4 2,3 3,2 1,3 1,3 2.Vj 1,2 – 2,0 – 0,0 2,4 – 0,8 1,2 4,1 0,4 1,6 3.Vj 0,8 0,4 1,7 2,5 – 1,1 – 2,6 2,0 1,2 1,5 4.Vj – 0,1 0,5 – 0,3 2,0 – 2,5 – 4,2 0,6 – 1,1 1,6
2009 1.Vj 0,5 – 1,1 – 9,9 3,6 – 5,1 3,1 – 0,3 – 4,9 1,4 2.Vj 0,4 3,7 – 8,9 – 0,1 – 5,4 5,6 – 2,5 – 3,7 0,7 3.Vj – 0,0 1,7 – 10,2 – 1,3 – 4,4 5,0 – 1,6 – 0,8 1,1 4.Vj – 0,0 3,3 – 6,2 – 0,7 – 3,3 1,2 0,2 – 3,4 1,3
2010 1.Vj 0,3 2,6 6,5 0,4 1,8 – 8,1 0,9 1,8 3,4 2.Vj 0,3 – 1,1 3,5 2,6 3,2 – 8,1 2,3 3,2 3,5 3.Vj 2,0 1,6 8,2 1,7 3,9 – 3,4 3,4 3,7 3,9 4.Vj 2,3 1,2 5,4 2,6 3,4 1,3 2,0 4,1 1,7
2011 1.Vj 2,1 1,6 1,9 – 1,0 4,6 8,4 2,3 5,0 0,2 2.Vj 1,8 2,0 5,2 – 0,8 3,4 3,5 2,6 5,4 0,4 3.Vj 1,7 1,9 – 1,3 0,3 3,8 4,0 2,3 3,2 0,6 4.Vj 0,9 1,1 – 0,5 – 1,6 3,6 2,5 1,8 3,5 0,8
2012 1.Vj 1,6 0,7 2,3 0,0 3,3 2,7 2,6 4,0 1,6 2.Vj 0,6 0,0 – 4,0 1,4 0,2 0,3 1,0 1,6 1,3 3.Vj – 0,1 – 0,9 – 0,9 – 0,1 – 1,2 – 0,6 – 0,2 1,6 0,7
1) Gesundheitspflege, Bildungswesen, Körperpflege, persönliche Gebrauchsgegenstände, Dienstleistungen sozialer Einrichtungen, Versicherungs- und Finanzdienstleistungen, sonstige Dienstleistungen.
Jahr,Vierteljahr
Veränderung gegenüber dem entsprechenden Vorjahreszeitraum in %
Statistisches Bundesamt, Fachserie 18, Reihe 1.2, 3.Vj 2012

3.8 Konsumausgaben des Staates in jeweiligen Preisen
Bund
zusammen zivil Verteidigung
1 2 3 4 5 6 7
Mrd. EUR
2007 434,04 44,12 18,49 25,63 119,54 90,82 179,56
2008 451,92 46,39 19,48 26,91 121,19 96,76 187,58
2009 475,30 47,03 19,15 27,88 126,91 101,71 199,65
2010 487,60 47,07 18,82 28,25 131,25 104,26 205,02
2011 499,77 48,91 20,51 28,40 133,79 108,37 208,70
2008 1.Vj 108,05 10,93 4,50 6,43 28,48 23,69 44,95 2.Vj 110,01 10,64 4,61 6,03 29,35 23,37 46,65 3.Vj 110,43 11,30 4,75 6,55 29,39 23,39 46,35 4.Vj 123,43 13,52 5,62 7,90 33,97 26,31 49,63
2009 1.Vj 114,48 11,37 4,59 6,78 30,47 25,03 47,61 2.Vj 115,25 11,13 4,67 6,46 30,47 24,42 49,23 3.Vj 117,10 11,61 4,72 6,89 30,69 24,89 49,91 4.Vj 128,47 12,92 5,17 7,75 35,28 27,37 52,90
2010 1.Vj 119,35 11,02 4,16 6,86 32,06 26,18 50,09 2.Vj 117,86 10,84 4,26 6,58 31,11 24,90 51,01 3.Vj 119,23 11,19 4,69 6,50 31,63 25,40 51,01 4.Vj 131,16 14,02 5,71 8,31 36,45 27,78 52,91
2011 1.Vj 121,01 11,21 4,71 6,50 31,91 26,75 51,14 2.Vj 121,98 11,19 4,75 6,44 32,86 26,02 51,91 3.Vj 122,03 11,73 4,71 7,02 32,09 26,56 51,65 4.Vj 134,75 14,78 6,34 8,44 36,93 29,04 54,00
2012 1.Vj 124,83 11,99 4,93 7,06 33,07 27,31 52,46 2.Vj 125,08 11,77 4,97 6,80 33,34 26,92 53,05 3.Vj 125,58 12,07 5,01 7,06 33,14 27,37 53,00
2007 2,2 0,6 – 1,8 2,4 0,5 2,7 3,5
2008 4,1 5,1 5,4 5,0 1,4 6,5 4,5
2009 5,2 1,4 – 1,7 3,6 4,7 5,1 6,4
2010 2,6 0,1 – 1,7 1,3 3,4 2,5 2,7
2011 2,5 3,9 9,0 0,5 1,9 3,9 1,8
2008 1.Vj 3,8 9,3 5,6 12,0 0,5 3,9 4,5 2.Vj 4,9 2,3 4,3 0,8 2,6 8,1 5,4 3.Vj 4,4 7,5 7,7 7,4 1,7 6,0 4,5 4.Vj 3,6 2,3 4,1 1,2 0,8 8,0 3,6
2009 1.Vj 6,0 4,0 2,0 5,4 7,0 5,7 5,9 2.Vj 4,8 4,6 1,3 7,1 3,8 4,5 5,5 3.Vj 6,0 2,7 – 0,6 5,2 4,4 6,4 7,7 4.Vj 4,1 – 4,4 – 8,0 – 1,9 3,9 4,0 6,6
2010 1.Vj 4,3 – 3,1 – 9,4 1,2 5,2 4,6 5,2 2.Vj 2,3 – 2,6 – 8,8 1,9 2,1 2,0 3,6 3.Vj 1,8 – 3,6 – 0,6 – 5,7 3,1 2,0 2,2 4.Vj 2,1 8,5 10,4 7,2 3,3 1,5 0,0
2011 1.Vj 1,4 1,7 13,2 – 5,2 – 0,5 2,2 2,1 2.Vj 3,5 3,2 11,5 – 2,1 5,6 4,5 1,8 3.Vj 2,3 4,8 0,4 8,0 1,5 4,6 1,3 4.Vj 2,7 5,4 11,0 1,6 1,3 4,5 2,1
2012 1.Vj 3,2 7,0 4,7 8,6 3,6 2,1 2,6 2.Vj 2,5 5,2 4,6 5,6 1,5 3,5 2,2 3.Vj 2,9 2,9 6,4 0,6 3,3 3,0 2,6
Veränderung gegenüber dem entsprechenden Vorjahreszeitraum in %
GemeindenSozial-
versicherungJahr,
VierteljahrInsgesamt Länder
Statistisches Bundesamt, Fachserie 18, Reihe 1.2, 3.Vj 2012

3.9 Bruttoanlageinvestitionen in jeweiligen Preisen
Ausrüstungsinvestitionen Bauinvestitionen
zusammen Hochbau Tiefbau
1 2 3 4 5 6 7 8 9 10
Mrd. EUR
2007 447,88 195,53 135,35 60,18 225,64 128,33 97,31 61,65 35,66 26,71
2008 459,53 200,04 141,16 58,88 231,65 127,61 104,04 67,03 37,01 27,84
2009 408,65 154,85 110,19 44,66 226,91 125,66 101,25 65,71 35,54 26,89
2010 435,26 170,81 115,13 55,68 236,81 133,24 103,57 67,49 36,08 27,64
2011 469,85 183,22 127,33 55,89 258,09 145,75 112,34 73,04 39,30 28,54
2008 1.Vj 101,07 45,01 31,40 13,61 49,51 27,63 21,88 14,81 7,07 6,55 2.Vj 120,28 51,98 35,57 16,41 61,50 33,80 27,70 17,55 10,15 6,80 3.Vj 119,92 49,25 34,29 14,96 63,69 34,84 28,85 18,33 10,52 6,98 4.Vj 118,26 53,80 39,90 13,90 56,95 31,34 25,61 16,34 9,27 7,51
2009 1.Vj 89,32 35,95 26,65 9,30 46,95 26,46 20,49 14,40 6,09 6,42 2.Vj 104,05 38,56 26,77 11,79 58,98 32,52 26,46 16,87 9,59 6,51 3.Vj 107,36 37,61 26,31 11,30 63,09 34,70 28,39 17,89 10,50 6,66 4.Vj 107,92 42,73 30,46 12,27 57,89 31,98 25,91 16,55 9,36 7,30
2010 1.Vj 89,05 35,90 23,68 12,22 46,62 27,02 19,60 13,89 5,71 6,53 2.Vj 113,20 42,36 27,14 15,22 64,13 35,83 28,30 18,11 10,19 6,71 3.Vj 116,49 42,71 30,26 12,45 66,91 37,19 29,72 18,79 10,93 6,87 4.Vj 116,52 49,84 34,05 15,79 59,15 33,20 25,95 16,70 9,25 7,53
2011 1.Vj 102,21 41,05 27,74 13,31 54,43 31,05 23,38 15,88 7,50 6,73 2.Vj 120,60 45,78 30,57 15,21 67,89 38,12 29,77 18,94 10,83 6,93 3.Vj 122,97 45,24 32,09 13,15 70,65 39,74 30,91 19,76 11,15 7,08 4.Vj 124,07 51,15 36,93 14,22 65,12 36,84 28,28 18,46 9,82 7,80
2012 1.Vj 105,17 42,21 . . . . . . 56,07 33,13 22,94 16,12 6,82 6,89 2.Vj 119,04 43,63 . . . . . . 68,31 39,48 28,83 18,44 10,39 7,10 3.Vj 121,33 41,72 . . . . . . 72,35 42,04 30,31 19,48 10,83 7,26
2007 7,2 9,8 10,4 8,5 5,4 4,0 7,3 9,8 3,3 3,8
2008 2,6 2,3 4,3 – 2,2 2,7 – 0,6 6,9 8,7 3,8 4,2
2009 – 11,1 – 22,6 – 21,9 – 24,2 – 2,0 – 1,5 – 2,7 – 2,0 – 4,0 – 3,4
2010 6,5 10,3 4,5 24,7 4,4 6,0 2,3 2,7 1,5 2,8
2011 7,9 7,3 10,6 0,4 9,0 9,4 8,5 8,2 8,9 3,3
2008 1.Vj 1,9 3,0 6,9 – 4,9 0,7 – 1,8 4,0 5,1 1,9 4,1 2.Vj 5,8 6,0 9,7 – 1,2 5,8 2,1 10,7 12,7 7,3 4,9 3.Vj 4,1 5,0 2,9 10,2 3,4 – 0,7 8,7 10,6 5,4 5,1 4.Vj – 1,4 – 3,8 – 0,8 – 11,4 0,4 – 2,2 3,7 6,0 – 0,1 2,9
2009 1.Vj – 11,6 – 20,1 – 15,1 – 31,7 – 5,2 – 4,2 – 6,4 – 2,8 – 13,9 – 2,0 2.Vj – 13,5 – 25,8 – 24,7 – 28,2 – 4,1 – 3,8 – 4,5 – 3,9 – 5,5 – 4,3 3.Vj – 10,5 – 23,6 – 23,3 – 24,5 – 0,9 – 0,4 – 1,6 – 2,4 – 0,2 – 4,6 4.Vj – 8,7 – 20,6 – 23,7 – 11,7 1,7 2,0 1,2 1,3 1,0 – 2,8
2010 1.Vj – 0,3 – 0,1 – 11,1 31,4 – 0,7 2,1 – 4,3 – 3,5 – 6,2 1,7 2.Vj 8,8 9,9 1,4 29,1 8,7 10,2 7,0 7,4 6,3 3,1 3.Vj 8,5 13,6 15,0 10,2 6,1 7,2 4,7 5,0 4,1 3,2 4.Vj 8,0 16,6 11,8 28,7 2,2 3,8 0,2 0,9 – 1,2 3,2
2011 1.Vj 14,8 14,3 17,1 8,9 16,8 14,9 19,3 14,3 31,3 3,1 2.Vj 6,5 8,1 12,6 – 0,1 5,9 6,4 5,2 4,6 6,3 3,3 3.Vj 5,6 5,9 6,0 5,6 5,6 6,9 4,0 5,2 2,0 3,1 4.Vj 6,5 2,6 8,5 – 9,9 10,1 11,0 9,0 10,5 6,2 3,6
2012 1.Vj 2,9 2,8 . . . . . . 3,0 6,7 – 1,9 1,5 – 9,1 2,4 2.Vj – 1,3 – 4,7 . . . . . . 0,6 3,6 – 3,2 – 2,6 – 4,1 2,5 3.Vj – 1,3 – 7,8 . . . . . . 2,4 5,8 – 1,9 – 1,4 – 2,9 2,5
1) Einschl. Textilien, Bekleidung, Leder-, Holz-, Kunststoff-, Glas-, Keramik- und Eisenwaren, Verlagserzeugnisse. � 2) Nutztiere und Nutzpflanzungen, immaterielle Anlagegüter, Grundstücksübertragungskosten für unbebauten Grund und Boden.
Jahr,Vierteljahr
FahrzeugeMaschinenu. Geräte 1)
zusammenInsgesamt
Veränderung gegenüber dem entsprechenden Vorjahreszeitraum in %
SonstigeAnlagen 2)
Wohn-bauten
zusammenNichtwohnbauten
Statistisches Bundesamt, Fachserie 18, Reihe 1.2, 3.Vj 2012
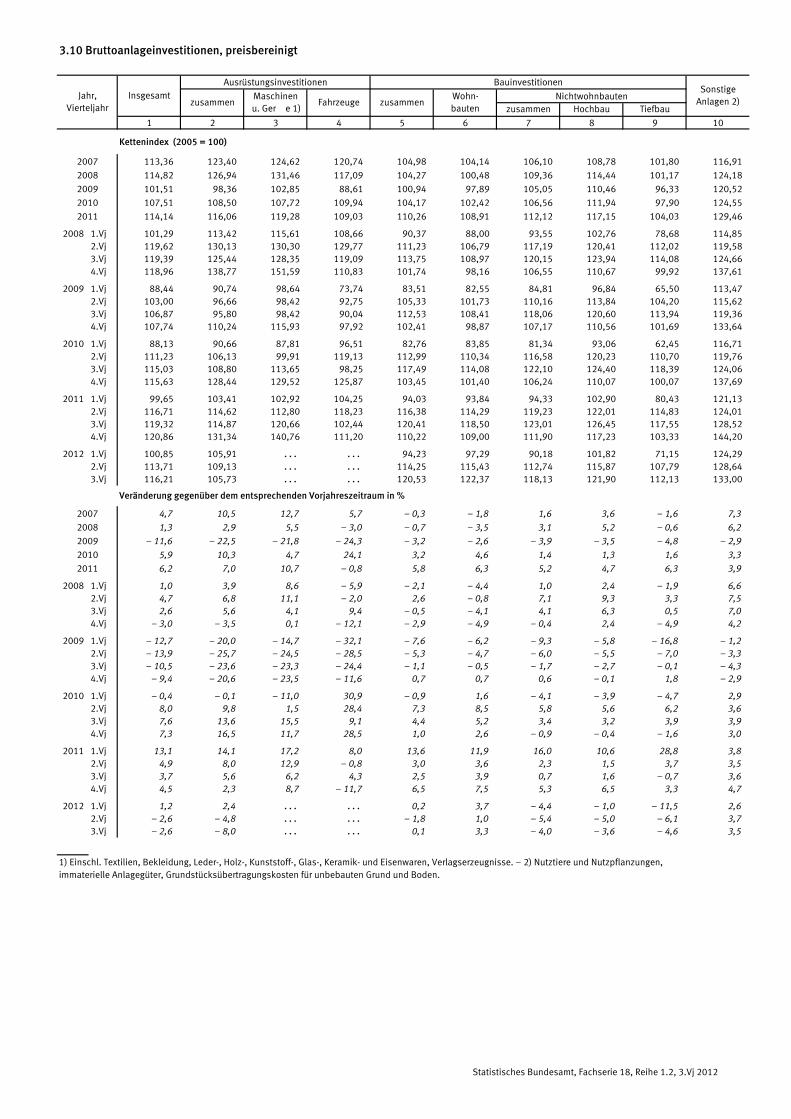
3.10 Bruttoanlageinvestitionen, preisbereinigt
Ausrüstungsinvestitionen Bauinvestitionen
zusammen Hochbau Tiefbau
1 2 3 4 5 6 7 8 9 10
Kettenindex (2005 = 100)
2007 113,36 123,40 124,62 120,74 104,98 104,14 106,10 108,78 101,80 116,91
2008 114,82 126,94 131,46 117,09 104,27 100,48 109,36 114,44 101,17 124,18
2009 101,51 98,36 102,85 88,61 100,94 97,89 105,05 110,46 96,33 120,52
2010 107,51 108,50 107,72 109,94 104,17 102,42 106,56 111,94 97,90 124,55
2011 114,14 116,06 119,28 109,03 110,26 108,91 112,12 117,15 104,03 129,46
2008 1.Vj 101,29 113,42 115,61 108,66 90,37 88,00 93,55 102,76 78,68 114,85 2.Vj 119,62 130,13 130,30 129,77 111,23 106,79 117,19 120,41 112,02 119,58 3.Vj 119,39 125,44 128,35 119,09 113,75 108,97 120,15 123,94 114,08 124,66 4.Vj 118,96 138,77 151,59 110,83 101,74 98,16 106,55 110,67 99,92 137,61
2009 1.Vj 88,44 90,74 98,64 73,74 83,51 82,55 84,81 96,84 65,50 113,47 2.Vj 103,00 96,66 98,42 92,75 105,33 101,73 110,16 113,84 104,20 115,62 3.Vj 106,87 95,80 98,42 90,04 112,53 108,41 118,06 120,60 113,94 119,36 4.Vj 107,74 110,24 115,93 97,92 102,41 98,87 107,17 110,56 101,69 133,64
2010 1.Vj 88,13 90,66 87,81 96,51 82,76 83,85 81,34 93,06 62,45 116,71 2.Vj 111,23 106,13 99,91 119,13 112,99 110,34 116,58 120,23 110,70 119,76 3.Vj 115,03 108,80 113,65 98,25 117,49 114,08 122,10 124,40 118,39 124,06 4.Vj 115,63 128,44 129,52 125,87 103,45 101,40 106,24 110,07 100,07 137,69
2011 1.Vj 99,65 103,41 102,92 104,25 94,03 93,84 94,33 102,90 80,43 121,13 2.Vj 116,71 114,62 112,80 118,23 116,38 114,29 119,23 122,01 114,83 124,01 3.Vj 119,32 114,87 120,66 102,44 120,41 118,50 123,01 126,45 117,55 128,52 4.Vj 120,86 131,34 140,76 111,20 110,22 109,00 111,90 117,23 103,33 144,20
2012 1.Vj 100,85 105,91 . . . . . . 94,23 97,29 90,18 101,82 71,15 124,29 2.Vj 113,71 109,13 . . . . . . 114,25 115,43 112,74 115,87 107,79 128,64 3.Vj 116,21 105,73 . . . . . . 120,53 122,37 118,13 121,90 112,13 133,00
2007 4,7 10,5 12,7 5,7 – 0,3 – 1,8 1,6 3,6 – 1,6 7,3
2008 1,3 2,9 5,5 – 3,0 – 0,7 – 3,5 3,1 5,2 – 0,6 6,2
2009 – 11,6 – 22,5 – 21,8 – 24,3 – 3,2 – 2,6 – 3,9 – 3,5 – 4,8 – 2,9
2010 5,9 10,3 4,7 24,1 3,2 4,6 1,4 1,3 1,6 3,3
2011 6,2 7,0 10,7 – 0,8 5,8 6,3 5,2 4,7 6,3 3,9
2008 1.Vj 1,0 3,9 8,6 – 5,9 – 2,1 – 4,4 1,0 2,4 – 1,9 6,6 2.Vj 4,7 6,8 11,1 – 2,0 2,6 – 0,8 7,1 9,3 3,3 7,5 3.Vj 2,6 5,6 4,1 9,4 – 0,5 – 4,1 4,1 6,3 0,5 7,0 4.Vj – 3,0 – 3,5 0,1 – 12,1 – 2,9 – 4,9 – 0,4 2,4 – 4,9 4,2
2009 1.Vj – 12,7 – 20,0 – 14,7 – 32,1 – 7,6 – 6,2 – 9,3 – 5,8 – 16,8 – 1,2 2.Vj – 13,9 – 25,7 – 24,5 – 28,5 – 5,3 – 4,7 – 6,0 – 5,5 – 7,0 – 3,3 3.Vj – 10,5 – 23,6 – 23,3 – 24,4 – 1,1 – 0,5 – 1,7 – 2,7 – 0,1 – 4,3 4.Vj – 9,4 – 20,6 – 23,5 – 11,6 0,7 0,7 0,6 – 0,1 1,8 – 2,9
2010 1.Vj – 0,4 – 0,1 – 11,0 30,9 – 0,9 1,6 – 4,1 – 3,9 – 4,7 2,9 2.Vj 8,0 9,8 1,5 28,4 7,3 8,5 5,8 5,6 6,2 3,6 3.Vj 7,6 13,6 15,5 9,1 4,4 5,2 3,4 3,2 3,9 3,9 4.Vj 7,3 16,5 11,7 28,5 1,0 2,6 – 0,9 – 0,4 – 1,6 3,0
2011 1.Vj 13,1 14,1 17,2 8,0 13,6 11,9 16,0 10,6 28,8 3,8 2.Vj 4,9 8,0 12,9 – 0,8 3,0 3,6 2,3 1,5 3,7 3,5 3.Vj 3,7 5,6 6,2 4,3 2,5 3,9 0,7 1,6 – 0,7 3,6 4.Vj 4,5 2,3 8,7 – 11,7 6,5 7,5 5,3 6,5 3,3 4,7
2012 1.Vj 1,2 2,4 . . . . . . 0,2 3,7 – 4,4 – 1,0 – 11,5 2,6 2.Vj – 2,6 – 4,8 . . . . . . – 1,8 1,0 – 5,4 – 5,0 – 6,1 3,7 3.Vj – 2,6 – 8,0 . . . . . . 0,1 3,3 – 4,0 – 3,6 – 4,6 3,5
1) Einschl. Textilien, Bekleidung, Leder-, Holz-, Kunststoff-, Glas-, Keramik- und Eisenwaren, Verlagserzeugnisse. � 2) Nutztiere und Nutzpflanzungen, immaterielle Anlagegüter, Grundstücksübertragungskosten für unbebauten Grund und Boden.
Jahr,Vierteljahr
FahrzeugeMaschinenu. Geräte 1)
zusammenInsgesamt
zusammenNichtwohnbauten
Veränderung gegenüber dem entsprechenden Vorjahreszeitraum in %
SonstigeAnlagen 2)
Wohn-bauten
Statistisches Bundesamt, Fachserie 18, Reihe 1.2, 3.Vj 2012
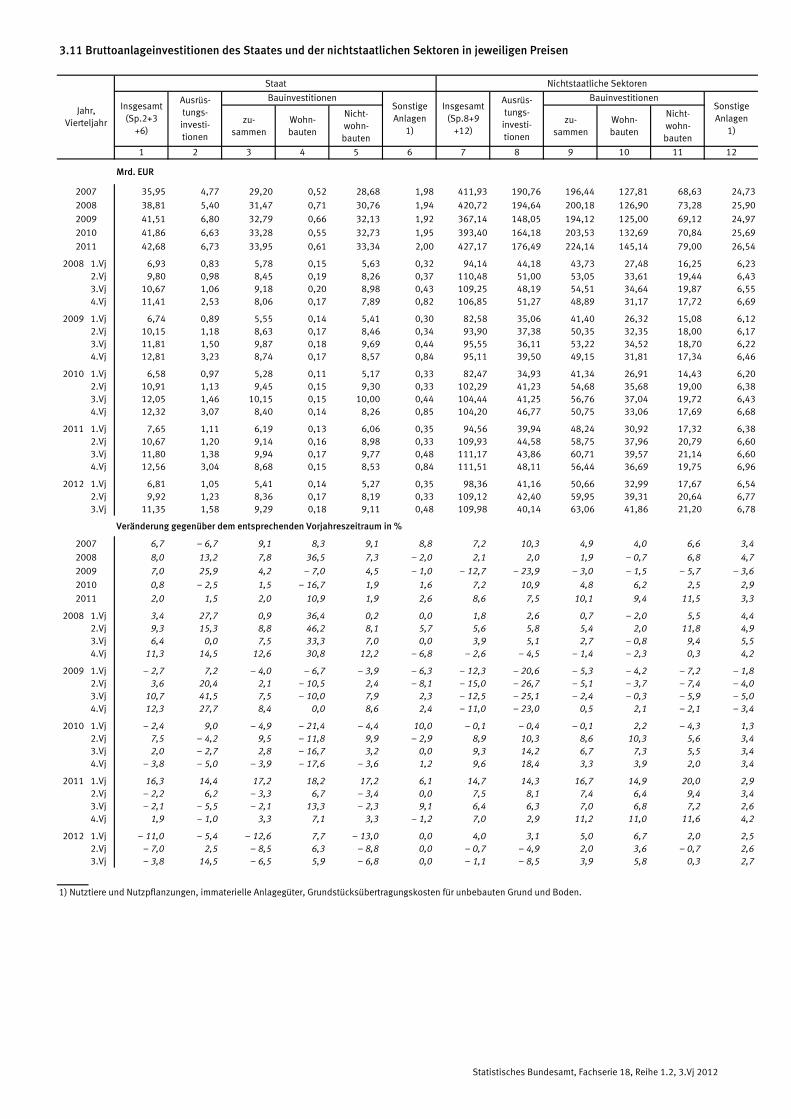
3.11 Bruttoanlageinvestitionen des Staates und der nichtstaatlichen Sektoren in jeweiligen Preisen
Staat Nichtstaatliche Sektoren
zu-sammen
Wohn-bauten
Nicht-wohn-bauten
zu-sammen
Wohn-bauten
Nicht-wohn-bauten
1 2 3 4 5 6 7 8 9 10 11 12
Mrd. EUR
2007 35,95 4,77 29,20 0,52 28,68 1,98 411,93 190,76 196,44 127,81 68,63 24,73
2008 38,81 5,40 31,47 0,71 30,76 1,94 420,72 194,64 200,18 126,90 73,28 25,90
2009 41,51 6,80 32,79 0,66 32,13 1,92 367,14 148,05 194,12 125,00 69,12 24,97
2010 41,86 6,63 33,28 0,55 32,73 1,95 393,40 164,18 203,53 132,69 70,84 25,69
2011 42,68 6,73 33,95 0,61 33,34 2,00 427,17 176,49 224,14 145,14 79,00 26,54
2008 1.Vj 6,93 0,83 5,78 0,15 5,63 0,32 94,14 44,18 43,73 27,48 16,25 6,232.Vj 9,80 0,98 8,45 0,19 8,26 0,37 110,48 51,00 53,05 33,61 19,44 6,433.Vj 10,67 1,06 9,18 0,20 8,98 0,43 109,25 48,19 54,51 34,64 19,87 6,554.Vj 11,41 2,53 8,06 0,17 7,89 0,82 106,85 51,27 48,89 31,17 17,72 6,69
2009 1.Vj 6,74 0,89 5,55 0,14 5,41 0,30 82,58 35,06 41,40 26,32 15,08 6,122.Vj 10,15 1,18 8,63 0,17 8,46 0,34 93,90 37,38 50,35 32,35 18,00 6,173.Vj 11,81 1,50 9,87 0,18 9,69 0,44 95,55 36,11 53,22 34,52 18,70 6,224.Vj 12,81 3,23 8,74 0,17 8,57 0,84 95,11 39,50 49,15 31,81 17,34 6,46
2010 1.Vj 6,58 0,97 5,28 0,11 5,17 0,33 82,47 34,93 41,34 26,91 14,43 6,202.Vj 10,91 1,13 9,45 0,15 9,30 0,33 102,29 41,23 54,68 35,68 19,00 6,383.Vj 12,05 1,46 10,15 0,15 10,00 0,44 104,44 41,25 56,76 37,04 19,72 6,434.Vj 12,32 3,07 8,40 0,14 8,26 0,85 104,20 46,77 50,75 33,06 17,69 6,68
2011 1.Vj 7,65 1,11 6,19 0,13 6,06 0,35 94,56 39,94 48,24 30,92 17,32 6,382.Vj 10,67 1,20 9,14 0,16 8,98 0,33 109,93 44,58 58,75 37,96 20,79 6,603.Vj 11,80 1,38 9,94 0,17 9,77 0,48 111,17 43,86 60,71 39,57 21,14 6,604.Vj 12,56 3,04 8,68 0,15 8,53 0,84 111,51 48,11 56,44 36,69 19,75 6,96
2012 1.Vj 6,81 1,05 5,41 0,14 5,27 0,35 98,36 41,16 50,66 32,99 17,67 6,542.Vj 9,92 1,23 8,36 0,17 8,19 0,33 109,12 42,40 59,95 39,31 20,64 6,773.Vj 11,35 1,58 9,29 0,18 9,11 0,48 109,98 40,14 63,06 41,86 21,20 6,78
Veränderung gegenüber dem entsprechenden Vorjahreszeitraum in %
2007 6,7 – 6,7 9,1 8,3 9,1 8,8 7,2 10,3 4,9 4,0 6,6 3,4
2008 8,0 13,2 7,8 36,5 7,3 – 2,0 2,1 2,0 1,9 – 0,7 6,8 4,7
2009 7,0 25,9 4,2 – 7,0 4,5 – 1,0 – 12,7 – 23,9 – 3,0 – 1,5 – 5,7 – 3,6
2010 0,8 – 2,5 1,5 – 16,7 1,9 1,6 7,2 10,9 4,8 6,2 2,5 2,9
2011 2,0 1,5 2,0 10,9 1,9 2,6 8,6 7,5 10,1 9,4 11,5 3,3
2008 1.Vj 3,4 27,7 0,9 36,4 0,2 0,0 1,8 2,6 0,7 – 2,0 5,5 4,42.Vj 9,3 15,3 8,8 46,2 8,1 5,7 5,6 5,8 5,4 2,0 11,8 4,93.Vj 6,4 0,0 7,5 33,3 7,0 0,0 3,9 5,1 2,7 – 0,8 9,4 5,54.Vj 11,3 14,5 12,6 30,8 12,2 – 6,8 – 2,6 – 4,5 – 1,4 – 2,3 0,3 4,2
2009 1.Vj – 2,7 7,2 – 4,0 – 6,7 – 3,9 – 6,3 – 12,3 – 20,6 – 5,3 – 4,2 – 7,2 – 1,82.Vj 3,6 20,4 2,1 – 10,5 2,4 – 8,1 – 15,0 – 26,7 – 5,1 – 3,7 – 7,4 – 4,03.Vj 10,7 41,5 7,5 – 10,0 7,9 2,3 – 12,5 – 25,1 – 2,4 – 0,3 – 5,9 – 5,04.Vj 12,3 27,7 8,4 0,0 8,6 2,4 – 11,0 – 23,0 0,5 2,1 – 2,1 – 3,4
2010 1.Vj – 2,4 9,0 – 4,9 – 21,4 – 4,4 10,0 – 0,1 – 0,4 – 0,1 2,2 – 4,3 1,32.Vj 7,5 – 4,2 9,5 – 11,8 9,9 – 2,9 8,9 10,3 8,6 10,3 5,6 3,43.Vj 2,0 – 2,7 2,8 – 16,7 3,2 0,0 9,3 14,2 6,7 7,3 5,5 3,44.Vj – 3,8 – 5,0 – 3,9 – 17,6 – 3,6 1,2 9,6 18,4 3,3 3,9 2,0 3,4
2011 1.Vj 16,3 14,4 17,2 18,2 17,2 6,1 14,7 14,3 16,7 14,9 20,0 2,92.Vj – 2,2 6,2 – 3,3 6,7 – 3,4 0,0 7,5 8,1 7,4 6,4 9,4 3,43.Vj – 2,1 – 5,5 – 2,1 13,3 – 2,3 9,1 6,4 6,3 7,0 6,8 7,2 2,64.Vj 1,9 – 1,0 3,3 7,1 3,3 – 1,2 7,0 2,9 11,2 11,0 11,6 4,2
2012 1.Vj – 11,0 – 5,4 – 12,6 7,7 – 13,0 0,0 4,0 3,1 5,0 6,7 2,0 2,52.Vj – 7,0 2,5 – 8,5 6,3 – 8,8 0,0 – 0,7 – 4,9 2,0 3,6 – 0,7 2,63.Vj – 3,8 14,5 – 6,5 5,9 – 6,8 0,0 – 1,1 – 8,5 3,9 5,8 0,3 2,7
1) Nutztiere und Nutzpflanzungen, immaterielle Anlagegüter, Grundstücksübertragungskosten für unbebauten Grund und Boden.
Jahr,Vierteljahr
SonstigeAnlagen
1)
Insgesamt(Sp.8+9
+12)
SonstigeAnlagen
1)
Insgesamt(Sp.2+3
+6)
Ausrüs-tungs-
investi-tionen
Ausrüs-tungs-
investi-tionen
Bauinvestitionen Bauinvestitionen
Statistisches Bundesamt, Fachserie 18, Reihe 1.2, 3.Vj 2012
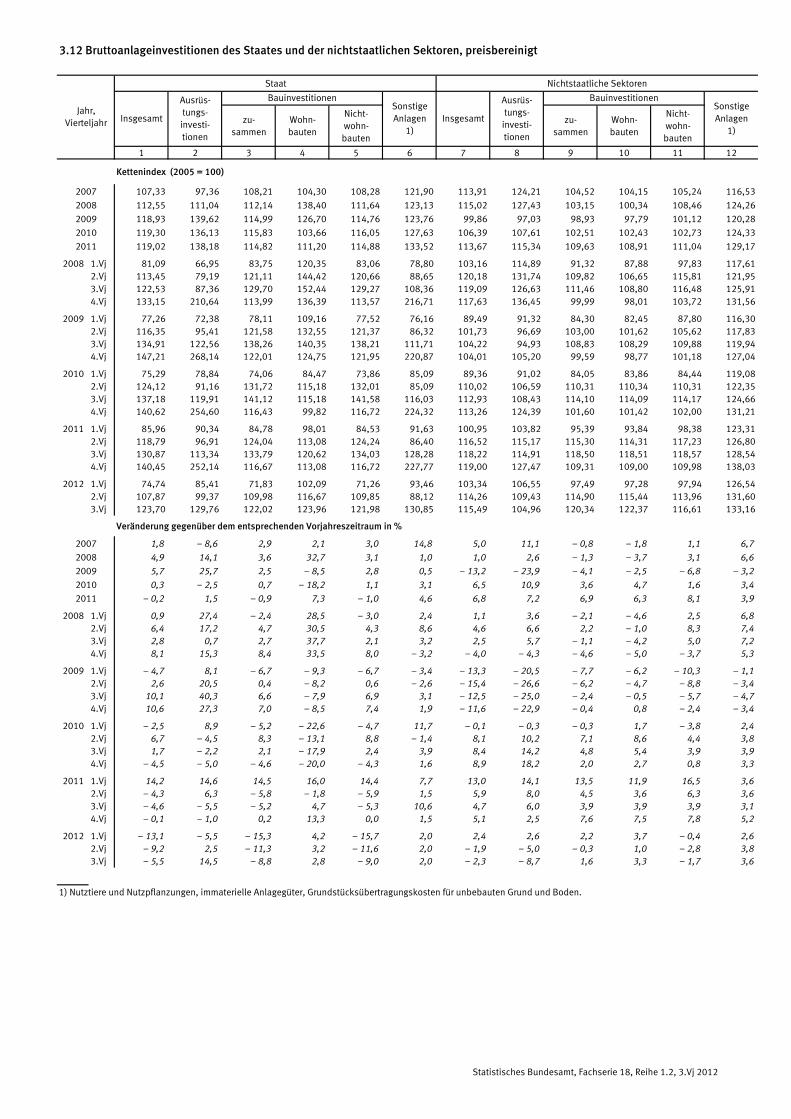
3.12 Bruttoanlageinvestitionen des Staates und der nichtstaatlichen Sektoren, preisbereinigt
Staat Nichtstaatliche Sektoren
zu-sammen
Wohn-bauten
Nicht-wohn-bauten
zu-sammen
Wohn-bauten
Nicht-wohn-bauten
1 2 3 4 5 6 7 8 9 10 11 12
Kettenindex (2005 = 100)
2007 107,33 97,36 108,21 104,30 108,28 121,90 113,91 124,21 104,52 104,15 105,24 116,53
2008 112,55 111,04 112,14 138,40 111,64 123,13 115,02 127,43 103,15 100,34 108,46 124,26
2009 118,93 139,62 114,99 126,70 114,76 123,76 99,86 97,03 98,93 97,79 101,12 120,28
2010 119,30 136,13 115,83 103,66 116,05 127,63 106,39 107,61 102,51 102,43 102,73 124,33
2011 119,02 138,18 114,82 111,20 114,88 133,52 113,67 115,34 109,63 108,91 111,04 129,17
2008 1.Vj 81,09 66,95 83,75 120,35 83,06 78,80 103,16 114,89 91,32 87,88 97,83 117,612.Vj 113,45 79,19 121,11 144,42 120,66 88,65 120,18 131,74 109,82 106,65 115,81 121,953.Vj 122,53 87,36 129,70 152,44 129,27 108,36 119,09 126,63 111,46 108,80 116,48 125,914.Vj 133,15 210,64 113,99 136,39 113,57 216,71 117,63 136,45 99,99 98,01 103,72 131,56
2009 1.Vj 77,26 72,38 78,11 109,16 77,52 76,16 89,49 91,32 84,30 82,45 87,80 116,302.Vj 116,35 95,41 121,58 132,55 121,37 86,32 101,73 96,69 103,00 101,62 105,62 117,833.Vj 134,91 122,56 138,26 140,35 138,21 111,71 104,22 94,93 108,83 108,29 109,88 119,944.Vj 147,21 268,14 122,01 124,75 121,95 220,87 104,01 105,20 99,59 98,77 101,18 127,04
2010 1.Vj 75,29 78,84 74,06 84,47 73,86 85,09 89,36 91,02 84,05 83,86 84,44 119,082.Vj 124,12 91,16 131,72 115,18 132,01 85,09 110,02 106,59 110,31 110,34 110,31 122,353.Vj 137,18 119,91 141,12 115,18 141,58 116,03 112,93 108,43 114,10 114,09 114,17 124,664.Vj 140,62 254,60 116,43 99,82 116,72 224,32 113,26 124,39 101,60 101,42 102,00 131,21
2011 1.Vj 85,96 90,34 84,78 98,01 84,53 91,63 100,95 103,82 95,39 93,84 98,38 123,312.Vj 118,79 96,91 124,04 113,08 124,24 86,40 116,52 115,17 115,30 114,31 117,23 126,803.Vj 130,87 113,34 133,79 120,62 134,03 128,28 118,22 114,91 118,50 118,51 118,57 128,544.Vj 140,45 252,14 116,67 113,08 116,72 227,77 119,00 127,47 109,31 109,00 109,98 138,03
2012 1.Vj 74,74 85,41 71,83 102,09 71,26 93,46 103,34 106,55 97,49 97,28 97,94 126,542.Vj 107,87 99,37 109,98 116,67 109,85 88,12 114,26 109,43 114,90 115,44 113,96 131,603.Vj 123,70 129,76 122,02 123,96 121,98 130,85 115,49 104,96 120,34 122,37 116,61 133,16
Veränderung gegenüber dem entsprechenden Vorjahreszeitraum in %
2007 1,8 – 8,6 2,9 2,1 3,0 14,8 5,0 11,1 – 0,8 – 1,8 1,1 6,7
2008 4,9 14,1 3,6 32,7 3,1 1,0 1,0 2,6 – 1,3 – 3,7 3,1 6,6
2009 5,7 25,7 2,5 – 8,5 2,8 0,5 – 13,2 – 23,9 – 4,1 – 2,5 – 6,8 – 3,2
2010 0,3 – 2,5 0,7 – 18,2 1,1 3,1 6,5 10,9 3,6 4,7 1,6 3,4
2011 – 0,2 1,5 – 0,9 7,3 – 1,0 4,6 6,8 7,2 6,9 6,3 8,1 3,9
2008 1.Vj 0,9 27,4 – 2,4 28,5 – 3,0 2,4 1,1 3,6 – 2,1 – 4,6 2,5 6,82.Vj 6,4 17,2 4,7 30,5 4,3 8,6 4,6 6,6 2,2 – 1,0 8,3 7,43.Vj 2,8 0,7 2,7 37,7 2,1 3,2 2,5 5,7 – 1,1 – 4,2 5,0 7,24.Vj 8,1 15,3 8,4 33,5 8,0 – 3,2 – 4,0 – 4,3 – 4,6 – 5,0 – 3,7 5,3
2009 1.Vj – 4,7 8,1 – 6,7 – 9,3 – 6,7 – 3,4 – 13,3 – 20,5 – 7,7 – 6,2 – 10,3 – 1,12.Vj 2,6 20,5 0,4 – 8,2 0,6 – 2,6 – 15,4 – 26,6 – 6,2 – 4,7 – 8,8 – 3,43.Vj 10,1 40,3 6,6 – 7,9 6,9 3,1 – 12,5 – 25,0 – 2,4 – 0,5 – 5,7 – 4,74.Vj 10,6 27,3 7,0 – 8,5 7,4 1,9 – 11,6 – 22,9 – 0,4 0,8 – 2,4 – 3,4
2010 1.Vj – 2,5 8,9 – 5,2 – 22,6 – 4,7 11,7 – 0,1 – 0,3 – 0,3 1,7 – 3,8 2,42.Vj 6,7 – 4,5 8,3 – 13,1 8,8 – 1,4 8,1 10,2 7,1 8,6 4,4 3,83.Vj 1,7 – 2,2 2,1 – 17,9 2,4 3,9 8,4 14,2 4,8 5,4 3,9 3,94.Vj – 4,5 – 5,0 – 4,6 – 20,0 – 4,3 1,6 8,9 18,2 2,0 2,7 0,8 3,3
2011 1.Vj 14,2 14,6 14,5 16,0 14,4 7,7 13,0 14,1 13,5 11,9 16,5 3,62.Vj – 4,3 6,3 – 5,8 – 1,8 – 5,9 1,5 5,9 8,0 4,5 3,6 6,3 3,63.Vj – 4,6 – 5,5 – 5,2 4,7 – 5,3 10,6 4,7 6,0 3,9 3,9 3,9 3,14.Vj – 0,1 – 1,0 0,2 13,3 0,0 1,5 5,1 2,5 7,6 7,5 7,8 5,2
2012 1.Vj – 13,1 – 5,5 – 15,3 4,2 – 15,7 2,0 2,4 2,6 2,2 3,7 – 0,4 2,62.Vj – 9,2 2,5 – 11,3 3,2 – 11,6 2,0 – 1,9 – 5,0 – 0,3 1,0 – 2,8 3,83.Vj – 5,5 14,5 – 8,8 2,8 – 9,0 2,0 – 2,3 – 8,7 1,6 3,3 – 1,7 3,6
1) Nutztiere und Nutzpflanzungen, immaterielle Anlagegüter, Grundstücksübertragungskosten für unbebauten Grund und Boden.
Jahr,Vierteljahr
SonstigeAnlagen
1)Insgesamt
BauinvestitionenSonstigeAnlagen
1)Insgesamt
Ausrüs-tungs-
investi-tionen
Ausrüs-tungs-
investi-tionen
Bauinvestitionen
Statistisches Bundesamt, Fachserie 18, Reihe 1.2, 3.Vj 2012
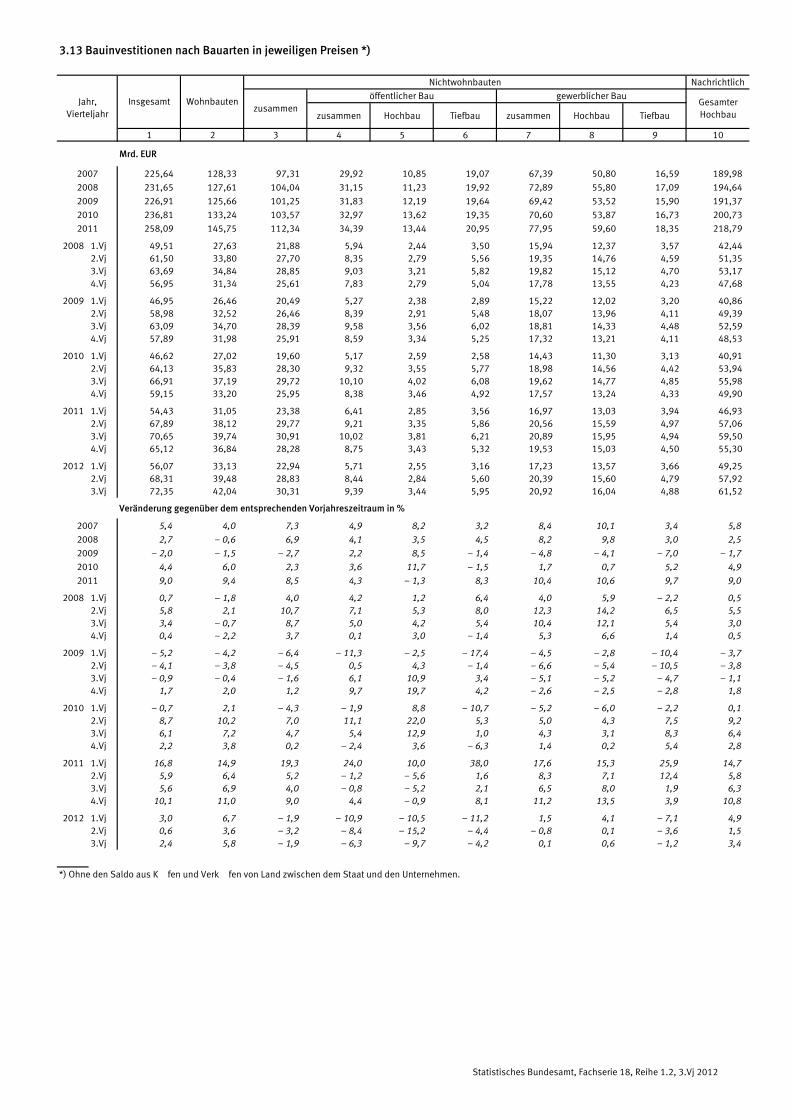
3.13 Bauinvestitionen nach Bauarten in jeweiligen Preisen *)
Nichtwohnbauten Nachrichtlich
öffentlicher Bau gewerblicher Bau
zusammen Hochbau Tiefbau zusammen Hochbau Tiefbau
1 2 3 4 5 6 7 8 9 10
Mrd. EUR
2007 225,64 128,33 97,31 29,92 10,85 19,07 67,39 50,80 16,59 189,98
2008 231,65 127,61 104,04 31,15 11,23 19,92 72,89 55,80 17,09 194,64
2009 226,91 125,66 101,25 31,83 12,19 19,64 69,42 53,52 15,90 191,37
2010 236,81 133,24 103,57 32,97 13,62 19,35 70,60 53,87 16,73 200,73
2011 258,09 145,75 112,34 34,39 13,44 20,95 77,95 59,60 18,35 218,79
2008 1.Vj 49,51 27,63 21,88 5,94 2,44 3,50 15,94 12,37 3,57 42,44 2.Vj 61,50 33,80 27,70 8,35 2,79 5,56 19,35 14,76 4,59 51,35 3.Vj 63,69 34,84 28,85 9,03 3,21 5,82 19,82 15,12 4,70 53,17 4.Vj 56,95 31,34 25,61 7,83 2,79 5,04 17,78 13,55 4,23 47,68
2009 1.Vj 46,95 26,46 20,49 5,27 2,38 2,89 15,22 12,02 3,20 40,86 2.Vj 58,98 32,52 26,46 8,39 2,91 5,48 18,07 13,96 4,11 49,39 3.Vj 63,09 34,70 28,39 9,58 3,56 6,02 18,81 14,33 4,48 52,59 4.Vj 57,89 31,98 25,91 8,59 3,34 5,25 17,32 13,21 4,11 48,53
2010 1.Vj 46,62 27,02 19,60 5,17 2,59 2,58 14,43 11,30 3,13 40,91 2.Vj 64,13 35,83 28,30 9,32 3,55 5,77 18,98 14,56 4,42 53,94 3.Vj 66,91 37,19 29,72 10,10 4,02 6,08 19,62 14,77 4,85 55,98 4.Vj 59,15 33,20 25,95 8,38 3,46 4,92 17,57 13,24 4,33 49,90
2011 1.Vj 54,43 31,05 23,38 6,41 2,85 3,56 16,97 13,03 3,94 46,93 2.Vj 67,89 38,12 29,77 9,21 3,35 5,86 20,56 15,59 4,97 57,06 3.Vj 70,65 39,74 30,91 10,02 3,81 6,21 20,89 15,95 4,94 59,50 4.Vj 65,12 36,84 28,28 8,75 3,43 5,32 19,53 15,03 4,50 55,30
2012 1.Vj 56,07 33,13 22,94 5,71 2,55 3,16 17,23 13,57 3,66 49,25 2.Vj 68,31 39,48 28,83 8,44 2,84 5,60 20,39 15,60 4,79 57,92 3.Vj 72,35 42,04 30,31 9,39 3,44 5,95 20,92 16,04 4,88 61,52
Veränderung gegenüber dem entsprechenden Vorjahreszeitraum in %
2007 5,4 4,0 7,3 4,9 8,2 3,2 8,4 10,1 3,4 5,8
2008 2,7 – 0,6 6,9 4,1 3,5 4,5 8,2 9,8 3,0 2,5
2009 – 2,0 – 1,5 – 2,7 2,2 8,5 – 1,4 – 4,8 – 4,1 – 7,0 – 1,7
2010 4,4 6,0 2,3 3,6 11,7 – 1,5 1,7 0,7 5,2 4,9
2011 9,0 9,4 8,5 4,3 – 1,3 8,3 10,4 10,6 9,7 9,0
2008 1.Vj 0,7 – 1,8 4,0 4,2 1,2 6,4 4,0 5,9 – 2,2 0,5 2.Vj 5,8 2,1 10,7 7,1 5,3 8,0 12,3 14,2 6,5 5,5 3.Vj 3,4 – 0,7 8,7 5,0 4,2 5,4 10,4 12,1 5,4 3,0 4.Vj 0,4 – 2,2 3,7 0,1 3,0 – 1,4 5,3 6,6 1,4 0,5
2009 1.Vj – 5,2 – 4,2 – 6,4 – 11,3 – 2,5 – 17,4 – 4,5 – 2,8 – 10,4 – 3,7 2.Vj – 4,1 – 3,8 – 4,5 0,5 4,3 – 1,4 – 6,6 – 5,4 – 10,5 – 3,8 3.Vj – 0,9 – 0,4 – 1,6 6,1 10,9 3,4 – 5,1 – 5,2 – 4,7 – 1,1 4.Vj 1,7 2,0 1,2 9,7 19,7 4,2 – 2,6 – 2,5 – 2,8 1,8
2010 1.Vj – 0,7 2,1 – 4,3 – 1,9 8,8 – 10,7 – 5,2 – 6,0 – 2,2 0,1 2.Vj 8,7 10,2 7,0 11,1 22,0 5,3 5,0 4,3 7,5 9,2 3.Vj 6,1 7,2 4,7 5,4 12,9 1,0 4,3 3,1 8,3 6,4 4.Vj 2,2 3,8 0,2 – 2,4 3,6 – 6,3 1,4 0,2 5,4 2,8
2011 1.Vj 16,8 14,9 19,3 24,0 10,0 38,0 17,6 15,3 25,9 14,7 2.Vj 5,9 6,4 5,2 – 1,2 – 5,6 1,6 8,3 7,1 12,4 5,8 3.Vj 5,6 6,9 4,0 – 0,8 – 5,2 2,1 6,5 8,0 1,9 6,3 4.Vj 10,1 11,0 9,0 4,4 – 0,9 8,1 11,2 13,5 3,9 10,8
2012 1.Vj 3,0 6,7 – 1,9 – 10,9 – 10,5 – 11,2 1,5 4,1 – 7,1 4,9 2.Vj 0,6 3,6 – 3,2 – 8,4 – 15,2 – 4,4 – 0,8 0,1 – 3,6 1,5 3.Vj 2,4 5,8 – 1,9 – 6,3 – 9,7 – 4,2 0,1 0,6 – 1,2 3,4
*) Ohne den Saldo aus Käufen und Verkäufen von Land zwischen dem Staat und den Unternehmen.
Jahr,Vierteljahr
GesamterHochbau
Insgesamtzusammen
Wohnbauten
Statistisches Bundesamt, Fachserie 18, Reihe 1.2, 3.Vj 2012
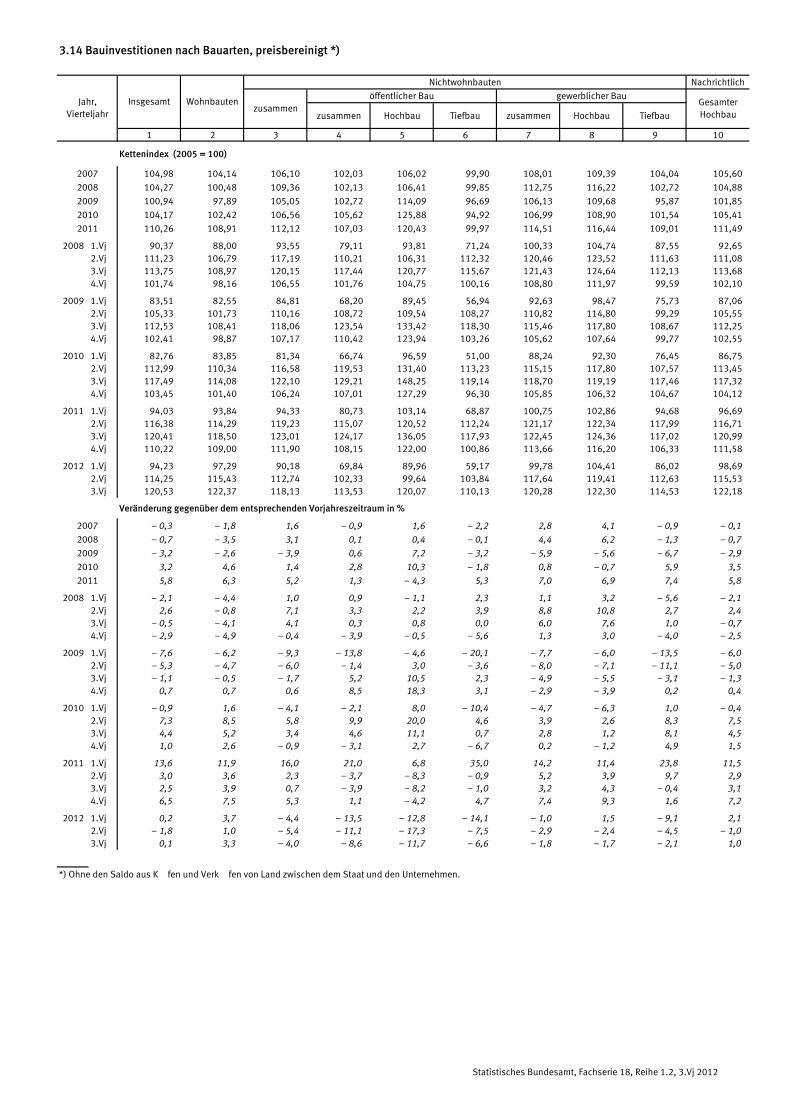
3.14 Bauinvestitionen nach Bauarten, preisbereinigt *)
Nichtwohnbauten Nachrichtlich
öffentlicher Bau gewerblicher Bau
zusammen Hochbau Tiefbau zusammen Hochbau Tiefbau
1 2 3 4 5 6 7 8 9 10
Kettenindex (2005 = 100)
2007 104,98 104,14 106,10 102,03 106,02 99,90 108,01 109,39 104,04 105,60
2008 104,27 100,48 109,36 102,13 106,41 99,85 112,75 116,22 102,72 104,88
2009 100,94 97,89 105,05 102,72 114,09 96,69 106,13 109,68 95,87 101,85
2010 104,17 102,42 106,56 105,62 125,88 94,92 106,99 108,90 101,54 105,41
2011 110,26 108,91 112,12 107,03 120,43 99,97 114,51 116,44 109,01 111,49
2008 1.Vj 90,37 88,00 93,55 79,11 93,81 71,24 100,33 104,74 87,55 92,65 2.Vj 111,23 106,79 117,19 110,21 106,31 112,32 120,46 123,52 111,63 111,08 3.Vj 113,75 108,97 120,15 117,44 120,77 115,67 121,43 124,64 112,13 113,68 4.Vj 101,74 98,16 106,55 101,76 104,75 100,16 108,80 111,97 99,59 102,10
2009 1.Vj 83,51 82,55 84,81 68,20 89,45 56,94 92,63 98,47 75,73 87,06 2.Vj 105,33 101,73 110,16 108,72 109,54 108,27 110,82 114,80 99,29 105,55 3.Vj 112,53 108,41 118,06 123,54 133,42 118,30 115,46 117,80 108,67 112,25 4.Vj 102,41 98,87 107,17 110,42 123,94 103,26 105,62 107,64 99,77 102,55
2010 1.Vj 82,76 83,85 81,34 66,74 96,59 51,00 88,24 92,30 76,45 86,75 2.Vj 112,99 110,34 116,58 119,53 131,40 113,23 115,15 117,80 107,57 113,45 3.Vj 117,49 114,08 122,10 129,21 148,25 119,14 118,70 119,19 117,46 117,32 4.Vj 103,45 101,40 106,24 107,01 127,29 96,30 105,85 106,32 104,67 104,12
2011 1.Vj 94,03 93,84 94,33 80,73 103,14 68,87 100,75 102,86 94,68 96,69 2.Vj 116,38 114,29 119,23 115,07 120,52 112,24 121,17 122,34 117,99 116,71 3.Vj 120,41 118,50 123,01 124,17 136,05 117,93 122,45 124,36 117,02 120,99 4.Vj 110,22 109,00 111,90 108,15 122,00 100,86 113,66 116,20 106,33 111,58
2012 1.Vj 94,23 97,29 90,18 69,84 89,96 59,17 99,78 104,41 86,02 98,69 2.Vj 114,25 115,43 112,74 102,33 99,64 103,84 117,64 119,41 112,63 115,53 3.Vj 120,53 122,37 118,13 113,53 120,07 110,13 120,28 122,30 114,53 122,18
Veränderung gegenüber dem entsprechenden Vorjahreszeitraum in %
2007 – 0,3 – 1,8 1,6 – 0,9 1,6 – 2,2 2,8 4,1 – 0,9 – 0,1
2008 – 0,7 – 3,5 3,1 0,1 0,4 – 0,1 4,4 6,2 – 1,3 – 0,7
2009 – 3,2 – 2,6 – 3,9 0,6 7,2 – 3,2 – 5,9 – 5,6 – 6,7 – 2,9
2010 3,2 4,6 1,4 2,8 10,3 – 1,8 0,8 – 0,7 5,9 3,5
2011 5,8 6,3 5,2 1,3 – 4,3 5,3 7,0 6,9 7,4 5,8
2008 1.Vj – 2,1 – 4,4 1,0 0,9 – 1,1 2,3 1,1 3,2 – 5,6 – 2,1 2.Vj 2,6 – 0,8 7,1 3,3 2,2 3,9 8,8 10,8 2,7 2,4 3.Vj – 0,5 – 4,1 4,1 0,3 0,8 0,0 6,0 7,6 1,0 – 0,7 4.Vj – 2,9 – 4,9 – 0,4 – 3,9 – 0,5 – 5,6 1,3 3,0 – 4,0 – 2,5
2009 1.Vj – 7,6 – 6,2 – 9,3 – 13,8 – 4,6 – 20,1 – 7,7 – 6,0 – 13,5 – 6,0 2.Vj – 5,3 – 4,7 – 6,0 – 1,4 3,0 – 3,6 – 8,0 – 7,1 – 11,1 – 5,0 3.Vj – 1,1 – 0,5 – 1,7 5,2 10,5 2,3 – 4,9 – 5,5 – 3,1 – 1,3 4.Vj 0,7 0,7 0,6 8,5 18,3 3,1 – 2,9 – 3,9 0,2 0,4
2010 1.Vj – 0,9 1,6 – 4,1 – 2,1 8,0 – 10,4 – 4,7 – 6,3 1,0 – 0,4 2.Vj 7,3 8,5 5,8 9,9 20,0 4,6 3,9 2,6 8,3 7,5 3.Vj 4,4 5,2 3,4 4,6 11,1 0,7 2,8 1,2 8,1 4,5 4.Vj 1,0 2,6 – 0,9 – 3,1 2,7 – 6,7 0,2 – 1,2 4,9 1,5
2011 1.Vj 13,6 11,9 16,0 21,0 6,8 35,0 14,2 11,4 23,8 11,5 2.Vj 3,0 3,6 2,3 – 3,7 – 8,3 – 0,9 5,2 3,9 9,7 2,9 3.Vj 2,5 3,9 0,7 – 3,9 – 8,2 – 1,0 3,2 4,3 – 0,4 3,1 4.Vj 6,5 7,5 5,3 1,1 – 4,2 4,7 7,4 9,3 1,6 7,2
2012 1.Vj 0,2 3,7 – 4,4 – 13,5 – 12,8 – 14,1 – 1,0 1,5 – 9,1 2,1 2.Vj – 1,8 1,0 – 5,4 – 11,1 – 17,3 – 7,5 – 2,9 – 2,4 – 4,5 – 1,0 3.Vj 0,1 3,3 – 4,0 – 8,6 – 11,7 – 6,6 – 1,8 – 1,7 – 2,1 1,0
*) Ohne den Saldo aus Käufen und Verkäufen von Land zwischen dem Staat und den Unternehmen.
Jahr,Vierteljahr
GesamterHochbau
Insgesamtzusammen
Wohnbauten
Statistisches Bundesamt, Fachserie 18, Reihe 1.2, 3.Vj 2012

3.15 Exporte und Importe in jeweiligen Preisen
Exporte Importe
insgesamt Waren 1)Dienst-
leistungeninsgesamt Waren
Dienst-leistungen
1 2 3 4 5 6 7
Mrd. EUR
2007 1 145,41 987,36 158,05 975,43 787,92 187,51 169,98
2008 1 191,19 1 019,42 171,77 1 035,36 839,44 195,92 155,83
2009 1 006,54 838,28 168,26 889,61 705,85 183,76 116,93
2010 1 173,34 992,04 181,30 1 034,44 834,54 199,90 138,90
2011 1 300,81 1 112,31 188,50 1 169,15 957,50 211,65 131,66
2008 1.Vj 298,08 257,71 40,37 251,41 206,65 44,76 46,67 2.Vj 305,97 265,06 40,91 259,12 211,18 47,94 46,85 3.Vj 300,91 256,99 43,92 271,13 215,73 55,40 29,78 4.Vj 286,23 239,66 46,57 253,70 205,88 47,82 32,53
2009 1.Vj 245,65 205,04 40,61 223,56 179,79 43,77 22,09 2.Vj 240,44 200,24 40,20 212,08 167,73 44,35 28,36 3.Vj 251,42 210,66 40,76 226,52 175,82 50,70 24,90 4.Vj 269,03 222,34 46,69 227,45 182,51 44,94 41,58
2010 1.Vj 268,69 227,86 40,83 233,43 189,38 44,05 35,26 2.Vj 290,38 246,40 43,98 257,59 208,23 49,36 32,79 3.Vj 298,41 252,07 46,34 268,47 212,47 56,00 29,94 4.Vj 315,86 265,71 50,15 274,95 224,46 50,49 40,91
2011 1.Vj 320,25 274,69 45,56 279,55 231,90 47,65 40,70 2.Vj 319,84 275,60 44,24 289,59 238,30 51,29 30,25 3.Vj 326,85 277,86 48,99 300,47 240,83 59,64 26,38 4.Vj 333,87 284,16 49,71 299,54 246,47 53,07 34,33
2012 1.Vj 335,54 288,47 47,07 295,08 243,79 51,29 40,46 2.Vj 339,73 290,41 49,32 301,72 248,01 53,71 38,01 3.Vj 344,18 293,44 50,74 309,58 247,22 62,36 34,60
in % in Mrd. EUR
2007 8,8 9,2 6,1 5,7 5,8 5,2 39,93
2008 4,0 3,2 8,7 6,1 6,5 4,5 � 14,15
2009 – 15,5 – 17,8 – 2,0 – 14,1 – 15,9 – 6,2 � 38,90
2010 16,6 18,3 7,7 16,3 18,2 8,8 21,97
2011 10,9 12,1 4,0 13,0 14,7 5,9 � 7,24
2008 1.Vj 6,7 6,0 10,7 6,2 6,5 5,2 3,85 2.Vj 8,6 8,9 6,5 8,7 8,8 8,0 3,58 3.Vj 5,4 4,7 9,7 9,3 10,9 3,6 � 7,71 4.Vj – 4,2 – 6,2 8,0 0,5 0,3 1,5 � 13,87
2009 1.Vj – 17,6 – 20,4 0,6 – 11,1 – 13,0 – 2,2 � 24,58 2.Vj – 21,4 – 24,5 – 1,7 – 18,2 – 20,6 – 7,5 � 18,49 3.Vj – 16,4 – 18,0 – 7,2 – 16,5 – 18,5 – 8,5 � 4,88 4.Vj – 6,0 – 7,2 0,3 – 10,3 – 11,4 – 6,0 9,05
2010 1.Vj 9,4 11,1 0,5 4,4 5,3 0,6 13,17 2.Vj 20,8 23,1 9,4 21,5 24,1 11,3 4,43 3.Vj 18,7 19,7 13,7 18,5 20,8 10,5 5,04 4.Vj 17,4 19,5 7,4 20,9 23,0 12,3 � 0,67
2011 1.Vj 19,2 20,6 11,6 19,8 22,5 8,2 5,44 2.Vj 10,1 11,9 0,6 12,4 14,4 3,9 � 2,54 3.Vj 9,5 10,2 5,7 11,9 13,3 6,5 � 3,56 4.Vj 5,7 6,9 – 0,9 8,9 9,8 5,1 � 6,58
2012 1.Vj 4,8 5,0 3,3 5,6 5,1 7,6 � 0,24 2.Vj 6,2 5,4 11,5 4,2 4,1 4,7 7,76 3.Vj 5,3 5,6 3,6 3,0 2,7 4,6 8,22
1) Im 4. Vierteljahr 2006 durch Nachmeldungen positiv beeinflusst.
Jahr,Vierteljahr
Außenbeitrag(Sp.1�4)
Veränderung gegenüber dem entsprechenden Vorjahreszeitraum
Statistisches Bundesamt, Fachserie 18, Reihe 1.2, 3.Vj 2012

3.16 Exporte und Importe, preisbereinigt
Exporte Importe
insgesamt Waren 1)Dienst-
leistungeninsgesamt Waren
Dienst-leistungen
1 2 3 4 5 6
Kettenindex (2005 = 100)
2007 122,11 122,35 120,62 117,89 120,20 109,13
2008 125,58 125,18 128,07 121,88 124,65 111,36
2009 109,49 105,52 133,60 112,15 113,91 105,50
2010 124,49 121,80 140,43 124,57 128,05 111,74
2011 134,22 132,41 144,52 133,84 138,61 116,29
2008 1.Vj 126,43 127,36 120,70 119,68 124,15 102,66 2.Vj 128,87 129,86 122,72 121,43 124,66 109,14 3.Vj 126,05 125,47 129,65 125,19 125,31 124,76 4.Vj 120,97 118,01 139,20 121,23 124,48 108,90
2009 1.Vj 106,56 102,84 129,17 112,02 115,02 100,58 2.Vj 105,31 100,99 131,58 106,89 108,26 101,70 3.Vj 109,51 106,34 128,81 114,54 114,07 116,41 4.Vj 116,57 111,93 144,85 115,17 118,28 103,31
2010 1.Vj 116,54 114,21 130,22 116,34 120,76 100,22 2.Vj 123,94 121,24 139,94 123,96 127,63 110,46 3.Vj 125,33 122,70 140,86 127,50 128,32 124,15 4.Vj 132,16 129,04 150,70 130,48 135,51 112,14
2011 1.Vj 132,72 131,24 140,94 128,63 135,07 104,98 2.Vj 132,30 131,06 139,02 131,97 137,23 112,62 3.Vj 134,54 132,06 149,03 137,63 139,39 131,05 4.Vj 137,31 135,26 149,09 137,12 142,73 116,51
2012 1.Vj 137,43 136,26 143,62 132,79 138,75 110,70 2.Vj 138,85 136,63 151,71 135,13 140,53 115,21 3.Vj 140,21 137,84 154,01 139,83 141,14 135,41
2007 8,0 8,5 5,0 5,4 5,7 4,2
2008 2,8 2,3 6,2 3,4 3,7 2,0
2009 – 12,8 – 15,7 4,3 – 8,0 – 8,6 – 5,3
2010 13,7 15,4 5,1 11,1 12,4 5,9
2011 7,8 8,7 2,9 7,4 8,2 4,1
2008 1.Vj 5,7 5,6 6,5 4,1 4,3 2,8 2.Vj 7,6 8,1 3,9 5,7 5,7 5,8 3.Vj 3,7 3,2 7,1 4,6 5,7 0,6 4.Vj – 5,1 – 7,1 7,1 – 0,7 – 0,7 – 0,6
2009 1.Vj – 15,7 – 19,3 7,0 – 6,4 – 7,4 – 2,0 2.Vj – 18,3 – 22,2 7,2 – 12,0 – 13,2 – 6,8 3.Vj – 13,1 – 15,2 – 0,6 – 8,5 – 9,0 – 6,7 4.Vj – 3,6 – 5,2 4,1 – 5,0 – 5,0 – 5,1
2010 1.Vj 9,4 11,1 0,8 3,9 5,0 – 0,4 2.Vj 17,7 20,1 6,4 16,0 17,9 8,6 3.Vj 14,4 15,4 9,4 11,3 12,5 6,6 4.Vj 13,4 15,3 4,0 13,3 14,6 8,5
2011 1.Vj 13,9 14,9 8,2 10,6 11,8 4,7 2.Vj 6,7 8,1 – 0,7 6,5 7,5 2,0 3.Vj 7,3 7,6 5,8 7,9 8,6 5,6 4.Vj 3,9 4,8 – 1,1 5,1 5,3 3,9
2012 1.Vj 3,5 3,8 1,9 3,2 2,7 5,4 2.Vj 5,0 4,2 9,1 2,4 2,4 2,3 3.Vj 4,2 4,4 3,3 1,6 1,3 3,3
1) Im 4. Vierteljahr 2006 durch Nachmeldungen positiv beeinflusst.
Jahr,Vierteljahr
Veränderung gegenüber dem entsprechenden Vorjahreszeitraum in %
Statistisches Bundesamt, Fachserie 18, Reihe 1.2, 3.Vj 2012

4 Arbeitstage *)
Zeitraum 2004 2005 2006 2007 2008 2009 2010 2011 2012 2013
Januar 20,6 20,6 21,6 22,0 22,0 20,6 19,6 20,6 21,6 22,0 Februar 19,6 19,6 19,6 19,6 20,6 19,6 19,6 20,0 20,6 19,6 März 23,0 21,0 23,0 22,0 19,0 22,0 23,0 22,6 22,0 20,0 April 20,0 21,0 18,0 19,0 22,0 20,0 20,0 19,0 19,0 21,0 Mai 19,0 19,3 21,0 20,0 19,3 19,0 19,0 22,0 20,0 19,3 Juni 21,3 22,0 20,3 20,3 21,0 20,3 21,3 19,3 20,3 20,0 Juli 22,0 21,0 21,0 22,0 23,0 23,0 22,0 21,0 22,0 23,0 August 22,0 22,8 22,8 22,8 20,8 21,0 22,0 22,8 22,8 21,8 September 22,0 22,0 21,0 20,0 22,0 22,0 22,0 22,0 20,0 21,0 Oktober 21,0 19,9 20,9 21,9 21,9 22,0 21,0 19,9 21,9 21,9 November 21,3 21,3 21,3 21,3 20,0 21,0 21,3 21,3 21,3 20,3 Dezember 21,0 21,0 19,0 17,0 19,0 20,0 21,0 21,0 17,0 18,0
1. Vj 63,2 61,2 64,2 63,6 61,6 62,2 62,2 63,2 64,2 61,6 2. Vj 60,3 62,3 59,3 59,3 62,3 59,3 60,3 60,3 59,3 60,3 3. Vj 66,0 65,8 64,8 64,8 65,8 66,0 66,0 65,8 64,8 65,8 4. Vj 63,3 62,2 61,2 60,2 60,9 63,0 63,3 62,2 60,2 60,2
Jahr 252,8 251,5 249,5 247,9 250,6 250,5 251,8 251,5 248,5 247,9
Januar 97,4 97,4 102,2 104,0 104,0 97,4 92,7 97,4 102,2 104,0 Februar 98,7 98,7 98,7 98,7 103,7 98,7 98,7 100,7 103,7 98,7 März 106,3 97,0 106,3 101,7 87,8 101,7 106,3 104,4 101,7 92,4 April 100,8 105,8 90,7 95,7 110,8 100,8 100,8 95,7 95,7 105,8 Mai 96,3 97,8 106,4 101,4 97,8 96,3 96,3 111,5 101,4 97,8 Juni 104,3 107,8 99,4 99,4 102,9 99,4 104,3 94,5 99,4 98,0 Juli 99,2 94,7 94,7 99,2 103,7 103,7 99,2 94,7 99,2 103,7 August 100,1 103,7 103,7 103,7 94,6 95,5 100,1 103,7 103,7 99,2 September 102,7 102,7 98,0 93,3 102,7 102,7 102,7 102,7 93,3 98,0 Oktober 98,2 93,1 97,8 102,4 102,4 102,9 98,2 93,1 102,4 102,4 November 102,3 102,3 102,3 102,3 96,1 100,9 102,3 102,3 102,3 97,5 Dezember 108,9 108,9 98,6 88,2 98,6 103,8 108,9 108,9 88,2 93,4
1. Vj 100,9 97,7 102,5 101,5 98,3 99,3 99,3 100,9 102,5 98,3 2. Vj 100,5 103,8 98,8 98,8 103,8 98,8 100,5 100,5 98,8 100,5 3. Vj 100,6 100,3 98,8 98,8 100,3 100,6 100,6 100,3 98,8 100,3 4. Vj 103,0 101,2 99,6 97,9 99,1 102,5 103,0 101,2 97,9 97,9
Jahr 101,2 100,7 99,9 99,3 100,4 100,3 100,8 100,7 99,5 99,3
Januar 99,0 99,0 103,8 105,7 105,7 99,0 94,2 99,0 103,8 105,7 Februar 94,2 94,2 94,2 94,2 99,0 94,2 94,2 96,1 99,0 94,2 März 110,5 100,9 110,5 105,7 91,3 105,7 110,5 108,6 105,7 96,1 April 96,1 100,9 86,5 91,3 105,7 96,1 96,1 91,3 91,3 100,9 Mai 91,3 92,7 100,9 96,1 92,7 91,3 91,3 105,7 96,1 92,7 Juni 102,4 105,7 97,6 97,6 100,9 97,6 102,4 92,7 97,6 96,1 Juli 105,7 100,9 100,9 105,7 110,5 110,5 105,7 100,9 105,7 110,5 August 105,7 109,6 109,6 109,6 100,0 100,9 105,7 109,6 109,6 104,8 September 105,7 105,7 100,9 96,1 105,7 105,7 105,7 105,7 96,1 100,9 Oktober 100,9 95,6 100,4 105,2 105,2 105,7 100,9 95,6 105,2 105,2 November 102,4 102,4 102,4 102,4 96,1 100,9 102,4 102,4 102,4 97,6 Dezember 100,9 100,9 91,3 81,7 91,3 96,1 100,9 100,9 81,7 86,5
1. Vj 101,2 98,0 102,8 101,9 98,7 99,6 99,6 101,2 102,8 98,7 2. Vj 96,6 99,8 95,0 95,0 99,8 95,0 96,6 96,6 95,0 96,6 3. Vj 105,7 105,4 103,8 103,8 105,4 105,7 105,7 105,4 103,8 105,4 4. Vj 101,4 99,6 98,0 96,4 97,6 100,9 101,4 99,6 96,4 96,4
Jahr 101,2 100,7 99,9 99,3 100,4 100,3 100,8 100,7 99,5 99,3
________*) 5-Tage-Woche, die Feiertage wurden mit folgenden Arbeitstageanteilen berücksichtigt:
Heilige Drei Könige (6.1.) = 0,6 Tage; Rosenmontag = 0,8 Tage; Fastnachtdienstag = 0,8 Tage; Fronleichnam = 0,3 Tage; Mariä Himmelfahrt (15.8.) = 0,8 Tage; Reformationstag (31.10.) = 0,9 Tage; Allerheiligen (1.11.) = 0,3 Tage; Heiligabend (24.12.) = 0,0 Tage; Silvester (31.12.) = 0,0 Tage;
1) Durchschnittsmonat = 20,8 Arbeitstage; Durchschnittsquartal = 62,4 Arbeitstage; Durchschnittsjahr = 249,7 Arbeitstage;
in % von Normperioden 1)
in % spezifischer Periodendurchschnitte
Statistisches Bundesamt, Fachserie 18, Reihe 1.2, 3.Vj 2012

Veröffentlichungstermine der Volkswirtschaftlichen Gesamtrechnungen (VGR) im Jahr 2013
Januar Februar März April Mai Juni Juli August September Oktober November Dezember
Inlandsproduktsberechnung
BIP-Pressekonferenz: Wirtschaftsleistung im Jahr 2012 15.
Wirtschaftsleistung im 4. Vierteljahr 2012Schnellmeldung 14.Ausführliche Ergebnisse 22.
Wirtschaftsleistung im 1. Vierteljahr 2013Schnellmeldung 15.Ausführliche Ergebnisse 24.
Wirtschaftsleistung im 2. Vierteljahr 2013Schnellmeldung 14.Ausführliche Ergebnisse 23.
Wirtschaftsleistung im 3. Vierteljahr 2013Schnellmeldung 14.Ausführliche Ergebnisse 22.
Erwerbstätigkeit *)
Erwerbstätige im Jahr 2012 02.
Erwerbstätige im 4. Vierteljahr 2012Schnellmeldung 31.Ausführliche Ergebnisse 19.
Erwerbstätige im 1. Vierteljahr 2013Schnellmeldung 30.Ausführliche Ergebnisse 16.
Erwerbstätige im 2. Vierteljahr 2013Schnellmeldung 31.Ausführliche Ergebnisse 20.
Erwerbstätige im 3. Vierteljahr 2013Schnellmeldung 30.Ausführliche Ergebnisse 19.
*) Ohne Veröffentlichungstermine der monatlichen Erwerbstätigen-Rechnung.