Embed Size (px)
Citation preview
Integrative analysis of
microRNA and mRNA expression profiles in
osteosarcoma cell lines
Stephanie Zillmer
Vollständiger Abdruck der von der Fakultät für Medizin der Technischen Universität
München zur Erlangung des akademischen Grades eines
Doktors der Medizin
genehmigten Dissertation.
Vorsitzender: Prof. Dr. E. J. Rummeny
Prüfer: 1. Prof. Dr. M. Nathrath
2. Prof. Dr. S. Burdach
Die Dissertation wurde am 26.05.2015 bei der Technischen Universität
München eingereicht und durch die Fakultät für Medizin
am 06.04.2016 angenommen.
TABLE OF CONTENTS
1. INTRODUCTION 6
1.1. Osteosarcoma 6
1.1.1. Definition and epidemiology 6
1.1.2. Etiology und pathogenesis 7
1.1.3. Molecular genetics 7
1.1.4. Histological classification 10
1.1.5. Clinical signs and diagnosis 10
1.1.6. Therapy 11
1.1.7. Prognosis 14
1.2. MicroRNA 15
1.2.1. Definition and biogenesis 15
1.2.2. MicroRNA in cancer 16
1.2.3. MicroRNA in osteosarcoma pathogenesis 17
2. THESIS OBJECTIVES AND DESIGN 19
2.1. Thesis objectives 19
2.2. Study design 20
3. MATERIAL AND METHODS 22
3.1. Osteosarcoma cell lines 22
3.2. Cell cultivation 24
3.2.1. Cell culture conditions 24
3.2.2. Cell counting 24
3.2.3. Wash cells and medium changing 24
3.2.4. Sub-culturing 24
3.3. Cell culture assays 25
3.3.1. General outline 25
3.3.2. Proliferation assay 25
3.3.3. Migration assay 26
3.3.4. Invasion assay 27
3.4. Transient transfection 28
3.4.1. Method definition 28
3.4.2. Optimization of transfection efficiency 29
3.4.3. Transfection of miRNA-181a and miRNA-let-7f 29
3.5. Molecular genetic material and methods 31
3.5.1. RNA extraction and sample preparation 31
3.5.2. MicroRNA expression array (miRCURY LNA-Array) 31
3.5.3. Gene expression profiling (Affymetrix 1.0 Gene Chip Array) 32
3.6. Data analysis 32
3.6.1. In vitro assay analysis 32
3.6.2. MicroRNA target prediction 32
3.6.3. Integration microRNA and mRNA expression in correlation to phenotype 33
3.6.4. Integrative analysis of microRNA and mRNA expression using correlation networks 34
4. RESULTS 37
4.1. MicroRNA expression profiling 37
4.1.1. Overview and unsupervised hierarchical clustering 37
4.1.2. Osteosarcoma cell lines vs. progenitor cell lines 42
4.2. Differentially expressed microRNA and likely targets 45
4.2.1. One-by-one comparison against the background of progenitor cell lines 45
4.3. Characterization of the phenotype 47
4.3.1. Proliferation analysis 47
4.3.2. Migration and invasion analysis 48
4.3.3. Grouping according to phenotype 51
4.4. Correlation of microRNA expression with cell lines’ phenotype 52
4.4.1. Differential microRNA expression of proliferative cell lines 52
4.4.2. Differential microRNA expression in migrative and invasive cell lines 54
4.5. Correlation of mRNA expression and cell lines’ phenotype 55
4.5.1. Differential gene expression in highly proliferative vs. slow proliferating cell lines 55
4.5.2. Correlation of gene expression and migrative/invasive properties 60
4.6. Integrative analysis of microRNA and their target genes in correlation to phenotype 61
4.6.1. Proliferation network 61
4.6.2. Migration/invasion network 65
4.7. Transfection of the miR-181a inhibitor 67
5. DISCUSSION 69
5.1. Summary and evaluation of methods 69
5.2. Study material 69
5.3. Differentially expressed miRNA and their target genes in
osteosarcoma cell lines versus normal tissue 70
5.4. Correlation of microRNA-mRNA data with phenotype 79
5.5. Comprehensive microRNA-mRNA network analysis based on phenotype 87
6. SUMMARY AND CONCLUSION 92
7. PERSPECTIVE 94
8. BIBLIOGRAPHY 95
9. LIST OF FIGURES 113
10. LIST OF TABLES 114
11. LIST OF ABBREVIATIONS 115
12. ACKNOWLEDGEMENTS 116
13. PUBLICATIONS 118
APPENDIX 119

“Two roads diverged in a wood, and I -
I took the one less traveled by, and that has made
all the difference.”
(The road not taken, Robert Frost)
miRNA expression in osteosarcoma Introduction
6
1. Introduction
1.1. Osteosarcoma
1.1.1. Definition and epidemiology
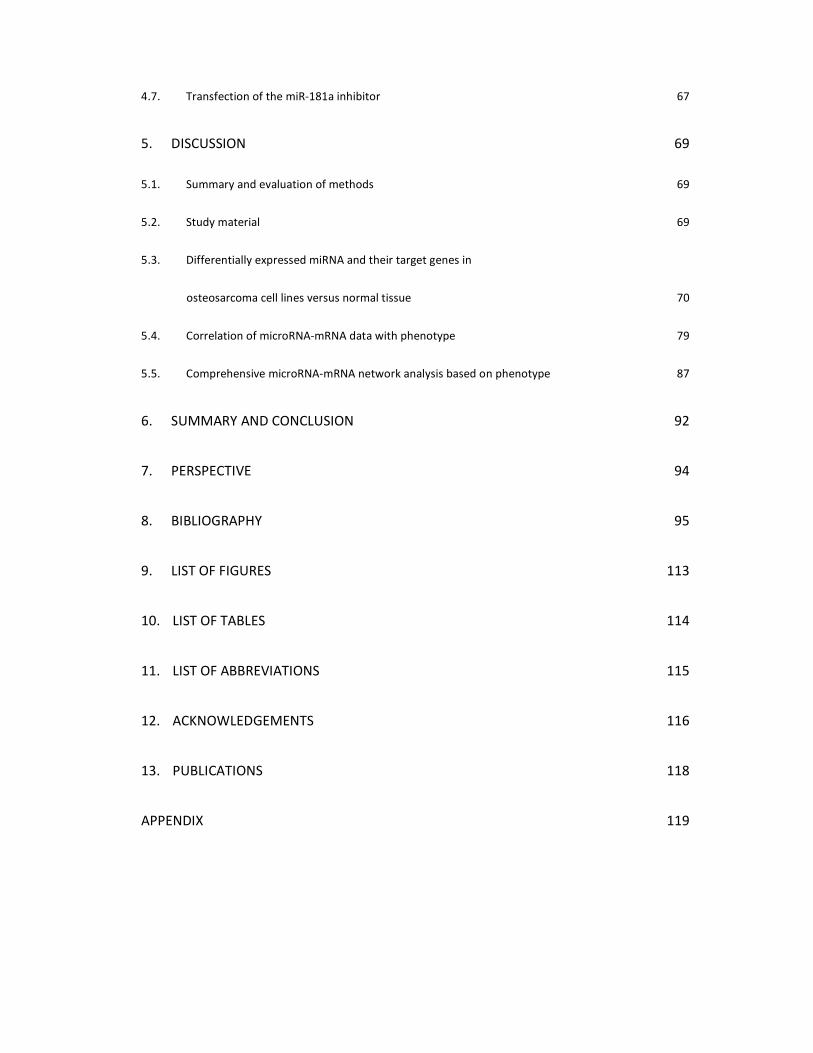
Osteosarcoma is a malignant bone tumor characterized by the presence of osteoid.
This unminerealized bone matrix (osteoid) is assumed to derive from malignant
mesenchymal cells (Klein and Siegal, 2006).
Although osteosarcoma is the most common primary bone tumor in childhood, with
its incidence of 2-3 new cases per year per million, it still belongs to the rare cancer
subtypes (Deutsches Krebsregister, 2009).
In adolescents this tumor entity represents the third most frequent neoplasia, in
children still the sixth frequent. There are two age peaks for osteosarcoma: The first
one arises in the adolescent age group, with the incidence being slightly higher in
adolescent males. The second age peak appears in the fifth to sixth life decade
(Bielack et al., 2002; Stiller, 2002). Osteosarcoma in older patients mostly appears
as a secondary malignancy, e.g. in the line of Paget’s disease or radiation-induced
(Potratz et al., 2006).
In contrast to Ewing’s sarcoma, osteosarcoma is most frequently located in the long
tubular bones, with > 65 % occurring in the distal femur and proximal tibia (Isakoff
et al., 2007).
Figure 1: Osteosarcoma incidence by disease sequence, SEER 9 (1973-2004)
miRNA expression in osteosarcoma Introduction
7
1.1.2. Etiology und pathogenesis
A definite etiological classification of osteosarcoma has not been possible so far
(Ottaviani and Jaffe, 2010). Since osteosarcoma, in most of the cases, develops in
the metaphyseal area of long bones, a close correlation to sceletogenesis has been
assumed (Potratz et al., 2006). The accumulation at the time of growth spurt
additionally supports this theory (Price, 1958).
No specific predisposing parameter has been identified so far; distinct risk factors
exist in only 10% of the patients (Potratz et al., 2006). Ionizing radiation, for
example, is known to be a cause for secondary osteosarcoma (Rosemann et al.;
Tucker et al., 1987). Other environmental parameters, like chemicals, viral infection
or repeated trauma to the affected bone have been discussed in several studies.
Patient-related factors, beside a certain age or gender, that seem to promote
osteosarcoma development are pre-existing bone abnormalities or diseases and
black or hispanic ethnicity (Ottaviani and Jaffe, 2010).
The influence of an individual’s height is an issue that has been controversially
discussed (Longhi and Pasini, 2005; Troisi et al., 2006).
Osteosarcoma is known to be associated with several syndromal diseases, such as
Li-Fraumeni- or Rothmund-Thomson-syndrome. Individuals with a mutation in the
RB1-tumorsuppressor-gene even have a 500 times greater risk for developing
osteosarcoma (Carrle D, Bielack, 2007; Ottaviani and Jaffe, 2010).
1.1.3. Molecular genetics
Comprehensive cytogenetic studies characterized osteosarcoma as a tumor with a
high amount of numerical and structural chromosomal alterations (Bridge et al.,
1997; Fletcher et al., 1994; Man et al., 2004; Ozaki et al., 2003; Smida et al., 2010)
with aneuploidy being a hallmark typically to be found in this malignancy (Al-
Romaih et al., 2003; Zoubek et al., 2006).
One of the best-described genetic defects associated with osteosarcoma is the
mutation of the RB1 tumor suppressor gene, which is assigned to chromosome
13q14 (Araki, N Uchida, 1991; Friend et al., 1986). It has been shown that sporadic
miRNA expression in osteosarcoma Introduction
8
osteosarcomas exhibit alterations in the retinoblastoma gene in up to 80 % of the
cases (Benassi and Molendini, 1999; Miller et al., 1996; Sandberg and Bridge, 2003;
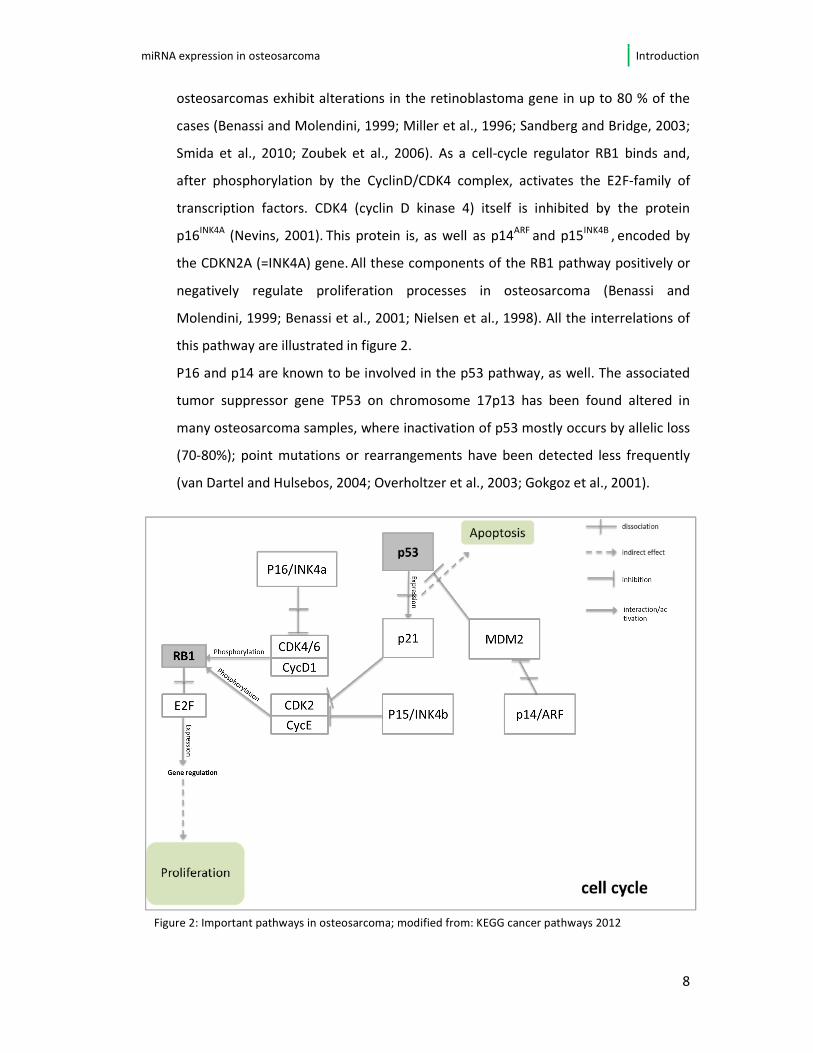
Smida et al., 2010; Zoubek et al., 2006). As a cell-cycle regulator RB1 binds and,
after phosphorylation by the CyclinD/CDK4 complex, activates the E2F-family of
transcription factors. CDK4 (cyclin D kinase 4) itself is inhibited by the protein
p16INK4A (Nevins, 2001). This protein is, as well as p14ARF and p15INK4B , encoded by
the CDKN2A (=INK4A) gene. All these components of the RB1 pathway positively or
negatively regulate proliferation processes in osteosarcoma (Benassi and
Molendini, 1999; Benassi et al., 2001; Nielsen et al., 1998). All the interrelations of
this pathway are illustrated in figure 2.
P16 and p14 are known to be involved in the p53 pathway, as well. The associated
tumor suppressor gene TP53 on chromosome 17p13 has been found altered in
many osteosarcoma samples, where inactivation of p53 mostly occurs by allelic loss
(70-80%); point mutations or rearrangements have been detected less frequently
(van Dartel and Hulsebos, 2004; Overholtzer et al., 2003; Gokgoz et al., 2001).
Figure 2: Important pathways in osteosarcoma; modified from: KEGG cancer pathways 2012
miRNA expression in osteosarcoma Introduction
9
An inherited disease characterized by an autosomal-dominant mutation in p53 is Li-
Fraumeni-syndrome, with osteosarcoma being the second-most common
malignancy in those patients. MDM2-amplification has been identified in up to 16%
of osteosarcomas and is accountable for p53 inactivation in these cases (Lonardo et
al., 1997; Momand et al., 1998). The Mouse Double Minute 2 homolog, MDM2, is
an E3 ubiquitin ligase that was described in 1991 in mice and later as a regulator of
p53 in men (Fakharzadeh et al., 1991; Momand et al., 1992).
The oncogene Her-2/neu, the human epidermal growth factor receptor 2, has been
found overexpressed in many different tumor types, above all in breast cancer (Ross
and Fletcher, 1998). The role of Her-2 in osteosarcoma has been discussed
controversially. Some studies described overexpression of its encoding ERBB2 gene
as related to poor clinical outcome (Gorlick et al., 1999; Zhou et al., 2003). Others,
including our group, could not find any correlation or even stated that HER-2-
overexpression may have a favorable effect on clinical outcome (Baumhoer et al.,
2011; Ma et al., 2012; Maitra et al., 2001; Scotlandi et al., 2005).
Other (onco-)genes that have been reported in relation to osteosarcoma
pathogenesis include MYCN, RECQL4, MMP2, SAS, MET, FOS, GLI1 and RUNX2,
MAPK, RANKL and the Wnt-pathway (Martin et al., 2012).
By using different cytogenetic methods (CGH, FISH, SKY) several studies identified
chromosomal rearrangements in osteosarcomas involving chromosomal bands or
regions 1p11-13, 1q11-12, 1q21-22, 11p14-15, 14p11-13, 15p11-13, 17p, and
19q13. Furthermore, gains on chromosome 1 and losses on chromosomes 9, 10 ,
13 and 17 have been shown (Bayani et al., 2003; Boehm and Neff J.R., Squire J.A.,
Bayani J., 2000; Bridge et al., 1997; Mertens and Mandahl, 1993).
Generally, the molecular genetic changes in osteosarcomas commonly involve
proteins of the cell cycle, e.g. those regulating the transition from G1 to the S-
phase. Furthermore, as already described, genomic instability is an essential feature
in osteosarcoma pathogenesis.
The general, conventional idea is that a “Cancer Genome” (Stratton, 2009),
irrespective of its cancer type, is the result of gradual changes over time.
A few years ago a completely different model was proposed by Stephens et al.:
They found such extended rearrangements in up to 25% of the examined
miRNA expression in osteosarcoma Introduction
10
osteosarcomas (besides other cancer types examined) that they could only have
occurred in a “single strike”. They found indications that chromosomes were
shattered into pieces and repaired and called the phenomenon “chromothripsis”
(Stephens et al., 2011).
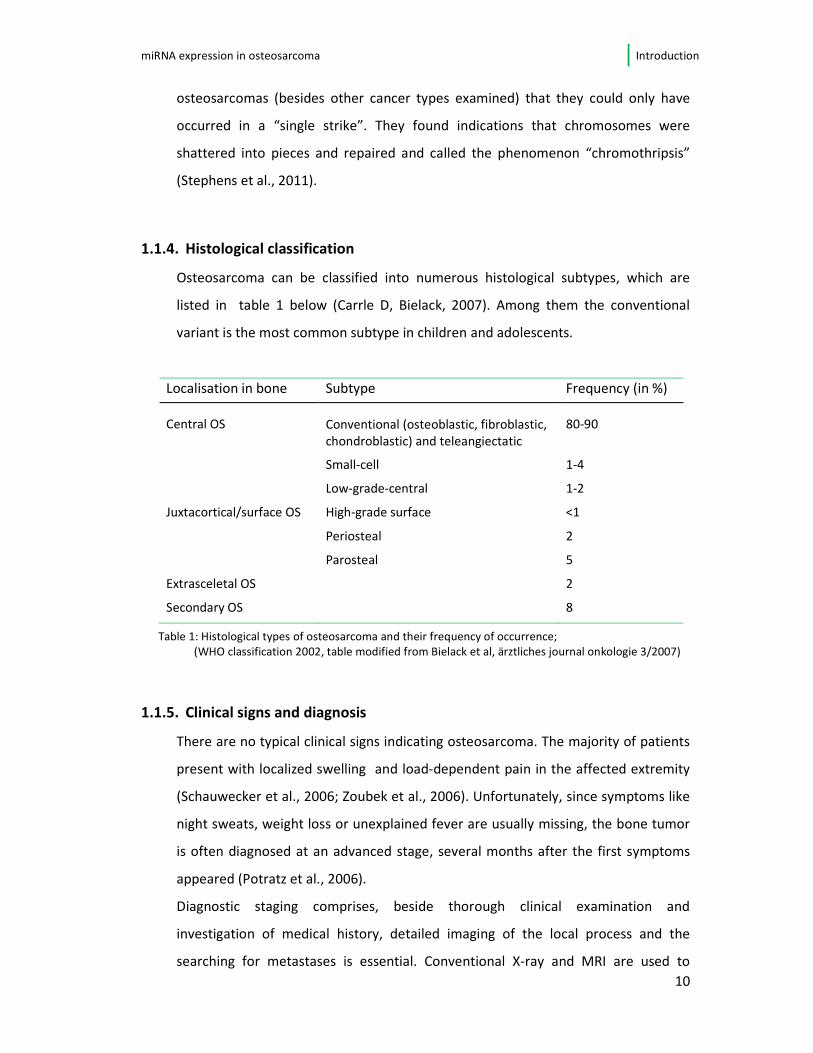
1.1.4. Histological classification
Osteosarcoma can be classified into numerous histological subtypes, which are
listed in table 1 below (Carrle D, Bielack, 2007). Among them the conventional
variant is the most common subtype in children and adolescents.
Localisation in bone Subtype Frequency (in %)
Central OS Conventional (osteoblastic, fibroblastic,
chondroblastic) and teleangiectatic
80-90
Small-cell 1-4
Low-grade-central 1-2
Juxtacortical/surface OS High-grade surface <1
Periosteal 2
Parosteal 5
Extrasceletal OS 2
Secondary OS 8
Table 1: Histological types of osteosarcoma and their frequency of occurrence;
(WHO classification 2002, table modified from Bielack et al, ärztliches journal onkologie 3/2007)
1.1.5. Clinical signs and diagnosis
There are no typical clinical signs indicating osteosarcoma. The majority of patients
present with localized swelling and load-dependent pain in the affected extremity
(Schauwecker et al., 2006; Zoubek et al., 2006). Unfortunately, since symptoms like
night sweats, weight loss or unexplained fever are usually missing, the bone tumor
is often diagnosed at an advanced stage, several months after the first symptoms
appeared (Potratz et al., 2006).
Diagnostic staging comprises, beside thorough clinical examination and
investigation of medical history, detailed imaging of the local process and the
searching for metastases is essential. Conventional X-ray and MRI are used to
miRNA expression in osteosarcoma Introduction
11
display the extent of the primary tumor and to look for so-called skip-lesions. For
detection of distant metastases conventional chest x-ray and lung CT is used in
addition to whole body scintigraphy: 10-15% of the patients present with primary
metastases, mostly in the lung (Carrle D, Bielack, 2007; Kager et al., 2003).
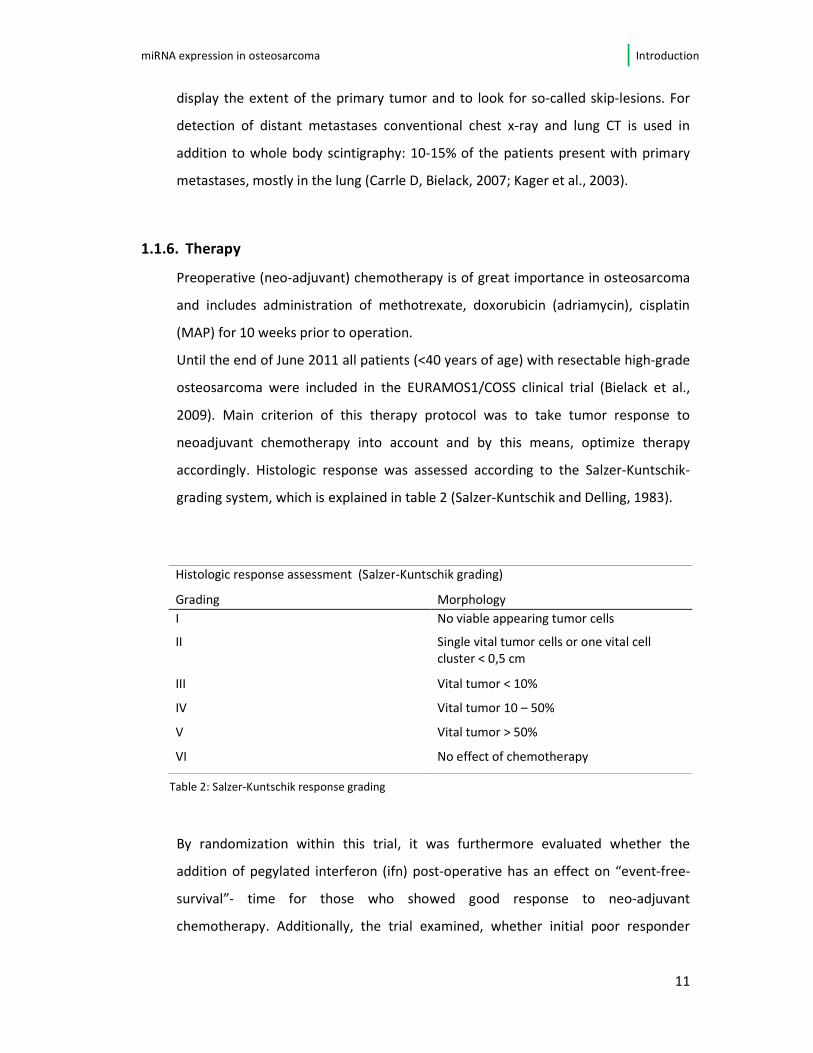
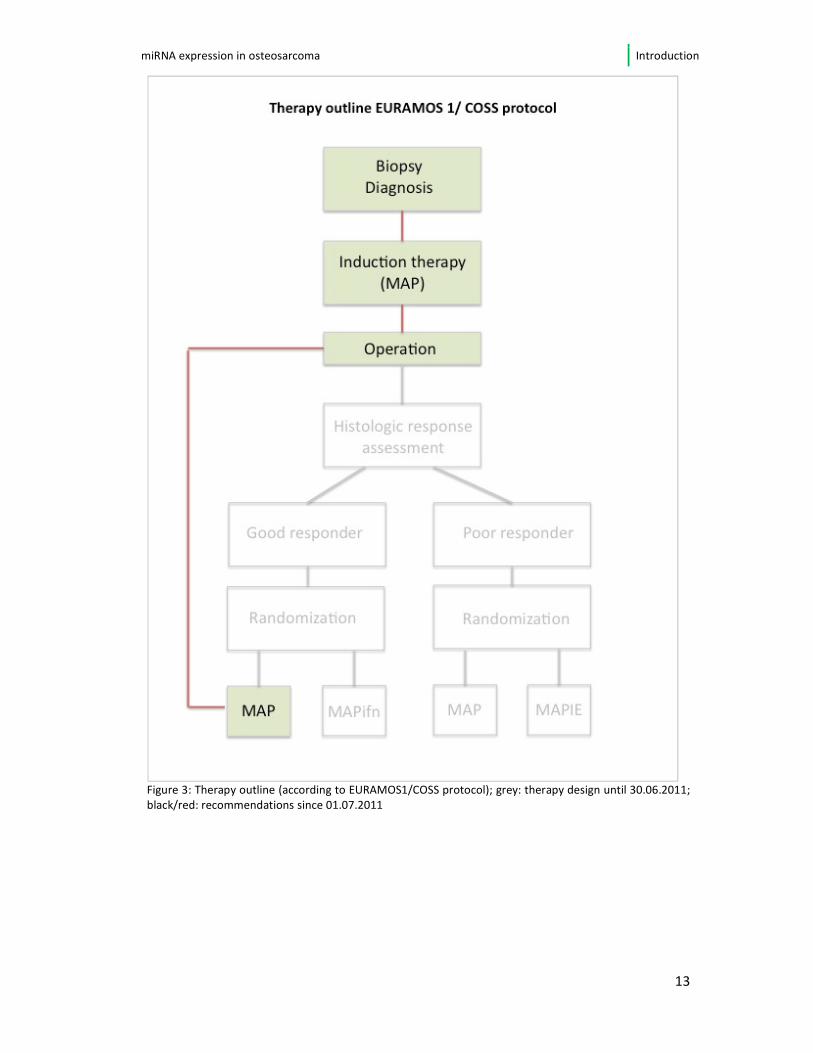
1.1.6. Therapy
Preoperative (neo-adjuvant) chemotherapy is of great importance in osteosarcoma
and includes administration of methotrexate, doxorubicin (adriamycin), cisplatin
(MAP) for 10 weeks prior to operation.
Until the end of June 2011 all patients (<40 years of age) with resectable high-grade
osteosarcoma were included in the EURAMOS1/COSS clinical trial (Bielack et al.,
2009). Main criterion of this therapy protocol was to take tumor response to
neoadjuvant chemotherapy into account and by this means, optimize therapy
accordingly. Histologic response was assessed according to the Salzer-Kuntschik-
grading system, which is explained in table 2 (Salzer-Kuntschik and Delling, 1983).
Table 2: Salzer-Kuntschik response grading
By randomization within this trial, it was furthermore evaluated whether the
addition of pegylated interferon (ifn) post-operative has an effect on “event-free-
survival”- time for those who showed good response to neo-adjuvant
chemotherapy. Additionally, the trial examined, whether initial poor responder
Histologic response assessment (Salzer-Kuntschik grading)
Grading Morphology
I No viable appearing tumor cells
II Single vital tumor cells or one vital cell
cluster < 0,5 cm
III Vital tumor < 10%
IV Vital tumor 10 – 50%
V Vital tumor > 50%
VI No effect of chemotherapy
miRNA expression in osteosarcoma Introduction
12
have a benefit from additional application of etoposide and ifosfamide (MAPIE), as
far as event-free-survival was concerned.
The recruitment for the above mentioned trial has been closed in June 2011.
Until further notice, the study committee is recommending treatment with
standard therapy MAP. A therapy adjustment according to histological response
after pre-operative chemotherapy is no longer included. An overview of the actual
treatment regimen can be seen in figure 3, page 14.
The first results regarding the good responders were officially presented in June
2013. It has been found that disease-free survival after 3 years post diagnosis has
not been influenced by whether the patients were randomized to receive
interferone or chemotherapy alone (77 vs. 74 %). The assessment of the poor
responder was presented in 2014. The Euramos Coss Trial group showed that
adding Ifosfamide and Etoposide to the therapy regimen does not have influence on
outcome of osteosarcoma patients. In fact adding these drugs to standard therapy
led to severe side effects (see EURAMOS-1 Poor Responders CTOS Presentation and
MRC CTU Article, November 2014).
miRNA expression in osteosarcoma Introduction
13
Figure 3: Therapy outline (according to EURAMOS1/COSS protocol); grey: therapy design until 30.06.2011;
black/red: recommendations since 01.07.2011
miRNA expression in osteosarcoma Introduction
14
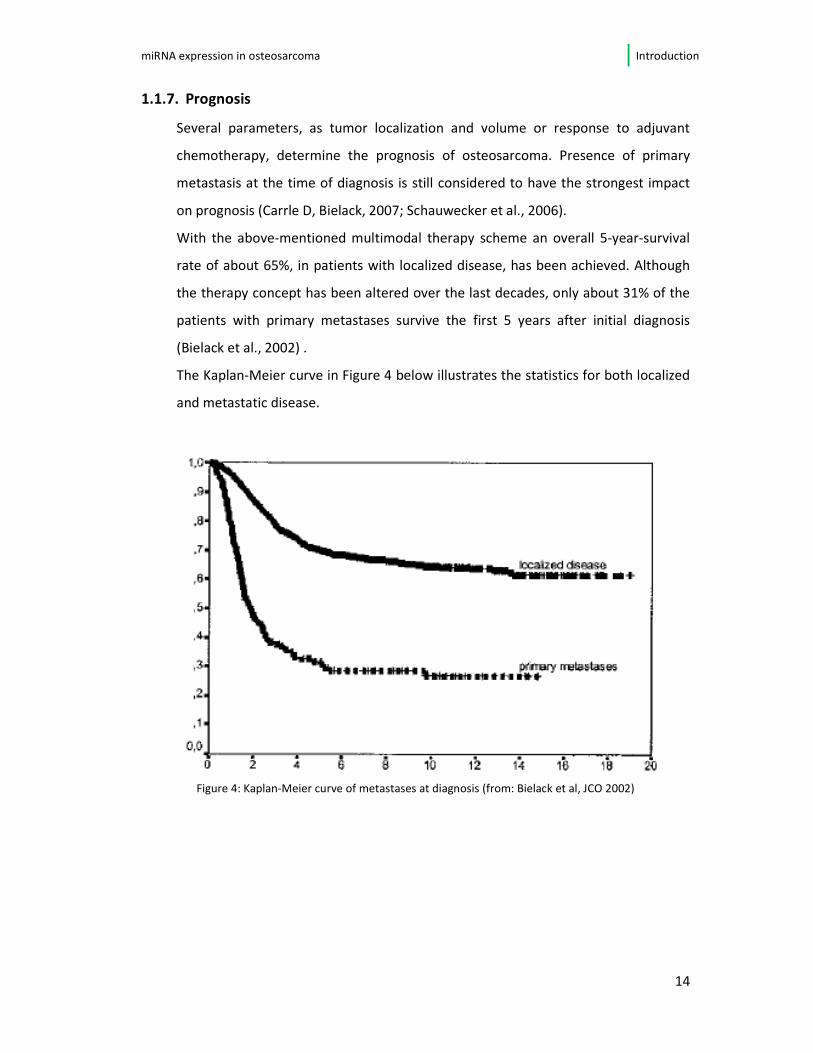
1.1.7. Prognosis
Several parameters, as tumor localization and volume or response to adjuvant
chemotherapy, determine the prognosis of osteosarcoma. Presence of primary
metastasis at the time of diagnosis is still considered to have the strongest impact
on prognosis (Carrle D, Bielack, 2007; Schauwecker et al., 2006).
With the above-mentioned multimodal therapy scheme an overall 5-year-survival
rate of about 65%, in patients with localized disease, has been achieved. Although
the therapy concept has been altered over the last decades, only about 31% of the
patients with primary metastases survive the first 5 years after initial diagnosis
(Bielack et al., 2002) .
The Kaplan-Meier curve in Figure 4 below illustrates the statistics for both localized
and metastatic disease.
Figure 4: Kaplan-Meier curve of metastases at diagnosis (from: Bielack et al, JCO 2002)
miRNA expression in osteosarcoma Introduction
15
1.2. MicroRNA
1.2.1. Definition and biogenesis
MicroRNAs are very short, non-coding RNAs of 20-24 nucleotides in length.
Lin-4 and let-7 were the first microRNA being described, discovered in the
nematode C. elegans (Lee et al., 1993; Reinhart et al., 2000). With the identification
of let-7-homologues in human genome in the year 2000, the microRNA research hit
the next level (Pasquinelli et al., 2000). In the last two decades it has been
discovered that microRNA play an important role in gene regulation (Ambros, 2004;
Bartel and Chen, 2004; He and Hannon, 2004).
The expression of potential targets is controlled either by inducing mRNA-cleavage
or by interfering with the protein translation (Bartel, 2004; Kong et al., 2008; Pillai
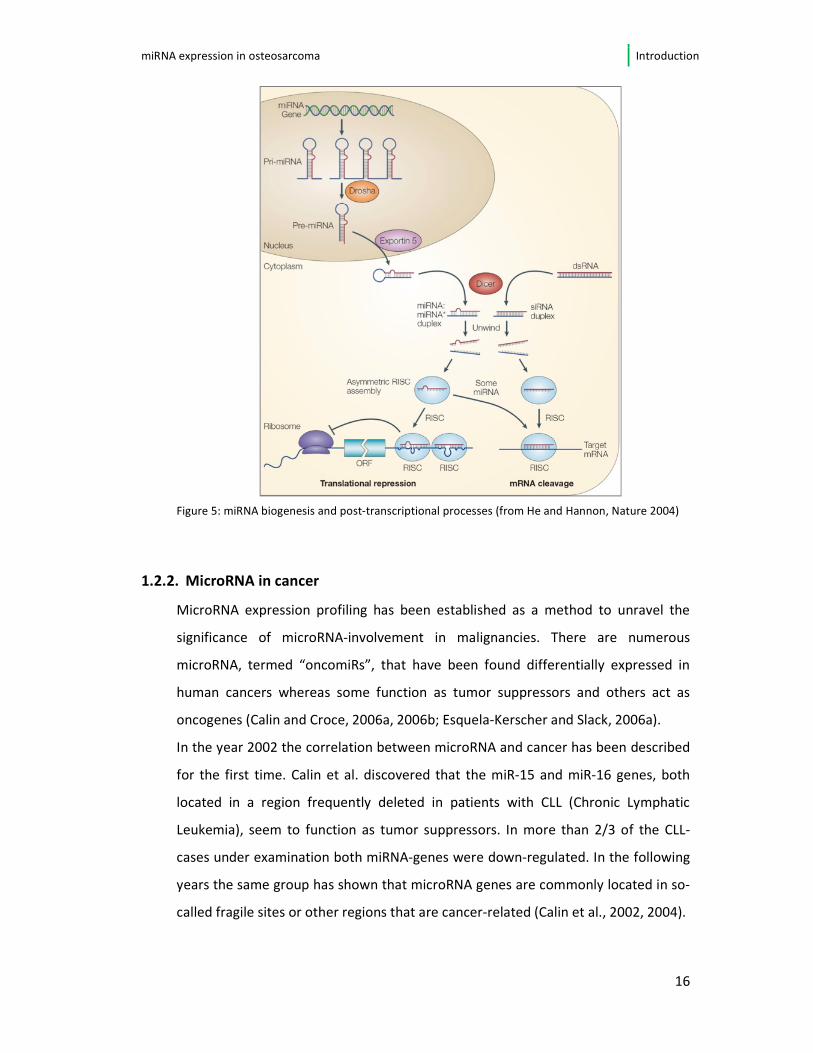
et al., 2005). First step in the microRNA maturation is the transcription of the
microRNA gene by means of RNA polymerase II. These microRNA-transcripts (pri-
miRNA) are subsequently processed into the 70-nucleotide-long precursor-
microRNA (pre-miRNA) by the RNASE III Endonuclease Drosha inside the nucleus
(Lee et al., 2002, 2003). Secondly, after being transported into the cytoplasm,
another RNAse III endonuclease (DICER) is responsible for the pre-miRNA
processing into microRNA-duplexes, consisting of a mature and a complement
microRNA-strand. In the following, these duplex is separated so that just one
strand is introduced into the so-called RISC (RNA-induced silencing) - complex (He
and Hannon, 2004; Kim, 2005). Usually the mature miRNA is incorporated, whereas
the complementary strand is lost to degradation. Depending on the extent of
complementarity to the target mRNA, the microRNA incorporated in the RISC-
complex induces either translational repression or degradation of the mRNA
(Grosshans and Filipowicz, 2008; Yekta et al., 2004). The whole biogenesis of
microRNA and their processing is visualized in figure 5.
miRNA expression in osteosarcoma Introduction
16
Figure 5: miRNA biogenesis and post-transcriptional processes (from He and Hannon, Nature 2004)
1.2.2. MicroRNA in cancer
MicroRNA expression profiling has been established as a method to unravel the
significance of microRNA-involvement in malignancies. There are numerous
microRNA, termed “oncomiRs”, that have been found differentially expressed in
human cancers whereas some function as tumor suppressors and others act as
oncogenes (Calin and Croce, 2006a, 2006b; Esquela-Kerscher and Slack, 2006a).
In the year 2002 the correlation between microRNA and cancer has been described
for the first time. Calin et al. discovered that the miR-15 and miR-16 genes, both
located in a region frequently deleted in patients with CLL (Chronic Lymphatic
Leukemia), seem to function as tumor suppressors. In more than 2/3 of the CLL-
cases under examination both miRNA-genes were down-regulated. In the following
years the same group has shown that microRNA genes are commonly located in so-
called fragile sites or other regions that are cancer-related (Calin et al., 2002, 2004).
miRNA expression in osteosarcoma Introduction
17
Typical microRNA expression profiles have been identified for nearly all cancer
subtypes. A study from 2005, for example, described a set of 15 different microRNA
that managed to distinguish between normal and malignant breast tissue in 86
samples (Iorio et al., 2005). In the same year, Lu and others were able to classify
numerous different cancer entities according to their microRNA expression profiling
(Lu et al., 2005). Moreover, microRNAs have not only been found to regulate certain
cancer-associated genes but to play a key role in most known cancer pathways.
Certain let-7-family-members seem to be involved in regulating NRAS oncogenes.
MiR-143 and miR-145 were proven to have a suppressing effect in colorectal cancer
by targeting KRAS (Chen et al., 2009; Johnson et al., 2005; Michael et al., 2003).
MiR-21 has been characterized as having anti-apoptotic features in glioblastoma. In
addition to that, miR-21 seems to be involved not only in breast cancer but also in
colorectal, other gastrointestinal malignancies or lung cancer (Asangani et al., 2008;
Frankel et al., 2008; Krichevsky and Gabriely, 2009). By targeting PDCD4, TPM1 or
MAPK, respectively, miR-21 has influence on migration, invasion and proliferation
representing cellular abilities that are uncontrolled in cancer. Furthermore, miRNA
like miR-126, miR-1 or miR-146b, miR-182 and miR-183 have been recognized in this
context, as well (Baranwal and Alahari, 2009).
Because of the multitude of miRNAs that has been linked to cancer it is almost
impossible to list all comprehensively. MicroRNA dysregulation, by down- or up-
regulation, seems to be a feature in all malignancies (Croce, 2009).
1.2.3. MicroRNA in osteosarcoma pathogenesis
There are several studies existing that examine microRNA expression in
osteosarcoma regarding their impact on clinical parameters, its pathogenesis or
their influence on certain target genes. The common point of all these studies is the
search for biomarkers or potential therapeutic targets in osteosarcoma.
A number of studies analyzed microRNA expression focusing on its ability to
discriminate between osteosarcoma and normal tissue (Maire et al., 2011; Namløs
et al., 2012). Furthermore genome-wide microRNA profiling has been performed to
miRNA expression in osteosarcoma Introduction
18
see how relevant certain microRNA are in osteosarcoma cell invasion, migration and
proliferation, apoptosis, metastasis or chemoresponse (Gougelet et al., 2011; He
et al., 2009; Song et al., 2010; Ziyan et al., 2011).
A database summarizing and evaluating all the data concerning microRNA
expression and their targeted genes has been established, in cooperation with our
group, just recently (Poos et al., 2014). On osteosarcoma-db.uni-muenster.de a
comprehensive overview about what is known so far about miR involvement in
osteosarcoma (81 microRNA-entries, 911 target genes as of 12/ 2014) can be found.
Based on this database and literature, the most relevant microRNA (as measured by
number of appearance, at least repeated once) in osteosarcoma are:
miR-9, miR-16 (16-5p), miR-17-92 cluster (17,18a, 19a, b and 20a, miR-92a and miR-
93), miR-21, miR-29a and b, miR-31, miR-34a, b, c, miR-133a and b, miR-134, miR-
140, miR-143, miR-145, miR-148a, miR-183, miR-195, miR-199a-3p, miR-223, miR-
335, miR-382, miR-451a.
To what extent this work can add new microRNA relevant in osteosarcoma or
strengthen existing data will be subject of the discussion later on.

miRNA expression in osteosarcoma Thesis objectives and design
19
2. Thesis objectives and design
2.1. Thesis objectives
Patients with osteosarcoma are in need of new therapy strategies. That microRNAs
seem to play an important role in osteosarcoma pathogenesis has been outlined
before. By approaching the topic “microRNA and its relevance in osteosarcoma
pathogenesis” from both cellular and genomic level, I intended to give a
comprehensive answer to the following questions:
• Can microRNA or a subset of microRNA be identified helping to distinguish
between osteosarcoma and normal tissue?
• Is it possible to connect the miRNA and mRNA expression patterns to real
biologic effects in the cells? Which are likely targets of these miRNA?
• Can microRNA deregulation help to explain the typical malignant features
(invasion, uncontrolled proliferation, migration) in osteosarcoma?
• Is it possible to locate more microRNAs as key players in canonical pathways of
osteosarcoma? Are there more miRNAs responsible than already identified in
osteosarcoma (for example miR-21, miR-34)?
• Will the “usual suspects” in osteosarcoma as RB1, c-myc or CDKN2A be
connected to candidate miRNA or will new potential target genes be found?
• Will the integration of miRNA and mRNA data help creating “new networks” to
explain how osteosarcoma is forming? Could the findings be connected to
existing networks (as bone differentiation or proliferation)?
miRNA expression in osteosarcoma Thesis objectives and design
20
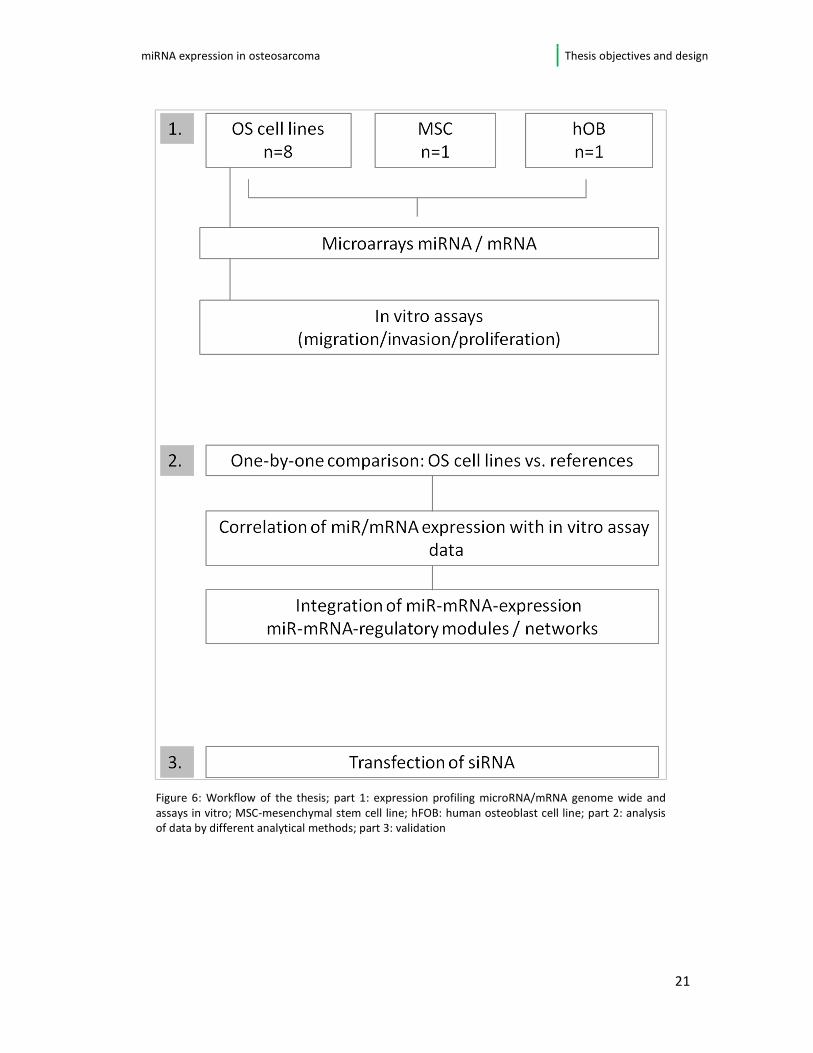
2.2. Study design
To investigate microRNA and their pathogenic relevance in osteosarcoma this work
was structured as follows (see figure 6, page 21):
• Eight established commercially available osteosarcoma cell lines (listed in table 3,
page 23), one human ostoblastic (hFOB1.19) and one mesenchymal stem cell line
(L87.4) were analyzed for genome wide expression of microRNA (miRCURY™ LNA
Array; miRbase version 15.0) and mRNA (Affymetrix 1.0 ST arrays; estimated
number of genes 28.869). Additionally the osteosarcoma cell lines were
characterized using in vitro (proliferation, migration and invasion) cell assays.
• The expression of osteosarcoma cells and the reference cell lines were compared
for both microRNA and mRNA separately for identifying microRNA and mRNA
differentially expressed in osteosarcoma versus progenitor cell lines.
Moreover, using conventional association testing, deregulated microRNA and their
potential target genes significantly correlating with the osteosarcoma cell lines’
potential to proliferate, migrate and invade, respectively, were identified. In
another, more advanced analytical approach, the expression matrices of both
microRNA and mRNA were utilized to find gene regulatory networks. Hereby the
focus lay exclusively on those microRNA-mRNA-couples that showed differential
expression between the phenotype groups (migration/invasion and proliferation
as indicator for degree of aggressiveness). To identify “real” mRNA-miRNA-
modules the couples in the prediction database mirdb were validated and only the
“most likely” (prediction score>80) kept for further analysis. Finally, by means of
the IPA (Ingenuity Pathway Analysis) software the microRNA-mRNA regulatory
modules (proliferation and migration/invasion) have been evaluated in regard to
their part in canonical pathways in cancer and disease.
• As common points were found in the analyses (deregulation of the same
microRNA identified by different approaches) primary validation experiments
were performed in the cell lines, e.g. transfection of siRNA.
miRNA expression in osteosarcoma Thesis objectives and design
21
Figure 1:
Figure 6: Workflow of the thesis; part 1: expression profiling microRNA/mRNA genome wide and
assays in vitro; MSC-mesenchymal stem cell line; hFOB: human osteoblast cell line; part 2: analysis of data by different analytical methods; part 3: validation
miRNA expression in osteosarcoma Material and methods
22
3. Material and methods
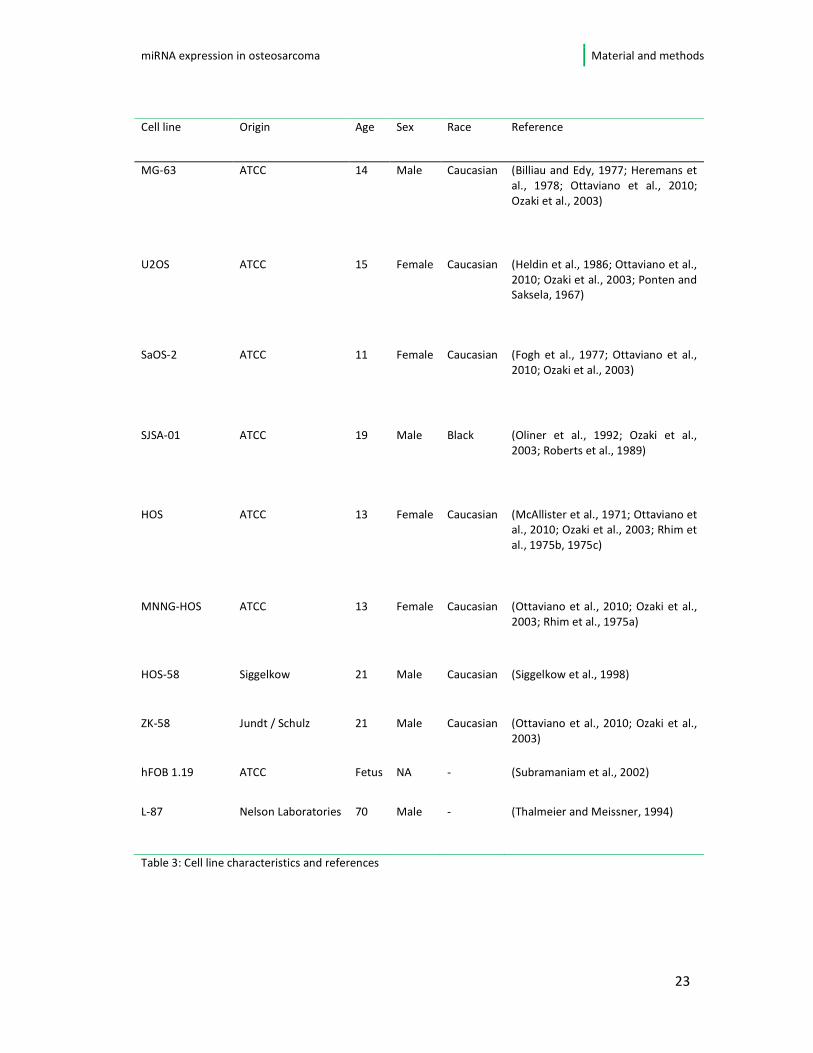
3.1. Osteosarcoma cell lines
Pre-therapeutic patient material of osteosarcoma is limited due to the treatment
trial design. Therefore tumor derived cell lines represent the best available model
for investigating the cells properties in a comprehensive manner without wasting
valuable patient samples. The immortal cell lines utilized in this study are well-
described adherent cell lines purchased from ATCC or other partner institutes
(Heide Siggelkow, Nelson Lab). An overview of the cell lines is given in table 3 on the
following page.
miRNA expression in osteosarcoma Material and methods
23
Table 3: Cell line characteristics and references
Cell line Origin Age Sex Race Reference
MG-63 ATCC 14 Male Caucasian (Billiau and Edy, 1977; Heremans et
al., 1978; Ottaviano et al., 2010;
Ozaki et al., 2003)
U2OS ATCC 15 Female Caucasian (Heldin et al., 1986; Ottaviano et al.,
2010; Ozaki et al., 2003; Ponten and Saksela, 1967)
SaOS-2 ATCC 11 Female Caucasian (Fogh et al., 1977; Ottaviano et al.,
2010; Ozaki et al., 2003)
SJSA-01 ATCC 19 Male Black (Oliner et al., 1992; Ozaki et al.,
2003; Roberts et al., 1989)
HOS ATCC 13 Female Caucasian (McAllister et al., 1971; Ottaviano et
al., 2010; Ozaki et al., 2003; Rhim et
al., 1975b, 1975c)
MNNG-HOS ATCC 13 Female Caucasian (Ottaviano et al., 2010; Ozaki et al.,
2003; Rhim et al., 1975a)
HOS-58 Siggelkow 21 Male Caucasian (Siggelkow et al., 1998)
ZK-58 Jundt / Schulz 21 Male Caucasian (Ottaviano et al., 2010; Ozaki et al.,
2003)
hFOB 1.19 ATCC Fetus NA - (Subramaniam et al., 2002)
L-87 Nelson Laboratories 70 Male - (Thalmeier and Meissner, 1994)
miRNA expression in osteosarcoma Material and methods
24
3.2. Cell cultivation
3.2.1. Cell culture conditions
The osteosarcoma cell lines SaOS-2, SJSA-01, MG-63, U2OS, HOS, HOS-58, ZK-58
und MNNG-HOS, as well as the human osteoblast cell line hFOB 1.19 and the stem
cell line L-87.4 were cultivated under sterile conditions in a humidified atmosphere
(37°C and 5% CO2 ) .The medium used for all cell lines was RPMI 1640 + L-Glutamine
(PAA), supplemented each with 10% FCS. No antibiotics or antimycotics were
added.
3.2.2. Cell counting
Cell counting was performed using the Beckman Cell Coulter Z1. After trypsinization
of adherent cells, the reaction has been stopped by adding RPMI Medium. After
that 0,5µl of this solution was added to 19,5ml sodium chloride solution obtaining a
dilution factor of 1:40. The Beckman Coulter then assessed cell number by counting
all particles exceeding a diameter of 7 µm.
3.2.3. Wash cells and medium changing
Culture medium was changed every 2-3 days, depending on each cell line’s
requirements. The color change of the medium indicated the nutritional status in
the culture flasks. First the old culture medium was removed very carefully with a
single-use-pipette. The adhering cells were washed once with PBS to remove any
residua of medium or cell debris. The washing buffer has again been aspirated with
a single-use-pipette. Subsequently 2,5 ml (or 6ml for T75-flasks) of fresh medium
was added to the culture flask.
3.2.4. Sub-culturing
When showing confluence under the light microscope, cells were sub-cultured. The
initial procedure was the same as previously described: old medium was completely
removed; attached cells were washed with PBS and aspirated again. Doing this it
was made sure to leave no residua of medium, which could diminish the effect of
miRNA expression in osteosarcoma Material and methods
25
trypsinization. Then (depending on size of the culture flask) around 0,4 ml trypsin
(or 1ml for T75) was added to culture flask. After a short incubation time (2-5 min,
differing according each cell lines adhesive characteristics) at 37°C on a hot plate,
culture flask was checked under an inverted microscope to see the amount of cell
detachment. The tenfold amount of cell culture medium RPMI (compared to the
amount of trypsin used) was added to stop the Trypsin effect.
After repeated re-suspension of this cell suspension a small amount (around 5-10%)
was transferred into a new culture flask. Culture medium was added to cell
suspension and the cells were incubated again.
3.3. Cell culture assays
3.3.1. General outline
For evaluation of the proliferative, migrative und invasive properties of our
osteosarcoma cell lines, assays already established in literature were used. Every
assay was performed under the same conditions for all cells. RPMI 1640 (10% FCS)
was used as the culture medium for all cell lines. Furthermore only cells showing
around 60-80% confluence were used for the assays.
3.3.2. Proliferation assay
For growth determination of the cell lines 1x10⁵ cells were seeded in 25cm2 cell
culture flasks. This was done for every cell line in duplicate. Over a time period of 7
days cells were counted using an automated cell counter (Beckman Coulter).
Therefore, cells were harvested after 24h, 48h, 72h, 96h and 168h hours by
trypsinization. The mean cell numbers for every cell line were calculated and
plotted into a growth curve with logarithmic scaling (see figure 7). In logarithmic
phase doubling time (td) has been calculated. This has been done for each cell line
using the following equation:
miRNA expression in osteosarcoma Material and methods
26
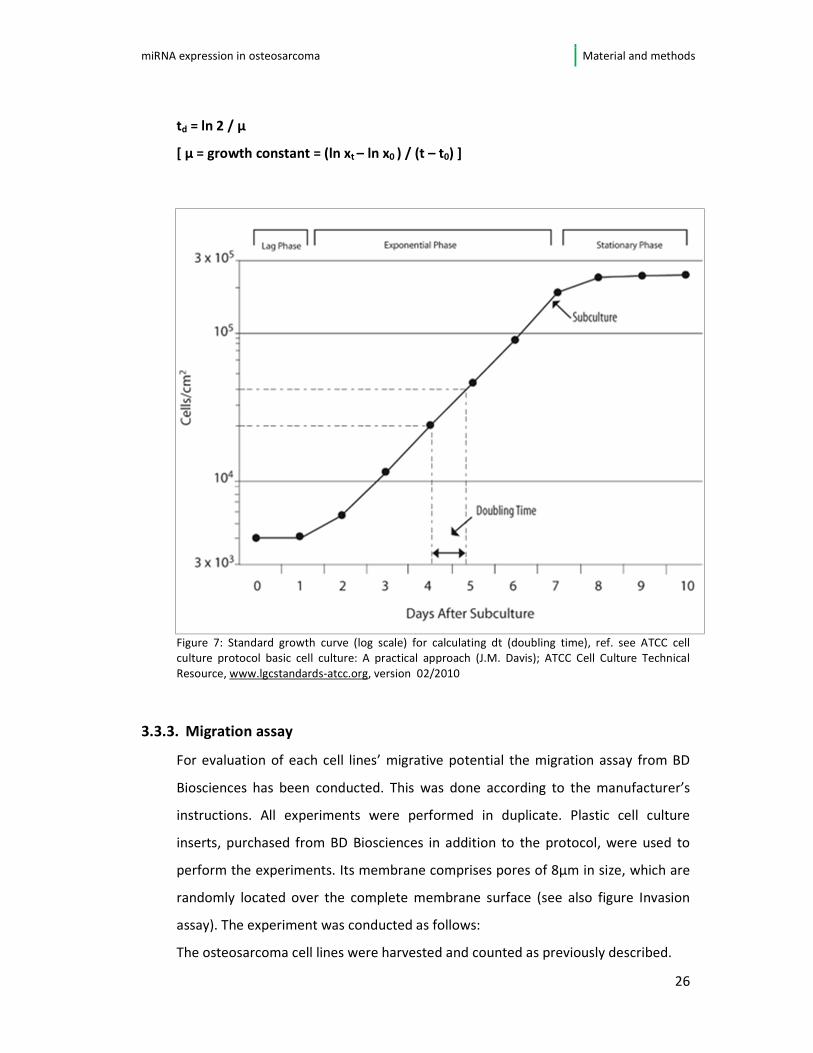
td = ln 2 / µ
[ µ = growth constant = (ln xt – ln x0 ) / (t – t0) ]
Figure 7: Standard growth curve (log scale) for calculating dt (doubling time), ref. see ATCC cell
culture protocol basic cell culture: A practical approach (J.M. Davis); ATCC Cell Culture Technical
Resource, www.lgcstandards-atcc.org, version 02/2010
3.3.3. Migration assay
For evaluation of each cell lines’ migrative potential the migration assay from BD
Biosciences has been conducted. This was done according to the manufacturer’s
instructions. All experiments were performed in duplicate. Plastic cell culture
inserts, purchased from BD Biosciences in addition to the protocol, were used to
perform the experiments. Its membrane comprises pores of 8µm in size, which are
randomly located over the complete membrane surface (see also figure Invasion
assay). The experiment was conducted as follows:
The osteosarcoma cell lines were harvested and counted as previously described.
miRNA expression in osteosarcoma Material and methods
27
In each well 900µl cell culture medium (RPMI 1640), supplemented with 10% FCS,
was put in to act as a chemo-attractant. After that the inserts were placed into the
wells. A cell suspension of 2,5x10⁴ cells in 0,2% FCS containing RPMI was added
making sure that the amount of fluid did not extent 350µl. Subsequently the
migration chambers (24-well-plate with inserts) have been incubated for 24 and 48
h at 37 °C (5% CO2). After that incubation time the inserts were transferred into a
clean 24-well-plate. They were washed once with 600µl PBS each. Afterwards the
upper side of the membrane was swabbed with a cotton tip twice to remove all
cells that have not been migrating through. Later the inserts were put in methanol
for 2 minutes to fixate the invaded cells on the lower side of the membrane. A short
washing procedure in aqua (Ampuwa) was performed after that. To stain the cells
on the lower membrane side, the inserts were placed into a 24-well-plate
containing 2% Toluidine-blue. The staining was performed for 10 minutes. The color
residuals were then washed in water. Again cotton swabs were used to clean the
membrane’s upper side from all color residuals. Subsequently the membranes were
dried for 1 h at 37°C. To allow light-microscopic analysis, the membranes were then
cut using a fine cannula. The membranes were fixated under a cover slip. For each
cell line (and duplicates) 10 visual fields (magnification 10x) were analyzed, counting
the stained cells.
3.3.4. Invasion assay
For evaluation of each cell lines’ invasive potential the Biocoat™ Matrigel™ Invasion
Assay (BD Biosciences) has been conducted. The BD Biocoat™ Matrigel™ Invasion
chamber is built similarily to the migration insert but additionally a Matrigel®
membrane coats the bottom of the cell culture insert. Please consult figure 8 on
page 29 for visualization. Matrigel® is a gelatin-like substance that derived from
mouse sarcoma cells (EHS). Since this protein mixture contains collagen Type IV,
laminin or heparan sulfate proteoglycan, it is supposed to simulate the basement
membrane (Kleinman et al., 1986). The method has basically been performed
analogous to the migration assay. Difference was that the chambers’ storage in -
20°C was necessary because of matrigel® coating present in these cell culture
miRNA expression in osteosarcoma Material and methods
28
inserts. Additionally, before starting the assay the matrigel-coated inserts have
been warmed up at room temperature for 20 minutes. In the following, according
to the manufacturer’s instructions, hydrogenating of the membrane with the basic
medium (RPMI 1640) was performed. The inserts were placed into the 24-well-
plates and incubated for 2 h at 37°C and 5% CO2.
Differently from the Migration assay a total of max. 500µl fluid for the inserts and a
total of 750µl chemo-attractant were used for the wells. This was a
recommendation by the manufacturer BD Biosciences. Subsequently the invasion
chambers (24-well-plate with inserts) have been incubated for 48 h at 37 °C (5%
CO2) and evaluation of invaded cell number was done only after 48 h.
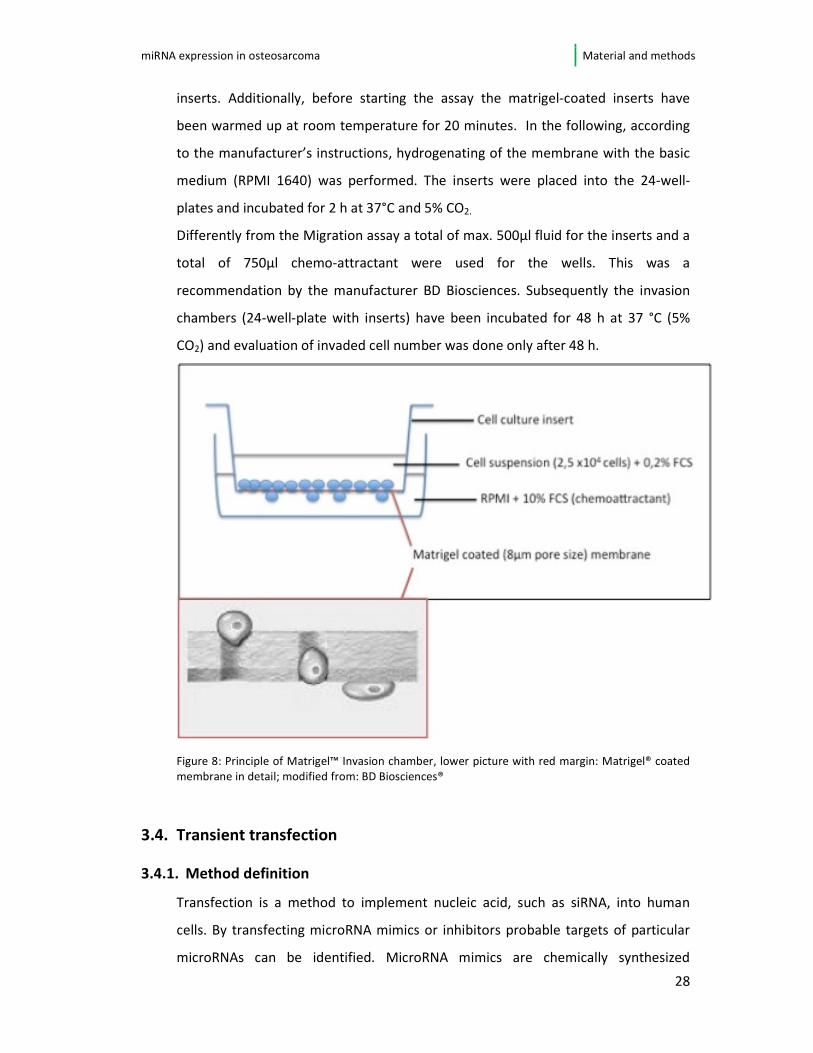
Figure 8: Principle of Matrigel™ Invasion chamber, lower picture with red margin: Matrigel® coated
membrane in detail; modified from: BD Biosciences®
3.4. Transient transfection
3.4.1. Method definition
Transfection is a method to implement nucleic acid, such as siRNA, into human
cells. By transfecting microRNA mimics or inhibitors probable targets of particular
microRNAs can be identified. MicroRNA mimics are chemically synthesized
miRNA expression in osteosarcoma Material and methods
29
microRNAs which, after being transfected into the cell, mimic naturally occurring
microRNAs. MicroRNA inhibitors are single-stranded modified RNAs which, after
transfection, specifically inhibit miRNA function. Reduced gene expression after
transfection of a microRNA mimic or increased expression after transfection of a
microRNA inhibitor provides evidence that the miRNA under study is involved in
regulation of that gene. Alternatively, the role of miRNAs in various pathways can
be studied by examination of a specific phenotype following microRNA mimic or
inhibitor transfection (see guidelines for miRNA mimic and miRNA inhibitor
experiments, Quiagen®).
3.4.2. Optimization of transfection efficiency
For evaluating transfection efficiency the AllStars Hs Cell Death Control siRNA ®
(purchased from Quiagen®) was used. AllStars Hs Cell Death Control® is a siRNA mix
targeting human genes responsible for cell survival. Transfection of this control
leads to a knockdown of these genes and subsequently a high amount of cell death.
The transfection control experiments were conducted according to the protocol
provided by Quiagen® (for detailed protocol description see Appendix)
After 48-96 hours post transfection its efficiency was observed by light microscopy.
Transfection conditions that resulted in the greatest degree of cell death in
comparison to transfection with a negative control were maintained in future
experiments. For finding the appropriate amount of transfection reagent, as well as
the right microRNA-mimic/inhibitor ratio necessary for the final transfection of our
cell type a number of optimization trials were conducted. Based on suggestions
given by the manufacturer different ratios of HiPerFect® reagent and siRNA were
pipetted together with the AllStar Hs Cell Death siRNA® as a positive control.
Analogue to the recommendations of Quiagen the 10fold amount of microRNA-
inhibitor compared to mimic was used for transfection.
3.4.3. Transfection of miRNA-181a and miRNA-let-7f
As a first part of the validation experiments both the mimicry miRNA and the
inhibiting microRNA of let-7f and miR-181a were transfected. These specific
miRNA expression in osteosarcoma Material and methods
30
microRNAs were chosen exemplarily to find out if the conclusion drawn from the
expression profiling and the cell culture assays can be validated.
Therefore 2µM of miRNA-181a- and the let-7f-mimic were transfected into 6 cell
lines (MNNG, SJSA, MG-63, HOS, SaOS and MNNG; duplicates for each) according to
the manufacturers protocol (see appendix for further information on the protocol).
Additionally 20µM of the inhibiting siRNA (anti-miR-181a and anti-let-7f) were
transfected. The transfection was started one day after seeding the cells with a
number of 105 – 106/well on 12-well plates to obtain an optimal confluence and
adequate physiological conditions for the osteosarcoma cells. These conditions
were chosen according to the traditional protocol, also provided by Quiagen® (see
appendix). In the next step only one of them (miR-181a) was transfected to see the
effect more clearly and to have a comparison between all osteosarcoma cell lines.
These first experiments should enable to find the appropriate amounts of inhibiting
or mimic miRNA and to verify which would be a safer choice for further
experiments. Since the positive control (AllStar Hs Cell Death Control®) was already
applied before, for this transfection only negative controls (same cells in media only
with transfection reagent) were used. According to the manufacturers
recommendations cells were seeded in 12-wells plates with 100.000 cells/well 24
hours prior to transfection. Transfection with 181a-miR-inhibitor (Anti-hsa-miR-
181a miScript miRNA inhibitor, mature miRNA sequence:
5’AACAUUCAACGCUGUCGGUGAGU), 181a-miR-mimic (syn-hsa-miR-181a miScrpt
miRNA mimic, mature miRNA sequence: 5’ AACAUUCAACGCUGUCGGUGAGU), let-
7-inhibitor (anti-hsa-let-7f miScript miRNA inhibitor, mature miR-sequence:
5’UGAGGUAGUAGAUUGUAUAGUU) and let-7-mimic ( Syn-hsa-let7f miScript miRNA
mimic, mature miR-sequence: 5’UGAGGUAGUAGAUUGUAUAGUU) was performed
using HiPerfect® Reagent. All reagents and oligonucleotides were purchased from
Quiagen®. For each replicate 3µl (=75ng) of the siRNA and 6µl of the Transfection
reagent HiPerfect was used.
After transfection of the osteosarcoma cell lines the in vitro assays (described in
chapter 3.3.2 - 3.3.4) to measure the growth activity and the potential to migrate
and invade were performed again. By this means the changes in phenotype after
transfection were evaluated.
miRNA expression in osteosarcoma Material and methods
31
We decided to focus only on the miR-181a-inhibitor to monitor its influence in
proliferation potential. Therefore all osteosarcoma cell lines were again transfected
with this inhibiting microRNA and a growth curve for the transfected cells was
conducted.
3.5. Molecular genetic material and methods
Since the microRNA expression arrays and the gene expression profiling were
performed by a cooperative department of the core facility or a service by a
company the methods will be described only for a general understanding but not in
detail.
3.5.1. RNA extraction and sample preparation
Isolation of total RNA was conducted by using the Ambion miRVana® Extraction Kit
and performed according to the manufacturer’s instructions. RNA-concentration
and -purity have been assessed by measuring UV absorbance. All samples showed a
ratio of 1,8 – 2,1 (Absorbance ratio A260nm /A280nm ) indicating highly pure RNA. RNA
quantification was performed by Nanodrop measurement. A total of 20 samples
(each cell line in duplicate, different passages) were submitted to Exiqon®. There
RNA’s high quality and therefore suitability for further microRNA micro array
analysis was confirmed.
3.5.2. MicroRNA expression array (miRCURY LNA-Array)
The performance of microRNA arrays was done by Exiqon® (Vedbaek, Denmark) as
follows: The samples were labeled using the miRCURY™ Hyr3/Hy5 Power Labeling
Kit and hybridized on the miRCURY™ LNA Array (5th Generation Array). This array
contained capture probes targeting all human microRNAs listed in the miRBase 15.0
version (Griffiths-Jones, 2004; Griffiths-Jones et al., 2008). The normalization of the
quantified, background corrected signals was accomplished using the global Lowess
Algorithm (Ritchie et al., 2007). The microRNA data were provided as an excel
spread sheet file containing the log2 ratio expression matrix of the microRNA array
probes. Those marked with “NA” showed insufficient quality. Only probes with valid
expression values (n=255 probes) in all cell lines were kept for further analysis.
miRNA expression in osteosarcoma Material and methods
32
Technical duplicates of the cell line microRNA expression data showed an overall
good correlation (> 70%).
3.5.3. Gene expression profiling (Affymetrix 1.0 Gene Chip Array)
The array data for the 10 cell lines (8 osteosarcoma, 2 progenitor cell lines) were
conducted in cooperation with the Institute of Experimental Genetics at HMGU.
The Affymetrix 1.0 Gene array is a whole-transcript-approach covering an estimated
number of 28.869 genes. An average of 26 probes per gene and only perfect match
probes (set of controls for background subtraction) were used. Around 58% of the
probe sets are supported by the databases RefSeq, Ensembl and GenBank, another
32% only by Ensembl. Around 100-150mg of total RNA was amplified and labeled
according to the WT Sense Target Labeling Assay. Labeled single stranded DNA was
hybridized to the above-mentioned array chip. Scanning of the chips was performed
using the Affymetrix GenChip Scanner 3000 7G. QC (quality control) and RMA
(robust multichip average) data were generated using the Affymetrix expression
console including annotation.
3.6. Data analysis
3.6.1. In vitro assay analysis
The assaying of the cell lines regarding their biological behavior in vitro provided a
way of distinguishing the osteosarcoma cell lines according to their phenotype.
Groups of similarities (fast and slow growing, migrating and non-migrating as well
as invading and non-invading cell lines) were created. The osteosarcoma cell lines
were assigned to be either negative or positive in the three characteristics.
This knowledge concerning the phenotype was later used to associate biological
appearance with the expression patterns in microRNA and mRNA.
3.6.2. MicroRNA target prediction
For this work the prediction data from the website miRDB 15.0
(http://mirdb.org/miRDB/) has been used. A prediction score is utilized to weigh
miRNA expression in osteosarcoma Material and methods
33
the miRDB prediction results. Only targets with a prediction score > 80 are very
likely to represent real microRNA targets of the miRNA of interest, so that only
those were included in target analysis (Griffiths-Jones, 2004; Griffiths-Jones et al.,
2008; Wang and El Naqa, 2008).
Two reference cell lines, one human osteoblast (FOB 1.19) and a mesenchymal stem
cell line (l-87) were used for analysis. The linear miRNA and mRNA expressions of
the tumor cell lines have been divided by those of the reference cell lines and the
resulting ratios were log2-transformed. Genes and microRNA were regarded as
differentially expressed when the log2-fold change was less than 0,8 (down-
regulation) or greater than 1,2 (up-regulation). Since in one-by-one comparison
statistical testing is not possible it was determined by sign-testing. Basis was the
null hypothesis that unchanged microRNA expression is reflected by unchanged
mRNA expression and hence by an equal distribution of positive and negative log2-
ratios around 0. The sign-test assigns a +1 to all positive log2-ratios and a -1 to all
that are negative regardless of the absolute value of the log2-ratio. Null hypothesis
is rejected when a microRNA molecule with a positive log-fold change leads to
significantly more negative microRNA log2-ratios in comparison to an equal
distribution of negatives and positives and vice versa. The results of this analysis
were summarized in an excel spreadsheet containing lists of microRNAs and genes.
The gene lists were then used to feed the online analysis tool DAVID
(http://david.abcc.ncifcrf.gov/) for generating DO term and pathway enrichment
analysis in order to get an idea of the functional impact of the genes (Huang et al.,
2009).
3.6.3. Integration microRNA and mRNA expression in correlation to phenotype
The endpoint assay data for migration/invasion and cell growth were used to
classify (two groups for each phenotype) the cell lines as positive or negative
regarding these certain characteristics. For both the microRNA and mRNA datasets
differentially expressed microRNA and mRNA were identified using the R package
limma. The expression data were fitted to a linear model using the function lmfit
and the contrasts, including estimated coefficients and standard errors, were
calculated between the groups using the function contrast.figt and the moderated
miRNA expression in osteosarcoma Material and methods
34
t-statistics, moderated f-statistic and log-odds of differential expression computed
by empirical Bayes shrinkage of the standard errors. The results were presented as
lists generated by the function toptable (see table 4; sorted by the log-FC and
includes only genes with p-values smaller than 0,05) containing the following
values:
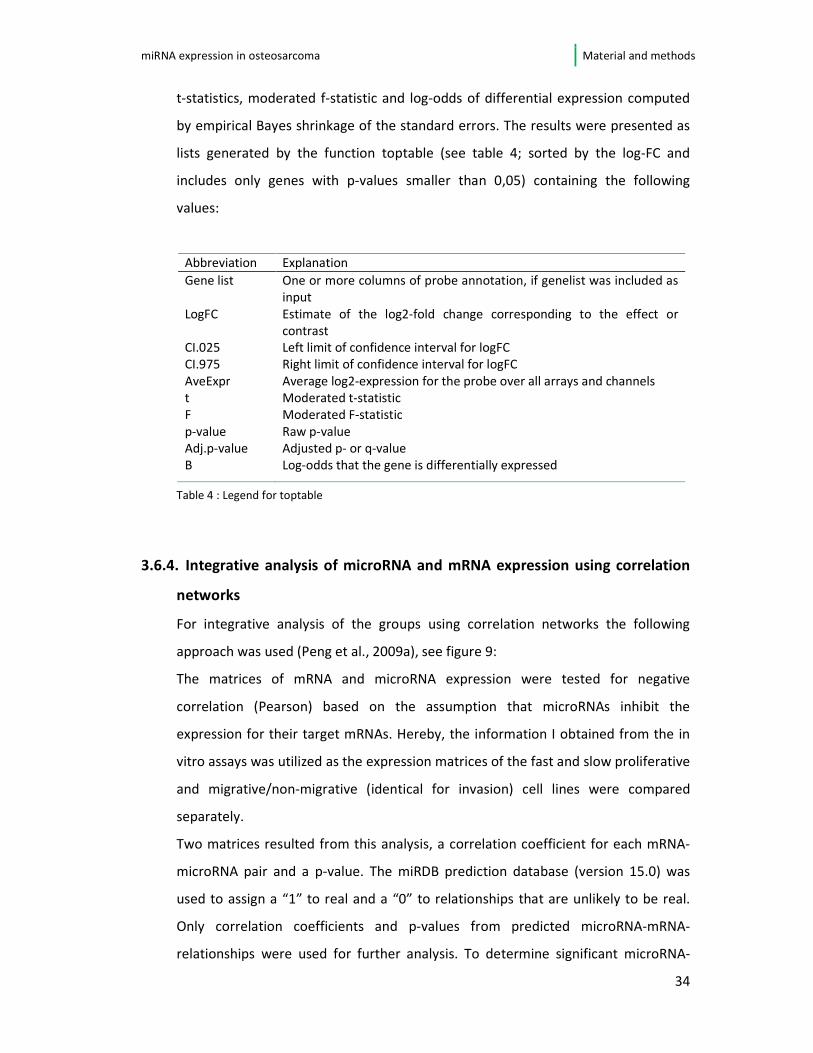
Abbreviation Explanation
Gene list One or more columns of probe annotation, if genelist was included as
input
LogFC Estimate of the log2-fold change corresponding to the effect or
contrast CI.025 Left limit of confidence interval for logFC
CI.975 Right limit of confidence interval for logFC
AveExpr Average log2-expression for the probe over all arrays and channels
t Moderated t-statistic
F Moderated F-statistic
p-value Raw p-value
Adj.p-value Adjusted p- or q-value
B Log-odds that the gene is differentially expressed
Table 4 : Legend for toptable
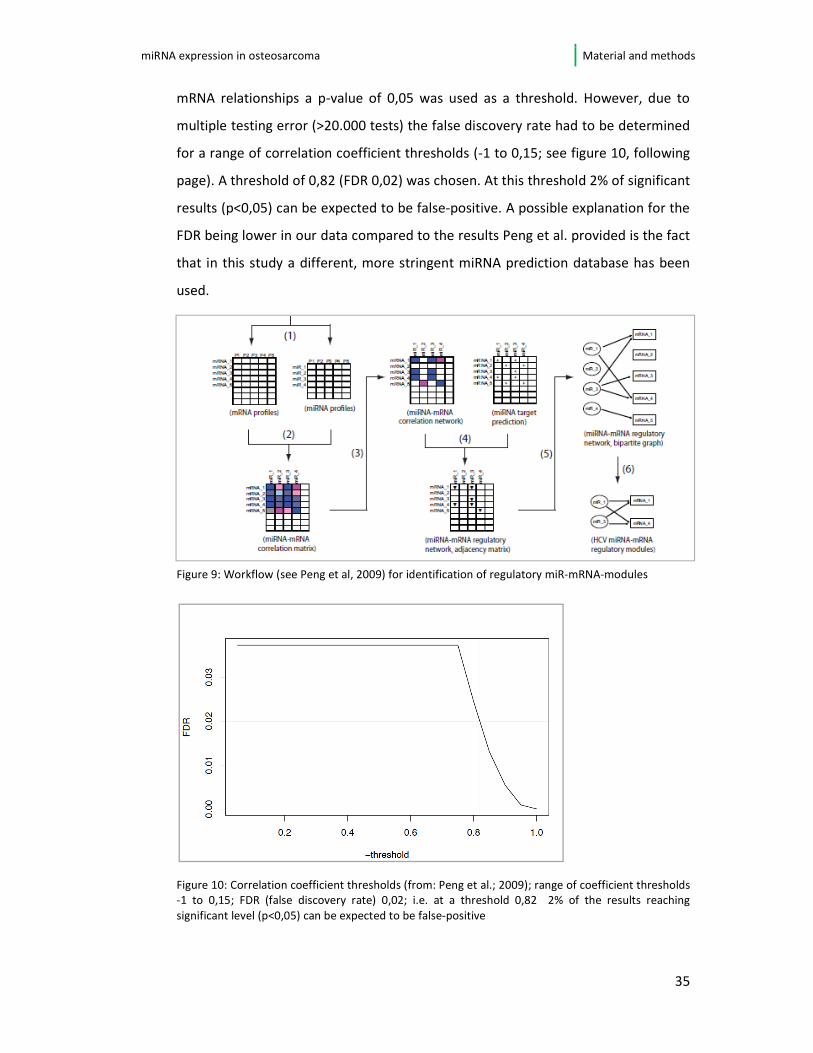
3.6.4. Integrative analysis of microRNA and mRNA expression using correlation
networks
For integrative analysis of the groups using correlation networks the following
approach was used (Peng et al., 2009a), see figure 9:
The matrices of mRNA and microRNA expression were tested for negative
correlation (Pearson) based on the assumption that microRNAs inhibit the
expression for their target mRNAs. Hereby, the information I obtained from the in
vitro assays was utilized as the expression matrices of the fast and slow proliferative
and migrative/non-migrative (identical for invasion) cell lines were compared
separately.
Two matrices resulted from this analysis, a correlation coefficient for each mRNA-
microRNA pair and a p-value. The miRDB prediction database (version 15.0) was
used to assign a “1” to real and a “0” to relationships that are unlikely to be real.
Only correlation coefficients and p-values from predicted microRNA-mRNA-
relationships were used for further analysis. To determine significant microRNA-
miRNA expression in osteosarcoma Material and methods
35
mRNA relationships a p-value of 0,05 was used as a threshold. However, due to
multiple testing error (>20.000 tests) the false discovery rate had to be determined
for a range of correlation coefficient thresholds (-1 to 0,15; see figure 10, following
page). A threshold of 0,82 (FDR 0,02) was chosen. At this threshold 2% of significant
results (p<0,05) can be expected to be false-positive. A possible explanation for the
FDR being lower in our data compared to the results Peng et al. provided is the fact
that in this study a different, more stringent miRNA prediction database has been
used.
Figure 9: Workflow (see Peng et al, 2009) for identification of regulatory miR-mRNA-modules
Figure 10: Correlation coefficient thresholds (from: Peng et al.; 2009); range of coefficient thresholds
-1 to 0,15; FDR (false discovery rate) 0,02; i.e. at a threshold 0,82 2% of the results reaching
significant level (p<0,05) can be expected to be false-positive
miRNA expression in osteosarcoma Material and methods
36
For both proliferation and migration or invasion, respectively, 2 larger and a few
smaller bipartite networks were identified. Genes and microRNA from these
networks were fed into the Ingenuity Pathway Analysis software IPA, version 9.0,
(Ingenuity Pathways Analyses, Ingenuity Systems, Mountain View, CA, see
www.ingenuity.com). IPA is a web-based software application for analyzing data
derived from gene or microRNA expression based on the Ingenuity Pathways
Knowledge Base. It helps to visualize and understand the impact the set of
deregulated miRNA amd mRNA identified in this study might have in the context of
canonical pathways (on basis of the actual literature). By uploading the microRNA-
mRNA-network lists (proliferation and migration networks) the IPA-software groups
the data according to the biological function or disease they seem to play a role in.
This is accomplished by a certain algorithm creating scores that show their
significance based on the number of genes/molecules that map to a biological
function, pathway, or network. Genes were overlaid onto a global molecular
network developed from information in the Ingenuity Pathways Knowledge Base.
Networks of these genes were then algorithmically generated based on their
connectivity. The IPA software creates networks rated by scores, which represent
the negative exponent of a p-value calculation and indicate the number of eligible
genes within a network. The higher the number of network eligible genes in a
network, the higher the score. By setting a particular threshold during analysis set
up IPA ignores values less than 2 fold up or down, differentiating the samples.
Based on these lists the program generates a graph displaying the connectivity of
certain genes or miRNA, whereas a number of 35 (for smaller networks) and 70
(merged networks) molecules were chosen as maximum in order to keep it easier to
visualize. For legend and further explanations consult graphs 20 (page 67) and 23
(page 70) in the results section.
miRNA expression in osteosarcoma Results
37
4. Results
4.1. MicroRNA expression profiling
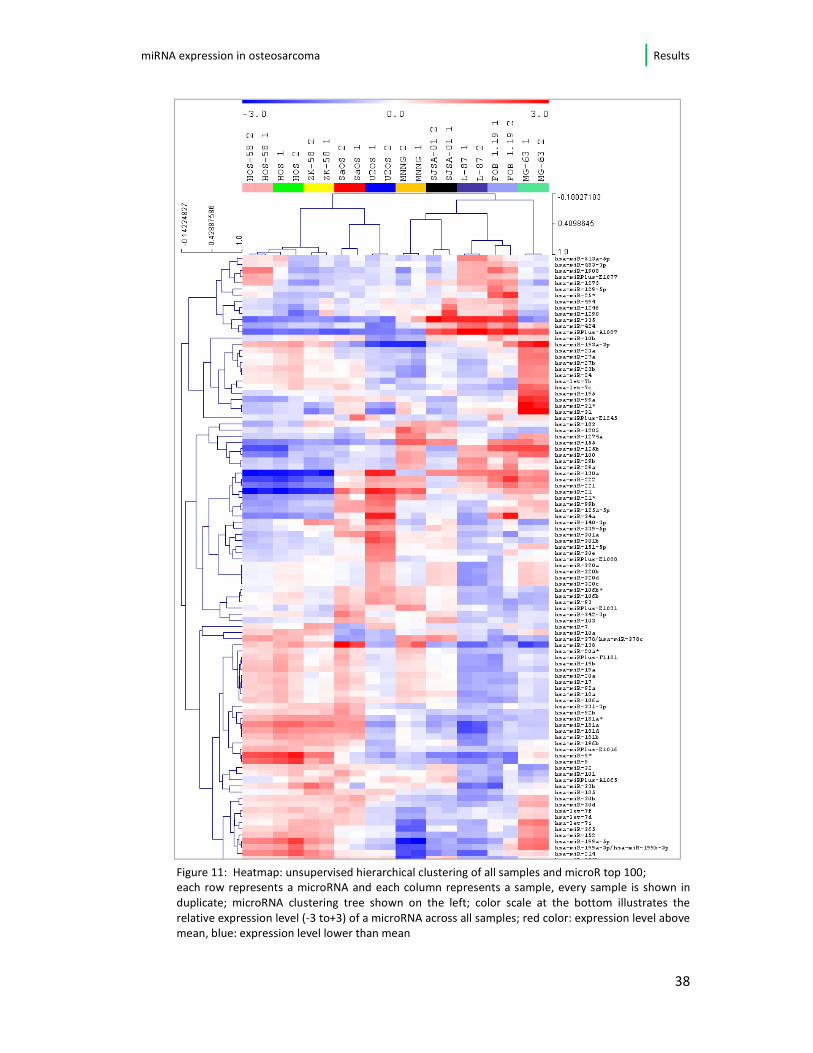
4.1.1. Overview and unsupervised hierarchical clustering
The microRNA expression data provided by Exiquon® have been visualized in
heatmaps. Figure 11 shows the result of the two-way hierarchical clustering of
microRNAs (top 100 microRNA) and samples. The comparison of all samples and
their distinct microRNA expression reveals a variety of differentially expressed
microRNA and shows subgroups among the complex data. The osteosarcoma cell
lines HOS, HOS-58 and ZK-58 for instance show a high level of similarity in their
expression patterns. Furthermore, the control cell lines (L87.4 and hFOB 1.19) show
similar expression when compared to the osteosarcoma cell lines.
miRNA expression in osteosarcoma Results
38
Figure 11: Heatmap: unsupervised hierarchical clustering of all samples and microR top 100; each row represents a microRNA and each column represents a sample, every sample is shown in
duplicate; microRNA clustering tree shown on the left; color scale at the bottom illustrates the
relative expression level (-3 to+3) of a microRNA across all samples; red color: expression level above
mean, blue: expression level lower than mean
miRNA expression in osteosarcoma Results
39
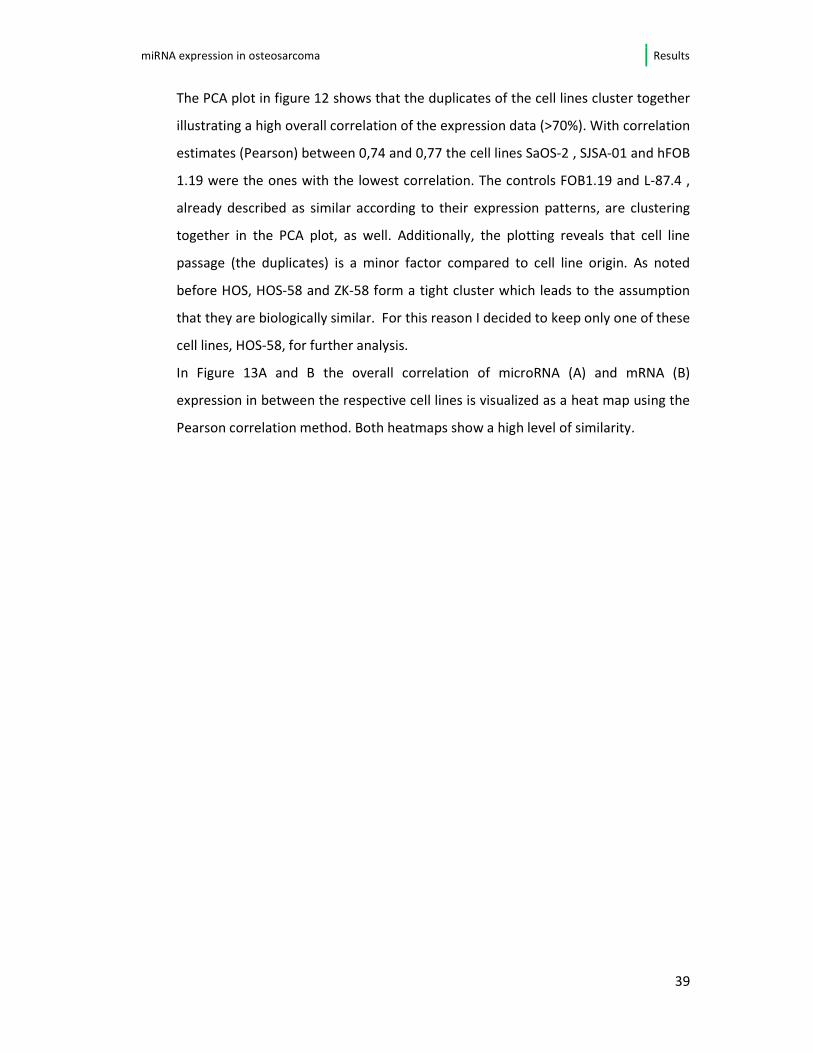
The PCA plot in figure 12 shows that the duplicates of the cell lines cluster together
illustrating a high overall correlation of the expression data (>70%). With correlation
estimates (Pearson) between 0,74 and 0,77 the cell lines SaOS-2 , SJSA-01 and hFOB
1.19 were the ones with the lowest correlation. The controls FOB1.19 and L-87.4 ,
already described as similar according to their expression patterns, are clustering
together in the PCA plot, as well. Additionally, the plotting reveals that cell line
passage (the duplicates) is a minor factor compared to cell line origin. As noted
before HOS, HOS-58 and ZK-58 form a tight cluster which leads to the assumption
that they are biologically similar. For this reason I decided to keep only one of these
cell lines, HOS-58, for further analysis.
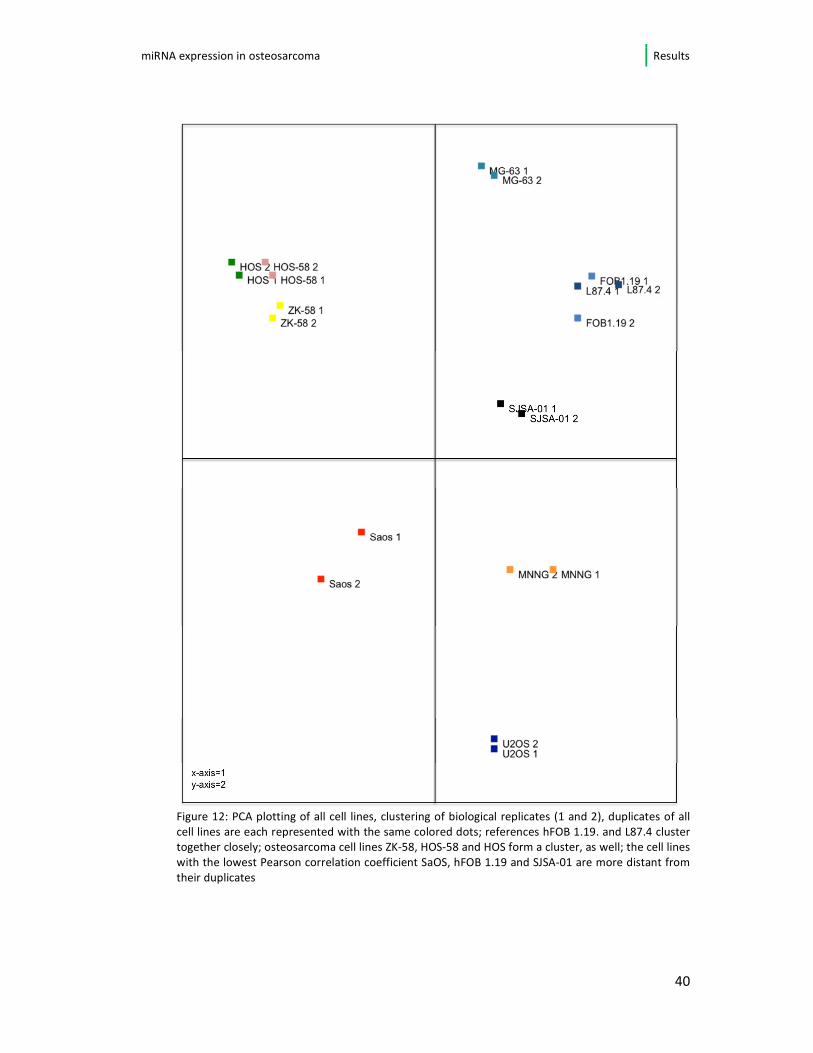
In Figure 13A and B the overall correlation of microRNA (A) and mRNA (B)
expression in between the respective cell lines is visualized as a heat map using the
Pearson correlation method. Both heatmaps show a high level of similarity.
miRNA expression in osteosarcoma Results
40
Figure 12: PCA plotting of all cell lines, clustering of biological replicates (1 and 2), duplicates of all
cell lines are each represented with the same colored dots; references hFOB 1.19. and L87.4 cluster
together closely; osteosarcoma cell lines ZK-58, HOS-58 and HOS form a cluster, as well; the cell lines
with the lowest Pearson correlation coefficient SaOS, hFOB 1.19 and SJSA-01 are more distant from
their duplicates
miRNA expression in osteosarcoma Results
41
Figure 13: Pearson correlation heat maps, microRNA (A) expression and mRNA (B) expression
between cell lines; red: positive correlation � high level of similarity; green: negative
correlation� low level of similarity
miRNA expression in osteosarcoma Results
42
4.1.2. Osteosarcoma cell lines vs. progenitor cell lines
In order to find differentially expressed microRNA each osteosarcoma cell lines’
expression pattern was compared separately to the expression levels of the
reference cell lines (L87-4 and hFOB 1.19).
Focusing only on the miRNA showing a deregulation (up/down) repeatedly, i.e. in ≥
4 of 6 osteosarcoma cell lines, I found a number of 15 miRNA with constant
alteration in comparison to the progenitor cell lines. An overview is given in table 5.
Of these 15 miRNA, 7 (miR-17-5p, miR-18a, miR-30b, miR-93, miR-106a and b, miR-
301a) were constantly up-regulated in all affected cell lines in comparison to both
osteoblasts (hFOB) and mesenchymal stem cells (L-87.4). In this set of miRNAs, 5
belong to the well-described oncogenic miR- 17-92 cluster.
A repeated down-regulation, when referred to the progenitor cell lines, was noted
for the miRNAs 29a, miR-335, miR-424 and miR-1275.
The miRNAs 125b, miR-193-3p and miR-193b showed differential regulation
between the individual osteosarcoma cell lines, meaning that miR-125b and 193a-
3p were up-regulated only in the cell line MG-63 and miR-193b was down-regulated
only in MNNG. One microRNA (miRNA-34a) was differential expressed within the
two progenitor cell lines, i.e. it presented up-regulated when compared to the stem
cell line and was down-regulated in 5/6 of the osteosarcoma cell lines when
compared to the osteoblasts
miRNA expression in osteosarcoma Results
43
Ref miRNA HOS SaOS MG63 MNNG SJSA U2OS AFC
L-87 hsa-miR-17 up
(1.62)
up
(1.68)
- up
(1.4)
up
(1.04)
- 1,44
hFOB hsa-miR-17 up
(1.67)
up
(1.73)
- up
(1.45)
up
(1.09)
- 1,49
L-87 hsa-miR-18a up (1.84)
up (1.47)
- up (1.74)
up (1.51)
- 1,64
hFOB hsa-miR-18a up
(1.49)
up
(1.12)
- Up
(1.39)
up
(1.16)
- 1,29
L-87 hsa-miR-29a down (-1.56)
down (-1.6)
- - down (-1.52)
down (-1.67)
-1,56
hFOB hsa-miR-29a down (-1.53)
down (-1.37)
- - down (-1.44)
down (-1.6)
-1,49
L-87 hsa-miR-30b up
(1.78)
up
(2.16)
up
(2.07)
- - up
(1.51)
1,88
hFOB hsa-miR-30b up (1.33)
up (1.71)
up (1.62)
- - up (1.06)
1,43
L-87 hsa-miR-34a - up
(1.17)
up
(1.41)
- up
(1.06)
up
(3.7)
1,84
hFOB hsa-miR-34a down (-3.56)
down (-2.08)
down (-1.84)
down (-2.59)
down (-2.19)
-2,45
L-87 hsa-miR-93 up (1.11)
up (1.43)
- up (1.51)
- up (1.97)
1,51
hFOB hsa-miR-93 up
(1.24)
up
(1.56)
- up
(1.64)
up
(1.11)
up
(2.1)
1,53
L-87 hsa-miR-106a up (1.62)
up (1.66) - up (1.37)
- up (1.24)
1,47
hFOB hsa-miR-106a up
(1.7)
up
(1.74)
- up
(1.44)
up
(1.07)
up
(1.32)
1,45
L-87 hsa-miR-106b up
(1.24)
up
(1.39)
- up
(1.41)
- up
(1.87)
1,48
miRNA expression in osteosarcoma Results
44
hFOB hsa-miR-106b up
(1.01)
up
(1.16)
- up
(1.18)
- up
(1.64)
1,25
L-87 hsa-miR-125b down
(-2.4)
down
(-1.21)
up
(1.19)
- down
(-1.94)
down
(-1.33)
-1,14
hFOB hsa-miR-125b down (-3.48)
down (-2.29)
- down (-1.23)
down (-3.02)
down (-2.42)
-2,49
L-87 hsa-miR-193a-3p - down
(-1.24)
up
(2.45)
down
(-2.83)
- down
(-2.59)
-1,05
hFOB hsa-miR-193a-3p - down (-1.94)
up (1.75)
down (-3.53)
down (-1.42)
down (-3.28)
-1,68
L-87 hsa-miR-193b up
(1.64)
up
(1.26)
up
(1.08)
down
(-1.42)
up
(1.4)
up
(1.22)
0,86
hFOB hsa-miR-193b up
(1.74)
up
(1.35)
up
(1.18)
down (1.33) up
(1.49)
up
(1.32)
0,96
L-87 hsa-miR-301a - up (2.04)
- up (1.11)
up (1.05)
up (2.63)
1,71
hFOB hsa-miR-301a - up
(2.05)
- up
(1.11)
up
(1.05)
up
(2.63)
1,71
L-87 hsa-miR-335 down (-3.97)
down (-3.95)
down (-3.88)
down (-1.94)
- down (-3.95)
-3,54
hFOB hsa-miR-335 down
(-3.77)
down
(-3.75)
down
(-3.68)
down
(-1.74)
- down
(-3.75)
-3,34
L-87 hsa-miR-424 down
(-2.43)
down
(-2.02)
down
(-1.09)
down
(-2.05)
down
(-1.05)
down
(-3.28)
-1,99
hFOB hsa-miR-424 down (-2.06)
down (-1.65)
- down (-1.67)
- down (-2.91)
-2,07
L-87 hsa-miR-1275 down
(-1.64)
down
(-1.24)
down
(-1.74)
down
(-1.31)
- down
(-1.28)
-1,44
hFOB hsa-miR-1275 down (-1.96)
down (-1.56)
down (-2.06)
down (-1.64)
- down (-1.61)
-1,77
Table 5: Differentially expressed miRNA in ≥ 4 out of 6 cell lines (n=15); each microRNA looked at separately for expression level in osteosarcoma versus progenitor cell lines
(leftmost column); abbreviations: ref: reference cell lines; AFC: Average Fold Change
miRNA expression in osteosarcoma Results
45
4.2. Differentially expressed microRNA and likely targets
4.2.1. One-by-one comparison against the background of progenitor cell lines
For predicting likely target genes for the subset of differentially expressed
microRNA the miRDB (http://mirdb.org) database was used. By means of a certain
prediction score (>80) up to 207 target transcripts and 155 target genes have been
identified per microRNA. The expression of all genes of the osteosarcoma cell lines
targeted by the 15 previously determined microRNAs were subsequently compared
separately between the osteosarcoma cells and both reference cell lines. When a
microRNA and its likely target mRNA did show an inverse expression pattern, i.e.
the microRNA up- and mRNA down-regulated (and vice versa), its deregulation was
assumed to be an effect of the microRNA. In table 6 the genes that show proper
regulation in ≥4/12 comparisons are presented. Since a comparison of 6 cell lines
and 2 reference cell lines was done, one gene had the possibility to present with
appropriate regulation by one microRNA in up to 12 comparisons.
RGMB, known as RGM domain family member B, for example showed a proper
regulation by miR-93 in 8/12 comparisons, herewith marking the combination of
microRNA/mRNA that show “correct” regulation in the highest number of
comparisons. The miR-93 as well as the other top-listed microRNA in table 6 (miR-
106a, b and miR-17) are members of the 17-92 cluster.
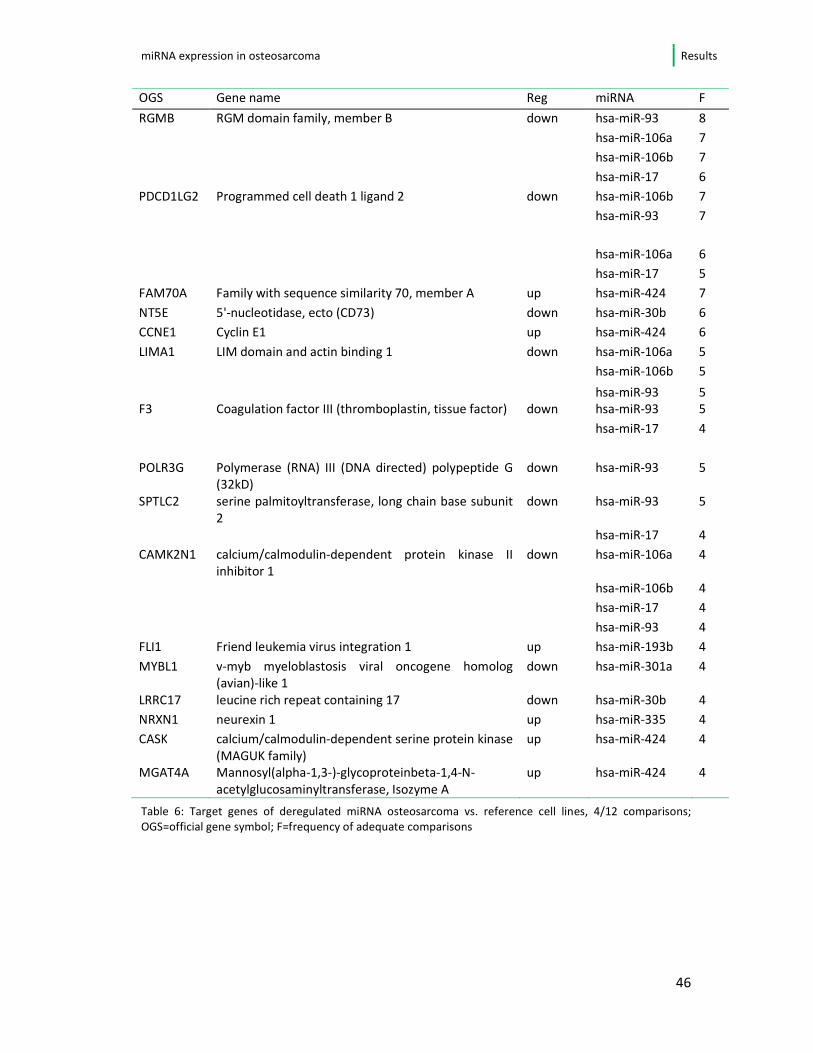
miRNA expression in osteosarcoma Results
46
OGS Gene name Reg miRNA F
RGMB RGM domain family, member B down hsa-miR-93 8
hsa-miR-106a 7
hsa-miR-106b 7
hsa-miR-17 6
PDCD1LG2 Programmed cell death 1 ligand 2 down hsa-miR-106b 7
hsa-miR-93 7
hsa-miR-106a 6
hsa-miR-17 5
FAM70A Family with sequence similarity 70, member A up hsa-miR-424 7
NT5E 5'-nucleotidase, ecto (CD73) down hsa-miR-30b 6
CCNE1 Cyclin E1 up hsa-miR-424 6
LIMA1 LIM domain and actin binding 1 down hsa-miR-106a 5
hsa-miR-106b 5
hsa-miR-93 5 F3 Coagulation factor III (thromboplastin, tissue factor) down hsa-miR-93 5
hsa-miR-17 4
POLR3G Polymerase (RNA) III (DNA directed) polypeptide G (32kD)
down hsa-miR-93 5
SPTLC2 serine palmitoyltransferase, long chain base subunit 2
down hsa-miR-93 5
hsa-miR-17 4
CAMK2N1 calcium/calmodulin-dependent protein kinase II inhibitor 1
down hsa-miR-106a 4
hsa-miR-106b 4
hsa-miR-17 4
hsa-miR-93 4
FLI1 Friend leukemia virus integration 1 up hsa-miR-193b 4
MYBL1 v-myb myeloblastosis viral oncogene homolog (avian)-like 1
down hsa-miR-301a 4
LRRC17 leucine rich repeat containing 17 down hsa-miR-30b 4
NRXN1 neurexin 1 up hsa-miR-335 4
CASK calcium/calmodulin-dependent serine protein kinase
(MAGUK family)
up hsa-miR-424 4
MGAT4A Mannosyl(alpha-1,3-)-glycoproteinbeta-1,4-N-
acetylglucosaminyltransferase, Isozyme A
up hsa-miR-424 4
Table 6: Target genes of deregulated miRNA osteosarcoma vs. reference cell lines, 4/12 comparisons;
OGS=official gene symbol; F=frequency of adequate comparisons
miRNA expression in osteosarcoma Results
47
4.3. Characterization of the phenotype
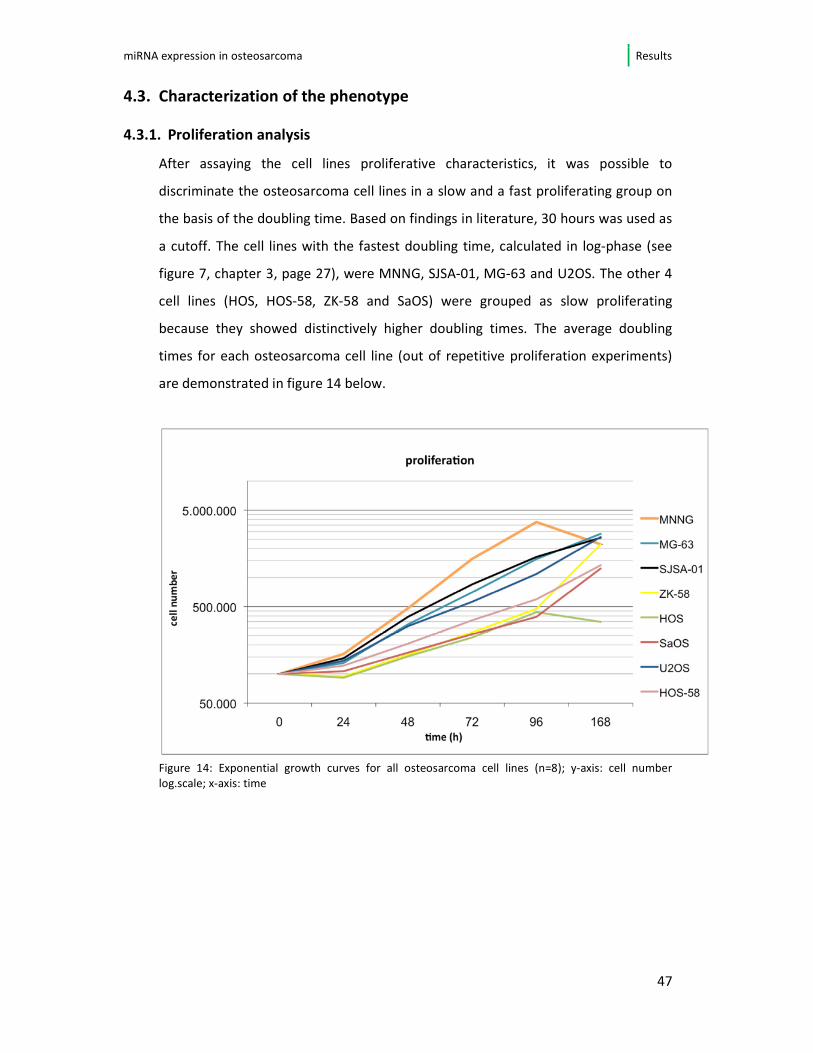
4.3.1. Proliferation analysis
After assaying the cell lines proliferative characteristics, it was possible to
discriminate the osteosarcoma cell lines in a slow and a fast proliferating group on
the basis of the doubling time. Based on findings in literature, 30 hours was used as
a cutoff. The cell lines with the fastest doubling time, calculated in log-phase (see
figure 7, chapter 3, page 27), were MNNG, SJSA-01, MG-63 and U2OS. The other 4
cell lines (HOS, HOS-58, ZK-58 and SaOS) were grouped as slow proliferating
because they showed distinctively higher doubling times. The average doubling
times for each osteosarcoma cell line (out of repetitive proliferation experiments)
are demonstrated in figure 14 below.
Figure 14: Exponential growth curves for all osteosarcoma cell lines (n=8); y-axis: cell number
log.scale; x-axis: time
miRNA expression in osteosarcoma Results
48
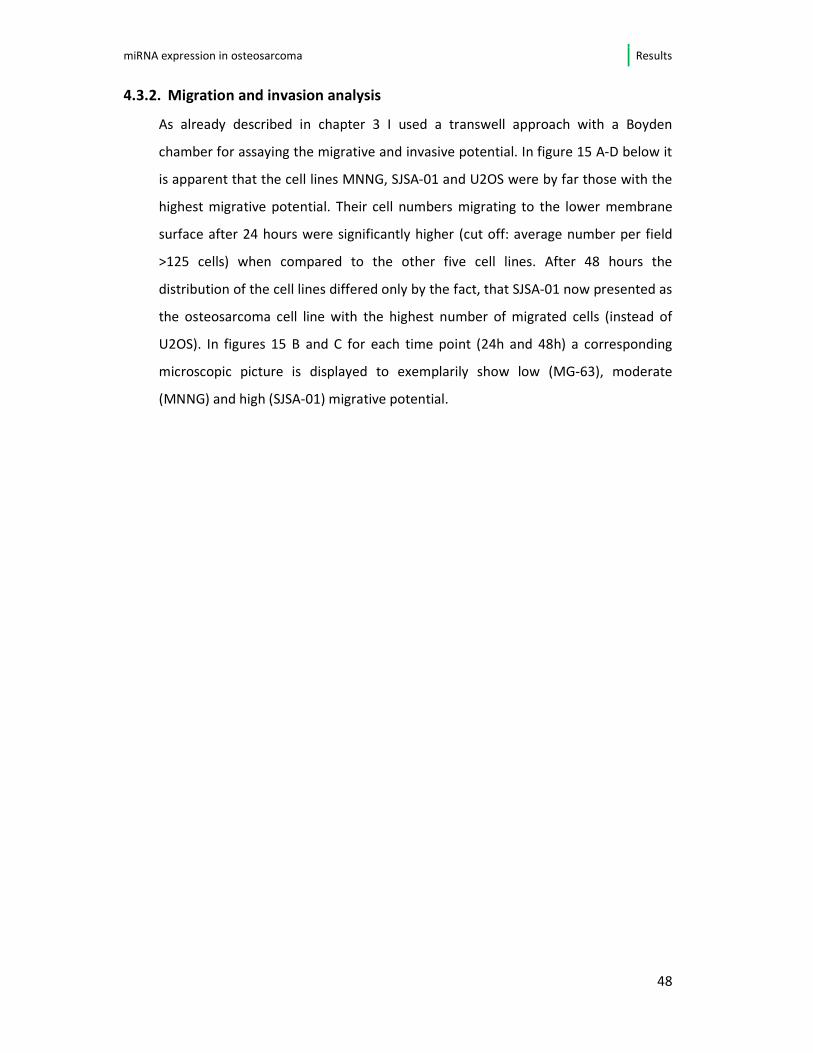
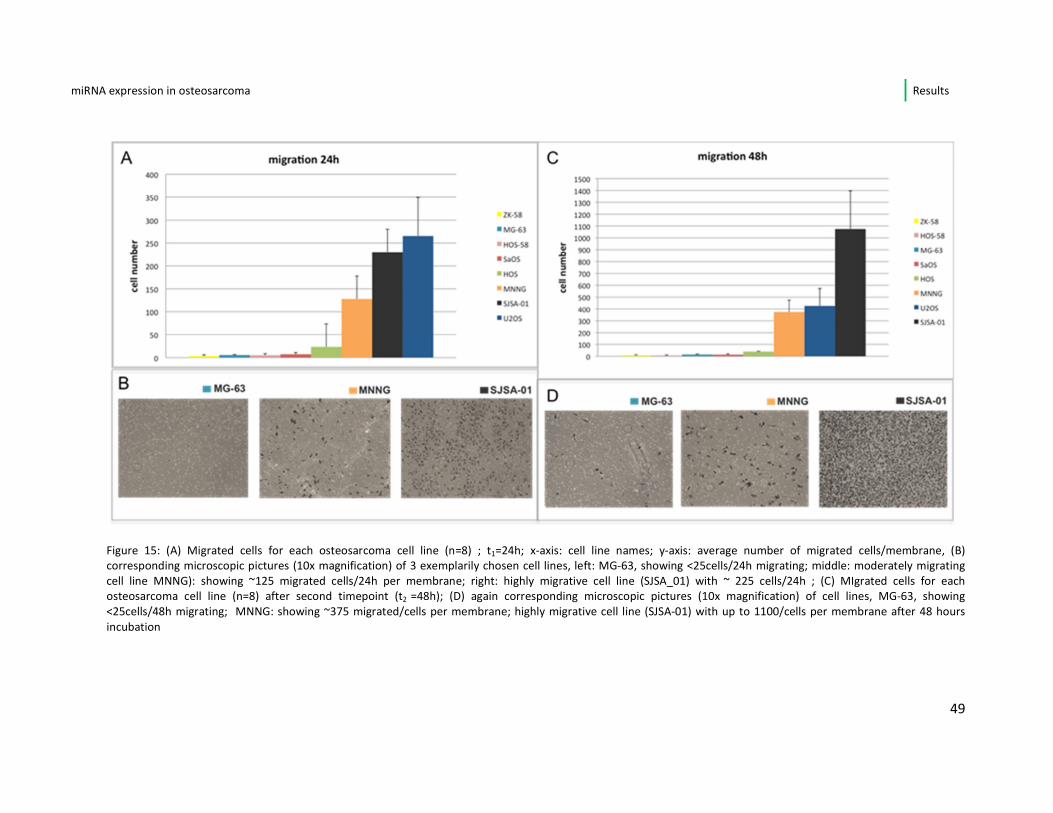
4.3.2. Migration and invasion analysis
As already described in chapter 3 I used a transwell approach with a Boyden
chamber for assaying the migrative and invasive potential. In figure 15 A-D below it
is apparent that the cell lines MNNG, SJSA-01 and U2OS were by far those with the
highest migrative potential. Their cell numbers migrating to the lower membrane
surface after 24 hours were significantly higher (cut off: average number per field
>125 cells) when compared to the other five cell lines. After 48 hours the
distribution of the cell lines differed only by the fact, that SJSA-01 now presented as
the osteosarcoma cell line with the highest number of migrated cells (instead of
U2OS). In figures 15 B and C for each time point (24h and 48h) a corresponding
microscopic picture is displayed to exemplarily show low (MG-63), moderate
(MNNG) and high (SJSA-01) migrative potential.
miRNA expression in osteosarcoma Results
49
Figure 15: (A) Migrated cells for each osteosarcoma cell line (n=8) ; t1=24h; x-axis: cell line names; y-axis: average number of migrated cells/membrane, (B)
corresponding microscopic pictures (10x magnification) of 3 exemplarily chosen cell lines, left: MG-63, showing <25cells/24h migrating; middle: moderately migrating
cell line MNNG): showing ~125 migrated cells/24h per membrane; right: highly migrative cell line (SJSA_01) with ~ 225 cells/24h ; (C) MIgrated cells for each
osteosarcoma cell line (n=8) after second timepoint (t2 =48h); (D) again corresponding microscopic pictures (10x magnification) of cell lines, MG-63, showing
<25cells/48h migrating; MNNG: showing ~375 migrated/cells per membrane; highly migrative cell line (SJSA-01) with up to 1100/cells per membrane after 48 hours
incubation
miRNA expression in osteosarcoma Results
50
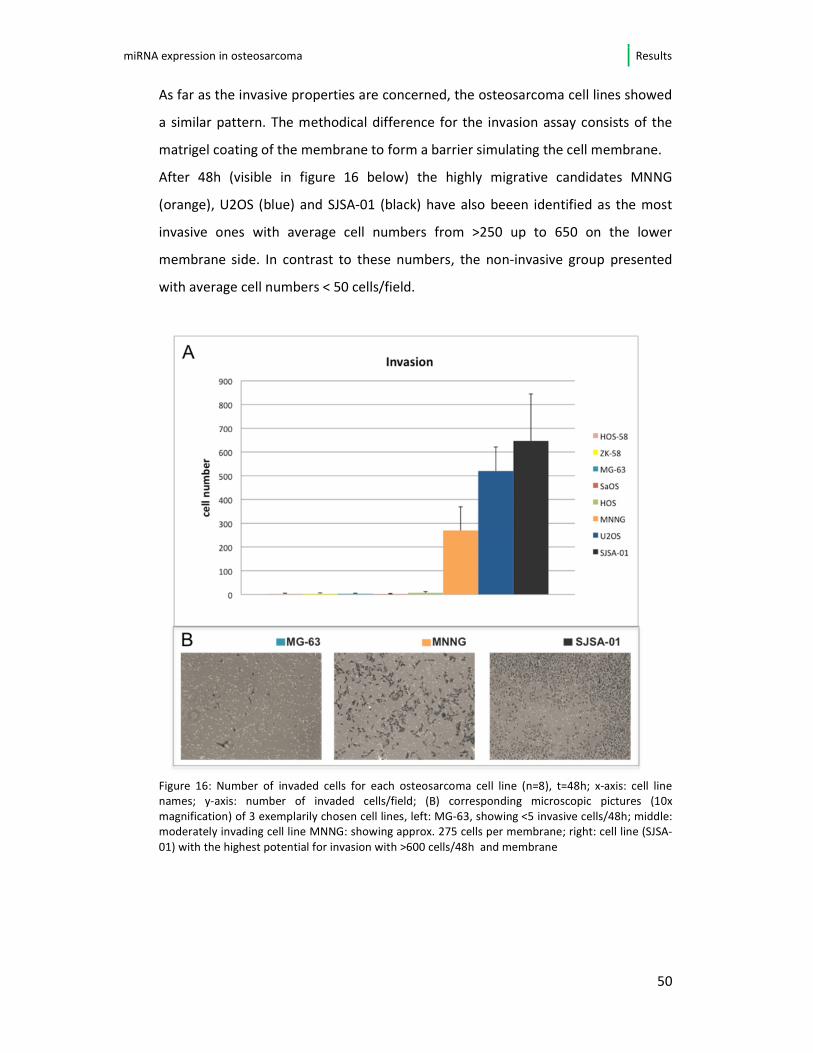
As far as the invasive properties are concerned, the osteosarcoma cell lines showed
a similar pattern. The methodical difference for the invasion assay consists of the
matrigel coating of the membrane to form a barrier simulating the cell membrane.
After 48h (visible in figure 16 below) the highly migrative candidates MNNG
(orange), U2OS (blue) and SJSA-01 (black) have also beeen identified as the most
invasive ones with average cell numbers from >250 up to 650 on the lower
membrane side. In contrast to these numbers, the non-invasive group presented
with average cell numbers < 50 cells/field.
Figure 16: Number of invaded cells for each osteosarcoma cell line (n=8), t=48h; x-axis: cell line
names; y-axis: number of invaded cells/field; (B) corresponding microscopic pictures (10x
magnification) of 3 exemplarily chosen cell lines, left: MG-63, showing <5 invasive cells/48h; middle:
moderately invading cell line MNNG: showing approx. 275 cells per membrane; right: cell line (SJSA-
01) with the highest potential for invasion with >600 cells/48h and membrane
miRNA expression in osteosarcoma Results
51
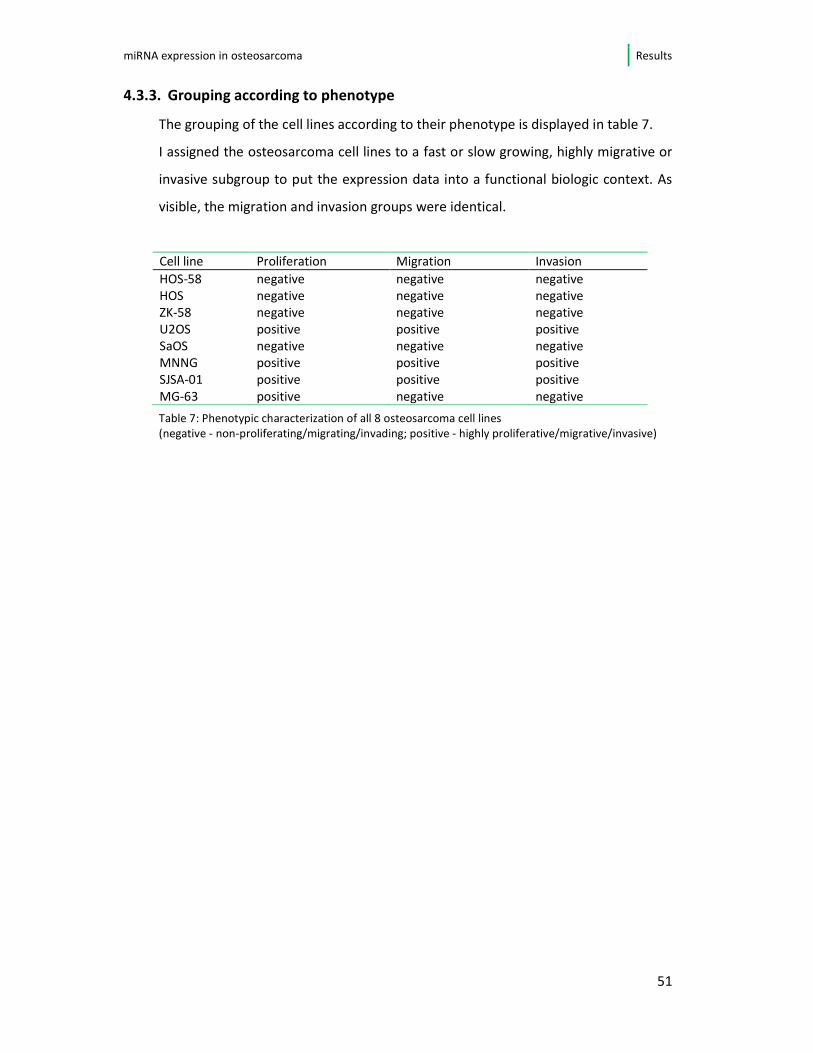
4.3.3. Grouping according to phenotype
The grouping of the cell lines according to their phenotype is displayed in table 7.
I assigned the osteosarcoma cell lines to a fast or slow growing, highly migrative or
invasive subgroup to put the expression data into a functional biologic context. As
visible, the migration and invasion groups were identical.
Cell line Proliferation Migration Invasion
HOS-58 negative negative negative HOS negative negative negative ZK-58 negative negative negative U2OS positive positive positive SaOS negative negative negative MNNG positive positive positive SJSA-01 positive positive positive
MG-63 positive negative negative
Table 7: Phenotypic characterization of all 8 osteosarcoma cell lines
(negative - non-proliferating/migrating/invading; positive - highly proliferative/migrative/invasive)
miRNA expression in osteosarcoma Results
52
4.4. Correlation of microRNA expression with cell lines’ phenotype
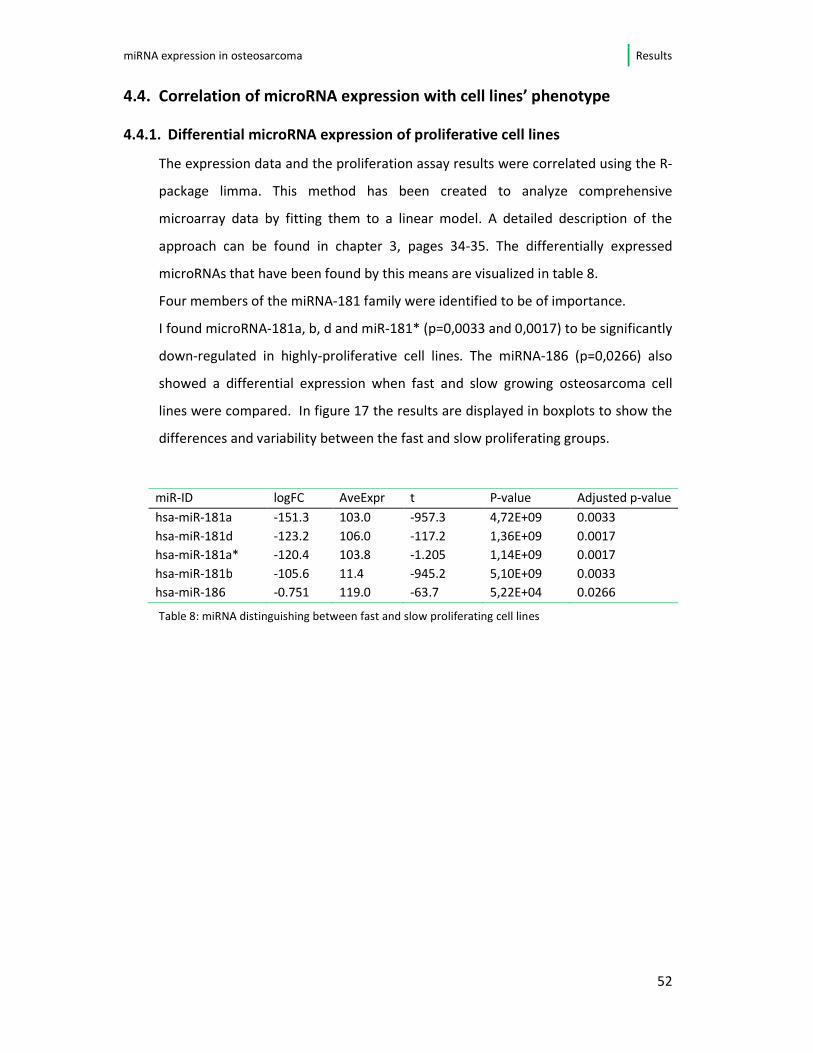
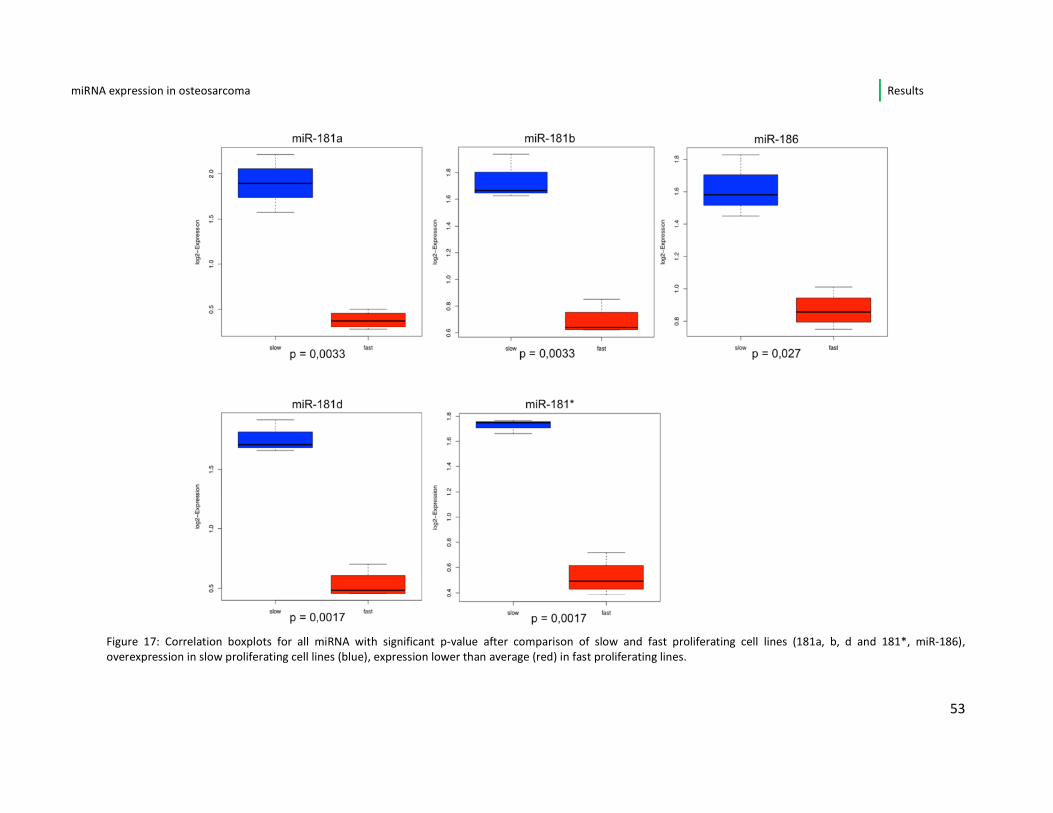
4.4.1. Differential microRNA expression of proliferative cell lines
The expression data and the proliferation assay results were correlated using the R-
package limma. This method has been created to analyze comprehensive
microarray data by fitting them to a linear model. A detailed description of the
approach can be found in chapter 3, pages 34-35. The differentially expressed
microRNAs that have been found by this means are visualized in table 8.
Four members of the miRNA-181 family were identified to be of importance.
I found microRNA-181a, b, d and miR-181* (p=0,0033 and 0,0017) to be significantly
down-regulated in highly-proliferative cell lines. The miRNA-186 (p=0,0266) also
showed a differential expression when fast and slow growing osteosarcoma cell
lines were compared. In figure 17 the results are displayed in boxplots to show the
differences and variability between the fast and slow proliferating groups.
Table 8: miRNA distinguishing between fast and slow proliferating cell lines
miR-ID logFC AveExpr t P-value Adjusted p-value
hsa-miR-181a -151.3 103.0 -957.3 4,72E+09 0.0033
hsa-miR-181d -123.2 106.0 -117.2 1,36E+09 0.0017
hsa-miR-181a* -120.4 103.8 -1.205 1,14E+09 0.0017
hsa-miR-181b -105.6 11.4 -945.2 5,10E+09 0.0033
hsa-miR-186 -0.751 119.0 -63.7 5,22E+04 0.0266
miRNA expression in osteosarcoma Results
53
Figure 17: Correlation boxplots for all miRNA with significant p-value after comparison of slow and fast proliferating cell lines (181a, b, d and 181*, miR-186),
overexpression in slow proliferating cell lines (blue), expression lower than average (red) in fast proliferating lines.
miRNA expression in osteosarcoma Results
54
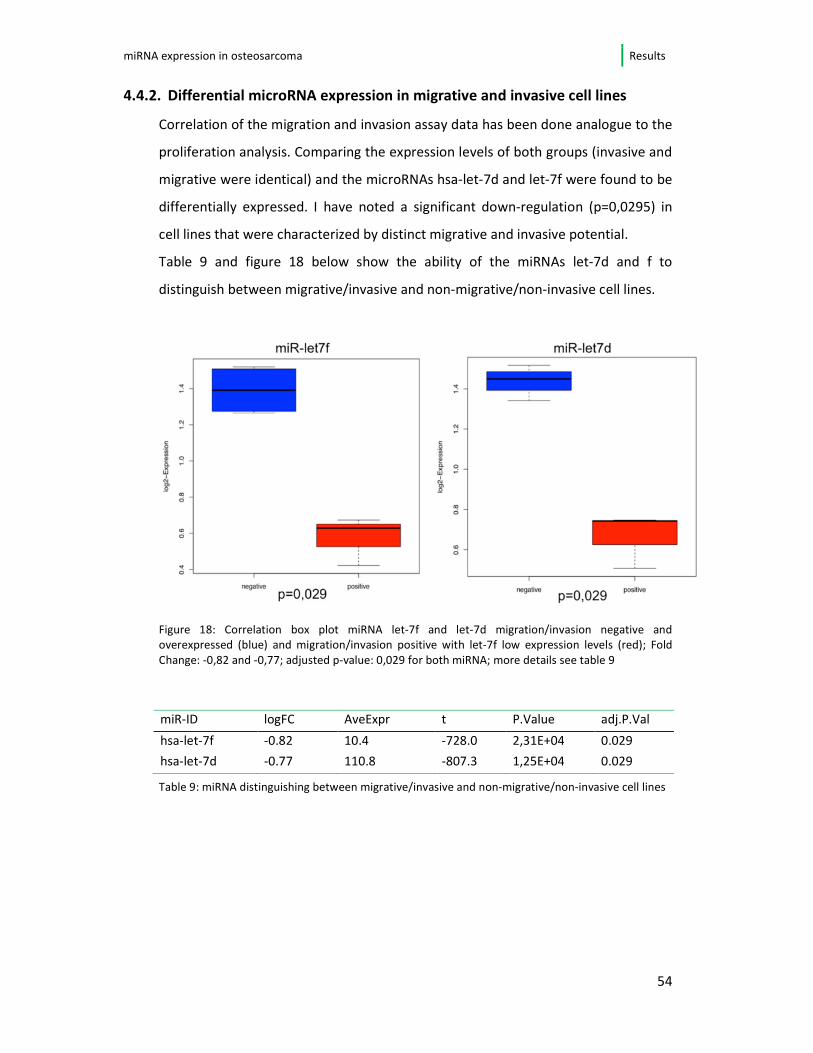
4.4.2. Differential microRNA expression in migrative and invasive cell lines
Correlation of the migration and invasion assay data has been done analogue to the
proliferation analysis. Comparing the expression levels of both groups (invasive and
migrative were identical) and the microRNAs hsa-let-7d and let-7f were found to be
differentially expressed. I have noted a significant down-regulation (p=0,0295) in
cell lines that were characterized by distinct migrative and invasive potential.
Table 9 and figure 18 below show the ability of the miRNAs let-7d and f to
distinguish between migrative/invasive and non-migrative/non-invasive cell lines.
Figure 18: Correlation box plot miRNA let-7f and let-7d migration/invasion negative and
overexpressed (blue) and migration/invasion positive with let-7f low expression levels (red); Fold
Change: -0,82 and -0,77; adjusted p-value: 0,029 for both miRNA; more details see table 9
Table 9: miRNA distinguishing between migrative/invasive and non-migrative/non-invasive cell lines
miR-ID logFC AveExpr t P.Value adj.P.Val
hsa-let-7f -0.82 10.4 -728.0 2,31E+04 0.029
hsa-let-7d -0.77 110.8 -807.3 1,25E+04 0.029
miRNA expression in osteosarcoma Results
55
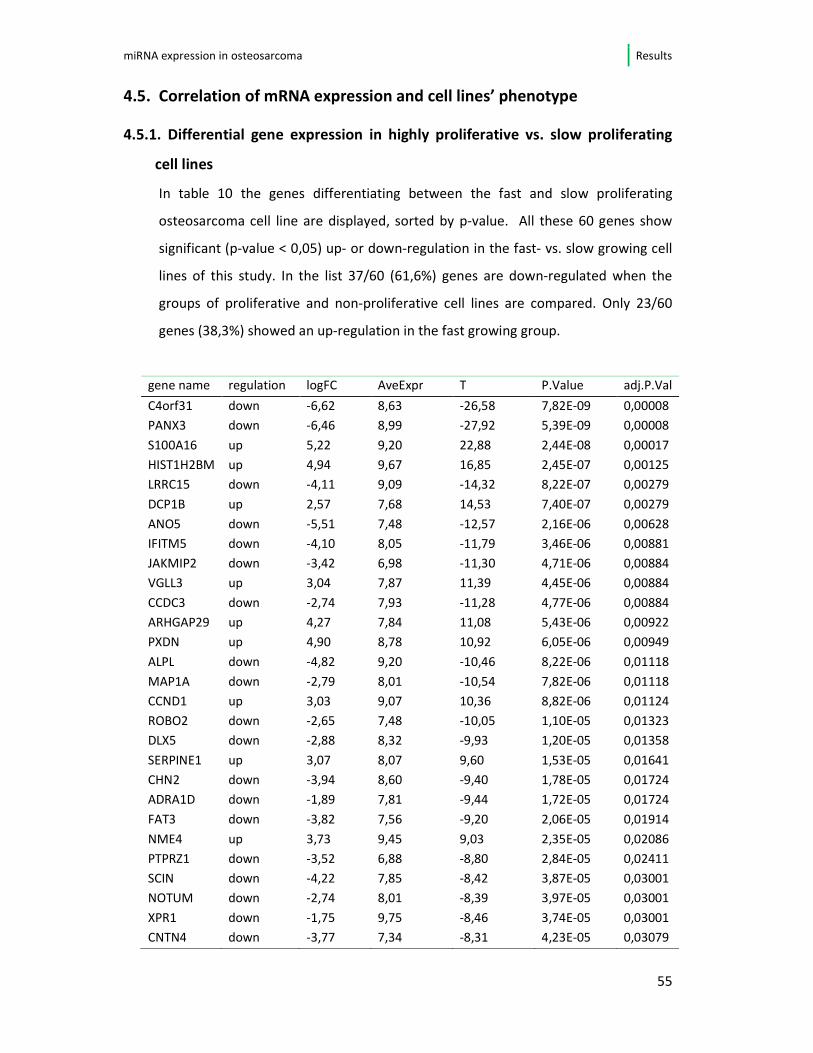
4.5. Correlation of mRNA expression and cell lines’ phenotype
4.5.1. Differential gene expression in highly proliferative vs. slow proliferating
cell lines
In table 10 the genes differentiating between the fast and slow proliferating
osteosarcoma cell line are displayed, sorted by p-value. All these 60 genes show
significant (p-value < 0,05) up- or down-regulation in the fast- vs. slow growing cell
lines of this study. In the list 37/60 (61,6%) genes are down-regulated when the
groups of proliferative and non-proliferative cell lines are compared. Only 23/60
genes (38,3%) showed an up-regulation in the fast growing group.
gene name regulation logFC AveExpr T P.Value adj.P.Val
C4orf31 down -6,62 8,63 -26,58 7,82E-09 0,00008
PANX3 down -6,46 8,99 -27,92 5,39E-09 0,00008
S100A16 up 5,22 9,20 22,88 2,44E-08 0,00017
HIST1H2BM up 4,94 9,67 16,85 2,45E-07 0,00125
LRRC15 down -4,11 9,09 -14,32 8,22E-07 0,00279
DCP1B up 2,57 7,68 14,53 7,40E-07 0,00279
ANO5 down -5,51 7,48 -12,57 2,16E-06 0,00628
IFITM5 down -4,10 8,05 -11,79 3,46E-06 0,00881
JAKMIP2 down -3,42 6,98 -11,30 4,71E-06 0,00884
VGLL3 up 3,04 7,87 11,39 4,45E-06 0,00884
CCDC3 down -2,74 7,93 -11,28 4,77E-06 0,00884
ARHGAP29 up 4,27 7,84 11,08 5,43E-06 0,00922
PXDN up 4,90 8,78 10,92 6,05E-06 0,00949
ALPL down -4,82 9,20 -10,46 8,22E-06 0,01118
MAP1A down -2,79 8,01 -10,54 7,82E-06 0,01118
CCND1 up 3,03 9,07 10,36 8,82E-06 0,01124
ROBO2 down -2,65 7,48 -10,05 1,10E-05 0,01323
DLX5 down -2,88 8,32 -9,93 1,20E-05 0,01358
SERPINE1 up 3,07 8,07 9,60 1,53E-05 0,01641
CHN2 down -3,94 8,60 -9,40 1,78E-05 0,01724
ADRA1D down -1,89 7,81 -9,44 1,72E-05 0,01724
FAT3 down -3,82 7,56 -9,20 2,06E-05 0,01914
NME4 up 3,73 9,45 9,03 2,35E-05 0,02086
PTPRZ1 down -3,52 6,88 -8,80 2,84E-05 0,02411
SCIN down -4,22 7,85 -8,42 3,87E-05 0,03001
NOTUM down -2,74 8,01 -8,39 3,97E-05 0,03001
XPR1 down -1,75 9,75 -8,46 3,74E-05 0,03001
CNTN4 down -3,77 7,34 -8,31 4,23E-05 0,03079
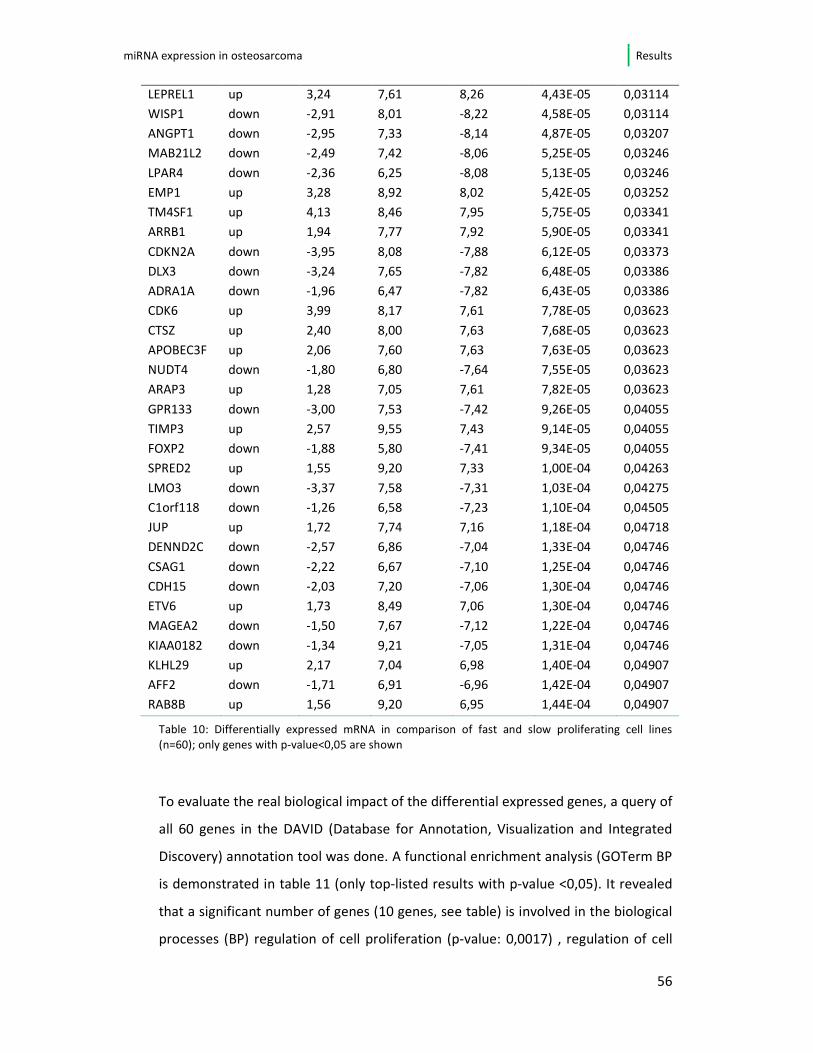
miRNA expression in osteosarcoma Results
56
LEPREL1 up 3,24 7,61 8,26 4,43E-05 0,03114
WISP1 down -2,91 8,01 -8,22 4,58E-05 0,03114
ANGPT1 down -2,95 7,33 -8,14 4,87E-05 0,03207
MAB21L2 down -2,49 7,42 -8,06 5,25E-05 0,03246
LPAR4 down -2,36 6,25 -8,08 5,13E-05 0,03246
EMP1 up 3,28 8,92 8,02 5,42E-05 0,03252
TM4SF1 up 4,13 8,46 7,95 5,75E-05 0,03341
ARRB1 up 1,94 7,77 7,92 5,90E-05 0,03341
CDKN2A down -3,95 8,08 -7,88 6,12E-05 0,03373
DLX3 down -3,24 7,65 -7,82 6,48E-05 0,03386
ADRA1A down -1,96 6,47 -7,82 6,43E-05 0,03386
CDK6 up 3,99 8,17 7,61 7,78E-05 0,03623
CTSZ up 2,40 8,00 7,63 7,68E-05 0,03623
APOBEC3F up 2,06 7,60 7,63 7,63E-05 0,03623
NUDT4 down -1,80 6,80 -7,64 7,55E-05 0,03623
ARAP3 up 1,28 7,05 7,61 7,82E-05 0,03623
GPR133 down -3,00 7,53 -7,42 9,26E-05 0,04055
TIMP3 up 2,57 9,55 7,43 9,14E-05 0,04055
FOXP2 down -1,88 5,80 -7,41 9,34E-05 0,04055
SPRED2 up 1,55 9,20 7,33 1,00E-04 0,04263
LMO3 down -3,37 7,58 -7,31 1,03E-04 0,04275
C1orf118 down -1,26 6,58 -7,23 1,10E-04 0,04505
JUP up 1,72 7,74 7,16 1,18E-04 0,04718
DENND2C down -2,57 6,86 -7,04 1,33E-04 0,04746
CSAG1 down -2,22 6,67 -7,10 1,25E-04 0,04746
CDH15 down -2,03 7,20 -7,06 1,30E-04 0,04746
ETV6 up 1,73 8,49 7,06 1,30E-04 0,04746
MAGEA2 down -1,50 7,67 -7,12 1,22E-04 0,04746
KIAA0182 down -1,34 9,21 -7,05 1,31E-04 0,04746
KLHL29 up 2,17 7,04 6,98 1,40E-04 0,04907
AFF2 down -1,71 6,91 -6,96 1,42E-04 0,04907
RAB8B up 1,56 9,20 6,95 1,44E-04 0,04907
Table 10: Differentially expressed mRNA in comparison of fast and slow proliferating cell lines
(n=60); only genes with p-value<0,05 are shown
To evaluate the real biological impact of the differential expressed genes, a query of
all 60 genes in the DAVID (Database for Annotation, Visualization and Integrated
Discovery) annotation tool was done. A functional enrichment analysis (GOTerm BP
is demonstrated in table 11 (only top-listed results with p-value <0,05). It revealed
that a significant number of genes (10 genes, see table) is involved in the biological
processes (BP) regulation of cell proliferation (p-value: 0,0017) , regulation of cell

miRNA expression in osteosarcoma Results
57
differentiation (p-value: 0.00616) or positive regulation of cell proliferation (p-
value: 0,0129). The annotation clustering tool of DAVID furthermore showed a
significant (p-value 0,0011) clustering of 4 genes (CDK6, CDKN2A, CCND1 and
Serpine1) involved in the p53 pathway.
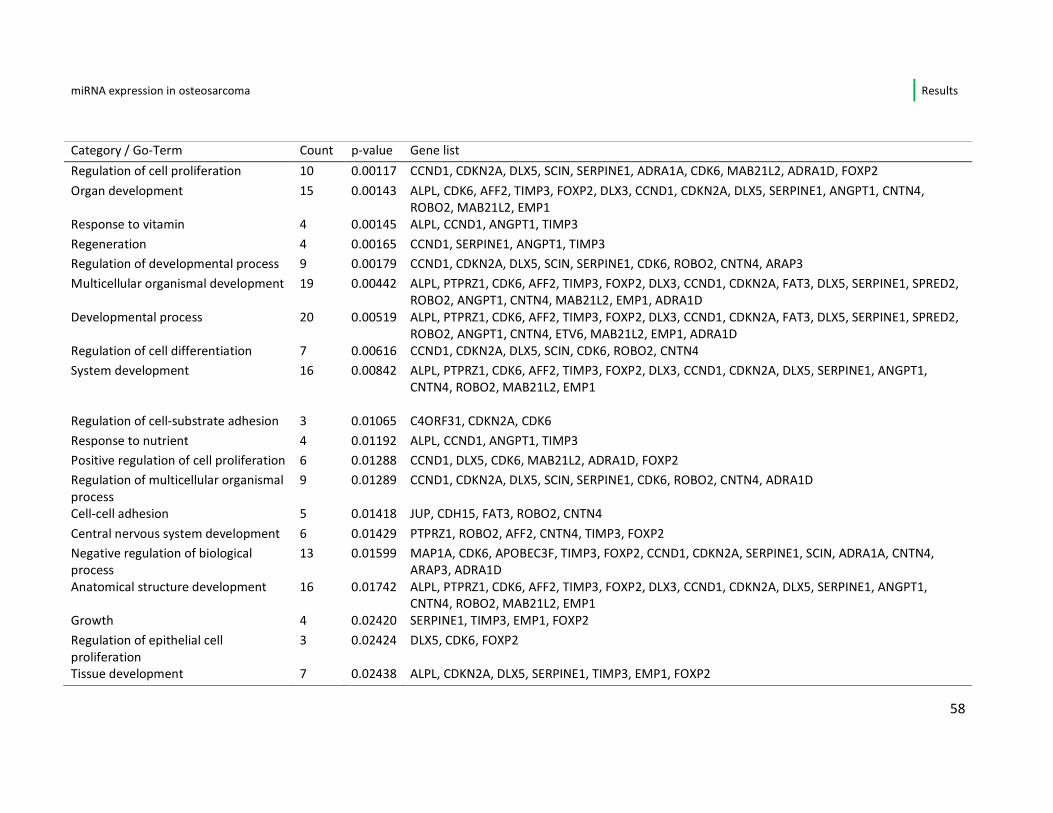
miRNA expression in osteosarcoma Results
58
Category / Go-Term Count p-value Gene list
Regulation of cell proliferation 10 0.00117 CCND1, CDKN2A, DLX5, SCIN, SERPINE1, ADRA1A, CDK6, MAB21L2, ADRA1D, FOXP2
Organ development 15 0.00143 ALPL, CDK6, AFF2, TIMP3, FOXP2, DLX3, CCND1, CDKN2A, DLX5, SERPINE1, ANGPT1, CNTN4,
ROBO2, MAB21L2, EMP1
Response to vitamin 4 0.00145 ALPL, CCND1, ANGPT1, TIMP3
Regeneration 4 0.00165 CCND1, SERPINE1, ANGPT1, TIMP3
Regulation of developmental process 9 0.00179 CCND1, CDKN2A, DLX5, SCIN, SERPINE1, CDK6, ROBO2, CNTN4, ARAP3
Multicellular organismal development 19 0.00442 ALPL, PTPRZ1, CDK6, AFF2, TIMP3, FOXP2, DLX3, CCND1, CDKN2A, FAT3, DLX5, SERPINE1, SPRED2,
ROBO2, ANGPT1, CNTN4, MAB21L2, EMP1, ADRA1D
Developmental process 20 0.00519 ALPL, PTPRZ1, CDK6, AFF2, TIMP3, FOXP2, DLX3, CCND1, CDKN2A, FAT3, DLX5, SERPINE1, SPRED2,
ROBO2, ANGPT1, CNTN4, ETV6, MAB21L2, EMP1, ADRA1D
Regulation of cell differentiation 7 0.00616 CCND1, CDKN2A, DLX5, SCIN, CDK6, ROBO2, CNTN4
System development 16 0.00842 ALPL, PTPRZ1, CDK6, AFF2, TIMP3, FOXP2, DLX3, CCND1, CDKN2A, DLX5, SERPINE1, ANGPT1,
CNTN4, ROBO2, MAB21L2, EMP1
Regulation of cell-substrate adhesion 3 0.01065 C4ORF31, CDKN2A, CDK6
Response to nutrient 4 0.01192 ALPL, CCND1, ANGPT1, TIMP3
Positive regulation of cell proliferation 6 0.01288 CCND1, DLX5, CDK6, MAB21L2, ADRA1D, FOXP2
Regulation of multicellular organismal
process
9 0.01289 CCND1, CDKN2A, DLX5, SCIN, SERPINE1, CDK6, ROBO2, CNTN4, ADRA1D
Cell-cell adhesion 5 0.01418 JUP, CDH15, FAT3, ROBO2, CNTN4
Central nervous system development 6 0.01429 PTPRZ1, ROBO2, AFF2, CNTN4, TIMP3, FOXP2
Negative regulation of biological
process
13 0.01599 MAP1A, CDK6, APOBEC3F, TIMP3, FOXP2, CCND1, CDKN2A, SERPINE1, SCIN, ADRA1A, CNTN4,
ARAP3, ADRA1D
Anatomical structure development 16 0.01742 ALPL, PTPRZ1, CDK6, AFF2, TIMP3, FOXP2, DLX3, CCND1, CDKN2A, DLX5, SERPINE1, ANGPT1, CNTN4, ROBO2, MAB21L2, EMP1
Growth 4 0.02420 SERPINE1, TIMP3, EMP1, FOXP2
Regulation of epithelial cell
proliferation
3 0.02424 DLX5, CDK6, FOXP2
Tissue development 7 0.02438 ALPL, CDKN2A, DLX5, SERPINE1, TIMP3, EMP1, FOXP2
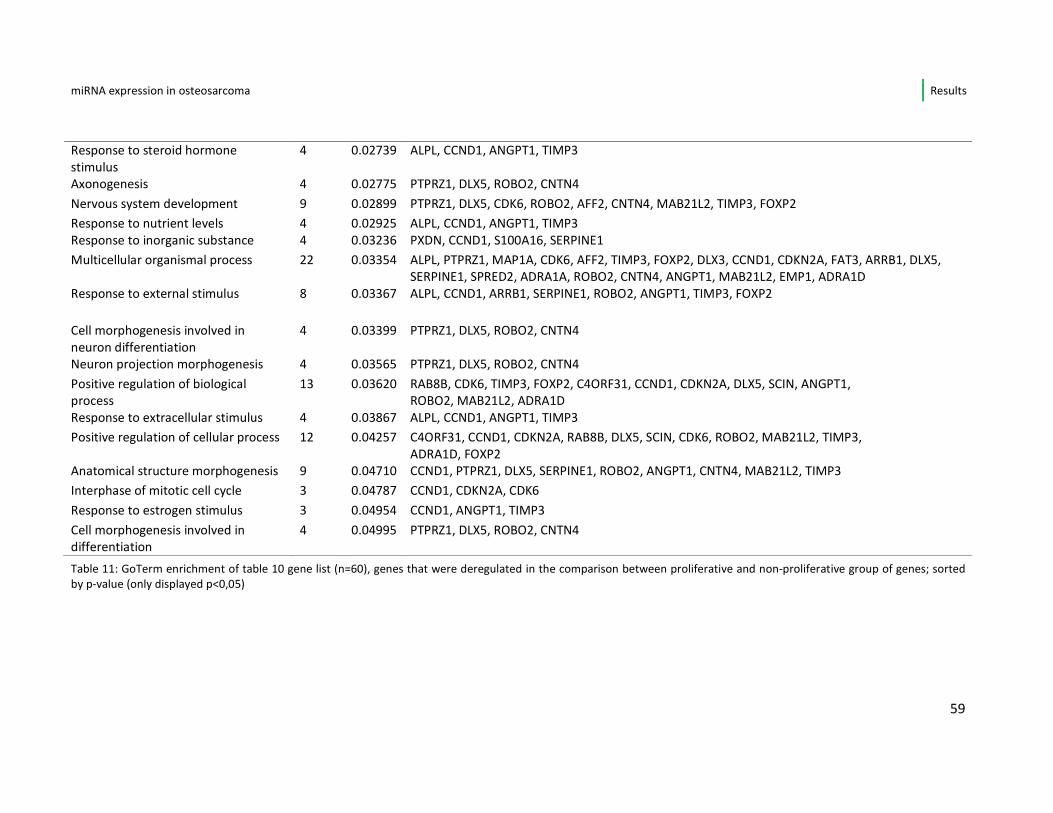
miRNA expression in osteosarcoma Results
59
Response to steroid hormone
stimulus
4 0.02739 ALPL, CCND1, ANGPT1, TIMP3
Axonogenesis 4 0.02775 PTPRZ1, DLX5, ROBO2, CNTN4
Nervous system development 9 0.02899 PTPRZ1, DLX5, CDK6, ROBO2, AFF2, CNTN4, MAB21L2, TIMP3, FOXP2
Response to nutrient levels 4 0.02925 ALPL, CCND1, ANGPT1, TIMP3
Response to inorganic substance 4 0.03236 PXDN, CCND1, S100A16, SERPINE1
Multicellular organismal process 22 0.03354 ALPL, PTPRZ1, MAP1A, CDK6, AFF2, TIMP3, FOXP2, DLX3, CCND1, CDKN2A, FAT3, ARRB1, DLX5,
SERPINE1, SPRED2, ADRA1A, ROBO2, CNTN4, ANGPT1, MAB21L2, EMP1, ADRA1D
Response to external stimulus 8 0.03367 ALPL, CCND1, ARRB1, SERPINE1, ROBO2, ANGPT1, TIMP3, FOXP2
Cell morphogenesis involved in
neuron differentiation
4 0.03399 PTPRZ1, DLX5, ROBO2, CNTN4
Neuron projection morphogenesis 4 0.03565 PTPRZ1, DLX5, ROBO2, CNTN4
Positive regulation of biological
process
13 0.03620 RAB8B, CDK6, TIMP3, FOXP2, C4ORF31, CCND1, CDKN2A, DLX5, SCIN, ANGPT1,
ROBO2, MAB21L2, ADRA1D
Response to extracellular stimulus 4 0.03867 ALPL, CCND1, ANGPT1, TIMP3
Positive regulation of cellular process 12 0.04257 C4ORF31, CCND1, CDKN2A, RAB8B, DLX5, SCIN, CDK6, ROBO2, MAB21L2, TIMP3,
ADRA1D, FOXP2
Anatomical structure morphogenesis 9 0.04710 CCND1, PTPRZ1, DLX5, SERPINE1, ROBO2, ANGPT1, CNTN4, MAB21L2, TIMP3
Interphase of mitotic cell cycle 3 0.04787 CCND1, CDKN2A, CDK6
Response to estrogen stimulus 3 0.04954 CCND1, ANGPT1, TIMP3
Cell morphogenesis involved in
differentiation
4 0.04995 PTPRZ1, DLX5, ROBO2, CNTN4
Table 11: GoTerm enrichment of table 10 gene list (n=60), genes that were deregulated in the comparison between proliferative and non-proliferative group of genes; sorted
by p-value (only displayed p<0,05)
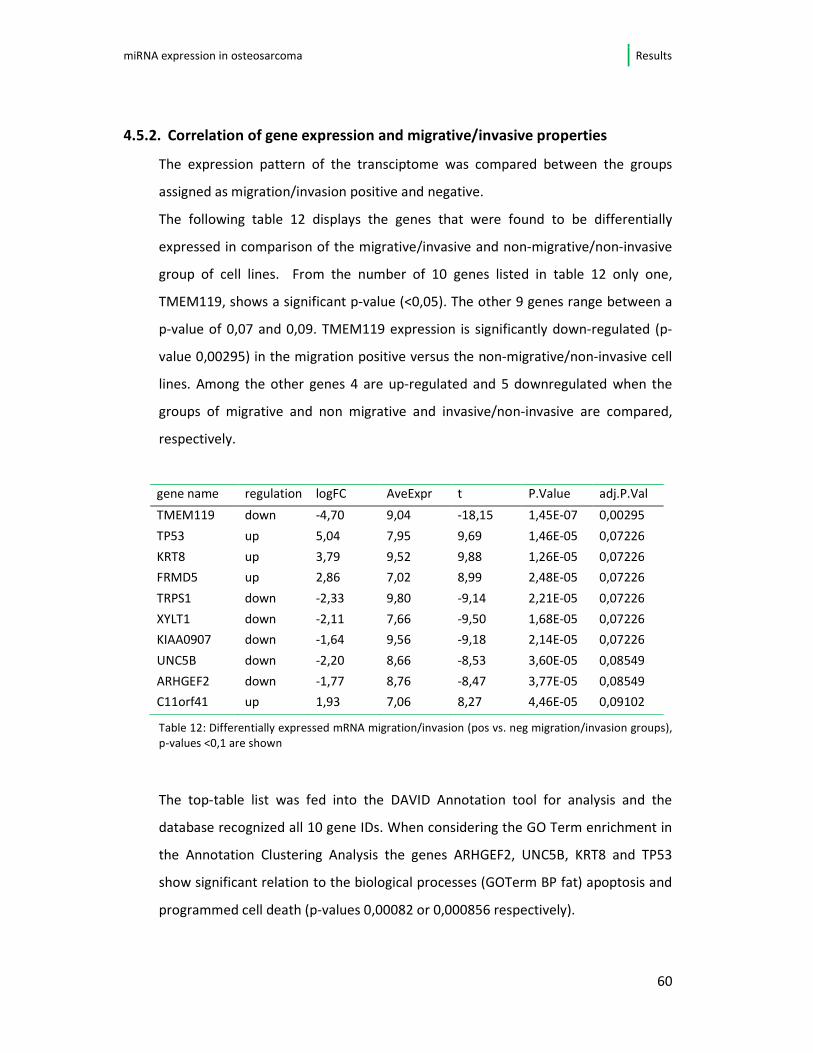
miRNA expression in osteosarcoma Results
60
4.5.2. Correlation of gene expression and migrative/invasive properties
The expression pattern of the transciptome was compared between the groups
assigned as migration/invasion positive and negative.
The following table 12 displays the genes that were found to be differentially
expressed in comparison of the migrative/invasive and non-migrative/non-invasive
group of cell lines. From the number of 10 genes listed in table 12 only one,
TMEM119, shows a significant p-value (<0,05). The other 9 genes range between a
p-value of 0,07 and 0,09. TMEM119 expression is significantly down-regulated (p-
value 0,00295) in the migration positive versus the non-migrative/non-invasive cell
lines. Among the other genes 4 are up-regulated and 5 downregulated when the
groups of migrative and non migrative and invasive/non-invasive are compared,
respectively.
gene name regulation logFC AveExpr t P.Value adj.P.Val
TMEM119 down -4,70 9,04 -18,15 1,45E-07 0,00295
TP53 up 5,04 7,95 9,69 1,46E-05 0,07226
KRT8 up 3,79 9,52 9,88 1,26E-05 0,07226
FRMD5 up 2,86 7,02 8,99 2,48E-05 0,07226
TRPS1 down -2,33 9,80 -9,14 2,21E-05 0,07226
XYLT1 down -2,11 7,66 -9,50 1,68E-05 0,07226
KIAA0907 down -1,64 9,56 -9,18 2,14E-05 0,07226
UNC5B down -2,20 8,66 -8,53 3,60E-05 0,08549
ARHGEF2 down -1,77 8,76 -8,47 3,77E-05 0,08549
C11orf41 up 1,93 7,06 8,27 4,46E-05 0,09102
Table 12: Differentially expressed mRNA migration/invasion (pos vs. neg migration/invasion groups),
p-values <0,1 are shown
The top-table list was fed into the DAVID Annotation tool for analysis and the
database recognized all 10 gene IDs. When considering the GO Term enrichment in
the Annotation Clustering Analysis the genes ARHGEF2, UNC5B, KRT8 and TP53
show significant relation to the biological processes (GOTerm BP fat) apoptosis and
programmed cell death (p-values 0,00082 or 0,000856 respectively).
miRNA expression in osteosarcoma Results
61
Furthermore a subset of 3 genes out of these 10 (ARHGEF2, TRPS1, TP53) is
significantly associated to the processes intracellular protein transport, protein
transport in general, establishment of protein localization or related terms.
This again fits to the comparison of expression levels between migrative and non-
migrative or invasive versus non-invasive cell lines that I performed.
4.6. Integrative analysis of microRNA and their target genes in correlation
to phenotype
By using a modified approach described by Peng et al. (2009) regulatory microRNA-
mRNA modules being associated to the features proliferation and
invasion/migration have been identified. The expression matrices of the cell lines
were used for testing mRNA and microRNA for negative correlation. It was assumed
that microRNAs disable the expression of their target mRNA. I fed all
data/microRNA-mRNA bipartite networks into the Ingenuity Pathway Analysis tool
for illustrating the biological context of the respective microRNA-mRNA-coupling.
The database created networks that include the up-/down-regulated molecules.
The networks visualize the connection of the deregulated mRNA and microRNA to
other molecules from canonical pathways derived from literature. The IPA software
combines in its core analysis all microRNA that share the same seed sequence
(identical Entrez Gene name) and terms those microRNA with one family name (e.g.
miR-181a-5p and other miR w/seed ACAUUCA) or an asterisks (see for example
miR-30*). To find a detailed description of the analytical approach, please consult
chapter 3, pages 35 - 37.
4.6.1. Proliferation network
By means of the IPA (Ingenuity Pathway Analysis) software networks for microRNA
and mRNA relationships assumingly involved in proliferation of osteosarcoma cells
have been created. Five networks (2 larger and 3 smaller) have been identified; see
screenshot in figure 20 for an overview of the networks.
In the following figure 19 the top-rated networks for proliferation are displayed
($scores 19 and 37).They include functional associations to Connective Tissue
miRNA expression in osteosarcoma Results
62
Disorders (13 molecules), Inflammatory Disease and Response (13 molecules),
Cellular Development (18 molecules), Cellular Growth and Proliferation (17
molecules) and Cancer.
Constantly up-regulated (highlighted in red) molecules in the 2 largest networks are
the genes AHR, CBX7, CAMK2N1, CEP97, DUSP6, TSHZ3, METAP1, KIF3A and ARSJ
as well as the miRNA-21, miR-30c, miR-130, miR-155
The genes GJA1, FRS2, DYNC1I1 and the miR-9, miR-17-(family), miR-19b, miR-23,
miR-30, miR-101, and miRNA 181a and b and miR-186, miR-374 present as
constantly down regulated molecules in our analysis.
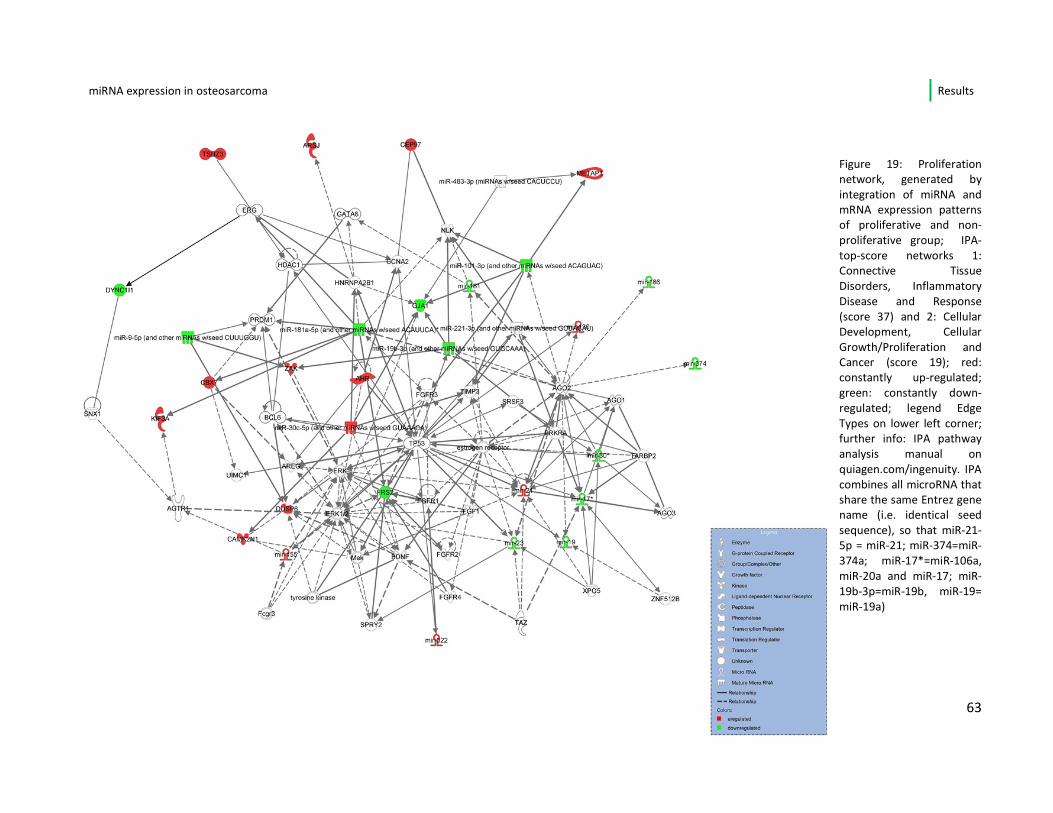
miRNA expression in osteosarcoma Results
63
Figure 19: Proliferation
network, generated by
integration of miRNA and
mRNA expression patterns
of proliferative and non-
proliferative group; IPA-
top-score networks 1:
Connective Tissue
Disorders, Inflammatory
Disease and Response
(score 37) and 2: Cellular
Development, Cellular
Growth/Proliferation and
Cancer (score 19); red:
constantly up-regulated;
green: constantly down-
regulated; legend Edge
Types on lower left corner;
further info: IPA pathway
analysis manual on
quiagen.com/ingenuity. IPA
combines all microRNA that
share the same Entrez gene
name (i.e. identical seed
sequence), so that miR-21-
5p = miR-21; miR-374=miR-
374a; miR-17*=miR-106a,
miR-20a and miR-17; miR-
19b-3p=miR-19b, miR-19=
miR-19a)
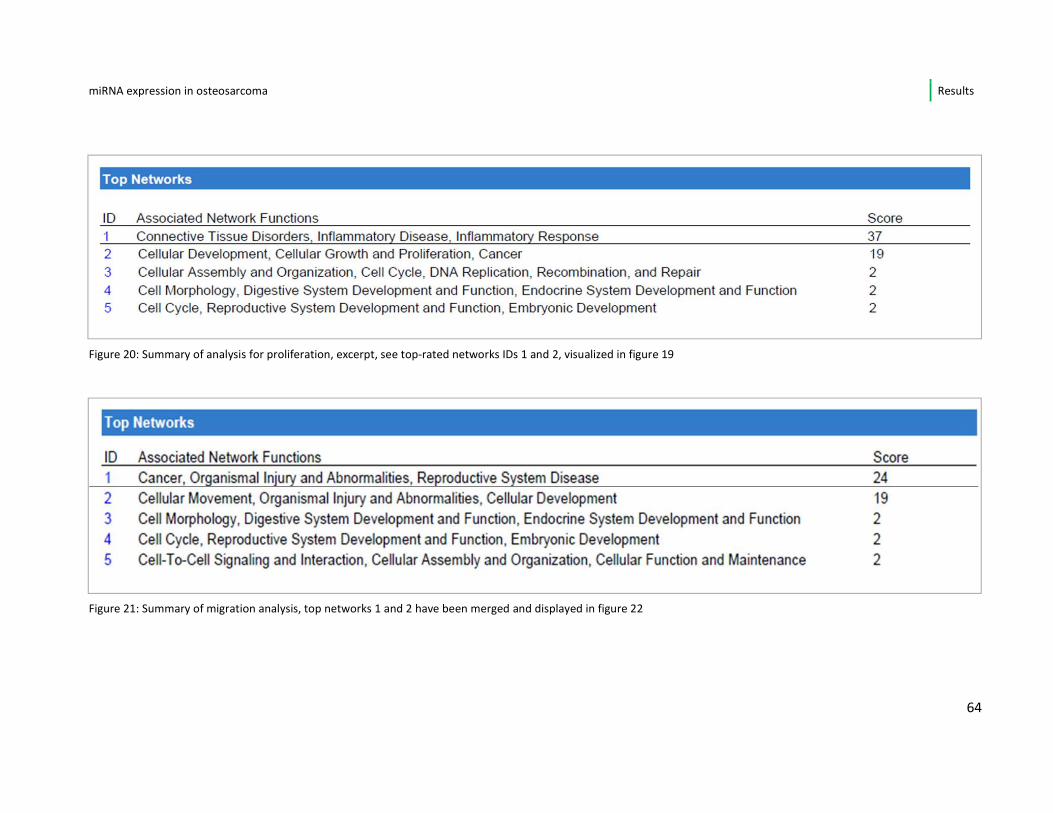
miRNA expression in osteosarcoma Results
64
Figure 20: Summary of analysis for proliferation, excerpt, see top-rated networks IDs 1 and 2, visualized in figure 19
Figure 21: Summary of migration analysis, top networks 1 and 2 have been merged and displayed in figure 22
miRNA expression in osteosarcoma Results
65
4.6.2. Migration/invasion network
With the same approach again 5 networks (2 large and 3 smaller) have been
created, this time integrating the expression data for both microRNA and mRNA in
migrative/invasive osteosarcoma cell lines.
The 2 top-rated networks (scores 24 and 19, see screenshot figure 21) for the
integrative analysis microRNA-mRNA-relationship can be seen in figure 22.
Associated functions of these networks are Cancer (28 molecules), Organismal
Injury and Abnormalities (23 molecules), Reproductive System Disease (20
molecules) as well as Cellular Development (13 molecules) and Cellular Movement
(8 molecules).
The miR-181a, miR-186, miR-199a, miR-19b, miR-23a, miR-374b, miR-30c belong to
the constantly down-regulated as well as DYNC11, FRS2 and GJA1, MEGF9.
ARSJ, CBX7, KIF3A, METAP1, PODXL, DUSP6, miR-19, miR-23, miR-30 and miR-181*
The miR-7a, miR-17, miR-21, miR-130a, miR-155 show up-regulation repeatedly.
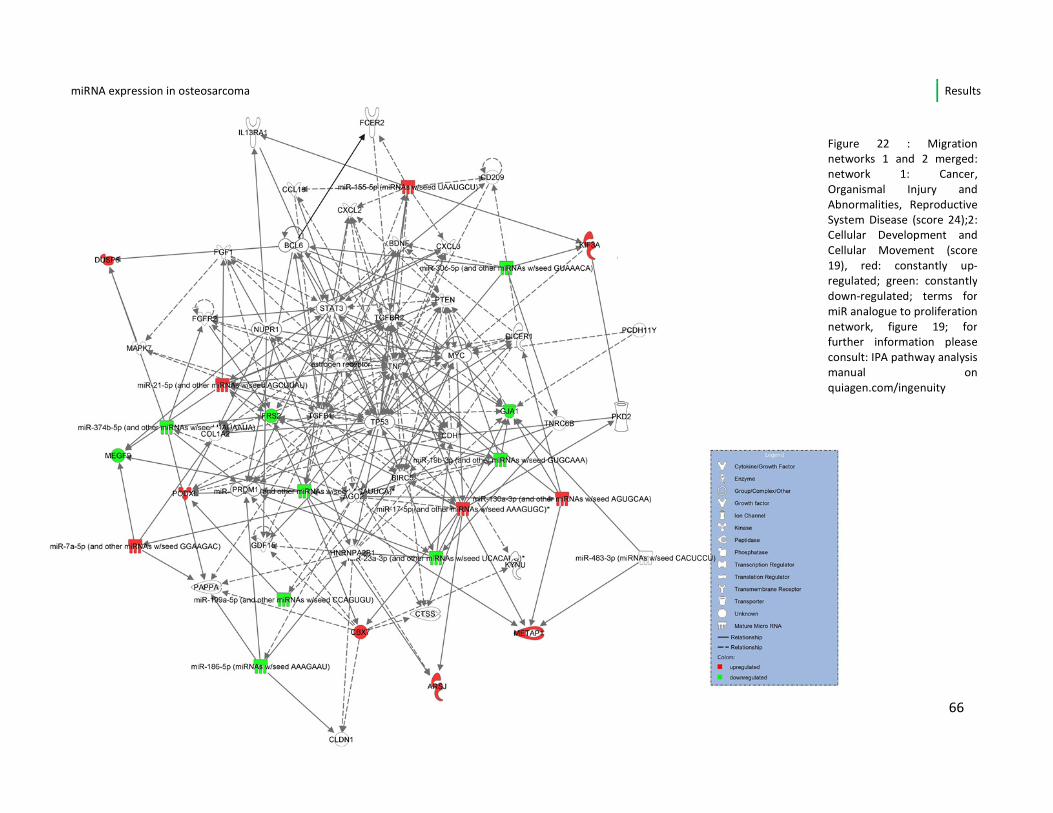
miRNA expression in osteosarcoma Results
66
Figure 22 : Migration
networks 1 and 2 merged:
network 1: Cancer,
Organismal Injury and
Abnormalities, Reproductive
System Disease (score 24);2:
Cellular Development and
Cellular Movement (score
19), red: constantly up-
regulated; green: constantly
down-regulated; terms for
miR analogue to proliferation
network, figure 19; for
further information please
consult: IPA pathway analysis
manual on
quiagen.com/ingenuity
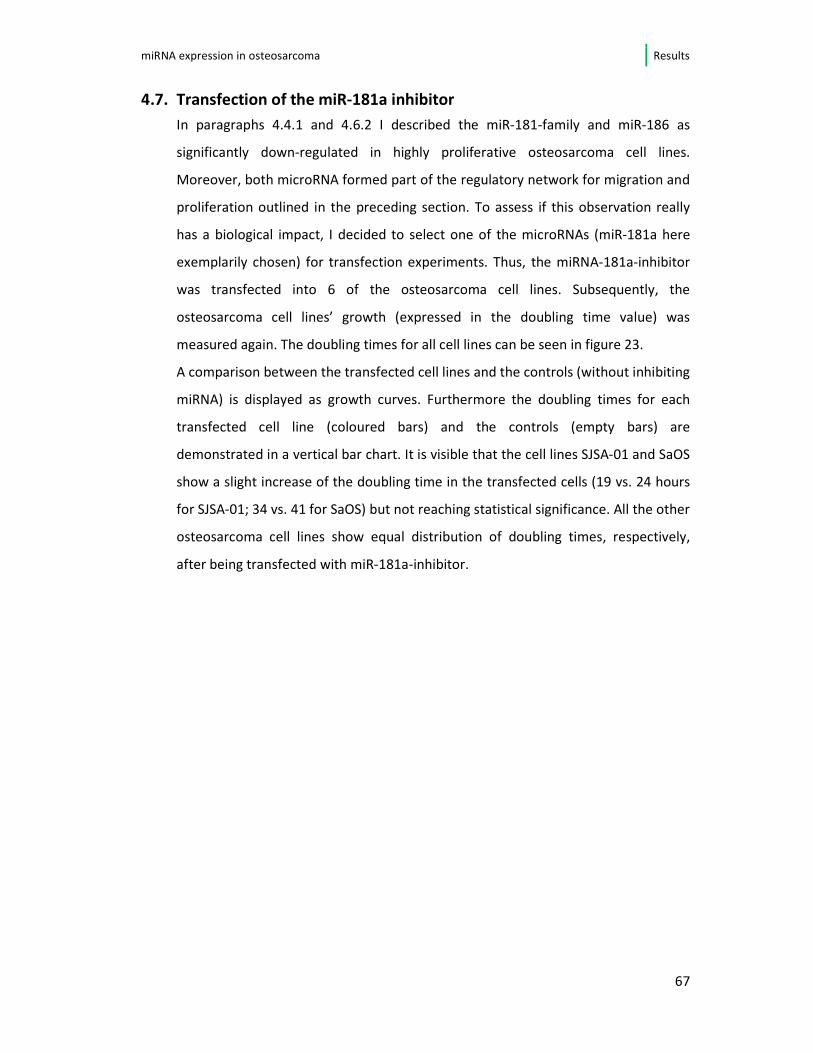
miRNA expression in osteosarcoma Results
67
4.7. Transfection of the miR-181a inhibitor
In paragraphs 4.4.1 and 4.6.2 I described the miR-181-family and miR-186 as
significantly down-regulated in highly proliferative osteosarcoma cell lines.
Moreover, both microRNA formed part of the regulatory network for migration and
proliferation outlined in the preceding section. To assess if this observation really
has a biological impact, I decided to select one of the microRNAs (miR-181a here
exemplarily chosen) for transfection experiments. Thus, the miRNA-181a-inhibitor
was transfected into 6 of the osteosarcoma cell lines. Subsequently, the
osteosarcoma cell lines’ growth (expressed in the doubling time value) was
measured again. The doubling times for all cell lines can be seen in figure 23.
A comparison between the transfected cell lines and the controls (without inhibiting
miRNA) is displayed as growth curves. Furthermore the doubling times for each
transfected cell line (coloured bars) and the controls (empty bars) are
demonstrated in a vertical bar chart. It is visible that the cell lines SJSA-01 and SaOS
show a slight increase of the doubling time in the transfected cells (19 vs. 24 hours
for SJSA-01; 34 vs. 41 for SaOS) but not reaching statistical significance. All the other
osteosarcoma cell lines show equal distribution of doubling times, respectively,
after being transfected with miR-181a-inhibitor.
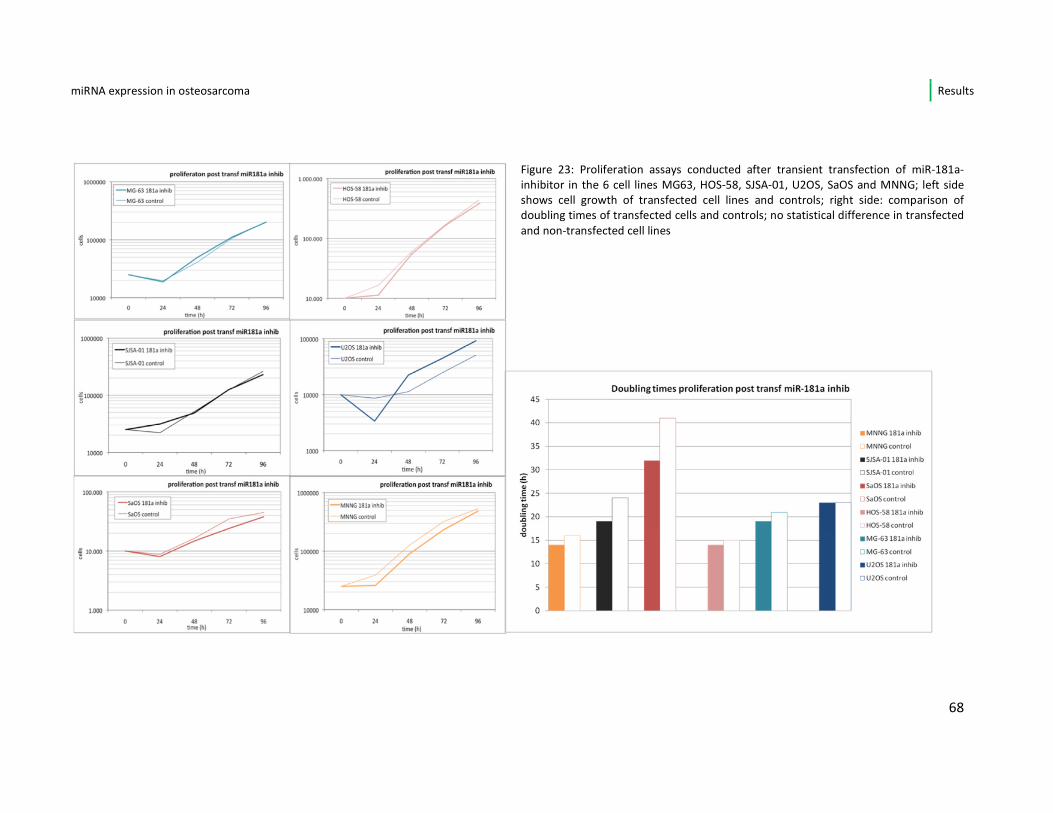
miRNA expression in osteosarcoma Results
68
Figure 23: Proliferation assays conducted after transient transfection of miR-181a-
inhibitor in the 6 cell lines MG63, HOS-58, SJSA-01, U2OS, SaOS and MNNG; left side
shows cell growth of transfected cell lines and controls; right side: comparison of
doubling times of transfected cells and controls; no statistical difference in transfected
and non-transfected cell lines
miRNA expression in osteosarcoma Discussion
69
5. Discussion
5.1. Summary and evaluation of methods
By combining different analytical methods I evaluated the microRNA and mRNA
expression data that were generated for 8 established osteosarcoma cell lines and 2
progenitor cell lines. I found three of the cell lines (HOS, HOS-58 and ZK-58) to be
very similar with only minor differences in their assay results and expression
profiles. An authentication test revealed that the three cell lines originate from the
same cell line. Hence, to maintain the discriminative power of the data, I decided to
keep only HOS-58 for further analysis.
First expression of 6 osteosarcoma cells and the reference cell lines for both
microRNA and mRNA was compared separately. Later on, using conventional
association testing, deregulated microRNA and their potential target genes were
correlated with the osteosarcoma cell lines’ potential to proliferate, migrate and
invade, respectively. Finally by integration of the expression matrices of both
microRNA and mRNA, networks have been identified that might play a role once
again in the proliferation or migration/invasion of osteosarcoma cells.
Goal of this work was to approach the topic microRNA deregulation in
osteosarcoma both from a genomic and cellular level. By evaluating the data in
conventional statistical methods (association testing, one-by-one-comparison) and
integrative approaches I aimed to achieve more solid results. As I could identify
common points in both approaches (e.g. miR-181a deregulation), a first validation
experiment in the cell lines was initiated.
5.2. Study material
Generally, tumor cell lines are a mean for gaining an insight into tumor biology in
vitro in a comprehensive manner without using valuable primary tumor material
and with the option of numerous repetitions. Due to the treatment regime and the
nature of osteosarcoma, primary patient material is rare and has to be dealt with
carefully. Therefore I decided to use osteosarcoma cell lines for studying the
microRNA expression in osteosarcoma.
miRNA expression in osteosarcoma Discussion
70
This allowed research without material limitations. Moreover the cell lines can be
used as a proximate model for studying osteosarcoma pathogenesis (Greshock et
al., 2007; Mohseny et al., 2011). Certainly, cell lines, like these chosen in this thesis,
have undergone mutations during the immortalization, so that their similarities to
the original osteosarcoma might change over time of cultivation. Therefore, the
significance of this study’s findings for the osteosarcoma pathogenesis has to be
validated in primary tumor samples.
5.3. Differentially expressed miRNA and their target genes in
osteosarcoma cell lines versus normal tissue
The oncogenic cluster miR-17/92 is deregulated in osteosarcoma cell lines
In this study 15 deregulated microRNA (see table 5 in paragraph 4.1.2, pages 49 and
50) were identified by comparing the microRNA expression of 6 osteosaroma cell
lines and the reference lines (osteoblast and mesenchymal stem cell line).
Remarkably, five of these microRNA (miR-17-5p, miR-18a, miR-93, miR-106a and
miR-106b) belong to the oncogenic microRNA-cluster 17/92 and its paralogue
clusters miR-106a-363 and miR106b-25, respectively (Mogilyansky and Rigoutsos,
2013; Olive et al., 2010). The polycistronic cluster is located on the locus of the
MIR17HG gene on chromosome 13 and encodes six microRNA (miR-17, 18a, 19a,
20a, 19b1 and 92a-1). Its two paralogues were identified on chromosome 7 (miR-
106b, miR-93 and miR-25) and the X-chromosome (miR-106a, miR-18b, miR-20b,
miR-19b-2, miR-92a-2 and miR-363). Figure 24 is showing all the members
organized by cluster and microRNA family and moreover illustrates what genes
have been identified as potential targets in this study.
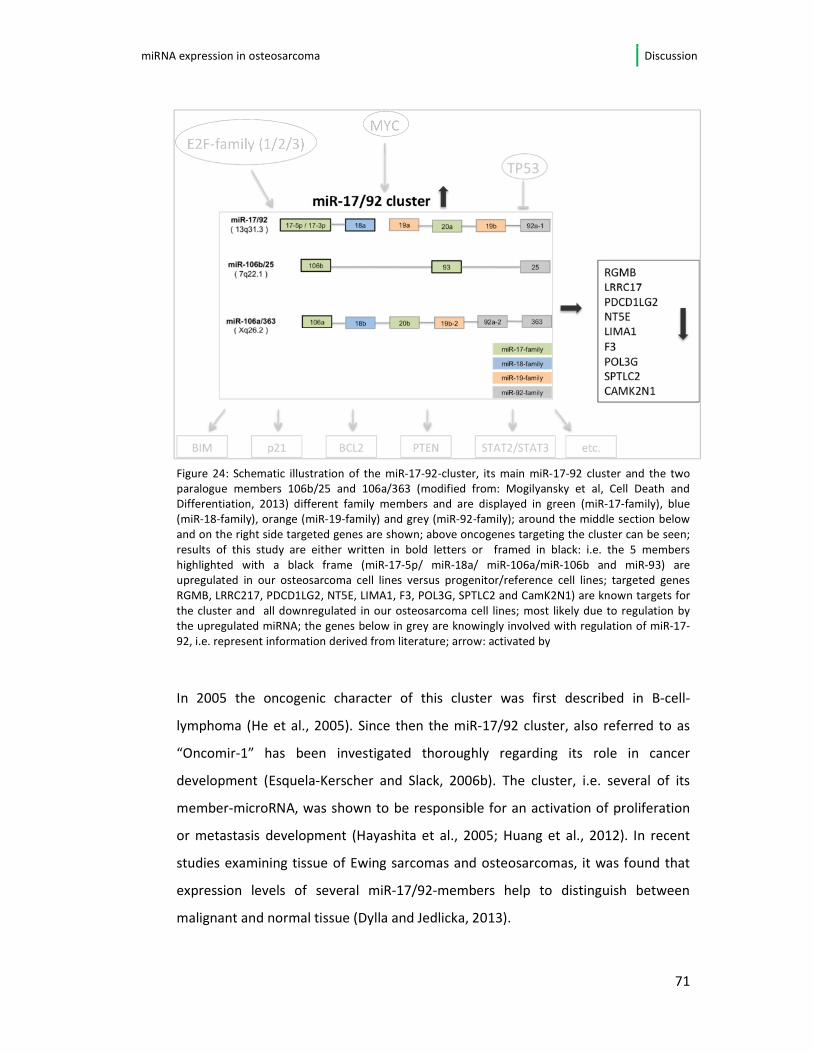
miRNA expression in osteosarcoma Discussion
71
Figure 24: Schematic illustration of the miR-17-92-cluster, its main miR-17-92 cluster and the two
paralogue members 106b/25 and 106a/363 (modified from: Mogilyansky et al, Cell Death and
Differentiation, 2013) different family members and are displayed in green (miR-17-family), blue
(miR-18-family), orange (miR-19-family) and grey (miR-92-family); around the middle section below
and on the right side targeted genes are shown; above oncogenes targeting the cluster can be seen;
results of this study are either written in bold letters or framed in black: i.e. the 5 members
highlighted with a black frame (miR-17-5p/ miR-18a/ miR-106a/miR-106b and miR-93) are
upregulated in our osteosarcoma cell lines versus progenitor/reference cell lines; targeted genes
RGMB, LRRC217, PDCD1LG2, NT5E, LIMA1, F3, POL3G, SPTLC2 and CamK2N1) are known targets for
the cluster and all downregulated in our osteosarcoma cell lines; most likely due to regulation by
the upregulated miRNA; the genes below in grey are knowingly involved with regulation of miR-17-
92, i.e. represent information derived from literature; arrow: activated by
In 2005 the oncogenic character of this cluster was first described in B-cell-
lymphoma (He et al., 2005). Since then the miR-17/92 cluster, also referred to as
“Oncomir-1” has been investigated thoroughly regarding its role in cancer
development (Esquela-Kerscher and Slack, 2006b). The cluster, i.e. several of its
member-microRNA, was shown to be responsible for an activation of proliferation
or metastasis development (Hayashita et al., 2005; Huang et al., 2012). In recent
studies examining tissue of Ewing sarcomas and osteosarcomas, it was found that
expression levels of several miR-17/92-members help to distinguish between
malignant and normal tissue (Dylla and Jedlicka, 2013).
miRNA expression in osteosarcoma Discussion
72
This coincides with our study as we found the miR-17-5p, miR-18a, miR-93, miR-
106a and miR-106b to be constantly up-regulated in the osteosarcoma cell lines vs.
reference cell lines, supporting the idea that the miR-17/92 and its paraloguos
clusters might have an oncogenic effect in osteosarcoma.
A study from Mogilansky et al. is reviewing the numerous works that have been
published up to now and interestingly members of miR-17/92 or its paralogues have
been shown overexpressed in all the solid tumors that have been examined
(Mogilyansky and Rigoutsos, 2013).
As potential targets of the miR-17/92-cluster MYC is one of the most important to
mention. This proto-oncogene, first described in 1982, is one of the key-players in
the cell cycle. By regulating their transcription it enables genes, such as CDK4, to
process from G1 to the S-phase; it stimulates proliferation, blocks differentiation of
cells and triggers apoptosis (Dang, 2012; Hermeking et al., 2000; Vennstrom et al.,
1982). In osteosarcoma in particular, MYC was shown to be amplified frequently.
It was demonstrated, not only by our group in 2010 but also by Gamberi et al. and
Kuijjer, to have an unfavorable prognostic value (Gamberi et al., 1998; Kuijjer et al.,
2012; Smida et al., 2010). On the other hand it was proven that MYC (c-myc) as well
as MYCN (n-myc) and the EF2-family directly activate the transcription of miR-17/92
by binding to its promoter region (Olive et al., 2010).
The transcription of 17/92 clusters might be also regulated by TP53 (p53), as
indicated by Yan et al. The group has detected that the expression of miR-17/92 is
downregulated in hypoxic cells containing p53-wildtype (Yan et al., 2009).
Since the cluster and its paralogues consist of several miRNA, each can target large
number of genes. It has been shown, for instance, that the cluster not only is
activated by E2Fs-genes, but targets itself the E2F-family. This and the information
earlier stated suggest that a feedback mechanism exists between miR-17/92, the
E2Fs and MYC (Aguda et al., 2008; Sylvestre et al., 2007).
A recently published study examined the expression of the miR-17/92 cluster
members in paraffin-samples of pre-therapeutic osteosarcomas. The group could
demonstrate that upregulation of the cluster members correlates with unfavorable
outcome (metastasis/survival). Furthermore they showed the relationship between
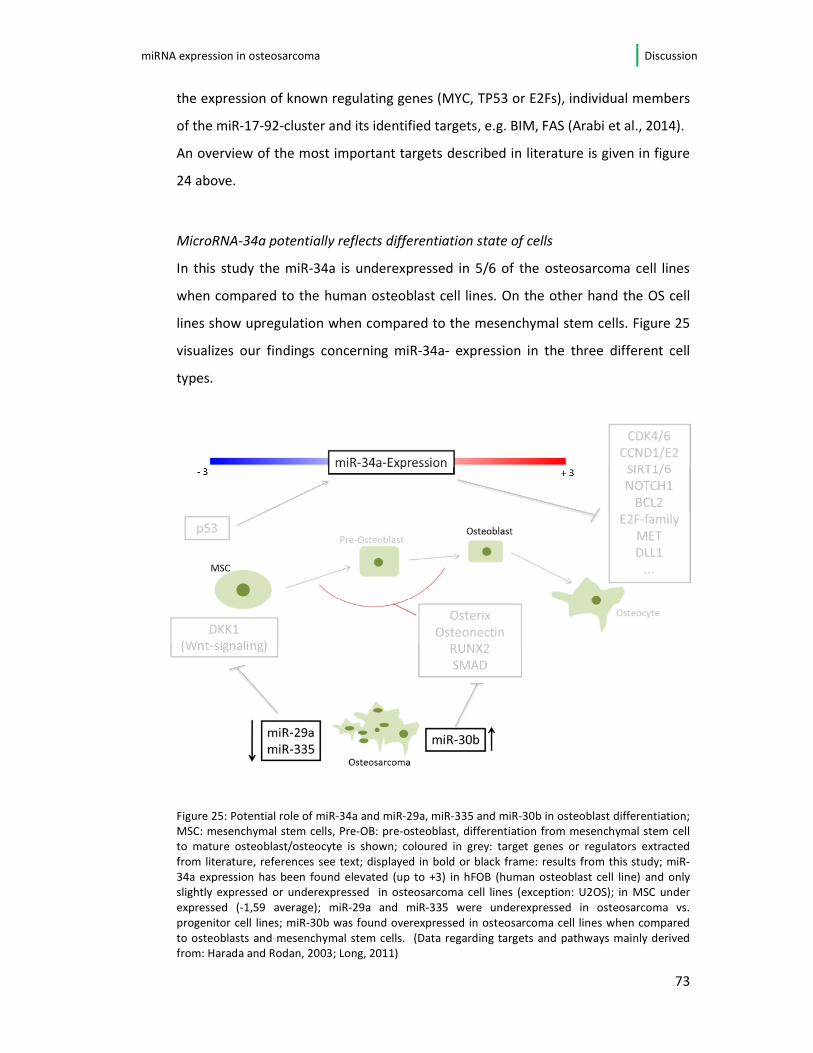
miRNA expression in osteosarcoma Discussion
73
the expression of known regulating genes (MYC, TP53 or E2Fs), individual members
of the miR-17-92-cluster and its identified targets, e.g. BIM, FAS (Arabi et al., 2014).
An overview of the most important targets described in literature is given in figure
24 above.
MicroRNA-34a potentially reflects differentiation state of cells
In this study the miR-34a is underexpressed in 5/6 of the osteosarcoma cell lines
when compared to the human osteoblast cell lines. On the other hand the OS cell
lines show upregulation when compared to the mesenchymal stem cells. Figure 25
visualizes our findings concerning miR-34a- expression in the three different cell
types.
Figure 25: Potential role of miR-34a and miR-29a, miR-335 and miR-30b in osteoblast differentiation;
MSC: mesenchymal stem cells, Pre-OB: pre-osteoblast, differentiation from mesenchymal stem cell
to mature osteoblast/osteocyte is shown; coloured in grey: target genes or regulators extracted
from literature, references see text; displayed in bold or black frame: results from this study; miR-
34a expression has been found elevated (up to +3) in hFOB (human osteoblast cell line) and only
slightly expressed or underexpressed in osteosarcoma cell lines (exception: U2OS); in MSC under
expressed (-1,59 average); miR-29a and miR-335 were underexpressed in osteosarcoma vs.
progenitor cell lines; miR-30b was found overexpressed in osteosarcoma cell lines when compared
to osteoblasts and mesenchymal stem cells. (Data regarding targets and pathways mainly derived
from: Harada and Rodan, 2003; Long, 2011)
miRNA expression in osteosarcoma Discussion
74
The miRNA 34a has been already described in literature as being tumor suppressive.
In neuroblastoma, for instance, its expression levels were low in tumor samples
compared to normal tissue. A direct targeting of E2F2 by miR-34a led to a decrease
of cell proliferation in this tumor. Another study examined the osteosarcoma cell
lines U2OS and SaOS and found that the miR-34 family inhibits proliferation and
metastasis and triggers apoptosis by directly targeting TP53 in these cell lines (Cole
et al., 2008; Welch et al., 2007). On the other hand miR-34a is regulated by TP53, as
well. He et al. did show that the miR-34 expression levels (miR-34a,b and c) were
low in osteosarcoma samples versus normal tissue samples (He et al., 2009).
More recently several groups found miR-34a in particular responsible for inhibiting
growth and metastasis in osteosarcoma (Yan et al., 2012; Zhao et al., 2013).
All these findings are in line with my results as I found 34a down-regulated in the
osteosarcoma cell lines when compared to hFOB suggesting a tumor suppressive
effect. The fact that, in our work, its expression in comparison to the stem cells (L-
87/4) is upregulated cannot be explained so easily.
Certainly, the level of differentiation has impact on a microRNAs expression level.
Bu et al. propose a “bimodal switch” mechanism for miR-34a. They found that, by
targeting NOTCH, it regulates the degree of differentiation in colon cancer cells and
their stem cells, respectively (Bu et al., 2013). Consistent with this and our results,
recent publications described that the miR-34a expression level increases with the
degree of cell differentiation in various tissues, among them osteosarcoma cells
(Aranha et al., 2011; Lefort et al., 2013). Chen at al. identified miR-34a as a
modulator of osteoblast differentiation. In their recently published work they
propose a “dual regulatory effect” meaning that miR-34a affects both mesenchymal
stem cell proliferation as well as the osteoblastic lineage (Chen et al., 2014).
The latter once again backs up our results and indicates that the miRNA-34a
involvement in differentiation of osteoblasts and bone forming, respectively, might
be crucial. Potential target genes of miR-34a are displayed in figure 25, as well.
miRNA expression in osteosarcoma Discussion
75
Other deregulated microRNA in osteosarcoma vs. progenitor cell lines
MiR-29a is downregulated in the osteosarcoma cell lines in this study when
compared to both progenitor lines.
In two, 2012 published articles, different groups compared microRNA epression
profiles in osteosarcoma and normal tissue. Both showed a downregulation of the
microRNA-expression levels in osteosarcoma tissue (Jones et al., 2012; Zhang et al.,
2012).
This confirms our findings and the tumor suppressive function that miR-29a might
have in osteosarcoma development. Its role in osteoblast differentiation has been
examined by Kapinas et al. in 2010. The authors show an increase of miR-29a
expression in the differentiation process of human osteoblasts (including our cell
line hFOB 1.19) and propose a positive feedback mechanism for miR-29 and
regulatory genes of the WNT-signaling pathway (Kapinas et al., 2010).
Another microRNA that has been connected to differentiation of osteoblasts and
osteosarcoma pathogenesis is the miR-125b (Mizuno et al., 2008). It was
characterized recently as a suppressor of both proliferation and migration in
osteosarcoma. Liu et al. explained this effect by inhibition of STAT3 (Liu et al., 2011).
Furthermore miR-125b has been linked to TP53 repeatedly, where it acts either
indirectly by suppressing CDKN2A (p14arf) or in a direct manner (Amir et al., 2013;
Le et al., 2011). The miR-125-family expression in general was examined in
numerous cancer types and its properties vary immensely between the cancer
entities, meaning that is seems to function as tumor suppressor and oncogene (Sun
et al., 2013).
Why in our study miR-125b is downregulated in all osteosarcoma cell lines except
MG-63, where it was found up-regulated, cannot be explained explicitly.
The difference of this particular cell line is that, although highly proliferative, it does
not show any migrative or invasive tendencies. Therefore MG-63 plays an
exceptional role in our subset of cell lines. Pautke et al. underline this when stating
that MG-63 has a very “heterogenous profile” in terms of immunocytochemistry
labeling (Pautke et al., 2004).
miRNA expression in osteosarcoma Discussion
76
The miR-30b, in our work up-regulated in 4/6 osteosarcoma cell lines, has been
described in the context of bone differentiation as well.
Wu et al. characterized several miR-30 family members (among them miR-30b) as
negative regulators of osteoblast differentiation as they target SMAD1 and RUNX2
(Wu et al., 2012). That the miR-30-family has a role in osteoblast differentiation
was confirmed just recently by Eguchi et al. They published a biomarker panel that
they named “ostemiRs” with the miR-30-family members as one of the most
important. According to their expression patterns they were divided into groups:
miR-30b/c and miR-30a/d/e (Eguchi et al., 2013).
The miR-193a-3p displays an up-regulation in our dataset (compared to both
progenitor cell lines) again only in MG-63.
Few other data is available about this microRNA so far. One recent publication
characterized miR-193a-3p as inducible by ionic radiation (different cell types) and
in this context inducing apoptosis by directly targeting MCL-1 (Kwon et al., 2013).
Another microRNA that seems to have a special role is miR-193b being only
downregulated in the osteosarcoma cell line MNNG.
This cell line, originating from HOS (ATCC CRL-1543), was transformed by treatment
with cancerogenous nitrosamines. It has been examined only for a small number of
cancer types, among them breast, prostate cancer and melanoma. Here miR-193b
shows tumor suppressive effects (Chen et al., 2010; Li et al., 2009; Rauhala et al.,
2010).
The miR-335 and miR-424 showed downregulation in 5/6 and 6/6 comparisons,
respectively, in our osteosarcoma cell lines.
The assumable tumor suppressive effect of both microRNAs has been backed up by
two studies from last year. They identified miR-335 lower expressed in
osteosarcoma than in normal tissue and proposed a miR-424 tumor suppressive
effect in osteosarcoma as well (Long et al., 2013; Wang et al., 2013). Furthermore,
miRNA expression in osteosarcoma Discussion
77
both microRNA (miR-335 and miR-424) have been described as modulators of
osteoblast differentiation (Gao et al., 2011; Zhang et al., 2011a).
The other miR-301a and miR-1275 demonstrated in our study as repeatedly up- or
downregulated (the latter microRNA) have not yet been in focus in regard to
osteosarcoma development. Therefore it might be worthwhile to further study their
role in osteosarcoma.
To sum up, the 15 miR identified as deregulated in the osteosarcoma cell lines,
especially the 17-92 cluster, miR-34a and miR-29a and 30b, seem to be essential
components in osteoblast differentiation and bone homeostasis. An overview of
these microRNA and their potential targets have been given in figure 24 and 25 (see
pages 71 and 73). These facts might help to give new insights in bone differentiation
and forming of malignant osteoid. Although the etiology of osteosarcoma has not
been clarified yet, its high incidence during puberty indicates that pubertal
hormonal changes and growth spurt are strongly associated. Therefore the
understanding of how the described subset of microRNA and its expression changes
can regulate the forming of new bone from stem cells is a crucial finding.
Differential gene expression of osteosarcoma cell lines versus reference cell lines
To predict potential targets for the 15 deregulated microRNAs I used the miRDB
database. This online tool identified up to 207 target transcripts and up to 155
target genes per microRNA. The expression levels of these potential target genes
were compared separately between the osteosarcoma and the reference cell lines.
But only those with the appropriate regulation in the highest number of
comparisons (≥4/12) were included in table 6 (consult results, page 47) and had to
be evaluated further (n=16). Seven of the deregulated genes could be correlated
again to the miR-17/92 cluster. Interestingly these genes were then only influenced
by members of this cluster and not by other miR. RGMB, PDCD1LG2, LIMA1, F3,
POLR3G, SPTLC2 and CAMK2N1 are the genes constantly down regulated by the
oncogenic cluster but are not influenced by other microRNA of our subset.
miRNA expression in osteosarcoma Discussion
78
Mainly the genes identified in this analysis take part in cell cycle processing,
apoptosis and bone differentiation.
I found RGMB constantly downregulated in the osteosarcoma versus reference cell
lines. Several members (miR-17, miR-93, miR-106a and miR-106b) have been
predicted to target RGMB and show the proper regulation (all up) in at least 4/12
comparisons. The fact that RGMB is downregulated in the majority of the
osteosarcoma cell lines utilized in this study suggests its relevance in the
pathogenesis of this cancer type.
RGMB (also referred to as DRAGON) acts as a co-receptor for BMP (bone
morphogenic protein) and in this role is responsible for differentiation processes in
bone (Halbrooks et al., 2007; Samad et al., 2005).
Other genes that seem to be regulated by the 17/92 cluster members include the
oncogenic LIMA1 (also referred to as EPLIN) and CAMK2N1, both so far described as
tumor-suppressive in prostate and breast cancer (Maul and Chang, 1999; Wang et
al.; Zhang et al., 2011b). Additionally, Ma et al. found that CAMK2 induced
apoptosis and cell cycle arrest in ovarian cancer cells (Ma et al., 2009).
Furthermore PDCD1LG2 (programmed cell death 1 ligand 2) is down-regulated by
17/92 in a high number of comparisons. This second ligand of the programmed cell
death protein has been first described in 2001 and seems mostly to be involved in
T-cell-regulation (Latchman et al., 2001).
Another gene from our list that is known to be involved in differentiation of bone is
LRRC17. In this study it was specifically targeted and down-regulated only by miR-
30b. Consistent with this, it was described as a negative regulator, by targeting
RANKL, of osteoclast function (Kim et al., 2009).
In this work, CCNE1 (Cyclin E1) is upregulated supposedly by the miR-424a only.
It is a member of the Cyclin family, which members are known for their regulatory
role for CDK kinases. Cyclin E1 in particular forms a complex with CDK2 and in this
function supports progression from G1 to S-phase in cell cycle. It has not only been
linked to several different cancer types but also to osteosarcoma genesis (Honda et
al., 2005; Lockwood et al., 2011).
miRNA expression in osteosarcoma Discussion
79
The identified target genes NT5E, MGAT4A (also referred to as GnT-Iva) and MYBL1
have been described as potential biomarkers in breast or pancreatic cancer as well
as in pediatric brain tumors (Ide et al., 2006; Lo Nigro et al., 2012; Ramkissoon et al.,
2013). In this analysis I could identify these 3 genes as deregulated in 4 of 12 and 6
of 12 comparisons, respectively.
Another gene important in cancer pathogenesis in the list is the gene FLI 1, whose
expression has been described as helpful to distinguish between small cell
osteosarcoma, chondrosarcoma and Ewing sarcoma (Lee et al., 2011).
Before, it was described extensively as an important player in the pathogenesis of
Ewing’s sarcoma, certain types of leukemia or breast cancer (Kauer et al., 2009;
Sakurai et al., 2007; Truong and Ben-David, 2000).
Whether F3, a gene encoding for Thromboplastin, POLR3G (Polymerase III
polypeptide G) or SPTLC2 (serine palmitoyltransferase, long chain base unit 2) take
part in the pathogenesis of cancer has not been described yet.
Therefore the results of our study, describing these genes as potential targets of 17-
92, give interesting novel information about their function.
According to several studies nearly all the genes found to be targeted by ths list of
microRNAs are involved in the transformation to malignancy. This fact underlines
the biological relevance of the identified microRNA. Especially the influence of the
miRNA-17-family (17-92 cluster or its paralogous clusters miR-106a-92 and 106b-25)
might be crucial. All these connections to genes involved in bone forming/bone
differentiation imply that the comparison of gene expression between
osteosarcoma tissue and precursor tissue shows a real “biologic path” that leads
from mesenchymal stem cells to bone cancer cells.
5.4. Correlation of microRNA-mRNA data with phenotype
In vitro assays - results in comparison with literature
A cancer’s growth properties and its tendency to infiltrate foreign tissue distinguish
an aggressive from a non-aggressive tumor. That’s why in this study I assessed, in
addition to the genotype, the proliferational, migrative and invasive potential of the
miRNA expression in osteosarcoma Discussion
80
osteosarcoma cell lines. I characterized HOS-58 and SaOS as slow proliferating cell
lines based on their doubling time (>30 hours, see figure 14, page 48).
As already mentioned, I could verify that the alleged cell lines HOS-58, ZK-58 and
HOS originate from the same cell line. Only HOS-58 was kept for further analysis
and will be discussed here. In literature HOS-58 is poorly described. The data about
this cell line range in doubling time from 20-36 hours in a state of pre-confluence
and up to 80 hours when the cells are completely confluent (Siggelkow et al., 1998).
SaOS has been shown to be slow proliferating in this study (51 hours doubling time),
a similar observation was found by others (Evdokiou et al., 2003; Jia et al., 2000).
As the cell lines with the highest growth potential MG-63 with an average of 26 h
doubling time, MNNG with 23h, U2OS with 27 h and SJSA-01 with 19 h have been
identfied. The literature backs up this findings, demonstrating doubling times for
these 4 cell lines ranging from 18 hours for SJSA-01 up to 30 hours for MG-63
(Evdokiou et al., 2003; Luu et al., 2005a; Manara et al., 2000; Pautke et al., 2004).
Generally, migration is the process helping multicellular organisms to move from
one place to the other, a complex sequence of extension, formation of adhesive
networks, translocation and re-integration. Invasion, based on an initial ability of
the cell to migrate is the ability to penetrate into other cell membranes (Friedl and
Wolf, 2003).
In this work I demonstrated that the cell lines SJSA, MNNG and U2OS are
osteosarcoma cell lines with a high migrative and invasive potential. The cell lines
SaOS, HOS58 and MG-63 could be classified as little or not migrative and invasive,
respectively (see figure 15+16 on pages 50 and 51).
For supporting my findings in regard to migration and invasion potential few data
was available. Several groups performed the same procedures, i.e. Boyden chamber
assay with (invasion assay) or without Matrigel® covered (migration assay) cell
culture inserts. Another method to use for migration analysis was the so-called
“scratch assay”, which I initially performed with a lab colleague to decide for an
appropriate method. The scratch assay holds a high risk of cell membrane damage
and additionally lacks reliable quantification of the result (Kramer et al., 2013;
Valster et al., 2005). Due to its better reproducibility, the possibility of testing with a
miRNA expression in osteosarcoma Discussion
81
chemogradient and a matrigel coating (to mimic the cell membrane) I selected the
transmembrane method.
Analogue to my findings, MG-63 is described to be a non-migrating and non-
invading cell line. U2OS is characterized as being highly invasive and migrative.
Other groups underpinned my work as well, their findings just differ in the number
of cells migrating/invading through the Matrigel® membrane. Others simply display
microscopic pictures with the invaded/migrated cells and show a grading without
any quantification (Cheng et al., 2004; Fromigué et al., 2008; Luu et al., 2005b; Mills
et al., 2009).
In summary, literature supports the findings of the in-vitro assays conducted in this
work. This is an indication that this approach to further characterize and categorize
the osteosarcoma cell lines is valid and reproducible.
MiRNA-181-family and miR-186 may have an anti-proliferative effect in
osteosarcoma cell lines
Table 8 on page 53 displays that the miR-181a, b, d and miR-181* as well as miR-
186 are significantly downregulated in the highly proliferative group of cell lines.
The miR-181a,b, d and miR-181* (miR-181a-2-3p) belong to the human 181-family
and their genes are located on chromosomes 1, 9 and 19. The family of miR was
first described in homo sapiens in 2007 (Landgraf et al., 2007).
miR-186-5p (previously referred to as solo miR-186) was first mentioned in the
context of human microRNA research some years later (Lagos-Quintana et al.,
2003). Its stem-loop-sequence (hsa-miR-186) is located on chromosome 1.
The role of the miRNA-181-family in cancer pathogenesis has been previously
investigated by different studies. Only recently, miR-181a has been described to
have a tumor suppressive effect by targeting K-RAS in squamos cell carcinoma (Shin
et al., 2011). Furthermore miR-181a and miR-181b have been outlined as one of the
relevant regulators in Cisplatin-induced apoptotic processes in NSCLC (Galluzzi et
al., 2010; Zhu et al., 2010). Shi et al. examined a tumor suppressive effect of miR-
181a and miR-181b in glioma cells, showing that these microRNA inhibit the cancer
cells’ proliferation in vitro (Shi et al., 2008). Another study showed miR-181b as a
miRNA expression in osteosarcoma Discussion
82
potential response marker in colorectal carcinomas, i.e. showing higher expression
levels in carcinoma vs. normal tissue and altered levels in surveillance (Nakajima et
al., 2006).
These results are in line with the antiproliferative effects that all the miR-181-
family-members seem to have in the osteosarcoma cell lines. Only recently, a
collaborating group has shown, based on the proliferation assay results of this study
but using a different analytical approach, that the miR-181a, b and d are
downregulated in osteosarcoma cell lines with high proliferative potential (Poos et
al., 2013). Two other studies described an upregulation of the miR-181a and b in
osteosarcoma (obtained from open biopsies) versus control bone samples (Jones et
al., 2012; Namløs et al., 2012).
The importance of miR-186 in cancerogenesis has been described in only a few
studies. It was shown to be overexpressed in epithelial cancer cells (via targeting
PTX7) for example (Zhou et al., 2008) . Moreover, Cai et al. found that
downregulation of miR-186 is associated to poor prognosis in adenocarcinoma of
the lung (Cai et al., 2013).
Its role in malignancies and osteosarcoma in particular has to be investigated
further. Nevertheless, my results show that miR-186 in addition to the miR-181-
family could be a set of biomarkers distinguishing between highly proliferative cells
and slowly growing osteosarcoma cells providing that these microRNA-set shows
the same potential in primary tumor samples.
Transfection of miR-181a inhibitor does not influence growth of the cell lines
The active role of mir-181a in osteosarcoma biology could not be validated.
Transfection of the miR-181a inhibitor did not change the doubling times of the
osteosarcoma cell lines significantly in comparison to the controls. A number of
reasons, methodically and biologically, have to be taken into consideration to
explain these results:
The methodology for the transfection holds several sources of errors. It is not yet
well-established for osteosarcoma cells. Therefore optimal conditions for
transfecting this cell type (although certain studies including cell line transfection
were consulted) were not described. A number of questions remain: Which amount
miRNA expression in osteosarcoma Discussion
83
of transfection reagent is the adequate? Is it advisable to use stable instead of
transient transfection? In transient transfection the genetic material brought into
the cell is not integrated in the genome, it has a limited life span due to cell division
or other factors. Stable transfection is usually virus-mediated and integration in the
genome takes place. Although the implication of a virus in the cells of interest might
be recently done with high efficiency and reproducibility, the risk of cytotoxicity or
(due to its random integration in the genome) the alteration or even damage of
oncogenes of interest is high (Kim and Eberwine, 2010).
Additionally, from a biological point of view, one microRNA may not act as an
isolated regulator of proliferation. So even if this study proofs an involvement of
miR-181a, b, d in the proliferation process they would be only components in the
complex growth mechanism of this cancer.
Genes constantly deregulated in highly proliferative versus slowly proliferating cell
lines
Table 10, on pages 56 and 57 exhibits the genes that show differential expression
when the fast growing cell lines and the slow ones were compared.
A high number of genes (n=60) was identified as deregulated, i.e. were found to be
significantly distinguishing (p-value< 0,05) between osteosarcoma cells with high
and low growth potential. I conducted a search in the DAVID Annotation tool to put
this gene list into a biological context. A significant (p-value 0,0011) clustering of 4
genes (CDK6, CDKN2A, CCND1 and Serpine1) involved in the p53 pathway was
found. Furthermore, a functional enrichment analysis (GOTerm BP; demonstrated in
table 11 on pages 63/64) was performed. It showed that 10 of the 60 genes
(CCND1, CDKN2A, DLX5, SCIN, SERPINE1, ADRA1A, CDK6, MAB21L2, ADRA1D,
FOXP2) are known to be involved in regulation of cell proliferation (p-value:
0,0017). The following genes mainly take part in regulation of cell differentiation
(CCND1, CDKN2A, DLX5, SCIN, CDK6, ROBO2, CNTN4) and growth (SERPINE1,
TIMP3, EMP1, FOXP2).
These results indicate that several genes that are differentially expressed among
the fast and slow proliferating groups in our analysis really have a biological role in
proliferation and growth processes.
miRNA expression in osteosarcoma Discussion
84
It is beyond the scope of this work to discuss every gene in detail. Therefore only
the earlier mentioned relevant genes involved in proliferation or growth will be
reviewed further.
The cell-cycle regulators (CDK6, CDKN2A, CCND1) and their significance in the
pathogenesis of osteosarcoma have been emphasized when molecular genetics was
described in the introduction.
In my analysis, CDK6 and CCND1 are upregulated in the comparison of slow and fast
proliferating cell lines. CDKN2A, in contrast, we found down regulated in this
comparison.
CDKN2A in particular, has been intensively characterized by Ottaviano et al.
regarding its relevance in osteosarcoma cell lines or osteosarcoma in general,
respectively (Ottaviano et al., 2010).
Cai et al. characterized CCND1, as a target of miR-15a and 16-1, as a contributor to
proliferation processes in osteosarcoma (Cai et al., 2012). In numerous other cancer
types (e.g. breast, endometrial, pancreatic, prostate cancer) it has been found to be
deregulated and therefore marking a focus of research for targeted therapy in these
malignomas. CDK6, as well as CDK4, participates in the phosphorylation of the RB
gene and thus plays an important role not only in osteosarcoma but in various
cancers (Kovar et al., 1997; Musgrove et al., 2011).
Interestingly, CCND1, CDK6 (upregulated) and DLX5, MAB21L2, ADRA1D, FOXP2 (all
downregulated in the highly proliferative cell lines) have been linked specifically to
the Go-term positive cell proliferation in my secondary analysis indicating that they
stimulate proliferation.
DLX5 (distal-less homeobox 5) has been mentioned in the context of osteoblast
differentiation (in vitro) repeatedly. Its expression has been found to be increasing
during the bone forming process. Furthermore it was shown that RUNX2 is a direct
target (Holleville et al., 2007; Ryoo et al., 1997).
In a comprehensive study of the genetic and epigenetic changes in osteosarcoma
cell lines and tumor samples by Kresse et al. DLX5 was found deregulated. Although
a different approach was used, the mRNA expression in the cell line SaOS was
upregulated as well. This confirms the findings of my work, with SaOS being a slow
proliferating cell line. However, as far as the the osteosarcoma tumor samples are
miRNA expression in osteosarcoma Discussion
85
concerned, the group of Kresse et al. showed an overexpression of DLX5 in all the
(five) examined tumors (Kresse et al., 2012). This fact cannot be explained
unequivocally as we found downregulation of DLX5 in highly proliferative cell lines.
Clearly, its role in proliferation and osteosarcoma pathogenesis has to be studied
further.
MAB21L2 (mab-21 like-2) has been described in growth factor-beta and BMP
signaling and it is assumingly involved in neural development (Baldessari et al.,
2004).
As far as the ADRA1D (adrenoreceptor alpha 1D) and other members of this gene
family are concerned, there is evidence that they induce apoptosis of prostate
cancer cells (Partin et al., 2003). In breast cancer, adrenoreceptors have been
discussed as a target for therapy but the rather paradox effects when antagonizing
the individual adrenoceptors obviated further attempts to introduce this clinically.
(Pérez Piñero et al., 2012).
The Forkhead-Box-Protein-2 (FOXP2) has been found expressed in the healthy brain
but neurologic diseases additionally (Enard et al., 2002).
The three latter genes have not been linked to bone or osteosarcoma development
so far. Thus, this study’s findings might help understanding the complex
mechanisms of osteosarcoma cell proliferation.
Let-7 d and let-7f are down regulated in migrative and invasive osteosarcoma cell
lines
Comparing the microRNA expression levels of the migrative/invasive with the group
of osteosarcoma cell lines showing obverse behavior I found the miR-let-7d and let-
7f to be down regulated in the osteosarcoma cell lines with high invasive and
migrative potential (to be seen in table 9 and figure 18 on page 55).
The let-7 (lethal-7) family of microRNA was not only one of the first microRNAs
identified but also the first human microRNA that has been described in scientific
literature. In 2000 it was found in C. elegans and a bit later the same year its
existence in homo sapiens was proven (Pasquinelli et al., 2000; Reinhart et al.,
2000). By now 11 mature let-7-family sequences are known (Roush and Slack,
2008). The role of let-7 in cancer pathogenesis seems to be manifold (Boyerinas et
miRNA expression in osteosarcoma Discussion
86
al., 2010). The regulation of cell differentiation, cell migration and invasion appears
to be of great relevance among its various functions. Liang et al., for example,
outlined that let-7f reduces the potential to invade and migrate in gastric cancer
cells (Liang et al., 2011). Let-7d, the other microRNA we found downregulated in
the osteosarcoma cells in our study, showed the same tendency in advanced-grade
renal cell carcinoma (Su et al., 2014). A study published in 2010, using
immunochemistry, characterized retinoblastoma samples with lower let-7
expression levels in the tumor samples with high mobility compared to normal
tissue or those samples with lower mobility (Mu et al., 2010).This is very interesting
since it is a well-known fact that people with RB1-germline mutation have a
significantly higher risk of developing osteosarcoma.
Though it has been indicated recently it is still not clear what role the let-7-family
members might play in osteosarcoma development.
Genes differentially regulated in migrative and invasive cell lines
Only one gene, TMEM119, showed significant (p=0,00295) deregulation in this
comparison. Table 12 on page 61 shows an overview of 10 genes differentially
expressed among the groups with high and low invasive/migrative potential. I
included 9 genes that presented with p-values <0,1 because of their apparent
relevance after conducting a GoTerm enrichment analysis. TP53, KRT8, UNC5B,
ARHGEF2 were significantly (p=0,00082 and 0,00086, respectively) associated to
apoptosis and programmed cell death. Furthermore, ARHGEF2, TP53 and TRPS1 are
known to be involved in the biological processes of protein transport and
intracellular transport.
TMEM119 is a known promoter of osteoblast differentiation is directly targeting
RUNX2. By interaction with the different bone morphogenetic proteins it
participates in the differentiation from myoblasts to osteoblastic cells (Hisa et al.,
2011; Tanaka et al., 2012).
The probably best-characterized tumor suppressor gene TP53, though not reaching
a significant level, is upregulated in the highly migrative versus non-migrative
osteosarcoma cell lines in this study. Introducing this work, I already described that
TP53 has been found altered in osteosarcoma repeatedly (see section molecular
miRNA expression in osteosarcoma Discussion
87
genetics). Its influence on migration, invasion and metastasis forming in cancer in
general has been reported to be significant as well (Muller et al., 2011).
5.5. Comprehensive microRNA-mRNA network analysis based on
phenotype
By using the integrative approach, based on the Peng et al. publication, two large
networks have been identified for each group (Peng et al., 2009b). These were
merged for both the migration/invasion and the proliferation group because they
comprised overlapping molecules each. The original analytical method was
modified. The expression matrices of all the cell lines were used for testing mRNA
and microRNA for negative correlation. The pre-selection of only differentially
expressed microRNA, as it has been done by the Peng group, was not done in my
work. It was assumed that microRNAs disable the expression of their target mRNA.
The miRDB prediction database was used to identify likely biologic relationships.
Using this approach described by Peng et al. a number of bipartite networks were
identified and fed into the Ingenuity Pathway Analysis tool for illustrating the
biological context of the respective microRNA-mRNA-coupling.
In the following section the two largest proliferation and migration networks (as
demonstrated in figures 19 and 22) will be discussed further.
Proliferation network
The top-rated networks resulting from the IPA query for proliferation were
connective tissue disorders, inflammatory disease and response (score 37) and
cellular development, cellular growth and proliferation and cancer (score 19). These
two networks were merged and displayed in figure 19 on page 64.
One of the central nodes in this figure is the so called “Guardian of the Genome”
TP53 (Lane, 1992). This is line with its known role as tumor suppressor gene
regulating cell divison and proliferation in all kinds of cancer. I found it, though not
reaching significant level, differentially expressed in migrative versus non-migrative
cell lines.
miRNA expression in osteosarcoma Discussion
88
Furthermore, in the earlier analyses, I identified numerous microRNA (e.g. miR-34a)
deregulated that are knowingly targeted by or target TP53. In this network the miR-
21, miR-30c-5p and the miR-130 (=miR-130a) are frequently upregulated and
directly targeted by TP53. Underexpressed target molecules of TP53 are the miR-19
and miR-30* (comprising the miR-30b and d). Considering the fact that TP53 is
known as a protector from a cell’s development to cancer it is remarkable to see
that its targeting of microRNA in my study leads to deregulation in both ways. Not
only is TP53 a target of hundreds of microRNA but it reciprocally regulates the
processing/transcription of microRNA (Boominathan, 2010).
The deregulation of (onco)mir-21 has been shown in nearly all sorts of cancer. Its
knock-down or suppression demonstrably results in inhibition of cell proliferation
and its overexpression on the other hand to cancer progression and metastasis
(Esquela-Kerscher and Slack, 2006b).
This is in line with this work’s findings as I see the miR-21 upregulated in the
proliferation network and therefore show its relevance in osteosarcoma cell lines.
AHR is one of the molecules upregulated in our proliferation network.
The AHR, the Aryl hydrocarbon receptor, a ligand-activated transcription factor and
its heterodimeric counterpart, the aryl hydrocarbon receptor nuclear translocator
(ARNT), build together the so called aryl hydrocarbon receptor complex (AhRC)
(Beischlag et al., 2008). AHR has been described to regulate the expression of
numerous genes. Thereby it is an interesting fact that many cancerogenous
pollutants and other environmental factors (e.g. EBV) seem to be activating the
receptor (Chopra and Schrenk, 2011; Inoue et al., 2012). Moreover, it has been
found to inhibit the transcription of MYC in breast tumors (Yang et al., 2005).
The Estrogen receptor 1 (ESR1) is one of the central nodes of the created IPA
network. It is known for its involvement mainly in breast cancer and other
gynecological cancers (Chen et al., 2008). Prior studies have examined and proven
the correlation of osteosarcoma and the Estrogen pathway Musselman et al., 2012;
Stossi et al., 2004). Though not deregulated in the osteosarcoma cell lines, the
Estrogen Receptor Gene (ESR) shows direct and indirect connections to various
miRNA expression in osteosarcoma Discussion
89
molecules in the Proliferation network (TP53, miR-21, miR-181a etc.) This is
consistent with the assumption that hormonal (especially estrogenic) changes,
extensive skeletal growth and the underlying genetic and epigenetic alterations are
highly related to the incidence peek of osteosarcoma at age 10-19 (Savage and
Mirabello, 2011).
I was able to show miR-181a and miR-186 differentially expressed when
proliferative and non-proliferative osteosarcoma cell lines were compared. That
these two microRNAs appear in the proliferation network, though based on a
different approach, backs up the solidity of my analysis.
CAMK2N1 has been shown downregulated when comparing the osteosarcoma cell
lines with the references in the very beginning. This seems to be in contradiction
with the upregulation in the proliferation network. But one has to take into
consideration that the analysis here was different from the other. In a one-by-one
comparison of osteosarcoma cell lines and precursor cells the CAMK2N1 showed
lower expression. However, the integrative analysis resulting in the genes’
overexpression in the network focused on the expression in osteosarcoma cell lines
with high growth potential only.
The miR-17, miR-20a and miR-106a belong to the well-described oncogenic cluster
17-92 which turned up with 5 members upregulated in the same analysis. Its
representation in this proliferation network with three members shows once again
its relevance in osteosarcoma pathogenesis or osteosarcoma cell proliferation,
respectively.
Migration/Invasion network
The two top-rated networks cellular development, reproductive system disease,
cellular growth and proliferation (score 28) and reproductive system disease,
cellular development, genetic disorder (score 22) were merged and displayed by
means of the IPA software (see figure 22).
MYC is, as well as TP53, a central molecule in this network. Although not
differentially expressed between the two groups in this study, it seems to have a
central role in the migration/invasion of osteosarcoma cells, as some of the
miRNA expression in osteosarcoma Discussion
90
downstream targets and interacting proteins are differentially expressed. The fact
that amplification of MYC (c-myc previously) has been observed repeatedly in
osteosarcoma has already been discussed in earlier.
I have outlined its connection to the miR-17/92-cluster, as I found 5 of its members
(miR-17, miR-18a, miR-93, miR-106a and b) to be differentially expressed when
compared to reference non-cancer cell lines. Quite recently, Arabi et al.
demonstrated the regulative effect that MYC has in these miR-17/92 members in
analogy to the proliferation network discussed before (Arabi et al., 2014). This adds
up since the one of the top rated networks includes cellular growth and
proliferation.
As depicted in the network, MYC directly acts on GJA1 (Gap junction protein alpha
1), which is downregulated frequently in proliferative versus non-proliferative
osteosarcoma cell lines.
Gap junction proteins (connexins) are integral proteins in the cell membrane and
responsible for cell-to-cell communication and transfer of ions and metabolites.
Gap junction protein alpha 1 (GJA1), that is also known as Connexin 43, is probably
the best-described family member. Interestingly, it has been shown to be a
suppressor of proliferation in the osteosarcoma cell line U2OS (Zhang et al., 2001).
Only recently, another study, examining potential biomarkers for osteosarcoma
surveillance, reported GJA1 to be differentially expressed between osteosarcoma
and normal tissue samples (Wu et al., 2014).
This supports the findings in this study, as GJA1 is differentially expressed, e.g.
upregulated in the non-proliferative cell lines. Furthermore, one has to note its
connectivity to three microRNAs that are frequently upregulated in the network:
miR-17*(=miR-106a, miR-17 and miR-20a), miR-23 and miR-101. Hence, GJA1 seems
to have a distinct effect in this regulatory module for osteosarcoma
migration/invasion and proliferation.
It was beyond the scope of this work to discuss all the molecules represented in the
networks. In fact, I intended to elucidate the miR-mRNA-interactions in
osteosarcoma cell proliferation and migration/invasion. These basic features
hypothetically define the aggressiveness of a cancer. So I focused more on the

miRNA expression in osteosarcoma Discussion
91
connectivity of the deregulated microRNAs and genes with known tumor
suppressors and oncogenes (TP53, MYC, MET etc.) to give further insight into the
complex mechanism of osteosarcoma development.
Finding several microRNAs (miR-181a, miR-186, the miR-17-92-cluster) and genes
(CAMK2N1, TP53) repeatedly, though using different analytical approaches,
underlines the solidity and reliability of this work.
miRNA expression in osteosarcoma Summary and conclusion
92
6. Summary and conclusion
The history of treatment in childhood cancer is a story of success; this is especially
true for lymphoblastic leukemia or lymphoma. In contrast to these malignancies
osteosarcoma is a cancer type that is still characterized by a high mortality. Even
with the actual multimodal treatment regime, a 5-year-survival rate of ~70% could
not be improved. In recurrent disease this number is even considerably lower (30%)
The main reason may lie in its pattern of molecular and chromosomal changes: they
are highly complex and not yet fully understood.
The search for novel therapy strategies and biomarkers for surveillance/earlier
diagnosis of osteosarcoma relapse is ongoing but could not yet provide a clinically
applicable result. The importance of microRNA in regulating not only physiological
cell function but also progression to cancer has been described extensively over the
past years. It has been indicated that microRNA dysregulation may play a major role
in osteosarcoma development. Whether microRNA are useful biomarkers in this
bone tumor has not been finally proven yet.
Therefore the goal of this study was to provide a comprehensive analysis of
microRNA and their targets in osteosarcoma. Hereby, eight established
osteosarcoma cell lines have been used as study material. Human osteoblasts and
mesenchymal stem cells have served as references.
First I compared the expression of osteosarcoma cells and the reference cell lines
for both microRNA and mRNA separately. By this means, I discovered a subset of
microRNA distinguishing between osteosarcoma and normal tissue (e.g. 17-92-
cluster). Among this subset, the miR-34a might serve as differentiation marker for
osteoblasts.
Moreover, using conventional association testing, I identified deregulated
microRNA (e.g.181-family, let-7-family) and their potential target genes (among
them CDKN2A, TMEM19) significantly correlating with the osteosarcoma cell lines’
potential to proliferate, migrate and invade, respectively.
In a more sophisticated analytical approach the expression matrices of both
microRNA and mRNA have been utilized to find gene regulatory networks. To
identify real biologically active mRNA-microRNA-systems (for proliferation and
miRNA expression in osteosarcoma Summary and conclusion
93
migration/invasion of osteosarcoma) I validated the microR-mRNA-couples that are
deregulated between the groups in the prediction database miRdb. Subsequently,
networks for proliferation and migration/invasion were created against the
background of canonical pathways in cancer and disease. I demonstrated several
well-described microRNA (e.g. miR-21, miR-181-family) not only to be deregulated
in osteosarcoma but additionally involved in a network of well-characterized
oncogenes (MYC) and tumor suppressor (TP53) genes.
A first validation of these results has been initialized by transfection of the miRNA-
181a-inhibitor into the osteosarcoma cells. A solid proof of biological relevance
though has not been accomplished yet and is subject of further research. To
validate my results in primary tumor material and to correlate this with patient data
has to be the next step.
miRNA expression in osteosarcoma Perspective
94
7. Perspective
Further experiments to further elucidate the role of microRNA in osteosarcoma
have to be done. This includes comprehensive transfection experiments of
candidate microRNAs combined in primary osteosarcoma samples and follow up
measurements of expression changes after transfection (quantification by RT-PCR,
western blot etc.) for both microRNA and gene expression. The use of stable
transfection systems has to be considered.
A sequencing of microRNA and gene expression in patient material is necessary to
compare differences in expression profiles and to correlate this with patient data
(different disease states, histology type, gender, age and localization to name only
some of the important data). When a number of miRNA has been identified as
biologically active in osteosarcoma the establishment of blood testing for microRNA
expression is desirable. Thus, the goal would be to take blood routinely at
examination points outlined in treatment protocol.
It is rather unlikely that a malignoma with such a bandwidth of genetic changes as
already found in Osteosarcoma can be attributed to deregulation of a single
microRNA. The key might be to use a panel of interesting miRNA for stratification
of, for example, the risk for developing metastases in osteosarcoma. A molecular
stratification in addition to traditional histopathology characteristics, as it is clinical
routine in leukemia or breast cancer, should be the objective.
The frequently growing amounts of data about osteosarcoma pathogenesis (genetic
and epigenetic alterations, copy number changes etc.) should be collected and to be
made accessible. The osteosarcoma database that was mentioned, introducing this
work, is the first one realizing this in a comprehensive manner. A further
development of such databases and osteosarcoma data collection in general has to
be the goal in order to bundle knowledge in this area and to facilitate the
development of new therapeutic options.

miRNA expression in osteosarcoma Bibliography
95
8. Bibliography
Aguda, B.D., Kim, Y., Piper-Hunter, M.G., Friedman, A., and Marsh, C.B. (2008). MicroRNA
regulation of a cancer network: consequences of the feedback loops involving miR-17-92,
E2F, and Myc. Proc. Natl. Acad. Sci. U. S. A. 105, 19678–19683.
Al-Romaih, K., Bayani, J., Vorobyova, J., Karaskova, J., Park, P.., Zielenska, M., and Squire,
J.. (2003). Chromosomal instability in osteosarcoma and its association with centrosome
abnormalities. Cancer Genet. Cytogenet. 144, 91–99.
Ambros, V. (2004). The functions of animal microRNAs. Nature 431, 350–355.
Amir, S., Ma, A.H., Shi, X.B., Xue, L., Kung, H.J., and deVere White, R.W. (2013). Oncomir
miR-125b Suppresses p14ARF to Modulate p53-Dependent and p53-Independent Apoptosis in Prostate Cancer. PLoS One 8, e61064.
Arabi, L., Gsponer, J.R., Smida, J., Nathrath, M., Perrina, V., Jundt, G., Ruiz, C., Quagliata,
L., and Baumhoer, D. (2014). Upregulation of the miR-17-92 cluster and its two paraloga in osteosarcoma – reasons and consequences. Gene and Cancer, Vol 5
Araki, N Uchida, A. (1991). Involvement of the retinoblastoma gene in primary
osteosarcomas and other bone and soft-tissue tumors. Clin. Orthop. Relat. Res. 270, 271–277.
Aranha, M.M., Santos, D.M., Solá, S., Steer, C.J., Rodrigues, C.M.P. (2011). miR-34a
regulates mouse neural stem cell differentiation. PLoS One 6, e21396.
Asangani, I.A., Rasheed, S.A.K., Nikolova, D.A., Leupold, J.H., Colburn, N.H., Post, S., and
Allgayer, H. (2008). MicroRNA-21 (miR-21) post-transcriptionally downregulates tumor
suppressor Pdcd4 and stimulates invasion, intravasation and metastasis in colorectal cancer. Oncogene 27, 2128–2136.
Baldessari, D., Badaloni, A., Longhi, R., Zappavigna, V., and Consalez, G.G. (2004).
MAB21L2, a vertebrate member of the Male-abnormal 21 family, modulates BMP signaling and interacts with SMAD1. BMC Cell Biol. 5, 48.
Baranwal, S., and Alahari, S. (2009). miRNA control of tumor cell invasion and metastasis.
Int. J. Cancer J. Int. Du Cancer 126, 1283–1290.
Bartel, D.P. (2004). MicroRNAs : Genomics , Biogenesis , Mechanism , and Function. 116,
281–297.
Bartel, D.P., and Chen, C.-Z. (2004). Micromanagers of gene expression: the potentially
widespread influence of metazoan microRNAs. Nat. Rev. Genet. 5, 396–400.
miRNA expression in osteosarcoma Bibliography
96
Baumhoer, D., Smida, J., Specht, K., Bink, K., Quintanilla-Martinez, L., Rosemann, M.,
Siggelkow, H., Nathrath, W.B., Atkinson, M.J., Bielack, S., et al. (2011). Aberrant
expression of the human epidermal growth factor receptor 2 oncogene is not a common
feature in osteosarcoma. Hum Pathol 42, 859–866.
Bayani, J., Zielenska, M., Pandita, A., Al-Romaih, K., Karaskova, J., Harrison, K., Bridge, J. a,
Sorensen, P., Thorner, P., and Squire, J. a (2003). Spectral karyotyping identifies recurrent
complex rearrangements of chromosomes 8, 17, and 20 in osteosarcomas. Genes. Chromosomes Cancer 36, 7–16.
Beischlag, T. V, Luis Morales, J., Hollingshead, B.D., and Perdew, G.H. (2008). The aryl
hydrocarbon receptor complex and the control of gene expression. Crit. Rev. Eukaryot. Gene Expr. 18, 207–250.
Benassi, M., and Molendini, L. (1999). Alteration of pRb/p16/cdk4 regulation in human
osteosarcoma. Int. J. Cancer 493, 489–493.
Benassi, M.S., Molendini, L., Gamberi, G., Magagnoli, G., Ragazzini, P., Gobbi, G.A.,
Sangiorgi, L., Pazzaglia, L., Asp, J., Brantsing, C., et al. (2001). Involvement of INK4A gene
products in the pathogenesis and development of human osteosarcoma. Cancer 92, 3062–3067.
Bielack, S., Jürgens, H., Jundt, G., Kevric, M., Kühne, T., Reichardt, P., Zoubek, A., Werner,
M., Winkelmann, W., and Kotz, R. (2009). Osteosarcoma: The COSS experience. In Cancer Treatment and Research, pp. 289–308.
Bielack, S.S., Kempf-Bielack, B., Delling, G., Exner, G.U., Flege, S., Helmke, K., Kotz, R.,
Salzer-Kuntschik, M., Werner, M., Winkelmann, W., et al. (2002). Prognostic factors in
high-grade osteosarcoma of the extremities or trunk: an analysis of 1,702 patients treated
on neoadjuvant cooperative osteosarcoma study group protocols. J. Clin. Oncol. 20, 776–
790.
Billiau, A., and Edy, V. (1977). Human interferon: mass production in a newly established
cell line, MG-63. Antimicrob. Agentsand Chemotherapy 12, 11–15.
Boehm, A., and Neff J.R., Squire J.A., Bayani J., N.M.B.J.A. (2000). Literature, Cytogenetic
Findings in 36 Osteosarcoma specimens and a review of the. Pediatr. Pathol. Mol. Med.
19, 359–376.
Boominathan, L. (2010). The tumor suppressors p53, p63, and p73 are regulators of microRNA processing complex. PLoS One 5, e10615.
Boyerinas, B., Park, S.-M., Hau, A., Murmann, A.E., and Peter, M.E. (2010). The role of let-
7 in cell differentiation and cancer. Endocr. Relat. Cancer 17, F19–F36.
miRNA expression in osteosarcoma Bibliography
97
Bridge, J. a., Nelson, M., McComb, E., McGuire, M.H., Rosenthal, H., Vergara, G., Maale,
G.E., Spanier, S., and Neff, J.R. (1997). Cytogenetic findings in 73 osteosarcoma specimens
and a review of the literature. Cancer Genet. Cytogenet. 95, 74–87.
Bu, P., Chen, K., Chen, J., Wang, L., and Walters, J. (2013). A microRNA miR-34a-regulated
bimodal switch targets notch in colon cancer stem cells. Cell Stem Cell 12, 602–615.
Cai, C.K., Zhao, G.Y., Tian, L.Y., Liu, L., Yan, K., Ma, Y.L., Ji, Z.W., Li, X.X., Han, K., Gao, J., et
al. (2012). miR-15a and miR-16-1 downregulate CCND1 and induce apoptosis and cell
cycle arrest in osteosarcoma. Oncol. Rep. 28, 1764–1770.
Cai, J., Wu, J., Zhang, H., Fang, L., Huang, Y., Yang, Y., Zhu, X., Li, R., and Li, M. (2013). MiR-
186 downregulation correlates with poor survival in lung adenocarcinoma, where it
interferes with cell-cycle regulation. Cancer Res. 73, 756–766.
Calin, G.A., and Croce, C.M. (2006a). MicroRNA-cancer connection: the beginning of a
new tale. Cancer Res. 66, 7390–7394.
Calin, G.A., and Croce, C.M. (2006b). MicroRNA signatures in human cancers. Nat. Rev. Cancer 6, 857–866.
Calin, G.A., Dumitru, C.D., Shimizu, M., Bichi, R., Zupo, S., Noch, E., Aldler, H., Rattan, S.,
Keating, M., Rai, K., et al. (2002). Frequent deletions and down-regulation of micro- RNA
genes miR15 and miR16 at 13q14 in chronic lymphocytic leukemia. Proc. Natl. Acad. Sci.
U. S. A. 99, 15524–15529.
Calin, G.A., Sevignani, C., Dumitru, C.D., Hyslop, T., Noch, E., Yendamuri, S., Shimizu, M.,
Rattan, S., Bullrich, F., Negrini, M., et al. (2004). Human microRNA genes are frequently
located at fragile sites and genomic regions involved in cancers. Proc. Natl. Acad. Sci. U. S.
A. 101, 2999–3004.
Carrle D, Bielack, S. (2007). Diagnostik und multimodales Therapiekonzept des
Osteosarkoms. Ärztliches J. Onkol. 34–38.
Chen, G.G., Zeng, Q., and Tse, G.M.K. (2008). Estrogen and Its Receptors in Cancer.Medicinal Research Reviews 28, 954–974.
Chen, J., Feilotter, H.E., Paré, G.C., Zhang, X., Pemberton, J.G.W., Garady, C., Lai, D., Yang,
X., and Tron, V.A. (2010). MicroRNA-193b represses cell proliferation and regulates cyclin
D1 in melanoma. Am. J. Pathol. 176, 2520–2529.
Chen, L., Holmstrøm, K., Qiu, W., and Ditzel, N. (2014). MicroRNA-34a Inhibits Osteoblast
Differentiation and In Vivo Bone Formation of Human Stromal Stem Cells. Stem Cells 32,
902–912.
Chen, X., Guo, X., Zhang, H., Xiang, Y., Chen, J., Yin, Y., Cai, X., Wang, K., Wang, G., Ba, Y.,
et al. (2009). Role of miR-143 targeting KRAS in colorectal tumorigenesis. Oncogene 28,
1385–1392.
miRNA expression in osteosarcoma Bibliography
98
Cheng, Y.Y., Huang, L., Lee, K.M., Li, K., and Kumta, S.M. (2004). Alendronate regulates cell
invasion and MMP-2 secretion in human osteosarcoma cell lines. Pediatr. Blood Cancer
42, 410–415.
Chopra, M., and Schrenk, D. (2011). Dioxin toxicity, aryl hydrocarbon receptor signaling,
and apoptosis-persistent pollutants affect programmed cell death. Crit. Rev. Toxicol. 41, 292–320.
Cole, K. a, Attiyeh, E.F., Mosse, Y.P., Laquaglia, M.J., Diskin, S.J., Brodeur, G.M., and Maris,
J.M. (2008). A functional screen identifies miR-34a as a candidate neuroblastoma tumor suppressor gene. Mol. Cancer Res. 6, 735–742.
Croce, C.M. (2009). Causes and consequences of microRNA dysregulation in cancer. Nat.
Rev. Genet. 10, 704–714.
Dang, C. V. (2012). MYC on the path to cancer. Cell 149, 22–35.
Van Dartel, M., and Hulsebos, T.J.M. (2004). Amplification and overexpression of genes in
17p11.2 ~ p12 in osteosarcoma. Cancer Genet. Cytogenet. 153, 77–80.
Dylla, L., and Jedlicka, P. (2013). Growth-promoting role of the miR-106a~363 cluster in
Ewing sarcoma. PLoS One 8, e63032.
Eguchi, T., Watanabe, K., Hara, E.S., Ono, M., Kuboki, T., and Calderwood, S.K. (2013).
OstemiR: a novel panel of microRNA biomarkers in osteoblastic and osteocytic
differentiation from mesencymal stem cells. PLoS One 8, e58796.
Enard, W., Przeworski, M., Fisher, S.E., Lai, C.S.L., Wiebe, V., Kitano, T., Monaco, A.P., and
Pääbo, S. (2002). Molecular evolution of FOXP2, a gene involved in speech and language.
Nature 418, 869–872.
Esquela-Kerscher, A., and Slack, F.J. (2006a and b). Oncomirs - microRNAs with a role in cancer. Nat. Rev. Cancer 6, 259–269.
Evdokiou, a, Labrinidis, a, Bouralexis, S., Hay, S., and Findlay, D.. (2003). Induction of cell
death of human osteogenic sarcoma cells by zoledronic acid resembles anoikis. Bone 33, 216–228.
Fakharzadeh, S.S., Trusko, S.P., and George, D.L. (1991). Tumorigenic potential associated
with enhanced expression of a gene that is amplified in a mouse tumor cell line. EMBO J. 10, 1565–1569.
Fletcher, J.A., Gebhardt, M.C., and Kozakewich, H.P. (1994). Cytogenetic aberrations in
osteosarcomas. Nonrandom deletions, rings, and double-minute chromosomes. Cancer
Genet. Cytogenet. 77, 81–88.
Fogh, J., Fogh, J.M., and Orfeo, T. (1977). One hundred and twenty-seven cultured human
tumor cell lines producing tumors in nude mice. J. Natl. Cancer Inst. 59, 221–226.
miRNA expression in osteosarcoma Bibliography
99
Frankel, L.B., Christoffersen, N.R., Jacobsen, A., Lindow, M., Krogh, A., and Lund, A.H.
(2008). Programmed cell death 4 (PDCD4) is an important functional target of the
microRNA miR-21 in breast cancer cells. J. Biol. Chem. 283, 1026–1033.
Friedl, P., and Wolf, K. (2003). Tumour-cell invasion and migration: diversity and escape
mechanisms. Nat. Rev. Cancer 3, 362–374.
Friend, S., Weinberg, R., Rapaport, J., and Albert, D. (1986). A human DNA segment with
properties of the gene that predisposes to retinoblastoma and osteosarcoma. Nature.
323, 643-646
Fromigué, O., Hamidouche, Z., and Marie, P.J. (2008). Blockade of the RhoA-JNK-c-Jun-
MMP2 cascade by atorvastatin reduces osteosarcoma cell invasion. J. Biol. Chem. 283,
30549–30556.
Galluzzi, L., Morselli, E., Vitale, I., Kepp, O., Senovilla, L., Criollo, A., Servant, N., Paccard,
C., Hupé, P., Robert, T., et al. (2010). miR-181a and miR-630 regulate cisplatin-induced
cancer cell death. Cancer Res. 70, 1793–1803.
Gamberi, G., Benassi, M.S., Bohling, T., Ragazzini, P., Molendini, L., Sollazzo, M.R.,
Pompetti, F., Merli, M., Magagnoli, G., Balladelli, A., et al. (1998). C-myc and c-fos in
human osteosarcoma: Prognostic value of mRNA and protein expression. Oncology 55, 556–563.
Gao, J., Yang, T., Han, J., Yan, K., Qiu, X., Zhou, Y., Fan, Q., and Ma, B. (2011). MicroRNA
expression during osteogenic differentiation of human multipotent mesenchymal stromal cells from Bone Marrow. J. Cell. Biochem. 112, 1844–1856.
Gokgoz, N., Wunder S., et al. (2001). Comparison of p53 Mutations in Patients with
Localized Osteosarcoma and metastatic osteosarcoma. Cancer 416, 2181-2189
Gorlick, B.R., Huvos, A.G., Heller, G., Aledo, A., Beardsley, G.P., Healey, J.H., and Meyers,
P.A. (1999). Expression of HER2/erbB-2 correlates with survival in Osteosarcoma. Journal
of Clinical Oncology 17, 2781–2788.
Gougelet, A., Pissaloux, D., Besse, A., Perez, J., Duc, A., Dutour, A., Blay, J.-Y., and Alberti,
L. (2011). Micro-RNA profiles in osteosarcoma as a predictive tool for ifosfamide
response. Int. J. Cancer 129, 680–690.
Greshock, J., Nathanson, K., Martin, A.-M., Zhang, L., Coukos, G., Weber, B.L., and Zaks,
T.Z. (2007). Cancer cell lines as genetic models of their parent histology: analyses based
on array comparative genomic hybridization. Cancer Res. 67, 3594–3600.
Griffiths-Jones, S. (2004). The microRNA Registry. Nucleic Acids Res. 32, D109–11.
Griffiths-Jones, S., Saini, H.K., van Dongen, S., and Enright, A.J. (2008). miRBase: tools for
microRNA genomics. Nucleic Acids Res. 36, D154–8.

miRNA expression in osteosarcoma Bibliography
100
Grosshans, H., and Filipowicz, W. (2008). Molecular biology: the expanding world of small
RNAs. Nature 451, 414–416.
Halbrooks, P.J., Ding, R., Wozney, J.M., and Bain, G. (2007). Role of RGM coreceptors in
bone morphogenetic protein signaling. J. Mol. Signal. 2, 4.
Harada, S., and Rodan, G.A. (2003). Control of osteoblast function and regulation of bone
mass. Nature 423, 349–355.
Hayashita, Y., Osada, H., Tatematsu, Y., Yamada, H., Yanagisawa, K., Tomida, S., Yatabe, Y.,
Kawahara, K., Sekido, Y., and Takahashi, T. (2005). A polycistronic MicroRNA cluster, miR-
17-92, is overexpressed in human lung cancers and enhances cell proliferation. Cancer
Res. 65, 9628–9632.
He, L., and Hannon, G.J. (2004). MicroRNAs: small RNAs with a big role in gene regulation. Nat. Rev. Genet. 5, 522–531.
He, C., Xiong, J., Xu, X., Lu, W., Liu, L., Xiao, D., and Wang, D. (2009). Functional
elucidation of MiR-34 in osteosarcoma cells and primary tumor samples. Biochem. Biophys. Res. Commun. 388, 35–40.
He, L., Thomson, J.M., Hemann, M.T., Hernando-Monge, E., Mu, D., Goodson, S., Powers,
S., Cordon-Cardo, C., Lowe, S.W., Hannon, G.J., et al. (2005). A microRNA polycistron as a potential human oncogene. Nature 435, 828–833.
Heldin, C., Johnsson, A., and Wennergren, S. (1986). A human osteosarcoma cell line
secretes a growth factor structurally related to a homodimer of PDGF A-chains. Letters to Nature, 319, 511-514.
Heremans, H., Billiau, A., Cassiman, J.J., Mulier, J.C., and de Somer, P. (1978). In vitro
cultivation of human tumor tissues. II. Morphological and virological characterization of three cell lines. Oncology 35, 246–252.
Hermeking, H., Rago, C., Schuhmacher, M., Li, Q., Barrett, J.F., Obaya, A.J., O’Connell, B.C.,
Mateyak, M.K., Tam, W., Kohlhuber, F., et al. (2000). Identification of CDK4 as a target of c-MYC. Proc. Natl. Acad. Sci. U. S. A. 97, 2229–2234.
Hisa, I., Inoue, Y., Hendy, G.N., Canaff, L., Kitazawa, R., Kitazawa, S., Komori, T., Sugimoto,
T., Seino, S., and Kaji, H. (2011). Parathyroid hormone-responsive Smad3-related factor,
Tmem119, promotes osteoblast differentiation and interacts with the bone
morphogenetic protein-Runx2 pathway. J. Biol. Chem. 286, 9787–9796.
Holleville, N., Matéos, S., Bontoux, M., Bollerot, K., and Monsoro-Burq, A. (2007). Dlx5
drives Runx2 expression and osteogenic differentiation in developing cranial suture
mesenchyme. Dev. Biol. 304, 860–874.
miRNA expression in osteosarcoma Bibliography
101
Honda, R., Lowe, E.D., Dubinina, E., Skamnaki, V., Cook, A., Brown, N.R., and Johnson, L.N.
(2005). The structure of cyclin E1/CDK2: implications for CDK2 activation and CDK2-
independent roles. EMBO J. 24, 452–463.
Huang, D.W., Sherman, B.T., and Lempicki, R. a (2009). Systematic and integrative analysis
of large gene lists using DAVID bioinformatics resources. Nat. Protoc. 4, 44–57.
Huang, G., Nishimoto, K., Zhou, Z., Hughes, D., and Kleinerman, E.S. (2012). miR-20a
encoded by the miR-17-92 cluster increases the metastatic potential of osteosarcoma
cells by regulating fas expression. Cancer Res. 72, 908–916.
Ide, Y., Miyoshi, E., Nakagawa, T., Gu, J., Tanemura, M., Nishida, T., Ito, T., Yamamoto, H.,
Kozutsumi, Y., and Taniguchi, N. (2006). Aberrant expression of N-
acetylglucosaminyltransferase-IVa and IVb (GnT-IVa and b) in pancreatic cancer. Biochem. Biophys. Res. Commun. 341, 478–482.
Inoue, H., Mishima, K., Yamamoto-Yoshida, S., Ushikoshi-Nakayama, R., Nakagawa, Y.,
Yamamoto, K., Ryo, K., Ide, F., and Saito, I. (2012). Aryl hydrocarbon receptor-mediated
induction of EBV reactivation as a risk factor for Sjögren’s syndrome. J. Immunol. 188,
4654–4662.
Iorio, M. V., Ferracin, M., Liu, C.G., Veronese, A., Spizzo, R., Sabbioni, S., Magri, E.,
Pedriali, M., Fabbri, M., Campiglio, M., et al. (2005). MicroRNA gene expression
deregulation in human breast cancer. Cancer Res. 65, 7065–7070.
Isakoff, Harris, M.J., Gebhardt, M.C., and Grier, H.E. (2007). Bone Sarcomas. In Cancer in Adolescents and Young Adults, pp. 203–218.
Jia, S., Worth, L.L., and Kleinerman, E.S. (2000). A nude mouse model of human
osteosarcoma lung metastases for evaluating new therapeutic strategies. Clinical & Experimental Metastasis, 17, 501–506.
Johnson, S.M., Grosshans, H., Shingara, J., Byrom, M., Jarvis, R., Cheng, A., Labourier, E.,
Reinert, K.L., Brown, D., and Slack, F.J. (2005). RAS is regulated by the let-7 microRNA family. Cell 120, 635–647.
Jones, K.B., Salah, Z., Del Mare, S., Galasso, M., Gaudio, E., Nuovo, G.J., Lovat, F., LeBlanc,
K., Palatini, J., Randall, R.L., et al. (2012). miRNA signatures associate with pathogenesis and progression of osteosarcoma. Cancer Res. 72, 1865–1877.
Kager, L., Zoubek, A., Pötschger, U., Kastner, U., Flege, S., Kempf-Bielack, B., Branscheid,
D., Kotz, R., Salzer-Kuntschik, M., Winkelmann, W., et al. (2003). Primary metastatic
osteosarcoma: Presentation and outcome of patients treated on neoadjuvant
Cooperative Osteosarcoma Study Group protocols. J. Clin. Oncol. 21, 2011–2018.
Kapinas, K., Kessler, C., Ricks, T., Gronowicz, G., and Delany, A.M. (2010). miR-29
modulates Wnt signaling in human osteoblasts through a positive feedback loop. J. Biol.
Chem. 285, 25221–25231.
miRNA expression in osteosarcoma Bibliography
102
Kauer, M., Ban, J., Kofler, R., Walker, B., Davis, S., Meltzer, P., and Kovar, H. (2009). A
molecular function map of Ewing’s sarcoma. PLoS One 4, e5415.
Kim, V.N. (2005). MicroRNA biogenesis: coordinated cropping and dicing. Nat. Rev. Mol.
Cell Biol. 6, 376–385.
Kim, T.K., and Eberwine, J.H. (2010). Mammalian cell transfection: the present and the
future. Anal. Bioanal. Chem. 397, 3173–3178.
Kim, T., Kim, K., Lee, S.H., So, H.-S., Lee, J., Kim, N., and Choi, Y. (2009). Identification of
LRRc17 as a negative regulator of receptor activator of NF-kappaB ligand (RANKL)-induced osteoclast differentiation. J. Biol. Chem. 284, 15308–15316.
Klein, M.J., and Siegal, G.P. (2006). Osteosarcoma. Am. J. Clin. Pathol. 125, 555–581.
Kleinman, H.K., McGarvey, M.L., Hassell, J.R., Star, V.L., Cannon, F.B., Laurie, G.W., and
Martin, G.R. (1986). Basement membrane complexes with biological activity.
Biochemistry 25, 312–318.
Kong, Y.W., Cannell, I.G., de Moor, C.H., Hill, K., Garside, P.G., Hamilton, T.L., Meijer, H.A.,
Dobbyn, H.C., Stoneley, M., Spriggs, K.A., et al. (2008). The mechanism of micro-RNA-
mediated translation repression is determined by the promoter of the target gene. Proc.
Natl. Acad. Sci. U. S. A. 105, 8866–8871.
Kovar, H., Jug, G., Aryee, D.N., Zoubek, a, Ambros, P., Gruber, B., Windhager, R., and
Gadner, H. (1997). Among genes involved in the RB dependent cell cycle regulatory
cascade, the p16 tumor suppressor gene is frequently lost in the Ewing family of tumors. Oncogene 15, 2225–2232.
Kramer, N., Walzl, A., Unger, C., Rosner, M., Krupitza, G., Hengstschläger, M., and Dolznig,
H. (2013). In vitro cell migration and invasion assays. Mutat. Res. 752, 10–24.
Kresse, S.H., Rydbeck, H., Skarn, M., Namlos, H.M., Barragan-Polania, A.H., Cleton-Jansen,
A.M., Serra, M., Liestol, K., Hogendoorn, P.C., Hovig, E., et al. (2012). Integrative analysis
reveals relationships of genetic and epigenetic alterations in osteosarcoma. PLoS One 7, e48262.
Krichevsky, A.M., and Gabriely, G. (2009). miR-21: A small multi-faceted RNA. J. Cell. Mol.
Med. 13, 39–53.
Kuijjer, M.L., Rydbeck, H., Kresse, S.H., Buddingh, E.P., Lid, A.B., Roelofs, H., Bürger, H.,
Myklebost, O., Hogendoorn, P.C.W., Meza-Zepeda, L.A., et al. (2012). Identification of
osteosarcoma driver genes by integrative analysis of copy number and gene expression
data. Genes Chromosom. Cancer 51, 696–706.
Kwon, J.E., Kim, B.Y., Kwak, S.Y., Bae, I.H., and Han, Y.H. (2013). Ionizing radiation-
inducible microRNA miR-193a-3p induces apoptosis by directly targeting Mcl-1. Apoptosis
18, 896–909.
miRNA expression in osteosarcoma Bibliography
103
Lagos-Quintana, M., Rauhut, R., Meyer, J., Borkhardt, A., and Tuschl, T. (2003). New
microRNAs from mouse and human. RNA 9, 175–179.
Landgraf, P., Rusu, M., Sheridan, R., Sewer, A., Iovino, N., Aravin, A., Pfeffer, S., Rice, A.,
Kamphorst, A.O., Landthaler, M., et al. (2007). A Mammalian microRNA Expression Atlas
Based on Small RNA Library Sequencing. Cell 129, 1401–1414.
Lane, D. (1992). p53, guardian of the genome. Nature 358, 15–16.
Latchman, Y., Wood, C.R., Chernova, T., Chaudhary, D., Chernova, I., Iwai, Y., Long, A.J.,
Brown, J.A., Nunes, R., Greenfield, E.A., et al. (2001). PD-L2 is a second ligand for PD-1 and inhibits T cell activation. 2, 261–268.
Le, M.T.N., Shyh-Chang, N., Khaw, S.L., Chin, L., Teh, C., Tay, J., O’Day, E., Korzh, V., Yang,
H., Lal, A., et al. (2011). Conserved regulation of p53 network dosage by microRNA-125b occurs through evolving miRNA-target gene pairs. PLoS Genet. 7, e1002242.
Lee, A.F., Hayes, M.M., Lebrun, D., Espinosa, I., Nielsen, G.P., Rosenberg, A.E., and Lee, C.-
H. (2011). FLI-1 distinguishes Ewing sarcoma from small cell osteosarcoma and mesenchymal chondrosarcoma. Appl. Immunohistochem. Mol. Morphol. 19, 233–238.
Lee, R.C., Feinbaum, R.L., and Ambrost, V. (1993). The C . elegans Heterochronic Gene lin-
4 Encodes Small RNAs with Antisense Complementarity to & II-14. 75, 843–854.
Lee, Y., Jeon, K., Lee, J.T., Kim, S., and Kim, V.N. (2002). MicroRNA maturation: Stepwise
processing and subcellular localization. EMBO J. 21, 4663–4670.
Lee, Y., Ahn, C., Han, J., Choi, H., Kim, J., Yim, J., Lee, J., Provost, P., Rådmark, O., Kim, S.,
et al. (2003). The nuclear RNase III Drosha initiates microRNA processing. Nature 425,
415–419.
Lefort, K., Brooks, Y., Ostano, P., Cario-André, M., Calpini, V., Guinea-Viniegra, J., Albinger-
Hegyi, A., Hoetzenecker, W., Kolfschoten, I., Wagner, E.F., et al. (2013). A miR-34a-SIRT6
axis in the squamous cell differentiation network. EMBO J. 32, 2248–2263.
Li, X.-F., Yan, P.-J., and Shao, Z.-M. (2009). Downregulation of miR-193b contributes to
enhance urokinase-type plasminogen activator (uPA) expression and tumor progression
and invasion in human breast cancer. Oncogene 28, 3937–3948.
Liang, S., He, L., Zhao, X., Miao, Y., Gu, Y., Guo, C., Xue, Z., Dou, W., Hu, F., Wu, K., et al.
(2011). MicroRNA let-7f inhibits tumor invasion and metastasis by targeting MYH9 in
human gastric cancer. PLoS One 6, e18409.
Liu, L. hong, Li, H., Li, J. ping, Zhong, H., Zhang, H. chon, Chen, J., and Xiao, T. (2011). miR-
125b suppresses the proliferation and migration of osteosarcoma cells through down-
regulation of STAT3. Biochem. Biophys. Res. Commun. 416, 31–38.
miRNA expression in osteosarcoma Bibliography
104
Lockwood, W.W., Stack, D., Morris, T., Grehan, D., O'Keane, C., Stewart, G.L.,
Cumiskey, J., Lam, W.L., Squire, J.A., Thomas, D.M., et al. (2011). Cyclin E1 is amplified and
overexpressed in osteosarcoma. J. Mol. Diagnostics 13, 289–296.
Lonardo, F., Ueda, T., Huvos, A.G., Healey, J., and Ladanyi, M. (1997). p53 and MDM2
alterations in osteosarcomas: Correlation with clinicopathologic features and proliferative rate. Cancer 79, 1541–1547.
Long, F. (2011). Building strong bones: molecular regulation of the osteoblast lineage.
Nat. Rev. Mol. Cell Biol. 13, 27–38.
Long, X.H., Mao, J.H., Peng, A.F., Zhou, Y., Huang, S.H., and Liu, Z.L. (2013). Tumor
suppressive microRNA-424 inhibits osteosarcoma cell migration and invasion via targeting
fatty acid synthase. Exp. Ther. Med. 5, 1048–1052.
Longhi, A., and Pasini, A. (2005). Height as a risk factor for osteosarcoma. J. Pediatr.
Hematology/Oncology 27, 314-318.
Lu, J., Getz, G., Miska, E. a, Alvarez-Saavedra, E., Lamb, J., Peck, D., Sweet-Cordero, A.,
Ebert, B.L., Mak, R.H., Ferrando, A. a, et al. (2005). MicroRNA expression profiles classify
human cancers. Nature 435, 834–838.
Luu, H.H., Kang, Q., Jong, K.P., Si, W., Luo, Q., Jiang, W., Yin, H., Montag, A.G., Simon,
M.A., Peabody, T.D., et al. (2005a). An orthotopic model of human osteosarcoma growth
and spontaneous pulmonary metastasis. Clin. Exp. Metastasis 22, 319–329.
Luu, H.H., Kang, Q., Park, J.K., Si, W., Luo, Q., Jiang, W., Yin, H., Montag, A.G., Simon, M. a,
Peabody, T.D., et al. (2005b). An orthotopic model of human osteosarcoma growth and
spontaneous pulmonary metastasis. Clin. Exp. Metastasis 22, 319–329.
Ma, Q., Zhou, Y., Ma, B., Chen, X., Wen, Y., and Liu, Y. (2012). The clinical value of CXCR4, HER2 and CD44 in human osteosarcoma: A pilot study. Oncol.letters 3, 797–801.
Ma, S., Yang, Y., Wang, C., Hui, N., Gu, L., Zhong, H., Cai, Z., Wang, Q., Zhang, Q., Li, N., et
al. (2009). Endogenous human CaMKII inhibitory protein suppresses tumor growth by
inducing cell cycle arrest and apoptosis through down-regulation of the
phosphatidylinositide 3-kinase/Akt/HDM2 pathway. J. Biol. Chem. 284, 24773–24782.
Maire, G., Martin, J.W., Yoshimoto, M., Chilton-MacNeill, S., Zielenska, M., and Squire, J. a
(2011). Analysis of miRNA-gene expression-genomic profiles reveals complex mechanisms
of microRNA deregulation in osteosarcoma. Cancer Genet. 204, 138–146.
Maitra, A., Wanzer, D., Weinberg, A.G., and Ashfaq, R. (2001). Amplification of the HER-
2/neu oncogene is uncommon in pediatric osteosarcomas. Cancer 92, 677–683.
Man, T.-K., Lu, X.-Y., Jaeweon, K., Perlaky, L., Harris, C.P., Shah, S., Ladanyi, M., Gorlick, R.,
Lau, C.C., and Rao, P.H. (2004). Genome-wide array comparative genomic hybridization
analysis reveals distinct amplifications in osteosarcoma. BMC Cancer 4, 45.
miRNA expression in osteosarcoma Bibliography
105
Manara, M.C., Baldini, N., Serra, M., Lollini, P., Giovanni, C. De, Vaccari, M., Argnani, A.,
Benini, S., Maurici, D., Picci, P., et al. (2000). Reversal of Malignant Phenotype in Human
Osteosarcoma Cells Transduced With the Alkaline Phosphatase Gene. 26, 215–220.
Martin, J.W., Squire, J. a, and Zielenska, M. (2012). The genetics of osteosarcoma.
Sarcoma 2012, 627254.
Maul, R.S., and Chang, D.D. (1999). EPLIN, epithelial protein lost in neoplasm. Oncogene
18, 7838–7841.
McAllister, R., Gardner, M., and Greene, A. (1971). Cultivation in vitro of cells derived from a human osteosarcoma. Cancer 27, 397-402
Mertens, F., and Mandahl, N. (1993). Cytogenetic findings in 33 osteosarcomas. Int J.
Cancer 50, 44–50.
Michael, M.Z., O’ Connor, S.M., van Holst Pellekaan, N.G., Young, G.P., and James, R.J.
(2003). Reduced accumulation of specific microRNAs in colorectal neoplasia. Mol. Cancer
Res. 1, 882–891.
Miller, C., Aslo, A., Won, A., and Tan, M. (1996). Alterations of thep53, Rb andMDM2
genes in osteosarcoms. J. Cancer Research and Clinical Oncology 122, 559–565.
Mills, J., Matos, T., Charytonowicz, E., Hricik, T., Castillo-Martin, M., Remotti, F., Lee, F.Y.,
and Matushansky, I. (2009). Characterization and comparison of the properties of
sarcoma cell lines in vitro and in vivo. Hum. Cell 22, 85–93.
Mizuno, Y., Yagi, K., Tokuzawa, Y., Kanesaki-Yatsuka, Y., Suda, T., Katagiri, T., Fukuda, T.,
Maruyama, M., Okuda, A., Amemiya, T., et al. (2008). miR-125b inhibits osteoblastic
differentiation by down-regulation of cell proliferation. Biochem. Biophys. Res. Commun.
368, 267–272.
Mogilyansky, E., and Rigoutsos, I. (2013). The miR-17/92 cluster: a comprehensive update
on its genomics, genetics, functions and increasingly important and numerous roles in
health and disease. Cell Death Differ. 20, 1603–1614.
Mohseny, A.B., Machado, I., Cai, Y., Schaefer, K.-L., Serra, M., Hogendoorn, P.C.W.,
Llombart-Bosch, A., and Cleton-Jansen, A.-M. (2011). Functional characterization of
osteosarcoma cell lines provides representative models to study the human disease. Lab.
Invest. 91, 1195–1205.
Momand, J., Zambetti, G.P., Olson, D.C., George, D., and Levine, A.J. (1992). The mdm-2
oncogene product forms a complex with the p53 protein and inhibits p53-mediated
transactivation. Cell 69, 1237–1245.
Momand, J., Jung, D., Wilczynski, S., and Niland, J. (1998). The MDM2 gene amplification
database. Nucl Acids Research 26, 3453–3459.
miRNA expression in osteosarcoma Bibliography
106
Mu, G., Liu, H., Zhou, F., Xu, X., Jiang, H., Wang, Y., and Qu, Y. (2010). Correlation of
overexpression of HMGA1 and HMGA2 with poor tumor differentiation, invasion, and
proliferation associated with let-7 down-regulation in retinoblastomas. Hum. Pathol. 41,
493–502.
Muller, P. a J., Vousden, K.H., and Norman, J.C. (2011). P53 and Its Mutants in Tumor Cell Migration and Invasion. J. Cell Biol. 192, 209–218.
Musgrove, E. a, Caldon, C.E., Barraclough, J., Stone, A., and Sutherland, R.L. (2011). Cyclin
D as a therapeutic target in cancer. Nat. Rev. Cancer 11, 558–572.
Musselman, J.R.B., Bergemann, T.L., Ross, J.A., Sklar, C., Silverstein, K.A.T., and Erica, K.
(2012). Case-parent analysis of variation in pubertal hormone genes and pediatric
osteosarcoma : a Children ’ s Oncology Group ( COG ) study. International Journal of Molecular Epidemiology and Genetics 3, 286–293.
Nakajima, G., Hayashi, K., and Xi, Y. (2006). Non-coding MicroRNAs hsa-let-7g and hsa-
miR-181b are associated with Chemoresponse to S-1 in colon cancer. Cancer Genomics and Proteomics 3, 317–324.
Namløs, H.M., Meza-Zepeda, L. a, Barøy, T., Østensen, I.H.G., Kresse, S.H., Kuijjer, M.L.,
Serra, M., Bürger, H., Cleton-Jansen, A.-M., and Myklebost, O. (2012). Modulation of the osteosarcoma expression phenotype by microRNAs. PLoS One 7, e48086.
Nevins, J.R. (2001). The Rb / E2F pathway and cancer. Human Mol Genetics 10, 699–704.
Nielsen, G.P., Burns, K.L., Rosenberg, A.E., and Louis, D.N. (1998). CDKN2A Gene Deletions
and Loss of p16 Expression Occur in Osteosarcomas That Lack RB Alterations. The Am J
Path 153, 159–163.
Lo Nigro, C., Monteverde, M., Lee, S., Lattanzio, L., Vivenza, D., Comino, a, Syed, N.,
McHugh, a, Wang, H., Proby, C., et al. (2012). NT5E CpG island methylation is a favourable
breast cancer biomarker. Br. J. Cancer 107, 75–83.
Oliner, J., Kinzler, K., and Meltzer, P. (1992). Amplification of a gene encoding p53-associated protein in human sarcomas. Letters to Nature 358, 80-83
Olive, V., Jiang, I., and He, L. (2010). Mir-17-92, a cluster of miRNAs in the midst of the
cancer network. Int. J. Biochem. Cell Biol. 42, 1348–1354.
Ottaviani, G., and Jaffe, N. (2010). The epidemiology of osteosarcoma. Pediatr. Adolesc.
Osteosarcoma, Cancer Treatment and Research book chapter, 152, 3-13
Ottaviano, L., Schaefer, K., Gajewski, M., Huckenbeck, W., Baldus, S., Rogel, U.,
Mackintosh, C., Alava, E. De, Myklebost, O., Kresse, S.H., et al. (2010). Molecular
Characterization of Commonly Used Cell Lines for Bone Tumor Research : A Trans-
European EuroBoNet Effort. Genes, Chromos and Cancer 49, 40–51.

miRNA expression in osteosarcoma Bibliography
107
Overholtzer, M., Rao, P.H., Favis, R., Lu, X.-Y., Elowitz, M.B., Barany, F., Ladanyi, M.,
Gorlick, R., and Levine, A.J. (2003). The presence of p53 mutations in human
osteosarcomas correlates with high levels of genomic instability. Proc. Natl. Acad. Sci. U.
S. A. 100, 11547–11552.
Ozaki, T., Neumann, T., Wai, D., Schäfer, K., Valen, F. Van, Dockhorn-dworniczak, B.,
Horst, J., and Poremba, C. (2003). Chromosomal alterations in osteosarcoma cell lines
revealed by comparative genomic hybridization and multicolor karyotyping. Cancer
Genetics and Cytogenetics 140, 145–152.
Partin, J. V, Anglin, I.E., and Kyprianou, N. (2003). Quinazoline-based alpha 1-
adrenoceptor antagonists induce prostate cancer cell apoptosis via TGF-beta signalling
and I kappa B alpha induction. Br. J. Cancer 88, 1615–1621.
Pasquinelli, A.E., Reinhart, B.J., Slack, F., Martindale, M.Q., Kuroda, M.I., Maller, B.,
Hayward, D.C., Srinivasan, A., Fishman, M., Finnerty, J., et al. (2000). Conservation of the
sequence and temporal expression of let-7 heterochronic regulatory RNA. Nature 408, 1998–2001.
Pautke, C., Schieker, M., Tischer, T., Kolk, A., Neth, P., Mutschler, W., and Milz, S. (2004).
Characterization of osteosarcoma cell lines MG-63, Saos-2 and U-2 OS in comparison to human osteoblasts. Anticancer Res. 24, 3743–3748.
Peng, X., Li, Y., Walters, K.-A., Rosenzweig, E.R., Lederer, S.L., Aicher, L.D., Proll, S., and
Katze, M.G. (2009a). Computational identification of hepatitis C virus associated microRNA-mRNA regulatory modules in human livers. BMC Genomics 10, 373.
Peng, X., Li, Y., Walters, K.-A., Rosenzweig, E.R., Lederer, S.L., Aicher, L.D., Proll, S., and
Katze, M.G. (2009b). Computational identification of hepatitis C virus associated microRNA-mRNA regulatory modules in human livers. BMC Genomics 10, 373.
Pérez Piñero, C., Bruzzone, A., Sarappa, M.G., Castillo, L.F., and Lüthy, I.A. (2012).
Involvement of α2- and β2-adrenoceptors on breast cancer cell proliferation and tumour growth regulation. Br. J. Pharmacol. 166, 721–736.
Pillai, R.S., Bhattacharyya, S.N., Artus, C.G., Zoller, T., Cougot, N., Basyuk, E., Bertrand, E.,
and Filipowicz, W. (2005). Inhibition of translational initiation by Let-7 MicroRNA in human cells. Science 309, 1573–1576.
Ponten, J., and Saksela, E. (1967). Two established in vitro cell lines from human
mesenchymal tumours. Int. J. Cancer 447, 434–447.
Poos, K., Smida, J., Nathrath, M., Maugg, D., Baumhoer, D., and Korsching, E. (2013). How
MicroRNA and Transcription Factor Co-regulatory Networks Affect Osteosarcoma Cell
Proliferation. PLoS Comput. Biol. 9, e1003210.
Poos, K., Smida, J., Nathrath, M., Maugg, D., Baumhoer, D., Neumann, A., and Korsching,
E. (2014). Structuring osteosarcoma knowledge: an osteosarcoma-gene association

miRNA expression in osteosarcoma Bibliography
108
database based on literature mining and manual annotation. Database : the journal of
biological databases and curation (Oxford). 2014, 1-9
Potratz, J., Zoubek, a., and Bielack, S. (2006). Maligne Knochentumoren bei Kindern und
Jugendlichen. Monatsschrift Kinderheilkd. 154, 10–19.
Price, C.H.G. (1958). Primary bone-forming tumours and their relationship to skeletal
growth. J. Bone Jt. Surgery, Br. Vol. 40 B, 574–593.
Ramkissoon, L. a, Horowitz, P.M., Craig, J.M., Ramkissoon, S.H., Rich, B.E., Schumacher,
S.E., McKenna, A., Lawrence, M.S., Bergthold, G., Brastianos, P.K., et al. (2013). Genomic
analysis of diffuse pediatric low-grade gliomas identifies recurrent oncogenic truncating
rearrangements in the transcription factor MYBL1. Proc. Natl. Acad. Sci. U. S. A. 110,
8188–8193.
Rauhala, H.E., Jalava, S.E., Isotalo, J., Bracken, H., Lehmusvaara, S., Tammela, T.L.J., Oja,
H., and Visakorpi, T. (2010). miR-193b is an epigenetically regulated putative tumor
suppressor in prostate cancer. Int. J. Cancer 127, 1363–1372.
Reinhart, B.J., Slack, F.J., Basson, M., Pasquinelli, A.E., Bettinger, J.C., Rougvie, A.E.,
Horvitz, H.R., and Ruvkun, G. (2000). The 21-nucleotide let-7 RNA regulates
developmental timing in Caenorhabditis elegans. Nature 403, 901–906.
Rhim, J., Park, D., and Arnstein, P. (1975a). Transformation of human cells in culture by N-
methyl-N′-nitro-N-nitrosoguanidine.Nature 256, 751-753.
Rhim, J.S., Cho, H.Y., and Huebner, R.J. (1975b). Non-producer human cells induced by murine sarcoma virus. Int. J. Cancer 15, 23–29.
Rhim, J.S., Cho, H.Y., Vernon, M.L., Arnstein, P., Huebner, R.J., and Gilden, R. V (1975c).
Characterization of non-producer human cells induced by Kirsten sarcoma virus. Int. J. Cancer 16, 840–849.
Ritchie, M.E., Silver, J., Oshlack, A., Holmes, M., Diyagama, D., Holloway, A., and Smyth,
G.K. (2007). A comparison of background correction methods for two-colour microarrays. Bioinformatics 23, 2700–2707.
Roberts, W.M., Douglass, E.C., Peiper, S.C., Houghton, P.J., and Look, A.T. (1989).
Amplification of the gli Gene in Childhood Sarcomas Amplification of the gli Gene in
Childhood Sarcomas. Cancer Research 49, 5407–5413.
Rosemann, M., Kuosaite, V., and Nathrath, M. The genetics of radiation-induced and
sporadic osteosarcoma : a unifying theory ? Journal of radiological protection 22, 113-
116.
Ross, J., and Fletcher, J. (1998). The HER-2/neu Oncogene in Breast Cancer: Prognostic
Factor, Predictive Factor, and Target for Therapy. Oncologist 2, 237–252.

miRNA expression in osteosarcoma Bibliography
109
Roush, S., and Slack, F.J. (2008). The let-7 family of microRNAs. Trends Cell Biol. 18, 505–
516.
Ryoo, H.M., Hoffmann, H.M., Beumer, T., Frenkel, B., Towler, D.A., Stein, G.S., Stein, J.L.,
van Wijnen, A.J., and Lian, J.B. (1997). Stage-specific expression of Dlx-5 during osteoblast
differentiation: involvement in regulation of osteocalcin gene expression. Mol. Endocrinol. 11, 1681–1694.
Sakurai, T., Kondoh, N., Arai, M., Hamada, J. ichi, Yamada, T., Kihara-negishi, F., Izawa, T.,
Ohno, H., Yamamoto, M., and Oikawa, T. (2007). Functional roles of Fli-1, a member of
the Ets family of transcription factors, in human breast malignancy. Cancer Sci. 98, 1775–
1784.
Salzer-Kuntschik, M., and Delling, G. (1983). Morphological grades of regression in osteosarcoma after polychemotherapy. J. Cancer Res Clin Oncol 166, 21–24.
Samad, T.A., Rebbapragada, A., Bell, E., Zhang, Y., Sidis, Y., Jeong, S.J., Campagna, J.A.,
Perusini, S., Fabrizio, D.A., Schneyer, A.L., et al. (2005). DRAGON, a bone morphogenetic protein co-receptor. J. Biol. Chem. 280, 14122–14129.
Sandberg, A. a, and Bridge, J. a (2003). Updates on the cytogenetics and molecular
genetics of bone and soft tissue tumors: osteosarcoma and related tumors. Cancer Genet. Cytogenet. 145, 1–30.
Savage, S. a, and Mirabello, L. (2011). Using epidemiology and genomics to understand
osteosarcoma etiology. Sarcoma 2011, 548151.
Schauwecker, J., Weirich, G., Gradinger, R., and Rechl, H. (2006). Das Osteosarkom.
Orthopädie und Rheuma, 2002, 36-42.
Scotlandi, K., Manara, M.C., Hattinger, C.M., Benini, S., Perdichizzi, S., Pasello, M., Bacci,
G., Zanella, L., Bertoni, F., Picci, P., et al. (2005). Prognostic and therapeutic relevance of
HER2 expression in osteosarcoma and Ewing’s sarcoma. Eur. J. Cancer 41, 1349–1361.
Shi, L., Cheng, Z., Zhang, J., Li, R., Zhao, P., Fu, Z., and You, Y. (2008). hsa-mir-181a and
hsa-mir-181b function as tumor suppressors in human glioma cells. Brain Res. 1236, 185–
193.
Shin, K.-H., Bae, S.D., Hong, H.S., Kim, R.H., Kang, M.K., and Park, N.-H. (2011). miR-181a
shows tumor suppressive effect against oral squamous cell carcinoma cells by
downregulating K-ras. Biochem. Biophys. Res. Commun. 404, 896–902.
Siggelkow, H., Niedhart, C., and Kurre, W. (1998). In vitro differentiation potential of a
new human osteosarcoma cell line (HOS 58). Differentiation research in biological
diversity 63, 81–91.
Smida, J., Baumhoer, D., Rosemann, M., Walch, A., Bielack, S., Poremba, C., Remberger,
K., Korsching, E., Scheurlen, W., Dierkes, C., et al. (2010). Genomic alterations and allelic
miRNA expression in osteosarcoma Bibliography
110
imbalances are strong prognostic predictors in osteosarcoma. Clin. Cancer Res. 16, 4256–
4267.
Song, B., Wang, Y., Titmus, M.A., Botchkina, G., Formentini, A., Kornmann, M., and Ju, J.
(2010). Molecular mechanism of chemoresistance by miR-215 in osteosarcoma and colon
cancer cells. Mol. Cancer 9, 96.
Stephens, P.J., Greenman, C.D., Fu, B., Yang, F., Bignell, G.R., Mudie, L.J., Pleasance, E.D.,
Lau, K.W., Beare, D., Stebbings, L. a, et al. (2011). Massive genomic rearrangement
acquired in a single catastrophic event during cancer development. Cell 144, 27–40.
Stiller, C. (2002). Epidemiology of cancer in adolescents. Med. Pediatr. Oncol. 39, 149–
155.
Stossi, F., Barnett, D.H., Frasor, J., Komm, B., Lyttle, C.R., and Katzenellenbogen, B.S.
(2004). Transcriptional profiling of estrogen-regulated gene expression via estrogen
receptor (ER) alpha or ERbeta in human osteosarcoma cells: distinct and common target
genes for these receptors. Endocrinology 145, 3473–3486.
Stratton, M. R. , Campbell, P. J., Futreal, P. A. (2009). The cancer genome. Nature 458,
719-724.
Su, B., Zhao, W., Shi, B., Zhang, Z., Yu, X., Xie, F., Guo, Z., Zhang, X., Liu, J., Shen, Q., et al.
(2014). Let-7d suppresses growth, metastasis, and tumor macrophage infiltration in renal
cell carcinoma by targeting COL3A1 and CCL7. Mol. Cancer 13, 206.
Subramaniam, M., Jalal, S.M., Rickard, D.J., Harris, S.A., Bolander, M.E., and Spelsberg,
T.C. (2002). Further characterization of human fetal osteoblastic hFOB 1.19 and hFOB/ER
alpha cells: bone formation in vivo and karyotype analysis using multicolor fluorescent in
situ hybridization. J. Cell. Biochem. 87, 9–15.
Sun, Y.-M., Lin, K.-Y., and Chen, Y.-Q. (2013). Diverse functions of miR-125 family in
different cell contexts. J. Hematol. Oncol. 6, 6.
Sylvestre, Y., De Guire, V., Querido, E., Mukhopadhyay, U.K., Bourdeau, V., Major, F.,
Ferbeyre, G., and Chartrand, P. (2007). An E2F/miR-20a autoregulatory feedback loop. J.
Biol. Chem. 282, 2135–2143.
Tanaka, K.I., Inoue, Y., Hendy, G.N., Canaff, L., Katagiri, T., Kitazawa, R., Komori, T.,
Sugimoto, T., Seino, S., and Kaji, H. (2012). Interaction of Tmem119 and the bone
morphogenetic protein pathway in the commitment of myoblastic into osteoblastic cells.
Bone 51, 158–167.
Thalmeier, K., and Meissner, P. (1994). Establishment of two permanent human bone
marrow stromal cell lines with long-term post irradiation feeder capacity.Blood 83, 1799–
1807.
miRNA expression in osteosarcoma Bibliography
111
Troisi, R., Masters, M.N., Joshipura, K., Douglass, C., Cole, B.F., and Hoover, R.N. (2006).
Perinatal factors, growth and development, and osteosarcoma risk. Br. J. Cancer 95,
1603–1607.
Truong, A.H., and Ben-David, Y. (2000). The role of Fli-1 in normal cell function and
malignant transformation. Oncogene 19, 6482–6489.
Tucker, M. a, D’Angio, G.J., Boice, J.D., Strong, L.C., Li, F.P., Stovall, M., Stone, B.J., Green,
D.M., Lombardi, F., and Newton, W. (1987). Bone sarcomas linked to radiotherapy and
chemotherapy in children. N. Engl. J. Med. 317, 588–593.
Valster, A., Tran, N.L., Nakada, M., Berens, M.E., Chan, A.Y., and Symons, M. (2005). Cell
migration and invasion assays. Methods 37, 208–215.
Vennstrom, B., Sheiness, D., Zabielski, J., and Bishop, J.M. (1982). Isolation and
characterization of c-myc, a cellular homolog of the oncogene (v-myc) of avian
myelocytomatosis virus strain 29. J. Virol. 42, 773–779.
Wang, X., and El Naqa, I.M. (2008). Prediction of both conserved and nonconserved microRNA targets in animals. Bioinformatics 24, 325–332.
Wang, T., Guo, S., Liu, Z., Wu, L., and Li, M. (2014) CAMK2N1 inhibits prostate cancer
progression androgen receptor-dependent signaling through.Oncotarget 5, 10293-10306.
Wang, Y., Zhao, W., and Fu, Q. (2013). MiR-335 suppresses migration and invasion by
targeting ROCK1 in osteosarcoma cells. Mol. Cell. Biochem. 384, 105–111.
Welch, C., Chen, Y., and Stallings, R.L. (2007). MicroRNA-34a functions as a potential
tumor suppressor by inducing apoptosis in neuroblastoma cells. Oncogene 26, 5017–
5022.
Wu, D., Chen, K., and Bai, Y. (2014). Screening of diagnostic markers for osteosarcoma. Mol. Med Reports 10, 2415-2420.
Wu, T., Zhou, H., Hong, Y., Li, J., Jiang, X., and Huang, H. (2012). miR-30 family members
negatively regulate osteoblast differentiation. J. Biol. Chem. 287, 7503–7511.
Yan, H., Xue, G., Mei, Q., Wang, Y., Ding, F., Liu, M.-F., Lu, M.-H., Tang, Y., Yu, H., and Sun,
S. (2009). Repression of the miR-17-92 cluster by p53 has an important function in
hypoxia-induced apoptosis. EMBO J. 28, 2719–2732.
Yan, K., Gao, J., Yang, T., Ma, Q., Qiu, X., Fan, Q., and Ma, B. (2012). MicroRNA-34a
inhibits the proliferation and metastasis of osteosarcoma cells both in vitro and in vivo.
PLoS One 7, e33778.
Yang, X., Liu, D., Murray, T.J., Mitchell, G.C., Hesterman, E. V, Karchner, S.I., Merson, R.R.,
Hahn, M.E., and Sherr, D.H. (2005). The aryl hydrocarbon receptor constitutively
represses c-myc transcription in human mammary tumor cells. Oncogene 24, 7869–7881.
miRNA expression in osteosarcoma Bibliography
112
Yekta, S., Shih, I.-H., and Bartel, D.P. (2004). MicroRNA-directed cleavage of HOXB8
mRNA. Science 304, 594–596.
Zhang, J., Tu, Q., Bonewald, L.F., He, X., Stein, G., Lian, J., and Chen, J. (2011a). Effects of
miR-335-5p in modulating osteogenic differentiation by specifically downregulating Wnt
antagonist DKK1. J. Bone Miner. Res. 26, 1953–1963.
Zhang, S., Wang, X., Osunkoya, A.O., Iqbal, S., Wang, Y., Chen, Z., Müller, S., Josson, S.,
Coleman, I.M., Nelson, P.S., et al. (2011b). EPLIN downregulation promotes epithelial–
mesenchymal transition in prostate cancer cells and correlates with clinical lymph node metastasis. Oncogene 30, 4941–4952.
Zhang, W., Qian, J.-X., Yi, H.-L., Yang, Z.-D., Wang, C.-F., Chen, J.-Y., Wei, X.-Z., Fu, Q., and
Ma, H. (2012). The microRNA-29 plays a central role in osteosarcoma pathogenesis and progression. Mol. Biol. 46, 557–562.
Zhang, Y.W., Morita, I., Ikeda, M., Ma, K.W., and Murota, S. (2001). Connexin43
suppresses proliferation of osteosarcoma U2OS cells through post-transcriptional regulation of p27. Oncogene 20, 4138–4149.
Zhao, H., Ma, B., Wang, Y., Han, T., Zheng, L., Sun, C., Liu, T., Zhang, Y., Qiu, X., and Fan, Q.
(2013). miR-34a inhibits the metastasis of osteosarcoma cells by repressing the expression of CD44. Oncol. Rep. 29, 1027–1036.
Zhou, H., Randall, R.L., Brothman, A.R., Ph, D., Maxwell, T., Coffin, C.M., and Goldsby, R.E.
(2003). Her-2/neu expression in osteosarcoma increases risk of lung metastasis and can be associated with gene amplification. J Pedr Hem/Oncol. 25, 27-32.
Zhou, L., Qi, X., Potashkin, J. a, Abdul-Karim, F.W., and Gorodeski, G.I. (2008). MicroRNAs
miR-186 and miR-150 down-regulate expression of the pro-apoptotic purinergic P2X7
receptor by activation of instability sites at the 3’-untranslated region of the gene that
decrease steady-state levels of the transcript. J. Biol. Chem. 283, 28274–28286.
Zhu, W., Shan, X., Wang, T., Shu, Y., and Liu, P. (2010). miR-181b modulates multidrug resistance by targeting BCL2 in human cancer cell lines. Int. J. Cancer 127, 2520–2529.
Ziyan, W., Shuhua, Y., Xiufang, W., and Xiaoyun, L. (2011). MicroRNA-21 is involved in
osteosarcoma cell invasion and migration. Med. Oncol. 28, 1469–1474.
Zoubek, A., Windhager, R., and Bielack, S. (2006). Osteosarkome. Pädiatrische
Hämatologie und Onkologie, book chapter pp. 882–893.
miRNA expression in osteosarcoma List of figures
113
9. List of figures
Figure 1: Osteosarcoma incidence by disease sequence, SEER 9 (1973-2004) ................... 6
Figure 2: Important pathways in osteosarcoma; modified from: KEGG cancer pathways … 8
Figure 3: Therapy outline ................................................................................................ 13
Figure 4: Kaplan-Meier curve of metastases at diagnosis ................................................ 14
Figure 5: miRNA biogenesis and post-transcriptional processes ...................................... 16
Figure 6: Workflow of the thesis ..................................................................................... 21
Figure 7: Standard growth curve for calculating dt (doubling time) ................................. 26
Figure 8: Principle of Matrigel™ Invasion chamber .......................................................... 28
Figure 9: Workflow for identification of regulatory miR-mRNA-modules ......................... 35
Figure 10: Correlation coefficient thresholds .................................................................. 35
Figure 11: Heatmap: unsupervised hierarchical clustering of all samples and miR .......... 38
Figure 12: PCA plotting of all cell lines ............................................................................. 40
Figure 13: Pearson correlation heat maps, microRNA and mRNA expression .................. 41
Figure 14: Exponential growth curves for all osteosarcoma cell lines .............................. 47
Figure 15: Migrated cells for each osteosarcoma cell line ............................................... 49
Figure 16: Number of invaded cells for each osteosarcoma cell line ................................ 50
Figure 17: Correlation boxplots for all miRNA with significant p-value ............................ 53
Figure 18: Correlation box plot miRNA let-7f and let-7d migration/invasion ................... 54
Figure 19: Proliferation network ..................................................................................... 63
Figure 20: Summary of analysis for proliferation ............................................................. 64
Figure 21: Summary of migration analysis ....................................................................... 64
Figure 22 : Migration networks ....................................................................................... 66
Figure 23: Proliferation assay results ............................................................................... 68
Figure 24: Schematic illustration of the miR-17-92-cluster .............................................. 71
Figure 25: Potential role of miR-34a and miR-29a, miR-335 and miR-30b in osteoblast
differentiation ......................................................................................................... 73
miRNA expression in osteosarcoma List of tables
114
10. List of tables
Table 1: Histological types of osteosarcoma and their frequency of occurrence; ............ 10
Table 2: Salzer-Kuntschik Response Grading ................................................................... 11
Table 3: Cell line characteristics and references .............................................................. 23
Table 4 : Legend for toptable .......................................................................................... 34
Table 5: Differentially expressed miRNA in ≥ 4 out of 6 cell lines (n=15) .......................... 44
Table 6: Target genes of deregulated miRNA osteosarcoma vs. reference cell lines ........ 46
Table 7: Phenotypic characterization of all 8 osteosarcoma cell lines .............................. 51
Table 8: miRNA distinguishing between fast and slow proliferating cell lines .................. 52
Table 9: miRNA distinguishing between migrative/invasive and non-migrative/non-
invasive cell lines ..................................................................................................... 54
Table 10: Differentially expressed mRNA in comparison of fast and slow proliferating cell
lines (n=60) ............................................................................................................. 56
Table 11: GoTerm enrichment of table 10 gene list (n=60) .............................................. 59
Table 12: Differentially expressed mRNA migration/invasion .......................................... 60
miRNA expression in osteosarcoma List of Abbreviations
115
11. List of Abbreviations
Abbreviation Explanation
OS Osteosarcoma
ATCC American Type Culture Collection
N/A Not Available
FCS Fetal Calf Serum
CG Chemogradient
CI Cell Index
Lowess-Algorithm Locally Weighted Scatterplot Smoothing
miRNA MicroRNA
mRNA Messenger RNA
PBS Phosphate Buffered Saline
RPMI Roswell Park Memorial Institute
RMA Robust Multichip Average
QC Quality Control
WT Whole Transcript
OGS Official Gene Symbol
SEER Surveillance, Epidemiology and End Results Program
Dt Doubling time
KEGG Kyoto Encyclopedia of Genes and Genomes
EURAMOS
CTOS
Go-Term
FISH
SKY
CGH
DAVID
CLL
MAP
MAPIE
European and American Osteosarcoma Study group
Connective Tissue Oncology Society
Gene Ontology Term
Flourescence In Situ Hybridization
Spectral Karyotyping
Comparative Genomic Hybridization
Database for Annotation, Visualization and Integrated
Discovery
Chronic Lymphocytic Leukemia
Methotrexate, Adriamycin, Cisplatin
Methotrexate, Adriamycin, Cisplatin, Ifosfamide, Etoposide

miRNA expression in osteosarcoma Acknowledgements
116
12. Acknowledgements
I would like to express my thanks to:
- Prof. Dr. med. Michaela Nathrath, who had confidence in me and gave me the
opportunity to do this thesis. Throughout all this time you have been animating
me and you have been always supportive. With your apparently infinite
motivation and honest commitment to medicine, in clinic or in research, you are
an inspiring example.
- The Holzhauer Stiftung, in person Peter Vaupel, who kindly provided the funding
for this work, especially for my stay in Munich. Without your generous support
this thesis would not have been possible.
- Dr. rer. nat. Jan Smida, who was an extraordinary supervisor throughout the
whole time of this thesis. You have answered all my questions patiently and you
helped with your comprehensive knowledge not only in molecular biology.
Besides, thanks a lot for being such an enjoyable and wise office partner during
my stay in Munich.
- My particluar thanks to all the other (past and actual) KKG-members for the
help with laboratory work and plenty of fruitful and amusing discussions about
science and life in general: PD Dr. med. Daniel Baumhoer, Laura Dajka, Dr. rer.
nat. Doris Maugg, Dr. rer. nat. Ela Karshovska, Dr. Michael Rosemann.
- Furthermore, I am very grateful for the warm welcome in his institute and the
insights into softball that I happily received by Prof. Michael Atkinson.
To the members of the Radiation Biology unit and the Department of Analytic
Pathology, Mareike, Klaudia, Isi, Anne, Fred, Natasha, Ines, Simone, Omid,
Bahar, Solvejg und Steffi I give my sincere thanks for their constant scientific
advice and support as well as regular diverting lunch breaks and discussions.

miRNA expression in osteosarcoma Acknowledgements
117
- Moreover, I thankfully acknowledge the special support that I received from my
former colleagues and supervisors of the Children’s Hospital Kassel.
You all created a very pleasant ambience at work that was exemplarily and even
during the time of my leave you were always supportive.
- Special thanks to our cooperation partners from the Helmholtz Centre Munich
and Institute of Bioinformatics, WWU Münster:
- Martin Irmler and Johannes Beckers, Intitute for Experimental Genetics
(Munich)
- Kristian Unger, Research Unit of Radiation Cytogenetics (Munich)
- PD Dr. Eberhard Korsching and Dr. rer. nat. Kathrin Poos (Münster)
miRNA expression in osteosarcoma Publications
118
13. Publications
13.1. Congress contributions
miRNA im Osteosarkom – von der Zelllinie zum primären Tumormaterial“
Annual Meeting of the German Society for Pediatrics and Adolescents (DGKJ) and
Society for Pediatric Oncology and Hematology (GPOH) , Hamburg 12th – 16th
September 2012 (oral presentation)
miRNA deregulation as a critical milestone on the road to osteosarcoma
development and metastasis?“ ; Annual Meeting of the European Musculo-Skeletal
Oncology Society (EMSOS), Bologna, Italy; 15th – 16th Mai 2012 (oral presentation)
13.2. Original articles
Baumhoer D, Elsner M, Smida J, Zillmer S, Rauser S, Schoene C, Balluff B, Bielack S,
Jundt G, Walch A, Nathrath M.: CRIP1 expression is correlated with a favorable
outcome and less metastases in osteosarcoma patients. Oncotarget. 2011
Dec;2(12):970-5.
Baumhoer D, Smida J, Zillmer S, Rosemann M, Atkinson MJ, Nelson PJ, Jundt G,
Luettichau IV, Nathrath M.: Strong expression of CXCL12 is associated with a
favorable outcome in osteosarcoma. Mod Pathol. 2011 Dec 16.; doi:
10.1038/modpathol.2011.193
Parts of this thesis have been published in this original article:
Baumhoer D*, Zillmer S*, Unger K, Rosemann M, Atkinson MJ, Irmler M, Siggelkow
H., von Luettichau I, Jundt G, Smida J, Nathrath M:
MicroRNA profiling with correlation to gene expression revealed the oncogenic
miR17-92 cluster to be up-regulated in osteosarcoma Cancer Genetics 2012 May;
205 (5): 212-9 (*both authors contributed equally to this work)
miRNA expression in osteosarcoma
119
APPENDIX
1. Materials, Kits and Reagents
A. Cell culture (Material and Media)
• PBS, manufacturer PAA
• RPMI 1640 + L-Glutamine, GIBCO
• Trypsin 0,05% + EDTA 0,02%
• FBS, manufacturer PAA
• Ethanol 80%
• Culture flasks (T25, T75), manufacturer Greiner bio-one
• Cell counter Z1 , manufacturer Beckman
• Incubator
• Water bath, manufacturer Memmert
• Glass-Pipettes ( 5, 10, 25 ml), manufacturer Greiner bio-one
• Aspiration pipette (2ml), manufacturer Sarstedt
• Pipette tips (1-10; 1-100, 101-1000µl), TipOne Starlab
• Pipettes (1-10, 1-100, 101-1000µl), manufacturer Eppendorf
• Pipette controller (Accu jet pro)
• Microscope 1 (Axiovert 25), manufacturer Zeiss
• Microscope 2 (LH 50 A), manufacturer Olympus
• Multiwell-tissue culture plates (6-well; 24-well), manufacturer Falcon
• Conical Tubes (15 ml, 50 ml), manufacturer Greiner bio-one
• Aspiration vacuum pump (BVC 21), manufacturer Vacuubrand
• Laminar flow hood, manufacturer BDK Luft- und Reinraumtechnik
• Precision hot plate, manufacturer Harry Gestigheit GmbH
• Tissue culture flasks (25cm2 , 75cm2), Greiner bio-one

miRNA expression in osteosarcoma
120
B. Migration and Invasion Assays
• BD Biocoat Invasion Chamber (Nr.: 354480), BD Biosciences
• Touludine blue 1%
• Methanole
• Ampuwa Water
• Canula/needle
2. Protocols
C. A. RNA-Extraction
• see protocol of mirVana miRNA Isolation Kit
D. Proliferation Assay
• Seed 1x10⁵ cells in 25cm2 cell culture flasks (for every cell line in duplicate)
• Count cells every 24 hours for 7 days using an automated cell counter (Beckman
Coulter), for this harvest cells after 24h, 48h, 72h, 96h und 168h hours by
trypsinization (for trypsinisation process, consult cell cultivation protocol)
• Calculate mean cell numbers for every cell line plot into a growth curve with
logarithmic scaling
• Calculate doubling time
E. Matrigel® Invasion Assay
• Remove the package from -20°C storage and allow to come to room temperature
• Add around 500µl of warm (37°C) culture medium (RPMI, no FCS) to the interior of
the inserts and bottom of wells. Allow to rehydrate for 2 hours in humidified
tissue culture incubator, 37°C, 5% CO2 atmosphere.
• In the meantime: Harvest the cells (washing procedure with 5-6ml PBS and 1/10 of
Trypsin 2-3 min, watch under microscope, neutralization with 5ml FCS 0,2%)
• Cell counting and re-suspension of 2,5x10⁴ cells of each cell line and fill with
medium to reach an amount of 350µl
• After rehydration, carefully remove the medium without disturbing the layer of
Matrigel™™ Matrix on the membrane.

miRNA expression in osteosarcoma
121
• Add chemoattractant (750µl 10% FCS) to the wells of a new BD Falcon 24-well-
plate
• Transfer the inserts to these wells and add the cell suspension (350µl)
• Use sterile forceps to transfer the chambers. Be sure that no air bubbles are
trapped beneath the membranes. This can be avoided by tipping the insert or
chamber at a slight angle as it is lowered into the liquid.
• Incubate the BD BioCoat Matrigel Invasion Chambers for 48 hours in a humidified
tissue culture incubator, at 37°C, 5% CO2 atmosphere.
• Observe under light microscope after 24hours and take pictures
• After incubation time aspirate the medium very carefully
• Transfer the inserts to a new 24-well-plate (wells filled with PBS) and swab the
insert with a PBS-humidified cotton swab 2-3 times to remove the non-invading
cells on the upper part of the membrane
• Fix the lower part with 600µl of Methanol for 2 minutes
• Transfer inserts to wells with Ampuwa water and wash for 2 minutes
• Transfer the inserts to well containing Touluidin blue 2% and stain for ca. 10min
• After rinse the inserts gently under water and remove remaining colour
• Allow the inserts to dry at 37°C for at least 1 hour
• Remove the membrane from the insert housing by inverting the insert and
inserting the tip of a sharp scalpel blade through the membrane at the edge
adjacent to the housing wall. Do not fully release the membrane from the housing
but leave a very small point of attachment
• Use forceps to peel the membrane from the remaining point of attachment and
place it bottom side down on a microscope slide on which a small drop of
immersion oil has been placed. Place a second very small drop of immersion oil on
top of the membrane
• Place a second slide or cover slip on top of the membrane and apply gentle
pressure to expel any air bubbles
• Observe and photograph the invading cells under the microscope at
approximately 40 - 200X magnifications depending on cell density. Count cells in
several fields
miRNA expression in osteosarcoma
122
F. Migration assay
• Harvest cells at approx. 80-85% confluence and count
• Resuspend the cells in 0,2% FCS
• Add chemoattractant (900µl of 10% FCS RPMI) to bottom of the wells
• Transfer inserts to the wells and add cells (2,5x10⁴ )
• Incubate the chambers for 24 and 48 hours each (37°C and 5% CO2)
• After each time point: aspirate medium
• Transfer chambers to a clean 24-well-plate with 600µl PBS in each well
• Use a PBS-humidified cotton swab to remove the non-migrating cells in the upper
part of the inserts (2-times)
• Last part of procedure analogue to invasion assay (protocol above)
G. Fast-Forward Transfection of HOS cells (or similar) with miRNA/miRNAinhibitor (using HiPerFect
Transfection Reagent)
• Shortly before transfection, seed 1.2 x 10⁵ cells per well of a 12-well plate in
1100μl of an appropriate culture medium containing serum and antibiotics. For
the short time until transfection, incubate the cells under normal growth
conditions (typically 37°C and 5% CO2).
• Cells may alternatively be seeded after step 3 of this protocol. Dilute 75 ng miRNA
(or 10 times this amount of miRNA inhibitor) in 100μl culture medium without
serum (this will give a final miRNA concentration of 5 nM after adding complexes
to cells in step 5). Add 6μl of HiPerFect Transfection Reagent to the diluted
miRNA/miRNA inhibitor and mix by vortexing. IMPORTANT: The amount of
transfection reagent and miRNA/miRNA inhibitor required for optimal
performance may vary, depending on the cell line and gene target. Incubate the
samples for 5−10 min at room temperature (15−25°C) to allow the formation of
transfection complexes. Add the complexes drop-wise onto the cells. Gently swirl
the plate to ensure uniform distribution of the transfection complexes. Incubate
the cells with the transfection complexes under their normal growth conditions
and monitor gene silencing after an appropriate time (e.g., 6−72 h after
transfection, depending on experimental setup). Change the medium as required.
Note: The optimal incubation time for gene silencing analysis depends on the cell
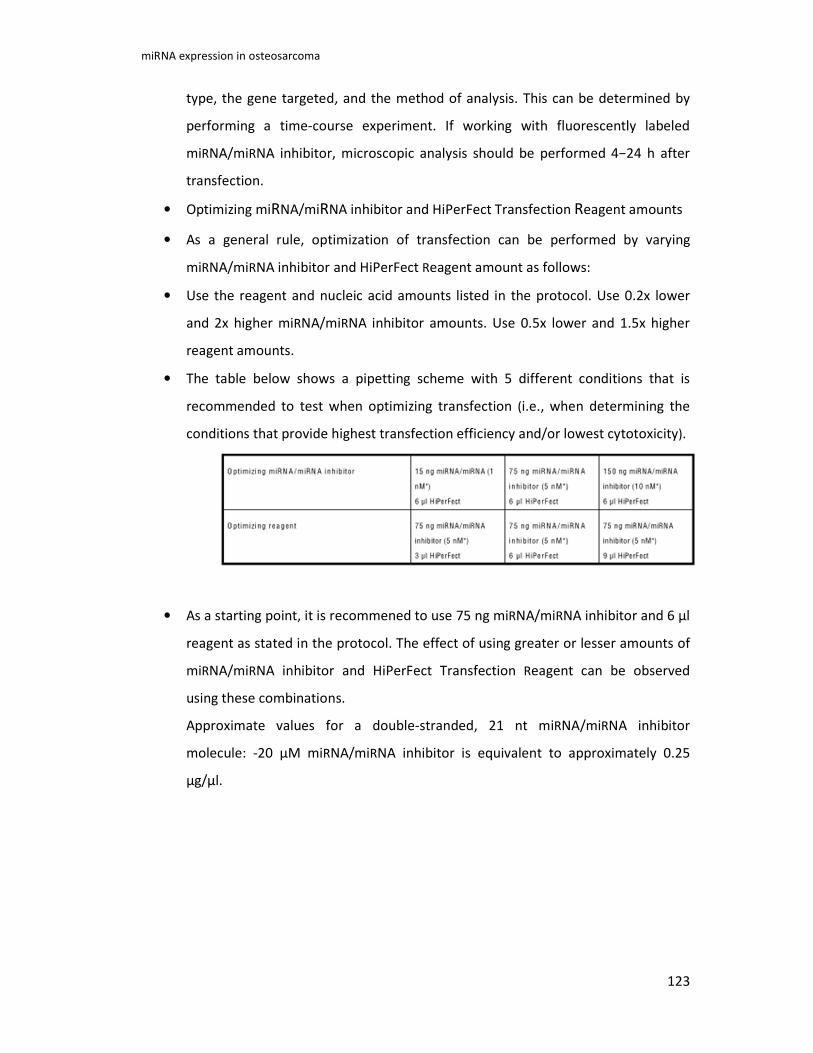
miRNA expression in osteosarcoma
123
type, the gene targeted, and the method of analysis. This can be determined by
performing a time-course experiment. If working with fluorescently labeled
miRNA/miRNA inhibitor, microscopic analysis should be performed 4−24 h after
transfection.
• Optimizing miRNA/miRNA inhibitor and HiPerFect Transfection Reagent amounts
• As a general rule, optimization of transfection can be performed by varying
miRNA/miRNA inhibitor and HiPerFect Reagent amount as follows:
• Use the reagent and nucleic acid amounts listed in the protocol. Use 0.2x lower
and 2x higher miRNA/miRNA inhibitor amounts. Use 0.5x lower and 1.5x higher
reagent amounts.
• The table below shows a pipetting scheme with 5 different conditions that is
recommended to test when optimizing transfection (i.e., when determining the
conditions that provide highest transfection efficiency and/or lowest cytotoxicity).
• As a starting point, it is recommened to use 75 ng miRNA/miRNA inhibitor and 6 μl
reagent as stated in the protocol. The effect of using greater or lesser amounts of
miRNA/miRNA inhibitor and HiPerFect Transfection Reagent can be observed
using these combinations.
Approximate values for a double-stranded, 21 nt miRNA/miRNA inhibitor
molecule: -20 μM miRNA/miRNA inhibitor is equivalent to approximately 0.25
μg/μl.