Embed Size (px)
Citation preview
The Long Tail of Idea Generationby
Robin W. Spencer and Timothy J. Woods
rreepprriinntteedd ffrroomm
IInntteerrnnaattiioonnaall JJoouurrnnaall ooff IInnnnoovvaattiioonn SScciieennccee
Volume 2 · Number 2 · June 2010
MMuullttii--SScciieennccee PPuubblliisshhiinngg11775577--22222233
Volume 2 · Number 2 · 2010
53
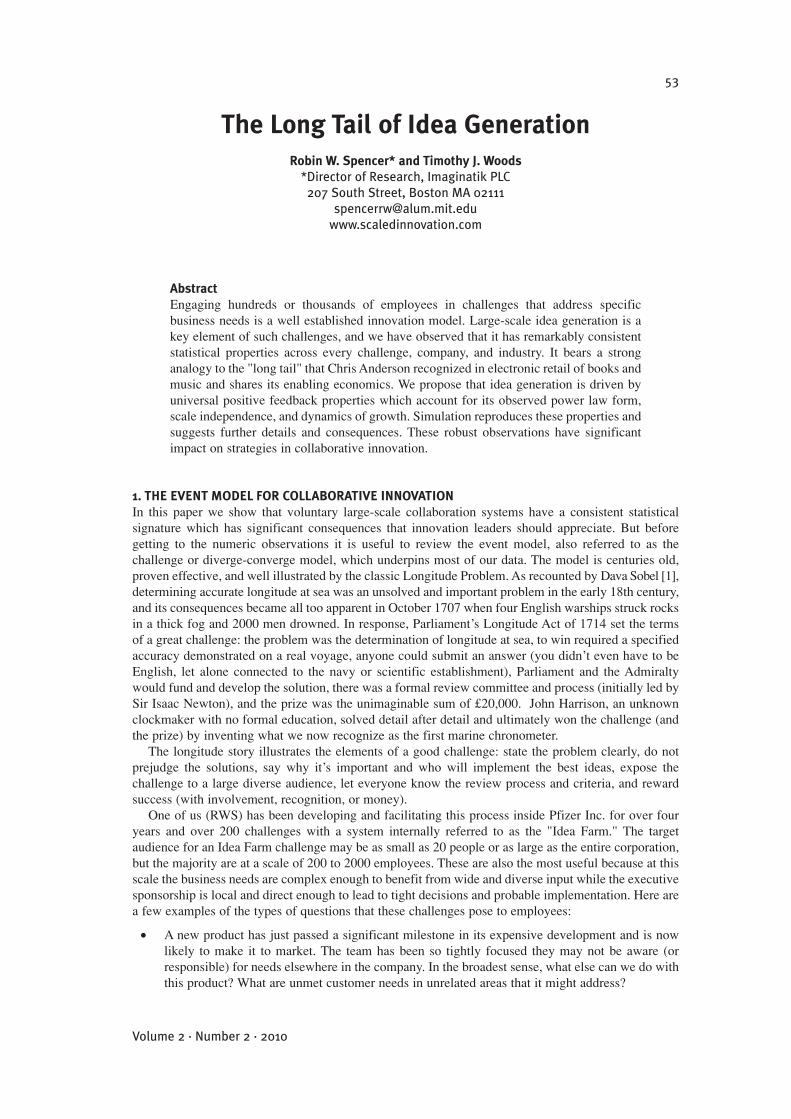
The Long Tail of Idea GenerationRobin W. Spencer* and Timothy J. Woods
*Director of Research, Imaginatik PLC207 South Street, Boston MA 02111
AbstractEngaging hundreds or thousands of employees in challenges that address specificbusiness needs is a well established innovation model. Large-scale idea generation is akey element of such challenges, and we have observed that it has remarkably consistentstatistical properties across every challenge, company, and industry. It bears a stronganalogy to the "long tail" that Chris Anderson recognized in electronic retail of books andmusic and shares its enabling economics. We propose that idea generation is driven byuniversal positive feedback properties which account for its observed power law form,scale independence, and dynamics of growth. Simulation reproduces these properties andsuggests further details and consequences. These robust observations have significantimpact on strategies in collaborative innovation.
1. THE EVENT MODEL FOR COLLABORATIVE INNOVATIONIn this paper we show that voluntary large-scale collaboration systems have a consistent statisticalsignature which has significant consequences that innovation leaders should appreciate. But beforegetting to the numeric observations it is useful to review the event model, also referred to as thechallenge or diverge-converge model, which underpins most of our data. The model is centuries old,proven effective, and well illustrated by the classic Longitude Problem. As recounted by Dava Sobel [1],determining accurate longitude at sea was an unsolved and important problem in the early 18th century,and its consequences became all too apparent in October 1707 when four English warships struck rocksin a thick fog and 2000 men drowned. In response, Parliament’s Longitude Act of 1714 set the termsof a great challenge: the problem was the determination of longitude at sea, to win required a specifiedaccuracy demonstrated on a real voyage, anyone could submit an answer (you didn’t even have to beEnglish, let alone connected to the navy or scientific establishment), Parliament and the Admiraltywould fund and develop the solution, there was a formal review committee and process (initially led bySir Isaac Newton), and the prize was the unimaginable sum of £20,000. John Harrison, an unknownclockmaker with no formal education, solved detail after detail and ultimately won the challenge (andthe prize) by inventing what we now recognize as the first marine chronometer.
The longitude story illustrates the elements of a good challenge: state the problem clearly, do notprejudge the solutions, say why it’s important and who will implement the best ideas, expose thechallenge to a large diverse audience, let everyone know the review process and criteria, and rewardsuccess (with involvement, recognition, or money).
One of us (RWS) has been developing and facilitating this process inside Pfizer Inc. for over fouryears and over 200 challenges with a system internally referred to as the "Idea Farm." The targetaudience for an Idea Farm challenge may be as small as 20 people or as large as the entire corporation,but the majority are at a scale of 200 to 2000 employees. These are also the most useful because at thisscale the business needs are complex enough to benefit from wide and diverse input while the executivesponsorship is local and direct enough to lead to tight decisions and probable implementation. Here area few examples of the types of questions that these challenges pose to employees:
• A new product has just passed a significant milestone in its expensive development and is nowlikely to make it to market. The team has been so tightly focused they may not be aware (orresponsible) for needs elsewhere in the company. In the broadest sense, what else can we do withthis product? What are unmet customer needs in unrelated areas that it might address?
• Regulatory authorities require us to prepare certain lengthy complex documents. Despite beingso constrained, what prevents us from cutting 30% off the time it takes to complete them?
• For a sales force that often works out of homes or automobiles, what are the most time-wastingor distracting aspects of the job and what are feasible solutions (given various constraints ofbudget or job requirements)?
• The IT department can take on a limited number of new projects each year. Targeting their entireinternal audience, what are new needs for IT capabilities this year? Rate them by complexity,consequences, scope, and urgency against preexisting commitments.
• As a side effect of the research needed to produce our core products (new pharmaceuticals),additional intellectual property may be generated. What are all of these intellectual propertyestates which may become opportunities for spin-off businesses?
• On an outside website we welcome new product ideas and proposals from the public at large.
These examples show that our challenges do not pigeonhole innovation: business needs around newproducts, saving time or money, allocating resources, and more are all in scope. If the results are newand useful, that is by definition innovative.
2. "NOT EVEN WRONG"Our investigation into the mathematical structure of innovation challenges begins with a simplequestion that could easily come from an executive sponsor: "What’s the average number of ideasentered per person?" A little exploration of this innocent and apparently reasonable question reveals thatany answer we could give – for example by dividing the total number of ideas by total participants –would be "not even wrong." This nice phrase comes from physicists, who say that an incorrectmeasurement based on a good theory might be wrong, but a measurement based on a bad theory wouldbe "not even wrong". It’s an insult and a warning to recognize that results based on bad theory shouldnot be calculated or presented, because doing so propagates misunderstanding and implicitly endorsesthe bad theory.
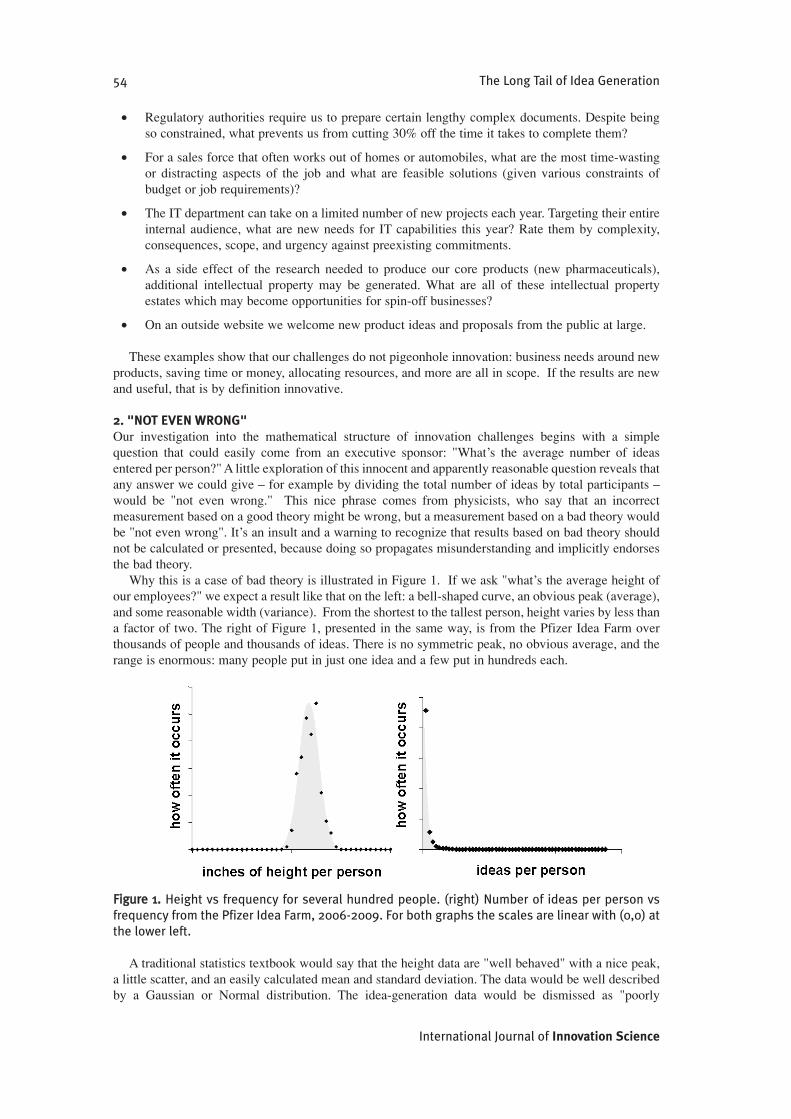
Why this is a case of bad theory is illustrated in Figure 1. If we ask "what’s the average height ofour employees?" we expect a result like that on the left: a bell-shaped curve, an obvious peak (average),and some reasonable width (variance). From the shortest to the tallest person, height varies by less thana factor of two. The right of Figure 1, presented in the same way, is from the Pfizer Idea Farm overthousands of people and thousands of ideas. There is no symmetric peak, no obvious average, and therange is enormous: many people put in just one idea and a few put in hundreds each.
FFiigguurree 11.. Height vs frequency for several hundred people. (right) Number of ideas per person vsfrequency from the Pfizer Idea Farm, 2006-2009. For both graphs the scales are linear with (0,0) atthe lower left.
A traditional statistics textbook would say that the height data are "well behaved" with a nice peak,a little scatter, and an easily calculated mean and standard deviation. The data would be well describedby a Gaussian or Normal distribution. The idea-generation data would be dismissed as "poorly
54 The Long Tail of Idea Generation
International Journal of Innovation Science
behaved" with no peak (except at the y-axis asymptote) and a calculated standard deviation much largerthan the calculated mean.
But this is science, and when large, accurately collected data sets disagree with theory, it’s the theorythat gets discarded, not the data. The theory we’re discarding is the tacit assumption that the worldshould be Gaussian, and we will need to find an alternative way to describe and think about data likethis. Nassim Nicolas Taleb and Paul Ormerod, authors of "The Black Swan" and "Why Most ThingsFail", would strongly agree [2,3]. We are trained to think in Gaussian terms, and while that’s sometimesan appropriate way to describe the world, it can sometimes be very wrong. The consequences can behuge: as Ormerod points out, financial strategies are too often based on an implicit assumption thatevents are Gaussian, but in the real world that may be very far from Gaussian, this can result inunderestimated risk, financial fragility, and economic collapse.
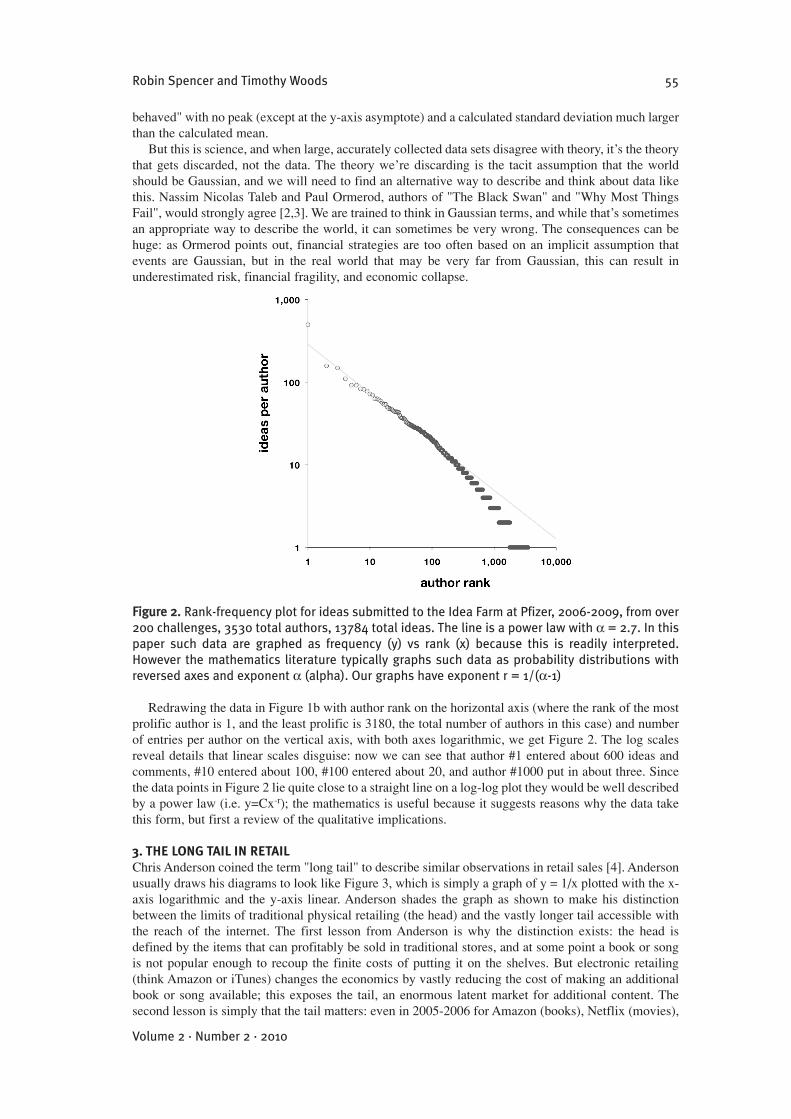
FFiigguurree 22.. Rank-frequency plot for ideas submitted to the Idea Farm at Pfizer, 2006-2009, from over200 challenges, 3530 total authors, 13784 total ideas. The line is a power law with ! = 2.7. In thispaper such data are graphed as frequency (y) vs rank (x) because this is readily interpreted.However the mathematics literature typically graphs such data as probability distributions withreversed axes and exponent ! (alpha). Our graphs have exponent r = 1/(!-1)
Redrawing the data in Figure 1b with author rank on the horizontal axis (where the rank of the mostprolific author is 1, and the least prolific is 3180, the total number of authors in this case) and numberof entries per author on the vertical axis, with both axes logarithmic, we get Figure 2. The log scalesreveal details that linear scales disguise: now we can see that author #1 entered about 600 ideas andcomments, #10 entered about 100, #100 entered about 20, and author #1000 put in about three. Sincethe data points in Figure 2 lie quite close to a straight line on a log-log plot they would be well describedby a power law (i.e. y=Cx-r); the mathematics is useful because it suggests reasons why the data takethis form, but first a review of the qualitative implications.
3. THE LONG TAIL IN RETAILChris Anderson coined the term "long tail" to describe similar observations in retail sales [4]. Andersonusually draws his diagrams to look like Figure 3, which is simply a graph of y = 1/x plotted with the x-axis logarithmic and the y-axis linear. Anderson shades the graph as shown to make his distinctionbetween the limits of traditional physical retailing (the head) and the vastly longer tail accessible withthe reach of the internet. The first lesson from Anderson is why the distinction exists: the head isdefined by the items that can profitably be sold in traditional stores, and at some point a book or songis not popular enough to recoup the finite costs of putting it on the shelves. But electronic retailing(think Amazon or iTunes) changes the economics by vastly reducing the cost of making an additionalbook or song available; this exposes the tail, an enormous latent market for additional content. Thesecond lesson is simply that the tail matters: even in 2005-2006 for Amazon (books), Netflix (movies),
Robin Spencer and Timothy Woods 55
Volume 2 · Number 2 · 2010
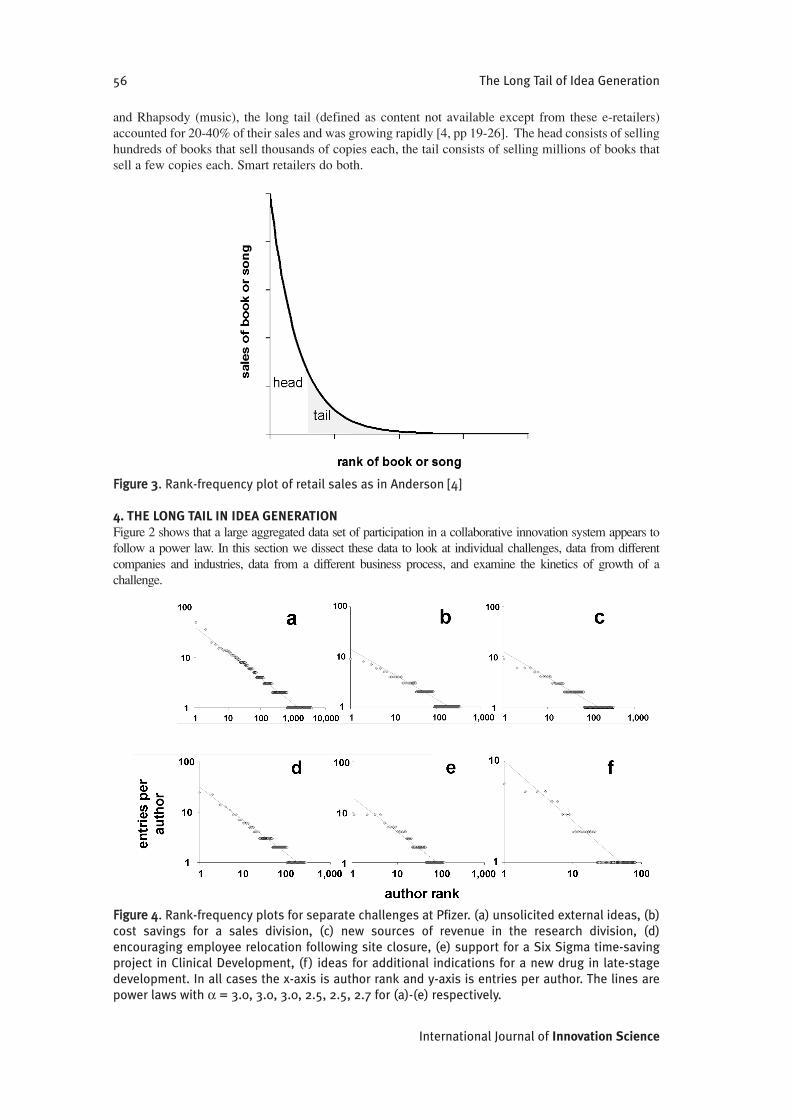
and Rhapsody (music), the long tail (defined as content not available except from these e-retailers)accounted for 20-40% of their sales and was growing rapidly [4, pp 19-26]. The head consists of sellinghundreds of books that sell thousands of copies each, the tail consists of selling millions of books thatsell a few copies each. Smart retailers do both.
FFiigguurree 33. Rank-frequency plot of retail sales as in Anderson [4]
4. THE LONG TAIL IN IDEA GENERATIONFigure 2 shows that a large aggregated data set of participation in a collaborative innovation system appears tofollow a power law. In this section we dissect these data to look at individual challenges, data from differentcompanies and industries, data from a different business process, and examine the kinetics of growth of achallenge.
FFiigguurree 44. Rank-frequency plots for separate challenges at Pfizer. (a) unsolicited external ideas, (b)cost savings for a sales division, (c) new sources of revenue in the research division, (d)encouraging employee relocation following site closure, (e) support for a Six Sigma time-savingproject in Clinical Development, (f ) ideas for additional indications for a new drug in late-stagedevelopment. In all cases the x-axis is author rank and y-axis is entries per author. The lines arepower laws with ! = 3.0, 3.0, 3.0, 2.5, 2.5, 2.7 for (a)-(e) respectively.
56 The Long Tail of Idea Generation
International Journal of Innovation Science
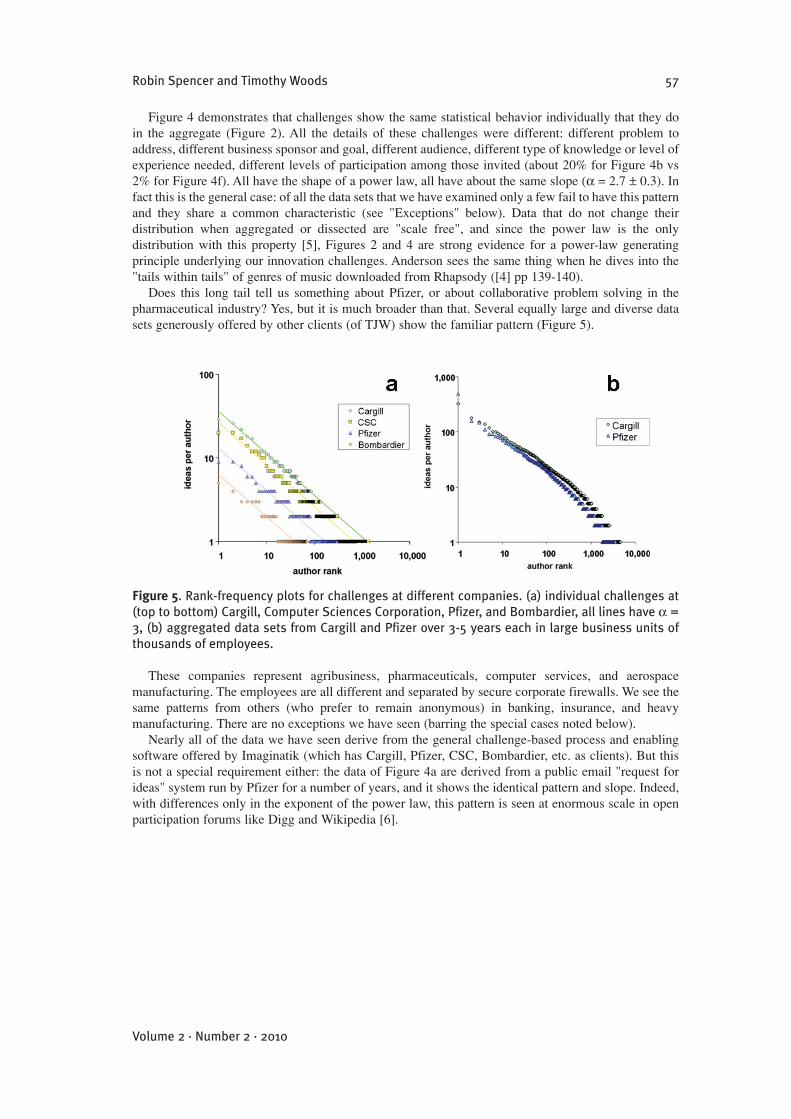
Figure 4 demonstrates that challenges show the same statistical behavior individually that they doin the aggregate (Figure 2). All the details of these challenges were different: different problem toaddress, different business sponsor and goal, different audience, different type of knowledge or level ofexperience needed, different levels of participation among those invited (about 20% for Figure 4b vs2% for Figure 4f). All have the shape of a power law, all have about the same slope (! = 2.7 ± 0.3). Infact this is the general case: of all the data sets that we have examined only a few fail to have this patternand they share a common characteristic (see "Exceptions" below). Data that do not change theirdistribution when aggregated or dissected are "scale free", and since the power law is the onlydistribution with this property [5], Figures 2 and 4 are strong evidence for a power-law generatingprinciple underlying our innovation challenges. Anderson sees the same thing when he dives into the"tails within tails" of genres of music downloaded from Rhapsody ([4] pp 139-140).
Does this long tail tell us something about Pfizer, or about collaborative problem solving in thepharmaceutical industry? Yes, but it is much broader than that. Several equally large and diverse datasets generously offered by other clients (of TJW) show the familiar pattern (Figure 5).
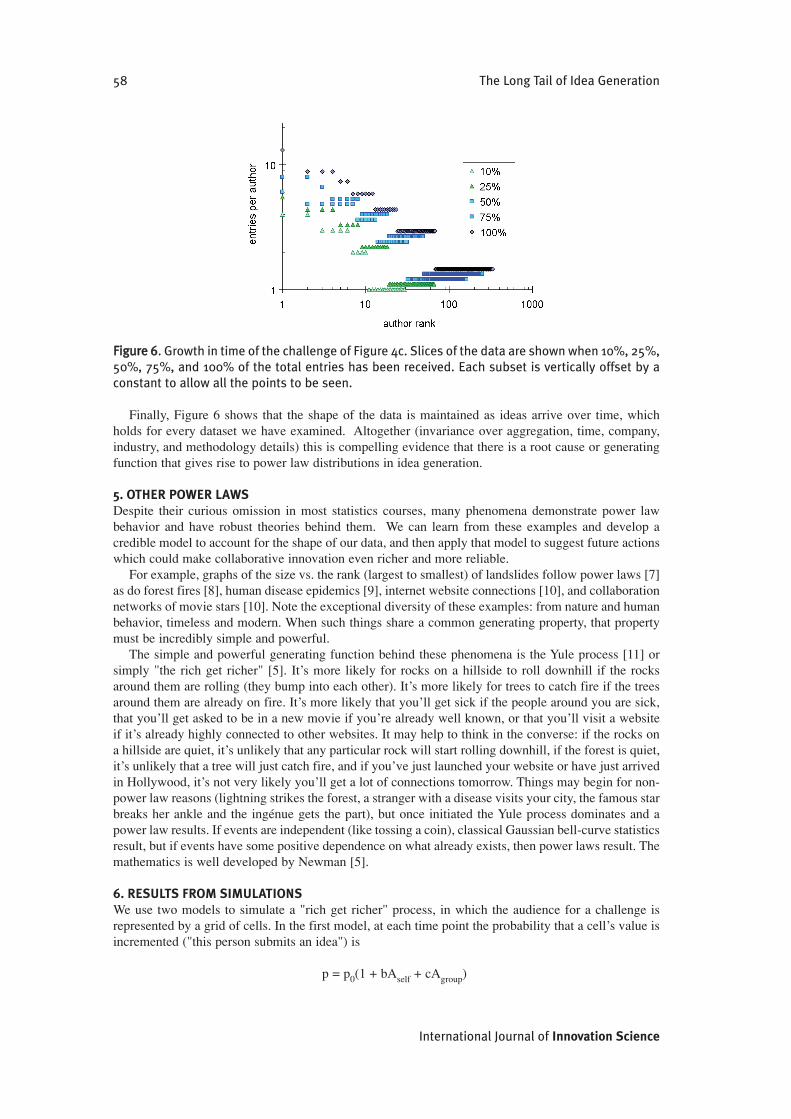
Figure 5. Rank-frequency plots for challenges at different companies. (a) individual challenges at(top to bottom) Cargill, Computer Sciences Corporation, Pfizer, and Bombardier, all lines have ! =3, (b) aggregated data sets from Cargill and Pfizer over 3-5 years each in large business units ofthousands of employees.
These companies represent agribusiness, pharmaceuticals, computer services, and aerospacemanufacturing. The employees are all different and separated by secure corporate firewalls. We see thesame patterns from others (who prefer to remain anonymous) in banking, insurance, and heavymanufacturing. There are no exceptions we have seen (barring the special cases noted below).
Nearly all of the data we have seen derive from the general challenge-based process and enablingsoftware offered by Imaginatik (which has Cargill, Pfizer, CSC, Bombardier, etc. as clients). But thisis not a special requirement either: the data of Figure 4a are derived from a public email "request forideas" system run by Pfizer for a number of years, and it shows the identical pattern and slope. Indeed,with differences only in the exponent of the power law, this pattern is seen at enormous scale in openparticipation forums like Digg and Wikipedia [6].
Robin Spencer and Timothy Woods 57
Volume 2 · Number 2 · 2010
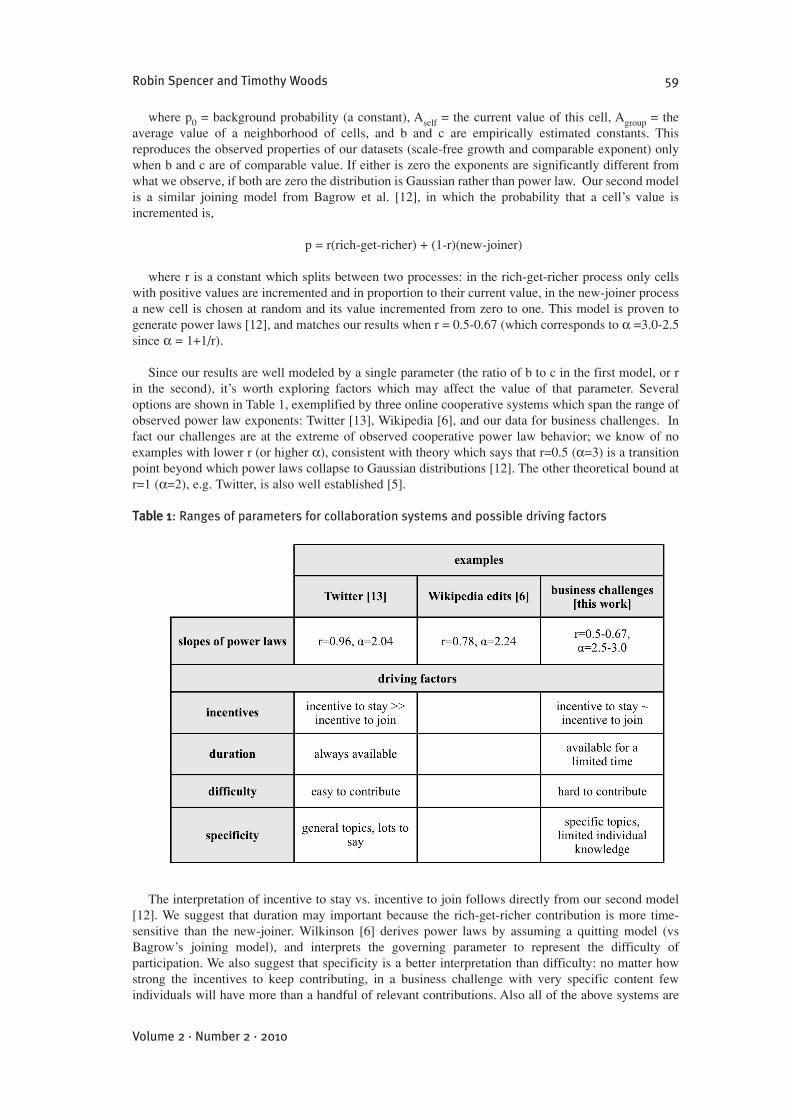
FFiigguurree 66. Growth in time of the challenge of Figure 4c. Slices of the data are shown when 10%, 25%,50%, 75%, and 100% of the total entries has been received. Each subset is vertically offset by aconstant to allow all the points to be seen.
Finally, Figure 6 shows that the shape of the data is maintained as ideas arrive over time, whichholds for every dataset we have examined. Altogether (invariance over aggregation, time, company,industry, and methodology details) this is compelling evidence that there is a root cause or generatingfunction that gives rise to power law distributions in idea generation.
5. OTHER POWER LAWSDespite their curious omission in most statistics courses, many phenomena demonstrate power lawbehavior and have robust theories behind them. We can learn from these examples and develop acredible model to account for the shape of our data, and then apply that model to suggest future actionswhich could make collaborative innovation even richer and more reliable.
For example, graphs of the size vs. the rank (largest to smallest) of landslides follow power laws [7]as do forest fires [8], human disease epidemics [9], internet website connections [10], and collaborationnetworks of movie stars [10]. Note the exceptional diversity of these examples: from nature and humanbehavior, timeless and modern. When such things share a common generating property, that propertymust be incredibly simple and powerful.
The simple and powerful generating function behind these phenomena is the Yule process [11] orsimply "the rich get richer" [5]. It’s more likely for rocks on a hillside to roll downhill if the rocksaround them are rolling (they bump into each other). It’s more likely for trees to catch fire if the treesaround them are already on fire. It’s more likely that you’ll get sick if the people around you are sick,that you’ll get asked to be in a new movie if you’re already well known, or that you’ll visit a websiteif it’s already highly connected to other websites. It may help to think in the converse: if the rocks ona hillside are quiet, it’s unlikely that any particular rock will start rolling downhill, if the forest is quiet,it’s unlikely that a tree will just catch fire, and if you’ve just launched your website or have just arrivedin Hollywood, it’s not very likely you’ll get a lot of connections tomorrow. Things may begin for non-power law reasons (lightning strikes the forest, a stranger with a disease visits your city, the famous starbreaks her ankle and the ingénue gets the part), but once initiated the Yule process dominates and apower law results. If events are independent (like tossing a coin), classical Gaussian bell-curve statisticsresult, but if events have some positive dependence on what already exists, then power laws result. Themathematics is well developed by Newman [5].
6. RESULTS FROM SIMULATIONSWe use two models to simulate a "rich get richer" process, in which the audience for a challenge isrepresented by a grid of cells. In the first model, at each time point the probability that a cell’s value isincremented ("this person submits an idea") is
p = p0(1 + bAself + cAgroup)
58 The Long Tail of Idea Generation
International Journal of Innovation Science
where p0 = background probability (a constant), Aself = the current value of this cell, Agroup = theaverage value of a neighborhood of cells, and b and c are empirically estimated constants. Thisreproduces the observed properties of our datasets (scale-free growth and comparable exponent) onlywhen b and c are of comparable value. If either is zero the exponents are significantly different fromwhat we observe, if both are zero the distribution is Gaussian rather than power law. Our second modelis a similar joining model from Bagrow et al. [12], in which the probability that a cell’s value isincremented is,
p = r(rich-get-richer) + (1-r)(new-joiner)
where r is a constant which splits between two processes: in the rich-get-richer process only cellswith positive values are incremented and in proportion to their current value, in the new-joiner processa new cell is chosen at random and its value incremented from zero to one. This model is proven togenerate power laws [12], and matches our results when r = 0.5-0.67 (which corresponds to ! =3.0-2.5since ! = 1+1/r).
Since our results are well modeled by a single parameter (the ratio of b to c in the first model, or rin the second), it’s worth exploring factors which may affect the value of that parameter. Severaloptions are shown in Table 1, exemplified by three online cooperative systems which span the range ofobserved power law exponents: Twitter [13], Wikipedia [6], and our data for business challenges. Infact our challenges are at the extreme of observed cooperative power law behavior; we know of noexamples with lower r (or higher !), consistent with theory which says that r=0.5 (!=3) is a transitionpoint beyond which power laws collapse to Gaussian distributions [12]. The other theoretical bound atr=1 (!=2), e.g. Twitter, is also well established [5].
TTaabbllee 11: Ranges of parameters for collaboration systems and possible driving factors
The interpretation of incentive to stay vs. incentive to join follows directly from our second model[12]. We suggest that duration may important because the rich-get-richer contribution is more time-sensitive than the new-joiner. Wilkinson [6] derives power laws by assuming a quitting model (vsBagrow’s joining model), and interprets the governing parameter to represent the difficulty ofparticipation. We also suggest that specificity is a better interpretation than difficulty: no matter howstrong the incentives to keep contributing, in a business challenge with very specific content fewindividuals will have more than a handful of relevant contributions. Also all of the above systems are
Robin Spencer and Timothy Woods 59
Volume 2 · Number 2 · 2010
technically easy to master; it cannot be the web interface which results in such consistent differences,but rather the content.
Our models and the literature offer little guidance on which of the driving forces above are morecorrect, or which others may be missing. All, alone or in combination, can be relevant. We offer themas aids to understanding and interpreting observed systems, and in planning experiments or strategy tochange outcomes.
7. NO NETWORKS NEEDEDNote that no "community" or "network" need be involved: as long as there is positive feedback fromthe group (c>0 and c~b, first model) whether that group consists of just a handful of nearest-neighborcells or the entire population, or its equivalent, a substantial level of new-joiners (1-r ~ 0.33-0.5, secondmodel), a good fit to observed data is seen. The data of Figure 4a corroborates this result: forconfidentiality reasons this public-facing idea solicitation site has been run as a blinded "drop box" suchthat contributors cannot see any content or any statistics from other previous contributors. They get nofeedback on others’ identities or behavior. This is an intriguing result because a considerable numberof power-law processes are claimed to rely on network feedback [10]. It may be that network effectscould augment idea generation ("I am more likely to contribute if I see my buddies or team membersdo so") but we have shown that it is not essential: only positive feedback from oneself ("I put in an ideabefore, so I’m more likely to again.") and a general background new-joiner rule are necessary.Interestingly, network theory may provide support for its own irrelevance: Ohtsuki et al [14] show thatall network topologies give the same results for feedback-driven cooperation, which may be telling usthat the network is moot and a very simple Bagrow-type model [12] suffices.
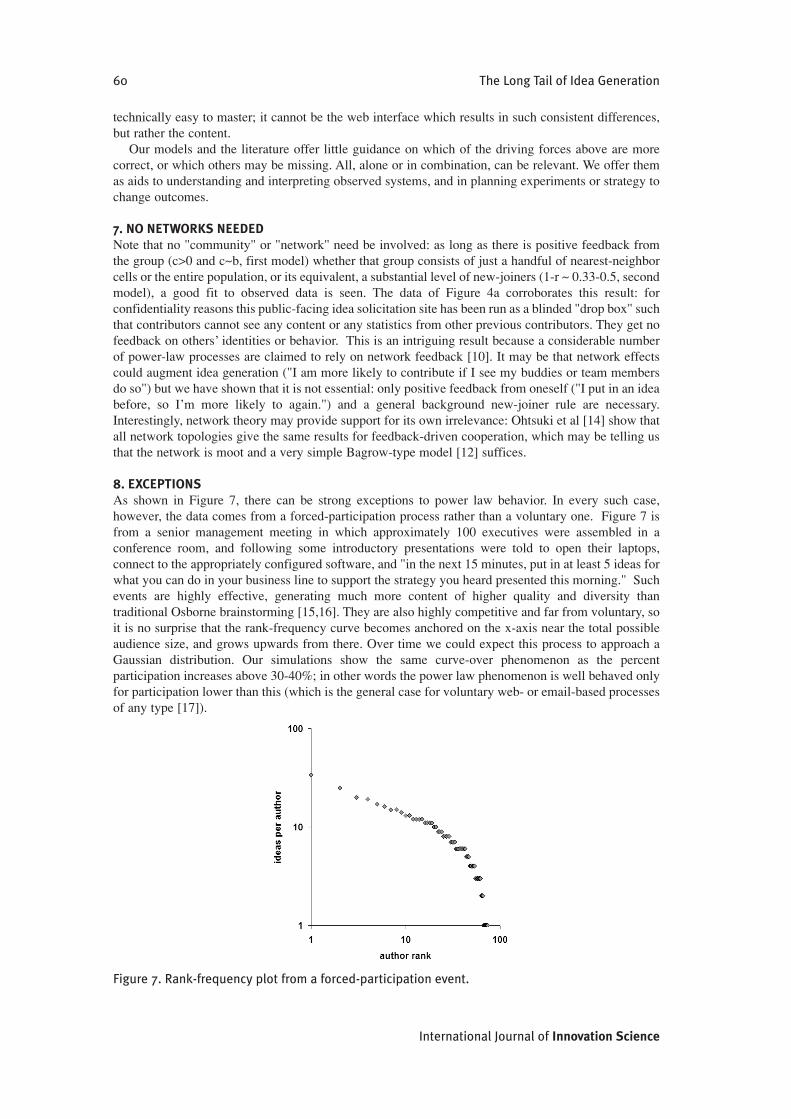
8. EXCEPTIONSAs shown in Figure 7, there can be strong exceptions to power law behavior. In every such case,however, the data comes from a forced-participation process rather than a voluntary one. Figure 7 isfrom a senior management meeting in which approximately 100 executives were assembled in aconference room, and following some introductory presentations were told to open their laptops,connect to the appropriately configured software, and "in the next 15 minutes, put in at least 5 ideas forwhat you can do in your business line to support the strategy you heard presented this morning." Suchevents are highly effective, generating much more content of higher quality and diversity thantraditional Osborne brainstorming [15,16]. They are also highly competitive and far from voluntary, soit is no surprise that the rank-frequency curve becomes anchored on the x-axis near the total possibleaudience size, and grows upwards from there. Over time we could expect this process to approach aGaussian distribution. Our simulations show the same curve-over phenomenon as the percentparticipation increases above 30-40%; in other words the power law phenomenon is well behaved onlyfor participation lower than this (which is the general case for voluntary web- or email-based processesof any type [17]).
Figure 7. Rank-frequency plot from a forced-participation event.
60 The Long Tail of Idea Generation
International Journal of Innovation Science
The aggregate data of Figure 2 contain a number of such forced events which may account for itsdownward trend at high author rank.
9. CONSEQUENCES FOR YOUR INNOVATION STRATEGYWe have seen that voluntary idea generation shows power-law behavior at all scales and across diverseuse-cases, companies, and industries. Simple simulations based on a positive feedback modelreproduce its behavior. Why does this matter?
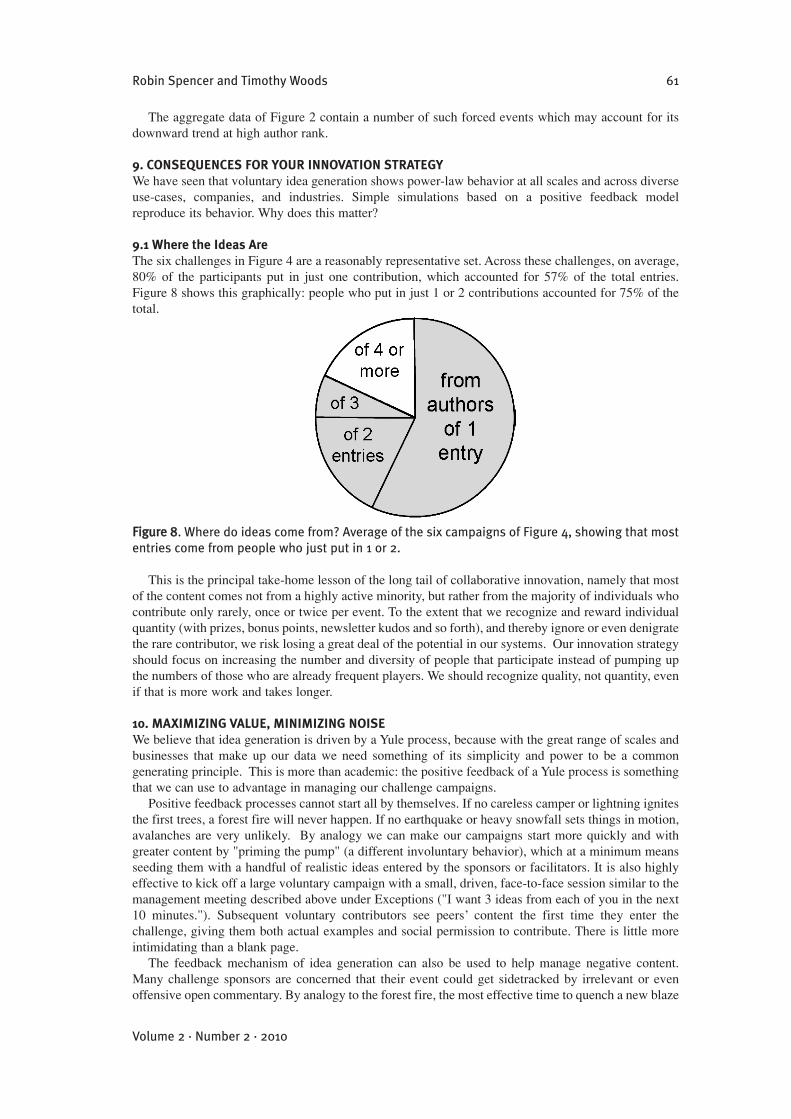
9.1 Where the Ideas AreThe six challenges in Figure 4 are a reasonably representative set. Across these challenges, on average,80% of the participants put in just one contribution, which accounted for 57% of the total entries.Figure 8 shows this graphically: people who put in just 1 or 2 contributions accounted for 75% of thetotal.
FFiigguurree 88. Where do ideas come from? Average of the six campaigns of Figure 4, showing that mostentries come from people who just put in 1 or 2.
This is the principal take-home lesson of the long tail of collaborative innovation, namely that mostof the content comes not from a highly active minority, but rather from the majority of individuals whocontribute only rarely, once or twice per event. To the extent that we recognize and reward individualquantity (with prizes, bonus points, newsletter kudos and so forth), and thereby ignore or even denigratethe rare contributor, we risk losing a great deal of the potential in our systems. Our innovation strategyshould focus on increasing the number and diversity of people that participate instead of pumping upthe numbers of those who are already frequent players. We should recognize quality, not quantity, evenif that is more work and takes longer.
10. MAXIMIZING VALUE, MINIMIZING NOISEWe believe that idea generation is driven by a Yule process, because with the great range of scales andbusinesses that make up our data we need something of its simplicity and power to be a commongenerating principle. This is more than academic: the positive feedback of a Yule process is somethingthat we can use to advantage in managing our challenge campaigns.
Positive feedback processes cannot start all by themselves. If no careless camper or lightning ignitesthe first trees, a forest fire will never happen. If no earthquake or heavy snowfall sets things in motion,avalanches are very unlikely. By analogy we can make our campaigns start more quickly and withgreater content by "priming the pump" (a different involuntary behavior), which at a minimum meansseeding them with a handful of realistic ideas entered by the sponsors or facilitators. It is also highlyeffective to kick off a large voluntary campaign with a small, driven, face-to-face session similar to themanagement meeting described above under Exceptions ("I want 3 ideas from each of you in the next10 minutes."). Subsequent voluntary contributors see peers’ content the first time they enter thechallenge, giving them both actual examples and social permission to contribute. There is little moreintimidating than a blank page.
The feedback mechanism of idea generation can also be used to help manage negative content.Many challenge sponsors are concerned that their event could get sidetracked by irrelevant or evenoffensive open commentary. By analogy to the forest fire, the most effective time to quench a new blaze
Robin Spencer and Timothy Woods 61
Volume 2 · Number 2 · 2010
is when it’s very small: a quick bucket of water does the trick while an army of firefighters will strugglewith a major blaze. Similarly, an attentive facilitator can stop irrelevant topics with a single calm butstern public comment. It is the public visibility of this cold water that makes it incredibly effective.There are many other best practices to mitigate this type of risk in a positive way which are beyond thescope of this article.
10.1 Lesson from Retail: Business as Usual is Not Good EnoughIn retail, the "head" is defined as the number of items (books or songs or movies) that a traditionalphysical store would carry. The head stops when the next-most-popular book is not likely to sell enoughto recoup the cost of offering it. The equivalent in business idea generation is calling meetings, creatinga team, or launching a task force: these are proven approaches to generating new ideas and building outoptions. But just like shelving a book, calling a meeting or forming a physical team has real costs inscheduling, logistics, travel, and disruption of other work. There is also a strong social limit to effectiveteam size with optima cited from 4 to 12 team members [18].
Imagine that we replaced the open electronic challenges of Figure 4 with teams limited to 10 peopleeach. Even if we were able to include only the most prolific people, we would have left 92% of theideas "down the tail," invisible to us. And yet by approaching business needs with small teams this isexactly what happens. We are not asserting that electronic media are superior to face-to-face smallteams in all tasks; certainly focused teams are proven and effective in their motivation, 100%participation, and follow-through. But in this internet age where electronic challenge forums are readilyavailable and easily implemented, to be restricted to tackling business needs only with small physicalteams is just as myopic, risky, and self-limiting as assuming that your friendly bookshop or music storecan ignore Amazon and iTunes forever.
11. ONGOING RESEARCHWe remain committed to ongoing research aimed at understanding and improving the efficiency andbusiness benefit that can be obtained from scalable collaboration methods. Our interests include (i)developing a value metric for ideas, (ii) investigating the scaling properties not just of ideas but on pagehits, written comments, and various voting and ranking techniques, and (iii) developing scalable, fairevaluation and decision strategies.
ACKNOWLEDGEMENTSThe support of Imaginatik (TJW) and Steve Street at Pfizer (RWS) is gratefully acknowledged, as wellas the generosity of Doug Phillips at Pfizer, Anne Rogers and Kurt Detloff at Cargill, Howard Smith atCSC, and David Wooten and Michael Hatrick at Bombardier for access to anonymized data sets.
REFERENCES[1] Sobel D., Longitude, Fourth Estate, London, 1995[2] Taleb N., The Black Swan, Random House, New York, 2007.[3] Ormerod P., Why Most Things Fail, Pantheon, New York, 2005, 173-179.[4] Anderson C., The Long Tail, Hyperion, New York, 2006[5] Newman M.E.J., Contemporary Physics 46, 323-351, 2005, arXiv:cond-mat/0412004v3.[6] Wilkinson D., Strong regularities in online peer production, in Proceedings of the 2008 ACM
Conference on E-Commerce, Chicago, IL, July 2008, atwww.hpl.hp.com/research/scl/papers/regularities/
[7] Guzzetti F., Malamu B., Turcott D., Reichenbach P., Earth and Planetary Science Letters 195,169-183, 2002
[8] Drossel B., Schwabl F., Phys. Rev. Lett. 69, 1629–1632, 1992, cited in [5][9] Rhodes C., Anderson R., Nature 381, 600-602, 1996[10] Barabasi A.L., Albert R., Science 286:509-512, 1999[11] Yule G., Philos. Trans. R. Soc. London B 213, 21–87, 1925, cited in [5].[12] Bagrow J., Sun J., ben-Avraham D., J. Phys. A: Math. Theor. 41, 185001, 2008,
arXiv:0712.2220v2
62 The Long Tail of Idea Generation
International Journal of Innovation Science

[13] Heil W., Piskorski M., Harvard Business School, athttp://blogs.harvardbusiness.org/cs/2009/06/new_twitter_research_men_follo.html# .The authorsquote 26.7 average tweets per Twitter contributor, so from Newman [5] equation 12 we canestimate !=2.04.
[14] Ohtsuki H., Hauert C., Lieberman E., Nowak M., Nature 441, 502-505, 2006[15] Spencer R., Innovation by the Side Door, in Research-Technology Management, 50: 5, pp 10-12, 2007[16] Johansson F., The Medici Effect, Harvard Business School Press, 2004[17] Nielsen J., Participation Inequality, at http://useit.com/alertbox/participation_inequality.html[18] Useem J., How to Build a Great Team, Fortune, June 1, 2006, at
http://money.cnn.com/2006/05/31/magazines/fortune/intro_greatteams_fortune_061206/index.htm[19] The preferential attachment simulator is open-source and available at
http://scaledinnovation.com#simulator
Robin Spencer and Timothy Woods 63
Volume 2 · Number 2 · 2010