Embed Size (px)
Citation preview
econstor www.econstor.eu
Der Open-Access-Publikationsserver der ZBW – Leibniz-Informationszentrum WirtschaftThe Open Access Publication Server of the ZBW – Leibniz Information Centre for Economics
Standard-Nutzungsbedingungen:
Die Dokumente auf EconStor dürfen zu eigenen wissenschaftlichenZwecken und zum Privatgebrauch gespeichert und kopiert werden.
Sie dürfen die Dokumente nicht für öffentliche oder kommerzielleZwecke vervielfältigen, öffentlich ausstellen, öffentlich zugänglichmachen, vertreiben oder anderweitig nutzen.
Sofern die Verfasser die Dokumente unter Open-Content-Lizenzen(insbesondere CC-Lizenzen) zur Verfügung gestellt haben sollten,gelten abweichend von diesen Nutzungsbedingungen die in der dortgenannten Lizenz gewährten Nutzungsrechte.
Terms of use:
Documents in EconStor may be saved and copied for yourpersonal and scholarly purposes.
You are not to copy documents for public or commercialpurposes, to exhibit the documents publicly, to make thempublicly available on the internet, or to distribute or otherwiseuse the documents in public.
If the documents have been made available under an OpenContent Licence (especially Creative Commons Licences), youmay exercise further usage rights as specified in the indicatedlicence.
zbw Leibniz-Informationszentrum WirtschaftLeibniz Information Centre for Economics
Lyons, Seán; Murphy, Liam; Tol, Richard S. J.
Working Paper
Estimating historical landfill quantities to predictmethane emissions
ESRI working paper, No. 333
Provided in Cooperation with:The Economic and Social Research Institute (ESRI), Dublin
Suggested Citation: Lyons, Seán; Murphy, Liam; Tol, Richard S. J. (2009) : Estimating historicallandfill quantities to predict methane emissions, ESRI working paper, No. 333
This Version is available at:http://hdl.handle.net/10419/50033
www.esri.ie
Working Paper No. 333
December 2009
Estimating Historical Landfill Quantities to Predict Methane Emissions
Seán Lyons,a Liam Murphya and Richard S.J. Tola,b,c
Abstract: We estimate Irish historical landfill quantities from 1960 -2008 and Irish methane emissions from 1968-2006. A model is constructed in which waste generation is a function of income, price of waste disposal and, household economies of scale. A transformation ratio of waste to methane is also included in the methane emissions model. Our results contrast significantly with the Irish Environmental Protection Agency’s (EPA) figures due to the differences in the underlying assumptions. The EPA’s waste generation and methane emission figures are larger than our estimates from the early 1990s onwards. Projections of the distance to target show that the EPA overestimates the required policy effort.
Key words: methane emissions, landfill, modelling
Corresponding Author: [email protected] a Economic and Social Research Institute, Whitaker Square, Sir John Rogerson’s Quay, Dublin 2, Ireland b Institute for Environmental Studies, Vrije Universiteit, Amsterdam, The Netherlands c Department of Spatial Economics, Vrije Universiteit, Amsterdam, The Netherlands
ESRI working papers represent un-refereed work-in-progress by members who are solely responsible for the content and any views expressed therein. Any comments on these papers will be welcome and should be sent to the author(s) by email. Papers may be downloaded for personal use only.
Estimating Historical Landfill Quantities to Predict Methane Emissions
Introduction A substantial amount of methane is emitted by waste decaying in landfills. This is a slow
process, with methane being emitted for 25 years or more after waste disposal. Methane
is the second-most important anthropogenic greenhouse gas. Emission reduction targets
are often formulated relative to 1990. This implies that waste data going back to 1965 are
needed to estimate methane emissions from landfill in 1990. In the absence of such data,
a model can be used. This paper describes a method for estimating historical disposal of
waste in landfills in order to predict historical and future emissions of methane, and it
applies the method to data from Ireland.
Articles 4 and 12 of the United Nations Framework Convention on Climate Change
(UNFCCC) state that signatory countries must publish their national inventories and
removals of all greenhouse gases not controlled by the Montreal Protocol (United Nations
2009). Ireland’s Environmental Protection Agency (EPA) is mandated to report emission
data to the UNFCCC. These greenhouse gas inventory levels are particularly important
due to Ireland’s commitment to reduce greenhouse gas levels to at least 20% below 1990
levels by 2020. Biodegradable waste disposed of in landfills is an important source of
methane, but these emissions are not normally directly measured: they must be imputed
by plugging historical waste disposal data into a model of waste decomposition.
The measurement of waste and the gas emissions (in particular greenhouse gas
emissions) that the waste emits is not an exact science. There are numerous papers which
have cast doubt upon the official greenhouse gas emission figures from waste. Ramirez et
al. (2008) consult experts and previous studies on the model parameters to construct a
Monte Carlo simulation on GHG emissions. They find that there is up to a 15%
uncertainty in Dutch methane emission levels at 95% confidence intervals. They believe
the main contributor to uncertainty in methane emissions to be managed solid waste
2
disposal. Similarly Winiwarter and Rypdal (2001), who use a similar methodology to
Ramirez et al. conclude that “the amount of waste stored in landfills was identified as the
parameter that contributed most strongly to trend uncertainties.” They find uncertainty in
Austrian methane emissions of 48.3% for 1990 and 47.5% for 1997 (again at 95%
confidence intervals) which are the only two years analysed. Both papers underline the
fact that there is large uncertainty in waste production and greenhouse gas emissions.
In Ireland the historical waste series is incomplete, which implies that we must first
estimate waste totals before predicting methane emissions. In the National Inventory
Report 2009, the EPA published statistics on Ireland’s generation of BMW and non-
BMW from 1990-2007. Actual data is only available in 1995, 1998 and annually from
2001 onwards. Hence we have to make a number of assumptions in order to calculate
BMW generations levels for all other years from 1990-2005. Some of these assumptions
include:
• Degradable Organic Carbon (DOC) is created by Municipal Solid Waste (MSW),
street cleanings and sludge from municipal wastewater treatment;
• MSW per-capita generation rates from 1995, 1998, 2001 and 2004 in addition to
those implied by earlier surveys are used to estimate MSW production in all
years;
• The ratio of street cleanings to MSW is estimated based on the figures for 1995,
1998 and 2001-2007;
• MSW is assumed to contain DOC in the following proportions: Organics – 15%,
Paper – 40% and Textiles – 40%; and
• The DOC contribution of sludge is determined from information on the
Biochemical Oxygen Demand (BOD) content, the BOD removal rate and the
proportion of sludge disposed to landfill.
Our calculation of EPA’s projected methane emissions are based upon an EPA
publication (Environmental Protection Agency 2009). This report does not explicitly
project methane emission levels however it does project greenhouse gas emission levels
3
from waste. We are assuming that methane emissions stay constant as a proportion of
greenhouse gas emissions and therefore grow at the same rate.
This paper estimates Ireland’s BMW generation from 1960-2008 (excluding the years
where actual data is available for obvious reasons). A simple constant elasticity demand
model for waste disposal is applied, using the number of households, income levels,
service sector production levels and commercial price levels to predict waste quantities.
Model parameters are drawn from previous research; in particular, the elasticities of
waste generation with respect to household disposable income and number of persons in
the household are used to estimate of residential waste, while the elasticity of demand
with respect to collection charges and service sector value added are used to estimate
commercial waste generation. Since these behavioural parameters are drawn from studies
that used data from different time periods and jurisdictions, they may not be correct today
let alone as far back as 1960. Hence it is necessary to carry out a sensitivity analysis of
these parameters as a robustness test.
Using the estimates of waste generated, we then predict methane emissions in Ireland
from 1968-2006. We model emissions from waste using the same model as applied by
the Irish EPA. We then compare our methane emissions estimates to the EPA’s figures.
The paper continues as follows. Section 2 discusses data and methods. Section 3 presents
the results. Section 4 concludes.
Data and Methodology
This paper takes the actual observations of waste sent to landfill in 1995, 1998 and 2001-
2006 as a staring point to calculate the data for all other years. These figures are taken
from the EPA’s National Waste Reports of the relevant years. We assume that residential
waste generation, RW, is a function of both the household density elasticity of waste
generation r (the percent change in waste per capita caused by a one percent change in
the number of persons per household, PPH), and the household income elasticity of
4
waste generation s (the percent change in waste generation per household caused by a one
percent change in real average disposable income, YD). For year t, this would be
estimated by:
ln( ) ln( ) ln( )t t tRW r PPH s YDα= + + (1)
The historical household income data is taken from the National Income and Expenditure
Accounts which are published by the Central Statistics Office (CSO). The population
data is also sourced from the CSO. Future household income data is taken from ESRI
forecasts (Bergin et al., 2009).
Commercial waste generation, CW, is assumed to be a function of the price elasticity of
demand of waste disposal m, the real price of waste collection PC, the output elasticity of
service sector waste demand n and the value added by the services sector, VAS. Thus, for
year t:
( ) ( ) (ln ln lnt tCW m PC n VASα= + + )t (2)
Unfortunately the CSO does not produce a wholesale price index for refuse disposal. The
CSO has however produced a Consumer Price Index for refuse since 1983. We take this
to be a proxy for the commercial price of refuse disposal. In the absence of other data, we
assume that the real price stayed constant for the period 1960-1983. This series reports a
large drop in 1997 due to the abolition of domestic water charges. As this change does
not apply to waste charges and has a large effect on the results, the series is adjusted to
remove the impact of the abolition of water charges. For future predictions, we assume
that the real price of refuse collection is constant from 2008-2020. The level of
commercial production is taken from the National Accounts, again published by the CSO.
This figure is however only available from 1970-2008.. Previous to this year, the ratio of
commercial waste generation to GDP within the economy is assumed constant and the
actual figure is deflated for the relevant lower GDP over the 1960-1969 period. Gross
Domestic Product (GDP) figures for this early period are sourced from the World
Resources Institute. Post 2008 figures for VAS are taken from forecasts by the ESRI
(Bergin et al., 2009).
5
The main waste parameter values are from a variety of previous papers. The household
income elasticity of waste generation is taken from Curtis et al. (2009). This paper
analysed panel data from 2003-2006 across the local authorities of Ireland. The data
shows a household income elasticity of waste generation of 1.08. Although this figure is
well above previous international studies, we feel it is more relevant as the figure is
calculated on Irish data. The sensitivity analysis below does consider different parameter
values. Choe and Fraser (1998) report income elasticities of waste generation from
several US studies and do not find a level higher than 0.6, so testing a lower figure than
the unit elasticity estimated from Irish data seems appropriate. We choose a value of 0.5.
The commercial price elasticity of demand parameter is taken from Jenkins (1993) who
carried out a study on nine American communities and found a result of -0.27. Another
study of American data carried out by Wertz (1976) found a result of -0.15 and other
experts have argued that the absolute cost of refuse disposal is so low that the commercial
price elasticity of demand for waste generation is effectively zero. A sensitivity analysis
of the model to price elasticity changes is undertaken below by setting the price elasticity
to zero. The parameter pertaining to household economies of scale is taken from Scott
and Watson (2006). They carry out a study on the imposition of waste charges in Ireland
and use household numbers as a control variable. From the coefficient of this variable the
household elasticity of waste generation figure can be formed. This figure is 0.486. In the
sensitivity analysis, the household density elasticity of waste generation is set to 0.
Finally, we assume that commercial waste has a unit elasticity with respect to the sector’s
value added. This represents a default position, since no direct estimates were available
for Ireland.
Once the waste levels have been estimated, we predict the related methane emissions.
The DOC in MSW, MSW, MSW to Landfill, Sludge and Street Cleaning figures are
taken from McGettigan et al (2009). For predictive purposes, the future levels of
management of DOC and the DOC in MSW are assumed to stay constant at 2008 levels
(95% of DOC managed and DOC comprising approximately 20% of MSW). It is
assumed that 0.6 of the DOC is dissimilated and that half of the methane remains in the
landfill (i.e. does not enter the atmosphere). The methane correction factor (MCF)
6
managed level is assumed to be 1 and the MCF unmanaged level is assumed to be 0.4.
The transformation from DOC to methane is taken to be 1.33 (but see the sensitivity
analysis). These parameters are taken from the National Inventory Report 2009. So while
this paper uses quite a different methodology to calculate waste generation, given that
level of waste generation the approach to calculate methane emissions is identical to the
approach used by the EPA. Using these assumptions, it is possible to estimate the total
managed and unmanaged methane emissions over the period.
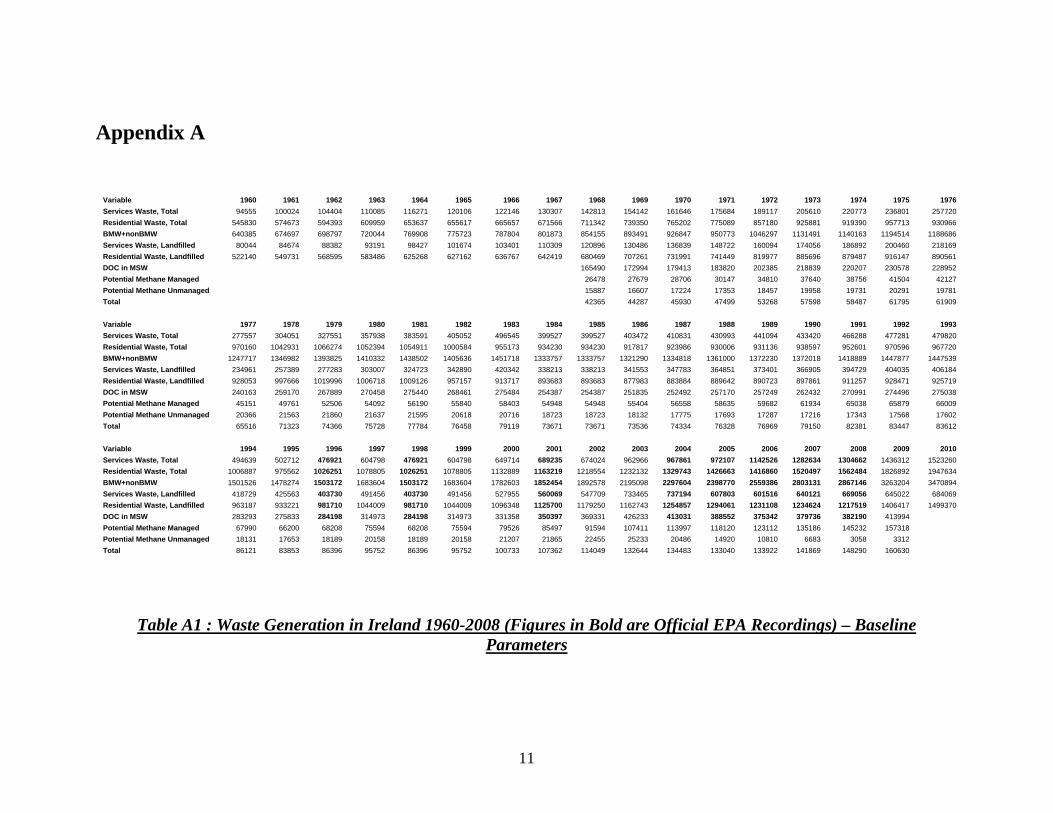
Results Table A1 shows the actual and estimated waste generation figures for Ireland from 1960-
2008 using the parameters as described above. Throughout the period, total waste (BMW
and non-BMW) followed an upward trend. Over the entire time period, total waste
increased by 369% from its 1960 base.
The following graphs show the sensitivity of the models to changes in selected
parameters. For each sensitivity test, the model was run varying a single parameter of
interest. Table 1 shows the parameter values of each of the adjusted models. Model YED
shows the effect of reducing the assumed elasticity of household waste demand with
respect to income from the baseline level of 1.08 to 0.5. Model PED reduces the price
elasticity of commercial waste demand equal to 0. This change would imply that
commercial waste generation is solely a function of the level of value added by the
services sector. Model Econ_Scale reduces the household economies of scale parameter
to zero. Model Trans_Ratio adjusts the transformation ratio of Dissolved Organic Carbon
to Methane to 1.
Figure 1 shows the total waste generation as predicted by the baseline and adjusted
models and the Irish Environmental Protection Agency (EPA). The Trans_Ratio model is
not included in this graph as the adjusted parameter has no influence upon the waste
generated (hence the values would have been identical to the baseline model). Because
the model is based on recent data and predicts earlier values, the baseline and adjusted
7
figures converge in recent times. Although there is some divergence in the past, this is
not particularly large considering the timeframe involved. The baseline and adjusted
models are lower than the EPA estimates from 1990 onwards.
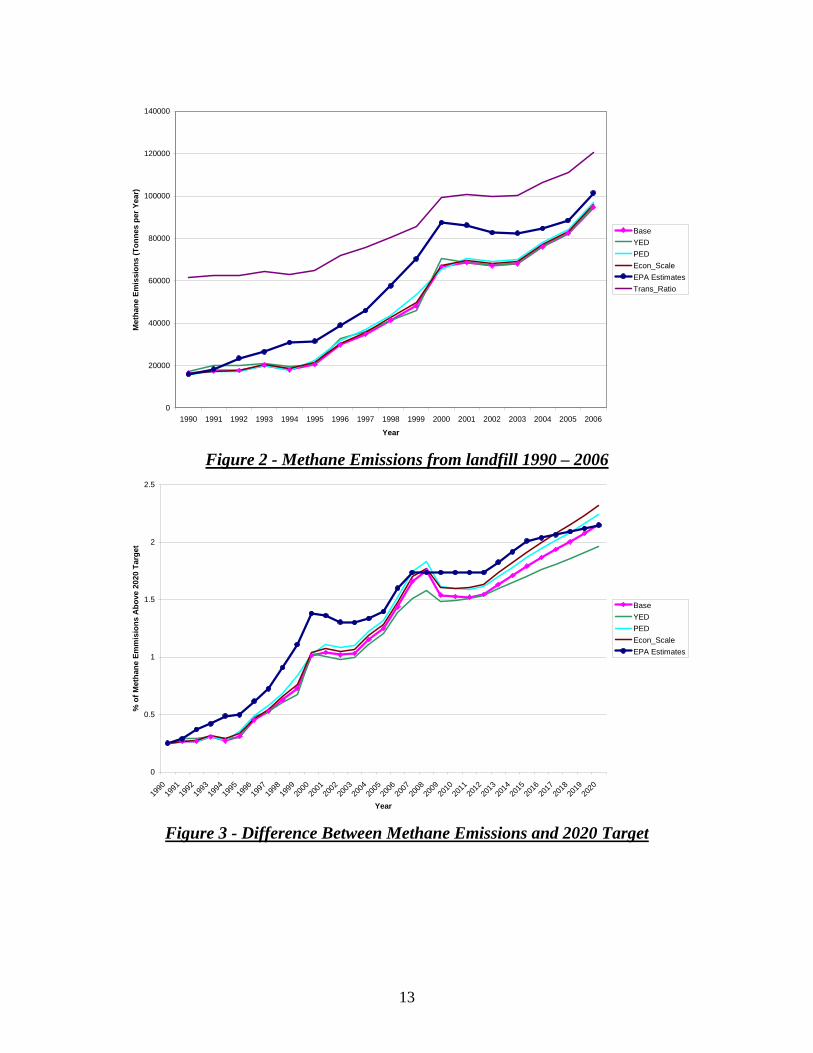
Figure 2 shows the baseline and adjusted models’ predicted methane emissions versus the
EPA’s methane estimates. The base model produces estimates quite similar to three of the
sensitivity test models: YED, PED and Econ_Scale. Predicted methane emissions are not
very sensitive to changes in these parameters. The EPA’s estimates are lower than our
model up until the early 1990s and higher after this point. There are substantial
differences between annual methane predictions from our model and the EPA series,
reaching more than 15,000 tonnes in some years.
The scenario that tests a unit value for the Transformation Ratio (“Trans_Ratio”) leads to
significantly lower predicted methane emissions. Methane emissions are highly sensitive
to changes in the assumed value of the Transformation Ratio parameter.
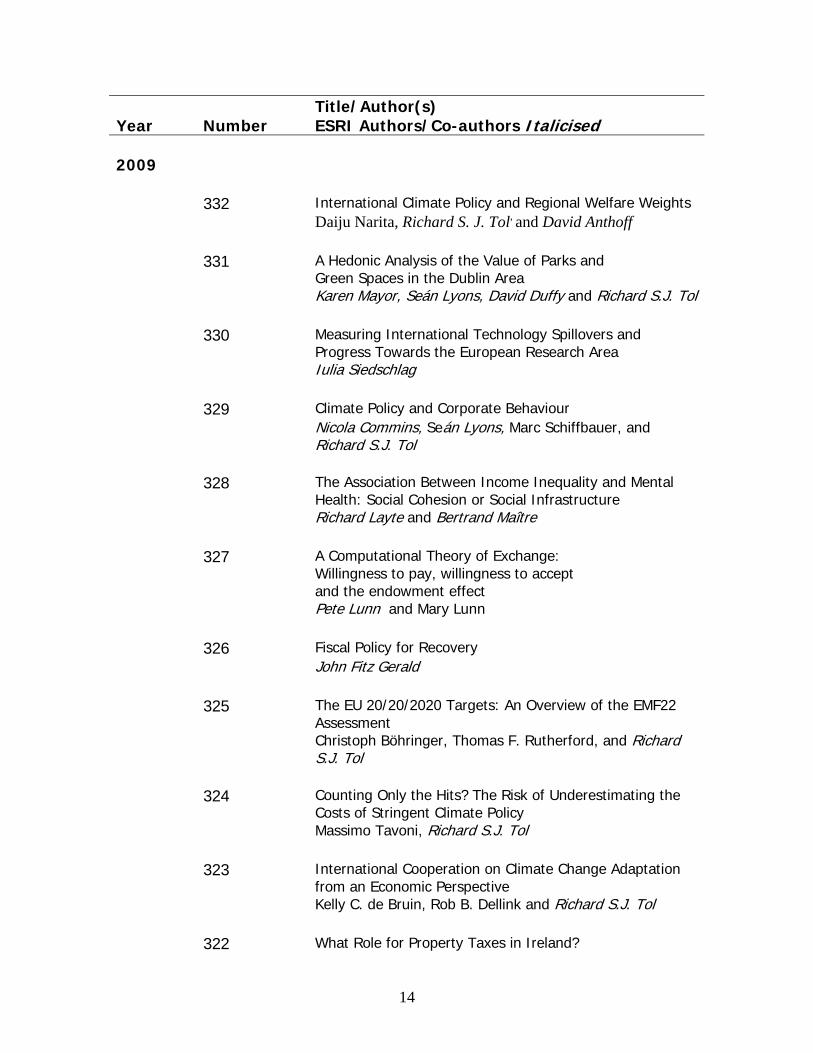
Figure 3 shows the percentage difference between the estimated level of methane
emissions from 1990-2020 and the target level of methane emissions for 2020 (20%
below 1990 emission levels). There is no Trans-Ratio series in this graph as the series is
identical to the baseline series. In all cases, estimated emissions exceed the target. The
EPA estimates are generally higher than our baseline estimates. That is, the EPA
overestimates the required emission reduction effort, because the EPA overestimates the
amount of waste in the past. In 2020, our estimate of the distance to target almost
coincides with the EPA estimate. This is because we project a faster increase in waste
than the EPA does (consistent with our faster increase in the past). In the short- and
medium term, the EPA overstates the methane-from-waste problem, but it understates it
in the long term.
Our baseline projection of the distance to target is very similar to the three alternative
projections (Econ_Scale, PED, YED). The alternative parameter values do not have a
large influence on the policy required to achieve the commitments.
8
Conclusion This paper set out to estimate the levels of waste generated by Ireland from 1960-2008 in
the years where actual observations were unavailable, as a means of estimating related
methane emissions. Using assumed demand functions and behaviour parameters we
estimated the total quantities of municipal waste produced in Ireland from 1960-2008 and
methane emitted from 1968-2006.
We carried out sensitivity tests on selected parameters in the model. There was little
change in the absolute waste generation levels due to changes in any parameter. The
predicted methane emissions are also quite insensitive to changes in all the parameters
with the exception of the Transformation Ratio. The value used for this parameter in the
baseline model is in line with international standards, so its sensitivity is not a matter for
concern per se. However, if future research were to indicate that a different value was
more appropriate, it is important that this information be taken into account in emission
prediction models. Overall, these sensitivity tests provide some comfort as to the
robustness of the model. However, other aspects of the model such as the functional
form assumed for each source of demand, is less amenable to sensitivity testing. Further
research should help cast light of the sensitivity of predicted landfill methane emissions
to such model design decisions.
The levels of waste generation and methane emissions estimated by our model are
different from the EPA’s estimates; in particular, our estimates suggest that methane
emissions from landfill are significantly lower than figures reported by the EPA. This
suggests that the distance to Kyoto targets may be less than currently thought, at least in
the medium term. However, such variations are to be expected given the uncertainty
about past waste emissions, as previously highlighted by Ramirez et al. (2008) and
Winiwarter and Rypder (2001).
9
10
References
1992, United Nations Framework Convention on Climate Change.
Bergin, A., Conefrey, T., Fitz Gerald, J., & Kearney, I. 2009, Recovery Scenarios for Ireland, ESRI, Dublin, 7.
Chongwoo, C. & Iain, F. 1998, "The economics of household waste management: a review", The Australian Journal of Agricultural and Resource Economics, vol. 42, no. 3, pp. 269-302.
Curtis, J., Lyons, S., & O'Callaghan-Platt, A. 2009Managing Household Waste in Ireland: Behavioural Parameters and Policy Options.
Enviromental Protection Agency 2009, Ireland's Greenhouse Gas Emission Projections 2008-2020, EPA, Wexford. Jenkins, R. R. 1993, The Economics of Solid Waste Generation, 1st edn, Edward Elgar Publishing Limited.
McGettigan, M., Duffy, P., Hyde, B., Hanley, E., & O'Brien, P. 2009, National Inventory Report 2009, Enviromental Protection Agency, Wexford.
Ramírez, A., de Keizer, C., Van der Sluijs, J. P., Olivier, J., & Brandes, L. 2008, "Monte Carlo analysis of uncertainties in the Netherlands greenhouse gas emission inventory for 1990-2004", Atmospheric Environment, vol. 42, no. 35, pp. 8263-8272.
Scott, S. & Watson, D. 2006, Introduction of Weight-Based Charges for Domestic Solid Waste: Final Reportt, Enviromental Protection Agency, Wexford.
Wertz, K. L. 1976, "Economic factors influencing households' production of refuse", Journal of Environmental Economics and Management, vol. 2, no. 4, pp. 263-272.
Winiwarter, W. & Rypdal, K. 2001, "Assessing the uncertainty associated with national greenhouse gas emission inventories: : a case study for Austria", Atmospheric Environment, vol. 35, no. 32, pp. 5425-5440.
Appendix A
Variable 1960 1961 1962 1963 1964 1965 1966 1967 1968 1969 1970 1971 1972 1973 1974 1975 1976 Services Waste, Total 94555 100024 104404 110085 116271 120106 122146 130307 142813 154142 161646 175684 189117 205610 220773 236801 257720 Residential Waste, Total 545830 574673 594393 609959 653637 655617 665657 671566 711342 739350 765202 775089 857180 925881 919390 957713 930966 BMW+nonBMW 640385 674697 698797 720044 769908 775723 787804 801873 854155 893491 926847 950773 1046297 1131491 1140163 1194514 1188686 Services Waste, Landfilled 80044 84674 88382 93191 98427 101674 103401 110309 120896 130486 136839 148722 160094 174056 186892 200460 218169 Residential Waste, Landfilled 522140 549731 568595 583486 625268 627162 636767 642419 680469 707261 731991 741449 819977 885696 879487 916147 890561 DOC in MSW 165490 172994 179413 183820 202385 218839 220207 230578 228952 Potential Methane Managed 26478 27679 28706 30147 34810 37640 38756 41504 42127 Potential Methane Unmanaged 15887 16607 17224 17353 18457 19958 19731 20291 19781 Total 42365 44287 45930 47499 53268 57598 58487 61795 61909 Variable 1977 1978 1979 1980 1981 1982 1983 1984 1985 1986 1987 1988 1989 1990 1991 1992 1993 Services Waste, Total 277557 304051 327551 357938 383591 405052 496545 399527 399527 403472 410831 430993 441094 433420 466288 477281 479820 Residential Waste, Total 970160 1042931 1066274 1052394 1054911 1000584 955173 934230 934230 917817 923986 930006 931136 938597 952601 970596 967720 BMW+nonBMW 1247717 1346982 1393825 1410332 1438502 1405636 1451718 1333757 1333757 1321290 1334818 1361000 1372230 1372018 1418889 1447877 1447539 Services Waste, Landfilled 234961 257389 277283 303007 324723 342890 420342 338213 338213 341553 347783 364851 373401 366905 394729 404035 406184 Residential Waste, Landfilled 928053 997666 1019996 1006718 1009126 957157 913717 893683 893683 877983 883884 889642 890723 897861 911257 928471 925719 DOC in MSW 240163 259170 267889 270458 275440 268461 275484 254387 254387 251835 252492 257170 257249 262432 270991 274496 275038 Potential Methane Managed 45151 49761 52506 54092 56190 55840 58403 54948 54948 55404 56558 58635 59682 61934 65038 65879 66009 Potential Methane Unmanaged 20366 21563 21860 21637 21595 20618 20716 18723 18723 18132 17775 17693 17287 17216 17343 17568 17602 Total 65516 71323 74366 75728 77784 76458 79119 73671 73671 73536 74334 76328 76969 79150 82381 83447 83612 Variable 1994 1995 1996 1997 1998 1999 2000 2001 2002 2003 2004 2005 2006 2007 2008 2009 2010 Services Waste, Total 494639 502712 476921 604798 476921 604798 649714 689235 674024 962966 967861 972107 1142526 1282634 1304662 1436312 1523260 Residential Waste, Total 1006887 975562 1026251 1078805 1026251 1078805 1132889 1163219 1218554 1232132 1329743 1426663 1416860 1520497 1562484 1826892 1947634 BMW+nonBMW 1501526 1478274 1503172 1683604 1503172 1683604 1782603 1852454 1892578 2195098 2297604 2398770 2559386 2803131 2867146 3263204 3470894 Services Waste, Landfilled 418729 425563 403730 491456 403730 491456 527955 560069 547709 733465 737194 607803 601516 640121 669056 645022 684069 Residential Waste, Landfilled 963187 933221 981710 1044009 981710 1044009 1096348 1125700 1179250 1162743 1254857 1294061 1231108 1234624 1217519 1406417 1499370 DOC in MSW 283293 275833 284198 314973 284198 314973 331358 350397 369331 426233 413031 388552 375342 379736 382190 413994 Potential Methane Managed 67990 66200 68208 75594 68208 75594 79526 85497 91594 107411 113997 118120 123112 135186 145232 157318 Potential Methane Unmanaged 18131 17653 18189 20158 18189 20158 21207 21865 22455 25233 20486 14920 10810 6683 3058 3312 Total 86121 83853 86396 95752 86396 95752 100733 107362 114049 132644 134483 133040 133922 141869 148290 160630
Table A1 : Waste Generation in Ireland 1960-2008 (Figures in Bold are Official EPA Recordings) – Baseline
Parameters
11
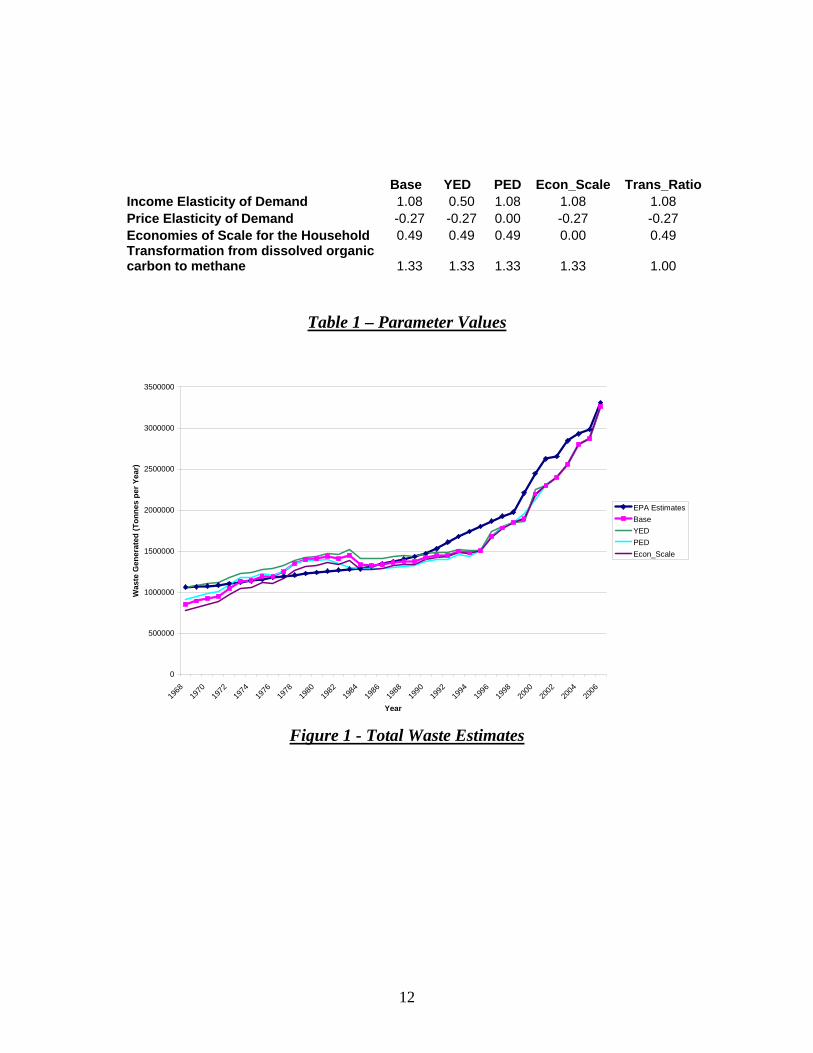
Base YED PED Econ_Scale Trans_RatioIncome Elasticity of Demand 1.08 0.50 1.08 1.08 1.08 Price Elasticity of Demand -0.27 -0.27 0.00 -0.27 -0.27 Economies of Scale for the Household 0.49 0.49 0.49 0.00 0.49 Transformation from dissolved organic carbon to methane 1.33 1.33 1.33 1.33 1.00
Table 1 – Parameter Values
0
500000
1000000
1500000
2000000
2500000
3000000
3500000
1968
1970
1972
1974
1976
1978
1980
1982
1984
1986
1988
1990
1992
1994
1996
1998
2000
2002
2004
2006
Year
Was
te G
ener
ated
(Ton
nes
per Y
ear)
EPA EstimatesBaseYEDPEDEcon_Scale
Figure 1 - Total Waste Estimates
12
0
20000
40000
60000
80000
100000
120000
140000
1990 1991 1992 1993 1994 1995 1996 1997 1998 1999 2000 2001 2002 2003 2004 2005 2006
Year
Met
hane
Em
issi
ons
(Ton
nes
per Y
ear)
BaseYEDPEDEcon_ScaleEPA EstimatesTrans_Ratio
Figure 2 - Methane Emissions from landfill 1990 – 2006
0
0.5
1
1.5
2
2.5
1990
1991
1992
1993
1994
1995
1996
1997
1998
1999
2000
2001
2002
2003
2004
2005
2006
2007
2008
2009
2010
2011
2012
2013
2014
2015
2016
2017
2018
2019
2020
Year
% o
f Met
hane
Em
mis
ions
Abo
ve 2
020
Targ
et
BaseYEDPEDEcon_ScaleEPA Estimates
Figure 3 - Difference Between Methane Emissions and 2020 Target
13
Year Number Title/Author(s) ESRI Authors/Co-authors Italicised
2009 332 International Climate Policy and Regional Welfare Weights Daiju Narita, Richard S. J. Tol, and David Anthoff 331 A Hedonic Analysis of the Value of Parks and
Green Spaces in the Dublin Area Karen Mayor, Seán Lyons, David Duffy and Richard S.J. Tol 330 Measuring International Technology Spillovers and
Progress Towards the European Research Area Iulia Siedschlag 329 Climate Policy and Corporate Behaviour Nicola Commins, Seán Lyons, Marc Schiffbauer, and
Richard S.J. Tol 328 The Association Between Income Inequality and Mental
Health: Social Cohesion or Social Infrastructure Richard Layte and Bertrand Maître 327 A Computational Theory of Exchange:
Willingness to pay, willingness to accept and the endowment effect
Pete Lunn and Mary Lunn 326 Fiscal Policy for Recovery John Fitz Gerald 325 The EU 20/20/2020 Targets: An Overview of the EMF22
Assessment Christoph Böhringer, Thomas F. Rutherford, and Richard
S.J. Tol 324 Counting Only the Hits? The Risk of Underestimating the
Costs of Stringent Climate Policy Massimo Tavoni, Richard S.J. Tol 323 International Cooperation on Climate Change Adaptation
from an Economic Perspective Kelly C. de Bruin, Rob B. Dellink and Richard S.J. Tol 322 What Role for Property Taxes in Ireland?
14
T. Callan, C. Keane and J.R. Walsh 321 The Public-Private Sector Pay Gap in Ireland: What Lies
Beneath? Elish Kelly, Seamus McGuinness, Philip O’Connell 320 A Code of Practice for Grocery Goods Undertakings and An
Ombudsman: How to Do a Lot of Harm by Trying to Do a Little Good
Paul K Gorecki 319 Negative Equity in the Irish Housing Market David Duffy 318 Estimating the Impact of Immigration on Wages in Ireland Alan Barrett, Adele Bergin and Elish Kelly 317 Assessing the Impact of Wage Bargaining and Worker
Preferences on the Gender Pay Gap in Ireland Using the National Employment Survey 2003
Seamus McGuinness, Elish Kelly, Philip O’Connell, Tim Callan
316 Mismatch in the Graduate Labour Market Among
Immigrants and Second-Generation Ethnic Minority Groups Delma Byrne and Seamus McGuinness 315 Managing Housing Bubbles in Regional Economies under
EMU: Ireland and Spain Thomas Conefrey and John Fitz Gerald 314 Job Mismatches and Labour Market Outcomes Kostas Mavromaras, Seamus McGuinness, Nigel O’Leary,
Peter Sloane and Yin King Fok 313 Immigrants and Employer-provided Training Alan Barrett, Séamus McGuinness, Martin O’Brien
and Philip O’Connell 312 Did the Celtic Tiger Decrease Socio-Economic Differentials
in Perinatal Mortality in Ireland? Richard Layte and Barbara Clyne 311 Exploring International Differences in Rates of Return to
Education: Evidence from EU SILC Maria A. Davia, Seamus McGuinness and Philip, J.
15
O’Connell 310 Car Ownership and Mode of Transport to Work in Ireland Nicola Commins and Anne Nolan 309 Recent Trends in the Caesarean Section Rate in Ireland
1999-2006 Aoife Brick and Richard Layte 308 Price Inflation and Income Distribution Anne Jennings, Seán Lyons and Richard S.J. Tol 307 Overskilling Dynamics and Education Pathways Kostas Mavromaras, Seamus McGuinness, Yin King Fok 306 What Determines the Attractiveness of the European Union
to the Location of R&D Multinational Firms? Iulia Siedschlag, Donal Smith, Camelia Turcu, Xiaoheng
Zhang 305 Do Foreign Mergers and Acquisitions Boost Firm
Productivity? Marc Schiffbauer, Iulia Siedschlag, Frances Ruane 304 Inclusion or Diversion in Higher Education in the Republic
of Ireland? Delma Byrne 303 Welfare Regime and Social Class Variation in Poverty and
Economic Vulnerability in Europe: An Analysis of EU-SILC Christopher T. Whelan and Bertrand Maître 302 Understanding the Socio-Economic Distribution and
Consequences of Patterns of Multiple Deprivation: An Application of Self-Organising Maps
Christopher T. Whelan, Mario Lucchini, Maurizio Pisati and Bertrand Maître
301 Estimating the Impact of Metro North Edgar Morgenroth 300 Explaining Structural Change in Cardiovascular Mortality in
Ireland 1995-2005: A Time Series Analysis Richard Layte, Sinead O’Hara and Kathleen Bennett 299 EU Climate Change Policy 2013-2020: Using the Clean
16
Development Mechanism More Effectively Paul K Gorecki, Seán Lyons and Richard S.J. Tol 298 Irish Public Capital Spending in a Recession Edgar Morgenroth 297 Exporting and Ownership Contributions to Irish
Manufacturing Productivity Growth Anne Marie Gleeson, Frances Ruane 296 Eligibility for Free Primary Care and Avoidable
Hospitalisations in Ireland Anne Nolan 295 Managing Household Waste in Ireland:
Behavioural Parameters and Policy Options John Curtis, Seán Lyons and Abigail O’Callaghan-Platt 294 Labour Market Mismatch Among UK Graduates;
An Analysis Using REFLEX Data Seamus McGuinness and Peter J. Sloane 293 Towards Regional Environmental Accounts for Ireland Richard S.J. Tol , Nicola Commins, Niamh Crilly, Sean
Lyons and Edgar Morgenroth 292 EU Climate Change Policy 2013-2020: Thoughts on
Property Rights and Market Choices Paul K. Gorecki, Sean Lyons and Richard S.J. Tol 291 Measuring House Price Change David Duffy 290 Intra-and Extra-Union Flexibility in Meeting the European
Union’s Emission Reduction Targets Richard S.J. Tol 289 The Determinants and Effects of Training at Work:
Bringing the Workplace Back In Philip J. O’Connell and Delma Byrne 288 Climate Feedbacks on the Terrestrial Biosphere and the
Economics of Climate Policy: An Application of FUND Richard S.J. Tol 287 The Behaviour of the Irish Economy: Insights from the
17
HERMES macro-economic model Adele Bergin, Thomas Conefrey, John FitzGerald and
Ide Kearney 286 Mapping Patterns of Multiple Deprivation Using
Self-Organising Maps: An Application to EU-SILC Data for Ireland
Maurizio Pisati, Christopher T. Whelan, Mario Lucchini and Bertrand Maître
285 The Feasibility of Low Concentration Targets:
An Application of FUND Richard S.J. Tol 284 Policy Options to Reduce Ireland’s GHG Emissions
Instrument choice: the pros and cons of alternative policy instruments
Thomas Legge and Sue Scott 283 Accounting for Taste: An Examination of Socioeconomic
Gradients in Attendance at Arts Events Pete Lunn and Elish Kelly 282 The Economic Impact of Ocean Acidification on Coral Reefs Luke M. Brander, Katrin Rehdanz, Richard S.J. Tol, and
Pieter J.H. van Beukering 281 Assessing the impact of biodiversity on tourism flows:
A model for tourist behaviour and its policy implications Giulia Macagno, Maria Loureiro, Paulo A.L.D. Nunes and
Richard S.J. Tol 280 Advertising to boost energy efficiency: the Power of One
campaign and natural gas consumption Seán Diffney, Seán Lyons and Laura Malaguzzi Valeri 279 International Transmission of Business Cycles Between
Ireland and its Trading Partners Jean Goggin and Iulia Siedschlag 278 Optimal Global Dynamic Carbon Taxation David Anthoff 277 Energy Use and Appliance Ownership in Ireland Eimear Leahy and Seán Lyons
18
276 Discounting for Climate Change David Anthoff, Richard S.J. Tol and Gary W. Yohe 275 Projecting the Future Numbers of Migrant Workers in the
Health and Social Care Sectors in Ireland Alan Barrett and Anna Rust 274 Economic Costs of Extratropical Storms under Climate
Change: An application of FUND Daiju Narita, Richard S.J. Tol, David Anthoff 273 The Macro-Economic Impact of Changing the Rate of
Corporation Tax Thomas Conefrey and John D. Fitz Gerald 272 The Games We Used to Play
An Application of Survival Analysis to the Sporting Life-course
Pete Lunn 2008 271 Exploring the Economic Geography of Ireland Edgar Morgenroth 270 Benchmarking, Social Partnership and Higher
Remuneration: Wage Settling Institutions and the Public-Private Sector Wage Gap in Ireland
Elish Kelly, Seamus McGuinness, Philip O’Connell 269 A Dynamic Analysis of Household Car Ownership in Ireland Anne Nolan 268 The Determinants of Mode of Transport to Work in the
Greater Dublin Area Nicola Commins and Anne Nolan 267 Resonances from Economic Development for Current
Economic Policymaking Frances Ruane 266 The Impact of Wage Bargaining Regime on Firm-Level
Competitiveness and Wage Inequality: The Case of Ireland Seamus McGuinness, Elish Kelly and Philip O’Connell 265 Poverty in Ireland in Comparative European Perspective
19
Christopher T. Whelan and Bertrand Maître 264 A Hedonic Analysis of the Value of Rail Transport in the
Greater Dublin Area Karen Mayor, Seán Lyons, David Duffy and Richard
S.J. Tol 263 Comparing Poverty Indicators in an Enlarged EU Christopher T. Whelan and Bertrand Maître 262 Fuel Poverty in Ireland: Extent,
Affected Groups and Policy Issues Sue Scott, Seán Lyons, Claire Keane, Donal McCarthy and
Richard S.J. Tol 261 The Misperception of Inflation by Irish Consumers David Duffy and Pete Lunn 260 The Direct Impact of Climate Change on Regional Labour
Productivity Tord Kjellstrom, R Sari Kovats, Simon J. Lloyd, Tom Holt,
Richard S.J. Tol 259 Damage Costs of Climate Change through Intensification
of Tropical Cyclone Activities: An Application of FUND
Daiju Narita, Richard S. J. Tol and David Anthoff 258 Are Over-educated People Insiders or Outsiders?
A Case of Job Search Methods and Over-education in UK Aleksander Kucel, Delma Byrne 257 Metrics for Aggregating the Climate Effect of Different
Emissions: A Unifying Framework Richard S.J. Tol, Terje K. Berntsen, Brian C. O’Neill, Jan S.
Fuglestvedt, Keith P. Shine, Yves Balkanski and Laszlo Makra
256 Intra-Union Flexibility of Non-ETS Emission Reduction
Obligations in the European Union Richard S.J. Tol 255 The Economic Impact of Climate Change Richard S.J. Tol 254 Measuring International Inequity Aversion
20
Richard S.J. Tol 253 Using a Census to Assess the Reliability of a National
Household Survey for Migration Research: The Case of Ireland
Alan Barrett and Elish Kelly 252 Risk Aversion, Time Preference, and the Social Cost of
Carbon David Anthoff, Richard S.J. Tol and Gary W. Yohe 251 The Impact of a Carbon Tax on Economic Growth and
Carbon Dioxide Emissions in Ireland Thomas Conefrey, John D. Fitz Gerald, Laura Malaguzzi
Valeri and Richard S.J. Tol 250 The Distributional Implications of a Carbon Tax in Ireland Tim Callan, Sean Lyons, Susan Scott, Richard S.J. Tol and
Stefano Verde 249 Measuring Material Deprivation in the Enlarged EU Christopher T. Whelan, Brian Nolan and Bertrand Maître 248 Marginal Abatement Costs on Carbon-Dioxide Emissions: A
Meta-Analysis Onno Kuik, Luke Brander and Richard S.J. Tol 247 Incorporating GHG Emission Costs in the Economic
Appraisal of Projects Supported by State Development Agencies
Richard S.J. Tol and Seán Lyons 246 A Carton Tax for Ireland Richard S.J. Tol, Tim Callan, Thomas Conefrey, John D.
Fitz Gerald, Seán Lyons, Laura Malaguzzi Valeri and Susan Scott
245 Non-cash Benefits and the Distribution of Economic Welfare
Tim Callan and Claire Keane 244 Scenarios of Carbon Dioxide Emissions from Aviation Karen Mayor and Richard S.J. Tol 243 The Effect of the Euro on Export Patterns: Empirical
Evidence from Industry Data Gavin Murphy and Iulia Siedschlag
21
242 The Economic Returns to Field of Study and Competencies
Among Higher Education Graduates in Ireland Elish Kelly, Philip O’Connell and Emer Smyth 241 European Climate Policy and Aviation Emissions Karen Mayor and Richard S.J. Tol 240 Aviation and the Environment in the Context of the EU-US
Open Skies Agreement Karen Mayor and Richard S.J. Tol 239 Yuppie Kvetch? Work-life Conflict and Social Class in
Western Europe Frances McGinnity and Emma Calvert 238 Immigrants and Welfare Programmes: Exploring the
Interactions between Immigrant Characteristics, Immigrant Welfare Dependence and Welfare Policy
Alan Barrett and Yvonne McCarthy 237 How Local is Hospital Treatment? An Exploratory Analysis
of Public/Private Variation in Location of Treatment in Irish Acute Public Hospitals
Jacqueline O’Reilly and Miriam M. Wiley 236 The Immigrant Earnings Disadvantage Across the Earnings
and Skills Distributions: The Case of Immigrants from the EU’s New Member States in Ireland
Alan Barrett, Seamus McGuinness and Martin O’Brien 235 Europeanisation of Inequality and European Reference
Groups Christopher T. Whelan and Bertrand Maître 234 Managing Capital Flows: Experiences from Central and
Eastern Europe Jürgen von Hagen and Iulia Siedschlag 233 ICT Diffusion, Innovation Systems, Globalisation and
Regional Economic Dynamics: Theory and Empirical Evidence
Charlie Karlsson, Gunther Maier, Michaela Trippl, Iulia Siedschlag, Robert Owen and Gavin Murphy
232 Welfare and Competition Effects of Electricity
22
Interconnection between Great Britain and Ireland Laura Malaguzzi Valeri 231 Is FDI into China Crowding Out the FDI into the European
Union? Laura Resmini and Iulia Siedschlag 230 Estimating the Economic Cost of Disability in Ireland John Cullinan, Brenda Gannon and Seán Lyons 229 Controlling the Cost of Controlling the Climate: The
Irish Government’s Climate Change Strategy Colm McCarthy, Sue Scott 228 The Impact of Climate Change on the Balanced-
Growth-Equivalent: An Application of FUND David Anthoff, Richard S.J. Tol 227 Changing Returns to Education During a Boom? The Case
of Ireland Seamus McGuinness, Frances McGinnity, Philip
O’Connell 226 ‘New’ and ‘Old’ Social Risks: Life Cycle and Social Class
Perspectives on Social Exclusion in Ireland Christopher T. Whelan and Bertrand Maître 225 The Climate Preferences of Irish Tourists by Purpose of
Travel Seán Lyons, Karen Mayor and Richard S.J. Tol 224 A Hirsch Measure for the Quality of Research Supervision,
and an Illustration with Trade Economists Frances P. Ruane and Richard S.J. Tol 223 Environmental Accounts for the Republic of Ireland: 1990-
2005 Seán Lyons, Karen Mayor and Richard S.J. Tol 2007 222 Assessing Vulnerability of Selected Sectors under
Environmental Tax Reform: The issue of pricing power
J. Fitz Gerald, M. Keeney and S. Scott 221 Climate Policy Versus Development Aid
23
Richard S.J. Tol 220 Exports and Productivity – Comparable Evidence for 14
Countries The International Study Group on Exports and
Productivity 219 Energy-Using Appliances and Energy-Saving Features:
Determinants of Ownership in Ireland Joe O’Doherty, Seán Lyons and Richard S.J. Tol 218 The Public/Private Mix in Irish Acute Public Hospitals:
Trends and Implications Jacqueline O’Reilly and Miriam M. Wiley
217 Regret About the Timing of First Sexual Intercourse:
The Role of Age and Context Richard Layte, Hannah McGee
216 Determinants of Water Connection Type and
Ownership of Water-Using Appliances in Ireland Joe O’Doherty, Seán Lyons and Richard S.J. Tol
215 Unemployment – Stage or Stigma?
Being Unemployed During an Economic Boom Emer Smyth
214 The Value of Lost Load Richard S.J. Tol 213 Adolescents’ Educational Attainment and School
Experiences in Contemporary Ireland Merike Darmody, Selina McCoy, Emer Smyth
212 Acting Up or Opting Out? Truancy in Irish Secondary
Schools Merike Darmody, Emer Smyth and Selina McCoy
211 Where do MNEs Expand Production: Location Choices
of the Pharmaceutical Industry in Europe after 1992 Frances P. Ruane, Xiaoheng Zhang
210 Holiday Destinations: Understanding the Travel
Choices of Irish Tourists Seán Lyons, Karen Mayor and Richard S.J. Tol
24
25
209 The Effectiveness of Competition Policy and the Price-
Cost Margin: Evidence from Panel Data Patrick McCloughan, Seán Lyons and William Batt
208 Tax Structure and Female Labour Market
Participation: Evidence from Ireland Tim Callan, A. Van Soest, J.R. Walsh