Embed Size (px)
Citation preview
IWIM - Institut für Weltwirtschaft und Internationales Management
IWIM- Institute for World Economicsand International Management
MARGINAL BENEFIT INCIDENCE ANALYSIS OF PUBLIC SPENDING ON HEALTH SERVICES IN NIGERIA
Reuben Adeolu Alabi
Department of Agricultural Economics, Ambrose Alli University, Ekpoma,
Nigeria
and
Alexander von Humboldt Research Fellow at the Institute for World
Economics and International Management
University of Bremen, Bremen, Germany
Berichte aus dem Weltwirtschaftlichen Colloquium
der Universität Bremen
Nr. 121
Hrsg. von
Andreas Knorr, Alfons Lemper, Axel Sell, Karl Wohlmuth
Universität Bremen

MARGINAL BENEFIT INCIDENCE ANALYSIS OF PUBLIC SPENDING ON HEALTH SERVICES IN NIGERIA
Reuben Adeolu Alabi1
Andreas Knorr, Alfons Lemper, Axel Sell, Karl Wohlmuth (Hrsg.):
Berichte aus dem Weltwirtschaftlichen Colloquium der Universität Bremen, Nr. 121, January 2011 ISSN 0948-3829
Bezug: IWIM - Institut für Weltwirtschaft und Internationales Management Universität Bremen Fachbereich Wirtschaftswissenschaft Postfach 33 04 40 D- 28334 Bremen Telefon: 04 21 / 2 18 – 3276 Telefax: 04 21 / 2 18 - 45 50 E-mail: [email protected] http://www.iwim.uni-bremen.de
1 The Grant from the Alexander Von Humboldt Foundation, which is based in Bonn, Germany, provided for this study is highly appreciated. Professor Karl Wohlmuth supervised the re-search and provided valuable logistic support for this research. His contribution to the aca-demic merit of this research output is unquantifiable. I am grateful to him and all the staff of IWIM in University of Bremen, Germany. The usual disclaimer applies.
Zusammenfassung
Die Studie schätzt die Grenznutzeninzidenz (MBI) der Staatsausgaben für das Gesundheitswesen in Nigeria. Die Nutzeninzidenz (BIA) und die Progressivität von des Nutzens (PB) wurden mit Hilfe der Distributive Analyse Stata-Paket (DASP) 2.1 Prozedur analysiert, wie in Araar und Duclos (2009) angege-ben. Die MBI wurde nach dem Verfahren von Ajwad und Wodok (2007) ge-schätzt. Die Studie nutzte Daten aus dem vom Nigeria Bureau of Statistics (NBS) erstellten Living Standard Household Survey (LSHS) aus dem Jahr 2004. Die Daten über die Impfung von Kindern sowie die Daten über die prä-und postnatale Beratung von Müttern wurden ebenfalls vom Living Standard Household Survey aus dem Jahre 2004 übernommen, um die Ziele der For-schungsarbeit zu erreichen. Das Ergebnis der Analyse zeigt, dass die Ausga-ben für die Bereitstellung von Gesundheitsleistungen in Nigeria nicht zu Guns-ten der Armen erfolgen, also nicht „pro-poor“ sind. Die Analyse der Grenznut-zeninzidenz der Ausgaben für das Gesundheitswesen in Nigeria zeigt, dass die ärmsten Gruppen in den Bereichen am meisten profitieren, in denen ihre aktuelle Beteiligung (Zugang zu Gesundheitsleistungen) hoch ist. Die Studie schließt mit Empfehlungen, wie die Armen in Nigeria stärker an den Leistun-gen des Gesundheitswesens partizipieren können, also wie die Zugangsmög-lichkeiten für diese Gruppen verbessert werden können.
Abstract
The study estimated the marginal benefit incidence (MBI) of government spending on the health service in Nigeria. Benefit incidence (BIA) and Pro-gressivity of Benefit (PB) were analysed by using the Distributive Analysis Stata Package (DASP) 2.1 procedure as indicated in Araar and Duclos (2009). MBI was estimated following the procedure of Ajwad and Wodon (2007). The study made use of the data from the Nigeria Bureau of Statistics (NBS) most recent Living Standard Household Survey conducted in 2004. The data on child vaccination, prenatal and postnatal consultation as contained in the Living Standard Household Survey were used to achieve the objectives of this study. The results of the analysis show that spending on health provision in Nigeria is not pro-poor. Marginal benefit incidence of spending on health services in Nigeria indicates that the poorest group will benefit more on the health services in which their current participation (accessibility) rate is high. The study concludes by making recommendations that can accelerate the speed at which the poor benefit more from particular health services by organ-ising increases in access to health services in Nigeria. Keywords: Marginal Benefit Incidence, Progressivity of Benefit, Public Spending Health Services Stichwörter: Grenznutzenanalyse Gesundheitsausgaben, Inzidenz Gesund-heitsausgaben, Partizipation Gesundheitsleistungen JEL-Classification: I10, I18
i
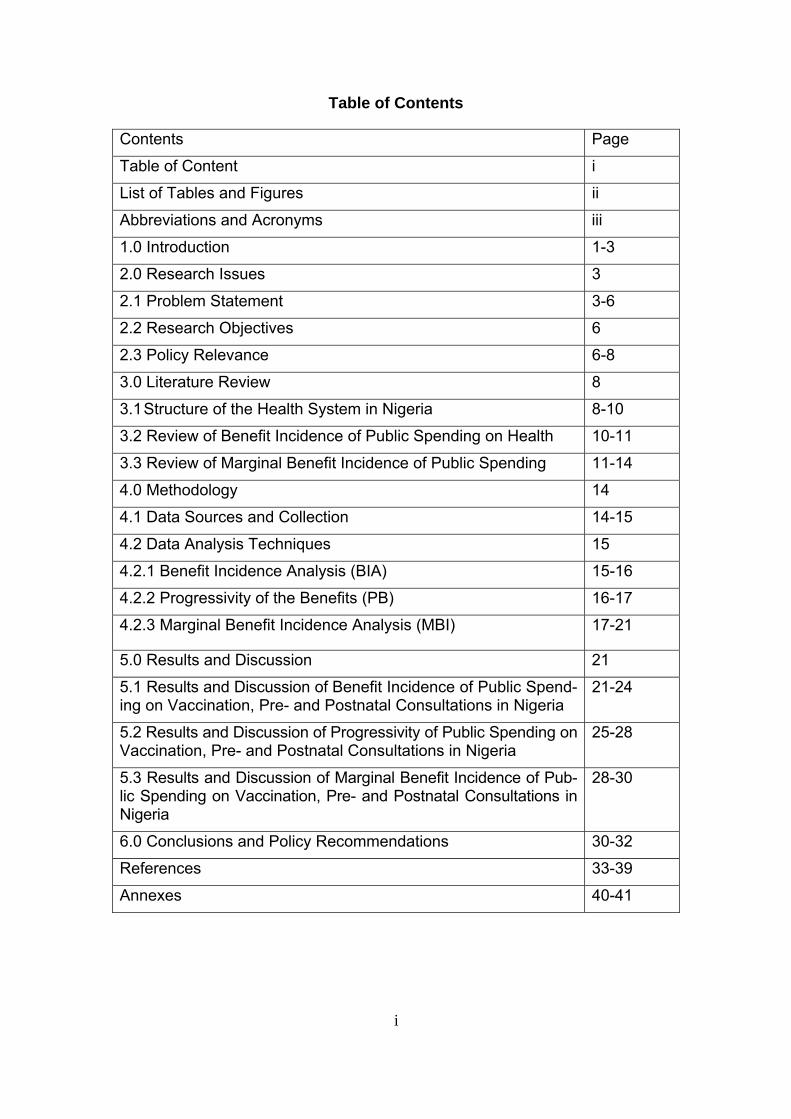
Table of Contents
Contents Page
Table of Content i
List of Tables and Figures ii
Abbreviations and Acronyms iii
1.0 Introduction 1-3
2.0 Research Issues 3
2.1 Problem Statement 3-6
2.2 Research Objectives 6
2.3 Policy Relevance 6-8
3.0 Literature Review 8
3.1 Structure of the Health System in Nigeria 8-10
3.2 Review of Benefit Incidence of Public Spending on Health 10-11
3.3 Review of Marginal Benefit Incidence of Public Spending 11-14
4.0 Methodology 14
4.1 Data Sources and Collection 14-15
4.2 Data Analysis Techniques 15
4.2.1 Benefit Incidence Analysis (BIA) 15-16
4.2.2 Progressivity of the Benefits (PB) 16-17
4.2.3 Marginal Benefit Incidence Analysis (MBI) 17-21
5.0 Results and Discussion 21
5.1 Results and Discussion of Benefit Incidence of Public Spend-ing on Vaccination, Pre- and Postnatal Consultations in Nigeria
21-24
5.2 Results and Discussion of Progressivity of Public Spending on Vaccination, Pre- and Postnatal Consultations in Nigeria
25-28
5.3 Results and Discussion of Marginal Benefit Incidence of Pub-lic Spending on Vaccination, Pre- and Postnatal Consultations in Nigeria
28-30
6.0 Conclusions and Policy Recommendations 30-32
References 33-39
Annexes 40-41
ii
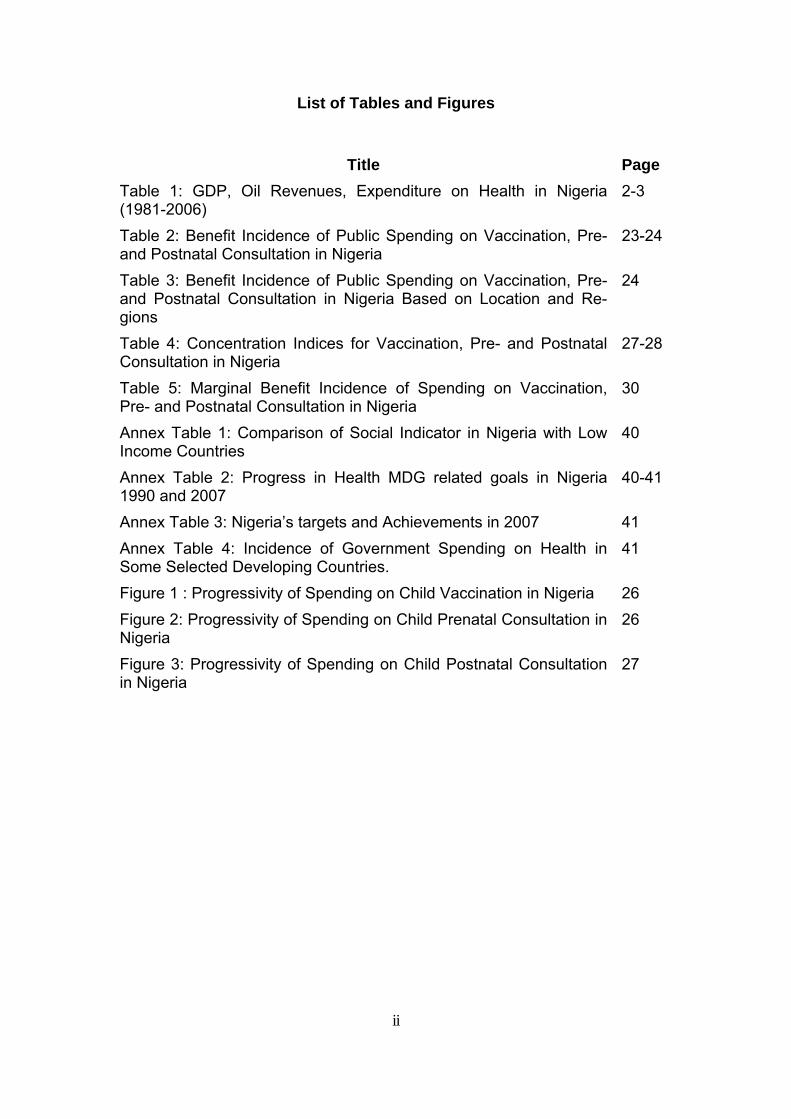
List of Tables and Figures
Title Page Table 1: GDP, Oil Revenues, Expenditure on Health in Nigeria (1981-2006)
2-3
Table 2: Benefit Incidence of Public Spending on Vaccination, Pre- and Postnatal Consultation in Nigeria
23-24
Table 3: Benefit Incidence of Public Spending on Vaccination, Pre- and Postnatal Consultation in Nigeria Based on Location and Re-gions
24
Table 4: Concentration Indices for Vaccination, Pre- and Postnatal Consultation in Nigeria
27-28
Table 5: Marginal Benefit Incidence of Spending on Vaccination, Pre- and Postnatal Consultation in Nigeria
30
Annex Table 1: Comparison of Social Indicator in Nigeria with Low Income Countries
40
Annex Table 2: Progress in Health MDG related goals in Nigeria 1990 and 2007
40-41
Annex Table 3: Nigeria’s targets and Achievements in 2007 41 Annex Table 4: Incidence of Government Spending on Health in Some Selected Developing Countries.
41
Figure 1 : Progressivity of Spending on Child Vaccination in Nigeria 26 Figure 2: Progressivity of Spending on Child Prenatal Consultation in Nigeria
26
Figure 3: Progressivity of Spending on Child Postnatal Consultation in Nigeria
27
iii
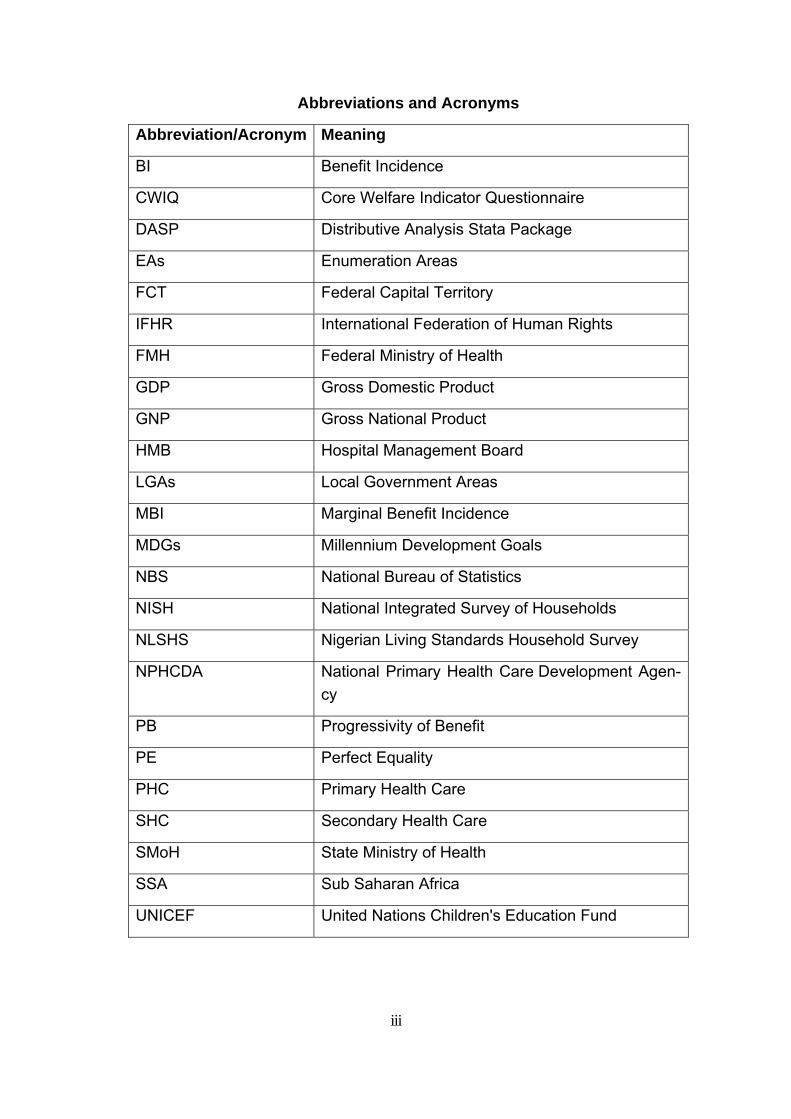
Abbreviations and Acronyms
Abbreviation/Acronym Meaning
BI Benefit Incidence
CWIQ Core Welfare Indicator Questionnaire
DASP Distributive Analysis Stata Package
EAs Enumeration Areas
FCT Federal Capital Territory
IFHR International Federation of Human Rights
FMH Federal Ministry of Health
GDP Gross Domestic Product
GNP Gross National Product
HMB Hospital Management Board
LGAs Local Government Areas
MBI Marginal Benefit Incidence
MDGs Millennium Development Goals
NBS National Bureau of Statistics
NISH National Integrated Survey of Households
NLSHS Nigerian Living Standards Household Survey
NPHCDA National Primary Health Care Development Agen-cy
PB Progressivity of Benefit
PE Perfect Equality
PHC Primary Health Care
SHC Secondary Health Care
SMoH State Ministry of Health
SSA Sub Saharan Africa
UNICEF United Nations Children's Education Fund
1
1.0 Introduction
With a population of over a 140 million people, Nigeria is the most
populous country in Africa, with a GDP second only to South Africa’s (Okonjo-
Iweala and Osafo-Kwaako, 2007). Nigeria’s economy depends heavily on the
oil and gas sector, which contributes 99 percent of export revenues, more
than 80 percent of government revenues. In about forty years of oil produc-
tion, Nigeria has earned over $400 billion at 1995 price from oil. With its large
reserves of human and natural resources, Nigeria has the potential to build a
prosperous economy, reduce poverty significantly, and provide the health ser-
vices its population needs. However, available evidence indicates that these
resources have not been judiciously managed to meet the need of the popula-
tion in terms of human capital development (Aigbokhan, et al, 2007).
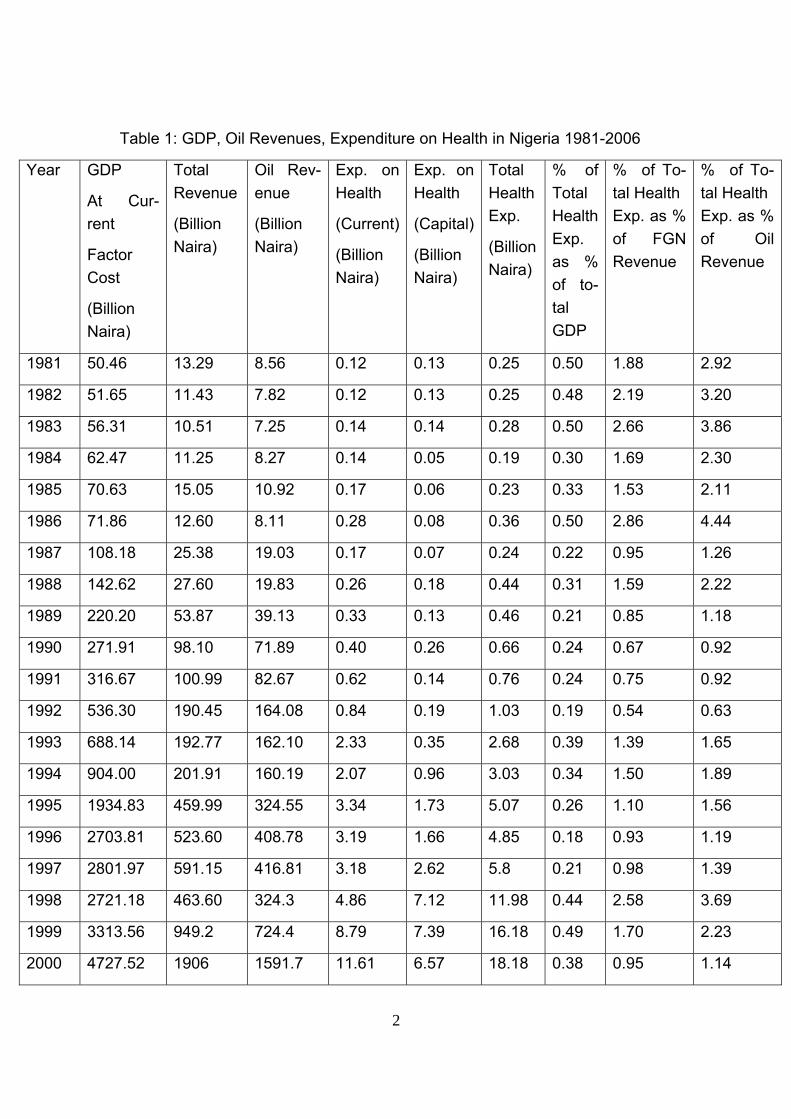
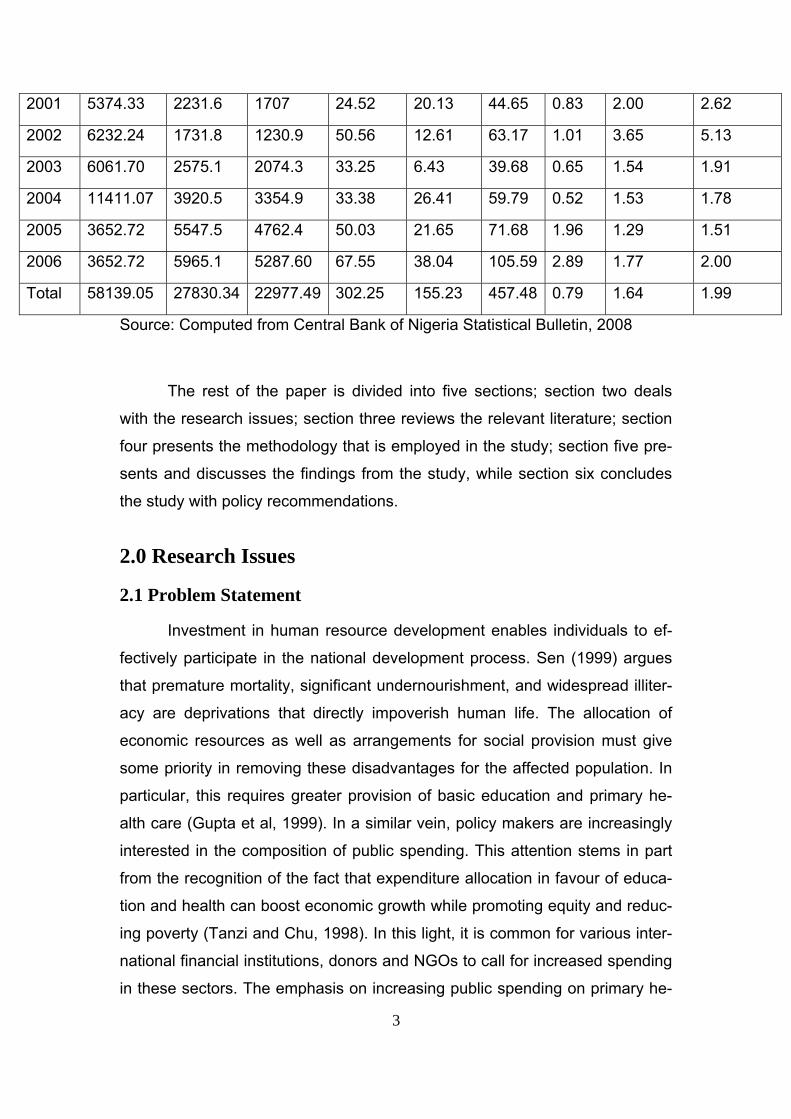
For instance, Nigeria generated about 23 trillion naira (191 billion US
dollars) from oil between 1981 and 2006, which is about 83% of total govern-
ment revenue. Less than 1% of GDP and about 2% of government revenue
respectively was allocated to health sector in Nigeria between 1981 and 2006
(Table 1). The fact that this low financial commitment will result in inequality in
access to health care resources and charges has been noted by Ogunbekun
et al (1999). Since majority of Nigerians are poor and pay for their health care
out of their pocket, many may be left out of health care provision. The Nigeria
Project Agenda (2007) has demonstrated that the accessibility to health care
facilities in Nigeria is low. It was revealed that only 3 out of 5 Nigerians have
access to health care facilities. However, how much did poor benefit from the-
se health infrastructures should be of interest to development economists be-
cause of the inequality that may be embedded in their distribution and social
distortions that they may generate. This makes the analysis of distributional
impact of public spending on health services in Nigeria of interest to me.
2
Table 1: GDP, Oil Revenues, Expenditure on Health in Nigeria 1981-2006
Year GDP
At Cur-rent
Factor Cost
(Billion Naira)
Total Revenue
(Billion Naira)
Oil Rev-enue
(Billion Naira)
Exp. on Health
(Current)
(Billion Naira)
Exp. on Health
(Capital)
(Billion Naira)
Total Health Exp.
(Billion Naira)
% of Total Health Exp. as % of to-tal GDP
% of To-tal Health Exp. as % of FGN Revenue
% of To-tal Health Exp. as % of Oil Revenue
1981 50.46 13.29 8.56 0.12 0.13 0.25 0.50 1.88 2.92
1982 51.65 11.43 7.82 0.12 0.13 0.25 0.48 2.19 3.20
1983 56.31 10.51 7.25 0.14 0.14 0.28 0.50 2.66 3.86
1984 62.47 11.25 8.27 0.14 0.05 0.19 0.30 1.69 2.30
1985 70.63 15.05 10.92 0.17 0.06 0.23 0.33 1.53 2.11
1986 71.86 12.60 8.11 0.28 0.08 0.36 0.50 2.86 4.44
1987 108.18 25.38 19.03 0.17 0.07 0.24 0.22 0.95 1.26
1988 142.62 27.60 19.83 0.26 0.18 0.44 0.31 1.59 2.22
1989 220.20 53.87 39.13 0.33 0.13 0.46 0.21 0.85 1.18
1990 271.91 98.10 71.89 0.40 0.26 0.66 0.24 0.67 0.92
1991 316.67 100.99 82.67 0.62 0.14 0.76 0.24 0.75 0.92
1992 536.30 190.45 164.08 0.84 0.19 1.03 0.19 0.54 0.63
1993 688.14 192.77 162.10 2.33 0.35 2.68 0.39 1.39 1.65
1994 904.00 201.91 160.19 2.07 0.96 3.03 0.34 1.50 1.89
1995 1934.83 459.99 324.55 3.34 1.73 5.07 0.26 1.10 1.56
1996 2703.81 523.60 408.78 3.19 1.66 4.85 0.18 0.93 1.19
1997 2801.97 591.15 416.81 3.18 2.62 5.8 0.21 0.98 1.39
1998 2721.18 463.60 324.3 4.86 7.12 11.98 0.44 2.58 3.69
1999 3313.56 949.2 724.4 8.79 7.39 16.18 0.49 1.70 2.23
2000 4727.52 1906 1591.7 11.61 6.57 18.18 0.38 0.95 1.14
3
2001 5374.33 2231.6 1707 24.52 20.13 44.65 0.83 2.00 2.62
2002 6232.24 1731.8 1230.9 50.56 12.61 63.17 1.01 3.65 5.13
2003 6061.70 2575.1 2074.3 33.25 6.43 39.68 0.65 1.54 1.91
2004 11411.07 3920.5 3354.9 33.38 26.41 59.79 0.52 1.53 1.78
2005 3652.72 5547.5 4762.4 50.03 21.65 71.68 1.96 1.29 1.51
2006 3652.72 5965.1 5287.60 67.55 38.04 105.59 2.89 1.77 2.00
Total 58139.05 27830.34 22977.49 302.25 155.23 457.48 0.79 1.64 1.99
Source: Computed from Central Bank of Nigeria Statistical Bulletin, 2008
The rest of the paper is divided into five sections; section two deals
with the research issues; section three reviews the relevant literature; section
four presents the methodology that is employed in the study; section five pre-
sents and discusses the findings from the study, while section six concludes
the study with policy recommendations.
2.0 Research Issues
2.1 Problem Statement
Investment in human resource development enables individuals to ef-
fectively participate in the national development process. Sen (1999) argues
that premature mortality, significant undernourishment, and widespread illiter-
acy are deprivations that directly impoverish human life. The allocation of
economic resources as well as arrangements for social provision must give
some priority in removing these disadvantages for the affected population. In
particular, this requires greater provision of basic education and primary he-
alth care (Gupta et al, 1999). In a similar vein, policy makers are increasingly
interested in the composition of public spending. This attention stems in part
from the recognition of the fact that expenditure allocation in favour of educa-
tion and health can boost economic growth while promoting equity and reduc-
ing poverty (Tanzi and Chu, 1998). In this light, it is common for various inter-
national financial institutions, donors and NGOs to call for increased spending
in these sectors. The emphasis on increasing public spending on primary he-
4
alth care is generally justified on the basis that such spending ameliortaes the
impact of diseases on the productive life years of the population(Gupta et al,
1999). It has been shown that the burden of diseases in developing countries
can be reduced greatly if governments were to make available a minimum
package of essential, cost effective clinical services (World Bank, 1993). Simi-
larly, many studies find that the contribution of public outlays to health status
as measured by infant mortality or child mortality is either smaller or statisti-
cally insignificant (Hammer et al,1995). Demery and Walton (1998) note that
public spending is a poor predictor of good health. In contrast, Ananh and Ra-
vallion (1993) and Hojman (1996) find that public health spending has a statis-
tically significant effect on health status. Similarly, Bidani and Ravallion (1993)
find that public spending has a beneficial impact on the health condition of the
poor.
The contradictions in some of the evidence presented in the above
mentioned studies can be explained by the fact that some relevant issues are
overlooked. Allocation of funds within the sectors is widely considered to be
important in explaining changes in social indicators, but these studies side-
step this issue. Also, the absence of a measureable impact of public spending
on indicators could be due to a differential effect on poor and non poor
groups, which are not captured by the aggregated social indicators in the stu-
dies reported above (Bidani and Ravallion, 1997; Gupta et al, 1999). The fact
that the health system resources are unevenly distributed is also not taken
into consideration. The fact that the allocation of these resources may not be
in the favour of the poor is another critical issue.
Mainardi (2007) reported that in developing countries (Nigeria inclu-
sive), public healthcare continues to fall short of demand, and remains un-
evenly distributed among the population. In several developing and transition
economies, public health expenditures are considered to have tended to fa-
vour an inappropriate allocation of medical resources (Mainardi, 2007). Re-
source misallocation appears to be reflected in unequal social and geographi-
cal accessibility of healthcare services, and insufficient attention to specific
types of ailments, forms of treatment, and measures of a preventive, rather
than curative nature. Shortcomings in health service provision include insuffi-
5
cient stock of facilities and personnel as well as wide disparities between ma-
jor urban centres and other areas. According to Marie-Claude (2008), in de-
veloping countries, some communities, regions and segments of the popula-
tion are particularly disadvantaged in terms of access to public resources, and
the uneven availability of such resources may contribute to the development
of health disparities.In the interest of economic and social progress, the use of
public resources must emphasize efficiency and equity. The efficient man-
agement of these resources is critical to growth, to human capital formation,
and to the welfare of the poor. Public expenditures offer significant opportuni-
ties for promoting growth and the equitable distribution of its fruits (Mainardi,
2007).
The issue of equity in distribution of economic benefits from public in-
vestment in health service is critical in Nigeria because of pervasive poverty
(more than 54% of population have been officially reported to be poor) and
high inequality (income inequality and health access inequality). In Nigeria,
accompanying economic growth that was experienced in 80s and 90s was se-
rious income inequality, disparity in access to health facilities, which are be-
lieved to have widened substantially. Despite past policy to correct this ab-
normality, inequality has increased the dimension of poverty in Nigeria (Alabi
et al, 2008). This is the reason that, as part of microeconomic objectives, Ni-
gerian government often give equitable distribution of income a priority
(Oyekale, et al, 2006). Achieving equitable distribution of income and allevia-
tion of poverty has for some time been a major development objective. Stud-
ies have, therefore, especially in the 1970s, appraised development policies in
terms of how far these objectives are being realized (Aigbokhan, 2000).
Moreover, public spending on health care services can be justified in Nigeria
because they will be of benefit to the poor. However, given the high level of
income inequality and disparity in access to these human capital development
resources, can increase in public spending on health services benefit the
poor? Will it benefit poor more than the rich? Have the very poor benefited
disproportionally more than the less-poor or even the non-poor from the im-
provements these spending brought about? Thus, these questions have to be
answered if a country wants to achieve poverty reduction in the short and the
6
long run. More importantly, for effective policies formulation and implementa-
tion on redistribution and poverty reduction, there is need to have knowledge
on the benefit incidence of public spending in Nigeria. What proportion of
poor people benefited from the past government spending can guide the fu-
ture spending and make it pro-poor. We still need to know who will benefit
from further expenditure, as Nigeria increased her budgetary allocation to
health sector by about 13-16% in 2008 (Budget, 2008). Nigeria Government
has a promised to channel more fund to health provision in order to achieve
the 7-Points Agenda, Millennium Development Goals (MDGs) and Vision
20202. However, if this future spending will benefit the poor depends on the
marginal benefit incidence of the spending which is the focus of this study.
2.2 Research Objectives
The core objective of this study is the determination of marginal benefit
incidence of Government spending on health services in Nigeria.
The specific objectives are to
(a) Estimate the benefit incidence and progressivity of government spending
on health (child vaccination, prenatal and postnatal consultation in public
health institutions) in Nigeria.
(b) Estimate marginal benefit incidence of government spending on health
(child vaccination, prenatal and postnatal consultation in public health institu-
tions) in Nigeria.
2.3 Policy Relevance
The need to study the benefit incidence in any Sub-Sahara African
(SSA) is necessary because overall progress and the distribution of progress
are likely to have been much more unfavourable in SSA (Grosse et al, 2006).
What aggravated poverty in Nigeria is high uneven distribution of income 2 Nigeria revenue profile is assumed to increase in the nearest future as a result of increase in oil price in the international market and favourable responses to tax reforms currently going on in the country.
7
(Okojie et al, 2001), which means that if care is not taken all the efforts of the
government’s spending at reducing poverty of the people may be aggravating
the gap between the poor and the rich, this may not necessarily reduce pov-
erty in the country. In fact, studies have shown that rise in inequality in Nigeria
over the last two decades, is a strong cause of high incidence of poverty
(Okojie and Shimeles, 2006). Hence, the study of benefit incidence of gov-
ernment spending in Nigeria is essential if poverty reduction goal is to be
maximized and inequality minimized in Nigeria.
According to Van de Walle (1995), the study on distributional outcomes
of public spending stems from three main sources. (i) Dissatisfaction with dis-
tributional outcomes in the absence of intervention. Market failures may leave
many households facing acute poverty. This may be the reason for protest
and violence in some part of Nigeria. But even a well-functioning market
economy can result in too much poverty and inequality according to prevailing
social norms. (ii) Lack of alternative policy instrument. In developed countries,
the tax system provides an additional redistributive device to promote equity.
In developing countries, where comprehensive income taxes are generally not
a viable option, the tax system is much less useful in this task. The public
spending’s role in distribution becomes that much vital3. (iii) The need for fis-
cal restraint and the sharp tradeoffs the government faces. Government play
a key role in the provision of certain public services, which are increasingly
seen to be of critical importance to developing countries, notably, inputs to
human capital development such as health care. Provision is expensive and
so hard policy choices come to fore. Information on distributional impacts, par-
ticularly the extent to which the poorest strata benefit can help in making
those choices. All these sources are inherent in the public system in Nigeria,
therefore the need to study distributional outcome of public spending in Nige-
ria.
Moreover, the Nigerian President said that he is more committed to
tackling the root causes of violence and poverty in the Nigeria. In that regard,
he came with a 7- Points Agenda for the development of Nigeria to achieve
3 In Nigeria, the tax component as part of total government revenue is less than 15%.
8
sustained growth and poverty reduction. These 7- Points Agenda is the
framework for achieving Vision 2020 by the government of Nigeria. The prin-
cipal focal areas of the agenda are: health care provision, education provision,
poverty reduction, inequality reduction and infrastructural development. The 7-
Point Agenda recognises that ‘middle class has all but disappeared in Nigeria.
The major aim of the Agenda is to introduce policies and measure that would
lead to the re-emergence of a vibrant middle class with positive impact on the
quality and standard of living of all Nigerians’ (Nigeria Project Agenda, 2007,
page 11). According to the Agenda, the challenge for on-going and future re-
forms in Nigeria is to ensure that the benefits positively affects and impacts all
Nigerians. It is to be noted that the past president always come with agenda
that is not based on scientific or analytical anchors. That most of the time,
makes the government spending on these focal areas expensive failure.
However, the current president has made it clear that the new administration
is open to scientific inputs from researchers so as to achieve the targets of
these Agenda (Jonathan, 2008). This study will provide a basis on which the-
se investments in health care provision can be based to make it pro-poor.
This study intends to do that by providing information on how the poor and
non poor are currently benefiting from the government spending, and how
they will benefit from further spending in the healthcare services. This may
form the basis for government redistributive efforts.
3.0 Literature Review
3.1 Structure of the Health System in Nigeria
All three levels of government, the Federal, State and Local Government
Areas (LGAs), have responsibilities for the provision of health care. The 36
States (and FCT) and 774 LGA's are responsible for all financial aspects
of Secondary Health Care (SHC) and Primary Health Care (PHC) depart-
ments, including personnel costs, consumables, running costs and capital in-
vestment. The Federal government sets overall policy goals, co-ordinates ac-
tivities, ensures quality, training and implements sector programmes such as
immunisation. The National Primary Health Care Development Agency
9
(NPHCDA) provides a source of technical knowledge and expertise on the
provision of PHC and monitors PHC delivery on behalf of the Federal Ministry
of Health. Public PHC services are funded and administered by the State Min-
istries of Health (SMoHs), which provide technical assistance to the
LGAs under the PHC Director in the SMoH. PHC services are the direct re-
sponsibility of LGAs whilst SHC services come under the State Hospital Man-
agement Board (HMB). However, there are very few links between the two
(FMH, 2009). As a result, the referral system is weak and undeveloped. Many
of the health problems that the country faces could be reduced through im-
provements at the primary care level, but there are many constraints. Accord-
ing to (FMH, 2009), inadequate financial resource ($2-3 per capita) for the
health sector is a major problem. Since the beginning of the economic crisis in
the 1980s, the health sector has suffered dramatically as all other public ser-
vice activity. Development and recurrent expenditure has declined resulting in
a scarcity of drugs and medical supplies, and the deterioration of facili-
ties. According to the World Bank (2000), public health financing of 0.3 per
cent of GNP in Nigeria remains lower in real per capita terms compared with
the late 1970s and early 1980s. About 60 per cent of health ser-
vice expenditure now occurs outside of the public sector on a range of non-
profit, traditional and modern practitioners. Nationally, the principal actors in
the formal private sector are for-profit patent medicine vendors and regis-
tered pharmacies. In Nigeria, nearly 15 per cent of Nigerian children do
not survive to their fifth birthday. Two leading causes of child mortality are ma-
laria (30 per cent), and diarrhoea (20 per cent). The importance of malaria as
devastating disease of children in Nigeria has been highlighted in Okafor and
Amzat (2007)4. Malnutrition contributes to 52 per cent of deaths of chil-
dren under five. There is a growing incidence and prevalence of non-
communicable diseases. For example, hypertension is generally estimated at
8-10 per cent for rural and 10-12 percent for urban communities. Okonjo-
Iweala and Osafo-Kwaako (2007) have reported low immunization of children
4According to Okafor and Amzat (2007), over 30% of all outpatient clinic visits are for ma-laria over 50% of outpatients attendances and 40% of hospital admissions, 30% of child mor-tality and 10% of maternal mortality are due to malaria in Nigeria.
10
in Nigeria. They reported that only 35% of the children that were supposed to
be immunized received measles vaccines in Nigeria, compared with an aver-
age of 63% for Low Income Countries (Annex Table 1). The consequences of
low immunisation are high infant and under-five mortality rates which were
higher than the average for the low income countries as reported by Okonjo-
Iweala and Osafo-Kwaako, 2007). The accessibility to health services was
65% as estimated by UNICEF (1996) in Nigeria, which is declining over the
year. The fact that the health conditions of Nigerians are poor and that Nigeria
is not making much progress toward achieving health millennium develop-
ment related goals is demonstrated in Annex Table 2. This is supported in
Annex Table 3, which illustrates that Nigeria was not able to achieve all the
health set goals for 2007.
3.2 Review of Benefit Incidence of Public Spending on Health
The past decade has seen a resurgence of interest in the relationship
between poverty and public spending in developing economies. This resur-
gence has fostered the return of incidence analysis, particularly, the benefit of
public spending in the social sectors. Although, analysis of tax incidence has
a long and venerable history in economics, distributional analysis of the bene-
fits of public spending and public policy generally is more recent (Younger,
2003). Benefit incidence analysis (BIA) is widely used to infer distributional
impacts of public spending. It depends on both the allocation of public spend-
ing and the behavior of households in using the services. While benefit inci-
dence analysis is a well-established tool in understanding who benefits from
public spending, it has its limitations. Among the most common criticisms of
standard benefit incidence analysis is that its description of average participa-
tion rates is not necessarily useful in guiding marginal changes in public
spending policies (Lipton and Ravallion, 1995). However, because of a pre-
sumed preference for public spending that benefits the poor people, pro-
grammes and policies are viewed as more favourable if the average participa-
tion of the poor people in such programmes and policies is higher than the
participation of non-poor people. A large increase in availability of nationally
representative household survey and the ease at which it can be computed
11
made it popular feature of poverty analysis in developing countries. The stan-
dard BIA method describes who is currently benefiting from a particular public
expenditure. As such, is a useful guide to the effects of a policy change that
distributes benefit in proportion to current benefits (Younger, 2003). There-
fore, standard BIA will be a useful guide in an efforts to redistribute current
benefits among the poor and non poor. This is more important in high income
inequality country as Nigeria. According to Reinikka (2002), employing BIA is
most deserving because of evidence of limited impact of public spending on
growth and human development outcome which is the case in Nigeria.
A vast body of literature exists on the incidence of government expendi-
tures. Most of the studies have used the benefit incidence approach on house-
hold data. Findings demonstrate that public expenditures are either progressive
or regressive and the share of different income groups varies depending on the
distribution of the benefits of the public expenditures across region, caste, relig-
ions, gender etc. (Hakro and Akram, 2007). The studies which demonstrate
progressiveness such as Rasmus et al. (2001) focus on the incidence of the
public expenditure on health (Mozambique data) and reported that the poorest
quintile of income groups receiving less than the share of the richest quintile.
Cross country studies such as Gupta et al. (2002) used 56 data sets and
showed that the increase in public expenditures on health are associated with
improvement in both access to and reduce the mortality rates in infants and
children. Hamid et al (2003) has also shown evidence of substantial cross-
country heterogeneity. A review of evidence from benefit incidence of public
spending in developing countries (Chu et al. 2000, covering 55 such studies)
highlighted some important findings. In the majority of cases, overall pub-
lic spending in each of the areas of health was found to be progressive, but it
was often poorly targeted, most often in Sub-Saharan Africa. The empirical
evidences of benefit incidence of spending on health in some selected devel-
oping countries are summarized in Annex Table 4.
3.3 Review of Marginal Benefit Incidence of Public Spending
A policy change that increases spending will not necessarily go to ex-
isting beneficiaries in proportion to their current benefits or even go to existing
12
beneficiaries at all. In these cases, standard BIA method may be insufficient in
analysing the distributional effects of public spending (Younger, 2003). In re-
sponse to these observations, several recent studies have proposed alterna-
tive methods to measure the marginal benefit incidence (MBI) of public spend-
ing. Marginal incidence analysis measures the incidence of actual increases
or proposed cuts in programme spending. This approach departs from stan-
dard benefit incidence analysis that attempts to estimate how the average
benefits from public spending are distributed at point in time (Van de Walle,
2002a). The latter can be deceptive about how changes in public expendi-
tures will be distributed. It is possible, for example, that the political economy
of incidence means that the rich tend to receive a large share of the infra-
marginal subsidies, while the poor benefit most from extra spending. Ravallion
(1999) provides a model of the political economy of fiscal adjustment that can
generate such an outcome. The simplest way to identify marginal incidence is
to compare average incidence across geographic areas with different degree
of programme sizes. This is essentially the method of the study by Lanjouw
and Ravallion (1999) who used data from India’s National Sample Survey
(NSS) for 1993-1994. Glick and Razakamanantsoa (2001) and Younger
(2002) examine shares of the change in benefit over time across the expendi-
ture distribution. Lanjouw and Ravallion (1999) estimate the ‘marginal odds of
participation’ for each expenditure quintile as the coefficient in a regression of
quintile and small area participation rates. Lanjouw et al. (2002) and Ravallion
(1999) apply a similar technique to panel data to control for fixed effect char-
acteristics. Younger (1999, 2002) considers marginal incidence to be the dis-
tribution of compensating variations for marginal policy changes, based on es-
timated demands for public services. Ajwad and Wodon (2002; 2003, and
2007) improved on the Lanjouw and Ravallion (1999) method by defining the
income quintile according to the position in the departmental distribution of in-
come, with the country being divided into several departments. The implica-
tion of this modification is that, the poorest household in the richest depart-
ment is classified as belonging to the poorest quintile, together with the poor-
est household in the poorest department, even though the poorest household
in the richest department may belong to a higher quintile in the overall distri-
13
bution of income. Lanjouw and Ravallion (1999) found out that primary school
enrolment rise with household expenditure per capita nationally, and in all
states. They indicated that enrolment tends to be lowest for the poorest quin-
tiles, and to increase as consumption per person increases. Their average
odd of enrolment (marginal benefit) suggests that subsidies to primary school-
ing would mildly favour the non-poor5. With a data set from Ecuador, Younger
(1999) used a combination of benefit and behavioral approaches and found that
public spending improves health and education indicators in developing coun-
tries. Ajwad and Wodon (2001) investigated whether people benefit more or
less than the non poor from an expansion in access to public services. In an-
swering the question, they applied marginal benefit incidence analysis to lo-
cal-level data from Bolivia and Paraguay. Their results indicated that the mar-
ginal benefit incidence is higher (or at least not systematically lower) for the
poor than for the non poor in most of the basic services. They concluded in
the paper that pro-poor policies must be implemented if the poor are to reap
the benefits of gains in access to social capital faster.
Ajwad and Wodon (2002) estimated average benefit and marginal
benefit incidence for Sri Lanka. In their study they revealed that the highest
disparities between the access rates of rich and poor households are for ac-
cess to electricity and indoor taps (i.e., piped water connection within the
house. In many cases, their estimates suggested that households in the poor-
est quintile would benefit more than the average household from an overall
increase in access rates. However, they claimed that the richest quintile of
households benefits more than the average household from an expansion in
access to public or private medical facility centre. Ajwad and Wodon (2003)
indicated that although there are important differences between different types
of services, in many cases marginal benefit incidence tends to be more pro-
poor than benefit incidence, especially once the non-poor already have high
levels of access. By contrast, when access rates are relatively low, special ef-
forts may be needed to ensure that the poor benefit from future increases in
access. This finding is reinforced in Ajwad and Wodon (2007) study in Bolivia
5 They did not split public from private schooling in the data they used.
14
and Paraguay.
Kruse et al (2009) estimated marginal benefit incidence analysis for In-
donesia. Taking into account behavioural responses to changes in publics
spending, they suggested that increased public health spending improves tar-
geting of public funds to the poor. At the margin, increased local public health
spending leads to net public resource transfers from the richest to the poorest
quarter of the population, as such spending increases both - public health
care utilization by the poor and the average benefit of public funds for the poor
through using these services. However, they concluded that initial utilization
shares still dominate the marginal benefits, such that the bulk of the benefits
accrue to the two middle quartiles. Hence, they recommended that for effec-
tive targeting of public resources to the poor, increased public health spending
induced through reallocation of central resources could be complemented with
more directly targeted demand side interventions, for example price subsidies
for the poor or social health insurance.
4.0 Methodology
4.1 Data Sources and Collections
This study was carried out in Nigeria. Nigeria lies between 40161 and
130531 North Latitude and between 20401 and 140411 East Longitude. It is lo-
cated in the West Africa bordered on the West by the Republic of Benin, on
the North by the Republic of Niger and on the east by the Republic of Camer-
oon. To the South, Nigeria is bordered by approximately 800 kilometers of the
Atlantic Ocean, stretching from Badagry in the west to the Rio del Rey in the
east. The country also occupies a land area of 923,768 kilometers and the
vegetation ranges from mangrove forest on the coast to desert in the far
north.
Administration-wise, Nigeria consists of 36 states and a Federal Capital
Territory. Each state is further divided into Local Government Areas (LGAs).
These are presently 774 LGAs in the country. Nigeria returned into democ-
ratic rule in May 1999 under presidential system of government at federal,
state and local government area levels. The federal government comprises of
15
an Executive arm, a bicameral legislative arm and the judiciary. Each state
has her own executive arm and house of assembly while each local govern-
ment has a chairman and a council. The total population of Nigeria according
to 2005 census was about 140 million.
The study made use of Nigeria Bureau of Statistics (NBS)’s Living
Standard Household Survey conducted in 2004. The Household Survey was
conducted with assistance from European Union, World Bank, Department for
International Development and United Nations Development Programme to
ensure good quality of the data generation. The survey had a national cover-
age, that is, all the 36 states of the Federation including the Federal Capital
Territory of Abuja were covered. The sample design for the survey was a two
stage stratified sample design. The first stage was the division of each state
into clusters called Enumeration Areas (EAs), while the second stage was the
division of enumeration areas into housing units. One hundred and twenty
(120) EAs were created for each state and 60 EAs for the Federal Capital Ter-
ritory for the twelve months survey duration. Ten EAs for each state and five
EAs for the FCT were covered per month (The survey was conducted through
the twelve months period). In each of the enumeration areas, 5 housing units
were scientifically selected and studied. On the whole, 600 housing units were
studied per state and 300 for the FCT. The survey has information on 96,610
respondents from 19,158 households. Data on health (child vaccination, pre-
natal and postnatal consultations in public health institution) based on loca-
tion, region and per capita expenditure (deflated by the region current prices)
were extracted from the survey and analysed in this study.
4.2 Data Analysis Techniques
4.2.1 Benefit Incidence Analysis (BIA)
The main objective of using a benefit incidence approach is to analyse
the distribution of benefits from the use of public services according to the dis-
tribution of living standards. Two main sources of information are used. The
first informs on the access of household members to public services. The
benefit incidence approach combines the use of these two sources
of information to analyse the distribution of public benefits and its progressiv-
16
ity. The advantage of Distributive Analysis Stata Package (DASP) 2.1 is the
possibility of using frequency data approach when information about the level
of total public expenditure is not available6. We performed Benefit Incidence
using Distributive Analysis Stata Package (DASP) 2.1 procedure as indicated
in Araar and Duclos (2009). This was done for all categories of the benefits
(child vaccination, prenatal and postnatal care based on location (rural and
urban) region (there are six regions in Nigeria) and nationally. Improving the
health status of the poor makes a significant contribution to escape from pov-
erty. Child vaccination, prenatal and postnatal consultations in public health
institutions were selected as health service indicators in this study because
they are preventive measures to reduce infant and maternal mortalities which
were reported to be higher in Nigeria than the average for the Low Income
Countries (Okonjo-Iweala and Osafo-Kwaako, 2007)7. McGuire (2006) has
shown that in a cross section of developing countries, access to maternal and
infant health programs was correlated with decreased under-five mortality.
4.2.2 Progressivity of the Benefits (PB)
Progressivity of Benefit (PB) was analysed using Distributive Analysis
Stata Package (DASP) 2.1 procedure as indicated in Araar and Duclos
(2009). In following their procedure, we estimated the progressivity of benefit
by comparing the Lorenz and concentration curves. In doing this, the house-
hold expenditure of the people was ranked in ascending order; then the bene-
fits (child vaccination, pre and postnatal consultation) were ranked according
to their associated expenditure. The concentration curve shows the proportion
of benefit enjoyed by the bottom p proportion of population. We supplemented
the estimation of progressivity with concentration Index. Normally, the higher
the index, the more concentrated is the benefit and the higher the inequality. 6 We were not able to get information on expenditure on these social services as the govern-ment agencies considered them as official documents. This fact that Nigeria government is reluctant in releasing some of their expenditure profile has been alluded to by Hinchliffe (2002). 7The fact that under five mortality rate of 194 estimated for Nigeria is higher than the average for SSA can be attributed to the decline in immunization between 1990 and 2007. The measles immunization declined from 54% to 35% within the period, while it increases form 56% to 73% between 1990 and 2007 in SSA (Alabi and Adams, 2010).
17
Hence, of the two benefit schemes, the more regressive one would be asso-
ciated with the highest concentration index (Kamgnia, 2008).
4.2.3 Marginal Benefit Incidence Analysis
To determine whether a government maximizes average access rates
across municipalities over time, it is typically necessary to have panel
data with information on both income/expenditure and access to services
for various areas or administrative entities over time. Without such panel data,
location unobserved heterogeneity cannot be controlled for. Unfortunately,
panel data are often not available in the case of Nigeria as in other developing
countries. The data restrictions often encountered require a technique for
identifying the beneficiaries of public service expansion using only cross sec-
tional data. Ajwad and Wodon (2007) and Lanjouw and Ravallion (1999) pro-
posed alternative empirical methodologies that use a single cross section8.
Both papers use the geographic variation in access rates across regions in a
country to capture the expected evolution over time, had one region been fol-
lowed over time. Thus, cross sectional variation in access rates were ex-
ploited to conduct a marginal benefit incidence analysis study9. So, in estimat-
ing the marginal benefit incidence we followed the procedure of Ajwad and
Wodon (2007).
In following the steps of Ajwad and Wodon (2007), we defined i = 1,…, N 8 The approaches differ in the manner in which the countries are ranked. Lanjouw and Ravallion (1999) classify municipalities as poor or rich according to their rank in the national distribution of in-come. On the other hand, Wodon and Ajwad (2007) classify municipalities according to their rank in the local (i.e., state) distribution of income, rather than the national-level. Under a decentralized sys-tem of government, as is observed in Bolivia, a local ranking may be more appropriate. Despite the differences in the ranking between the above studies, the objective of both papers is to determine the beneficiaries of the various public services. 9 Said differently, the method subsumes that different regions are in different levels of development, with poorer regions today being like the richer ones in the past. In terms of access most services, this assumption seems reasonable. However, there may be some types of services for which technological advances may change access rates patterns so much that this assumption would not be valid. One ex-ample could be access to mobile phones, where network-based physical investments are much smaller than for the fixed line network, so that depending on needs and pricing, we could potentially see some poorer regions catch up faster with richer regions and overcome regions at medium stages of develop-ment in any given country. Technological developments may well change the basic structure assumed in our model and test.

18
states, which in this case are 37 states10 in Nigeria. We ranked the house-
holds by expenditure per capita within each state and assign them to one of q
= 1,…, Q expenditure bracket intervals(these quintiles were defined at the
state level. We denoted qiJX , the benefit incidence of a programme or service
in state J belonging to interval q of state i. This benefit incidence reflects the
share of the population with access to the public programme or service11. The
mean benefit incidence in interval q for state i is denoted by qiX , and the over-
all state mean is denoted by iX and qiJ is the number of households in interval
q of state i. The two means are respectively equal to:
qi
J
J
qiJ
qi J
XX
qi
∑== 1
∑
∑∑
=
=== Q
q
qi
J
J
qiJ
Q
qJ
J
XX
qi
1
11 (3)
The households are ranked by expenditure interval at the state level. The
method of estimating the distribution of marginal benefit incidence consists of
using the geographic variation in access (both between households and be-
tween states) as a source of information for understanding the diffusion proc-
ess generating access. This was done by regressing the benefit incidence in
each of the intervals against the state means, using Q regressions as follows:
qi
q
i
Q
q
q
i
JQ
jq
J
j
q
ij
q
ijqqq
i
JJ
xxq
i iq
aX εβ +
⎢⎢⎢⎢⎢
⎣
⎡
⎥⎥⎥⎥
⎦
⎤
−
−+=
∑
∑ ∑
=
== =
1
,
1,1 1
(4)
for q = 1,…, Q 10 The states are 36 states with Federal Capital Territory. 11 In this case the services are child vaccination, pre and postnatal consultations in public health institution in Nigeria.

19
In the first and poorest interval (q = 1), equation 4 yields a regression of the
mean level of programme participation in the poorest households in the vari-
ous states on the mean level of programme participation in the corresponding
state. To avoid endogeneity, the right hand side variable was computed at the
state level as the mean on all the households except those belonging to inter-
val q. We assumed that all the intervals within a given state have the same
number of households ( iqi JJ = ). With i
qi JJ = for all i, then we
have i
Q
q
qi XQX =∑
=1, equation (4) can be simplified as follows:
qi
qiiqqq
i QXXQ
aX εβ +⎟⎟⎠
⎞⎜⎜⎝
⎛
−−
+=1
(5)
for q = 1,…, Q
We pulled all the observations from the various intervals together and esti-
mate 5 as a single equation as follows:
qi
qi
Q
q
qiQ
q
q
qqi Q
XXaX εβ +
⎟⎟⎟⎟⎟
⎠
⎞
⎜⎜⎜⎜⎜
⎝
⎛
−
−+=
∑∑∑ =
== 11
11 (6)
In equation 6, the intercepts and the slopes are allowed to differ for various
intervals, this is an implicit restriction. It must be that across the various inter-
vals, the average marginal increase in access from a unitary increase in mean
access is one12. The restriction can be made explicit by totally differentiating
∑==
Q
q
qi
qi
XQX 1
1
(7)
So that: ⎟⎟⎠
⎞⎜⎜⎝
⎛+−∑
=q
q Q ββ11
= 1 (8)
12 The restriction is that the mean marginal benefit incidence estimates for all the categories must be equal to one.

20
Writing βQ , the parameter for the last interval Q, in terms of the other pa-
rameters yields:
βQ =
q
q
qqQ
qqi
Q
QQX
ββ
ββ
+−
+−−−=
∑
∑−
=
−
=
1
)1/(1)(1(
1
1
1
1 (9)
Taking into account restriction in 8, we can rewrite equation 6 as
( ) qi
Q
q
Qi
qi
Q
q
Q
q
qi
qiQ
q
Q
q
qqqi Q
XX
Q
Q
XXaX ε
ββ
ββ
β +
⎟⎟⎟⎟⎟
⎠
⎞
⎜⎜⎜⎜⎜
⎝
⎛
−
−
+−
⎟⎟⎠
⎞⎜⎜⎝
⎛
+−−
−+
⎟⎟⎟⎟⎟
⎠
⎞
⎜⎜⎜⎜⎜
⎝
⎛
−
−+=
∑
∑
∑∑∑ ∑ =
−
=
−
==
=
−
= 11
11
11
11
1
1
11
1
1
1
(10)
Dropping the error term and rearranging the terms equation 10 yields
( )
11
1/
−+
−+=
Q
XQQaX qi
qqqi β
β (11)
for q = 1,…, Q
Therefore, a change in programme benefit incidence for the household be-
longing to q in response to change or increase in the aggregate incidence at
the state level is given by
: q
q
i
qi
XX
ββ+−
=∂∂
1 (12)
for q = 1,…, Q
The right side values of equation 12 ⎟⎟⎠
⎞⎜⎜⎝
⎛+− q
q
ββ
1are the estimates of marginal
benefit incidence. A value larger (smaller) than one implies that the corre-
sponding group of households benefit more (less) than all the households on
average from an expansion in public programs or services.
21
Equation 6 was estimated through non-linear least square methodology as
contained in DASP 2.1. The marginal benefit incidence estimates were ob-
tained for child vaccination, prenatal and postnatal healthcares consultation in
public health institutions in Nigeria.
5.0 Results and Discussions
5.1 Results and Discussions of Benefit Incidence of Public Spending on Vaccination, Pre and Postnatal Consultations in Nigeria
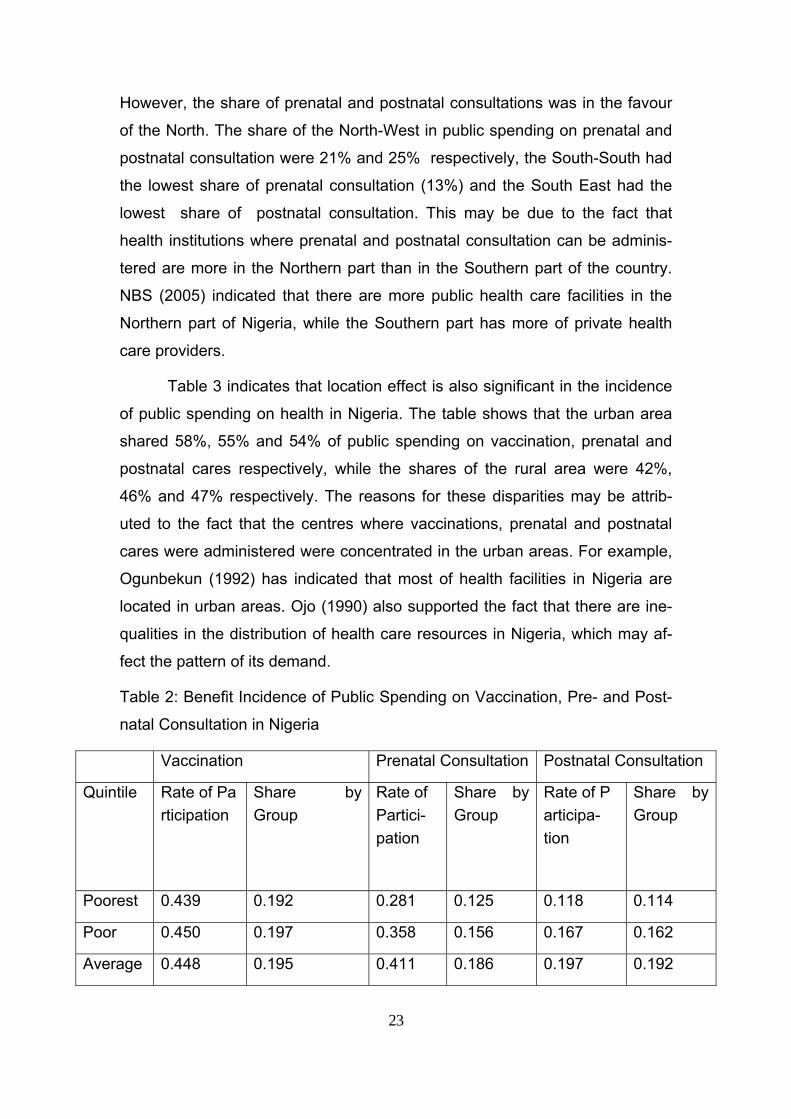
Generally, the participation rate of under-five year vaccination is low in
Nigeria as indicated in Table 2. The table indicates that only 46% of the chil-
dren that eligible for vaccination were vaccinated, while 51% of eligible chil-
dren from richest quintile participated in vaccination, 44% of eligible children
from poorest quintile participated in vaccination programme. According to
NBS (2004), the reasons for non-participation in vaccination programme as
given by the respondents are, ignorance about the vaccination (27%), the
vaccination centre is too far (20%), short supply of vaccine (7%), cost (3%)
and other reasons (41%)13. The same trend of low participation is also noticed
in prenatal and postnatal consultations. Table 2 reveals that only 45% and
21% of women that supposed to consult public health institution for prenatal
and postnatal health care did. The reasons for low participation in prenatal
consultation can not only because of the cost, as only 55% of them that went
for prenatal consultation claimed that they paid, the other reasons given by
the women in the survey are that they did not know it was necessary (41%)14,
unavailability of prenatal consultation centre (18%), the centre is too far
(16%), cannot afford it (10%) and other reasons (15%). The low rate of vacci-
nation, prenatal and postnatal consultations have implication for under-five,
13 These other reasons may include socio-cultural and religious beliefs. 14 The fact that prenatal consultation is free and that postnatal consultation is not free may account for different level of use between prenatal and postnatal consultations. Ignorance about the importance of postnatal consultation may also account for lower use of postnatal consultation in Nigeria, because, the woman who may need the postnatal consultation has de-livered the baby, she felt some relief and may not see the reason for further healthcare consul-tation.
22
infant and maternal mortalities in Nigeria. The under-five mortality rate of 194
per 1000 births in Nigeria which is higher than the Sub Sahara Africa’s aver-
age of 183 per 1000 births, has been attributed to the decline in child vaccina-
tion in Nigeria (Alabi and Adams, 2010). They indicated that the measles vac-
cination declined from 54% to 35% between 1990 and 2007, while it in-
creased from 56% to 73% between 1990 and 2007 in the whole of Sub Sa-
hara Africa. FIDH (2010) reveals that healthcare facilities in Nigeria are in-
adequate in quality, number, and funding and that lack of access to prenatal
and postnatal care contributes to the high maternal mortality rate in Nigeria.
FIDH (2010) reveals further that Nigeria has the world second highest mater-
nal mortality rate (1,100 per 100,000 births) in 2007 after India.
The social selectivity based on income is also noticed in vaccination,
prenatal and postnatal consultations. For example, the poorest quintile shares
19%, 13% and 11% of public spending on vaccination, prenatal and postnatal
consultation respectively, the shares of the richest quintile are 22%, 28% and
29% respectively. This indicated that the richest quintiles benefited more than
the poorest quintiles on public spending on vaccination, prenatal and postna-
tal consultation. Other scholars have also reported that the richest benefited
more than the poorest on public spending on health in Africa (Demery, 2000;
Djindil et al., 2008)
The North-South disparity can also be observed in the incidence of
public spending on vaccination, prenatal and postnatal consultation in Nigeria
as indicated in Table 3. The South East has the highest share of vaccination
(23%), while the North-Central has the lowest share of vaccination (9%)15.
15 There was a boycott of the polio vaccination campaign in Northern Nigeria, which has in-definitely stalled global polio eradication targets. The polio immunization drive was brought to a standstill in July 2003 as religious and political leaders in northern Nigeria responded to fears that the vaccines were deliberately contaminated with anti-fertility agents and the HIV virus. Although the polio vaccine boycott has proved costly in both economic and human terms, it has opened important lines of communication at global and national levels, poten-tially deepening dialogue, participation and sensitivity necessary for global health campaigns. Although immunization comes with countless benefits, it is a complex and difficult health strategy to enforce (Yahya, 2009).
23
However, the share of prenatal and postnatal consultations was in the favour
of the North. The share of the North-West in public spending on prenatal and
postnatal consultation were 21% and 25% respectively, the South-South had
the lowest share of prenatal consultation (13%) and the South East had the
lowest share of postnatal consultation. This may be due to the fact that
health institutions where prenatal and postnatal consultation can be adminis-
tered are more in the Northern part than in the Southern part of the country.
NBS (2005) indicated that there are more public health care facilities in the
Northern part of Nigeria, while the Southern part has more of private health
care providers.
Table 3 indicates that location effect is also significant in the incidence
of public spending on health in Nigeria. The table shows that the urban area
shared 58%, 55% and 54% of public spending on vaccination, prenatal and
postnatal cares respectively, while the shares of the rural area were 42%,
46% and 47% respectively. The reasons for these disparities may be attrib-
uted to the fact that the centres where vaccinations, prenatal and postnatal
cares were administered were concentrated in the urban areas. For example,
Ogunbekun (1992) has indicated that most of health facilities in Nigeria are
located in urban areas. Ojo (1990) also supported the fact that there are ine-
qualities in the distribution of health care resources in Nigeria, which may af-
fect the pattern of its demand.
Table 2: Benefit Incidence of Public Spending on Vaccination, Pre- and Post-
natal Consultation in Nigeria
Vaccination Prenatal Consultation Postnatal Consultation
Quintile Rate of Participation
Share by Group
Rate of Partici-pation
Share by Group
Rate of Participa-tion
Share by Group
Poorest 0.439 0.192 0.281 0.125 0.118 0.114
Poor 0.450 0.197 0.358 0.156 0.167 0.162
Average 0.448 0.195 0.411 0.186 0.197 0.192
24
Rich 0.433 0.191 0.565 0.252 0.250 0.243
Richest 0.511 0.244 0.634 0.282 0.296 0.288
All 0.456 1.00 0.450 1.00 0.206 1.00
Sources: Authors’ Computation Based on NBS (2004)
Table 3: Benefit Incidence of Public Spending on Vaccination, Pre- and Post-
natal Consultation Based on Location and Regions
Vaccination Prenatal Consultation Postnatal Consultation
Region Rate of Participation
Share by Group
Rate of Participation
Share by Group
Rate of Participation
Share by Group
South South
0.429 0.177 0.697 0.130 0.249 0.138
South East
0.458 0.230 0.801 0.143 0.327 0.130
South West
0.395 0.210 0.832 0.178 0.323 0.186
North Central
0.444 0.093 0.525 0.158 0.233 0.150
North East
0.448 0.115 0.411 0.183 0.160 0.142
North West
0.625 0.175 0.231 0.207 0.141 0.253
All 0.456 1.00 0.450 1.00 0.206 1.00
Urban 0.445 0.579 0.599 0.545 0.271 0.535
Rural 0.472 0.421 0.346 0.455 0.161 0.465
All 0.456 1.00 0.450 1.00 0.206 1.00
Sources: Authors’ Computation Based on NBS (2004)
25
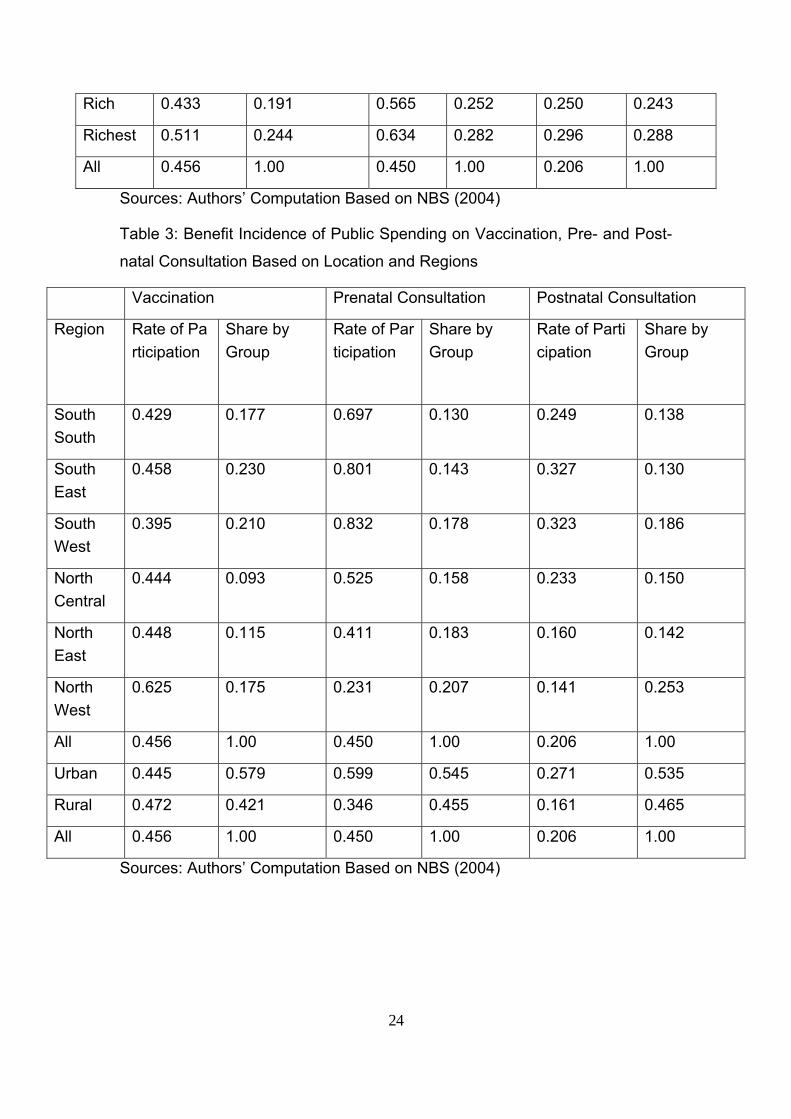
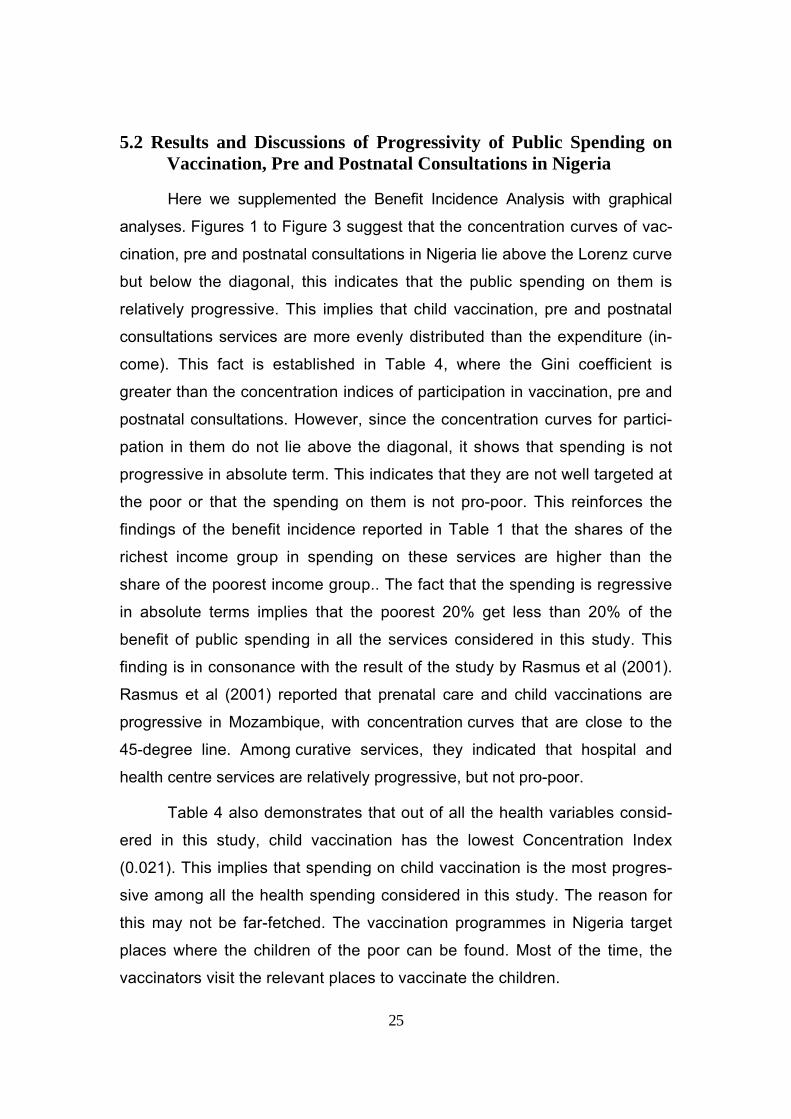
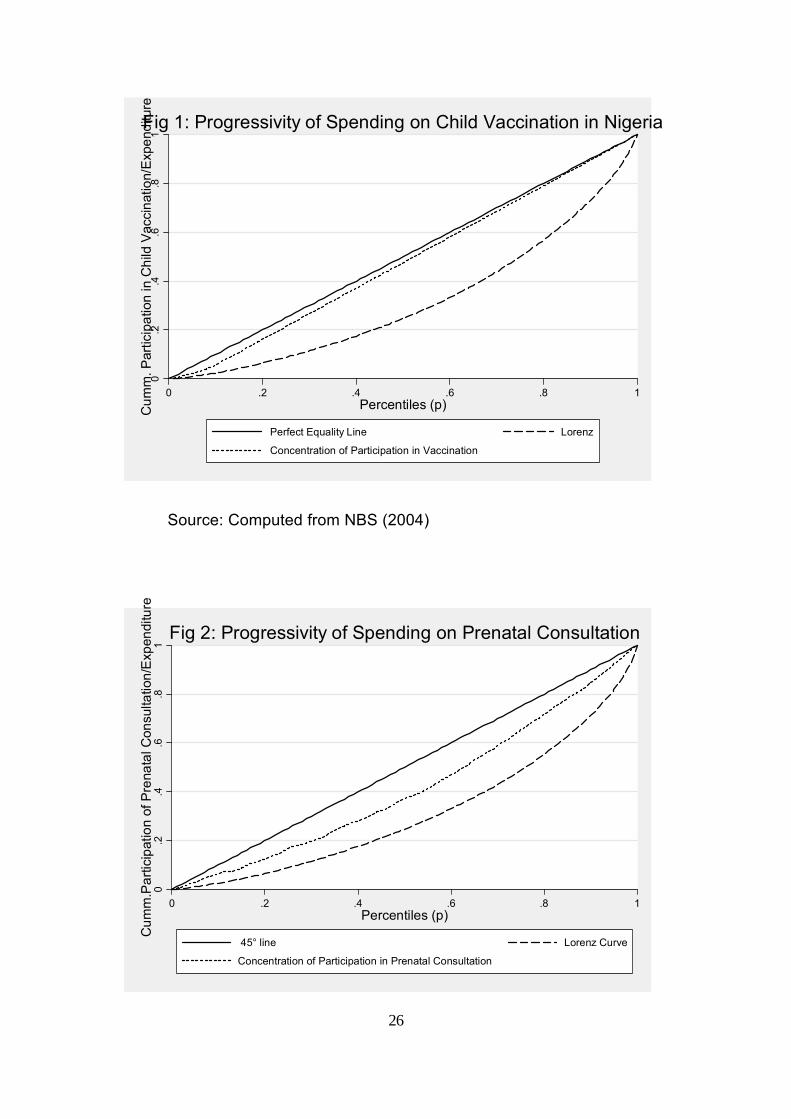
5.2 Results and Discussions of Progressivity of Public Spending on Vaccination, Pre and Postnatal Consultations in Nigeria
Here we supplemented the Benefit Incidence Analysis with graphical
analyses. Figures 1 to Figure 3 suggest that the concentration curves of vac-
cination, pre and postnatal consultations in Nigeria lie above the Lorenz curve
but below the diagonal, this indicates that the public spending on them is
relatively progressive. This implies that child vaccination, pre and postnatal
consultations services are more evenly distributed than the expenditure (in-
come). This fact is established in Table 4, where the Gini coefficient is
greater than the concentration indices of participation in vaccination, pre and
postnatal consultations. However, since the concentration curves for partici-
pation in them do not lie above the diagonal, it shows that spending is not
progressive in absolute term. This indicates that they are not well targeted at
the poor or that the spending on them is not pro-poor. This reinforces the
findings of the benefit incidence reported in Table 1 that the shares of the
richest income group in spending on these services are higher than the
share of the poorest income group.. The fact that the spending is regressive
in absolute terms implies that the poorest 20% get less than 20% of the
benefit of public spending in all the services considered in this study. This
finding is in consonance with the result of the study by Rasmus et al (2001).
Rasmus et al (2001) reported that prenatal care and child vaccinations are
progressive in Mozambique, with concentration curves that are close to the
45-degree line. Among curative services, they indicated that hospital and
health centre services are relatively progressive, but not pro-poor.
Table 4 also demonstrates that out of all the health variables consid-
ered in this study, child vaccination has the lowest Concentration Index
(0.021). This implies that spending on child vaccination is the most progres-
sive among all the health spending considered in this study. The reason for
this may not be far-fetched. The vaccination programmes in Nigeria target
places where the children of the poor can be found. Most of the time, the
vaccinators visit the relevant places to vaccinate the children.
26
0.2
.4.6
.81
Cum
m. P
artic
ipat
ion
in C
hild
Vac
cina
tion/
Exp
endi
ture
0 .2 .4 .6 .8 1Percentiles (p)
Perfect Equality Line Lorenz
Concentration of Participation in Vaccination
Fig 1: Progressivity of Spending on Child Vaccination in Nigeria
Source: Computed from NBS (2004)
0.2
.4.6
.81
Cum
m.P
artic
ipat
ion
of P
rena
tal C
onsu
ltatio
n/E
xpen
ditu
re
0 .2 .4 .6 .8 1Percentiles (p)
45° line Lorenz Curve
Concentration of Participation in Prenatal Consultation
Fig 2: Progressivity of Spending on Prenatal Consultation
27
Source: Computed from NBS (2004)
0
.2.4
.6.8
1C
umm
. Par
t. P
ostn
atal
Con
sulta
tion
in N
iger
ia/E
xpen
ditu
re
0 .2 .4 .6 .8 1Percentiles (p)
Perfect Equality Line Lorenz Curve
Concentration of Participation in Postnatal Consultation
Fig 3: Progressivity of Postnatal Consultation in Nigeria
Source: Computed from NBS (2004)
Table 4: Concentration Indices for Vaccination, Pre and Postnatal consulta-
tions in Nigeria
Social Utilities Gini Coefficient Concentra-tion Index
Differ-ence
T-ratio Remark
Vaccination 0.409 0.021 -0.388 -9.367* Relatively Progres-sive
Prenatal Consultation
0.378 0.170 -0.208 -11.382* Relatively Progres-sive
Postnatal Consultation
0.391 0.179 -0.212 -10.943* Relatively Progres-sive
Source: Authors’ Computation Based on NBS (2004)
28
* It implies that the difference between the Concentration index and Gini coeffi-
cient is significant
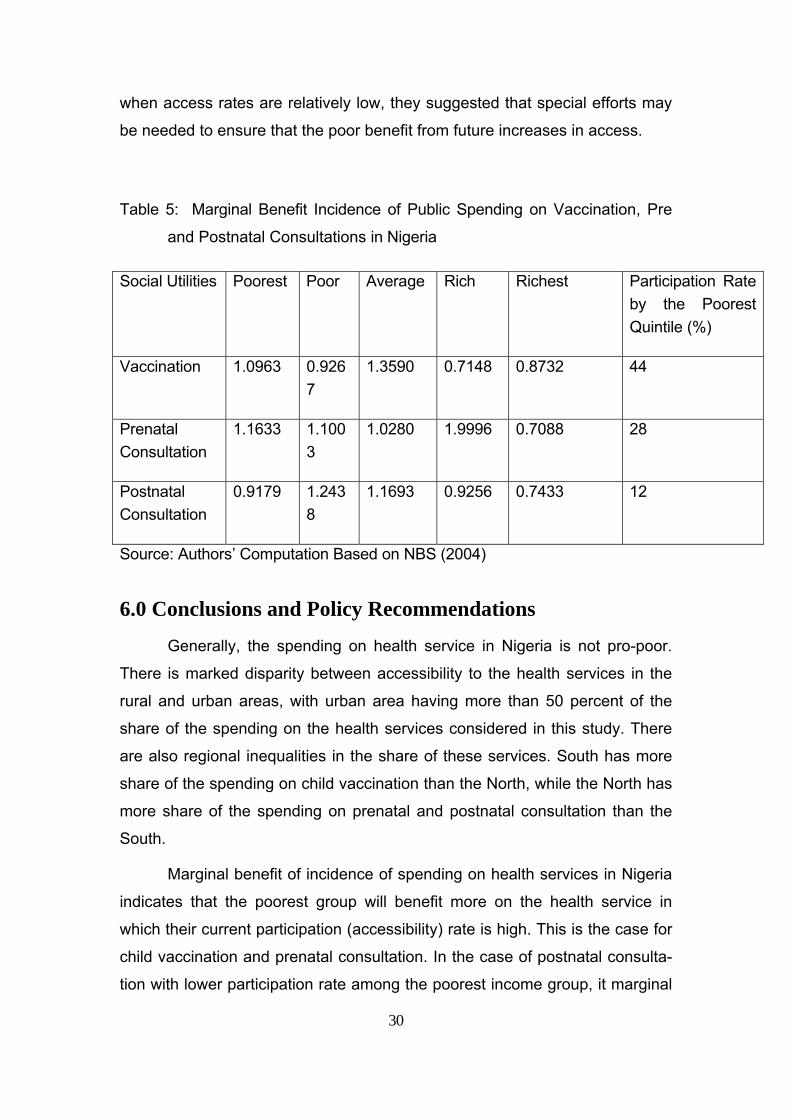
5.3 Results and Discussions of Marginal Benefit Incidence of Public Spending on Vaccination, Pre- and Postnatal Consultations in Nigeria
The result of marginal benefit incidence analysis presented in Table 5
suggests that any commitment that result in 1% expansion in child vaccina-
tion, prenatal consultation and postnatal will lead to about 1.10%, 1.16%,
0.92%, increase in child vaccination, prenatal and postnatal consultation
among the poorest income group respectively16. The same values for the
richest income group are about 0.87%, 0.71% and 0.74%, for child vaccina-
tion, prenatal and postnatal consultation respectively. The table also reveals
that the poorest group will benefit more than the richest group in expansion of
child vaccination and prenatal consultation, while the poor and average in-
come group will benefit more than the other income groups in the expansion
of postnatal health care provisions.
The fact that expansion in child vaccination programme will benefit the
poorest income group more than the richest income group may be due to the
fact that the poorest income households tend to have more children than the
richest income group; hence they may need this service than the richest in-
come group. The positive effect of UNICEF vaccination campaign in Nigeria
may explain the chances that the children from the poorest household are
vaccinated. The campaign is being done in such a manner that the vaccina-
tors target places where the children from the poorest income groups can be
found, such as public schools and religious places of worship.
Table 5 reveals further that the poorest income group will benefit more
than the richest income group in the expansion of prenatal consultation, while
16 The reverse can also apply here if there is a cut in the commitment. If there is any cut in commitment that results in 1% contraction in child vaccination, prenatal consultation, postna-tal consultation, will lead to about 1.10%, 1.16% and 0.92% reduction in child vaccination, prenatal consultation and postnatal consultation among the poorest income group respec-tively.
29
the middle income group will benefit more in the case of postnatal consulta-
tions. Adekolu-John (1989) demonstrated that postnatal care was not a prior-
ity to the mothers (majority who are illiterate and poor) in Nigeria and not a pri-
ority even to the health care providers17. This may explain the fact that even if
there is expansion in the provision of postnatal cares the poorest group will
not benefit as much as the middle income group in the expansion, because
the poorest group may not consider postnatal health care as a necessity, at
least after safe child delivery.
The general observation about the marginal benefit incidence of public
spending in Nigeria as presented in Table 5 is that the marginal benefit inci-
dence is higher for the poorest income group in the health services in which
the poorest income group has a high participation rates (this is the case for
child vaccination and prenatal consultation), and the marginal benefit inci-
dence is lower for the poorest income group in the health service in which the
poorest income group has low participation rates (this the case for postnatal
consultation). The poorest income participation rates in, child vaccination and
prenatal consultation are 44% and 28% respectively, while the participation
rate by the poorest income group in postnatal consultation is 12% as indicated
in Table 5. In the case of postnatal consultation with lower participation rate
among the poorest income group, it marginal benefit incidence among the
poorest income group is equally lower (MBI =0.9179) as compared with the
marginal benefit incidence for child vaccination (MBI =1.0963) and prenatal
consultation (MBI = 1.1633). So, initial accessibility rate to health service by
the poor may determine whether the poor will benefit more or less from the
expansion of that health service. This finding is in consonance with result of
marginal benefit incidence estimated by Ajwad and Wodon (2003; 2007).
They indicated that although there are important differences between mar-
ginal benefit incidence for different types of services, and that in many cases
marginal benefit incidence tends to be more pro-poor than benefit incidence,
especially once the non-poor already have high levels of access. By contrast,
17 In some health care centers, prenatal consultation is free of charge, whereas postnatal con-sultation is not.
30
when access rates are relatively low, they suggested that special efforts may
be needed to ensure that the poor benefit from future increases in access.
Table 5: Marginal Benefit Incidence of Public Spending on Vaccination, Pre
and Postnatal Consultations in Nigeria
Social Utilities Poorest Poor Average Rich Richest Participation Rate by the Poorest Quintile (%)
Vaccination 1.0963 0.9267
1.3590 0.7148 0.8732 44
Prenatal Consultation
1.1633 1.1003
1.0280 1.9996 0.7088 28
Postnatal Consultation
0.9179 1.2438
1.1693 0.9256 0.7433 12
Source: Authors’ Computation Based on NBS (2004)
6.0 Conclusions and Policy Recommendations
Generally, the spending on health service in Nigeria is not pro-poor.
There is marked disparity between accessibility to the health services in the
rural and urban areas, with urban area having more than 50 percent of the
share of the spending on the health services considered in this study. There
are also regional inequalities in the share of these services. South has more
share of the spending on child vaccination than the North, while the North has
more share of the spending on prenatal and postnatal consultation than the
South.
Marginal benefit of incidence of spending on health services in Nigeria
indicates that the poorest group will benefit more on the health service in
which their current participation (accessibility) rate is high. This is the case for
child vaccination and prenatal consultation. In the case of postnatal consulta-
tion with lower participation rate among the poorest income group, it marginal
31
benefit incidence among the poorest income group is equally lower (MBI =
0.9179) as compared with the marginal benefit incidence for child vaccination
(MBI = 1.0963) and prenatal consultation (MBI = 1.1633).
From this study, the following recommendations can be made. Gener-
ally, there is a need for pro-poor policies in order to accelerate the speed at
which the poor benefit more from increases in access to health services in Ni-
geria:
Better Health for All Nigerians (2010) asserted that Government’s re-
sponsibility for health in Nigeria is shared between the three tiers of govern-
ment without any clear legal division as to who does what. So for effective im-
plementation of health policy that will be of benefit to the poor, there must be
clear demarcation of the legal responsibility of each tier of Government. Be-
cause of the importance of primary health (Primary Health Care is much more
effective in preventing and treating 90% of the health problems in Nigeria), the
federal government and local government can be financially and legally
charged to take responsibility of primary health care provision.
The Nigerian Government at all levels spends less than 5% of public
expenditure on health, despite being signatory to the 2000 Abuja Declaration
to increase this to 15%. In 2004 the current civilian regime launched an ambi-
tious programme of “Health Sector Reform”. This is designed to reform the
national health system and thereby improve the health status of all Nigerians.
There is a draft National Health Bill before the National Assembly, which is yet
to be passed. This defines the roles and responsibilities of tiers of govern-
ment, establishes a fund for Primary Health Care, and sets out a minimum
package of health for all citizens. The passage of the bill will improve funding
to the primary health care which is very low at the moment (according to
World Bank (2005) capital expenditure on health in Nigeria is US$9.44, which
is very low compared with a number of comparable economies). The imple-
mentation of the National Health Bill will also enhance the effectiveness and
efficiency of health care provision and improve the health indices in Nigeria
(Nigeria still has one of the worst records on health indices in the world and
sadly accounts for 10% of the world’s maternal deaths in child birth whereas
32
the country represents 2% of the world population).
Nigeria should increase her per capita spending on health from 9.44
USD to at least 34 USD as recommended by the World Health Organisation
(WHO). Towards this, all levels of governments, Federal, State and local
should increase budgetary allocation to Health to at least 15% and publish
such budget for proper monitoring by the people. This extra funding will be
used to put in place a special system of social welfare focusing on providing
safety nets and free medical services for the disadvantaged or vulnerable
groups including pregnant women, children under 5 years of age, the aged
and poor. The budget should also be restructured in the favour of the primary
health care provision. A situation where about 69% of Nigeria’s health budget
is spent on tertiary care is not pro-poor. The spending should also be re-
aligned in the favour of the rural area. As at the moment, 70 percentage of Ni-
geria’s health budget is spent in urban areas where 30% of the population re-
sides and 30 percent spent in rural areas where 70 percent of the people re-
sides (Vital Facts on Health Care in Nigeria, 2010). The regional dis-
parities can be bridged by increasing expansion to child vaccination pro-
grammes in the Northern part of Nigeria, while more resources are devoted to
expand accessibility to prenatal, postnatal healthcare consultations in the
South.
The current health insurance policy should be designed to include the
poorest income group so that they can benefit from the programme. An health
insurance programme which exclude the self employed workers as currently
being done in Nigeria cannot be said to be pro-poor.
Civil society should ensure that it continues advocacy towards increas-
ing budgetary allocation to health by all governments to at least 15%. They
should advocate to elected officers to account for their stewardship especially
in the area of health care funding. Non Governmental Organizations should
also be active in educating and enlightening the populace on the importance
of preventive health care in Nigeria.
33
REFERENCES
Adekolu-John E.O. (1989), Maternal health care and outcome of pregnancies in Kainji Lake Area of Nigeria, Public Health, 103 (1): 41-9
Aigbokhan, B., Alabi, R. A. and M. I. Ailemen (2007), ‘Oil resources and inci-dence of conflicts in Nigeria’, In Karl Wohlmuth et al. (eds.), Africa – Commodity Dependence, Resource Curse and Export Diversification, Af-rican Development Perspectives Yearbook, Volume 12, Institute of World Economics and International Management, Bremen, Germany. Pp. 610. http://www.lit-verlag.de/isbn/3-8258-0256-1
Aigbokhan, B. E. (2000), Poverty, growth and inequality in Nigeria, A case study, African Economic Research Consortium, Research Paper 102. Nairobi, Kenya
Ajwad, M. I. and Q. Wodon (2007), Do local government maximise access rates to public services across areas?, A test based on marginal benefit incidence analysis, The Quarterly Review of Economics and Finance 47: 242-260.
Ajwad, M. I. and Q. Wodon (2003), Who benefits from increased access to public services at the local level?, A marginal benefit incidence analysis for education and basic infrastructure, Munich Personal RePEC Archive (MPRA) No 12309, Available at: http://mpra.ub.uni-muenchen.de/12309
Ajwad, M. I. and Q. Wodon (2002), Marginal benefit incidence analysis using a single cross-section of data, Available via internet at: / /wbln0018.worldbank.org /LAC /LACinfoclient
Ajwad, M. I. and Q. Wodon (2001), Marginal benefit incidence analysis using a single cross-section of data, Available via internet at: / /wbln0018.worldbank.org /LAC /LACinfoclient
Alabi, R. A. and O. O Adams (2010), Achievement of Millennium Develop-ment Goals (MDG) and the global financial crisis in Nigeria, Paper pre-sented at International Conference on ‘The impact of the global financial crisis on economic reform process in Africa’, Held at the Bremen Univer-sity of Applied Sciences, Bremen, Germany on January 28-29th, 2010
Alabi, R. A., S. O. Abu and M. Ailemen (2008), Perceptions, Causes Of Pov-erty, And Poverty Alleviation Programmes In Niger-Delta, Nigeria, New Growth and Poverty Alleviation Strategies for Africa: Institutional and Local Aspects, Volume 14, Pp. 437-474, LIT VERLAG Berlin/Münster, Germany
Araar, A. and Jean-Yves Duclos (2009), DASP 2.1: Distributive Analysis Stata Package, PEP, CIRPEE and World Bank
34
Anand, S. and M. Ravallion (1993), Human development in poor countries: On the role of private incomes and public services, Journal of Economic Perspectives Vol. 7(1): 133-150
Better Health for All Nigerians (2010), Ensuring effective, qualitative, afford-able and accessible health care for all Nigerians beyond 2007, Available on the internet at: http://www.herfon.org/docs/021207_advocacyDoc_postNHC2006-1.pdf
Bidani, B. and M. Ravallion (1997), Decomposing social indicators using dis-tributional data, Journal of Econometrics Vol. 77(1): 125-139
Bidani, B. and M. Ravallion (1993), “How robust is a poverty profile?", Policy Research Working Paper Series 1223, The World Bank
Budge (2008), 2008 budget speech, Available via internet at: www. budgetoffice.gov.ng/PDF/2008%20presidet’s%20budget%speech.pdf
CBN (2008), CBN Annual Statement of Accounts for 2008, Central Bank of Nigeria, Abuja, Nigeria
CBN (2007), Central Bank of Nigeria Statistical Bulletin, 2007, Central Bank of Nigeria Statisti-cal Bulletin Vol 17, Available on the internet at: http://www.cenbank.org/OUT/PUBLICATIONS/STATBULLETIN/RD/2008/STABULL-2006.PDF
Chu, Ke-Young, H. Davoodi, and S. Gupta (2000), Income distribution and tax and government spending policies in developing countries, IMF Working Paper /00/62
Demery, L. (2000), Benefit incidence analysis, Memo, Poverty Reduction and Economic Management Network, World Bank Washington, D.C.
Demery, L. and M. Walton (1998), Are poverty reduction and other 21st Cen-tury social goals attainable?, Washington, D.C, World Bank.
Demery, L., Chaos, S. Bernier, R. Mehrak (1995), The incidence of social spending in Ghana, PSD Discussion Paper Series 1970, Poverty and Social Policy Department, World Bank, Washington, D.C.
Djindil, N. S, Dang, T. S and M. A. Tomar (2007), Who benefits from social expenditure in Chad?, An incidence analysis using survey data, PMMA Working Paper 2007-11
FMH (2009), Federal Ministry of Health News, Available on the internet at: www.fmh.gov.ng/news
FIDH (2010), Dossier of Claims: Nigeria, Available on the internet at: http://www.africa4womensrights.org/post/2010/03/05/Dossier-of-Claims:-Nigeria
35
Glick, P. and M. Razakamanantsoa (2001), The distribution of social services in Madagascar, 1993-1999, Cornell Food and Nutrition Policy Pro-gramme (CFNPP) Working Paper 128, Cornell University, Cornell Food and Nutrition Policy Programme, Ithaca, N.Y.
Grosse, M., Harttgen, K. and S. Klasen (2006), Measuring pro-poor growth with non-income indicators, Paper presented at the 29th General Confer-ence of the International Association for Research in Income and Wealth, Joensnu, Finland, 20-26th August, 2006, Available on the internet at: www.iariw.org.
Gupta, S., Marijn, V. and R. T Erwin (2002), The effectiveness of government spending on education and health care in developing and transition
economies, European Journal of Political Economy, Vol. 18: 717-737
Gupta, S., Verhoeven, M., and E. Tiongson (1999), Does higher government spending buy better results in education and health care?, IMF Work-ing Papers, WP/99/21
Hakro, A. W. and Muhammed Akram (2007), The incidence of government expenditures on education and health: Microeconomic evidence from Pakistan, The Lahore Journal of Economics 12 (2): 27-48
Hammer, Jeffrey, Ijaz Nabi, and James A. Cercon (1995), Distributional Ef-fects of Social Sector Expenditures in Malaysia, 1974-1989, in: Van de Walle, Dominique, and Kimberly Nead (eds), Public Spending and the Poor — Theory and Evidence, Johns Hopkins University Press, Balti-more, Md.
Hamid, R. D., Erwin R. T., and S. A. Sawitree (2003), How useful are benefit incidence analyses of public education and health Spending?, IMF Working Paper 227, WP/03/227
Hinchliffe, K. (2002), Public Expenditure on education in Nigeria: Issues, Es-timates and some Implications, African Region Human Development Re-port Working Paper Series, The World Bank, Washington, D.C.
Hojman, D. E. (1996), Economic and other determinants of infant and child mortality in small developing countries: The case of Central America and the Caribbean, Applied Economics, Vol. 28: 281-290
Jonathan, G. E. (2008), Seven Points Agenda will hasten Nigeria’s develop-ment, Available on the internet at: www.naijanews.com/content/view/1002/86
Kamgnia, D. B. (2008), “Distribution Impact of Public Spending in Cameroon:
36
The Case of Health Care”, AERC Research Paper 179, Nairobi, Kenya
Kruse, I., Pradhan, M. and R. Sparrow (2009), Marginal Benefit Incidence of public health spending: Evidence from Indonesian Sub-national data, Available on the internet at: www.aiid.org/docs/HealthSpendingIndonesia7dec2009%5B1%5D.pdf
Lanjouw, Peter and Martin Ravallion (1999), Benefit incidence and the timing of program capture, World Bank Economic Review 13(2): 257-74
Lanjouw, P. M., Pradhan, F., Saadah, H. Sayed, and R. Sparrow (2002), Pov-erty, education, and health in Indonesia: Who benefits from public spend-ing?, in: Christian Morrisson (ed)., Education and Health Expenditure, and Development: The Cases of Indonesia and Peru, OECD/Organization for Economic Co-operation and Development, Paris
Lipton, M. and M. Ravallion (1995), Poverty and Policy, in: Jere Behrman and T. N. Srinivasan, eds., The Handbook of Development Economics, vol.38. Amsterdam, North- Holland
Mainardi, S. (2007), Unequal access to public healthcare facilities: Theories and measurement revisited, Surveys in Mathematics and its Application, Vol. 2: 91-112
Marie-Claude, M. (2008), Individual and collective resources and health in Morocco, WIDER Research Paper No 2008/21
McGuire, J.W. (2006), Basic health care provision and Under 5 mortality: A cross-national study of developing countries, World Development 34, pp. 405-425
Nigeria Project Agenda (2007), Nigeria Project and shared aspiration, Avail-able via the internet at: http://siteresources.worldbank.org/NIGERIAEXTN/Resources/7Points_policy_Nigeria.pdf
NBS (2005), Health facilities distribution in Nigeria, National Bureau of Statis-tics Office, Abuja, Nigeria
NBS (2004), National Bureau of Statistics Database, National Bureau of Sta-tistics Office, Abuja, Nigeria
NQAI (1994), National Quality Assurance Initiative, Nigerbus Survey, USAID, Lagos
Ogunbekun, I. (1992), Information for support for health planning and man-agement: A private sector perspective, Proceedings of the National Con-ference on Health Management Information System, Abuja, Nigeria, January 6- 8
37
Ogunbekun, I., Ogunbekun, A. and N. Orobaton, (1999), Private Health Care in Nigeria: Walking the tightrope, Health Policy and Planning, 14 (2):174-181
Ojo, K. (1990), The crisis in the distribution of health personnel in Nigeria, Health Policy and Planning 5(1): pp. 60-66
Okafor, E. E. and J. Amzat (2007), Problems of malaria menace and behav-ioural intervention for its management in Sub-Sahara Africa, Journal of Human Ecology 21(2): 155-162
Okojie, C. E., Anyanwu, J. C., Ogwumike, F. O., and Alayande, B. A. (2001), Poverty in Nigeria: An analysis of gender issues, access to social ser-vices, and the labour market, African Economic Research Consortium (AERC) Report, Nairobi, Kenya
Okojie, C. and A. Shimeles (2006), Inequality in Sub-Sahara Africa: A synthe-sis of recent research on the levels, trend, effects and determinants of inequality in its different dimensions, The inter regional inequality facility, Overseas Development Institute, London, UK
Okonjo-Iweala, N. and P Osafo-Kwaako (2007), Nigeria’ economic reforms: Progress and challenges, Brookings Global Economy and Development, The Brookings Institution, 1775 Massachusetts, Avenue, Washington, D.C. 20036
Oyekale, A. S., Adeoti, A. I. and T. O. Oyekale (2006), Measurement and sources of income inequality among rural and urban households in Nige-ria, Poverty Monitoring, Measurement and Analysis Working Paper 2006-20, Policy and Economic Policy, Quebec, Canada
Rasmus, H., K. Simler and F. Tarp (2001), Public spending and poverty in Mozambique, World Institute for Development Economics Research (WIDER), Discussion Paper NO 2001/61
Ravallion, M. (1999), Is more targeting consistent with less spending?, Inter-national Tax and Public Finance, 6: 411-19
Ravallion, M. (2000), Monitoring and targeting performance when decentral-ized allocations to the poor are unobserved, World Bank Economic Re-view 14(2): 331-45
Ravallion, M. (2004), Pro-poor growth: A Primer, Policy Research Working Paper 3242, World Bank, Washington, D.C.
Reinikka, R. (2002), Public expenditure tracking and service delivery surveys: A review of design and implementation issues, PEAM Course, May 23, DECRG, The World Bank
38
Sen, A. (1999), Economic policy and equity: An overview, in: Tanzi, V., K. Chu, and S. Gupta (eds), Economic Policy and Equity, World Bank, Washington, D.C.
Tanzi, V. and K. Chu (1998), Income distribution and high quality of Growth, Cambridge, MIT Press
UNICEF (1996), The State of the World’s Children’s Health, New York: Oxford University Press
Van de Walle, Dominique (1995), Public spending and the poor: What we know, what we need to know, Policy Research Working Paper Service 1476, Policy Research Department, The World Bank
Van de Walle, Dominique (2002). Poverty and Transfers in Yemen, Middle East and North Africa, Working Paper Series 30, World Bank, Office of the Chief Economist, Middle East and North Africa Region, Washington, D. C. Processed
Vital Facts on Health Care in Nigeria (2010), Health information in Nigeria, Available on the internet at: http://nigerianhealthjournal.wordpress.com/2010/04/05/vital-facts-on-health-care-in-nigeria/
WHO (2000), The African Malaria Report 2000, Geneva, WHO/CDS/MAL Re-port
World Bank (2005), Pro-poor growth in the 1990s - Lessons and insights from 14 countries, Washington, D.C.: Operationalizing Pro-Poor Growth Re-search Program
World Bank (2000), The Quality of Growth, Research Dept., World Bank, Washington D.C.
World Bank (1993), World Development Report 1993, Oxford University Press, New York
Yahya, M. (2009), Polio vaccines — "no thank you!" barriers to polio eradica-tion in Northern Nige-ria, available on the internet at: http://afraf.oxfordjournals.org/cgi/content/abstract/106/423/185
Younger, Stephen (2003), Benefits on the margin: Observations on marginal benefit incidence, The World Bank Economic Review 17 (1): 89-106
Younger, Stephen (2002), Public Social Sector Expenditures and Poverty in Peru, in: Christian Morrisson (ed.), Education and Health Expenditure, and Development: The Cases of Indonesia and Peru. Organization for

39
Economic Co-operation and Development, Paris
Younger, Stephen (1999), The Relative Progressivity of Social Services in Ecuador, Public Finance Review, 27(3):310-352
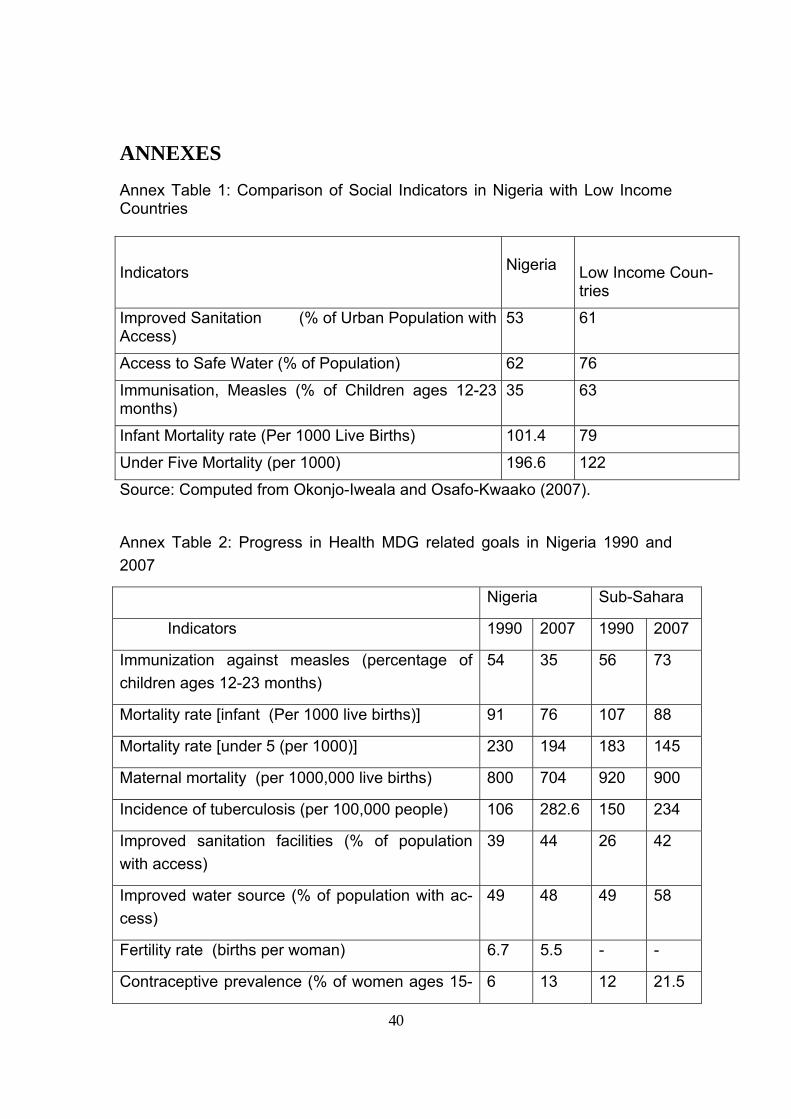
40
ANNEXES
Annex Table 1: Comparison of Social Indicators in Nigeria with Low Income Countries
Source: Computed from Okonjo-Iweala and Osafo-Kwaako (2007). Annex Table 2: Progress in Health MDG related goals in Nigeria 1990 and 2007
Nigeria Sub-Sahara
Indicators 1990 2007 1990 2007
Immunization against measles (percentage of children ages 12-23 months)
54 35 56 73
Mortality rate [infant (Per 1000 live births)] 91 76 107 88
Mortality rate [under 5 (per 1000)] 230 194 183 145
Maternal mortality (per 1000,000 live births) 800 704 920 900
Incidence of tuberculosis (per 100,000 people) 106 282.6 150 234
Improved sanitation facilities (% of population with access)
39 44 26 42
Improved water source (% of population with ac-cess)
49 48 49 58
Fertility rate (births per woman) 6.7 5.5 - -
Contraceptive prevalence (% of women ages 15- 6 13 12 21.5
Indicators
Nigeria
Low Income Coun-tries
Improved Sanitation (% of Urban Population with Access)
53 61
Access to Safe Water (% of Population) 62 76
Immunisation, Measles (% of Children ages 12-23 months)
35 63
Infant Mortality rate (Per 1000 Live Births) 101.4 79
Under Five Mortality (per 1000) 196.6 122
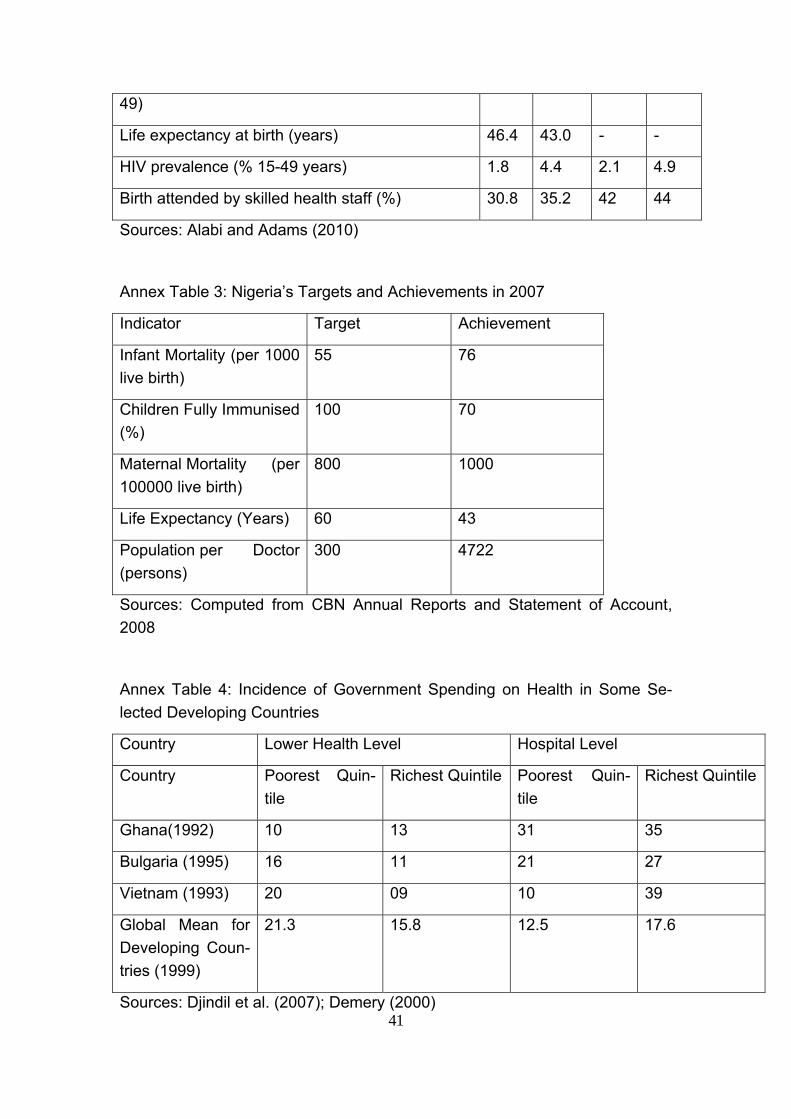
41
49)
Life expectancy at birth (years) 46.4 43.0 - -
HIV prevalence (% 15-49 years) 1.8 4.4 2.1 4.9
Birth attended by skilled health staff (%) 30.8 35.2 42 44
Sources: Alabi and Adams (2010)
Annex Table 3: Nigeria’s Targets and Achievements in 2007
Indicator Target Achievement
Infant Mortality (per 1000 live birth)
55 76
Children Fully Immunised (%)
100 70
Maternal Mortality (per 100000 live birth)
800 1000
Life Expectancy (Years) 60 43
Population per Doctor (persons)
300 4722
Sources: Computed from CBN Annual Reports and Statement of Account, 2008
Annex Table 4: Incidence of Government Spending on Health in Some Se-lected Developing Countries
Country Lower Health Level Hospital Level
Country Poorest Quin-tile
Richest Quintile Poorest Quin-tile
Richest Quintile
Ghana(1992) 10 13 31 35
Bulgaria (1995) 16 11 21 27
Vietnam (1993) 20 09 10 39
Global Mean for Developing Coun-tries (1999)
21.3 15.8 12.5 17.6
Sources: Djindil et al. (2007); Demery (2000)

42
xlii
Bisher erschienene “Berichte aus dem Weltwirtschaftlichen Colloquium” des Instituts für Weltwirtschaft und Internationales Management
(Downloads: http://www.iwim.uni-bremen.de/publikationen/pub-blue)
Nr. 1 Sell, Axel: Staatliche Regulierung und Arbeitslosigkeit im internationalen Sektor. 1984. 35 S. Nr. 2 Menzel, Ulrich/ Senghaas, Dieter: Indikatoren zur Bestimmung von Schwellenländern. Ein Vorschlag zur Opera-tionalisierung. 1984. 40 S. Nr. 3 Lörcher, Siegfried: Wirtschaftsplanung in Japan. 1985. 19 S. Nr. 4 Iwersen, Albrecht: Grundelemente der Rohstoffwirtschaftlichen Zusammenarbeit im RGW. 1985. 52 S. Nr. 5 Sell, Axel: Economic Structure and Development of Burma. 1985. 39 S. Nr. 6 Hansohm, Dirk/ Wohlmuth, Karl: Transnationale Konzerne der Dritten Welt und der Entwicklungsprozeß unter-entwickelter Länder. 1985. 38 S. Nr. 7 Sell, Axel: Arbeitslosigkeit in Industrieländern als Folge struktureller Verhärtungen. 1986. 21 S. Nr. 8 Hurni, Bettina: EFTA, Entwicklungsländer und die neue GATT-Runde. 1986. 28 S. Nr. 9 Wagner, Joachim: Unternehmensstrategien im Strukturwandel und Entwicklung der internationa-len Wettbewerbsfähigkeit. 1986. 28 S. Nr. 10 Lemper, Alfons: Exportmarkt Westeuropa. Chinas Vorstoß auf die Weltmärkte. 1987. 40 S. Nr. 11 Timm, Hans-Jürgen: Der HWWA-Index der Rohstoffpreise - Methodik, Wirtschafts- und Entwick-lungspolitische Bedeutung. 1987. 57 S. Nr. 12 Shams, Rasul: Interessengruppen und entwicklungspolitische Entscheidungen. 1987. 23 S. Nr. 13 Sell, Axel: ASEAN im Welthandelskraftfeld zwischen USA, Japan und EG. 1987. 23 S.
xliii
Nr. 14 Kim, Young-Yoon/ Lemper Alfons: Der Pazifikraum: Ein integrierter Wirtschaftsraum? 1987. 24 S. Nr. 15 Sell, Axel: Feasibility Studien für Investitionsprojekte, Problemstruktur und EDV-gestützte Planungsansätze. 1988. 18 S. Nr. 16 Hansohm, Dirk/ Wohlmuth, Karl: Sudan´s Small Industry Development. Structures, Failures and Perspectives. 1989. 38 S. Nr. 17 Borrmann, Axel/ Wolff, Hans-Ulrich: Probleme bei der Planung industrieller Investitionen in Entwicklungsländern. 1989. 28 S. Nr. 18 Wohlmuth, Karl: Structural Adjustment and East-West-South Economic Cooperation: Key Is-sues. 1989. 53 S. Nr. 19 Brandtner, Torsten: Die Regionalpolitik in Spanien unter besonderer Berücksichtigung der neuen Verfassung von 1978 und des Beitritts in die Europäische Gemeinschaft. 1989. 40 S. Nr. 20 Lemper, Alfons: Integrationen als gruppendynamische Prozesse. Ein Beitrag zur Neuorientie-rung der Integrationstheorie. 1990. 47 S. Nr. 21 Wohlmuth, Karl: Die Transformation der osteuropäischen Länder in die Marktwirtschaft - Marktentwicklung und Kooperationschancen. 1991. 23 S. Nr. 22 Sell, Axel: Internationale Unternehmenskooperationen. 1991. 12 S. Nr. 23 Bass, Hans-Heinrich/ Li, Zhu: Regionalwirtschafts- und Sektorpolitik in der VR China: Ergebnisse und Per-spektiven. 1992. 28 S. Nr. 24 Wittkowsky, Andreas: Zur Transformation der ehemaligen Sowjetunion: Alternativen zu Schockthe-rapie und Verschuldung. 1992. 30 S. Nr. 25 Lemper, Alfons: Politische und wirtschaftliche Perspektiven eines neuen Europas als Partner im internationalen Handel. 1992. 17 S.
xliv
Nr. 26 Feldmeier, Gerhard: Die ordnungspolitische Dimension der Europäischen Integration. 1992. 23 S. Nr. 27 Feldmeier, Gerhard: Ordnungspolitische Aspekte der Europäischen Wirtschafts- und Währungs-union. 1992. 26 S. Nr. 28 Sell, Axel: Einzel- und gesamtwirtschaftliche Bewertung von Energieprojekten. - Zur Rol-le von Wirtschaftlichkeitsrechnung, Cost-Benefit Analyse und Multikriterien-verfahren-. 1992. 20 S. Nr. 29 Wohlmuth, Karl: Die Revitalisierung des osteuropäischen Wirtschaftsraumes - Chancen für Eu-ropa und Deutschland nach der Vereinigung. 1993. 36 S. Nr. 30 Feldmeier, Gerhard: Die Rolle der staatlichen Wirtschaftsplanung und -programmierung in der Eu-ropäischen Gemeinschaft. 1993. 26 S. Nr. 31 Wohlmuth, Karl: Wirtschaftsreform in der Diktatur? Zur Wirtschaftspolitik des Bashir-Regimes im Sudan. 1993. 34 S. Nr. 32 Shams, Rasul: Zwanzig Jahre Erfahrung mit flexiblen Wechselkursen. 1994. 8 S. Nr. 33 Lemper, Alfons: Globalisierung des Wettbewerbs und Spielräume für eine nationale Wirt-schaftspolitik. 1994. 20 S. Nr. 34 Knapman, Bruce: The Growth of Pacific Island Economies in the Late Twentieth Century. 1995. 34 S. Nr. 35 Gößl, Manfred M./ Vogl. Reiner J.: Die Maastrichter Konvergenzkriterien: EU-Ländertest unter besonderer Be-rücksichtigung der Interpretationsoptionen. 1995. 29 S. Nr. 36 Feldmeier, Gerhard: Wege zum ganzheitlichen Unternehmensdenken: „Humanware“ als integrati-ver Ansatz der Unternehmensführung. 1995. 22 S. Nr. 37 Gößl, Manfred M.: Quo vadis, EU? Die Zukunftsperspektiven der europäischen Integration. 1995. 20 S.
xlv
Nr. 38 Feldmeier, Gerhard/ Winkler, Karin: Budgetdisziplin per Markt oder Dekret? Pro und Contra einer institutionellen Festschreibung bindender restriktiver Haushaltsregeln in einer Europäischen Wirtschafts- und Währungsunion. 1996. 28 S. Nr. 39 Feldmeier, Gerhard/ Winkler, Karin: Industriepolitik à la MITI - ein ordnungspolitisches Vorbild für Europa? 1996. 25 S. Nr. 40 Wohlmuth, Karl: Employment and Labour Policies in South Africa. 1996. 35 S. Nr. 41 Bögenhold, Jens: Das Bankenwesen der Republik Belarus. 1996. 39 S. Nr. 42 Popov, Djordje: Die Integration der Bundesrepublik Jugoslawien in die Weltwirtschaft nach Aufhebung der Sanktionen des Sicherheitsrates der Vereinten Nationen. 1996. 34 S. Nr. 43 Arora, Daynand: International Competitiveness of Financial Institutions: A Case Study of Japa-nese Banks in Europe. 1996. 55 S. Nr. 44 Lippold, Marcus: South Korean Business Giants: Organizing Foreign Technology for Economic Development. 1996. 46 S. Nr. 45 Messner, Frank: Approaching Sustainable Development in Mineral Exporting Economies: The Case of Zambia. 1996. 41 S. Nr. 46 Frick, Heinrich: Die Macht der Banken in der Diskussion. 1996. 19 S. Nr. 47 Shams, Rasul: Theorie optimaler Währungsgebiete und räumliche Konzentrations- und Loka-lisations-prozesse. 1997. 21 S. Nr. 48 Scharmer, Marco: Europäische Währungsunion und regionaler Finanzausgleich - Ein politisch verdrängtes Problem. 1997. 45 S. Nr. 49 Meyer, Ralf/ Vogl, Reiner J.: Der „Tourismusstandort Deutschland“ im globalen Wettbewerb. 1997. 17 S. Nr. 50 Hoormann, Andreas/ Lange-Stichtenoth, Thomas: Methoden der Unternehmensbewertung im Akquisitionsprozeß - eine empiri-sche Analyse -. 1997. 25 S.
xlvi
Nr. 51 Gößl, Manfred M.: Geoökonomische Megatrends und Weltwirtschaftsordnung. 1997. 20 S. Nr. 52 Knapman, Bruce/ Quiggin, John: The Australian Economy in the Twentieth Century. 1997. 34 S. Nr. 53 Hauschild, Ralf J./ Mansch, Andreas: Erfahrungen aus der Bestandsaufnahme einer Auswahl von Outsourcingfällen für Logistik-Leistungen. 1997. 34 S. Nr. 54 Sell, Axel: Nationale Wirtschaftspolitik und Regionalpolitik im Zeichen der Globalisierung - ein Beitrag zur Standortdebatte in Bremen. 1997. 29 S. Nr. 55 Sell, Axel: Inflation: does it matter in project appraisal. 1998. 25 S. Nr. 56 Mtatifikolo, Fidelis: The Content and Challenges of Reform Programmes in Africa - The Case Study of Tanzania, 1998. 37 S. Nr. 57 Popov, Djordje: Auslandsinvestitionen in der BR Jugoslawien. 1998. 32 S. Nr. 58 Lemper, Alfons: Predöhl und Schumpeter: Ihre Bedeutung für die Erklärung der Entwicklung und der Handelsstruktur Asiens. 1998. 19 S. Nr. 59 Wohlmuth, Karl: Good Governance and Economic Development. New Foundations for Growth in Africa. 1998. 90 S. Nr. 60 Oni, Bankole: The Nigerian University Today and the Challenges of the Twenty First Cen-tury. 1999. 36 S. Nr. 61 Wohlmuth, Karl: Die Hoffnung auf anhaltendes Wachstum in Afrika. 1999. 28 S. Nr. 62 Shams, Rasul: Entwicklungsblockaden: Neuere theoretische Ansätze im Überblick. 1999. 20 S. Nr. 63 Wohlmuth, Karl: Global Competition and Asian Economic Development. Some Neo-Schumpeterian Approaches and their Relevance. 1999. 69 S. Nr. 64 Oni, Bankole: A Framework for Technological Capacity Building in Nigeria: Lessons from Developed Countries. 1999. 56 S.
xlvii
Nr. 65 Toshihiko, Hozumi: Schumpeters Theorien in Japan: Rezeptionsgeschichte und gegenwärtige Bedeutung. 1999. 22 S. Nr. 66 Bass, Hans H.: Japans Nationales Innovationssystem: Leistungsfähigkeit und Perspektiven. 1999. 24 S. Nr. 67 Sell, Axel: Innovationen und weltwirtschaftliche Dynamik – Der Beitrag der Innovations-forschung nach Schumpeter. 2000. 31 S. Nr. 68 Pawlowska, Beata: The Polish Tax Reform. 2000. 41 S. Nr. 69 Gutowski, Achim: PR China and India – Development after the Asian Economic Crisis in a 21st Century Global Economy. 2001. 56 S. Nr. 70 Jha, Praveen: A note on India's post-independence economic development and some com-ments on the associated development discourse. 2001. 22 S. Nr. 71 Wohlmuth, Karl: Africa’s Growth Prospects in the Era of Globalisation: The Optimists versus The Pessimists. 2001. 71 S. Nr. 72 Sell, Axel: Foreign Direct Investment, Strategic Alliances and the International Competi-tiveness of Nations. With Special Reference on Japan and Germany. 2001. 23 S. Nr. 73 Arndt, Andreas: Der innereuropäische Linienluftverkehr - Stylized Facts und ordnungspoliti-scher Rahmen. 2001. 44 S. Nr. 74 Heimann, Beata: Tax Incentives for Foreign Direct Investment in the Tax Systems of Poland, The Netherlands, Belgium and France. 2001. 53 S. Nr. 75 Wohlmuth, Karl: Impacts of the Asian Crisis on Developing Economies – The Need for Institu-tional Innovations. 2001. 63 S. Nr. 76 Heimann, Beata: The Recent Trends in Personal Income Taxation in Poland and in the UK. Crisis on Developing Economies – The Need for Institutional Innovations. 2001. 77 S.
xlviii
Nr. 77 Arndt, Andreas: Zur Qualität von Luftverkehrsstatistiken für das innereuropäische Luftver-kehrsgebiet. 2002. 36 S. Nr. 78 Frempong, Godfred: Telecommunication Reforms – Ghana’s Experience. 2002. 39 S. Nr. 79 Kifle, Temesgen: Educational Gender Gap in Eritrea. 2002. 54 S. Nr. 80 Knedlik, Tobias/ Burger, Philippe: Optimale Geldpolitik in kleinen offenen Volkswirtschaften – Ein Modell. 2003. 20 S. Nr. 81 Wohlmuth, Karl: Chancen der Globalisierung – für wen? 2003. 65 S. Nr. 82 Meyn, Mareike: Das Freihandelsabkommen zwischen Südafrika und der EU und seine Impli-kationen für die Länder der Southern African Customs Union (SACU). 2003. 34 S. Nr. 83 Sell, Axel: Transnationale Unternehmen in Ländern niedrigen und mittleren Einkom-mens. 2003. 13 S. Nr. 84 Kifle, Temesgen: Policy Directions and Program Needs for Achieving Food Security in Eritrea. 2003. 27 S. Nr. 85 Gutowski, Achim: Standortqualitäten und ausländische Direktinvestitionen in der VR China und Indien. 2003. 29 S. Nr. 86 Uzor, Osmund Osinachi: Small and Medium Enterprises Cluster Development in South-Eastern Region of Nigeria. 2004. 35 S. Nr. 87 Knedlik, Tobias: Der IWF und Währungskrisen – Vom Krisenmanagement zur Prävention. 2004. 40 S. Nr. 88 Riese, Juliane: Wie können Investitionen in Afrika durch nationale, regionale und internatio-nale Abkommen gefördert werden? 2004. 67 S. Nr. 89 Meyn, Mareike: The Export Performance of the South African Automotive Industry. New Stim-uli by the EU-South Africa Free Trade Agreement? 2004. 61 S.
xlix
Nr. 90 Kifle, Temesgen: Can Border Demarcation Help Eritrea to Reverse the General Slowdown in Economic Growth? 2004. 44 S. Nr. 91 Wohlmuth, Karl: The African Growth Tragedy: Comments and an Agenda for Action. 2004. 56 S. Nr. 92 Decker, Christian/ Paesler, Stephan: Financing of Pay-on-Production-Models. 2004. 15 S. Nr. 93 Knorr, Andreas/ Žigová, Silvia: Competitive Advantage Through Innovative Pricing Strategies – The Case of the Airline Industry. 2004. 21 S. Nr. 94 Sell, Axel: Die Genesis von Corporate Governance. 2004. 18 S. Nr. 95 Yun, Chunji: Japanese Multinational Corporations in East Asia: Status Quo or Sign of Changes? 2005. 57 S. Nr. 96 Knedlik, Tobias: Schätzung der Monetären Bedingungen in Südafrika. 2005. 20 S. Nr. 97 Burger, Philippe: The transformation process in South Africa: What does existing data tell us? 2005. 18 S. Nr. 98 Burger, Philippe: Fiscal sustainability: the origin, development and nature of an ongoing 200-year old debate. 2005. 32 S. Nr. 99 Burmistrova, Marina A.: Corporate Governance and Corporate Finance: A Cross-Country Analysis. 2005. 16 S. Nr. 100 Sell, Axel: Alternativen einer nationalstaatlichen Beschäftigungspolitik. 2005. 41 S. Nr. 101 Bass, Hans-Heinrich: KMU in der deutschen Volkswirtschaft: Vergangenheit, Gegenwart, Zukunft. 2006. 19 S. Nr. 102 Knedlik, Tobias/ Kronthaler, Franz: Kann ökonomische Freiheit durch Entwicklungshilfe forciert werden? Eine empiri-sche Analyse. 2006. 18 S.
l
Nr. 103 Lueg, Barbara: Emissionshandel als eines der flexiblen Instrumente des Kyoto-Protokolls. Wir-kungsweisen und praktische Ausgestaltung. 2007. 32 S. Nr. 104 Burger, Phillipe: South Africa economic policy: Are we moving towards a welfare state? 2007. 31 S. Nr. 105 Ebenthal, Sebastian: Messung von Globalisierung in Entwicklungsländern: Zur Analyse der Globalisie-rung mit Globalisierungsindizes. 2007. 36 S. Nr. 106 Wohlmuth, Karl: Reconstruction of Economic Governance after Conflict in Resource-Rich Afri-can Countries: Concepts, Dimensions and Policy Interventions. 2007. 42 S. Nr. 107 Smirnych, Larissa: Arbeitsmarkt in Russland - Institutionelle Entwicklung und ökonomische Ten-denzen. 2007. 34 S. Nr. 108 Kifle, Temesgen: Africa Hit Hardest by Global Warming Despite its Low Greenhouse Gas Emis-sions. 2008. 22 S. . Nr. 109 Alabi, Reuben Adeolu: Income Sources Diversification: Empirical Evidence from Edo State, Nigeria. 2008. 54 S. Nr. 110 Jantzen, Katharina Eine Einführung in Regulierungssysteme für die Fischerei im Nordatlantik am Beispiel der Fanggründe vor Island und Neufundland, 2008. 32 S. Nr. 111 Ebenthal, Sebastian: Mexiko im Kontext der Globalisierung -Ergebnisse eines Globalisierungsindex für Entwicklungsländer, 2008. 72 S. Nr. 112 Rieckmann, Johannes: Two Dynamic Export Sectors (Diamonds, Tourism) in Namibia and Botswana: Comparison of Development Strategies. 2008. 48 S. Nr. 113 Albers, Harm: Globalisierung und Wachstum: Die Konvergenzdebatte – dargestellt mit Be-zug auf Veröffentlichungen dreier Wissenschaftler. 2008. 35 S. Nr. 114 Alabi Reuben Adeolu: Income distribution and accessibility to primary and secondary schools in Ni-geria. 2009. 54 S. Nr. 115 Wohlmuth, Karl: World Economic Crisis - Globalization - Global Employment Crisis - Challenge
li
for the Reform of Labour and Employment Policies in Japan and in Germany, 2009.55 S. Nr.116 Temesgen, Kifle: Motivation of Remittance Senders: Evidence from Eritrean Immigrants in German, 2009. 38 S. Nr. 117 Wohlmuth , Karl: Emerging Markets - Die afrikanischen Staaten in der Weltwirtschaft, 2009. 13 S. Nr. 118 Uzor, Osmund Usinachi: The ISMED Model and Public-Private Partnerships in the Promotion of Agro-Industrial Clusters in Nigeria. 2010. 37 S. Nr. 119 Alabi, Reuben Adeolu: Progressivity of Education Spending in Nigeria. 2010. 56S. Nr. 120 Alabi, Reuben Adeolu: Redistribution of Education and Redistributive Effects of Education Spending in Nigeria. 2010. 82 S. Nr. 121 Alabi, Reuben Adeolu: Marginal Benefit Incidence of Public Spending on Health Services in Nigeria. 2011. 53S.


![Journal für Reproduktionsmedizin und EndokrinologieThe prevalence of infertility among couples of reproduc-tive age is estimated at 15 % [1]. In approximately 25 %, various causes](https://img.pdfslide.org/doc/110x75/600f3716e12e95082562ba4d/journal-fr-reproduktionsmedizin-und-endokrinologie-the-prevalence-of-infertility.jpg)