Embed Size (px)
Citation preview
KFV - Sicher Leben#7
KFV (Kuratorium für Verkehrssicherheit)
The impact of distraction on driving behaviour in urban traffic.
Results of a simulator-based study
KFV - Sicher Leben#7
KFV - Sicher Leben. Band #7. The impact of distraction on driving behaviour in urban traffic.Results of a simulator-based study. Vienna, 2017
Media owner and publisherKFV (Austrian Road Safety Board)
AuthorsMonika Pilgerstorfer (KFV)Sofie Boets (BRSI)
© KFV (Kuratorium für Verkehrssicherheit)
The impact of distraction on driving behaviour in urban traffic.
Results of a simulator-based study
5 | KFV The impact of distraction on driving behaviour in urban traffic
CONTENT 1 ABSTRACT 8
2 INTRODUCTION 10 2.1 Background 10 2.2 Research questions 11 2.3 Framework and setting 12
3 METHODOLOGY 14 3.1 Participants 14 3.2 Materials 18 3.2.1 BRSI driving simulator 18 3.2.2 Simulated test tracks & secondary tasks 19 3.2.3 Eye-tracking 22 3.2.4 Questionnaires 23 3.3 Study design and analysis 23 3.4 Eye-tracking analysis 26
4 RESULTS 28 4.1 Pre-questionnaire 28 4.1.1 Self-reported behaviour 28 4.1.2 Opinions 30 4.1.3 Intentions 31 4.1.4 Summary 32 4.2 Simulator driving variables 32 4.2.1 Mean speed 33 4.2.2 Standard deviation of lateral position (SDLP) 35 4.2.3 Detection time (DT) 37 4.2.4 Reaction time (RT) 38 4.2.5 Crashes and crash probability 40 4.2.6 Summary and comments on the mathematical models 42 4.3 Post-ride questionnaires 43 4.4 Comparison of pre- and post-questionnaires 47 4.4.1 Opinions 48 4.4.2 Intentions 49 4.4.3 Simulator sickness 49 4.5 Eye-tracking 50
5 SUMMARY & CONCLUSIONS 54
KFV The impact of distraction on driving behaviour in urban traffic | 65 | KFV The impact of distraction on driving behaviour in urban traffic
REFERENCES 58
APPENDIX 62 1. Detailed procedure 62 2. Standard instructions (start-up and for each test track) 63 3. Operationalization of tasks 64 4. Text messages - English translation 65 5. Questions in the phoning task and order in the scenario 65 6. Pre-questionnaire – English translation 66 7. Post-ride questionnaires – English summary 70 8. Post questionnaires (original German version) 72 9. Post-questionnaire – English translation 77 10. Mathematical model sample boxplots (N56) 79 11. Full sample boxplots (N63) 80
IMPRESSUM 83
KFV The impact of distraction on driving behaviour in urban traffic | 87 | KFV The impact of distraction on driving behaviour in urban traffic
1 ABSTRACTDistraction in traffic is a growing problem. In Austria, distraction, together with inattention, is res-
ponsible for one third of all injury accidents.1 On an international level, it is estimated that distraction
contributes to 5% to 25% of all traffic accidents.2 For this reason, the Austrian Road Safety Board
(KFV) has dealt extensively with the topic of distraction while driving. Surveys, expert assessments
and Naturalistic Driving Observations have been used to identify the main sources of distraction (in
terms of frequency, duration, use of cognitive, visual, auditive and manual resources) for Austrian car
drivers. These were identified as: (1) phoning, (2) texting, and (3) eating and drinking.
The aim of the current study was to evaluate the effect of these sources of distraction on the driving
behaviour and safety of experienced drivers using a repeated measures design. Six experimental con-
ditions were included in three simulator tracks: (1) reading and writing text messages; (2) talking on
the phone (hand-held as well as hands-free); (3) eating and drinking. Each experimental condition
was composed of two track sections that included the respective distraction task. The effects were
analysed with regard to driver related characteristics (two age groups and gender) and unexpected
incidents while driving (e.g. a pedestrian suddenly crossing the road). In total, 63 participants comple-
ted all four tracks (three experimental and one control) in the StiSim3 driving simulator. The order of
the conditions was counterbalanced between the subjects to reduce order effects due to fatigue or le-
arning. Simulator driving and self-reported data were gathered for all subjects, as well as eye-tracking
data for part of the sample. Six (generalized) mixed linear models were developed to estimate the
effects of different side activities on each dependent variable, while also taking into account random
effects (heterogeneity across subjects). The six dependent variables were: mean speed, standard devi-
ation of lateral position (SDLP), hazard detection time, reaction time to the hazard, hazard collision
and general collision probability.
The results obtained by applying (generalized) mixed linear models indicate that, compared with the
other distraction sources, reading and writing text messages had the most detrimental effects on the
simulated driving (i.e. lower mean driving speed, increased reaction time and standard deviation of
lateral position), while hands-free phoning did not influence driving. The eye-tracking results are also
in line with this finding: the percentage of gaze at relevant screen areas for reading and writing text
messages was lower than the control condition. Interactions were found with age and especially with
gender, suggesting that females, and to some extent middle-aged drivers, are more likely to self-re-
gulate than males and young drivers when distracted while driving. Finally, the perceived effects of
the different sources of distraction during the experiment were largely in line with actual driving
performance.
1 Verkehrsunfallstatistik 2013, 2014, 2015; Statistik Austria. 2 DaCoTA (2012). Driver distraction. Deliverable 4.8 of the EC FP7 project DaCoTA; SWOV (2013) SWOV- Fact sheet. Distraction in traffic. Leidschendam, the Netherlands, Institute for
Road Safety Research.
GO TO CONTENT
KFV The impact of distraction on driving behaviour in urban traffic | 109 | KFV The impact of distraction on driving behaviour in urban traffic
2INTRODUCTION
2.1 BackgroundDistraction on the roads is a familiar yet increasing area of concern for road safety. In Austria, distrac-
tion together with inattention is the main cause of one third of all injury related traffic accidents.3 In
2014, a total of 111 road users died in Austria because they or someone else were (was) inattentive or
distracted while driving. In 2015, this figure rose to 123 such fatalities. On an international level, it is
estimated that distraction plays a role in 5% to 25% of all traffic accidents.4
International studies indicate that drivers are distracted for about 25% to 30% of their driving time:
they have conversations with passengers, listen to music (and therefore operate devices) and often
eat or drink while driving.5
A recent analysis of Naturalistic Driving6 data for 905 crash events that resulted in injuries to people
and/or damage to property showed that distraction is detrimental to driver safety. The use rates and
risk of accident are especially high for hand-held electronic devices. A closer look at road accidents
that resulted in injuries and/or damage to property reveals that distraction was a factor in 68.3% of all
cases. Overall, the risk of accident due to distraction while driving was two times higher than in cases
when the driver was not distracted. Researchers conclude that sources of distraction which require
drivers to take their eyes off the road ahead have the highest risk.7
A previous analysis of the distracting effects of mobile phones showed that although talking on the
phone seems to have no effect on crash risk, visual-manual phone tasks such as dialling or texting
significantly increase crash and near-crash risk. Furthermore, drivers distracted by such activities look
away from the road for a long time and distance. On average, drivers take their eyes off the road for
23.3 seconds while texting, 7.8 seconds while dialling without a hands-free system, and between 0.5
and 2.5 seconds when starting a hands-free call.8 When it comes to the duration of distracting activi-
ties in relation to total driving time, the following activities distract drivers longest: talking to passen-
gers (15.32%), eating and drinking (3.16%), and the use of mobile devices (1.3%).9
Based on findings in corresponding literature and previous KFV projects10, the topic of distraction in
traffic was further examined by KFV in 2015. In an extensive phone survey, 1,000 road users, inclu-
ding 657 car drivers, were asked about the frequency of their side activities while driving. The respon-
3 Statistics Austria: Road traffic accidents.4 DaCoTA (2012). Driver distraction. Deliverable 4.8 of the EC FP7 project DaCoTA; SWOV (2013) SWOV- Fact sheet. Distraction in traffic. Leidschendam, the Netherlands, Institute for Road Safety Research.5 SWOV (2013) SWOV- Fact sheet. Distraction in traffic. Leidschendam, the Netherlands, Institute for Road Safety Research; Klauer S.G., Dingus T.A., Neale V.L., Sudweeks J., Ramsey D., The impact of driver
inattention on near-crash/crash risk: An analysis using the 100-car naturalistic driving study data. Washington DC: NHTSA; 2006. (Technical Report).6 In naturalistic driving observations, the behaviour of road users is observed unobtrusively in a natural setting for a long period of time (SWOV, 2012).7 Dingus, T.A., Guo, F., Lee S., Antin, J.F., Perez, M., Buchanan-King, M., & Hankey, J. (2016). Driver crash risk factors and prevalence evaluation using naturalistic driving data. PNAS Early Edition, 113(10),
2636-26418 Fitch G.M, Soccolich S.A, Guo F., McClafferty J., Fang Y, Olson R.L., Perez M.A., Hanowski R-J.,. Hankey J.M. Dingus T.A.(2013). The impact of handheld and hands-free cell phone use on driving performance
and safety critical event risk. DOT HS 811 757. USA: National Highway Traffic Safety Administration.9 http://www.rospa.com/road-safety/advice/drivers/distraction/fact-sheet/ 10 Cf. Kühnelt-Leddihn, A., Bauer, R., Schuster, M., Braun, E., Hofer, M. (2013) Get Smart. Smartphone Verwendung und Verkehrssicherheit bei jugendlichen FußgängerInnen und RadfahrerInnen [Smartphone
use by young pedestrians and cyclists and road safety], https://www.bmvit.gv.at/verkehr/strasse/publikationen/sicherheit/vsf/downloads/26_endbericht_getsmart.pdf; Nitsche, P., Aichinger, C., Aigner-Breuss, E., Hahn, M., Kaiser, S., Rußwurm, K., Stütz, R. (2014) FAST. Fahrverhaltensstudien zur Ablenkungsbewertung von Straßeninfrastruktur [Driving Behaviour Studies on the Impact of Road Infrastructure on Driver Distraction] (2014), http://www.bmvit.gv.at/verkehr/strasse/sicherheit/fonds/vsf/downloads/33_fast.pdf ; Aleksa, M., Aichinger, C., Hahn, M., Harnisch, M., Kaiser, S., Nitsche, P., Rußwurm, K., Winkelbauer, M. (2014) ORTUNG. Objektive Beurteilung von Navigationssystemen mit Empfehlungen für den Gesetzesgeber [Objective assessment of navigation systems with recommenda-tions for policy makers], https://www.bmvit.gv.at/service/publikationen/verkehr/strasse/verkehrssicherheit/vsf/downloads/37_ortung.pdf
GO TO CONTENT
11 | KFV The impact of distraction on driving behaviour in urban traffic
ses indicated that the most common distractors in Austrian traffic are: conversation with passengers,
followed by daydreaming or becoming lost in thoughts, drinking and eating. Another common side
activity are phone calls - About one third of the responding car drivers use a mobile phone to make
a call while driving at least occasionally. Of these phone calls, 18.5% are made without hands-free
equipment. Around half of the car drivers answer their mobile phones while driving at least occasio-
nally, 32.6% of them using a hand-held device.
The reading and writing of text messages are a further cause of risks. Forty percent of the survey par-
ticipants Forty percent state that they check for incoming messages, text actively or read text messages
– 5% even do so “frequently”. An extrapolation of the responses to a previous survey,11 which focused
on phone use while driving, showed that about 73 million text messages are sent from Austrian cars
every year. If we assume that drivers do not look at the road for five seconds per text message, at an
average speed of 50 km/h Austrian cars would circumnavigate the globe 128 times (5.1 million kilo-
metres) every year while being driven blind.
In addition to the visual distraction, such activities also take up cognitive and motoric resources. It
can likewise be assumed that this kind of side activity will continue to grow. To identify specifics for
novice drivers, 256 participants in the second phase of driver training12 (mostly young adults aged
up to 22 years) were also surveyed using questionnaires which focused on the frequencies of various
side activities during driving. The results showed a rise in communication via text messages during
driving among young drivers.
The subjective information was complemented by a video analysis of Naturalistic Driving Observati-
ons,13 in which driving behaviour is observed unobtrusively in a natural setting by video cameras and
measuring devices. This analysis revealed that distracting activities could be observed in around half
of the video sequences examined. The most frequent side activities were conversations (10%), most
of them presumably hands-free phone calls (a few may have been conversations with passengers or
soliloquys) and hand-held phone calls (2%).
A KFV expert panel assessed the internal resources used in the most common side activities while dri-
ving. In doing so, they assessed the extent to which the attention required for participating in traffic is
hindered by visual, auditive, motoric, and/or cognitive demands and ranked the side activities accor-
ding to their need for action(s). The following three side activities used the most internal resources:
phoning, texting, and eating/drinking.
2.2 Research questionsThe aim of the current study was to evaluate the effect of the top three distracting activities on the
driving behaviour and safety of experienced drivers in Austria using a repeated measures design. The
specific research questions were as follows:
1. What is the impact of reading text messages, writing text messages, phoning with a hand-held
device, phoning with hands-free equipment, eating, and drinking on
· five key aspects of driving behaviour and road safety (speed, standard deviation of lateral position,
detection and reaction time to sudden critical events, crashes), and on
· the perceived mental load of car drivers?
11 Representative survey (1,000 Austrian drivers, 17+ years), conducted by Marketmind on behalf of KFV, 2014.12 A post-licence measure in Austria; All learner drivers must complete a safe driving course, psychological group discussion and two feedback drives within a year of obtaining their licence.13 Data were used from Pommer, A., Donabauer, M., Winkelbauer, M., Schneider, F., Robatsch, K. (2016). KFV- Sicher Leben. Band #1. 100-Car Study Österreich [100-Car Study Austria]. Vienna.
GO TO CONTENT
KFV The impact of distraction on driving behaviour in urban traffic | 1211 | KFV The impact of distraction on driving behaviour in urban traffic
2. Which differences can be observed in gaze behaviour between different driving conditions (no
distraction and distracting activities)?
Although this is a well-researched topic, the aim was also to add to the existing literature by inclu-
ding interactions with age and gender as well as subjective data. The study is an extended replication
of a Belgian study on the effects of texting (reading and writing) on the driving behaviour of young
drivers.14
2.3 Framework and settingThe project was carried out by the Belgian Road Safety Institute (BRSI) for and with KFV. BRSI was
responsible for the set-up, field work, and analysis of questionnaires and simulator data. KFV provi-
ded support in the development of the design and scope, the recruitment of subjects, and the fieldwo-
rk in Vienna. The eye-tracking data analysis was also conducted by KFV. The project was carried out
between June and December 2015.
14 Boets, S., Ross, V., Van Belle, G., Vanroelen, G. & Jongen, E. (2015) Effects of texting on driving behaviour of young drivers in urban traffic. Results of a simulator-based study. Road Safety and Simulation Conference, Orlando, USA (Oct. 6-8 2015).
GO TO CONTENT
KFV The impact of distraction on driving behaviour in urban traffic | 1413 | KFV The impact of distraction on driving behaviour in urban traffic
3 METHODOLOGY
3.1 ParticipantsThe recruitment of participants was outsourced to a survey services provider. The aim was to obtain
a study sample of 60 participants distributed equally over four groups by age (20-34 years and 35-49
years) and gender, and an additional sample of participants aged 50+ years (only included in the de-
scriptive analysis). Participation was voluntary. The initial inclusion criteria were:
· has a class B driving licence15 and is medically fit to drive
· has driven a car for a minimum of 10,000 km in the last 12 months
· Samsung Galaxy smartphone user
· does not suffer from migraines or epilepsy, does not wear reading glasses, has no food allergies
Some of the initial criteria had to be lowered or omitted to reach the required sample size (>5,000 km
driven in last 12 months; not all participants were Samsung Galaxy smartphone users, but all were
experienced in the use of this device; some participants wore reading glasses). Participants were asked
to bring their unlocked/charged smartphone, earplugs (if available, otherwise these were provided by
KFV), and glasses with them on the day of the experiment. The participants each received 50 euros as
compensation for their participation. A total of 78 people were invited to participate. Since eight of
these did not show up, and seven had to be excluded (five did not meet the inclusion criteria and two
had to stop due to simulator sickness), the final study sample consisted of 63 participants.
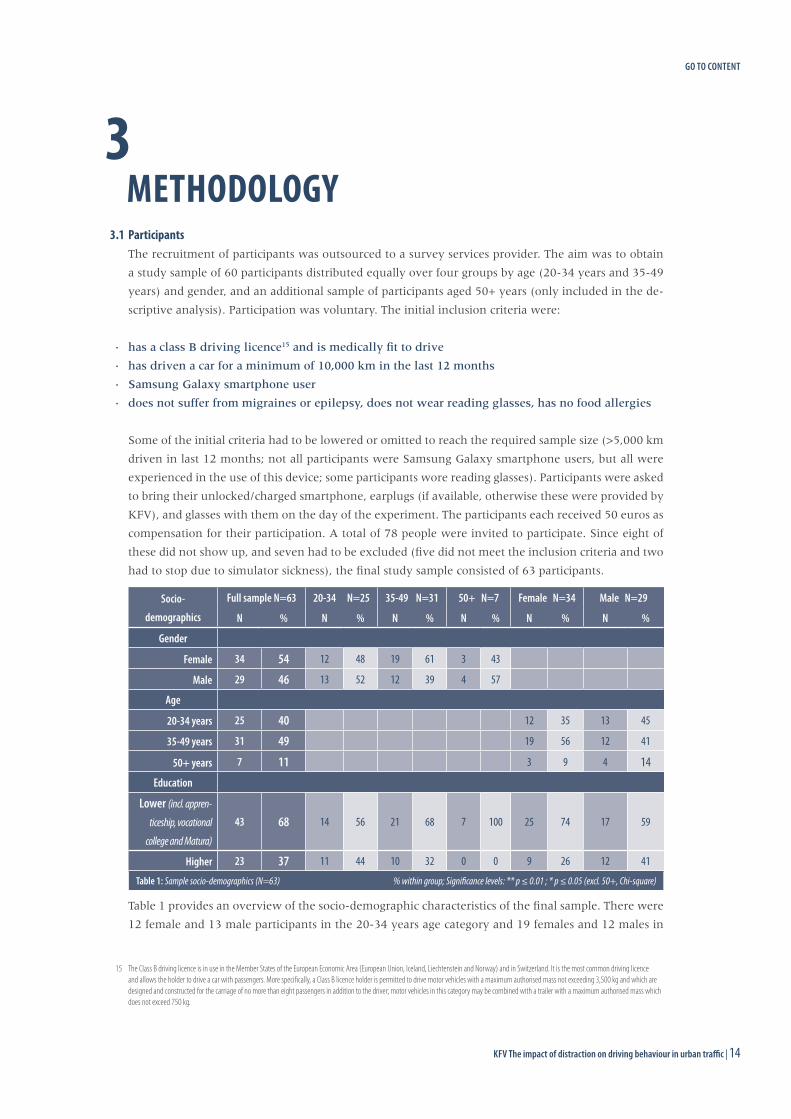
Table 1 provides an overview of the socio-demographic characteristics of the final sample. There were
12 female and 13 male participants in the 20-34 years age category and 19 females and 12 males in
15 The Class B driving licence is in use in the Member States of the European Economic Area (European Union, Iceland, Liechtenstein and Norway) and in Switzerland. It is the most common driving licence and allows the holder to drive a car with passengers. More specifically, a Class B licence holder is permitted to drive motor vehicles with a maximum authorised mass not exceeding 3,500 kg and which are designed and constructed for the carriage of no more than eight passengers in addition to the driver; motor vehicles in this category may be combined with a trailer with a maximum authorised mass which does not exceed 750 kg.
Socio-
demographics
Full sample N=63 20-34 N=25 35-49 N=31 50+ N=7 Female N=34 Male N=29
N % N % N % N % N % N %
Gender
Female 34 54 12 48 19 61 3 43
Male 29 46 13 52 12 39 4 57
Age
20-34 years 25 40 12 35 13 45
35-49 years 31 49 19 56 12 41
50+ years 7 11 3 9 4 14Education
Lower (incl. appren-ticeship, vocational
college and Matura)
43 68 14 56 21 68 7 100 25 74 17 59
Higher 23 37 11 44 10 32 0 0 9 26 12 41
Table 1: Sample socio-demographics (N=63) % within group; Significance levels: ** p ≤ 0.01 ; * p ≤ 0.05 (excl. 50+, Chi-square)
GO TO CONTENT
15 | KFV The impact of distraction on driving behaviour in urban traffic
the 35-49 years age group. The 50+ years group consisted of 3 female and 4 male participants. There
were no significant differences in the level of education among the (gender or age) groups. The mean
age was 37.4 years (SD 10.4; range: 21-63).
Further comparisons based on gender and age category (20-34 vs. 35-49 years) indicated that the
subgroups matched on different relevant driving and smartphone related variables, such as reported
frequency of car driving, kilometres driven in the last 12 months, months of owning a smartphone,
and perceived ease of texting. The frequency of texting did however differ.
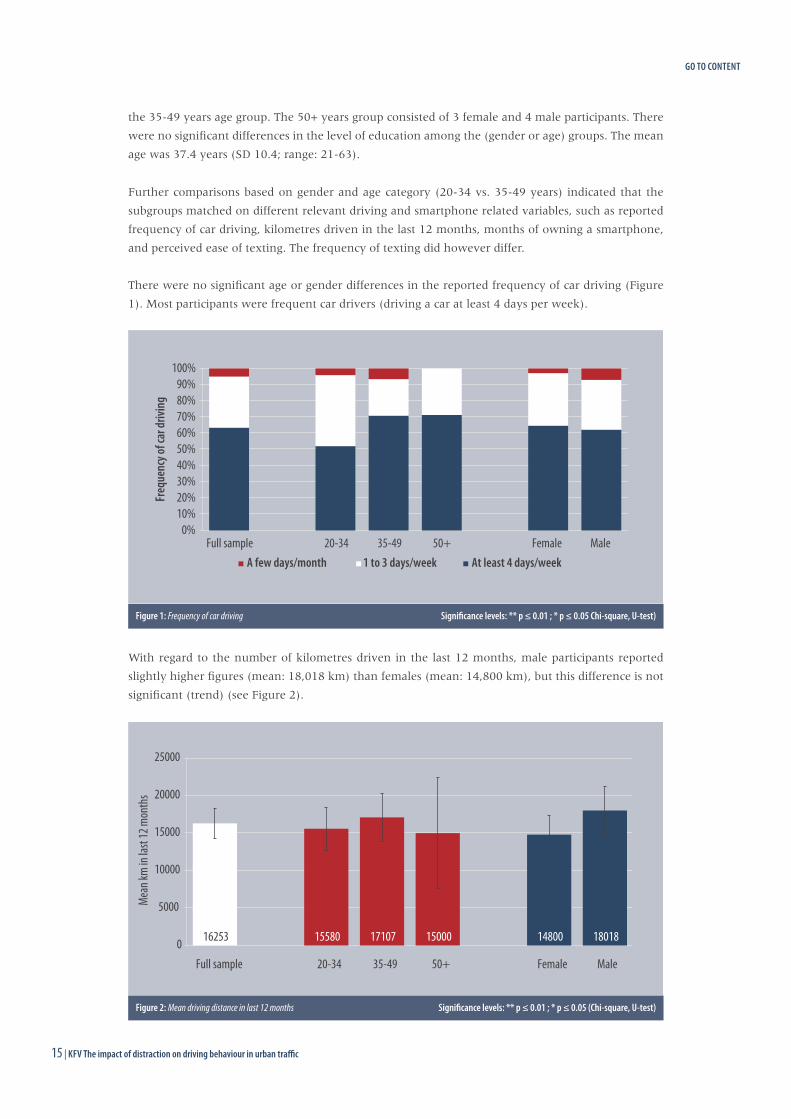
There were no significant age or gender differences in the reported frequency of car driving (Figure
1). Most participants were frequent car drivers (driving a car at least 4 days per week).
With regard to the number of kilometres driven in the last 12 months, male participants reported
slightly higher figures (mean: 18,018 km) than females (mean: 14,800 km), but this difference is not
significant (trend) (see Figure 2).
0% 10% 20% 30% 40% 50% 60% 70% 80% 90%
100%
Full sample 20-34 35-49 50+ Female Male
Freq
uenc
y of c
ar dr
iving
A few days/month 1 to 3 days/week At least 4 days/week
Figure 1: Frequency of car driving Significance levels: ** p ≤ 0.01 ; * p ≤ 0.05 Chi-square, U-test)
16253 15580 17107 15000 14800 18018 0
5000
10000
15000
20000
25000
Full sample 20-34 35-49 50+ Female Male
Mean
km in
last
12 m
onth
s
Figure 2: Mean driving distance in last 12 months Significance levels: ** p ≤ 0.01 ; * p ≤ 0.05 (Chi-square, U-test)
GO TO CONTENT
KFV The impact of distraction on driving behaviour in urban traffic | 1615 | KFV The impact of distraction on driving behaviour in urban traffic
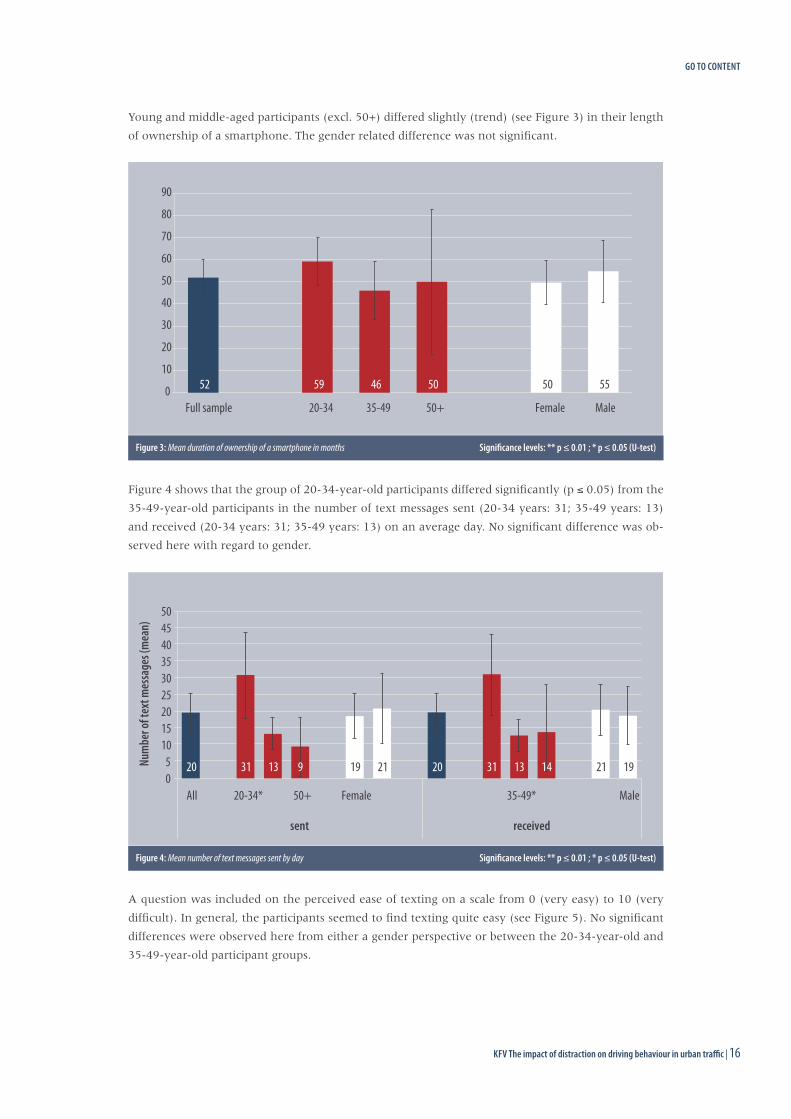
Young and middle-aged participants (excl. 50+) differed slightly (trend) (see Figure 3) in their length
of ownership of a smartphone. The gender related difference was not significant.
Figure 4 shows that the group of 20-34-year-old participants differed significantly (p ≤ 0.05) from the
35-49-year-old participants in the number of text messages sent (20-34 years: 31; 35-49 years: 13)
and received (20-34 years: 31; 35-49 years: 13) on an average day. No significant difference was ob-
served here with regard to gender.
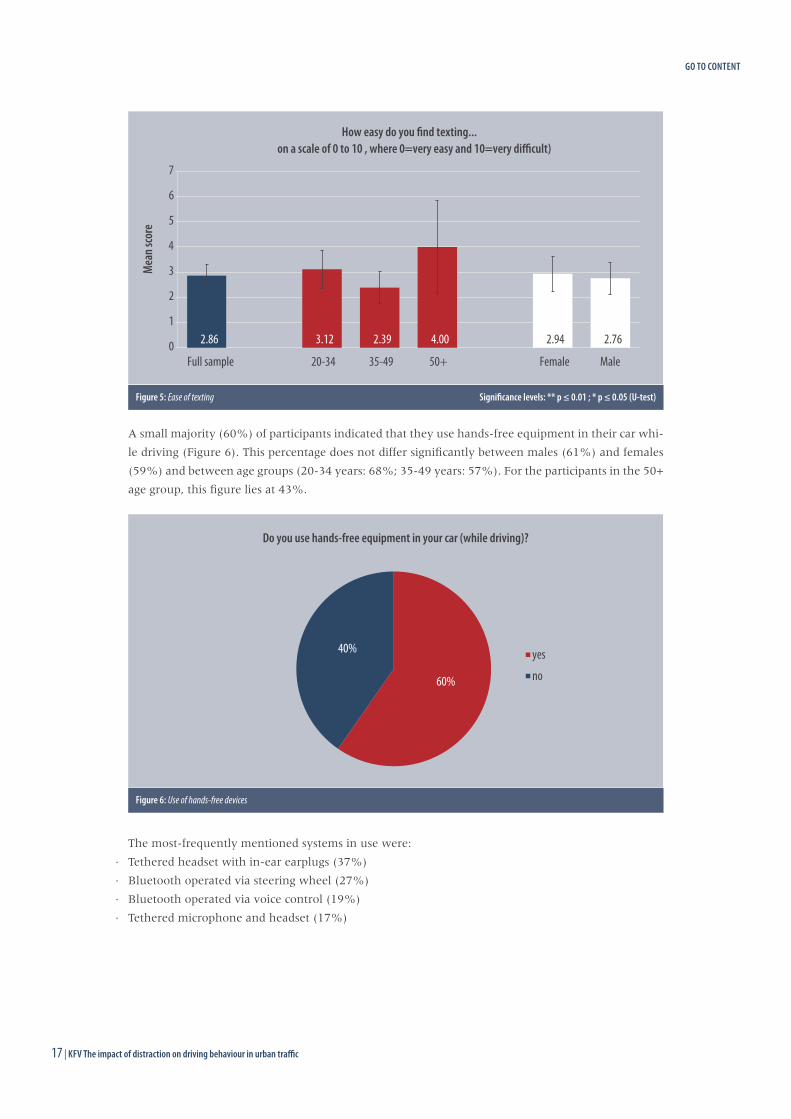
A question was included on the perceived ease of texting on a scale from 0 (very easy) to 10 (very
difficult). In general, the participants seemed to find texting quite easy (see Figure 5). No significant
differences were observed here from either a gender perspective or between the 20-34-year-old and
35-49-year-old participant groups.
52 59 46 50 50 55 0
10
20
30
40
50
60
70
80
90
Full sample 20-34 35-49 50+ Female Male
Figure 3: Mean duration of ownership of a smartphone in months Significance levels: ** p ≤ 0.01 ; * p ≤ 0.05 (U-test)
20 31 13 9 19 21 20 31 13 14 21 19 0 5
10 15 20 25 30 35 40 45 50
All 20-34* 50+ Female 35-49* Male
sent received
Num
ber o
f tex
t mes
sage
s (m
ean)
Figure 4: Mean number of text messages sent by day Significance levels: ** p ≤ 0.01 ; * p ≤ 0.05 (U-test)
GO TO CONTENT
17 | KFV The impact of distraction on driving behaviour in urban traffic
A small majority (60%) of participants indicated that they use hands-free equipment in their car whi-
le driving (Figure 6). This percentage does not differ significantly between males (61%) and females
(59%) and between age groups (20-34 years: 68%; 35-49 years: 57%). For the participants in the 50+
age group, this figure lies at 43%.
The most-frequently mentioned systems in use were:
· Tethered headset with in-ear earplugs (37%)
· Bluetooth operated via steering wheel (27%)
· Bluetooth operated via voice control (19%)
· Tethered microphone and headset (17%)
2.86 3.12 2.39 4.00 2.94 2.76 0
1
2
3
4
5
6
7
Full sample 20-34 35-49 50+ Female Male
Mea
n sco
re
How easy do you find texting... on a scale of 0 to 10 , where 0=very easy and 10=very difficult)
Figure 5: Ease of texting Significance levels: ** p ≤ 0.01 ; * p ≤ 0.05 (U-test)
60%
40%
Do you use hands-free equipment in your car (while driving)?
yes
no
Figure 6: Use of hands-free devices
GO TO CONTENT
KFV The impact of distraction on driving behaviour in urban traffic | 1817 | KFV The impact of distraction on driving behaviour in urban traffic
3.2 Materials 3.2.1 BRSI driving simulator
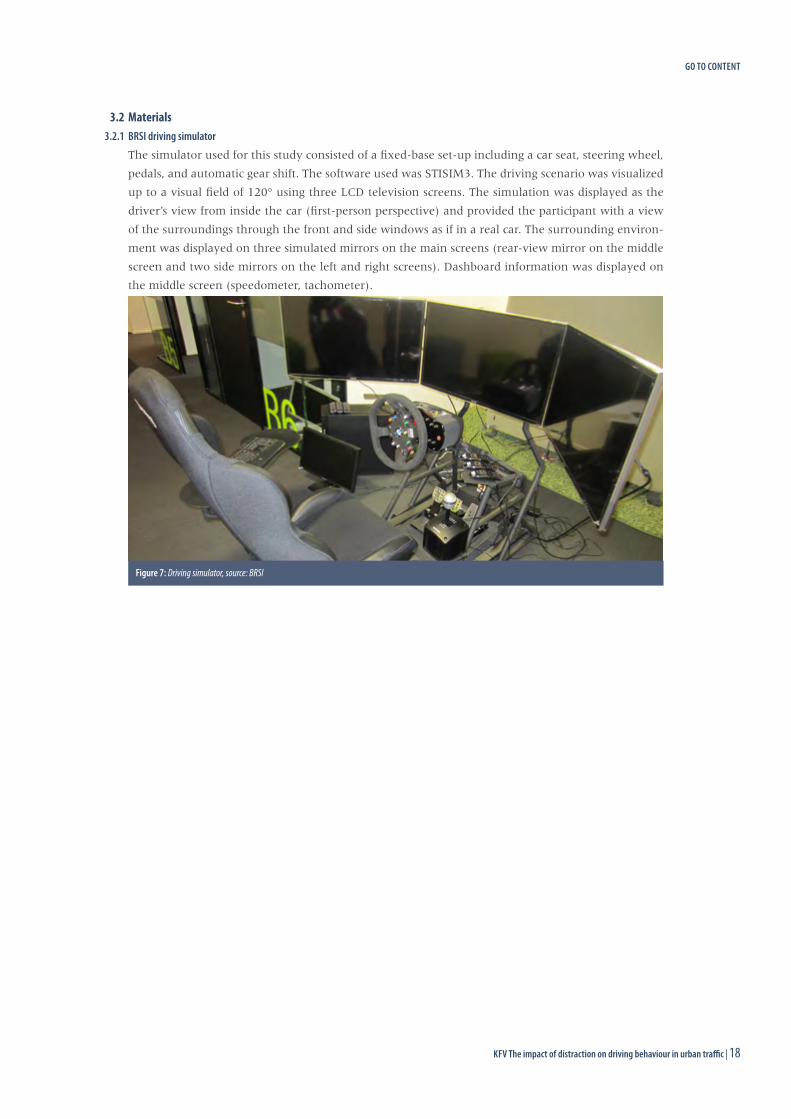
The simulator used for this study consisted of a fixed-base set-up including a car seat, steering wheel,
pedals, and automatic gear shift. The software used was STISIM3. The driving scenario was visualized
up to a visual field of 120° using three LCD television screens. The simulation was displayed as the
driver’s view from inside the car (first-person perspective) and provided the participant with a view
of the surroundings through the front and side windows as if in a real car. The surrounding environ-
ment was displayed on three simulated mirrors on the main screens (rear-view mirror on the middle
screen and two side mirrors on the left and right screens). Dashboard information was displayed on
the middle screen (speedometer, tachometer).
Figure 7: Driving simulator, source: BRSI
GO TO CONTENT
19 | KFV The impact of distraction on driving behaviour in urban traffic
3.2.2 Simulated test tracks & secondary tasks
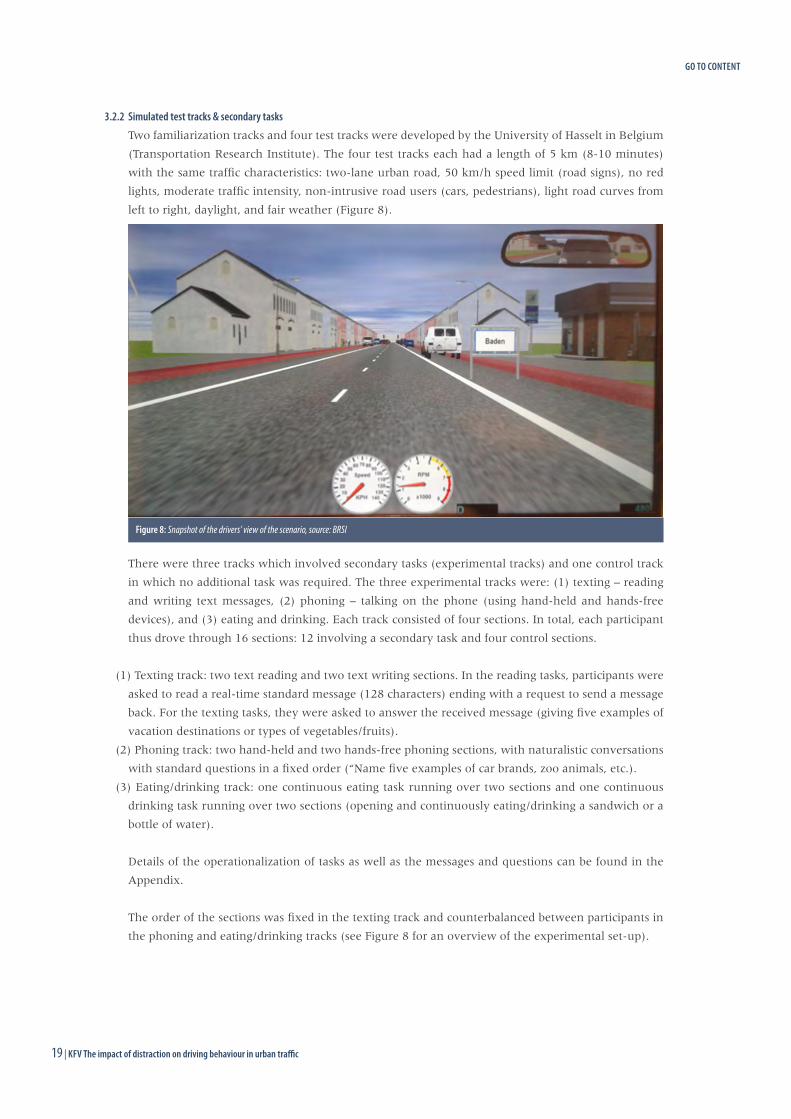
Two familiarization tracks and four test tracks were developed by the University of Hasselt in Belgium
(Transportation Research Institute). The four test tracks each had a length of 5 km (8-10 minutes)
with the same traffic characteristics: two-lane urban road, 50 km/h speed limit (road signs), no red
lights, moderate traffic intensity, non-intrusive road users (cars, pedestrians), light road curves from
left to right, daylight, and fair weather (Figure 8).
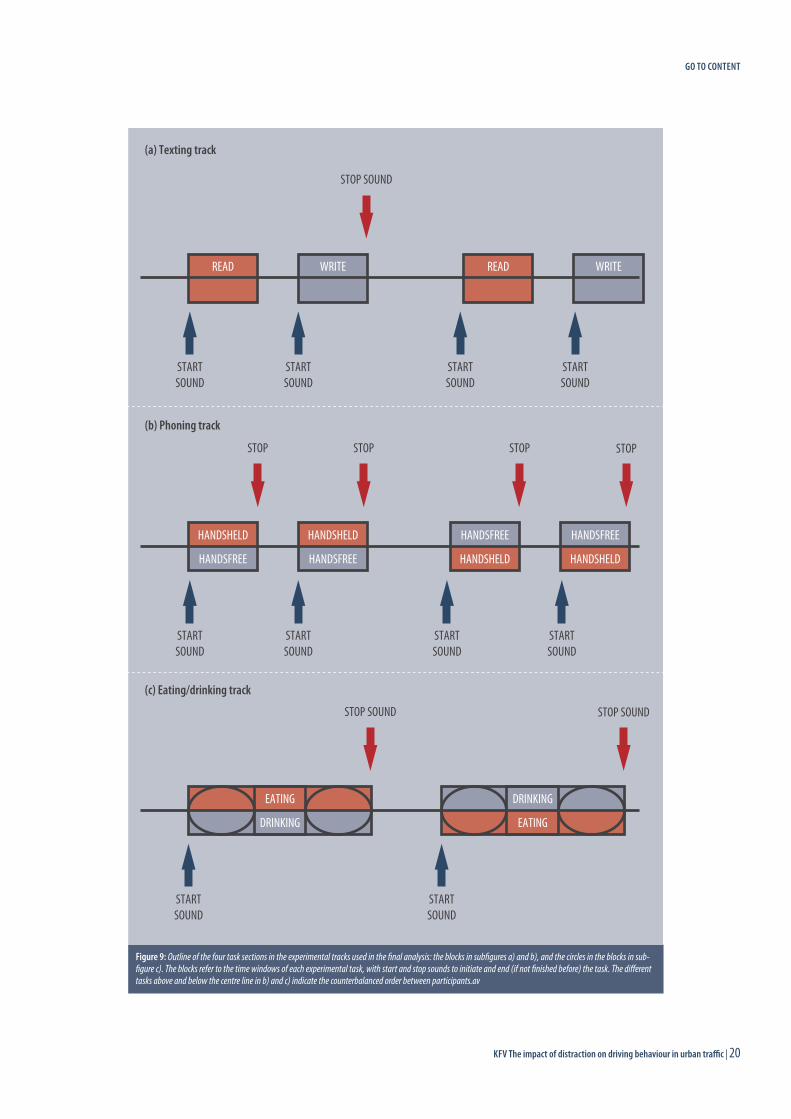
There were three tracks which involved secondary tasks (experimental tracks) and one control track
in which no additional task was required. The three experimental tracks were: (1) texting – reading
and writing text messages, (2) phoning – talking on the phone (using hand-held and hands-free
devices), and (3) eating and drinking. Each track consisted of four sections. In total, each participant
thus drove through 16 sections: 12 involving a secondary task and four control sections.
(1) Texting track: two text reading and two text writing sections. In the reading tasks, participants were
asked to read a real-time standard message (128 characters) ending with a request to send a message
back. For the texting tasks, they were asked to answer the received message (giving five examples of
vacation destinations or types of vegetables/fruits).
(2) Phoning track: two hand-held and two hands-free phoning sections, with naturalistic conversations
with standard questions in a fixed order (“Name five examples of car brands, zoo animals, etc.).
(3) Eating/drinking track: one continuous eating task running over two sections and one continuous
drinking task running over two sections (opening and continuously eating/drinking a sandwich or a
bottle of water).
Details of the operationalization of tasks as well as the messages and questions can be found in the
Appendix.
The order of the sections was fixed in the texting track and counterbalanced between participants in
the phoning and eating/drinking tracks (see Figure 8 for an overview of the experimental set-up).
Figure 8: Snapshot of the drivers’ view of the scenario, source: BRSI
GO TO CONTENT
KFV The impact of distraction on driving behaviour in urban traffic | 2019 | KFV The impact of distraction on driving behaviour in urban traffic
STOP STOP STOP STOP
STARTSOUND
STARTSOUND
STARTSOUND
STARTSOUND
HANDSHELD
HANDSFREE
HANDSHELD
HANDSFREE
HANDSFREE
HANDSHELD
HANDSFREE
HANDSHELD
STOP SOUND STOP SOUND
STARTSOUND
STARTSOUND
EATING
DRINKING
DRINKING
EATING
STOP SOUND
STARTSOUND
STARTSOUND
STARTSOUND
STARTSOUND
READ WRITE READ WRITE
(a) Texting track
(b) Phoning track
(c) Eating/drinking track
Figure 9: Outline of the four task sections in the experimental tracks used in the final analysis: the blocks in subfigures a) and b), and the circles in the blocks in sub-figure c). The blocks refer to the time windows of each experimental task, with start and stop sounds to initiate and end (if not finished before) the task. The different tasks above and below the centre line in b) and c) indicate the counterbalanced order between participants.av
GO TO CONTENT
21 | KFV The impact of distraction on driving behaviour in urban traffic
The start and end point of each section was identical in the four scenarios. In order to reduce order
effects, the environmental characteristics differed within each section. In the tracks with secondary
tasks, the onset and end of the tasks was announced by a start and stop sound programmed in the
scenario.
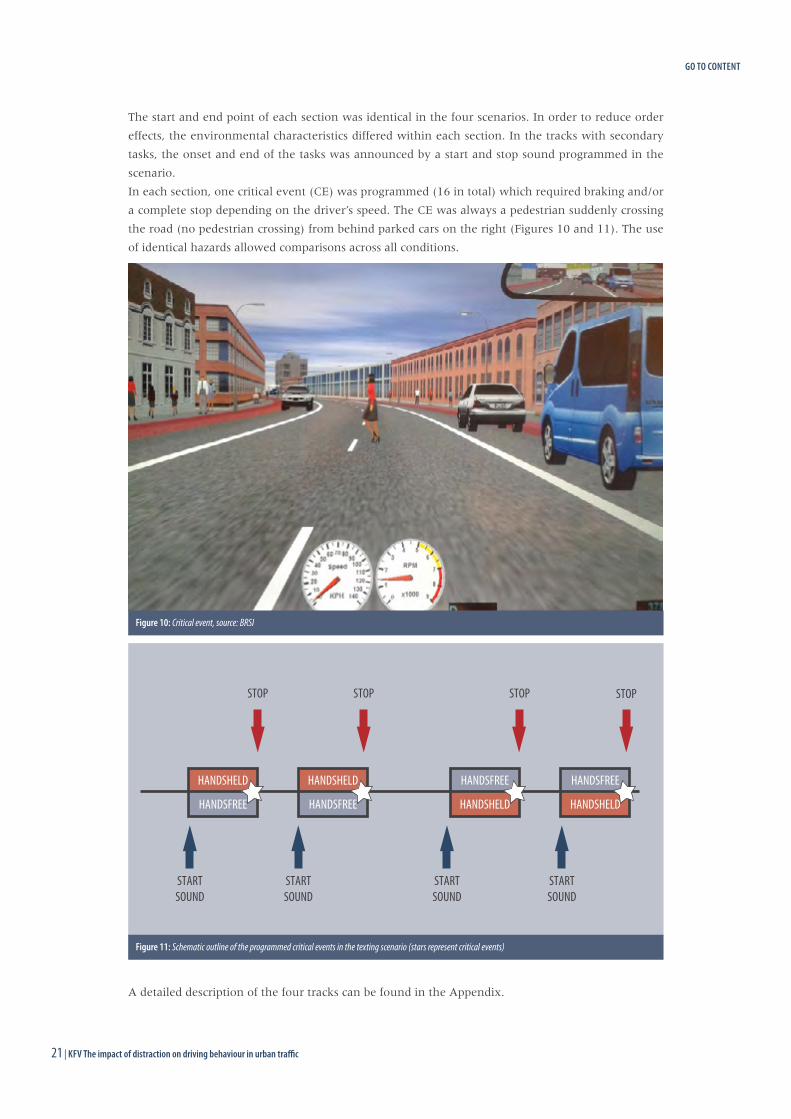
In each section, one critical event (CE) was programmed (16 in total) which required braking and/or
a complete stop depending on the driver’s speed. The CE was always a pedestrian suddenly crossing
the road (no pedestrian crossing) from behind parked cars on the right (Figures 10 and 11). The use
of identical hazards allowed comparisons across all conditions.
A detailed description of the four tracks can be found in the Appendix.
Figure 10: Critical event, source: BRSI
STOP STOP STOP STOP
STARTSOUND
STARTSOUND
STARTSOUND
STARTSOUND
HANDSHELD
HANDSFREE
HANDSHELD
HANDSFREE
HANDSFREE
HANDSHELD
HANDSFREE
HANDSHELD
Figure 11: Schematic outline of the programmed critical events in the texting scenario (stars represent critical events)
GO TO CONTENT
KFV The impact of distraction on driving behaviour in urban traffic | 2221 | KFV The impact of distraction on driving behaviour in urban traffic
The effects of different types of distractions were evaluated for five key parameters. The definitions of
these dependent variables were derived from previous research investigating the effects of distraction
on driving behaviour (e.g. Cuenen et al. 2015, Engström et al. 2005, McKeever et al. 2013). The fol-
lowing variables were extracted for the 16 study sections:
· Mean speed: mean driving speed in meters per second (m/s)
· SDLP: standard deviation of lateral position in meters (m), which can be considered as an index
of road-tracking precision (Ramaekers, 2003)
· Hazard perception:
Detection time (DT): time between the first unexpected move in the critical event and the release
of the accelerator (throttle release) in seconds
Reaction time (RT): time between the first unexpected move in the critical event and the pushing
of the brake pedal in seconds
· Collisions: moment when the surface of the driver’s vehicle overlaps with the surface of any
other object. A differentiation was made between a ‘collision with critical event’ and an ‘other
collision’.
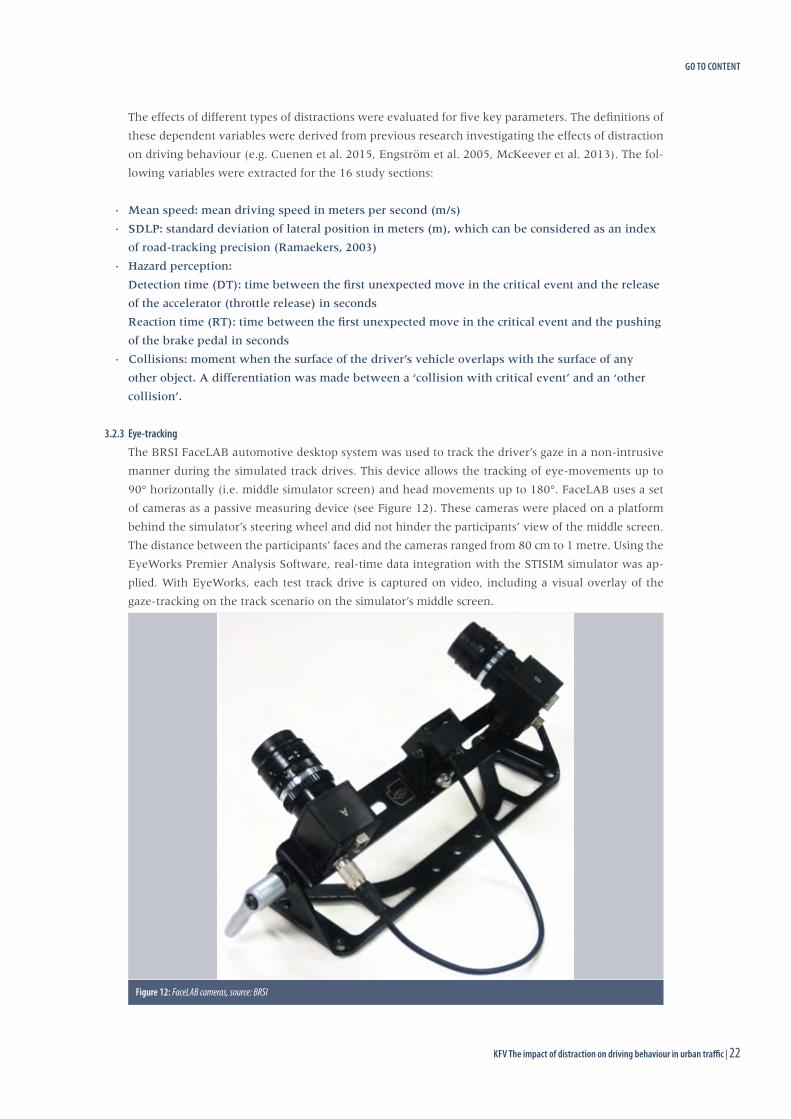
3.2.3 Eye-tracking
The BRSI FaceLAB automotive desktop system was used to track the driver’s gaze in a non-intrusive
manner during the simulated track drives. This device allows the tracking of eye-movements up to
90° horizontally (i.e. middle simulator screen) and head movements up to 180°. FaceLAB uses a set
of cameras as a passive measuring device (see Figure 12). These cameras were placed on a platform
behind the simulator’s steering wheel and did not hinder the participants’ view of the middle screen.
The distance between the participants’ faces and the cameras ranged from 80 cm to 1 metre. Using the
EyeWorks Premier Analysis Software, real-time data integration with the STISIM simulator was ap-
plied. With EyeWorks, each test track drive is captured on video, including a visual overlay of the
gaze-tracking on the track scenario on the simulator’s middle screen.
Figure 12: FaceLAB cameras, source: BRSI
GO TO CONTENT
23 | KFV The impact of distraction on driving behaviour in urban traffic
3.2.4 Questionnaires
A number of different questionnaires were developed, namely a pre- and post-questionnaire to be
completed by each participant before and after the experiment as well as three post-ride questionnai-
res to be completed after each experimental track in order to assess how the drive and tasks were
experienced (copies of all questionnaires are provided in the Appendix).
· Pre-questionnaire: socio-demographic and car driving variables, smartphone use, self-reported dist-
raction behaviour while driving, perceived impact of distractions on attention to traffic, opinion on
a total ban of mobile phone use while driving, reasons for engaging in distracting activities while
driving, and presence of symptoms related to simulator sickness.
· Post-questionnaire to assess the impact of participation on the perceived effect of distractions while
driving, opinion on the total ban of mobile phone use while driving, reasons for engaging in distrac-
ting activities, and the simulator sickness symptoms.
· Post-ride questionnaires to obtain assessments from participants directly after they had driven the test
tracks with distraction tasks. These included items like perceived required effort, self-evaluation of
driving behaviour, and perceived effects of the distraction tasks.
3.3 Study design and analysisThis study took the form of a laboratory experiment with a repeated measures (within subjects)
design with one control and six experimental conditions. The order of the conditions was counterba-
lanced between participants to reduce fatigue or learning effects. In addition to within-subject com-
parisons of experimental and control conditions, the recruited sample also allowed between-group
comparisons for two age (20-34 and 35-49 years) and gender groups. Driving and self-reported data
were gathered for all participants along with eye-tracking data for part of the sample.
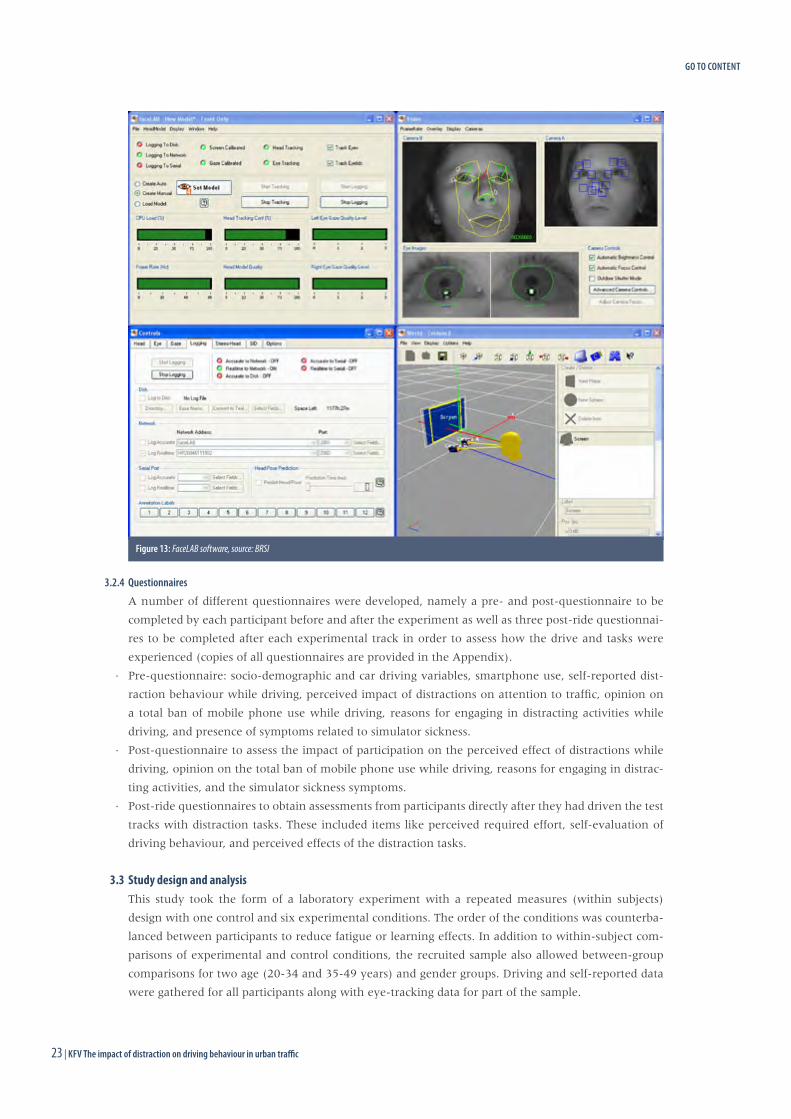
Figure 13: FaceLAB software, source: BRSI
GO TO CONTENT
KFV The impact of distraction on driving behaviour in urban traffic | 2423 | KFV The impact of distraction on driving behaviour in urban traffic
The effects of different types of distraction were evaluated for five key parameters. The definitions of
these dependent variables were derived from previous research investigating the effects of distraction
on driving behaviour.16 A Matlab© compiler (Release 2015a, Mathworks) was used to extract the five
dependent driving variables:
· Mean speed: Mean of the digitally recorded driver speed with an interval of 30 milliseconds (ms)
within the defined analysis section = within each critical section from start sound until just before the
onset of the CE (m/s).
· SDLP: Standard deviation of the continuously recorded (meter (m); each 30ms) lateral lane position,
referenced in relation to the centre of the driver’s vehicle with respect to the centre dividing line on
the roadway, within the critical analysis section for SDLP.
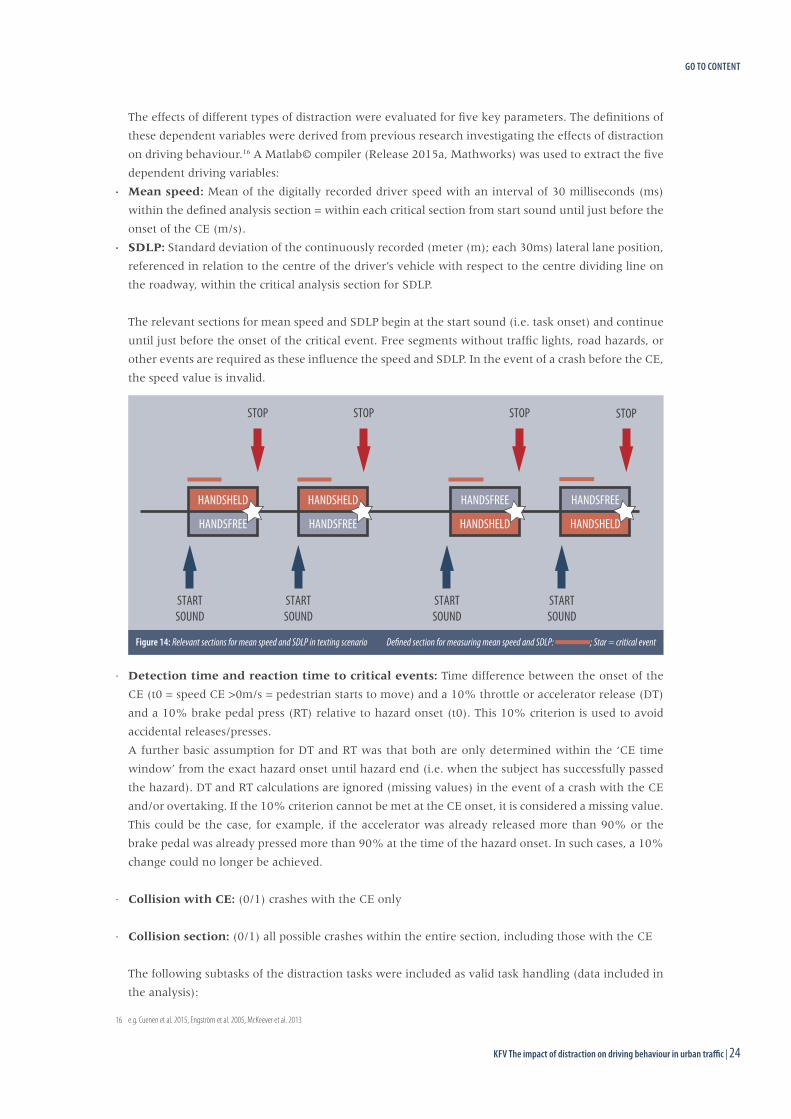
The relevant sections for mean speed and SDLP begin at the start sound (i.e. task onset) and continue
until just before the onset of the critical event. Free segments without traffic lights, road hazards, or
other events are required as these influence the speed and SDLP. In the event of a crash before the CE,
the speed value is invalid.
· Detection time and reaction time to critical events: Time difference between the onset of the
CE (t0 = speed CE >0m/s = pedestrian starts to move) and a 10% throttle or accelerator release (DT)
and a 10% brake pedal press (RT) relative to hazard onset (t0). This 10% criterion is used to avoid
accidental releases/presses.
A further basic assumption for DT and RT was that both are only determined within the ‘CE time
window’ from the exact hazard onset until hazard end (i.e. when the subject has successfully passed
the hazard). DT and RT calculations are ignored (missing values) in the event of a crash with the CE
and/or overtaking. If the 10% criterion cannot be met at the CE onset, it is considered a missing value.
This could be the case, for example, if the accelerator was already released more than 90% or the
brake pedal was already pressed more than 90% at the time of the hazard onset. In such cases, a 10%
change could no longer be achieved.
· Collision with CE: (0/1) crashes with the CE only
· Collision section: (0/1) all possible crashes within the entire section, including those with the CE
The following subtasks of the distraction tasks were included as valid task handling (data included in
the analysis):
16 e.g. Cuenen et al. 2015, Engström et al. 2005, McKeever et al. 2013
STOP STOP STOP STOP
STARTSOUND
STARTSOUND
STARTSOUND
STARTSOUND
HANDSHELD
HANDSFREE
HANDSHELD
HANDSFREE
HANDSFREE
HANDSHELD
HANDSFREE
HANDSHELD
Figure 14: Relevant sections for mean speed and SDLP in texting scenario Defined section for measuring mean speed and SDLP: ; Star = critical event
GO TO CONTENT
25 | KFV The impact of distraction on driving behaviour in urban traffic
· Reading/writing: pick up phone from seat, open text messenger, read/write, send back, lay phone
back down on passenger seat
· Hand-held phoning: pick up phone from seat, initiate call, listen and talk, lay phone back down on
passenger seat when call is ended
· Hands-free phoning: initiate phone call by clicking the earplug OR via the phone, listen and talk, lay
phone back down on passenger seat when call is ended
· Eating: pick up food from seat, unwrap, continuously eat, lay food back down on seat at stop sound
· Drinking: pick up bottle from seat, open, drink, lay bottle back down on seat at stop sound or before
(if finished)
The validity of secondary tasks was assessed using the qualitative information on the observation grid
that was filled out independently by at least two observers. The research team made prior decisions on
inclusion and exclusion criteria for the tasks. Driving data was excluded, for instance, when no task
was done (e.g. participant did not want to eat/had an allergy, connection problem prevented the call
being received, call was erroneously rejected, etc.) or in the event that it was not handled properly
(e.g. difficulty in reading/writing a text message without reading glasses, participant waited a long
time before starting task, etc.). Outlier data was excluded from the analysis (continuous values >2
SD from sample mean or ‘extreme’ values). For the self-reported data, several (additional) variables
were recoded and computed (e.g. questionnaire rating scale answers transformed into dichotomous
variables; composite score of self-reported distraction behaviour while driving, etc.).
The analysis began with a descriptive analysis of the entire sample, followed by analyses for age
group and gender: tables and figures for self-reported data, and boxplots and scatterplots for driving
data (median; upper/lower quartile; min/max; outliers) (see Chapter 4). The 50+ age group (N=7)
was always excluded in the analysis of driving data.
For the in-depth analysis of self-reported data, the Chi-square test, Mann-Whitney U-test, Fried-
man tow-way analysis of variance by ranks, and Wilcoxon signed rank test (SPSS) were used for the
following evaluations:
· General comparisons of different conditions (post-ride questionnaire and parts of pre-questionnaire)
· Self-reported data by age category and gender (pre-questionnaire)
· Comparisons of pre- and post-questionnaires (impact evaluation).
For analyses based on age categories, the participants in the 50+ age group were excluded. Compari-
sons based on gender were executed on the full sample (N=63) as well as on the sample excluding the
50+ age group (N=56). The results always refer correctly to the source sample.
For the N=56 sample (50+ age group excluded), mathematical models were developed for the six
dependent driving variables using R software for statistical computing and graphics (R Core Team,
2015). These models included age category (2), gender, number of kilometres driven in the last 12
months, a composite score of self-reported distraction behaviour while driving, and task order in
the experiment. Linear Mixed Models (LMM) were made for continuous driving variables and Ge-
neralized Linear Mixed Models (GLMM) for collisions (binomial). The purpose of such a model is to
estimate the effects of different independent variables on the dependent variable, while taking into
account random effects (heterogeneity across individuals). The six dependent variables are: mean
speed, standard deviation of lateral position (SDLP), detection time for the critical event (DT to CE),
reaction time to the critical event (RT to CE), collision with the critical event (crash CE), and collision
within the section (crash section). The independent variables are: the different distraction tasks (and
GO TO CONTENT
KFV The impact of distraction on driving behaviour in urban traffic | 2625 | KFV The impact of distraction on driving behaviour in urban traffic
their interactions with age category and with gender), age category (2), gender, kilometres driven in
the last 12 months, self-report composite, and task order (to capture order related bias, e.g. through
boredom, fatigue or learning).
The self-report composite is the calculated mean of the responses to a question in the pre-questi-
onnaire regarding the six secondary tasks in the experiment. The question was “In the last 12 months,
how often did you do the following while driving a car?”. The behaviours were: answer a phone call
(hand-held), answer a phone call (hands-free), read a text message or e-mail on a smartphone, write/
send a text message/e-mail on a smartphone, eat wrapped food (e.g. sandwich, chocolate bar), and
drink from a bottle/can. Participants could answer on a scale from 1 to 5, where 1 = “never” and 5 =
“(almost) always”. The composite thus gives a score of reported frequency of involvement in distrac-
tion activities while driving.
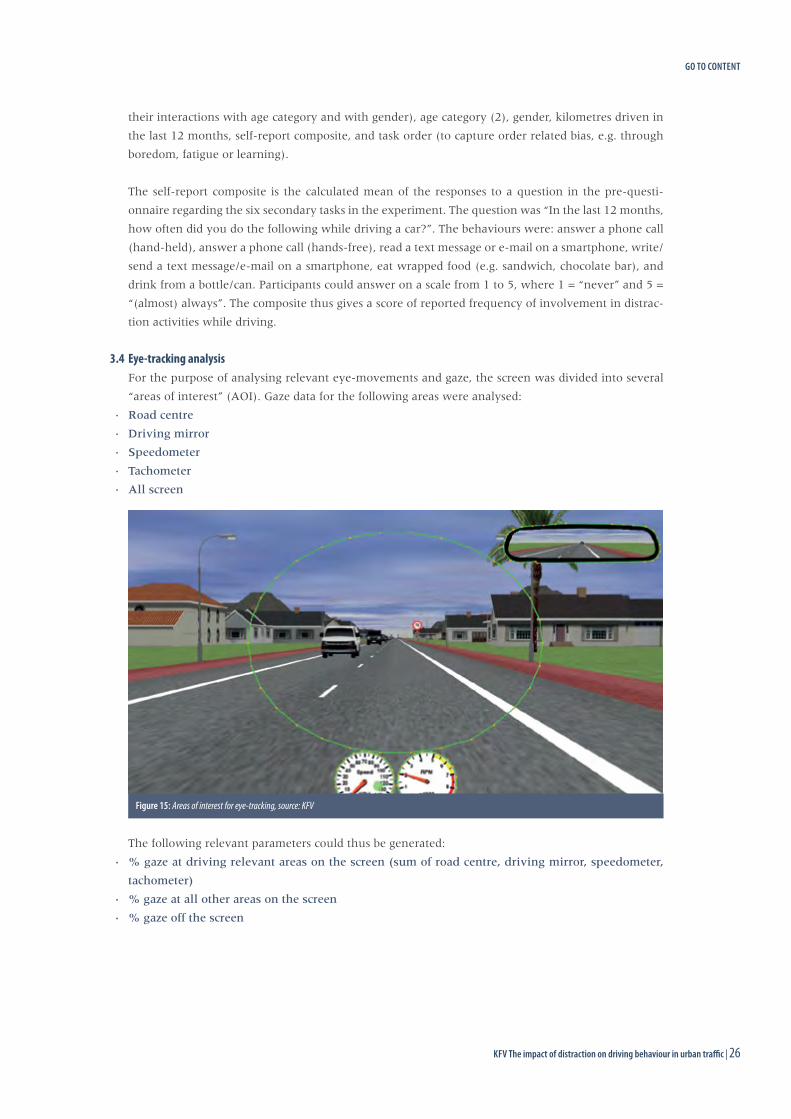
3.4 Eye-tracking analysisFor the purpose of analysing relevant eye-movements and gaze, the screen was divided into several
“areas of interest” (AOI). Gaze data for the following areas were analysed:
· Road centre
· Driving mirror
· Speedometer
· Tachometer
· All screen
The following relevant parameters could thus be generated:
· % gaze at driving relevant areas on the screen (sum of road centre, driving mirror, speedometer,
tachometer)
· % gaze at all other areas on the screen
· % gaze off the screen
Figure 15: Areas of interest for eye-tracking, source: KFV
GO TO CONTENT
KFV The impact of distraction on driving behaviour in urban traffic | 2827 | KFV The impact of distraction on driving behaviour in urban traffic
4 RESULTS
4.1 Pre-questionnaireThis section includes the results of the pre-questionnaire items pertaining to self-reported distrac-
tion behaviour while driving and opinions and intentions with regard to distraction and driving.
The analyses were performed using IBM SPSS Statistics 22. For some questions, the responses were
dichotomized for comparative analysis purposes. Different non-parametric tests were used. The Wil-
coxon signed rank test was used to assess whether population mean ranks of repeated measurements
in a single sample differ between self-reported distraction behaviour while driving and self-reported
distraction behaviour while waiting at a red light or in a traffic jam. The Friedmann test was used to
detect differences on the same statement for different types of distraction. Chi-square tests were used
to assess differences between age groups (20-34 vs. 35-49 years) and gender. Statistical significance
was set at a 95% confidence interval (p ≤ 0.05).
4.1.1 Self-reported behaviour
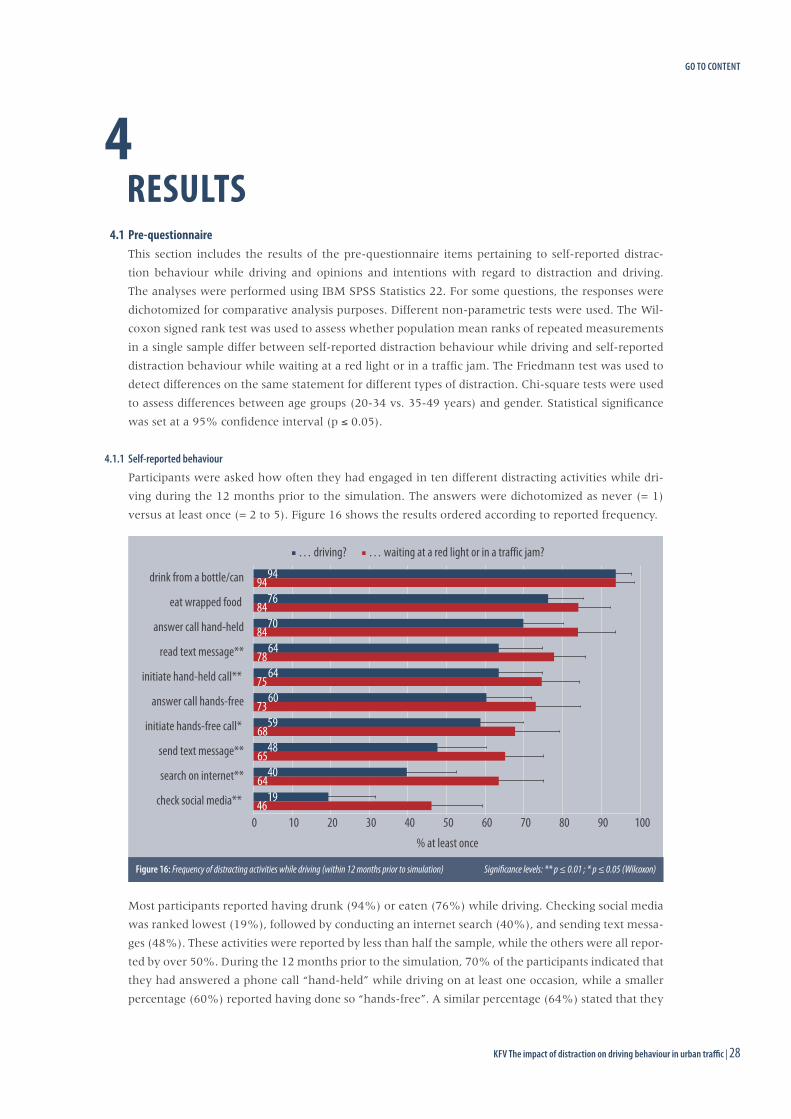
Participants were asked how often they had engaged in ten different distracting activities while dri-
ving during the 12 months prior to the simulation. The answers were dichotomized as never (= 1)
versus at least once (= 2 to 5). Figure 16 shows the results ordered according to reported frequency.
Most participants reported having drunk (94%) or eaten (76%) while driving. Checking social media
was ranked lowest (19%), followed by conducting an internet search (40%), and sending text messa-
ges (48%). These activities were reported by less than half the sample, while the others were all repor-
ted by over 50%. During the 12 months prior to the simulation, 70% of the participants indicated that
they had answered a phone call “hand-held” while driving on at least one occasion, while a smaller
percentage (60%) reported having done so “hands-free”. A similar percentage (64%) stated that they
46
64
65
68
73
75
78
84
84
94
19
40
48
59
60
64
64
70
76
94
0 10 20 30 40 50 60 70 80 90 100
check social media**
search on internet**
send text message**
initiate hands-free call*
answer call hands-free
initiate hand-held call**
read text message**
answer call hand-held
eat wrapped food
drink from a bottle/can
% at least once
… driving? … waiting at a red light or in a traffic jam?
Figure 16: Frequency of distracting activities while driving (within 12 months prior to simulation) Significance levels: ** p ≤ 0.01 ; * p ≤ 0.05 (Wilcoxon)
GO TO CONTENT
29 | KFV The impact of distraction on driving behaviour in urban traffic
had read a text message or initiated a hand-held phone call while driving on at least one occasion. On
a descriptive level, a comparative analysis evaluating differences according to driving context (while
driving vs. while waiting at a red light or in a traffic jam) indicated that each secondary activity, with
the exception of drinking (2 x 94%), was reported more frequently while waiting at red light or in a
traffic jam. This difference is significant for some distractions, namely reading/sending text messages,
initiating phone calls (hand-held and hands-free), and using the internet/social media. Indeed, the
percentage of participants who reported using the internet or social media almost doubled (from 19%
to 46%, and from 40% to 64% respectively).
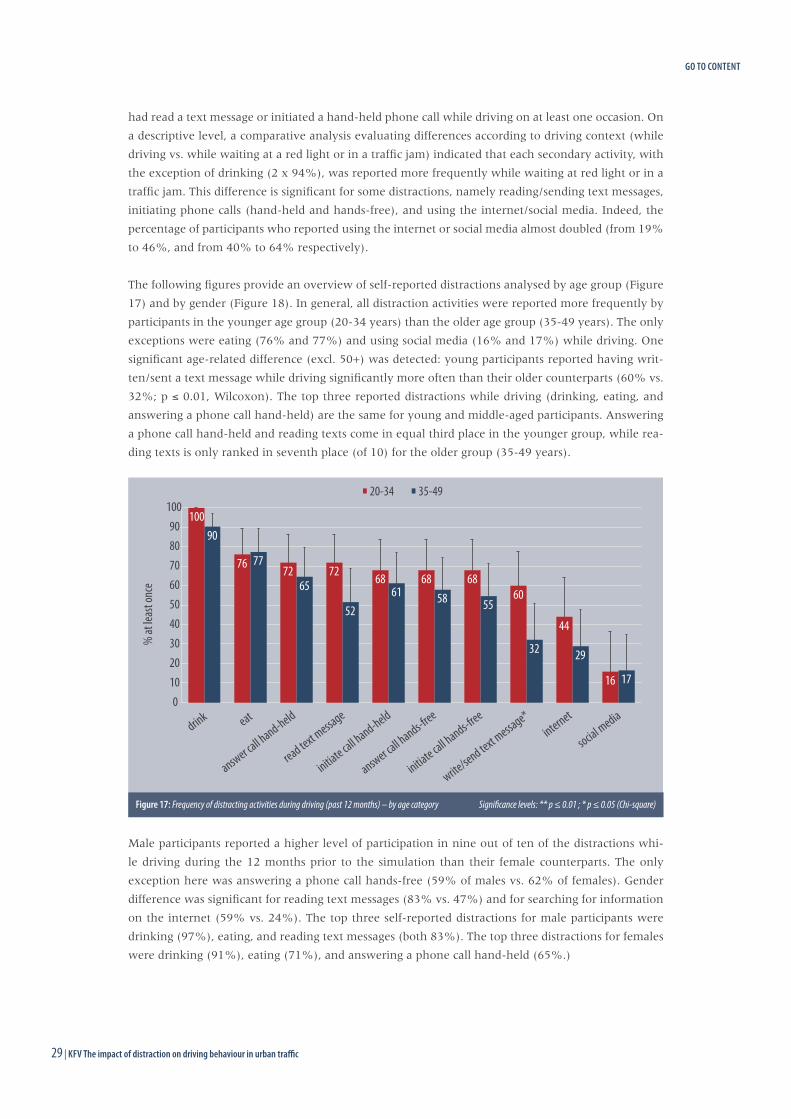
The following figures provide an overview of self-reported distractions analysed by age group (Figure
17) and by gender (Figure 18). In general, all distraction activities were reported more frequently by
participants in the younger age group (20-34 years) than the older age group (35-49 years). The only
exceptions were eating (76% and 77%) and using social media (16% and 17%) while driving. One
significant age-related difference (excl. 50+) was detected: young participants reported having writ-
ten/sent a text message while driving significantly more often than their older counterparts (60% vs.
32%; p ≤ 0.01, Wilcoxon). The top three reported distractions while driving (drinking, eating, and
answering a phone call hand-held) are the same for young and middle-aged participants. Answering
a phone call hand-held and reading texts come in equal third place in the younger group, while rea-
ding texts is only ranked in seventh place (of 10) for the older group (35-49 years).
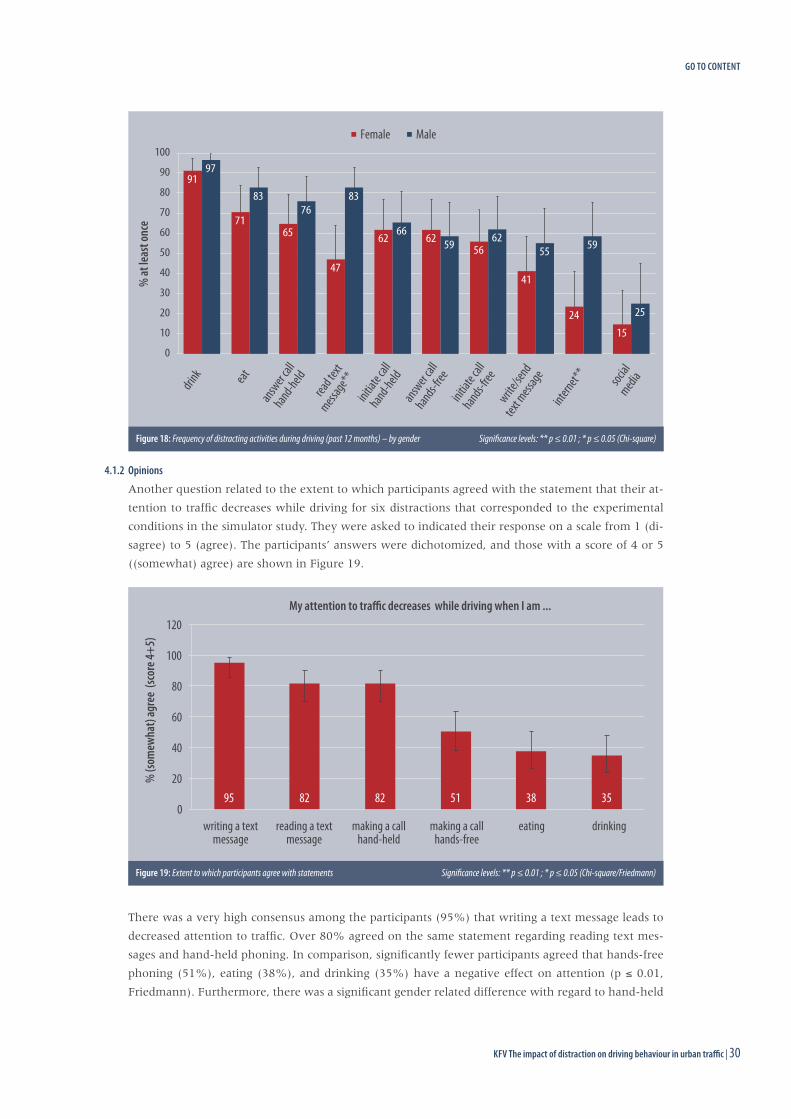
Male participants reported a higher level of participation in nine out of ten of the distractions whi-
le driving during the 12 months prior to the simulation than their female counterparts. The only
exception here was answering a phone call hands-free (59% of males vs. 62% of females). Gender
difference was significant for reading text messages (83% vs. 47%) and for searching for information
on the internet (59% vs. 24%). The top three self-reported distractions for male participants were
drinking (97%), eating, and reading text messages (both 83%). The top three distractions for females
were drinking (91%), eating (71%), and answering a phone call hand-held (65%.)
100
76 72 72 68 68 68 60
44
16
90
77
65
52 61 58 55
32 29
17
0 10 20 30 40 50 60 70 80 90
100
drink eat
answer call hand-held
read text message
initiate call hand-held
answer call hands-free
initiate call hands-free
write/send text m
essage* internet
social media
% at
leas
t onc
e
20-34 35-49
Figure 17: Frequency of distracting activities during driving (past 12 months) – by age category Significance levels: ** p ≤ 0.01 ; * p ≤ 0.05 (Chi-square)
GO TO CONTENT
KFV The impact of distraction on driving behaviour in urban traffic | 3029 | KFV The impact of distraction on driving behaviour in urban traffic
4.1.2 Opinions
Another question related to the extent to which participants agreed with the statement that their at-
tention to traffic decreases while driving for six distractions that corresponded to the experimental
conditions in the simulator study. They were asked to indicated their response on a scale from 1 (di-
sagree) to 5 (agree). The participants’ answers were dichotomized, and those with a score of 4 or 5
((somewhat) agree) are shown in Figure 19.
There was a very high consensus among the participants (95%) that writing a text message leads to
decreased attention to traffic. Over 80% agreed on the same statement regarding reading text mes-
sages and hand-held phoning. In comparison, significantly fewer participants agreed that hands-free
phoning (51%), eating (38%), and drinking (35%) have a negative effect on attention (p ≤ 0.01,
Friedmann). Furthermore, there was a significant gender related difference with regard to hand-held
91
71 65
47
62 62 56
41
24 15
97
83 76
83
66 59 62
55 59
25
0
10
20
30
40
50
60
70
80
90
100
drink eat
answer c
allhand-held
read tex
t mess
age**
initiate c
all hand-held
answer c
all hands-f
reeinitia
te call
hands-free
write/se
nd tex
t mess
ageinter
net**
social
media
% at
leas
t onc
e Female Male
Figure 18: Frequency of distracting activities during driving (past 12 months) – by gender Significance levels: ** p ≤ 0.01 ; * p ≤ 0.05 (Chi-square)
95 82 82 51 38 35 0
20
40
60
80
100
120
writing a text message
reading a text message
making a call hand-held
making a call hands-free
eating drinking
% (s
omew
hat)
agre
e (sc
ore 4
+5)
My attention to traffic decreases while driving when I am ...
Figure 19: Extent to which participants agree with statements Significance levels: ** p ≤ 0.01 ; * p ≤ 0.05 (Chi-square/Friedmann)
GO TO CONTENT
31 | KFV The impact of distraction on driving behaviour in urban traffic
phoning: 91% of females vs. 71% of males (somewhat) agreed that hand-held phoning while driving
decreases attention to traffic (p ≤ 0.05, Chi-square) (the significance disappears when participants in
the 50+ age group are excluded). No age related differences could be observed (excl. 50+).
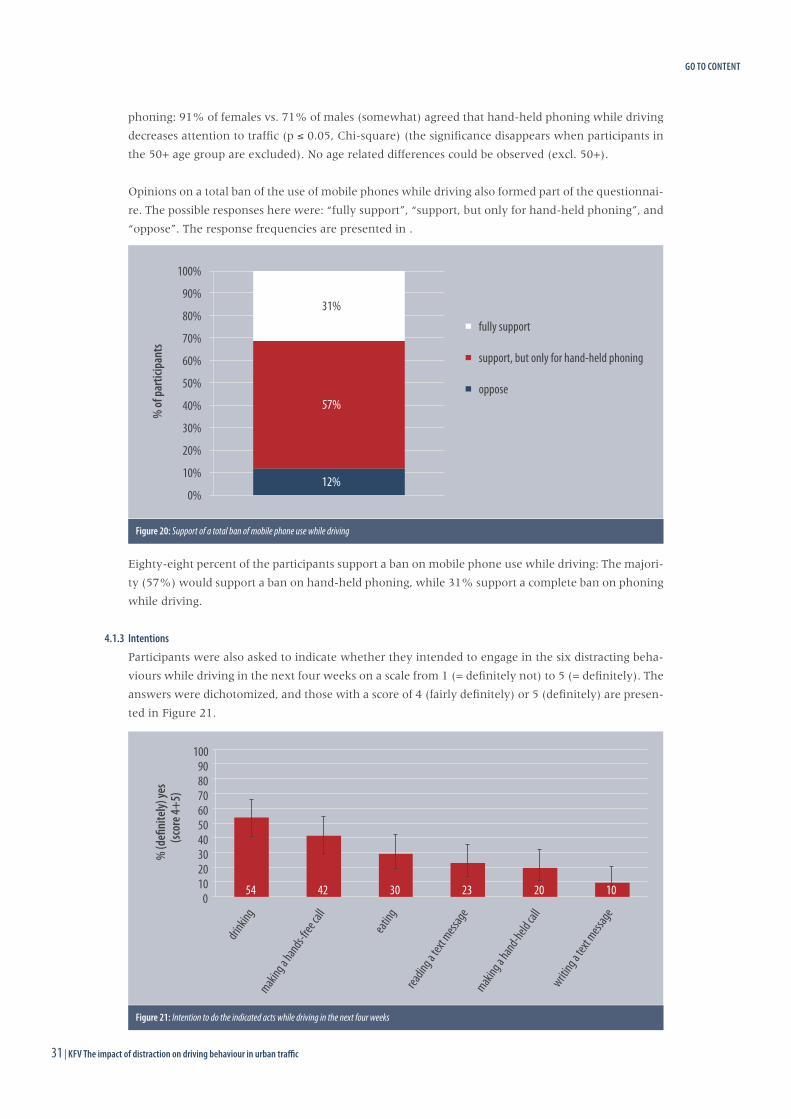
Opinions on a total ban of the use of mobile phones while driving also formed part of the questionnai-
re. The possible responses here were: “fully support”, “support, but only for hand-held phoning”, and
“oppose”. The response frequencies are presented in .
Eighty-eight percent of the participants support a ban on mobile phone use while driving: The majori-
ty (57%) would support a ban on hand-held phoning, while 31% support a complete ban on phoning
while driving.
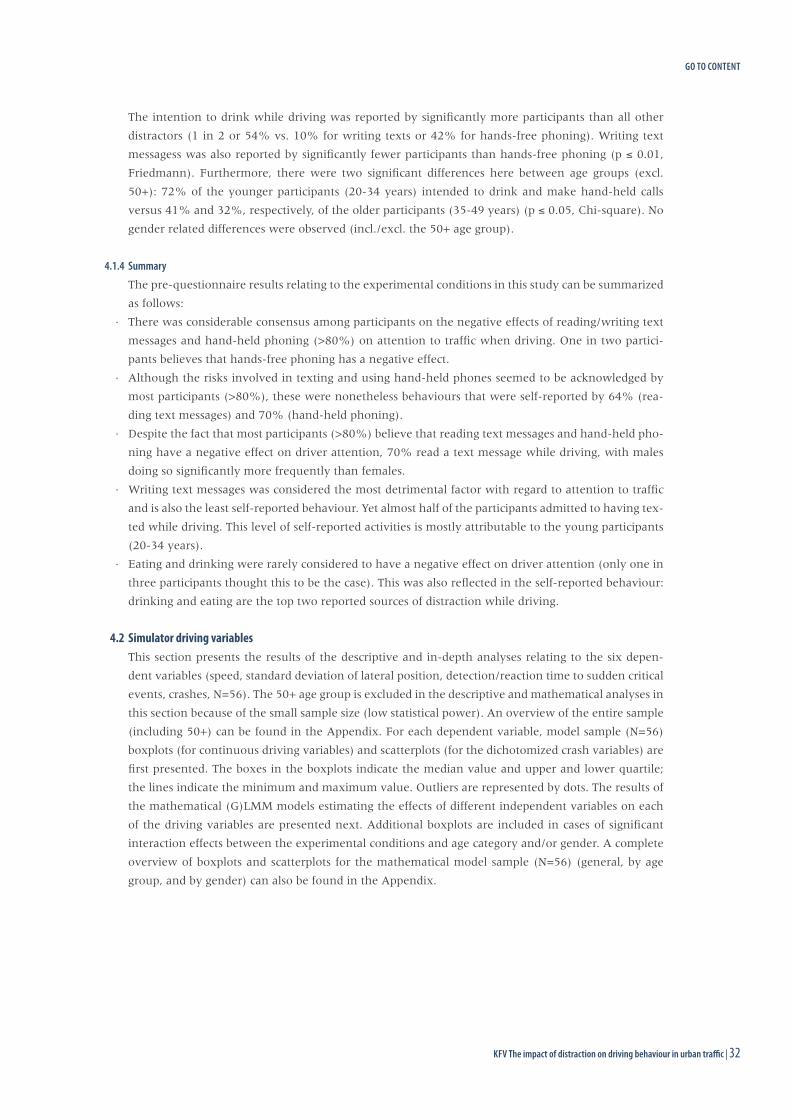
4.1.3 Intentions
Participants were also asked to indicate whether they intended to engage in the six distracting beha-
viours while driving in the next four weeks on a scale from 1 (= definitely not) to 5 (= definitely). The
answers were dichotomized, and those with a score of 4 (fairly definitely) or 5 (definitely) are presen-
ted in Figure 21.
12%
57%
31%
0%
10%
20%
30%
40%
50%
60%
70%
80%
90%
100%
% of
parti
cipan
ts
fully support
support, but only for hand-held phoning
oppose
Figure 20: Support of a total ban of mobile phone use while driving
54 42 30 23 20 10 0
10 20 30 40 50 60 70 80 90
100
drinkin
g maki
ng a hands-
free c
all
eating
readin
g a te
xt mess
age
making a
hand-held
call
writing a
text m
essage
% (d
efini
tely)
yes
(scor
e 4+
5)
Figure 21: Intention to do the indicated acts while driving in the next four weeks
GO TO CONTENT
KFV The impact of distraction on driving behaviour in urban traffic | 3231 | KFV The impact of distraction on driving behaviour in urban traffic
The intention to drink while driving was reported by significantly more participants than all other
distractors (1 in 2 or 54% vs. 10% for writing texts or 42% for hands-free phoning). Writing text
messagess was also reported by significantly fewer participants than hands-free phoning (p ≤ 0.01,
Friedmann). Furthermore, there were two significant differences here between age groups (excl.
50+): 72% of the younger participants (20-34 years) intended to drink and make hand-held calls
versus 41% and 32%, respectively, of the older participants (35-49 years) (p ≤ 0.05, Chi-square). No
gender related differences were observed (incl./excl. the 50+ age group).
4.1.4 Summary
The pre-questionnaire results relating to the experimental conditions in this study can be summarized
as follows:
· There was considerable consensus among participants on the negative effects of reading/writing text
messages and hand-held phoning (>80%) on attention to traffic when driving. One in two partici-
pants believes that hands-free phoning has a negative effect.
· Although the risks involved in texting and using hand-held phones seemed to be acknowledged by
most participants (>80%), these were nonetheless behaviours that were self-reported by 64% (rea-
ding text messages) and 70% (hand-held phoning).
· Despite the fact that most participants (>80%) believe that reading text messages and hand-held pho-
ning have a negative effect on driver attention, 70% read a text message while driving, with males
doing so significantly more frequently than females.
· Writing text messages was considered the most detrimental factor with regard to attention to traffic
and is also the least self-reported behaviour. Yet almost half of the participants admitted to having tex-
ted while driving. This level of self-reported activities is mostly attributable to the young participants
(20-34 years).
· Eating and drinking were rarely considered to have a negative effect on driver attention (only one in
three participants thought this to be the case). This was also reflected in the self-reported behaviour:
drinking and eating are the top two reported sources of distraction while driving.
4.2 Simulator driving variables This section presents the results of the descriptive and in-depth analyses relating to the six depen-
dent variables (speed, standard deviation of lateral position, detection/reaction time to sudden critical
events, crashes, N=56). The 50+ age group is excluded in the descriptive and mathematical analyses in
this section because of the small sample size (low statistical power). An overview of the entire sample
(including 50+) can be found in the Appendix. For each dependent variable, model sample (N=56)
boxplots (for continuous driving variables) and scatterplots (for the dichotomized crash variables) are
first presented. The boxes in the boxplots indicate the median value and upper and lower quartile;
the lines indicate the minimum and maximum value. Outliers are represented by dots. The results of
the mathematical (G)LMM models estimating the effects of different independent variables on each
of the driving variables are presented next. Additional boxplots are included in cases of significant
interaction effects between the experimental conditions and age category and/or gender. A complete
overview of boxplots and scatterplots for the mathematical model sample (N=56) (general, by age
group, and by gender) can also be found in the Appendix.
GO TO CONTENT
33 | KFV The impact of distraction on driving behaviour in urban traffic
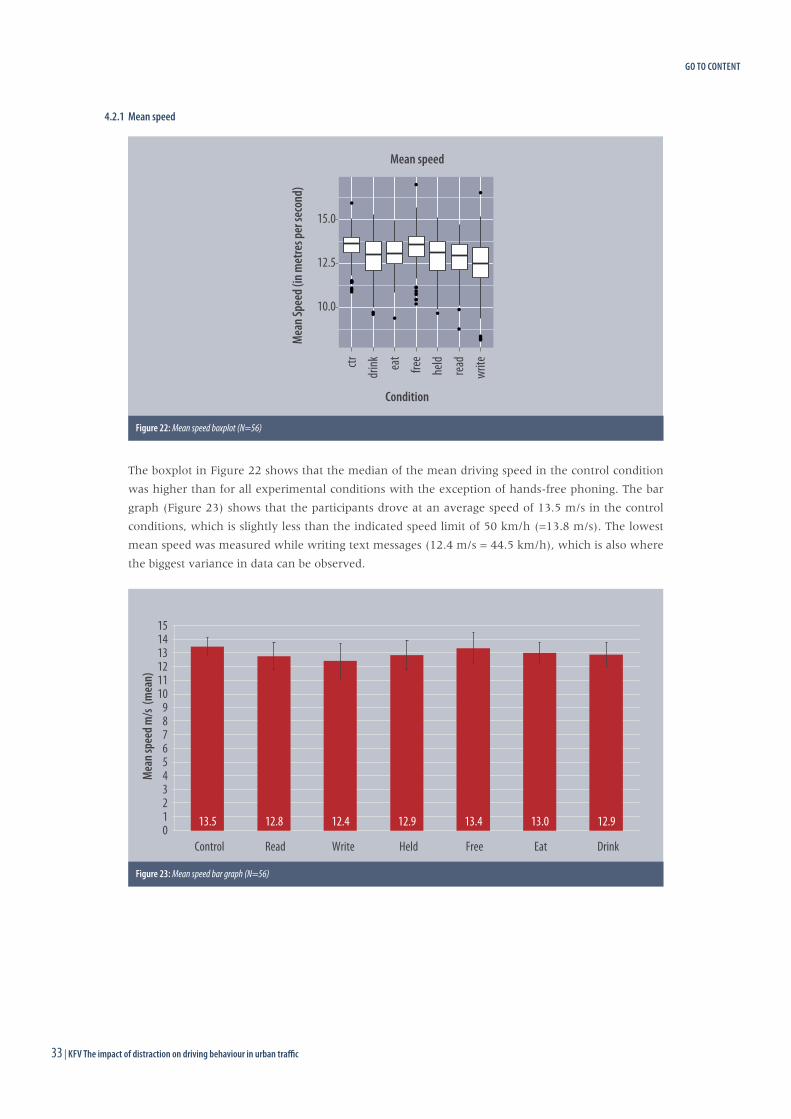
4.2.1 Mean speed
The boxplot in Figure 22 shows that the median of the mean driving speed in the control condition
was higher than for all experimental conditions with the exception of hands-free phoning. The bar
graph (Figure 23) shows that the participants drove at an average speed of 13.5 m/s in the control
conditions, which is slightly less than the indicated speed limit of 50 km/h (=13.8 m/s). The lowest
mean speed was measured while writing text messages (12.4 m/s = 44.5 km/h), which is also where
the biggest variance in data can be observed.
10.0
12.5
15.0
ctr
drink ea
t
free
held
read
write
Condition
Mea
n Spe
ed (i
n met
res p
er se
cond
)
Mean speed
Figure 22: Mean speed boxplot (N=56)
13.5 12.8 12.4 12.9 13.4 13.0 12.9 0 1 2 3 4 5 6 7 8 9
10 11 12 13 14 15
Control Read Write Held Free Eat Drink
Mea
n spe
ed m
/s (m
ean)
Figure 23: Mean speed bar graph (N=56)
GO TO CONTENT
KFV The impact of distraction on driving behaviour in urban traffic | 3433 | KFV The impact of distraction on driving behaviour in urban traffic
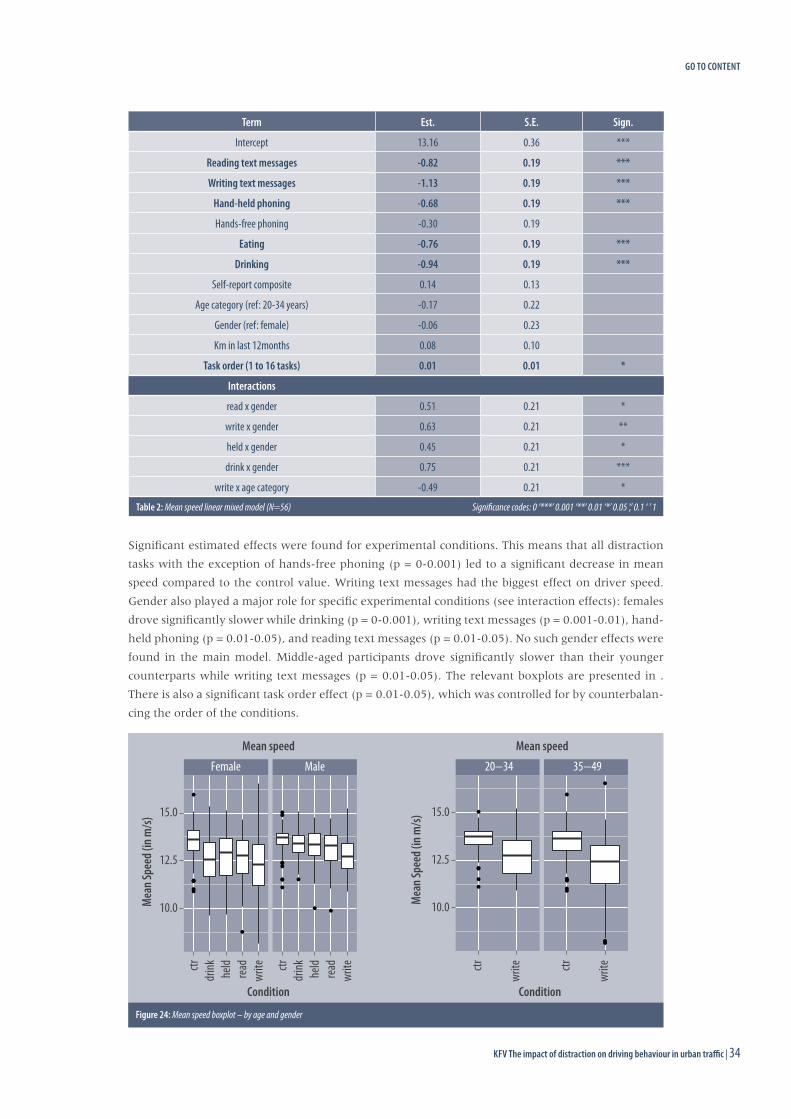
Significant estimated effects were found for experimental conditions. This means that all distraction
tasks with the exception of hands-free phoning (p = 0-0.001) led to a significant decrease in mean
speed compared to the control value. Writing text messages had the biggest effect on driver speed.
Gender also played a major role for specific experimental conditions (see interaction effects): females
drove significantly slower while drinking (p = 0-0.001), writing text messages (p = 0.001-0.01), hand-
held phoning (p = 0.01-0.05), and reading text messages (p = 0.01-0.05). No such gender effects were
found in the main model. Middle-aged participants drove significantly slower than their younger
counterparts while writing text messages (p = 0.01-0.05). The relevant boxplots are presented in .
There is also a significant task order effect (p = 0.01-0.05), which was controlled for by counterbalan-
cing the order of the conditions.
Term Est. S.E. Sign.
Intercept 13.16 0.36 ***
Reading text messages -0.82 0.19 ***
Writing text messages -1.13 0.19 ***
Hand-held phoning -0.68 0.19 ***
Hands-free phoning -0.30 0.19
Eating -0.76 0.19 ***
Drinking -0.94 0.19 ***
Self-report composite 0.14 0.13
Age category (ref: 20-34 years) -0.17 0.22
Gender (ref: female) -0.06 0.23
Km in last 12months 0.08 0.10
Task order (1 to 16 tasks) 0.01 0.01 *
Interactions
read x gender 0.51 0.21 *
write x gender 0.63 0.21 **
held x gender 0.45 0.21 *
drink x gender 0.75 0.21 ***
write x age category -0.49 0.21 *
Table 2: Mean speed linear mixed model (N=56) Significance codes: 0 ‘***’ 0.001 ‘**’ 0.01 ‘*’ 0.05 ‘,’ 0.1 ‘ ’ 1
20−34 35−49
10.0
12.5
15.0
ctr
write ctr
write
Condition
Mea
n Spe
ed (i
n m/s)
Mean speed
Female Male
10.0
12.5
15.0
ctrdr
ink held
read
write ctr
drink he
ldrea
dwr
ite
Condition
Mea
n Spe
ed (i
n m/s)
Mean speed
Figure 24: Mean speed boxplot – by age and gender
GO TO CONTENT
35 | KFV The impact of distraction on driving behaviour in urban traffic
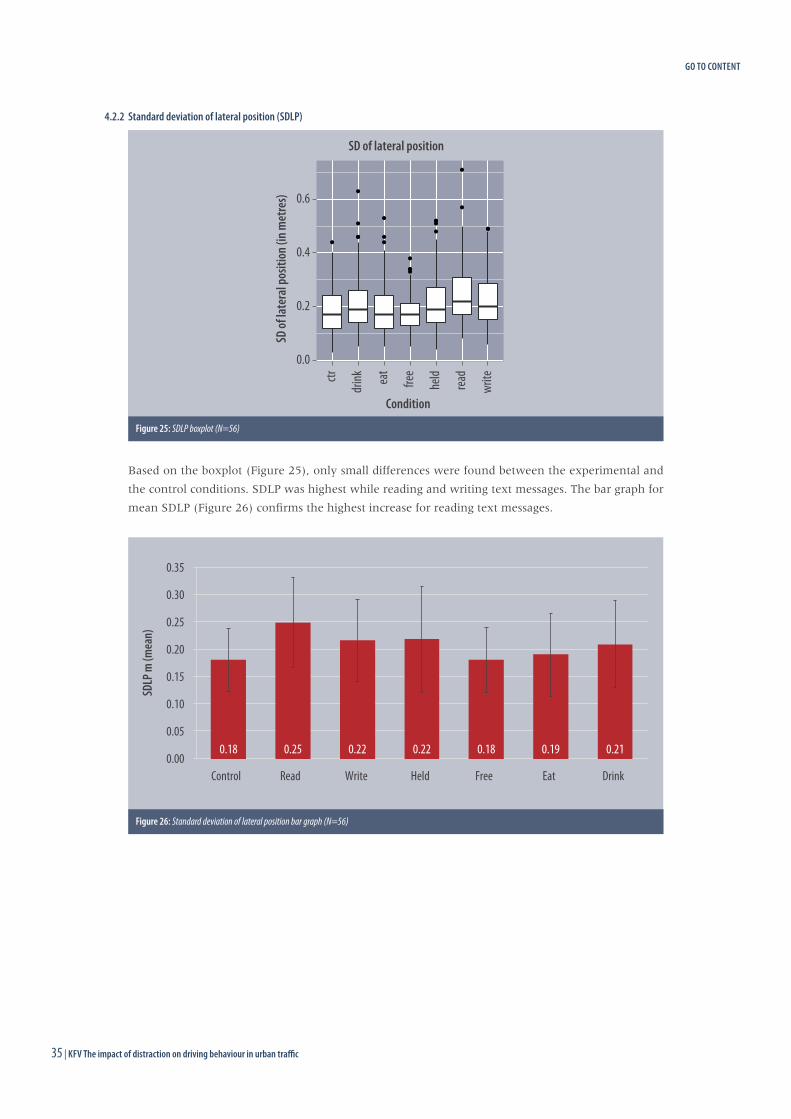
4.2.2 Standard deviation of lateral position (SDLP)
Based on the boxplot (Figure 25), only small differences were found between the experimental and
the control conditions. SDLP was highest while reading and writing text messages. The bar graph for
mean SDLP (Figure 26) confirms the highest increase for reading text messages.
0.0
0.2
0.4
0.6
ctr
drink ea
t
free
held
read
write
Condition
SD of
late
ral p
ositi
on (i
n met
res)
SD of lateral position
Figure 25: SDLP boxplot (N=56)
0.18 0.25 0.22 0.22 0.18 0.19 0.21 0.00
0.05
0.10
0.15
0.20
0.25
0.30
0.35
Control Read Write Held Free Eat Drink
SDLP
m (m
ean)
Figure 26: Standard deviation of lateral position bar graph (N=56)
GO TO CONTENT
KFV The impact of distraction on driving behaviour in urban traffic | 3635 | KFV The impact of distraction on driving behaviour in urban traffic
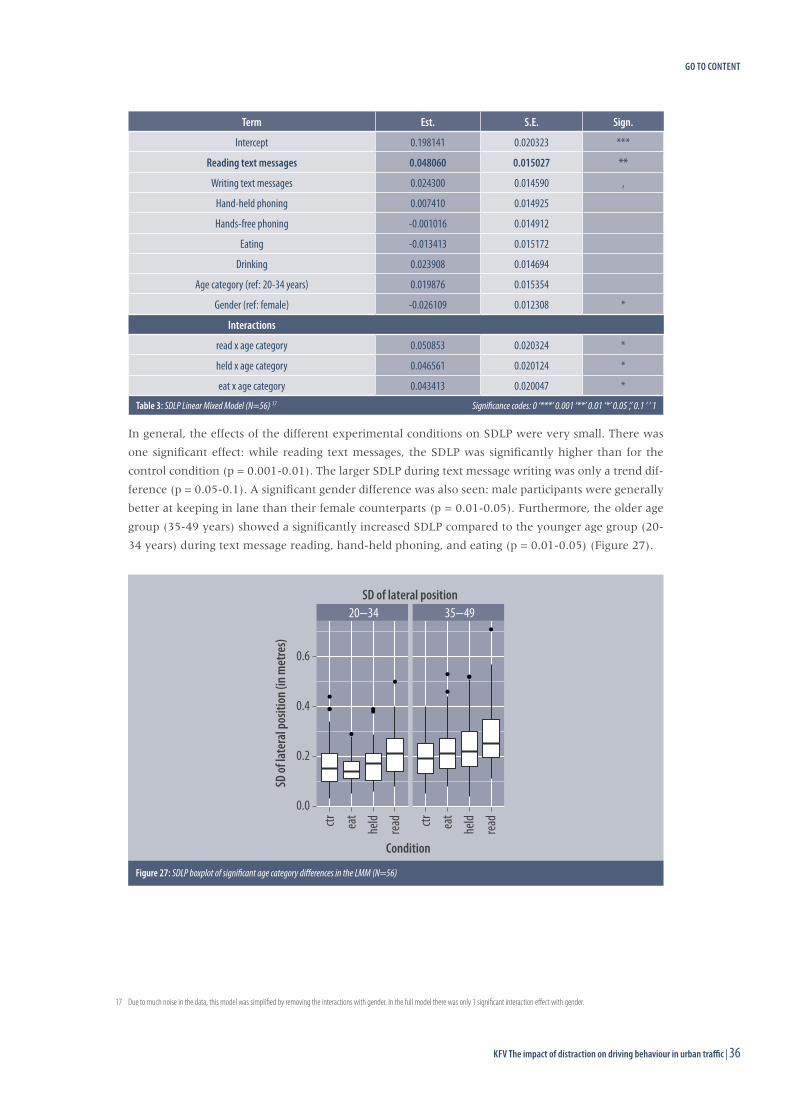
In general, the effects of the different experimental conditions on SDLP were very small. There was
one significant effect: while reading text messages, the SDLP was significantly higher than for the
control condition (p = 0.001-0.01). The larger SDLP during text message writing was only a trend dif-
ference (p = 0.05-0.1). A significant gender difference was also seen: male participants were generally
better at keeping in lane than their female counterparts (p = 0.01-0.05). Furthermore, the older age
group (35-49 years) showed a significantly increased SDLP compared to the younger age group (20-
34 years) during text message reading, hand-held phoning, and eating (p = 0.01-0.05) (Figure 27).
17 Due to much noise in the data, this model was simplified by removing the interactions with gender. In the full model there was only 1 significant interaction effect with gender.
Term Est. S.E. Sign.
Intercept 0.198141 0.020323 ***
Reading text messages 0.048060 0.015027 **
Writing text messages 0.024300 0.014590 ,
Hand-held phoning 0.007410 0.014925
Hands-free phoning -0.001016 0.014912
Eating -0.013413 0.015172
Drinking 0.023908 0.014694
Age category (ref: 20-34 years) 0.019876 0.015354
Gender (ref: female) -0.026109 0.012308 *
Interactions
read x age category 0.050853 0.020324 *
held x age category 0.046561 0.020124 *
eat x age category 0.043413 0.020047 *
Table 3: SDLP Linear Mixed Model (N=56) 17 Significance codes: 0 ‘***’ 0.001 ‘**’ 0.01 ‘*’ 0.05 ‘,’ 0.1 ‘ ’ 1
20−34 35−49
0.0
0.2
0.4
0.6
ctr eat
held
read ctr eat
held
read
Condition
SD of
late
ral p
ositi
on (i
n met
res)
SD of lateral position
Figure 27: SDLP boxplot of significant age category differences in the LMM (N=56)
GO TO CONTENT
37 | KFV The impact of distraction on driving behaviour in urban traffic
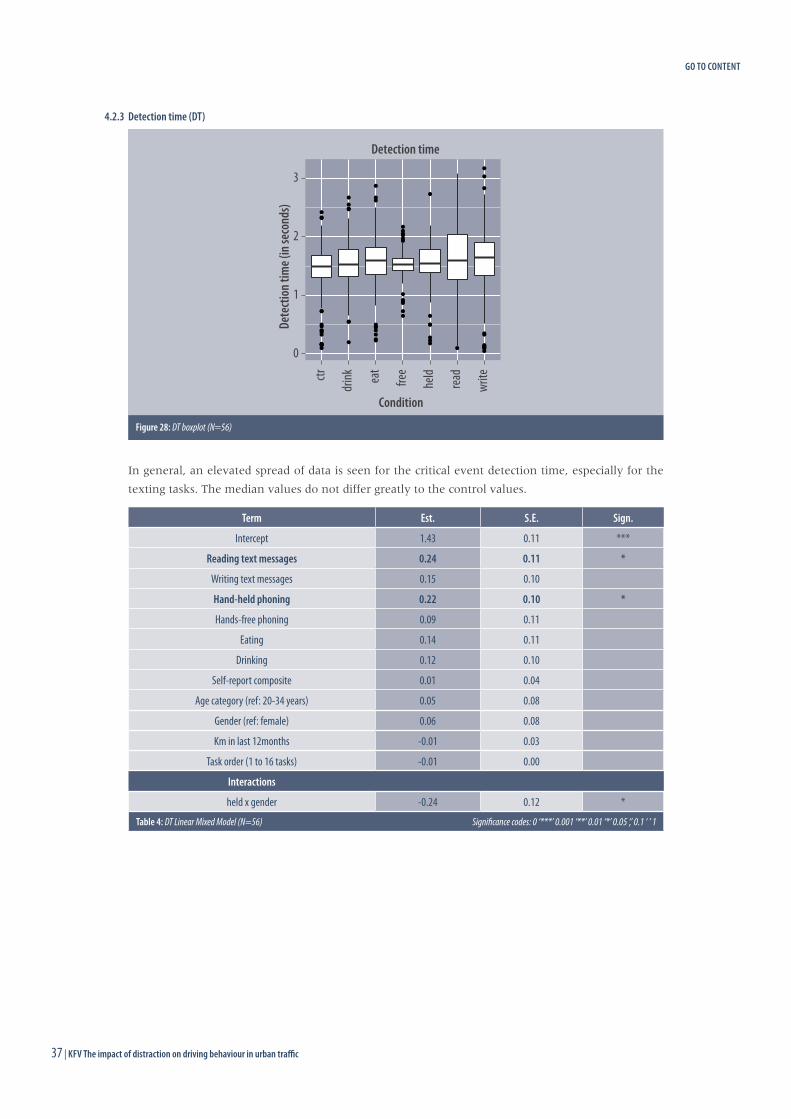
4.2.3 Detection time (DT)
In general, an elevated spread of data is seen for the critical event detection time, especially for the
texting tasks. The median values do not differ greatly to the control values.
0
1
2
3
ctr
drink ea
t
free
held
read
write
Condition
Dete
ctio
n tim
e (in
seco
nds)
Detection time
Figure 28: DT boxplot (N=56)
Term Est. S.E. Sign.
Intercept 1.43 0.11 ***
Reading text messages 0.24 0.11 *
Writing text messages 0.15 0.10
Hand-held phoning 0.22 0.10 *
Hands-free phoning 0.09 0.11
Eating 0.14 0.11
Drinking 0.12 0.10
Self-report composite 0.01 0.04
Age category (ref: 20-34 years) 0.05 0.08
Gender (ref: female) 0.06 0.08
Km in last 12months -0.01 0.03
Task order (1 to 16 tasks) -0.01 0.00
Interactions
held x gender -0.24 0.12 *
Table 4: DT Linear Mixed Model (N=56) Significance codes: 0 ‘***’ 0.001 ‘**’ 0.01 ‘*’ 0.05 ‘,’ 0.1 ‘ ’ 1
GO TO CONTENT
KFV The impact of distraction on driving behaviour in urban traffic | 3837 | KFV The impact of distraction on driving behaviour in urban traffic
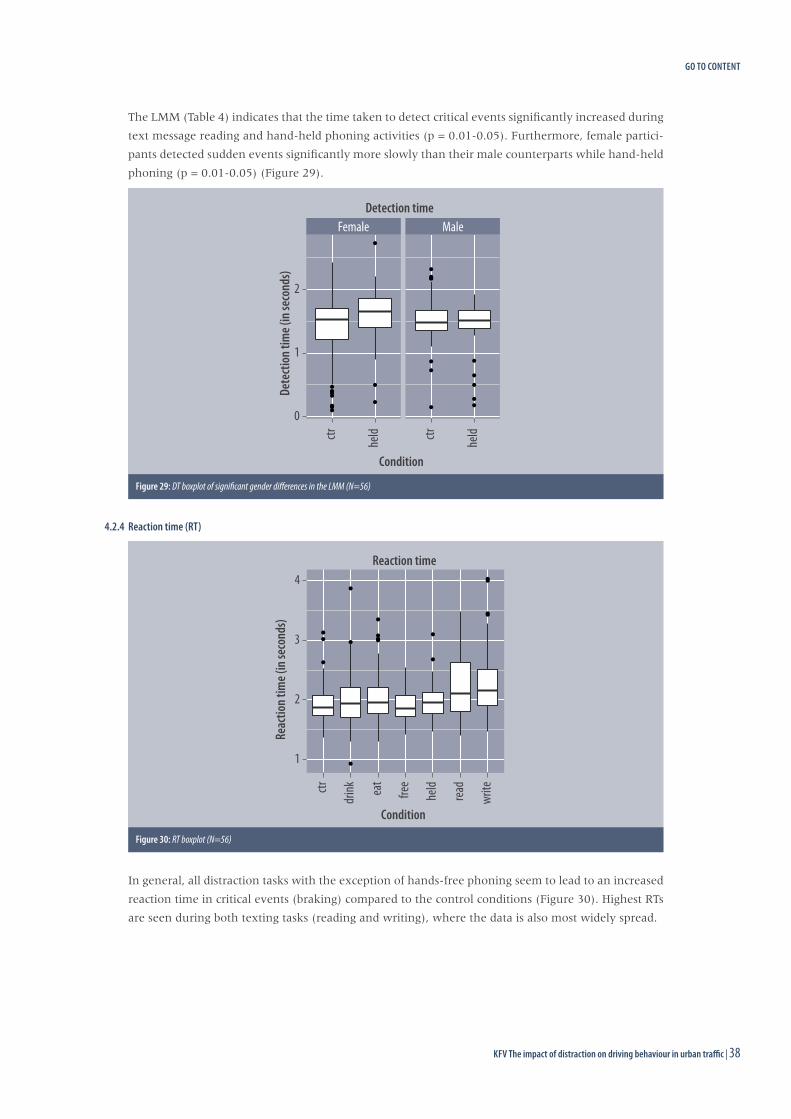
The LMM (Table 4) indicates that the time taken to detect critical events significantly increased during
text message reading and hand-held phoning activities (p = 0.01-0.05). Furthermore, female partici-
pants detected sudden events significantly more slowly than their male counterparts while hand-held
phoning (p = 0.01-0.05) (Figure 29).
4.2.4 Reaction time (RT)
In general, all distraction tasks with the exception of hands-free phoning seem to lead to an increased
reaction time in critical events (braking) compared to the control conditions (Figure 30). Highest RTs
are seen during both texting tasks (reading and writing), where the data is also most widely spread.
Female Male
0
1
2
ctr held ctr held
Condition
Dete
ctio
n tim
e (in
seco
nds)
Detection time
Figure 29: DT boxplot of significant gender differences in the LMM (N=56)
1
2
3
4
ctr
drink ea
t
free
held
read
write
Condition
Reac
tion t
ime (
in se
cond
s)
Reaction time
Figure 30: RT boxplot (N=56)
GO TO CONTENT
39 | KFV The impact of distraction on driving behaviour in urban traffic
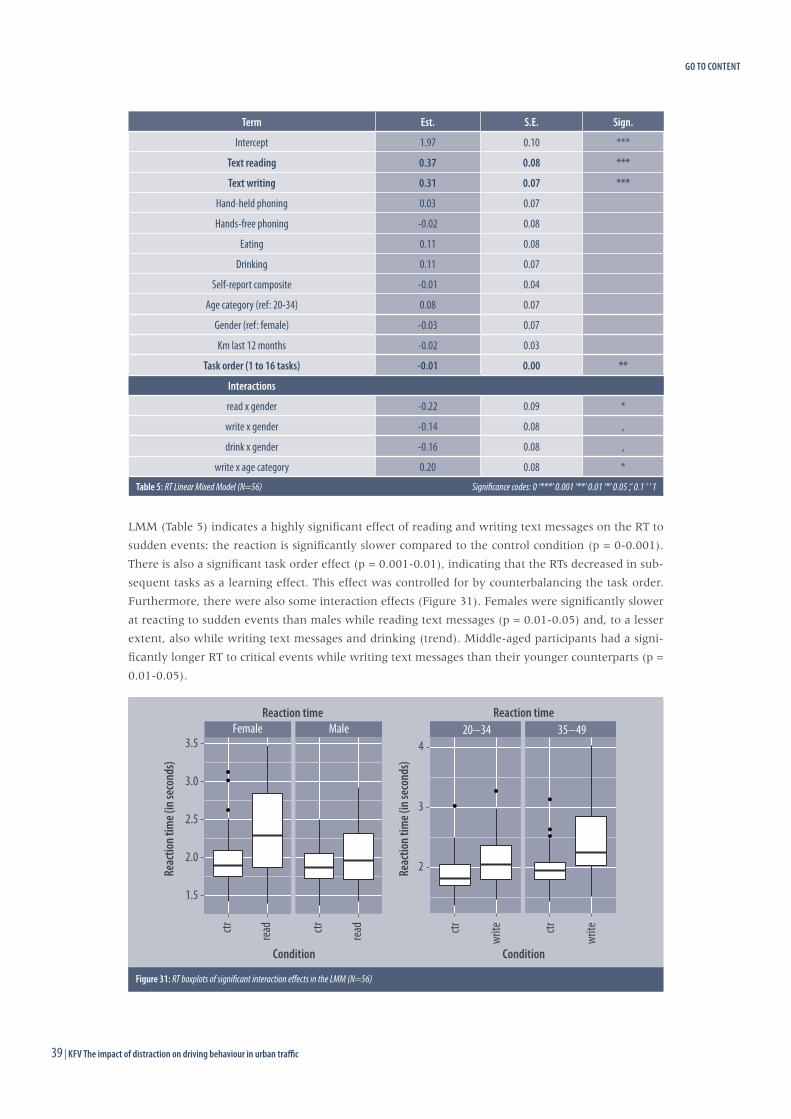
LMM (Table 5) indicates a highly significant effect of reading and writing text messages on the RT to
sudden events: the reaction is significantly slower compared to the control condition (p = 0-0.001).
There is also a significant task order effect (p = 0.001-0.01), indicating that the RTs decreased in sub-
sequent tasks as a learning effect. This effect was controlled for by counterbalancing the task order.
Furthermore, there were also some interaction effects (Figure 31). Females were significantly slower
at reacting to sudden events than males while reading text messages (p = 0.01-0.05) and, to a lesser
extent, also while writing text messages and drinking (trend). Middle-aged participants had a signi-
ficantly longer RT to critical events while writing text messages than their younger counterparts (p =
0.01-0.05).
Term Est. S.E. Sign.
Intercept 1.97 0.10 ***
Text reading 0.37 0.08 ***
Text writing 0.31 0.07 ***
Hand-held phoning 0.03 0.07
Hands-free phoning -0.02 0.08
Eating 0.11 0.08
Drinking 0.11 0.07
Self-report composite -0.01 0.04
Age category (ref: 20-34) 0.08 0.07
Gender (ref: female) -0.03 0.07
Km last 12 months -0.02 0.03
Task order (1 to 16 tasks) -0.01 0.00 **
Interactions
read x gender -0.22 0.09 *
write x gender -0.14 0.08 ,
drink x gender -0.16 0.08 ,
write x age category 0.20 0.08 *
Table 5: RT Linear Mixed Model (N=56) Significance codes: 0 ‘***’ 0.001 ‘**’ 0.01 ‘*’ 0.05 ‘,’ 0.1 ‘ ’ 1
Figure 31: RT boxplots of significant interaction effects in the LMM (N=56)
20−34 35−49
2
3
4
ctr
write ctr
write
Condition
Reac
tion t
ime (
in se
cond
s)
Reaction timeFemale Male
1.5
2.0
2.5
3.0
3.5
ctr read ctr read
Condition
Reac
tion t
ime (
in se
cond
s)
Reaction time
GO TO CONTENT
KFV The impact of distraction on driving behaviour in urban traffic | 4039 | KFV The impact of distraction on driving behaviour in urban traffic
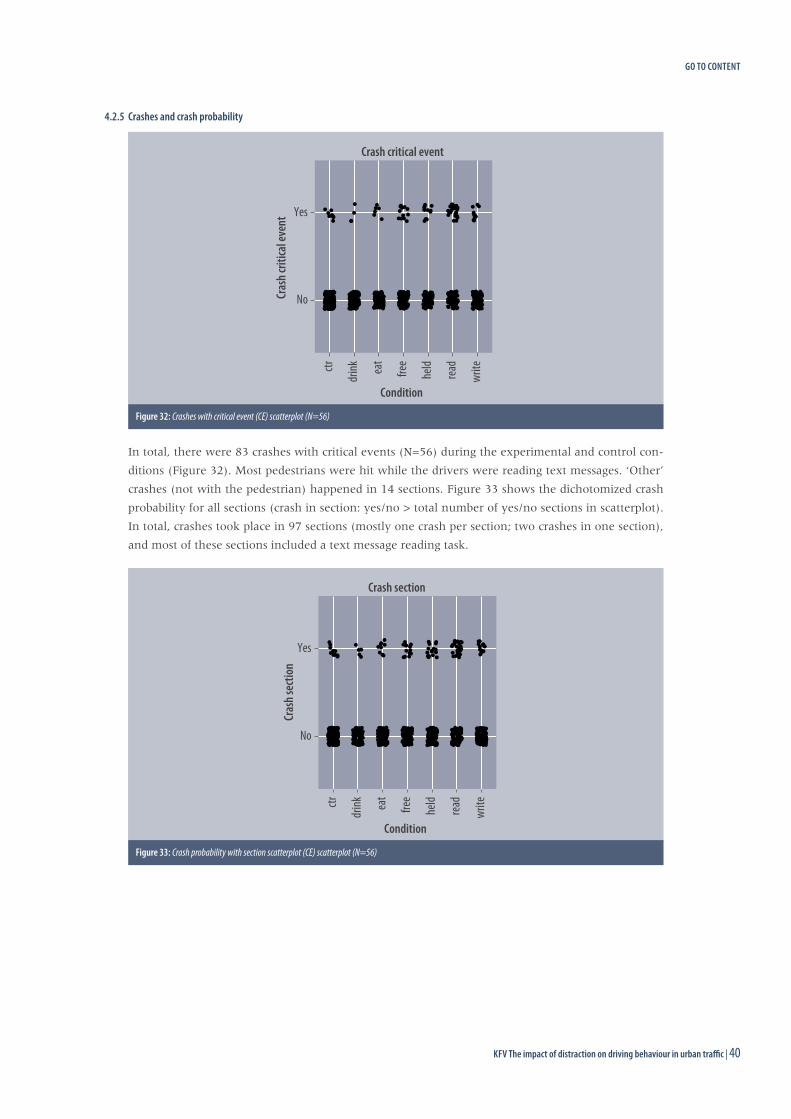
4.2.5 Crashes and crash probability
In total, there were 83 crashes with critical events (N=56) during the experimental and control con-
ditions (Figure 32). Most pedestrians were hit while the drivers were reading text messages. ‘Other’
crashes (not with the pedestrian) happened in 14 sections. Figure 33 shows the dichotomized crash
probability for all sections (crash in section: yes/no > total number of yes/no sections in scatterplot).
In total, crashes took place in 97 sections (mostly one crash per section; two crashes in one section),
and most of these sections included a text message reading task.
No
Yes
ctr
drink ea
t
free
held
read
write
Condition
Cras
h crit
ical e
vent
Crash critical event
Figure 32: Crashes with critical event (CE) scatterplot (N=56)
No
Yes
ctr
drink ea
t
free
held
read
write
Condition
Cras
h sec
tion
Crash section
Figure 33: Crash probability with section scatterplot (CE) scatterplot (N=56)
GO TO CONTENT
41 | KFV The impact of distraction on driving behaviour in urban traffic
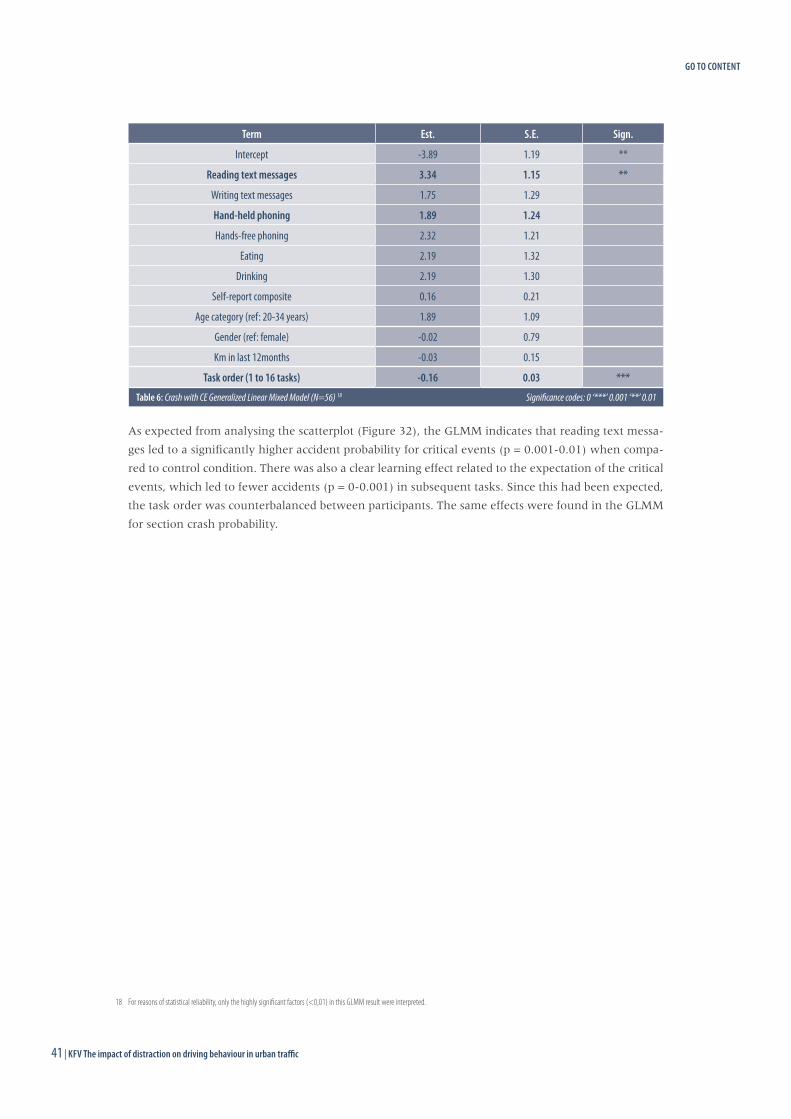
As expected from analysing the scatterplot (Figure 32), the GLMM indicates that reading text messa-
ges led to a significantly higher accident probability for critical events (p = 0.001-0.01) when compa-
red to control condition. There was also a clear learning effect related to the expectation of the critical
events, which led to fewer accidents (p = 0-0.001) in subsequent tasks. Since this had been expected,
the task order was counterbalanced between participants. The same effects were found in the GLMM
for section crash probability.
18 For reasons of statistical reliability, only the highly significant factors (<0,01) in this GLMM result were interpreted.
Term Est. S.E. Sign.
Intercept -3.89 1.19 **
Reading text messages 3.34 1.15 **
Writing text messages 1.75 1.29
Hand-held phoning 1.89 1.24
Hands-free phoning 2.32 1.21
Eating 2.19 1.32
Drinking 2.19 1.30
Self-report composite 0.16 0.21
Age category (ref: 20-34 years) 1.89 1.09
Gender (ref: female) -0.02 0.79
Km in last 12months -0.03 0.15
Task order (1 to 16 tasks) -0.16 0.03 ***
Table 6: Crash with CE Generalized Linear Mixed Model (N=56) 18 Significance codes: 0 ‘***’ 0.001 ‘**’ 0.01
GO TO CONTENT
KFV The impact of distraction on driving behaviour in urban traffic | 4241 | KFV The impact of distraction on driving behaviour in urban traffic
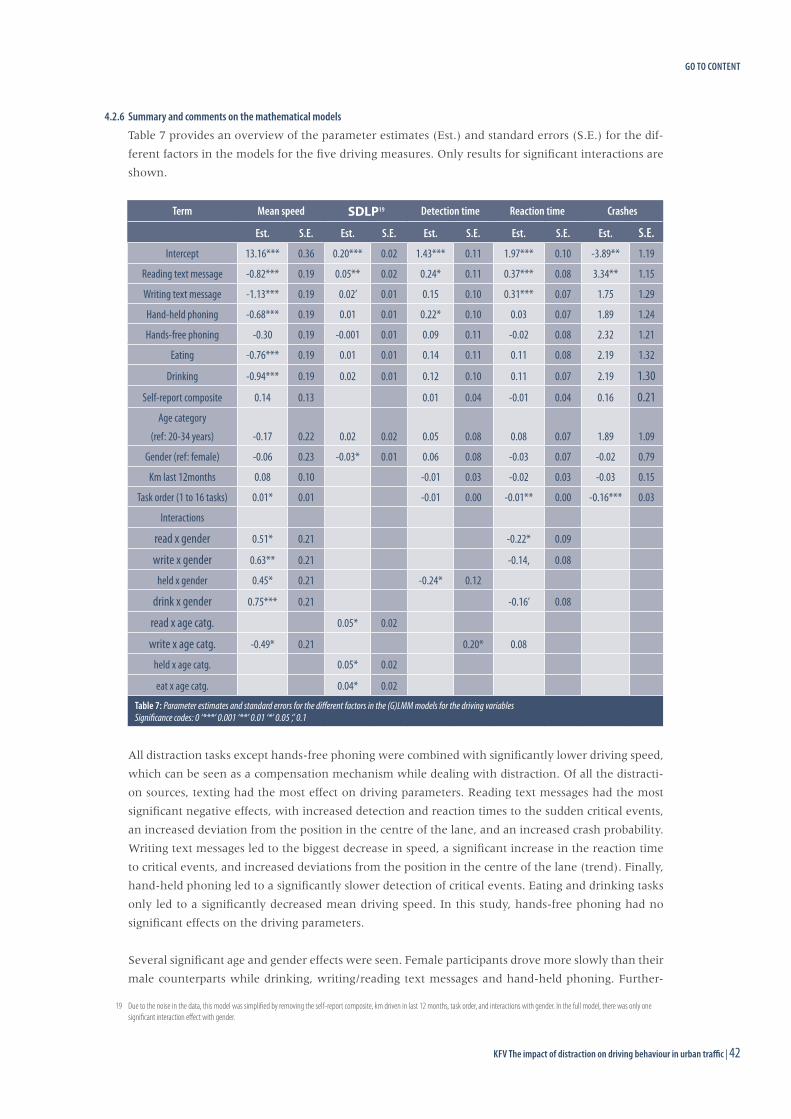
4.2.6 Summary and comments on the mathematical models
Table 7 provides an overview of the parameter estimates (Est.) and standard errors (S.E.) for the dif-
ferent factors in the models for the five driving measures. Only results for significant interactions are
shown.
Term Mean speed SDLP19 Detection time Reaction time Crashes
Est. S.E. Est. S.E. Est. S.E. Est. S.E. Est. S.E.
Intercept 13.16*** 0.36 0.20*** 0.02 1.43*** 0.11 1.97*** 0.10 -3.89** 1.19
Reading text message -0.82*** 0.19 0.05** 0.02 0.24* 0.11 0.37*** 0.08 3.34** 1.15
Writing text message -1.13*** 0.19 0.02’ 0.01 0.15 0.10 0.31*** 0.07 1.75 1.29
Hand-held phoning -0.68*** 0.19 0.01 0.01 0.22* 0.10 0.03 0.07 1.89 1.24
Hands-free phoning -0.30 0.19 -0.001 0.01 0.09 0.11 -0.02 0.08 2.32 1.21
Eating -0.76*** 0.19 0.01 0.01 0.14 0.11 0.11 0.08 2.19 1.32
Drinking -0.94*** 0.19 0.02 0.01 0.12 0.10 0.11 0.07 2.19 1.30
Self-report composite 0.14 0.13 0.01 0.04 -0.01 0.04 0.16 0.21Age category
(ref: 20-34 years) -0.17 0.22 0.02 0.02 0.05 0.08 0.08 0.07 1.89 1.09
Gender (ref: female) -0.06 0.23 -0.03* 0.01 0.06 0.08 -0.03 0.07 -0.02 0.79
Km last 12months 0.08 0.10 -0.01 0.03 -0.02 0.03 -0.03 0.15
Task order (1 to 16 tasks) 0.01* 0.01 -0.01 0.00 -0.01** 0.00 -0.16*** 0.03
Interactions
read x gender 0.51* 0.21 -0.22* 0.09
write x gender 0.63** 0.21 -0.14, 0.08
held x gender 0.45* 0.21 -0.24* 0.12
drink x gender 0.75*** 0.21 -0.16’ 0.08
read x age catg. 0.05* 0.02
write x age catg. -0.49* 0.21 0.20* 0.08
held x age catg. 0.05* 0.02
eat x age catg. 0.04* 0.02 Table 7: Parameter estimates and standard errors for the different factors in the (G)LMM models for the driving variables Significance codes: 0 ‘***’ 0.001 ‘**’ 0.01 ‘*’ 0.05 ‘,’ 0.1
All distraction tasks except hands-free phoning were combined with significantly lower driving speed,
which can be seen as a compensation mechanism while dealing with distraction. Of all the distracti-
on sources, texting had the most effect on driving parameters. Reading text messages had the most
significant negative effects, with increased detection and reaction times to the sudden critical events,
an increased deviation from the position in the centre of the lane, and an increased crash probability.
Writing text messages led to the biggest decrease in speed, a significant increase in the reaction time
to critical events, and increased deviations from the position in the centre of the lane (trend). Finally,
hand-held phoning led to a significantly slower detection of critical events. Eating and drinking tasks
only led to a significantly decreased mean driving speed. In this study, hands-free phoning had no
significant effects on the driving parameters.
Several significant age and gender effects were seen. Female participants drove more slowly than their
male counterparts while drinking, writing/reading text messages and hand-held phoning. Further-
19 Due to the noise in the data, this model was simplified by removing the self-report composite, km driven in last 12 months, task order, and interactions with gender. In the full model, there was only one significant interaction effect with gender.
GO TO CONTENT
43 | KFV The impact of distraction on driving behaviour in urban traffic
more, the detrimental effects of hand-held phoning (slower CE detections) and reading text messages
(slower reactions to CEs) were greater for females. Higher RTs were also seen during text message
writing and drinking, but this was merely a trend difference. Finally, females had a higher SDLP than
males (not specifically related to distraction tasks). Middle-aged participants (35-49 years) differed
significantly from their younger counterparts (20-34 years). In particular, they drove more slowly and
also reacted more slowly to critical events while writing text messages (which are related phenome-
na). Furthermore, the 35-49-year-old participants deviated further from the centre of the road than
the 20-24-year-olds while reading text messages, hand-held phoning, and eating.
The mathematical models indicated that task order significantly affected mean speed, RT, and crash
probability. Task order effects were controlled for as far as possible by counterbalancing the tasks
between participants. However, the task of reading a text message did have a “disadvantage” when it
came to order effects in this study, because the tasks in the texting track had a fixed order (first rea-
ding the text message, then writing the text message, and repeated).
No effect of the composite score from the pre-questionnaire “self-reported distraction behaviour whi-
le driving” on the driving parameters was found.
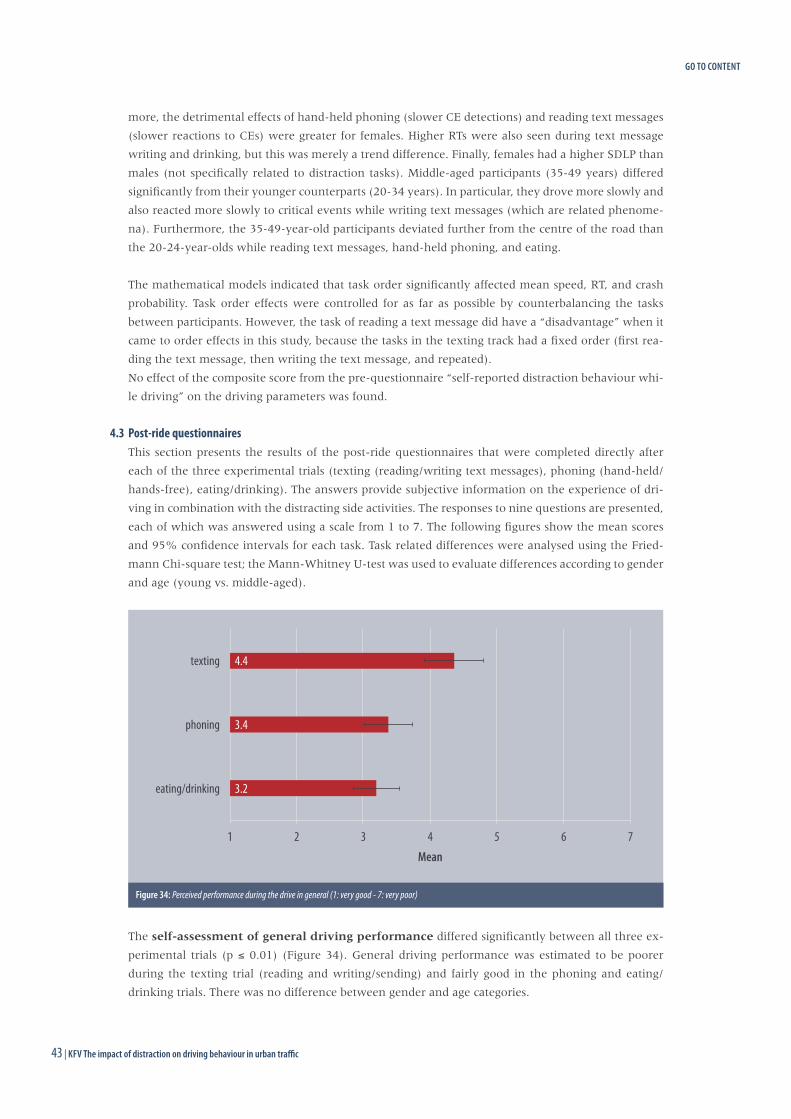
4.3 Post-ride questionnairesThis section presents the results of the post-ride questionnaires that were completed directly after
each of the three experimental trials (texting (reading/writing text messages), phoning (hand-held/
hands-free), eating/drinking). The answers provide subjective information on the experience of dri-
ving in combination with the distracting side activities. The responses to nine questions are presented,
each of which was answered using a scale from 1 to 7. The following figures show the mean scores
and 95% confidence intervals for each task. Task related differences were analysed using the Fried-
mann Chi-square test; the Mann-Whitney U-test was used to evaluate differences according to gender
and age (young vs. middle-aged).
The self-assessment of general driving performance differed significantly between all three ex-
perimental trials (p ≤ 0.01) (Figure 34). General driving performance was estimated to be poorer
during the texting trial (reading and writing/sending) and fairly good in the phoning and eating/
drinking trials. There was no difference between gender and age categories.
3.2
3.4
4.4
1 2 3 4 5 6 7
eating/drinking
phoning
texting
Mean
Figure 34: Perceived performance during the drive in general (1: very good - 7: very poor)
GO TO CONTENT
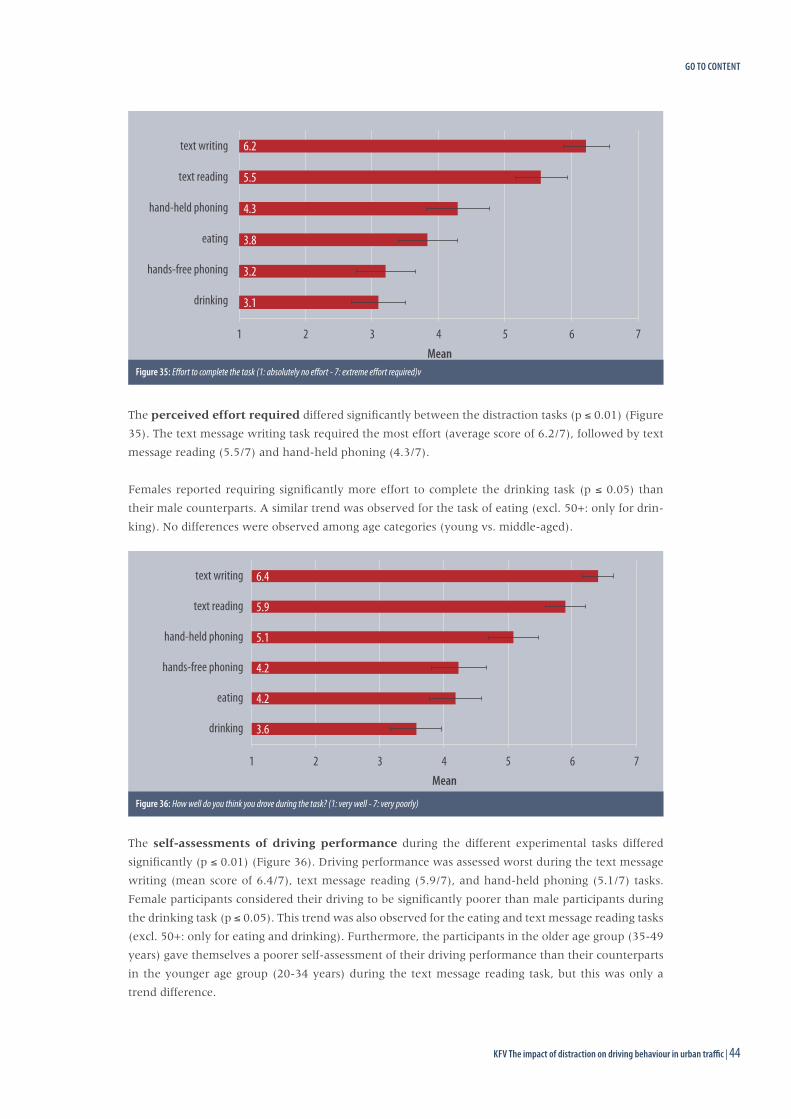
KFV The impact of distraction on driving behaviour in urban traffic | 4443 | KFV The impact of distraction on driving behaviour in urban traffic
The perceived effort required differed significantly between the distraction tasks (p ≤ 0.01) (Figure
35). The text message writing task required the most effort (average score of 6.2/7), followed by text
message reading (5.5/7) and hand-held phoning (4.3/7).
Females reported requiring significantly more effort to complete the drinking task (p ≤ 0.05) than
their male counterparts. A similar trend was observed for the task of eating (excl. 50+: only for drin-
king). No differences were observed among age categories (young vs. middle-aged).
The self-assessments of driving performance during the different experimental tasks differed
significantly (p ≤ 0.01) (Figure 36). Driving performance was assessed worst during the text message
writing (mean score of 6.4/7), text message reading (5.9/7), and hand-held phoning (5.1/7) tasks.
Female participants considered their driving to be significantly poorer than male participants during
the drinking task (p ≤ 0.05). This trend was also observed for the eating and text message reading tasks
(excl. 50+: only for eating and drinking). Furthermore, the participants in the older age group (35-49
years) gave themselves a poorer self-assessment of their driving performance than their counterparts
in the younger age group (20-34 years) during the text message reading task, but this was only a
trend difference.
3.1
3.2
3.8
4.3
5.5
6.2
1 2 3 4 5 6 7
drinking
hands-free phoning
eating
hand-held phoning
text reading
text writing
Mean Figure 35: Effort to complete the task (1: absolutely no effort - 7: extreme effort required)v
3.6
4.2
4.2
5.1
5.9
6.4
1 2 3 4 5 6 7
drinking
eating
hands-free phoning
hand-held phoning
text reading
text writing
Mean
Figure 36: How well do you think you drove during the task? (1: very well - 7: very poorly)
GO TO CONTENT
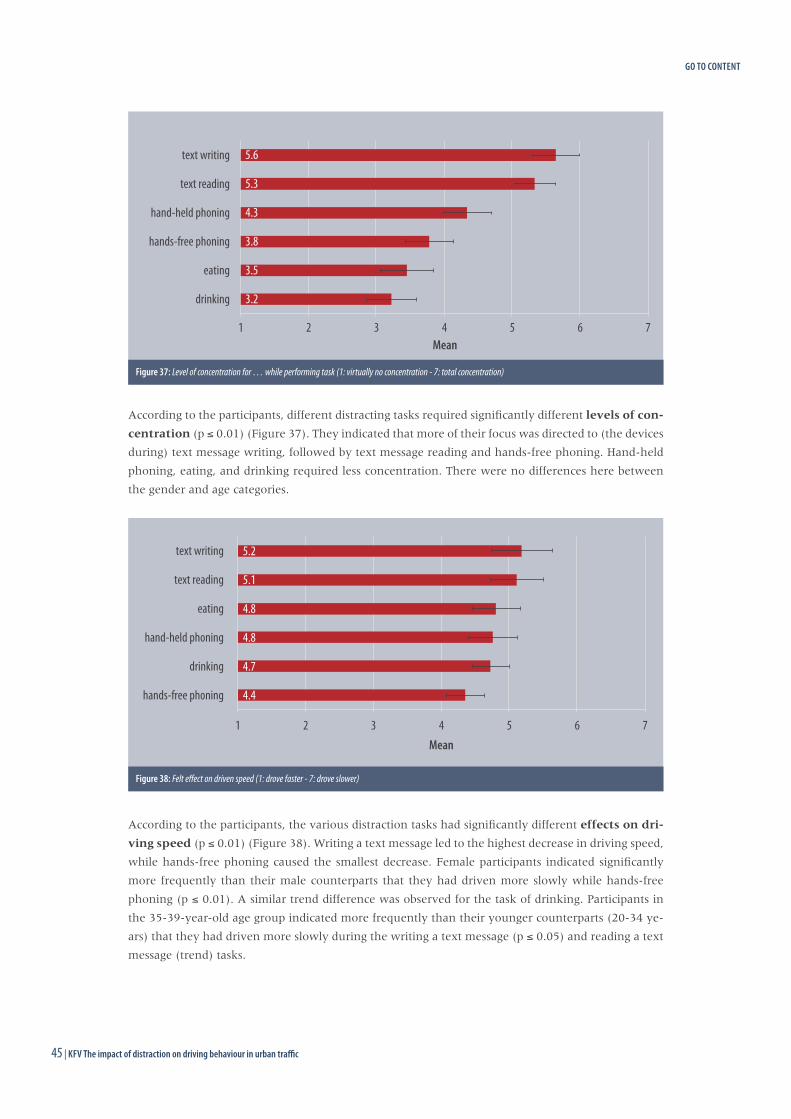
45 | KFV The impact of distraction on driving behaviour in urban traffic
According to the participants, different distracting tasks required significantly different levels of con-
centration (p ≤ 0.01) (Figure 37). They indicated that more of their focus was directed to (the devices
during) text message writing, followed by text message reading and hands-free phoning. Hand-held
phoning, eating, and drinking required less concentration. There were no differences here between
the gender and age categories.
According to the participants, the various distraction tasks had significantly different effects on dri-
ving speed (p ≤ 0.01) (Figure 38). Writing a text message led to the highest decrease in driving speed,
while hands-free phoning caused the smallest decrease. Female participants indicated significantly
more frequently than their male counterparts that they had driven more slowly while hands-free
phoning (p ≤ 0.01). A similar trend difference was observed for the task of drinking. Participants in
the 35-39-year-old age group indicated more frequently than their younger counterparts (20-34 ye-
ars) that they had driven more slowly during the writing a text message (p ≤ 0.05) and reading a text
message (trend) tasks.
3.2
3.5
3.8
4.3
5.3
5.6
1 2 3 4 5 6 7
drinking
eating
hands-free phoning
hand-held phoning
text reading
text writing
Mean
Figure 37: Level of concentration for … while performing task (1: virtually no concentration - 7: total concentration)
4.4
4.7
4.8
4.8
5.1
5.2
1 2 3 4 5 6 7
hands-free phoning
drinking
hand-held phoning
eating
text reading
text writing
Mean
Figure 38: Felt effect on driven speed (1: drove faster - 7: drove slower)
GO TO CONTENT
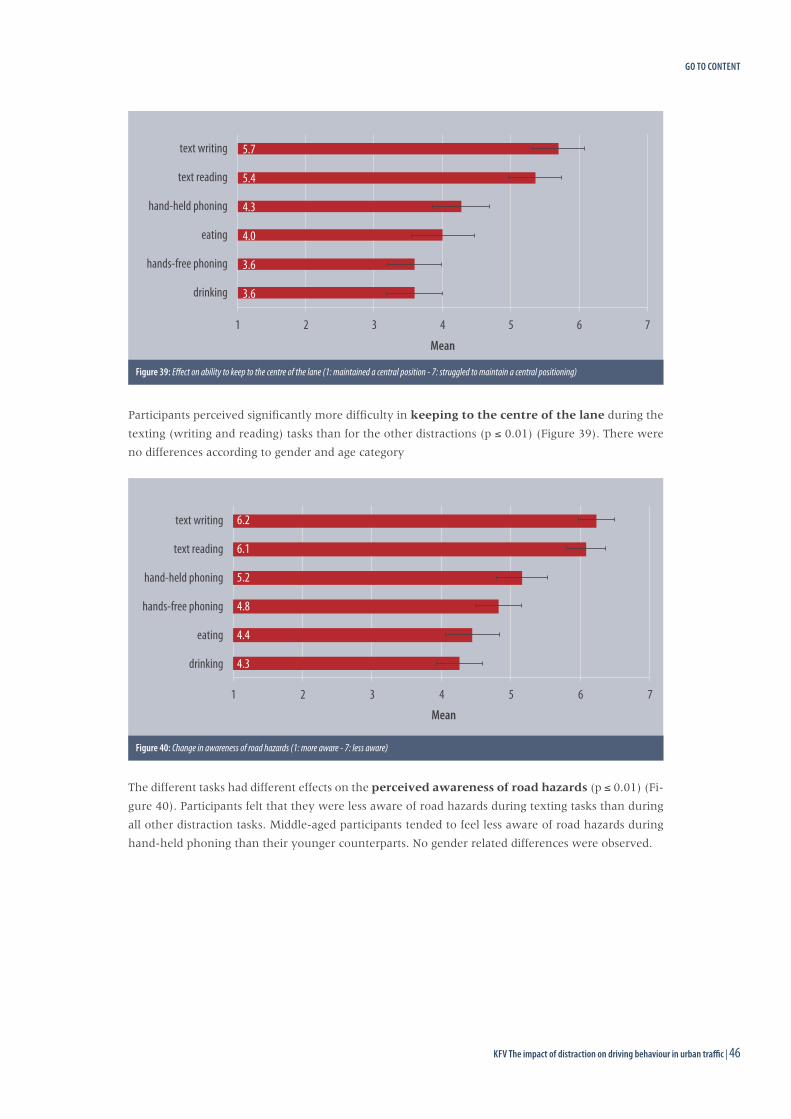
KFV The impact of distraction on driving behaviour in urban traffic | 4645 | KFV The impact of distraction on driving behaviour in urban traffic
Participants perceived significantly more difficulty in keeping to the centre of the lane during the
texting (writing and reading) tasks than for the other distractions (p ≤ 0.01) (Figure 39). There were
no differences according to gender and age category
The different tasks had different effects on the perceived awareness of road hazards (p ≤ 0.01) (Fi-
gure 40). Participants felt that they were less aware of road hazards during texting tasks than during
all other distraction tasks. Middle-aged participants tended to feel less aware of road hazards during
hand-held phoning than their younger counterparts. No gender related differences were observed.
3.6
3.6
4.0
4.3
5.4
5.7
1 2 3 4 5 6 7
drinking
hands-free phoning
eating
hand-held phoning
text reading
text writing
Mean
Figure 39: Effect on ability to keep to the centre of the lane (1: maintained a central position - 7: struggled to maintain a central positioning)
4.3
4.4
4.8
5.2
6.1
6.2
1 2 3 4 5 6 7
drinking
eating
hands-free phoning
hand-held phoning
text reading
text writing
Mean
Figure 40: Change in awareness of road hazards (1: more aware - 7: less aware)
GO TO CONTENT
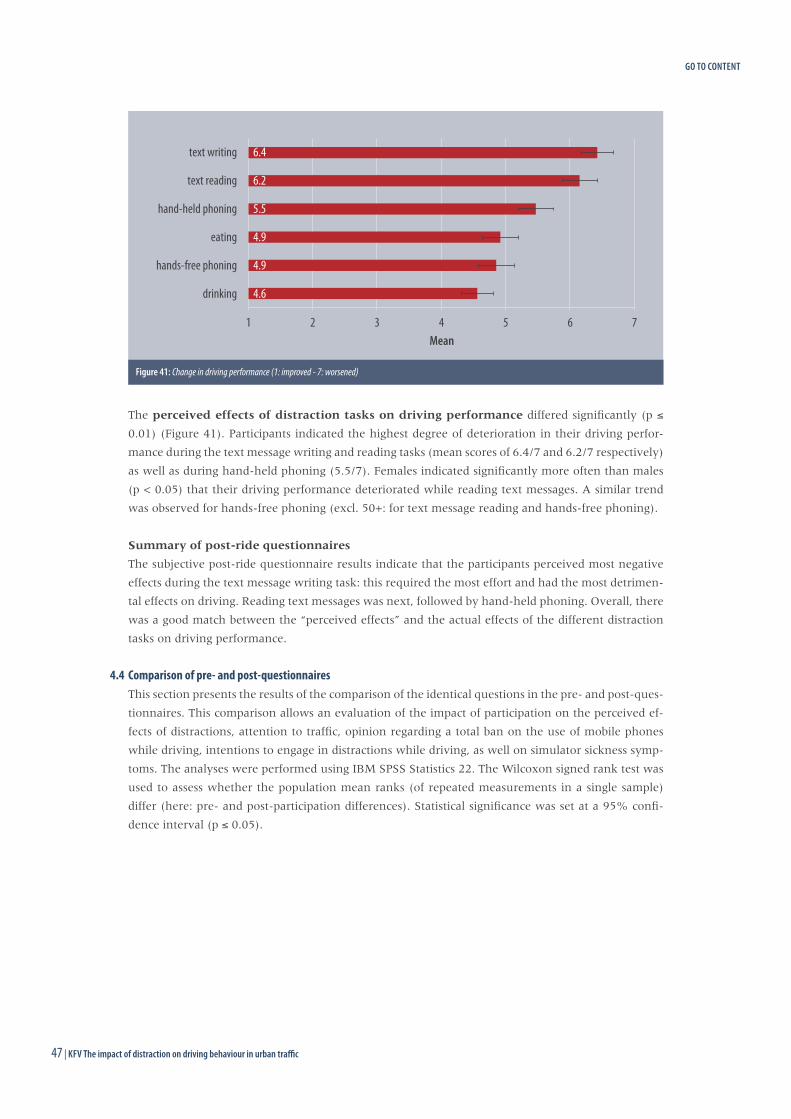
47 | KFV The impact of distraction on driving behaviour in urban traffic
The perceived effects of distraction tasks on driving performance differed significantly (p ≤
0.01) (Figure 41). Participants indicated the highest degree of deterioration in their driving perfor-
mance during the text message writing and reading tasks (mean scores of 6.4/7 and 6.2/7 respectively)
as well as during hand-held phoning (5.5/7). Females indicated significantly more often than males
(p < 0.05) that their driving performance deteriorated while reading text messages. A similar trend
was observed for hands-free phoning (excl. 50+: for text message reading and hands-free phoning).
Summary of post-ride questionnaires
The subjective post-ride questionnaire results indicate that the participants perceived most negative
effects during the text message writing task: this required the most effort and had the most detrimen-
tal effects on driving. Reading text messages was next, followed by hand-held phoning. Overall, there
was a good match between the “perceived effects” and the actual effects of the different distraction
tasks on driving performance.
4.4 Comparison of pre- and post-questionnairesThis section presents the results of the comparison of the identical questions in the pre- and post-ques-
tionnaires. This comparison allows an evaluation of the impact of participation on the perceived ef-
fects of distractions, attention to traffic, opinion regarding a total ban on the use of mobile phones
while driving, intentions to engage in distractions while driving, as well on simulator sickness symp-
toms. The analyses were performed using IBM SPSS Statistics 22. The Wilcoxon signed rank test was
used to assess whether the population mean ranks (of repeated measurements in a single sample)
differ (here: pre- and post-participation differences). Statistical significance was set at a 95% confi-
dence interval (p ≤ 0.05).
4.6
4.9
4.9
5.5
6.2
6.4
1 2 3 4 5 6 7
drinking
hands-free phoning
eating
hand-held phoning
text reading
text writing
Mean
Figure 41: Change in driving performance (1: improved - 7: worsened)
GO TO CONTENT
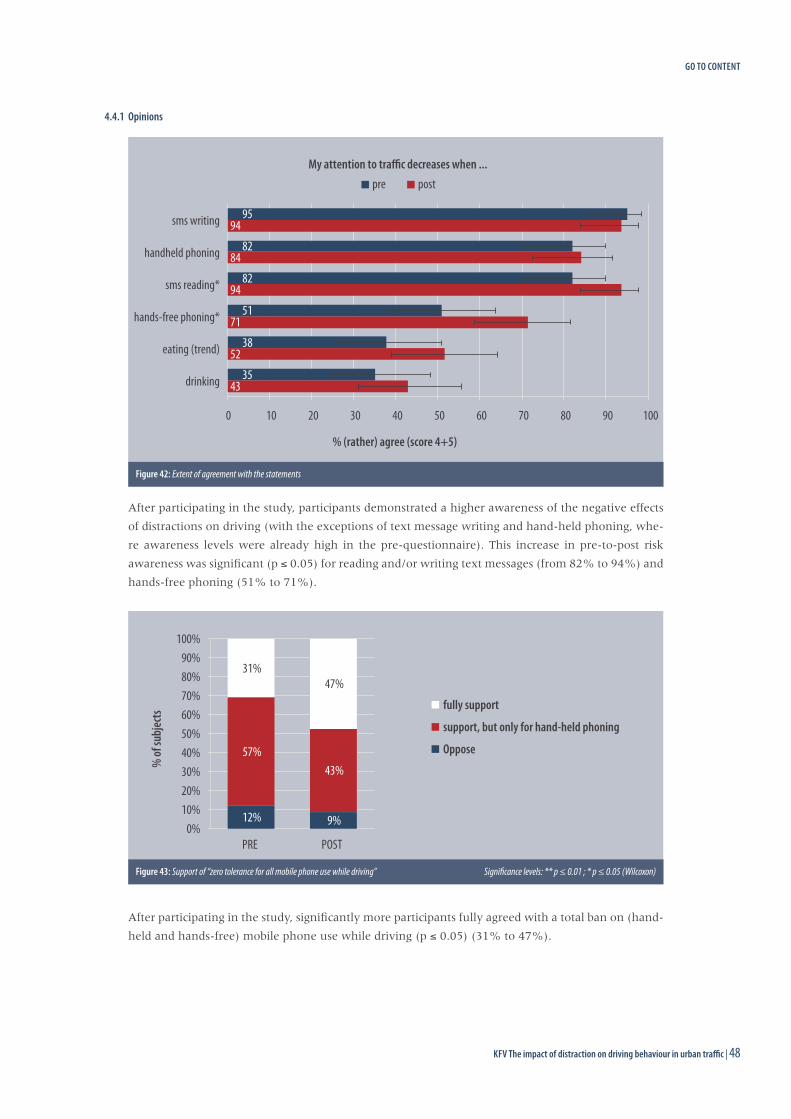
KFV The impact of distraction on driving behaviour in urban traffic | 4847 | KFV The impact of distraction on driving behaviour in urban traffic
4.4.1 Opinions
After participating in the study, participants demonstrated a higher awareness of the negative effects
of distractions on driving (with the exceptions of text message writing and hand-held phoning, whe-
re awareness levels were already high in the pre-questionnaire). This increase in pre-to-post risk
awareness was significant (p ≤ 0.05) for reading and/or writing text messages (from 82% to 94%) and
hands-free phoning (51% to 71%).
After participating in the study, significantly more participants fully agreed with a total ban on (hand-
held and hands-free) mobile phone use while driving (p ≤ 0.05) (31% to 47%).
43
52
71
94
84
94
35
38
51
82
82
95
0 10 20 30 40 50 60 70 80 90 100
drinking
eating (trend)
hands-free phoning*
sms reading*
handheld phoning
sms writing
% (rather) agree (score 4+5)
My attention to traffic decreases when ...pre post
Figure 42: Extent of agreement with the statements
12% 9%
57% 43%
31% 47%
0% 10% 20% 30% 40% 50% 60% 70% 80% 90%
100%
PRE POST
% of
subj
ects
fully support
support, but only for hand-held phoning
Oppose
Figure 43: Support of “zero tolerance for all mobile phone use while driving” Significance levels: ** p ≤ 0.01 ; * p ≤ 0.05 (Wilcoxon)
GO TO CONTENT
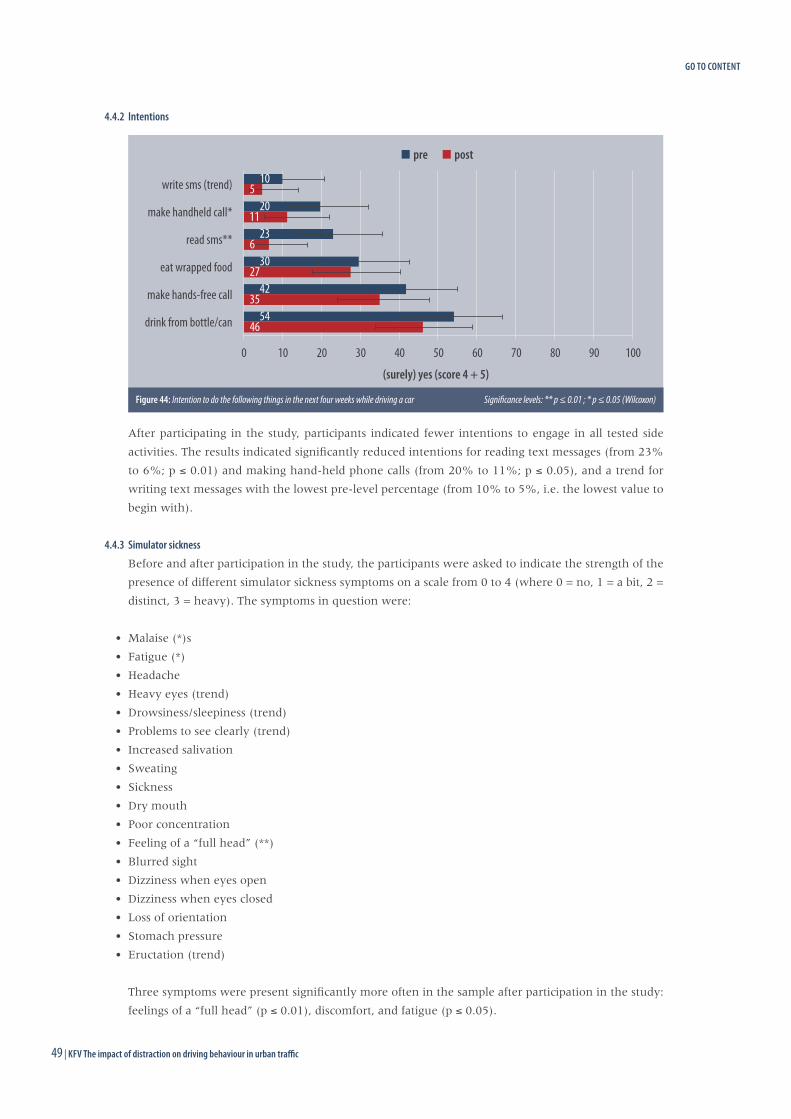
49 | KFV The impact of distraction on driving behaviour in urban traffic
4.4.2 Intentions
After participating in the study, participants indicated fewer intentions to engage in all tested side
activities. The results indicated significantly reduced intentions for reading text messages (from 23%
to 6%; p ≤ 0.01) and making hand-held phone calls (from 20% to 11%; p ≤ 0.05), and a trend for
writing text messages with the lowest pre-level percentage (from 10% to 5%, i.e. the lowest value to
begin with).
4.4.3 Simulator sickness
Before and after participation in the study, the participants were asked to indicate the strength of the
presence of different simulator sickness symptoms on a scale from 0 to 4 (where 0 = no, 1 = a bit, 2 =
distinct, 3 = heavy). The symptoms in question were:
• Malaise (*)s
• Fatigue (*)
• Headache
• Heavy eyes (trend)
• Drowsiness/sleepiness (trend)
• Problems to see clearly (trend)
• Increased salivation
• Sweating
• Sickness
• Dry mouth
• Poor concentration
• Feeling of a “full head” (**)
• Blurred sight
• Dizziness when eyes open
• Dizziness when eyes closed
• Loss of orientation
• Stomach pressure
• Eructation (trend)
Three symptoms were present significantly more often in the sample after participation in the study:
feelings of a “full head” (p ≤ 0.01), discomfort, and fatigue (p ≤ 0.05).
46
35
27
6
11
5
54
42
30
23
20
10
0 10 20 30 40 50 60 70 80 90 100
drink from bottle/can
make hands-free call
eat wrapped food
read sms**
make handheld call*
write sms (trend)
(surely) yes (score 4 + 5)
pre post
Figure 44: Intention to do the following things in the next four weeks while driving a car Significance levels: ** p ≤ 0.01 ; * p ≤ 0.05 (Wilcoxon)
GO TO CONTENT
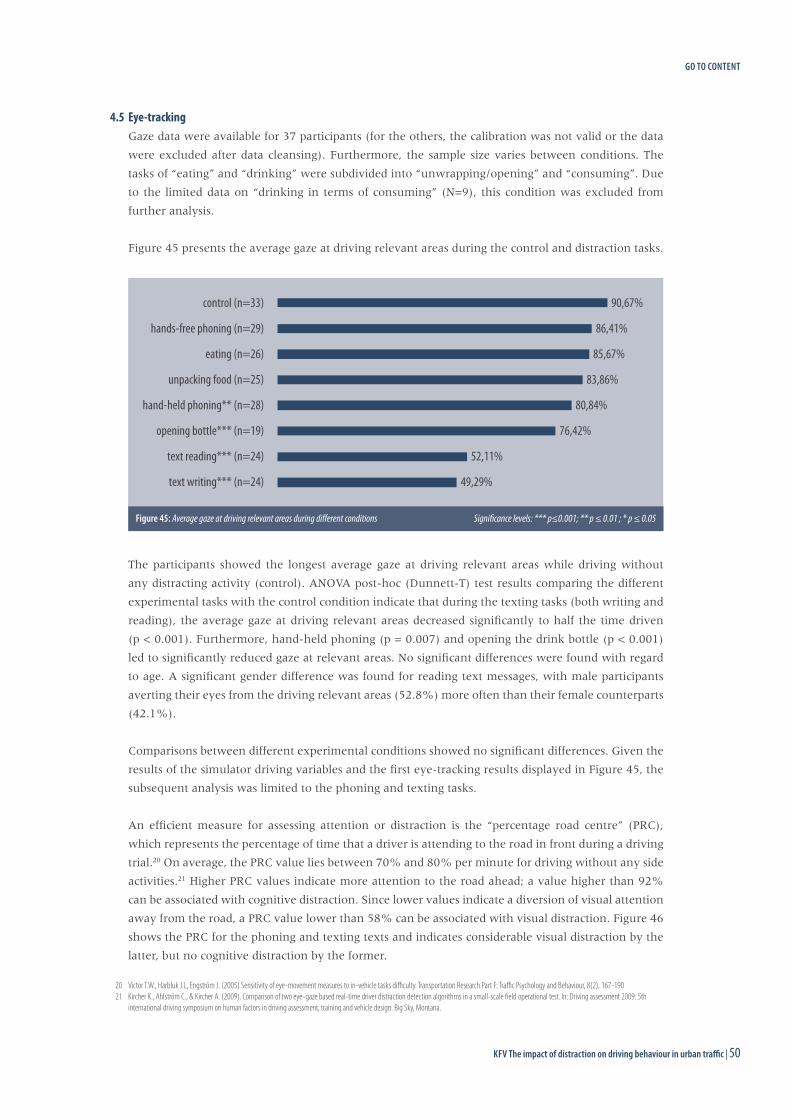
KFV The impact of distraction on driving behaviour in urban traffic | 5049 | KFV The impact of distraction on driving behaviour in urban traffic
4.5 Eye-trackingGaze data were available for 37 participants (for the others, the calibration was not valid or the data
were excluded after data cleansing). Furthermore, the sample size varies between conditions. The
tasks of “eating” and “drinking” were subdivided into “unwrapping/opening” and “consuming”. Due
to the limited data on “drinking in terms of consuming” (N=9), this condition was excluded from
further analysis.
Figure 45 presents the average gaze at driving relevant areas during the control and distraction tasks.
The participants showed the longest average gaze at driving relevant areas while driving without
any distracting activity (control). ANOVA post-hoc (Dunnett-T) test results comparing the different
experimental tasks with the control condition indicate that during the texting tasks (both writing and
reading), the average gaze at driving relevant areas decreased significantly to half the time driven
(p < 0.001). Furthermore, hand-held phoning (p = 0.007) and opening the drink bottle (p < 0.001)
led to significantly reduced gaze at relevant areas. No significant differences were found with regard
to age. A significant gender difference was found for reading text messages, with male participants
averting their eyes from the driving relevant areas (52.8%) more often than their female counterparts
(42.1%).
Comparisons between different experimental conditions showed no significant differences. Given the
results of the simulator driving variables and the first eye-tracking results displayed in Figure 45, the
subsequent analysis was limited to the phoning and texting tasks.
An efficient measure for assessing attention or distraction is the “percentage road centre” (PRC),
which represents the percentage of time that a driver is attending to the road in front during a driving
trial.20 On average, the PRC value lies between 70% and 80% per minute for driving without any side
activities.21 Higher PRC values indicate more attention to the road ahead; a value higher than 92%
can be associated with cognitive distraction. Since lower values indicate a diversion of visual attention
away from the road, a PRC value lower than 58% can be associated with visual distraction. Figure 46
shows the PRC for the phoning and texting texts and indicates considerable visual distraction by the
latter, but no cognitive distraction by the former.
20 Victor T.W., Harbluk J.L, Engström J. (2005) Sensitivity of eye-movement measures to in-vehicle tasks difficulty. Transportation Research Part F: Traffic Psychology and Behaviour, 8(2), 167-19021 Kircher K., Ahlström C., & Kircher A. (2009). Comparison of two eye-gaze based real-time driver distraction detection algorithms in a small-scale field operational test. In: Driving assessment 2009: 5th
international driving symposium on human factors in driving assessment, training and vehicle design. Big Sky, Montana.
49,29%
52,11%
76,42%
80,84%
83,86%
85,67%
86,41%
90,67%
text writing*** (n=24)
text reading*** (n=24)
opening bottle*** (n=19)
hand-held phoning** (n=28)
unpacking food (n=25)
eating (n=26)
hands-free phoning (n=29)
control (n=33)
Figure 45: Average gaze at driving relevant areas during different conditions Significance levels: *** p≤0.001; ** p ≤ 0.01 ; * p ≤ 0.05
GO TO CONTENT
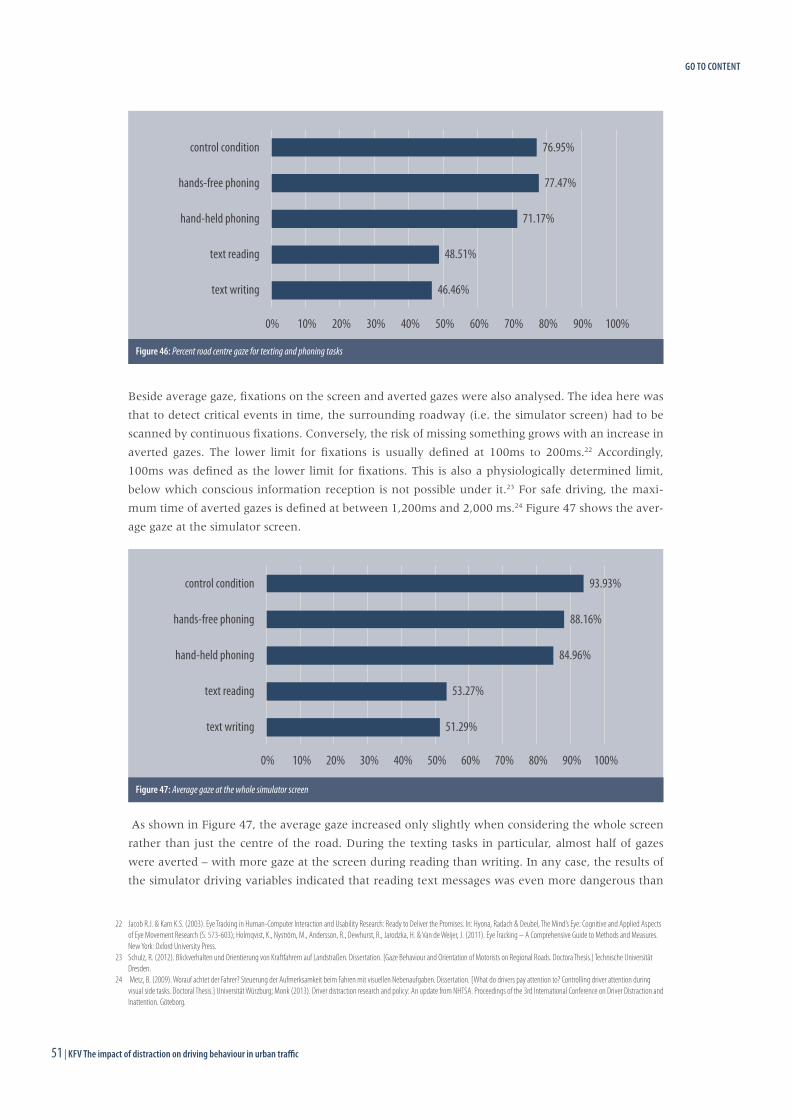
51 | KFV The impact of distraction on driving behaviour in urban traffic
Beside average gaze, fixations on the screen and averted gazes were also analysed. The idea here was
that to detect critical events in time, the surrounding roadway (i.e. the simulator screen) had to be
scanned by continuous fixations. Conversely, the risk of missing something grows with an increase in
averted gazes. The lower limit for fixations is usually defined at 100ms to 200ms.22 Accordingly,
100ms was defined as the lower limit for fixations. This is also a physiologically determined limit,
below which conscious information reception is not possible under it.23 For safe driving, the maxi-
mum time of averted gazes is defined at between 1,200ms and 2,000 ms.24 Figure 47 shows the aver-
age gaze at the simulator screen.
As shown in Figure 47, the average gaze increased only slightly when considering the whole screen
rather than just the centre of the road. During the texting tasks in particular, almost half of gazes
were averted – with more gaze at the screen during reading than writing. In any case, the results of
the simulator driving variables indicated that reading text messages was even more dangerous than
22 Jacob R.J. & Karn K.S. (2003). Eye Tracking in Human-Computer Interaction and Usability Research: Ready to Deliver the Promises. In: Hyona, Radach & Deubel, The Mind’s Eye: Cognitive and Applied Aspects of Eye Movement Research (S. 573-603); Holmqvist, K., Nyström, M., Andersson, R., Dewhurst, R., Jarodzka, H. & Van de Weijer, J. (2011). Eye Tracking – A Comprehensive Guide to Methods and Measures. New York: Oxford University Press.
23 Schulz, R. (2012). Blickverhalten und Orientierung von Kraftfahrern auf Landstraßen. Dissertation. [Gaze Behaviour and Orientation of Motorists on Regional Roads. Doctora Thesis.] Technische Universität Dresden.
24 Metz, B. (2009). Worauf achtet der Fahrer? Steuerung der Aufmerksamkeit beim Fahren mit visuellen Nebenaufgaben. Dissertation. [What do drivers pay attention to? Controlling driver attention during visual side tasks. Doctoral Thesis.] Universität Würzburg; Monk (2013). Driver distraction research and policy: An update from NHTSA. Proceedings of the 3rd International Conference on Driver Distraction and Inattention. Göteborg.
46.46%
48.51%
71.17%
77.47%
76.95%
0% 10% 20% 30% 40% 50% 60% 70% 80% 90% 100%
text writing
text reading
hand-held phoning
hands-free phoning
control condition
Figure 46: Percent road centre gaze for texting and phoning tasks
51.29%
53.27%
84.96%
88.16%
93.93%
0% 10% 20% 30% 40% 50% 60% 70% 80% 90% 100%
text writing
text reading
hand-held phoning
hands-free phoning
control condition
Figure 47: Average gaze at the whole simulator screen
GO TO CONTENT
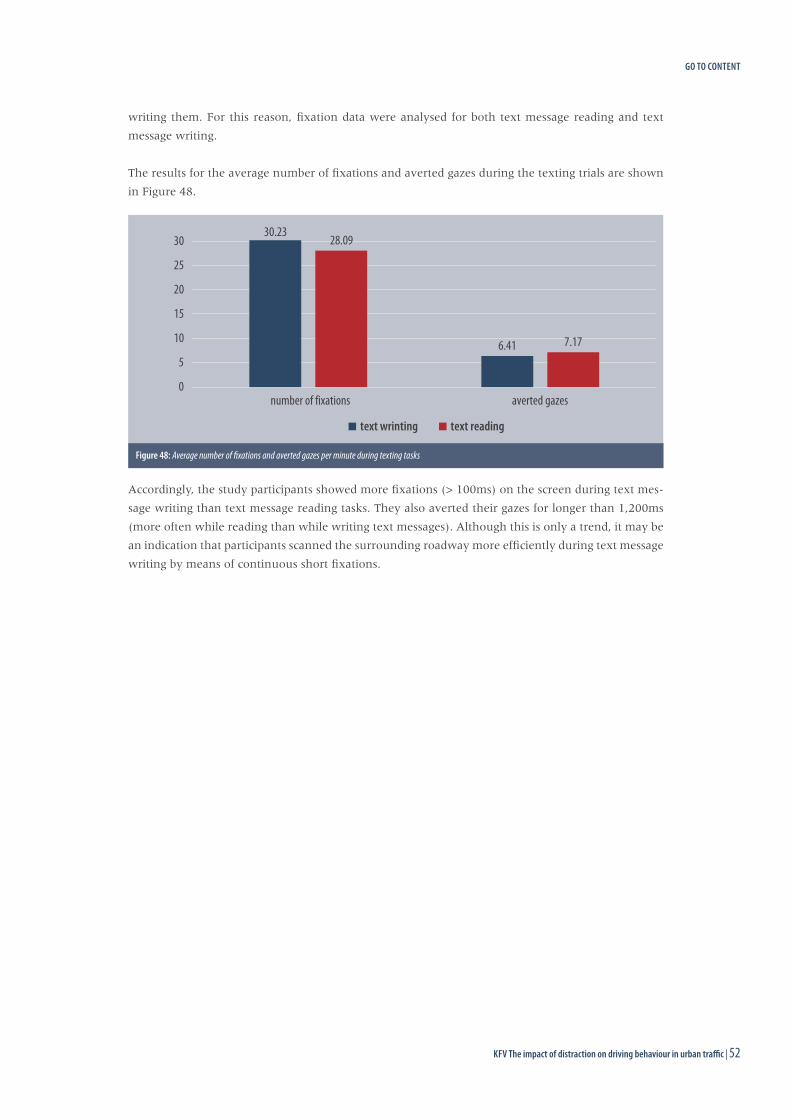
KFV The impact of distraction on driving behaviour in urban traffic | 5251 | KFV The impact of distraction on driving behaviour in urban traffic
writing them. For this reason, fixation data were analysed for both text message reading and text
message writing.
The results for the average number of fixations and averted gazes during the texting trials are shown
in Figure 48.
Accordingly, the study participants showed more fixations (> 100ms) on the screen during text mes-
sage writing than text message reading tasks. They also averted their gazes for longer than 1,200ms
(more often while reading than while writing text messages). Although this is only a trend, it may be
an indication that participants scanned the surrounding roadway more efficiently during text message
writing by means of continuous short fixations.
30.23
6.41
28.09
7.17
0
5
10
15
20
25
30
number of fixations averted gazes
text wrinting text reading
Figure 48: Average number of fixations and averted gazes per minute during texting tasks
GO TO CONTENT
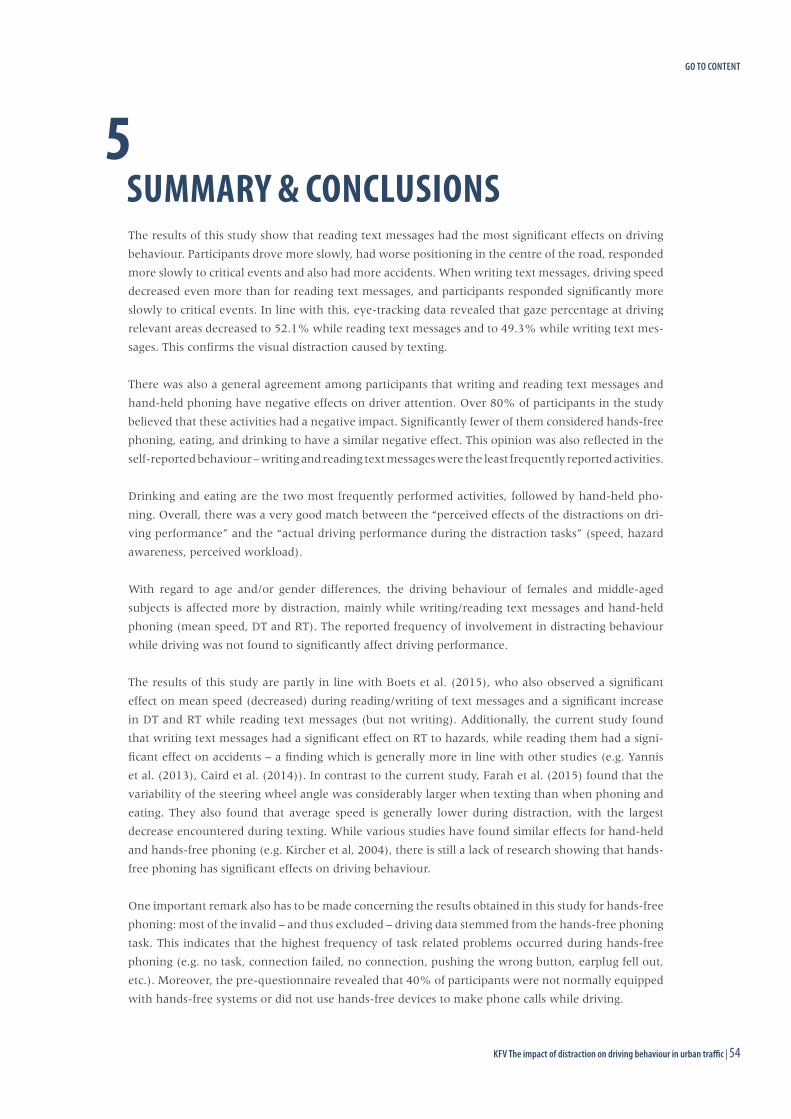
KFV The impact of distraction on driving behaviour in urban traffic | 5453 | KFV The impact of distraction on driving behaviour in urban traffic
5 SUMMARY & CONCLUSIONSThe results of this study show that reading text messages had the most significant effects on driving
behaviour. Participants drove more slowly, had worse positioning in the centre of the road, responded
more slowly to critical events and also had more accidents. When writing text messages, driving speed
decreased even more than for reading text messages, and participants responded significantly more
slowly to critical events. In line with this, eye-tracking data revealed that gaze percentage at driving
relevant areas decreased to 52.1% while reading text messages and to 49.3% while writing text mes-
sages. This confirms the visual distraction caused by texting.
There was also a general agreement among participants that writing and reading text messages and
hand-held phoning have negative effects on driver attention. Over 80% of participants in the study
believed that these activities had a negative impact. Significantly fewer of them considered hands-free
phoning, eating, and drinking to have a similar negative effect. This opinion was also reflected in the
self-reported behaviour – writing and reading text messages were the least frequently reported activities.
Drinking and eating are the two most frequently performed activities, followed by hand-held pho-
ning. Overall, there was a very good match between the “perceived effects of the distractions on dri-
ving performance” and the “actual driving performance during the distraction tasks” (speed, hazard
awareness, perceived workload).
With regard to age and/or gender differences, the driving behaviour of females and middle-aged
subjects is affected more by distraction, mainly while writing/reading text messages and hand-held
phoning (mean speed, DT and RT). The reported frequency of involvement in distracting behaviour
while driving was not found to significantly affect driving performance.
The results of this study are partly in line with Boets et al. (2015), who also observed a significant
effect on mean speed (decreased) during reading/writing of text messages and a significant increase
in DT and RT while reading text messages (but not writing). Additionally, the current study found
that writing text messages had a significant effect on RT to hazards, while reading them had a signi-
ficant effect on accidents – a finding which is generally more in line with other studies (e.g. Yannis
et al. (2013), Caird et al. (2014)). In contrast to the current study, Farah et al. (2015) found that the
variability of the steering wheel angle was considerably larger when texting than when phoning and
eating. They also found that average speed is generally lower during distraction, with the largest
decrease encountered during texting. While various studies have found similar effects for hand-held
and hands-free phoning (e.g. Kircher et al, 2004), there is still a lack of research showing that hands-
free phoning has significant effects on driving behaviour.
One important remark also has to be made concerning the results obtained in this study for hands-free
phoning: most of the invalid – and thus excluded – driving data stemmed from the hands-free phoning
task. This indicates that the highest frequency of task related problems occurred during hands-free
phoning (e.g. no task, connection failed, no connection, pushing the wrong button, earplug fell out,
etc.). Moreover, the pre-questionnaire revealed that 40% of participants were not normally equipped
with hands-free systems or did not use hands-free devices to make phone calls while driving.
GO TO CONTENT
55 | KFV The impact of distraction on driving behaviour in urban traffic
Generally speaking, engaging in other tasks while driving can lead to visual, cognitive, manual and
auditory distraction. The results of this study indicate that texting (reading/writing) has more negati-
ve effects on driving performance than phoning, eating, and drinking and leads to increased accident
risk. Contrary to popular belief, reading text messages proved to be even more dangerous than writing
them, although drivers did lose most sight of the road they were driving on when writing text mes-
sages. One reason for this might be that writing is more self-controlled than reading, it can be easily
split up into small parts. In contrast, receptive reading requires us to read more parts of the text at
once and thus commands more of our resources.
As already mentioned, the effects of hands-free phoning were rather limited in this study, a result
which could be related to the set-up of the experiment. However, the results did show that hand-held
phoning does have endangering effects on driving.
Furthermore, the research revealed that drivers reduce speed as a compensation mechanism when
they are distracted. In most cases, they slow down while writing text messages, perhaps because most
of them are aware of the dangerous effects of this activity.
Of all the possible sources of distraction studied, eating and drinking appeared to have the lowest ef-
fect on drivers’ attention and behaviour. Negative effects mainly occurred here while opening a bottle
unwrapping food.
With regard to age and/or gender differences, the results of this study show that women generally
slowed down more than men. Women also detected and reacted to sudden hazards much more slowly
while reading text messages and hand-held phoning.
Although drivers seem to be well aware of the risks involved, a clear majority (except for writing text
messages) nonetheless admits to engaging in the studied distraction behaviours.
In conclusion, the results of this study add to the weight of scientific evidence that texting – compared
with phoning, eating and drinking – has clear degrading effects on driving performance, leads to sig-
nificantly more visual distraction, and increases accident risk. While subjective data also rank texting
as the most demanding tasks with the most effect on driving behaviour, the subjective, visual, and
drive data are not completely in line in this regard. The results further suggest that there are some
particular age and gender related effects for different distraction sources, but that these could also be
linked to different levels of exposure.
A suggestion for further research would be a study design that allows drivers to decide for themselves
how and when to perform distracting activities (strategic compensation). Considering the speed of
technological development in communication devices, a multitude of possible additional distraction
activities that affect visual, manual, and cognitive resources can be expected in future. Combined
efforts with regard to legislation, enforcement, blocking technologies, campaigns, and education con-
tinue to be required.
Recommendations
Due to both the frequency of phone use during driving and the observed effects – especially of texting
– on driving behaviour, measures are needed which counter the risk of distraction in traffic.
GO TO CONTENT
KFV The impact of distraction on driving behaviour in urban traffic | 5655 | KFV The impact of distraction on driving behaviour in urban traffic
Awareness raising
Awareness raising activities are essential to override distracted driving, and corresponding measures
do serve to sensitise drivers to the risks involved. The website www.ab-gelenkt.at for example, which
was developed on behalf of KFV, is an online application for raising awareness of distraction while
driving, the risks involved, and correct behaviour in traffic. The application is addressed at different
target groups (including drivers).
The use of smartphones is now omnipresent, particularly among young drivers. At the same time
young drivers lack driving experience, which increases the dangers of distraction. For this reason,
KFV works with other institutions to develop distraction workshops for young people. In these work-
shops, participants are shown the consequences of distraction and have the opportunity to experience
them first-hand in practical exercises. The aims of the workshops are to impart knowledge, raise awa-
reness and hazard perception, and communicate personal strategies for changing behaviour.
Effective execution of the prohibition of the use of mobile phones while driving
The 32nd Amendment to the Austrian Motor Vehicles Act (KFG-Novelle), which came into force
from June 2016, expanded the ban on phone use while driving and clarified its extent. Henceforth,
any phone use – aside from hands-free phoning and navigating with a phone that is mounted in the
car – is prohibited in Austria. Furthermore, the 34th Amendment to the Austrian Motor Vehicles Act
allows the use of pictures taken by speed cameras, distance measurements, red light radars, and ca-
mera tracking from police cars in the detection of distracted driving, which will increase the efficiency
of enforcement.
GO TO CONTENT
KFV The impact of distraction on driving behaviour in urban traffic | 5857 | KFV The impact of distraction on driving behaviour in urban traffic
REFERENCES Aleksa, M., Aichinger, C., Hahn, M., Harnisch, M., Kaiser, S., Nitsche, P., Rußwurm, K., Winkelbauer, M. (2014)
ORTUNG. Objektive Beurteilung von Navigationssystemen mit Empfehlungen für den Gesetzesgeber
[Objective assessment of navigation systems and recommendations for policy makers], https://www.
bmvit.gv.at/service/publikationen/verkehr/strasse/verkehrssicherheit/vsf/downloads/37_ortung.pdf
Boets, S., Ross, V., Van Belle, G., Vanroelen, G. & Jongen, E. (2015) Effects of texting on driving behaviour of
young drivers in urban traffic. Results of a simulator-based study. Road Safety and Simulation Confe-
rence, Orlando, USA (Oct. 6-8 2015).
Caird, J.K., Johnston, K., Willness, C. & Asbridge, M. (2013) The Use of Meta-analysis or Research Synthesis to
Combine Driving Simulation or Naturalistic Study Results on Driver Distraction. Road Safety and
Simulation Conference, Rome, Italy (Oct. 23-25 2013).
Cuenen, A., Jongen, E.M.M., Brijs, T., Brijs, K., Lutin, M., Van Vlierden, K. & Wets, G. (2015) Does attention ca-
pacity moderate the effect of driver distraction in older drivers? Accident Analysis and Prevention 77
(2015) 12–20.
DaCoTA (2012). Driver distraction, Deliverable 4.8f of the EC FP7 project DaCoTA
Dingus, T.A., Guo, F., Lee S., Antin, J.F., Perez, M., Buchanan-King, M., & Hankey, J. (2016). Driver crash risk
factors and prevalence evaluation using naturalistic driving data. PNAS Early Edition, 113(10), 2636-
2641
Engström, J., Johansson, E. & Ostlund, J. (2005) Effects of visual and cognitive load in real and simulated motor-
way driving. Transportation Research Part F 8 (2005) 97–120.
Farah, H., Zatmeh, S., Toledo, T. (2015) Impact of distracting activities and drivers’ cognitive failures on driving
performance. Road Safety and Simulation Conference, Orlando, Florida, USA (Oct. 6-8 2015).
Fitch, G.M., Soccolich, S.A., Guo, F., McClafferty, J., Fang, Y., Olson, R.L., Perez, M.A., Hanowski, R-J., Hankey,
J.M. & Dingus T.A. (2013) The impact of handheld and hands-free cell phone use on driving perfor-
mance and safety critical event risk. DOT HS 811 757. USA: National Highway Traffic Safety Admi-
nistration.
Holmqvist, K., Nyström, M., Andersson, R., Dewhurst, R., Jarodzka, H. & Van de Weijer, J. (2011). Eye Tracking –
A Comprehensive Guide to Methods and Measures. New York: Oxford University Press.
Jacob, R.J. & Karn, K.S. (2003). Eye Tracking in Human-Computer Interaction and Usability Research: Ready to
Deliver the Promises. In: Hyona, Radach & Deubel, The Mind’s Eye: Cognitive and Applied Aspects of
Eye Movement Research (S. 573-603)
Klauer S.G., Dingus T.A., Neale V.L., Sudweeks J., Ramsey D., The impact of driver inattention on near-crash/crash
risk: An analysis using the 100-car naturalistic driving study data. Washington DC: NHTSA; 2006.
(Technical Report Technical report).
Kircher, K., Ahlström, C., & Kircher, A. (2009). Comparison of two eye-gaze based real-time driver distraction
detection algorithms in a small-scale field operational test. In: Driving assessment 2009: 5th interna-
tional driving symposium on human factors in driving assessment, training and vehicle design. Big
Sky, Montana.
Kircher, A., Vogel, K., Törnros, J., Bolling, A., Nilsson, L., Patten, C., Malmström, T., Ceci, R. (2004) Mobile tele-
phone simulator study. Swedish National Road and Transport Research Institute (VTI), Linköping,
Sweden.
GO TO CONTENT
59 | KFV The impact of distraction on driving behaviour in urban traffic
Kühnelt-Leddihn, A., Bauer, R., Schuster, M., Braun, E. & Hofer, M. (2013) Get Smart. Smartphone Verwendung
und Verkehrssicherheit bei jugendlichen FußgängerInnen und RadfahrerInnen [Smartphone use and
road safety among young pedestrians and cyclists], https://www.bmvit.gv.at/verkehr/strasse/publika-
tionen/sicherheit/vsf/downloads/26_endbericht_getsmart.pdf
McKeever, J.D., Schultheis, M.T., Padmanaban, V. & Blasco, A. (2013) Driver Performance While Texting: Even a
Little is Too Much. Traffic Injury Prevention, 14:2, 132-137, DOI: 10.1080/15389588.2012.699695.
Metz, B. (2009). Worauf achtet der Fahrer? Steuerung der Aufmerksamkeit beim Fahren mit visuellen Nebenauf-
gaben. Dissertation. [What do drivers pay attention to? Controlling driver attention during visual side
tasks. Doctoral Thesis.] Universität Würzburg.
Monk (2013). Driver distraction research and policy: An update from NHTSA. Proceedings of the 3rd International
Conference on Driver Distraction and Inattention. Göteborg.
Nitsche, P., Aichinger, C., Aigner-Breuss, E., Hahn, M., Kaiser, S., Rußwurm, K., Stütz, R. (2014) FAST. Fahrver-
haltensstudien zur Ablenkungsbewertung von Straßeninfrastruktur [Driving Behaviour Studies on
the Impact of Road Infrastructure on Driver Distraction] (2014), http://www.bmvit.gv.at/verkehr/
strasse/sicherheit/fonds/vsf/downloads/33_fast.pdf
Pommer, A., Donabauer, M., Winkelbauer, M., Schneider, F. & Robatsch, K. (2016). KFV- Sicher Leben. Band #1.
100-Car Study Österreich. Wien.
Ramaekers, J. G. (2003). Antidepressants and driver impairment: empirical evidence from a standard on-the-road
test. Journal of Clinical Psychiatry, 64, 20-29.
RoSPA, 2012. Road Safety Information. Fact Sheet: Driver Distraction. Birmingham. Available at: http://www.
rospa.com/road-safety/advice/drivers/distraction/fact-sheet/
Schulz, R. (2012). Blickverhalten und Orientierung von Kraftfahrern auf Landstraßen. Dissertation. [Gaze Be-
haviour and Orientation of Motorists on Regional Roads. Doctoral Thesis.] Technische Universität
Dresden.
Statistics Austria: Road traffic accidents, Available at: http://www.statistik.at/web_en/statistics/EnergyEnviron-
mentInnovationMobility/transport/road/road_traffic_accidents/index.html
SWOV, 2012. SWOV- Fact sheet. Naturalistic Driving: observing everyday driving behaviour. Leidschendam, the
Netherlands, Institute for Road Safety Research. Available at: https://www.swov.nl/sites/default/files/
publicaties/gearchiveerde-factsheet/uk/fs_naturalistic_driving_uk_archived.pdf
SWOV, 2013. SWOV- Fact sheet. Distraction in traffic. Leidschendam, the Netherlands, Institute for Road Safety
Research. Available at: http://www.swov.nl/rapport/Factsheets/UK/FS_Distraction_in_traffic.pdf
Verkehrsunfallstatistik 2013, 2014; Statistik Austria. Available at: http://www.statistik.at/web_de/statistiken/ener-
gie_umwelt_innovation_mobilitaet/verkehr/strasse/unfaelle_mit_personenschaden/index.html
Victor T.W., Harbluk J.L., Engström J. (2005) Sensitivity of eye-movement measures to in-vehicle tasks difficulty.
Transportation Research Part F: Traffic Psychology and Behaviour, 8(2), 167-190
Yannis G., Laiou A., Papantoniou P., Christoforou C. (2014) Impact of texting on young drivers’ behaviour and
safety in urban and rural roads through a simulation experiment. Journal of Safety Research, Vol. 49,
2014, pp.25-31.
GO TO CONTENT
KFV The impact of distraction on driving behaviour in urban traffic | 6261 | KFV The impact of distraction on driving behaviour in urban traffic
APPENDIX 1. Detailed procedure
After arrival, the study was briefly explained to the participants (see Appendix: study information
form), after which they filled out the pre-questionnaire. The different devices required for the expe-
riment were then checked (personal/supplied smartphone/earplugs). The smartphone settings were:
shell case removed, sound off, and display unlocked. The predictive text option was not changed
from the original setting. The participants then did trial runs for text message opening/reading, text
message writing/sending, and answering the phone (with and without earplugs). They also chose
something to eat (a sandwich with cheese or ham) and drink (still, mild or sparkling mineral water)
in the experiment.
They then proceeded to the driving simulator, where the seat position was adjusted, the vehicle ma-
nuals checked, and the eye-tracker configured and calibrated. If the calibration resulted in a mean
angular error below 2° with no central deviations, eye-tracking was included in the experiment.
Each participant first completed two familiarization rides (approx. 10 minutes in total), which also
included a trial of the phone answering task (with earplugs). The first familiarization track consisted
of driving on an empty forest road to practice vehicle handling, speed control, sudden/smooth bra-
king, and accelerating. The aim of the second trial ride was to familiarize the subject with the road and
traffic characteristics for the subsequent tests.
All task devices and supplies (phone, earplug, food, water) were placed on a chair to the right of the
driver (like a passenger seat), and standard start-up instructions were provided by the test leader (see
Appendix). The participants were asked to drive as they would normally drive on a road in simil-
ar circumstances. They then drove the three experimental and control tracks in the predetermined
counterbalanced order. Standard instructions (see Appendix) were provided prior to each test track.
An observation grid (see Appendix) was used by the test leaders to record qualitative information
on how each ride and task was performed and to note any relevant information that could affect the
validity of driving and eye-tracking data in each condition (section). A post-ride questionnaire was
completed after each track.
At the end of the complete experiment, each participant was required to fill out the post-questionnai-
re and received the agreed incentive for participation.
The entire procedure lasted approximately 75 minutes per participant.
GO TO CONTENT
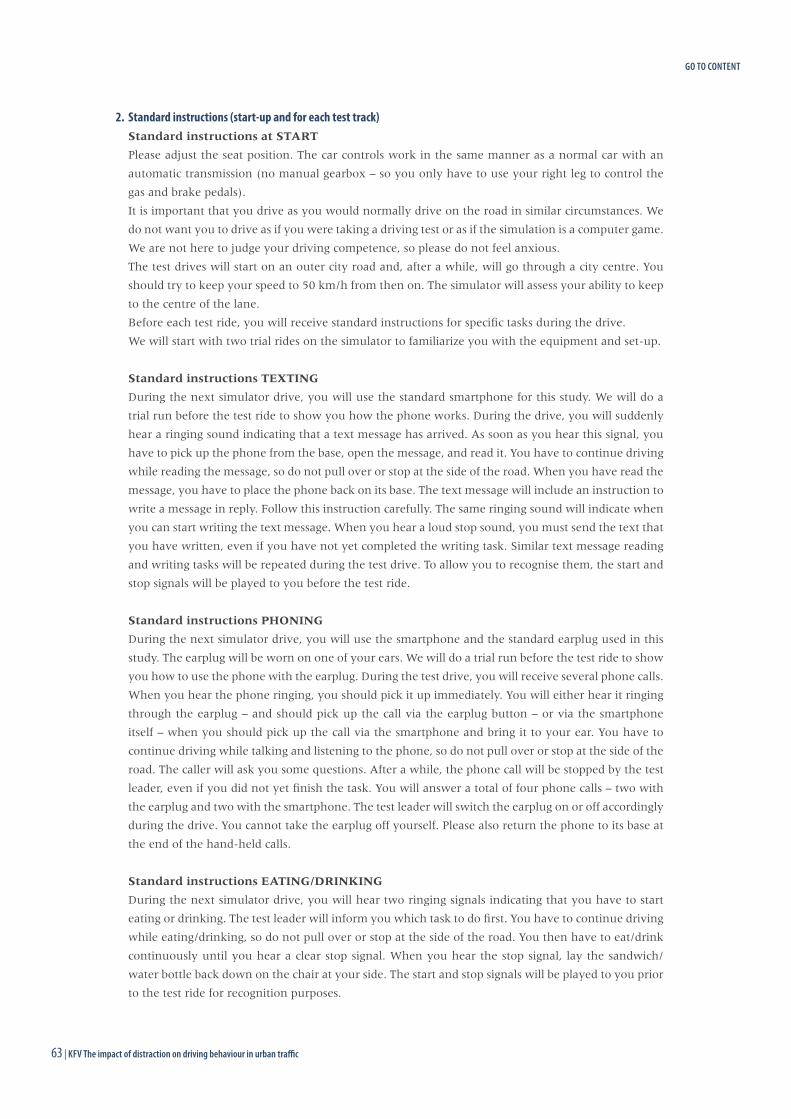
63 | KFV The impact of distraction on driving behaviour in urban traffic
2. Standard instructions (start-up and for each test track) Standard instructions at START
Please adjust the seat position. The car controls work in the same manner as a normal car with an
automatic transmission (no manual gearbox – so you only have to use your right leg to control the
gas and brake pedals).
It is important that you drive as you would normally drive on the road in similar circumstances. We
do not want you to drive as if you were taking a driving test or as if the simulation is a computer game.
We are not here to judge your driving competence, so please do not feel anxious.
The test drives will start on an outer city road and, after a while, will go through a city centre. You
should try to keep your speed to 50 km/h from then on. The simulator will assess your ability to keep
to the centre of the lane.
Before each test ride, you will receive standard instructions for specific tasks during the drive.
We will start with two trial rides on the simulator to familiarize you with the equipment and set-up.
Standard instructions TEXTING
During the next simulator drive, you will use the standard smartphone for this study. We will do a
trial run before the test ride to show you how the phone works. During the drive, you will suddenly
hear a ringing sound indicating that a text message has arrived. As soon as you hear this signal, you
have to pick up the phone from the base, open the message, and read it. You have to continue driving
while reading the message, so do not pull over or stop at the side of the road. When you have read the
message, you have to place the phone back on its base. The text message will include an instruction to
write a message in reply. Follow this instruction carefully. The same ringing sound will indicate when
you can start writing the text message. When you hear a loud stop sound, you must send the text that
you have written, even if you have not yet completed the writing task. Similar text message reading
and writing tasks will be repeated during the test drive. To allow you to recognise them, the start and
stop signals will be played to you before the test ride.
Standard instructions PHONING
During the next simulator drive, you will use the smartphone and the standard earplug used in this
study. The earplug will be worn on one of your ears. We will do a trial run before the test ride to show
you how to use the phone with the earplug. During the test drive, you will receive several phone calls.
When you hear the phone ringing, you should pick it up immediately. You will either hear it ringing
through the earplug – and should pick up the call via the earplug button – or via the smartphone
itself – when you should pick up the call via the smartphone and bring it to your ear. You have to
continue driving while talking and listening to the phone, so do not pull over or stop at the side of the
road. The caller will ask you some questions. After a while, the phone call will be stopped by the test
leader, even if you did not yet finish the task. You will answer a total of four phone calls – two with
the earplug and two with the smartphone. The test leader will switch the earplug on or off accordingly
during the drive. You cannot take the earplug off yourself. Please also return the phone to its base at
the end of the hand-held calls.
Standard instructions EATING/DRINKING
During the next simulator drive, you will hear two ringing signals indicating that you have to start
eating or drinking. The test leader will inform you which task to do first. You have to continue driving
while eating/drinking, so do not pull over or stop at the side of the road. You then have to eat/drink
continuously until you hear a clear stop signal. When you hear the stop signal, lay the sandwich/
water bottle back down on the chair at your side. The start and stop signals will be played to you prior
to the test ride for recognition purposes.
GO TO CONTENT
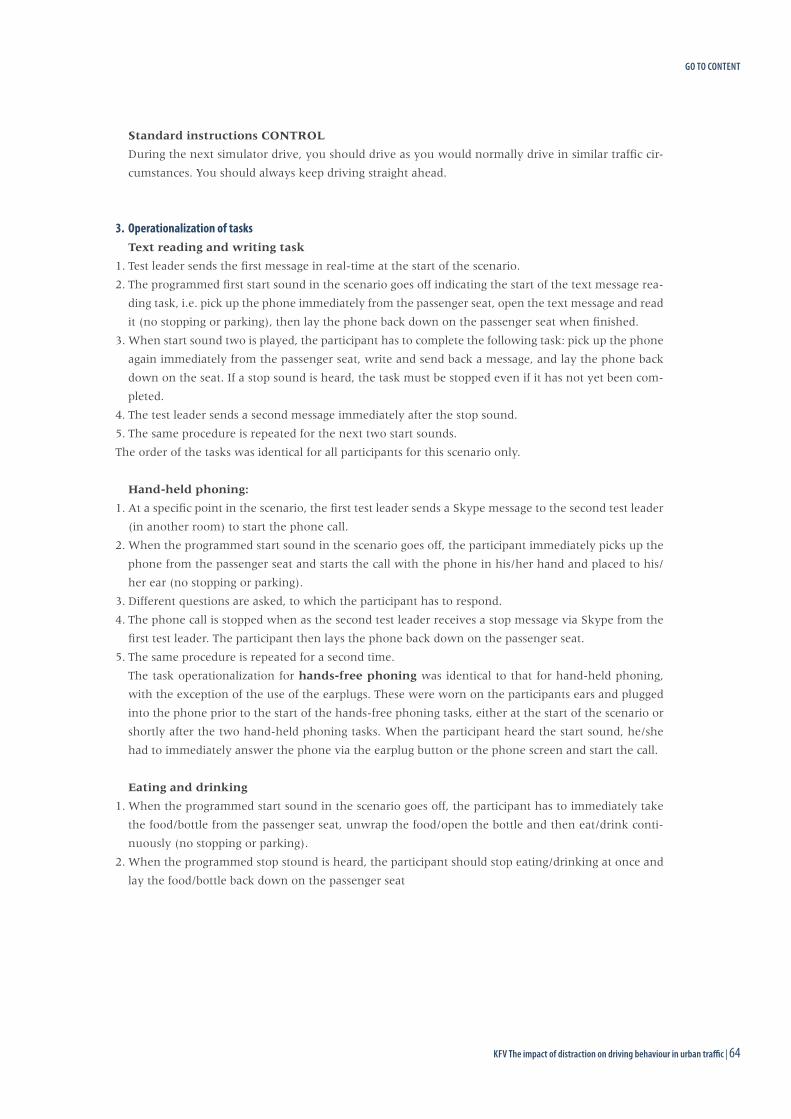
KFV The impact of distraction on driving behaviour in urban traffic | 6463 | KFV The impact of distraction on driving behaviour in urban traffic
Standard instructions CONTROL
During the next simulator drive, you should drive as you would normally drive in similar traffic cir-
cumstances. You should always keep driving straight ahead.
3. Operationalization of tasksText reading and writing task
1. Test leader sends the first message in real-time at the start of the scenario.
2. The programmed first start sound in the scenario goes off indicating the start of the text message rea-
ding task, i.e. pick up the phone immediately from the passenger seat, open the text message and read
it (no stopping or parking), then lay the phone back down on the passenger seat when finished.
3. When start sound two is played, the participant has to complete the following task: pick up the phone
again immediately from the passenger seat, write and send back a message, and lay the phone back
down on the seat. If a stop sound is heard, the task must be stopped even if it has not yet been com-
pleted.
4. The test leader sends a second message immediately after the stop sound.
5. The same procedure is repeated for the next two start sounds.
The order of the tasks was identical for all participants for this scenario only.
Hand-held phoning:
1. At a specific point in the scenario, the first test leader sends a Skype message to the second test leader
(in another room) to start the phone call.
2. When the programmed start sound in the scenario goes off, the participant immediately picks up the
phone from the passenger seat and starts the call with the phone in his/her hand and placed to his/
her ear (no stopping or parking).
3. Different questions are asked, to which the participant has to respond.
4. The phone call is stopped when as the second test leader receives a stop message via Skype from the
first test leader. The participant then lays the phone back down on the passenger seat.
5. The same procedure is repeated for a second time.
The task operationalization for hands-free phoning was identical to that for hand-held phoning,
with the exception of the use of the earplugs. These were worn on the participants ears and plugged
into the phone prior to the start of the hands-free phoning tasks, either at the start of the scenario or
shortly after the two hand-held phoning tasks. When the participant heard the start sound, he/she
had to immediately answer the phone via the earplug button or the phone screen and start the call.
Eating and drinking
1. When the programmed start sound in the scenario goes off, the participant has to immediately take
the food/bottle from the passenger seat, unwrap the food/open the bottle and then eat/drink conti-
nuously (no stopping or parking).
2. When the programmed stop stound is heard, the participant should stop eating/drinking at once and
lay the food/bottle back down on the passenger seat
GO TO CONTENT
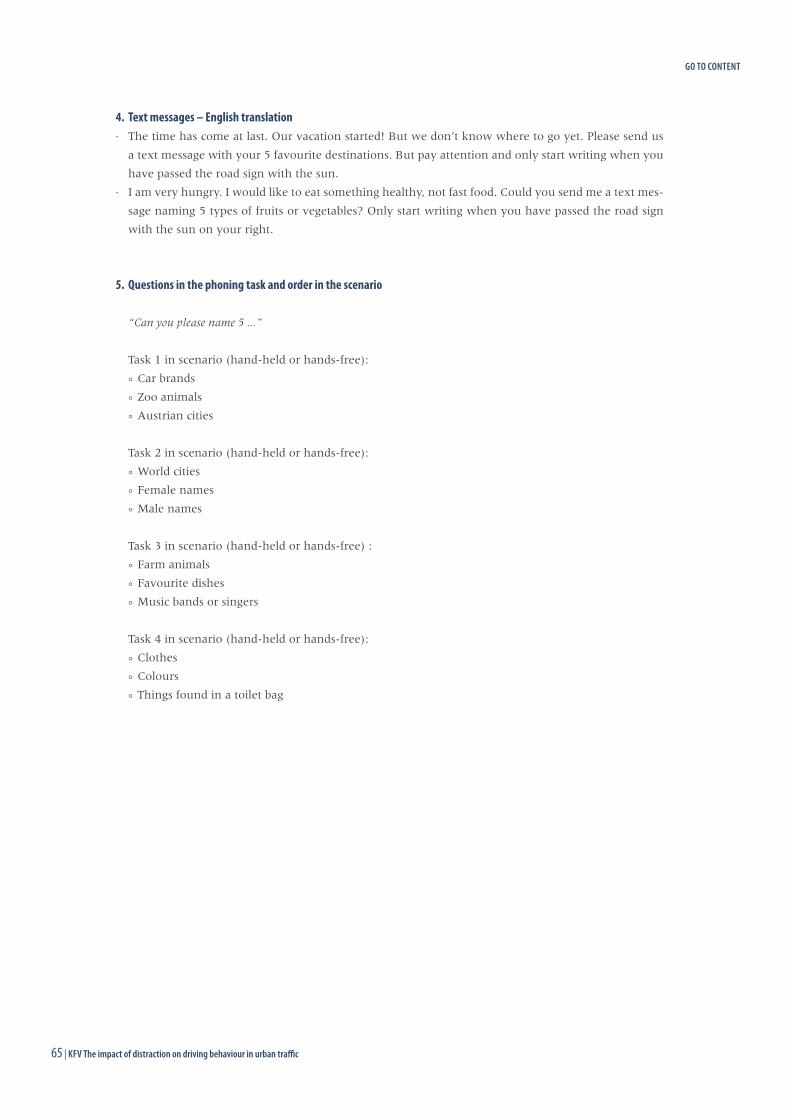
65 | KFV The impact of distraction on driving behaviour in urban traffic
4. Text messages – English translation· The time has come at last. Our vacation started! But we don’t know where to go yet. Please send us
a text message with your 5 favourite destinations. But pay attention and only start writing when you
have passed the road sign with the sun.
· I am very hungry. I would like to eat something healthy, not fast food. Could you send me a text mes-
sage naming 5 types of fruits or vegetables? Only start writing when you have passed the road sign
with the sun on your right.
5. Questions in the phoning task and order in the scenario
“Can you please name 5 ...”
Task 1 in scenario (hand-held or hands-free):
° Car brands
° Zoo animals
° Austrian cities
Task 2 in scenario (hand-held or hands-free):
° World cities
° Female names
° Male names
Task 3 in scenario (hand-held or hands-free) :
° Farm animals
° Favourite dishes
° Music bands or singers
Task 4 in scenario (hand-held or hands-free):
° Clothes
° Colours
° Things found in a toilet bag
GO TO CONTENT
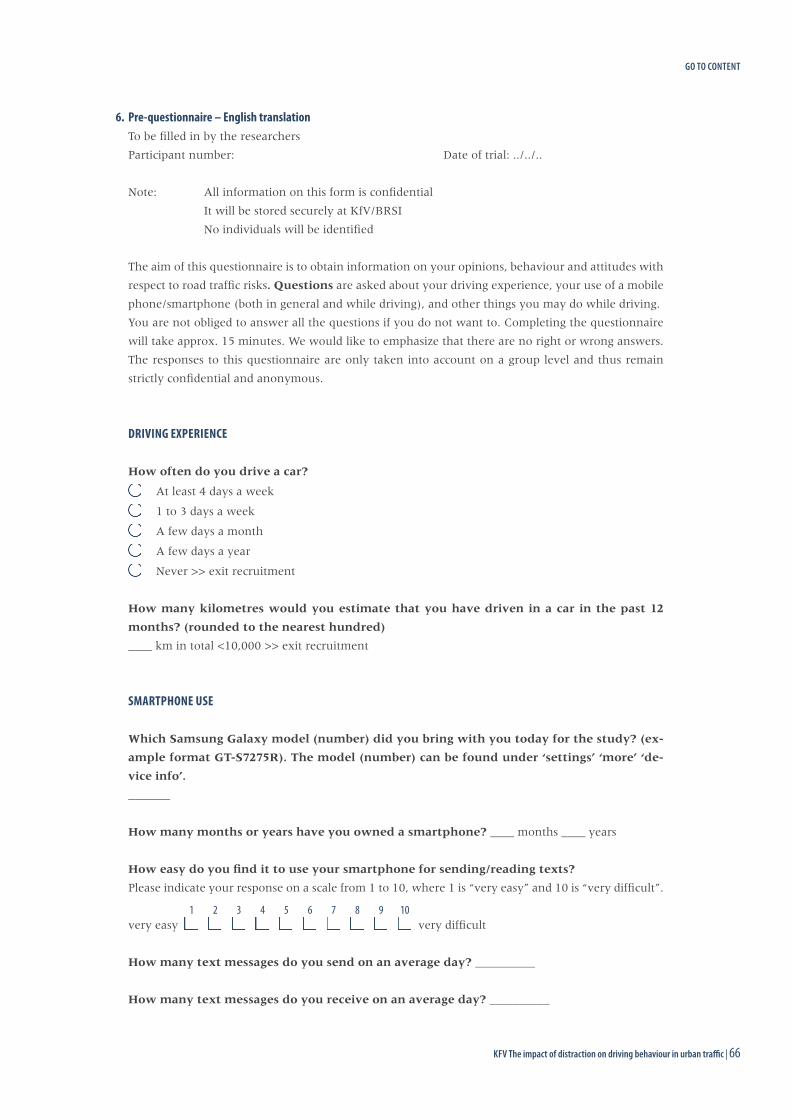
KFV The impact of distraction on driving behaviour in urban traffic | 6665 | KFV The impact of distraction on driving behaviour in urban traffic
6. Pre-questionnaire – English translationTo be filled in by the researchers
Participant number: Date of trial: ../../..
Note: All information on this form is confidential
It will be stored securely at KfV/BRSI
No individuals will be identified
The aim of this questionnaire is to obtain information on your opinions, behaviour and attitudes with
respect to road traffic risks. Questions are asked about your driving experience, your use of a mobile
phone/smartphone (both in general and while driving), and other things you may do while driving.
You are not obliged to answer all the questions if you do not want to. Completing the questionnaire
will take approx. 15 minutes. We would like to emphasize that there are no right or wrong answers.
The responses to this questionnaire are only taken into account on a group level and thus remain
strictly confidential and anonymous.
DRIVING EXPERIENCE
How often do you drive a car?
At least 4 days a week
1 to 3 days a week
A few days a month
A few days a year
Never >> exit recruitment
How many kilometres would you estimate that you have driven in a car in the past 12
months? (rounded to the nearest hundred)
____ km in total <10,000 >> exit recruitment
SMARTPHONE USE
Which Samsung Galaxy model (number) did you bring with you today for the study? (ex-
ample format GT-S7275R). The model (number) can be found under ‘settings’ ‘more’ ‘de-
vice info’.
_______
How many months or years have you owned a smartphone? ____ months ____ years
How easy do you find it to use your smartphone for sending/reading texts?
Please indicate your response on a scale from 1 to 10, where 1 is “very easy” and 10 is “very difficult”.
very easy 1
2
3
4
5
6
7
8
9
10
very difficult
How many text messages do you send on an average day? __________
How many text messages do you receive on an average day? __________
GO TO CONTENT
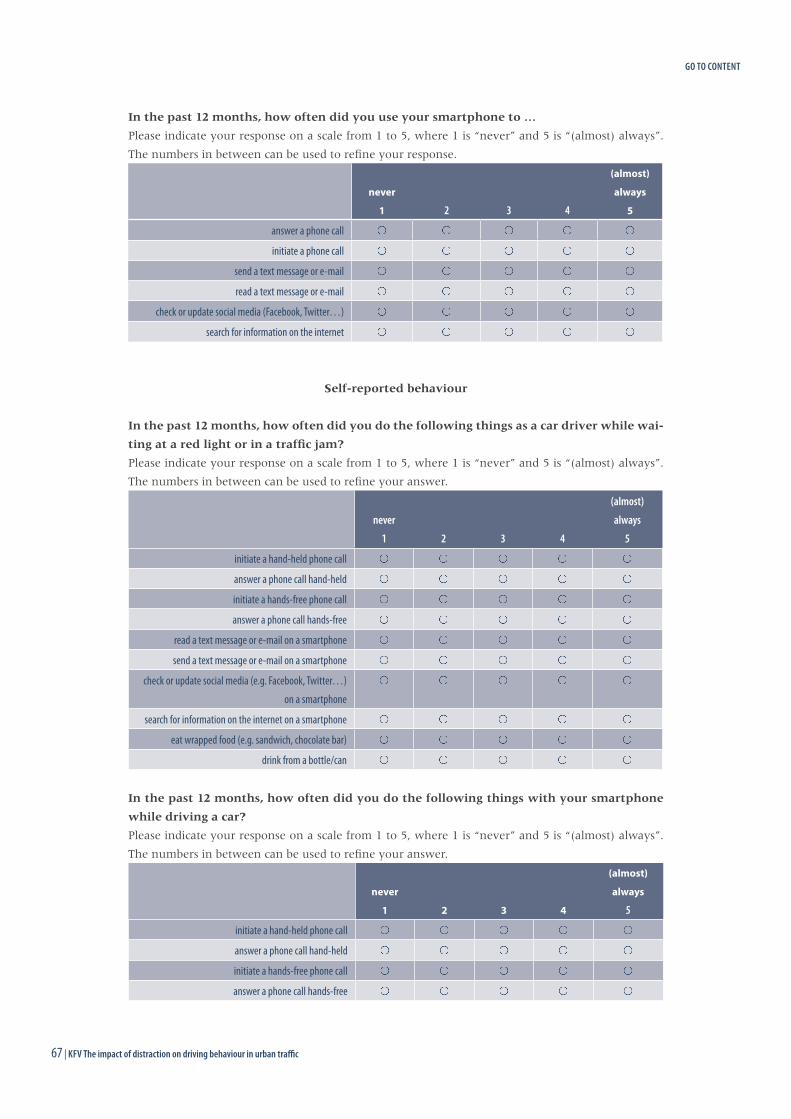
67 | KFV The impact of distraction on driving behaviour in urban traffic
In the past 12 months, how often did you use your smartphone to …
Please indicate your response on a scale from 1 to 5, where 1 is “never” and 5 is “(almost) always”.
The numbers in between can be used to refine your response.
never
1 2 3 4
(almost)
always
5
answer a phone call
initiate a phone call
send a text message or e-mail
read a text message or e-mail
check or update social media (Facebook, Twitter…)
search for information on the internet
Self-reported behaviour
In the past 12 months, how often did you do the following things as a car driver while wai-
ting at a red light or in a traffic jam?
Please indicate your response on a scale from 1 to 5, where 1 is “never” and 5 is “(almost) always”.
The numbers in between can be used to refine your answer.
never
1 2 3 4
(almost)
always
5
initiate a hand-held phone call
answer a phone call hand-held
initiate a hands-free phone call
answer a phone call hands-free
read a text message or e-mail on a smartphone
send a text message or e-mail on a smartphone
check or update social media (e.g. Facebook, Twitter…) on a smartphone
search for information on the internet on a smartphone
eat wrapped food (e.g. sandwich, chocolate bar)
drink from a bottle/can
In the past 12 months, how often did you do the following things with your smartphone
while driving a car?
Please indicate your response on a scale from 1 to 5, where 1 is “never” and 5 is “(almost) always”.
The numbers in between can be used to refine your answer.
never
1 2 3 4
(almost)
always
5
initiate a hand-held phone call
answer a phone call hand-held
initiate a hands-free phone call
answer a phone call hands-free
GO TO CONTENT
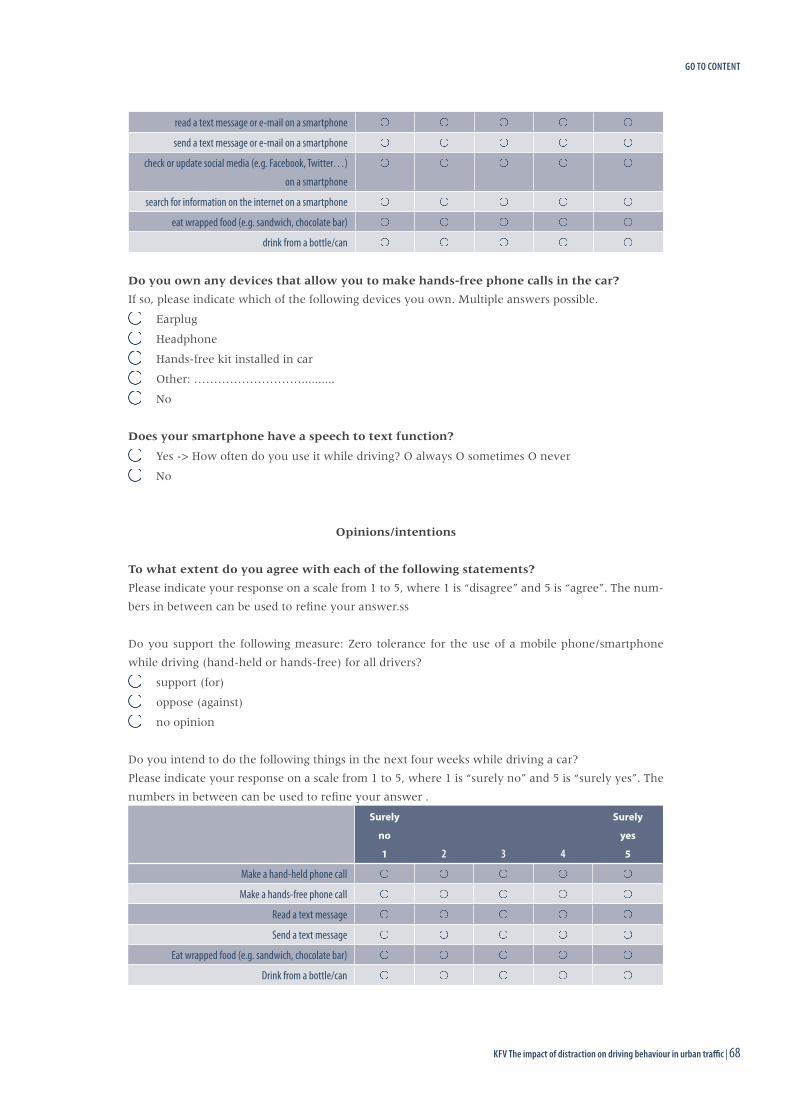
KFV The impact of distraction on driving behaviour in urban traffic | 6867 | KFV The impact of distraction on driving behaviour in urban traffic
read a text message or e-mail on a smartphone
send a text message or e-mail on a smartphone
check or update social media (e.g. Facebook, Twitter…) on a smartphone
search for information on the internet on a smartphone
eat wrapped food (e.g. sandwich, chocolate bar)
drink from a bottle/can
Do you own any devices that allow you to make hands-free phone calls in the car?
If so, please indicate which of the following devices you own. Multiple answers possible.
Earplug
Headphone
Hands-free kit installed in car
Other: ………………………..........
No
Does your smartphone have a speech to text function?
Yes -> How often do you use it while driving? O always O sometimes O never
No
Opinions/intentions
To what extent do you agree with each of the following statements?
Please indicate your response on a scale from 1 to 5, where 1 is “disagree” and 5 is “agree”. The num-
bers in between can be used to refine your answer.ss
Do you support the following measure: Zero tolerance for the use of a mobile phone/smartphone
while driving (hand-held or hands-free) for all drivers?
support (for)
oppose (against)
no opinion
Do you intend to do the following things in the next four weeks while driving a car?
Please indicate your response on a scale from 1 to 5, where 1 is “surely no” and 5 is “surely yes”. The
numbers in between can be used to refine your answer .
Surely
no
1 2 3 4
Surely
yes
5
Make a hand-held phone call
Make a hands-free phone call
Read a text message
Send a text message
Eat wrapped food (e.g. sandwich, chocolate bar)
Drink from a bottle/can
GO TO CONTENT
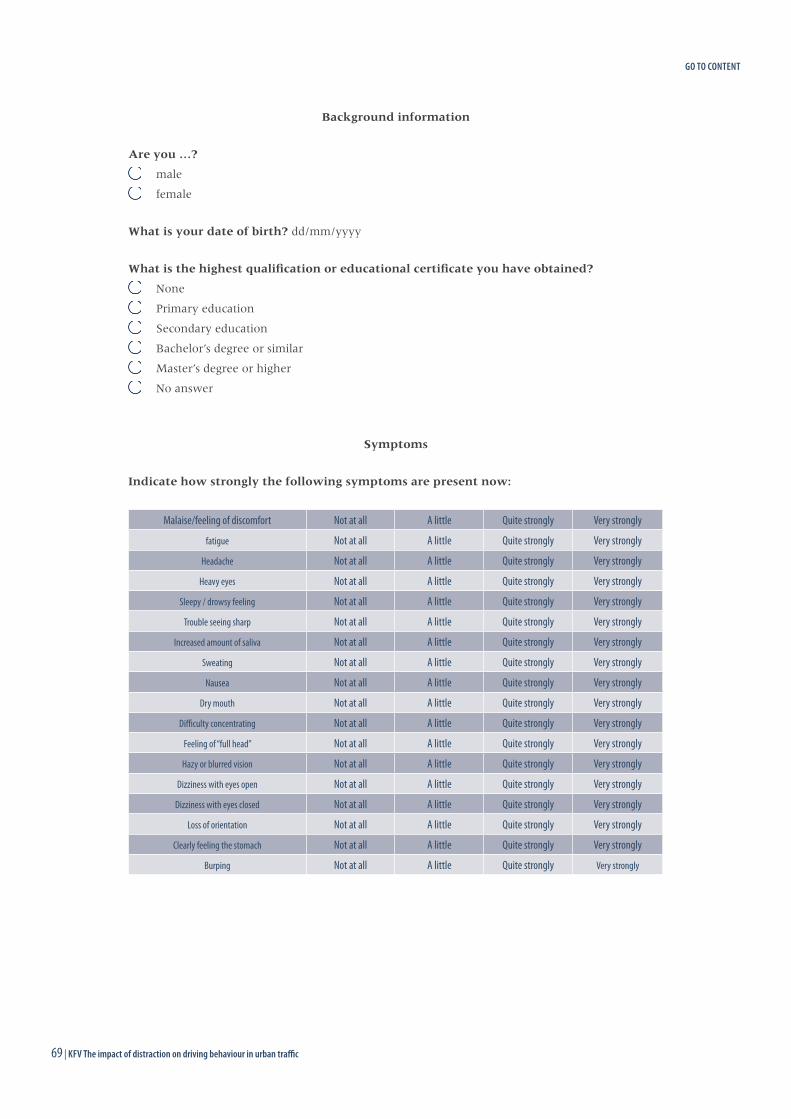
69 | KFV The impact of distraction on driving behaviour in urban traffic
Background information
Are you …?
male
female
What is your date of birth? dd/mm/yyyy
What is the highest qualification or educational certificate you have obtained?
None
Primary education
Secondary education
Bachelor’s degree or similar
Master’s degree or higher
No answer
Symptoms
Indicate how strongly the following symptoms are present now:
Malaise/feeling of discomfort Not at all A little Quite strongly Very strongly
fatigue Not at all A little Quite strongly Very strongly
Headache Not at all A little Quite strongly Very strongly
Heavy eyes Not at all A little Quite strongly Very strongly
Sleepy / drowsy feeling Not at all A little Quite strongly Very strongly
Trouble seeing sharp Not at all A little Quite strongly Very strongly
Increased amount of saliva Not at all A little Quite strongly Very strongly
Sweating Not at all A little Quite strongly Very strongly
Nausea Not at all A little Quite strongly Very strongly
Dry mouth Not at all A little Quite strongly Very strongly
Difficulty concentrating Not at all A little Quite strongly Very strongly
Feeling of “full head” Not at all A little Quite strongly Very strongly
Hazy or blurred vision Not at all A little Quite strongly Very strongly
Dizziness with eyes open Not at all A little Quite strongly Very strongly
Dizziness with eyes closed Not at all A little Quite strongly Very strongly
Loss of orientation Not at all A little Quite strongly Very strongly
Clearly feeling the stomach Not at all A little Quite strongly Very strongly
Burping Not at all A little Quite strongly Very strongly
GO TO CONTENT
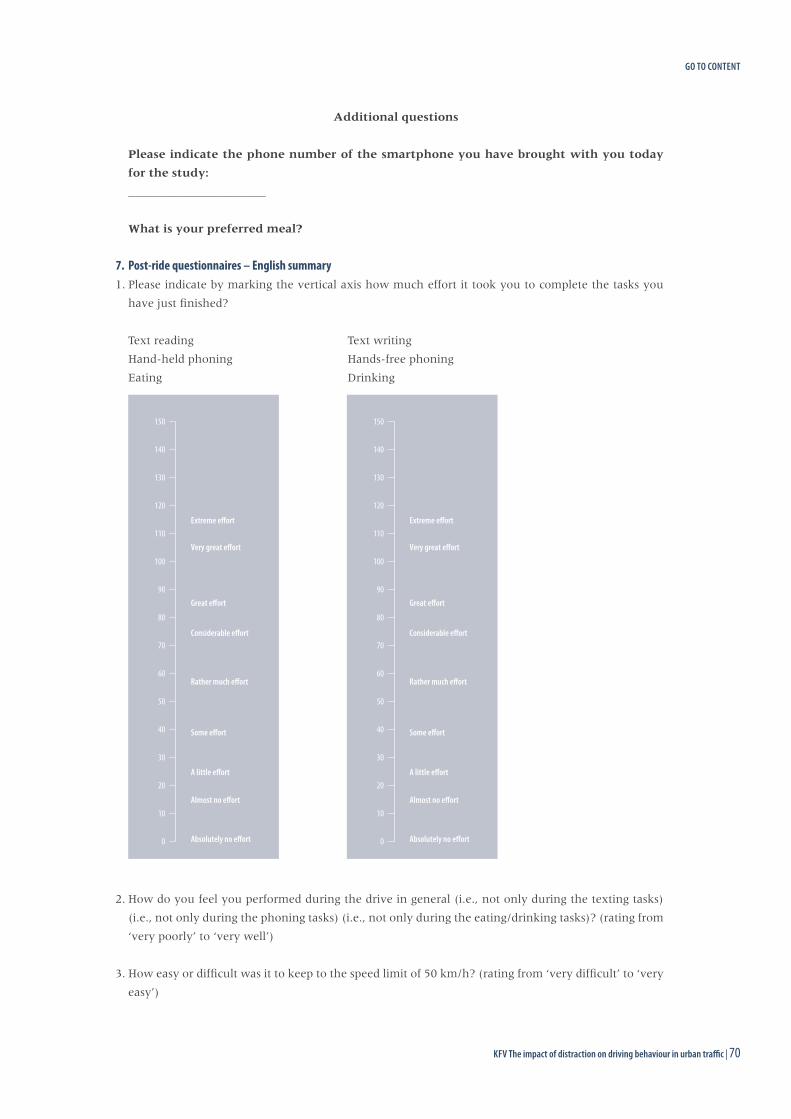
KFV The impact of distraction on driving behaviour in urban traffic | 7069 | KFV The impact of distraction on driving behaviour in urban traffic
Additional questions
Please indicate the phone number of the smartphone you have brought with you today
for the study:
_______________________
What is your preferred meal?
7. Post-ride questionnaires – English summary1. Please indicate by marking the vertical axis how much effort it took you to complete the tasks you
have just finished?
Text reading Text writing
Hand-held phoning Hands-free phoning
Eating Drinking
2. How do you feel you performed during the drive in general (i.e., not only during the texting tasks)
(i.e., not only during the phoning tasks) (i.e., not only during the eating/drinking tasks)? (rating from
‘very poorly’ to ‘very well’)
3. How easy or difficult was it to keep to the speed limit of 50 km/h? (rating from ‘very difficult’ to ‘very
easy’)
150
140
130
120
Extreme effort
Very great effort
Great effort
Considerable effort
Rather much effort
Some effort
A little effort
Almost no effort
Absolutely no effort
110
100
90
80
70
60
50
40
30
20
10
0
150
140
130
120
Extreme effort
Very great effort
Great effort
Considerable effort
Rather much effort
Some effort
A little effort
Almost no effort
Absolutely no effort
110
100
90
80
70
60
50
40
30
20
10
0
GO TO CONTENT
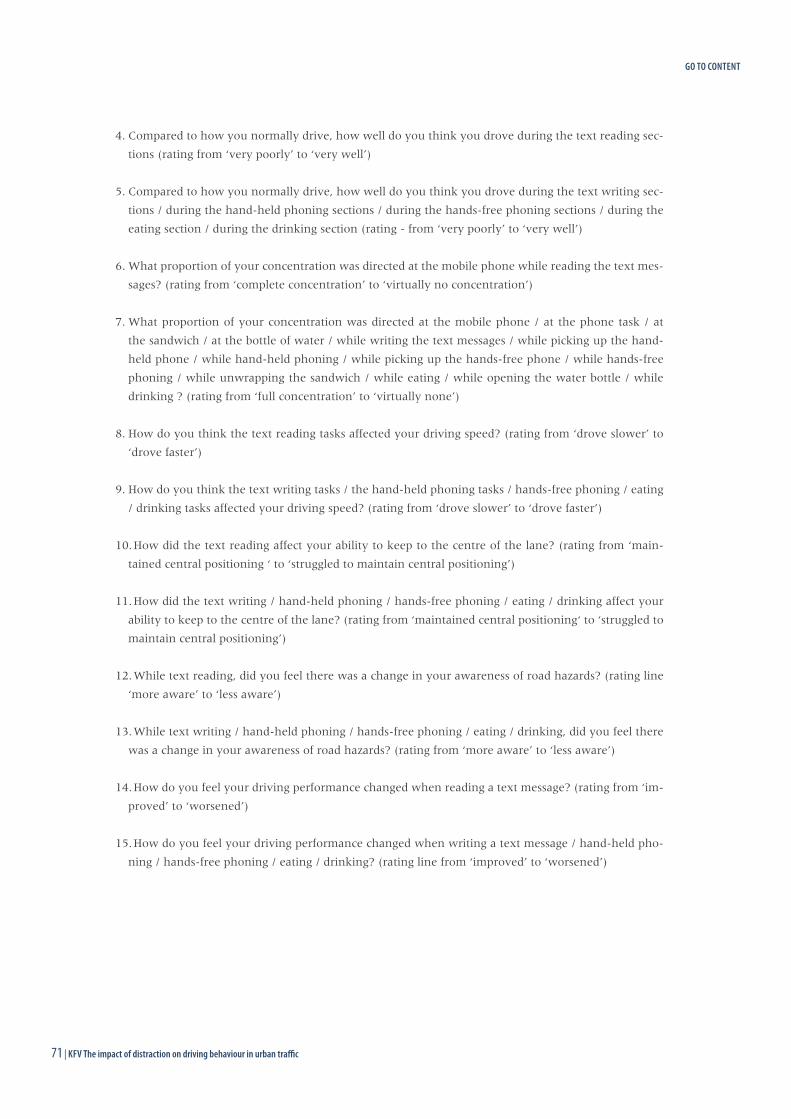
71 | KFV The impact of distraction on driving behaviour in urban traffic
4. Compared to how you normally drive, how well do you think you drove during the text reading sec-
tions (rating from ‘very poorly’ to ‘very well’)
5. Compared to how you normally drive, how well do you think you drove during the text writing sec-
tions / during the hand-held phoning sections / during the hands-free phoning sections / during the
eating section / during the drinking section (rating - from ‘very poorly’ to ‘very well’)
6. What proportion of your concentration was directed at the mobile phone while reading the text mes-
sages? (rating from ‘complete concentration’ to ‘virtually no concentration’)
7. What proportion of your concentration was directed at the mobile phone / at the phone task / at
the sandwich / at the bottle of water / while writing the text messages / while picking up the hand-
held phone / while hand-held phoning / while picking up the hands-free phone / while hands-free
phoning / while unwrapping the sandwich / while eating / while opening the water bottle / while
drinking ? (rating from ‘full concentration’ to ‘virtually none’)
8. How do you think the text reading tasks affected your driving speed? (rating from ‘drove slower’ to
‘drove faster’)
9. How do you think the text writing tasks / the hand-held phoning tasks / hands-free phoning / eating
/ drinking tasks affected your driving speed? (rating from ‘drove slower’ to ‘drove faster’)
10. How did the text reading affect your ability to keep to the centre of the lane? (rating from ‘main-
tained central positioning ‘ to ‘struggled to maintain central positioning’)
11. How did the text writing / hand-held phoning / hands-free phoning / eating / drinking affect your
ability to keep to the centre of the lane? (rating from ‘maintained central positioning‘ to ‘struggled to
maintain central positioning’)
12. While text reading, did you feel there was a change in your awareness of road hazards? (rating line
‘more aware’ to ‘less aware’)
13. While text writing / hand-held phoning / hands-free phoning / eating / drinking, did you feel there
was a change in your awareness of road hazards? (rating from ‘more aware’ to ‘less aware’)
14. How do you feel your driving performance changed when reading a text message? (rating from ‘im-
proved’ to ‘worsened’)
15. How do you feel your driving performance changed when writing a text message / hand-held pho-
ning / hands-free phoning / eating / drinking? (rating line from ‘improved’ to ‘worsened’)
GO TO CONTENT
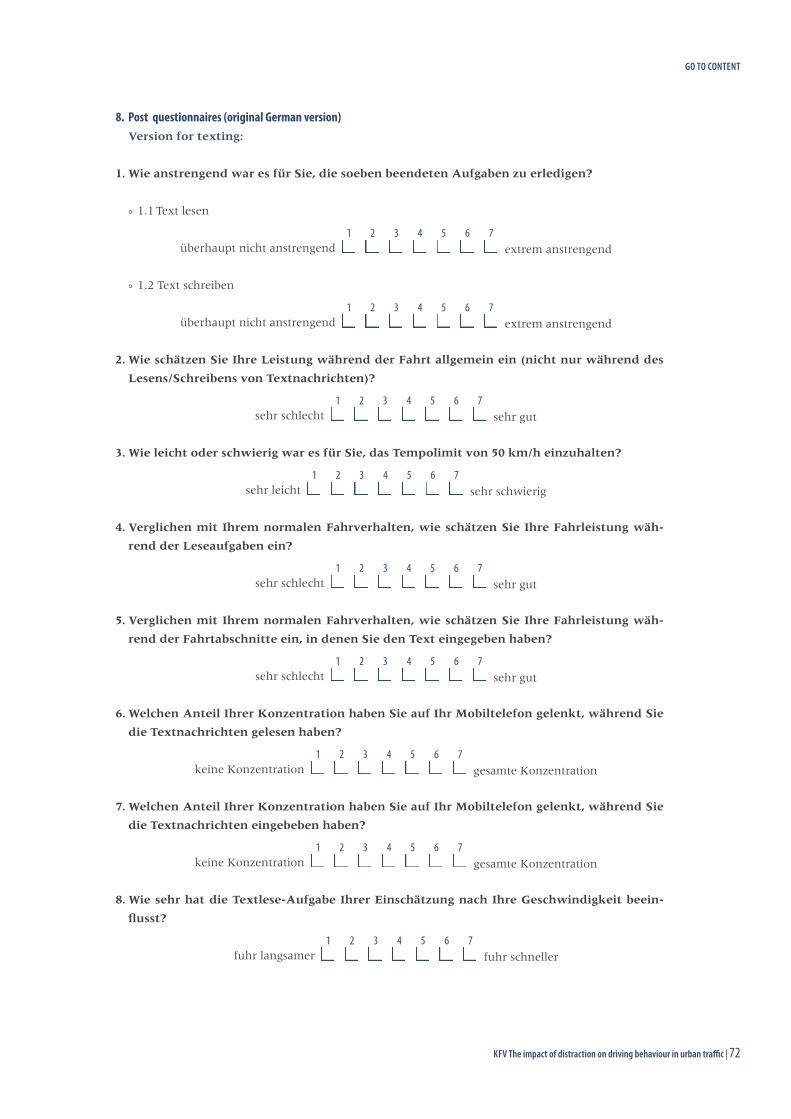
KFV The impact of distraction on driving behaviour in urban traffic | 7271 | KFV The impact of distraction on driving behaviour in urban traffic
8. Post questionnaires (original German version) Version for texting:
1. Wie anstrengend war es für Sie, die soeben beendeten Aufgaben zu erledigen?
° 1.1 Text lesen
überhaupt nicht anstrengend 1
2
3
4
5
6
7
extrem anstrengend
° 1.2 Text schreiben
überhaupt nicht anstrengend 1
2
3
4
5
6
7
extrem anstrengend
2. Wie schätzen Sie Ihre Leistung während der Fahrt allgemein ein (nicht nur während des
Lesens/Schreibens von Textnachrichten)?
sehr schlecht 1
2
3
4
5
6
7
sehr gut
3. Wie leicht oder schwierig war es für Sie, das Tempolimit von 50 km/h einzuhalten?
sehr leicht 1
2
3
4
5
6
7
sehr schwierig
4. Verglichen mit Ihrem normalen Fahrverhalten, wie schätzen Sie Ihre Fahrleistung wäh-
rend der Leseaufgaben ein?
sehr schlecht 1
2
3
4
5
6
7
sehr gut
5. Verglichen mit Ihrem normalen Fahrverhalten, wie schätzen Sie Ihre Fahrleistung wäh-
rend der Fahrtabschnitte ein, in denen Sie den Text eingegeben haben?
sehr schlecht 1
2
3
4
5
6
7
sehr gut
6. Welchen Anteil Ihrer Konzentration haben Sie auf Ihr Mobiltelefon gelenkt, während Sie
die Textnachrichten gelesen haben?
keine Konzentration 1
2
3
4
5
6
7
gesamte Konzentration
7. Welchen Anteil Ihrer Konzentration haben Sie auf Ihr Mobiltelefon gelenkt, während Sie
die Textnachrichten eingebeben haben?
keine Konzentration 1
2
3
4
5
6
7
gesamte Konzentration
8. Wie sehr hat die Textlese-Aufgabe Ihrer Einschätzung nach Ihre Geschwindigkeit beein-
flusst?
fuhr langsamer 1
2
3
4
5
6
7
fuhr schneller
GO TO CONTENT
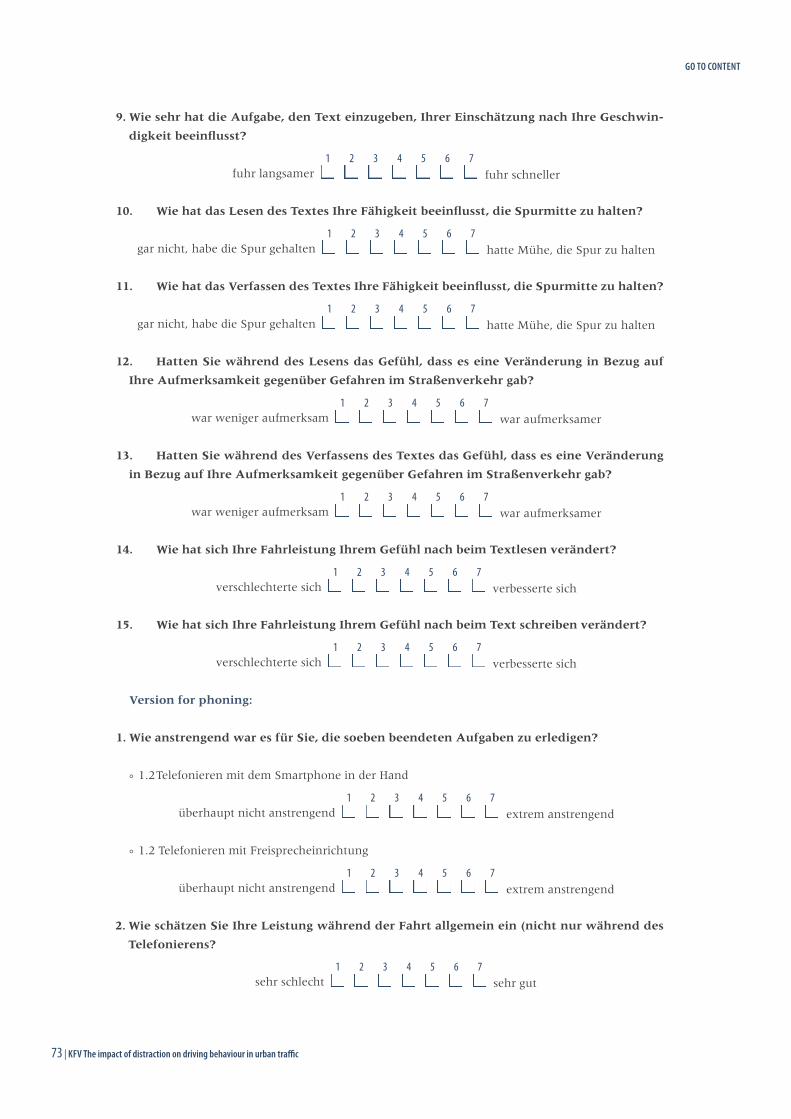
73 | KFV The impact of distraction on driving behaviour in urban traffic
9. Wie sehr hat die Aufgabe, den Text einzugeben, Ihrer Einschätzung nach Ihre Geschwin-
digkeit beeinflusst?
fuhr langsamer 1
2
3
4
5
6
7
fuhr schneller
10. Wie hat das Lesen des Textes Ihre Fähigkeit beeinflusst, die Spurmitte zu halten?
gar nicht, habe die Spur gehalten 1
2
3
4
5
6
7
hatte Mühe, die Spur zu halten
11. Wie hat das Verfassen des Textes Ihre Fähigkeit beeinflusst, die Spurmitte zu halten?
gar nicht, habe die Spur gehalten 1
2
3
4
5
6
7
hatte Mühe, die Spur zu halten
12. Hatten Sie während des Lesens das Gefühl, dass es eine Veränderung in Bezug auf
Ihre Aufmerksamkeit gegenüber Gefahren im Straßenverkehr gab?
war weniger aufmerksam 1
2
3
4
5
6
7
war aufmerksamer
13. Hatten Sie während des Verfassens des Textes das Gefühl, dass es eine Veränderung
in Bezug auf Ihre Aufmerksamkeit gegenüber Gefahren im Straßenverkehr gab?
war weniger aufmerksam 1
2
3
4
5
6
7
war aufmerksamer
14. Wie hat sich Ihre Fahrleistung Ihrem Gefühl nach beim Textlesen verändert?
verschlechterte sich 1
2
3
4
5
6
7
verbesserte sich
15. Wie hat sich Ihre Fahrleistung Ihrem Gefühl nach beim Text schreiben verändert?
verschlechterte sich 1
2
3
4
5
6
7
verbesserte sich
Version for phoning:
1. Wie anstrengend war es für Sie, die soeben beendeten Aufgaben zu erledigen?
° 1.2 Telefonieren mit dem Smartphone in der Hand
überhaupt nicht anstrengend 1
2
3
4
5
6
7
extrem anstrengend
° 1.2 Telefonieren mit Freisprecheinrichtung
überhaupt nicht anstrengend 1
2
3
4
5
6
7
extrem anstrengend
2. Wie schätzen Sie Ihre Leistung während der Fahrt allgemein ein (nicht nur während des
Telefonierens?
sehr schlecht 1
2
3
4
5
6
7
sehr gut
GO TO CONTENT
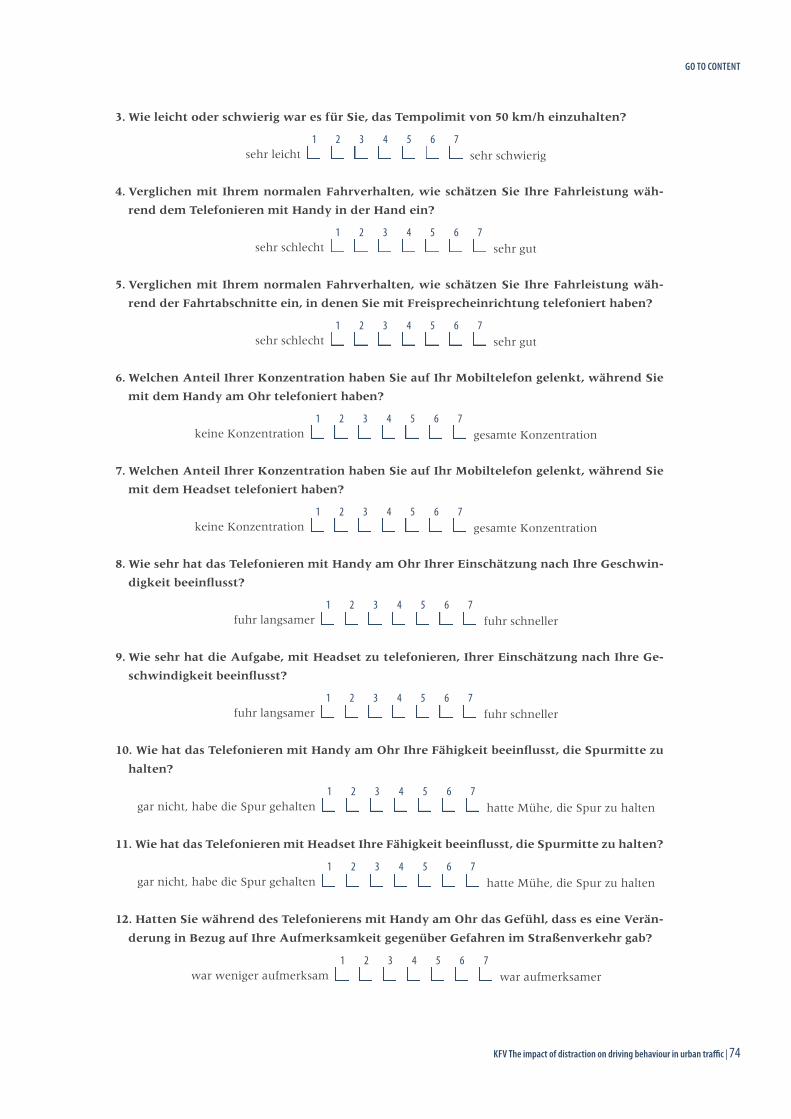
KFV The impact of distraction on driving behaviour in urban traffic | 7473 | KFV The impact of distraction on driving behaviour in urban traffic
3. Wie leicht oder schwierig war es für Sie, das Tempolimit von 50 km/h einzuhalten?
sehr leicht 1
2
3
4
5
6
7
sehr schwierig
4. Verglichen mit Ihrem normalen Fahrverhalten, wie schätzen Sie Ihre Fahrleistung wäh-
rend dem Telefonieren mit Handy in der Hand ein?
sehr schlecht 1
2
3
4
5
6
7
sehr gut
5. Verglichen mit Ihrem normalen Fahrverhalten, wie schätzen Sie Ihre Fahrleistung wäh-
rend der Fahrtabschnitte ein, in denen Sie mit Freisprecheinrichtung telefoniert haben?
sehr schlecht 1
2
3
4
5
6
7
sehr gut
6. Welchen Anteil Ihrer Konzentration haben Sie auf Ihr Mobiltelefon gelenkt, während Sie
mit dem Handy am Ohr telefoniert haben?
keine Konzentration 1
2
3
4
5
6
7
gesamte Konzentration
7. Welchen Anteil Ihrer Konzentration haben Sie auf Ihr Mobiltelefon gelenkt, während Sie
mit dem Headset telefoniert haben?
keine Konzentration 1
2
3
4
5
6
7
gesamte Konzentration
8. Wie sehr hat das Telefonieren mit Handy am Ohr Ihrer Einschätzung nach Ihre Geschwin-
digkeit beeinflusst?
fuhr langsamer 1
2
3
4
5
6
7
fuhr schneller
9. Wie sehr hat die Aufgabe, mit Headset zu telefonieren, Ihrer Einschätzung nach Ihre Ge-
schwindigkeit beeinflusst?
fuhr langsamer 1
2
3
4
5
6
7
fuhr schneller
10. Wie hat das Telefonieren mit Handy am Ohr Ihre Fähigkeit beeinflusst, die Spurmitte zu
halten?
gar nicht, habe die Spur gehalten 1
2
3
4
5
6
7
hatte Mühe, die Spur zu halten
11. Wie hat das Telefonieren mit Headset Ihre Fähigkeit beeinflusst, die Spurmitte zu halten?
gar nicht, habe die Spur gehalten 1
2
3
4
5
6
7
hatte Mühe, die Spur zu halten
12. Hatten Sie während des Telefonierens mit Handy am Ohr das Gefühl, dass es eine Verän-
derung in Bezug auf Ihre Aufmerksamkeit gegenüber Gefahren im Straßenverkehr gab?
war weniger aufmerksam 1
2
3
4
5
6
7
war aufmerksamer
GO TO CONTENT
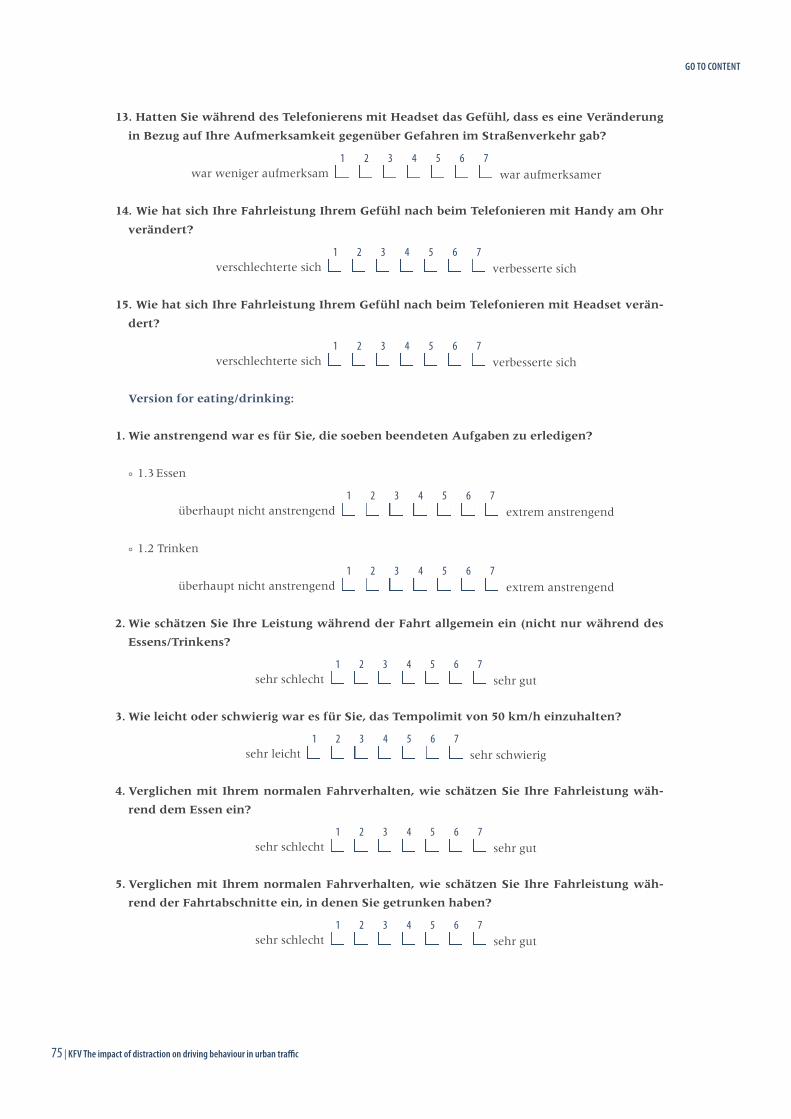
75 | KFV The impact of distraction on driving behaviour in urban traffic
13. Hatten Sie während des Telefonierens mit Headset das Gefühl, dass es eine Veränderung
in Bezug auf Ihre Aufmerksamkeit gegenüber Gefahren im Straßenverkehr gab?
war weniger aufmerksam 1
2
3
4
5
6
7
war aufmerksamer
14. Wie hat sich Ihre Fahrleistung Ihrem Gefühl nach beim Telefonieren mit Handy am Ohr
verändert?
verschlechterte sich 1
2
3
4
5
6
7
verbesserte sich
15. Wie hat sich Ihre Fahrleistung Ihrem Gefühl nach beim Telefonieren mit Headset verän-
dert?
verschlechterte sich 1
2
3
4
5
6
7
verbesserte sich
Version for eating/drinking:
1. Wie anstrengend war es für Sie, die soeben beendeten Aufgaben zu erledigen?
° 1.3 Essen
überhaupt nicht anstrengend 1
2
3
4
5
6
7
extrem anstrengend
° 1.2 Trinken
überhaupt nicht anstrengend 1
2
3
4
5
6
7
extrem anstrengend
2. Wie schätzen Sie Ihre Leistung während der Fahrt allgemein ein (nicht nur während des
Essens/Trinkens?
sehr schlecht 1
2
3
4
5
6
7
sehr gut
3. Wie leicht oder schwierig war es für Sie, das Tempolimit von 50 km/h einzuhalten?
sehr leicht 1
2
3
4
5
6
7
sehr schwierig
4. Verglichen mit Ihrem normalen Fahrverhalten, wie schätzen Sie Ihre Fahrleistung wäh-
rend dem Essen ein?
sehr schlecht 1
2
3
4
5
6
7
sehr gut
5. Verglichen mit Ihrem normalen Fahrverhalten, wie schätzen Sie Ihre Fahrleistung wäh-
rend der Fahrtabschnitte ein, in denen Sie getrunken haben?
sehr schlecht 1
2
3
4
5
6
7
sehr gut
GO TO CONTENT
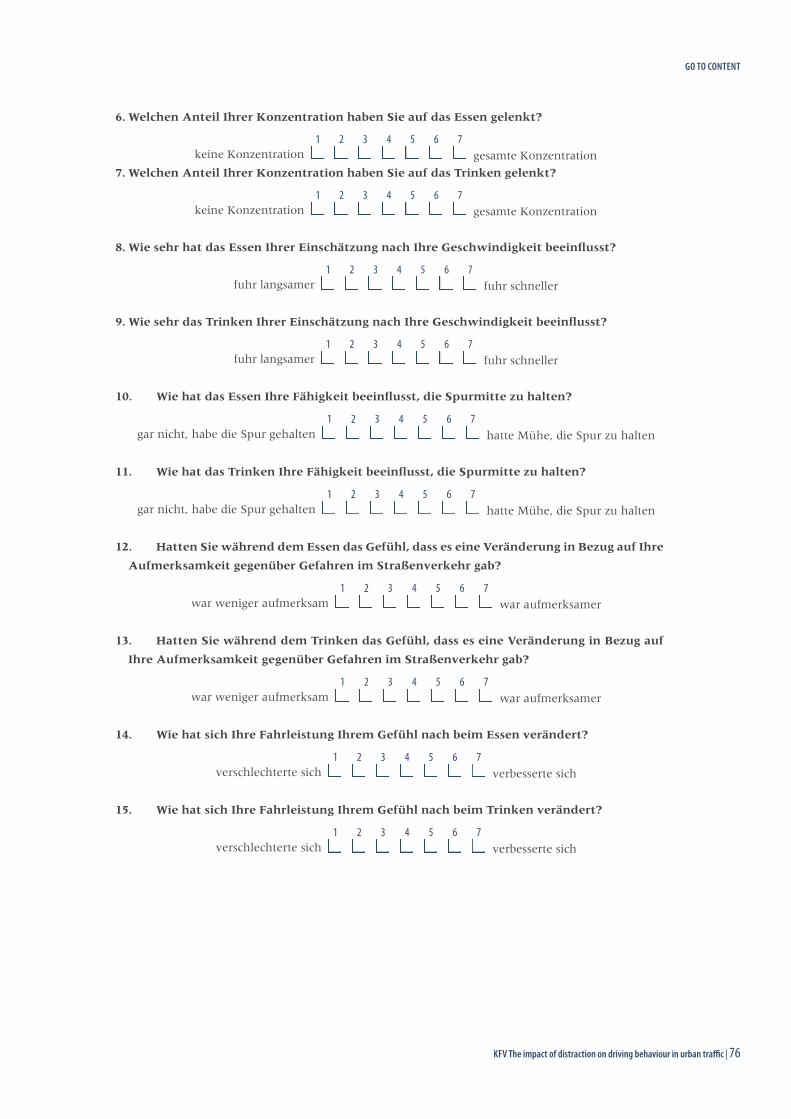
KFV The impact of distraction on driving behaviour in urban traffic | 7675 | KFV The impact of distraction on driving behaviour in urban traffic
6. Welchen Anteil Ihrer Konzentration haben Sie auf das Essen gelenkt?
keine Konzentration 1
2
3
4
5
6
7
gesamte Konzentration
7. Welchen Anteil Ihrer Konzentration haben Sie auf das Trinken gelenkt?
keine Konzentration 1
2
3
4
5
6
7
gesamte Konzentration
8. Wie sehr hat das Essen Ihrer Einschätzung nach Ihre Geschwindigkeit beeinflusst?
fuhr langsamer 1
2
3
4
5
6
7
fuhr schneller
9. Wie sehr das Trinken Ihrer Einschätzung nach Ihre Geschwindigkeit beeinflusst?
fuhr langsamer 1
2
3
4
5
6
7
fuhr schneller
10. Wie hat das Essen Ihre Fähigkeit beeinflusst, die Spurmitte zu halten?
gar nicht, habe die Spur gehalten 1
2
3
4
5
6
7
hatte Mühe, die Spur zu halten
11. Wie hat das Trinken Ihre Fähigkeit beeinflusst, die Spurmitte zu halten?
gar nicht, habe die Spur gehalten 1
2
3
4
5
6
7
hatte Mühe, die Spur zu halten
12. Hatten Sie während dem Essen das Gefühl, dass es eine Veränderung in Bezug auf Ihre
Aufmerksamkeit gegenüber Gefahren im Straßenverkehr gab?
war weniger aufmerksam 1
2
3
4
5
6
7
war aufmerksamer
13. Hatten Sie während dem Trinken das Gefühl, dass es eine Veränderung in Bezug auf
Ihre Aufmerksamkeit gegenüber Gefahren im Straßenverkehr gab?
war weniger aufmerksam 1
2
3
4
5
6
7
war aufmerksamer
14. Wie hat sich Ihre Fahrleistung Ihrem Gefühl nach beim Essen verändert?
verschlechterte sich 1
2
3
4
5
6
7
verbesserte sich
15. Wie hat sich Ihre Fahrleistung Ihrem Gefühl nach beim Trinken verändert?
verschlechterte sich 1
2
3
4
5
6
7
verbesserte sich
GO TO CONTENT
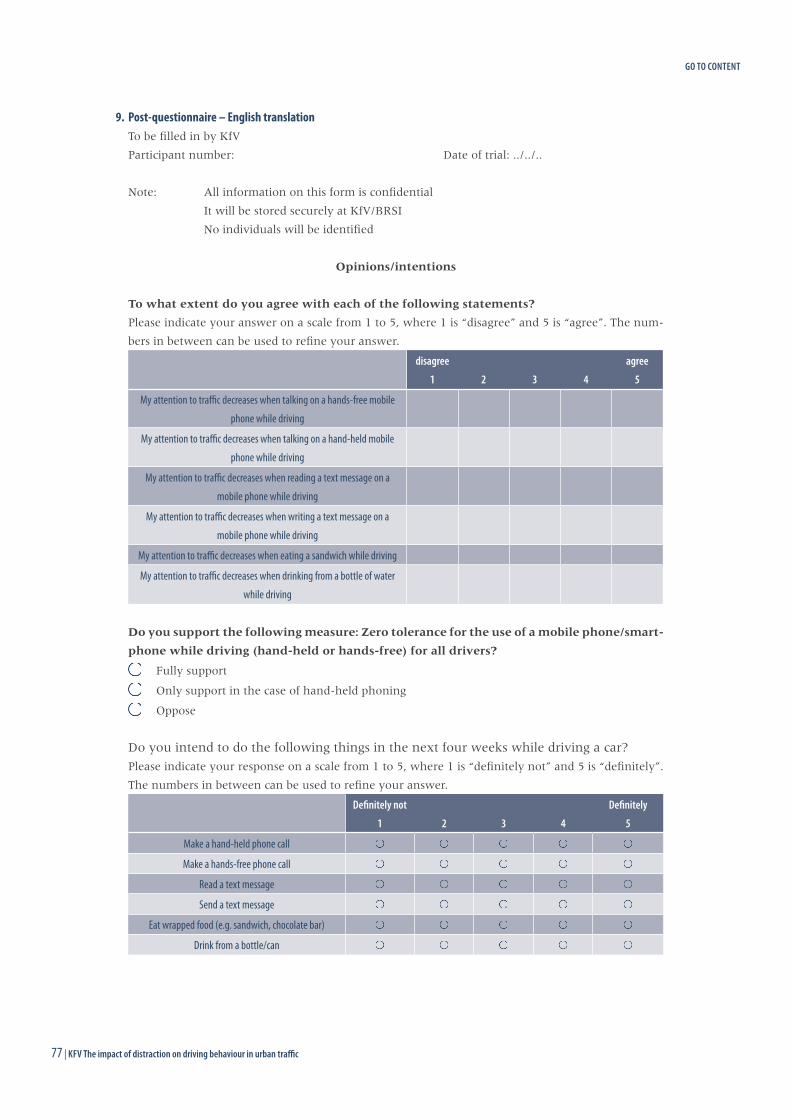
77 | KFV The impact of distraction on driving behaviour in urban traffic
9. Post-questionnaire – English translationTo be filled in by KfV
Participant number: Date of trial: ../../..
Note: All information on this form is confidential
It will be stored securely at KfV/BRSI
No individuals will be identified
Opinions/intentions
To what extent do you agree with each of the following statements?
Please indicate your answer on a scale from 1 to 5, where 1 is “disagree” and 5 is “agree”. The num-
bers in between can be used to refine your answer.
disagree
1 2 3 4
agree
5
My attention to traffic decreases when talking on a hands-free mobile phone while driving
My attention to traffic decreases when talking on a hand-held mobile phone while driving
My attention to traffic decreases when reading a text message on a mobile phone while driving
My attention to traffic decreases when writing a text message on a mobile phone while driving
My attention to traffic decreases when eating a sandwich while driving
My attention to traffic decreases when drinking from a bottle of water while driving
Do you support the following measure: Zero tolerance for the use of a mobile phone/smart-
phone while driving (hand-held or hands-free) for all drivers?
Fully support
Only support in the case of hand-held phoning
Oppose
Do you intend to do the following things in the next four weeks while driving a car?Please indicate your response on a scale from 1 to 5, where 1 is “definitely not” and 5 is “definitely”.
The numbers in between can be used to refine your answer.
Definitely not
1 2 3 4
Definitely
5
Make a hand-held phone call
Make a hands-free phone call
Read a text message
Send a text message
Eat wrapped food (e.g. sandwich, chocolate bar)
Drink from a bottle/can
GO TO CONTENT
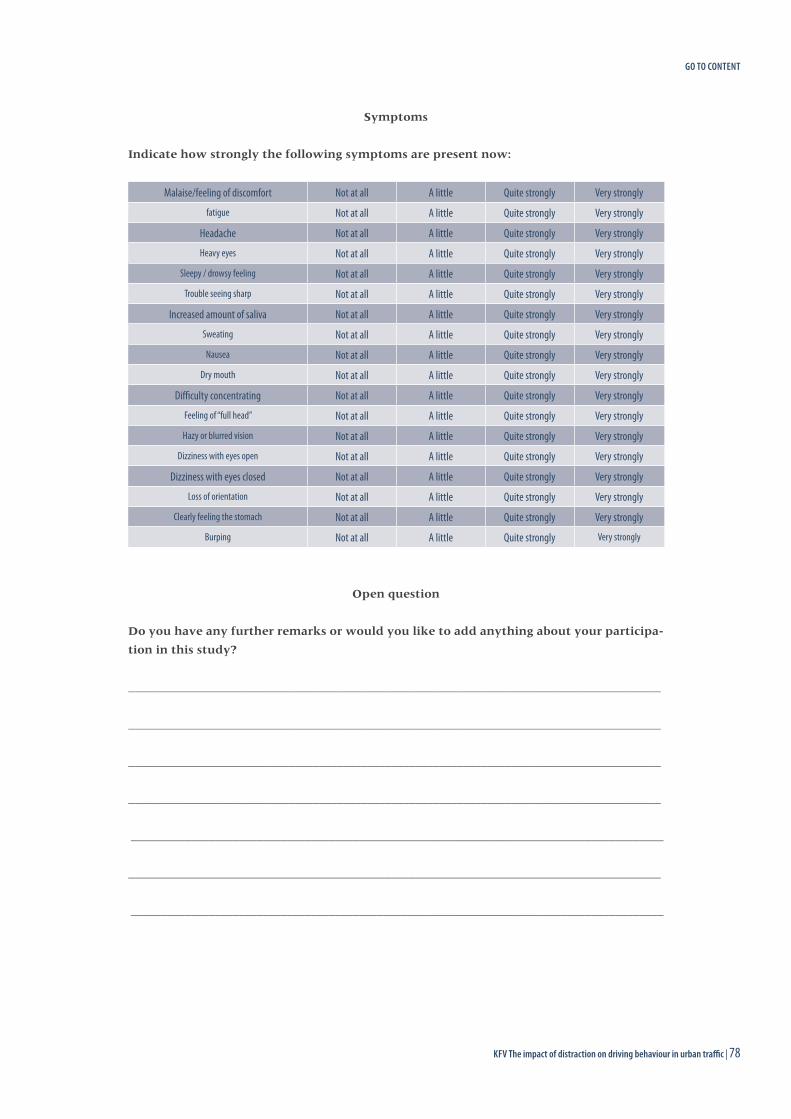
KFV The impact of distraction on driving behaviour in urban traffic | 7877 | KFV The impact of distraction on driving behaviour in urban traffic
Symptoms
Indicate how strongly the following symptoms are present now:
Malaise/feeling of discomfort Not at all A little Quite strongly Very strongly
fatigue Not at all A little Quite strongly Very strongly
Headache Not at all A little Quite strongly Very strongly
Heavy eyes Not at all A little Quite strongly Very strongly
Sleepy / drowsy feeling Not at all A little Quite strongly Very strongly
Trouble seeing sharp Not at all A little Quite strongly Very strongly
Increased amount of saliva Not at all A little Quite strongly Very strongly
Sweating Not at all A little Quite strongly Very strongly
Nausea Not at all A little Quite strongly Very strongly
Dry mouth Not at all A little Quite strongly Very strongly
Difficulty concentrating Not at all A little Quite strongly Very strongly
Feeling of “full head” Not at all A little Quite strongly Very strongly
Hazy or blurred vision Not at all A little Quite strongly Very strongly
Dizziness with eyes open Not at all A little Quite strongly Very strongly
Dizziness with eyes closed Not at all A little Quite strongly Very strongly
Loss of orientation Not at all A little Quite strongly Very strongly
Clearly feeling the stomach Not at all A little Quite strongly Very strongly
Burping Not at all A little Quite strongly Very strongly
Open question
Do you have any further remarks or would you like to add anything about your participa-
tion in this study?
_________________________________________________________________________________________
_________________________________________________________________________________________
_________________________________________________________________________________________
_________________________________________________________________________________________
_________________________________________________________________________________________
_________________________________________________________________________________________
_________________________________________________________________________________________
GO TO CONTENT
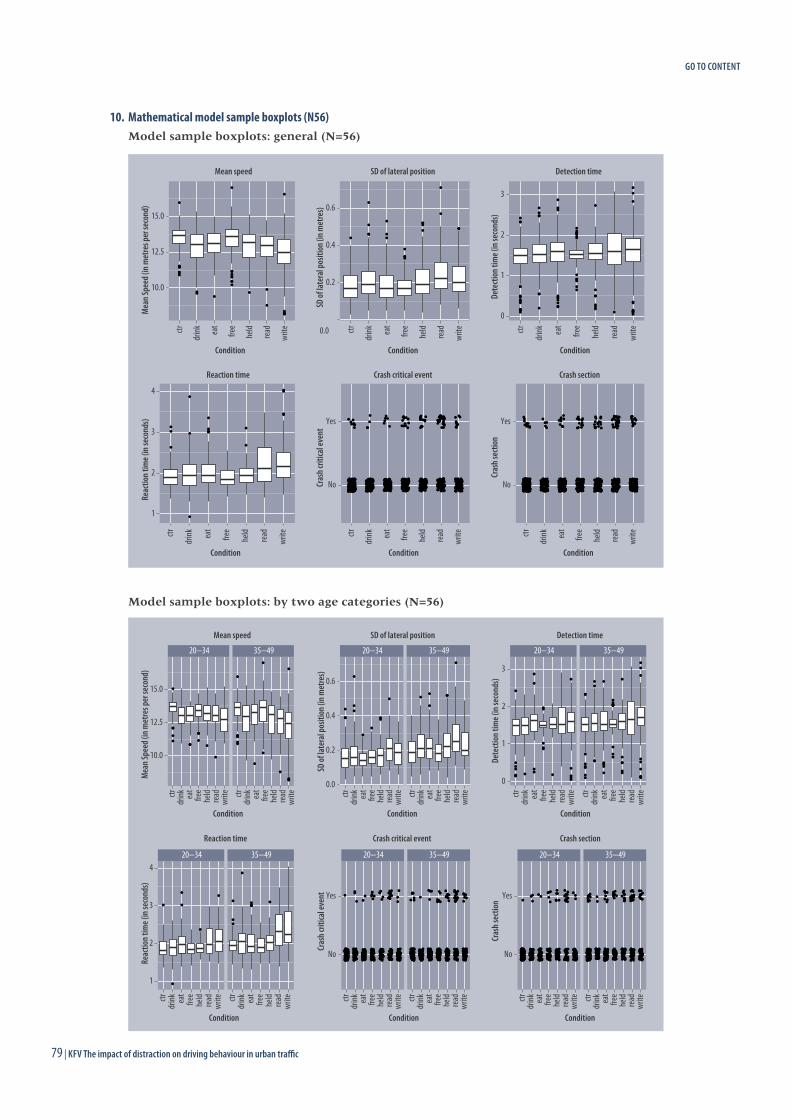
79 | KFV The impact of distraction on driving behaviour in urban traffic
10. Mathematical model sample boxplots (N56)Model sample boxplots: general (N=56)
Model sample boxplots: by two age categories (N=56)
10.0
12.5
15.0
ctr
drink ea
t
free
held
read
write
Condition
Mea
n Spe
ed (i
n met
res p
er se
cond
)
Mean speed
0.0
0.2
0.4
0.6
ctr
drink ea
t
free
held
read
write
Condition
SD of
late
ral p
ositi
on (i
n met
res)
SD of lateral position
0
1
2
3
ctr
drink ea
t
free
held
read
write
Condition
Dete
ctio
n tim
e (in
seco
nds)
Detection time
1
2
3
4
ctr
drink ea
t
free
held
read
write
Condition
Reac
tion t
ime (
in se
cond
s)
Reaction time
No
Yes
ctr
drink ea
t
free
held
read
write
Condition
Cras
h crit
ical e
vent
Crash critical event
No
Yes
ctr
drink ea
t
free
held
read
write
Condition
Cras
h sec
tion
Crash section
20−34 35−49
10.0
12.5
15.0
Condition
Mea
n Spe
ed (i
n met
res p
er se
cond
)
Mean speed
20−34 35−49
0.0
0.2
0.4
0.6
ctrdr
ink eat
free
held
read
write ctr
drink ea
tfre
ehe
ldrea
dwr
itectrdr
ink eat
free
held
read
write ctr
drink ea
tfre
ehe
ldrea
dwr
ite
Condition
SD of
late
ral p
ositi
on (i
n met
res)
SD of lateral position
20−34 35−49
0
1
2
3
ctrdr
ink eat
free
held
read
write ctr
drink ea
tfre
ehe
ldrea
dwr
ite
Condition
Dete
ctio
n tim
e (in
seco
nds)
Detection time
20−34 35−49
1
2
3
4
ctrdr
ink eat
free
held
read
write ctr
drink ea
tfre
ehe
ldrea
dwr
ite
Condition
Reac
tion t
ime (
in se
cond
s)
Reaction time
20−34 35−49
No
Yes
ctrdr
ink eat
free
held
read
write ctr
drink ea
tfre
ehe
ldrea
dwr
ite
Condition
Cras
h crit
ical e
vent
Crash critical event
20−34 35−49
No
Yes
ctrdr
ink eat
free
held
read
write ctr
drink ea
tfre
ehe
ldrea
dwr
ite
Condition
Cras
h sec
tion
Crash section
GO TO CONTENT
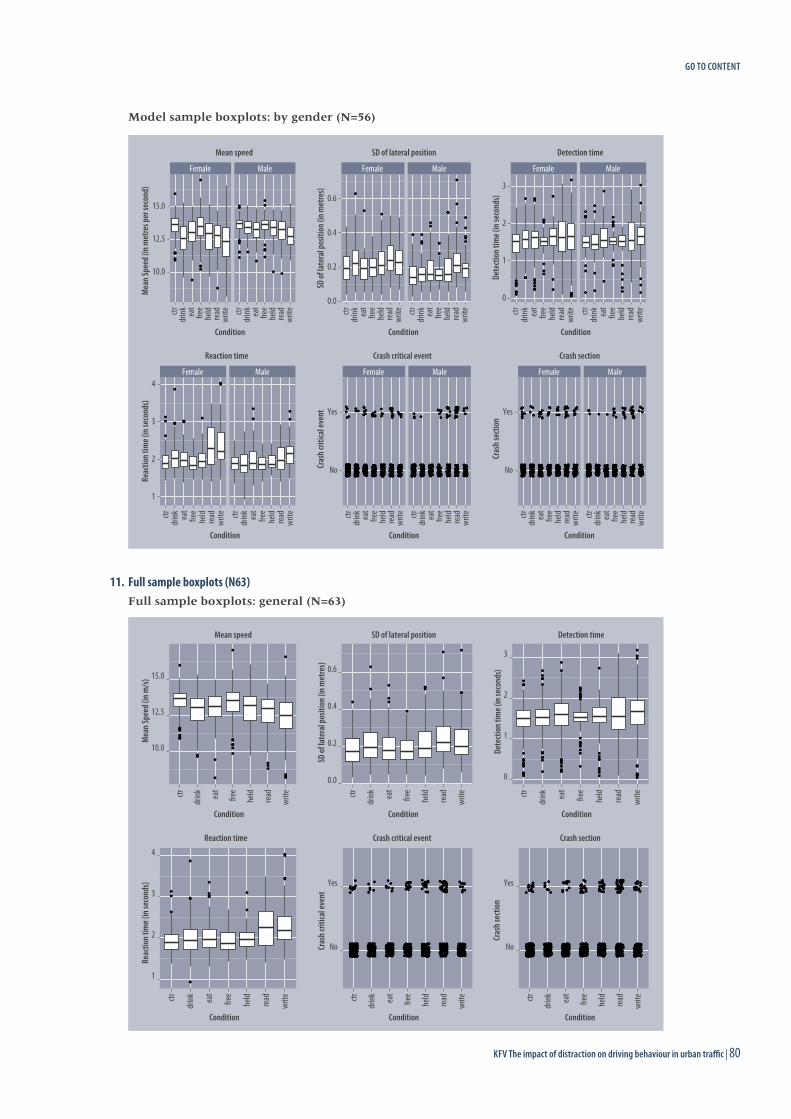
KFV The impact of distraction on driving behaviour in urban traffic | 8079 | KFV The impact of distraction on driving behaviour in urban traffic
Model sample boxplots: by gender (N=56)
11. Full sample boxplots (N63)Full sample boxplots: general (N=63)
Female Male
10.0
12.5
15.0
ctrdr
ink eat
free
held
read
write ctr
drink ea
tfre
ehe
ldrea
dwr
ite
Condition
Mea
n Spe
ed (i
n met
res p
er se
cond
)Mean speed
Female Male
0.0
0.2
0.4
0.6
ctrdr
ink eat
free
held
read
write ctr
drink ea
tfre
ehe
ldrea
dwr
ite
ConditionSD
of la
tera
l pos
ition
(in m
etre
s)
SD of lateral position
Female Male
0
1
2
3
ctrdr
ink eat
free
held
read
write ctr
drink ea
tfre
ehe
ldrea
dwr
ite
Condition
Dete
ctio
n tim
e (in
seco
nds)
Detection time
Female Male
1
2
3
4
ctrdr
ink eat
free
held
read
write ctr
drink ea
tfre
ehe
ldrea
dwr
ite
Condition
Reac
tion t
ime (
in se
cond
s)
Reaction time
Female Male
No
Yes
ctrdr
ink eat
free
held
read
write ctr
drink ea
tfre
ehe
ldrea
dwr
ite
Condition
Cras
h crit
ical e
vent
Crash critical event
Female Male
No
Yes
ctrdr
ink eat
free
held
read
write ctr
drink ea
tfre
ehe
ldrea
dwr
ite
Condition
Cras
h sec
tion
Crash section
10.0
12.5
15.0
ctr
drink ea
t
free
held
read
write
Condition
Mea
n Spe
ed (i
n m/s)
Mean speed
0.0
0.2
0.4
0.6
ctr
drink ea
t
free
held
read
write
Condition
SD of
late
ral p
ositi
on (i
n met
res)
SD of lateral position
0
1
2
3
ctr
drink ea
t
free
held
read
write
Condition
Dete
ctio
n tim
e (in
seco
nds)
Detection time
1
2
3
4
ctr
drink ea
t
free
held
read
write
Condition
Reac
tion t
ime (
in se
cond
s)
Reaction time
No
Yes
ctr
drink ea
t
free
held
read
write
Condition
Cras
h crit
ical e
vent
Crash critical event
No
Yes
ctr
drink ea
t
free
held
read
write
Condition
Cras
h sec
tion
Crash section
GO TO CONTENT
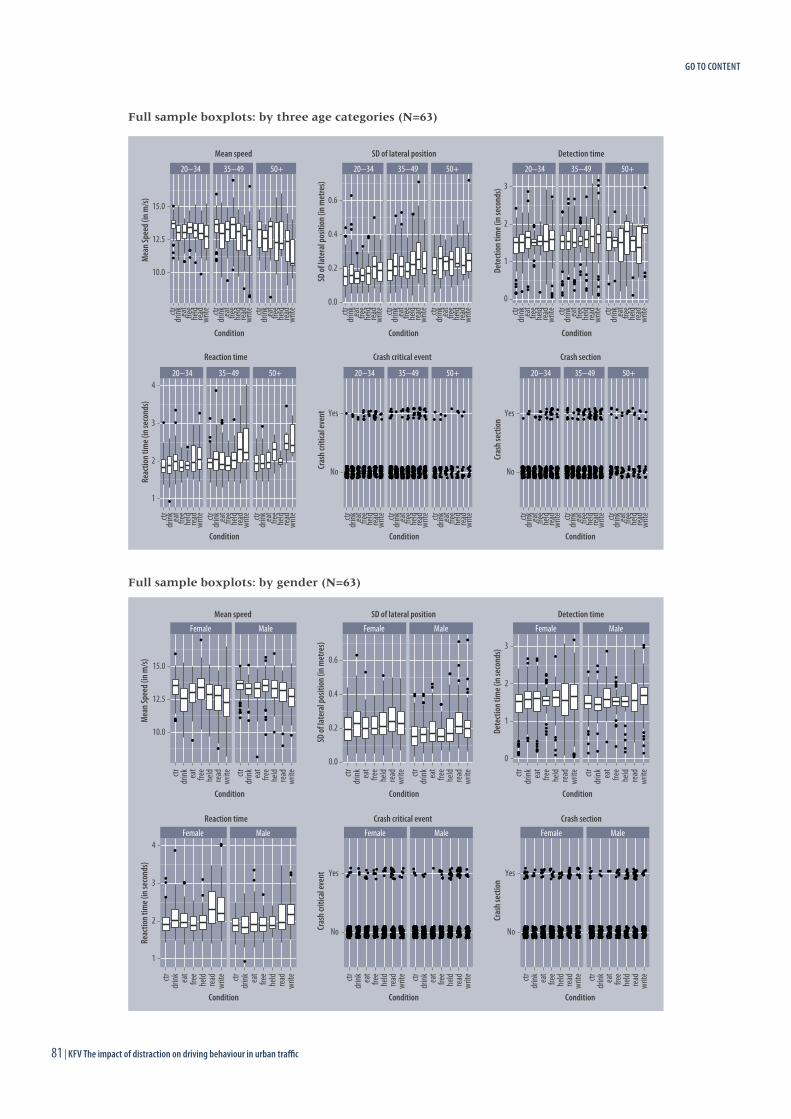
81 | KFV The impact of distraction on driving behaviour in urban traffic
Full sample boxplots: by three age categories (N=63)
Full sample boxplots: by gender (N=63)
20−34 35−49 50+
10.0
12.5
15.0
ctrdr
ink eat
free
held
read
write ctr
drink ea
tfre
ehe
ldrea
dwr
ite ctrdr
ink eat
free
held
read
write
Condition
Mea
n Spe
ed (i
n m/s)
Mean speed
20−34 35−49 50+
0.0
0.2
0.4
0.6
ctrdr
ink eat
free
held
read
write ctr
drink ea
tfre
ehe
ldrea
dwr
ite ctrdr
ink eat
free
held
read
write
ConditionSD
of la
tera
l pos
ition
(in m
etre
s)
SD of lateral position
20−34 35−49 50+
0
1
2
3
ctrdr
ink eat
free
held
read
write ctr
drink ea
tfre
ehe
ldrea
dwr
ite ctrdr
ink eat
free
held
read
write
Condition
Dete
ctio
n tim
e (in
seco
nds)
Detection time
20−34 35−49 50+
1
2
3
4
ctrdr
ink eat
free
held
read
write ctr
drink ea
tfre
ehe
ldrea
dwr
ite ctrdr
ink eat
free
held
read
write
Condition
Reac
tion t
ime (
in se
cond
s)
Reaction time
20−34 35−49 50+
No
Yes
ctrdr
ink eat
free
held
read
write ctr
drink ea
tfre
ehe
ldrea
dwr
ite ctrdr
ink eat
free
held
read
write
Condition
Cras
h crit
ical e
vent
Crash critical event
20−34 35−49 50+
No
Yes
ctrdr
ink eat
free
held
read
write ctr
drink ea
tfre
ehe
ldrea
dwr
ite ctrdr
ink eat
free
held
read
write
Condition
Cras
h sec
tion
Crash section
Female Male
10.0
12.5
15.0
ctrdr
ink eat
free
held
read
write ctr
drink ea
tfre
ehe
ldrea
dwr
ite
Condition
Mea
n Spe
ed (i
n m/s)
Mean speed
Female Male
0.0
0.2
0.4
0.6
ctrdr
ink eat
free
held
read
write ctr
drink ea
tfre
ehe
ldrea
dwr
ite
Condition
SD of
late
ral p
ositi
on (i
n met
res)
SD of lateral position
Female Male
0
1
2
3
ctrdr
ink eat
free
held
read
write ctr
drink ea
tfre
ehe
ldrea
dwr
ite
Condition
Dete
ctio
n tim
e (in
seco
nds)
Detection time
Female Male
1
2
3
4
ctrdr
ink eat
free
held
read
write ctr
drink ea
tfre
ehe
ldrea
dwr
ite
Condition
Reac
tion t
ime (
in se
cond
s)
Reaction time
Female Male
No
Yes
ctrdr
ink eat
free
held
read
write ctr
drink ea
tfre
ehe
ldrea
dwr
ite
Condition
Cras
h crit
ical e
vent
Crash critical event
Female Male
No
Yes
ctrdr
ink eat
free
held
read
write ctr
drink ea
tfre
ehe
ldrea
dwr
ite
Condition
Cras
h sec
tion
Crash section
GO TO CONTENT
83 | KFV The impact of distraction on driving behaviour in urban traffic
IMPRESSUMMedia owner and publisherKFV (Austrian Road Safety Board)Schleiergasse 181100 ViennaTel.: +43 (5)577 0 77-1919Fax.: +43 (0)577 0 [email protected]
Purpose of the association and orientationThe association is an institution responsible for all purposes of accident prevention and a coordination centre for measures which serve the safety in road traffic and other areas of everyday life. It is divided into the fields of road traffic and mobility, home, leisure, sports, property and fire as well as further fields of safety.
Executive boardDr. Othmar Thann, Dr. Louis Norman-Audenhove
Association registration number801 397 500
Principle directionThe publication series “KFV – Safe Living” serves the dissemination of studies in the field of road traffic safety, which have been conducted by or on behalf of the KFV.
AuthorsMonika Pilgerstorfer (KFV)Sofie Boets (BRSI)
Specialist responsibilityDipl.-Ing. Klaus Robatsch
Editorial teamMag. Christoph FeymannMag. Ingrid Rozhon, MASKFV (Austrian Road Safety Board)Schleiergasse 181100 Vienna
Publishing placeVienna, 2017
Copy-editingAngela Dickinson
GraphicsCatharina Ballan .com
Photos © KFV (Austrian Road Safety Board)KFV (Austrian Road Safety Board) respectively the referred sources
ISBN pdf-version: 978-3-7070-0136-5
CitationKFV – Safe Living, Vol. #7, The impact of distraction on driving behaviour in urban traffic. Results of a simulator-based study. Vienna, 2017
GO TO CONTENT
KFV The impact of distraction on driving behaviour in urban traffic | 8483 | KFV The impact of distraction on driving behaviour in urban traffic
Copyright© KFV (Austrian Road Safety Board)All rights reserved. Latest Version: May 2017. All information is supplied without guarantee.
DisclaimerDespite of careful examination, all information in this publication is provided without guarantee. All liability by the authors or the KFV shall be excluded. Due to rounding summations may undercut or exceed the 100% figure.
Any personal references shall refer equally to men and women.
Disclosure in accordance with § 25 of the Media Act and reporting obligation in accordance with § 5 of the E-Commerce-Act are to be found under www.kfv.at/footer-links/impressum
GO TO CONTENT

ISBN (PDF): 978-3-7070-0136-5