Embed Size (px)
Citation preview
LETTERdoi:10.1038/nature15522
Observation of non-Hermitian degeneraciesin a chaotic exciton-polariton billiardT. Gao1, E. Estrecho1, K. Y. Bliokh1,2, T. C. H. Liew3, M. D. Fraser2, S. Brodbeck4, M. Kamp4, C. Schneider4, S. Hofling4,5,Y. Yamamoto6,7, F. Nori2,8, Y. S. Kivshar1, A. G. Truscott1, R. G. Dall1 & E. A. Ostrovskaya1
Exciton-polaritons are hybrid light–matter quasiparticles formedby strongly interacting photons and excitons (electron–hole pairs)in semiconductor microcavities1–3. They have emerged as a robustsolid-state platform for next-generation optoelectronic applica-tions as well as for fundamental studies of quantum many-bodyphysics. Importantly, exciton-polaritons are a profoundly open(that is, non-Hermitian4,5) quantum system, which requiresconstant pumping of energy and continuously decays, releasingcoherent radiation6. Thus, the exciton-polaritons always exist ina balanced potential landscape of gain and loss. However, theinherent non-Hermitian nature of this potential has so far beenlargely ignored in exciton-polariton physics. Here we demonstratethat non-Hermiticity dramatically modifies the structure of modesand spectral degeneracies in exciton-polariton systems, and, there-fore, will affect their quantum transport, localization and dynam-ical properties7–9. Using a spatially structured optical pump10–12, wecreate a chaotic exciton-polariton billiard—a two-dimensionalarea enclosed by a curved potential barrier. Eigenmodes of thisbilliard exhibit multiple non-Hermitian spectral degeneracies,known as exceptional points13,14. Such points can cause remarkablewave phenomena, such as unidirectional transport15, anomalouslasing/absorption16,17 and chiral modes18. By varying parametersof the billiard, we observe crossing and anti-crossing of energy levelsand reveal the non-trivial topological modal structure exclusive tonon-Hermitian systems9,13–22. We also observe mode switching anda topological Berry phase for a parameter loop encircling the excep-tional point23,24. Our findings pave the way to studies of non-Hermitian quantum dynamics of exciton-polaritons, which mayuncover novel operating principles for polariton-based devices.
Studies of open quantum systems go back to Gamow’s theory ofnuclear a-decay developed in the early days of quantum mechanics4.Indeed, metastable states of a single quantum particle in a sphericallysymmetric potential well with semi-transparent barriers decay in time,and therefore are characterized by complex energies. Furthermore,introducing a 2D potential well with non-trivial geometry, that is, aquantum billiard, results in strongly correlated energy levels and trans-ition to quantum chaos7,19,21,25–28. Spectral degeneracies crucially deter-mine transport and dynamical properties in both non-Hermitian andchaotic wave systems7–9,15–17. In chaotic and disordered wave systems,spectral degeneracies underpin statistical properties and quantumphase transitions from localized to delocalized dynamics8,9. In non-Hermitian (including PT-symmetric) systems, non-trivial topologyof eigenmodes and unusual transport properties in the vicinity ofexceptional points15–17,19 are currently under investigation. Basic non-Hermitian or stochastic dynamics have so far been studied in the con-text of microwave9,18–20,24, optical15–17,19,21, atomic22,26,27 and electron25,28
waves. However, the concepts of non-Hermiticity and quantum chaosremain largely separated from each other, owing to the lack of a simple
quantum system in which both features would be readily accessible.Moreover, it is challenging to produce artificial complex potentials withgain and loss for classical waves, as well as to observe nanoscopicelectron states in solids.
Microcavity exciton-polaritons represent a unique quantum macro-scopic system, which combines the main advantages of light and mat-ter waves1–3. Being bosons, exciton-polaritons can display collectivequantum behaviour, Bose–Einstein condensation (BEC), when theyoccupy a single-particle quantum state in massive numbers. Exciton-polaritons have provided a very accessible system for studies of col-lective quantum behaviour because they condense at temperaturesranging from 10 K to room temperature (compared to nanokelvinsfor neutral atoms) and do not require painstaking isolation fromthe environment.
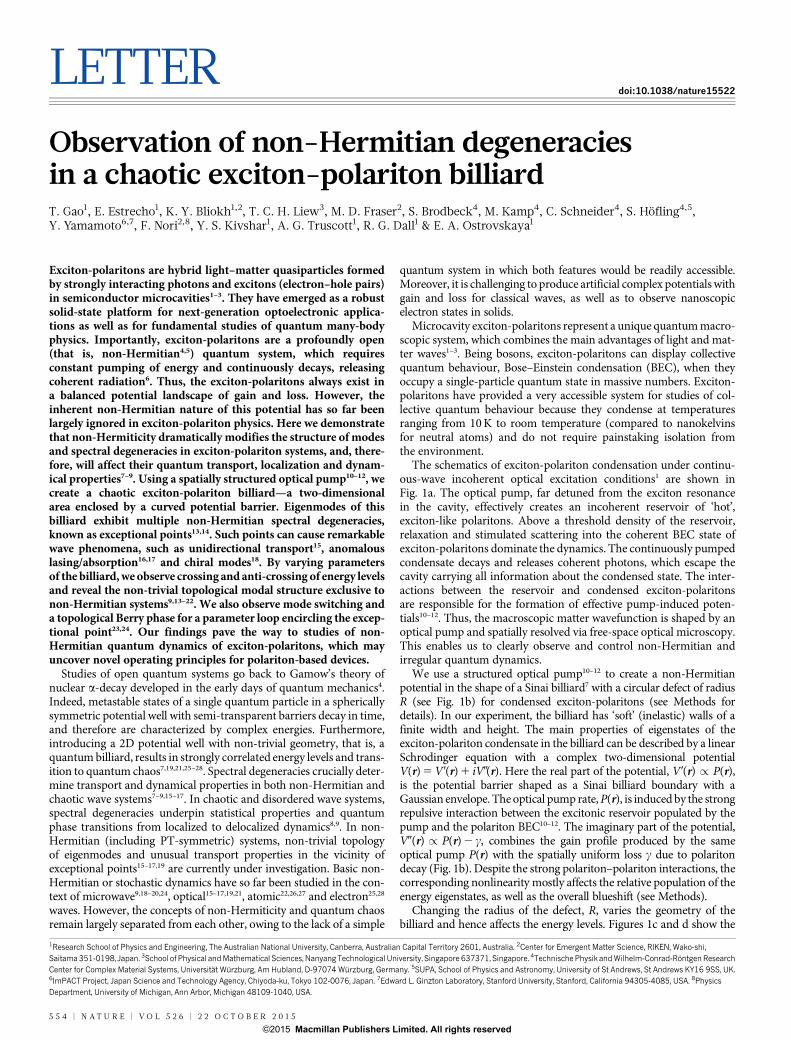
The schematics of exciton-polariton condensation under continu-ous-wave incoherent optical excitation conditions1 are shown inFig. 1a. The optical pump, far detuned from the exciton resonancein the cavity, effectively creates an incoherent reservoir of ‘hot’,exciton-like polaritons. Above a threshold density of the reservoir,relaxation and stimulated scattering into the coherent BEC state ofexciton-polaritons dominate the dynamics. The continuously pumpedcondensate decays and releases coherent photons, which escape thecavity carrying all information about the condensed state. The inter-actions between the reservoir and condensed exciton-polaritonsare responsible for the formation of effective pump-induced poten-tials10–12. Thus, the macroscopic matter wavefunction is shaped by anoptical pump and spatially resolved via free-space optical microscopy.This enables us to clearly observe and control non-Hermitian andirregular quantum dynamics.
We use a structured optical pump10–12 to create a non-Hermitianpotential in the shape of a Sinai billiard7 with a circular defect of radiusR (see Fig. 1b) for condensed exciton-polaritons (see Methods fordetails). In our experiment, the billiard has ‘soft’ (inelastic) walls of afinite width and height. The main properties of eigenstates of theexciton-polariton condensate in the billiard can be described by a linearSchrodinger equation with a complex two-dimensional potentialV(r) 5 V9(r) 1 iV0(r). Here the real part of the potential, V9(r) / P(r),is the potential barrier shaped as a Sinai billiard boundary with aGaussian envelope. The optical pump rate, P(r), is induced by the strongrepulsive interaction between the excitonic reservoir populated by thepump and the polariton BEC10–12. The imaginary part of the potential,V0(r) / P(r) 2 c, combines the gain profile produced by the sameoptical pump P(r) with the spatially uniform loss c due to polaritondecay (Fig. 1b). Despite the strong polariton–polariton interactions, thecorresponding nonlinearity mostly affects the relative population of theenergy eigenstates, as well as the overall blueshift (see Methods).
Changing the radius of the defect, R, varies the geometry of thebilliard and hence affects the energy levels. Figures 1c and d show the
1Research School of Physics and Engineering, The Australian National University, Canberra, Australian Capital Territory 2601, Australia. 2Center for Emergent Matter Science, RIKEN, Wako-shi,Saitama 351-0198, Japan. 3School of Physical and Mathematical Sciences, Nanyang Technological University, Singapore 637371, Singapore. 4Technische Physik and Wilhelm-Conrad-Rontgen ResearchCenter for Complex Material Systems, Universitat Wurzburg, Am Hubland, D-97074 Wurzburg, Germany. 5SUPA, School of Physics and Astronomy, University of St Andrews, St Andrews KY16 9SS, UK.6ImPACT Project, Japan Science and Technology Agency, Chiyoda-ku, Tokyo 102-0076, Japan. 7Edward L. Ginzton Laboratory, Stanford University, Stanford, California 94305-4085, USA. 8PhysicsDepartment, University of Michigan, Ann Arbor, Michigan 48109-1040, USA.
5 5 4 | N A T U R E | V O L 5 2 6 | 2 2 O C T O B E R 2 0 1 5
G2015 Macmillan Publishers Limited. All rights reserved
experimentally measured and numerically computed energy spectraE(R) of the first 11 levels as a function of R. Variations of the shape ofthe 2D potential tune eigenvalues of different modes at different rates,and as a result some energy levels approach each other at certain valuesof R. It can be seen (Fig. 1c, d) that multiple degeneracies (or near-degeneracies) appear in the spectrum. In a ‘hard-wall’ Hermitian Sinaibilliard, the proliferation of degeneracies is a signature of the transitionfrom regular to chaotic dynamics7. Although our exciton-polaritonbilliard has ‘soft’ walls and can generically exhibit mixed regular-chaotic behaviour27, we clearly observe multiple degeneracies similarto the ‘hard-wall’ case7. In Hermitian billiards, the levels genericallyavoid crossing (that is, they anti-cross) in the vicinity of degeneracies,which correspond to the average level repulsion and Wigner distri-bution of the nearest-neighbour energy spacings8. In contrast, the non-Hermitian systems can exhibit both crossings and anti-crossings oflevels9,19–22. This is because the energy eigenvalues in non-Hermitiansystems are complex: the real part and imaginary parts correspond tothe real energies and linewidths of the modes, respectively. A crossingof the energies is accompanied by an anti-crossing of the linewidthsand vice versa. In our experiment, we measure the spectral profile ofthe cavity photoluminescence at a particular spatial position andextract both peak energies and widths of spectral resonances (seeMethods). Crossings as well as anti-crossings of real energy levelsare clearly seen both in experiments (Fig. 1c) and numerical simula-tions (Fig. 1d).
To observe the transition between crossing and anti-crossing for thesame near-degenerate pair of eigenvalues, a second control parameter
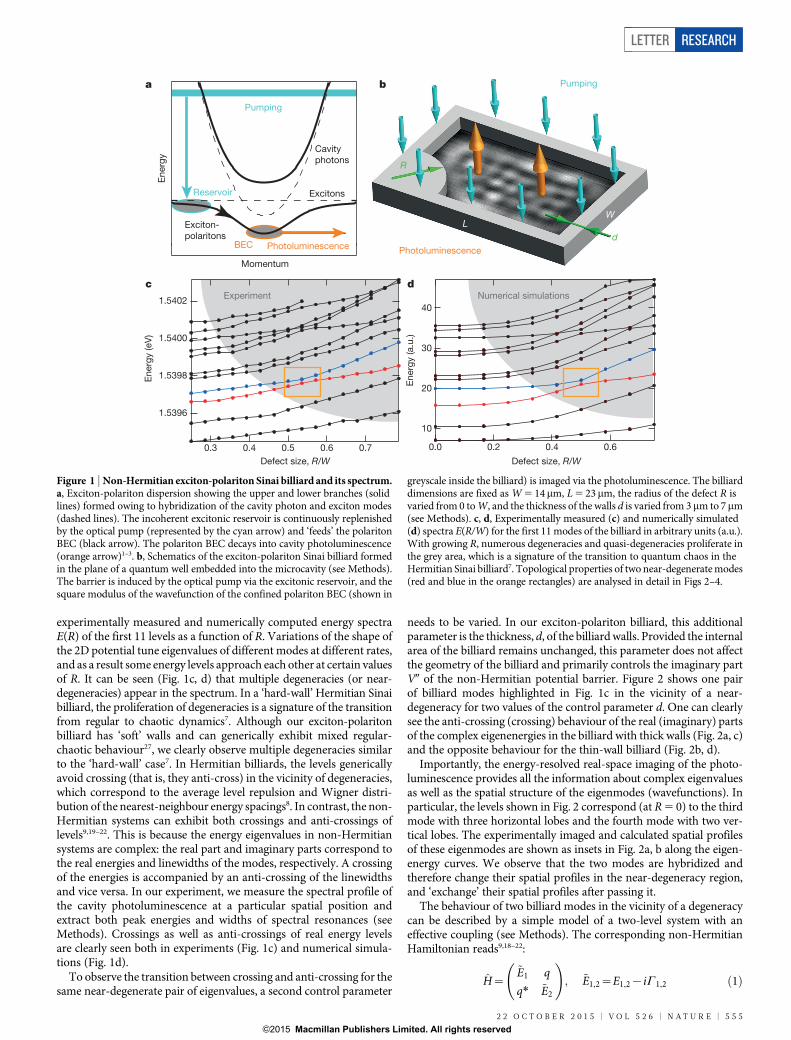
needs to be varied. In our exciton-polariton billiard, this additionalparameter is the thickness, d, of the billiard walls. Provided the internalarea of the billiard remains unchanged, this parameter does not affectthe geometry of the billiard and primarily controls the imaginary partV0 of the non-Hermitian potential barrier. Figure 2 shows one pairof billiard modes highlighted in Fig. 1c in the vicinity of a near-degeneracy for two values of the control parameter d. One can clearlysee the anti-crossing (crossing) behaviour of the real (imaginary) partsof the complex eigenenergies in the billiard with thick walls (Fig. 2a, c)and the opposite behaviour for the thin-wall billiard (Fig. 2b, d).
Importantly, the energy-resolved real-space imaging of the photo-luminescence provides all the information about complex eigenvaluesas well as the spatial structure of the eigenmodes (wavefunctions). Inparticular, the levels shown in Fig. 2 correspond (at R 5 0) to the thirdmode with three horizontal lobes and the fourth mode with two ver-tical lobes. The experimentally imaged and calculated spatial profilesof these eigenmodes are shown as insets in Fig. 2a, b along the eigen-energy curves. We observe that the two modes are hybridized andtherefore change their spatial profiles in the near-degeneracy region,and ‘exchange’ their spatial profiles after passing it.
The behaviour of two billiard modes in the vicinity of a degeneracycan be described by a simple model of a two-level system with aneffective coupling (see Methods). The corresponding non-HermitianHamiltonian reads9,18–22:
H~~E1 q
q1 ~E2
!; ~E1,2~E1,2{iC1,2 ð1Þ
1.5402
1.5400
1.5398
1.5396
0.70.60.50.40.3
40
30
20
10
Ene
rgy
(a.u
.)
0.60.40.20.0
Defect size, R/W
d
Ene
rgy
(eV
)
Defect size, R/W
c Experiment Numerical simulations
Pumping
R
dPhotoluminescence
WL
ba
Ene
rgy
Momentum
Photoluminescence
Pumping
Reservoir
BEC
Excitons
Exciton-polaritons
Cavityphotons
Figure 1 | Non-Hermitian exciton-polariton Sinai billiard and its spectrum.a, Exciton-polariton dispersion showing the upper and lower branches (solidlines) formed owing to hybridization of the cavity photon and exciton modes(dashed lines). The incoherent excitonic reservoir is continuously replenishedby the optical pump (represented by the cyan arrow) and ‘feeds’ the polaritonBEC (black arrow). The polariton BEC decays into cavity photoluminescence(orange arrow)1–3. b, Schematics of the exciton-polariton Sinai billiard formedin the plane of a quantum well embedded into the microcavity (see Methods).The barrier is induced by the optical pump via the excitonic reservoir, and thesquare modulus of the wavefunction of the confined polariton BEC (shown in
greyscale inside the billiard) is imaged via the photoluminescence. The billiarddimensions are fixed as W 5 14mm, L 5 23mm, the radius of the defect R isvaried from 0 to W, and the thickness of the walls d is varied from 3mm to 7mm(see Methods). c, d, Experimentally measured (c) and numerically simulated(d) spectra E(R/W) for the first 11 modes of the billiard in arbitrary units (a.u.).With growing R, numerous degeneracies and quasi-degeneracies proliferate inthe grey area, which is a signature of the transition to quantum chaos in theHermitian Sinai billiard7. Topological properties of two near-degenerate modes(red and blue in the orange rectangles) are analysed in detail in Figs 2–4.
2 2 O C T O B E R 2 0 1 5 | V O L 5 2 6 | N A T U R E | 5 5 5
LETTER RESEARCH
G2015 Macmillan Publishers Limited. All rights reserved
Here ~E1,2 are the complex eigenvalues of two uncoupled modes (withE1,2 being the real energies and C1,2 being the decay/gain rates),whereas q characterizes the coupling between these two modes (thestar stands for complex conjugation). We will also use the meancomplex energy ~E~ ~E1z~E2
� �=2:E{iC , and the complex energy
difference d~E~ ~E2{~E1� �
=2:dE{idC . The eigenvalues of the
Hamiltonian (equation (1)) are l1,2~~E+ffiffiffiffiffiffiffiffiffiffiffiffiffiffiffiffiffiffiffid~E2z qj j2
q; their real and
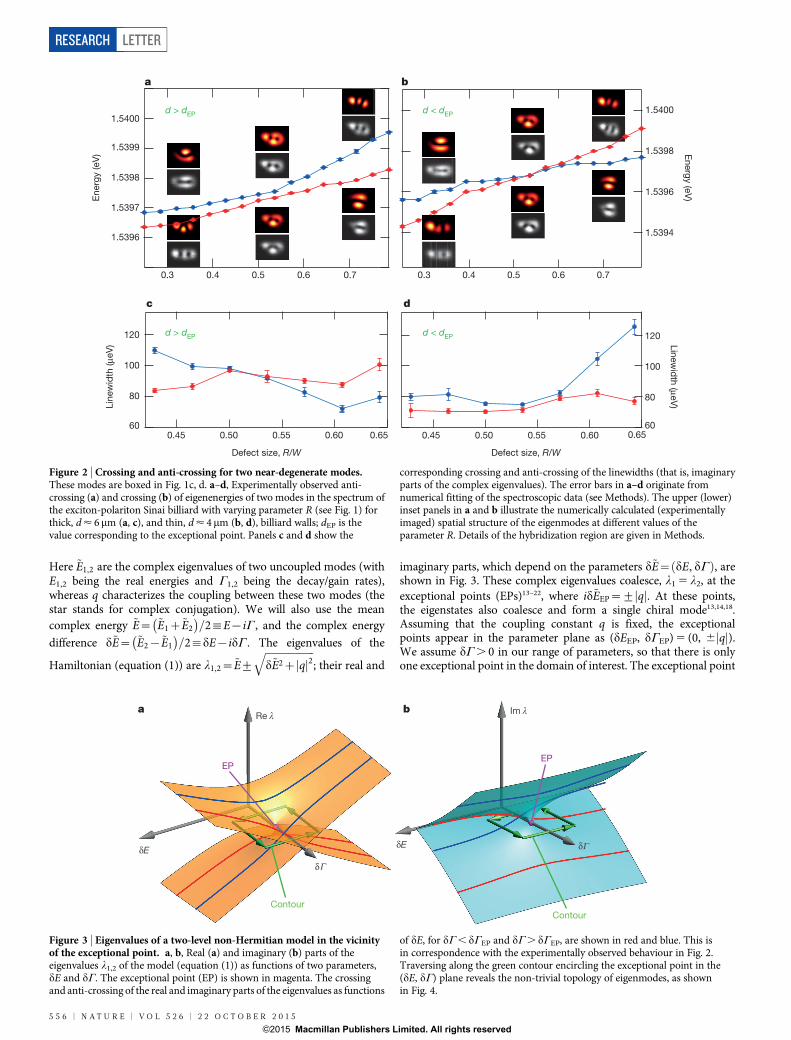
imaginary parts, which depend on the parameters d~E~ dE, dCð Þ, areshown in Fig. 3. These complex eigenvalues coalesce, l1 5 l2, at theexceptional points (EPs)13–22, where id~EEP~+ qj j. At these points,the eigenstates also coalesce and form a single chiral mode13,14,18.Assuming that the coupling constant q is fixed, the exceptionalpoints appear in the parameter plane as (dEEP, dCEP) 5 (0, 6jqj).We assume dC . 0 in our range of parameters, so that there is onlyone exceptional point in the domain of interest. The exceptional point
0.70.60.50.40.3
0.650.600.550.500.45
Defect size, R/W
b
d
d < dEP
d < dEP
0.650.600.550.500.45
0.70.60.50.40.3
Defect size, R/W
a
d > dEP
d > dEP 120
100
80
60
1.5400
1.5399
1.5398
1.5397
1.5396
1.5400
1.5398
1.5396
1.5394
120
100
80
60
Line
wid
th (μ
eV)
Ene
rgy
(eV
) Energy (eV
)
Linewid
th (μeV)
c
Figure 2 | Crossing and anti-crossing for two near-degenerate modes.These modes are boxed in Fig. 1c, d. a–d, Experimentally observed anti-crossing (a) and crossing (b) of eigenenergies of two modes in the spectrum ofthe exciton-polariton Sinai billiard with varying parameter R (see Fig. 1) forthick, d < 6mm (a, c), and thin, d < 4mm (b, d), billiard walls; dEP is thevalue corresponding to the exceptional point. Panels c and d show the
corresponding crossing and anti-crossing of the linewidths (that is, imaginaryparts of the complex eigenvalues). The error bars in a–d originate fromnumerical fitting of the spectroscopic data (see Methods). The upper (lower)inset panels in a and b illustrate the numerically calculated (experimentallyimaged) spatial structure of the eigenmodes at different values of theparameter R. Details of the hybridization region are given in Methods.
a b
δ
δE δδE
Re λ Im λ
EPEP
ContourContour
Γ
Γ
Figure 3 | Eigenvalues of a two-level non-Hermitian model in the vicinityof the exceptional point. a, b, Real (a) and imaginary (b) parts of theeigenvalues l1,2 of the model (equation (1)) as functions of two parameters,dE and dC. The exceptional point (EP) is shown in magenta. The crossingand anti-crossing of the real and imaginary parts of the eigenvalues as functions
of dE, for dC , dCEP and dC . dCEP, are shown in red and blue. This isin correspondence with the experimentally observed behaviour in Fig. 2.Traversing along the green contour encircling the exceptional point in the(dE, dC) plane reveals the non-trivial topology of eigenmodes, as shownin Fig. 4.
5 5 6 | N A T U R E | V O L 5 2 6 | 2 2 O C T O B E R 2 0 1 5
RESEARCH LETTER
G2015 Macmillan Publishers Limited. All rights reserved
can be encircled in the (dE, dC ) plane by varying these two parameters,as seen in Fig. 3.
Two parameters of the model, (dE, dC), approximately correspondto the varying parameters (R, d) of our exciton-polariton billiard. Theradius R mostly affects the real part of the potential, V9(r), and hencethe energy difference between the modes. Increasing R corresponds toa tighter spatial confinement and therefore to increasing dE. In turn,the thickness d of the billiard walls controls the gain/loss profile V0(r).Different modes have different spatial overlaps with the imaginarypotential V0(r), and, therefore, are characterized by different integral(spatially averaged) dissipation parameters C1,2 (see Methods). In ourcase, increasing d corresponds to decreasing dC. The effective couplingq in our model (equation (1)) is determined by the spatial overlapbetween the two modes away from the hybridization region9. Thered and blue curves in Fig. 3 show the crossing/anti-crossing behaviourof the real and imaginary parts of the eigenvalues versus the energydifference dE for two values of the dissipation parameter: dC , dCEP
and dC . dCEP. This behaviour is perfectly consistent with that in theexperimental Fig. 2, which means that our range of varying parametersincludes the exceptional point.
The structure of the complex eigenvalues in the vicinity of theexceptional point reveals non-trivial topology of a branch-pointtype13–22, shown in Fig. 3. Therefore, continuous encircling of thenon-Hermitian degeneracy in the two-parameter plane (for example,along the green contour in Fig. 3) results in the transition to the otherbranch. When the contour is traversed twice, we return to the originalmode, most significantly with a topological phase shift of p. Thisphase shift is the manifestation of the Berry phase resulting fromencircling of a non-Hermitian degeneracy in a two-dimensional para-meter space23,24. We use the method suggested in the microwaveexperiment24 to trace the above topological structure of two modesin the vicinity of the exceptional point. We compare the eigenmodes atneighbouring values of parameters (dE, dC ) , (R, d) along the contourencircling the exceptional point (see Fig. 3). Notably, we do not con-sider adiabatic evolution of modes due to variations of the parameters(R, d) in time; such evolution would be accompanied by unavoidablenon-adiabatic transitions in the non-Hermitian case29,30. Rather, weexamine the natural topological structure and geometrical connectionof stationary modes depending on the parameter values.
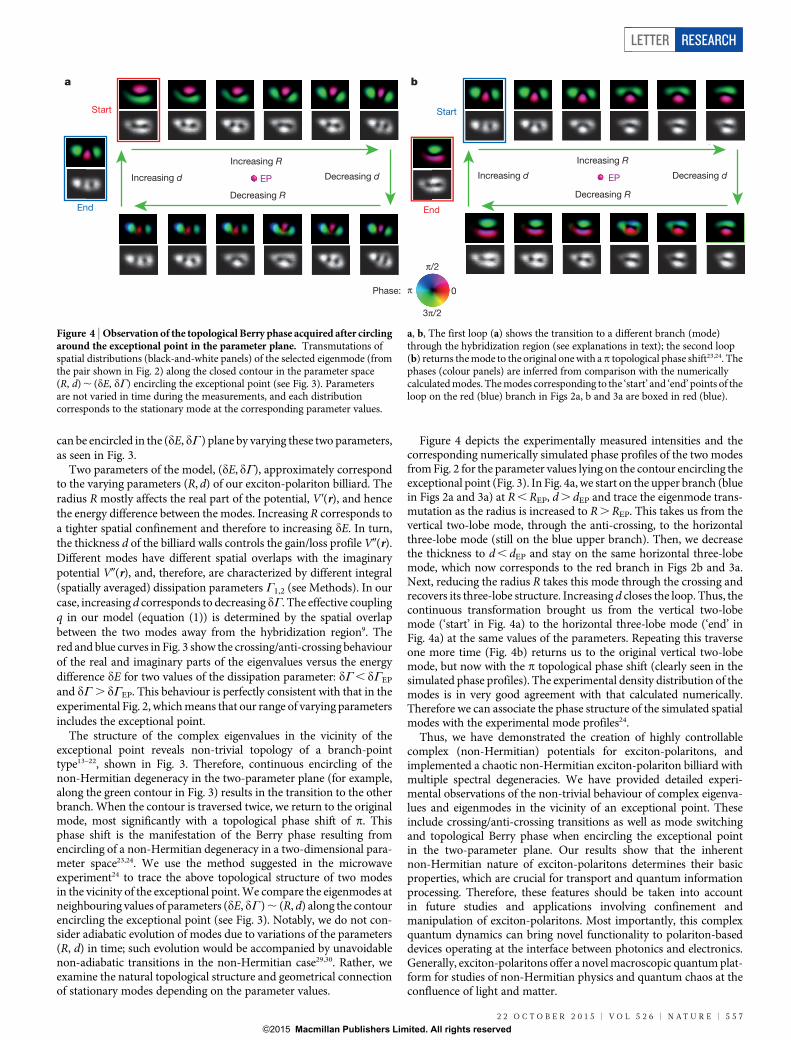
Figure 4 depicts the experimentally measured intensities and thecorresponding numerically simulated phase profiles of the two modesfrom Fig. 2 for the parameter values lying on the contour encircling theexceptional point (Fig. 3). In Fig. 4a, we start on the upper branch (bluein Figs 2a and 3a) at R , REP, d . dEP and trace the eigenmode trans-mutation as the radius is increased to R . REP. This takes us from thevertical two-lobe mode, through the anti-crossing, to the horizontalthree-lobe mode (still on the blue upper branch). Then, we decreasethe thickness to d , dEP and stay on the same horizontal three-lobemode, which now corresponds to the red branch in Figs 2b and 3a.Next, reducing the radius R takes this mode through the crossing andrecovers its three-lobe structure. Increasing d closes the loop. Thus, thecontinuous transformation brought us from the vertical two-lobemode (‘start’ in Fig. 4a) to the horizontal three-lobe mode (‘end’ inFig. 4a) at the same values of the parameters. Repeating this traverseone more time (Fig. 4b) returns us to the original vertical two-lobemode, but now with the p topological phase shift (clearly seen in thesimulated phase profiles). The experimental density distribution of themodes is in very good agreement with that calculated numerically.Therefore we can associate the phase structure of the simulated spatialmodes with the experimental mode profiles24.
Thus, we have demonstrated the creation of highly controllablecomplex (non-Hermitian) potentials for exciton-polaritons, andimplemented a chaotic non-Hermitian exciton-polariton billiard withmultiple spectral degeneracies. We have provided detailed experi-mental observations of the non-trivial behaviour of complex eigenva-lues and eigenmodes in the vicinity of an exceptional point. Theseinclude crossing/anti-crossing transitions as well as mode switchingand topological Berry phase when encircling the exceptional pointin the two-parameter plane. Our results show that the inherentnon-Hermitian nature of exciton-polaritons determines their basicproperties, which are crucial for transport and quantum informationprocessing. Therefore, these features should be taken into accountin future studies and applications involving confinement andmanipulation of exciton-polaritons. Most importantly, this complexquantum dynamics can bring novel functionality to polariton-baseddevices operating at the interface between photonics and electronics.Generally, exciton-polaritons offer a novel macroscopic quantum plat-form for studies of non-Hermitian physics and quantum chaos at theconfluence of light and matter.
a
Start
End
Decreasing dIncreasing d
Increasing R
Decreasing R
EP
b
Start
End
Decreasing dIncreasing d
Increasing R
Decreasing R
EP
0
π/2
π
3π/2
Phase:
Figure 4 | Observation of the topological Berry phase acquired after circlingaround the exceptional point in the parameter plane. Transmutations ofspatial distributions (black-and-white panels) of the selected eigenmode (fromthe pair shown in Fig. 2) along the closed contour in the parameter space(R, d) , (dE, dC) encircling the exceptional point (see Fig. 3). Parametersare not varied in time during the measurements, and each distributioncorresponds to the stationary mode at the corresponding parameter values.
a, b, The first loop (a) shows the transition to a different branch (mode)through the hybridization region (see explanations in text); the second loop(b) returns the mode to the original one with a p topological phase shift23,24. Thephases (colour panels) are inferred from comparison with the numericallycalculated modes. The modes corresponding to the ‘start’ and ‘end’ points of theloop on the red (blue) branch in Figs 2a, b and 3a are boxed in red (blue).
2 2 O C T O B E R 2 0 1 5 | V O L 5 2 6 | N A T U R E | 5 5 7
LETTER RESEARCH
G2015 Macmillan Publishers Limited. All rights reserved
Online Content Methods, along with any additional Extended Data display itemsandSourceData, are available in the online version of the paper; references uniqueto these sections appear only in the online paper.
Received 4 April; accepted 18 August 2015.
Published online 12 October 2015.
1. Kasprzak, J. et al. Bose–Einstein condensation of exciton polaritons. Nature 443,409–414 (2006).
2. Deng, H., Haug, H. & Yamamoto, Y. Exciton-polariton Bose–Einstein condensation.Rev. Mod. Phys. 82, 1489–1537 (2010).
3. Carusotto, I. &Ciuti, C.Quantum fluidsof light. Rev.Mod.Phys.85, 299–366 (2013).4. Moiseyev, N. Non-Hermitian Quantum Mechanics (Cambridge Univ. Press, 2011).5. Bender, C. M. Making sense of non-Hermitian Hamiltonians. Rep. Prog. Phys. 70,
947–1018 (2007).6. Savvidis, P. G. et al. Off-branch polaritons and multiple scattering in
semiconductor microcavities. Phys. Rev. B 64, 075311 (2001).7. Berry, M. V. Quantizing a classically ergodic system: Sinai’s billiard and the KKR
method. Ann. Phys. 131, 163–216 (1981).8. Guhr, T., Muller-Groeling, A. & Weidenmuller, H. A. Random-matrix theories in
quantum physics: common concepts. Phys. Rep. 299, 189–425 (1998).9. Bliokh, K. Y.,Bliokh, Y.P., Freilikher, V., Genack, A. Z.&Sebbah,P.Coupling and level
repulsion in the localized regime: from isolated to quasiextended modes. Phys.Rev. Lett. 101, 133901 (2008).
10. Tosi, G. et al. Sculpting oscillators with light within a nonlinear quantum fluid.Nature Phys. 8, 190–194 (2012).
11. Sanvitto, D. et al. All-optical control of the quantum flow of a polariton condensate.Nature Photon. 5, 610–614 (2011).
12. Dall, R. et al. Creation of orbital angular momentum states with chiral polaritoniclenses. Phys. Rev. Lett. 113, 200404 (2014).
13. Berry,M.V.Physics ofnon-Hermitiandegeneracies.Czech. J. Phys.54,1039–1047(2004).
14. Heiss, W. D. The physics of exceptional points. J. Phys. Math. Gen. 45, 444016(2012).
15. Guo, A. et al. Observation of PT-symmetry breaking in complex optical potentials.Phys. Rev. Lett. 103, 093902 (2009).
16. Peng, B. et al. Loss-induced suppression and revival of lasing. Science 346,328–332 (2014).
17. Sun, Y., Tan, W., Li, H.-Q., Li, J. & Chen, H. Experimental demonstration of acoherent perfect absorber with PT phase transition. Phys. Rev. Lett. 112, 143903(2014).
18. Dembowski, C. et al. Observation of a chiral state in a microwave cavity. Phys. Rev.Lett. 90, 034101 (2003).
19. Cao, H. & Wiersig, J. Dielectric microcavities: model systems for wave chaos andnon-Hermitian physics. Rev. Mod. Phys. 87, 61–111 (2015).
20. Dembowski, C. et al. Experimental observation of the topological structure ofexceptional points. Phys. Rev. Lett. 86, 787–790 (2001).
21. Lee, S.-B. et al. Observation of an exceptional point in a chaotic optical microcavity.Phys. Rev. Lett. 103, 134101 (2009).
22. Choi, Y. et al. Quasi-eigenstate coalescence in an atomic-cavity quantumcomposite. Phys. Rev. Lett. 104, 153601 (2010).
23. Heiss, W. D. Phases of wave functions and level repulsion. Eur. Phys. J. D 7, 1–4(1999).
24. Dembowski, C. et al. Encircling an exceptional point. Phys. Rev. E 69, 056216(2004).
25. Akis, R., Ferry, D. K. & Bird, J. P. Wave function scarring effects in open stadiumshaped quantum dots. Phys. Rev. Lett. 79, 123–126 (1997).
26. Milner, V., Hanssen, J. L., Campbell, W. C. & Raizen, M. G. Optical billiards for atoms.Phys. Rev. Lett. 86, 1514–1517 (2001).
27. Kaplan, A., Friedman, N., Anderson, M. & Davidson, N. Observation of islands ofstability in soft wall atom-optics billiards. Phys. Rev. Lett. 87, 274101 (2001).
28. Ponomarenko, L. A. et al. Chaotic Dirac billiard in graphene quantum dots. Science320, 356–358 (2008).
29. Uzdin, R., Mailybaev, A. & Moiseyev, N. On the observability and asymmetry ofadiabatic state flips generatedbyexceptionalpoints. J. Phys. A 44,435302(2011).
30. Berry,M. V. & Uzdin, R. Slownon-Hermitian cycling: exact solutions and the Stokesphenomenon. J. Phys. A 44, 435303 (2011).
Acknowledgements WethankM.Berry and O.Kirillov for comments. This researchwassupported by the Australian Research Council, the ImPACT Program of the Council forScience, Technology and Innovation (Cabinet Office, Government of Japan), the RIKENiTHES Project, the MURI Center for Dynamic Magneto-Optics, a Grant-in-Aid forScientific Research (type A), and the State of Bavaria.
Author Contributions E.A.O., T.G., E.E. and K.Y.B. conceived the idea for this research;T.G., E.E., M.D.F., R.G.D. and A.G.T. designed and built the experiment with conceptualcontributions from E.A.O.; T.G., E.E. and R.G.D. collected and analysed experimentaldata; K.Y.B, E.E., T.C.H.L. and E.A.O. performed theoretical and numerical analysis; S.B.,M.K., C.S. and S.H. fabricated and characterized the semiconductor microcavity; E.A.O.and K.Y.B. wrote the paper with input from T.G., E.E. and T.C.H.L.; F.N., M.D.F., A.G.T, S.H.,Y.Y. and Y.S.K. contributed to discussions and the shaping of the manuscript.
Author Information Reprints and permissions information is available atwww.nature.com/reprints. The authors declare no competing financial interests.Readers are welcome to comment on the online version of the paper.Correspondence and requests for materials should be addressed to E.A.O.([email protected]).
5 5 8 | N A T U R E | V O L 5 2 6 | 2 2 O C T O B E R 2 0 1 5
RESEARCH LETTER
G2015 Macmillan Publishers Limited. All rights reserved
METHODSExperimental setup. The semiconductor sample used in the experiment is aGaAs/AlGaAs microcavity containing 12 quantum wells (QWs) (,13 nm wideeach) sandwiched between distributed Bragg reflector mirrors (32/36 mirrorpairs). To achieve the strong interaction regime between cavity photons andquantum-well excitons1,31, the quantum wells are distributed in the sample viathree sets of four located at the anti-nodes of the photon mode. The cavity photonmode is red-detuned by 2.8 meV from the exciton resonance at 1.546 eV, resultingin the exciton-polariton dispersion schematically shown in Fig. 1a. The sample ismounted on a cold finger inside a continuous flow microscopy cryostat andmaintained at 5.6 K.
A schematic of the experimental apparatus is shown in Extended Data Fig. 1.The exciton-polariton condensate is formed by illuminating the sample by a quasi-continuous, off-resonant, linearly polarized pump beam derived from a continu-ous wave (CW) Ti:sapphire laser operating at 732 nm. The threshold power for thecondensation is ,0.079 mWmm22. To minimize heating of the sample, the pumpbeam is chopped by an acoustic optical modulator (AOM). We use a digitalmicromirror device (DMD) to engineer the spatial pump profile in the shape ofa Sinai billiard shown in Fig. 1b, which is then re-imaged onto the sample atnormal incidence through a high numerical aperture (NA) microscope objective.
Owing to the continuous decay of the exciton-polaritons, coherent photonsescape the cavity as a photoluminescence signal and carry all the informationabout the condensate1. The photoluminescence is then collected via the micro-scope objective and analysed using the CCD camera and spectrometer (ExtendedData Fig. 1). We reconstruct the spatial modes by scanning the real space imagingacross the slit of the spectrometer.Creating exciton-polariton billiards. The DMD mirror is programmed to reflectthe spatial pattern shown in Extended Data Fig. 2, thus creating a structured pumpbeam in the shape of a Sinai billiard32. The pump creates an inhomogeneousdistribution of reservoir excitons in the plane of the quantum well, thereforeinducing an effective potential for the condensed exciton-polaritons10.
The two parameters of the billiard controlling the non-Hermitian dynamics ofexciton-polaritons are the radius of the round corner (defect), R, and the thicknessof the walls, d. The latter is different on the different sides of the perimeter due tothe shape of the laser beam illuminating the DMD. Throughout the main text, weconsider a continuous change of R (0 , R/W , 1), but only two modifications of d(shown in Extended Data Fig. 2).
We have verified that, for any R, when the thickness of the walls is variedwithin our experimental range, the pump power density remains approximatelyconstant. For the ‘thin’ and ‘thick’ wall configurations shown in ExtendedData Fig. 2, the values are 0.11060.0033 mWmm22 (Extended Data Fig. 2a)and 0.11760.0047 mWmm22 (Extended Data Fig. 2b), respectively. This effec-tively means that the height of the billiard potential walls, defined by the pumppower, remains the same. Since the internal area and hence geometry of the billiarddoes not depend on d either, this leads us to conclude that the wall thicknesscontrols mainly the imaginary part of the billiard potential.Spectroscopy of the billiard. Above the condensation threshold, exciton-polar-itons occupy multiple energy levels of the billiard potential, and in our experimentswe comfortably resolve approximately the first 15 levels in the energy versusposition spectrum. As the radius of the defect in the Sinai billiard grows, the areaof the potential confining exciton-polaritons shrinks, so that the energy levels areblueshifted (see Fig. 1c, d). The spectral line profiles measured at fixed spatialpositions in the vicinity of degeneracy highlighted in Fig. 1c, d are shown inExtended Data Fig. 3. The line profiles obtained for several values of the defectradius within the range (0.4 , R/W , 0.65) are plotted on the same plot and theirrelative blueshift is represented by the offset on the intensity axis.
Positions of the individual energy levels (Fig. 2a, b) for different values of R arederived from the spectroscopic peaks, as schematically shown in Extended DataFig. 3, and the linewidths (Fig. 2c, d) are determined by the numerical fitting of thespectral profile. The errors indicated in Fig. 2 arise from the numerical fittingprocedure and therefore are very small.Modelling of the billiard. The full dynamics of the exciton-polariton condensatesubject to off-resonant, incoherent optical pumping can be described by the gen-eralized complex Gross–Pitaevskii (or Ginzburg–Landau) equation33–35 for thecondensate wavefunction, y:
i�hLy(r , t)
Lt~ {
�h2
2m+2z(g{icnl) yj j2z(gRzi�hR)nR(r){i�hc
� �yzi�h<½y(r , t)�
ð2ÞHere m is the effective mass of the lower polariton, g is the polariton–polaritoninteraction strength, gR is the strength of interaction between the reservoir andcondensed polaritons, R is the rate of stimulated scattering into the condensedstate, and c is the spatially homogeneous decay rate of polaritons. The reservoir
density distribution nR(r) / P(r) is defined by the rate of reservoir (excitonic)polariton injection per unit area and time, P(r). The parameter cnl entering equa-tion (2) characterizes gain saturation and, in general, depends on the spatialdistribution of the pump. In our numerical calculations, we take the cnl to be smalland spatially homogeneous due to the weak overlap between the condensate andthe pumping area.The model, equation (2), was initially suggested phenomenologically33 and sub-sequently derived from the semiclassical Maxwell–Bloch equations34. It qualita-tively coincides with the generalized open-dissipative Gross–Pitaevskii model36
augmented with the rate equation for the excitonic reservoir density:
LNR
Lt~P (r){ cRzR yj j2
� �NR
in the regime of near-threshold pumping37. In this limit, the steady state reservoirdensity distribution can be expressed as NR<P rð Þ=cR{RP rð Þ yj j2
�c2
R~nR rð Þ{cnl�h
{1R{1 yj j2, where cR is the decay rate of reservoir polaritons.The phenomenological energy relaxation35,38,39, which is essential to
adequately model the multi-mode nature of the condensate38, is taken in thefollowing form35,38:
< y r , tð Þ½ �~anR m r, tð Þ{i�hLLt
� �y r, tð Þ
where a is the energy relaxation rate, and m(r, t) is a local chemical potential ofthe condensate.
We use equation (2) to obtain the structure of the spatial modes of the exciton-polariton condensate corresponding to peaks of the energy spectrum. Theparameters of the model used for our dynamical simulations are as follows:m 5 5 3 1025 me, where me is the free electron mass, g 5 2 3 1023 meVmm2,gR 5 2g, �hR 5 6 3 1024 meVmm2, c 5 0.1 ps21, cnl 5 0.3g, a 5 1.2 3 1023mm2
ps21 meV21. The effective potential height is max(V9) 5 2.25 meV, and the bil-liard wall profile given by the reservoir density distribution, nR(r), is convolutedwith a Gaussian profile to account for the ‘soft’ edges of the potential created by theoptical excitation and exciton diffusion.
The spatial modes computed numerically using the fully nonlinear, open-dis-sipative dynamical model, equation (2), are presented in the bottom row ofExtended Data Fig. 4. For comparison, the middle row of Extended Data Fig. 4shows the single-particle eigenstates of the complex linear potential induced by theexcitonic reservoir: V rð Þ~V 0ziV 00:gRnR rð Þzi�h RnR rð Þ{c½ �, with both realand imaginary parts V9, V0 proportional to the pumping rate36, P(r). One cansee that the condensate dynamics described by equation (2) effectively populatesthe eigenstates of the linear complex effective potential. The validity of our modelis confirmed by the excellent agreement with the experimental images of thebilliard modes presented in the top row of Extended Data Fig. 4.
In agreement with previous studies40, the nonlinearity due to exciton-polaritoninteractions strongly determines the relative population of the eigenstates, as wellas the overall blueshift of the eigenenergies. The eigenenergies are complex, and sothe spectral linewidths may exceed the level separation. For this reason, in ourexperiment some of the higher-order energy-filtered wavefunctions representsuperpositions of neighbouring eigenstates. For example, the seventh mode mea-sured in the experiment (last column in Extended Data Fig. 4) is, in fact, a super-position of eigenstates eight and nine, as revealed by the comparison with thenumerically calculated modes. In contrast, the lower-order modes in ExtendedData Fig. 4 represent almost pure eigenstates, having a very weak (less that 10%)admixture of the neighbouring eigenstates.Hybridization of modes. Hybridization of modes occurs in the vicinity of cross-ing and anti-crossing of the energy levels in Fig. 2a and b. In these regions,the billiard modes are different in shape to the uncoupled modes away from the(near-)degeneracy. In experiments, it is hard to spectrally resolve pure modes inthe hybridization region since their spectral linewidths exceed the peak separation.Therefore, what is experimentally imaged and shown in the insets of Fig. 2a and bis a superposition of two modes. This is especially true for Fig. 2b, where thespectral peaks (but not the linewidths) precisely coincide at the crossing, so thatin the experiment we can only image a single mode corresponding to a single peak.
To match the spatial distributions obtained in the experiment with those foundnumerically, we plot superpositions of the pure eigenstates found in numericalsimulations: Qs~aQ3zbQ4eiq, where Q3,4 are the pure eigenstates 3 and 4, a and bare their relative amplitudes, and q is the relative phase. We find that only therelative phase q 5p/2 can produce a superposition that fits well with the experi-ment. These spatial modes (pure and superposition states) for the thick and thinbilliard in the hybridization region (anti-crossing and crossing of eigenenergies,respectively) are shown in Extended Data Fig. 5.
Note that this mode mixing is performed only in the hybridization region. Awayfrom this region, the experimentally imaged and numerically calculated modes
LETTER RESEARCH
G2015 Macmillan Publishers Limited. All rights reserved
match extremely well. Importantly, in Fig. 4, in order to perform a reliable phaseextraction from numerically found modes away from the (near-)degeneracy, it isabsolutely necessary to trace the continuous variation of phase of the pure modesas we pass the hybridization region. For this reason, we did not mix numericallyfound pure modes to match experimentally imaged spatial distributions of super-position states. This explains visible discrepancies between the spatial structure ofnumerically calculated and experimentally imaged modes in the hybridizationregions in Fig. 4.Coupled-mode model. The behaviour of any two non-Hermitian modes of thebilliard potential near the degeneracy point can be described by a standardcoupled-mode model written in the dimensionless form as follows:
iLyn, n’ r , tð Þ
Lt~ {+2zV ’ rð ÞziV ’’ rð Þ�
yn, n’zVyn’, n ð3Þ
where V characterizes the coupling strength between the states n and n9.Separating the temporal and spatial dependence of the wavefunctions,yn~an(t)Qn rð Þ, substituting this ansatz into equation (3), and integrating outthe spatial degrees of freedom, leads us to the eigenvalue equation (1) in the maintext, where (n, n9) 5 (1, 2). The real energies of the modes away from the degen-eracy in equation (1) are defined by the shape of the billiard potential,{+2zV ’ rð Þ�
Qn rð Þ~EnQn rð Þ, the complex parts of the eigenenergies are givenby the overlap between the billiard modes and the exciton reservoir,Cn!
ÐV ’’ rð Þ Qn rð Þj j2d2r , and the off-diagonal matrix elements in equation (1)
are determined by the degree of spatial overlap between the two modes,q!
ÐQ�n rð ÞQn’ rð Þ d2r . Here we assume that the uncoupled modes are properly
normalized.
We stress that our theory essentially uncovers the non-Hermitian features ofdegeneracies of the modes of the entire billiard, which can be considered as a two-dimensional resonator in the plane of the quantum well. This approach is con-ceptually close to, for example, the theory of two-dimensional PT-symmetricsystems41 and differs from the well developed coupled-mode theories for weaklycoupled non-Hermitian single-mode resonators.
31. Kavokin, A., Baumberg, J., Malpuech, G. & Laussy, F. Microcavities (Oxford Univ.Press, 2007).
32. Sinai, Y. G. Dynamical systems with elastic reflections. Russ. Math. Surv. 25,137–189 (1970).
33. Keeling, J. & Berloff, N. G. Spontaneous rotating vortex lattices in a pumpeddecaying condensate. Phys. Rev. Lett. 100, 250401 (2008).
34. Cristofolini, P. et al. Optical superfluid phase transitions and trapping of polaritoncondensates. Phys. Rev. Lett. 110, 186403 (2013).
35. Askitopoulos, A. et al. A robust platform for engineering pure-quantum-statetransitions in polariton condensates. Phys. Rev. B 92, 035305 (2015).
36. Wouters, M. & Carusotto, I. Excitations in a nonequilibrium Bose–Einsteincondensate of exciton polaritons. Phys. Rev. Lett. 99, 140402 (2007).
37. Smirnov, L. A., Smirnova, D. A., Ostrovskaya, E. A. & Kivshar, Yu. S. Dynamics andstability of dark solitons in exciton-polariton condensates. Phys. Rev. B 89, 235310(2014).
38. Wouters, M. Energy relaxation in the mean-field description of polaritoncondensates. New J. Phys. 14, 075020 (2012).
39. Wertz, E. et al. Propagation and amplification dynamics of 1D polaritoncondensates. Phys. Rev. Lett. 109, 216404 (2012).
40. Eastham, P. R. Mode locking and mode competition in a nonequilibrium solid-state condensate. Phys. Rev. B 78, 035319 (2008).
41. Ge, L. & Stone, A. D. Parity-time symmetry breaking beyond one dimension: therole of degeneracy. Phys. Rev. X 4, 031011 (2014).
RESEARCH LETTER
G2015 Macmillan Publishers Limited. All rights reserved
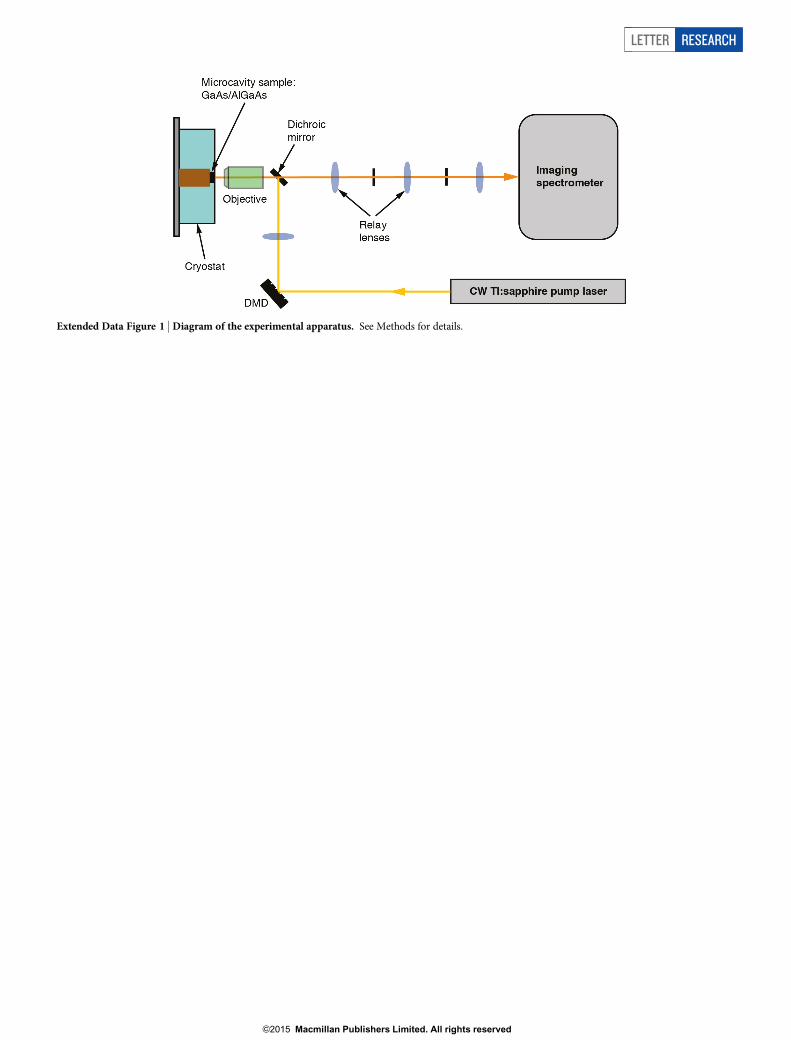
Extended Data Figure 1 | Diagram of the experimental apparatus. See Methods for details.
LETTER RESEARCH
G2015 Macmillan Publishers Limited. All rights reserved
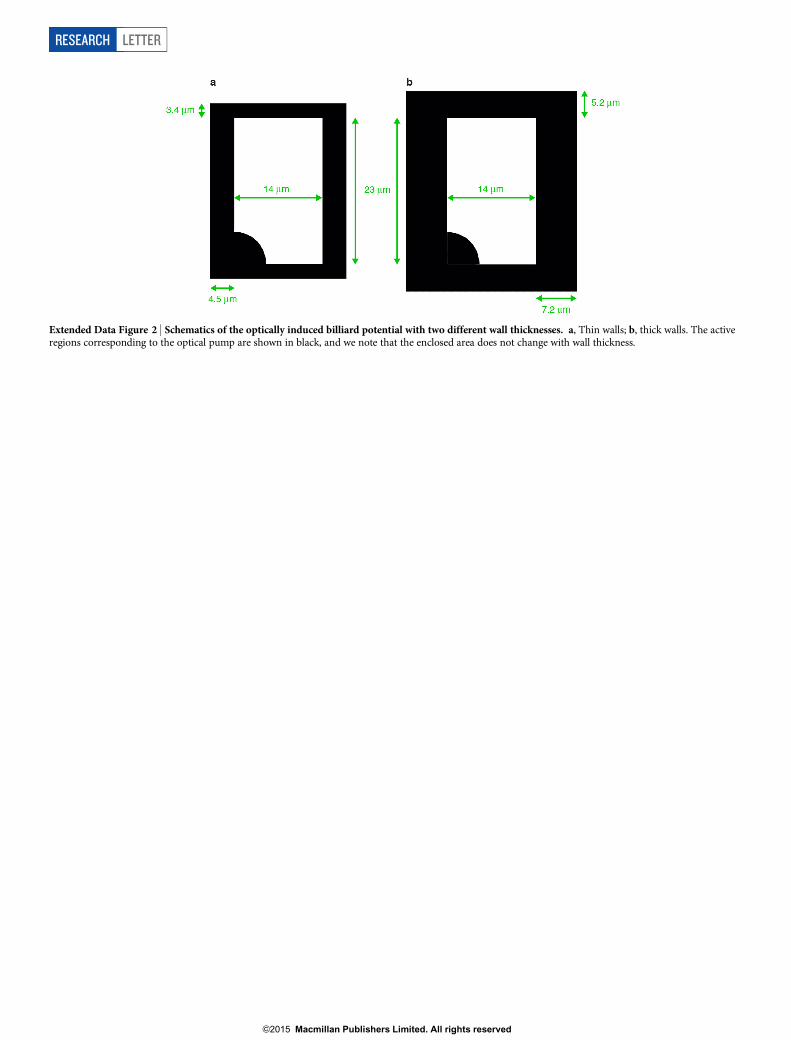
Extended Data Figure 2 | Schematics of the optically induced billiard potential with two different wall thicknesses. a, Thin walls; b, thick walls. The activeregions corresponding to the optical pump are shown in black, and we note that the enclosed area does not change with wall thickness.
RESEARCH LETTER
G2015 Macmillan Publishers Limited. All rights reserved
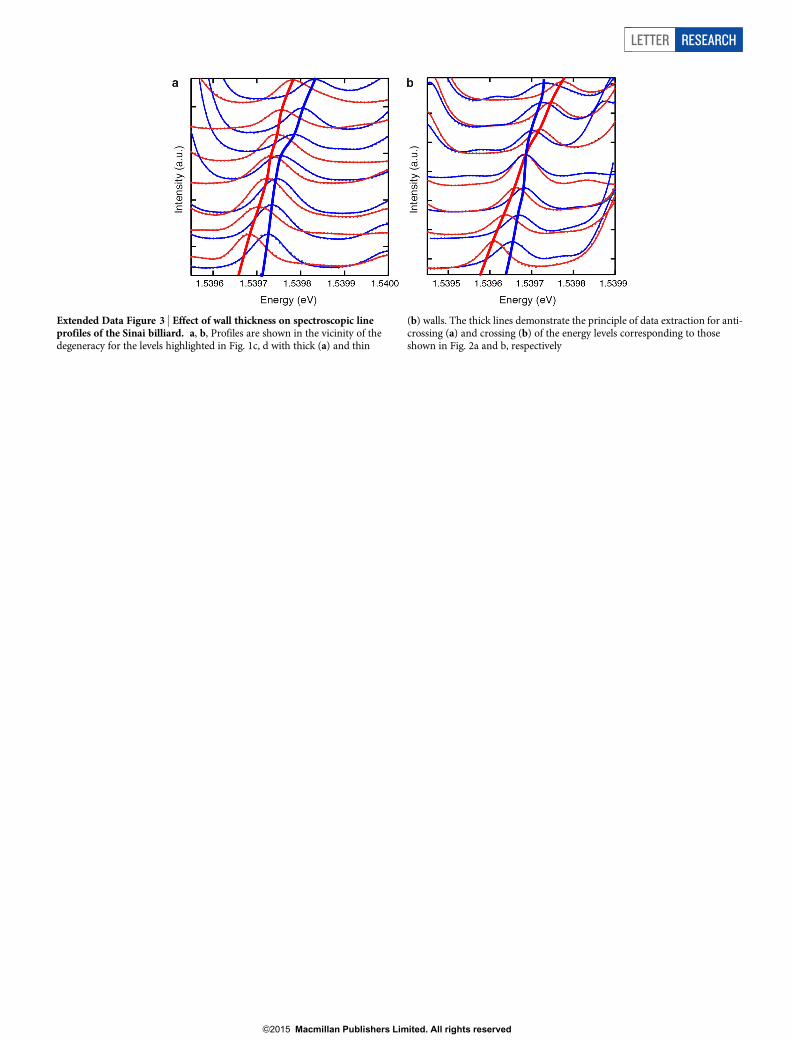
Extended Data Figure 3 | Effect of wall thickness on spectroscopic lineprofiles of the Sinai billiard. a, b, Profiles are shown in the vicinity of thedegeneracy for the levels highlighted in Fig. 1c, d with thick (a) and thin
(b) walls. The thick lines demonstrate the principle of data extraction for anti-crossing (a) and crossing (b) of the energy levels corresponding to thoseshown in Fig. 2a and b, respectively
LETTER RESEARCH
G2015 Macmillan Publishers Limited. All rights reserved
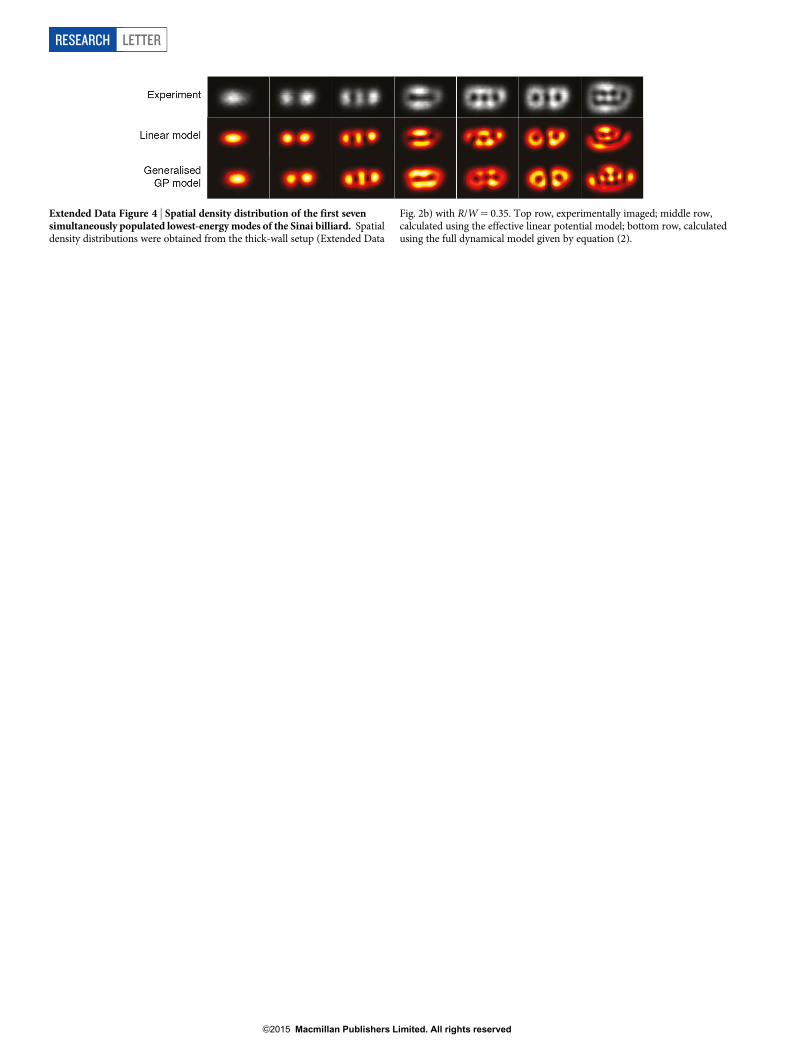
Extended Data Figure 4 | Spatial density distribution of the first sevensimultaneously populated lowest-energy modes of the Sinai billiard. Spatialdensity distributions were obtained from the thick-wall setup (Extended Data
Fig. 2b) with R/W 5 0.35. Top row, experimentally imaged; middle row,calculated using the effective linear potential model; bottom row, calculatedusing the full dynamical model given by equation (2).
RESEARCH LETTER
G2015 Macmillan Publishers Limited. All rights reserved
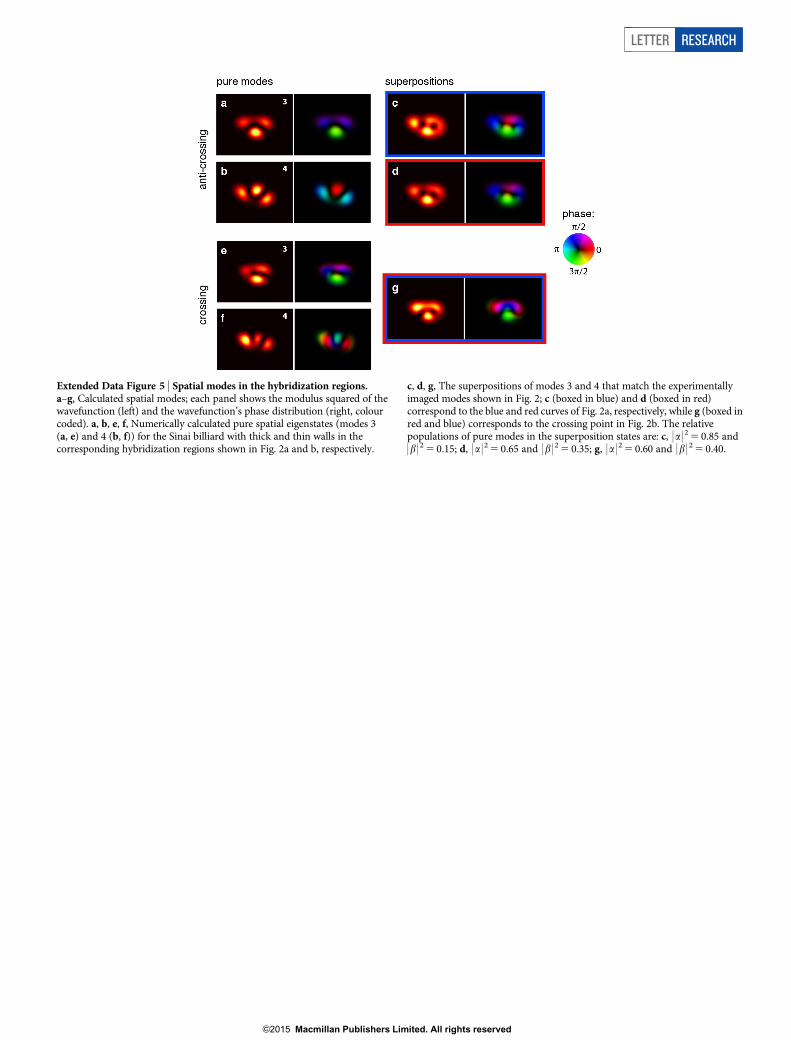
Extended Data Figure 5 | Spatial modes in the hybridization regions.a–g, Calculated spatial modes; each panel shows the modulus squared of thewavefunction (left) and the wavefunction’s phase distribution (right, colourcoded). a, b, e, f, Numerically calculated pure spatial eigenstates (modes 3(a, e) and 4 (b, f)) for the Sinai billiard with thick and thin walls in thecorresponding hybridization regions shown in Fig. 2a and b, respectively.
c, d, g, The superpositions of modes 3 and 4 that match the experimentallyimaged modes shown in Fig. 2; c (boxed in blue) and d (boxed in red)correspond to the blue and red curves of Fig. 2a, respectively, while g (boxed inred and blue) corresponds to the crossing point in Fig. 2b. The relativepopulations of pure modes in the superposition states are: c, | a | 2 5 0.85 and| b | 2 5 0.15; d, | a | 2 5 0.65 and | b | 2 5 0.35; g, | a | 2 5 0.60 and | b | 2 5 0.40.
LETTER RESEARCH
G2015 Macmillan Publishers Limited. All rights reserved