Embed Size (px)
DESCRIPTION
Jon Makler, Portland State University
Citation preview
oy���Jon Makler, AICP | @plangineering
Portland State University Oregon Transporta>on Research & Educa>on Consor>um
j���OF WEB-‐BASED, GEOSPATIAL TRANSIT PERFORMANCE DATA ARCHIVES

Morgan Harvey, Developer!Dr. Kristin Tufte, Architect!
Steve Callas Service & Performance Analysis Manager!
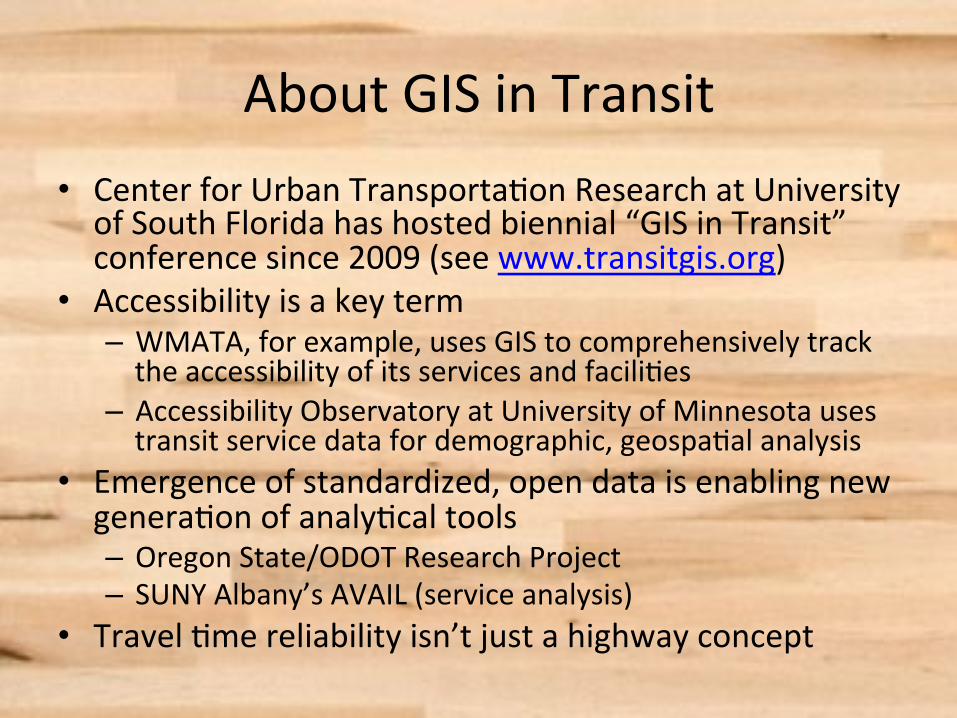
About GIS in Transit • Center for Urban Transporta5on Research at University of South Florida has hosted biennial “GIS in Transit” conference since 2009 (see www.transitgis.org)
• Accessibility is a key term – WMATA, for example, uses GIS to comprehensively track the accessibility of its services and facili5es
– Accessibility Observatory at University of Minnesota uses transit service data for demographic, geospa5al analysis
• Emergence of standardized, open data is enabling new genera5on of analy5cal tools – Oregon State/ODOT Research Project – SUNY Albany’s AVAIL (service analysis)
• Travel 5me reliability isn’t just a highway concept
Why?
• More informed decision making through visualiza5on
• Efficient support for user requests for data • Enable innova5ve performance analysis
compass.its.pdx.edu!
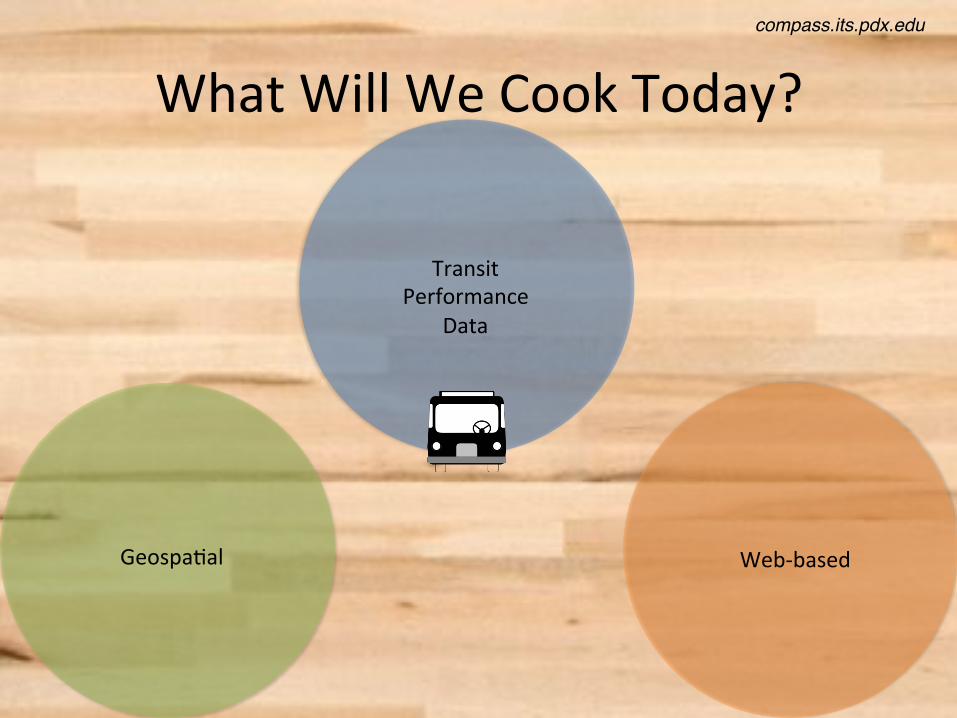
What Will We Cook Today?
Transit Performance
Data
Geospa5al Web-‐based
compass.its.pdx.edu!
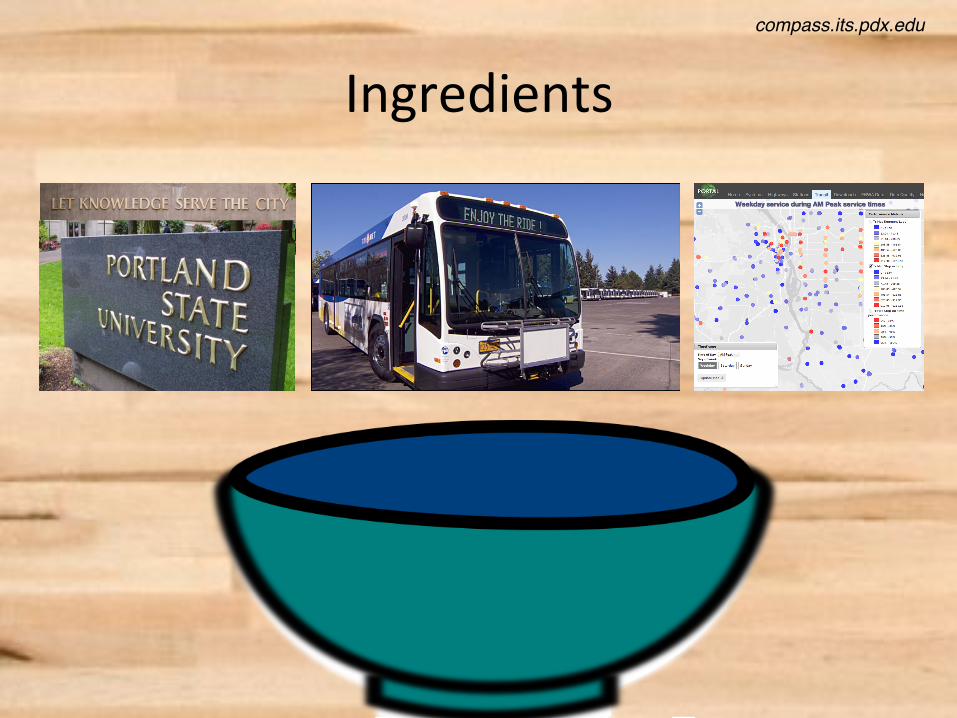
Ingredients compass.its.pdx.edu!
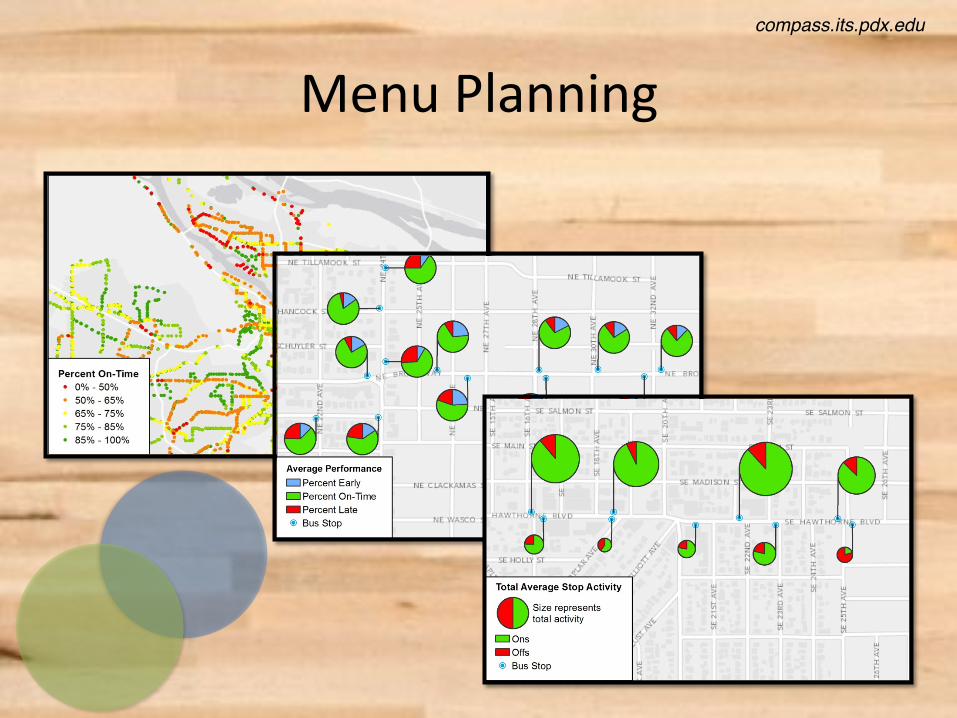
Menu Planning compass.its.pdx.edu!
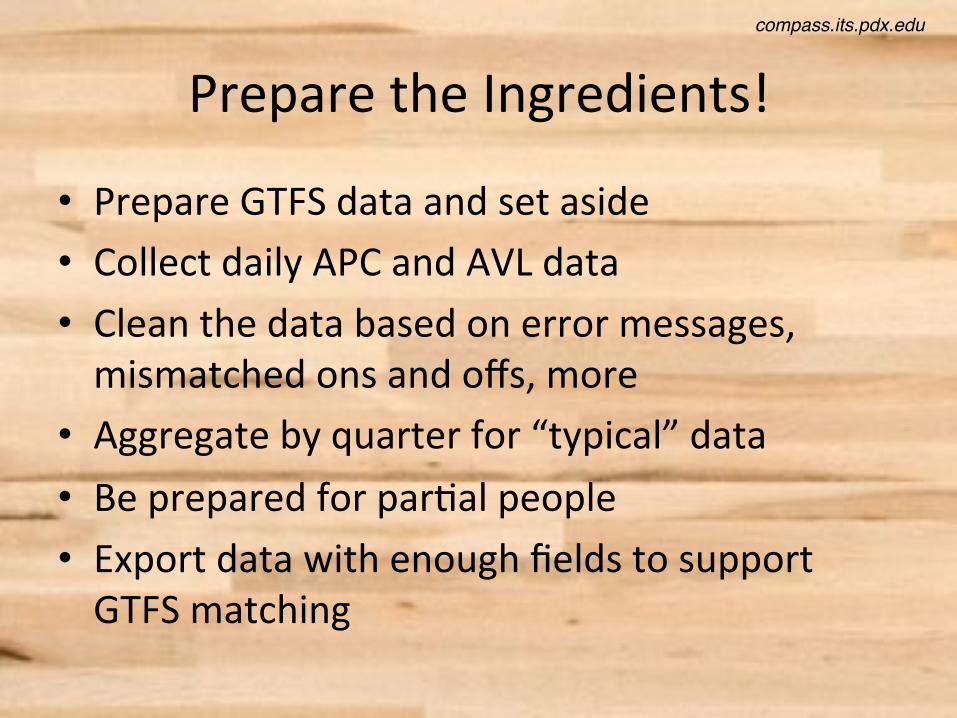
Prepare the Ingredients!
• Prepare GTFS data and set aside • Collect daily APC and AVL data • Clean the data based on error messages, mismatched ons and offs, more
• Aggregate by quarter for “typical” data • Be prepared for par5al people • Export data with enough fields to support GTFS matching
compass.its.pdx.edu!

Step 1: Convert GTFS to Feature Class compass.its.pdx.edu!
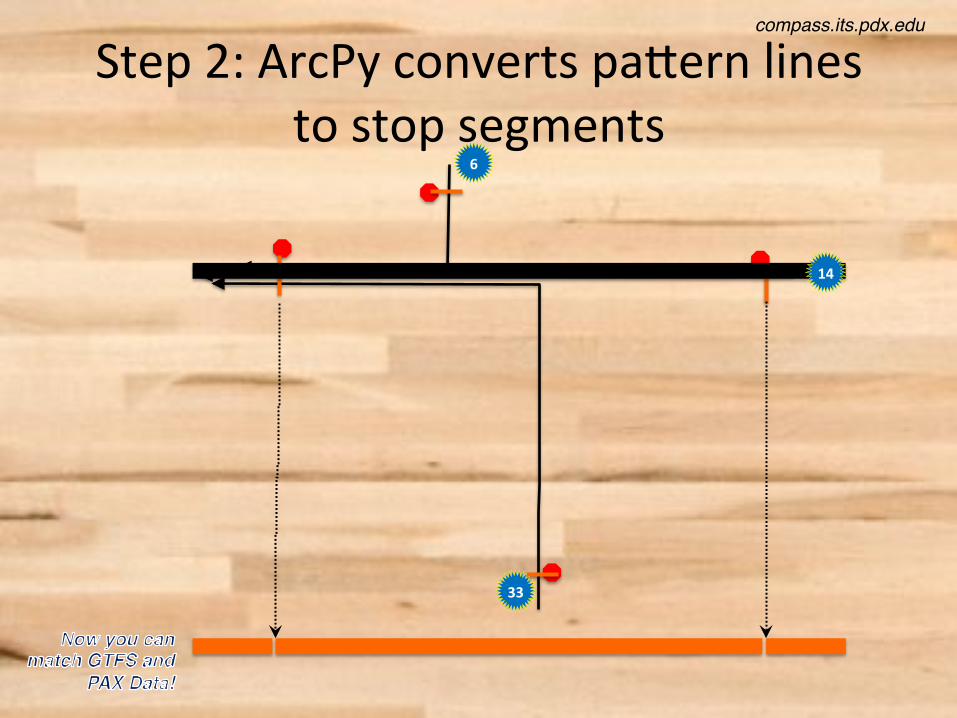
Step 2: ArcPy converts padern lines to stop segments
14
6
33
compass.its.pdx.edu!
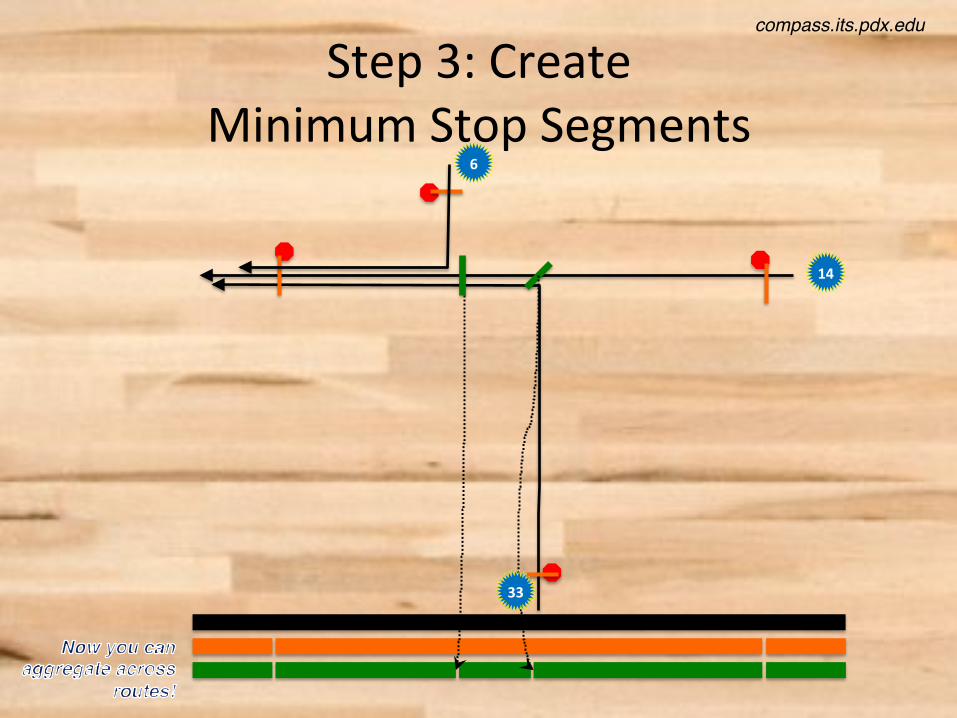
Step 3: Create Minimum Stop Segments
33
6
14
compass.its.pdx.edu!
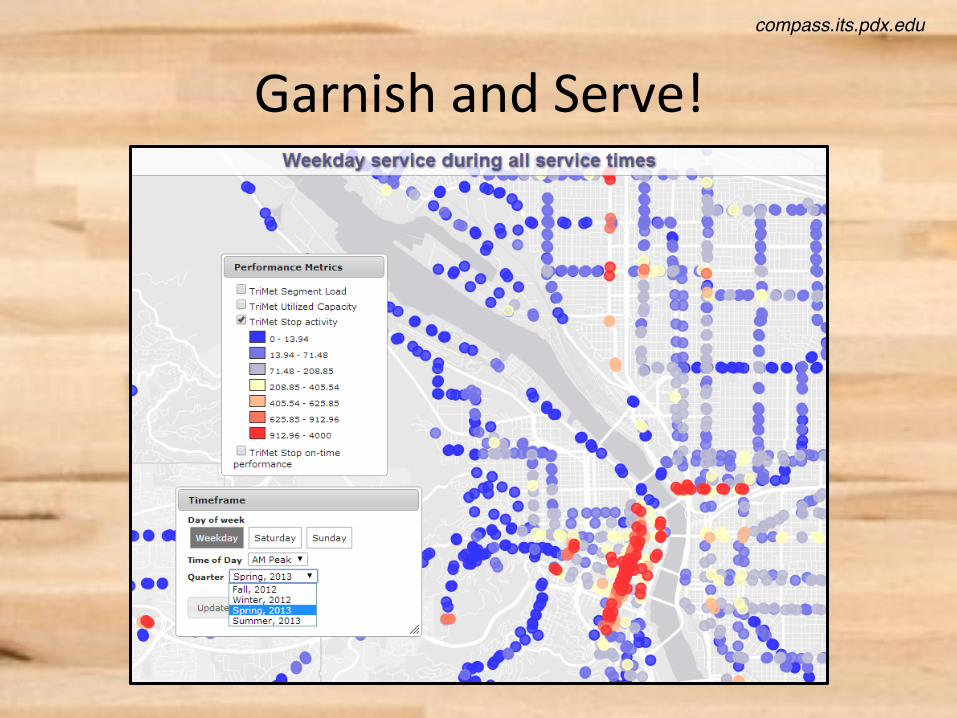
Garnish and Serve! compass.its.pdx.edu!
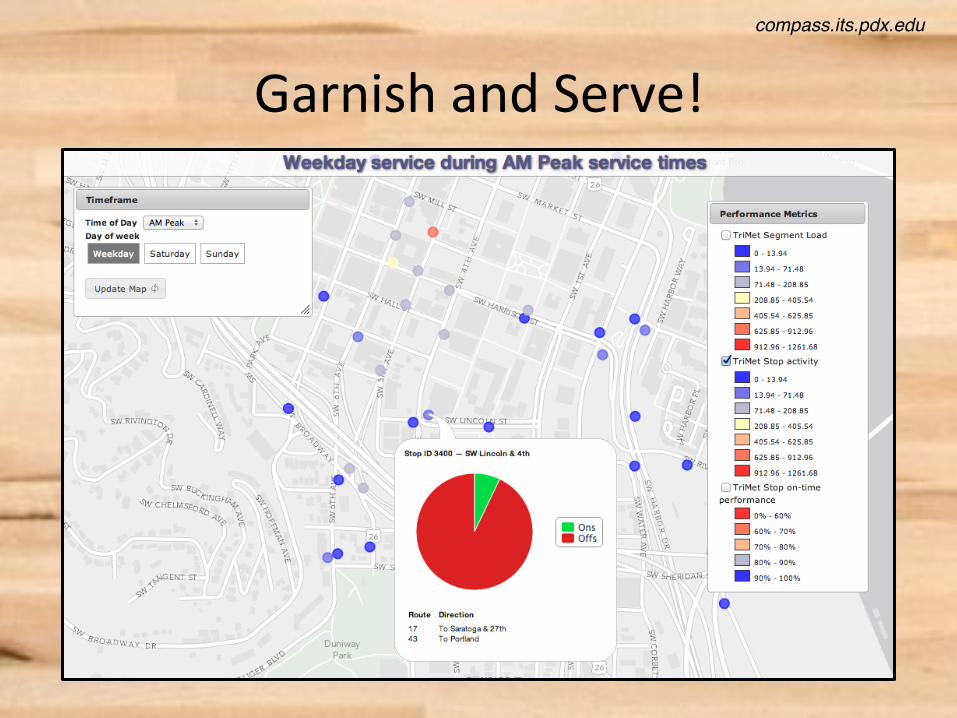
Garnish and Serve! compass.its.pdx.edu!
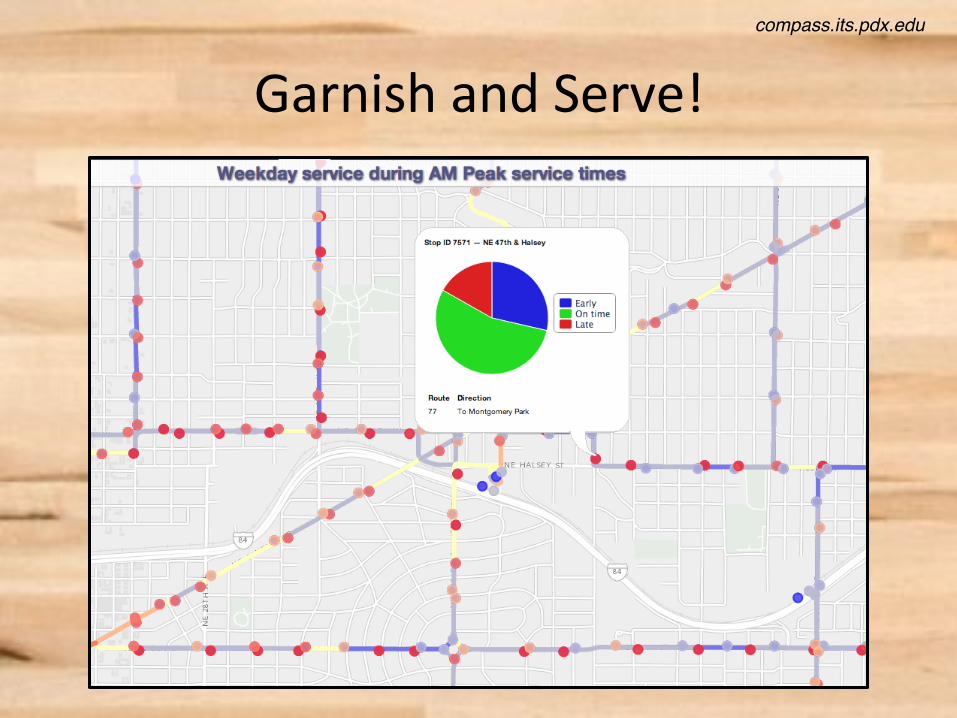
Garnish and Serve! compass.its.pdx.edu!
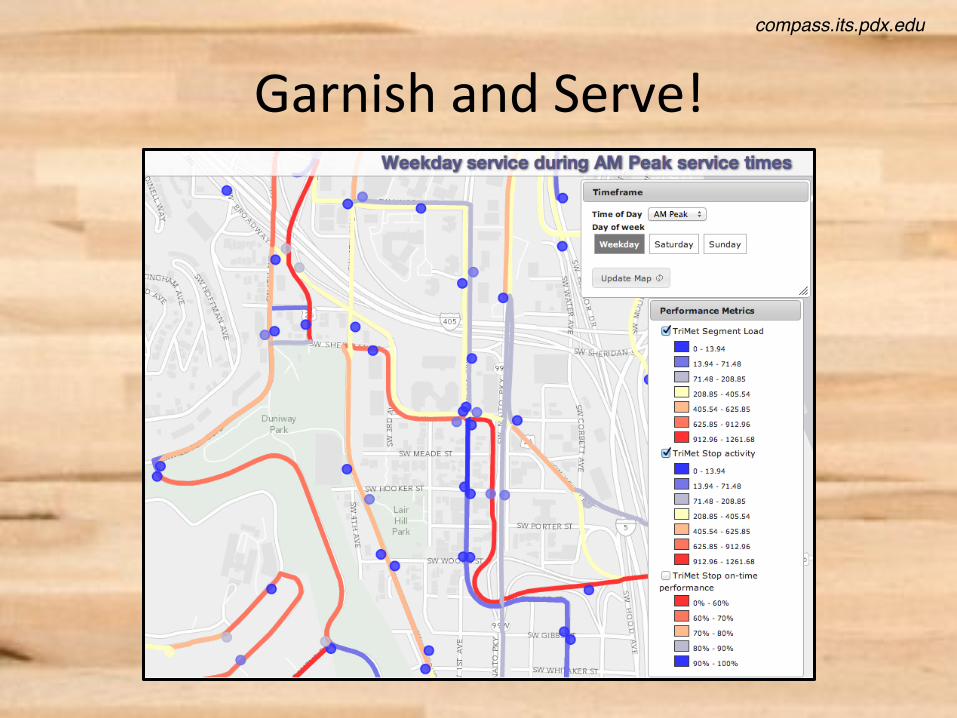
Garnish and Serve! compass.its.pdx.edu!
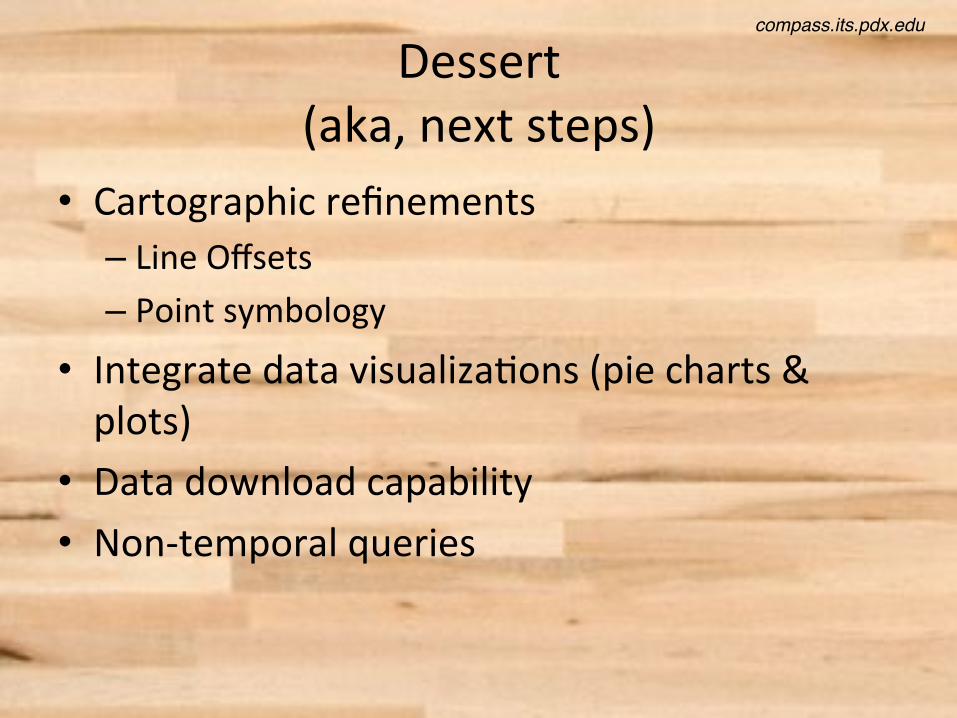
Dessert (aka, next steps)
• Cartographic refinements – Line Offsets – Point symbology
• Integrate data visualiza5ons (pie charts & plots)
• Data download capability • Non-‐temporal queries
compass.its.pdx.edu!
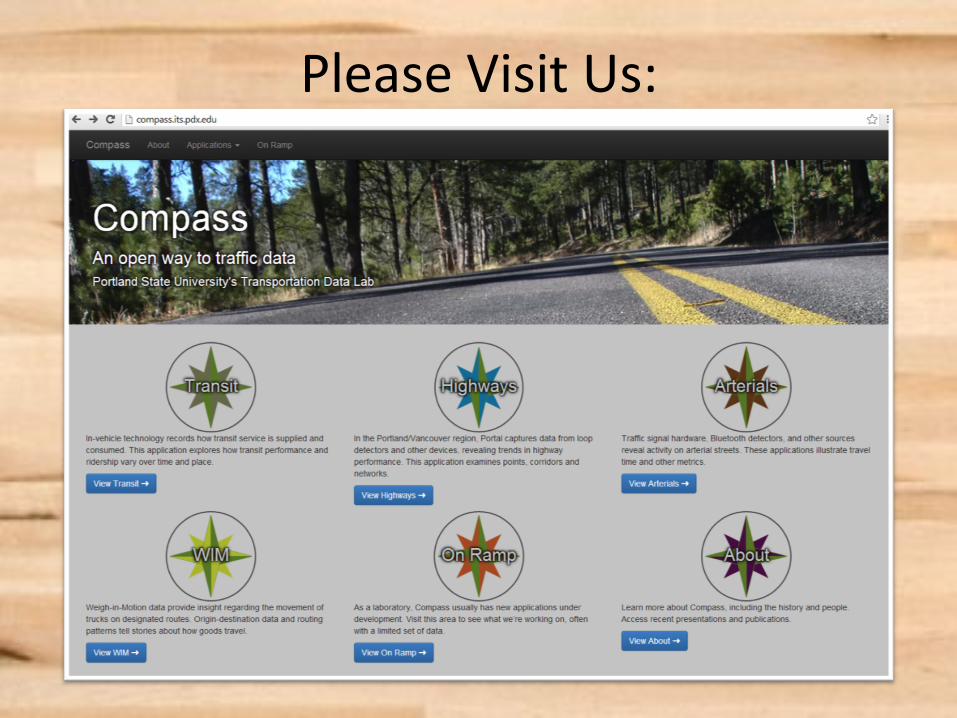
Please Visit Us:
Thank You!
Jon Makler, AICP [email protected]
Kris5n Tuje, Ph.D. [email protected]
Morgan Harvey [email protected]
compass.its.pdx.edu