Embed Size (px)
Citation preview
Max-Planck-Institutfür Meteorologie
REPORT No. 326
O
N
DIPOLE
-
LIKE
VARIABILITY
IN
THE
TROPICAL
I
NDIAN
O
CEAN
by
Astrid Baquero-Bernal and Mojib Latif
HAMBURG, August 2001
AUTHORS:
Astrid Baquero-Bernal, Max-Planck-Institut für MeteorologieMojib Latif Hamburg, Germany
MAX-PLANCK-INSTITUTFÜR METEOROLOGIEBUNDESSTRASSE 55D-20146 HAMBURGF.R. GERMANY
Tel.: +49 - (0)40 - 411 73 - 0Telefax: +49 - (0)40 - 411 73 - 298E-Mail: <name>@dkrz.de
On dipole-like variability in the tropical Indian
Ocean
Astrid Baquero-Bernal and Mojib Latif
Max-Planck Institut f�ur Meteorologie, Hamburg
E-mail: [email protected]
Submitted to Journal of Climate
ISSN 0937-1060
1
Abstract
The interannual variability of the tropical Indian Ocean sea surface temper-
ature (SST) is studied with observational data and a hierarchy of coupled
general circulation models (CGCMs). Special attention is given to the ques-
tion whether an oscillatory dipole mode exists in the tropical Indian Ocean
region with centers east and west of 80�E. Our observational analyses indi-
cate that dipole-like variability can be explained as an oscillatory mode only
in the context of ENSO (El Ni~no/Southern Oscillation).
A dipole-like structure in the SST anomalies independent of ENSO was
found also. Our series of coupled model experiments shows that ocean dy-
namics is not important to this type of dipole-like SST variability. It is forced
by surface heat ux anomalies that are integrated by the thermal inertia of
the oceanic mixed layer, which reddens the SST spectrum.
2
1 Introduction
Since the interannual variability in the tropical Indian Ocean sea surface
temperature (SST) is much weaker than that in the Paci�c, it did not re-
ceive so much attention and is less well understood than the variability in
the Paci�c. The latter is dominated by the El Ni~no/Southern Oscillation
(ENSO) phenomenon. Although ENSO originates in the tropical Paci�c, it
a�ects the global climate. Several investigations have suggested that ENSO
also in uences the Indian Ocean in di�erent ways (Latif and Barnett, 1995;
Tourre and White, 1997; Chambers et al., 1999; Venzke et al., 2000; Meyers,
1996). Other studies have suggested that a signi�cant fraction of the SST
variability is related to ENSO but that there are other factors that are also
important in determining the SST anomalies (SSTA) (Reverdin et. al, 1986:
Murtugudde, 1999). Recently, Saji et al. (1999) and Webster et al. (1999)
have proposed the existence of a coupled ocean-atmosphere mode that origi-
nates in the Indian Ocean climate system, which has characteristic seasonal
phase locking and may induce anomalous rainfall over eastern Africa and
Indonesia. Furthermore, it is argued that the mode is independent of ENSO.
The mode is referred to as the \Dipole Mode (DM)". The DM spatial struc-
ture they proposed is characterized by SSTAs of one sign in the southeastern
tropical Indian Ocean (SETIO: 90�E - 110�E, 10�S - 0�) and SSTAs of the
opposite sign in the western tropical Indian Ocean (WTIO: 50�E - 70�E, 10�S
- 10�N).
Here we investigate the interannual variability in the tropical Indian
Ocean SST and its relationship to ENSO in more detail. SST observations
and results from a series of coupled model integrations are used. We ap-
ply correlation analyses using area-averaged anomalies and the technique of
Principal Oscillation Patterns (POPs) to remove the ENSO signal. POP
analysis is designed to extract the characteristic space-time variations within
a complex multi-dimensional system (Hasselmann, 1988; von Storch et al.,
3
1988; Xu and von Storch, 1990). We show that an oscillatory dipole-like
structure like the one proposed by Saji et al. (1999) exists only as part of
the ENSO cycle. There exists, however, dipole-like variability in the Indian
Ocean independent of ENSO, but this type of variability is driven by the
atmosphere.
The paper is organized as follows. The results of the analyses of the
observed SSTs are presented in the section 2. We describe the results of the
coupled model simulations in section 3. We present our major conclusions in
section 4.
2 SST observations
We use the monthly SST dataset from the Hadley Center for Climate Pre-
diction and Research (Folland et al. 1999). Although the dataset covers the
period 1870- 1998, we analyzed only the period 1949 to 1998 which is com-
monly believed to be the most reliable period. The SSTAs were calculated by
subtracting the mean annual cycle. We consider the region 40�E to 60�W and
30�S to 30�N, which corresponds to the tropical Indian and Paci�c Oceans.
To perform the correlations between global and box-averaged SSTAs we al-
ways used mean seasonal values. We also performed a POP analysis based
on monthly values in order to identify the ENSO-related SST variability and
to remove it from the full dataset.
2.1 Analysis considering all the seasons
The correlations of the Indo-Paci�c SSTAs with box averaged SSTAs in SE-
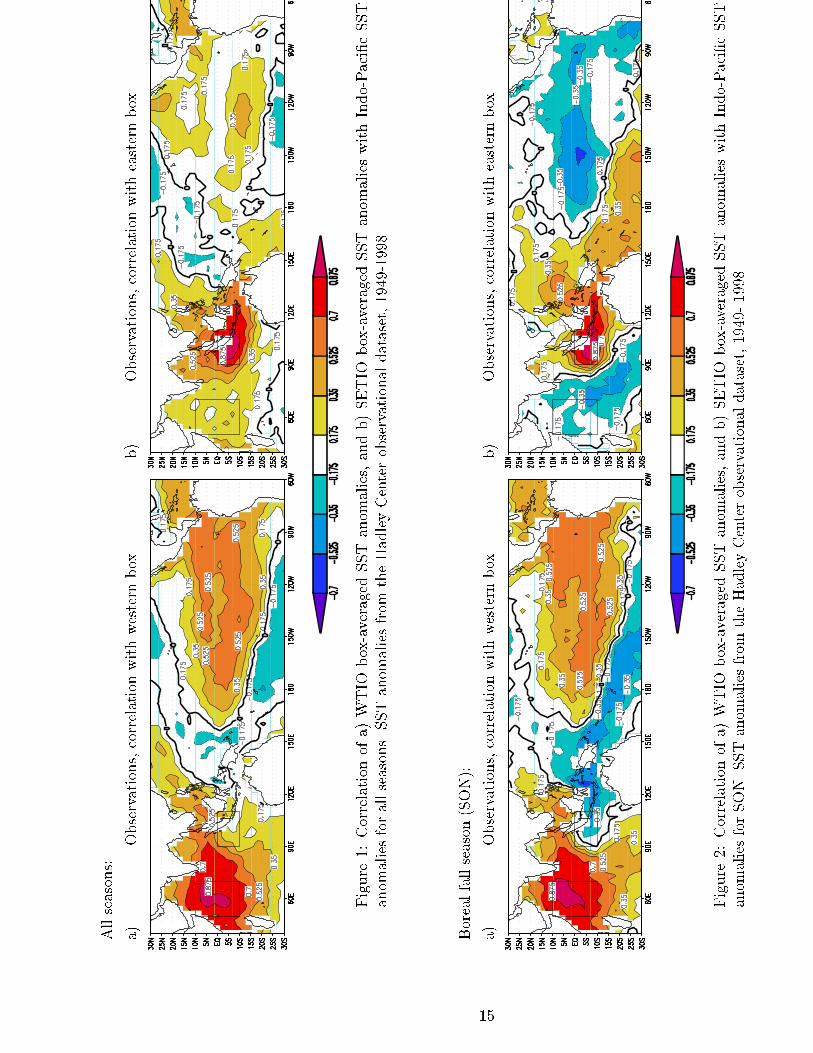
TIO and WTIO are shown in Fig. 1. The WTIO box shows signi�cant cor-
relations with equatorial SSTAs in the Paci�c Ocean, but it has no negative
correlation with the anomalies in SETIO (Fig. 1a). The SETIO box does not
show either any signi�cant positive or negative correlation with the SSTAs in
4
WTIO, and the correlations with the SSTAs in the Paci�c are smaller. Both
correlation maps (Fig. 1a and 1b) lead to the conclusion that the SSTAs in
SETIO and in WTIO are not signi�cantly negatively correlated with each
other at lag zero, which is consistent with the results of Dommenget and
Latif (2001). Additionally, we performed lagged cross-correlation analyses
between the SSTAs in SETIO and those in WTIO. We found that maxi-
mum cross-correlation (r=0.43) occurs when the SST variations in SETIO
lag those in WTIO by 1 season. Higher correlations are found when the
cross-correlation analysis is performed with respect to the Ni~no3 time series.
We found maximum cross-correlation (r=0.65) when the SSTAs in the west-
ern Indian Ocean lag those of the eastern Paci�c by about 1 season, which
is consistent with the results of Venzke et al. (2000). Maximum cross corre-
lation (r=0.48) is obtained when the SSTAs in the eastern Indian Ocean lag
those of the eastern Paci�c by 2 seasons. This lag of 2 seasons is consistent
with the fact that the SSTAs in SETIO lag those in WTIO by 1 season. At
lag zero, the correlation between WTIO and Ni~no3 time series is positive
and close to the maximum value of about 0.60. It should be noted that al-
though the maximum correlation between the SSTAs in SETIO and Ni~no3
is at lag=1 season, the correlation at lag zero is also positive and relatively
strong.
In summary, the results of the correlation analyses and the cross-correlation
analyses with respect to the SSTA in the eastern Paci�c (Ni~no3) reveal that
the SST variability in the Indian Ocean is strongly remotely forced by the
ENSO phenomenon. Furthermore, a dipole-like mode cannot be identi�ed if
all seasons are considered.
2.2 Seasonal analyses
In the next step, we computed the correlation maps for every season sepa-
rately (like those shown in Fig. 1). No negative correlation was found between
the SSTAs in SETIO and WTIO neither in winter nor in spring (not shown).
5
For the boreal summer season, there is a very weak negative correlation be-
tween the SSTAs in the WTIO and those near the western coast of Indonesia
and the north-western coast of Australia (not shown). Some stronger cross
Indian Ocean gradient, however, was found in boreal fall. More importantly,
this is the season when a strong correlation between the surface westerlies
over the equatorial Indian Ocean and the rainfall at the coast of East Africa
can be found (Hastenrath et al, 1993). Accordingly, the boreal fall season
(SON) will be considered in detail.
2.3 Analysis for SON
We turn now to the boreal fall season. The SSTAs in WTIO show negative
correlations with those in the eastern Indian Ocean, but they are restricted
to a small region (Fig. 2a). The SETIO SSTAs do show negative correlations
with those in the central Indian region, which are strongest south of the
equator (Fig. 2b). Both correlation maps, however, show that the SSTAs in
SETIO and in WTIO are not strongly negatively correlated with each other.
Furthermore, the SSTAs in the two boxes, SETIO and WTIO, are strongly
correlated with the SSTAs in the Paci�c. This contradicts the claim of Saji et
al. (1999) that there exists an ENSO-independent dipole mode, with centers
of action in WTIO and SETIO.
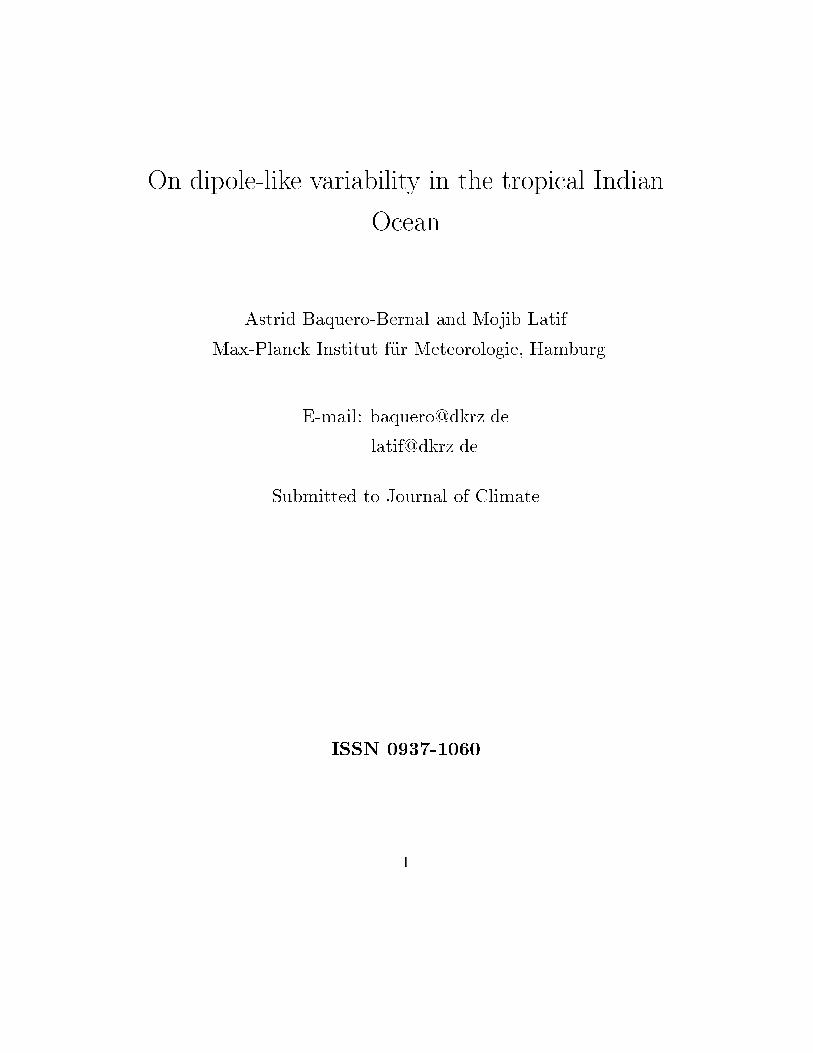
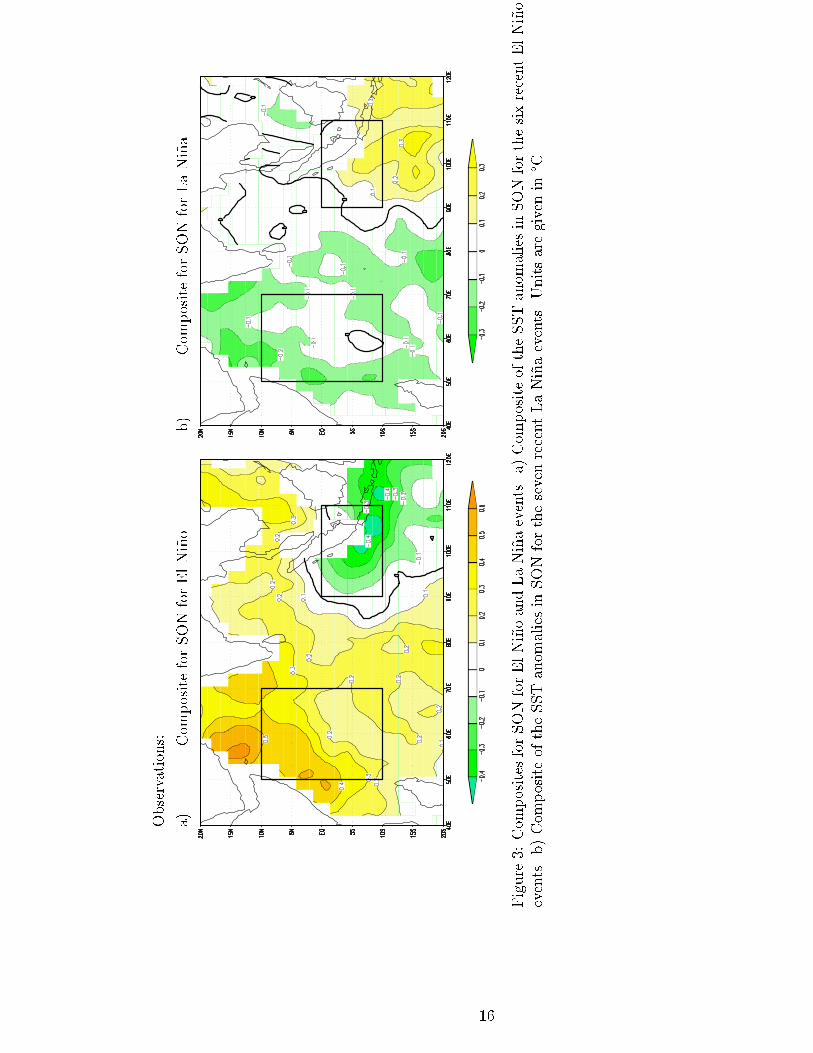
Fig. 3 shows the composites for El Ni~no and La Ni~na events. Fig. 3a
shows the composite for the six recent El Ni~no events (1957, 1965, 1972,
1982, 1987 and 1997) and Fig. 3b that for the seven recent La Ni~na events
(1955, 1970, 1971, 1973, 1975, 1985 and 1988). ENSO-related variability in
the Indian Ocean in the boreal fall season looks like a seesaw: for the El Ni~no
events, there are positive SST anomalies in the western region and negative
anomalies in the east. The situation is reversed during La Ni~na conditions,
but the magnitude of the anomalies is smaller in the western region. Figs.
2 and 3 demonstrate clearly that the dipole-like variability in the tropical
Indian Ocean is not independent of the ENSO phenomenon.
6
2.4 ENSO-removed analyses
Our analyses may be in uenced by the presence of the strong ENSO signal.
We therefore repeated the correlation analyses by removing the ENSO signal
prior to the analyses. There is no unique way to do this. Here we subtracted
the leading POP mode from the monthly SSTA. Seasonal mean values were
then computed from the residual dataset.
The POP analysis of the monthly SSTAs revealed one dominant POP pair
(the ENSO mode, not shown) accounting for 26.4% of the total variance. The
rotation period of this POP pair amounts to 42 months, with a decay time
of 10 months. All other POPs were statistically insigni�cant. The dominant
POP pair is clearly associated with ENSO, which can be inferred from the
correlation of the complex coe�cient time series (not shown) with the Ni~no3
(5�S - 5N, 150�W -90�W) SSTA time series. The zero lag correlation of the
real part time series with the Ni~no3 time series amounts to 0.94 and the
4-months lag correlation of the imaginary part time series with the Ni~no3
time series to 0.74. A cross spectral analysis of the two coe�cient time series
(not shown) showed the theoretically expected result that they are highly
coherent (above the 99% signi�cance level) with a phase shift of about -90�
for periods between 20 and 70 months.
2.4.1 Analysis considering all the seasons
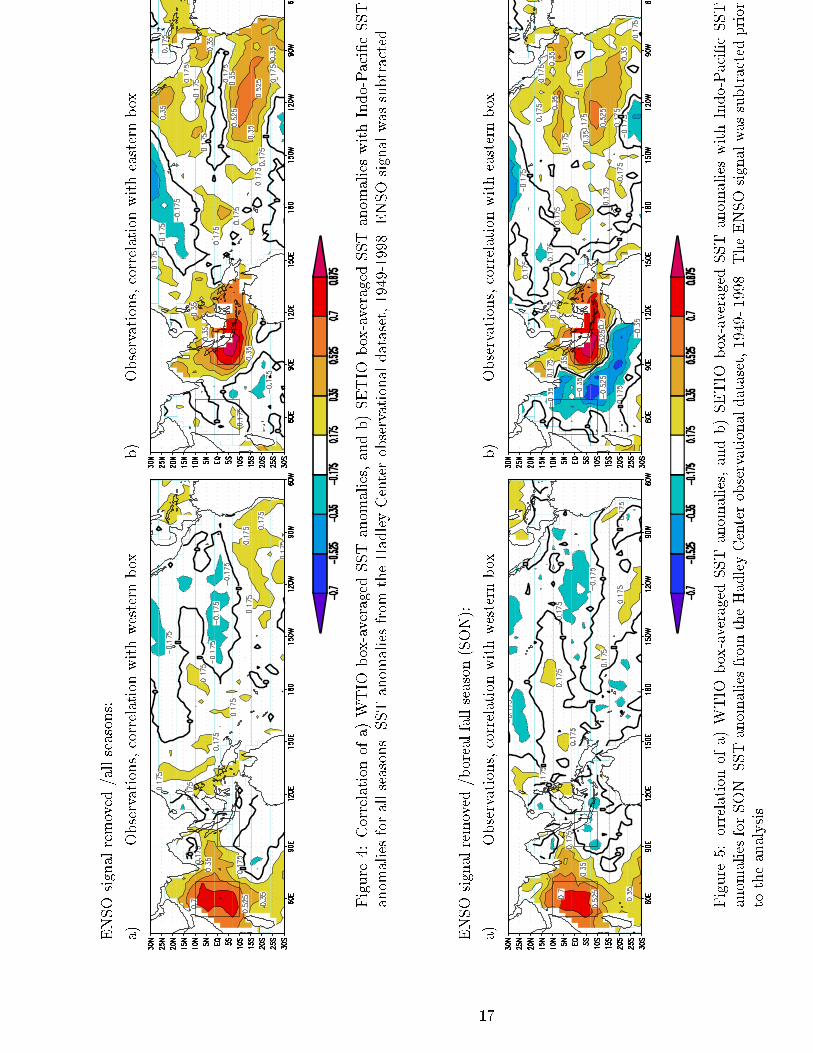
The correlations of the Indo-Paci�c SSTAs with the averaged SSTAs in SE-
TIO and WTIO based on seasonal values are shown in Fig. 4. Again (as
shown in Fig. 1 by retaining the full data set), the correlation maps obtained
from the \ENSO-removed" data show that the SSTA in the eastern and
western parts of the Indian Ocean are not signi�cantly correlated with each
other, when we consider all 4 seasons together.
7
2.4.2 Analysis for SON
Fig. 5 shows the correlations of the Indo-Paci�c SSTAs with box averaged
SSTAs in SETIO and WTIO for the fall season. A negative correlation
between the SSTAs in SETIO and those in the central (but not western)
Indian Ocean is seen in Fig. 5b. These negative correlations are larger than
those in Fig. 2b and they extend to the north of the equator. In conclusion,
Figs. 2, 4 and 5 show that SSTAs in the eastern and western parts of the
Indian Ocean are not strongly negatively correlated, and that there is a
signi�cant negative correlation between the SSTAs in the eastern and central
parts of the Indian Ocean during the boreal fall season. This anti-correlation
between the eastern and central regions exists also when the ENSO signal is
removed from the data. In the next section we shall discuss the mechanisms
that may explain this dipole-like variability by analyzing a suite of coupled
model simulations.
3 Coupled model simulations
We turn now to the coupled model simulations. We analyzed three di�erent
coupled model runs. The �rst coupled run is an extended range integration
with a coupled ocean-atmosphere general circulation model (GCM). This run
serves as a control integration. The second coupled run is a similar run, but
with the ENSO variability suppressed. The ocean GCM is replaced by a
�xed-depth mixed layer model in the third coupled run. This set of coupled
experiments enables us to investigate the roles of ENSO and ocean dynamics
in the generation of the interannual SST variability of the tropical Indian
Ocean.
8
3.1 Fully coupled ocean-atmosphere GCM
To examine the interannual variability independent of ENSO, the subtrac-
tion of the leading POP pair may not be the best method. We therefore an-
alyzed additionally the outputs of two simulations with the ECHO-G model
(Legutke and Voss (1999)). The ECHO-G model has a horizontal resolution
of 2.8 �x 2.8 �. The ocean component uses a higher meridional resolution
of 0.5 �within the region 10�N - 10�S. Here we use the �rst 100 years from
the control run, while the coupled run in which the ENSO variability has
been suppressed (no-ENSO run) has a duration of 40 years. The suppres-
sion of ENSO variability was realized in the coupled model by replacing the
actual SSTs simulated by the ocean component in the tropical Paci�c by
climatology before passing them to the atmosphere model.
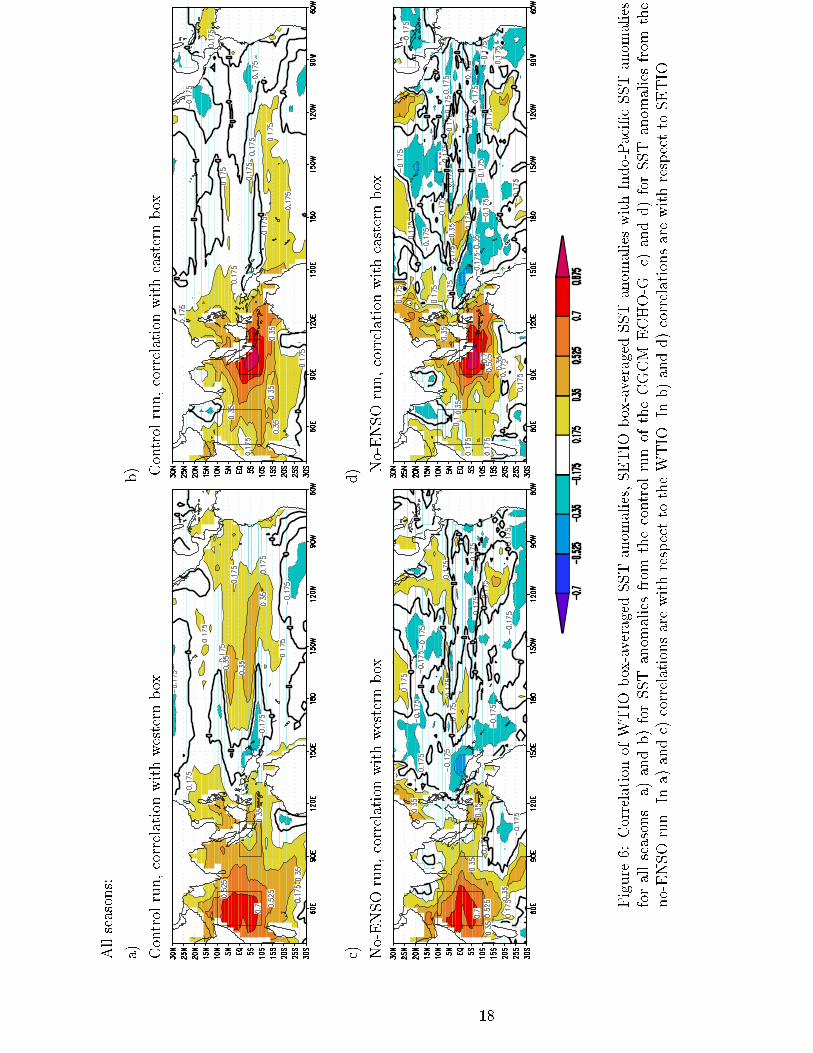
Fig. 6 shows the SSTA-correlation maps with the box averaged SST
anomalies in the SETIO and in WTIO regions when all seasons are consid-
ered. Both simulations, the control run (Fig. 6a and 6b) and the no-ENSO
run (Figs. 6c and 6d), show positive correlations almost everywhere in the
Indian Ocean. In particular, as in the observations, there is no negative cor-
relation simulated in the two coupled runs between the western and eastern
Indian Ocean. These model results con�rm our observational results. We
conclude further that our results do not depend on the way of subtracting
the ENSO signal.
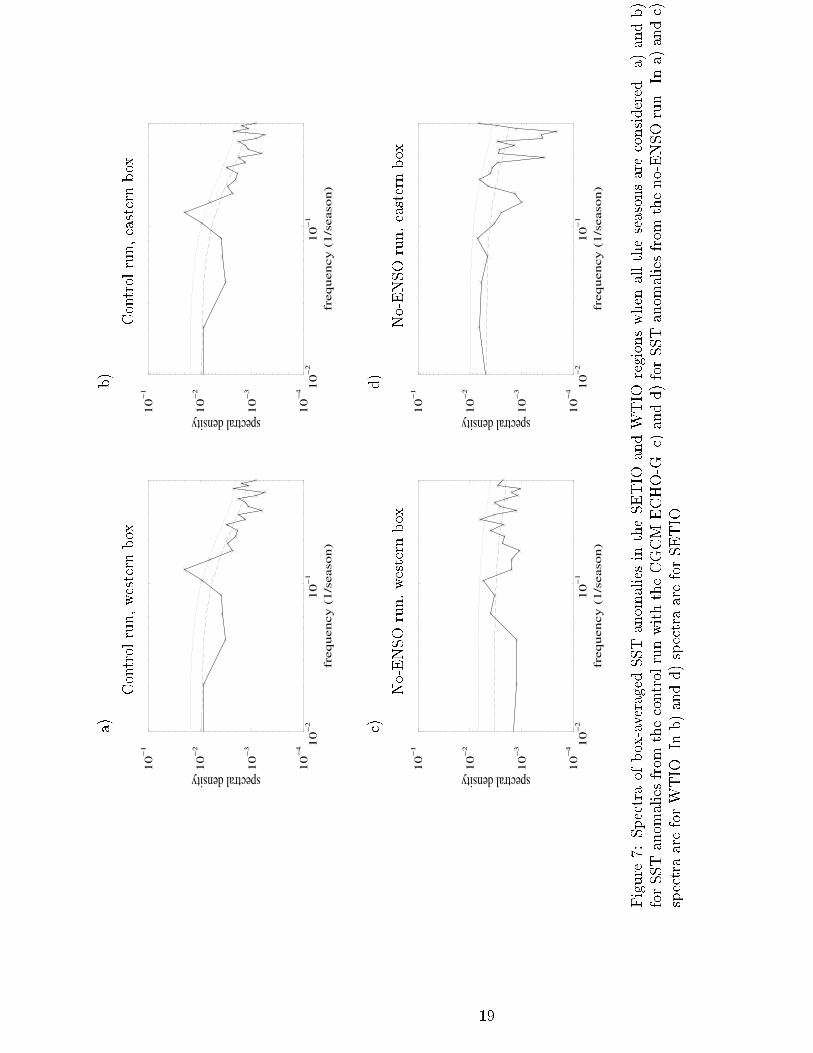
Fig. 7 shows the spectra of box-averaged SST anomalies in the SETIO
and WTIO regions for the control and no-ENSO runs. Each spectrum is
tested against the hypothesis that the spectrum is produced by a �rst order
autoregressive process (red noise spectrum) and a 95% con�dence level for
accepting the red noise hypothesis is also shown. For the control run, the
spectra of the two boxes (Figs. 7a and 7b) show enhanced variability for
periods of 5-10 seasons, i. e. about 1-3 years (the coupled model simulates a
quasi-biennial ENSO period). In contrast, the spectra of the no-ENSO run
(Figs. 7c and 7d) are consistent with red noise spectra. This result indicates
9
also that a dipole mode that is associated with a speci�c timescale does not
exist.
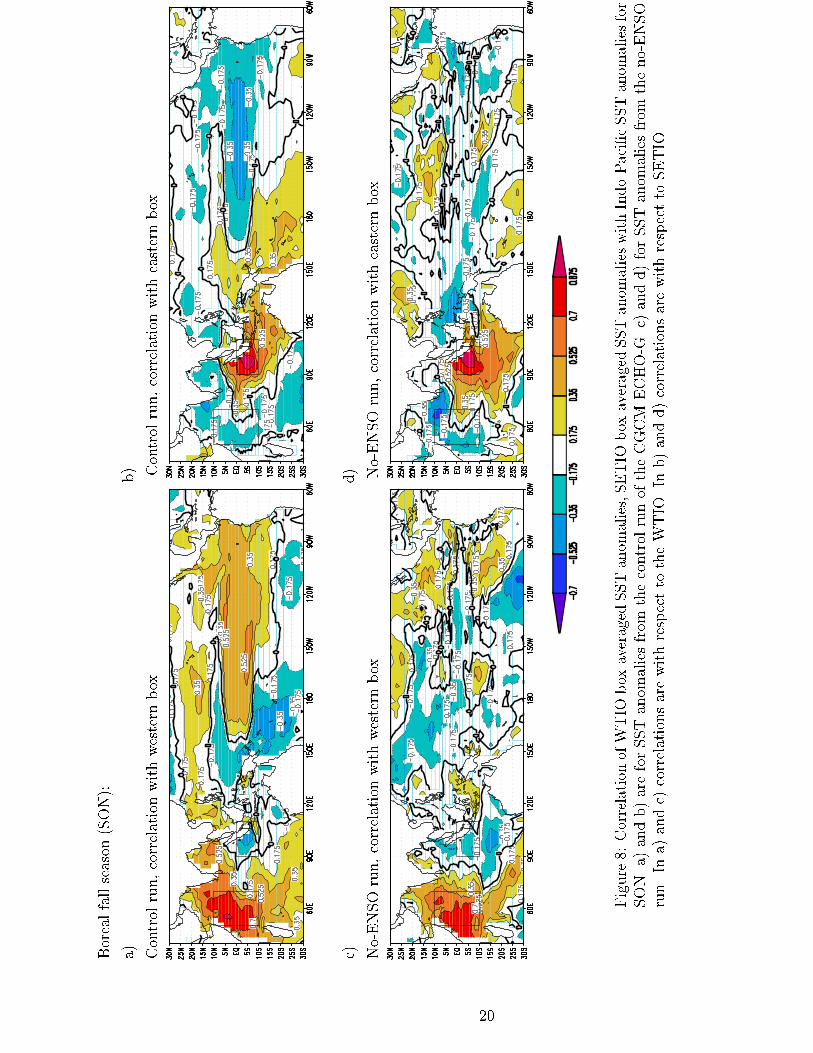
The correlation maps for fall (SON) are shown in Fig. 8. Both the control
run and the no-ENSO run yield similar correlation maps, with some indica-
tion of dipole-like variability. This means that although ENSO was removed
physically in the no-ENSO run, there is still a mechanism which produces a
dipole-like structure in the SST anomalies in the boreal fall season. The cor-
relation maps for the other seasons (not shown) do not exhibit a dipole-like
structure.
3.2 AGCM coupled to a mixed layer ocean
Is the dipole-like variability in the no-ENSO run a result of ocean dynamics
or of atmospheric forcing? In order to answer this question, we coupled a
mixed layer ocean model with the ECHAM4 atmosphere model (the same
atmosphere model that has been used in the coupled runs discussed above).
The mixed layer model has a constant depth of 50m and does not carry by
de�nition any ocean dynamics. Variations in the surface heat ux is the only
mechanism which can produce SST anomalies in such a model.
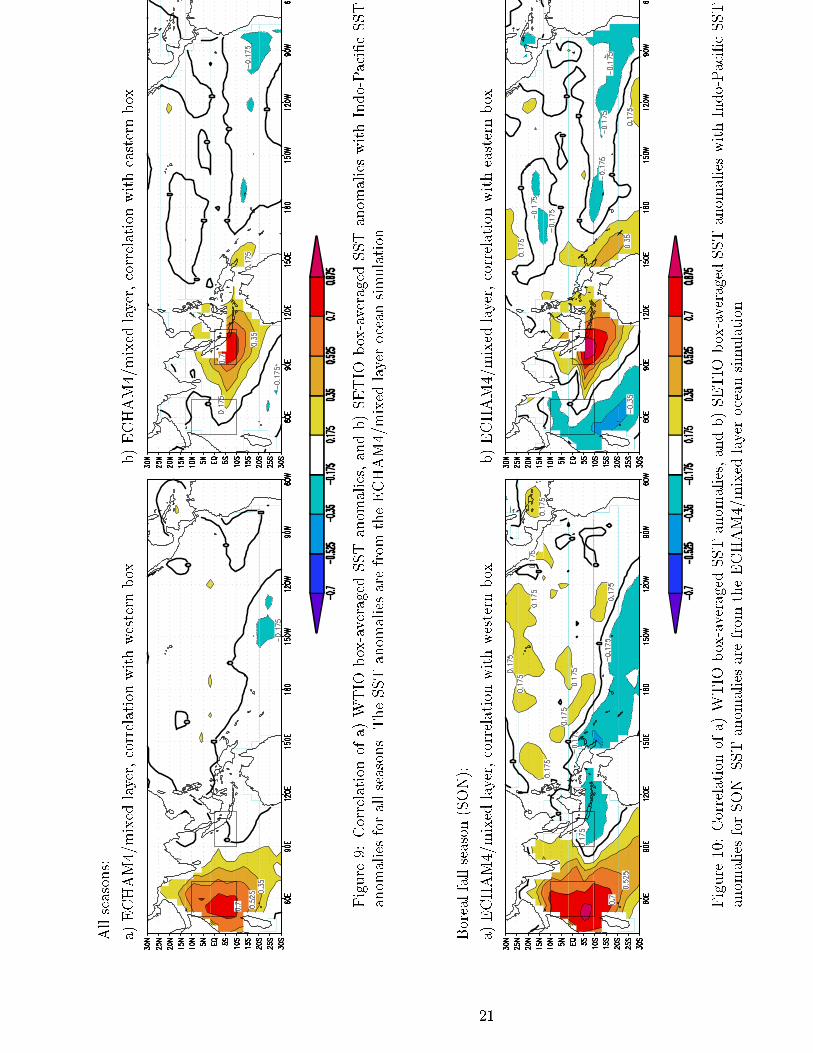
Correlation analyses of SST anomalies from the mixed layer simulation
are shown in Figs. 9 and 10. Fig. 9 corresponds to the case when all the
seasons are considered and Fig. 10 when only fall (SON) is considered. Both
Fig. 9 and Fig. 10 show some correspondence with the maps derived from
the observations (Figs. 1 and 2), and with those for the coupled runs (Figs.
6 and 8). The spectra of the SST anomalies in the boxes SETIO and WTIO
considering all the seasons are consistent with the red noise assumption (not
shown). It can be concluded from the results of the mixed layer simulation
that an ENSO-independent dipole-like SST anomaly pattern exists in the
boreal fall season, which can be explained by atmospheric forcing. Dynamical
processes in the ocean are not necessary to produce this type of bipolar SST
variability.
10
4 Conclusions
Correlation analyses of seasonal SST anomalies from the Hadley Center SST
observations during the period 1949-1998 and from three di�erent coupled
GCM runs show consistent results. The dominant SST variability in the
tropical Indian Ocean is related to ENSO. The ENSO-related SST response
of the Indian Ocean in the fall season is a dipole. However, we do not �nd
evidence for an ENSO-independent oscillatory mode with dipole-like SST
anomalies. Yet, dipole-like variability exists in the tropical Ocean, but this
type of variability is driven by the atmosphere and does not involve ocean
dynamics.
Most studies so far described the ENSO response in the Indian Ocean as
a homogeneous response: During El Ni~no events, the Indian Ocean exhibits
basin wide warm SST anomalies and during La Ni~na conditions, the SST
anomalies are of opposite sign. This is true for some seasons, especially for
the winter season (DJF), but for fall (SON), this is generally not the case.
We found that in the boreal fall season, on average, the ENSO signal can
be seen as a dipole-like pattern: During El Ni~no events, cold anomalies are
observed east of 80�E and warm SST anomalies west of 80�E, during La Ni~na
events, we observe the reverse SST anomaly pattern.
An oscillatory ENSO-independent dipole mode does not exist in the trop-
ical Indian Ocean. This has been validated by simulations with a hierarchy
of coupled models. The only mode-like dipole variability (in the physical
sense that air-sea interactions lead to an oscillation) is associated with the
ENSO phenomenon.
In summary, there is dipole-like variability in the SST of the Indian Ocean.
This variability, however, is either associated with the ENSO phenomenon
or forced stochastically by the atmosphere. A dipole mode independent of
ENSO and originating from air-sea interactions over the Indian Ocean seems
not to exist.
11
Acknowledgments
We would like to thank Dr. D. Dommenget for helpful discussions and sug-
gestions and Dr. S. Legutke, MPIM, Hamburg, for supplying the model data.
A. Baquero-Bernal is supported by the \Francisco Jos�e de Caldas Institute
for the Development of Science and Technology (COLCIENCIAS)", under
its scholarships program. Support is also given by the European Union's
PROMISE project and by the German Government through its Ocean CLI-
VAR project.
12
References
Chambers, D.P., B. D. Tapley, and R. H. Stewart, 1999. Anomalous warm-
ing in the Indian Ocean coincident with El Ni~no. J. Geophys. Res., 99,
7991- 8014.
Dommenget D. and M. Latif, 2001. A cautionary note on the interpretation
of EOFs. J. Climate, submitted.
Folland, C. K., D. Parker, A. Colman and R. Washington, 1999. Large scale
modes of ocean surface temperature since the late nineteenth century,
pp. 73-102 in Beyond El Ni~no: decadal and interdecadal climate vari-
ability, edited by A. Navarra. Springer-Verlag, Berlin.
Hasselmann, K. 1988. PIPs and POPs: the reduction of complex dynamical
systems using principal interaction and oscillation patterns. Journal
Geophys. Res., 93, 11015-11021.
Hastenrath, S., A. Nicklis, and L. Greischar, 1993. Atmospheric- hydro-
spheric mechanisms of climate anomalies in the western equatorial In-
dian Ocean. J. Geophys. Res., 98 (C11), 20 219-20 235.
Latif, M and T. P. Barnett, 1995. Interactions of the tropical Oceans. J.
Climate, 8, 952-964.
Legutke, S. and R. Voss, 1999. The Hamburg atmosphere-ocean coupled cir-
culation model ECHO-G. Technical Report 18, German Climate Com-
puter Center (DKRZ).
Meyers, G., 1996. Variation of Indonesian through ow and El Ni~no - South-
ern Oscillation. J. Geophys. Res., 101 (C5), 12 255-12 263.
Murtugudde, R., and A. Busalacchi, 1999. Interannual variability of the dy-
namics and thermodynamics of the tropical Indian Ocean. J. Climate,
12, 2300-2326.
13
Reverdin, G., D. Cadet, and D. Gutzler, 1986. Interannual displacements
of convection and surface circulation over the equatorial Indian Ocean.
Quart. J. Roy. Meteor. Soc., 112, 43-67.
Saji, N. H., B. N. Goswami, P. N. Vinayachandran, and T. Yamagata, 1999.
A dipole mode in the Indian Ocean. Nature, 401, 360-363.
Tourre, Y. M. and W. B. White, 1997. Evolution of ENSO signals over the
Indo-Paci�c domain. J. Phys. Oceanogr., 27, 683-696.
Venzke, S., M. Latif, and A. Villwock, 2000. The coupled GCM ECHO-2,
part II: Indian Ocean response to ENSO. J. Climate, in press.
von Storch, H., T. Bruns, I. Fischer- Bruns, and K. Hasselmann, 1988.
Principal Oscillation Pattern analysis of the 30-60 day oscillation in a
GCM equatorial troposphere. J. Geophys. Res., 93, 11 022-11 036.
Webster, P. J., A. M. Moore, J. P. Loschnigg, and R. R. Leben, 1999.
Coupled ocean-atmosphere dynamics in the Indian Ocean during 1997-
1998. Nature, 401, 356-360.
Xu, J. S. and H. von Storch, 1990. Principal Oscillation Pattern - prediction
of the state of ENSO, J. Climate, 3, 1316-1329.
14
Allseasons:
a)
Observations,correlationwithwesternbox
b)
Observations,correlationwitheasternbox
Figure1:Correlationofa)WTIObox-averagedSSTanomalies,andb)SETIObox-averagedSSTanomalieswithIndo-Paci�cSST
anomaliesforallseasons.SSTanomaliesfromtheHadleyCenterobservationaldataset,1949-1998.
Borealfallseason(SON):
a)
Observations,correlationwithwesternbox
b)
Observations,correlationwitheasternbox
Figure2:Correlationofa)WTIObox-averagedSSTanomalies,andb)SETIObox-averagedSSTanomalieswithIndo-Paci�cSST
anomaliesforSON.SSTanomaliesfromtheHadleyCenterobservationaldataset,1949-1998.
15
Observations:
a)
CompositeforSONforElNi~no
b)
CompositeforSONforLaNi~na
Figure3:CompositesforSONforElNi~noandLaNi~naevents.a)CompositeoftheSSTanomaliesinSONforthesixrecentElNi~no
events.b)CompositeoftheSSTanomaliesinSONforthesevenrecentLaNi~naevents.Unitsaregivenin
�
C.
16
ENSOsignalremoved/allseasons:
a)
Observations,correlationwithwesternbox
b)
Observations,correlationwitheasternbox
Figure4:Correlationofa)WTIObox-averagedSSTanomalies,andb)SETIObox-averagedSSTanomalieswithIndo-Paci�cSST
anomaliesforallseasons.SSTanomaliesfromtheHadleyCenterobservationaldataset,1949-1998.ENSOsignalwassubtracted.
ENSOsignalremoved/borealfallseason(SON):
a)
Observations,correlationwithwesternbox
b)
Observations,correlationwitheasternbox
Figure5:orrelationofa)WTIObox-averagedSSTanomalies,andb)SETIObox-averagedSSTanomalieswithIndo-Paci�cSST
anomaliesforSON.SSTanomaliesfromtheHadleyCenterobservationaldataset,1949-1998.TheENSOsignalwassubtractedprior
totheanalysis.
17
Allseasons:
a)
b)
Controlrun,correlationwithwesternbox
Controlrun,correlationwitheasternbox
c)
d)
No-ENSOrun,correlationwithwesternbox
No-ENSOrun,correlationwitheasternbox
Figure6:CorrelationofWTIObox-averagedSSTanomalies,SETIObox-averagedSSTanomalieswithIndo-Paci�cSSTanomalies
forallseasons.a)andb)forSSTanomaliesfromthecontrolrunoftheCGCM
ECHO-G.c)andd)forSSTanomaliesfromthe
no-ENSOrun.Ina)andc)correlationsarewithrespecttotheWTIO.Inb)andd)correlationsarewithrespecttoSETIO.
18
a)
b)
Controlrun,westernbox
Controlrun,easternbox
10
−2
10
−1
frequency (
1/s
easo
n)
10
−4
10
−3
10
−2
10
−1
spectral density
10
−2
10
−1
frequency (
1/s
easo
n)
10
−4
10
−3
10
−2
10
−1
spectral density
c)
d)
No-ENSOrun,westernbox
No-ENSOrun,easternbox
10
−2
10
−1
frequency (
1/s
easo
n)
10
−4
10
−3
10
−2
10
−1
spectral density
10
−2
10
−1
frequency (
1/s
easo
n)
10
−4
10
−3
10
−2
10
−1
spectral density
Figure7:Spectraofbox-averagedSSTanomaliesintheSETIOandWTIOregionswhenalltheseasonsareconsidered.a)andb)
forSSTanomaliesfromthecontrolrunwiththeCGCMECHO-G.c)andd)forSSTanomaliesfromtheno-ENSOrun.Ina)andc)
spectraareforWTIO.Inb)andd)spectraareforSETIO.
19
Borealfallseason(SON):
a)
b)
Controlrun,correlationwithwesternbox
Controlrun,correlationwitheasternbox
c)
d)
No-ENSOrun,correlationwithwesternbox
No-ENSOrun,correlationwitheasternbox
Figure8:CorrelationofWTIObox-averagedSSTanomalies,SETIObox-averagedSSTanomalieswithIndo-Paci�cSSTanomaliesfor
SON.a)andb)areforSSTanomaliesfromthecontrolrunoftheCGCMECHO-G.c)andd)forSSTanomaliesfromtheno-ENSO
run.Ina)andc)correlationsarewithrespecttotheWTIO.Inb)andd)correlationsarewithrespecttoSETIO.
20
Allseasons:
a)ECHAM4/mixedlayer,correlationwithwesternbox
b)ECHAM4/mixedlayer,correlationwitheasternbox
Figure9:Correlationofa)WTIObox-averagedSSTanomalies,andb)SETIObox-averagedSSTanomalieswithIndo-Paci�cSST
anomaliesforallseasons.TheSSTanomaliesarefromtheECHAM4/mixedlayeroceansimulation.
Borealfallseason(SON):
a)ECHAM4/mixedlayer,correlationwithwesternbox
b)ECHAM4/mixedlayer,correlationwitheasternbox
Figure10:Correlationofa)WTIObox-averagedSSTanomalies,andb)SETIObox-averagedSSTanomalieswithIndo-Paci�cSST
anomaliesforSON.SSTanomaliesarefromtheECHAM4/mixedlayeroceansimulation.
21

MPI-Report-Reference: *Reprinted in
1
Report 1-276
Please order the reference list from MPI for Meteorology, Hamburg
Report No. 277 September 1998
Interannual to Decadal Variability in the Tropical Atlantic Dietmar Dommenget, Mojib Latif * Journal of Climate, 1998 (submitted)
Report No. 278 October 1998
Application of a grid-scale lateral discharge model in the BALTEX region Stefan Hagemann, Lydia Dümenil * Nordic Hydrology, 30 (3), 209-230, 1999
Report No. 279 October 1998
Cyclostationary Circulation Estimation with a Global Ocean Assimilation System Detlev Müller, Ralf Giering, Uwe Mikolajewicz, Ernst Maier-Reimer
Report No. 280 October 1998
A coarse grid three dimensional global inverse model of the atmospheric transport 1. Adjoint Model and Jacobian Matrix 2. Inversion of the transport of CO2 in the 1980s Thomas Kaminski, Martin Heimann, Ralf Giering * Journal of Geophysical Research, 1998 (submitted)
Report No. 281 November 1998
Paleonutrient Data Analysis of the Glacial Atlantic using an Adjoint Ocean General Circulation Model Arne M. E. Winguth, David Archer, Ernst Maier-Reimer, Uwe Mikolajewicz * AGU Geophysical Monograph Series, Vol. 114, 171-183, 1999
Report No. 282 November 1998
The Effect of Environmental Conditions on Volcanic Plume Rise Hans-F. Graf, Michael Herzog, Josef M. Oberhuber, Christiane Textor * Journal of Geophysical Research, 1998 (submitted)
Report No. 283 December 1998
Model Simulations of the Changing Distribution of Ozone and its Radiative Forcing of Climate: Past, Present and Future Geert-Jan Roelofs, Jos Lelieveld, Johann Feichter
Report No. 284 December 1998
Predicting the Number of Cloud Droplets in the ECHAM GCM Ulrike Lohmann, Johann Feichter, Catherine C. Chuang, Joyce E. Penner * Journal of Geophysical Research - Atmospheres, 1998 (accepted)
Report No. 285 December 1998
The Role of Ocean Dynamics for Low-Frequency Fluctuations of the NAO in a Coupled Ocean-Atmosphere GCM Michael Christoph, Uwe Ulbrich, Josef M. Oberhuber, Erich Roeckner
Report No. 286 January 1999
Formation of nitrous acid: Parameterisation and comparison with observations Gerhard Lammel
Report No. 287 Februar 1999
Natürliche Senken und Quellen des atmosphärischen Kohlendioxids: Stand des Wissens und Optionen des Handelns Martin Heimann, Christine Weber, Jan C. Duinker, Arne Körtzinger, Ludger Mintrop, Nina Buchmann, Ernst-Detlef Schulze, Michaela Hein, Alberte Bondeau, Wolfgang Cramer, Marcus Lindner, Gerd Esser
Report No. 288 March 1999
Large-eddy simulation of a nocturnal stratocumulus-topped marine atmospheric boundary layer: An uncertainty analysis Andreas Chlond, Andreas Wolkau Boundary-Layer Meteorology, 95,31-55, 2000
Report No. 289 March 1999
Derivation of global GCM boundary conditions from 1 km land use satellite data Stefan Hagemann, Michael Botzet, Lydia Dümenil, Bennert Machenhauer
MPI-Report-Reference: *Reprinted in
2
Report No. 290 June 1999
A nonlinear impulse response model of the coupled carbon cycle-ocean-atmosphere climate system Georg Hooss, Reinhard Voss, Klaus Hasselmann, Ernst Maier-Reimer, Fortunat Joos
Report No. 291 June 1999
Rapid algorithms for plane-parallel radiative transfer calculations Vassili Prigarin
Report No. 292 June 1999
Oceanic Control of Decadal North Atlantic Sea Level Pressure Variability in Winter Mojib Latif, Klaus Arpe, Erich Roeckner * Geophysical Research Letters, 1999 (submitted)
Report No. 293 July 1999
A process-based, climate-sensitive model to derive methane emissions from natural wetlands: Application to 5 wetland sites, sensitivity to model parameters and climate Bernadette P. Walter, Martin Heimann * Global Biogeochemical Cycles, 1999 (submitted)
Report No. 294 August 1999
Possible Changes of δδδδ18O in Precipitation Caused by a Meltwater Event in the North Atlantic Martin Werner, Uwe Mikolajewicz, Georg Hoffmann, Martin Heimann * Journal of Geophysical Research - Atmospheres, 105, D8, 10161-10167, 2000
Report No. 295 August 1999
Borehole versus Isotope Temperatures on Greenland: Seasonality Does Matter Martin Werner, Uwe Mikolajewicz, Martin Heimann, Georg Hoffmann * Geophysical Research Letters, 27, 5, 723-726, 2000
Report No. 296 August 1999
Numerical Modelling of Regional Scale Transport and Photochemistry directly together with Meteorological Processes Bärbel Langmann * Atmospheric Environment, 34, 3585-3598, 2000
Report No. 297 August 1999
The impact of two different land-surface coupling techniques in a single column version of the ECHAM4 atmospheric model Jan-Peter Schulz, Lydia Dümenil, Jan Polcher * Journal of Applied Meteorology, 40, 642-663, 2001
Report No. 298 September 1999
Long-term climate changes due to increased CO2 concentration in the coupled atmosphere-ocean general circulation model ECHAM3/LSG Reinhard Voss, Uwe Mikolajewicz * Climate Dynamics, 17, 45-60, 2001
Report No. 299 October 1999
Tropical Stabilisation of the Thermohaline Circulation in a Greenhouse Warming Simulation Mojib Latif, Erich Roeckner * Journal of Climate, 1999 (submitted)
Report No. 300 October 1999
Impact of Global Warming on the Asian Winter Monsoon in a Coupled GCM Zeng-Zhen Hu, Lennart Bengtsson, Klaus Arpe * Journal of Geophysical Research-Atmosphere, 105, D4, 4607-4624, 2000
Report No. 301 December 1999
Impacts of Deforestation and Afforestation in the Mediterranean Region as Simulated by the MPI Atmospheric GCM Lydia Dümenil Gates, Stefan Ließ
Report No. 302 December 1999
Dynamical and Cloud-Radiation Feedbacks in El Niño and Greenhouse Warming Fei-Fei Jin, Zeng-Zhen Hu, Mojib Latif, Lennart Bengtsson, Erich Roeckner * Geophysical Research Letter, 28, 8, 1539-1542, 2001
MPI-Report-Reference: *Reprinted in
3
Report No. 303 December 1999
The leading variability mode of the coupled troposphere-stratosphere winter circulation in different climate regimes Judith Perlwitz, Hans-F. Graf, Reinhard Voss * Journal of Geophysical Research, 105, 6915-6926, 2000
Report No. 304 January 2000
Generation of SST anomalies in the midlatitudes Dietmar Dommenget, Mojib Latif * Journal of Climate, 1999 (submitted)
Report No. 305 June 2000
Tropical Pacific/Atlantic Ocean Interactions at Multi-Decadal Time Scales Mojib Latif * Geophysical Research Letters, 28,3,539-542,2001
Report No. 306 June 2000
On the Interpretation of Climate Change in the Tropical Pacific Mojib Latif * Journal of Climate, 2000 (submitted)
Report No. 307 June 2000
Observed historical discharge data from major rivers for climate model validation Lydia Dümenil Gates, Stefan Hagemann, Claudia Golz
Report No. 308 July 2000
Atmospheric Correction of Colour Images of Case I Waters - a Review of Case II Waters - a Review D. Pozdnyakov, S. Bakan, H. Grassl * Remote Sensing of Environment, 2000 (submitted)
Report No. 309 August 2000
A Cautionary Note on the Interpretation of EOFs Dietmar Dommenget, Mojib Latif * Journal of Climate, 2000 (submitted)
Report No. 310 September 2000
Midlatitude Forcing Mechanisms for Glacier Mass Balance Investigated Using General Circulation Models Bernhard K. Reichert, Lennart Bengtsson, Johannes Oerlemans * Journal of Climate, 2000 (accepted)
Report No. 311 October 2000
The impact of a downslope water-transport parameterization in a global ocean general circulation model Stephanie Legutke, Ernst Maier-Reimer
Report No. 312 November 2000
The Hamburg Ocean-Atmosphere Parameters and Fluxes from Satellite Data (HOAPS): A Climatological Atlas of Satellite-Derived Air-Sea-Interaction Parameters over the Oceans Hartmut Graßl, Volker Jost, Ramesh Kumar, Jörg Schulz, Peter Bauer, Peter Schlüssel
Report No. 313 December 2000
Secular trends in daily precipitation characteristics: greenhouse gas simulation with a coupled AOGCM Vladimir Semenov, Lennart Bengtsson
Report No. 314 December 2000
Estimation of the error due to operator splitting for micro-physical-multiphase chemical systems in meso-scale air quality models Frank Müller * Atmospheric Environment, 2000 (submitted)
Report No. 315 January 2001
Sensitivity of global climate to the detrimental impact of smoke on rain clouds Hans-F. Graf, Daniel Rosenfeld, Frank J. Nober * nur unter www.mpimet.mpg.de · Veröffentlichungen · MPI-Reports
MPI-Report-Reference: *Reprinted in
4
Report No. 316 March 2001
Lake Parameterization for Climate Models Ben-Jei Tsuang, Chia-Ying Tu, Klaus Arpe
Report No 317 March 2001
The German Aerosol Lidar Network: Methodology, Data, Analysis J. Bösenberg, M. Alpers, D. Althausen, A. Ansmann, C. Böckmann, R. Eixmann, A. Franke, V. Freudenthaler, H. Giehl, H. Jäger, S. Kreipl, H. Linné, V. Matthias, I. Mattis, D. Müller, J. Sarközi, L. Schneidenbach, J. Schneider, T. Trickl, E. Vorobieva, U. Wandinger, M. Wiegner
Report No. 318 March 2001
On North Pacific Climate Variability Mojib Latif * Journal of Climate, 2001 (submitted)
Report No. 319 March 2001
The Madden-Julian Oscillation in the ECHAM4 / OPYC3 CGCM Stefan Liess, Lennart Bengtsson, Klaus Arpe * Climate Dynamics, 2001 (submitted)
Report No. 320 May 2001
Simulated Warm Polar Currents during the Middle Permian A. M. E. Winguth, C. Heinze, J. E. Kutzbach, E. Maier-Reimer, U. Mikolajewicz, D. Rowley, A. Rees, A. M. Ziegler * Paleoceanography, 2001 (submitted)
Report No. 321 June 2001
Impact of the Vertical Resolution on the Transport of Passive Tracers in the ECHAM4 Model Christine Land, Johann Feichter, Robert Sausen * Tellus, 2001 (submitted)
Report No.322 August 2001
Summer Session 2000 Beyond Kyoto: Achieving Sustainable Development Edited by Hartmut Graßl and Jacques Léonardi
Report No.323 July 2001
An atlas of surface fluxes based on the ECMWF Re-Analysis- a climatological dataset to force global ocean general circulation models Frank Röske
Report No.324 August 2001
Long-range transport and multimedia partitioning of semivolatile organic compounds: A case study on two modern agrochemicals Gerhard Lammel, Johann Feichter, Adrian Leip * Journal of Geophysical Research-Atmospheres, 2001 (submitted)
Report No. 325 August 2001
A High Resolution AGCM Study of the El Niño Impact on the North Atlantic / European Sector Ute Merkel, Mojib Latif * Geophysical Research Letters, 2001 (submitted)
Report No. 326 August 2001
On dipole-like variability in the tropical Indian Ocean Astrid Baquero-Bernal, Mojib Latif * Journal of Climate, 2001 (submitted)


ISSN 0937-1060