Embed Size (px)
Citation preview
111
AC
TIV
IDA
D F
ÍSIC
A Y
SA
LUD
| H
EA
LTH
AN
D P
HY
SIC
AL
AC
TIV
ITYMáxima oxidación de grasa mediante
variabilidad de la frecuencia cardiaca en sujetos físicamente activos
Sebastián Sáez-Olivares1, Johanna Pino-Zúñiga2, Mariela Olivares-Gálvez2 y Jorge Cancino-López3*
1 Facultad de Ciencias, Universidad Mayor, Chile, 2 Centro de Nutrición y Cirugía Bariátrica, Clínica Las Condes, Chile,
3 Laboratorio de Ciencias del Ejercicio, Escuela de Kinesiología, Universidad Finis Terrae, Chile
ResumenIntroducción. El objetivo de este estudio es identificar la in-tensidad del punto de máxima oxidación de grasas (Fatmax) y su relación con el primer umbral de variabilidad de frecuencia cardiaca (UVFC1). Sujetos y métodos. 23 sujetos (10 hombres; 13 mujeres), IMC 24.3 ± 3.1 kg/m2, edad 32 ± 10 años, físi-camente activos (≥600 METS minuto-semana), realizaron un test incremental por escalones en cicloergómetro. Se registró el V· O2, V
· CO2, VFC y la oxidación de grasa para cada eta-pa. Para el análisis estadístico se usaron medidas de tendencia central, contrastación de medias, coeficiente de correlación y análisis de gráficos de Bland-Altman. Resultados. Los valores para Fatmax vs. el UVFC1 fueron de 48.7 ± 7.1 vs 55.4 ± 9.2 %V· O2pico, 68 ± 34 vs. 84 ± 39 Watts, 112 ± 14 vs.125 ±11 lpm y 1.25 ± .49 vs. 1.41 ± .54 L · min–1, todas las intensi-dades presentaron diferencias significativas (p < .01) y se iden-tificaron correlaciones superiores a .8 para W y V· O2. El valor de SD1 en Fatmax fue 5.56 ± 2.8 ms. El Fatmax se ubicó al 84.2; 90.5 y 90.5% de la carga en W, FC y V· O2pico del UVFC1 respectivamente. El valor de 84.2%UVFC1 y SD1 = 5.56 en intensidad de watts no presentaron diferencias significativas (p > .05), correlaciones superiores a .8, un sesgo de ≈3W y buen nivel de acuerdo con los valores de Fatmax. Conclusión. Existe correlación entre UVFC1 y el Fatmax en las variables de V· O2 y Watts. Al utilizar esta relación se puede identificar la carga en watts del Fatmax.
Palabras clave: umbral de variabilidad de la frecuencia car-diaca, calorimetría indirecta, consumo de oxígeno, Fatmax
IntroducciónEl punto de máxima oxidación de grasas (Fatmax) se de-fine como la intensidad donde ocurre la máxima tasa de oxidación de grasa en valores absolutos (MFO) (g · min–1) (Randell et al., 2017), expresándose como porcentajes del máximo consumo de oxígeno (V· O2max). El ejercicio rea-lizado a esta intensidad se presenta como una alternativa
Maximal Fat Oxidation by Heart Rate Variability in Physically
Active SubjectsSebastián Sáez-Olivares1, Johanna Pino-Zúñiga2,
Mariela Olivares-Gálvez2 and Jorge Cancino-López3*1 Faculty of Sciences, Universidad Mayor, Chile, 2 Centre for
Nutrition and Bariatric Surgery, Clínica Las Condes, Chile, 3 Exercise Science Laboratory, School of Kinesiology, Finis Terrae University,
Chile
AbstractIntroduction: the objective of this study is to identify the intensity of the maximal fat oxidation point (Fatmax) and its relationship to the first heart rate variability threshold (HRVT1). Subjects and methods. 23 subjects (10 M; 13 W), BMI 24.3 ± 3.1 kg/m2, age 32 ± 10 years, physically ac-tive (≥ 600 METS minute-week), performed an incremen-tal step test on a cycloergometer. V· O2, V
· CO2, HRV and fat oxidation were recorded for each stage. Measurements of central tendency, mean contrast, correlation coefficient and Bland-Altman plot analysis were used for the statisti-cal analysis. Results. The values for Fatmax vs. HRVT1 were 48.7 ± 7.1 vs. 55.4 ± 9.2 %V· O2peak, 68 ± 34 vs. 84 ± 39 Watts, 112 ± 14 vs. 125 ± 11 bpm and 1.25 ± .49 vs. 1.41 ± .54 L · min-1; all intensities presented significant differences (p < .01) and correlations higher than .8 were identified for W and V· O2. The SD1 value in Fatmax was 5.56 ± 2.8 ms. Fatmax was at 84.2; 90.5 and 90.5% of the load in W, HR and V· O2peak of HRVT1, respectively. The value of 84.2% HRVT1 and SD1 = 5.56 in intensity of watts did not present significant differences (p > .05), correlations higher than .8, a bias of ≈3W and a good level of agreement with the values of Fatmax. Conclusion: there is correlation between HRVT1 and Fatmax in the V· O2 and Watts variables. The watts load of Fatmax can be identified using this relationship.
Keywords: heart rate variability threshold, indirect calo-rimetry, oxygen consumption, Fatmax
IntroductionThe maximal fat oxidation point (Fatmax) is defined as the intensity at which the maximal fat oxidation (MFO) rate in absolute values (g · min-1) occurs (Ran-dell et al., 2017), expressed as percentages of the maximum rate of oxygen consumption (V· O2max). Exercise performed at this intensity is presented as an
* Correspondence: Jorge Cancino-López ([email protected]).
* Correspondencia: Jorge Cancino-López ([email protected]).
Fecha de recepción: 2.3.2018 / Fecha de aceptación: 12.2.2019Received: March 2, 2018 / Accepted: February 12, 2019
Apunts. Educación Física y Deportes 2019, n.º 138, 4.º trimestre (octubre-diciembre), pp. 111-122 ISSN-1577-4015 DOI: https://dx.doi.org/10.5672/apunts.2014-0983.es.(2019/4).138.09
112
Sáez-Olivares S., Pino-Zúñiga, J., Olivares-Gálvez, M., Cancino-López, J.
Apunts. Educación Física y Deportes. 2019, n.º 138. 4.º trimestre (octubre-diciembre), pp. 111-122. ISSN-1577-4015
AC
TIV
IDA
D F
ÍSIC
A Y
SA
LUD
| H
EA
LTH
AN
D P
HY
SIC
AL
AC
TIV
ITY para las personas que no toleran ejercicio de alta inten-
sidad (Lazzer et al., 2011), reportando beneficios en el metabolismo lipídico, sensibilidad a la insulina y dismi-nución de la masa grasa (Lazzer et al., 2011; Tan et al., 2016; Venables y Jeukendrup, 2008). La identificación de la MFO y Fatmax se realiza por medio de calorimetría indirecta (Frayn, 1983) entregando de manera indirecta la oxidación de sustratos específicos, para este cálculo se requiere un equipo analizador de gases espirados. El Fatmax se encuentra correlacionado con el primer umbral ventilatorio (VT1) (Gmada et al., 2013) y el umbral de lactato (UL) (San-Millán y Brooks, 2017) situándose poco antes de estos umbrales fisiológicos, estos umbrales son homónimos e intercambiables (Pallarés et al., 2016) para la identificación de la transición de fase aeróbica a aeróbi-ca-anaeróbica.
En ejercicio incremental se identifican cambios en el sistema nervioso autónomo observándose una retirada del sistema nervioso parasimpático (SNPS) y un aumento en el sistema nervioso simpático (SNS) (Michael et al., 2017). La variabilidad de la frecuencia cardiaca (VFC) es un método que estima el nivel de actividad SNS y SNPS por medio del análisis matemático de las variacio-nes latido a latido (intervalos RR) (Task Force, 1996). En el análisis de VFC en ejercicio incremental se exhi-ben dos umbrales diferenciando tres fases de ejercicio, siendo el primer umbral de variabilidad de frecuencia cardiaca (UVFC1) expuesto como un método alternativo para la determinación de VT1 y UL (Grannell y De Vito, 2017; Karapetian et al., 2008; Sales et al., 2011).
Al ser el Fatmax de gran utilidad para la progra-mación de ejercicios en poblaciones que no pueden utilizar intensidades de ejercicio elevadas, que buscan reducir grasa corporal, mejorar metabolismo de las grasas o una forma de mejorar rendimiento, resulta re-levante determinar Fatmax previo a la programación individual del entrenamiento. Sin embargo, el método y procedimiento de medición implica un equipamiento costoso y técnicas invasivas. Teniendo en considera-ción estas situaciones y la posible relación que existe entre los parámetros asociados al Fatmax con la va-riabilidad de la frecuencia cardiaca para su utilización como técnica no invasiva y de menor coste, el objetivo de este estudio fue determinar la correlación entre la variabilidad de la frecuencia cardiaca y el Fatmax en adultos físicamente activos.
alternative for people who do not tolerate high-inten-sity exercise (Lazzer et al., 2011), showing benefits in lipid metabolism, insulin sensitivity and fat mass reduction (Lazzer et al., 2011; Tan et al., 2016; Ven-ables & Jeukendrup, 2008). MFO and Fatmax are identified by means of indirect calorimetry (Frayn, 1983), indirectly delivering the oxidation of specif-ic substrates; an exhaled gas analyser device is re-quired for this calculation. Fatmax is correlated with the first ventilatory threshold (VT1) (Gmada et al., 2013) and the lactate threshold (LT) (San-Millán & Brooks, 2017) just before these physiological thresh-olds; these thresholds are homonymous and inter-changeable (Pallarés et al., 2016) for identifying the transition from the aerobic to the aerobic-anaerobic stage.
In incremental exercise, changes in the autonom-ic nervous system are identified and a withdraw-al of the parasympathetic nervous system (PSNS) and an increase in the sympathetic nervous system (SNS) (Michael et al., 2017) are observed. Heart rate variability (HRV) is a method of estimating the level of SNS and PSNS activity by means of the mathematical analysis of the variations in heartbeat (RR intervals) (Task Force, 1996). There are two thresholds in incremental exercise HRV analysis which separate three exercise stages, and the first heart rate variability threshold (HRVT1) is an alter-native method for determining VT1 and LT (Gran-nell & De Vito, 2017; Karapetian et al., 2008; Sales et al., 2011).
As Fatmax is very useful for exercise program-ming in populations that cannot achieve high exercise intensities but are looking to reduce body fat, improve fat metabolism or as a way to improve performance, determining Fatmax prior to individual training pro-gramming is relevant. However, the measurement method and procedure require costly equipment and invasive techniques. Considering these situations, and the possible relationship between the parameters asso-ciated with Fatmax and heart rate variability for use as a non-invasive, lower-cost technique, the objective of this study was to determine the correlation between heart rate variability and Fatmax in physically active adults.
113Apunts. Educación Física y Deportes. 2019, n.º 138. 4.º trimestre (octubre-diciembre), pp. 111-122. ISSN-1577-4015
Máxima oxidación de grasa mediante variabilidad de la frecuencia cardiaca en sujetos físicamente activos Maximal Fat Oxidation by Heart Rate Variability in Physically Active Subjects
AC
TIV
IDA
D F
ÍSIC
A Y
SA
LUD
| H
EA
LTH
AN
D P
HY
SIC
AL
AC
TIV
ITYMetodología
Sujetos Participaron en el estudio veintitrés sujetos, 10 hombres y 13 mujeres, de características fisiológicas y antropomé-tricas que se muestran en la tabla 1. Los sujetos fueron seleccionados por conveniencia del Centro de Nutrición y Cirugía Bariátrica de la Clínica Las Condes Santiago de Chile según el cumplimiento de los criterios de inclu-sión de índice de masa corporal (IMC) bajo 30 (kg/m2), ser mayor de 18 años, ser físicamente activos (Salas et al., 2016) y no presentar enfermedades asociadas.
Los sujetos estaban previo al test en ayunas de al me-nos 6 horas, sin haber consumido café o té al menos 4 horas previas, sin haber realizado actividad física du-rante las 24 horas previas, y sin haber consumido fárma-cos o drogas al menos 12 horas previas a la evaluación.
A las personas que cumplían con los criterios se les informaba del objetivo del estudio y si estaban dispuestas a la utilización de los datos del examen para este estudio, firmaban el consentimiento informado. El estudio contó con la aprobación del comité ético de la Clínica y se ajus-taba a las normas para el uso de investigación con sujetos humanos, tal como indica la Declaración de Helsinki.
Medidas antropométricasLos sujetos fueron pesados en una báscula electrónica (Seca, modelo 769, Alemania) con precisión de 100 g. La talla se midió con un tallímetro (Seca, modelo 220, Alemania) con precisión de 1 mm. El índice de masa corporal (IMC) se determinó por medio de la ecuación de Quetelet (kg/m2).
Cuantificación del nivel de actividad físicaLa actividad física se obtuvo por medio del cuestiona-rio internacional de actividad física validado y traducido al español (IPAQ) en su versión corta (Crespo et al., 2015). Los sujetos fueron clasificados como físicamente activos si realizaban ≥ 600 MET-minuto/semana entre la suma de las actividades físicas vigorosas y moderadas (Salas et al., 2016).
Protocolo del test, determinación de valores máximo y umbrales El test se realizó en cicloergómetro (Lode; Corival, Groningen, The Netherlands) iniciando con 1 minuto
MethodologySubjects Twenty-three subjects participated in the study, 10 men and 13 women, with the physiological and anthropomet-ric characteristics shown in Table 1. The subjects were selected by convenience sampling from the Center of Nutrition and Bariatric Surgery at Clínica Las Condes in Santiago de Chile based on compliance with the inclu-sion criteria of body mass index (BMI) under 30 (kg/m2), being over 18 years old, physically active (Salas et al., 2016) and not presenting associated diseases.
The subjects had fasted for at least 6 hours prior to the test, had not drunk coffee or tea for at least 4 hours, had not been physically active for the previous 24 hours and had not taken medication or drugs for at least 12 hours prior to the assessment.
The people who met the criteria were informed of the purpose of the study and they signed an informed consent form if they were prepared to allow the exam-ination data to be used for it. The study was approved by the Clinic’s ethics committee and conformed to the standards for the use of research with human subjects as stated in the Declaration of Helsinki.
Anthropometric MeasurementsThe subjects were weighed on an electronic scale (Seca, model 769, Germany) with an accuracy of 100 g. Height was measured with a measuring rod (Seca, model 220, Germany) with an accuracy of 1 mm. Body mass index (BMI) was determined by means of the Quetelet equa-tion (kg/m2).
Quantification of Physical Activity LevelPhysical activity was obtained through the Interna-tional Physical Activity Questionnaire (IPAQ) vali-dated and translated into Spanish in its short version (Crespo et al., 2015). Subjects were classified as physically active if they performed ≥ 600 MET-min-ute/week when vigorous and moderate physical activ-ities were added together (Salas et al., 2016).
Test Protocol, Determination of Maximum Values and Thresholds The test was performed on a cycloergometer (Lode; Corival, Groningen, The Netherlands) starting with
114
Sáez-Olivares S., Pino-Zúñiga, J., Olivares-Gálvez, M., Cancino-López, J.
Apunts. Educación Física y Deportes. 2019, n.º 138. 4.º trimestre (octubre-diciembre), pp. 111-122. ISSN-1577-4015
AC
TIV
IDA
D F
ÍSIC
A Y
SA
LUD
| H
EA
LTH
AN
D P
HY
SIC
AL
AC
TIV
ITY de toma de parámetros basales seguido de 3 minutos
de calentamiento al 20% de la potencia teórica máxima (WTmax). Los aumentos fueron del 10% de la WTmax (Jones et al., 1985) cada 5 minutos hasta llegar a un valor del coeficiente respiratorio (RER) estable de 1.0 posterior a esto las etapas se reducen a 1 minuto hasta la fatiga voluntaria. Para los indicadores de maxima-lidad se adoptaron los criterios de Jones (Jones et al., 1985). Se registró el volumen de oxígeno consumido (V· O2) y el dióxido de carbono producido (V· CO2) a tra-vés de un equipo analizador de gases espirados (Cor-tex, Metamax 3b, Alemania). Los intervalos RR fueron registrados con un pulsómetro Polar RS800 (Kempele, Finlandia) validado para registros electrocardiográficos (Hernando et al., 2016). Para el consumo pico de oxí-geno (V· Opico) se utilizó el promedio en litros por mi-nuto del último minuto del test. El umbral ventilatorio 1 (VT1) se determinó a través de la identificación del pun-to más bajo antes de aumentar del equivalente ventilato-rio de oxígeno (VE/V· O2) y del punto de inflexión entre el V· O2 y V· CO2 por medio de la metodología V-slope (Beaver et al., 1986).
Calorimetría indirecta Se realizó el cálculo de calorimetría indirecta en los últimos 2 minutos de cada escalón de 5 minutos (Brun et al., 2011), según las ecuaciones estequiometricas de Frayn (Frayn, 1983): Oxidación de grasas en gramos por minuto (g/min) = 1.67 × V· O2 – 1.67 × V· CO2. Para la determinación del punto de máxima oxidación de gra-sas (Fatmax), se identificó el escalón con el valor más alto de oxidación de grasas y se lo vinculó al valor de V· O2 (L · min–1), %V· O2pico, carga en Watts (W) y fre-cuencia cardiaca (lpm) de la media del último minuto del escalón respectivo (Achten et al., 2002).
Variabilidad de la frecuencia cardiaca El registro de intervalos RR fue extraído y filtrado con el programa Polar Protrainer 5®, para ser analizados con el software Kubios HRV 2.0 (Biosignal Analysis and Medical Imaging Group, Kuopio, Finlandia).
Para la determinación del primer umbral de VFC se analizaron los valores del SD1 del gráfico de Poincare del último minuto de cada escalón. Los criterios fueron: in-tensidad, donde la diferencia entre los valores de dos eta-pas consecutivas es inferior a un 1 milisegundo; punto de inflexión inferior a 3 milisegundos, y/o la combinación
1 minute of taking baseline factors followed by 3 minutes of warm-up at 20% of maximum theoret-ical power (WTmax). The increases were 10% of WTmax (Jones et al., 1985) every 5 minutes until a stable respiratory exchange ratio (RER) value of 1.0 was achieved, and thereafter the stages were reduced to 1 minute until voluntary fatigue was reached. Jones’s criteria were used for the maximal indicators (Jones et al., 1985). The volume of oxygen consumed (V· O2) and carbon dioxide produced (V· CO2) were re-corded by an exhaled gas analyser device (Cortex, Metamax 3b, Germany). RR intervals were record-ed with a Polar RS800 heart rate monitor (Kempele, Finland) validated for electrocardiographic records (Hernando et al., 2016). The average in litres per minute of the last minute of the test was used for peak oxygen consumption (V· Opeak). Ventilatory thresh-old 1 (VT1) was determined by identifying the lowest point before increase of ventilatory oxygen equivalent (VE/V· O2) and the inflection point between V· O2 and V· CO2 by means of the V-slope methodology (Beaver et al., 1986).
Indirect Calorimetry Indirect calorimetry was calculated in the last 2 minutes of each 5-minute step (Brun et al., 2011) based on Frayn’s stoichiometric equations (Frayn, 1983): fat oxidation in grams per minute (g/min) = 1.67 × V· O2 – 1.67 × V· CO2. For the determi-nation of the maximal fat oxidation point (Fatmax), the step with the highest fat oxidation value was identified and linked to the value of V· O2 (L · min–1), %V· O2peak, load in Watts (W) and heart rate (bpm) of the mean of the last minute of the respective step (Achten et al., 2002).
Heart Rate Variability The RR interval record was extracted and filtered us-ing the Polar Protrainer 5® program to be analysed with HRV 2.0 Kubios Software (Biosignal Analysis and Medical Imaging Group, Kuopio, Finland).
The SD1 values of the Poincaré plot of the last minute of each step were analysed to determine the first HRV threshold. The criteria were: intensity, where the difference between the values of two con-secutive stages is less than 1 millisecond; inflection point less than 3 milliseconds, and/or the combination
115Apunts. Educación Física y Deportes. 2019, n.º 138. 4.º trimestre (octubre-diciembre), pp. 111-122. ISSN-1577-4015
Máxima oxidación de grasa mediante variabilidad de la frecuencia cardiaca en sujetos físicamente activos Maximal Fat Oxidation by Heart Rate Variability in Physically Active Subjects
AC
TIV
IDA
D F
ÍSIC
A Y
SA
LUD
| H
EA
LTH
AN
D P
HY
SIC
AL
AC
TIV
ITYof the two previous criteria (Sales et al., 2011; Gran-
nell & De Vito, 2017).
First HRV Threshold and FatmaxThe percentage mathematical relationship between the first HRV threshold and Fatmax was identified using the Fatmax/HRVT1 · 100 equation to identi-fy the average percentage in which Fatmax occurs in relation to HRVT1. Subsequently, a mathemat-ical correction was made to the intensity values of the first HRV threshold according to the percentage variation between them. In addition, the average value of SD1 was identified when Fatmax occurred and the values closest to this average were searched for within each test. These two methods were used for the load variables in watts and heart rates due to their accessibility.
Statistical AnalysisThe normality of the sample was confirmed with the Shapiro-Wilk test. In the parametric analysis, Stu-dent’s paired sample t-test and the Pearson correla-tion coefficient were performed. The Wilcoxon test and Spearman’s rank correlation coefficient were per-formed in the non-parametric analysis. All data were represented as mean ± SD and the value of p < .05 was adopted. A Bland-Altman plot analysis was used to identify agreement and bias between methods (Bland & Altman, 1986) with 95% confidence inter-vals. The SPSS statistical software version 19.0 was used (IBM, Company).
ResultsThe anthropometric and physiological values of the sample are shown in Table 1. After the normali-ty test in the deltas of the intensities it transpired that the VT1-HRVT1 (V· O2), Fatmax-HRVT1 (W and V· O2) and Fatmax-84.2% HRVT1 (W) variables did not fit as the normality curve and were therefore an-alysed using non-parametric tests. When Fatmax was expressed as a percentage of HRVT1, the values were 84.2 ± 31.4%, 90.5 ± 11.2%, 90.5 ± 23.4% for load (W), heart rate (bpm) and V· O2 (L · min–1), respective-ly, and the average value of SD1 in Fatmax was 5.56 ms. The average values of VT1, Fatmax, HRVT1, SD1 = 5.56 and %HRVT corrected by the percentage
de los dos criterios anteriores (Sales et al., 2011; Gran-nell y De Vito, 2017).
Primer umbral de VFC y FatmaxSe identificó la relación matemática porcentual entre el primer umbral de VFC y Fatmax para lo cual se usó la ecuación Fatmax/UVFC1 · 100 y así identificar el porcentaje promedio en que ocurre Fatmax en relación con el UVFC1. Posterior a eso, se realizó una correc-ción matemática en los valores de intensidad del primer umbral de VFC según el porcentaje de variación entre estas. Además, se identificó el valor promedio de SD1 cuando ocurría el Fatmax, con este valor se procedió a buscar dentro de cada test los valores más cercanos a este promedio. Estos dos métodos fueron realizados para las variables de carga en watts y frecuencias cardiaca dado su accesibilidad.
Análisis estadísticoLa normalidad de la muestra se comprobó con el test de Shapiro-Wilk. En el análisis paramétrico se realizó el test t de Student para muestras pareadas y coeficiente de correlación de Pearson. En el análisis no paramétrico se realizó test de Wilcoxon y coeficiente de correlación de Spearman. Todos los datos fueron representados como la media ± DE y se adoptó como valor de p < .05. Para identificar el acuerdo y sesgo entre métodos se utilizó el análisis de gráficos de Bland-Altman (Bland y Altman, 1986) con intervalos de confianza al 95%. Fue utilizado el software estadístico SPSS versión 19.0. (IBM, Com-pany).
ResultadosLos valores antropométricos y fisiológicos de la muestra se expresan en la tabla 1. Posterior a la prueba de nor-malidad en los deltas de las intensidades se identificó que las variables de VT1-UVFC1 (V· O2), Fatmax-UVFC1 (W y V· O2) y Fatmax-84.2%UVFC1 (W) no se acomodaron como la curva de normalidad por lo tanto para ellas se realizó análisis con pruebas no paramétricas. Al expresar el Fatmax como porcentaje del UVFC1 los valores fue-ron de 84.2 ± 31.4%, 90.5 ± 11.2%, 90.5 ± 23.4% para carga (W), frecuencia cardiaca (lpm) y V· O2 (L · min–1) respectivamente y el valor promedio de SD1 en Fatmax fue de 5.56 ms. Los valores promedios de VT1, Fatmax, UVFC1, SD1 = 5.56 y %UVFC corregido por el
116
Sáez-Olivares S., Pino-Zúñiga, J., Olivares-Gálvez, M., Cancino-López, J.
Apunts. Educación Física y Deportes. 2019, n.º 138. 4.º trimestre (octubre-diciembre), pp. 111-122. ISSN-1577-4015
AC
TIV
IDA
D F
ÍSIC
A Y
SA
LUD
| H
EA
LTH
AN
D P
HY
SIC
AL
AC
TIV
ITY
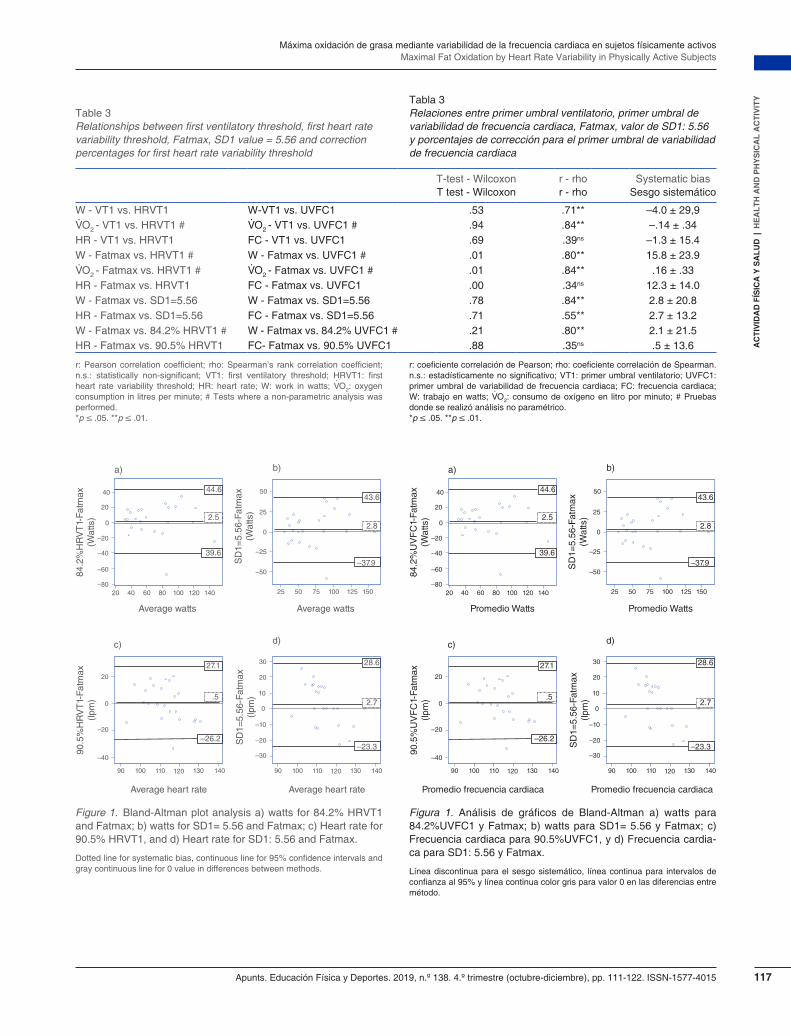
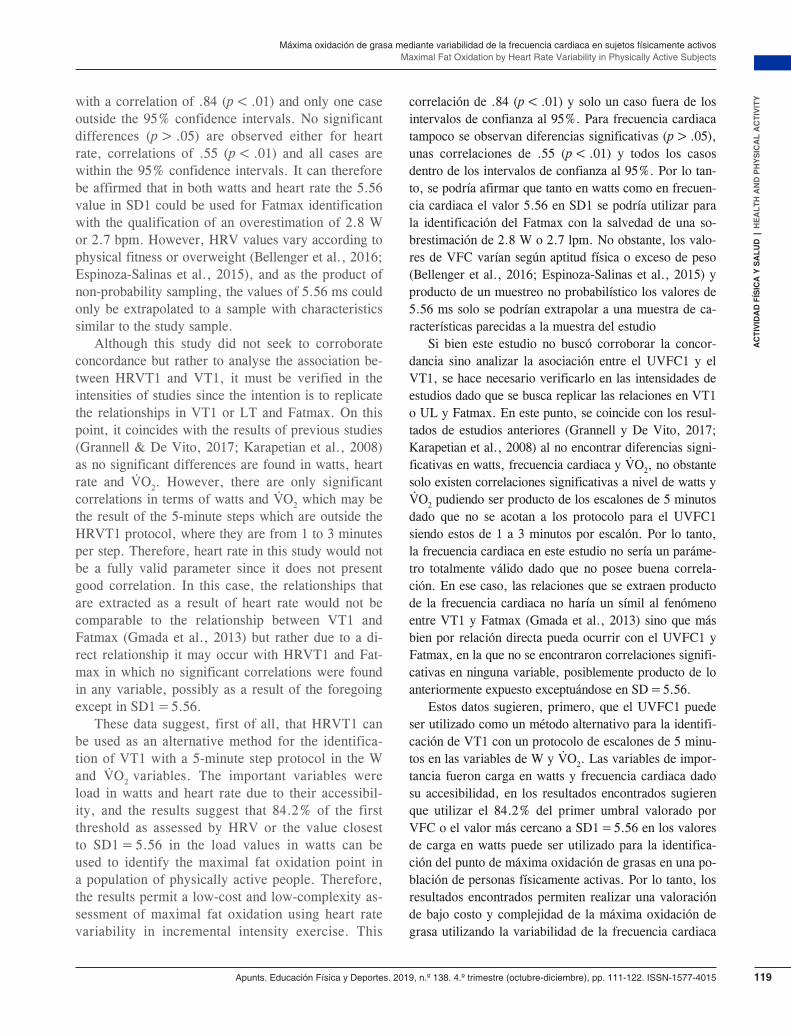
according to the intensity variable are shown in Ta-ble 2. Table 3 describes the relationships between the VT1, Fatmax, HRVT1, SD1 = 5.56 and %HRVT vari-ables. It can be seen that in the first column of data describing the p-values for the differences between means there are only significant differences in the HR (p≤ .01), V· O2 (p ≤ .01) and W (p ≤ .01) variables which compare Fatmax with HRVT1. Significant cor-relations were identified between VT1 and HRVT1 in Watts (rho = .71, p ≤ .05) and oxygen consumption (rho = .84, p ≤ .05), Fatmax and HRVT1 in Watts (rho = .8, p ≤ .05) and oxygen consumption (rho = .84, p ≤ .05), Fatmax and SD1=5.56 in W (r = .84, p ≤ .05) and heart rate (r = .55, p ≤ .05) and Fatmax and 84.2% HRVT1 for watts (rho = .8, p ≤ .05). Fig-ure 1 shows that there is good agreement for load in watts and heart rate in the 84.2% HRVT1(a), 90.5% HRVT1 (c) and SD1 = 5.56 (b,d) methods, and the differences between methods are within the confidence intervals, except in one case for 84.2% HRVT1(a), 90.5% HRVT1 (c) and SD1=5.56 (b).
porcentaje según variable de intensidad se expresan en la tabla 2. En la tabla 3 se describen las relaciones en-tre las variables de VT1, Fatmax, UVFC1, SD1 = 5.56 y %UVFC, Se aprecia que en la primera columna de da-tos se describen los valores p para las diferencias entre medias solo existen diferencias significativas en las va-riables de FC (p ≤ .01), V· O2 (p ≤ .01) y W (p ≤ .01), que comparan Fatmax con el UVFC1. Se identifican co-rrelaciones significativas entre VT1 y UVFC1 en Watts
(r = .71, p ≤ .05) y consumo de oxígeno (rho = .84, p ≤ .05), Fatmax y UVFC1 en Watts (rho = .8, p ≤ .05) y consumo de oxígeno (rho = .84, p ≤ .05), Fatmax y SD1=5.56 en W (r = .84, p ≤ .05) y frecuencia cardiaca (r = .55, p ≤ .05) y Fatmax y 84.2%UVFC1 para watts (rho = .8, p ≤ .05). La figura 1 muestra que existe un buen acuerdo para la carga en watts y frecuencia cardiaca en los métodos de 84.2%UVFC1(a), 90.5%UVFC1 (c) y SD1 = 5.56 (b,d), las diferencias entre métodos se en-cuentran dentro de los intervalos de confianza exceptuan-do por un caso para 84.2%UVFC1(a), 90.5%UVFC1 (c) y SD1 = 5.56 (b).
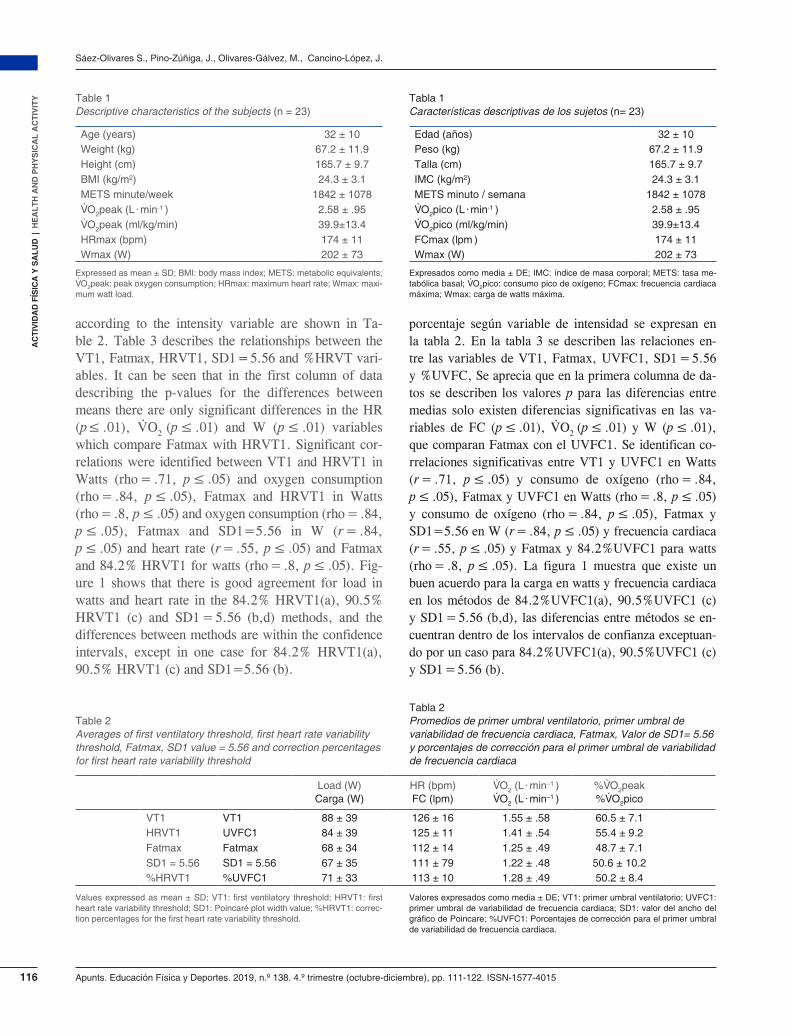
Tabla 1 Características descriptivas de los sujetos (n= 23)
Edad (años) 32 ± 10Peso (kg) 67.2 ± 11.9Talla (cm) 165.7 ± 9.7IMC (kg/m2) 24.3 ± 3.1METS minuto / semana 1842 ± 1078V· O2pico (L · min-1 ) 2.58 ± .95V· O2pico (ml/kg/min) 39.9±13.4FCmax (lpm ) 174 ± 11Wmax (W) 202 ± 73
Expresados como media ± DE; IMC: índice de masa corporal; METS: tasa me-tabólica basal; V· O2pico: consumo pico de oxígeno; FCmax: frecuencia cardiaca máxima; Wmax: carga de watts máxima.
Load (W)Carga (W)
HR (bpm)FC (lpm)
V· O2 (L · min–1 )V· O2 (L · min–1 )
%V· O2peak%V· O2pico
VT1 VT1 88 ± 39 126 ± 16 1.55 ± .58 60.5 ± 7.1HRVT1 UVFC1 84 ± 39 125 ± 11 1.41 ± .54 55.4 ± 9.2Fatmax Fatmax 68 ± 34 112 ± 14 1.25 ± .49 48.7 ± 7.1SD1 = 5.56 SD1 = 5.56 67 ± 35 111 ± 79 1.22 ± .48 50.6 ± 10.2%HRVT1 %UVFC1 71 ± 33 113 ± 10 1.28 ± .49 50.2 ± 8.4
Tabla 2 Promedios de primer umbral ventilatorio, primer umbral de variabilidad de frecuencia cardiaca, Fatmax, Valor de SD1= 5.56 y porcentajes de corrección para el primer umbral de variabilidad de frecuencia cardiaca
Table 2 Averages of first ventilatory threshold, first heart rate variability threshold, Fatmax, SD1 value = 5.56 and correction percentages for first heart rate variability threshold
Valores expresados como media ± DE; VT1: primer umbral ventilatorio; UVFC1: primer umbral de variabilidad de frecuencia cardiaca; SD1: valor del ancho del gráfico de Poincare; %UVFC1: Porcentajes de corrección para el primer umbral de variabilidad de frecuencia cardiaca.
Values expressed as mean ± SD; VT1: first ventilatory threshold; HRVT1: first heart rate variability threshold; SD1: Poincaré plot width value; %HRVT1: correc-tion percentages for the first heart rate variability threshold.
Table 1 Descriptive characteristics of the subjects (n = 23)
Age (years) 32 ± 10Weight (kg) 67.2 ± 11.9Height (cm) 165.7 ± 9.7BMI (kg/m2) 24.3 ± 3.1METS minute/week 1842 ± 1078V· O2peak (L · min-1 ) 2.58 ± .95V· O2peak (ml/kg/min) 39.9±13.4HRmax (bpm) 174 ± 11Wmax (W) 202 ± 73
Expressed as mean ± SD; BMI: body mass index; METS: metabolic equivalents; V· O2peak: peak oxygen consumption; HRmax: maximum heart rate; Wmax: maxi-mum watt load.
117Apunts. Educación Física y Deportes. 2019, n.º 138. 4.º trimestre (octubre-diciembre), pp. 111-122. ISSN-1577-4015
Máxima oxidación de grasa mediante variabilidad de la frecuencia cardiaca en sujetos físicamente activos Maximal Fat Oxidation by Heart Rate Variability in Physically Active Subjects
AC
TIV
IDA
D F
ÍSIC
A Y
SA
LUD
| H
EA
LTH
AN
D P
HY
SIC
AL
AC
TIV
ITY
T-test - WilcoxonT test - Wilcoxon
r - rhor - rho
Systematic biasSesgo sistemático
W - VT1 vs. HRVT1 W-VT1 vs. UVFC1 .53 .71** –4.0 ± 29,9V· O2 - VT1 vs. HRVT1 # V· O2 - VT1 vs. UVFC1 # .94 .84** –.14 ± .34HR - VT1 vs. HRVT1 FC - VT1 vs. UVFC1 .69 .39ns –1.3 ± 15.4W - Fatmax vs. HRVT1 # W - Fatmax vs. UVFC1 # .01 .80** 15.8 ± 23.9V· O2 - Fatmax vs. HRVT1 # V· O2 - Fatmax vs. UVFC1 # .01 .84** .16 ± .33HR - Fatmax vs. HRVT1 FC - Fatmax vs. UVFC1 .00 .34ns 12.3 ± 14.0W - Fatmax vs. SD1=5.56 W - Fatmax vs. SD1=5.56 .78 .84** 2.8 ± 20.8HR - Fatmax vs. SD1=5.56 FC - Fatmax vs. SD1=5.56 .71 .55** 2.7 ± 13.2W - Fatmax vs. 84.2% HRVT1 # W - Fatmax vs. 84.2% UVFC1 # .21 .80** 2.1 ± 21.5HR - Fatmax vs. 90.5% HRVT1 FC- Fatmax vs. 90.5% UVFC1 .88 .35ns .5 ± 13.6
Tabla 3 Relaciones entre primer umbral ventilatorio, primer umbral de variabilidad de frecuencia cardiaca, Fatmax, valor de SD1: 5.56 y porcentajes de corrección para el primer umbral de variabilidad de frecuencia cardiaca
Table 3 Relationships between first ventilatory threshold, first heart rate variability threshold, Fatmax, SD1 value = 5.56 and correction percentages for first heart rate variability threshold
r: coeficiente correlación de Pearson; rho: coeficiente correlación de Spearman. n.s.: estadísticamente no significativo; VT1: primer umbral ventilatorio; UVFC1: primer umbral de variabilidad de frecuencia cardiaca; FC: frecuencia cardiaca; W: trabajo en watts; V· O2: consumo de oxígeno en litro por minuto; # Pruebas donde se realizó análisis no paramétrico.*p ≤ .05. **p ≤ .01.
r: Pearson correlation coefficient; rho: Spearman’s rank correlation coefficient; n.s.: statistically non-significant; VT1: first ventilatory threshold; HRVT1: first heart rate variability threshold; HR: heart rate; W: work in watts; V· O2: oxygen consumption in litres per minute; # Tests where a non-parametric analysis was performed.*p ≤ .05. **p ≤ .01.
Figure 1. Bland-Altman plot analysis a) watts for 84.2% HRVT1 and Fatmax; b) watts for SD1= 5.56 and Fatmax; c) Heart rate for 90.5% HRVT1, and d) Heart rate for SD1: 5.56 and Fatmax.
Dotted line for systematic bias, continuous line for 95% confidence intervals and gray continuous line for 0 value in differences between methods.
Figura 1. Análisis de gráficos de Bland-Altman a) watts para 84.2%UVFC1 y Fatmax; b) watts para SD1= 5.56 y Fatmax; c) Frecuencia cardiaca para 90.5%UVFC1, y d) Frecuencia cardia-ca para SD1: 5.56 y Fatmax.
Línea discontinua para el sesgo sistemático, línea continua para intervalos de confianza al 95% y línea continua color gris para valor 0 en las diferencias entre método.
90.5
%H
RV
T1-
Fatm
ax(lp
m)
84.2
%H
RV
T1-
Fatm
ax(W
atts
)
20
40
0
–80
–20
–40
–60
44.6
2.5
20 40 60 80 100 120 140
43.6
25
50
0
–50
–25
25 50 75 100 125 150
20
0
–40
–20
90 100 110 120 130 140
20
30
10
–30
0
–10
–20
–37.9
90 100 110 120 130 140
SD
1=5.
56-F
atm
ax(lp
m)
SD
1=5.
56-F
atm
ax(W
atts
)
c) d)
–26.2
.5
27.1
2.8
28.6
2.7
–23.3
Average watts Average watts
Average heart rate Average heart rate
a) b)
39.6
90.5
%U
VF
C1-
Fatm
ax(lp
m)
84.2
%U
VF
C1-
Fatm
ax(W
atts
)
20
40
0
–80
–20
–40
–60
44.6
2.5
20 40 60 80 100 120 140
43.6
25
50
0
–50
–25
25 50 75 100 125 150
20
0
–40
–20
90 100 110 120 130 140
20
30
10
–30
0
–10
–20
–37.9
90 100 110 120 130 140
SD
1=5.
56-F
atm
ax(lp
m)
SD
1=5.
56-F
atm
ax(W
atts
)
c) d)
–26.2
.5
27.1
2.8
28.6
2.7
–23.3
Promedio Watts Promedio Watts
Promedio frecuencia cardiaca Promedio frecuencia cardiaca
a) b)
39.6
118
Sáez-Olivares S., Pino-Zúñiga, J., Olivares-Gálvez, M., Cancino-López, J.
Apunts. Educación Física y Deportes. 2019, n.º 138. 4.º trimestre (octubre-diciembre), pp. 111-122. ISSN-1577-4015
AC
TIV
IDA
D F
ÍSIC
A Y
SA
LUD
| H
EA
LTH
AN
D P
HY
SIC
AL
AC
TIV
ITY Discusión
Este estudio se presenta como un avance en investiga-ción que relaciona las variables de modulación vagal y la oxidación de sustratos específicos, siendo este el pri-mero a relacionar el UVFC1 y el Fatmax, además de generar dos métodos alternativos para la determinación del Fatmax mediante índices de VFC en personas sanas físicamente activas.
En relación con el objetivo de identificar la relación entre UVFC1 y Fatmax, el UVFC1 presenta diferencias significativas con Fatmax (p ≤ .05), un sesgo positivo en todas las variables y correlaciones significativas solo en W (r = .8) y V· O2 (rho = .84). Por lo tanto no se pue-de afirmar que el UVFC y Fatmax son sucesos fisioló-gicos que ocurren al mismo tiempo, solo en W y V· O2 se puede confirmar una relación que tiende a sobrestimar el valor (15.8 W y .16 L · min–1 respectivamente). Los datos de sesgo y diferencias significativas confirman que el UVFC1 presenta valores sistemáticamente superiores al Fatmax, lo que confirman estudios anteriores respecto a la correlación entre estas variables y la ubicación del Fatmax antes de la transición aeróbica-anaeróbica (Gma-da et al., 2013; San-Millán y Brooks, 2017).
Al expresar el Fatmax como porcentaje del UVFC1 se aprecia que está muy cercano a este con valores de 84.2 ± 31.4%, 90.5 ± 11.2 %, 90.5 ± 23.4% para carga (W), frecuencia cardiaca (lpm) y V· O2 (L · min–1) respec-tivamente. En el método que utiliza el porcentaje donde ocurre el Fatmax se observa que no existen diferencias significativas (p > .05) para la carga en watts con una correlación significativa mayor a .8 y en todos los ca-sos, exceptuando uno, se encontraron dentro de los in-tervalos de confianza al 95%. Por lo tanto en este caso si se podría afirmar que el 84.2% del UVFC1 para watts como un método para la identificación del Fatmax, con la salvedad de un sesgo de sobrestimación sistemática de 2.5 W. Por el contrario, este método en frecuencia car-diaca no obtuvo una correlación significativa, por lo tanto se descartaría como un método alternativo independiente de poseer un buen acuerdo y no presentar diferencias sig-nificativas con el método de calorimetría indirecta.
El promedio de SD1 al ocurrir Fatmax fue de 5.56 ms, este valor promedio se ubica temporalmente an-tes que el valor de referencia de 3 ms del UVFC1 (Gran-nell & De Vito, 2017; Sales et al., 2011), esto coincide con el fenómeno ya expuesto como cuando el Fatmax es menor que el VT1 y UL. En este método no se apre-cian diferencias significativas (p > .05) en watts, con una
DiscussionThis study constitutes a breakthrough in research which relates the variables of vagal modulation and the oxidation of specific substrates and is the first to relate HRVT1 and Fatmax. It also provides two al-ternative methods for the determination of Fatmax by means of HRV indexes in physically active healthy people.
With regard to the objective of identifying the rela-tionship between HRVT1 and Fatmax, HRVT1 pres-ents significant differences with Fatmax (p ≤ .05), a positive bias in all variables and signific ant cor-relations only in W (r = .8) and V· O2 (rho = .84). Therefore, it cannot be said that HRVT and Fatmax are physiological events that occur at the same time; only in W and V· O2 can a relationship that tends to overestimate the value (15.8 W and .16 L · min–1, respectively) be confirmed. The bias and significant difference data confirm that HRVT1 presents system-atically higher values than Fatmax, which confirms previous studies regarding the correlation between these variables and the location of Fatmax before the aerobic-anaerobic transition (Gmada et al., 2013; San-Millán & Brooks, 2017).
When Fatmax is expressed as a percentage of HRVT1, it is very close to the latter, with values of 84.2 ± 31.4%, 90.5 ± 11.2%, 90.5 ± 23.4% for load (W), heart rate (bpm) and V· O2 (L · min–1), respective-ly. In the method using the percentage where Fatmax occurs, there are no significant differences (p > .05) for the load in watts with a significant correlation greater than .8, and in all cases except one they were within the 95% confidence intervals. So in this case 84.2% of HRVT1 for watts could be asserted as a method for Fatmax identification, qualified by a sys-tematic overestimation bias of 2.5 W. By contrast, in heart rate this method did not obtain a significant cor-relation, so it would be ruled out as an independent alternative method to obtain good agreement and not present significant differences with the indirect calo-rimetry method.
The SD1 average when Fatmax occurred was 5.56 ms, and this average value, in terms of time, precedes the 3 ms reference value for HRVT1 (Gran-nell & De Vito, 2017; Sales et al., 2011) this coin-cides with the abovementioned phenomenon when Fatmax is less than VT1 and LT. There are no sig-nificant differences (p > .05) in watts in this method,
119Apunts. Educación Física y Deportes. 2019, n.º 138. 4.º trimestre (octubre-diciembre), pp. 111-122. ISSN-1577-4015
Máxima oxidación de grasa mediante variabilidad de la frecuencia cardiaca en sujetos físicamente activos Maximal Fat Oxidation by Heart Rate Variability in Physically Active Subjects
AC
TIV
IDA
D F
ÍSIC
A Y
SA
LUD
| H
EA
LTH
AN
D P
HY
SIC
AL
AC
TIV
ITYwith a correlation of .84 (p < .01) and only one case
outside the 95% confidence intervals. No significant differences (p > .05) are observed either for heart rate, correlations of .55 (p < .01) and all cases are within the 95% confidence intervals. It can therefore be affirmed that in both watts and heart rate the 5.56 value in SD1 could be used for Fatmax identification with the qualification of an overestimation of 2.8 W or 2.7 bpm. However, HRV values vary according to physical fitness or overweight (Bellenger et al., 2016; Espinoza-Salinas et al., 2015), and as the product of non-probability sampling, the values of 5.56 ms could only be extrapolated to a sample with characteristics similar to the study sample.
Although this study did not seek to corroborate concordance but rather to analyse the association be-tween HRVT1 and VT1, it must be verified in the intensities of studies since the intention is to replicate the relationships in VT1 or LT and Fatmax. On this point, it coincides with the results of previous studies (Grannell & De Vito, 2017; Karapetian et al., 2008) as no significant differences are found in watts, heart rate and V· O2. However, there are only significant correlations in terms of watts and V· O2 which may be the result of the 5-minute steps which are outside the HRVT1 protocol, where they are from 1 to 3 minutes per step. Therefore, heart rate in this study would not be a fully valid parameter since it does not present good correlation. In this case, the relationships that are extracted as a result of heart rate would not be comparable to the relationship between VT1 and Fatmax (Gmada et al., 2013) but rather due to a di-rect relationship it may occur with HRVT1 and Fat-max in which no significant correlations were found in any variable, possibly as a result of the foregoing except in SD1 = 5.56.
These data suggest, first of all, that HRVT1 can be used as an alternative method for the identifica-tion of VT1 with a 5-minute step protocol in the W and V· O2 variables. The important variables were load in watts and heart rate due to their accessibil-ity, and the results suggest that 84.2% of the first threshold as assessed by HRV or the value closest to SD1 = 5.56 in the load values in watts can be used to identify the maximal fat oxidation point in a population of physically active people. Therefore, the results permit a low-cost and low-complexity as-sessment of maximal fat oxidation using heart rate variability in incremental intensity exercise. This
correlación de .84 (p < .01) y solo un caso fuera de los intervalos de confianza al 95%. Para frecuencia cardiaca tampoco se observan diferencias significativas (p > .05), unas correlaciones de .55 (p < .01) y todos los casos dentro de los intervalos de confianza al 95%. Por lo tan-to, se podría afirmar que tanto en watts como en frecuen-cia cardiaca el valor 5.56 en SD1 se podría utilizar para la identificación del Fatmax con la salvedad de una so-brestimación de 2.8 W o 2.7 lpm. No obstante, los valo-res de VFC varían según aptitud física o exceso de peso (Bellenger et al., 2016; Espinoza-Salinas et al., 2015) y producto de un muestreo no probabilístico los valores de 5.56 ms solo se podrían extrapolar a una muestra de ca-racterísticas parecidas a la muestra del estudio
Si bien este estudio no buscó corroborar la concor-dancia sino analizar la asociación entre el UVFC1 y el VT1, se hace necesario verificarlo en las intensidades de estudios dado que se busca replicar las relaciones en VT1 o UL y Fatmax. En este punto, se coincide con los resul-tados de estudios anteriores (Grannell y De Vito, 2017; Karapetian et al., 2008) al no encontrar diferencias signi-ficativas en watts, frecuencia cardiaca y V· O2, no obstante solo existen correlaciones significativas a nivel de watts y V· O2 pudiendo ser producto de los escalones de 5 minutos dado que no se acotan a los protocolo para el UVFC1 siendo estos de 1 a 3 minutos por escalón. Por lo tanto, la frecuencia cardiaca en este estudio no sería un paráme-tro totalmente válido dado que no posee buena correla-ción. En ese caso, las relaciones que se extraen producto de la frecuencia cardiaca no haría un símil al fenómeno entre VT1 y Fatmax (Gmada et al., 2013) sino que más bien por relación directa pueda ocurrir con el UVFC1 y Fatmax, en la que no se encontraron correlaciones signifi-cativas en ninguna variable, posiblemente producto de lo anteriormente expuesto exceptuándose en SD = 5.56.
Estos datos sugieren, primero, que el UVFC1 puede ser utilizado como un método alternativo para la identifi-cación de VT1 con un protocolo de escalones de 5 minu-tos en las variables de W y V· O2. Las variables de impor-tancia fueron carga en watts y frecuencia cardiaca dado su accesibilidad, en los resultados encontrados sugieren que utilizar el 84.2% del primer umbral valorado por VFC o el valor más cercano a SD1 = 5.56 en los valores de carga en watts puede ser utilizado para la identifica-ción del punto de máxima oxidación de grasas en una po-blación de personas físicamente activas. Por lo tanto, los resultados encontrados permiten realizar una valoración de bajo costo y complejidad de la máxima oxidación de grasa utilizando la variabilidad de la frecuencia cardiaca
120
Sáez-Olivares S., Pino-Zúñiga, J., Olivares-Gálvez, M., Cancino-López, J.
Apunts. Educación Física y Deportes. 2019, n.º 138. 4.º trimestre (octubre-diciembre), pp. 111-122. ISSN-1577-4015
AC
TIV
IDA
D F
ÍSIC
A Y
SA
LUD
| H
EA
LTH
AN
D P
HY
SIC
AL
AC
TIV
ITY study represents a breakthrough in the understand-
ing of fat oxidation versus HRV in physically active healthy people, a somewhat unexplored topic since the direct physiological relationship between these two variables would not be explained. The influ-ence of lactate as a lacto-hormone counter-regulator of lipolysis (Ahmed et al., 2010) and its appearance in blood related to the withdrawal and stabilisation of the parasympathetic nervous system (Karapetian et al., 2008) would mean that following the stabi-lisation of a low parasympathetic system value the rate of fat oxidation should fall. This process is ev-idenced in this paper with an average Fatmax value of SD1 above the HRVT1 reference value, which would explain that in order to achieve maximal fat oxidation there must be at least a low expression of parasympathetic activity, which is contrasted with evidence of the stimulation of the sympathetic sys-tem as a determining factor in the increase in fat ox-idation (Zeng et al., 2015).
The limitations stemmed from the presence of people who did not minimally meet the criteria and others who did competition-level athlete training and the non-expression of the classic kinematics of the fat oxidation curve in all subjects. Consider-ing the above, an analysis of the interaction of the sympathetic-parasympathetic system using HRV would be useful for a more comprehensive expla-nation of fat oxidation in incremental exercise in different populations, and thus explain the time and the internal, external or training conditions where the assertion of the “high sympathetic and low parasympathetic system” leads to a rise in fat oxi-dation.
Conclusion The results of this study suggest that there is a correlation between the first heart rate variability threshold and the point of maximal fat oxidation in the oxygen consumption and watts load variables in physically active healthy adults. This relation-ship can be used to identify the load in watts at the point of maximal fat oxidation with good concor-dance.
Further research is needed to confirm the data ob-tained and to determine whether there are direct phys-iological processes between the autonomic nervous system and fat oxidation in incremental exercise.
en un ejercicio de intensidad incremental. Este estudio representa un avance en el entendimiento de la oxidación de las grasas versus VFC en personas sanas y físicamen-te activas, siendo este tema muy poco estudiado dado que no se explicaría la relación fisiológica directa entre estas dos variables. Las influencias del lactato como lac-tohormona contrarreguladora de la lipólisis (Ahmed et al., 2010) y su aparición en sangre relacionada con una retirada y estabilización del sistema nervioso parasimpá-tico (Karapetian et al., 2008), se traducirían en que pos-teriormente a la estabilización de un valor bajo del siste-ma parasimpático debería bajar la tasa de oxidación de grasa. Este fenómeno se logra evidenciar en este trabajo con un valor de Fatmax promedio de SD1 mayor que el valor de referencia del UVFC1, lo que explicaría que para lograr la máxima oxidación de grasa es necesario por lo menos una baja expresión de actividad parasimpá-tica, que se contrapone con evidencia de la estimulación del sistema simpático como un factor determinante en el aumento en la oxidación de grasas (Zeng et al., 2015).
Las limitaciones vinieron por la existencia de per-sonas que no cumplían los criterios de forma mínima, así como otras que realizaban entrenamiento de atletas con nivel competitivo y la no expresión de la cinemática clásica de la curva oxidación de grasas en todos los pa-cientes. Teniendo en cuenta lo dicho, sería beneficioso para una explicación más completa de la oxidación de la grasa en ejercicio incremental en diferentes poblaciones, el análisis de la interacción del sistema simpático-para-simpático a través de la VFC y así se podría dilucidar el momento y las condiciones internas, externas o de en-trenamiento que la aseveración del “sistema simpático elevado y parasimpático bajo” procede a una alza en la oxidación de las grasas.
Conclusión Los resultados del trabajo sugieren que existe correla-ción entre el primer umbral de variabilidad de frecuen-cia cardiaca y el punto de máxima oxidación de gra-sas en las variables de consumo de oxígeno y carga en watts en adultos sanos físicamente activos. Al utilizar esta relación se puede identificar la carga en watts en el punto de máxima oxidación de grasas con una buena concordancia.
Debe investigarse más para confirmar los datos obte-nidos y precisar si existen procesos fisiológicos directos entre el sistema nervioso autonómico y la oxidación de las grasas en ejercicio incremental.
121Apunts. Educación Física y Deportes. 2019, n.º 138. 4.º trimestre (octubre-diciembre), pp. 111-122. ISSN-1577-4015
Máxima oxidación de grasa mediante variabilidad de la frecuencia cardiaca en sujetos físicamente activos Maximal Fat Oxidation by Heart Rate Variability in Physically Active Subjects
AC
TIV
IDA
D F
ÍSIC
A Y
SA
LUD
| H
EA
LTH
AN
D P
HY
SIC
AL
AC
TIV
ITYAgradecimientos
Agradecemos a las personas participantes en el estu-dio haber proporcionado sus datos del examen para el avance de la ciencia, así como también al personal do-cente de la universidad, al personal médico del Cen-tro de Nutrición y Cirugía Bariátrica de la Clínica Las Condes por su constante apoyo, y a nuestras familias por sus sacrificios y esfuerzos en nuestra formación profesional.
Conflicto de intereses Las autorías no han comunicado ningún conflicto de in-tereses.
AcknowledgmentsWe would like to thank the participants in the study for having provided their examination data for the advancement of science, as well as the uni-versity faculty, the medical staff at the Center for Nutrition and Bariatric Surgery at the Clínica Las Condes for their constant support, and our fami-lies for their sacrifices and efforts in our profes-sional training.
Conflict of InterestsNo conflict of interest was reported by the authors.
References ReferenciasAchten, J., Gleeson, M., & Jeukendrup, A. E. (2002). Determination of
the exercise intensity that elicits maximal fat oxidation. Medicine and Science in Sports and Exercise, 34(1), 92-97. doi:10.1097/00005768-200201000-00015
Ahmed, K., Tunaru, S., Tang, C., Müller, M., Gille, A., Sassmann, A., … Offermanns, S. (2010). An autocrine lactate loop mediates insulin-dependent inhibition of lipolysis through GPR81. Cell Meta-bolism, 11(4), 311-319. doi:10.1016/j.cmet.2010.02.012
Beaver, W. L., Wasserman, K., & Whipp, B. J. (1986). A new method for detecting anaerobic threshold by gas exchange. Journal of Applied Physiology, 60(6), 2020-2027. doi:10.1152/jappl.1986.60.6.2020
Bellenger, C. R., Fuller, J. T., Thomson, R. L., Davison, K., Robert-son, E. Y., & Buckley, J. D. (2016). Monitoring athletic training status through autonomic heart rate regulation: A systematic review and meta-analysis. Sports Medicine (Auckland, N.Z.), 46(10), 1461-1486. doi:10.1007/s40279-016-0484-2
Bland, J. M., & Altman, D. G. (1986). Statistical methods for asses-sing agreement between two methods of clinical measurement. Lan-cet, 1(8476), 307–310. doi:10.1016/S0140-6736(86)90837-8
Brun, J.-F., Romain, A.-J., & Mercier, J. (2011). Maximal lipid oxidation during exercise (Lipoxmax): From physiological measu-rements to clinical applications. Facts and uncertainties. Science & Sports, 26(2), 57-71. doi:10.1016/j.scispo.2011.02.001
Crespo-Salgado, J. J., Delgado-Martín, J. L., Blanco-Iglesias, O., & Aldecoa-Landesa, S. (2015). Guía básica de detección del sedentaris-mo y recomendaciones de actividad física en atención primaria. Aten-ción Primaria, 47(3), 175-183. doi:10.1016/j.aprim.2014.09.004
Espinoza-Salinas, A., Zafra-Santos, E., Pavez-Von Martens, G., Cofré-Bolados, C., Lemus-Zúñiga, J., & Sánchez-Aguilera, P. (2015). Análisis de variabilidad del ritmo cardiaco y su relación con la sensibilidad insulínica en pacientes obesos y con sobrepeso. Revista Médica de Chile, 143(9), 1129-1135. doi:10.4067/S0034-98872015000900005
Frayn, K. N. (1983). Calculation of substrate oxidation rates in vivo from gaseous exchange. Journal of Applied Physiology: Res-piratory, Environmental and Exercise Physiology, 55(2), 628–634. doi:10.1152/jappl.1983.55.2.628
Gmada, N., Marzouki, H., Sassi, R. H., Tabka, Z., Shephard, R., Brun, J.-F., & Bouhlel, E. (2013). Relative and absolute reliability of the crossover and maximum fat oxidation points and their rela-tionship to ventilatory threshold. Science & Sports, 4(28), e99–e105. doi:10.1016/j.scispo.2012.04.007
Grannell, A., & De Vito, G. (2017). An investigation into the relation-ship between heart rate variability and the ventilatory threshold in healthy moderately trained males. Clinical Physiology and Functional Imaging. doi:10.1111/cpf.12437
Hernando, D., Garatachea, N., Almeida, R., Casajús, J. A., & Bailón, R. (2016). Validation of heart rate monitor Polar RS800 for heart rate variability analysis during exercise. Journal of Strength and Con-ditioning Research. doi:10.1519/JSC.0000000000001662
Jones, N. L., Makrides, L., Hitchcock, C., Chypchar, T., & McCart-ney, N. (1985). Normal standards for an incremental progressive cycle ergometer test. The American Review of Respiratory Disease, 131(5), 700-708. doi:10.1164/arrd.1985.131.5.700
Karapetian, G. K., Engels, H. J., & Gretebeck, R. J. (2008). Use of heart rate variability to estimate LT and VT. International Journal of Sports Medicine, 29(8), 652-657. doi:10.1055/s-2007-989423
Lazzer, S., Lafortuna, C., Busti, C., Galli, R., Agosti, F., & Sartorio, A. (2011). Effects of low- and high-intensity exercise training on body composition and substrate metabolism in obese adolescents. Journal of Endocrinological Investigation, 34(1), 45-52. doi:10.1007/BF03346694
Michael, S., Graham, K. S., & Davis, G. M. (2017). Cardiac auto-nomic responses during exercise and post-exercise recovery using heart rate variability and systolic time intervals-A review. Frontiers in Physiology, 8, 301. doi:10.3389/fphys.2017.00301
Pallarés, J. G., Morán-Navarro, R., Ortega, J. F., Fernández-Elías, V. E., & Mora-Rodriguez, R. (2016). Validity and reliability of ventila-tory and blood lactate thresholds in well-trained cyclists. PLOS ONE, 11(9), e0163389. doi:10.1371/journal.pone.0163389
Randell, R. K., Rollo, I., Roberts, T. J., Dalrymple, K. J., Jeuken-drup, A. E., & Carter, J. M. (2017). Maximal fat oxidation rates in an athletic population. Medicine and Science in Sports and Exercise, 49(1), 133-140. doi:10.1249/MSS.0000000000001084
Salas, C., Cristi-Montero, C., Fan, Y., Durán, E., Labraña, A. M., Martínez, M. A., … Alvarez, C. (2016). Ser físicamen-te activo modifica los efectos nocivos del sedentarismo sobre marcadores de obesidad y cardiometabólicos en adultos. Revis-ta Médica de Chile, 144(11), 1400-1409. doi:10.4067/S0034-98872016001100005
Sales, M. M., Campbell, C. S. G., Morais, P. K., Ernesto, C., Soares-Caldeira, L. F., Russo, P., … Simões, H. G. (2011). No-ninvasive method to estimate anaerobic threshold in individuals with type 2 diabetes. Diabetology & Metabolic Syndrome, 3(1), 1. doi:10.1186/1758-5996-3-1
122
Sáez-Olivares S., Pino-Zúñiga, J., Olivares-Gálvez, M., Cancino-López, J.
Apunts. Educación Física y Deportes. 2019, n.º 138. 4.º trimestre (octubre-diciembre), pp. 111-122. ISSN-1577-4015
AC
TIV
IDA
D F
ÍSIC
A Y
SA
LUD
| H
EA
LTH
AN
D P
HY
SIC
AL
AC
TIV
ITY San-Millán, I., & Brooks, G. A. (2017). Assessment of metabolic fle-
xibility by means of measuring blood lactate, fat, and carbohydrate oxidation responses to exercise in professional endurance athletes and less-fit individuals. Sports Medicine. doi:10.1007/s40279-017-0751-x
Tan, S., Wang, J., Cao, L., Guo, Z., & Wang, Y. (2016). Positive effect of exercise training at maximal fat oxidation intensity on body composition and lipid metabolism in overweight middle-aged wo-men. Clinical Physiology and Functional Imaging, 36(3), 225-230. doi:10.1111/cpf.12217
Task Force of the European Society of Cardiology and the North American Society of Pacing and Electrophysiology. (1996).
Heart rate variability. Standards of measurement, physiological interpretation, and clinical use. European Heart Journal, 17(3), 354-381.
Venables, M. C., & Jeukendrup, A. E. (2008). Endurance training and obesity: Effect on substrate metabolism and insulin sensitivi-ty. Medicine and Science in Sports and Exercise, 40(3), 495-502. doi:10.1249/MSS.0b013e31815f256f
Zeng, W., Pirzgalska, R. M., Pereira, M. M. A., Kubasova, N., Ba-rateiro, A., Seixas, E., … Domingos, A. I. (2015). Sympathetic neu-ro-adipose connections mediate leptin-driven lipolysis. Cell, 163(1), 84–94. doi:10.1016/j.cell.2015.08.055
Article Citation Citación del artículo
Sáez-Olivares S., Pino-Zúñiga, J., Olivares-Gálvez, M., & Cancino-López, J. (2019). Maximal Fat Oxidation by Heart Rate Variability in Physically Active Subjects. Apunts. Educación Física y Deportes, 138, 111-122. doi:10.5672/apunts.2014-0983.es.(2019/4).138.09