Embed Size (px)
Citation preview
Medizinische Fakultät der Universität Ulm
Klinik für Neurologie
Prof. Dr. Albert C. Ludolph
The Effects of Endurance Exercise on Lactatedehydro-
genase-A and Lactatedehydrogenase-B Gene Expres-
sion in Skeletal Muscle of Asymptomatic and Sympto-
matic Huntington's Disease Mutation Carriers
Dissertation zur Erlangung des Doktorgrades der
Medizin der Medizinischen Fakultät der Universität Ulm
Vorgelegt von Frieder Taurai Hummes
geboren in Esslingen am Neckar
2019

Amtierender Dekan:
Prof. Dr. Thomas Wirth
1. Berichterstatter:
PD Dr. Patrick Weydt
2. Berichterstatter:
Prof. Dr. Jürgen Steinacker
Tag der Promotion:
12.04.2021
I
Table of contents
Table of contents ................................................................................................................... I
Abbreviations .................................................................................................................... III
1. Introduction .............................................................................................................. 1
1.1 Huntington's Disease ........................................................................................................ 1
1.2 Mitochondria .................................................................................................................... 4
1.3 Lactate metabolism .......................................................................................................... 4
1.4 Metabolic changes in HD ................................................................................................. 6
1.5 PGC-1α - A Master Regulator of Mitochondrial Biogenesis ........................................ 9
1.6 The Role of PGC-1α in HD ............................................................................................ 10
1.7 Skeletal muscle fine needle biopsies .............................................................................. 10
1.8 Hypothesis and aim ........................................................................................................ 11
2. Methods and material ............................................................................................ 12
2.1 Participants ..................................................................................................................... 12
2.2 Methods ........................................................................................................................... 13
2.3 Material ........................................................................................................................... 21
3. Results ...................................................................................................................... 25
3.1 Complication rate of skeletal muscle fine needle biopsies .......................................... 25
3.2 Blood lactate ................................................................................................................... 26
3.3 Lactate Dehydrogenase (LDH) ..................................................................................... 28
4. Discussion ................................................................................................................ 44
5. Summary ................................................................................................................. 53
6. Bibliography ............................................................................................................ 55
Acknowledgements ............................................................................................................ 61

II
Curriculum Vitae ............................................................................................................... 62
III
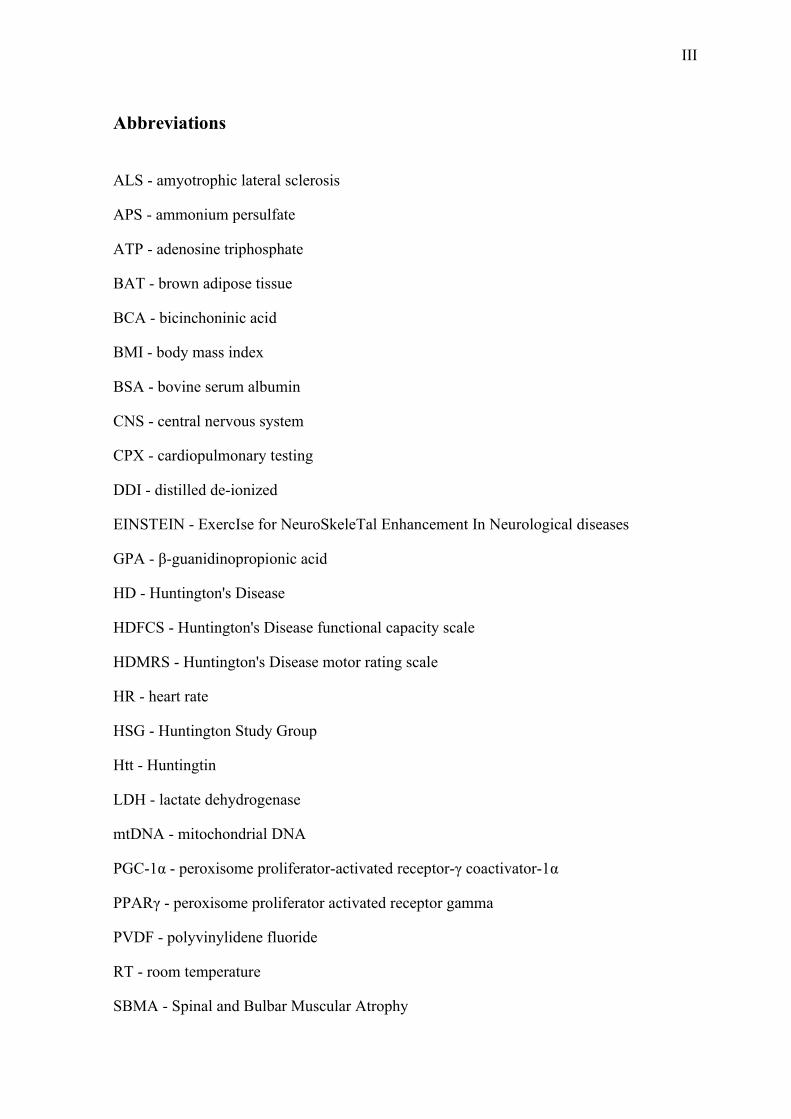
Abbreviations
ALS - amyotrophic lateral sclerosis
APS - ammonium persulfate
ATP - adenosine triphosphate
BAT - brown adipose tissue
BCA - bicinchoninic acid
BMI - body mass index
BSA - bovine serum albumin
CNS - central nervous system
CPX - cardiopulmonary testing
DDI - distilled de-ionized
EINSTEIN - ExercIse for NeuroSkeleTal Enhancement In Neurological diseases
GPA - β-guanidinopropionic acid
HD - Huntington's Disease
HDFCS - Huntington's Disease functional capacity scale
HDMRS - Huntington's Disease motor rating scale
HR - heart rate
HSG - Huntington Study Group
Htt - Huntingtin
LDH - lactate dehydrogenase
mtDNA - mitochondrial DNA
PGC-1α - peroxisome proliferator-activated receptor-γ coactivator-1α
PPARγ - peroxisome proliferator activated receptor gamma
PVDF - polyvinylidene fluoride
RT - room temperature
SBMA - Spinal and Bulbar Muscular Atrophy

IV
SDS - sodium dodecyl sulfate
SDS-Page - sodium dodecyl sulfate-polyacrylamide gel electrophoresis
TEMED - tetramethylethylenediamine
UHDRS - Unified Huntington's Disease rating scale
UHDRS MS - Unified Huntington's Disease rating scale motor score
VAT - ventilatory anaerobic threshold
VO2max - maximal oxygen consumption
W - Watt
1
1. Introduction
1.1 Huntington's Disease
1.1.1 Epidemiology and symptoms
Huntington's Disease (HD) is an incurable autosomal dominant hereditary disease, that
results from an abnormal expansion of the CAG-repeat tract in the Huntingtin (Htt)
gene on the short arm of chromosome 4p16.3 [1]. The prevalence of the disease in Eu-
rope is approximately 5-7/100.000 inhabitants [2]. Typically the first symptoms occur
between the age of 35 and 50 years but the manifestation can occur at any age. Patients
themselves are not always aware of their symptoms at this stage. The first manifesta-
tions can show as irritability, fidgeting and restlessness, among other things. When the
symptoms become stronger, choreatic movement, motor impersistence and lack of co-
ordination usually allow the formal diagnosis of HD [2]. Death typically occurs 10-20
years after symptom onset and is usually due to complications, such as pneumonia [3].
1.1.1 Genetics
The gene locus mutated in HD encodes for the protein huntingtin (Htt). The mutation
leads to an expansion of a polyglutamine tract in the Htt protein. This causes a gain-of-
function and possibly a partial loss-of-function. Normal Htt alleles show a repeat num-
ber ranging from 7 to 35, the pathological threshold lies at around 38 repeats [4]. Com-
plete penetrance with a varying expressivity is characteristic for the autosomal dominant
transmission of HD [5]. However, incomplete penetrance is documented in the range of
36-40 CAG-repeats [2].
Htt is expressed in all cells of the human body, including skeletal muscle, with the high-
est expression rates in brain and testicular tissue [2, 6, 7]. The exact functions of wild-
type Htt vary greatly and have not yet been completely established [8, 9].
Transgenic animal models are a very useful tool to investigate the pathologies of HD.
However there are limitations to these models and the results usually cannot be trans-
2
ferred directly to humans [10]. This necessitates studies with human participants and
tissue to further understand the features, including the metabolic characteristics of HD.
The number of CAG-repeats correlates with the age-of-onset and can therefore be used
as a predictor for disease onset in presymptomatic HD gene carriers. A higher number
of repeats points to an earlier age-of-onset. Nonetheless, it is still not possible to predict
the exact time of onset [11]. Some studies suggest that the gene encoding for the protein
PGC-1α has an influence on the age-of-onset [12-14], while others did not replicate this
[15].
1.1.2 Clinical stages
There are several scales available to measure the symptoms of HD. Very widely used
are the Unified Huntington's Disease Rating Scale Motor Score (UHDRS MS) and the
Huntington's Disease Total Functional Capacity scale (HD TFC). For the present study
we chose the UHDRS MS as a tool to categorize the different stages of the participants.
The UHDRS Motor score takes into account six different domains: motor capacity,
cognitive function, behavioral abnormalities, independence scale, functional assessment
and total functional capacity. A qualified investigator uses a questionnaire to assess
these domains [16]. The course of HD can be divided into six clinical stages, ranging
from stage 0 as the presymptomatic stage to stage 5, the final stage. In this stage the
patient is bed-ridden and symptoms such as bradykinesia and dystonia dominate and
even simple tasks can no longer be performed and the patient has become completely
dependent.
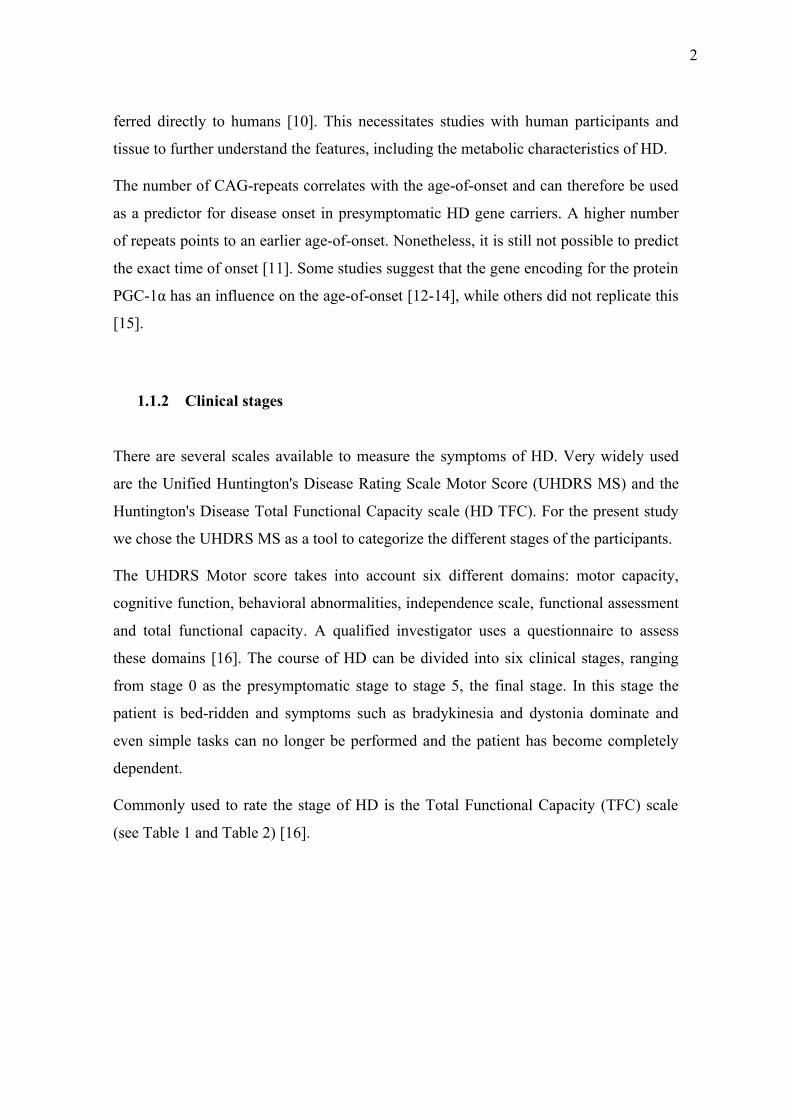
Commonly used to rate the stage of HD is the Total Functional Capacity (TFC) scale
(see Table 1 and Table 2) [16].
3
Table 1 Total Functional Capacity (TFC) scale. The TFC is a scale to measure a persons ability to live inde-
pendently [16]
Domain Ability Score
Occupation Unable 0
Marginal work only 1
Reduced capacity for usual
job
2
Normal 3
Finances Unable 0
Major assistance 1
Slight assistance 2
Normal 3
Domestic chores Unable 0
Impaired 1
Normal 2
Activities of Daily Living Total care 0
Gross tasks only 1
Minimal impairment 2
Normal 3
Care-Level Full-time nursing care 0
Home of chronic care 1
Home 2
Total Range 0-13

4
Table 2 Disease stage according to the Total Functional Capacity (TFC) scale [16]
Total Functional Capacity Scale Score Disease Stage
11-13 I
7-10 II
3-6 III
1-2 IV
0 V
1.2 Mitochondria
Mitochondria are part of every cell of the human body and contribute to many different
metabolic processes. One of the most important roles of mitochondria is energy metabo-
lism. Through oxidative phosphorylation mitochondria provide adenosine triphosphate
(ATP), which is a vital energy source. Furthermore, mitochondria generate reactive ox-
ygen species (ROS), which contribute to cell signaling pathways and oxidative stress
response [17]. Lactate metabolism also takes place in and around mitochondria [18].
Mitochondria have their own circular genome, which is passed on maternally only and
in humans encodes for 12 different proteins. However the number of proteins expressed
in mitochondria vastly exceeds the number of proteins encoded by mitochondrial DNA
(mtDNA). Thus most of the mitochondrial proteins are encoded in the nucleus and then
transferred to the mitochondria [17].
1.3 Lactate metabolism
Lactate production in skeletal muscle occurs during physical exercise, when the oxygen
supply is not sufficient to keep up with the energy demands of the skeletal muscle. This
point is called ventilatory anaerobic threshold (VAT). After reaching the VAT, muscle
lactate and whole body lactate increase rapidly due to increased pyruvate reduction and
decreased lactate oxidation [19]. Lactate clearance occurs through oxidation to pyruvate
5
by lactate dehydrogenase LDH. Lactate is then used for ATP production or gluconeo-
genesis, making lactate an important piece in the energy metabolism of skeletal muscle
[20].
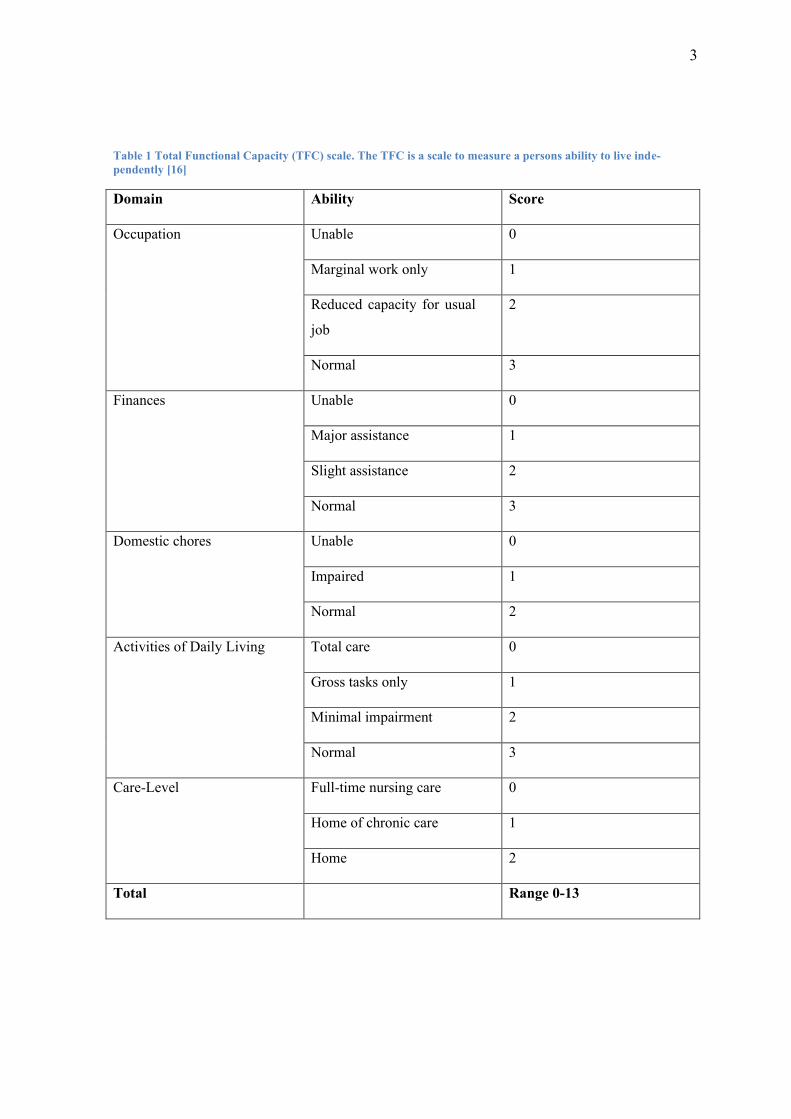
The key rate-limiting enzyme in lactate metabolism is LDH. LDH in humans is found in
five different molecular isoforms, which are each made up of varying combinations of
two LDH subunits. The subunit compositions differ between different tissues. The sub-
units are labeled M for muscle and H for heart. While LDH 1 consists almost solely of
subunit H, LDH 5 is almost completely made up of subunit M. The different propor-
tions of the subunits also define the enzymes' activity, with LDH 1 mostly being in-
volved in lactate oxidation and LDH 5 predominantly reducing pyruvate to lactate. LDH
2-4 show intermediate activity [21] (see Figure 1).
Figure 1 The influence of Lactacte dehydrogenase (LDH) A and LDH B on lactate metabolism. LDH A genes code
for the subunit M (muscle) of LDH, while LDH B genes cod for the subunit H (heart). The resulting five different
LDH isoforms show different levels of activity for Pyruvate reduction and lactate oxidation, depending on their
composition. [21, 22]
Using PGC-1α transgenic and knock-out mice, Summermatter et al. showed that the
regulation of the expression of LDH A and LDH B genes in skeletal muscle is tightly
regulated by PGC-1α [22]. The upregulation of PGC-1α during exercise induces expres-
sion of LDH B and inhibits the expression of LDH A. This leads to reduced levels of
subunit M and LDH 5 and increased levels of subunit H and LDH 1, 2 and 3. The in-
creased lactate clearance and oxidation resulting from these enzymes' activities led to

6
lowered lactate levels in response to higher expression of PGC-1α [22]. In addition,
Liang et al. found higher mitochondrial activity and increased endurance capacity in
LDH B transgenic mice, suggesting a direct influence of LDH B on mitochondrial res-
piration [23].
In skeletal muscle of aged mice, LDH A as well as LDH B had lower expression levels
than in skeletal muscle of younger mice and the response to pharmacological stimula-
tion with nandrolone deconate was opposite to that of younger muscle [24]. The anti-
oxidative ability of older skeletal muscle is reduced compared to younger skeletal mus-
cle but it is not completely absent. Hence, metabolic response to exercise in elderly
people is not as strong but still similar to that of younger people [25].
1.4 Metabolic changes in HD
HD affects the entire body and thus metabolic changes occur not only in the areas where
neuronal loss can be observed but also in all other tissues of the body [2, 7, 26]. Fur-
thermore, changes in metabolism can be detected before the onset of the first neurologi-
cal symptoms. Thus peripheral tissue like skeletal muscle is a promising and compara-
tively easy to access tissue to investigate and monitor metabolic change in HD.
As mentioned above, lactate production is a sign of anaerobic energy generation, thus
increased lactate levels point towards an altered energy metabolism and an earlier
switch from aerobic to anaerobic metabolism.
Presymptomatic HD gene carriers and HD patients have peak lactate levels at rest that
are much higher than those of the control group, detected through proton magnetic res-
onance spectroscopy [27]. Furthermore, lactate-pyruvate ratios are increased in the cer-
ebral-spinal fluid due to reduced pyruvate levels. Since pyruvate and lactate are both
substrates for the enzyme LDH (see Figure 1), reduced pyruvate production may be the
cause of the reduced ratios. However, lactate levels were higher in the cerebral cortex of
HD patients, indicating an increased lactate production [28].
Mitochondria have been a subject of HD research for some time now and their function-
ality in HD is still incompletely understood.
7
Mitochondrial dysfunction can be detected before the onset of the first symptoms and
seems to play a major role in the neurodegenerative processes underlying HD [29]. Sev-
eral studies have linked HD to mitochondrial dysfunction in different tissues, including
the striatum, liver cells and lymphoblasts [30-33].
In myoblasts and fibroblasts of HD patients mitochondrial structure is almost lost or
pathologically rearranged. The cells showed similar defects as neurons that were affect-
ed in HD patients. On top of that, other cell structures are altered in peripheral tissue
such as fibroblasts and myoblasts as well [34].
In the R6/2 mouse model, a commonly used mouse model of HD, a switch in fast glyco-
lytic muscle fibers to slower muscle types can be observed, as well as severe atrophy of
histologically healthy looking skeletal muscle [35, 36]. However, these preclinical find-
ings haven't been confirmed for HD patients. Ciammola et al. found that the anaerobic
threshold was lower and lactate production increased in skeletal muscle of HD patients
[37]. This runs against findings in rodents' skeletal muscle, since a higher anaerobic
threshold and reduced lactate production would be expected in slower muscle types
[38].
The influence of body composition on metabolism in HD patients hasn't been thorough-
ly researched yet. Controls with a higher BMI have decreased exercise capacity and
physical function [39, 40].
In summary, these findings show an alteration of energy metabolism in HD patients,
with mitochondrial dysfunction playing a major part. There seems to be a shift towards
early anaerobic exercise. This view is supported by the fiber type switch of skeletal
muscle in the mouse model, which so far however has not been confirmed in HD pa-
tients [37, 38, 41].
8
1.4.1 HD and physical exercise
Loss of muscle mass and loss of muscle tone are some of the most common early symp-
toms in HD [42-44], followed by uncontrolled choreatic movements. Hence, investiga-
tion of skeletal muscle affected by HD and the effect of exercise on metabolism in skel-
etal muscle may give a deeper insight into the pathologies of the disease and may even-
tually lead to new monitoring or even treatment options.
Key part of the ongoing debate is the question whether exercise is beneficial or harmful
for patients and presymptomatic HD gene carriers. In transgenic N171-82Q HD mice
regular wheel running led to an earlier onset of disease and significantly increased
symptoms, including motor deficits as well as cognitive impairment [45].
On the other hand, current evidence leans toward a beneficial effect of moderate intensi-
ty exercise on a regular basis. Several studies with different mouse models have found a
positive effect of exercise on motor symptoms [46-51]. However the reported effect on
mitochondrial function and biogenesis was contradictory in these studies, calling for
further investigations.
In a different study physical exercise did not affect motor symptoms as strongly as cog-
nitive symptoms in the R6/1 mouse model [52].
To further investigate the influence of exercise, the metabolic changes in skeletal mus-
cle of HD patients following an acute bout of exercise are of great interest.
The anaerobic threshold during intense physical exercise is much lower in HD patients
than in control subjects and lactate production in skeletal muscle cells of HD patients is
severely increased [37]. This suggests mitochondrial dysfunction in skeletal muscle as
the underlying cause. However this conflicts with the findings of fiber type switches in
transgenic mice towards slower, oxidative fiber types. One explanation for this may be
an insufficient supply of oxygen in the skeletal muscle. Also, the transgenic model of
R6/2 mice has fundamental limitations, such as the extreme repeat length, which com-
plicates the transfer of findings in this model to the human metabolism.
Ciammola et al. found mitochondrial abnormalities in skeletal muscle of HD patients
[37]. In muscle tissue of HD patients and presymptomatic HD gene carriers mitochon-
drial ATP-production was significantly reduced before and after endurance exercise
[53]. Following intense exercise, Josefsen et al. found impaired gluconeogenesis in the
9
liver of HD patients, however there was no impaired glucose or lactate metabolism in
blood from the jugular vein during or after the exercise. In the R6/2 mouse model they
found reduced lactate clearance and hepatic glucose output after a lactate load was ad-
ministered [38].
These findings suggest that the increased lactate concentrations may be a result of insuf-
ficient use of oxygen supply as well as mitochondrial dysfunction.
1.5 PGC-1α - A Master Regulator of Mitochondrial Biogenesis
In 1998, PGC-1α was first described as a coactivator of peroxisome proliferator activat-
ed receptor gamma (PPARγ) and is a versatile regulator of mitochondrial activity and
brown adipose tissue (BAT) differentiation [54]. PGC-1α is a protein with 795 amino
acids and has a calculated molecular weight of 92 kDa [54]. It is a promotor and regula-
tor of different mitochondrial genes and coordinates the activity of several different
transcription factors, such as PPAR and estrogen receptor (ER) [55]. It is an important
protein that, in healthy individuals, controls stress response and reacts to metabolic de-
mands in skeletal muscle and is up-regulated after exercise. The versatile coregulator
influences the expression of LDH genes in skeletal muscle and therefore controls skele-
tal muscle and whole-body lactate levels [22].
PGC-1α has an extensive effect on metabolic processes in the entire body, including
skeletal muscle and central nervous system (CNS). It is strongly induced by exercise
and influences mitochondrial function, cell energy metabolism and thermogenic re-
sponse [56-61].
Exercise in elderly muscle can reduce mitochondrial inactivity and therefore also reduce
age-related metabolic changes Not many studies have investigated the direct influence
of age on the expression and function of PGC-1α. There is however ample indirect evi-
dence suggesting PGC-1α levels and its activity to be lower in older people [62, 63].
10
1.6 The Role of PGC-1α in HD
In the past few years, PGC-1α has become a focus of research in neurodegenerative
diseases as its mechanisms of action are seen as possible treatment approaches [64]. The
role of PGC-1α in HD is not yet fully understood.
The metabolic changes of mouse models where PGC-1α was knocked out are similar to
those in HD and HD-related changes in mouse model skeletal muscle can be positively
influenced by PGC-1α [65-67].
Further evidence stems from studies where PPAR agonists were administered in HD
mouse models and the effects of lowered PGC-1α levels could be partly reversed [68-
70].
Therefore the investigation of the influence of exercise on the metabolic changes in
skeletal muscle gives an insight into the pathologies of HD. The investigation of skele-
tal muscle has the great advantage of directly investigating human tissue and thus elimi-
nating artifacts of a mouse model.
1.7 Skeletal muscle fine needle biopsies
Skeletal muscle fine needle biopsies have been established as a practical method to ob-
tain skeletal muscle tissue for RNA analysis as well as measurement of protein expres-
sion levels [71]. So far, these skeletal muscle fine needle biopsies were mostly used in
exercise studies [72]. To examine skeletal muscle tissue for neurological purposes, the
method that is still commonly used is the open biopsy. This method is more invasive
and therefore more prone to complications such as bleeding, infection and pain [73].
11
1.8 Hypothesis and aim
In summary, the findings outlined above lead to the conclusion, that the metabolic
changes, especially in response to exercise have not yet been completely understood.
Skeletal muscle is a promising and easy to obtain tissue to investigate metabolic change
in HD.
This dissertation focuses on the hypothesis that LDH A and LDH B gene expression in
skeletal muscle of presymptomatic HD gene carriers and HD patients responds differ-
ently to moderate intensity endurance exercise than in skeletal muscle of controls.
I further hypothesized that the lactate response to moderate endurance exercise is altered
in presymptomatic HD gene carriers and symptomatic HD patients, leading to a lower
anabolic threshold and increased blood lactate levels during the exercise.
To test this hypothesis, I investigated the influence of an acute bout of moderate intensi-
ty endurance exercise on the gene expression of LDH A and LDH B in skeletal muscle
of presymptomatic HD gene carriers and symptomatic HD patients in comparison to
controls, as well as serum lactate levels during the exercise.
12
2. Methods and material
2.1 Participants
For this thesis I examined a total of 22 participants, which included 12 controls, 9 pre-
symptomatic presymptomatic HD gene carriers and 1 symptomatic HD patient into the
analysis for this thesis. Also part of the study but not discussed in this thesis were 8
ALS participants. The other 5 participants were excluded either due to physical reasons,
insufficient biopsy material or withdrawal from the study.
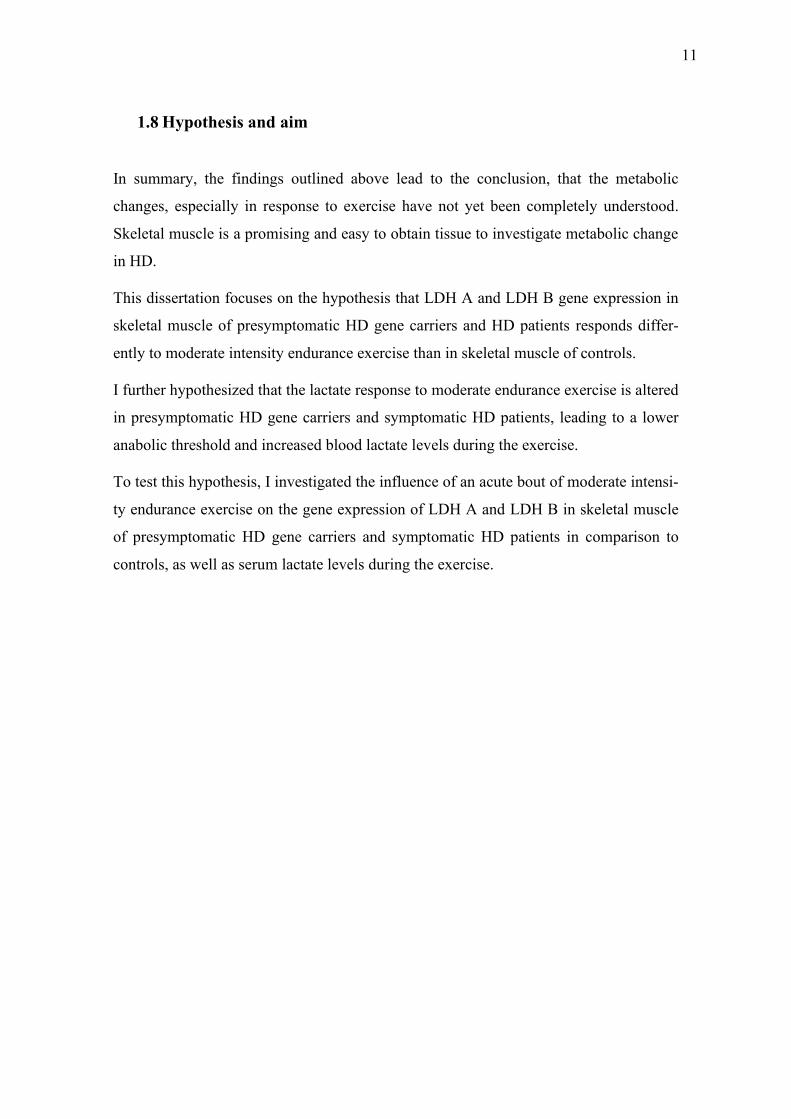
Table 3 shows a summary of key characteristics of the study cohort. The participants
were all untrained with VO2max < 54 ml/min/kg.
Table 3 Participants A summary of key characteristics of the study cohort. The participants' data was collected
during the first of two appointments at Universitätsklinikum Ulm between 2014 and 2016. The participants were
all untrained with VO2max (maximal oxygen consumption) < 54 ml/min/kg.
Control presymptomatic
Huntington's Dis-
ease (HD) gene
carriers
HD stage 2
Number of subjects 12 9 1
Male 7 5 1
Female 5 4 0
Age (years), mean
± SD
32.3 ± 2.1 44.3 ± 5.2 64
BMI (kg/m2), mean
± SD
26.2 ± 1.2 25.8 ± 1.4 24.8
Body weight (kg),
mean ± SD
81.3 ± 4.6 76.8 ± 4.9 66.8
VO2max
(ml/kg/min), mean
± SD
30.0 ± 1.4 26.3 ± 3.7 22.7
CAG repeats, mean
± SD
43.1 ± 1.0 42
13
2.2 Methods
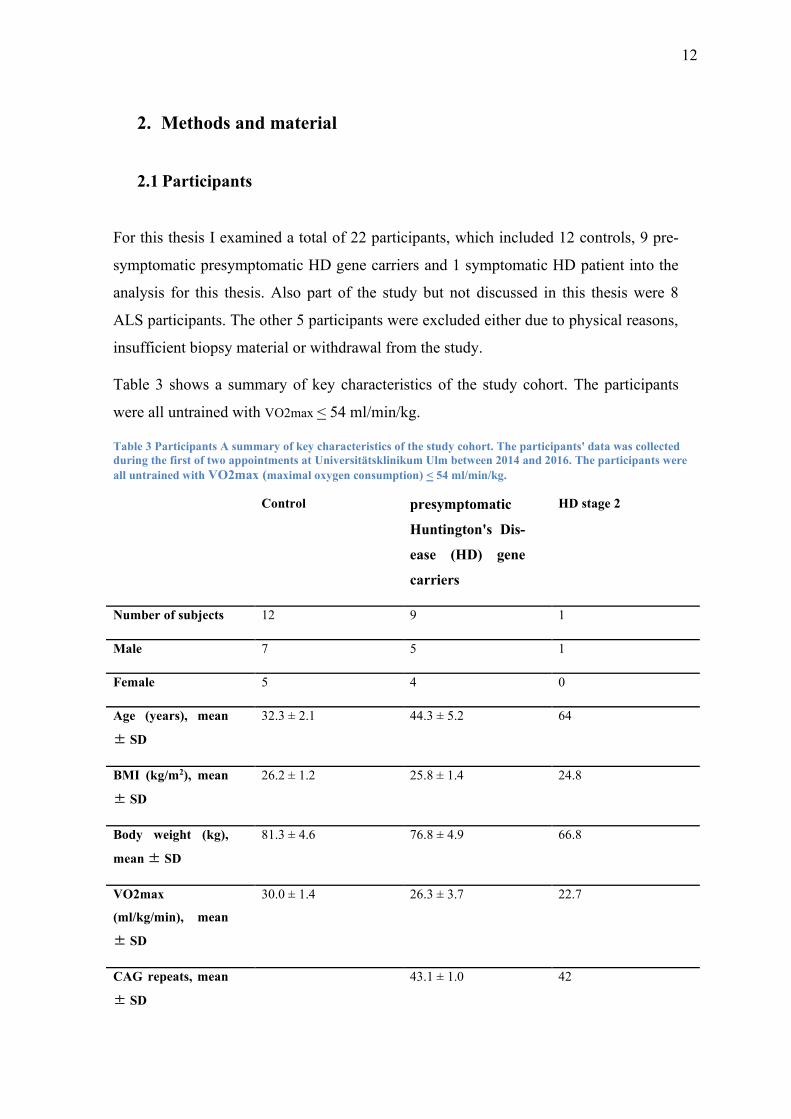
2.2.1 EINSTEIN feasibility trial
This work is part of the EINSTEIN (ExercIse for NeuroSkeleTal Enhancement In Neuro-
degenerative diseases) feasibility trial which was conducted by the Departments of Sport
and Rehabilitation Medicine and the Department of Neurology at Ulm University. The
participants were recruited through the HD outpatient clinic of the Dept of Neurology of
Ulm University. Throughout the study a total of 14 control subjects, 11 presymptomatic
HD gene carriers and 2 symptomatic HD patient were examined. Of these subjects, 2 con-
trols, 3 presymptomatic HD gene carriers and 1 HD patient were excluded, because of
missing data or withdrawal from the study.
Figure 2 EINSTEIN (ExercIse for NeuroSkeleTal Enhancement In Neurodegenerative diseases) study design to
investigate Metabolic gene expression and Mitochondrial function in Huntington`s Disease (HD) patients (With
friendly permission by Martina Zügel, 2014)
14
In the study, each participant had two appointments on two different days. On the first day
(T1) the participants underwent cardiopulmonary testing (CPX) that started at 25 W and
was raised by 25 W in three minute intervals up to the participant's point of exhaustion.
This was used to determine the person's Pmax and VO2max. Additionally anthropometry,
including the measurement of body weight, height and BMI, as well as blood sampling
took place. To determine whether the person was in a condition to participate in the study,
an echocardiography and a lung function test were done. If there were doubts about the
health of the subject, the person was excluded from the study.
On the second day (T2) the basal metabolic rate was measured and blood and sputum sam-
ples were taken under fasting conditions. Afterwards a fine needle biopsy (approximately
20mg) was taken from the subject's M. vastus lateralis.
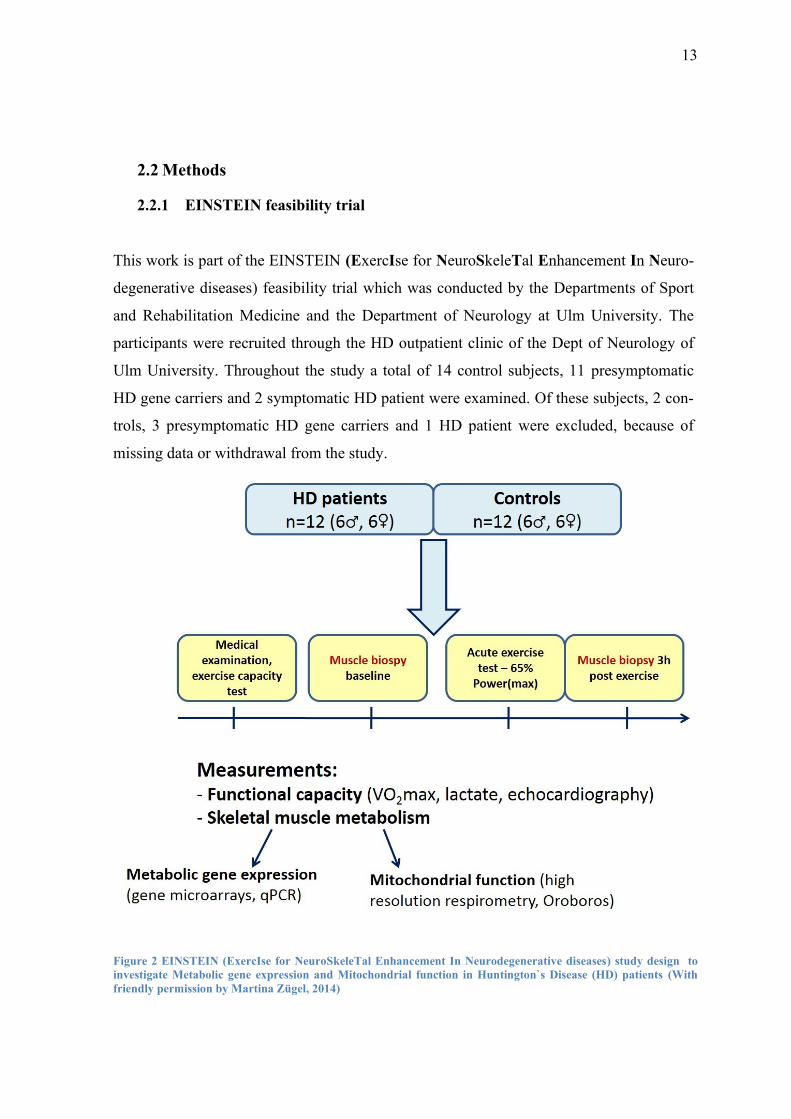
Subsequently the subjects performed moderate intensity physical exercise at 65% of their
individual Pmax on a bicycle ergometer. This was kept up for 30 minutes or until the point
of exhaustion. During the exercise blood lactate, HR and the perceived exertion by the
BORG Rating of Perceived Exertion Scale were measured at a 10 minute interval (Figure
3).
Figure 3 BORG Rating of Perceived Exertion Scale was used to measure the subjective exertion of the participants
15
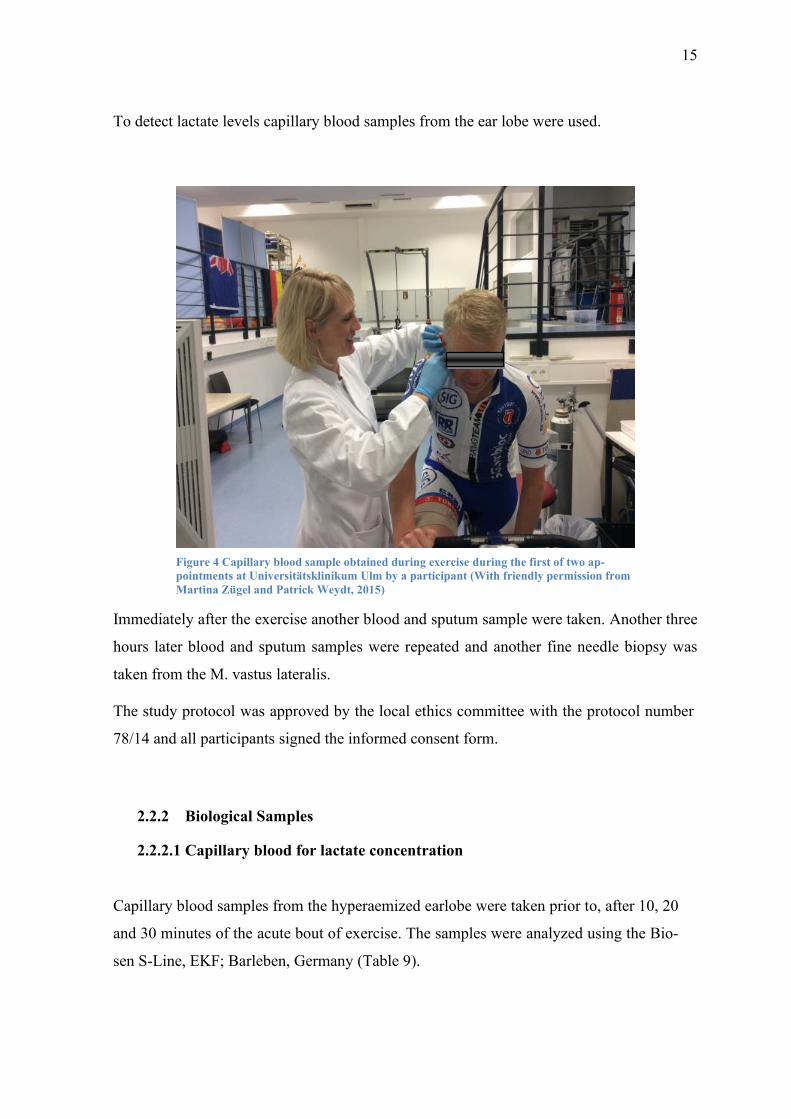
To detect lactate levels capillary blood samples from the ear lobe were used.
Immediately after the exercise another blood and sputum sample were taken. Another three
hours later blood and sputum samples were repeated and another fine needle biopsy was
taken from the M. vastus lateralis.
The study protocol was approved by the local ethics committee with the protocol number
78/14 and all participants signed the informed consent form.
2.2.2 Biological Samples
2.2.2.1 Capillary blood for lactate concentration
Capillary blood samples from the hyperaemized earlobe were taken prior to, after 10, 20
and 30 minutes of the acute bout of exercise. The samples were analyzed using the Bio-
sen S-Line, EKF; Barleben, Germany (Table 9).
Figure 4 Capillary blood sample obtained during exercise during the first of two ap-
pointments at Universitätsklinikum Ulm by a participant (With friendly permission from
Martina Zügel and Patrick Weydt, 2015)
16
2.2.2.2 Blood samples
Blood samples were taken four times overall, once on the first appointment at rest and
three times on the second day at rest, immediately after the exercise and three hours after
the exercise. Each time a complete blood count, measurement of electrolytes and hormone
profile were done. Sputum samples were taken for purposes that are not part of this thesis.
Serum samples were obtained by centrifugation for 10 minutes at 2.500x g and were stored
at -80°C for subsequent analysis.
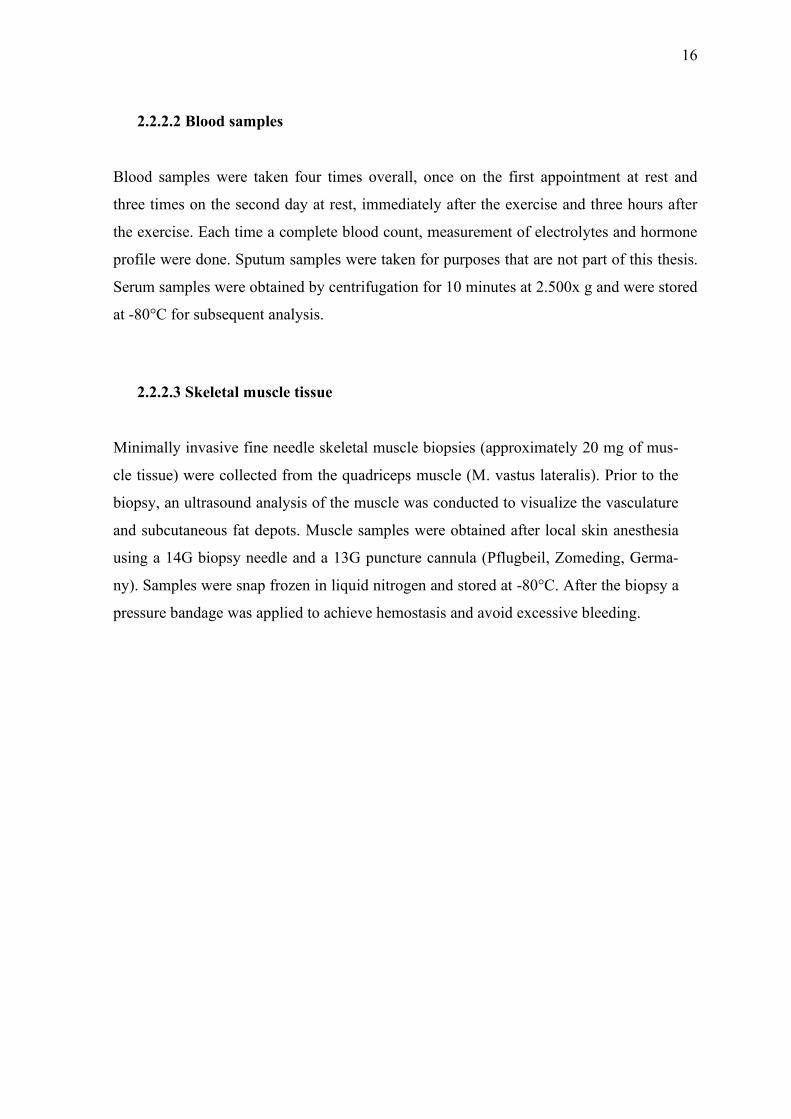
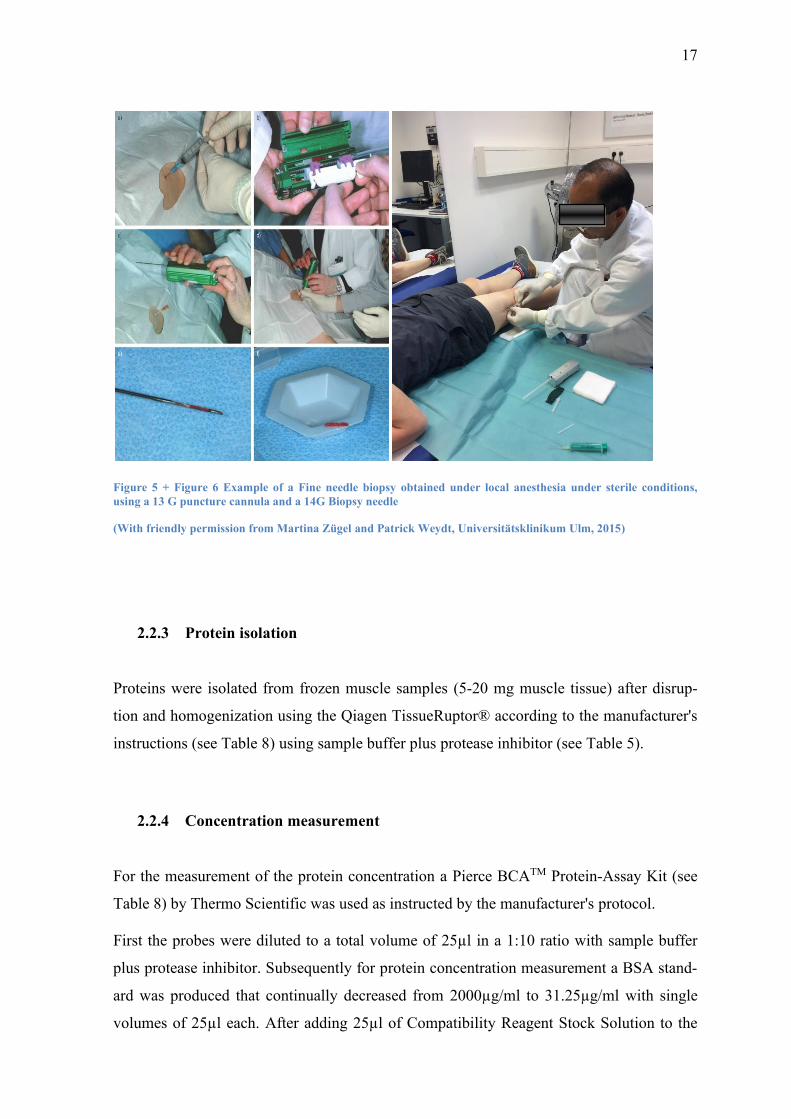
2.2.2.3 Skeletal muscle tissue
Minimally invasive fine needle skeletal muscle biopsies (approximately 20 mg of mus-
cle tissue) were collected from the quadriceps muscle (M. vastus lateralis). Prior to the
biopsy, an ultrasound analysis of the muscle was conducted to visualize the vasculature
and subcutaneous fat depots. Muscle samples were obtained after local skin anesthesia
using a 14G biopsy needle and a 13G puncture cannula (Pflugbeil, Zomeding, Germa-
ny). Samples were snap frozen in liquid nitrogen and stored at -80°C. After the biopsy a
pressure bandage was applied to achieve hemostasis and avoid excessive bleeding.
17
Figure 5 + Figure 6 Example of a Fine needle biopsy obtained under local anesthesia under sterile conditions,
using a 13 G puncture cannula and a 14G Biopsy needle
(With friendly permission from Martina Zügel and Patrick Weydt, Universitätsklinikum Ulm, 2015)
2.2.3 Protein isolation
Proteins were isolated from frozen muscle samples (5-20 mg muscle tissue) after disrup-
tion and homogenization using the Qiagen TissueRuptor® according to the manufacturer's
instructions (see Table 8) using sample buffer plus protease inhibitor (see Table 5).
2.2.4 Concentration measurement
For the measurement of the protein concentration a Pierce BCATM Protein-Assay Kit (see
Table 8) by Thermo Scientific was used as instructed by the manufacturer's protocol.
First the probes were diluted to a total volume of 25µl in a 1:10 ratio with sample buffer
plus protease inhibitor. Subsequently for protein concentration measurement a BSA stand-
ard was produced that continually decreased from 2000µg/ml to 31.25µg/ml with single
volumes of 25µl each. After adding 25µl of Compatibility Reagent Stock Solution to the
18
probes and the standards, they were put in a vortex shortly and then incubated in a 37°C
water bath for 15 minutes. Subsequently 1 ml of bicinchoninic acid (BCA) Working Rea-
gent was added to each of the probes and then incubation was continued for another 30
minutes.
During the incubation Cu+-ions of the protein suspension built a color complex with BCA
an absorption peak at 562nm. Using the photometer, a standard curve was now developed,
which was then used to determine the particular protein concentration of each probe.
2.2.5 Western Blotting
Taking into account the protein concentrations as described in 2.2.4 the proteins could be
visiualized through immunodetection. In this work the proteins LDH-A and LDH-B were
detected. LDH A and LDH B were detected in separate Western Blotting procedures be-
cause of their similar molecular weights.
Furthermore the highly conserved and in every cell constitutively active cytoskeletal pro-
tein β-Actin was detected as a reference protein and to check whether the blots were loaded
correctly.
First, I calculated the exact amount needed for each sample to contain 3µg of protein. Then
I filled up the samples with sample buffer (see Table 5) to 25µl. Afterwards another 5µl of
6xSDS loading buffer were added (see Table 5). Before loading the gels, I added 1.5µl of
β-Mercaptoethanol and heated them at 95 °C for 4-5 minutes to start reduction of the pro-
teins.
2.2.6 Sodium Dodecyl Sulfate-Polyacrylamide Gel Electrophoresis (SDS-Page)
To later be able to show the proteins on a polyvinylidene fluoride(PVDF)-membrane with
a specific antibody, they first had to be separated according to their size in an SDS-PAGE.
This was done in 4% collecting gel and 15% separation gel. To produce this, DDI H2O,
30% Acrylamide/BIS, the particular gel-buffer and 10% SDS were mixed first (see Table
5). After adding the catalyst Tetramethylethylenediamine (TEMED) and the free-radical
initiator Ammonium persulfate (APS) the polymerization was started.

19
During this process the probes were diluted to 3 µg and 10µl 6xSDS-loading-buffer were
added.
After the polymerization of the gels was completed, the wells were each loaded with 27 µl
of the probes, as well as a molecular size marker (5ul) Bio-Rad Precision Plus Protein
Standard Dual Color (‘161-0374) (see Table 4). Then the proteins were separated in the gel
according to their size, first at around 80 V for approximately one hour and then at 130 V
for another 2h.
2.2.7 Protein-Transfer
After the SDS-PAGE the actual Western Blot was done.
To transfer the proteins to the PVDF-membrane, the membranes were first activated for
three minutes in 100% methanol. Afterwards they were put into the blotting chamber, to-
gether with the gel from the SDS-PAGE, 4 filter papers and blotting sponges, as well as the
given amount of transfer-buffer (see Table 5). Now the proteins were blotted onto the
membranes at 140 V for 90 minutes in adequately cold temperatures (room temperature
(RT) plus cooling packs).
2.2.8 Blocking
To check, whether the transfer was successful, the membranes were then incubated in Pon-
ceau S solution (see Table 4)for about 5 minutes. This reversibly stains all the proteins on
the membrane and makes them detectable. The background was discolored using DDH2O
and a picture was taken for documentation. To reverse the coloring, the membranes were
washed in TTBS (Tween-Tris-Buffered Saline) (see Table 5) for about 30 min. Subse-
quently the membranes were blocked for 1h in 5% milk powder blocking solution (see
Table 5) at RT to prevent binding of unwanted proteins. Coloring, blocking, washing and
Antibody-incubation were all done on a shaker.
After the blocking was finished, the membranes were cut above the 37kDa-band, in order
to be able to incubate the LDH-A and LDH-B antibodies separately from the ß-Actin anti-
bodies. LDH A has a molecular weight of 37 kDa, while that of LDH B is 35 kDa. The
20
molecular weight of ß-Actin is 42 kDa. Separate gels and membranes were prepared for
LDH A and LDH B due to their similar molecular sizes.
2.2.9 Antibody-Incubation
The incubation of the membrane strips with the primary antibodies took place over night at
4°C in 2% milk powder antibody buffer (LDH-A 1:5.000, LDH-B 1:10.000, ß-Actin
1:10.000) (see Table 6). Afterwards the membranes were washed in TTBS for 3x12 min to
remove the rest of the primary antibodies. Following the washing the membranes were
incubated with the specific secondary antibody against species in which primary antibody
was raised necessary for protein detection. Therefore the membranes were incubated with
2% milk powder antibody buffer (LDH-A 1:5000, LDH-B 1:5000, ß-Actin 1:10000) (see
Table 7) at room temperature for one hour.
At the end of the incubation period the membranes were again washed with TTBS for 3x12
minutes.
2.2.10 Protein visualization and quantification
To visualize the proteins I used the ChemiDoc™ XRS+ (Bio-Rad, see Table 9) accord-
ing to the user's manual. To analyze the images produced with the ChemiDoc™ XRS+ I
used the ImageLab software (Bio-Rad, see Table 9). The marker I used was Precision
Plus Protein Standard Dual Color by Bio-Rad.
To measure the quantity of LDH in each sample, I compared the mean grey value of the
bands with the mean grey value of the ß-Actin bands, which is expressed ubiquitously
in all cells and can therefore be used as a reference protein.
2.2.11 Statistical analysis
I analyzed the data using two-way ANOVA followed by Bonferroni post-hoc tests to
investigate lactate levels and their interaction with time and disease stage, as well as
LDH A and B levels and their interaction with time and disease stage and sex.
21
For the analysis of the participants' data I used unpaired t-tests.
Linear regression analysis was used to analyze the correlation of LDH A and B levels
with age and BMI.
Statistical significance was postulated by convention at p<0.05.
All statistical analysis was done using the GraphPad Prism software Version 5.
2.3 Material
2.3.1 Reagents and solutions
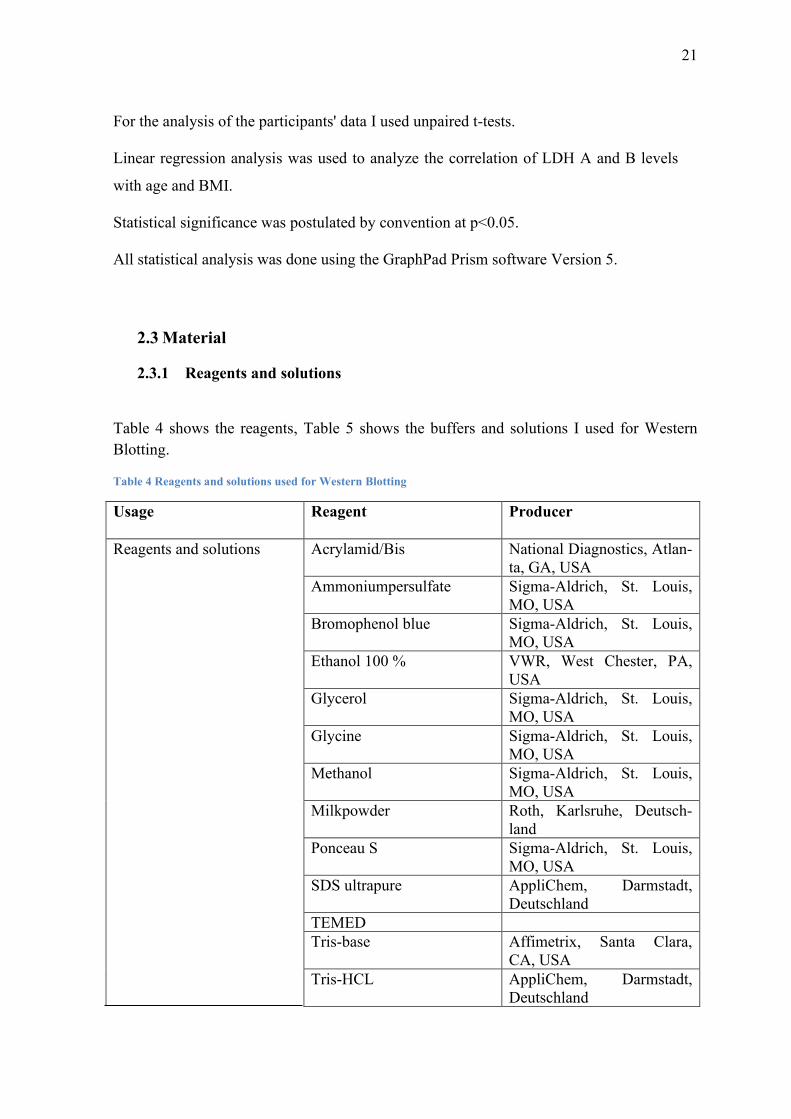
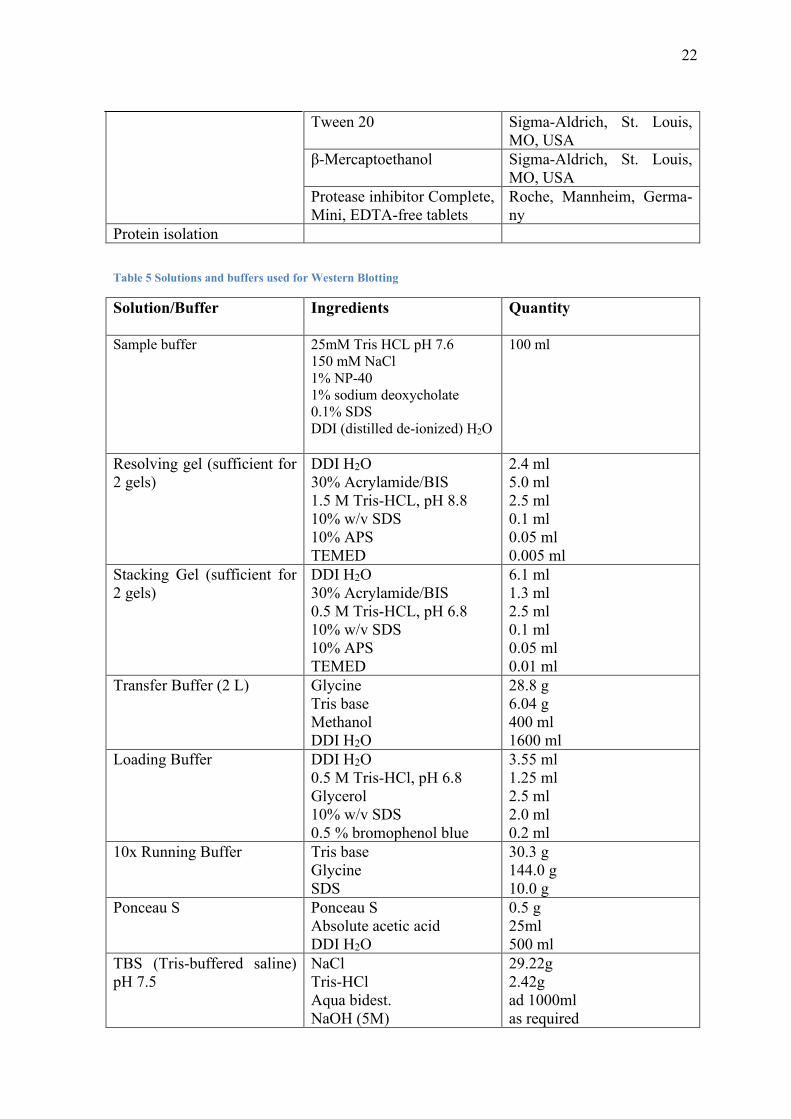
Table 4 shows the reagents, Table 5 shows the buffers and solutions I used for Western
Blotting.
Table 4 Reagents and solutions used for Western Blotting
Usage Reagent Producer
Reagents and solutions Acrylamid/Bis National Diagnostics, Atlan-
ta, GA, USA
Ammoniumpersulfate Sigma-Aldrich, St. Louis,
MO, USA
Bromophenol blue Sigma-Aldrich, St. Louis,
MO, USA
Ethanol 100 % VWR, West Chester, PA,
USA
Glycerol Sigma-Aldrich, St. Louis,
MO, USA
Glycine Sigma-Aldrich, St. Louis,
MO, USA
Methanol Sigma-Aldrich, St. Louis,
MO, USA
Milkpowder Roth, Karlsruhe, Deutsch-
land
Ponceau S Sigma-Aldrich, St. Louis,
MO, USA
SDS ultrapure AppliChem, Darmstadt,
Deutschland
TEMED
Tris-base Affimetrix, Santa Clara,
CA, USA
Tris-HCL AppliChem, Darmstadt,
Deutschland
22
Tween 20 Sigma-Aldrich, St. Louis,
MO, USA
β-Mercaptoethanol Sigma-Aldrich, St. Louis,
MO, USA
Protease inhibitor Complete,
Mini, EDTA-free tablets
Roche, Mannheim, Germa-
ny
Protein isolation
Table 5 Solutions and buffers used for Western Blotting
Solution/Buffer Ingredients Quantity
Sample buffer 25mM Tris HCL pH 7.6
150 mM NaCl
1% NP-40
1% sodium deoxycholate
0.1% SDS
DDI (distilled de-ionized) H2O
100 ml
Resolving gel (sufficient for
2 gels)
DDI H2O
30% Acrylamide/BIS
1.5 M Tris-HCL, pH 8.8
10% w/v SDS
10% APS
TEMED
2.4 ml
5.0 ml
2.5 ml
0.1 ml
0.05 ml
0.005 ml
Stacking Gel (sufficient for
2 gels)
DDI H2O
30% Acrylamide/BIS
0.5 M Tris-HCL, pH 6.8
10% w/v SDS
10% APS
TEMED
6.1 ml
1.3 ml
2.5 ml
0.1 ml
0.05 ml
0.01 ml
Transfer Buffer (2 L) Glycine
Tris base
Methanol
DDI H2O
28.8 g
6.04 g
400 ml
1600 ml
Loading Buffer DDI H2O
0.5 M Tris-HCl, pH 6.8
Glycerol
10% w/v SDS
0.5 % bromophenol blue
3.55 ml
1.25 ml
2.5 ml
2.0 ml
0.2 ml
10x Running Buffer Tris base
Glycine
SDS
30.3 g
144.0 g
10.0 g
Ponceau S Ponceau S
Absolute acetic acid
DDI H2O
0.5 g
25ml
500 ml
TBS (Tris-buffered saline)
pH 7.5
NaCl
Tris-HCl
Aqua bidest.
NaOH (5M)
29.22g
2.42g
ad 1000ml
as required
23
TTBS (Tween-Tris-buffered
saline)
TBS
Tween 20
1000 ml
1 ml
Blocking solution 5% Nonfat milk powder
TBS
2.0 g
40 ml
Antibody buffer Nonfat milk powder
TTBS
0.4 g
20 ml
2.3.2 Antibodies
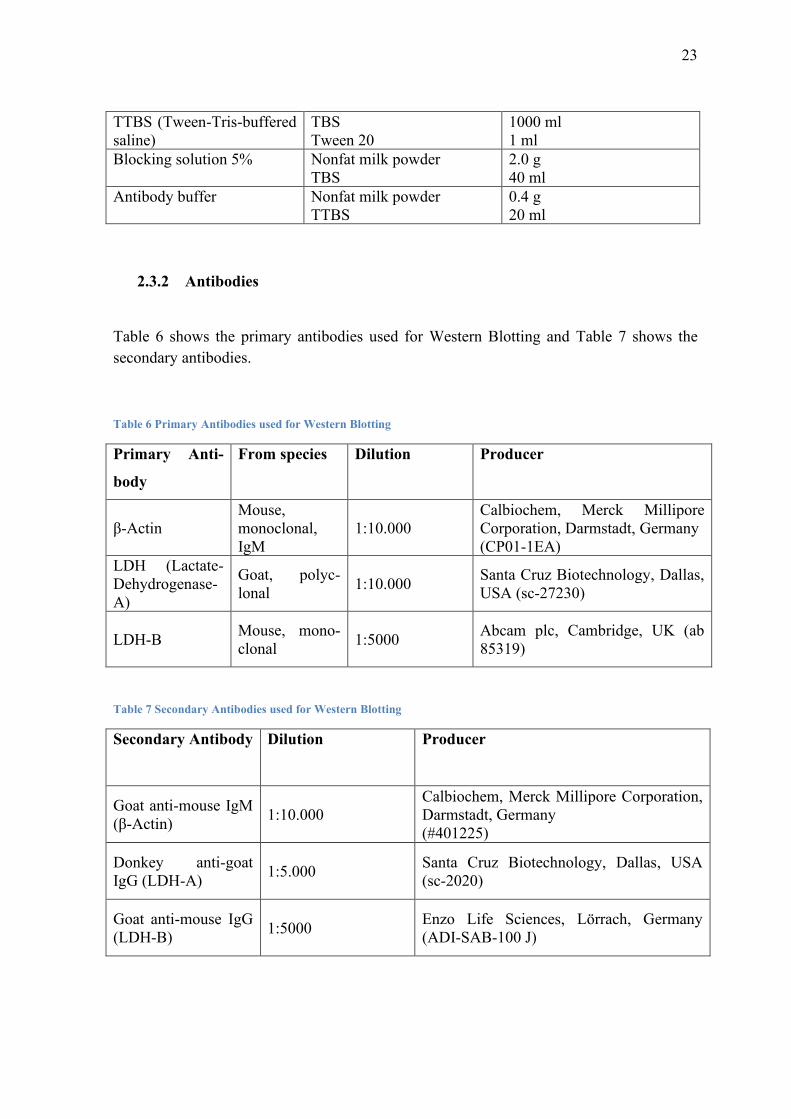
Table 6 shows the primary antibodies used for Western Blotting and Table 7 shows the
secondary antibodies.
Table 6 Primary Antibodies used for Western Blotting
Primary Anti-
body
From species Dilution Producer
β-Actin
Mouse,
monoclonal,
IgM
1:10.000
Calbiochem, Merck Millipore
Corporation, Darmstadt, Germany
(CP01-1EA)
LDH (Lactate-
Dehydrogenase-
A)
Goat, polyc-
lonal 1:10.000
Santa Cruz Biotechnology, Dallas,
USA (sc-27230)
LDH-B Mouse, mono-
clonal 1:5000
Abcam plc, Cambridge, UK (ab
85319)
Table 7 Secondary Antibodies used for Western Blotting
Secondary Antibody Dilution Producer
Goat anti-mouse IgM
(β-Actin) 1:10.000
Calbiochem, Merck Millipore Corporation,
Darmstadt, Germany
(#401225)
Donkey anti-goat
IgG (LDH-A) 1:5.000
Santa Cruz Biotechnology, Dallas, USA
(sc-2020)
Goat anti-mouse IgG
(LDH-B) 1:5000
Enzo Life Sciences, Lörrach, Germany
(ADI-SAB-100 J)

24
2.3.3 Kits
Table 8 shows the kits I used for protein isolation and western blotting.
Table 8 Kits used for Western Blotting and Protein isolation
QIAshredderTM by Qiagen
BCATM Protein Assay Kit-
Reducing Agent Compati-
ble by Thermo Scientific
Mini-Protean Tetra cell by
Bio-Rad
Homogenization of the cell
lysate
Measurement of protein
concentration
Western Blotting
- BCATM Reagent A, 250ml
- BCATM Reagent B, 25ml
- Compatibility Reagent
10*20 mg
- Reconstitution Buffer, 15
ml
- Albumin Standard
(2mg/ml)
10*1 ml ampules
- Casting stand
- Casting frame and glass
plate sandwich
- Plastic combs
- Glass plates with integrat-
ed spacers
- Clamping frame and elec-
trode assembly
- Blotting chamber
2.3.4 Equipment
Table 9 shows the equipment I used for the fine needle biopsies, protein isolation and
Western Blotting.
Table 9 Equipment used for fine needle biopsies, protein isolation and Western Blotting
Equipment Type / Art.-number Producer
Biopsy needle
Puncture cannula
14 G
13 G
Pflugbeil, Zomeding, Ger-
many
Heating block (metal-block-
thermostate) MBT 100-2
Kleinfeld Labortechnik,
Gehrden, Deutschland
Photometer Ultrospec III Pharmacia LKB, Upsalla,
Schweden
Vortex VTX-3000 L Mixer Uzusio LMS, Brigachtal, Deutsch-
land
Centrifuge 5810R Eppendorf, Hamburg,
Deutschland
Image system ChemiDoc™ XRS+
170-8070
Bio-Rad Laboratories, Her-
cules, USA
Image software ImageLab Bio-Rad Laboratories, Her-
cules, USA
Lactate concentration meas-
urement Biosen S-Line, EKF Barsleben, Germany

25
3. Results
3.1 Complication rate of skeletal muscle fine needle biopsies
While I did not perform the fine needle biopsies myself, I investigated the complica-
tions and analyzed the rates at which they occurred.
Under local anesthesia the subjects tolerated the skeletal muscle fine needle biopsies
very well. There were no major complications such as bleeding, excessive pain, infec-
tion or permanent tissue damage.
All participants were able to perform 30 minutes of exercise on a cycle ergometer im-
mediately after the procedure without any complaints in the area of the biopsy. After the
exercise, no bleeding, increased swelling, severe pain or other complications were re-
ported by any of the subjects (See Table 10).
26
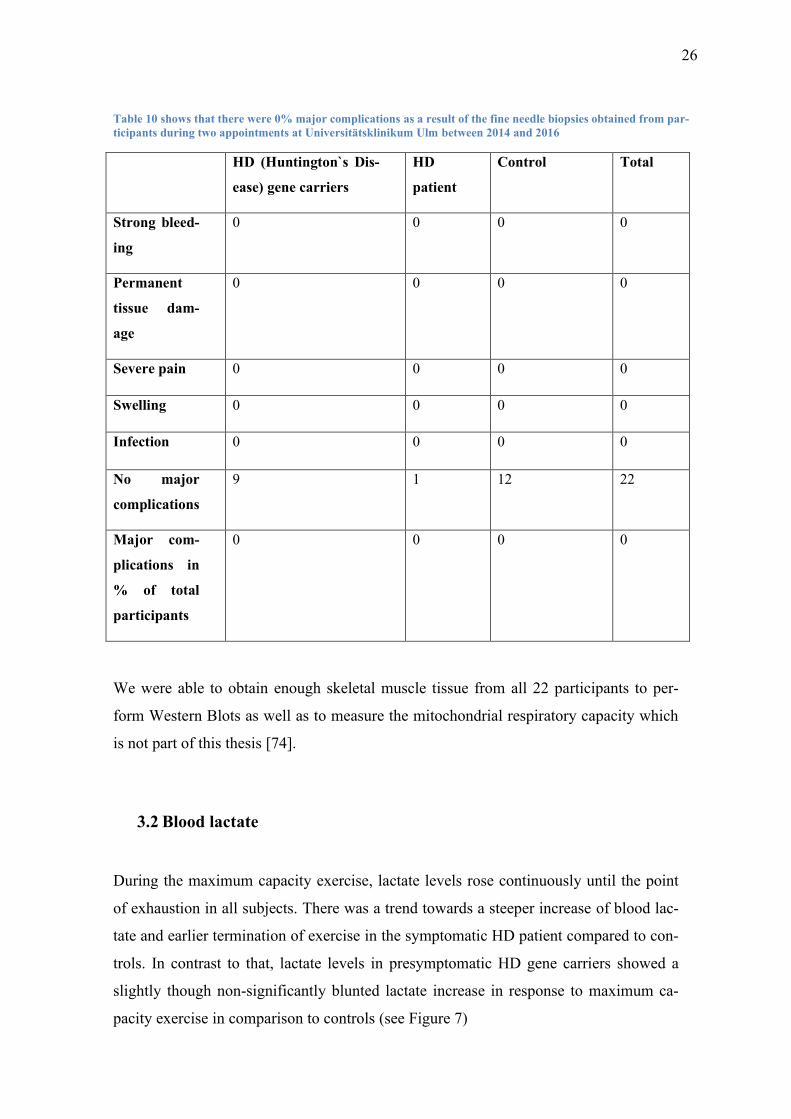
Table 10 shows that there were 0% major complications as a result of the fine needle biopsies obtained from par-
ticipants during two appointments at Universitätsklinikum Ulm between 2014 and 2016
HD (Huntington`s Dis-
ease) gene carriers
HD
patient
Control Total
Strong bleed-
ing
0 0 0 0
Permanent
tissue dam-
age
0 0 0 0
Severe pain 0 0 0 0
Swelling 0 0 0 0
Infection 0 0 0 0
No major
complications
9 1 12 22
Major com-
plications in
% of total
participants
0 0 0 0
We were able to obtain enough skeletal muscle tissue from all 22 participants to per-
form Western Blots as well as to measure the mitochondrial respiratory capacity which
is not part of this thesis [74].
3.2 Blood lactate
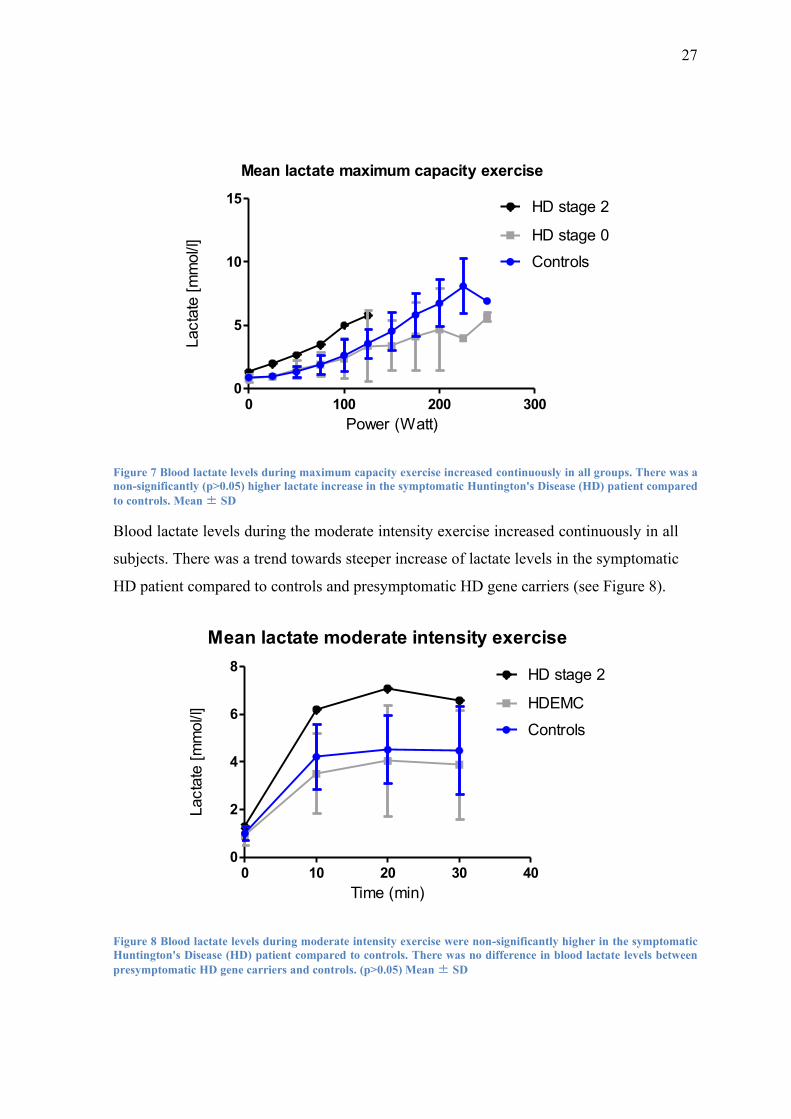
During the maximum capacity exercise, lactate levels rose continuously until the point
of exhaustion in all subjects. There was a trend towards a steeper increase of blood lac-
tate and earlier termination of exercise in the symptomatic HD patient compared to con-
trols. In contrast to that, lactate levels in presymptomatic HD gene carriers showed a
slightly though non-significantly blunted lactate increase in response to maximum ca-
pacity exercise in comparison to controls (see Figure 7)
27
0 100 200 3000
5
10
15
Mean lactate maximum capacity exercise
Controls
HD stage 0
HD stage 2
Power (Watt)
Lacta
te [
mm
ol/l]
Figure 7 Blood lactate levels during maximum capacity exercise increased continuously in all groups. There was a
non-significantly (p>0.05) higher lactate increase in the symptomatic Huntington's Disease (HD) patient compared
to controls. Mean ± SD
Blood lactate levels during the moderate intensity exercise increased continuously in all
subjects. There was a trend towards steeper increase of lactate levels in the symptomatic
HD patient compared to controls and presymptomatic HD gene carriers (see Figure 8).
0 10 20 30 400
2
4
6
8
Mean lactate moderate intensity exercise
Controls
HDEMC
HD stage 2
Time (min)
Lacta
te [
mm
ol/l]
Figure 8 Blood lactate levels during moderate intensity exercise were non-significantly higher in the symptomatic
Huntington's Disease (HD) patient compared to controls. There was no difference in blood lactate levels between
presymptomatic HD gene carriers and controls. (p>0.05) Mean ± SD
28
3.3 Lactate Dehydrogenase (LDH)
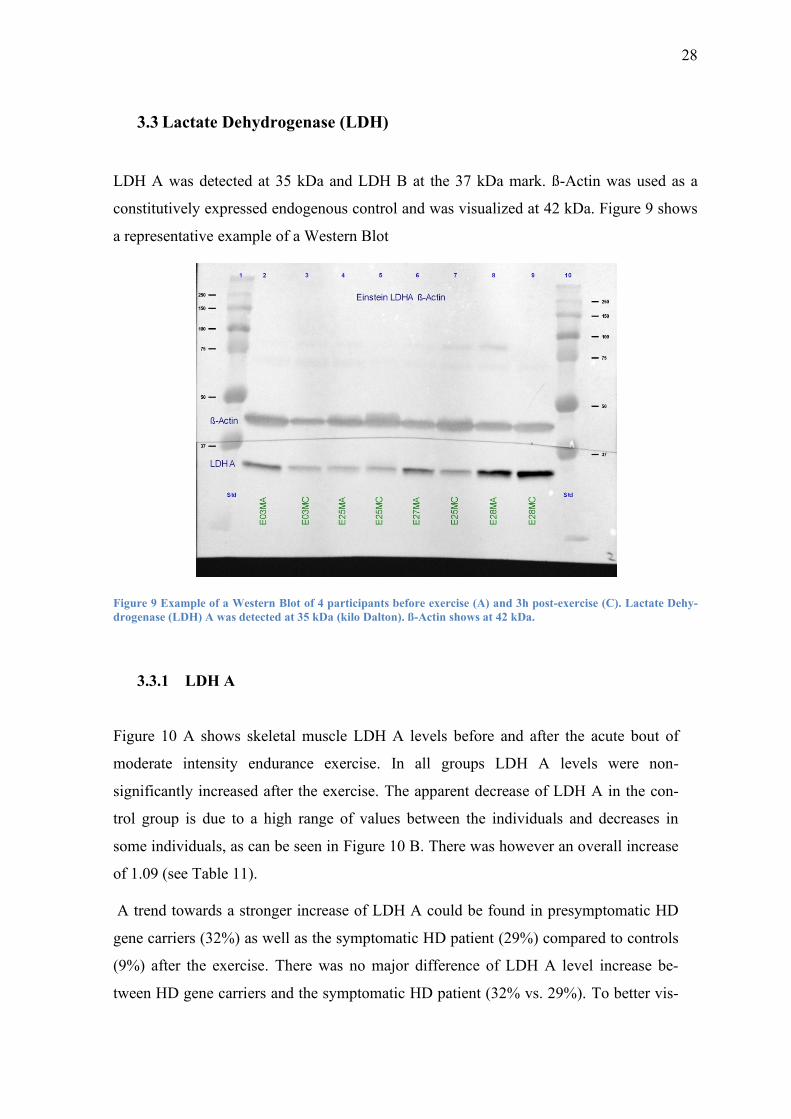
LDH A was detected at 35 kDa and LDH B at the 37 kDa mark. ß-Actin was used as a
constitutively expressed endogenous control and was visualized at 42 kDa. Figure 9 shows
a representative example of a Western Blot
Figure 9 Example of a Western Blot of 4 participants before exercise (A) and 3h post-exercise (C). Lactate Dehy-
drogenase (LDH) A was detected at 35 kDa (kilo Dalton). ß-Actin shows at 42 kDa.
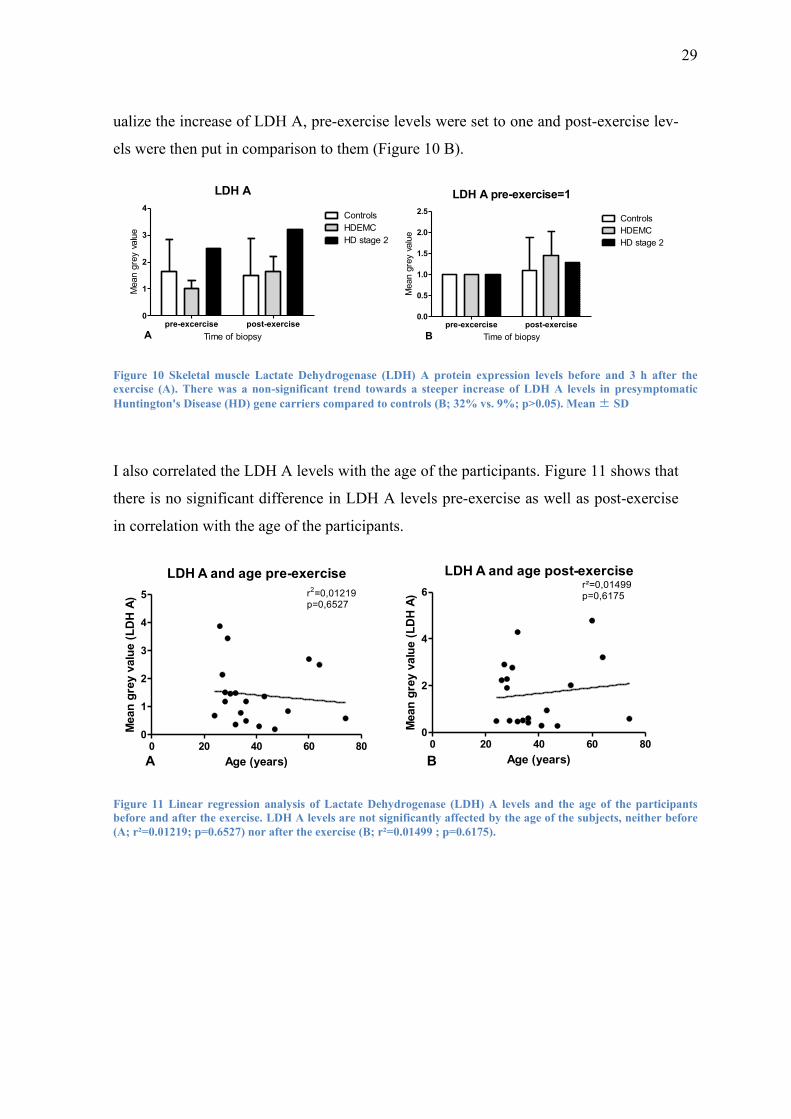
3.3.1 LDH A
Figure 10 A shows skeletal muscle LDH A levels before and after the acute bout of
moderate intensity endurance exercise. In all groups LDH A levels were non-
significantly increased after the exercise. The apparent decrease of LDH A in the con-
trol group is due to a high range of values between the individuals and decreases in
some individuals, as can be seen in Figure 10 B. There was however an overall increase
of 1.09 (see Table 11).
A trend towards a stronger increase of LDH A could be found in presymptomatic HD
gene carriers (32%) as well as the symptomatic HD patient (29%) compared to controls
(9%) after the exercise. There was no major difference of LDH A level increase be-
tween HD gene carriers and the symptomatic HD patient (32% vs. 29%). To better vis-
29
ualize the increase of LDH A, pre-exercise levels were set to one and post-exercise lev-
els were then put in comparison to them (Figure 10 B).
LDH A
pre-excercise post-exercise0
1
2
3
4Controls
HDEMC
HD stage 2
A Time of biopsy
Mean g
rey v
alu
e
LDH A pre-exercise=1
pre-excercise post-exercise0.0
0.5
1.0
1.5
2.0
2.5Controls
HDEMC
HD stage 2
B Time of biopsy
Mean g
rey v
alu
e
Figure 10 Skeletal muscle Lactate Dehydrogenase (LDH) A protein expression levels before and 3 h after the
exercise (A). There was a non-significant trend towards a steeper increase of LDH A levels in presymptomatic
Huntington's Disease (HD) gene carriers compared to controls (B; 32% vs. 9%; p>0.05). Mean ± SD
I also correlated the LDH A levels with the age of the participants. Figure 11 shows that
there is no significant difference in LDH A levels pre-exercise as well as post-exercise
in correlation with the age of the participants.
LDH A and age pre-exercise
0 20 40 60 800
1
2
3
4
5
A Age (years)
Mean
gre
y v
alu
e (
LD
H A
) r2=0,01219p=0,6527
LDH A and age post-exercise
0 20 40 60 800
2
4
6
B
r²=0,01499p=0,6175
Age (years)
Mean
gre
y v
alu
e (
LD
H A
)
Figure 11 Linear regression analysis of Lactate Dehydrogenase (LDH) A levels and the age of the participants
before and after the exercise. LDH A levels are not significantly affected by the age of the subjects, neither before
(A; r²=0.01219; p=0.6527) nor after the exercise (B; r²=0.01499 ; p=0.6175).
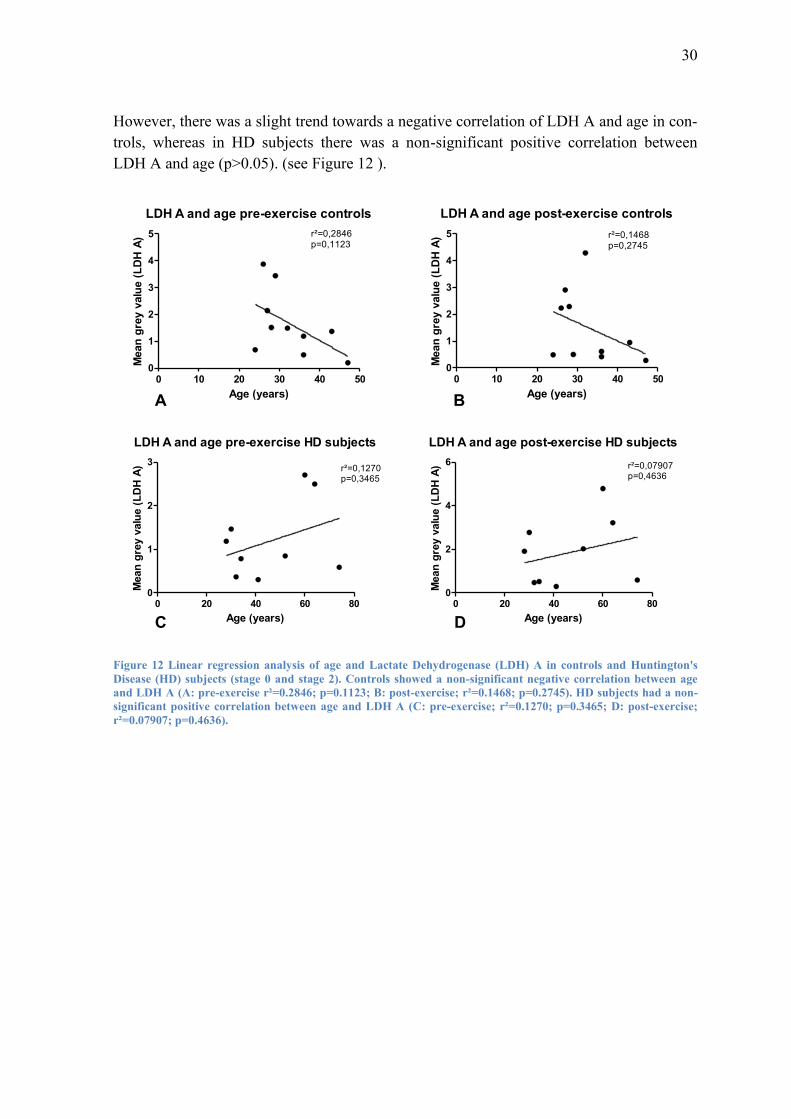
30
However, there was a slight trend towards a negative correlation of LDH A and age in con-
trols, whereas in HD subjects there was a non-significant positive correlation between
LDH A and age (p>0.05). (see Figure 12 ).
LDH A and age pre-exercise controls
0 10 20 30 40 500
1
2
3
4
5 r²=0,2846p=0,1123
Age (years)
Mean
gre
y v
alu
e (
LD
H A
)
LDH A and age post-exercise controls
0 10 20 30 40 500
1
2
3
4
5 r²=0,1468p=0,2745
Age (years)
Mean
gre
y v
alu
e (
LD
H A
)LDH A and age pre-exercise HD subjects
0 20 40 60 800
1
2
3r²=0,1270p=0,3465
Age (years)
Mean
gre
y v
alu
e (
LD
H A
)
LDH A and age post-exercise HD subjects
0 20 40 60 800
2
4
6 r²=0,07907p=0,4636
Age (years)
Mean
gre
y v
alu
e (
LD
H A
)
A B
C D
Figure 12 Linear regression analysis of age and Lactate Dehydrogenase (LDH) A in controls and Huntington's
Disease (HD) subjects (stage 0 and stage 2). Controls showed a non-significant negative correlation between age
and LDH A (A: pre-exercise r²=0.2846; p=0.1123; B: post-exercise; r²=0.1468; p=0.2745). HD subjects had a non-
significant positive correlation between age and LDH A (C: pre-exercise; r²=0.1270; p=0.3465; D: post-exercise;
r²=0.07907; p=0.4636).
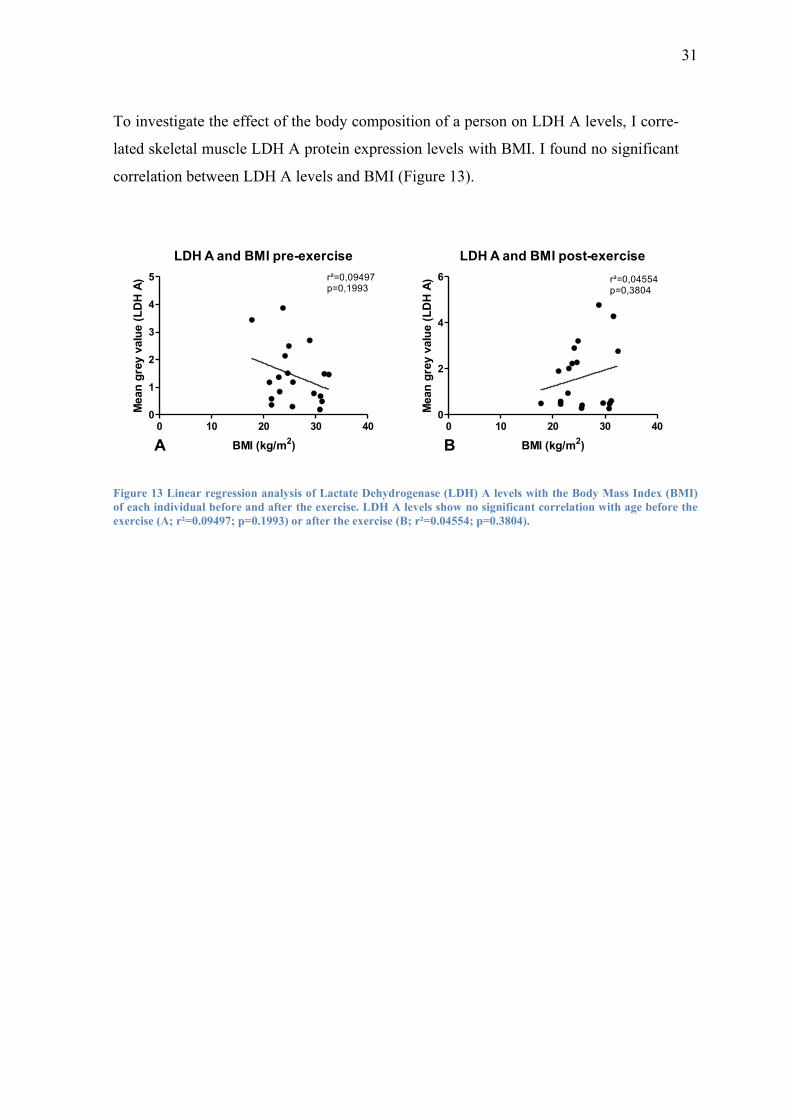
31
To investigate the effect of the body composition of a person on LDH A levels, I corre-
lated skeletal muscle LDH A protein expression levels with BMI. I found no significant
correlation between LDH A levels and BMI (Figure 13).
LDH A and BMI pre-exercise
0 10 20 30 400
1
2
3
4
5 r²=0,09497p=0,1993
BMI (kg/m2)
Mean
gre
y v
alu
e (
LD
H A
)
LDH A and BMI post-exercise
0 10 20 30 400
2
4
6 r²=0,04554p=0,3804
BMI (kg/m2)
Mean
gre
y v
alu
e (
LD
H A
)
A B
Figure 13 Linear regression analysis of Lactate Dehydrogenase (LDH) A levels with the Body Mass Index (BMI)
of each individual before and after the exercise. LDH A levels show no significant correlation with age before the
exercise (A; r²=0.09497; p=0.1993) or after the exercise (B; r²=0.04554; p=0.3804).
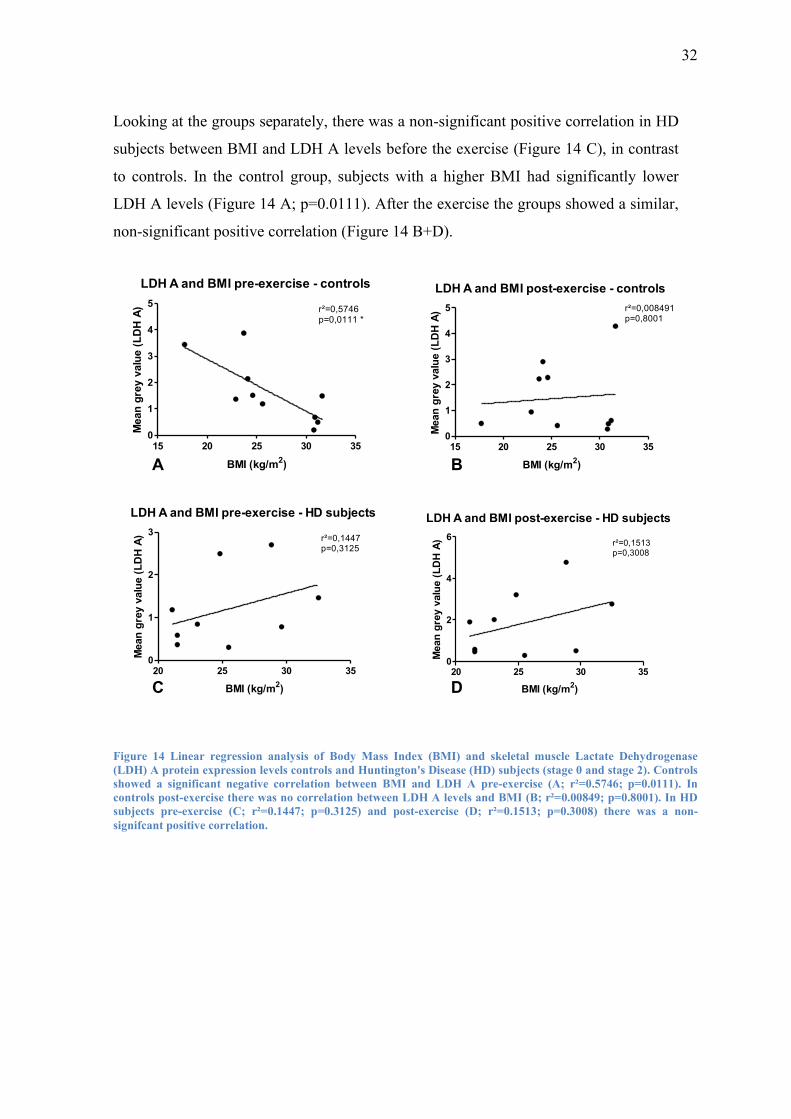
32
Looking at the groups separately, there was a non-significant positive correlation in HD
subjects between BMI and LDH A levels before the exercise (Figure 14 C), in contrast
to controls. In the control group, subjects with a higher BMI had significantly lower
LDH A levels (Figure 14 A; p=0.0111). After the exercise the groups showed a similar,
non-significant positive correlation (Figure 14 B+D).
LDH A and BMI pre-exercise - controls
15 20 25 30 350
1
2
3
4
5r²=0,5746p=0,0111 *
BMI (kg/m2)
Mean
gre
y v
alu
e (
LD
H A
)
LDH A and BMI post-exercise - controls
15 20 25 30 350
1
2
3
4
5 r²=0,008491p=0,8001
BMI (kg/m2)
Mean
gre
y v
alu
e (
LD
H A
)
LDH A and BMI pre-exercise - HD subjects
20 25 30 350
1
2
3r²=0,1447p=0,3125
BMI (kg/m2)
Mean
gre
y v
alu
e (
LD
H A
)
LDH A and BMI post-exercise - HD subjects
20 25 30 350
2
4
6r²=0,1513p=0,3008
BMI (kg/m2)
Mean
gre
y v
alu
e (
LD
H A
)
A B
C D
Figure 14 Linear regression analysis of Body Mass Index (BMI) and skeletal muscle Lactate Dehydrogenase
(LDH) A protein expression levels controls and Huntington's Disease (HD) subjects (stage 0 and stage 2). Controls
showed a significant negative correlation between BMI and LDH A pre-exercise (A; r²=0.5746; p=0.0111). In
controls post-exercise there was no correlation between LDH A levels and BMI (B; r²=0.00849; p=0.8001). In HD
subjects pre-exercise (C; r²=0.1447; p=0.3125) and post-exercise (D; r²=0.1513; p=0.3008) there was a non-
signifcant positive correlation.
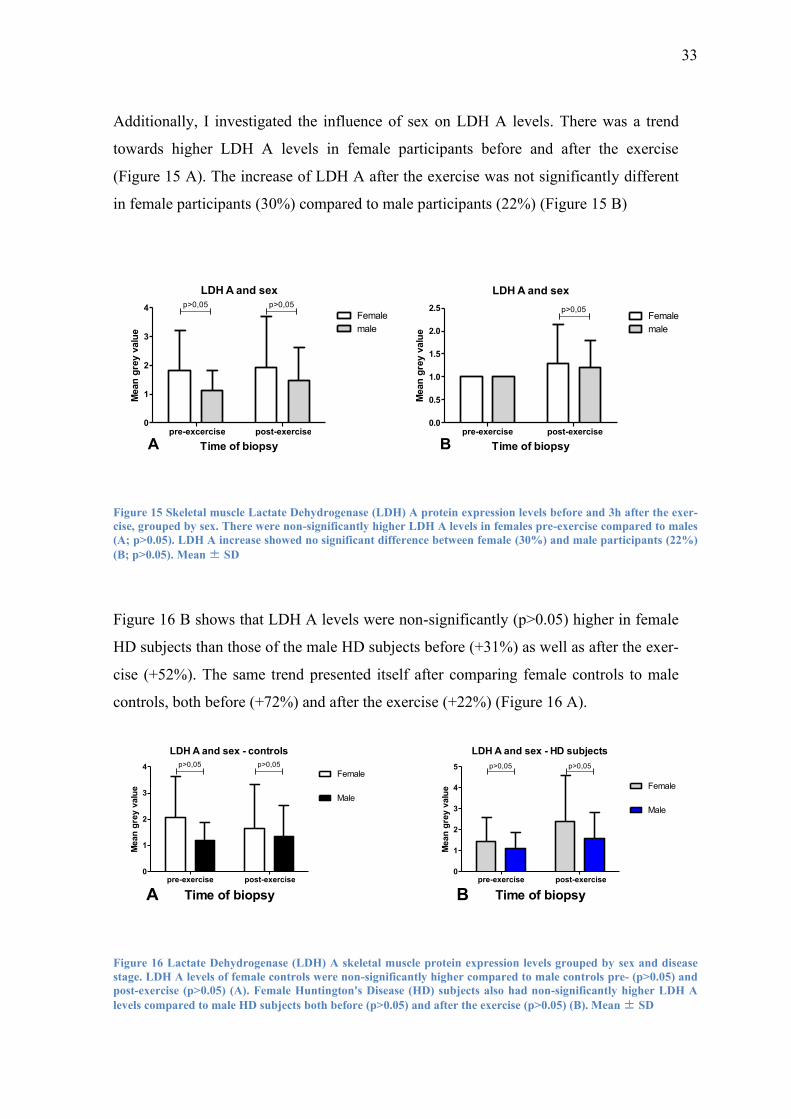
33
Additionally, I investigated the influence of sex on LDH A levels. There was a trend
towards higher LDH A levels in female participants before and after the exercise
(Figure 15 A). The increase of LDH A after the exercise was not significantly different
in female participants (30%) compared to male participants (22%) (Figure 15 B)
LDH A and sex
pre-excercise post-exercise0
1
2
3
4Female
male
p>0,05 p>0,05
Time of biopsy
Mean
gre
y v
alu
e
LDH A and sex
pre-exercise post-exercise0.0
0.5
1.0
1.5
2.0
2.5Female
male
p>0,05
Time of biopsy
Mean
gre
y v
alu
e
A B
Figure 15 Skeletal muscle Lactate Dehydrogenase (LDH) A protein expression levels before and 3h after the exer-
cise, grouped by sex. There were non-significantly higher LDH A levels in females pre-exercise compared to males
(A; p>0.05). LDH A increase showed no significant difference between female (30%) and male participants (22%)
(B; p>0.05). Mean ± SD
Figure 16 B shows that LDH A levels were non-significantly (p>0.05) higher in female
HD subjects than those of the male HD subjects before (+31%) as well as after the exer-
cise (+52%). The same trend presented itself after comparing female controls to male
controls, both before (+72%) and after the exercise (+22%) (Figure 16 A).
LDH A and sex - controls
pre-exercise post-exercise0
1
2
3
4Female
Male
p>0,05p>0,05
Time of biopsy
Mean
gre
y v
alu
e
LDH A and sex - HD subjects
pre-exercise post-exercise0
1
2
3
4
5
Female
Male
p>0,05 p>0,05
Time of biopsy
Mean
gre
y v
alu
e
A B
Figure 16 Lactate Dehydrogenase (LDH) A skeletal muscle protein expression levels grouped by sex and disease
stage. LDH A levels of female controls were non-significantly higher compared to male controls pre- (p>0.05) and
post-exercise (p>0.05) (A). Female Huntington's Disease (HD) subjects also had non-significantly higher LDH A
levels compared to male HD subjects both before (p>0.05) and after the exercise (p>0.05) (B). Mean ± SD
34
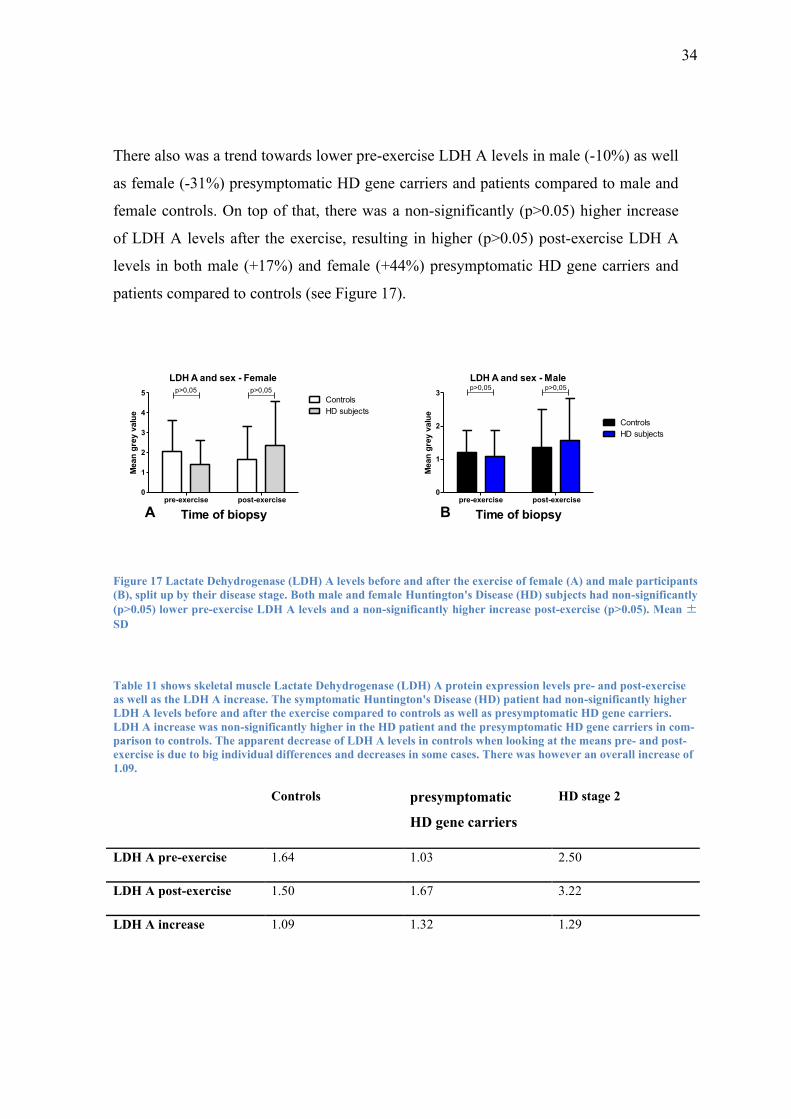
There also was a trend towards lower pre-exercise LDH A levels in male (-10%) as well
as female (-31%) presymptomatic HD gene carriers and patients compared to male and
female controls. On top of that, there was a non-significantly (p>0.05) higher increase
of LDH A levels after the exercise, resulting in higher (p>0.05) post-exercise LDH A
levels in both male (+17%) and female (+44%) presymptomatic HD gene carriers and
patients compared to controls (see Figure 17).
LDH A and sex - Female
pre-exercise post-exercise0
1
2
3
4
5Controls
HD subjects
p>0,05 p>0,05
Time of biopsy
Mean
gre
y v
alu
e
LDH A and sex - Male
pre-exercise post-exercise0
1
2
3
Controls
HD subjects
p>0,05p>0,05
Time of biopsy
Mean
gre
y v
alu
e
A B
Figure 17 Lactate Dehydrogenase (LDH) A levels before and after the exercise of female (A) and male participants
(B), split up by their disease stage. Both male and female Huntington's Disease (HD) subjects had non-significantly
(p>0.05) lower pre-exercise LDH A levels and a non-significantly higher increase post-exercise (p>0.05). Mean ±
SD
Table 11 shows skeletal muscle Lactate Dehydrogenase (LDH) A protein expression levels pre- and post-exercise
as well as the LDH A increase. The symptomatic Huntington's Disease (HD) patient had non-significantly higher
LDH A levels before and after the exercise compared to controls as well as presymptomatic HD gene carriers.
LDH A increase was non-significantly higher in the HD patient and the presymptomatic HD gene carriers in com-
parison to controls. The apparent decrease of LDH A levels in controls when looking at the means pre- and post-
exercise is due to big individual differences and decreases in some cases. There was however an overall increase of
1.09.
Controls presymptomatic
HD gene carriers
HD stage 2
LDH A pre-exercise 1.64 1.03 2.50
LDH A post-exercise 1.50 1.67 3.22
LDH A increase 1.09 1.32 1.29
35
3.3.2 LDH B
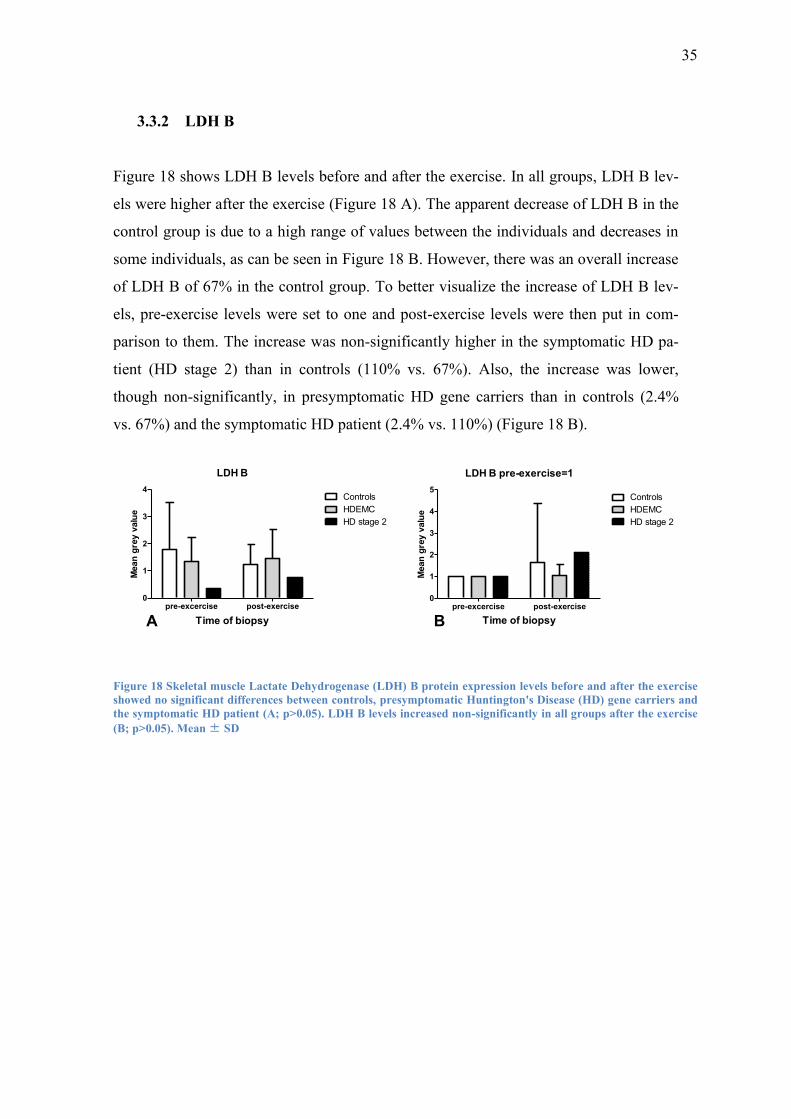
Figure 18 shows LDH B levels before and after the exercise. In all groups, LDH B lev-
els were higher after the exercise (Figure 18 A). The apparent decrease of LDH B in the
control group is due to a high range of values between the individuals and decreases in
some individuals, as can be seen in Figure 18 B. However, there was an overall increase
of LDH B of 67% in the control group. To better visualize the increase of LDH B lev-
els, pre-exercise levels were set to one and post-exercise levels were then put in com-
parison to them. The increase was non-significantly higher in the symptomatic HD pa-
tient (HD stage 2) than in controls (110% vs. 67%). Also, the increase was lower,
though non-significantly, in presymptomatic HD gene carriers than in controls (2.4%
vs. 67%) and the symptomatic HD patient (2.4% vs. 110%) (Figure 18 B).
LDH B
pre-excercise post-exercise0
1
2
3
4Controls
HDEMC
HD stage 2
Time of biopsy
Mean
gre
y v
alu
e
LDH B pre-exercise=1
pre-excercise post-exercise0
1
2
3
4
5Controls
HDEMC
HD stage 2
Time of biopsy
Mean
gre
y v
alu
e
A B
Figure 18 Skeletal muscle Lactate Dehydrogenase (LDH) B protein expression levels before and after the exercise
showed no significant differences between controls, presymptomatic Huntington's Disease (HD) gene carriers and
the symptomatic HD patient (A; p>0.05). LDH B levels increased non-significantly in all groups after the exercise
(B; p>0.05). Mean ± SD
36
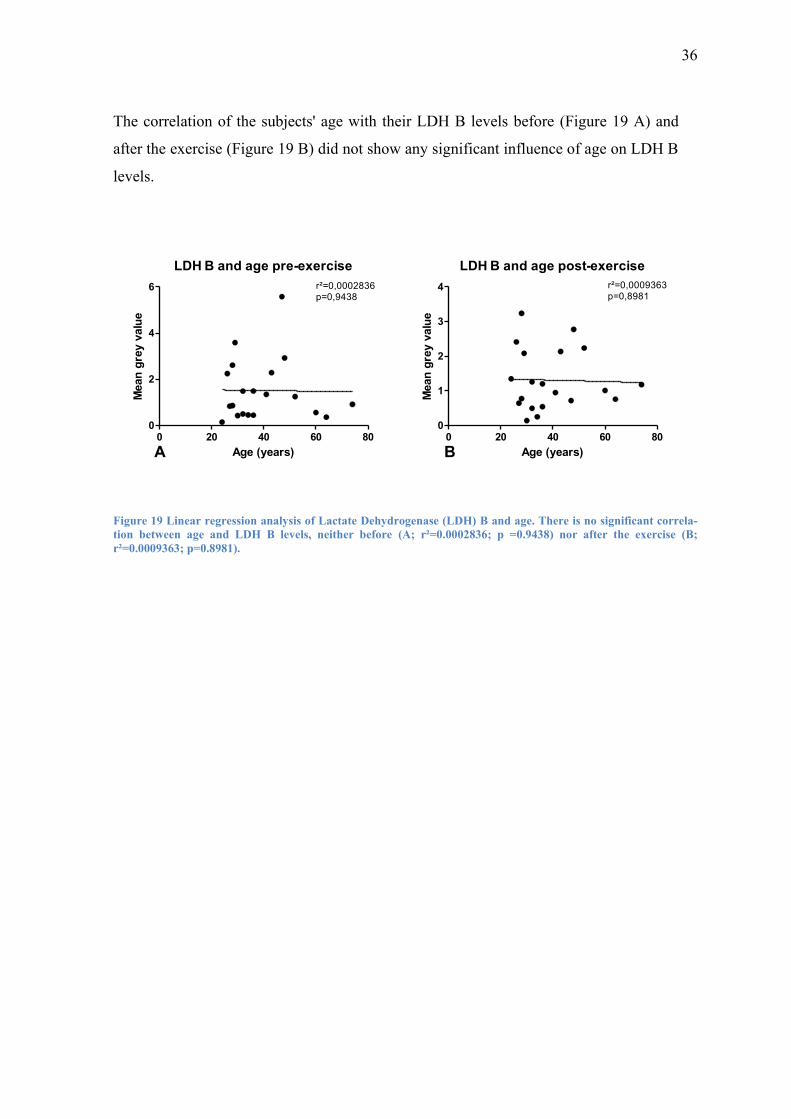
The correlation of the subjects' age with their LDH B levels before (Figure 19 A) and
after the exercise (Figure 19 B) did not show any significant influence of age on LDH B
levels.
LDH B and age pre-exercise
0 20 40 60 800
2
4
6 r²=0,0002836p=0,9438
Age (years)
Mean
gre
y v
alu
e
LDH B and age post-exercise
0 20 40 60 800
1
2
3
4 r²=0,0009363p=0,8981
Age (years)
Mean
gre
y v
alu
e
A B
Figure 19 Linear regression analysis of Lactate Dehydrogenase (LDH) B and age. There is no significant correla-
tion between age and LDH B levels, neither before (A; r²=0.0002836; p =0.9438) nor after the exercise (B;
r²=0.0009363; p=0.8981).
37
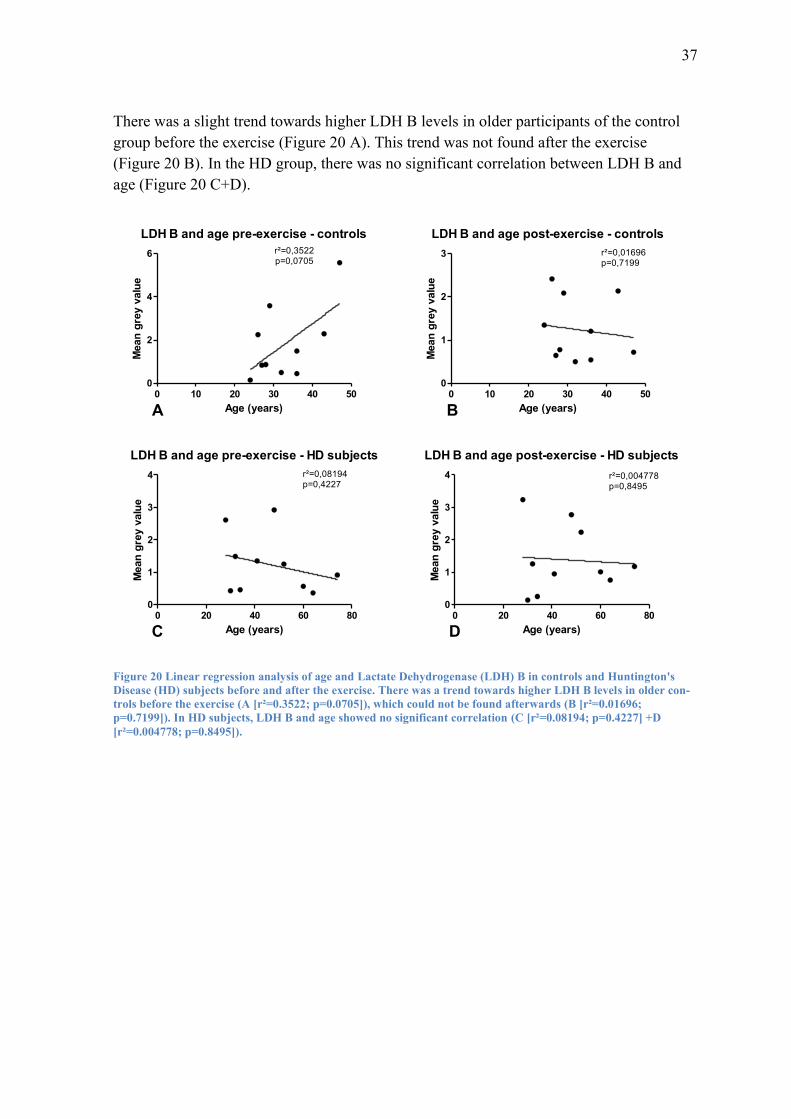
There was a slight trend towards higher LDH B levels in older participants of the control
group before the exercise (Figure 20 A). This trend was not found after the exercise
(Figure 20 B). In the HD group, there was no significant correlation between LDH B and
age (Figure 20 C+D).
LDH B and age pre-exercise - controls
0 10 20 30 40 500
2
4
6 r²=0,3522p=0,0705
Age (years)
Mean
gre
y v
alu
e
LDH B and age post-exercise - controls
0 10 20 30 40 500
1
2
3 r²=0,01696p=0,7199
Age (years)
Mean
gre
y v
alu
e
LDH B and age pre-exercise - HD subjects
0 20 40 60 800
1
2
3
4 r²=0,08194p=0,4227
Age (years)
Mean
gre
y v
alu
e
LDH B and age post-exercise - HD subjects
0 20 40 60 800
1
2
3
4 r²=0,004778p=0,8495
Age (years)
Mean
gre
y v
alu
e
A B
C D
Figure 20 Linear regression analysis of age and Lactate Dehydrogenase (LDH) B in controls and Huntington's
Disease (HD) subjects before and after the exercise. There was a trend towards higher LDH B levels in older con-
trols before the exercise (A [r²=0.3522; p=0.0705]), which could not be found afterwards (B [r²=0.01696;
p=0.7199]). In HD subjects, LDH B and age showed no significant correlation (C [r²=0.08194; p=0.4227] +D
[r²=0.004778; p=0.8495]).
38
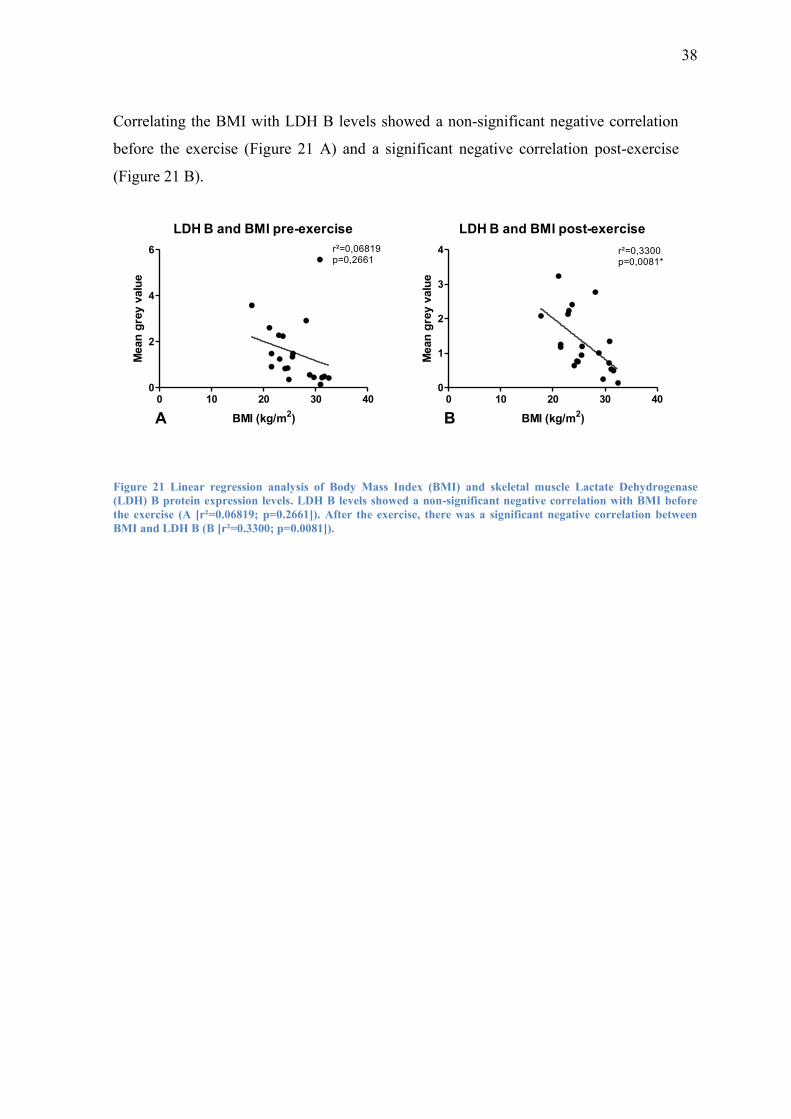
Correlating the BMI with LDH B levels showed a non-significant negative correlation
before the exercise (Figure 21 A) and a significant negative correlation post-exercise
(Figure 21 B).
LDH B and BMI pre-exercise
0 10 20 30 400
2
4
6 r²=0,06819p=0,2661
BMI (kg/m2)
Mean
gre
y v
alu
e
LDH B and BMI post-exercise
0 10 20 30 400
1
2
3
4 r²=0,3300p=0,0081*
BMI (kg/m2)
Mean
gre
y v
alu
eA B
Figure 21 Linear regression analysis of Body Mass Index (BMI) and skeletal muscle Lactate Dehydrogenase
(LDH) B protein expression levels. LDH B levels showed a non-significant negative correlation with BMI before
the exercise (A [r²=0.06819; p=0.2661]). After the exercise, there was a significant negative correlation between
BMI and LDH B (B [r²=0.3300; p=0.0081]).
39
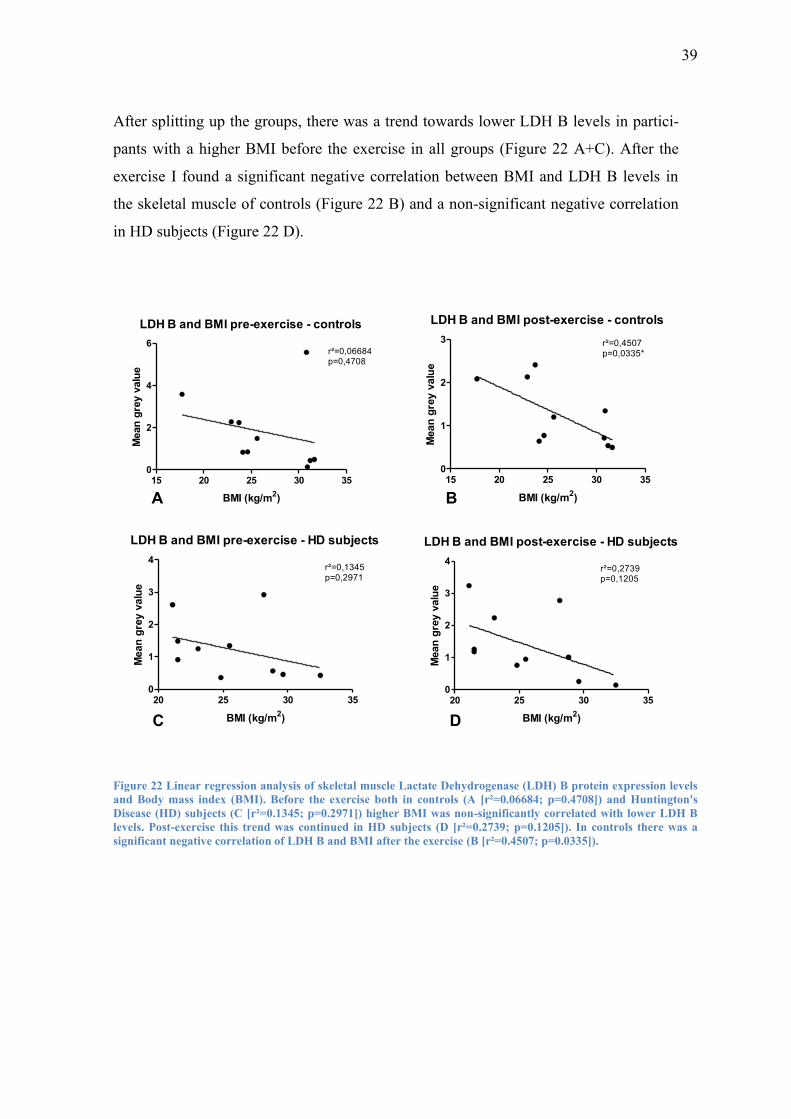
After splitting up the groups, there was a trend towards lower LDH B levels in partici-
pants with a higher BMI before the exercise in all groups (Figure 22 A+C). After the
exercise I found a significant negative correlation between BMI and LDH B levels in
the skeletal muscle of controls (Figure 22 B) and a non-significant negative correlation
in HD subjects (Figure 22 D).
LDH B and BMI pre-exercise - controls
15 20 25 30 350
2
4
6r²=0,06684p=0,4708
BMI (kg/m2)
Mean
gre
y v
alu
e
LDH B and BMI post-exercise - controls
15 20 25 30 350
1
2
3 r²=0,4507p=0,0335*
BMI (kg/m2)
Mean
gre
y v
alu
e
LDH B and BMI pre-exercise - HD subjects
20 25 30 350
1
2
3
4r²=0,1345p=0,2971
BMI (kg/m2)
Mean
gre
y v
alu
e
LDH B and BMI post-exercise - HD subjects
20 25 30 350
1
2
3
4r²=0,2739p=0,1205
BMI (kg/m2)
Mean
gre
y v
alu
e
A B
C D
Figure 22 Linear regression analysis of skeletal muscle Lactate Dehydrogenase (LDH) B protein expression levels
and Body mass index (BMI). Before the exercise both in controls (A [r²=0.06684; p=0.4708]) and Huntington's
Disease (HD) subjects (C [r²=0.1345; p=0.2971]) higher BMI was non-significantly correlated with lower LDH B
levels. Post-exercise this trend was continued in HD subjects (D [r²=0.2739; p=0.1205]). In controls there was a
significant negative correlation of LDH B and BMI after the exercise (B [r²=0.4507; p=0.0335]).
40
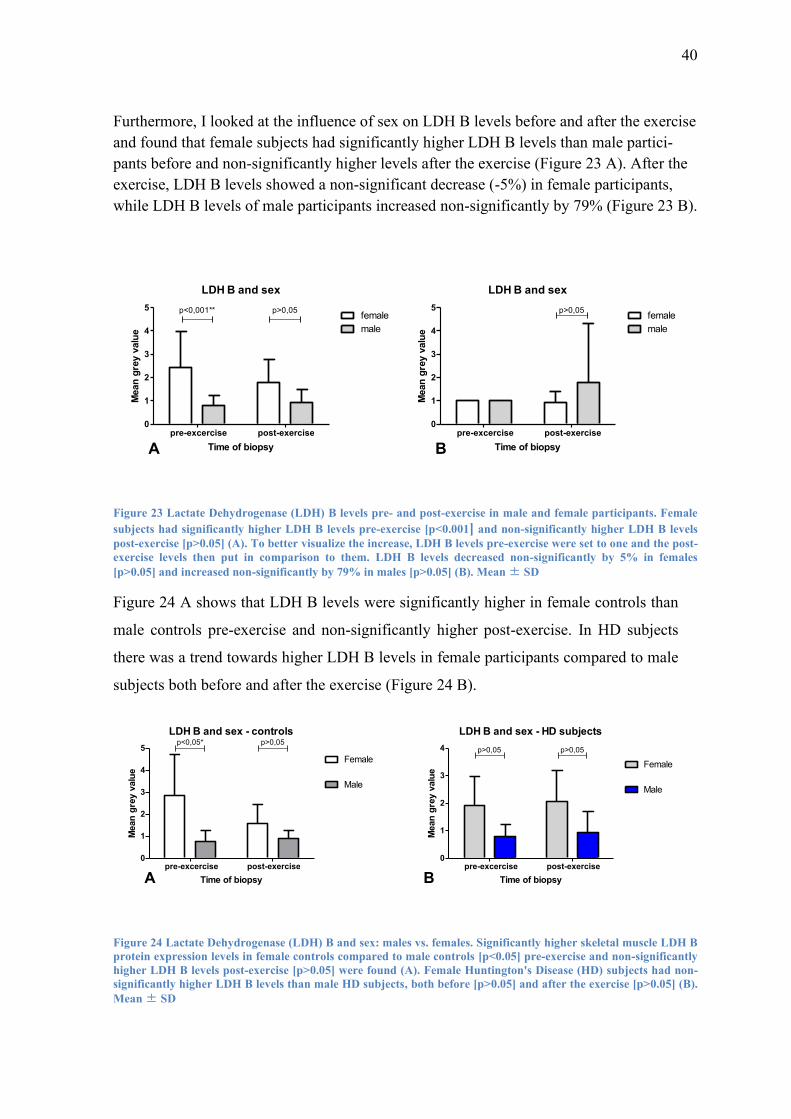
Furthermore, I looked at the influence of sex on LDH B levels before and after the exercise
and found that female subjects had significantly higher LDH B levels than male partici-
pants before and non-significantly higher levels after the exercise (Figure 23 A). After the
exercise, LDH B levels showed a non-significant decrease (-5%) in female participants,
while LDH B levels of male participants increased non-significantly by 79% (Figure 23 B).
LDH B and sex
pre-excercise post-exercise0
1
2
3
4
5female
male
p<0,001** p>0,05
Time of biopsy
Mean
gre
y v
alu
e
LDH B and sex
pre-excercise post-exercise0
1
2
3
4
5female
male
p>0,05
Time of biopsy
Mean
gre
y v
alu
e
A B
Figure 23 Lactate Dehydrogenase (LDH) B levels pre- and post-exercise in male and female participants. Female
subjects had significantly higher LDH B levels pre-exercise [p<0.001] and non-significantly higher LDH B levels
post-exercise [p>0.05] (A). To better visualize the increase, LDH B levels pre-exercise were set to one and the post-
exercise levels then put in comparison to them. LDH B levels decreased non-significantly by 5% in females
[p>0.05] and increased non-significantly by 79% in males [p>0.05] (B). Mean ± SD
Figure 24 A shows that LDH B levels were significantly higher in female controls than
male controls pre-exercise and non-significantly higher post-exercise. In HD subjects
there was a trend towards higher LDH B levels in female participants compared to male
subjects both before and after the exercise (Figure 24 B).
LDH B and sex - controls
pre-excercise post-exercise0
1
2
3
4
5
Female
Male
p<0,05* p>0,05
Time of biopsy
Mean
gre
y v
alu
e
LDH B and sex - HD subjects
pre-excercise post-exercise0
1
2
3
4
Female
Male
p>0,05p>0,05
Time of biopsy
Mean
gre
y v
alu
e
A B
Figure 24 Lactate Dehydrogenase (LDH) B and sex: males vs. females. Significantly higher skeletal muscle LDH B
protein expression levels in female controls compared to male controls [p<0.05] pre-exercise and non-significantly
higher LDH B levels post-exercise [p>0.05] were found (A). Female Huntington's Disease (HD) subjects had non-
significantly higher LDH B levels than male HD subjects, both before [p>0.05] and after the exercise [p>0.05] (B).
Mean ± SD
41
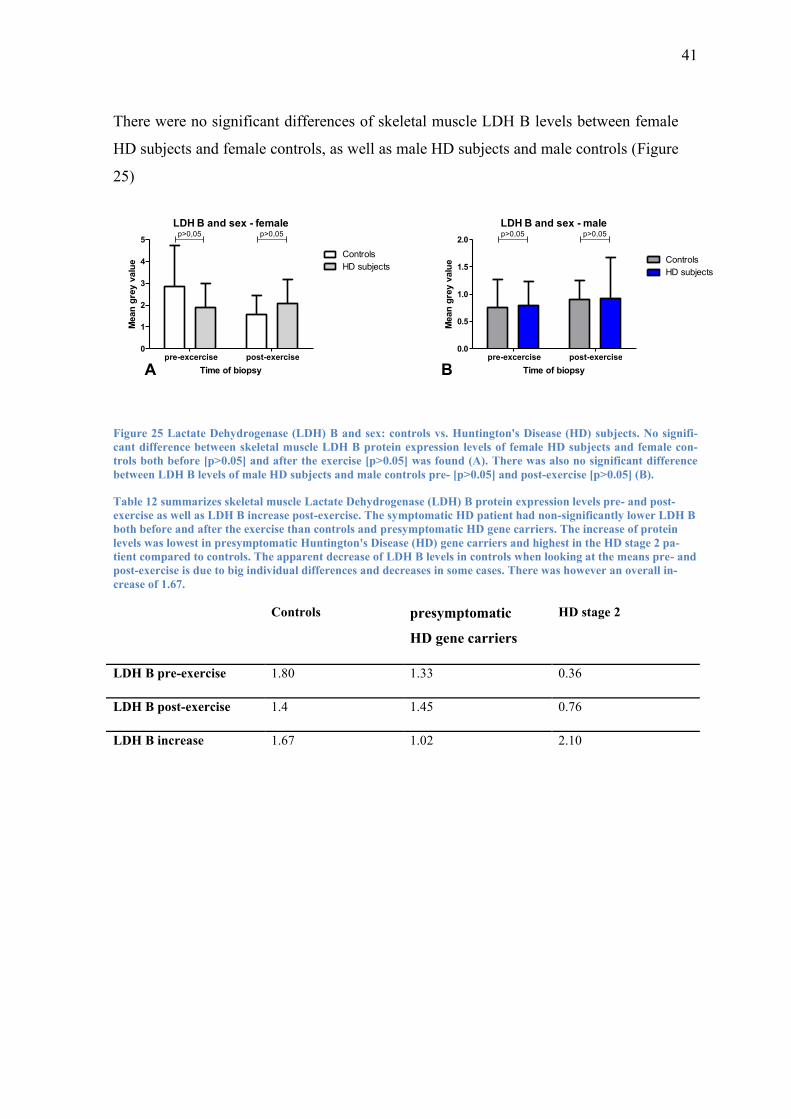
There were no significant differences of skeletal muscle LDH B levels between female
HD subjects and female controls, as well as male HD subjects and male controls (Figure
25)
LDH B and sex - female
pre-excercise post-exercise0
1
2
3
4
5
Controls
HD subjects
p>0,05p>0,05
Time of biopsy
Mean
gre
y v
alu
e
LDH B and sex - male
pre-excercise post-exercise0.0
0.5
1.0
1.5
2.0
Controls
HD subjects
p>0,05p>0,05
Time of biopsy
Mean
gre
y v
alu
e
A B
Figure 25 Lactate Dehydrogenase (LDH) B and sex: controls vs. Huntington's Disease (HD) subjects. No signifi-
cant difference between skeletal muscle LDH B protein expression levels of female HD subjects and female con-
trols both before [p>0.05] and after the exercise [p>0.05] was found (A). There was also no significant difference
between LDH B levels of male HD subjects and male controls pre- [p>0.05] and post-exercise [p>0.05] (B).
Table 12 summarizes skeletal muscle Lactate Dehydrogenase (LDH) B protein expression levels pre- and post-
exercise as well as LDH B increase post-exercise. The symptomatic HD patient had non-significantly lower LDH B
both before and after the exercise than controls and presymptomatic HD gene carriers. The increase of protein
levels was lowest in presymptomatic Huntington's Disease (HD) gene carriers and highest in the HD stage 2 pa-
tient compared to controls. The apparent decrease of LDH B levels in controls when looking at the means pre- and
post-exercise is due to big individual differences and decreases in some cases. There was however an overall in-
crease of 1.67.
Controls presymptomatic
HD gene carriers
HD stage 2
LDH B pre-exercise 1.80 1.33 0.36
LDH B post-exercise 1.4 1.45 0.76
LDH B increase 1.67 1.02 2.10
42
3.3.3 LDH A vs. LDH B
To find out whether the expression levels of LDH A and LDH B responded differently
in skeletal muscle of controls compared to HD subjects to the acute bout of moderate
intensity endurance exercise, I compared LDH A and LDH B levels before and after the
exercise. Additionally, I compared the increase of protein expression levels of LDH A
and LDH B post-exercise.
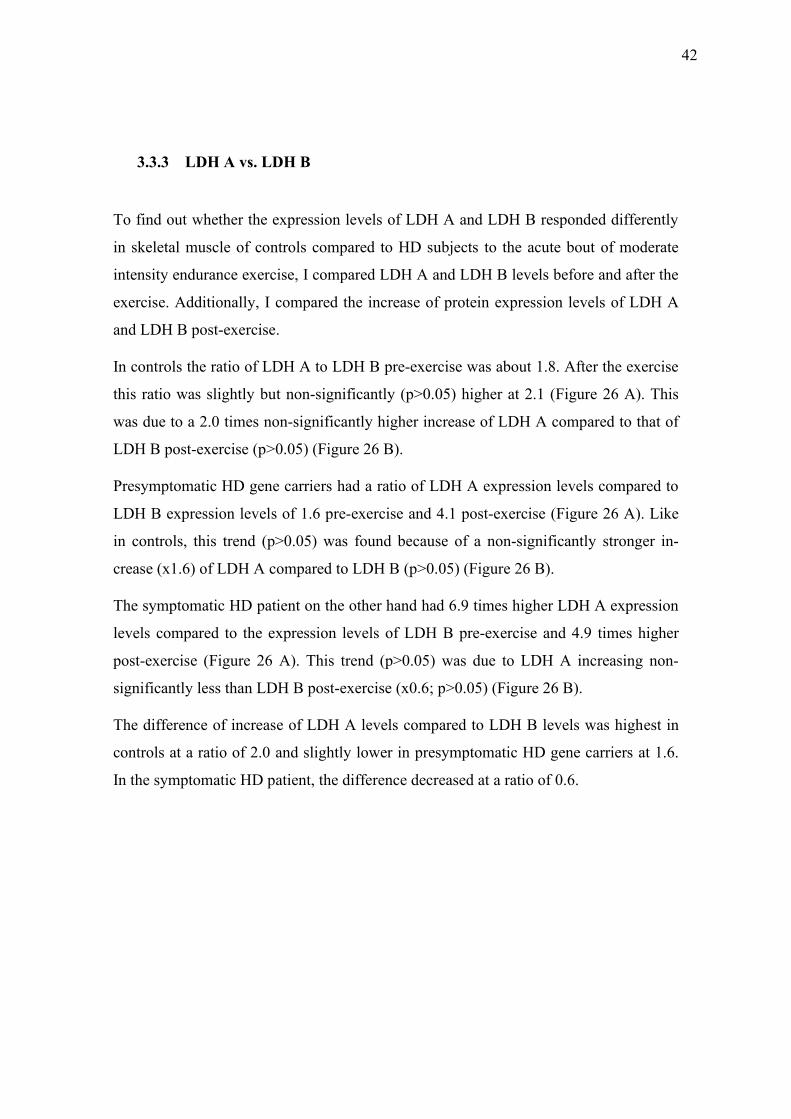
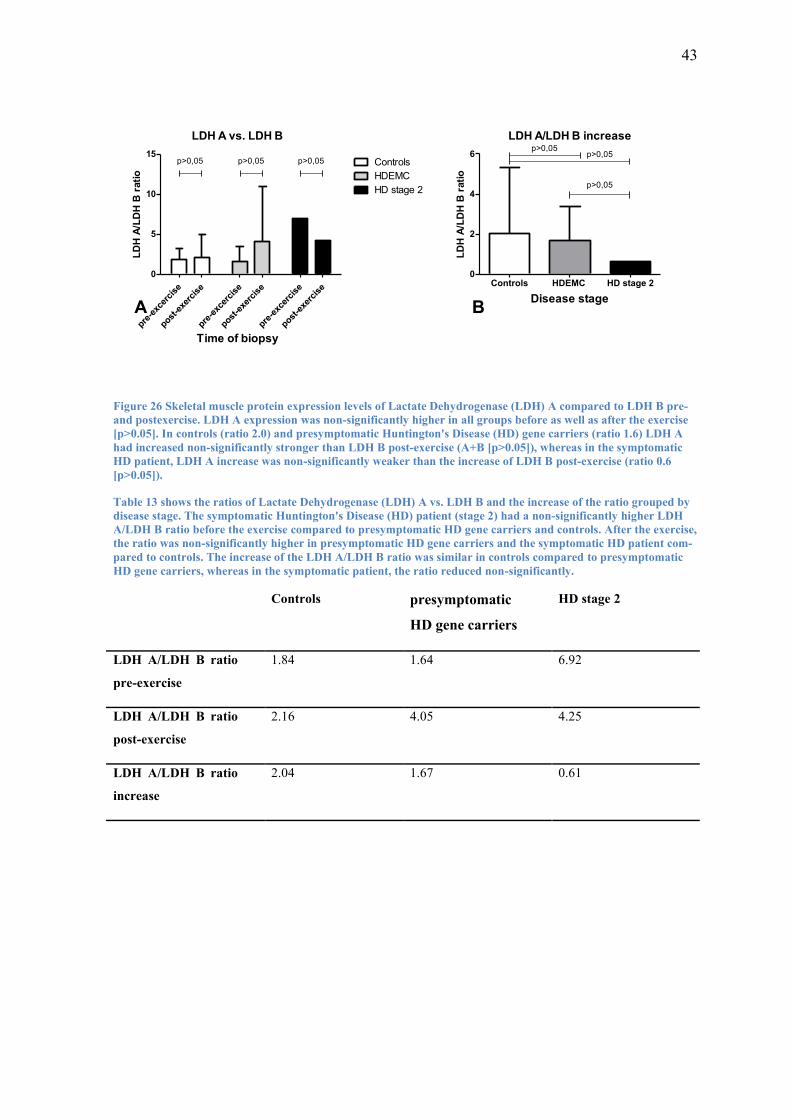
In controls the ratio of LDH A to LDH B pre-exercise was about 1.8. After the exercise
this ratio was slightly but non-significantly (p>0.05) higher at 2.1 (Figure 26 A). This
was due to a 2.0 times non-significantly higher increase of LDH A compared to that of
LDH B post-exercise (p>0.05) (Figure 26 B).
Presymptomatic HD gene carriers had a ratio of LDH A expression levels compared to
LDH B expression levels of 1.6 pre-exercise and 4.1 post-exercise (Figure 26 A). Like
in controls, this trend (p>0.05) was found because of a non-significantly stronger in-
crease (x1.6) of LDH A compared to LDH B (p>0.05) (Figure 26 B).
The symptomatic HD patient on the other hand had 6.9 times higher LDH A expression
levels compared to the expression levels of LDH B pre-exercise and 4.9 times higher
post-exercise (Figure 26 A). This trend (p>0.05) was due to LDH A increasing non-
significantly less than LDH B post-exercise (x0.6; p>0.05) (Figure 26 B).
The difference of increase of LDH A levels compared to LDH B levels was highest in
controls at a ratio of 2.0 and slightly lower in presymptomatic HD gene carriers at 1.6.
In the symptomatic HD patient, the difference decreased at a ratio of 0.6.
43
LDH A vs. LDH B
pre-e
xcer
cise
post-e
xerc
ise
pre-e
xcer
cise
post-e
xerc
ise
pre-e
xcer
cise
post-e
xerc
ise
0
5
10
15Controls
HDEMC
HD stage 2
p>0,05 p>0,05 p>0,05
Time of biopsy
LD
H A
/LD
H B
rati
oLDH A/LDH B increase
Controls HDEMC HD stage 20
2
4
6p>0,05
p>0,05
p>0,05
Disease stage
LD
H A
/LD
H B
rati
o
A B
Figure 26 Skeletal muscle protein expression levels of Lactate Dehydrogenase (LDH) A compared to LDH B pre-
and postexercise. LDH A expression was non-significantly higher in all groups before as well as after the exercise
[p>0.05]. In controls (ratio 2.0) and presymptomatic Huntington's Disease (HD) gene carriers (ratio 1.6) LDH A
had increased non-significantly stronger than LDH B post-exercise (A+B [p>0.05]), whereas in the symptomatic
HD patient, LDH A increase was non-significantly weaker than the increase of LDH B post-exercise (ratio 0.6
[p>0.05]).
Table 13 shows the ratios of Lactate Dehydrogenase (LDH) A vs. LDH B and the increase of the ratio grouped by
disease stage. The symptomatic Huntington's Disease (HD) patient (stage 2) had a non-significantly higher LDH
A/LDH B ratio before the exercise compared to presymptomatic HD gene carriers and controls. After the exercise,
the ratio was non-significantly higher in presymptomatic HD gene carriers and the symptomatic HD patient com-
pared to controls. The increase of the LDH A/LDH B ratio was similar in controls compared to presymptomatic
HD gene carriers, whereas in the symptomatic patient, the ratio reduced non-significantly.
Controls presymptomatic
HD gene carriers
HD stage 2
LDH A/LDH B ratio
pre-exercise
1.84 1.64 6.92
LDH A/LDH B ratio
post-exercise
2.16 4.05 4.25
LDH A/LDH B ratio
increase
2.04 1.67 0.61
44
4. Discussion
The goal of this study was to investigate the role of exercise in Huntington's Disease
(HD). This was done by testing the hypothesis, that lactate dehydrogenase (LDH) A and
LDH B gene expression respond differently to moderate intensity endurance exercise in
presymptomatic HD gene carriers versus patients and compared to controls indicating
an altered lactate response to endurance exercise.
Skeletal muscle fine needle biopsies as a useful tool to obtain skeletal
muscle tissue and investigate exercise-induced metabolic changes in Hunting-
ton's Disease patients
Fine needle biopsies are a minimally invasive and efficient way to obtain skeletal mus-
cle tissue in HD patients. With no major complications, participants were even able to
perform endurance exercise immediately after the biopsy. Presymptomatic HD gene
carriers as well as symptomatic HD patients did not report any subjective complaints.
This leads to the conclusion that in contrast to open biopsies, which are more painful
and prone to complications [73], minimally invasive skeletal muscle fine needle biop-
sies can be performed on HD patients and presymptomatic HD gene carriers to investi-
gate the influence of exercise on metabolic changes, with a minimized risk of permanent
tissue damage or aggravation of symptoms.
However, the repeated biopsies may cause altered gene expression themselves and
therefore the results need to be interpreted with caution [75].
45
Blood lactate is elevated after moderate intensity endurance exercise in
HD patient but not presymptomatic HD gene carriers compared to controls
In the sole symptomatic HD patient, there was a trend towards a steeper increase of
blood lactate during maximum as well as moderate intensity endurance exercise. Ciam-
mola et al. also found higher lactate levels in HD patients as well as in presymptomatic
HD gene carriers during maximum intensity exercise [37]. However my analysis did not
confirm this trend in presymptomatic HD gene carriers, suggesting lactate metabolism
not to be detectebly altered in HD before the manifestation of clinical symptoms. Fur-
ther studies investigating the effects of exercise intensity on lactate metabolism in
symptomatic HD patients are required in the future.
These findings are in line with the results of Buck et al. who found the mitochondrial
respiratory function in skeletal muscle of the same presymptomatic HD gene carriers to
be normal compared to controls [74].
Since lactate production and clearance are mostly controlled through the expression of
LDH A and LDH B (see Figure 1), the results suggest altered expression levels of these
two proteins in symptomatic HD patients.
Lactate Dehydrogenase (LDH) expression in skeletal muscle is altered in
presymptomatic HD gene carriers and the HD patient after moderate intensity
endurance exercise
After being induced by maximum intensity endurance exercise, PGC-1α inhibits the
expression of LDH A and induces LDH B expression [22]. This is a response to higher
lactate levels in skeletal muscle due to exercise and leads to an increased lactate clear-
ance and lactate to pyruvate conversion. With PGC-1α function being altered in HD, I
investigated, whether skeletal muscle LDH A and LDH B expression response to mod-
erate intensity endurance exercise is different in presymptomatic HD gene carriers and
symptomatic HD patients than in controls.
LDH B levels were also increased post-exercise in all groups, though the increase was
lower in presymptomatic HD gene carriers than controls and the HD patient. These find-
46
ings suggest LDH A and LDH B expression in skeletal muscle to be altered before the
onset of symptoms in HD, as well as after the outbreak of the disease, with higher lac-
tate production through upregulation of LDH A and lower lactate clearance through
weaker upregulation of LDH B in presymptomatic HD gene carriers and the HD patient
compared to controls.
This can lead to the conclusion that LDH A is up regulated, while LDH B is inhibited in
HD gene carriers as well as symptomatic HD patients.
However, these conclusions are in conflict with the lactate levels of presymptomatic HD
gene carriers during moderate intensity endurance exercise, which were not elevated. A
reason for these inconsistent results may be the alteration of protein expression by mus-
cle biopsies, which can mimic gene expression response to exercise [75]. An important
limitation of this pilot study is the small number of participants.
There were no big differences between the groups after comparing the LDH A expres-
sion levels to LDH B expression levels and their changes after exercise. Only the symp-
tomatic HD patient had a stronger LDH B increase than that of LDH A. This, in contrast
to my other findings, does not point to altered skeletal muscle lactate metabolism in
HD. However, there were two very high individual values which may have altered the
results of LDH A/LDH B comparison (see Limitations and possible sources of error).
There were no statistically significant differences of LDH A and B expression between
presymptomatic HD gene carriers and controls or the HD patient and controls. Howev-
er, a trend towards a stronger LDH A increase after moderate intensity endurance exer-
cise was found in presymptomatic HD gene carriers and the HD patient. With PGC-1α
being induced by exercise and subsequently activating LDH B and repressing LDH A,
PGC-1α or its function seem to be altered before and after the onset of symptoms in
HD[12, 66, 67, 76].
Of further interest is the influence of different parameters such as age, Body Mass Index
(BMI), sex or the training status of participants on the expression levels of LDH A and
LDH B in skeletal muscle of controls as well as presymptomatic HD gene carriers and
HD patients.
47
LDH A but not LDH B response to moderate intensity endurance ex-
ercise in older participants is opposite in HD subjects compared to controls
The analysis of LDH A and LDH B response in correlation with age showed a trend
towards lower LDH A levels in older (>35 years) controls compared to younger controls
(<35 years), which can potentially explained through lower metabolic response in older
people [25] and compromised PGC-1α expression and function in older people [62, 63].
In HD subjects this trend was opposite, with higher LDH A levels in older (>40 years)
participants compared to younger participants (<40 years). This suggests an altered
metabolic ability of skeletal muscle of presymptomatic HD gene carriers as well as HD
patients and possibly an inhibition of PGC-1α, which suppresses LDH A and induces
LDH B expression and activity. The onset of symptoms in HD usually occurs between
the age of 35 and 50 years. Hence older presymptomatic HD gene carriers are arguably
closer to the outbreak of the disease which may be an explanation for the altered LDH A
levels in older presymptomatic HD gene carriers.
At rest there was a trend towards higher LDH B levels in older controls, which was re-
versed after the exercise. LDH B expression levels were lower in older participants in
all groups after the exercise and HD subjects before the exercise, further implementing
the impression of age reducing LDH B expression. There doesn't seem to be a differ-
ence between controls and HD subjects in LDH B expression in relation with age, rais-
ing the question whether or not LDH B might be compromised in presymptomatic HD
gene carriers compared to LDH A.
48
LDH A response to exercise in correlation with BMI is opposite in HD
subjects compared to controls
I found trends towards lower LDH A levels in controls with a higher BMI (>25 kg/m²)
pre-exercise and a reversion of these results post-exercise. As a higher BMI is associat-
ed with decreased exercise capacity and physical function [39, 40], this suggests that
subjects with a lower BMI (<25 kg/m²) are capable of responding to higher lactate lev-
els more sufficiently, by reducing LDH A levels and therefore lactate production. For
LDH B, I found a trend towards a negative correlation with BMI in all groups both be-
fore and after the exercise. This suggests a decreased LDH B response to exercise in
subjects with a higher BMI in all groups but no difference between HD subjects and
controls.
Interestingly, in HD subjects, both before and after the exercise lower LDH A levels
were non-significantly correlated with a lower BMI. This suggests an impaired LDH A
response to the higher exercise-induced blood lactate levels. With weight loss and a
negative energy-balance as early symptoms in non-symptomatic and early stage HD
patients [43, 44], the correlation of BMI and LDH A may be part of the altered energy
metabolism. As weight loss is one of the first symptoms of the disease, this could mean
that LDH A response is altered in people with a lower BMI, because they are closer to
the onset of symptoms. It could also mean that the metabolism is altered more severely
in HD subjects with a lower BMI, the weight loss has not however been associated with
a worsened functional state and aggravation of other symptoms [77].
Again this points towards LDH A being altered earlier in the disease than LDH B.
49
LDH A and LDH B skeletal muscle expression levels are higher in fe-
males compared to males in controls and HD subjects at rest and post-exercise
The influence of sex on metabolic processes in skeletal muscle has been an area of in-
terest in the past, especially in the context of exercise. Wiecek et al. found no differ-
ences between men and women in the metabolic response to maximum intensity exer-
cise. However the absolute lactate levels were higher in females compared to males,
both before and after the exercise. They also found women to have a higher anti-
oxidative capacity [78, 79]. Several studies have found the basic metabolic rate and ac-
tivity of enzymes of the energy metabolism to be higher in males than in females, also
of LDH [80, 81] thus explaining lower anaerobic exercise capacity in females compared
to males.
In conflict with this data, I found both LDH A and LDH B expression levels to be high-
er in females at rest and post-exercise in controls as well as the HD group.
An explanation for these discrepancies, may be the small number of participants and
that repeated skeletal muscle biopsies can lead to similar metabolic changes as exercise
[75] (see Limitations and possible sources of error).
Besides that, there was a trend towards lower pre-exercise LDH A expression levels in
both female and male HD subjects compared to female and male controls. The increase
of LDH A expression levels was also non-significantly higher in HD subjects compared
to controls, both in females and males. There was no such difference in LDH B expres-
sion levels.
Again this points to the impression that LDH A expression is compromised in HD sub-
jects of both sexes, whereas LDH B expression levels and response to exercise don't
seem to be different in HD subjects compared to controls.
50
Limitations and possible sources of error
To minimize errors, protocols that have been established and in use for a long time in
medical and biochemical research were strictly followed and all experiments were su-
pervised by highly schooled and experienced medical and scientific staff.
A possible source of error is the alteration of muscle metabolism through repeated mus-
cle biopsies [75]. The study suggests similar changes in gene expression after repeated
muscle biopsies and resistance exercise. However in this study only two biopsies were
taken 2 cm apart from each other and therefore the influence of the biopsies on gene
expression was kept to a minimum.
The EINSTEIN study is a feasibility study, therefore the groups that were examined
were small, underpowered for definitive results. However the results provide the basis
for power calculations for future studies.
51
Conclusion and outlook
The results of this study demonstrate feasibility contribute to understanding the meta-
bolic changes in response to exercise in HD.
First of all, I was able to show that the fine needle biopsies are well tolerated by pre-
symptomatic HD gene carriers as well as symptomatic HD patients. Skeletal muscle
tissue is readily obtainable and can be used to investigate metabolism in controls as well
as HD subjects.
I couldn't find any significant results on whether physical exercise has an influence on
the symptoms and their onset. Further long-term studies need to be conducted.
I was not able to find significant differences in HD subjects compared to controls. Dur-
ing moderate intensity endurance exercise lactate levels were elevated in the HD pa-
tients but not in presymptomatic HD gene carriers compared to controls. An explanation
for this may be the small number of participants. If the results can be reproduced in big-
ger cohorts, a possible explanation could be that other studies which found lactate levels
to be higher in presymptomatic HD gene carriers like that of Ciammola et al. [37] used
maximum capacity exercise and not moderate intensity endurance exercise.
However, the trends I found after investigating skeletal muscle LDH A and LDH B ex-
pression at rest and after moderate intensity endurance exercise suggest that skeletal
muscle LDH A expression levels may be compromised in HD patients and, interesting-
ly, also in presymptomatic HD gene carriers. This is possibly due to alterations in PGC-
1α expression or function [66, 76]. LDH B expression on the other hand didn't seem to
be impacted by the HD mutation.
With PGC-1α having a known influence on both HD and LDH A and B expression, the
question arises, whether or not it is altered in a way that influences LDH A but not LDH
B expression in HD. Thus also explaining the increased exercise-induced lactate levels
that were found in presymptomatic HD gene carriers and HD patients compared to con-
trols in other studies [37].
If these results can be reproduced, the investigation of skeletal muscle LDH A and B
expression and alteration could lead to a better understanding of the pathophysiology
and the metabolic changes preceding the outbreak of symptoms in HD.

52
These results clearly warrant the conduction of larger studies.
53
5. Summary
The goal of this feasibility study was to investigate the metabolic changes underlying
Huntington's Disease (HD) before and after the onset of symptoms and the influence of
endurance exercise on skeletal muscle metabolism. Therefore I analyzed the skeletal
muscle protein expression of lactatedehydrogenase (LDH) A and LDH B before and
after an acute bout of moderate intensity endurance exercise, as well as lactate levels
during the exercise on a bicycle ergometer.
Skeletal muscle tissue was obtained using fine needle biopsies, which proved to be an
effective and minimally invasive procedure which was tolerated well by all subjects. It
presents itself as less invasive than commonly used methods and very useful to investi-
gate metabolic changes in HD in presymptomatic HD gene carriers as well as the symp-
tomatic HD patient.
Western blot was used to quantify skeletal muscle LDH A and LDH B levels. Lactate
levels were measured in capillary blood from the earlobe during the exercise.
Blood lactate increased continuously in all groups, the levels were higher in the symp-
tomatic HD patient compared to controls, presymptomatic HD gene carriers didn't have
higher levels than controls.
Western blots showed trends to altered skeletal muscle LDH A expression levels in pre-
symptomatic HD gene carriers and the HD patient in comparison with controls, with
higher LDH A levels after the exercise and a stronger increase in response to exercise.
Skeletal muscle LDH B expression levels were not different in presymptomatic HD
gene carriers and the HD patient compared to controls.
I found higher LDH A and LDH B expression levels in females of all groups, compared
to males of all groups, contradicting other data which may be due to the small number
of participants.
This data suggests skeletal muscle LDH A gene expression to be altered before the on-
set of the first symptoms in presymptomatic HD gene carriers. LDH B doesn't seem to
be altered in HD.
This raises the question, whether peroxisome proliferator-activated receptor-γ coactiva-
tor-1α (PGC-1α) , which controls LDH A and LDH B expression and also has an influ-
54
ence on HD may be altered in a way that compromises LDH A but not LDH B expres-
sion. If these results can be reproduced, the further investigation of skeletal muscle
LDH A and LDH B expression and its response to exercise may contribute to a better
understanding of the metabolic changes underlying HD and foregoing the outbreak of
symptoms.
In order to confirm these findings and further investigate the influence of PGC-1α on
HD and the role of lactate metabolism in HD, studies with bigger cohorts are needed.
The recruiting for the ExercIse for NeuroSkeleTal Enhancement In Neurological diseas-
es (EINSTEIN) study was therefore still going on when this thesis was finished.

55
6. Bibliography
1. MacDonald, M.E., C.M. Ambrose, M.P. Duyao, R.H. Myers, C. Lin, L. Srinidhi, G. Barnes, S.A. Taylor, M. James, N. Groot, H. MacFarlane, B. Jenkins, M.A. Anderson, N.S. Wexler, J.F. Gusella, G.P. Bates, S. Baxendale, H. Hummerich, S. Kirby, M. North, S. Youngman, R. Mott, G. Zehetner, Z. Sedlacek, A. Poustka, A.-M. Frischauf, H. Lehrach, A.J. Buckler, D. Church, L. Doucette-Stamm, M.C. O'Donovan, L. Riba-Ramirez, M. Shah, V.P. Stanton, S.A. Strobel, K.M. Draths, J.L. Wales, P. Dervan, D.E. Housman, M. Altherr, R. Shiang, L. Thompson, T. Fielder, J.J. Wasmuth, D. Tagle, J. Valdes, L. Elmer, M. Allard, L. Castilla, M. Swaroop, K. Blanchard, F.S. Collins, R. Snell, T. Holloway, K. Gillespie, N. Datson, D. Shaw, and P.S. Harper, A novel gene containing a trinucleotide repeat that is expanded and unstable on Huntington's disease chromosomes. Cell, 1993:971-983.
2. Walker, F.O., Huntington's disease. The Lancet, 2007:218-228. 3. Hedlin, M. Stages of Huntington's Disease. 2011 [cited 2017 20.09.2017];
Available from: http://web.stanford.edu/group/hopes/cgi-bin/hopes_test/stages-of-huntingtons-disease/.
4. Shoulson, I. and A.B. Young, Milestones in huntington disease. Mov Disord, 2011:1127-1133.
5. Sitzer, M. and H. Steinmetz, Chorea Huntington, in Lehrbuch Neurologie, M. Kortenhaus, Editor. 2011, Urban&Fischer: München253-255.
6. Sharp, A.H., S.J. Loev, G. Schilling, S.H. Li, X.J. Li, J. Bao, M.V. Wagster, J.A. Kotzuk, J.P. Steiner, A. Lo, and et al., Widespread expression of Huntington's disease gene (IT15) protein product. Neuron, 1995:1065-1074.
7. Marques Sousa, C. and S. Humbert, Huntingtin: here, there, everywhere! J Huntingtons Dis, 2013:395-403.
8. Caviston, J.P., J.L. Ross, S.M. Antony, M. Tokito, and E.L. Holzbaur, Huntingtin facilitates dynein/dynactin-mediated vesicle transport. Proc Natl Acad Sci U S A, 2007:10045-10050.
9. Saudou, F. and S. Humbert, The Biology of Huntingtin. Neuron, 2016:910-926. 10. Perlman, R.L., Mouse models of human disease: An evolutionary perspective. Evol
Med Public Health, 2016:170-176. 11. Langbehn, D.R., R.R. Brinkman, D. Falush, J.S. Paulsen, M.R. Hayden, and G. on
behalf of an International Huntington's Disease Collaborative, A new model for prediction of the age of onset and penetrance for Huntington's disease based on CAG length. Clinical Genetics, 2004:267-277.
12. Weydt, P., S.M. Soyal, C. Gellera, S. DiDonato, C. Weidinger, H. Oberkofler, G.B. Landwehrmeyer, and W. Patsch, The gene coding for PGC-1α modifies age at onset in Huntington's Disease. Molecular Neurodegeneration, 2009:3-3.
13. Weydt, P., S.M. Soyal, G.B. Landwehrmeyer, and W. Patsch, A single nucleotide polymorphism in the coding region of PGC-1α is a male-specific modifier of Huntington disease age-at-onset in a large European cohort. BMC Neurol, 2014:1.
14. Che, H.V., S. Metzger, E. Portal, C. Deyle, O. Riess, and H.P. Nguyen, Localization of sequence variations in PGC-1alpha influence their modifying effect in Huntington disease. Mol Neurodegener, 2011:1.
15. Ramos, E.M., J.C. Latourelle, J.H. Lee, T. Gillis, J.S. Mysore, F. Squitieri, A. Di Pardo, S. Di Donato, M.R. Hayden, P.J. Morrison, M. Nance, C.A. Ross, R.L. Margolis, E.
56
Gomez-Tortosa, C. Ayuso, O. Suchowersky, R.J. Trent, E. McCusker, A. Novelletto, M. Frontali, R. Jones, T. Ashizawa, S. Frank, M.H. Saint-Hilaire, S.M. Hersch, H.D. Rosas, D. Lucente, M.B. Harrison, A. Zanko, K. Marder, J.F. Gusella, J.M. Lee, I. Alonso, J. Sequeiros, R.H. Myers, and M.E. Macdonald, Population stratification may bias analysis of PGC-1alpha as a modifier of age at Huntington disease motor onset. Hum Genet, 2012:1833-1840.
16. Group, H.S., Unified Huntington's Disease Rating Scale: reliability and consistency. Huntington Study Group. Mov Disord, 1996:136-142.
17. Nunnari, J. and A. Suomalainen, Mitochondria: In Sickness and in Health. Cell, 2012:1145-1159.
18. Elustondo, P.A., A.E. White, M.E. Hughes, K. Brebner, E. Pavlov, and D.A. Kane, Physical and Functional Association of Lactate Dehydrogenase (LDH) with Skeletal Muscle Mitochondria. J Biol Chem, 2013:25309-25317.
19. Albouaini, K., M. Egred, and A. Alahmar, Cardiopulmonary exercise testing and its application. Heart, 2007:1285-1292.
20. Adeva, M., M. González-Lucán, M. Seco, and C. Donapetry, Enzymes involved in l-lactate metabolism in humans. Mitochondrion, 2013:615-629.
21. Dawson, D.M., T.L. Goodfriend, and N.O. Kaplan, LACTIC DEHYDROGENASES: FUNCTIONS OF THE TWO TYPES RATES OF SYNTHESIS OF THE TWO MAJOR FORMS CAN BE CORRELATED WITH METABOLIC DIFFERENTIATION. Science, 1964:929-933.
22. Summermatter, S., G. Santos, J. Perez-Schindler, and C. Handschin, Skeletal muscle PGC-1alpha controls whole-body lactate homeostasis through estrogen-related receptor alpha-dependent activation of LDH B and repression of LDH A. Proc Natl Acad Sci U S A, 2013:8738-8743.
23. Liang, X., L. Liu, T. Fu, Q. Zhou, D. Zhou, L. Xiao, J. Liu, Y. Kong, H. Xie, F. Yi, L. Lai, R.B. Vega, D.P. Kelly, S.R. Smith, and Z. Gan, Exercise Inducible Lactate Dehydrogenase B Regulates Mitochondrial Function in Skeletal Muscle. J Biol Chem, 2016:25306-25318.
24. Washington, T.A., J.M. Healey, R.W. Thompson, L.L. Lowe, and J.A. Carson, Lactate dehydrogenase regulation in aged skeletal muscle: Regulation by anabolic steroids and functional overload. Exp Gerontol, 2014:66-74.
25. Ji, L.L., Redox signaling in skeletal muscle: role of aging and exercise. Advances in Physiology Education, 2015:352-359.
26. Sassone, J., C. Colciago, G. Cislaghi, V. Silani, and A. Ciammola, Huntington's disease: the current state of research with peripheral tissues. Exp Neurol, 2009:385-397.
27. Harms, L., H. Meierkord, G. Timm, L. Pfeiffer, and A.C. Ludolph, Decreased N-acetyl-aspartate/choline ratio and increased lactate in the frontal lobe of patients with Huntington's disease: a proton magnetic resonance spectroscopy study. J Neurol Neurosurg Psychiatry, 1997:27-30.
28. Koroshetz, W.J., B.G. Jenkins, B.R. Rosen, and M.F. Beal, Energy metabolism defects in Huntington's disease and effects of coenzyme Q10. Ann Neurol, 1997:160-165.
29. Lin, M.T. and M.F. Beal, Mitochondrial dysfunction and oxidative stress in neurodegenerative diseases. Nature, 2006:787.
30. Choo, Y.S., G.V. Johnson, M. MacDonald, P.J. Detloff, and M. Lesort, Mutant huntingtin directly increases susceptibility of mitochondria to the calcium-induced
57
permeability transition and cytochrome c release. Hum Mol Genet, 2004:1407-1420.
31. Milakovic, T. and G.V. Johnson, Mitochondrial respiration and ATP production are significantly impaired in striatal cells expressing mutant huntingtin. J Biol Chem, 2005:30773-30782.
32. Squitieri, F., M. Cannella, G. Sgarbi, V. Maglione, A. Falleni, P. Lenzi, A. Baracca, G. Cislaghi, C. Saft, G. Ragona, M.A. Russo, L.M. Thompson, G. Solaini, and F. Fornai, Severe ultrastructural mitochondrial changes in lymphoblasts homozygous for Huntington disease mutation. Mech Ageing Dev, 2006:217-220.
33. Quintanilla, R.A., Y.N. Jin, R. von Bernhardi, and G.V.W. Johnson, Mitochondrial permeability transition pore induces mitochondria injury in Huntington disease. Mol Neurodegener, 2013:45.
34. Squitieri, F., A. Falleni, M. Cannella, S. Orobello, F. Fulceri, P. Lenzi, and F. Fornai, Abnormal morphology of peripheral cell tissues from patients with Huntington disease. J Neural Transm (Vienna), 2010:77-83.
35. Hering, T., P. Braubach, G.B. Landwehrmeyer, K.S. Lindenberg, and W. Melzer, Fast-to-Slow Transition of Skeletal Muscle Contractile Function and Corresponding Changes in Myosin Heavy and Light Chain Formation in the R6/2 Mouse Model of Huntington's Disease. PLoS One, 2016:e0166106.
36. Ribchester, R.R., D. Thomson, N.I. Wood, T. Hinks, T.H. Gillingwater, T.M. Wishart, F.A. Court, and A.J. Morton, Progressive abnormalities in skeletal muscle and neuromuscular junctions of transgenic mice expressing the Huntington's disease mutation. European Journal of Neuroscience, 2004:3092-3114.
37. Ciammola, A., J. Sassone, M. Sciacco, N.E. Mencacci, M. Ripolone, C. Bizzi, C. Colciago, M. Moggio, G. Parati, V. Silani, and G. Malfatto, Low anaerobic threshold and increased skeletal muscle lactate production in subjects with Huntington's disease. Mov Disord, 2011:130-137.
38. Josefsen, K., S.M. Nielsen, A. Campos, T. Seifert, L. Hasholt, J.E. Nielsen, A. Norremolle, N.H. Skotte, N.H. Secher, and B. Quistorff, Reduced gluconeogenesis and lactate clearance in Huntington's disease. Neurobiol Dis, 2010:656-662.
39. Colak, R. and O. Ozcelik, Effects of short-period exercise training and orlistat therapy on body composition and maximal power production capacity in obese patients. Physiol Res, 2004:53-60.
40. Hergenroeder, A.L., J.S. Brach, A.D. Otto, P.J. Sparto, and J.M. Jakicic, The Influence of Body Mass Index on Self-report and Performance-based Measures of Physical Function in Adult Women. Cardiopulm Phys Ther J, 2011:11-20.
41. Waters, C.W., G. Varuzhanyan, R.J. Talmadge, and A.A. Voss, Huntington disease skeletal muscle is hyperexcitable owing to chloride and potassium channel dysfunction. Proc Natl Acad Sci U S A, 2013:9160-9165.
42. Pratley, R.E., A.D. Salbe, E. Ravussin, and J.N. Caviness, Higher sedentary energy expenditure in patients with Huntington's disease. Ann Neurol, 2000:64-70.
43. Goodman, A.O., P.R. Murgatroyd, G. Medina-Gomez, N.I. Wood, N. Finer, A.J. Vidal-Puig, A.J. Morton, and R.A. Barker, The metabolic profile of early Huntington's disease--a combined human and transgenic mouse study. Exp Neurol, 2008:691-698.
44. Djousse, L., B. Knowlton, L.A. Cupples, K. Marder, I. Shoulson, and R.H. Myers, Weight loss in early stage of Huntington's disease. Neurology, 2002:1325-1330.
58
45. Potter, M.C., C. Yuan, C. Ottenritter, M. Mughal, and H. van Praag, Exercise is not beneficial and may accelerate symptom onset in a mouse model of Huntington’s disease. PLoS Curr, 2010.
46. Safdar, A., J.M. Bourgeois, D.I. Ogborn, J.P. Little, B.P. Hettinga, M. Akhtar, J.E. Thompson, S. Melov, N.J. Mocellin, G.C. Kujoth, T.A. Prolla, and M.A. Tarnopolsky, Endurance exercise rescues progeroid aging and induces systemic mitochondrial rejuvenation in mtDNA mutator mice. Proc Natl Acad Sci U S A, 2011:4135-4140.
47. Herbst, E.A. and G.P. Holloway, Exercise training normalizes mitochondrial respiratory capacity within the striatum of the R6/1 model of Huntington's disease. Neuroscience, 2015:515-523.
48. Frese, S., J.A. Petersen, M. Ligon-Auer, S.M. Mueller, V. Mihaylova, S.M. Gehrig, V. Kana, E.J. Rushing, E. Unterburger, G. Kägi, J.-M. Burgunder, M. Toigo, and H.H. Jung, Exercise effects in Huntington disease. Journal of Neurology, 2017:32-39.
49. van Dellen, A., C. Blakemore, R. Deacon, D. York, and A.J. Hannan, Delaying the onset of Huntington's in mice. Nature, 2000:721-722.
50. van Dellen, A., P.M. Cordery, T.L. Spires, C. Blakemore, and A.J. Hannan, Wheel running from a juvenile age delays onset of specific motor deficits but does not alter protein aggregate density in a mouse model of Huntington's disease. BMC Neurosci, 2008:34.
51. Mueller, S.M., S.M. Gehrig, J.A. Petersen, S. Frese, V. Mihaylova, M. Ligon-Auer, N. Khmara, J.M. Nuoffer, A. Schaller, C. Lundby, M. Toigo, and H.H. Jung, Effects of endurance training on skeletal muscle mitochondrial function in Huntington disease patients. Orphanet J Rare Dis, 2017:184.
52. Harrison, D.J., M. Busse, R. Openshaw, A.E. Rosser, S.B. Dunnett, and S.P. Brooks, Exercise attenuates neuropathology and has greater benefit on cognitive than motor deficits in the R6/1 Huntington's disease mouse model. Exp Neurol, 2013:457-469.
53. Lodi, R., A.H. Schapira, D. Manners, P. Styles, N.W. Wood, D.J. Taylor, and T.T. Warner, Abnormal in vivo skeletal muscle energy metabolism in Huntington's disease and dentatorubropallidoluysian atrophy. Ann Neurol, 2000:72-76.
54. Puigserver, P., Z. Wu, C.W. Park, R. Graves, M. Wright, and B.M. Spiegelman, A cold-inducible coactivator of nuclear receptors linked to adaptive thermogenesis. Cell, 1998:829-839.
55. Handschin, C. and B.M. Spiegelman, Peroxisome proliferator-activated receptor gamma coactivator 1 coactivators, energy homeostasis, and metabolism. Endocr Rev, 2006:728-735.
56. Norrbom, J., C.J. Sundberg, H. Ameln, W.E. Kraus, E. Jansson, and T. Gustafsson, PGC-1alpha mRNA expression is influenced by metabolic perturbation in exercising human skeletal muscle. J Appl Physiol (1985), 2004:189-194.
57. Koves, T.R., P. Li, J. An, T. Akimoto, D. Slentz, O. Ilkayeva, G.L. Dohm, Z. Yan, C.B. Newgard, and D.M. Muoio, Peroxisome proliferator-activated receptor-gamma co-activator 1alpha-mediated metabolic remodeling of skeletal myocytes mimics exercise training and reverses lipid-induced mitochondrial inefficiency. J Biol Chem, 2005:33588-33598.
58. Choi, C.S., D.E. Befroy, R. Codella, S. Kim, R.M. Reznick, Y.J. Hwang, Z.X. Liu, H.Y. Lee, A. Distefano, V.T. Samuel, D. Zhang, G.W. Cline, C. Handschin, J. Lin, K.F. Petersen, B.M. Spiegelman, and G.I. Shulman, Paradoxical effects of increased
59
expression of PGC-1alpha on muscle mitochondrial function and insulin-stimulated muscle glucose metabolism. Proc Natl Acad Sci U S A, 2008:19926-19931.
59. Lin, J., P.H. Wu, P.T. Tarr, K.S. Lindenberg, J. St-Pierre, C.Y. Zhang, V.K. Mootha, S. Jager, C.R. Vianna, R.M. Reznick, L. Cui, M. Manieri, M.X. Donovan, Z. Wu, M.P. Cooper, M.C. Fan, L.M. Rohas, A.M. Zavacki, S. Cinti, G.I. Shulman, B.B. Lowell, D. Krainc, and B.M. Spiegelman, Defects in adaptive energy metabolism with CNS-linked hyperactivity in PGC-1alpha null mice. Cell, 2004:121-135.
60. Leone, T.C., J.J. Lehman, B.N. Finck, P.J. Schaeffer, A.R. Wende, S. Boudina, M. Courtois, D.F. Wozniak, N. Sambandam, C. Bernal-Mizrachi, Z. Chen, O.H. J, D.M. Medeiros, R.E. Schmidt, J.E. Saffitz, E.D. Abel, C.F. Semenkovich, and D.P. Kelly, PGC-1α Deficiency Causes Multi-System Energy Metabolic Derangements: Muscle Dysfunction, Abnormal Weight Control and Hepatic Steatosis. PLoS Biol, 2005.
61. Handschin, C., S. Chin, P. Li, F. Liu, E. Maratos-Flier, N.K. LeBrasseur, Z. Yan, and B.M. Spiegelman, Skeletal Muscle Fiber-type Switching, Exercise Intolerance, and Myopathy in PGC-1α Muscle-specific Knock-out Animals. Journal of Biological Chemistry, 2007:30014-30021.
62. Lanza, I.R., D.K. Short, K.R. Short, S. Raghavakaimal, R. Basu, M.J. Joyner, J.P. McConnell, and K.S. Nair, Endurance Exercise as a Countermeasure for Aging. Diabetes, 2008:2933-2942.
63. Anderson, R. and T. Prolla, PGC-1α in aging and anti-aging interventions. Biochim Biophys Acta, 2009:1059-1066.
64. Rona-Voros, K. and P. Weydt, The role of PGC-1alpha in the pathogenesis of neurodegenerative disorders. Curr Drug Targets, 2010:1262-1269.
65. Cui, L., H. Jeong, F. Borovecki, C.N. Parkhurst, N. Tanese, and D. Krainc, Transcriptional repression of PGC-1alpha by mutant huntingtin leads to mitochondrial dysfunction and neurodegeneration. Cell, 2006:59-69.
66. Chaturvedi, R.K., P. Adhihetty, S. Shukla, T. Hennessy, N. Calingasan, L. Yang, A. Starkov, M. Kiaei, M. Cannella, J. Sassone, A. Ciammola, F. Squitieri, and M.F. Beal, Impaired PGC-1alpha function in muscle in Huntington's disease. Hum Mol Genet, 2009:3048-3065.
67. Chaturvedi, R.K., N.Y. Calingasan, L. Yang, T. Hennessey, A. Johri, and M.F. Beal, Impairment of PGC-1alpha expression, neuropathology and hepatic steatosis in a transgenic mouse model of Huntington's disease following chronic energy deprivation. Hum Mol Genet, 2010:3190-3205.
68. Johri, A., N.Y. Calingasan, T.M. Hennessey, A. Sharma, L. Yang, E. Wille, A. Chandra, and M.F. Beal, Pharmacologic activation of mitochondrial biogenesis exerts widespread beneficial effects in a transgenic mouse model of Huntington's disease. Hum Mol Genet, 2012:1124-1137.
69. Jin, J., J. Albertz, Z. Guo, Q. Peng, G. Rudow, J.C. Troncoso, C.A. Ross, and W. Duan, Neuroprotective effects of PPAR-γ agonist rosiglitazone in N171-82Q mouse model of Huntington’s disease. Journal of neurochemistry, 2013:410-419.
70. Chiang, M.C., Y. Chern, and R.N. Huang, PPARgamma rescue of the mitochondrial dysfunction in Huntington's disease. Neurobiol Dis, 2012:322-328.
71. Tobina, T., H. Nakashima, S. Mori, M. Abe, H. Kumahara, E. Yoshimura, Y. Nishida, A. Kiyonaga, N. Shono, and H. Tanaka, The Utilization of a Biopsy Needle to Obtain Small Muscle Tissue Specimens to Analyze the Gene and Protein Expression. Journal of Surgical Research, 2009:252-257.
60
72. Buford, T.W., M.B. Cooke, and D.S. Willoughby, Resistance exercise-induced changes of inflammatory gene expression within human skeletal muscle. European Journal of Applied Physiology, 2009:463.
73. Heckmatt, J.Z., A. Moosa, C. Hutson, C.A. Maunder-Sewry, and V. Dubowitz, Diagnostic needle muscle biopsy. A practical and reliable alternative to open biopsy. Arch Dis Child, 1984:528-532.
74. Buck, E., M. Zugel, U. Schumann, T. Merz, A.M. Gumpp, A. Witting, J.M. Steinacker, G.B. Landwehrmeyer, P. Weydt, E. Calzia, and K.S. Lindenberg, High-resolution respirometry of fine-needle muscle biopsies in pre-manifest Huntington's disease expansion mutation carriers shows normal mitochondrial respiratory function. PLoS One, 2017:e0175248.
75. Birgit Friedman-Bette, F.R.S., Holger Eckhardt, Rudolf Billeter, Gabriel Bonaterra, Ralf Kinscherf, Similar changes of gene expression in human skeletal muscle after resistance exercise and multiple fine needle biopsies. Journal of Applied Physiology, 2012:289-295.
76. Jesse, S., H. Bayer, M.C. Alupei, M. Zügel, M. Mulaw, F. Tuorto, S. Malmsheimer, K. Singh, J. Steinacker, U. Schumann, A.C. Ludolph, K. Scharffetter-Kochanek, A. Witting, P. Weydt, and S. Iben, Ribosomal transcription is regulated by PGC-1alpha and disturbed in Huntington’s disease. Sci Rep, 2017.
77. Cubo, E., J. Rivadeneyra, D. Armesto, N. Mariscal, A. Martinez, and R.J. Camara, Relationship between Nutritional Status and the Severity of Huntington's Disease. A Spanish Multicenter Dietary Intake Study. J Huntingtons Dis, 2015:78-85.
78. Wiecek, M., M. Maciejczyk, J. Szymura, and Z. Szygula, Changes in oxidative stress and acid-base balance in men and women following maximal-intensity physical exercise. Physiol Res, 2015:93-102.
79. Wiecek, M., M. Maciejczyk, J. Szymura, and Z. Szygula, Effect of maximal-intensity exercise on systemic nitro-oxidative stress in men and women. Redox Report, 2017:176-182.
80. Esbjornsson, M., C. Sylven, I. Holm, and E. Jansson, Fast twitch fibres may predict anaerobic performance in both females and males. Int J Sports Med, 1993:257-263.
81. Green, H.J., I.G. Fraser, and D.A. Ranney, Male and female differences in enzyme activities of energy metabolism in vastus lateralis muscle. Journal of the Neurological Sciences, 1984:323-331.

61
Acknowledgements
My sincere thanks goes to my doctoral advisor Patrick Weydt, for leaving me the topic
of this dissertation and for always being by my side with advice, motivation and trust.
Also to the entire team of the Department of Sports and Rehabilitation Medicine under
the direction of Professor Jürgen M. Steinacker, which played a huge role in the devel-
opment of the study and the collection of data. I especially want to thank the entire la-
boratory team at Parkstraße, led by Uwe Schuhmann. Especially Martina Zügel, who
was a tremendous help with the laboratory work and helped during the process of writ-
ing the thesis with constant advice and correction. And Jasmine-Leonike Eisenmann
who guided me expertly throughout the entire laboratory time and who both always had
an open ear and a helping hand.
I also want to thank Bruno Schmidt who made so much possible through his generous
support for the EINSTEIN study and the Charcot Foundation.
And of course I also want to thank all the others involved in the Einstein-study, who
made this thesis possible, from the Departments of Neurology and of Sports- and Reha-
bilitation medicine.
Not to forget are the participants of this study, without whom there wouldn't have been
any samples, data or work to begin with, who are the most important and valuable part
of every clinical trial and who graciously sacrificed their time, pain and will to help find
answers to unanswered medical questions.
Another huge thanks goes to my beloved family, for the constant support, the enthusi-
asm, the time, the listening, reading, understanding, tolerating me and my moods and
making it possible for me to work as what I have always dreamed of.
My biggest gratitude, however, goes to the most important person, my Judith.
62
Curriculum Vitae
Name: Frieder Hummes
Year of birth: 1990
Place of birth: Esslingen am Neckar
Clinical Experience
Since April 2018 Intern at St. Marien Krankenhaus Berlin, Department for
Internal Medicine I
Poster presentations
09/2017 90. DGN-Kongress, Leipzig
"The effects of an acute bout of moderate intensity
endurance exercise on LDH-A and LDH-B gene
expression in skeletal muscle of Huntington mutation
carriers and patients"
Medical School
May 2017 Graduation, grade 2
October 2010 - May 2017 Medical Studies at Ulm University
Education
July 2009 Abitur, grade 1,6
2007-2009 Gymnasium Neckartenzlingen
2006-2007 East Aurora High School, NY, USA
2000-2006 Gymnasium Neckartenzlingen
1996-2000 Liebenaugrundschule Neckartailfingen