Embed Size (px)
Citation preview
econstor www.econstor.eu
Der Open-Access-Publikationsserver der ZBW – Leibniz-Informationszentrum WirtschaftThe Open Access Publication Server of the ZBW – Leibniz Information Centre for Economics
Standard-Nutzungsbedingungen:
Die Dokumente auf EconStor dürfen zu eigenen wissenschaftlichenZwecken und zum Privatgebrauch gespeichert und kopiert werden.
Sie dürfen die Dokumente nicht für öffentliche oder kommerzielleZwecke vervielfältigen, öffentlich ausstellen, öffentlich zugänglichmachen, vertreiben oder anderweitig nutzen.
Sofern die Verfasser die Dokumente unter Open-Content-Lizenzen(insbesondere CC-Lizenzen) zur Verfügung gestellt haben sollten,gelten abweichend von diesen Nutzungsbedingungen die in der dortgenannten Lizenz gewährten Nutzungsrechte.
Terms of use:
Documents in EconStor may be saved and copied for yourpersonal and scholarly purposes.
You are not to copy documents for public or commercialpurposes, to exhibit the documents publicly, to make thempublicly available on the internet, or to distribute or otherwiseuse the documents in public.
If the documents have been made available under an OpenContent Licence (especially Creative Commons Licences), youmay exercise further usage rights as specified in the indicatedlicence.
zbw Leibniz-Informationszentrum WirtschaftLeibniz Information Centre for Economics
McKenzie, David J.; Siegel, Melissa
Working Paper
Eliciting Illegal Migration Rates through ListRandomization
IZA Discussion Paper, No. 7401
Provided in Cooperation with:Institute for the Study of Labor (IZA)
Suggested Citation: McKenzie, David J.; Siegel, Melissa (2013) : Eliciting Illegal Migration Ratesthrough List Randomization, IZA Discussion Paper, No. 7401
This Version is available at:http://hdl.handle.net/10419/80654
DI
SC
US
SI
ON
P
AP
ER
S
ER
IE
S
Forschungsinstitut zur Zukunft der ArbeitInstitute for the Study of Labor
Eliciting Illegal Migration Ratesthrough List Randomization
IZA DP No. 7401
May 2013
David McKenzieMelissa Siegel
Eliciting Illegal Migration Rates
through List Randomization
David McKenzie World Bank, BREAD, CEPR,
CREAM and IZA
Melissa Siegel Maastricht Graduate School of Governance
and UNU-MERIT
Discussion Paper No. 7401 May 2013
IZA
P.O. Box 7240 53072 Bonn
Germany
Phone: +49-228-3894-0 Fax: +49-228-3894-180
E-mail: [email protected]
Any opinions expressed here are those of the author(s) and not those of IZA. Research published in this series may include views on policy, but the institute itself takes no institutional policy positions. The IZA research network is committed to the IZA Guiding Principles of Research Integrity. The Institute for the Study of Labor (IZA) in Bonn is a local and virtual international research center and a place of communication between science, politics and business. IZA is an independent nonprofit organization supported by Deutsche Post Foundation. The center is associated with the University of Bonn and offers a stimulating research environment through its international network, workshops and conferences, data service, project support, research visits and doctoral program. IZA engages in (i) original and internationally competitive research in all fields of labor economics, (ii) development of policy concepts, and (iii) dissemination of research results and concepts to the interested public. IZA Discussion Papers often represent preliminary work and are circulated to encourage discussion. Citation of such a paper should account for its provisional character. A revised version may be available directly from the author.
IZA Discussion Paper No. 7401 May 2013
ABSTRACT
Eliciting Illegal Migration Rates through List Randomization* Most migration surveys do not ask about the legal status of migrants due to concerns about the sensitivity of this question. List randomization is a technique that has been used in a number of other social science applications to elicit sensitive information. We trial this technique by adding it to surveys conducted in Ethiopia, Mexico, Morocco and the Philippines. We show how, in principal, this can be used to both give an estimate of the overall rate of illegal migration in the population being surveyed, as well as to determine illegal migration rates for subgroups such as more or less educated households. Our results suggest that there is some useful information in this method: we find higher rates of illegal migration in countries where illegal migration is thought to be more prevalent and households who say they have a migrant are more likely to report having an illegal migrant. Nevertheless, some of our other findings also suggest some possible inconsistencies or noise in the conclusions obtained using this method, so we suggest directions for future attempts to implement this approach in migration surveys. JEL Classification: F22, C83, J61, K42 Keywords: illegal migration, list randomization, item count method, survey techniques Corresponding author: David McKenzie The World Bank 1818 H Street N.W. Washington, DC 20433 USA E-mail: [email protected]
* We thank Emily Beam, Miriam Bruhn, Gabriel Lara, and Dean Yang for their collaboration on the related surveys that we added these questions to; the World Bank’s Research Support Budget for funding the Philippines survey; the Russian Trust Fund for Financial Literacy for funding the Mexico survey; the Dutch Ministry of Foreign Affairs for funding the Ethiopian and Moroccan surveys; the field teams in each country for their excellent work in conducting these surveys; and Matthew Groh for valuable research assistance. All opinions expressed in the paper are those of the authors alone and do not necessarily reflect those of their respective institutions.
2
1. Introduction
“Responding effectively to irregular migration is hampered by a serious lack of verifiably accurate data,
making it difficult to identify trends or compare the scale of the phenomenon in different parts of the
world” IOM (2010, p. 31)
Illegal or irregular migration is a topic of policy interest in much of the world.1 Globally it is estimated
that between 10 and 15 percent of the World’s migrant population, or 20 to 30 million people, are
individuals without the appropriate documentation (IOM, 2010). In the United States, it is estimated
that 11.2 million people, or 28 percent of all foreign-born (Passel and Cohn, 2011) and 56 percent of all
Mexican immigrants (Hanson, 2006) are illegal, while in the European Union estimates range from 7 to
13 percent of the immigrant population (Clandestino, 2009).
However, since illegal migration is by definition migration that occurs without the proper
documentation, measuring the extent of it is difficult and the above estimates involve considerable
uncertainty. Several approaches are typically used to estimate these stocks. The “residual method” used
in the United States involves comparing numbers of individuals recorded as foreign-born in surveys to
numbers on official admissions files (Passel and Cohn, 2011). Other estimates come from border
apprehension data, re-inspections of travelers, and regularization or amnesty program applications
(Morrel-Samuels 2002; IOM, 2010). However, such data are often not available for all countries, and in
most cases provide, at best, an estimate of the overall incidence of illegal migration without any
socioeconomic or demographic information about these migrants.
An alternative is to try and directly measure illegal migration through survey approaches (Massey and
Capoferro, 2007). There are two key challenges here. The first is getting a representative sample of
illegal migrants when no sampling frame is available. In countries with high emigration or immigration a
random sample of dwellings might be sufficient. However, in many destination countries where a
random sample is not possible, approaches like intercept point sampling may instead need to be used
(Clandestino, 2009). The second challenge is eliciting information about an illegal act. This raises
questions of both research ethics (Duvell et al, 2008) as well as whether one can obtain truthful
responses to questions about this sensitive issue. As a result of these issues, while there are a few
1 The terms “illegal immigration”, “irregular migration”, “unauthorized migration”, and “undocumented migration”
are often used to describe much of the same phenomena. In some cases it is possible for individuals to be without documents but not technically illegal, but since this is rare, for simplicity we will use the term illegal migration in our paper.
3
exceptions (e.g. the Mexican Migration Project), most surveys of migrants (especially in destination
countries) do not ask about their legal status.
Of course illegal migration is far from the only sensitive behavior of interest to social scientists, and a
variety of methods have been developed to help obtain more reliable data on the incidences of these
behaviors. One of the more widely used and simple to apply methods is that of list randomization.
Under this method, a sample is randomly divided into two groups. The first group is given a list of n
statements (often n=3) and asked to say how many of the three statements they agree with. The second
group is given a list of n+1 statements, consisting of the same n statements as the first group, plus an
additional statement which is about the behavior of interest. Since respondents only need reveal the
number of statements they agree with, and not which ones, this can yield more truthful responses. The
difference in the mean number of responses between the two groups then gives an estimate of the
incidence of the behavior of interest.
Our purpose in this paper is to explore the use of list randomization as a means of measuring both the
incidence of illegal migration, as well as the characteristics of illegal migrants. This is the first paper of its
kind to use this method in a migration setting. We do this by adding a list randomization question to
surveys being undertaken in four countries: Ethiopia, Mexico, Morocco and the Philippines. We illustrate
how the incidence of illegal migration can be obtained via this method, how one can then obtain
estimates by socio-demographic characteristic, and in the case of Ethiopia and Morocco, compare direct
elicitation to this indirect method. Our results show both some promise, but also limitations, of this
approach. They enable us to get estimates of the incidence of illegal migration which are broadly
consistent with prior knowledge of relative differences in the share of migration which is legal across our
four countries, and which are not too different from the direct measures for the two countries where
this was not considered too sensitive a question to ask directly. However, we also show that confidence
intervals can be wide unless samples are large, and there are some areas where future efforts could add
additional tests.
The remainder of the paper is as follows: Section 2 briefly summarizes existing literature on list
randomization; Section 3 describes the list randomization question used in our study and the four
surveys in which it was added; Section 4 gives our main results, and Section 5 provides discussion and
conclusions.
4
2. List Randomization
List randomization (also referred to as list experiments, the item-count technique, and the unmatched
count technique) was introduced by Miller (1984) as a way of eliciting information about sensitive
behaviors (in her case, illegal drug use). It has been used in a number of papers in sociology, political
science, and psychology to measure incidences of sensitive behaviors as well as attitudes that might
otherwise be misreported because of social desirability pressures.
The use of this method typically leads to higher reports of sensitive behaviors than is obtained through
direct questioning. For example, LaBrie and Earleywine (2000) find college students to have higher
incidences of having had sex without a condom, and having had sex without a condom after drinking via
the list randomization method than in an anonymous self‐report survey; Gonzalez-Ocantos et al. (2012)
use it to find higher incidences of people reporting they had been promised a gift or service in exchange
for their vote in elections in Nicaragua; Tsuchiya et al. (2007) find a higher proportion of shop-lifters
than by direct questioning; and Wimbush and Dalton (1997) find higher incidences of reports of
employees engaging in theft. This technique has seldom been used in economics, but a recent exception
is Karlan and Zinman (2012) who find microfinance clients to be more likely to report spending their
loans on things other than business uses when asked via list randomization than through direct
response. In contrast, actions and behaviors which have not had social stigma or illegality associated
with them have resulted in similar estimates via list randomization as from direct elicitation. Examples
include asking college students whether they have gotten drunk (LaBrie and Earleywine, 2000) and
asking about giving blood (Tsuchiya et al, 2007).
As well as behaviors, the method has been used in a number of contexts to elicit attitudes, such as racial
prejudice (Blair and Imai, 2012) and attitudes towards safety after civil conflict (Jayasuriya and Gibson,
2013). The one migration-related study we are aware of which uses this technique follows in this line of
using the method to elicit attitudes. Janus (2010) uses the method to gauge support for more restrictive
immigration policies in the U.S., and finds more support for cutting off immigration when asked via list
randomization than when asked directly, particularly among more educated individuals and self-
identified political liberals.
5
3. Implementing list randomization for measuring illegal migration
3.1 The List Randomization Question
We randomly allocate individuals into two groups. Group A is asked “can you tell me how many of the
following four statements you regard as true”:
1. At least one member of my household plans on opening a new business in the next five years
2. The economic situation of my household has improved considerably over the past five years
3. Corruption in my country is a less serious problem than ten years ago
4. This household has at least a member currently residing abroad without a legal residence permit
Group B is asked how many of the following three statements they regard as true:
1. At least one member of my household plans on opening a new business in the next five years
2. The economic situation of my household has improved considerably over the past five years
3. Corruption in my country is a less serious problem than ten years ago
Subtracting the mean number of true statements reported by group B from the mean number of true
statements reported by group A then gives the proportion of the sample which has a member residing
abroad without the proper documentation.
Several factors enter into the decision of which three questions to make common to the two groups. We
choose questions that we thought i) would be a natural fit in either a typical economic survey or would
not seem too unusual in the context of a specialty migration survey; ii) would be considered relatively
innocuous by most respondents, but not so bland that the illegal migration question would stick out as
very different in sensitivity; iii) could be seen by respondents as not easily inferable by the researchers
(since if we knew the true answers for the household for each of 1 through 3, then we would be able to
infer individual responses for question 4 in group A); and iv) that we thought that people would think it
was plausible that many people would answer that at least one question was true, but that few people
would be likely to regard all three statements as true.
6
3.2 Surveys
In order to trial this methodology, we took advantage of surveys in four countries that were being taken
for other purposes and added this list randomization question. The surveys in Ethiopia and Morocco
were surveys on Migration and Development conducted by Maastricht Graduate School of Governance,
and oversampled households with migrants. The Philippines survey was conducted by the World Bank,
Innovations for Poverty Action and the University of Michigan as a baseline survey for an experiment
intended to help lower barriers to international migration. The Mexican survey was conducted by the
World Bank and Innovations for Poverty Action as a follow-up survey for a financial literacy experiment.
We describe the population of interest in each study.
The Ethiopian sample was a study explicitly designed to study migration and so over-sampled areas with
high concentrations of migrants. Sampling was based on a two stage purposive sampling technique. The
five regions of Amhara, Oromia, SNNP, Tigray, and Addis Ababa were chosen, and within each region,
three Woredas were selected for enumeration: one urban Woreda and two rural Woredas. The
Woredas were selected to represent a city within the region (urban area), a rural area Woreda close to
an international border area, and a rural area farther from the border. The final criteria for selection
were Woredas that were known to have migration. Within each Woreda, the Kebeles selected for the
initial household listing were selected based on accessibility. After listing, the survey randomly chose
households to survey, oversampling households with current or return migrants (Kuschminder, 2012).
Surveying took place between February and April 2011. The resulting sample consists of 1251
households given the list randomization question.
The Morocco survey took place in four regions of Morocco between November 2011 and February 2012.
Four areas in Morocco were selected for their representation of key migration characteristics. These
were: the Tadla, the Tingitane Peninsula, the Atlantic Axis consisting of the agglomeration of Casablanca,
Rabat and Kénitra, and the Rif Central. Smaller geographic units within these areas from which to
sample households were then chosen through purposive sampling, and within these areas, the
interviewed households were selected through a “random walk”. The departure point - usually a well-
known reference point like a school or a mosque - of the random walk was chosen with the help of a
community representative. Interviewers followed a predetermined route. Depending on the density of
buildings, either each 5th household or, in less populated areas, each 3rd household was interviewed. The
7
resulting sample consists of 1485 households given the list randomization question. Survey enumerators
alternated to include the fourth list question on every second survey.
The Mexican survey took place in Mexico City. A convenience sample was first obtained between April
and June 2011 by intercepting individuals in five branches of a major Mexican bank, as well as on the
streets in public plazas and busy avenues in seven parts of Mexico City. These individuals were then
used in an experiment to test the impact of a financial literacy workshop run by this Mexican bank
(Bruhn et al, 2013). The follow-up survey for this intervention was conducted between February and
June 2012. Randomization was done conditional on agreeing to participate in the follow-up survey, as
was done via a computer draw which determined which version of the question an interviewer should
ask. In total 1,044 individuals were given the list randomization module in this paper.2
The Philippines survey took place between March and August 2010 in Sorsogon Province. Sorsogon is a
relatively isolated and rural province, located approximately 12 hours by bus from Manila. International
migration rates are lower than the Philippines average as a result of this isolation, and so this location
was chosen for an experiment designed to test several interventions aimed at lowering barriers to
international migration (Beam et al, 2013). The sample was obtained by first selecting municipalities
within this province, then randomly selecting baranguays (local administrative areas) and conducting a
door-to-door listing of households in these areas. As such, the survey is representative of this part of the
Philippines. These list randomization questions were added to the survey partway during the baseline,
and were able to be asked of 2983 individuals. Randomization was done by a computer draw which
determined which version of the question an interviewer should ask each interviewee.
4. Results
4.1 Sample Characteristics and Verification of Randomization
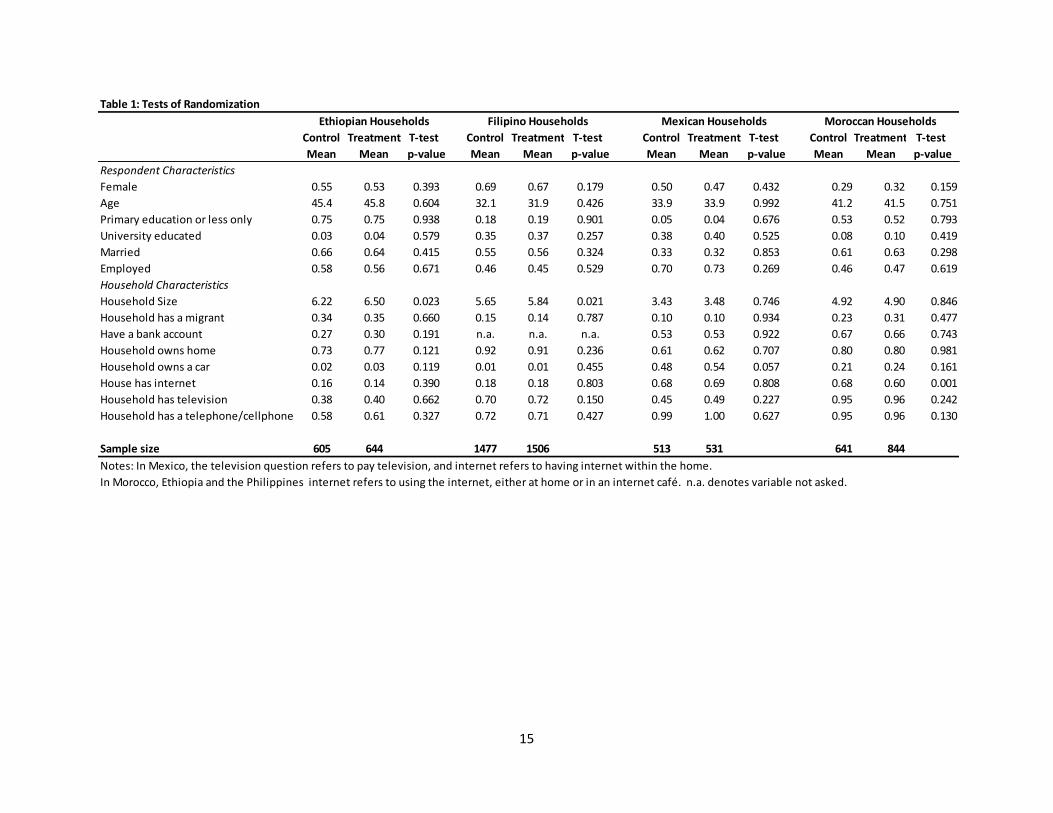
Table 1 provides sample means for the treatment (group A) and control (group B) in each of the four
countries for a set of variables that are common to all four surveys. We see the different settings enable
us to trial this methodology across a range of demographic settings.
The Ethiopian sample is the least educated and poorest, with 75 percent of respondents having primary
education or lower, only 2 percent of households owning a car, and only 39 percent having a television.
2 An additional group of respondents were randomized into a Group C, which had the same first three questions as
groups A and B, and then a fourth question asking about debt stress. We do not use this group in this paper.
8
The oversampling of migrants is reflected in 35 percent of the sample reporting that they have a
household member abroad, compared to a national average of only 0.7 percent of the population being
emigrants (World Bank, 2011). The Moroccan sample is more heavily dominated by males (the main
respondent was chosen as the person who has most control over household finances), still has half the
sample with primary education or lower, and has 22 percent owning a car, but almost universal
television and telephone ownership. Oversampling of migrants has 28 percent of the sample reporting
they have a migrant, compared to a national average of 9.3 percent of the population being emigrants
(World Bank, 2011)
The Mexican sample has relatively young and the most educated respondents, with an average age of
34 and 39 percent having university education. They are richer than the Ethiopian and Moroccan
samples, with 52 percent owning a car and 68 percent having internet access at home. Ten percent
report that they live in a household with a migrant abroad, which is similar to the national average of
10.7 percent of the population being emigrants (World Bank, 2011). The Philippines sample has an
average age of 32, and is the most likely to be female (68 percent). In this part of the Philippines car
ownership is rare (1 percent), although many households use motorcycles. Fourteen percent have an
intermediate family member who is a current migrant, which is higher than the national average of 4.6
percent of the population being emigrants (World Bank, 2011).3
Comparing the means for treatment and control groups, we see that randomization has largely
succeeded in achieving balance on observable characteristics of respondents and their households. The
only significant differences are in household size among the Ethiopian and Filipino samples, and in
internet usage among the Moroccan sample. Given that we are testing 56 different treatment-control
differences in this table, this number of significant differences is no more than we would expect by
chance. As a result we can consider Group A and Group B as being comparable in each country’s case, so
that any differences in responses to the list randomization question should reflect the impact of adding
the illegal migration question to Group A’s set.
3 There are two important reasons why the rate is greater than the national average for the Filipino sample. First,
the World Bank data is based on destination country census reports of where individuals live, which can miss a lot of the temporary migration from the Philippines. Second, our definition of migrant for this sample includes both a direct household member being a migrant as well as an immediate family member.
9
4.2 Measuring Illegal Migration
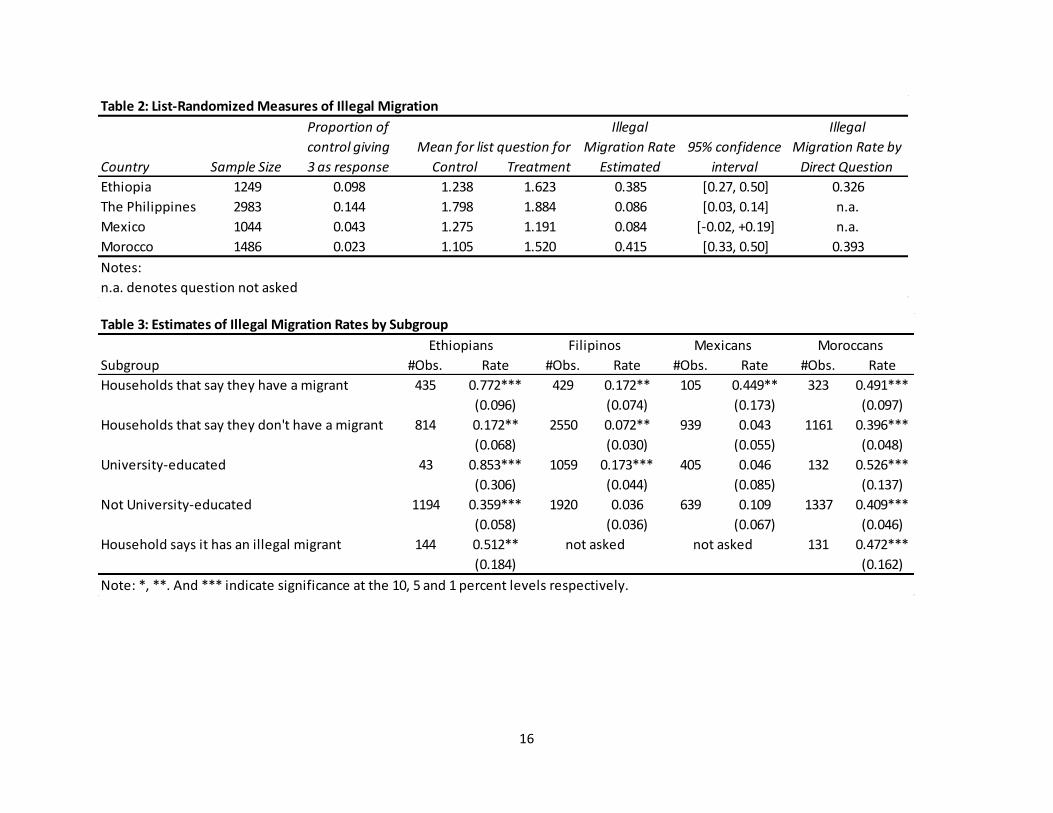
Table 2 reports the results of the list randomization exercise. The first column reports sample size, and
the second uses the control group to check what proportion of respondents answer “3” to the list
randomization question, reflecting that they think all three statements in the list are true. We would be
concerned if this proportion was high, since then respondents with illegal migrants would be in the
position of having to answer “4” if they were in the treatment group, thereby revealing their illegal
migrant status. Reassuringly we see that the proportion answering “3” in the control group is low, being
0.14 for the Philippines, less than 0.10 for Ethiopia, and less than 0.05 for Mexico and Morocco.
The next three columns then report the mean number of true statements reported in the control group,
in the treatment group, and the difference. The difference is our list randomization estimate of the
incidence of illegal migration. We estimate that 8.4 percent of the households in the Mexican sample
have an illegal migrant abroad, as does 8.6 percent of the Philippines sample, 38.5 percent of the
Ethiopian sample, and 41.5 percent of the Moroccan sample.
In addition to this point estimate, we can also use the confidence interval for the difference in means to
provide a 95 confidence for the incidence of illegal migration. Despite sample sizes of over 1000
households in each case, these confidence intervals are reasonably wide, typically covering 20
percentage points (11 percentage points in the larger Filipino sample). This is one downside of this
indirect elicitation approach – if we asked 1000 individuals a direct question the 95 confidence interval
for the proportion would have width at most 6 percent.
Despite the reluctance to ask about illegal migration status in surveys taken at destination, it is possible
that reliable answers might be obtained by directly asking sending households in migrant source
countries, particularly in cases where illegal migration is commonplace (and hence carries no stigma)
and where no contact information for the migrant is collected (limiting the potential for this information
to harm the migrant). During a different part of the survey to the list randomization questions, the
Moroccan and Ethiopian surveys asked households who reported having a migrant abroad what type of
documentation the person had acquired before entering the destination country, with possible options
including work visa, student visa, refugee visa, tourist visa, no documents, or other. We code migrants
who enter with no documentation or on a tourist visa as illegal migrants, and report the illegal migration
rates as obtained via this direct elicitation in the last column of Table 2. The directly reported rates are
39.3 percent for Morocco and 32.6 percent for Ethiopia, which are reasonably close to (and well within
10
the confidence intervals of) our list randomization estimates. This suggests that list randomization is
giving us reasonably accurate estimates.
4.3 Measuring Illegal Migration Rates for Subgroups
In addition to knowing the overall (unconditional) incidence of illegal migration, researchers and
policymakers will often be interested in knowing more about the characteristics of which types of
households are more likely to have illegal migrants. This can be done by simply comparing treatment
and control means within subgroups defined by the characteristics of interest. Ideally one would stratify
the randomization on these characteristics, but even without this stratification, randomization should
still on average ensure balance within subgroups provided sample sizes are not too small.
Table 3 illustrates this through considering several subgroups of interest. The first group consists of
households that report that they have a migrant abroad. We are then interested in knowing the
conditional rate of illegal migration – i.e. what proportion of migrant households have an illegal
migrant? The first row of Table 3 shows that we estimate that 17 percent of the Filipino migrant
households, 45 percent of the Mexican migrant households, 49 percent of the Moroccan migrant
households, and 77 percent of the Ethiopian migrant households have illegal migrants.
This ranking is reasonably consistent with other evidence on illegality. Hanson (2006) reports estimates
that 56 percent of the Mexican population in the U.S. is illegal, with this rate likely slightly lower for
individuals from urban areas as in our study. Opiniano (2007) reports official estimates that 10.6 percent
of the Philippines migrant population is irregular. We are unaware of numerical estimates of the
proportions of Ethiopian and Moroccan migrants that are illegal, but the reports that are available do
suggest that more of the migrants from Ethiopia are illegal than legal (Kebede, n.d.), while illegal
migration is also prevalent from Morocco (Ennaji, n.d.).
A second question of interest is whether there are households who have an illegal migrant that say they
do not have a migrant when asked directly. The second row of Table 3 suggests this is not the case in
Mexico, but occurs for 7 percent of non-migrant households in the Philippines, 17 percent of the
Ethiopian non-migrant households, and 40 percent of the Moroccan non-migrant households might
actually have illegal migrants.
The third and fourth rows illustrate how one can look by characteristic, in this case university education.
Sample sizes get small in some countries where education levels are low. The rates reported reflect the
11
combination in differences in the likelihood of having a migrant at all by education status, as well as
differences in the illegality of that migration. We see that in Ethiopia, Morocco, and the Philippines that
more educated households are no less likely (and in fact more likely) to have illegal migrants, whereas in
Mexico the less educated households are the ones more likely to have illegal migrants. This may reflect
the limited opportunities for Ethiopians and Moroccans to engage in legal forms of international
migration regardless of their education level.
Finally, the last row looks at the list randomization estimate of illegal migration for households which
answer a direct question that they have a member who went abroad with no documentation or only a
tourist visa. We would expect to find an estimated rate close to one for this group, but only get rates of
around 50%, with the 95 confidence intervals going up to 79 percent for Morocco and 88 percent for
Ethiopia. While one can think of reasons for this discrepancy (for example, migrants may have entered
without documents but have subsequently obtained them), this row does suggest there is likely some
noise amongst the signal provided by this list randomization question.
5. Conclusions and Discussion
By adding questions to surveys conducted in four countries, we were able to trial the use of list
randomization as a means of eliciting illegal migration rates. We find a variety of evidence that taken
together suggest that the method is providing useful information. In particular, we find higher rates of
illegal migration in surveys which were designed to oversample migrants; that households who report
having a migrant are also more likely to have an illegal migrant; that the rankings of illegal migration
rates conditional on migration are consistent with other estimates of illegal migration; and that in two
countries where it was not considered too sensitive to also ask directly about illegal migration we obtain
rates which are reasonably close to our list randomized estimates.
Nevertheless, there are several limitations of this approach. A first limitation is that the confidence
intervals for estimates using this method are much larger than those obtained when asking migrants
directly, so in situations where illegal migration is widespread and not considered sensitive, it may be
better to just ask directly. Secondly, the accuracy of the method relies on individuals understanding that
the question protects their privacy and in answering the question accurately. If individuals who do not
understand the question just give a random answer between 0 and the number of statements, this will
inflate the estimate of the illegal migration rate. Adding a third treatment group which is given the same
three statements as the control plus a fourth statement that it is expected that almost zero will respond
12
yes to (e.g. “a member of my family is a millionaire”) would be a good way to test for such an effect, and
enable an adjustment to be made for any such noise effect.
In practice, asking about illegal migration status is likely to be a far more sensitive issue when asked of
the migrants themselves in migration destinations than when asking sending households in the home
countries. Human subjects review boards are reluctant to authorize researchers from asking about
documentation status for fear of this entailing an undue risk on the migrant, and all the major surveys of
migrants in destination countries which we are aware of do not ask documentation status. The results in
this paper, therefore, suggest that a list randomization approach may be a useful alternative in such
cases, and it would be a valuable avenue for future research to explore the performance of this
approach in destination country surveys.
References
Beam, Emily, David McKenzie and Dean Yang (2013) “Why don’t more people leave the Philippines?
Experimental evidence on barriers to overseas migration”, Mimeo. World Bank.
Blair, Graeme and Kosuke Imai (2012) “Statistical Analysis of List Experiments”, Political Analysis 20: 47-
77.
Bruhn, Miriam, Gabriel Lara and David McKenzie (2013) “Why is voluntary financial education so
unpopular? Experimental evidence from Mexico”, Mimeo. World Bank.
Clandestino (2009) “Size and development of irregular migration to the EU Clandestino Research
Project: Comparative Policy Brief – Size or Irregular Migration”, Clandestino http://irregular-
migration.net//fileadmin/irregular-
migration/dateien/4.Background_Information/4.2.Policy_Briefs_EN/ComparativePolicyBrief_SizeOfIrreg
ularMigration_Clandestino_Nov09_2.pdf [accessed January 24, 2013].
Duvell, Franck, Anna Triandafyllidou and Bastian Vollmer (2008) “Ethical issues in irregular migration
research”, Clandestino Working Paper http://irregular-
migration.net//typo3_upload/groups/31/4.Background_Information/4.1.Methodology/EthicalIssuesIrre
gularMigration_Clandestino_Report_Nov09.pdf [accessed January 24, 2013].
Ennaji, Moha (n.d.) Illegal Migration from Morocco to Europe Accessed on 29/1/13 at:
http://doc.abhatoo.net.ma/doc/img/pdf/illegal_migration.pdf [accessed January 31, 2013].
Gonzalez-Ocantos, Ezequiel, Chad Kiewiet de Jonge, Carlos Meléndez, Javier Osorio and David Nickerson
(2012) “Vote buying and social desirability bias: Experimental evidence from Nicaragua”, American
Journal of Political Science 56(1): 202-17.
13
Hanson, Gordon (2006) “Illegal Migration from Mexico to the United States”, Journal of Economic
Literature 44(4): 869-924.
International Organization for Migration (IOM) (2010) World Migration Report 2010: The Future of
Migration – building capacities for change. IOM, Geneva.
Janus, Alexander (2010) “The influence of social desirability pressures on expressed immigration
attitudes”, Social Science Quarterly 91(4): 928-46.
Jayasuriya, Dinuk and John Gibson (2013) “Elephants or Tigers? What scares people in post-conflict Sri
Lanka”, Mimeo. University of Waikato.
Karlan, Dean and Jonathan Zinman (2012) “List randomization for sensitive behavior: An application for
measuring use of loan proceeds”, Journal of Development Economics 98(1): 71-75.
Kebede, Emebet (n.d.) Ethiopia: An Assessment of the International Labour Migration Situation: The
case of female labour migrants, ILO Working Paper, Accessed on 29/1/13 at
http://www.oit.org/wcmsp5/groups/public/---ed_emp/documents/publication/wcms_117931.pdf
[accessed January 31, 2013]
Kuschminder, Katie (2012) “Fieldwork Report Ethiopia: Methodology and Sampling”, Migration and
Development : A World in Motion report, Maastricht School of Governance.
LaBrie, Joseph and Mitchell Earleywine (2000) “Sexual Risk Behaviors and Alcohol: Higher Base Rates
Revealed Using the Unmatched-Count Technique.” Journal of Sex Research 37:321–6.
Massey, Douglas and Chiara Capoferro (2007) “Measuring undocumented migration”, pp. 257-84 in
Alejandro Portes and Josh deWind (eds.) Rethinking Migration: New theoretical and empirical
perspectives. Berghahn Books: New York, NY.
Miller, Judith (1984), “A New Survey Technique for Studying Deviant Behavior,” Ph.D. thesis, The George
Washington University
Morrel-Samuels, Palmer (2002) “Measuring illegal immigration at U.S. border stations by sampling from
a flow of 500 million travelers”, Population and Environment 23(3): 285-302.
Opiniano, Jeremaiah (2007) “Statistics on Filipinos’ International Migration: Issues and Steps Towards
Harmonizing the Data”, Paper presented at the 10th National Conference on Statistics, October 1-2,
http://www.nscb.gov.ph/ncs/10thNCS/papers/contributed%20papers/cps-03/cps03-04.pdf [accessed
24 January, 2013].
Passel, Jeffrey and D’Vera Cohn (2011) “Unauthorized Immigrant Population: National and State Trends,
2010”, Pew Research Center http://www.pewhispanic.org/2011/02/01/unauthorized-immigrant-
population-brnational-and-state-trends-2010/ [accessed 24 January 2013].

14
Tsuchiya, Takahiro, Yoko Hirai, and Shigeru Ono (2007) “A study of the properties of the item count
technique” Public Opinion Quarterly, 71: 253–272
Wimbush, James and Dan Dalton (1997) Base rate for employee theft: Convergence of multiple
methods” Journal of Applied Psychology, 82(5): 756-763
World Bank (2011) Migration and Remittances Factbook 2011. World Bank, Washington, D.C.
15
Table 1: Tests of Randomization
Control Treatment T-test Control Treatment T-test Control Treatment T-test Control Treatment T-test
Mean Mean p-value Mean Mean p-value Mean Mean p-value Mean Mean p-value
Respondent Characteristics
Female 0.55 0.53 0.393 0.69 0.67 0.179 0.50 0.47 0.432 0.29 0.32 0.159
Age 45.4 45.8 0.604 32.1 31.9 0.426 33.9 33.9 0.992 41.2 41.5 0.751
Primary education or less only 0.75 0.75 0.938 0.18 0.19 0.901 0.05 0.04 0.676 0.53 0.52 0.793
University educated 0.03 0.04 0.579 0.35 0.37 0.257 0.38 0.40 0.525 0.08 0.10 0.419
Married 0.66 0.64 0.415 0.55 0.56 0.324 0.33 0.32 0.853 0.61 0.63 0.298
Employed 0.58 0.56 0.671 0.46 0.45 0.529 0.70 0.73 0.269 0.46 0.47 0.619
Household Characteristics
Household Size 6.22 6.50 0.023 5.65 5.84 0.021 3.43 3.48 0.746 4.92 4.90 0.846
Household has a migrant 0.34 0.35 0.660 0.15 0.14 0.787 0.10 0.10 0.934 0.23 0.31 0.477
Have a bank account 0.27 0.30 0.191 n.a. n.a. n.a. 0.53 0.53 0.922 0.67 0.66 0.743
Household owns home 0.73 0.77 0.121 0.92 0.91 0.236 0.61 0.62 0.707 0.80 0.80 0.981
Household owns a car 0.02 0.03 0.119 0.01 0.01 0.455 0.48 0.54 0.057 0.21 0.24 0.161
House has internet 0.16 0.14 0.390 0.18 0.18 0.803 0.68 0.69 0.808 0.68 0.60 0.001
Household has television 0.38 0.40 0.662 0.70 0.72 0.150 0.45 0.49 0.227 0.95 0.96 0.242
Household has a telephone/cellphone 0.58 0.61 0.327 0.72 0.71 0.427 0.99 1.00 0.627 0.95 0.96 0.130
Sample size 605 644 1477 1506 513 531 641 844
Notes: In Mexico, the television question refers to pay television, and internet refers to having internet within the home.
In Morocco, Ethiopia and the Philippines internet refers to using the internet, either at home or in an internet café. n.a. denotes variable not asked.
Mexican Households Moroccan HouseholdsEthiopian Households Filipino Households
16
Table 2: List-Randomized Measures of Illegal Migration
Proportion of Illegal Illegal
control giving Migration Rate 95% confidence Migration Rate by
Country Sample Size 3 as response Control Treatment Estimated interval Direct Question
Ethiopia 1249 0.098 1.238 1.623 0.385 [0.27, 0.50] 0.326
The Philippines 2983 0.144 1.798 1.884 0.086 [0.03, 0.14] n.a.
Mexico 1044 0.043 1.275 1.191 0.084 [-0.02, +0.19] n.a.
Morocco 1486 0.023 1.105 1.520 0.415 [0.33, 0.50] 0.393
Notes:
n.a. denotes question not asked
Mean for list question for
Table 3: Estimates of Illegal Migration Rates by Subgroup
Subgroup #Obs. Rate #Obs. Rate #Obs. Rate #Obs. Rate
Households that say they have a migrant 435 0.772*** 429 0.172** 105 0.449** 323 0.491***
(0.096) (0.074) (0.173) (0.097)
Households that say they don't have a migrant 814 0.172** 2550 0.072** 939 0.043 1161 0.396***
(0.068) (0.030) (0.055) (0.048)
University-educated 43 0.853*** 1059 0.173*** 405 0.046 132 0.526***
(0.306) (0.044) (0.085) (0.137)
Not University-educated 1194 0.359*** 1920 0.036 639 0.109 1337 0.409***
(0.058) (0.036) (0.067) (0.046)
Household says it has an illegal migrant 144 0.512** 131 0.472***
(0.184) (0.162)
Note: *, **. And *** indicate significance at the 10, 5 and 1 percent levels respectively.
Ethiopians Filipinos Mexicans Moroccans
not askednot asked