Embed Size (px)
Citation preview
TECHNISCHE UNIVERSITÄT MÜNCHEN
MAX-PLANCK-INSTITUT FÜR BIOCHEMIE
Methionine Oxidation in Human Prion Protein –
Design of Anti- and Pro-Aggregation Variants
Christina Wolschner
Vollständiger Abdruck der von der Fakultät für Chemie der Technischen Universität
München zur Erlangung des akademischen Grades eines Doktors der
Naturwissenschaften genehmigten Dissertation.
Vorsitzender: Univ.-Prof. Dr. Michael Groll
Prüfer der Dissertation: 1. Priv.-Doz. Dr. Nediljko Budisa
2. Univ.-Prof. Dr. Christian F.W. Becker
Die Dissertation wurde am 8. April. 2009 bei der Technischen Universität München
eingereicht und durch die Fakultät für Chemie am 14. Mai. 2009 angenommen.
Parts of this work were published as listed below:
Wolschner C, Giese A, Kretzschmar H, Huber R, Moroder L, and Budisa N (2009)
Design of anti- and pro-aggregation variants to assess the effects of methionine
oxidation in human prion protein. Proc Natl Acad Sci USA 16:7756-7761.
Abstract presentations:
Department Retreat, Bacterial Expression of Hyperstable Collagen by an Expanded
Genetic Code, October 26-29, 2006, Linz, Austria
6. Graduate Retreat, Generation of a Semisynthetic Prion Protein, June 26-28, 2006,
Ringberg Castle, Ringberg, Germany
Poster presentations:
Wolschner C and Budisa N, ForPrion Symposium and Award Ceremony,
Mai 22, 2007, Munich, Germany
Wiltschi B, Wenger W, Merkel L, Cheburkin Y, Wolschner C, Lepthien S, and
Budisa N, BMBF BioFuture Meeting – 5. Presentation, February 02-03, 2006,
Berlin, Germany
Danksagung
An dieser Stelle möchte ich mich bei allen bedanken, die zum Gelingen dieser
Arbeit beigetragen haben.
Zuallererst möchte ich mich bei meinem Betreuer PD Dr. Nediljko Budisa
bedanken. Er ermöglichte mir nicht nur meine Arbeit in einer jungen und
dynamischen Forschungsgruppe durchzuführen, sondern auch das Arbeiten an
diesem interessanten Projekt. Seine Kreativität und sein Enthusiasmus für die
wissenschaftliche Forschung, sowie die wertvollen Ratschlägen waren
ausschlaggebend für das Gelingen meiner Arbeit. Außerdem möchte ich mich für das
kollegiale Arbeitsverhältnis und die Möglichkeit, jederzeit seine Unterstützung zu
erhalten, bedanken.
Für die Übernahme des Korreferats bedanke ich mich bei Herrn Prof. Dr. Christian
F.W. Becker.
Ganz besonders möchte ich mich bei Herrn Prof. Dr. Luis Moroder bedanken, der
durch seinen umfassenden Rat bei chemischen und biophysikalischen
Fragestellungen aber auch durch seine konstruktive Kritik, diese Arbeit sehr
beeinflusste. In diesem Zusammenhang gilt mein ganz besonderer Dank Frau
Elisabeth Weyher-Stingl. Ihr unübertroffener Erfahrungsschatz auf dem Gebiet der
Spektrometrie und Spektroskopie, den sie mit Geduld und Freude weitergibt, war
essentiell für das Gelingen meiner Arbeit. Außerdem möchte ich mich ganz herzlich
für die unzähligen Arbeitsstunden, die ich ihr bescherte, bedanken und, dass sie
trotzdem jederzeit für mich und meine Fragen Zeit hatte.
Bei Herrn Dr. Stephan Uebel und den anderen Mitgliedern der Core-Facility
möchte ich mich für ihren unermüdlichen Einsatz in der Protein- und
Aminosäureanalytik bedanken.
Herrn Prof. Dr. Armin Giese möchte ich für die gute Unterstützung und die
Möglichkeit, meine Arbeiten im S2 Labor am Zentrum für Neuropathologie und
Prionforschung durchführen zu können, danken.
Herrn Prof. Dr. Dieter Oesterhelt sowie Herrn Prof. Dr. Dr h. c. Hans Kretzschmar
danke ich für die Möglichkeit, in ihren Abteilungen arbeiten und die hervorragende
Infrastruktur nutzen zu können.
Herrn Prof. Dr. Robert Huber möchte ich für die Unterstützung im Bezug auf meine
Veröffentlichung recht herzlich danken.
Meinen liebsten Kollegen ‘den Budisas’ danke ich für ihre Unterstützung und die
tolle Zusammenarbeit im Labor, aber vor allem für die wundervolle Zeit!
Im Besonderen möchte ich Frau Waltraud Wenger danken, die durch ihre
jahrelange Erfahrung im Labor immer eine große Hilfe war. Herrn Dr. Lars Merkel
und Herrn Michael Hösl möchte ich für die gute Kameradschaft und tolle
Zusammenarbeit danken. Frau Dr. Birgit Wiltschi danke ich für ihren kritischen Blick
bei den Korrekturlesungen meiner Arbeit, und die Möglichkeit meine Arbeit in dieser
Gruppe durchführen zu können.
An dieser Stelle möchte ich mich ganz besonders bei Frau Dr. Sandra Lepthien
bedanken. Zuerst möchte ich ihr für ihre Mühe beim Korrekturlesen meiner Arbeit
danken. Jedoch ganz besonders danke ich ihr für ihre Freundschaft, innerhalb aber
auch außerhalb der Arbeitszeit, durch die mir meine Zeit hier immer in Erinnerung
bleiben wird!
Zum Schluss möchte ich noch den wichtigsten Menschen in meinem Leben
danken, meinen Eltern, meinen Geschwistern und meinem Freund Andreas. Vor
allem möchte ich aber meinen Eltern und Andreas für ihre großartige Unterstützung
und Liebe danken und, dass sie bei all meinen Entscheidungen immer hinter mir
stehen.
Table of contents
I Nomenclature and Definitions ................................................................. I
I.I Nomenclature ...................................................................................... I
I.II Definitions .......................................................................................... V
1 Summary .................................................................................................. 1
2 Zusammenfassung .................................................................................. 2
3 Introduction ............................................................................................. 4
3.1 DNA and the genetic information - historical background ................... 4
3.2 Flow of the genetic information and the genetic code ........................ 4
3.3 The degeneracy of the genetic code .................................................. 6
3.4 Protein synthesis ................................................................................ 7
3.4.1 Natural co-translation of selenocysteine and pyrrolysine ............ 8
3.5 Engineering the genetic code ............................................................. 9
3.5.1 Comparison of different approaches ......................................... 12
3.6 Methionine - a unique amino acid in the genetic code ...................... 14
3.6.1 Properties of methionine ........................................................... 14
3.6.2 Methionine in the protein synthesis ........................................... 15
3.6.3 Methionine metabolism ............................................................. 16
3.6.4 Methionine oxidation ................................................................. 17
3.7 Proteins and their conformational properties .................................... 19
3.7.1 Protein folding ........................................................................... 19
3.7.2 Protein misfolding and disease ................................................. 20
3.7.3 Oxidative stress and protein damage ........................................ 21
3.8 Prion disease ................................................................................... 22
4 The Goal: Chemical model for prion protein conversion ................... 26
5 Material ................................................................................................... 27
5.1 Equipment ........................................................................................ 27
5.2 Chemicals ........................................................................................ 28
5.3 Buffers and solutions ........................................................................ 29
5.4 Polyacrylamide gel electrophoresis (PAGE) ..................................... 30
5.5 Media ............................................................................................... 31
5.6 Enzymes .......................................................................................... 32
5.7 Protein molecular weight marker ...................................................... 32
5.8 Plasmids ........................................................................................... 32
5.8.1 pET17b-hPrP(23-231)WT81 ..................................................... 32
5.8.2 pRIL .......................................................................................... 32
5.9 Antibiotics ......................................................................................... 33
5.10 Bacterial strains ................................................................................ 33
5.11 Fluorescent dyes .............................................................................. 33
5.12 Antibodies ........................................................................................ 33
5.13 Software ........................................................................................... 33
6 Methods .................................................................................................. 35
6.1 Microbiological methods ................................................................... 35
6.1.1 Production of electrocompetent cells ........................................ 35
6.1.2 Transformation .......................................................................... 35
6.1.3 Limitation test ............................................................................ 35
6.1.4 Expression test .......................................................................... 36
6.1.5 Protein fermentation and expression of full length rhPrPC ........ 36
6.1.6 Protein purification of full length rhPrPC .................................... 36
6.1.7 Protein purity and concentration determination ......................... 37
6.2 Spectroscopy and spectrometry ....................................................... 38
6.2.1 Mass spectrometry (Orbitrap ESI-MS/MS) ................................ 38
6.2.1.1 In-solution Digestion. ............................................................. 38
6.2.1.2 NanoLC-MS/MS .................................................................... 38
6.2.1.3 Peptide Identification via MASCOT Search ........................... 39
6.2.2 Electrospray mass spectrometry (ESI-MS) ............................... 39
6.2.3 Circular dichroism (CD) spectroscopy and melting curves ........ 39
6.2.4 Quantification of individual Met residue oxidation in rhPrPC ...... 40
6.3 Peptide synthesis ............................................................................. 40
6.4 FCS/SIFT measurements and analysis ............................................ 41
6.4.1 Fluorescent labeling of rhPrPC .................................................. 42
6.4.2 Quality control of labeled rhPrPC ............................................... 43
6.4.3 Western blot .............................................................................. 45
6.4.4 Aggregation assay .................................................................... 45
6.4.5 Aggregation assay in different periodate concentrations ........... 46
7 Results ................................................................................................... 48
7.1 Expression and purification of the rhPrPC model protein .................. 48
7.2 Sodium periodate induced aggregation of Met-rhPrPC ..................... 50
7.3 Attempts to map Met oxidation by Orbitrap ESI-MS/MS ................... 52
7.4 Mapping Met oxidation by Bruckner Daltonics ESI-MS .................... 55
7.4.1 Met-rhPrPC oxidation using 5 equiv. NaIO4 ............................... 55
7.4.2 Met-rhPrPC oxidation using 25 equiv. NaIO4 (soluble fraction) .. 58
7.4.3 Met-rhPrPC oxidized using 25 equiv. NaIO4 (pellet fraction) ...... 60
7.4.4 Overall picture of NaIO4 induced Met oxidation ......................... 62
7.5 Attempts for Met(O) and Met(O2) incorporation into rhPrPC ............. 62
7.6 Expression and isolation of Nle-rhPrPC and Mox-rhPrPC ................. 64
7.7 CD spectroscopy of Nle-rhPrPC and Mox-rhPrPC ............................. 68
7.8 Monitoring secondary structure change upon heating ...................... 69
7.9 Melting curves of Met-rhPrPC and its variants .................................. 71
7.10 Pro- and anti-aggregation prion protein variants .............................. 72
7.11 Far-UV CD spectroscopy of the designed Nle and Mox peptide ...... 74
8 Discussion ............................................................................................. 76
8.1 Met oxidation as a possible origin of prion protein structural
conversion ................................................................................................... 76
8.2 Recombinant hPrPC as model for structural conversion ................... 76
8.3 Protein damage caused by Met oxidation ........................................ 77
8.4 Oxidation of Met residues in rhPrPC and structural conversion ........ 78
8.4.1 Met residues in the prion protein ............................................... 78
8.4.2 Structural consequences of Met oxidation in the prion protein .. 79
8.4.3 Prion protein aggregation upon periodate oxidation .................. 79
8.5 Chemical model for α → β conversion in rhPrPC .............................. 82
8.6 Proof of principle of the newly developed chemical model ............... 84
8.7 The model peptide ............................................................................ 85
9 Conclusions ........................................................................................... 87
10 References ............................................................................................. 89
11 Figure List ............................................................................................ 101
12 Table List .............................................................................................. 104
13 Appendix .............................................................................................. 105
13.1 Mapping NaIO4 induced Met oxidation by mass spectrometry-
5 equivalents NaIO4 .................................................................................. 105
13.2 Mapping NaIO4 induced Met oxidation by mass spectrometry-
25 equivalents NaIO4- soluble fraction ...................................................... 112
13.3 Mapping NaIO4 induced Met oxidation by mass spectrometry-
25 equivalents NaIO4- pellet fraction ......................................................... 116
Nomenclature and Definitions I
I Nomenclature and Definitions
I.I Nomenclature
Abbreviations used throughout the thesis are according to the recommendations of
the IUPAC-IUB Commission of biochemical nomenclature and of the ACS Style
Guide.
Furthermore, the following abbreviations were used:
A Adenine
AARS Aminoacyl-tRNA-synthetase
APS Ammonium persulfate
Arg Arginine
BHMT Betaine:homocysteine methyltransferase
C Cytosine
CD Circular dichroism
CJD Creuzfeldt-Jakob disease
DMG N,N-dimethylglycine
E. coli Escherichia coli
εM Molar extinction coefficient
ER Endoplasmatic reticulum
ESI-TOF Electrospray ionization-time of flight
FCS Fluorescence cross-correlation spectroscopy analysis
FFI Fatal Familia Insomnia
fMet Formylmethionine
G Guanine
GPI Glycosylphosphatidylinositol
Nomenclature and Definitions II
GSS Gerstmann-Sträussler-Scheinker syndrome
Hcy Homocysteine
His Histidine
Ile Isoleucine
IPTG Isopropyl-β-D-thiogalactopyranoside
λEx Excitation wavelength
LC Liquid chromatography
MAT Methionine adenosyltransferase
Met Methionine
Mox Methoxinine
Met(O) Methionine sulfoxide
Met(O2) Methionine sulfone
MetRS Methionyl-tRNA-synthetase
mRNA Messenger RNA
MS Met synthase
MS Mass spectrometry
MsrA Methionine sulfoxide reductase A
MsrB Methionine sulfoxide reductase B
N Number of particles
NADP Nicotinamide adenine dinucleotide (oxidized)
NADPH Nicotinamide adenine dinucleotide (reduced)
NaIO4 Sodium periodate
nvCJD New variant CJD
OD600 Optical density at λ = 600 nm
PAGE Polyacrylamide gel electrophoresis
Nomenclature and Definitions III
Phe Phenylalanine
PMDs protein misfolded diseases
Pro Proline
PrPC Cellular prion protein
PrPSc Scrapie prion protein
Q-TOF Quadrupole-time of flight
rhPrPC Recombinant human cellular prion protein
RNA Ribonucleic acid
ROS Reactive oxygen species
RP-HPLC Reverse phase-high performance liquid chromatography
rRNA Ribosomal RNA
rpm Revolutions per minute
SAM S-adenosylmethionine
SAH S-adenosylhomocysteine
SAHH S-adenosylhomocysteine hydrolase
SDS Sodium dodecyl sulfate
SIFT Scanning for intensely fluorescent targets
Ser Serine
SPI Supplementation incorporation method
T Thymine
Tau Taurine
TEMED N,N,N',N'-tetramethylethylenediamine
THF Tetrahydrofolat
tRNA Transfer RNA
Trp Tryptophan

Nomenclature and Definitions IV
TSE Transmissible spongiform encephalopathies
Tyr Tyrosine
U Uracil
UV280 Ultraviolet light at λ = 280 nm
Nomenclature and Definitions V
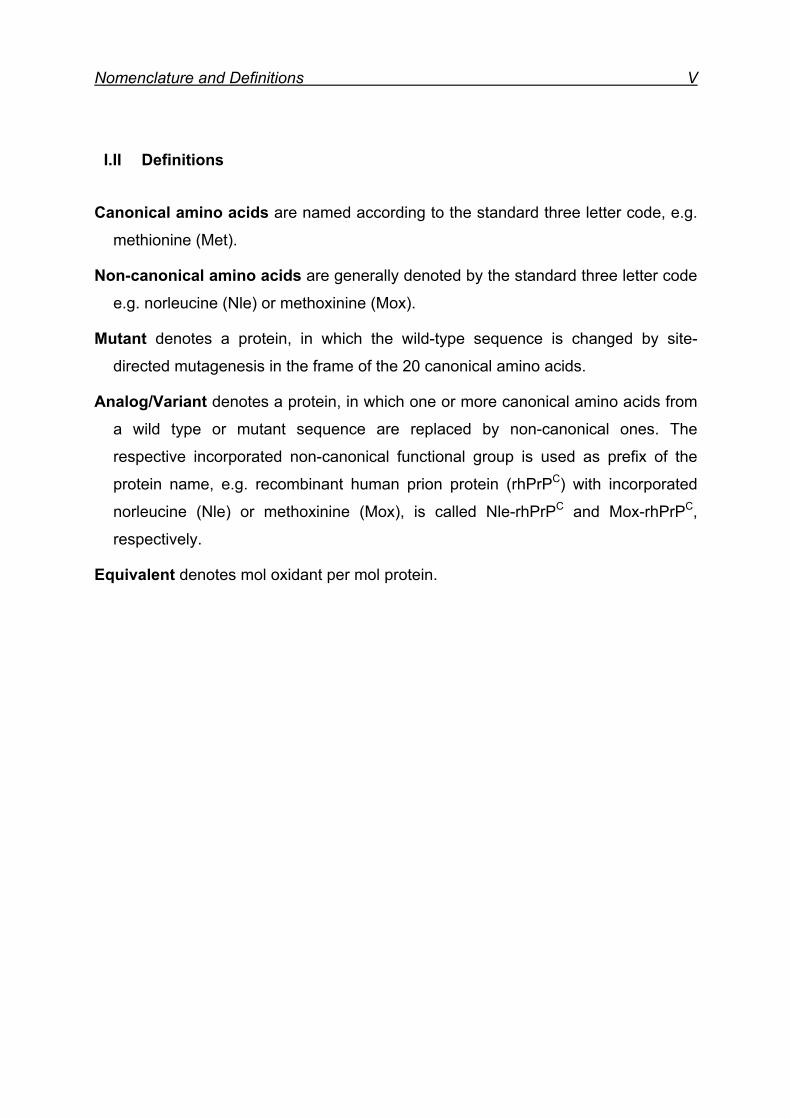
I.II Definitions
Canonical amino acids are named according to the standard three letter code, e.g.
methionine (Met).
Non-canonical amino acids are generally denoted by the standard three letter code
e.g. norleucine (Nle) or methoxinine (Mox).
Mutant denotes a protein, in which the wild-type sequence is changed by site-
directed mutagenesis in the frame of the 20 canonical amino acids.
Analog/Variant denotes a protein, in which one or more canonical amino acids from
a wild type or mutant sequence are replaced by non-canonical ones. The
respective incorporated non-canonical functional group is used as prefix of the
protein name, e.g. recombinant human prion protein (rhPrPC) with incorporated
norleucine (Nle) or methoxinine (Mox), is called Nle-rhPrPC and Mox-rhPrPC,
respectively.
Equivalent denotes mol oxidant per mol protein.
Summary 1
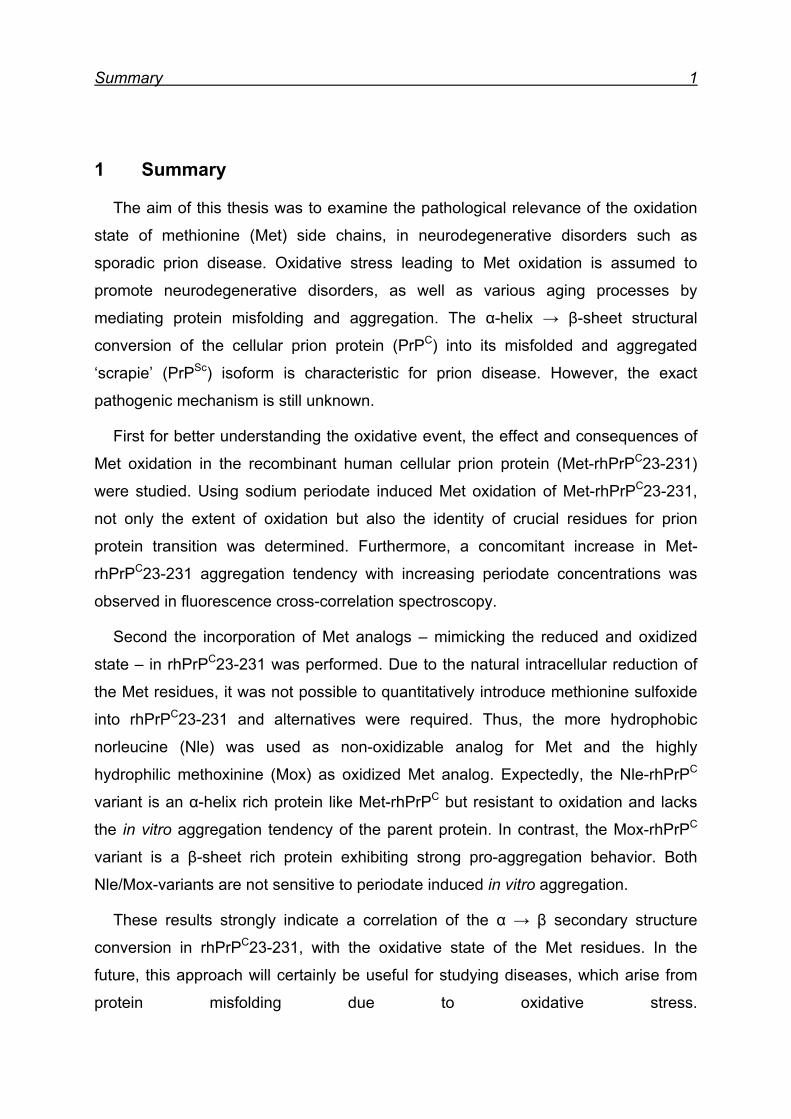
1 Summary
The aim of this thesis was to examine the pathological relevance of the oxidation
state of methionine (Met) side chains, in neurodegenerative disorders such as
sporadic prion disease. Oxidative stress leading to Met oxidation is assumed to
promote neurodegenerative disorders, as well as various aging processes by
mediating protein misfolding and aggregation. The α-helix → β-sheet structural
conversion of the cellular prion protein (PrPC) into its misfolded and aggregated
‘scrapie’ (PrPSc) isoform is characteristic for prion disease. However, the exact
pathogenic mechanism is still unknown.
First for better understanding the oxidative event, the effect and consequences of
Met oxidation in the recombinant human cellular prion protein (Met-rhPrPC23-231)
were studied. Using sodium periodate induced Met oxidation of Met-rhPrPC23-231,
not only the extent of oxidation but also the identity of crucial residues for prion
protein transition was determined. Furthermore, a concomitant increase in Met-
rhPrPC23-231 aggregation tendency with increasing periodate concentrations was
observed in fluorescence cross-correlation spectroscopy.
Second the incorporation of Met analogs – mimicking the reduced and oxidized
state – in rhPrPC23-231 was performed. Due to the natural intracellular reduction of
the Met residues, it was not possible to quantitatively introduce methionine sulfoxide
into rhPrPC23-231 and alternatives were required. Thus, the more hydrophobic
norleucine (Nle) was used as non-oxidizable analog for Met and the highly
hydrophilic methoxinine (Mox) as oxidized Met analog. Expectedly, the Nle-rhPrPC
variant is an α-helix rich protein like Met-rhPrPC but resistant to oxidation and lacks
the in vitro aggregation tendency of the parent protein. In contrast, the Mox-rhPrPC
variant is a β-sheet rich protein exhibiting strong pro-aggregation behavior. Both
Nle/Mox-variants are not sensitive to periodate induced in vitro aggregation.
These results strongly indicate a correlation of the α → β secondary structure
conversion in rhPrPC23-231, with the oxidative state of the Met residues. In the
future, this approach will certainly be useful for studying diseases, which arise from
protein misfolding due to oxidative stress.
Zusammenfassung 2
2 Zusammenfassung
Ziel dieser Arbeit war es, die pathologische Bedeutung des Oxidationszustands
der Methionin-Seitenketten (Met) in neurodegenerativen Krankheiten, wie der
sporadischen Prion-Erkrankung, zu untersuchen. Es wird vermutet, dass die durch
oxidativen Stress verursachte Met-Oxidation zu Proteinfehlfaltung und Aggregation
führt und dieses die Entwicklung von neurodegenerativen Erkrankungen sowie
Alterungsprozessen fördert. Das charakteristische Merkmal der Prion-Erkrankung ist
die α-Helix → β-Faltblatt Umwandlung vom zellulären Prion Protein (PrPC), in die
fehlgefaltete und zu Aggregation neigende ‘Scrapie’ (PrPSc) Isoform. Die genauen
molekularen Hintergründe sind allerdings noch nicht geklärt.
Um die Auswirkungen der Oxidation besser verstehen zu können, wurden
zunächst die Folgen der Met-Oxidation mittels Natriumperiodat im rekombinanten
humanen zellulären Prion Protein (Met-rhPrPC23-231) untersucht. Auf diese Weise
war es nicht nur möglich das Ausmaß der Oxidation zu ermitteln, sondern auch die
einzelnen oxidierten Met-Reste, die für die Prion-Umformung verantwortlich sein
könnten, zu identifizieren. Mit Hilfe der Fluoreszenz-Kreuzkorrelations-Spektroskopie
zeigte sich außerdem, dass steigende Periodatkonzentrationen mit einem erhöhten
Aggregationsverhalten von Met-rhPrPC23-231 einhergehen. Um das Protein im
reduzierten und im oxidierten Zustand simulieren zu können, wurden entsprechende
Met-Analoga in rhPrPC23-231 eingebaut. Aufgrund der natürlichen intrazellulären
Reduktion der Met-Reste war es nicht möglich, durch den Einbau von
Methioninsulfoxid einen quantitativen und stabilen Oxidationszustand in rhPrPC23-
231 zu erzielen. Als Alternativen wurden Norleucin (Nle) als nicht oxidierbares Met-
Analog und Methoxinine (Mox) als oxidiertes Analog verwendet. Wie erwartet hat die
Nle-rhPrPC-Variante einen hohen α-helikalen Anteil, wie auch Met-rhPrPC, ist aber
gegenüber Oxidation stabil und aggregiert kaum. Im Gegensatz dazu hat die Mox-
rhPrPC-Variante einen hohen β-Faltblattanteil und neigt zu Aggregation. Periodat hat
in vitro keine Auswirkungen auf das Aggregationsverhalten der Prion-Varianten mit
Nle oder Mox.

Zusammenfassung 3
Diese Ergebnisse deuten stark auf einen Zusammenhang zwischen der α → β-
Umwandlung der Sekundärstruktur und dem Oxidationszustand der Methionin-Reste
im rhPrPC hin. In Zukunft wird diese Methode sicherlich bei der Untersuchung von
Krankheiten, die mit Proteinfehlfaltungen durch oxidativen Stress einhergehen,
äußerst nützlich sein.
Introduction 4
3 Introduction
3.1 DNA and the genetic information - historical background
One of the fundamental similarities of all living beings is that they share a common
chemistry. This chemistry is implemented by the catalytic activities of proteins that
are encoded in the desoxyribonucleic acid (DNA). For a long time, people believed
that proteins are the carrier of the genetic information, although F. Miescher already
isolated DNA out of human cells in 1871 (1). It took until 1944 when O. T. Avery and
his coworkers experimentally identified DNA as the carrier of the genetic information
(2). Soon after, Levine and Todd discovered that the DNA molecule was built up of
four bases (adenine (A), thymidine (T), guanine (G) and cytosine (C)), which are held
together by a sugar-phosphate backbone. The next step was to clarify the question,
how these four bases are combined, to store the genetic information. The most
important experiment regarding this question was the discovery of the Chargaff rules,
named after the Austrian chemist E. Chargaff. He discovered that the amount of A or
G equals the amount of T or C, respectively. Using the information provided by E.
Chargaff and the crystallographic information produced by R. Franklin, M. Wilkins
together with J. Watson and F. Crick developed a model for the helical structure of
DNA. The DNA molecule is a twisted ladder, where two long and twisted sugar-
phosphate backbones form the outside of the ladder and the rungs are formed by the
base pairs, A-T and G-C, which are weakly joined in the center by hydrogen bonds
(3-7). This knowledge has enabled modern biology to make great leaps in
understanding the human genome and the importance of DNA for life and health.
3.2 Flow of the genetic information and the genetic code
The concept known as the ‘central dogma of molecular biology’ was originally
proposed by F. Crick in 1957. This was the first hypothesis capable to predict a
transfer direction of the genetic information in living organisms. The basic statement
is that the flow of genetic information is unidirectional. This means that the transfer of
information from nucleic acid to nucleic acid or from nucleic acid to protein is
Introduction 5
possible, but transfer from protein to protein or protein to nucleic acid is
impossible (8). In this scheme, the genetic information stored in the DNA is first
transcribed into RNA (where T is replaced by uracil (U)), by the cellular transcription
machinery. Different forms of RNAs are known, and all of them exhibit different
functions, e.g. messenger RNA (mRNA) is the template for protein synthesis, transfer
RNA (tRNA) transports activated amino acids to the ribosome, ribosomal RNA
(rRNA) forms the main component of the ribosomes, and small nuclear RNA (snRNA)
participates in the splicing process on RNA exons. After transcription, the mRNA is
translated into their corresponding amino acid sequence at the ribosome (9).
The crucial experiment to decode the genetic code was done in 1961 by
M. Nirenberg and his colleague H. Matthaei (10), when they used a cell-free system
to translate a poly-uracil RNA sequence and discovered that the polypeptide they
had synthesized consisted of only the amino acid phenylalanine. Five years later the
genetic code was completely deciphered. After the elucidation of the triplet code it
became clear, how the information of linear amino acid sequences was preserved in
co-linear nucleic acid sequences. This means that on the mRNA three nucleobases
(coding triplets) encode for one amino acid in the related protein. The four bases A,
U, G and C can be combined into 4 x 4 x 4 = 64 distinct triplets. Three triplet
combinations (UAA (ochre), UGA (opal) and UAG (amber)) are known to code for
stop codons, which are signals for chain translation termination. The remaining 61
codons encode for a pool of 20 canonical amino acids that are invariant in all known
organisms. Therefore, most but not all amino acids are encoded by more than one
codon (Fig. 1).
Introduction 6
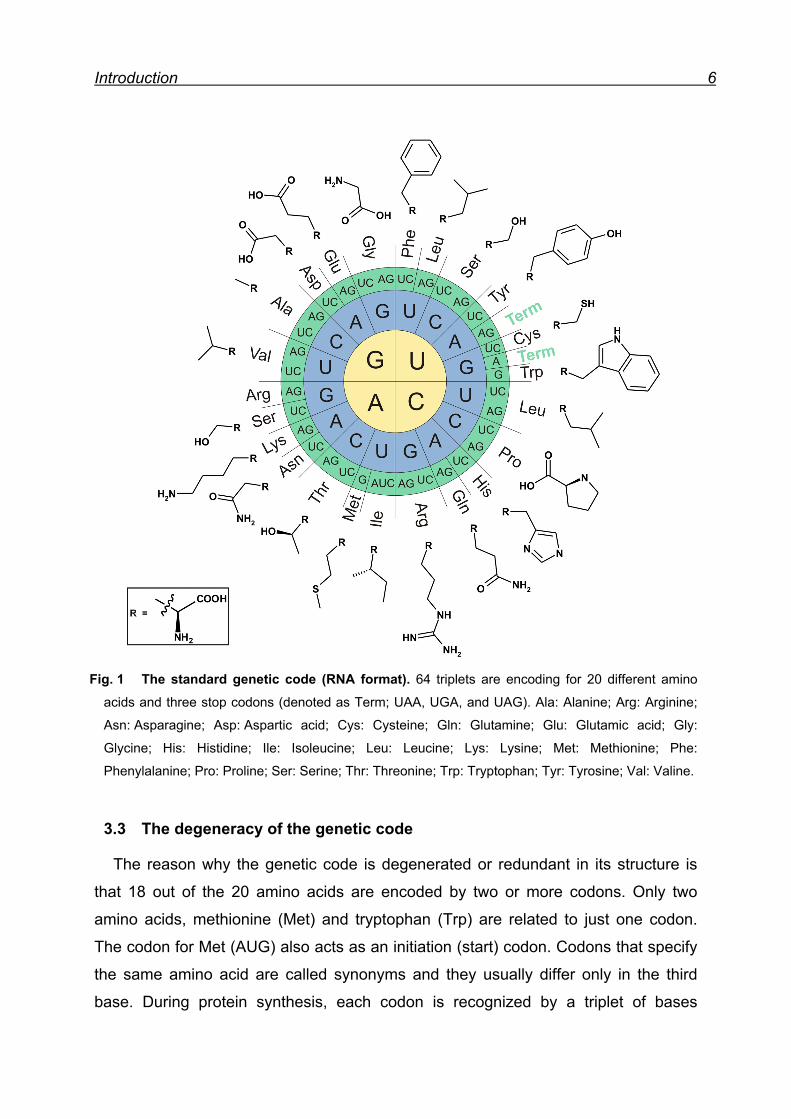
Fig. 1 The standard genetic code (RNA format). 64 triplets are encoding for 20 different amino
acids and three stop codons (denoted as Term; UAA, UGA, and UAG). Ala: Alanine; Arg: Arginine;
Asn: Asparagine; Asp: Aspartic acid; Cys: Cysteine; Gln: Glutamine; Glu: Glutamic acid; Gly:
Glycine; His: Histidine; Ile: Isoleucine; Leu: Leucine; Lys: Lysine; Met: Methionine; Phe:
Phenylalanine; Pro: Proline; Ser: Serine; Thr: Threonine; Trp: Tryptophan; Tyr: Tyrosine; Val: Valine.
3.3 The degeneracy of the genetic code
The reason why the genetic code is degenerated or redundant in its structure is
that 18 out of the 20 amino acids are encoded by two or more codons. Only two
amino acids, methionine (Met) and tryptophan (Trp) are related to just one codon.
The codon for Met (AUG) also acts as an initiation (start) codon. Codons that specify
the same amino acid are called synonyms and they usually differ only in the third
base. During protein synthesis, each codon is recognized by a triplet of bases
Introduction 7
(anticodon), in a specific tRNA molecule. In 1966 F. Crick formulated the ‘wobble
hypothesis’, which postulates less strict specificity in the pairing of the 5’ base of the
tRNA anticodon with the 3’ base of the codon. This allows alternative hydrogen
bonding with the third base of the codon of the mRNA. Therefore, a point mutation in
the DNA or mRNA that changes just the 3’ nucleotide of a codon has often no effect
on the amino acid sequence of the encoded polypeptide (11).
3.4 Protein synthesis
Normally, proteins consist only of 100 to 1000 amino acids and, hence, it is
essential to keep translation as precise as possible. Misincorporation of amino acids
into the polypetide chain during translation occurs only in one out of 104 cases (12).
The adapters, which are responsible for the correct connection between nucleic acid
and amino acid, are the tRNAs. Their secondary structure is usually represented by a
cloverleaf. It consists of three stem loops, one of which bears the anticodon. The
amino acid is attached onto the acceptor part on the opposite of the anticodon stem.
A cognate enzyme called aminoacyl-tRNA-synthetase (AARS) catalyzes the
attachment of an amino acid to a particular tRNA. For each canonical amino acid are
usually a few tRNAs, but only one AARS. This enzyme catalyzes the aminoaclyation
reaction, which takes place in two steps. In the first step the enzyme recognizes its
‘own’ amino acid and binds ATP (cofactor Mg2+), which further forms aminoacyl-
adenylate (aminoacyl-AMP) by concomitantly releasing pyrophosphate (activation
step). In the second step, the enzyme binds the cognate tRNA whereby the
aminoacyl group of aminoacyl-AMP is transferred to the 3’ end of the tRNA to form
the charged-tRNA or aminoacyl-tRNA (transfer step). The synthesis of aminoacyl-
tRNAs is the crucial step in protein biosynthesis, because each amino acid must be
covalently linked to a tRNA adapter in order to take part in protein synthesis at the
ribosome. Additionally this covalent bond is a high energy bond, which enables the
amino acid to react with the end of the growing polypeptide chain to form a new
peptide bond. During translation the ribosome reads the nucleotide sequence in the
5’ to 3’ direction, while synthesizing the corresponding protein from amino acids in an
N-terminal to C-terminal direction (9, 11, 12).
Introduction 8
Protein synthesis at ribosome takes place in three steps: initiation, elongation and
termination. During initiation the mRNA-ribosome complex is formed and the first
codon (AUG) binds the aminoacyl-tRNACAU (which is N-formylmethionine (fMet)-
tRNACAU in prokaryotes and Met-tRNACAU in eukaryotes). In the elongation phase,
the other codons are sequentionally read and the polypeptide grows by amino acid
addition to its C-terminal end. In the last phase, known as termination, the ribosome
reaches a stop codon, which does not have a corresponding aminoacyl-tRNA, but
related release factor that terminates chain elongation. Thereby protein synthesis
ceases and the completed polypeptide is released from the ribosome (9).
Approximately 10-20 polymerization reactions are performed per second by the
ribosome, therefore polypeptide biosynthesis is five times slower than RNA synthesis
(13).
The ribosome contains three binding sites for the tRNA. These are called A-
(aminoacyl-), P- (peptidyl-) and E- (exit-) site. While a tRNA is connected with the
nascent peptide chain at the P-site, an aminoacyl-tRNA binds to the A-site. The
amino group of the aminoacyl-tRNA nucleophil attacks the carbonyl-group of the
peptidyl-tRNA in such a way that a new peptide bond is formed. After this process,
the tRNA and the mRNA have to be moved on so that a new cycle can start. The
deacetylated tRNA moves to the E-site where it leaves the ribosome, and the
peptidyl-tRNA moves from the A to the P-site (9).
In all living organism protein synthesis is performed by the ribosomes and
consumes a lot of energy. Moreover, a minimum of 35-45% of the genome is
assigned to the protein synthesis apparatus. In humans, protein synthesis burns up
approximately 5% of the caloric intake and in E.coli it even uses 30-50% of the
generated energy (14). In living cells the cellular investment in protein synthesis can
be correlated to the amount of RNA, since all RNA types account for about 21% of
the whole biomass in an average E.coli population (14).
3.4.1 Natural co-translation of selenocysteine and pyrrolysine
Though all living organisms translate the same 20 canonical amino acids into
protein sequences according to the rules of the genetic code, some deviation in its
interpretation can be found. In mitochondria, chloroplasts and in some ciliates, the
Introduction 9
assignment of codons to amino acids is changed, e.g. UAA and UAG code for
glutamine instead of translation termination (11). Moreover, two additional amino
acids, beside the 20 canonical amino acids, named selenocysteine (15) (in archea,
bacteria and mammals) and pyrrolysine (16) (in archea), can be incorporated into the
nascent polypeptide chain. However, their incorporation is sequence context
dependent and requires both, specific translation factors and specific secondary
structure elements in the mRNA.
3.5 Engineering the genetic code
By the end of the 19th century most of the amino acids were identified, which are
known to be the main buildings blocks of all proteins. 50 years later, there were
considerable interests to study cellular metabolism and growth by using non-
canonical amino acids. The most important and far-reaching finding was the
quantitative replacement of Met by selenomethionine (SeMet) in proteins, reported by
Cowie and Cohen (17). For this incorporation experiment, the use of a Met
auxotrophic E.coli strain and defined fermentation conditions were mandatory. Amino
acid auxotrophic bacteria strains will proliferate only if the medium is supplemented
with the appropriate amino acid (e.g. the canonical amino acid Met). Therefore,
growth of the culture is fully dependent on the external Met supply, and in a defined
synthetic medium, it is possible to replace Met by SeMet. This landmark experiment
was the first and is till date the only experiment with a proteome wide canonical
amino acid → noncanonical analog substitution, none the less the cell capacity to
divide and grow was retained. In 1990 W. Hendrickson rediscovered the SeMet
incorporation into proteins, using it as an important tool for structural biology,
especially for X-ray and NMR analyses of biological macromolecules (18).
Cowie and Cohen reported that the incorporation of SeMet into E.coli proteins was
almost quantitative and the cellular viability was not significantly harmed. However,
this is rather an exception. Already in early experiments, it became clear that non-
canonical amino acids are mainly bacteriostatic or even bactericidal. For example,
the Met analog Nle leads to only 38% replacement of Met in proteins accompanied
by greatly impaired viability of E.coli ML304d (17, 19). Therefore, to circumvent the
Introduction 10
problem of analog toxicity and to achieve full substitution of single target proteins, the
translation capacity should be resolved from metabolic toxicity (20). For this
approach, auxotrophic host cells are starved on a specific canonical amino acid and
protein synthesis is induced with concomitant addition of the analog to the culture
medium. This approach together with routine recombinant DNA techniques (i.e.
heterogonous gene expression in a highly efficient and controllable manner) allows
the production of a single substituted target protein, without the need for large scale
changes, in the host cell proteome. Consequently, the basic prerequisites for
successful non-canonical amino acid incorporation into a defined target protein are,
first bacterial expression of host cells with a genetically stable auxotrophic marker for
the amino acid that should be exchanged; second a tightly controlled but highly
inducible expression vector for the gene of the model protein; and finally a calibrated
fermentation, where the cell mass is grown on a limiting amount of canonical amino
acid that is exhausted as soon as the cells enter mid-log phase. After this amino acid
is depleted from the media, the non-canonical amino acid is added and target gene
synthesis is induced. Thereupon, the bacterial host cells incorporate the desired non-
canonical amino acid in a residue-specific manner. The desired non-canonical amino
acid has to be available in excess during expression of the target protein for optimal
incorporation. Since the growth medium is supplemented with the desired non-
canonical amino acid, this method is termed supplementation incorporation method
(SPI).
For the successful production of a completely labeled target protein, additional
requirements must be fulfilled. The most crucial is the efficient uptake of the non-
canonical amino acid from the growth medium. Fortunately, the amino acid transport
systems are quite promiscuous and are therefore not able to distinguish between
chemically and structurally similar amino acids (14). The incorporation propensity of a
non-canonical amino acid is certainly highly influenced by its intracellular
accumulation. Recently, it has been reported that active uptake of fluorotryptophans
in breast cancer cells leaded to 70-fold higher intracellular concentrations, than
extracellular ones (21).
However, once in the cell, non-canonical amino acids may participate in
intracellular chemical reactions and transformations and these reactions may change
Introduction 11
their chemical nature and/or transform them into toxic compounds. Therefore, the
most favorable features of the desired non-canonical amino acids are, to be
metabolically neutral and chemically stable.
Besides the high intracellular accumulation level of the desired amino acid analog,
its efficient charging of the analog onto the tRNA, by its AARS, is equally important.
Although the AARS are crucial enzymes in the interpretation of the genetic code and
are highly specific in cognate amino acid recognition, they are often not capable to
distinguish catalytically between similar substrates. This feature is known as
substrate promiscuity and is quite widespread among many enzymes (14). It is the
key feature for the expansion of the amino acid repertoire by the SPI method and
makes it quite simple and straightforward. In particular, their promiscuity enables
enzymes to either catalyze one specific reaction with a number of similar substrates
or to catalyze a range of chemical reactions depending on the reaction partner (22).
Recently, Szostak and coworkers have compiled a list of over 90 amino acid analogs
that are substrates for wild type AARSs in an in vitro reaction (23, 24) and
demonstrated that about 70% of the codons of the genetic code could be reassigned
to non-canonical amino acids. Thus, a large number of non-canonical amino acids
can successfully be incorporated into proteins, since they resemble the canonical
counterparts in terms of shape, size and chemical properties. On the other hand, the
catalytic efficiency of these analogs is usually much lower than that of their natural
counterparts. For example, already in 1979 A. Fersht and C. Dingwall published that
the Km value of Nle for Met-RS from B. stearothermophilus was 100 times higher
than that for the canonical amino acid Met (25).
In a typical SPI experiment, the non-canonical amino acid analog ought to
accumulate in high concentration in the cell, compared to the canonical amino acid,
which should efficiently be exhausted. Therefore, the natural AARS can catalyze
tRNA charging of the analog. Although it is far less efficient than for the canonical
counterpart, translation of the target protein with the novel amino acid should not be
significantly affected. The pre- and post-transfer proofreading mechanisms of AARS,
as well as ribosome proofreading are normally bypassed in a successful SPI-
experiment (14). The last crucial step in protein synthesis is the protein folding, which
is influenced by different factors: van der Waals interactions, hydrogen bonds,
Introduction 12
hydrophobic interactions, hydration effects of non-polar groups, and salt bridges (26,
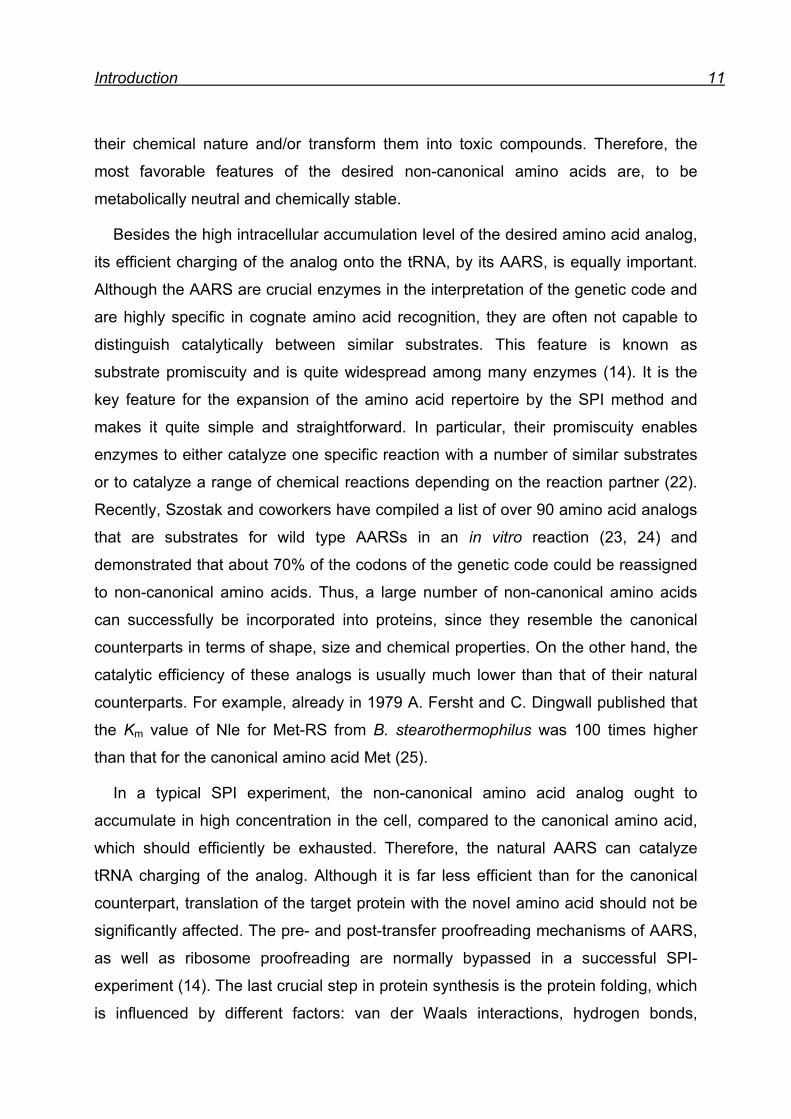
27). Fig. 2 represents the basic prerequisites for noncanonical amino acid
incorporation.
Fig. 2 Basic prerequisites for noncanonical amino acid incorporation. First, the non-canonical
amino acid has to be uptaken from the cell. Second, high intracellular concentration of the desired
amino acid analog and efficient charging of the analog onto the cognate tRNA is regarded. Third,
bypassing of the proofreading mechanisms of AARS and ribosome, and finally proper folding of the
target protein. The figure was kindly provided by Dr. B. Wiltschi.
3.5.1 Comparison of different approaches
The basic advantages of the SPI method are first the possibility to direct sense-
codon substitution, second the expression and purification of the variant protein at
wild type levels and finally the simple and reproducible methodology. A big drawback
of this method is that it is not possible to site-specifically exchange one amino acid
(all or none exchange manner). Nonetheless, the SPI approach still holds the most
promise for large-scale synthesis of proteins with non-canonical amino acids for
therapeutic, biomaterial and bioengineering applications.
Introduction 13
Besides the previously described residue-specific method (SPI method), another
approach (site-specific method) was described by Chapeville et al. (28) in 1962. They
showed that a misaminoacylateded Ala-tRNACys, which was generated by the
chemical reduction of Cys-tRNACys, is able to incorporate code-specific Ala instead of
Cys in vitro. This discovery provided a basis for approaches that use chemically or
enzymatically aminoacylated tRNAs with changed identity in protein translation. In
later methodological developments the focus was on the suppression of termination
codons, whose original meaning is suppressed by specific misaminoacylated tRNAs
(nonsense suppressor tRNA). In this approach, one of three stop codons is
reassigned to any desirable amino acids. In cell-free protein synthesis systems, e.g.
amber suppressor tRNAs can be pre-acetylated either chemically, ezymatically or
with the help of engineered ribozymes. This allows the incorporation of an unnatural
amino acid at the position corresponding to the stop-codon position (29, 30). Though
pre-acetylated suppressor tRNAs provide the most general approach for unnatural
amino acid incorporation, this approach is limited, due to low product yields that
originate from inefficient stop codon suppression and a technically expensive and
highly sophisticated experimental setup.
The in vivo amber-suppression approach allows the replacement of an amino acid
residue by a non-canonical analog at the predefined site in a site-directed manner.
Nowadays the common strategy for such site specific insertion of non-canonical
amino acids, into recombinant proteins, relies on the read-through of an amber
(UAG) stop codon in a mRNA by an amber suppressor tRNACUA that is acetylated
with the desired non-canonical amino acid (15, 31, 32). Like in above described in
vitro system, the genetic code is expanded in vivo by reassigning the amber stop
codon to a specific non-canonical amino acid. The key requirement for this approach
is that genetically encoded AARS/ tRNACUA pairs are not interfering with any of the
AARS and tRNAs of the endogenous expression system. However, the main
bottleneck of this system is the sequence context dependence of the efficiency of the
suppression, which further causes relatively low yield of the expressed proteins. In
recent years, several other incorporation methods (both in vitro and in vivo) were
developed to incorporate non-canonical amino acids into proteins site-specifically.
These are missense suppression (33), frameshift suppression (34, 35), use of
Introduction 14
rybozymes (36), orthogonal ribosomes (37-39) and even novel DNA base pairs (40-
43).
The incorporation of non-canonical amino acids with novel chemical, physical and
biological properties into proteins, generates not only a new dimension to protein
engineering, but also provides the molecular tools for both, studies of protein folding
structure and function, and design of proteins with new or enhanced characteristics.
The most commonly used unnatural amino acids are those which are fluorescent or
photoactivatable, those that carry heavy atoms or reactive side chains and those that
mimic post-translational modifications such as phosphorylation and glycosylation.
Expanding the genetic code makes the design and construction of new protein
biomolecules possible, which can be used to address challenging problems that are
currently not routinely accessible by traditional methods, but find as well a great
application field in medicine and technology (15, 44).
3.6 Methionine - a unique amino acid in the genetic code
3.6.1 Properties of methionine
The canonical amino acid methionine (Met) chemically belongs to the sulfur
containing amino acids. Biophysically it is classified as nonpolar, and rather modestly
hydrophobic (14). However, unlike the side chain of other hydrophobic amino acids,
such as Ile, Val or Leu, the Met side chain is rather flexible. This is possibly the
reason why Met residues are so often involved in biological processes, where
flexibility is required, such as cofactor binding (45). Met is indeed involved in many
important processes in the cell. Although sulfur belongs to the same group in the
periodic table as oxygen, it is much less electronegative. Thus, this feature affords
some of the distinct properties of this canonical amino acid. Moreover, Met plays as
well a special role in protein biosynthesis. It is the initiating amino acid in the
synthesis of eukaryotic proteins, whereas fMet serves the same function in
prokaryotes (see 3.4) (46). Furthermore, it plays an important role in the physiology
of the cell. Met functions not only as the methyl donor in biological methylation
Introduction 15
reaction, but also contributes to the stability of protein structures, with both
hydrophobic interaction and hydrogen bonding (46).
Met residues are relatively rare in protein sequences, where they represent just
1.5% of all residues of known protein structures (14). Since Met has a hydrophobic
character it is often located in the interior of a protein and just 15% of all Met residues
are exposed at the protein surface (14). These surface exposed Mets are very
susceptible to oxidation. In some cases, functional changes due to Met oxidation in
proteins appear to have pathophysiological significance, as will be discussed later.
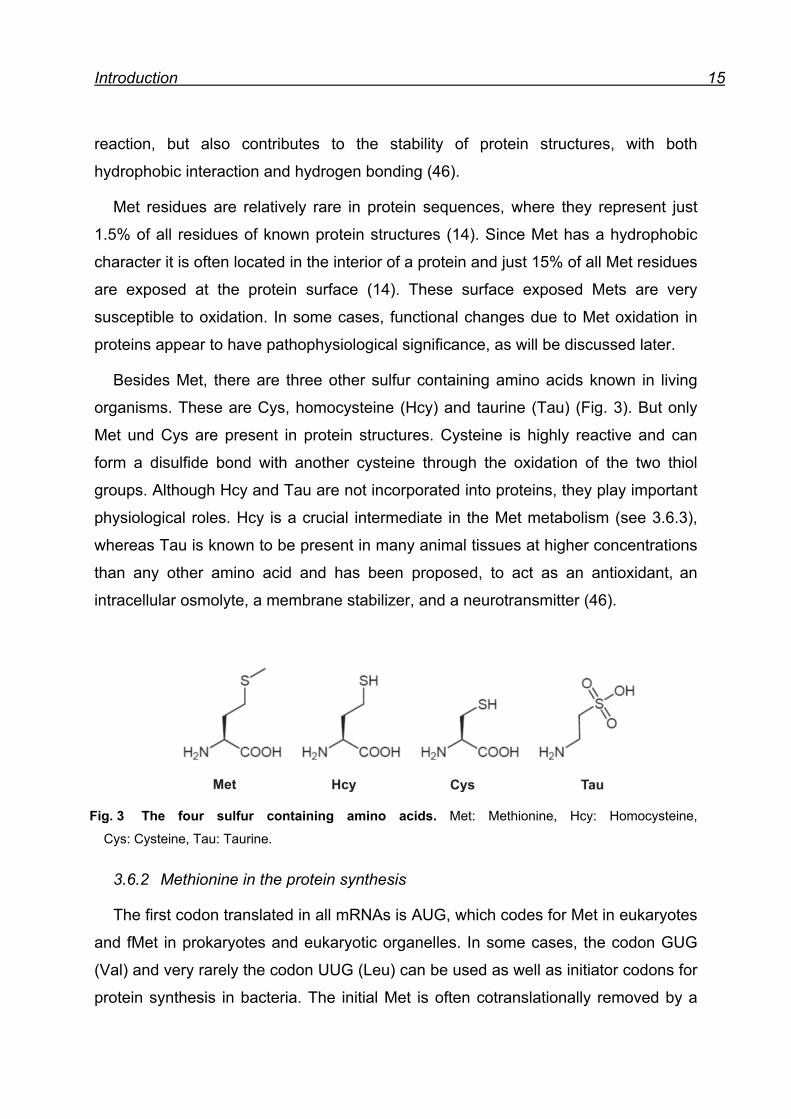
Besides Met, there are three other sulfur containing amino acids known in living
organisms. These are Cys, homocysteine (Hcy) and taurine (Tau) (Fig. 3). But only
Met und Cys are present in protein structures. Cysteine is highly reactive and can
form a disulfide bond with another cysteine through the oxidation of the two thiol
groups. Although Hcy and Tau are not incorporated into proteins, they play important
physiological roles. Hcy is a crucial intermediate in the Met metabolism (see 3.6.3),
whereas Tau is known to be present in many animal tissues at higher concentrations
than any other amino acid and has been proposed, to act as an antioxidant, an
intracellular osmolyte, a membrane stabilizer, and a neurotransmitter (46).
Fig. 3 The four sulfur containing amino acids. Met: Methionine, Hcy: Homocysteine,
Cys: Cysteine, Tau: Taurine.
3.6.2 Methionine in the protein synthesis
The first codon translated in all mRNAs is AUG, which codes for Met in eukaryotes
and fMet in prokaryotes and eukaryotic organelles. In some cases, the codon GUG
(Val) and very rarely the codon UUG (Leu) can be used as well as initiator codons for
protein synthesis in bacteria. The initial Met is often cotranslationally removed by a
Introduction 16
Met aminopeptidase. The tRNA that recognizes the initiation codon differs from the
tRNA that carries internal Met residues, although they both recognize the same AUG
codon. Presumably, the conformations of these tRNAs are different enough to permit
them to be distinguished in the reaction of chain initiation and elongation. However,
both tRNAs are aminoacylated by the same MetRS (47). Drabkin and Rajbhandary
reported in 1998 that the hydrophobic nature of Met is the key element for being the
initiator amino acid. They showed that Val (a highly hydrophobic amino acid) could
be used for initiation in eukaryotic cells but that (Glu) glutamine (a polar amino acid)
was ineffective (48).
3.6.3 Methionine metabolism
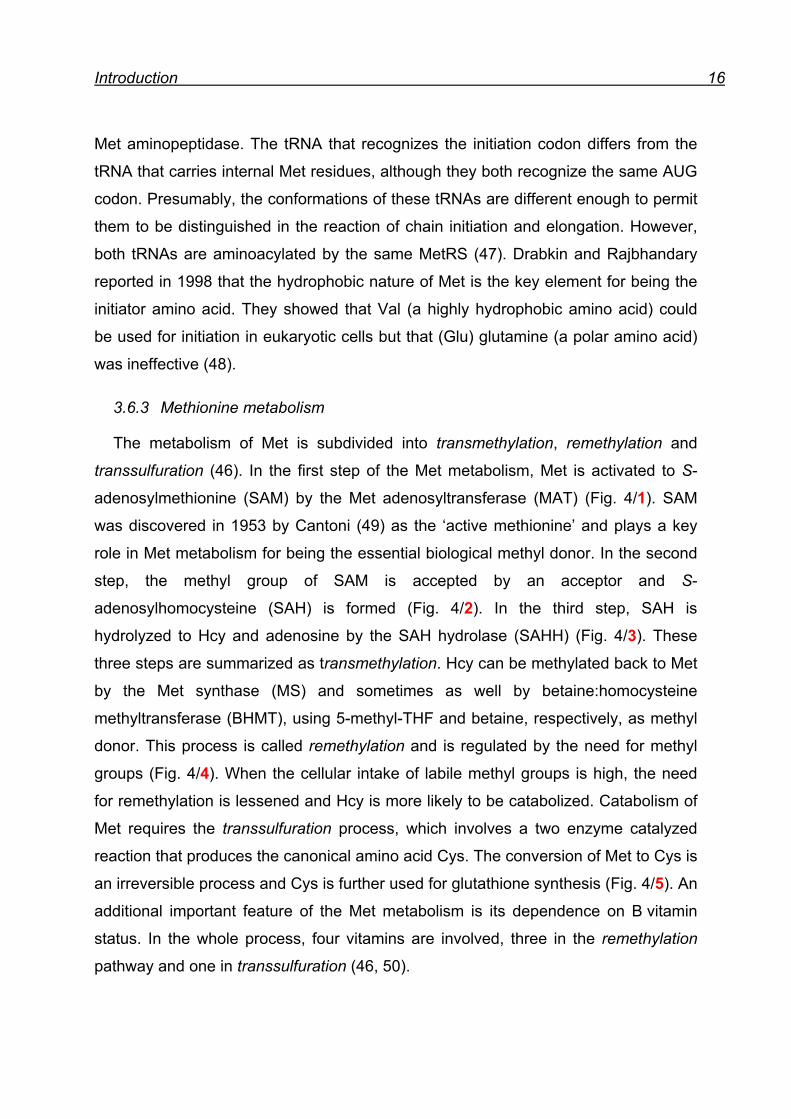
The metabolism of Met is subdivided into transmethylation, remethylation and
transsulfuration (46). In the first step of the Met metabolism, Met is activated to S-
adenosylmethionine (SAM) by the Met adenosyltransferase (MAT) (Fig. 4/1). SAM
was discovered in 1953 by Cantoni (49) as the ‘active methionine’ and plays a key
role in Met metabolism for being the essential biological methyl donor. In the second
step, the methyl group of SAM is accepted by an acceptor and S-
adenosylhomocysteine (SAH) is formed (Fig. 4/2). In the third step, SAH is
hydrolyzed to Hcy and adenosine by the SAH hydrolase (SAHH) (Fig. 4/3). These
three steps are summarized as transmethylation. Hcy can be methylated back to Met
by the Met synthase (MS) and sometimes as well by betaine:homocysteine
methyltransferase (BHMT), using 5-methyl-THF and betaine, respectively, as methyl
donor. This process is called remethylation and is regulated by the need for methyl
groups (Fig. 4/4). When the cellular intake of labile methyl groups is high, the need
for remethylation is lessened and Hcy is more likely to be catabolized. Catabolism of
Met requires the transsulfuration process, which involves a two enzyme catalyzed
reaction that produces the canonical amino acid Cys. The conversion of Met to Cys is
an irreversible process and Cys is further used for glutathione synthesis (Fig. 4/5). An
additional important feature of the Met metabolism is its dependence on B vitamin
status. In the whole process, four vitamins are involved, three in the remethylation
pathway and one in transsulfuration (46, 50).
Introduction 17
Fig. 4 Met metabolism. MAT: Met adenosyltransferase, SAM: S-adenosylmethionine, SAH: S-
adenosylhomocysteine, SAHH: S-adenosylhomocysteine hydrolase, MS: Met synthase, BHMT:
betaine:homocysteine methyltransferase, THF: Tetrahydrofolat, DMG: N,N-dimethylglycine
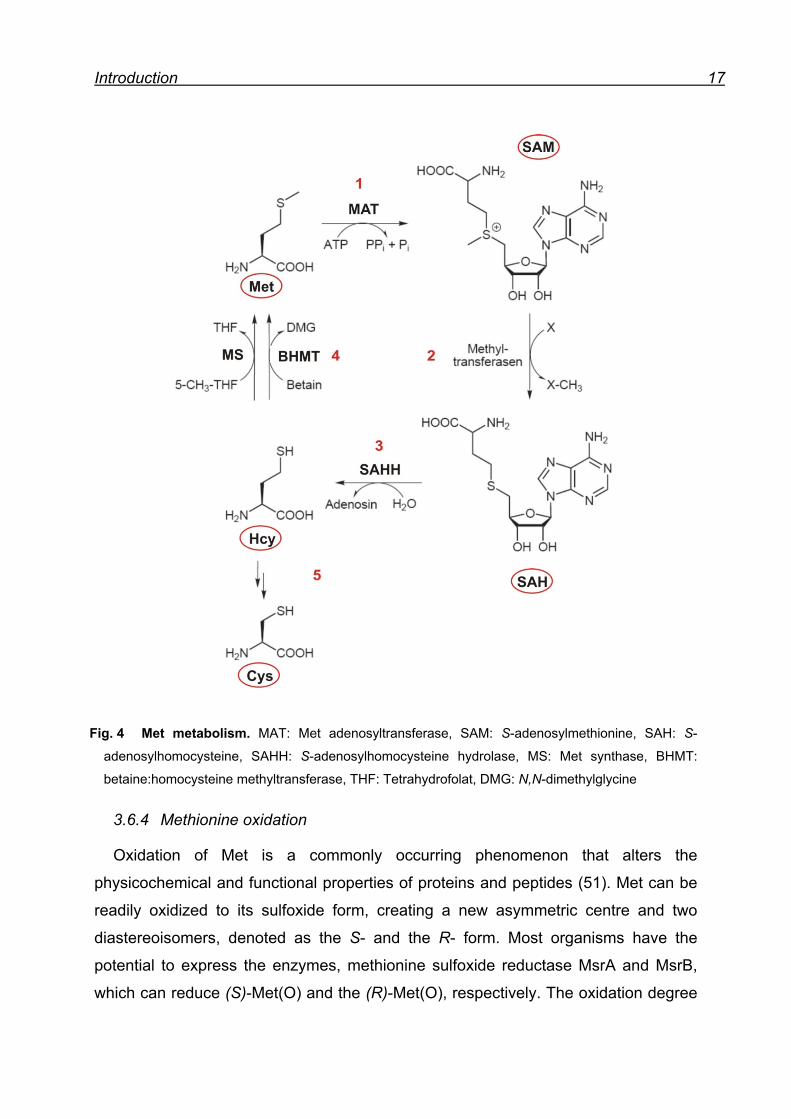
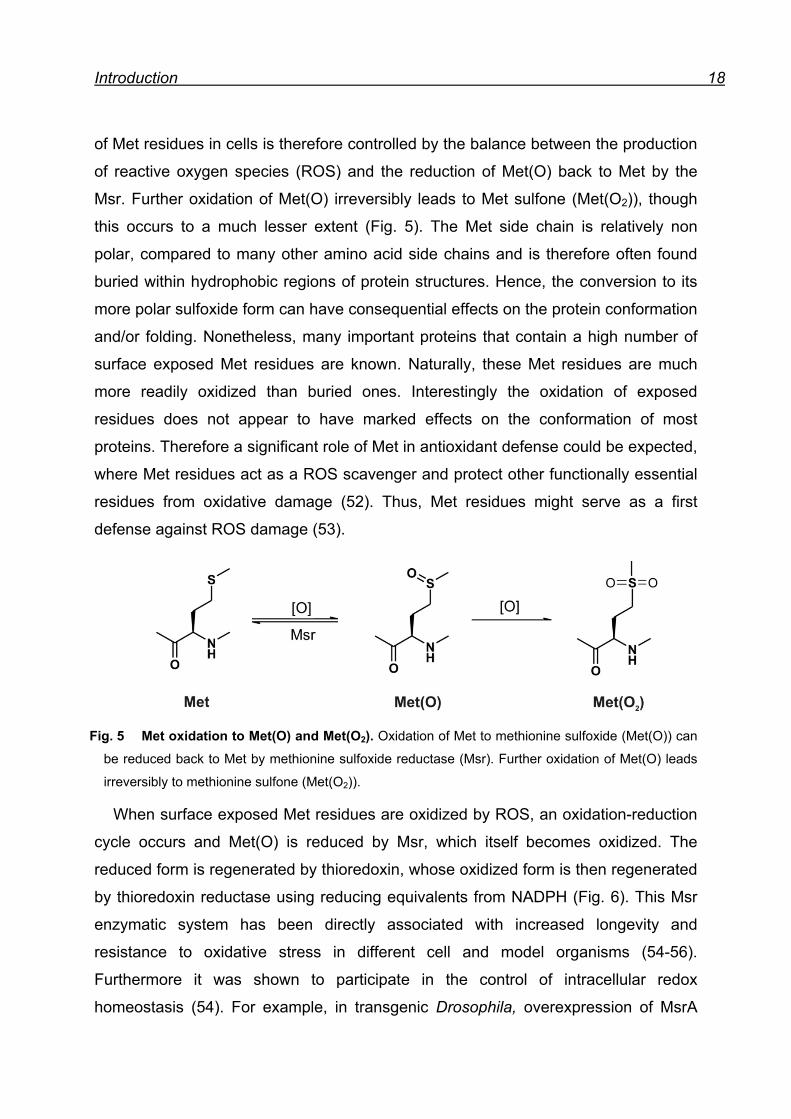
3.6.4 Methionine oxidation
Oxidation of Met is a commonly occurring phenomenon that alters the
physicochemical and functional properties of proteins and peptides (51). Met can be
readily oxidized to its sulfoxide form, creating a new asymmetric centre and two
diastereoisomers, denoted as the S- and the R- form. Most organisms have the
potential to express the enzymes, methionine sulfoxide reductase MsrA and MsrB,
which can reduce (S)-Met(O) and the (R)-Met(O), respectively. The oxidation degree
Introduction 18
of Met residues in cells is therefore controlled by the balance between the production
of reactive oxygen species (ROS) and the reduction of Met(O) back to Met by the
Msr. Further oxidation of Met(O) irreversibly leads to Met sulfone (Met(O2)), though
this occurs to a much lesser extent (Fig. 5). The Met side chain is relatively non
polar, compared to many other amino acid side chains and is therefore often found
buried within hydrophobic regions of protein structures. Hence, the conversion to its
more polar sulfoxide form can have consequential effects on the protein conformation
and/or folding. Nonetheless, many important proteins that contain a high number of
surface exposed Met residues are known. Naturally, these Met residues are much
more readily oxidized than buried ones. Interestingly the oxidation of exposed
residues does not appear to have marked effects on the conformation of most
proteins. Therefore a significant role of Met in antioxidant defense could be expected,
where Met residues act as a ROS scavenger and protect other functionally essential
residues from oxidative damage (52). Thus, Met residues might serve as a first
defense against ROS damage (53).
Fig. 5 Met oxidation to Met(O) and Met(O2). Oxidation of Met to methionine sulfoxide (Met(O)) can
be reduced back to Met by methionine sulfoxide reductase (Msr). Further oxidation of Met(O) leads
irreversibly to methionine sulfone (Met(O2)).
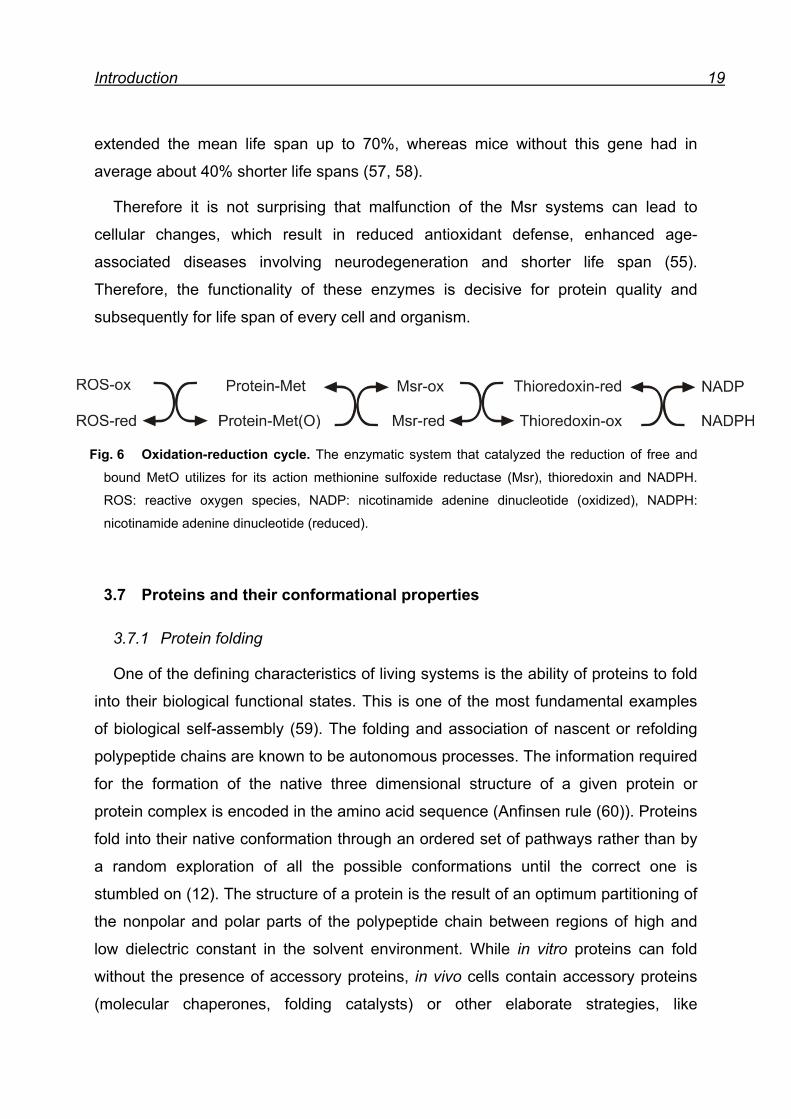
When surface exposed Met residues are oxidized by ROS, an oxidation-reduction
cycle occurs and Met(O) is reduced by Msr, which itself becomes oxidized. The
reduced form is regenerated by thioredoxin, whose oxidized form is then regenerated
by thioredoxin reductase using reducing equivalents from NADPH (Fig. 6). This Msr
enzymatic system has been directly associated with increased longevity and
resistance to oxidative stress in different cell and model organisms (54-56).
Furthermore it was shown to participate in the control of intracellular redox
homeostasis (54). For example, in transgenic Drosophila, overexpression of MsrA
Introduction 19
extended the mean life span up to 70%, whereas mice without this gene had in
average about 40% shorter life spans (57, 58).
Therefore it is not surprising that malfunction of the Msr systems can lead to
cellular changes, which result in reduced antioxidant defense, enhanced age-
associated diseases involving neurodegeneration and shorter life span (55).
Therefore, the functionality of these enzymes is decisive for protein quality and
subsequently for life span of every cell and organism.
Fig. 6 Oxidation-reduction cycle. The enzymatic system that catalyzed the reduction of free and
bound MetO utilizes for its action methionine sulfoxide reductase (Msr), thioredoxin and NADPH.
ROS: reactive oxygen species, NADP: nicotinamide adenine dinucleotide (oxidized), NADPH:
nicotinamide adenine dinucleotide (reduced).
3.7 Proteins and their conformational properties
3.7.1 Protein folding
One of the defining characteristics of living systems is the ability of proteins to fold
into their biological functional states. This is one of the most fundamental examples
of biological self-assembly (59). The folding and association of nascent or refolding
polypeptide chains are known to be autonomous processes. The information required
for the formation of the native three dimensional structure of a given protein or
protein complex is encoded in the amino acid sequence (Anfinsen rule (60)). Proteins
fold into their native conformation through an ordered set of pathways rather than by
a random exploration of all the possible conformations until the correct one is
stumbled on (12). The structure of a protein is the result of an optimum partitioning of
the nonpolar and polar parts of the polypeptide chain between regions of high and
low dielectric constant in the solvent environment. While in vitro proteins can fold
without the presence of accessory proteins, in vivo cells contain accessory proteins
(molecular chaperones, folding catalysts) or other elaborate strategies, like
Introduction 20
degradation mechanisms and quality control, to allow proper folding of the
polypeptide chains (59). Even after the completion of the initial folding process,
proteins are in a dynamic equilibrium between their folded states and a series of
more or less unfolded forms (local minima). Thus, a protein can always escape from
its correctly folded state into its subsequently misfolded state. In addition when the
mechanisms, which are designed to detect and neutralize the effects of such
behavior fail, the consequences can be highly disruptive and fatal (61).
3.7.2 Protein misfolding and disease
A broad range of human diseases arise from the failure of a specific protein to
adopt or remain in its native functional conformation. Protein misfolding can further
lead to aggregation and has been associated with several genetic and environmental
factors. The overall mechanism is most likely the destabilization of the native protein
conformation and favoring of misfolding and aggregation. Environmental factors that
catalyze protein misfolding are metal ions, pathological chaperon proteins, pH or
oxidative stress and macromolecular increase in the concentration of the misfolded
protein. Many of these alterations are associated with neurodegenerative diseases
an aging (62, 63).
The hallmark event in protein misfolded diseases (PMDs) is the change in the
secondary and tertiary structure of the native protein that is possibly caused by a
primary structural change (e.g. Met oxidation). Therefore, the conformational change
may promote the disease either by the gain of a toxic activity or by the loss of the
biological function. Additionally, in most of the PMDs, the misfolded protein is rich in
β-sheet conformation, which is believed to be the generic state of proteins (64). This
means that for many proteins the favorable state is therefore the aggregated one. If
this is true, at an infinite time all proteins will be transformed to an aggregated state
(65). Thus, it is reasonable to assume that minor stochastically formed modifications
of the polypeptide chain induce local α → β structural transition. In this context, Met
residues could represent the key structural switches because of their high sensitivity
toward oxidation that converts the moderately hydrophobic thioether side chain into
the hydrophilic sulfoxide form. Indeed, this redox-controlled Met → Met(O) reaction
can induce an α-helix → β-sheet conformational switch in model peptides (66).
Introduction 21
Although Met is a rare amino acid in proteins (67) there are many important proteins
whose activity is altered by Met-oxidation such as 1-antitrypsin calmodulin,
fibronectin, cytochrome C, apolipoprotein, chymotrypsin, hemoglobin etc. (52).
An increasing number of human diseases, including Alzheimer’s diseases,
Parkinson’s diseases, Huntington’s diseases, spongiform encephalopathies (prion
diseases) and late-onset diabetes, are known to be directly associated with
deposition of aggregates in tissue (59). Diseases of this type are becoming
increasingly prevalent, since the human population generally gets older due to new
agricultural, dietary and medical practices. Therefore, most of the PMDs do not result
from genetic mutations but develop rather sporadically or are associated with old
age. One of the most characteristic features of these diseases is that they give rise to
the deposition of proteins in the form of amyloid fibrils and plaques. Several studies
shown that amyloid-like fibrils are composed of several protofilaments which consist
of hydrogen bonding of β-sheet structures (cross-β conformation) (62, 64). Taken
together, it is likely that slight conformational changes result in the formation of a
misfolded protein intermediate that becomes stabilized by intermolecular interaction
with other molecules and further forms small β-sheet oligomers. That finally leads to
amyloid-like fibril formation.
Although all above mentioned neurodegenerative diseases are associated with
abnormalities in the folding of different proteins, the molecular pathway, which leads
to misfolding and aggregation, as well as the mechanism by which this process might
lead to neuronal death, seems to be similar. Thus, these findings provide hope that a
common therapeutic strategy can be developed to prevent or treat these defects and
diseases.
3.7.3 Oxidative stress and protein damage
Proteins are the major target for oxidants not only because of their abundance in
biological systems, but also due to their high rate constants for reaction (53).
Depending on the oxidizing species, protein oxidation can lead to either reversible or
irreversible protein damage. Radicals and non-radical oxidants can be generated by
a wide variety of different processes in biological systems. These range from the
deliberate and highly controlled generation of radicals with the active site enzymes to
Introduction 22
the point of unintended formation of oxidants in cells and tissue. The production of
ROS and reactive nitrogen species (RNS) can as well be promoted by different
exogeneous or endogeneous oxidative stress factors (54). In proteins, almost all
amino acids are susceptible to oxidation, but sulfur containing and aromatic amino
acids are the most sensitive to oxidative modification. However, specific enzymatic
systems have been identified to reduce certain oxidation products, especially for the
sulfur containing amino acids, Cys and Met. Furthermore, it is believed that the
reversion of Met oxidation may be involved in protein function regulation.
Nevertheless, it is well established that oxidation of proteins can have a wide range
of downstream consequences. The side chain oxidation of proteins can lead to both,
unfolding and conformational changes that can further have consequential effects on
their biological function.
Several studies suggested that the oxidation of surface exposed residues have
less influence on protein conformational changes than the oxidation of buried ones.
Moreover, buried residues are much less rapidly oxidized and additionally require
harsher oxidation conditions for being oxidized. In most cases, protein damage is
irreversible and the normal fate of these oxidized proteins is their elimination through
proteolysis by the intracellular protein degradation pathways. However, heavily
oxidized proteins may resist proteolytic attack and form aggregates (68). Additionally,
with increasing age the activity of the cellular protein degradation and repair systems
decline, which further favors the accumulation of oxidized proteins. Since the steady-
state level of oxidized proteins is dependent on the balance between the rate of
protein oxidative damage and oxidized protein elimination, it is believed that the age
and/or disease related accumulation of oxidized proteins is due to increased protein
damage and decreased oxidized protein removal and repair (54, 68).
3.8 Prion disease
Prion protein (PrP) diseases belong to the transmissible spongiform
encephalopathies (TSE), which are a group of rapidly progressive, fatal
neurodegenerative diseases that affecting both humans and animals. Most TSEs are
characterized by long incubation periods and a neuropathological feature of
Introduction 23
multifocal spongiform changes, astrogliosis, neuronal loss and absence of
inflammatory reaction. TSEs in humans include Creuzfeldt-Jakob disease (CJD),
Kuru, Gerstmann-Sträussler-Scheinker syndrome (GSS), Fatal Familia Insomnia
(FFI) and new variant CJD (nvCJD). In animals it includes scrapie in sheep and
goats, transmissible mink encephalopathy in mink, chronic wasting disease in deer
and elk, bovine spongiform encephalopathy, exotic ungulate spongiform
encephalopathy and feline spongiform encephalopathy in cats, albino tigers and
cheetahs (69). Initially, the agent of PrP disease was thought to be a slow virus, but
further research indicated that this agent differs significantly from viruses. The
‘protein-only’ hypothesis was first enunciated by J. S. Griffith in 1967, where he
proposed that the material responsible for disease transmission, was uniquely a
protein that has the ability to replicate itself in the body (64). In 1982 Prusiner
introduced the term ‘prion’ to described the proteinaceous infectious particle (70).
Nowadays the best current working definition of a prion is a proteinacious infectious
particle that lacks nucleic acid (71).
The cellular prion protein (PrPC) is encoded by the PRNP gene, which directs the
synthesis of a 253 residue protein. The first 22 amino acids encode a secretion signal
peptide that is cleaved off during its transit through the endoplasmic reticulum (ER)
and the Golgi apparatus. It further contains five octapeptide repeats near the amino
terminus, two glycosylation sites, one disulfide bridge and additionally a
glycosylphosphatidylinositol (GPI) anchor that attaches the protein to the outer
surface of the cell membrane. PrPC is expressed in three different glycosylation forms
(mono-, di- and unglycosylated) and is found in the brain and other tissues of healthy
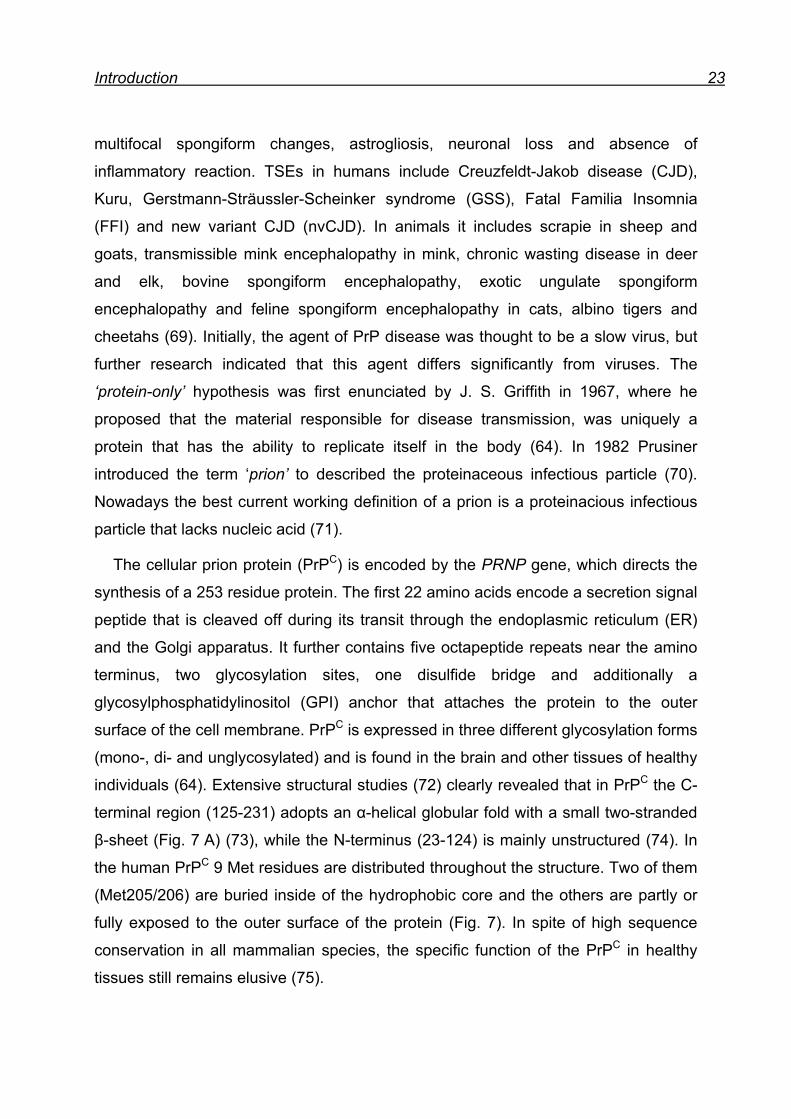
individuals (64). Extensive structural studies (72) clearly revealed that in PrPC the C-
terminal region (125-231) adopts an α-helical globular fold with a small two-stranded
β-sheet (Fig. 7 A) (73), while the N-terminus (23-124) is mainly unstructured (74). In
the human PrPC 9 Met residues are distributed throughout the structure. Two of them
(Met205/206) are buried inside of the hydrophobic core and the others are partly or
fully exposed to the outer surface of the protein (Fig. 7). In spite of high sequence
conservation in all mammalian species, the specific function of the PrPC in healthy
tissues still remains elusive (75).
Introduction 24
Fig. 7 Three-dimensional structure of human PrPC(125-231) (PDB accession No. 1QM0) (A) Soluble domain of the PrPC with secondary structure elements and buried Met residues. (B) Surface representation with marked Met residues (yellow). Note that except for Met205/206,
which are buried inside the PrPC structure, all other Met residues (including Met109 and Met112,
which are part of the unstructured N-terminal domain) are solvent-exposed and therefore in principle
susceptible to oxidation.
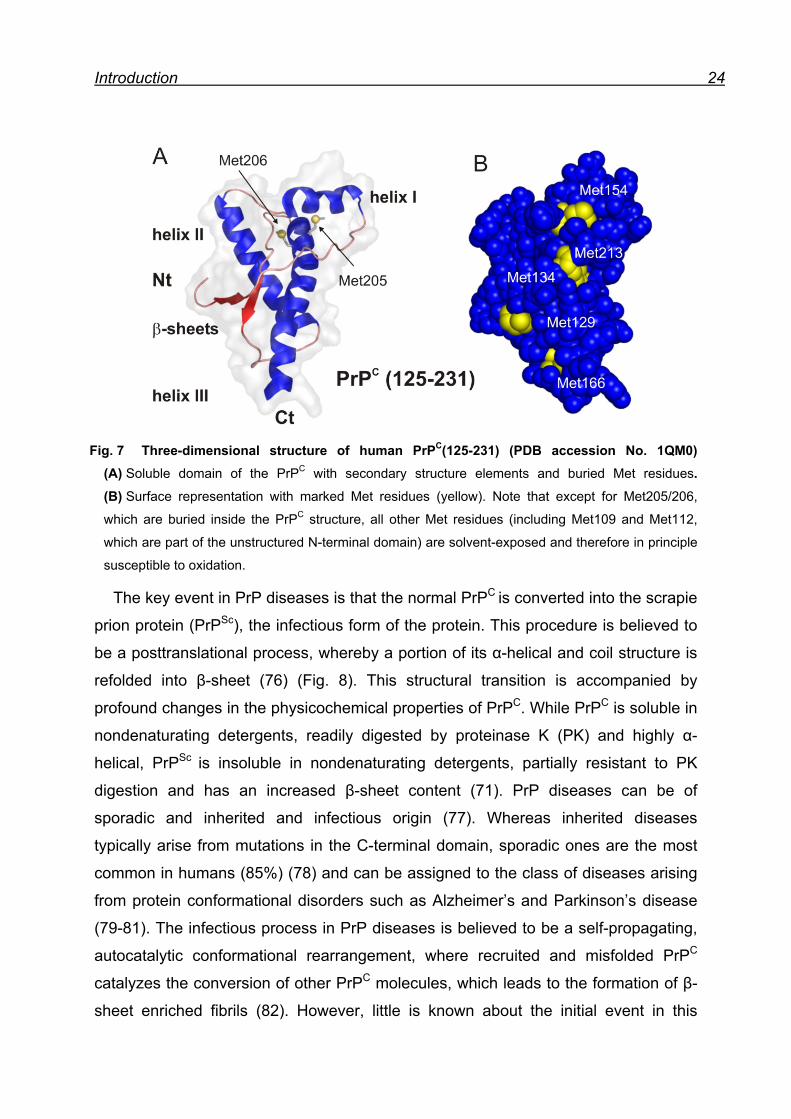
The key event in PrP diseases is that the normal PrPC is converted into the scrapie
prion protein (PrPSc), the infectious form of the protein. This procedure is believed to
be a posttranslational process, whereby a portion of its α-helical and coil structure is
refolded into β-sheet (76) (Fig. 8). This structural transition is accompanied by
profound changes in the physicochemical properties of PrPC. While PrPC is soluble in
nondenaturating detergents, readily digested by proteinase K (PK) and highly α-
helical, PrPSc is insoluble in nondenaturating detergents, partially resistant to PK
digestion and has an increased β-sheet content (71). PrP diseases can be of
sporadic and inherited and infectious origin (77). Whereas inherited diseases
typically arise from mutations in the C-terminal domain, sporadic ones are the most
common in humans (85%) (78) and can be assigned to the class of diseases arising
from protein conformational disorders such as Alzheimer’s and Parkinson’s disease
(79-81). The infectious process in PrP diseases is believed to be a self-propagating,
autocatalytic conformational rearrangement, where recruited and misfolded PrPC
catalyzes the conversion of other PrPC molecules, which leads to the formation of β-
sheet enriched fibrils (82). However, little is known about the initial event in this
Introduction 25
autocatalytic misfolding cascade. Besides genetic causes (mutations) various
environmental factors such as molecular crowding, metal ions, chaperone proteins,
membrane lipid composition, pH, and/or oxidative stress have been claimed as
responsible (83, 84).
Fig. 8 Structure of PrPC and speculative structure of PrPSc. PrPC shows a high α-helical content,
where PrPSc shows an increase in β-sheet. The picture was adapted from
www.stanford.edu/group/virus/prion/normal_rogue.gif.
Goal 26
4 The Goal: Chemical model for prion protein conversion
The central research goal of our group is to generate proteins with properties
beyond those of existing ones in the natural biological realm. In this work we aimed
at using our synthetic amino acid incorporation methodology to examine the chemical
event behind the α → β structural conversion in the recombinant full length human
prion protein, since nothing is known about a possible chemical mechanism (85).
Oxidative stress leading to Met oxidation is proposed to be a process capable to
promote neurodegenerative disorders, as well as various aging processes by
mediating protein misfolding and aggregation. In this context, we reason that a
chemical modification of Met residues, such as oxidation, might trigger the structural
α → β transition in rhPrPC, which further initiates the misfolding cascade. To check
this hypothesis, we use periodate induced Met oxidation. Thereby, we are not only
able to determine the extent of oxidation, but we can also identify crucial Met
residues that might be responsible for prion protein transition. In second instance, we
generate a suitable model for the structural transition. For an adequate replacement
of the amino acid Met, it is necessary that the polarity of the surrogate side chain can
be varied in a controlled manner. Therefore, we expand the genetic code for the AUG
triplet, by norleucine (Nle) and methoxinine (Mox). These Met analogs are chemically
stable and non-invasive and due to their structural similarity to Met, they introduce
only the least possible structural perturbation. Importantly, they have opposite
polarities. In comparison with Met, Nle is more hydrophobic, whereas Mox (like
Met(O)) is a highly hydrophilic (polar) amino acid. It is reasonable to expect that
these dramatic differences in physico-chemical properties between Met, Nle and Mox
will be fully reflected in the related protein variants.
With this novel tool, we expect to stabilize rhPrPC, as well as to alter the global
folding pattern of rhPrPC, from a predominantly α-helical structure (like PrPC) to a
structure with predominantly β-sheet content (like it infectious form PrPSc). In this
way, it should be possible to provide a chemical model, which can mimic the α → β
structural conversion, not only in prion protein but also in proteins generally important
in various neurodegenerative diseases.
Material 27
5 Material
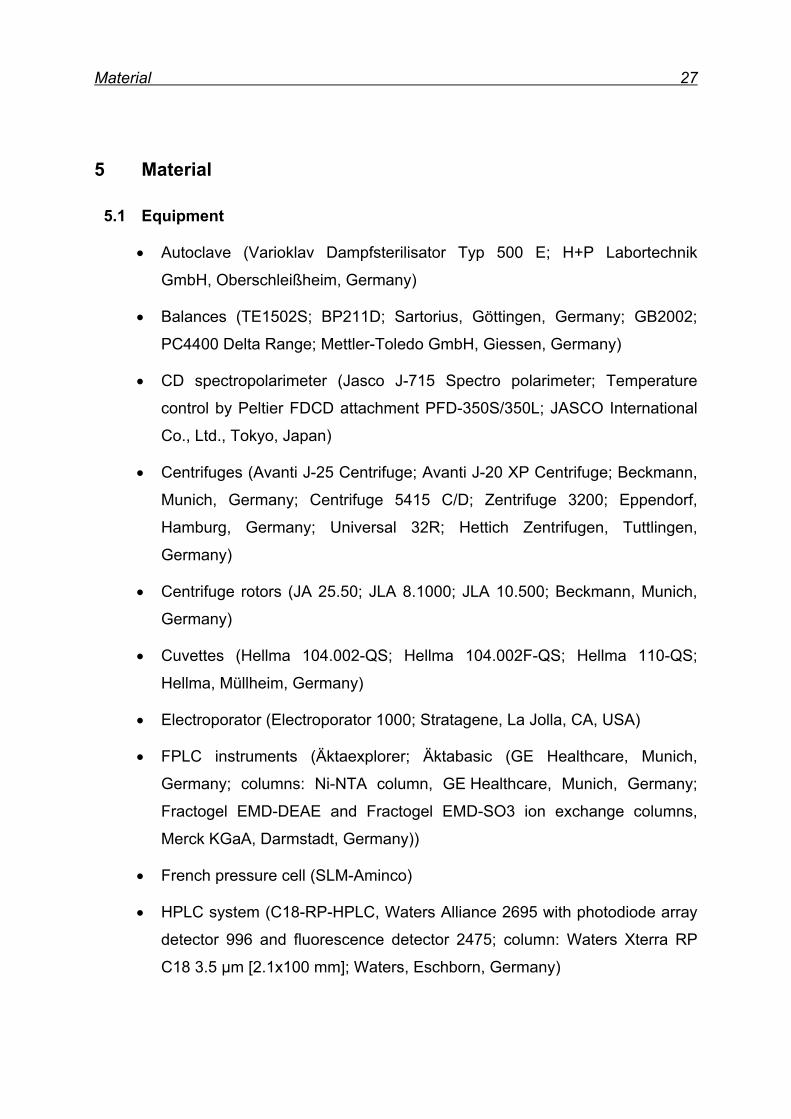
5.1 Equipment
• Autoclave (Varioklav Dampfsterilisator Typ 500 E; H+P Labortechnik
GmbH, Oberschleißheim, Germany)
• Balances (TE1502S; BP211D; Sartorius, Göttingen, Germany; GB2002;
PC4400 Delta Range; Mettler-Toledo GmbH, Giessen, Germany)
• CD spectropolarimeter (Jasco J-715 Spectro polarimeter; Temperature
control by Peltier FDCD attachment PFD-350S/350L; JASCO International
Co., Ltd., Tokyo, Japan)
• Centrifuges (Avanti J-25 Centrifuge; Avanti J-20 XP Centrifuge; Beckmann,
Munich, Germany; Centrifuge 5415 C/D; Zentrifuge 3200; Eppendorf,
Hamburg, Germany; Universal 32R; Hettich Zentrifugen, Tuttlingen,
Germany)
• Centrifuge rotors (JA 25.50; JLA 8.1000; JLA 10.500; Beckmann, Munich,
Germany)
• Cuvettes (Hellma 104.002-QS; Hellma 104.002F-QS; Hellma 110-QS;
Hellma, Müllheim, Germany)
• Electroporator (Electroporator 1000; Stratagene, La Jolla, CA, USA)
• FPLC instruments (Äktaexplorer; Äktabasic (GE Healthcare, Munich,
Germany; columns: Ni-NTA column, GE Healthcare, Munich, Germany;
Fractogel EMD-DEAE and Fractogel EMD-SO3 ion exchange columns,
Merck KGaA, Darmstadt, Germany))
• French pressure cell (SLM-Aminco)
• HPLC system (C18-RP-HPLC, Waters Alliance 2695 with photodiode array
detector 996 and fluorescence detector 2475; column: Waters Xterra RP
C18 3.5 µm [2.1x100 mm]; Waters, Eschborn, Germany)
Material 28
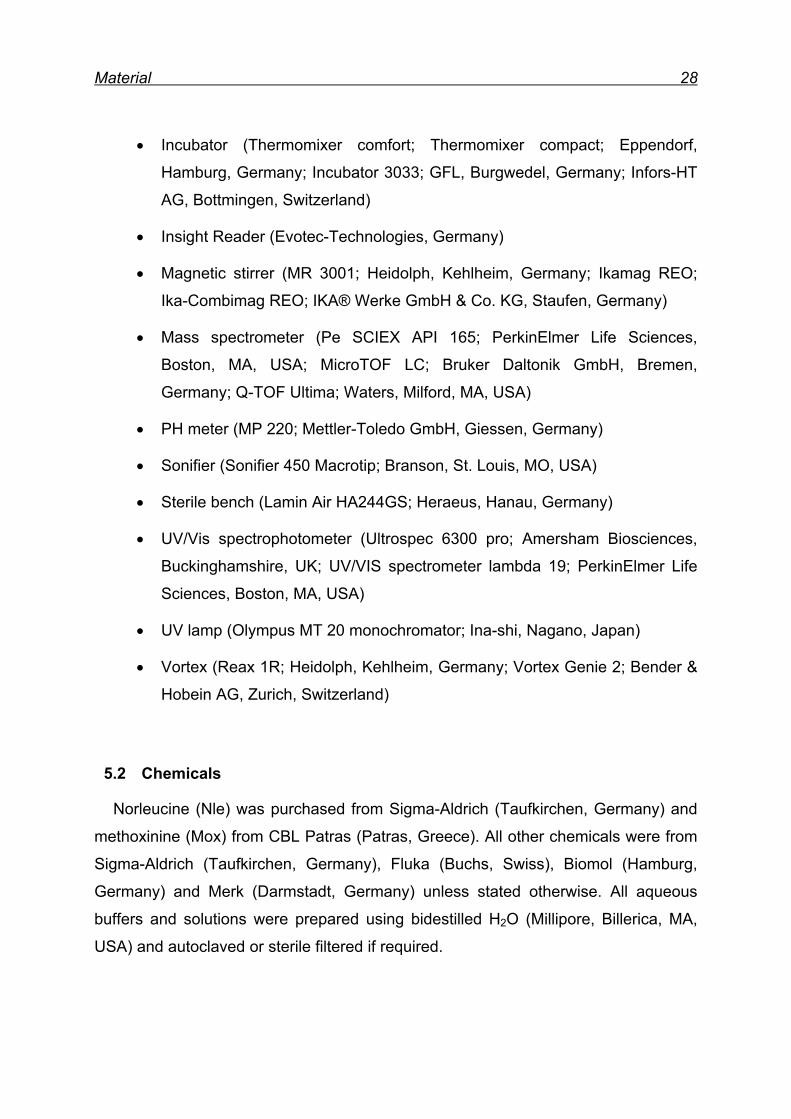
• Incubator (Thermomixer comfort; Thermomixer compact; Eppendorf,
Hamburg, Germany; Incubator 3033; GFL, Burgwedel, Germany; Infors-HT
AG, Bottmingen, Switzerland)
• Insight Reader (Evotec-Technologies, Germany)
• Magnetic stirrer (MR 3001; Heidolph, Kehlheim, Germany; Ikamag REO;
Ika-Combimag REO; IKA® Werke GmbH & Co. KG, Staufen, Germany)
• Mass spectrometer (Pe SCIEX API 165; PerkinElmer Life Sciences,
Boston, MA, USA; MicroTOF LC; Bruker Daltonik GmbH, Bremen,
Germany; Q-TOF Ultima; Waters, Milford, MA, USA)
• PH meter (MP 220; Mettler-Toledo GmbH, Giessen, Germany)
• Sonifier (Sonifier 450 Macrotip; Branson, St. Louis, MO, USA)
• Sterile bench (Lamin Air HA244GS; Heraeus, Hanau, Germany)
• UV/Vis spectrophotometer (Ultrospec 6300 pro; Amersham Biosciences,
Buckinghamshire, UK; UV/VIS spectrometer lambda 19; PerkinElmer Life
Sciences, Boston, MA, USA)
• UV lamp (Olympus MT 20 monochromator; Ina-shi, Nagano, Japan)
• Vortex (Reax 1R; Heidolph, Kehlheim, Germany; Vortex Genie 2; Bender &
Hobein AG, Zurich, Switzerland)
5.2 Chemicals
Norleucine (Nle) was purchased from Sigma-Aldrich (Taufkirchen, Germany) and
methoxinine (Mox) from CBL Patras (Patras, Greece). All other chemicals were from
Sigma-Aldrich (Taufkirchen, Germany), Fluka (Buchs, Swiss), Biomol (Hamburg,
Germany) and Merk (Darmstadt, Germany) unless stated otherwise. All aqueous
buffers and solutions were prepared using bidestilled H2O (Millipore, Billerica, MA,
USA) and autoclaved or sterile filtered if required.
Material 29
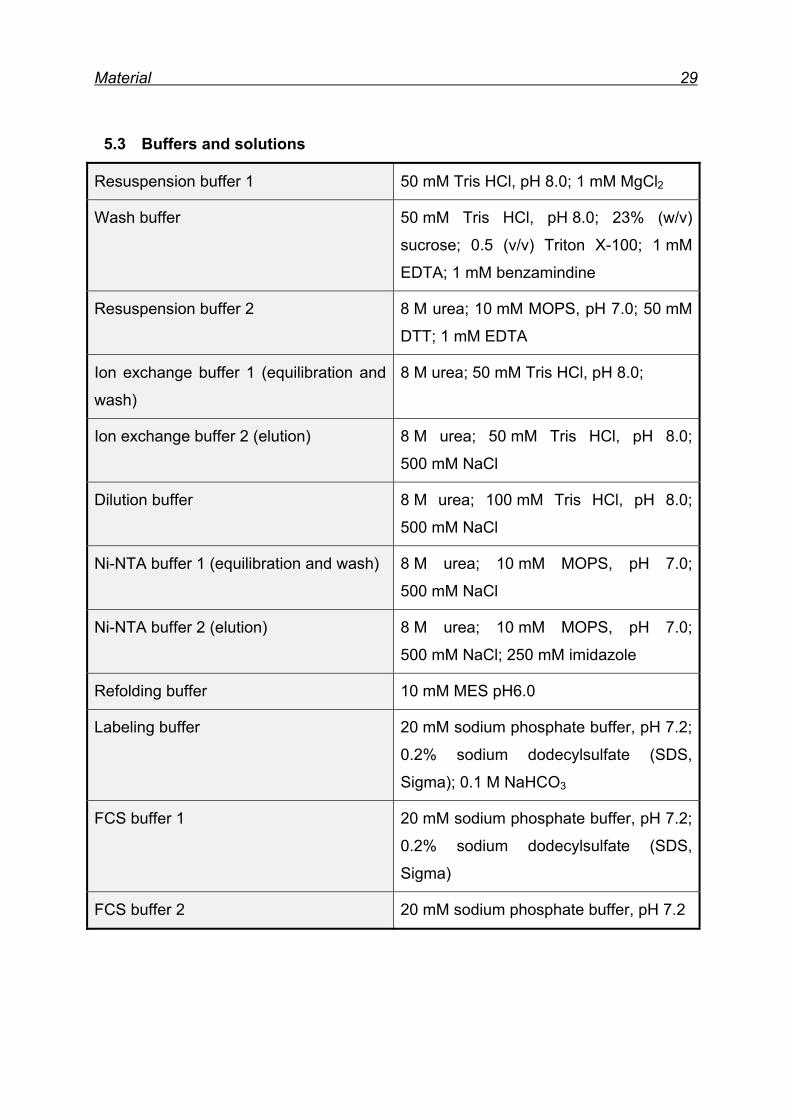
5.3 Buffers and solutions
Resuspension buffer 1 50 mM Tris HCl, pH 8.0; 1 mM MgCl2
Wash buffer 50 mM Tris HCl, pH 8.0; 23% (w/v)
sucrose; 0.5 (v/v) Triton X-100; 1 mM
EDTA; 1 mM benzamindine
Resuspension buffer 2 8 M urea; 10 mM MOPS, pH 7.0; 50 mM
DTT; 1 mM EDTA
Ion exchange buffer 1 (equilibration and
wash)
8 M urea; 50 mM Tris HCl, pH 8.0;
Ion exchange buffer 2 (elution) 8 M urea; 50 mM Tris HCl, pH 8.0;
500 mM NaCl
Dilution buffer 8 M urea; 100 mM Tris HCl, pH 8.0;
500 mM NaCl
Ni-NTA buffer 1 (equilibration and wash) 8 M urea; 10 mM MOPS, pH 7.0;
500 mM NaCl
Ni-NTA buffer 2 (elution) 8 M urea; 10 mM MOPS, pH 7.0;
500 mM NaCl; 250 mM imidazole
Refolding buffer 10 mM MES pH6.0
Labeling buffer 20 mM sodium phosphate buffer, pH 7.2;
0.2% sodium dodecylsulfate (SDS,
Sigma); 0.1 M NaHCO3
FCS buffer 1 20 mM sodium phosphate buffer, pH 7.2;
0.2% sodium dodecylsulfate (SDS,
Sigma)
FCS buffer 2 20 mM sodium phosphate buffer, pH 7.2
Material 30
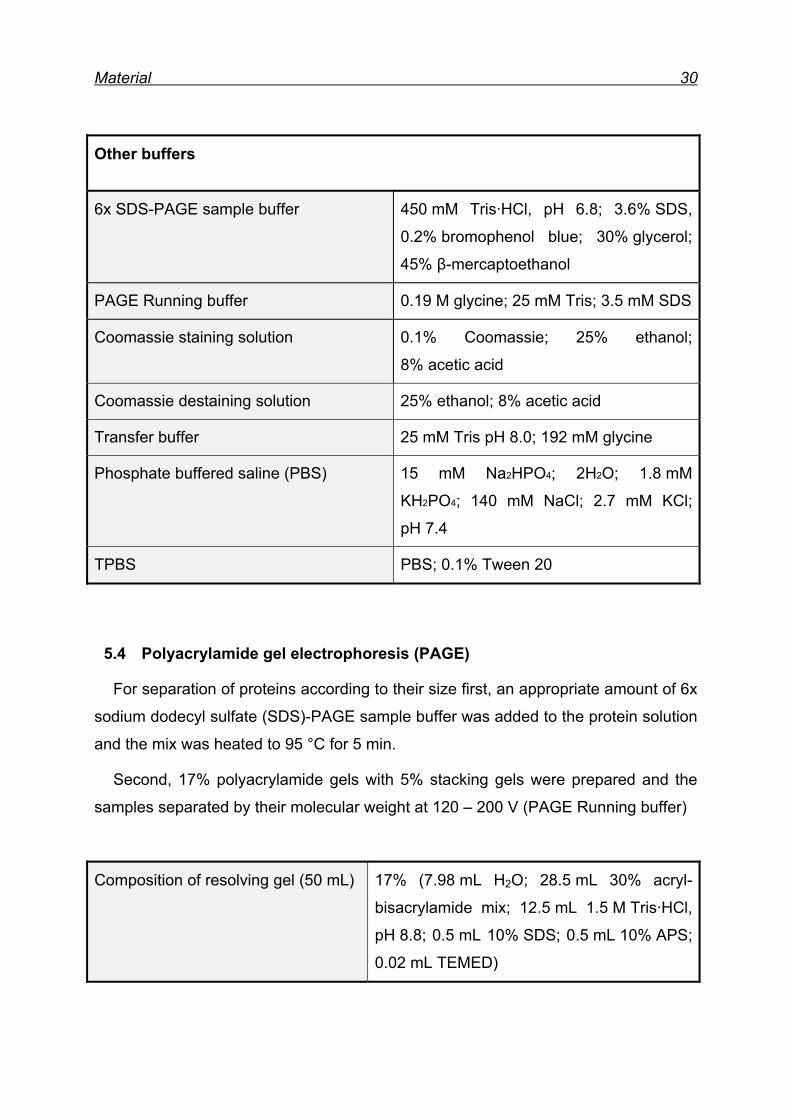
Other buffers
6x SDS-PAGE sample buffer 450 mM Tris·HCl, pH 6.8; 3.6% SDS,
0.2% bromophenol blue; 30% glycerol;
45% β-mercaptoethanol
PAGE Running buffer 0.19 M glycine; 25 mM Tris; 3.5 mM SDS
Coomassie staining solution 0.1% Coomassie; 25% ethanol;
8% acetic acid
Coomassie destaining solution 25% ethanol; 8% acetic acid
Transfer buffer 25 mM Tris pH 8.0; 192 mM glycine
Phosphate buffered saline (PBS) 15 mM Na2HPO4; 2H2O; 1.8 mM
KH2PO4; 140 mM NaCl; 2.7 mM KCl;
pH 7.4
TPBS PBS; 0.1% Tween 20
5.4 Polyacrylamide gel electrophoresis (PAGE)
For separation of proteins according to their size first, an appropriate amount of 6x
sodium dodecyl sulfate (SDS)-PAGE sample buffer was added to the protein solution
and the mix was heated to 95 °C for 5 min.
Second, 17% polyacrylamide gels with 5% stacking gels were prepared and the
samples separated by their molecular weight at 120 – 200 V (PAGE Running buffer)
Composition of resolving gel (50 mL) 17% (7.98 mL H2O; 28.5 mL 30% acryl-
bisacrylamide mix; 12.5 mL 1.5 M Tris·HCl,
pH 8.8; 0.5 mL 10% SDS; 0.5 mL 10% APS;
0.02 mL TEMED)
Material 31
Composition of stacking gel (50 mL): 34 mL H2O; 8.5 mL 30% acryl-bisacrylamide
mix; 6.25 mL 1.5 M Tris·HCl, pH 6.8; 0.5 mL
10% SDS; 0.5 mL 10% APS;
0.05 mL TEMED
Third, the gels were stained by Coomassie staining solution, and finally destained
by Coomassie destaining solution.
5.5 Media
For bacterial growth, fermentation, and protein expression two different media
were used: LB medium and New Minimal Medium (NMM) (86).
The components of LB medium, BactoTM Tryptone and BactoTM Yeast Extract
were purchased from BD Biosciences (San José, CA, USA). 10 g BactoTM Tryptone,
5 g BactoTM Yeast Extract, and 10 g NaCl were dissolved in 1 L H2O and autoclaved
before usage.
For the incorporation of non-canonical amino acids into protein via SPI method,
NMM was used as fermentation medium. For its preparation, first an amino acid mix
at pH 7.0 was prepared which contained all amino acids except Met. For this
purpose, 0.5 g of each amino acid (as lyophilized powder) were dissolved in
22 mL 1 M KH2PO4, 48 mL 1 M K2HPO4 and H2O add 1 L. The solution was sterile
filtered before usage. Sterile NMM components were mixed as follows: 7.5 mM
(NH4)2SO4; 8.5 mM NaCl; 22.5 mM KH2PO4; 50 mM K2HPO4; 1 mM MgSO4; 20 mM
glucose; 100 mL/(L NMM) amino acid mix; 1 µg/(mL NMM) CaCl2; 1 µg/(mL NMM)
FeSO4; trace elements 0,01 ng each/(mL NMM) (86); 10 µg/(mL NMM) thiamine;
10 µg/mL NMM biotin and the appropriate antibiotics (100 µg/ml ampicillin and
34 µg/ml chloramphenicol). The stock solutions of Met, Nle and Mox (100 mg/mL)
were freshly made and sterile filtered before usage and routinely used for expression
and incorporation at a concentration of 5.0 mM without special precautions.
Material 32
5.6 Enzymes
Lysozyme (application: protein purification)
DNAse I (application: protein purification)
RNAse A (application: protein purification)
Trypsin (application: mass spectrometry; Promega, Madison, WI, USA)
Proteinase K (application: FCS quality control; Merck (Darmstadt, Deutschland)
5.7 Protein molecular weight marker
PageRulerTM Prestained Protein Ladder; Fermentas, St. Leon-Rot, Germany
5.8 Plasmids
5.8.1 pET17b-hPrP(23-231)WT81
The pET17b-hPrP(23-231)WT81 encodes for human PrP23-231 M129 (87), which
is under the control of the T7 promoter and provides an ampicillin resistant. The
coding sequence of the recombinant full-length human prion protein rhPrPC(23-231)
contains beside the codon for the initial methionine (Met(1)) also serine (Ser(2)) as
second amino acid (88). This amino acid composition should facilitate N-terminal
Met-excision (89) and subsequently increase protein stability against degradation,
according to the N-End Rules (90). Therefore, the gene rhPrPC(23-231) encodes for
211 amino acids, whereas in the purified proteins N-terminal Met residue is expected
to be excised.
5.8.2 pRIL
The chloramphenicol resistant rare codon plasmid, pRIL (Stratagene, La Jolla, CA,
USA) is a derivative of pACYC184 plasmid and contains tRNA-genes for the rare
Arg, Ile, and Leu codons (AGG, AGA, AUA, and CUA, respectively).
Material 33
5.9 Antibiotics
Ampicillin (working concentration 100 µg/mL)
Chloramphenicol (working concentration 34 µg/mL)
5.10 Bacterial strains
Met-auxotrophic Escherichia coli strain B834(DE3) (F-ompT hsdSD(rD- mD-) gal
dcm metE λ(DE3)) (Novagen Merck Chemicals Ltd., Nottingham, UK).
5.11 Fluorescent dyes
Alexa488 (Alexa Fluor-488-O-Succinimidylester) Molecular Probes (Eugene,
USA); MW = 643.26 Da
Alexa647 (Alexa Fluor-647-O-Succinimidylester) Molecular Probes (Eugene,
USA); MW = 1300 Da
5.12 Antibodies
Primary antibody: mAb 385 (monoclonal mouse antibody, anti-hPrP octarepeats),
(ZNP, LMU, Martinsried, Germany)
Secondary antibody: goat anti-mouse IgG coupled to alkaline phosphatase
(Dianova, Hamburg, Germany)
5.13 Software
• Except standard software, Origin 6.1G (OriginLab Corporation,
Northampton, MA, USA) was applied for data analysis.
• The calculated composition of the different secondary structures of the two
peptide analogues, Nle and Mox, of the Dado-Gellmann model peptide was
computed with the CONTIN software (Reference SMP56)/CDPro Analysis.
Material 34
• Orbitrap ESI-MS/MS data analysis was performed with the 1.0.9.19
MaxQuant software (Matrix Science, London, UK), supported by Mascot as
the database search engine for peptide identifications.
• The fluorescence data were analyzed by correlation analysis using the
FCSPPEvaluation software version 2.0 (Evotec OAI, Germany) as
described (91). Two-colour cross-correlation amplitudes G(0) were
determined using the same software.
Methods 35
6 Methods
6.1 Microbiological methods
6.1.1 Production of electrocompetent cells
First cells were incubated overnight at 37 °C in 5 mL LB medium without
antibiotics. On the following day, 1 L LB medium without antibiotics was inoculated
using the 5 mL overnight culture and incubated at 37 °C and 220 rpm until the OD600
of the cell culture was between 0.6 and 0.8. The cells were harvested and washed
twice with ice-cold 10% glycerol, subsequently. Finally the cell pellet was
resuspended in 5 mL 10% glycerol, aliquots à 100 µL were frozen in liquid nitrogen,
and kept at -80 °C until further use.
6.1.2 Transformation
Bacterial cells were transformed by electroporation. For this purpose, a 100 µL
competent cell aliquot of the appropriate cell strain was mixed with ~1 µg of the
required plasmid in an electroporation cuvette. The cell suspension was shocked by
1650 V, mixed with 1 mL chilled LB medium, and transferred to a sterile eppendorf
cup, subsequently. In the following, the cells were incubated at 37 °C and 800 rpm
for 1 h. Finally, the cells were distributed on agarose gel plates with the appropriate
antibiotics.
On the next day, single colonies were transferred to 5 mL of LB medium with the
appropriate antibiotics and incubated overnight at 37 °C and 220 rpm.
6.1.3 Limitation test
For the incorporation of non-canonical amino acids into proteins during protein
expression it is absolutely necessary that the applied cell strain is auxotrophic for the
respective canonical amino acid. Therefore, prior to the incorporation experiment, it is
essential to prove the cell´s auxotrophy and determine the optimal amino acid
concentration for biomass production by a limitation test. For this purpose,
5 mL NMM with appropriate antibiotics and different concentrations of L-Met were
inoculated with 50 µL of pre-culture. These suspensions were incubated overnight at
Methods 36
37 °C and 220 rpm and on the next day, cell growth was checked by measurement of
OD600. The amino acid concentration which permitted cell growth up to an OD600
between 0.6 and 0.8 was utilized as limiting concentration for biomass production for
incorporation experiments.
6.1.4 Expression test
To select the best expression clone, 1 mL of each overnight cell culture was
transferred to a sterile eppendorf cup and the protein expression was induced by
adding 1 mM IPTG. The cell cultures were incubated at 800 rpm and 30 °C. In
parallel, a non-induced sample (without addition of IPTG) was prepared.
After incubation, the cells were first harvested, second resuspended in 50 µL H2O,
and finally heated to 95 °C for 5 min after addition of 10 µL 6x SDS sample buffer.
Afterwards, protein expression was checked by SDS-PAGE and the best expressing
clone was selected for subsequent protein expression.
6.1.5 Protein fermentation and expression of full length rhPrPC
All fermentation and expression experiments were performed in the above
described synthetic medium (NMM). Transformed cells were grown in 5 mL LB-
medium overnight with 100 µg/mL ampicillin and 34 µg/mL chloamphenicol. 100 µL
of the overnight culture were used for the inoculation of 1 L NMM. Cells were grown
to mid-log phase (OD600 0.6-0.8) in NMM containing limiting amounts (0.04 mM) of L-
Met. Protein expression in Met starved cells was induced with 1 mM isopropyl-β-D-1-
thiogalactopyranoside (IPTG; Applichem, Darmstadt, Germany) and 5.0 mM L-Met,
D, L-Nle or L-Mox was concomitantly added. Proteins expression was performed for
4 hours to overnight at 30 °C with aeration achieved by vigorous shaking (220 rpm).
After cell harvest, cell pellets were resuspended in resuspension buffer 1 and
frozen at -20 °C until further purification.
6.1.6 Protein purification of full length rhPrPC
Proteins were expressed in inclusion bodies. The isolation and refolding protocol
was identical for all variants. Based on the published protocols (92) cells pellets were
thaw and disrupted in a French pressure cell (15000 psi; SLM-Aminco). Lysozym,
Methods 37
DNase and RNase were added to the disrupted cells and were vigorously shaked for
20 min at 30°C. The inclusion bodies were sedimented by centrifugation (25 min,
49000g, 4 °C) and washed twice with wash buffer. The pellet was dissolved in
resuspension buffer 2 and was centrifuged (30 min, 130000g, 22°C). The
supernatant was applied to linked Fractogel EMD-DEAE and Fractogel EMD-SO3 ion
exchange columns (Merck KGaA, Darmstadt, Germany), 25 mL and 15 mL
respectively, which were equilibrated in ion exchange buffer 1. Proteins were eluted
from the Fractogel EMD-SO3 column with ion exchange buffer 2. All fractions
containing solubilized rhPrPCs were pooled and diluted in dilution buffer to a protein
concentration of 0.05 mg/mL. Subsequently, the CuSO4 was added to a final
concentration of 2 µM, and the solution was stirred for 4 h at room temperature. As a
result, the formation of the single disulfide bond takes place. The oxidation reaction
was quenched by addition of 1 mM EDTA. Excessive EDTA was bound with the
addition of 1 mM NiAc and pH was adjusted to about 6.8 with 1 M HCl. The oxidized
PrPCs were applied to 5 mL Chelating Sepharose Fast Flow (GE Healthcare,
Germany), pre-charged with NiAc according to the manufacturer's recommendations
and pre-equilibrated with Ni-NTA buffer 1. The bound proteins were eluted with Ni-
NTA buffer 2. Protein containing fractions were pooled and refolding was done in 50-
fold volume in refolding buffer at 4 °C overnight. Refolded proteins were concentrated
and stored at 4 °C.
6.1.7 Protein purity and concentration determination
The purity of the recombinant protein samples was demonstrated by SDS-PAGE,
HPLC-profile analysis and electrospray mass spectra analysis (ESI-MS).
Concentrations of rhPrPC samples were determined using the UV/VIS spectrometer
lambda 19 (PerkinElmer Life Sciences, Boston, MA, USA) assuming an extinction
coefficient of 57932.5 M-1cm-1 as calculated from the amino acid composition using
SwissProtParam software tools (Lambert-Beer-Equation ,
A = absorbance; ε = molar extinction coefficient; c = concentration; d = path length).
Protein concentrations were calculated as described elsewhere (93).
Methods 38
6.2 Spectroscopy and spectrometry
6.2.1 Mass spectrometry (Orbitrap ESI-MS/MS)
6.2.1.1 In-solution Digestion.
Samples were diluted 4 X in a 6 M urea/2 M thiourea (in 10 mM Hepes, pH 8.0) to
reach denaturating conditions. To reduce disulfide bonds 100 mM DTT was added to
a final concentration of 10 mM in the protein solutions and incubated for 45 min at
RT. The resulting free thiol (-SH) groups were subsequently alkylated with
iodoacetamide (55 mM final concentration) for 30 min at RT in the dark. The
solutions were then digested with Lys-C (Wako) (1 µg/50 µg sample protein for 3 h at
RT) diluted 4X with 50 mM NH4HCO3, and digested with Trypsin (Promega)
(1 µg/50 µg sample protein for 16 h at 37 °C) (94). Peptide mixtures were then
desalted by using Stop and go extraction (STAGE) tips and the eluted peptides used
for mass spectrometric analysis.
6.2.1.2 NanoLC-MS/MS
All digested peptide mixtures were separated by on-line nanoLC and analyzed by
electrospray tandem mass spectrometry. The experiments were performed on an
Agilent 1200 nanoflow system connected to an LTQ Orbitrap mass spectrometer
(Thermo Electron, Bremen, Germany) equipped with a nanoelectrospray ion source
(Proxeon Biosystems, Odense, Denmark). Binding and chromatographic separation
of the peptides took place in a 15 cm fused silica emitter (75 µm inner diameter from
Proxeon Biosystems, Odense, Denmark) in-house packed with reversed-phase
ReproSil-Pur C18-AQ 3 µm resin (Dr. Maisch GmbH, Ammerbuch-Entringen,
Germany). Peptides were eluted with a 140 min linear gradient of 98% solvent A
(0.5% acetic acid (Fluka) in H2O) to 50% solvent B (80% acetonitrile (Merck) and
0.5% acetic acid in H2O). The precursor ion spectra were acquired in the Orbitrap
analyzer (m/z 300–1800, R = 60,000, and ion accumulation to a target value of
1,000,000), and the five most intense ions were fragmented and recorded in the ion
trap. The lock mass option enabled accurate mass measurement in both MS and
Orbitrap MS/MS mode as described previously (95). Target ions already selected for
MS/MS were dynamically excluded for 90 s.
Methods 39
6.2.1.3 Peptide Identification via MASCOT Search
The data analysis was performed with the MaxQuant software as described (96)
supported by Mascot as the database search engine for peptide identifications.
Peaks in MS scans were determined as three-dimensional hills in the mass-retention
time plane. MS/MS peak lists were filtered to contain at most six peaks per 100 Da
interval and searched by Mascot (Matrix Science) against a forward and reversed
version of the IPI Human database. The initial mass tolerance in MS mode was set to
7 ppm. and MS/MS mass tolerance was 0.5 Da. Cysteine carbamidomethylation was
searched as a fixed modification, whereas oxidized Met, Tyr, Trp and His were
searched as variable modifications.
6.2.2 Electrospray mass spectrometry (ESI-MS)
The extent of replacement of the native Met residues by Nle or Mox was confirmed
by high resolution mass analysis using liquid chromatography (LC) coupled with the
electrospray ionization-time of flight (ESI-TOF) mass spectrometer MicroTOF-LC
from Bruker Daltonics (Bremen, Germany). Samples were separated by Symmetry
C4 column (Waters, Eschborn, Germany) with a flow rate of 250 µL/min and 15 min
linear gradient from 20% - 80% acetonitrile/0.05% trifluoroacetic acid.
6.2.3 Circular dichroism (CD) spectroscopy and melting curves
The far-UV CD spectra of full-length rhPrPCs were recorded on a dichrograph
JASCO J-715 (JASCO International Co., Ltd., Tokio, Japan. All spectra are averages
of four scans and are reported as mean residue molar ellipticity ([θ]R) in
degrees x cm2 x dmol-1. Quartz cells (110-QS Hellma) of 0.1 cm optical path length
and protein concentrations of 8.73 µM were used. Ellipticity changes were recorded
between 200 nm and 260 nm at 37 °C in 10 mM MES pH 6.0. Melting curves were
determined by monitoring the changes in dichroic intensity at 222 nm in function of
temperature increase. Thermal denaturation experiments were performed in the
range from 4 °C to 95 °C, with a heating rate of 30 °C h-1. Temperature was
controlled by a JASCO Peltier type FDCD attachment (model PFD-350S/350L;
JASCO International Co., Ltd., Tokyo, Japan). The fractions of unfolded protein were
Methods 40
calculated from the corresponding ellipticity data as well as the midpoint of
denaturation (melting temperature or Tm value) (92).
6.2.4 Quantification of individual Met residue oxidation in rhPrPC
The oxidation of Met-rhPrPC was performed at 0.4 mM protein concentration with
0.5, 5 and 25 equiv. sodium periodate in 10 mM MES, pH 6.0, at 0 °C and overnight,
according to well established protocols (97). After tryptic digestion the peptide
mixture was analyzed by ESI-MS. Samples were separated by Symmetry Varian
Pursuit XRs ultra C18 column (Varian, Germany) with a flow rate of 250 µL/min and
80 min linear gradient from 30% - 90% acetonitrile/0.05% trifluoroacetic acid.
6.3 Peptide synthesis
The two peptides were kindly provided by the Microchemistry Core Facility (MPI of
Biochemistry, Mrs. S. Andric). The peptides were synthesized, using the 433A
Peptide Synthesizer (Applied Biosystems, USA). After synthesis a test cleavage from
the resin was done, which was further analyzed using an analytical RP-HPLC
(Waters, Eschborn, Germany), using an EC 125/4 Nucleosil 100-5 C8 colum
(Macherey Nagel, Düren, Germany), with a flow rate of 1.5 mL/min. The used
gradient was from 100% A (2% H3PO4 (95%) and acetonitrile (5%)) to 100% B
(2% H3PO4 (10%) and acetonitrile (90%)) in 28 min. In addition ESI-MS was
performed. Subsequently, remain of the synthesized peptides were cleaved from the
resin with 96% triflouracetic acid, 2% triisopropylsilane and 2% water. Afterwards the
peptides were precipitated using n-hexane/tert-butylmethylether (1:2, v/v). The
precipitated Nle-peptide (83 g) was dissolved in 10% acetic acid and 90% water. The
Mox-peptide (55 g), which was less soluble, was dissolved in 5% triflouracetic acid,
25% acetonitrile and 70% water. The purification of the peptide solutions was done
using a preparative RP-HPLC (Gilson Abimed, Langenfeld, Germany). For that
purpose an EC 125/4 Nucleosil 100-5 C18 column (Macherey Nagel, Düren,
Germany) with a flow rate of 1.2 mL/min and a gradient of 10% - 90% buffer B
(buffer A (0.1% triflouracetic acid in water) and buffer B (0.08% triflouracetic acid in
acetonitrile) in 90 min was used. The correct mass of the peptides were confirmed
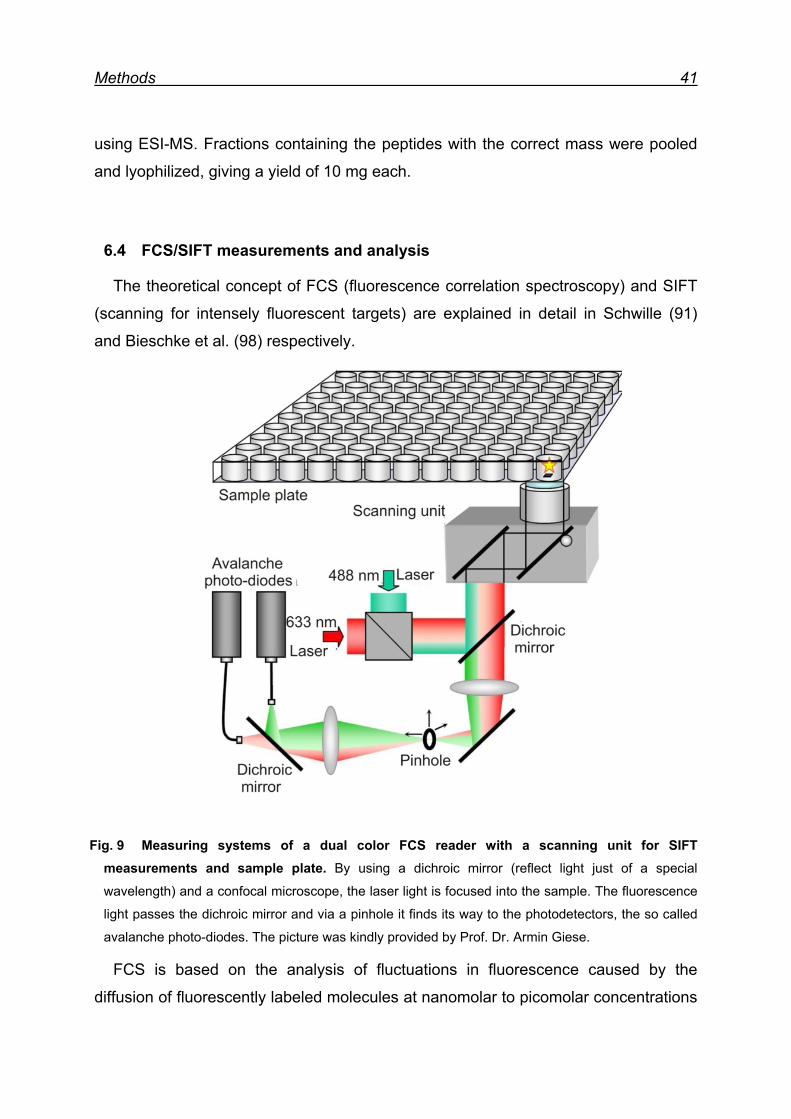
Methods 41
using ESI-MS. Fractions containing the peptides with the correct mass were pooled
and lyophilized, giving a yield of 10 mg each.
6.4 FCS/SIFT measurements and analysis
The theoretical concept of FCS (fluorescence correlation spectroscopy) and SIFT
(scanning for intensely fluorescent targets) are explained in detail in Schwille (91)
and Bieschke et al. (98) respectively.
Fig. 9 Measuring systems of a dual color FCS reader with a scanning unit for SIFT measurements and sample plate. By using a dichroic mirror (reflect light just of a special
wavelength) and a confocal microscope, the laser light is focused into the sample. The fluorescence
light passes the dichroic mirror and via a pinhole it finds its way to the photodetectors, the so called
avalanche photo-diodes. The picture was kindly provided by Prof. Dr. Armin Giese.
FCS is based on the analysis of fluctuations in fluorescence caused by the
diffusion of fluorescently labeled molecules at nanomolar to picomolar concentrations
Methods 42
through an open detection volume of approximately 1 fL defined by a focused laser
beam. When molecules labeled with two different fluorophores form complexes, the
amount of complex formation can be easily monitored and quantified by cross-
correlation analysis in a dual-color setup (91, 98-101).
FCS - using a stationary focus - and SIFT - using a mobile focus - measurements
were carried out (Insight Reader, Evotec-Technologies, Germany) with dual-color
excitation at 488 nm and 633 nm, using a 40 x 1.2 NA microscope objective
(Olympus, Japan) and a pinhole diameter of 70 µm at FIDA setting (Fig. 9). Excitation
power was 200 µW at 488 nm and 300 µW at 633 nm. Measurement time was 5 x
10 sec. For scanned measurements, scanning parameters were set to 100 µm scan
path length, 50 Hz beamscanner frequency, and 2000 µm positioning table
movement. This is equivalent to approximately 10 mm/s scanning speed. The
temperature for all measurements was 20-25 °C. The fluorescence data were
analyzed by correlation analysis using the FCSPPEvaluation software version 2.0
(Evotec OAI, Germany) as described (91). Two-color cross-correlation amplitudes
G(0) were determined using the same software. Evaluation of SIFT data in two-
dimensional intensity distribution histograms was performed as described previously
(98).
To quantify aggregate formation, cross-correlation analysis was used, because
dual-color cross-correlation analysis allows more sensitive detection and
quantification than single-color auto-correlation analysis. Moreover, cross-correlation
analysis can be combined with scanning, which further improves sensitivity of
aggregate detection (99).
6.4.1 Fluorescent labeling of rhPrPC
Protein labeling was performed with the amino-reactive fluorescent dyes Alexa
Fluor-488- and Alexa Fluor-647-O-succinimidylester (Molecular Probes, USA),
respectively. The fluorescent dyes (2 mg/mL in DMSO) were added to a solution of
8.73 µM (10 µg/50 µL labeling buffer) rhPrPC at a molar ratio of 3:1. After incubation
for 2 h at room temperature in darkness, unbound fluorophores were separated by
two filtration steps in Microspin columns filled with Sephadex G25 (Pharmacia
Biotech, Sweden), equilibrated with 20 mM sodium phosphate buffer (pH 7.2)
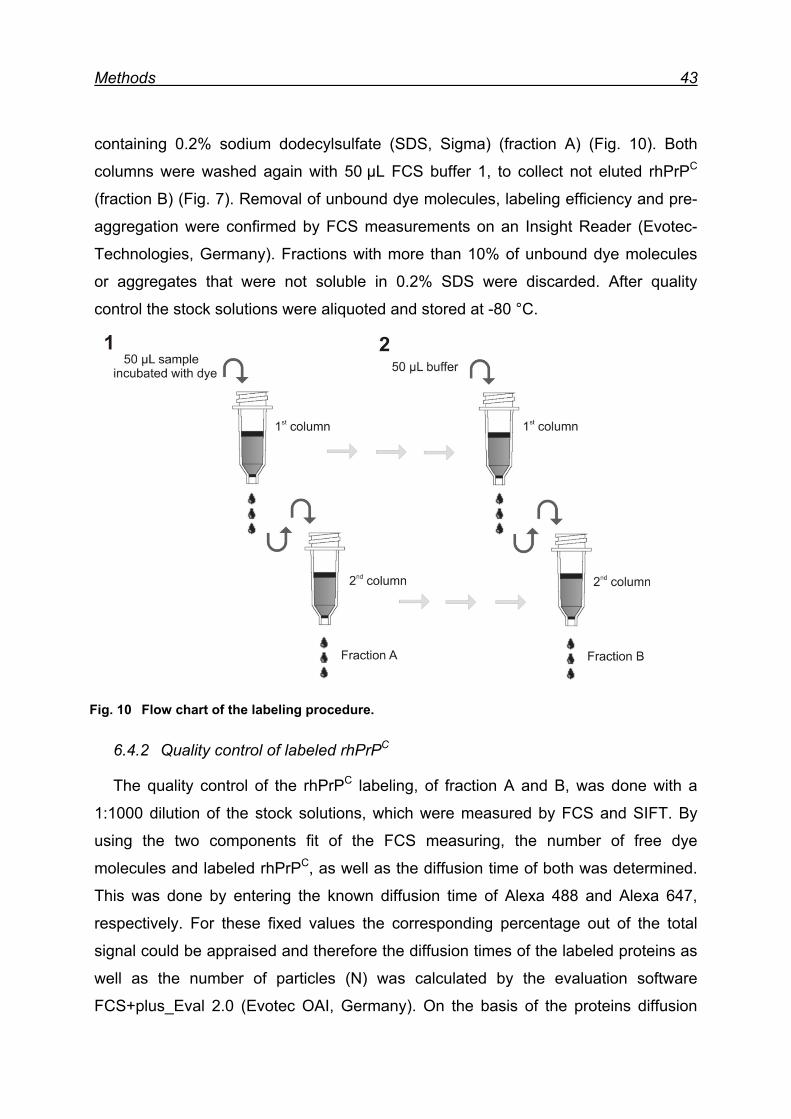
Methods 43
containing 0.2% sodium dodecylsulfate (SDS, Sigma) (fraction A) (Fig. 10). Both
columns were washed again with 50 µL FCS buffer 1, to collect not eluted rhPrPC
(fraction B) (Fig. 7). Removal of unbound dye molecules, labeling efficiency and pre-
aggregation were confirmed by FCS measurements on an Insight Reader (Evotec-
Technologies, Germany). Fractions with more than 10% of unbound dye molecules
or aggregates that were not soluble in 0.2% SDS were discarded. After quality
control the stock solutions were aliquoted and stored at -80 °C.
Fig. 10 Flow chart of the labeling procedure.
6.4.2 Quality control of labeled rhPrPC
The quality control of the rhPrPC labeling, of fraction A and B, was done with a
1:1000 dilution of the stock solutions, which were measured by FCS and SIFT. By
using the two components fit of the FCS measuring, the number of free dye
molecules and labeled rhPrPC, as well as the diffusion time of both was determined.
This was done by entering the known diffusion time of Alexa 488 and Alexa 647,
respectively. For these fixed values the corresponding percentage out of the total
signal could be appraised and therefore the diffusion times of the labeled proteins as
well as the number of particles (N) was calculated by the evaluation software
FCS+plus_Eval 2.0 (Evotec OAI, Germany). On the basis of the proteins diffusion
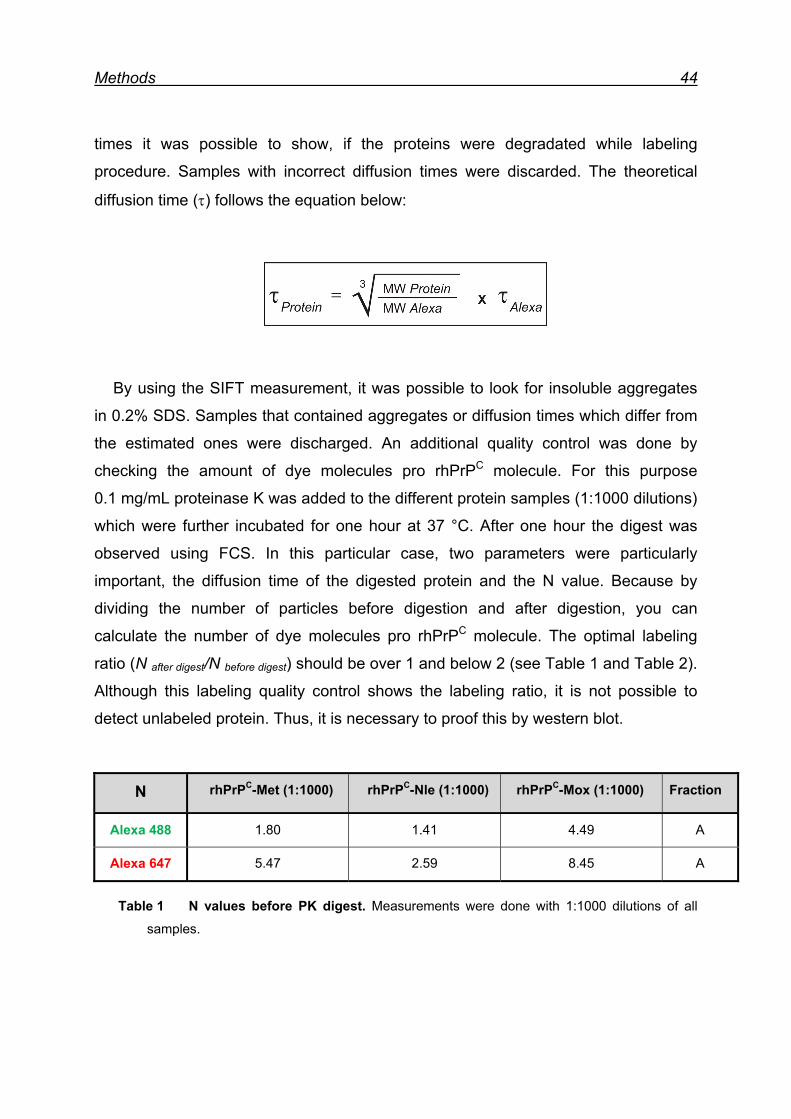
Methods 44
times it was possible to show, if the proteins were degradated while labeling
procedure. Samples with incorrect diffusion times were discarded. The theoretical
diffusion time (τ) follows the equation below:
By using the SIFT measurement, it was possible to look for insoluble aggregates
in 0.2% SDS. Samples that contained aggregates or diffusion times which differ from
the estimated ones were discharged. An additional quality control was done by
checking the amount of dye molecules pro rhPrPC molecule. For this purpose
0.1 mg/mL proteinase K was added to the different protein samples (1:1000 dilutions)
which were further incubated for one hour at 37 °C. After one hour the digest was
observed using FCS. In this particular case, two parameters were particularly
important, the diffusion time of the digested protein and the N value. Because by
dividing the number of particles before digestion and after digestion, you can
calculate the number of dye molecules pro rhPrPC molecule. The optimal labeling
ratio (N after digest/N before digest) should be over 1 and below 2 (see Table 1 and Table 2).
Although this labeling quality control shows the labeling ratio, it is not possible to
detect unlabeled protein. Thus, it is necessary to proof this by western blot.
N rhPrPC-Met (1:1000) rhPrPC-Nle (1:1000) rhPrPC-Mox (1:1000) Fraction
Alexa 488 1.80 1.41 4.49 A
Alexa 647 5.47 2.59 8.45 A
Table 1 N values before PK digest. Measurements were done with 1:1000 dilutions of all
samples.
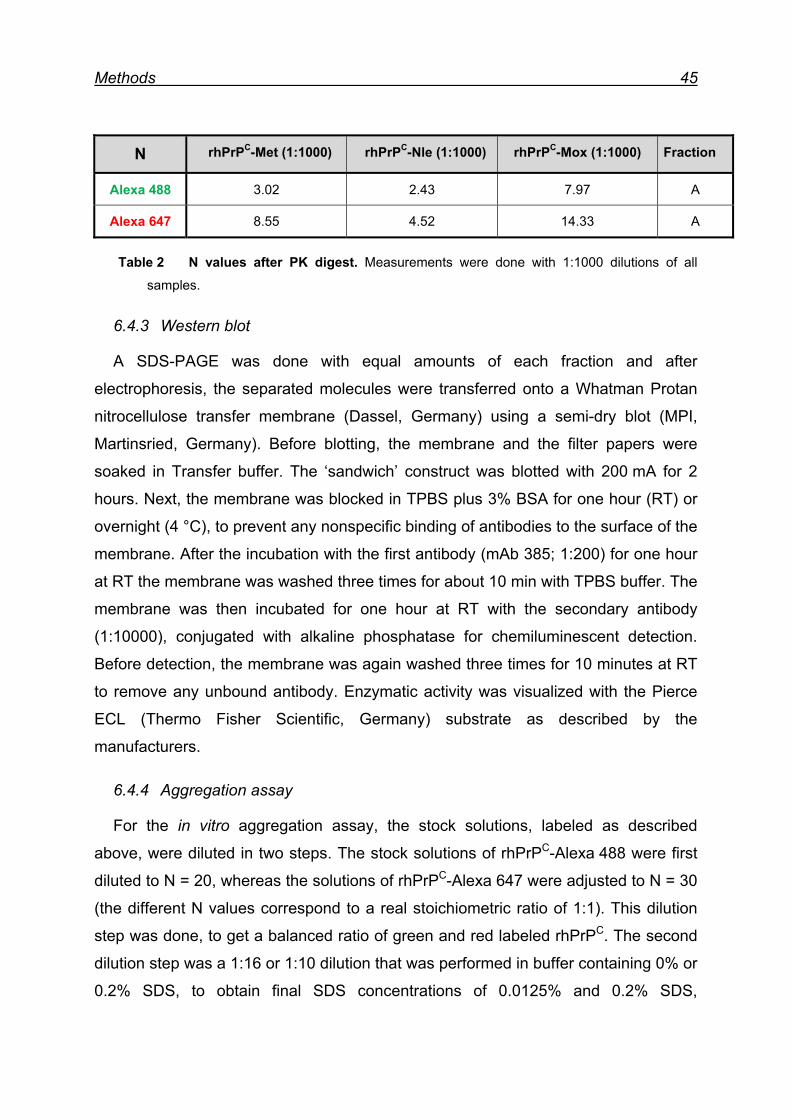
Methods 45
N rhPrPC-Met (1:1000) rhPrPC-Nle (1:1000) rhPrPC-Mox (1:1000) Fraction
Alexa 488 3.02 2.43 7.97 A
Alexa 647 8.55 4.52 14.33 A
6.4.3 Western blot
A SDS-PAGE was done with equal amounts of each fraction and after
electrophoresis, the separated molecules were transferred onto a Whatman Protan
nitrocellulose transfer membrane (Dassel, Germany) using a semi-dry blot (MPI,
Martinsried, Germany). Before blotting, the membrane and the filter papers were
soaked in Transfer buffer. The ‘sandwich’ construct was blotted with 200 mA for 2
hours. Next, the membrane was blocked in TPBS plus 3% BSA for one hour (RT) or
overnight (4 °C), to prevent any nonspecific binding of antibodies to the surface of the
membrane. After the incubation with the first antibody (mAb 385; 1:200) for one hour
at RT the membrane was washed three times for about 10 min with TPBS buffer. The
membrane was then incubated for one hour at RT with the secondary antibody
(1:10000), conjugated with alkaline phosphatase for chemiluminescent detection.
Before detection, the membrane was again washed three times for 10 minutes at RT
to remove any unbound antibody. Enzymatic activity was visualized with the Pierce
ECL (Thermo Fisher Scientific, Germany) substrate as described by the
manufacturers.
6.4.4 Aggregation assay
For the in vitro aggregation assay, the stock solutions, labeled as described
above, were diluted in two steps. The stock solutions of rhPrPC-Alexa 488 were first
diluted to N = 20, whereas the solutions of rhPrPC-Alexa 647 were adjusted to N = 30
(the different N values correspond to a real stoichiometric ratio of 1:1). This dilution
step was done, to get a balanced ratio of green and red labeled rhPrPC. The second
dilution step was a 1:16 or 1:10 dilution that was performed in buffer containing 0% or
0.2% SDS, to obtain final SDS concentrations of 0.0125% and 0.2% SDS,
Table 2 N values after PK digest. Measurements were done with 1:1000 dilutions of all
samples.
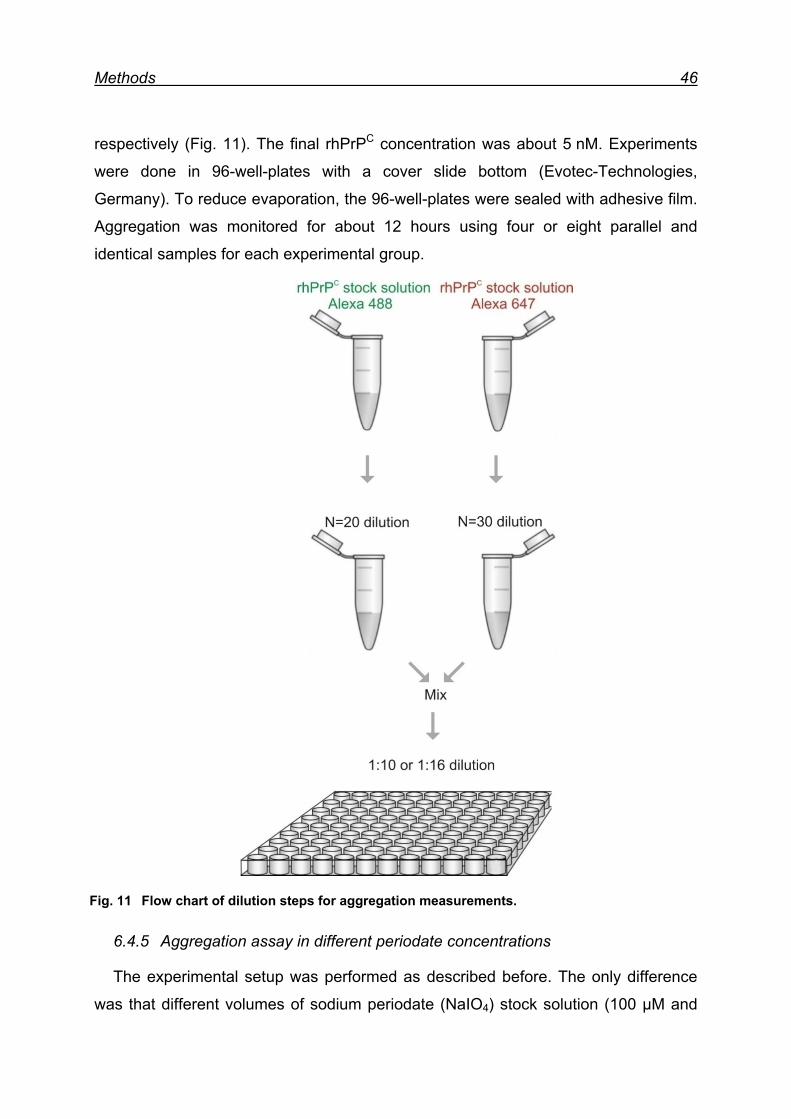
Methods 46
respectively (Fig. 11). The final rhPrPC concentration was about 5 nM. Experiments
were done in 96-well-plates with a cover slide bottom (Evotec-Technologies,
Germany). To reduce evaporation, the 96-well-plates were sealed with adhesive film.
Aggregation was monitored for about 12 hours using four or eight parallel and
identical samples for each experimental group.
Fig. 11 Flow chart of dilution steps for aggregation measurements.
6.4.5 Aggregation assay in different periodate concentrations
The experimental setup was performed as described before. The only difference
was that different volumes of sodium periodate (NaIO4) stock solution (100 µM and

Methods 47
50 mM) were pipetted in order to give final concentration of 2 µM, 200 µM and 10 mM
NaIO4 in the examined samples during the first dilution step. The samples were
incubated for about 12 hours and further diluted for measurement as described
before.
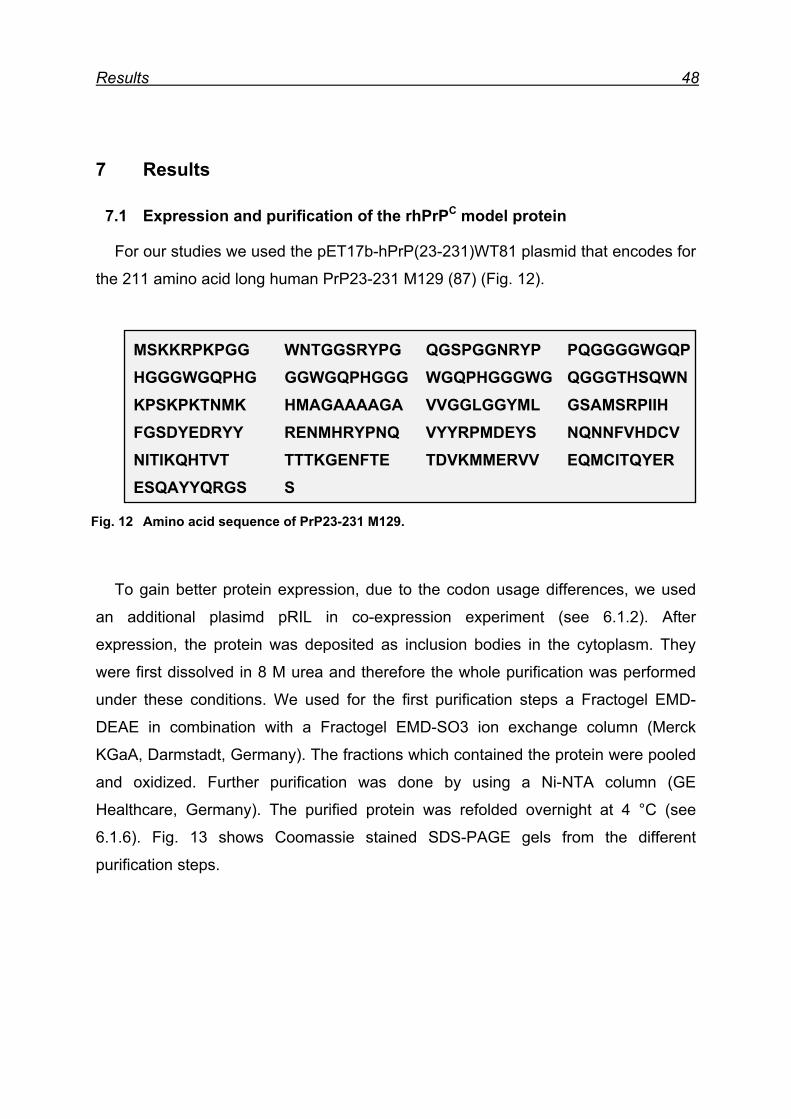
Results 48
7 Results
7.1 Expression and purification of the rhPrPC model protein
For our studies we used the pET17b-hPrP(23-231)WT81 plasmid that encodes for
the 211 amino acid long human PrP23-231 M129 (87) (Fig. 12).
MSKKRPKPGG WNTGGSRYPG QGSPGGNRYP PQGGGGWGQP HGGGWGQPHG GGWGQPHGGG WGQPHGGGWG QGGGTHSQWN KPSKPKTNMK HMAGAAAAGA VVGGLGGYML GSAMSRPIIH FGSDYEDRYY RENMHRYPNQ VYYRPMDEYS NQNNFVHDCV NITIKQHTVT TTTKGENFTE TDVKMMERVV EQMCITQYER ESQAYYQRGS S
Fig. 12 Amino acid sequence of PrP23-231 M129.
To gain better protein expression, due to the codon usage differences, we used
an additional plasimd pRIL in co-expression experiment (see 6.1.2). After
expression, the protein was deposited as inclusion bodies in the cytoplasm. They
were first dissolved in 8 M urea and therefore the whole purification was performed
under these conditions. We used for the first purification steps a Fractogel EMD-
DEAE in combination with a Fractogel EMD-SO3 ion exchange column (Merck
KGaA, Darmstadt, Germany). The fractions which contained the protein were pooled
and oxidized. Further purification was done by using a Ni-NTA column (GE
Healthcare, Germany). The purified protein was refolded overnight at 4 °C (see
6.1.6). Fig. 13 shows Coomassie stained SDS-PAGE gels from the different
purification steps.
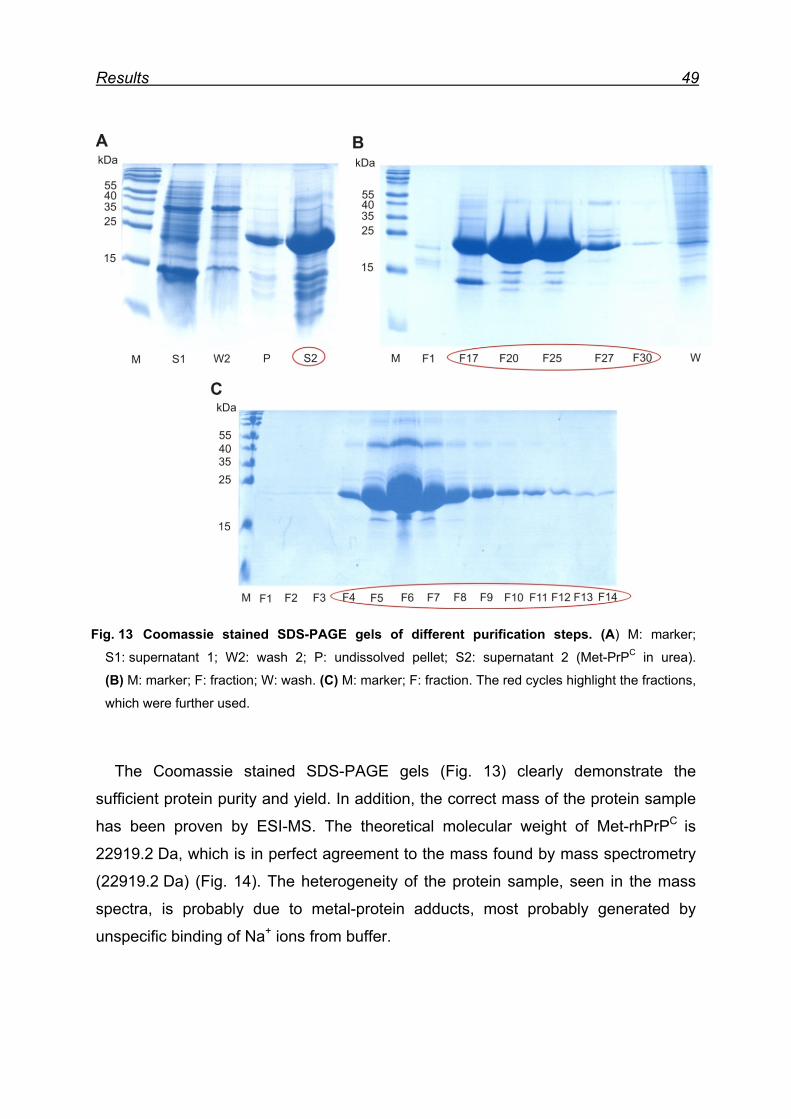
Results 49
Fig. 13 Coomassie stained SDS-PAGE gels of different purification steps. (A) M: marker;
S1: supernatant 1; W2: wash 2; P: undissolved pellet; S2: supernatant 2 (Met-PrPC in urea). (B) M: marker; F: fraction; W: wash. (C) M: marker; F: fraction. The red cycles highlight the fractions,
which were further used.
The Coomassie stained SDS-PAGE gels (Fig. 13) clearly demonstrate the
sufficient protein purity and yield. In addition, the correct mass of the protein sample
has been proven by ESI-MS. The theoretical molecular weight of Met-rhPrPC is
22919.2 Da, which is in perfect agreement to the mass found by mass spectrometry
(22919.2 Da) (Fig. 14). The heterogeneity of the protein sample, seen in the mass
spectra, is probably due to metal-protein adducts, most probably generated by
unspecific binding of Na+ ions from buffer.
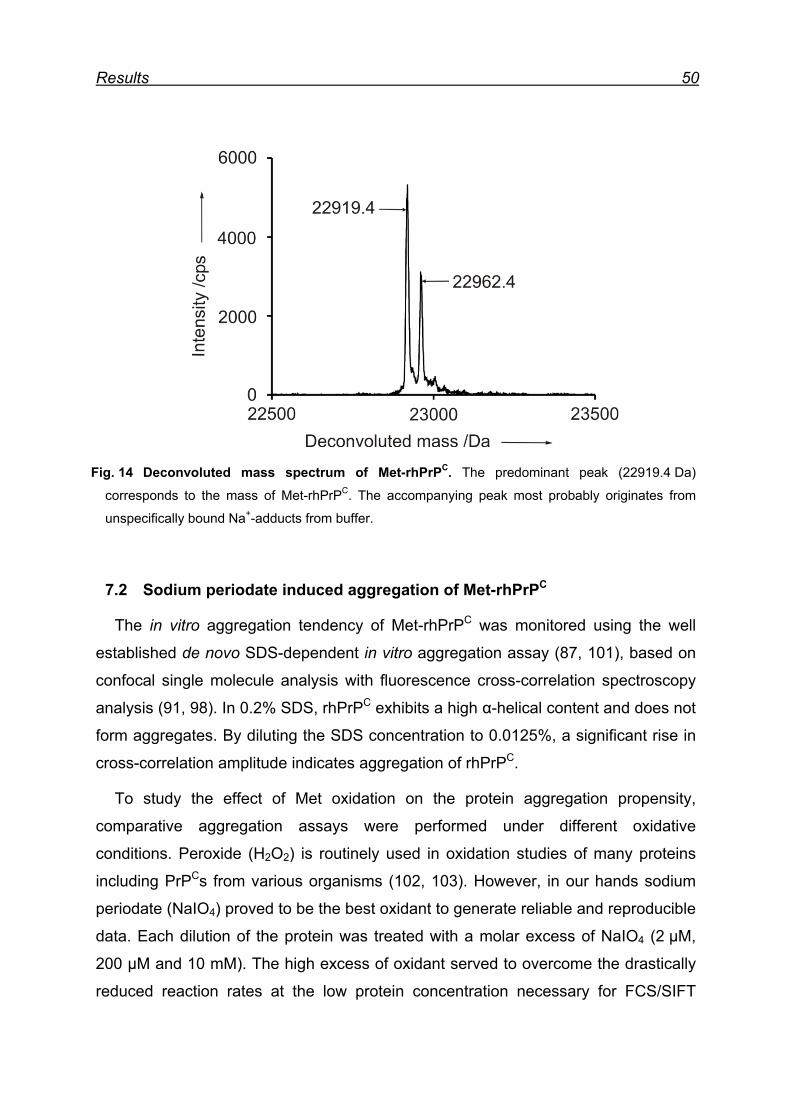
Results 50
Fig. 14 Deconvoluted mass spectrum of Met-rhPrPC. The predominant peak (22919.4 Da)
corresponds to the mass of Met-rhPrPC. The accompanying peak most probably originates from
unspecifically bound Na+-adducts from buffer.
7.2 Sodium periodate induced aggregation of Met-rhPrPC
The in vitro aggregation tendency of Met-rhPrPC was monitored using the well
established de novo SDS-dependent in vitro aggregation assay (87, 101), based on
confocal single molecule analysis with fluorescence cross-correlation spectroscopy
analysis (91, 98). In 0.2% SDS, rhPrPC exhibits a high α-helical content and does not
form aggregates. By diluting the SDS concentration to 0.0125%, a significant rise in
cross-correlation amplitude indicates aggregation of rhPrPC.
To study the effect of Met oxidation on the protein aggregation propensity,
comparative aggregation assays were performed under different oxidative
conditions. Peroxide (H2O2) is routinely used in oxidation studies of many proteins
including PrPCs from various organisms (102, 103). However, in our hands sodium
periodate (NaIO4) proved to be the best oxidant to generate reliable and reproducible
data. Each dilution of the protein was treated with a molar excess of NaIO4 (2 µM,
200 µM and 10 mM). The high excess of oxidant served to overcome the drastically
reduced reaction rates at the low protein concentration necessary for FCS/SIFT
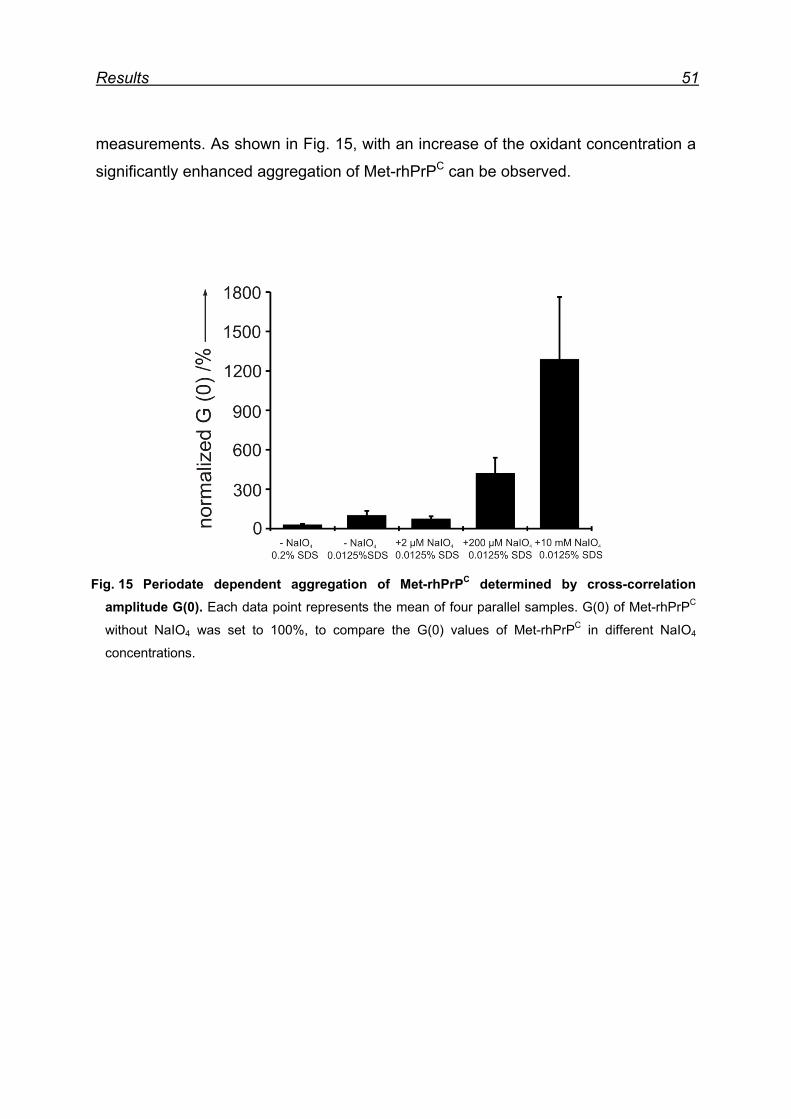
Results 51
measurements. As shown in Fig. 15, with an increase of the oxidant concentration a
significantly enhanced aggregation of Met-rhPrPC can be observed.
Fig. 15 Periodate dependent aggregation of Met-rhPrPC determined by cross-correlation amplitude G(0). Each data point represents the mean of four parallel samples. G(0) of Met-rhPrPC
without NaIO4 was set to 100%, to compare the G(0) values of Met-rhPrPC in different NaIO4
concentrations.
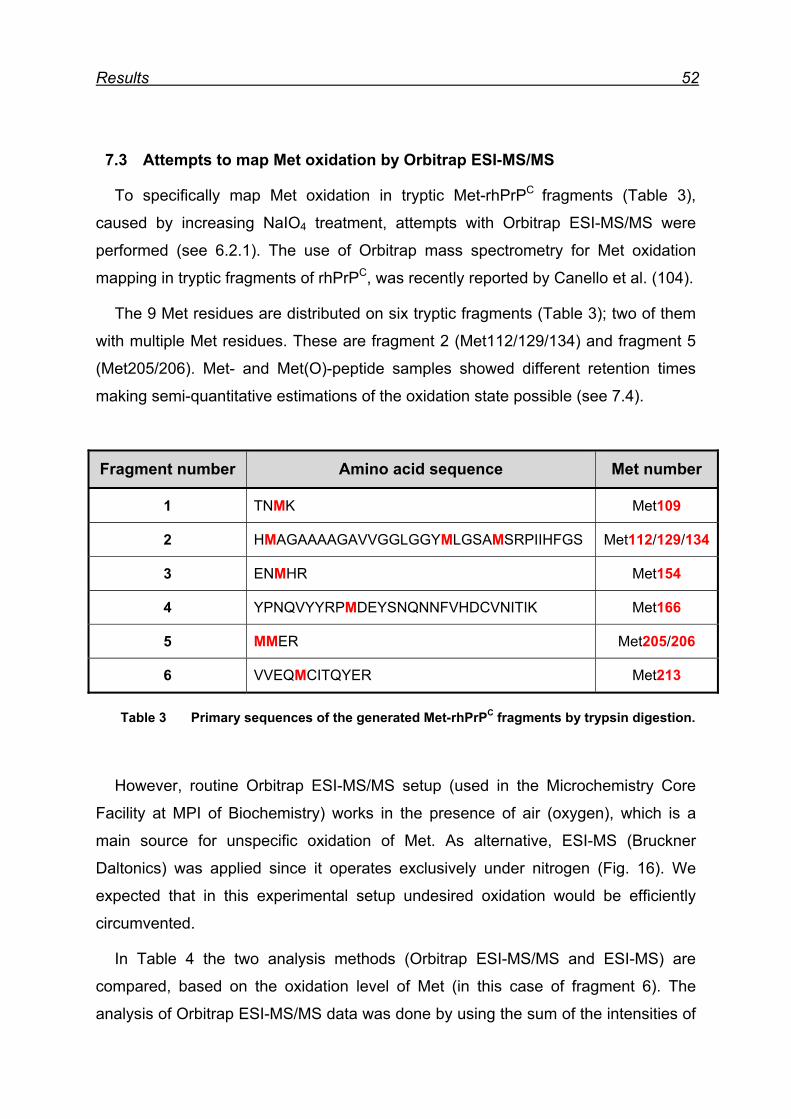
Results 52
7.3 Attempts to map Met oxidation by Orbitrap ESI-MS/MS
To specifically map Met oxidation in tryptic Met-rhPrPC fragments (Table 3),
caused by increasing NaIO4 treatment, attempts with Orbitrap ESI-MS/MS were
performed (see 6.2.1). The use of Orbitrap mass spectrometry for Met oxidation
mapping in tryptic fragments of rhPrPC, was recently reported by Canello et al. (104).
The 9 Met residues are distributed on six tryptic fragments (Table 3); two of them
with multiple Met residues. These are fragment 2 (Met112/129/134) and fragment 5
(Met205/206). Met- and Met(O)-peptide samples showed different retention times
making semi-quantitative estimations of the oxidation state possible (see 7.4).
Fragment number Amino acid sequence Met number
1 TNMK Met109
2 HMAGAAAAGAVVGGLGGYMLGSAMSRPIIHFGS Met112/129/134
3 ENMHR Met154
4 YPNQVYYRPMDEYSNQNNFVHDCVNITIK Met166
5 MMER Met205/206
6 VVEQMCITQYER Met213
However, routine Orbitrap ESI-MS/MS setup (used in the Microchemistry Core
Facility at MPI of Biochemistry) works in the presence of air (oxygen), which is a
main source for unspecific oxidation of Met. As alternative, ESI-MS (Bruckner
Daltonics) was applied since it operates exclusively under nitrogen (Fig. 16). We
expected that in this experimental setup undesired oxidation would be efficiently
circumvented.
In Table 4 the two analysis methods (Orbitrap ESI-MS/MS and ESI-MS) are
compared, based on the oxidation level of Met (in this case of fragment 6). The
analysis of Orbitrap ESI-MS/MS data was done by using the sum of the intensities of
Table 3 Primary sequences of the generated Met-rhPrPC fragments by trypsin digestion.
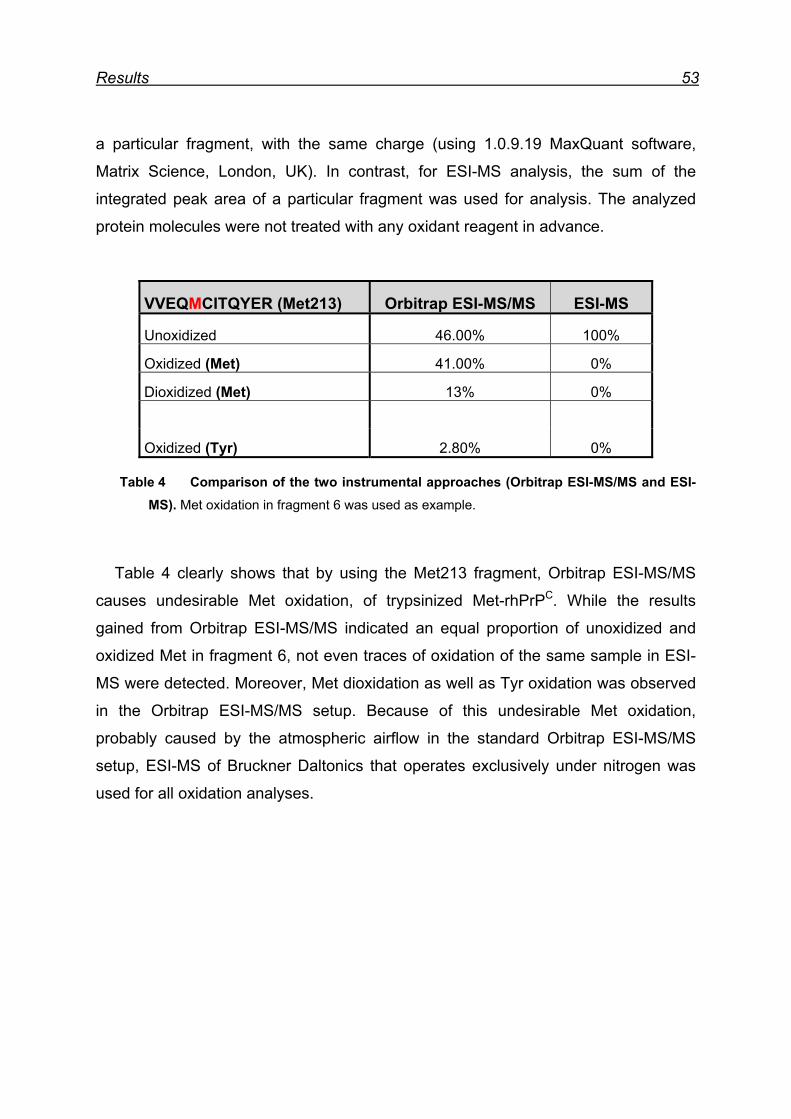
Results 53
a particular fragment, with the same charge (using 1.0.9.19 MaxQuant software,
Matrix Science, London, UK). In contrast, for ESI-MS analysis, the sum of the
integrated peak area of a particular fragment was used for analysis. The analyzed
protein molecules were not treated with any oxidant reagent in advance.
VVEQMCITQYER (Met213) Orbitrap ESI-MS/MS ESI-MS
Unoxidized 46.00% 100%
Oxidized (Met) 41.00% 0%
Dioxidized (Met) 13% 0%
Oxidized (Tyr) 2.80% 0%
Table 4 clearly shows that by using the Met213 fragment, Orbitrap ESI-MS/MS
causes undesirable Met oxidation, of trypsinized Met-rhPrPC. While the results
gained from Orbitrap ESI-MS/MS indicated an equal proportion of unoxidized and
oxidized Met in fragment 6, not even traces of oxidation of the same sample in ESI-
MS were detected. Moreover, Met dioxidation as well as Tyr oxidation was observed
in the Orbitrap ESI-MS/MS setup. Because of this undesirable Met oxidation,
probably caused by the atmospheric airflow in the standard Orbitrap ESI-MS/MS
setup, ESI-MS of Bruckner Daltonics that operates exclusively under nitrogen was
used for all oxidation analyses.
Table 4 Comparison of the two instrumental approaches (Orbitrap ESI-MS/MS and ESI-MS). Met oxidation in fragment 6 was used as example.

Results 54
Fig. 16 Schematic representation of basic instrumental setup of Orbitrap ESI-MS/MS and ESI-MS. (A) Orbitrap ESI-MS/MS (B) ESI-MS: peptide solution is ionized, with high voltage, at the end
of the capillary tube. The hereby evolving ions desolvate during the transfer into an ion trap, which
captures the peptide ions using an electric field. By changing the electric field, the ions are
sequentially extracted according to their mass-to-charge ratio, and are finally detected. The main
difference between A and B is that in B a nitrogen curtain supports desolvation, whereas in A
atmospheric air is used.
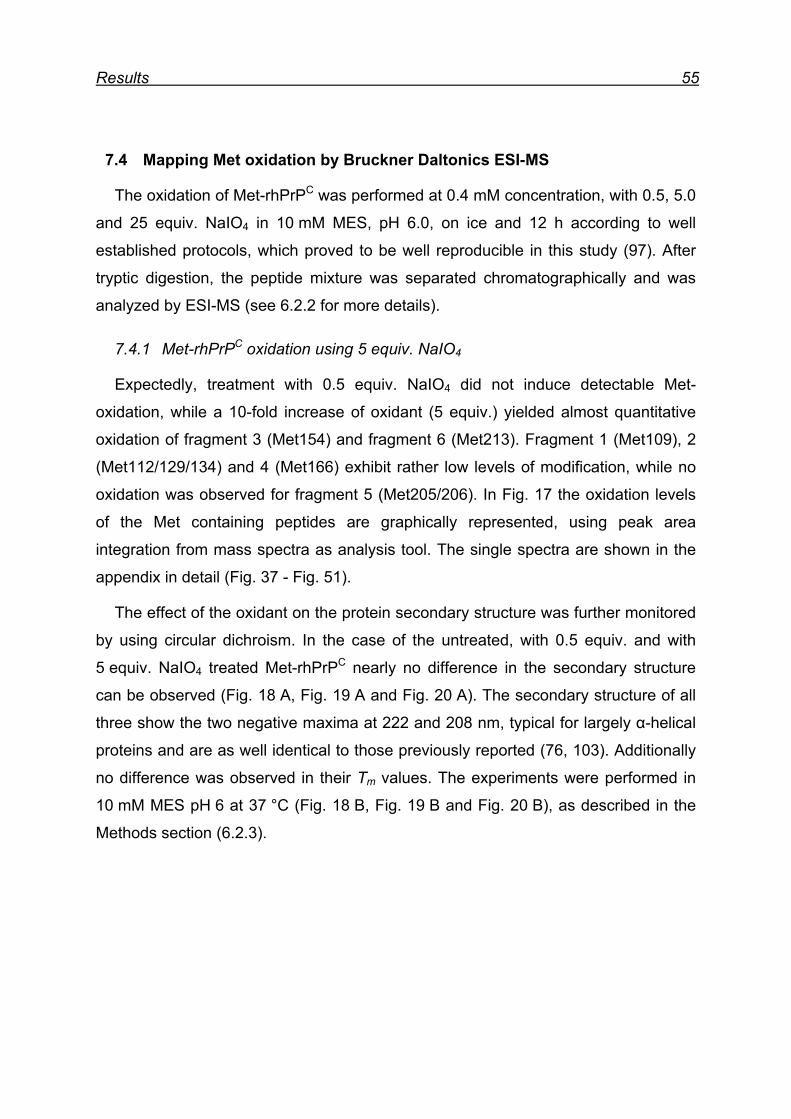
Results 55
7.4 Mapping Met oxidation by Bruckner Daltonics ESI-MS
The oxidation of Met-rhPrPC was performed at 0.4 mM concentration, with 0.5, 5.0
and 25 equiv. NaIO4 in 10 mM MES, pH 6.0, on ice and 12 h according to well
established protocols, which proved to be well reproducible in this study (97). After
tryptic digestion, the peptide mixture was separated chromatographically and was
analyzed by ESI-MS (see 6.2.2 for more details).
7.4.1 Met-rhPrPC oxidation using 5 equiv. NaIO4
Expectedly, treatment with 0.5 equiv. NaIO4 did not induce detectable Met-
oxidation, while a 10-fold increase of oxidant (5 equiv.) yielded almost quantitative
oxidation of fragment 3 (Met154) and fragment 6 (Met213). Fragment 1 (Met109), 2
(Met112/129/134) and 4 (Met166) exhibit rather low levels of modification, while no
oxidation was observed for fragment 5 (Met205/206). In Fig. 17 the oxidation levels
of the Met containing peptides are graphically represented, using peak area
integration from mass spectra as analysis tool. The single spectra are shown in the
appendix in detail (Fig. 37 - Fig. 51).
The effect of the oxidant on the protein secondary structure was further monitored
by using circular dichroism. In the case of the untreated, with 0.5 equiv. and with
5 equiv. NaIO4 treated Met-rhPrPC nearly no difference in the secondary structure
can be observed (Fig. 18 A, Fig. 19 A and Fig. 20 A). The secondary structure of all
three show the two negative maxima at 222 and 208 nm, typical for largely α-helical
proteins and are as well identical to those previously reported (76, 103). Additionally
no difference was observed in their Tm values. The experiments were performed in
10 mM MES pH 6 at 37 °C (Fig. 18 B, Fig. 19 B and Fig. 20 B), as described in the
Methods section (6.2.3).
Results 56
Fig. 17 Oxidation level of the Met-rhPrPC peptides using 5 equiv. NaIO4. The amount of oxidation
was estimated by peak area integration from mass spectra. The protein was oxidized using 5 equiv.
NaIO4. Peptides were generated by tryptic digestion, as described in Methods (6.2.4).
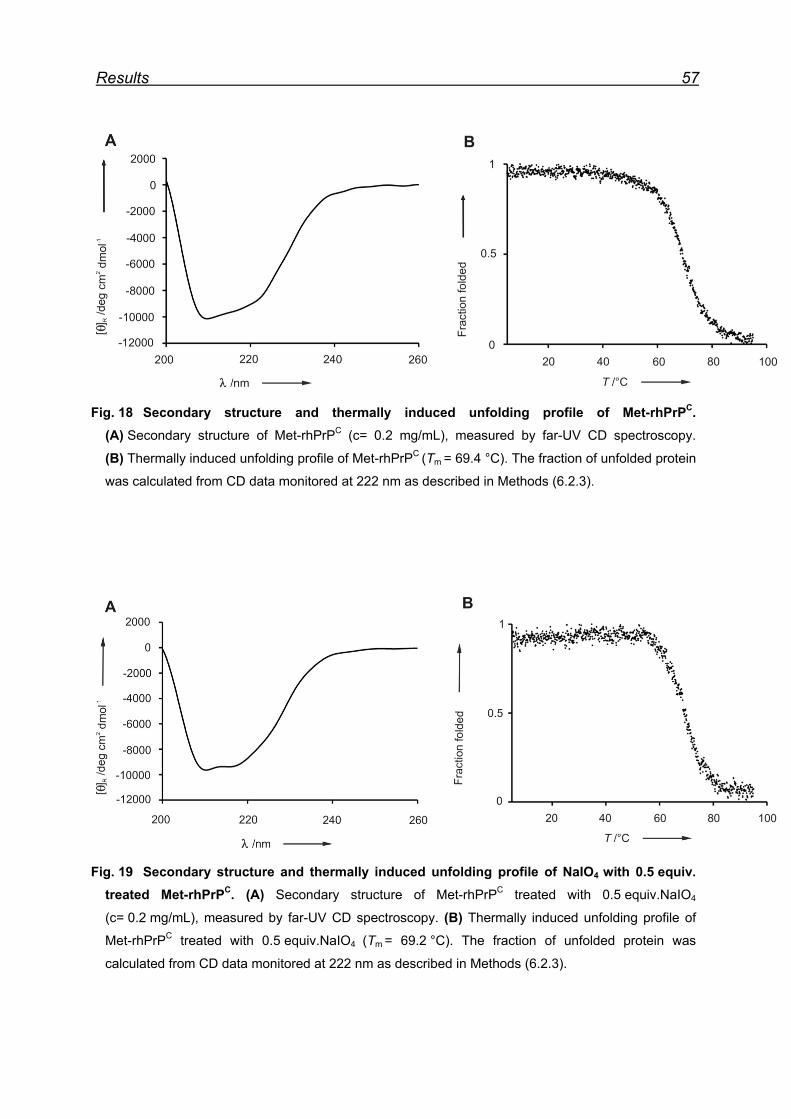
Results 57
Fig. 18 Secondary structure and thermally induced unfolding profile of Met-rhPrPC. (A) Secondary structure of Met-rhPrPC (c= 0.2 mg/mL), measured by far-UV CD spectroscopy. (B) Thermally induced unfolding profile of Met-rhPrPC (Tm = 69.4 °C). The fraction of unfolded protein
was calculated from CD data monitored at 222 nm as described in Methods (6.2.3).
Fig. 19 Secondary structure and thermally induced unfolding profile of NaIO4 with 0.5 equiv. treated Met-rhPrPC. (A) Secondary structure of Met-rhPrPC treated with 0.5 equiv.NaIO4
(c= 0.2 mg/mL), measured by far-UV CD spectroscopy. (B) Thermally induced unfolding profile of
Met-rhPrPC treated with 0.5 equiv.NaIO4 (Tm = 69.2 °C). The fraction of unfolded protein was
calculated from CD data monitored at 222 nm as described in Methods (6.2.3).
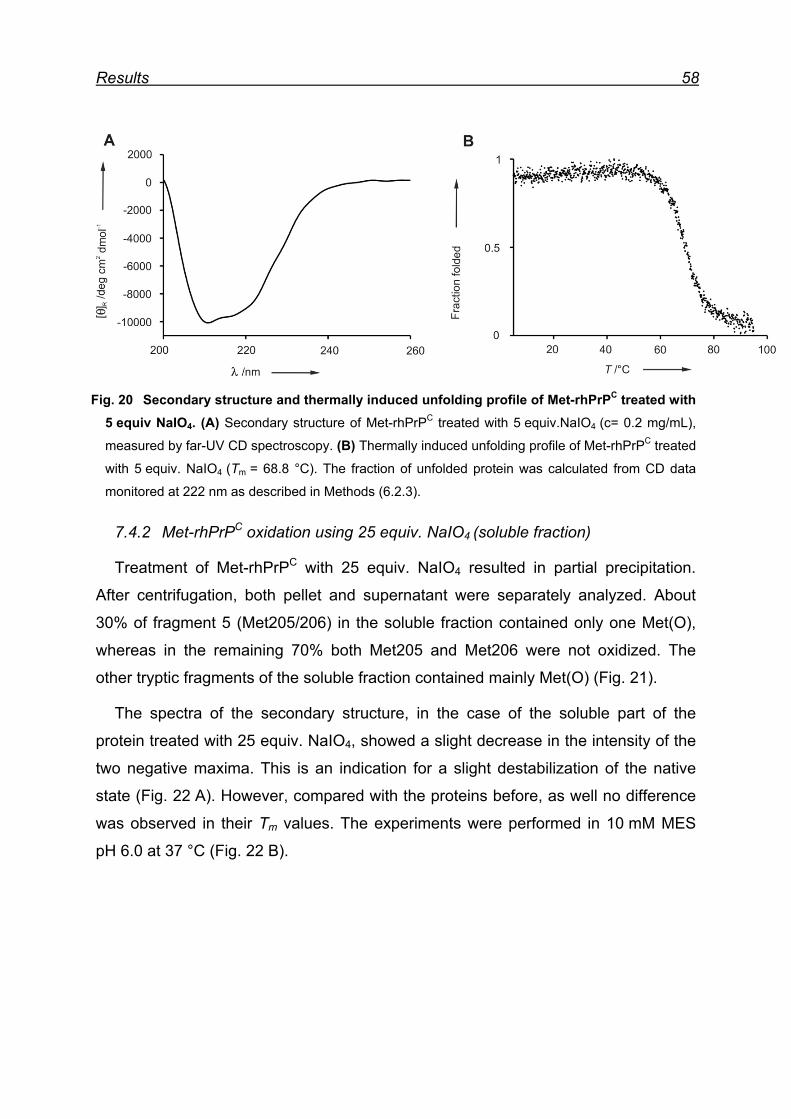
Results 58
Fig. 20 Secondary structure and thermally induced unfolding profile of Met-rhPrPC treated with 5 equiv NaIO4. (A) Secondary structure of Met-rhPrPC treated with 5 equiv.NaIO4 (c= 0.2 mg/mL),
measured by far-UV CD spectroscopy. (B) Thermally induced unfolding profile of Met-rhPrPC treated
with 5 equiv. NaIO4 (Tm = 68.8 °C). The fraction of unfolded protein was calculated from CD data
monitored at 222 nm as described in Methods (6.2.3).
7.4.2 Met-rhPrPC oxidation using 25 equiv. NaIO4 (soluble fraction)
Treatment of Met-rhPrPC with 25 equiv. NaIO4 resulted in partial precipitation.
After centrifugation, both pellet and supernatant were separately analyzed. About
30% of fragment 5 (Met205/206) in the soluble fraction contained only one Met(O),
whereas in the remaining 70% both Met205 and Met206 were not oxidized. The
other tryptic fragments of the soluble fraction contained mainly Met(O) (Fig. 21).
The spectra of the secondary structure, in the case of the soluble part of the
protein treated with 25 equiv. NaIO4, showed a slight decrease in the intensity of the
two negative maxima. This is an indication for a slight destabilization of the native
state (Fig. 22 A). However, compared with the proteins before, as well no difference
was observed in their Tm values. The experiments were performed in 10 mM MES
pH 6.0 at 37 °C (Fig. 22 B).
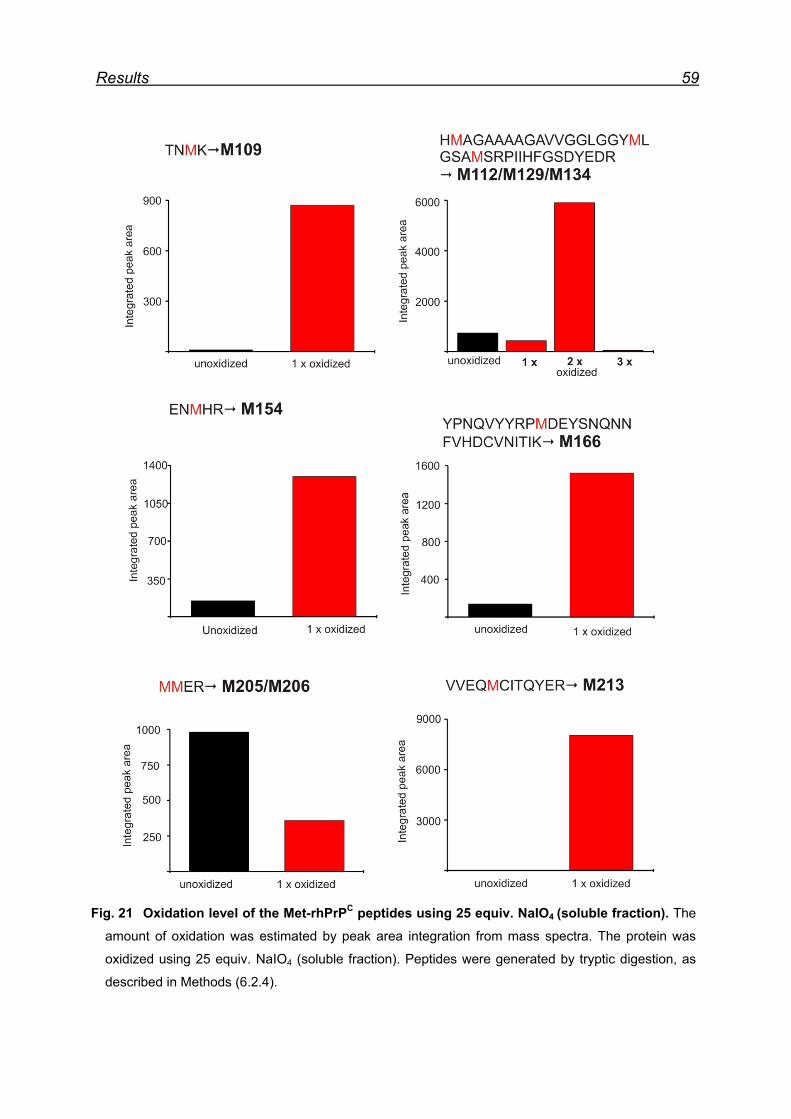
Results 59
Fig. 21 Oxidation level of the Met-rhPrPC peptides using 25 equiv. NaIO4 (soluble fraction). The
amount of oxidation was estimated by peak area integration from mass spectra. The protein was
oxidized using 25 equiv. NaIO4 (soluble fraction). Peptides were generated by tryptic digestion, as
described in Methods (6.2.4).
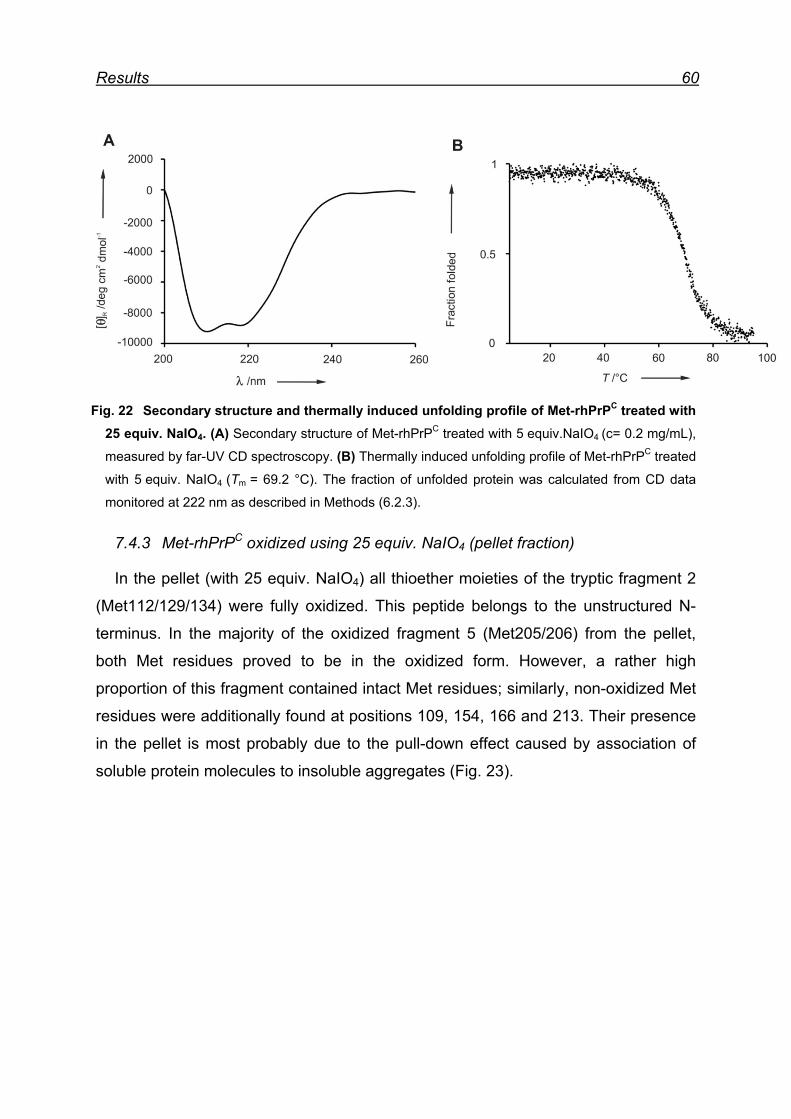
Results 60
Fig. 22 Secondary structure and thermally induced unfolding profile of Met-rhPrPC treated with 25 equiv. NaIO4. (A) Secondary structure of Met-rhPrPC treated with 5 equiv.NaIO4 (c= 0.2 mg/mL),
measured by far-UV CD spectroscopy. (B) Thermally induced unfolding profile of Met-rhPrPC treated
with 5 equiv. NaIO4 (Tm = 69.2 °C). The fraction of unfolded protein was calculated from CD data
monitored at 222 nm as described in Methods (6.2.3).
7.4.3 Met-rhPrPC oxidized using 25 equiv. NaIO4 (pellet fraction)
In the pellet (with 25 equiv. NaIO4) all thioether moieties of the tryptic fragment 2
(Met112/129/134) were fully oxidized. This peptide belongs to the unstructured N-
terminus. In the majority of the oxidized fragment 5 (Met205/206) from the pellet,
both Met residues proved to be in the oxidized form. However, a rather high
proportion of this fragment contained intact Met residues; similarly, non-oxidized Met
residues were additionally found at positions 109, 154, 166 and 213. Their presence
in the pellet is most probably due to the pull-down effect caused by association of
soluble protein molecules to insoluble aggregates (Fig. 23).
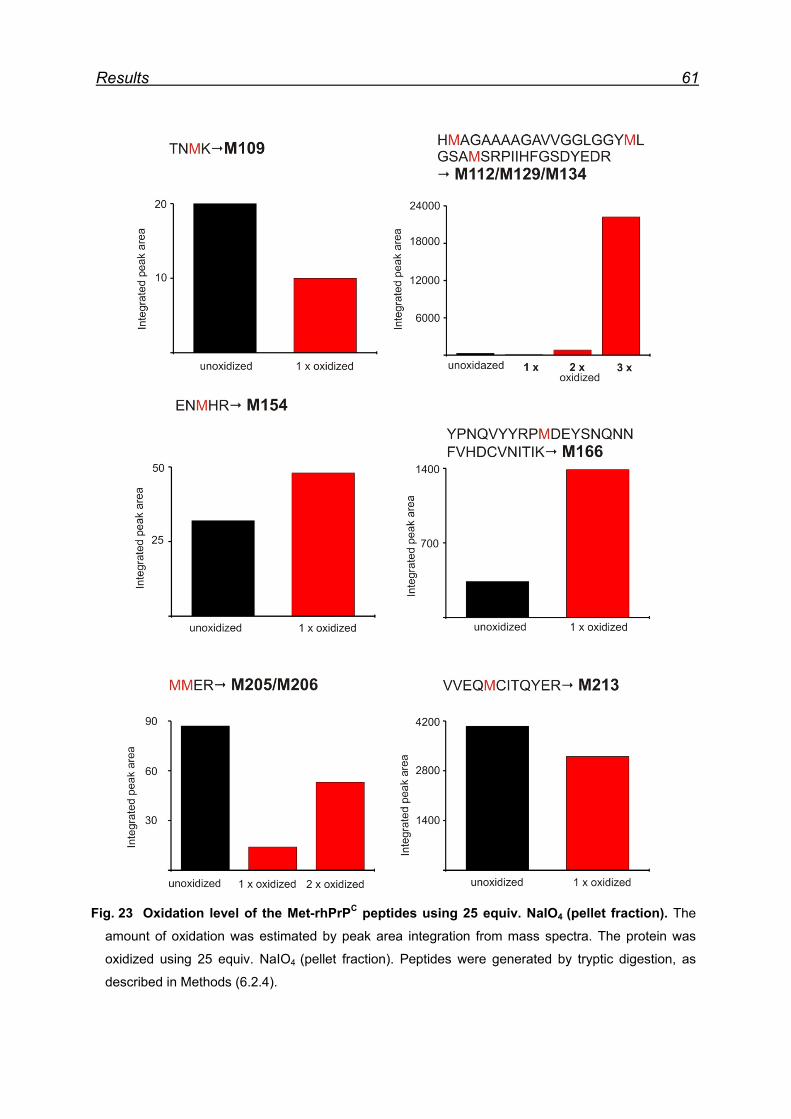
Results 61
Fig. 23 Oxidation level of the Met-rhPrPC peptides using 25 equiv. NaIO4 (pellet fraction). The
amount of oxidation was estimated by peak area integration from mass spectra. The protein was
oxidized using 25 equiv. NaIO4 (pellet fraction). Peptides were generated by tryptic digestion, as
described in Methods (6.2.4).
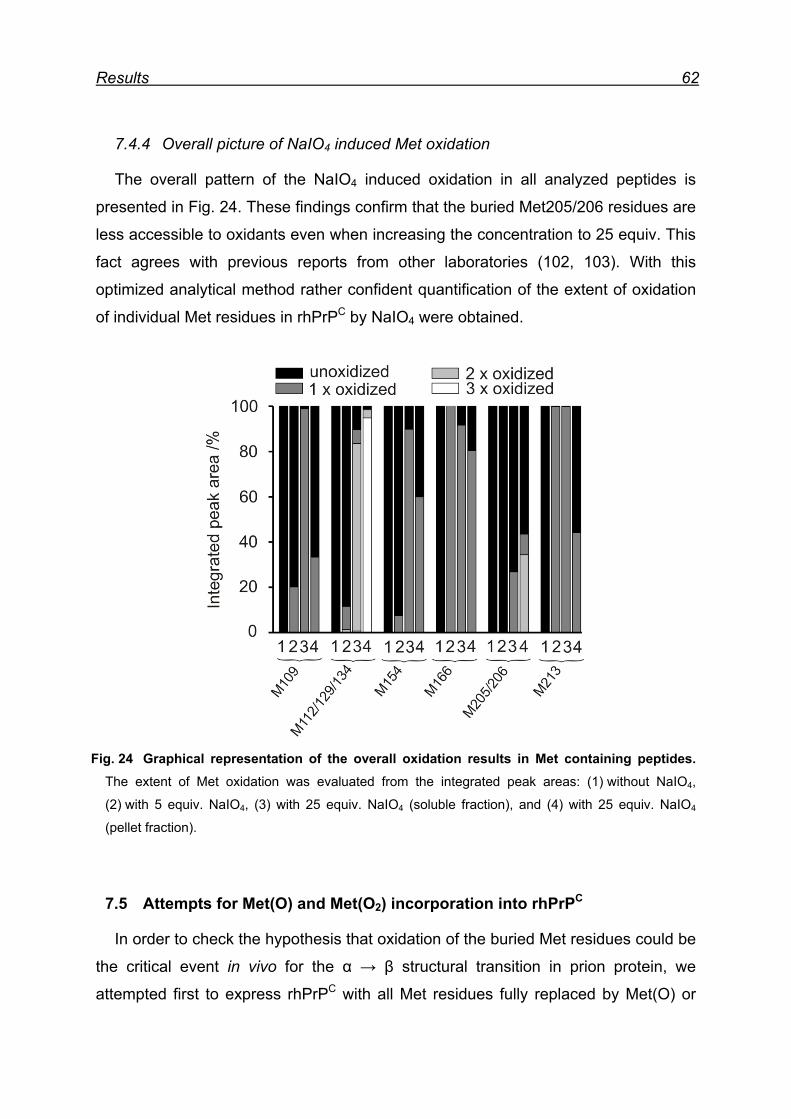
Results 62
7.4.4 Overall picture of NaIO4 induced Met oxidation
The overall pattern of the NaIO4 induced oxidation in all analyzed peptides is
presented in Fig. 24. These findings confirm that the buried Met205/206 residues are
less accessible to oxidants even when increasing the concentration to 25 equiv. This
fact agrees with previous reports from other laboratories (102, 103). With this
optimized analytical method rather confident quantification of the extent of oxidation
of individual Met residues in rhPrPC by NaIO4 were obtained.
Fig. 24 Graphical representation of the overall oxidation results in Met containing peptides. The extent of Met oxidation was evaluated from the integrated peak areas: (1) without NaIO4,
(2) with 5 equiv. NaIO4, (3) with 25 equiv. NaIO4 (soluble fraction), and (4) with 25 equiv. NaIO4
(pellet fraction).
7.5 Attempts for Met(O) and Met(O2) incorporation into rhPrPC
In order to check the hypothesis that oxidation of the buried Met residues could be
the critical event in vivo for the α → β structural transition in prion protein, we
attempted first to express rhPrPC with all Met residues fully replaced by Met(O) or
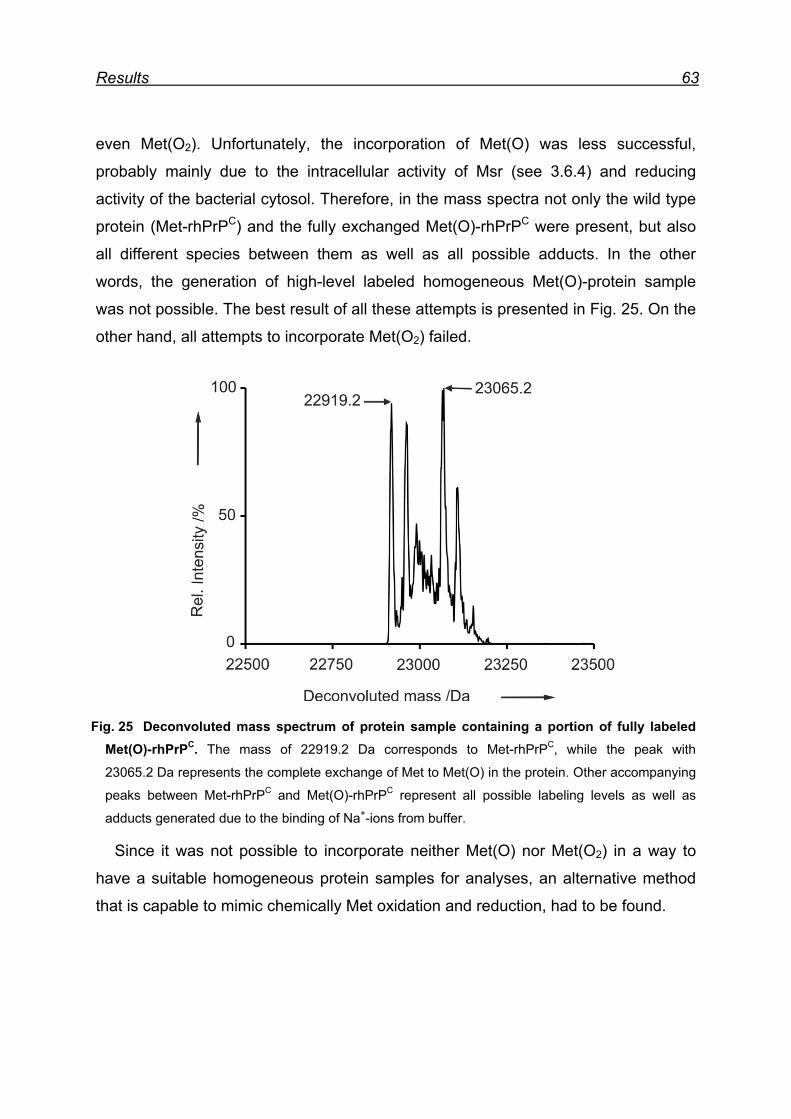
Results 63
even Met(O2). Unfortunately, the incorporation of Met(O) was less successful,
probably mainly due to the intracellular activity of Msr (see 3.6.4) and reducing
activity of the bacterial cytosol. Therefore, in the mass spectra not only the wild type
protein (Met-rhPrPC) and the fully exchanged Met(O)-rhPrPC were present, but also
all different species between them as well as all possible adducts. In the other
words, the generation of high-level labeled homogeneous Met(O)-protein sample
was not possible. The best result of all these attempts is presented in Fig. 25. On the
other hand, all attempts to incorporate Met(O2) failed.
Fig. 25 Deconvoluted mass spectrum of protein sample containing a portion of fully labeled Met(O)-rhPrPC. The mass of 22919.2 Da corresponds to Met-rhPrPC, while the peak with
23065.2 Da represents the complete exchange of Met to Met(O) in the protein. Other accompanying
peaks between Met-rhPrPC and Met(O)-rhPrPC represent all possible labeling levels as well as
adducts generated due to the binding of Na+-ions from buffer.
Since it was not possible to incorporate neither Met(O) nor Met(O2) in a way to
have a suitable homogeneous protein samples for analyses, an alternative method
that is capable to mimic chemically Met oxidation and reduction, had to be found.
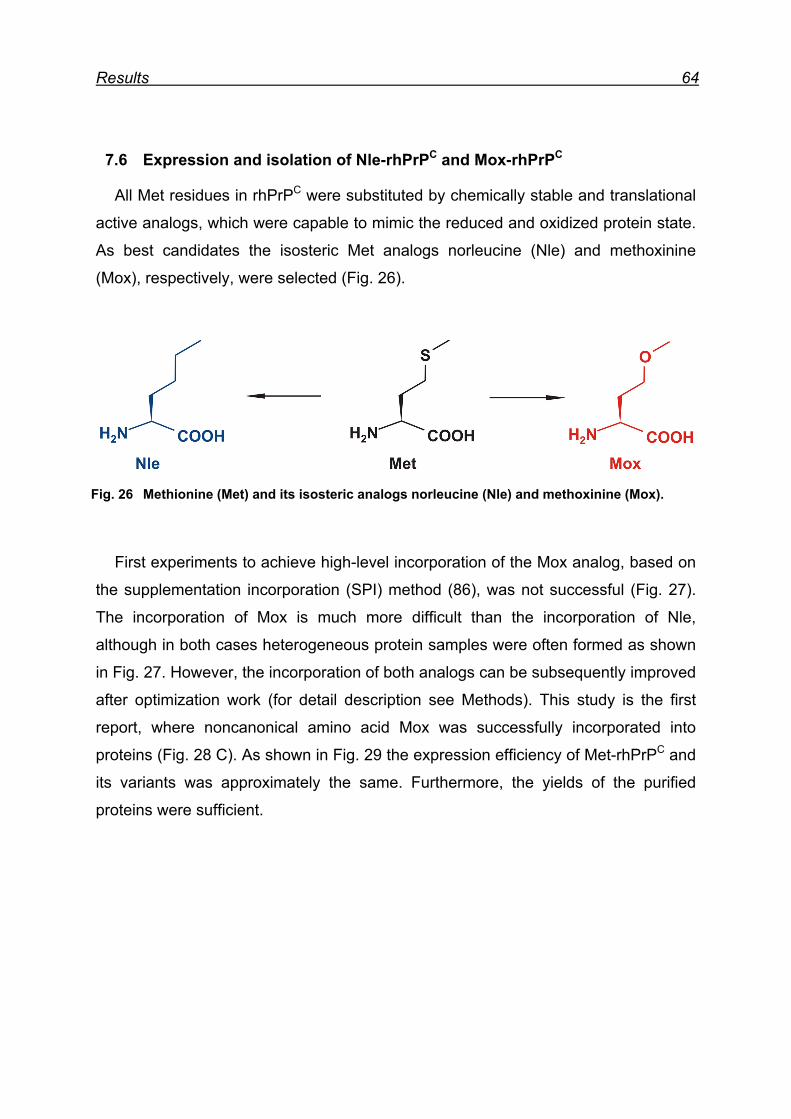
Results 64
7.6 Expression and isolation of Nle-rhPrPC and Mox-rhPrPC
All Met residues in rhPrPC were substituted by chemically stable and translational
active analogs, which were capable to mimic the reduced and oxidized protein state.
As best candidates the isosteric Met analogs norleucine (Nle) and methoxinine
(Mox), respectively, were selected (Fig. 26).
Fig. 26 Methionine (Met) and its isosteric analogs norleucine (Nle) and methoxinine (Mox).
First experiments to achieve high-level incorporation of the Mox analog, based on
the supplementation incorporation (SPI) method (86), was not successful (Fig. 27).
The incorporation of Mox is much more difficult than the incorporation of Nle,
although in both cases heterogeneous protein samples were often formed as shown
in Fig. 27. However, the incorporation of both analogs can be subsequently improved
after optimization work (for detail description see Methods). This study is the first
report, where noncanonical amino acid Mox was successfully incorporated into
proteins (Fig. 28 C). As shown in Fig. 29 the expression efficiency of Met-rhPrPC and
its variants was approximately the same. Furthermore, the yields of the purified
proteins were sufficient.
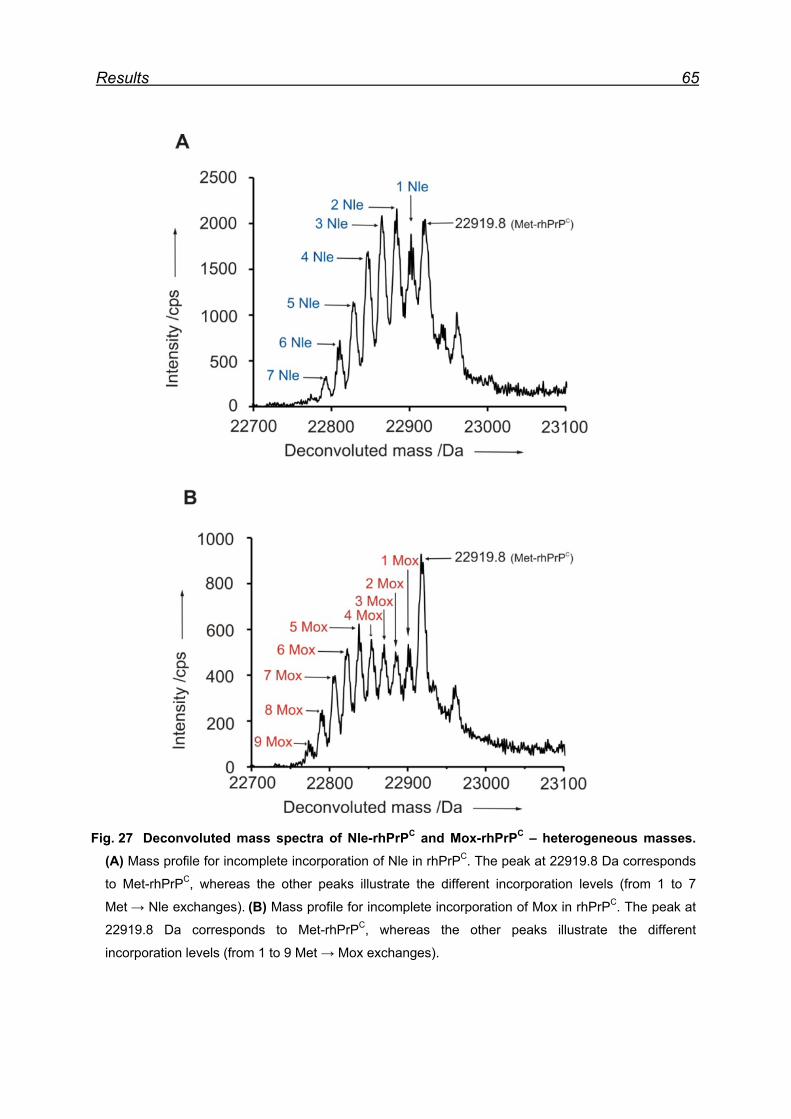
Results 65
Fig. 27 Deconvoluted mass spectra of Nle-rhPrPC and Mox-rhPrPC – heterogeneous masses. (A) Mass profile for incomplete incorporation of Nle in rhPrPC. The peak at 22919.8 Da corresponds
to Met-rhPrPC, whereas the other peaks illustrate the different incorporation levels (from 1 to 7
Met → Nle exchanges). (B) Mass profile for incomplete incorporation of Mox in rhPrPC. The peak at
22919.8 Da corresponds to Met-rhPrPC, whereas the other peaks illustrate the different
incorporation levels (from 1 to 9 Met → Mox exchanges).
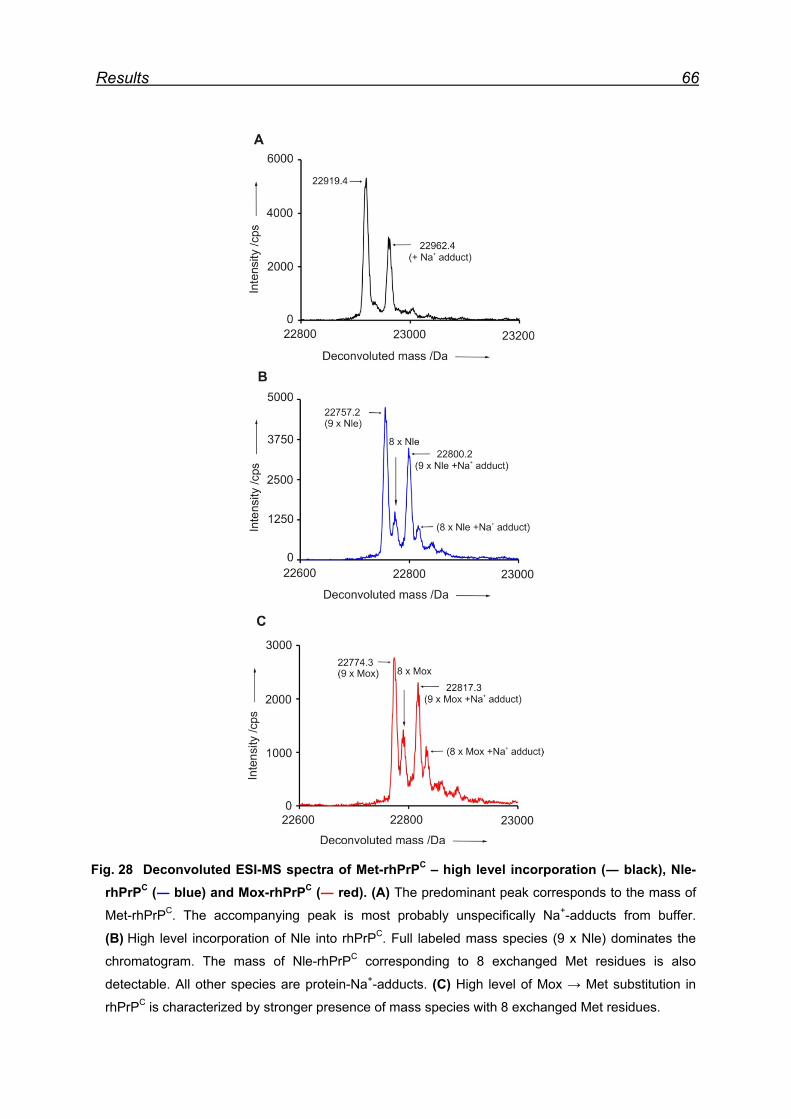
Results 66
Fig. 28 Deconvoluted ESI-MS spectra of Met-rhPrPC – high level incorporation (― black), Nle-rhPrPC (― blue) and Mox-rhPrPC (― red). (A) The predominant peak corresponds to the mass of
Met-rhPrPC. The accompanying peak is most probably unspecifically Na+-adducts from buffer. (B) High level incorporation of Nle into rhPrPC. Full labeled mass species (9 x Nle) dominates the
chromatogram. The mass of Nle-rhPrPC corresponding to 8 exchanged Met residues is also
detectable. All other species are protein-Na+-adducts. (C) High level of Mox → Met substitution in
rhPrPC is characterized by stronger presence of mass species with 8 exchanged Met residues.
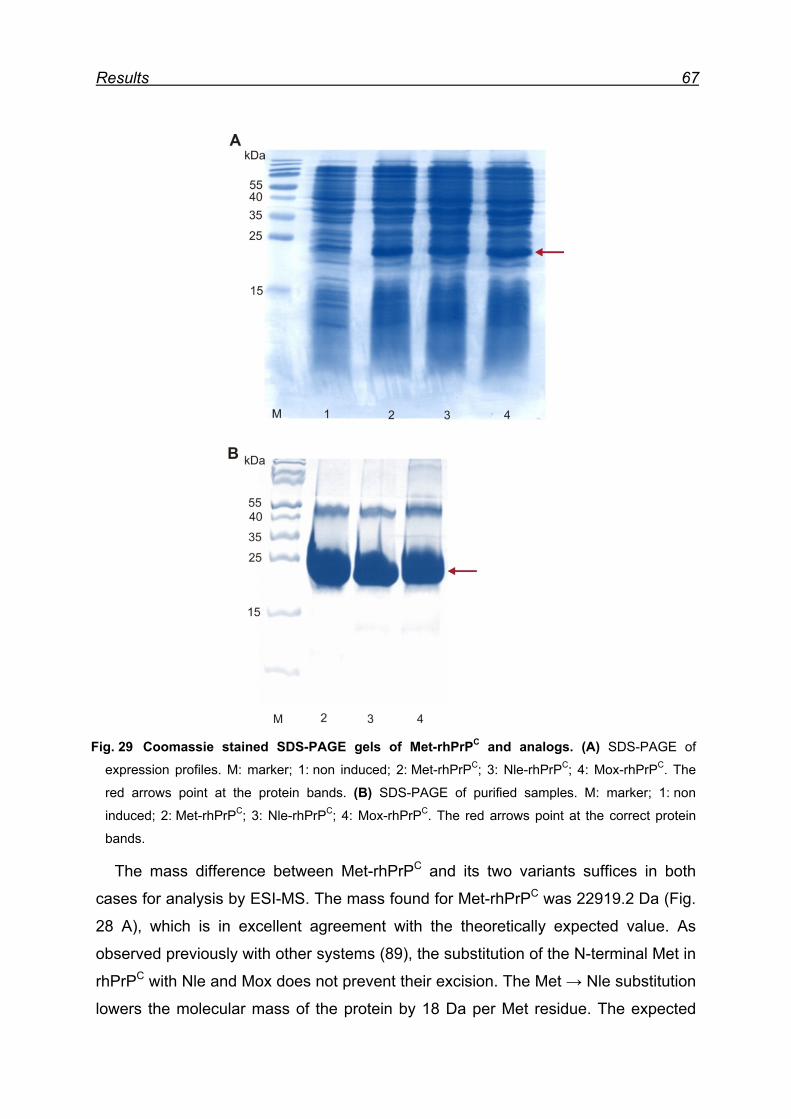
Results 67
Fig. 29 Coomassie stained SDS-PAGE gels of Met-rhPrPC and analogs. (A) SDS-PAGE of
expression profiles. M: marker; 1: non induced; 2: Met-rhPrPC; 3: Nle-rhPrPC; 4: Mox-rhPrPC. The
red arrows point at the protein bands. (B) SDS-PAGE of purified samples. M: marker; 1: non
induced; 2: Met-rhPrPC; 3: Nle-rhPrPC; 4: Mox-rhPrPC. The red arrows point at the correct protein
bands.
The mass difference between Met-rhPrPC and its two variants suffices in both
cases for analysis by ESI-MS. The mass found for Met-rhPrPC was 22919.2 Da (Fig.
28 A), which is in excellent agreement with the theoretically expected value. As
observed previously with other systems (89), the substitution of the N-terminal Met in
rhPrPC with Nle and Mox does not prevent their excision. The Met → Nle substitution
lowers the molecular mass of the protein by 18 Da per Met residue. The expected
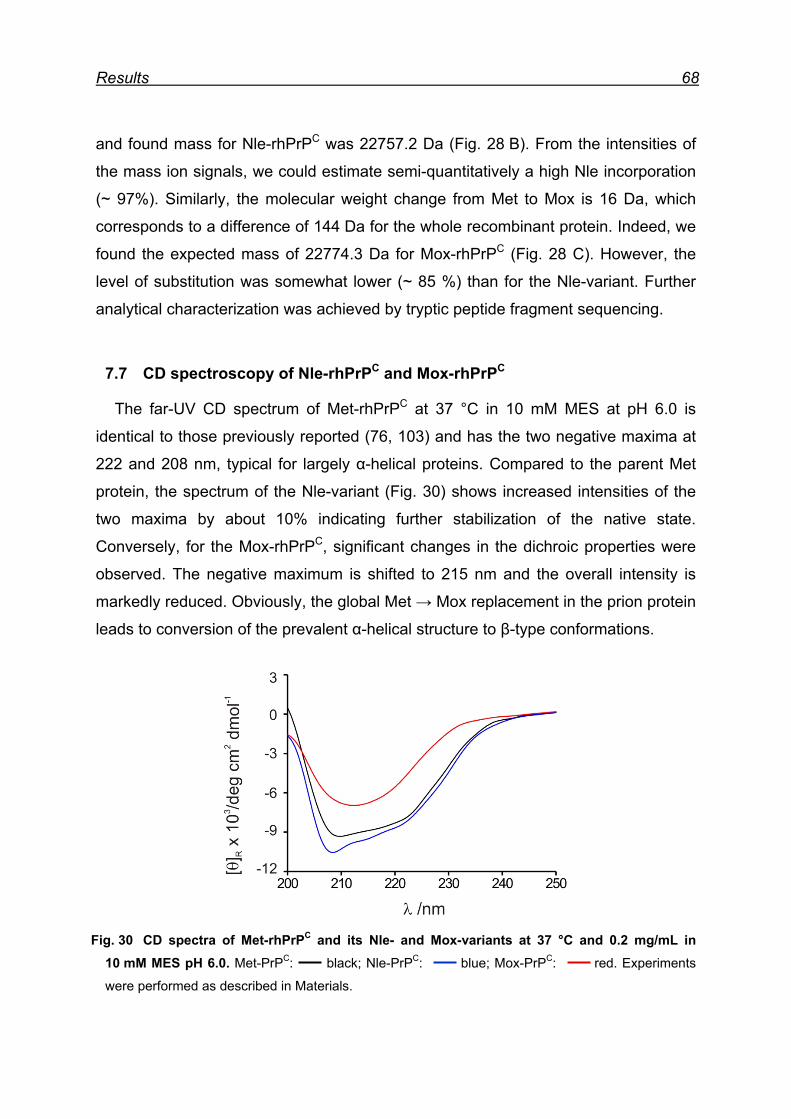
Results 68
and found mass for Nle-rhPrPC was 22757.2 Da (Fig. 28 B). From the intensities of
the mass ion signals, we could estimate semi-quantitatively a high Nle incorporation
(~ 97%). Similarly, the molecular weight change from Met to Mox is 16 Da, which
corresponds to a difference of 144 Da for the whole recombinant protein. Indeed, we
found the expected mass of 22774.3 Da for Mox-rhPrPC (Fig. 28 C). However, the
level of substitution was somewhat lower (~ 85 %) than for the Nle-variant. Further
analytical characterization was achieved by tryptic peptide fragment sequencing.
7.7 CD spectroscopy of Nle-rhPrPC and Mox-rhPrPC
The far-UV CD spectrum of Met-rhPrPC at 37 °C in 10 mM MES at pH 6.0 is
identical to those previously reported (76, 103) and has the two negative maxima at
222 and 208 nm, typical for largely α-helical proteins. Compared to the parent Met
protein, the spectrum of the Nle-variant (Fig. 30) shows increased intensities of the
two maxima by about 10% indicating further stabilization of the native state.
Conversely, for the Mox-rhPrPC, significant changes in the dichroic properties were
observed. The negative maximum is shifted to 215 nm and the overall intensity is
markedly reduced. Obviously, the global Met → Mox replacement in the prion protein
leads to conversion of the prevalent α-helical structure to β-type conformations.
Fig. 30 CD spectra of Met-rhPrPC and its Nle- and Mox-variants at 37 °C and 0.2 mg/mL in 10 mM MES pH 6.0. Met-PrPC: black; Nle-PrPC: blue; Mox-PrPC: red. Experiments
were performed as described in Materials.
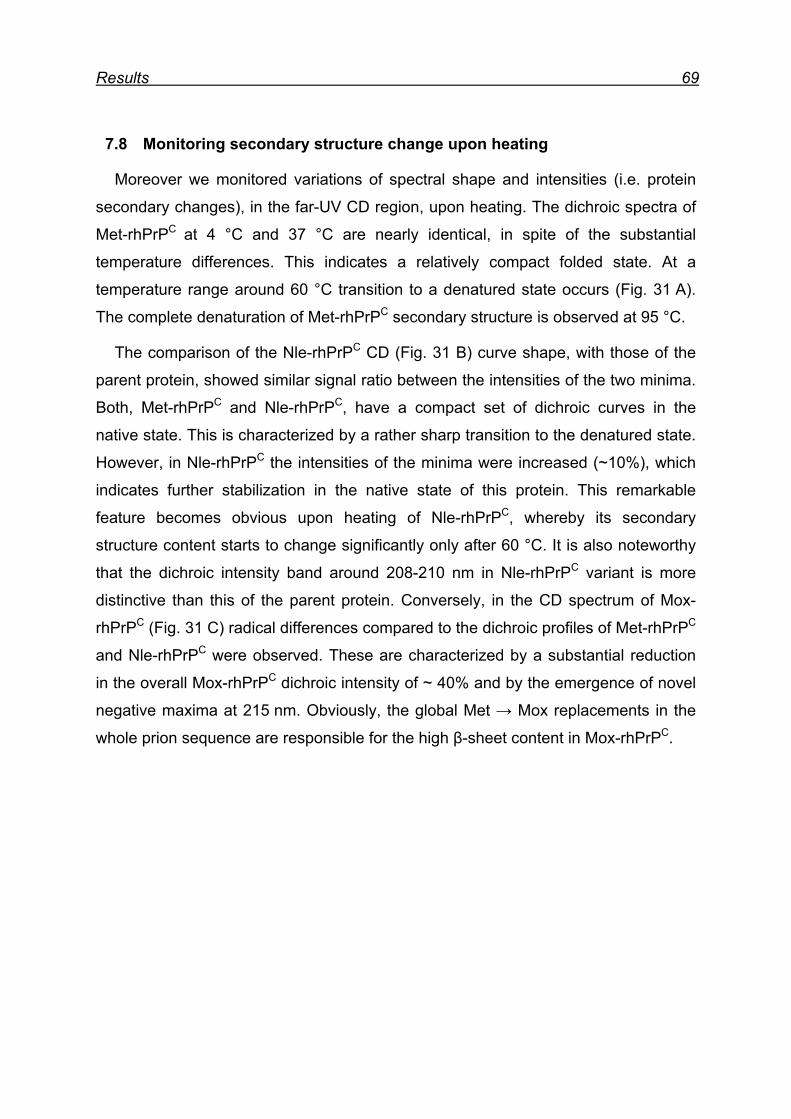
Results 69
7.8 Monitoring secondary structure change upon heating
Moreover we monitored variations of spectral shape and intensities (i.e. protein
secondary changes), in the far-UV CD region, upon heating. The dichroic spectra of
Met-rhPrPC at 4 °C and 37 °C are nearly identical, in spite of the substantial
temperature differences. This indicates a relatively compact folded state. At a
temperature range around 60 °C transition to a denatured state occurs (Fig. 31 A).
The complete denaturation of Met-rhPrPC secondary structure is observed at 95 °C.
The comparison of the Nle-rhPrPC CD (Fig. 31 B) curve shape, with those of the
parent protein, showed similar signal ratio between the intensities of the two minima.
Both, Met-rhPrPC and Nle-rhPrPC, have a compact set of dichroic curves in the
native state. This is characterized by a rather sharp transition to the denatured state.
However, in Nle-rhPrPC the intensities of the minima were increased (~10%), which
indicates further stabilization in the native state of this protein. This remarkable
feature becomes obvious upon heating of Nle-rhPrPC, whereby its secondary
structure content starts to change significantly only after 60 °C. It is also noteworthy
that the dichroic intensity band around 208-210 nm in Nle-rhPrPC variant is more
distinctive than this of the parent protein. Conversely, in the CD spectrum of Mox-
rhPrPC (Fig. 31 C) radical differences compared to the dichroic profiles of Met-rhPrPC
and Nle-rhPrPC were observed. These are characterized by a substantial reduction
in the overall Mox-rhPrPC dichroic intensity of ~ 40% and by the emergence of novel
negative maxima at 215 nm. Obviously, the global Met → Mox replacements in the
whole prion sequence are responsible for the high β-sheet content in Mox-rhPrPC.
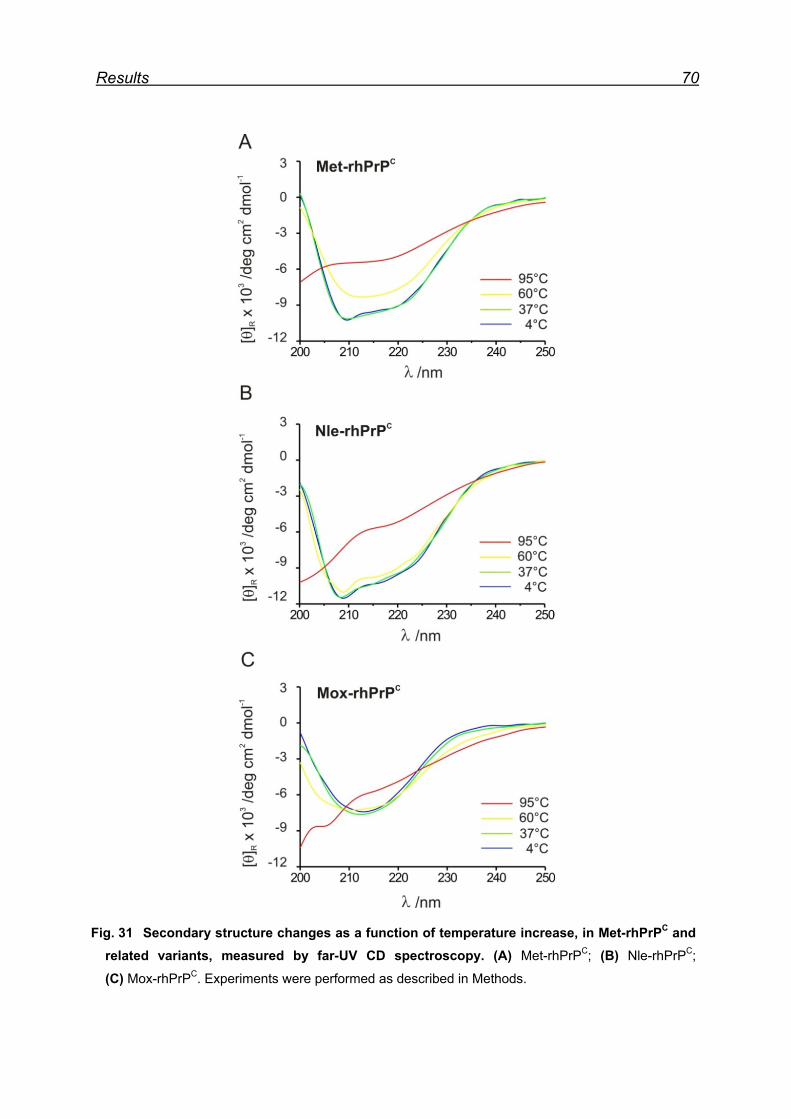
Results 70
Fig. 31 Secondary structure changes as a function of temperature increase, in Met-rhPrPC and related variants, measured by far-UV CD spectroscopy. (A) Met-rhPrPC; (B) Nle-rhPrPC; (C) Mox-rhPrPC. Experiments were performed as described in Methods.
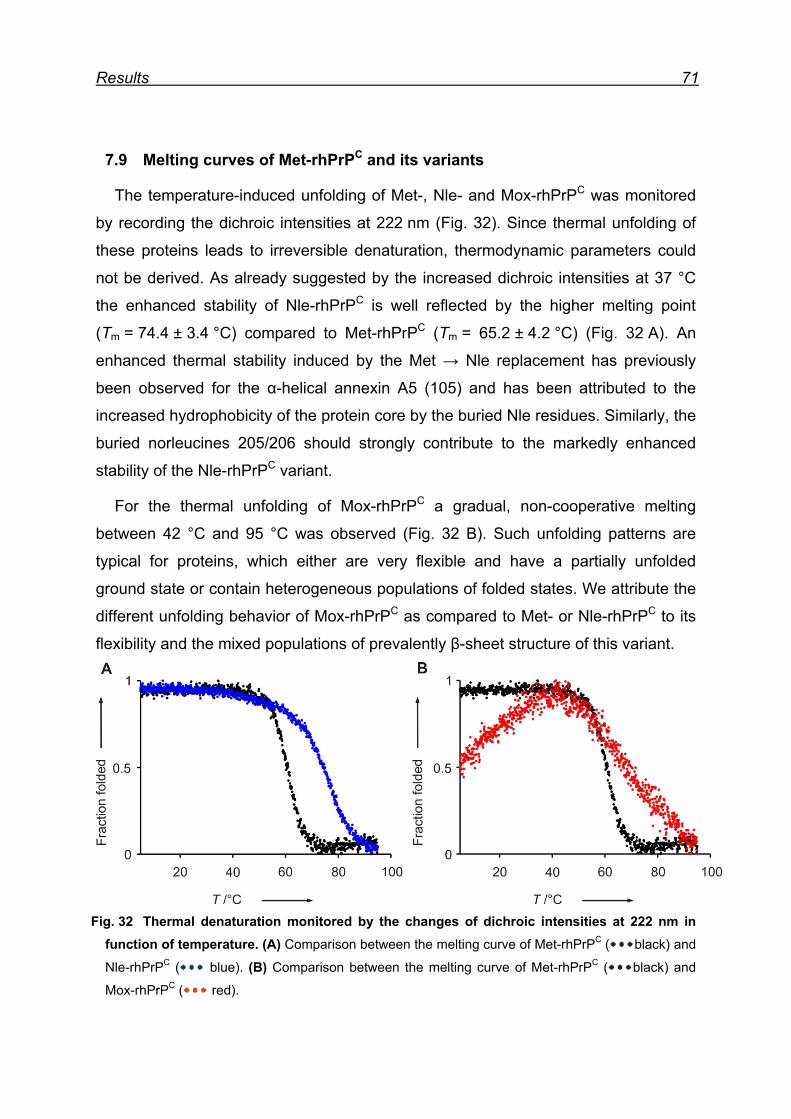
Results 71
7.9 Melting curves of Met-rhPrPC and its variants
The temperature-induced unfolding of Met-, Nle- and Mox-rhPrPC was monitored
by recording the dichroic intensities at 222 nm (Fig. 32). Since thermal unfolding of
these proteins leads to irreversible denaturation, thermodynamic parameters could
not be derived. As already suggested by the increased dichroic intensities at 37 °C
the enhanced stability of Nle-rhPrPC is well reflected by the higher melting point
(Tm = 74.4 ± 3.4 °C) compared to Met-rhPrPC (Tm = 65.2 ± 4.2 °C) (Fig. 32 A). An
enhanced thermal stability induced by the Met → Nle replacement has previously
been observed for the α-helical annexin A5 (105) and has been attributed to the
increased hydrophobicity of the protein core by the buried Nle residues. Similarly, the
buried norleucines 205/206 should strongly contribute to the markedly enhanced
stability of the Nle-rhPrPC variant.
For the thermal unfolding of Mox-rhPrPC a gradual, non-cooperative melting
between 42 °C and 95 °C was observed (Fig. 32 B). Such unfolding patterns are
typical for proteins, which either are very flexible and have a partially unfolded
ground state or contain heterogeneous populations of folded states. We attribute the
different unfolding behavior of Mox-rhPrPC as compared to Met- or Nle-rhPrPC to its
flexibility and the mixed populations of prevalently β-sheet structure of this variant.
Fig. 32 Thermal denaturation monitored by the changes of dichroic intensities at 222 nm in function of temperature. (A) Comparison between the melting curve of Met-rhPrPC ( black) and
Nle-rhPrPC ( blue). (B) Comparison between the melting curve of Met-rhPrPC ( black) and
Mox-rhPrPC ( red).
Results 72
An additional striking feature of the temperature induced denaturation experiment
with the Mox-variant is the maximum stability in the temperature range between
35 °C and 45 °C, while below and above these temperatures protein denaturation
takes place (Fig. 32 B). A decrease in protein stability induced by lower temperatures
is known as cold denaturation (106). In natural proteins cold denaturation usually
occurs below the freezing point of water and was observed for proteins with
hydrophilic amino acid residues in the core structure (107). Therefore, the cold-
denaturation-like melting of Mox-rhPrPC is most probably caused by the introduction
of hydrophilicity in the globular domain of rhPrPC with the methoxinine 205/206
residues. A similar observation was reported recently for a variant of the
ribonuclease inhibitor bastar containing a hydrophilic tryptophan analog in the protein
interior (27).
7.10 Pro- and anti-aggregation prion protein variants
The in vitro aggregation tendency of Met-rhPrPC and its variants was monitored
using the well established de novo SDS-dependent in vitro aggregation assay (87,
101). The aggregation behavior of fluorescently labeled rhPrPC was observed by
using confocal single molecule analysis techniques; such as fluorescence cross-
correlation spectroscopy analysis (cross-correlation FCS) as well as scanning for
intensely fluorescent targets (SIFT) (91, 98). The samples containing 0.2% SDS act
as reference, since in 0.2% SDS no aggregation should take place (data not shown).
The aggregation onset was, when the SDS concentration in the samples was diluted
to 0.0125%. In Fig. 33 A, the aggregation capacity of Nle-rhPrPC is significantly
reduced compared to that of Met-rhPrPC, under the identical experimental
conditions. This strong anti-aggregation effect directly correlates with an enhanced
stability of the spatial structure and a high α-helical content of Nle-rhPrPC (vide infra).
In contrast, the Met replacement by Mox in rhPrPC caused a strong pro-aggregatory
effect. As expected, in the aggregation assay under oxidative conditions both Nle-
and Mox-variants were relatively insensitive to the different NaIO4 concentrations
(Fig. 33 B). The observed increase in the aggregation tendency, at higher oxidant
concentrations (over 2 mM), has to be attributed to the oxidative degradation of other
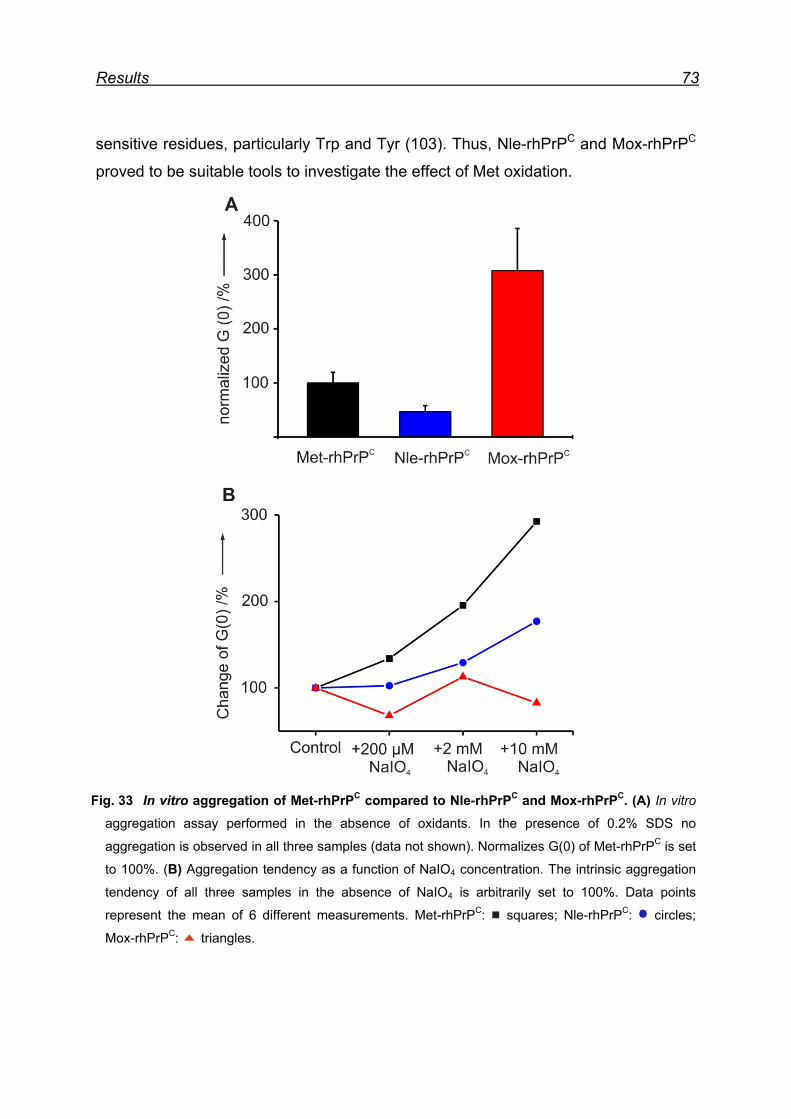
Results 73
sensitive residues, particularly Trp and Tyr (103). Thus, Nle-rhPrPC and Mox-rhPrPC
proved to be suitable tools to investigate the effect of Met oxidation.
Fig. 33 In vitro aggregation of Met-rhPrPC compared to Nle-rhPrPC and Mox-rhPrPC. (A) In vitro
aggregation assay performed in the absence of oxidants. In the presence of 0.2% SDS no
aggregation is observed in all three samples (data not shown). Normalizes G(0) of Met-rhPrPC is set
to 100%. (B) Aggregation tendency as a function of NaIO4 concentration. The intrinsic aggregation
tendency of all three samples in the absence of NaIO4 is arbitrarily set to 100%. Data points
represent the mean of 6 different measurements. Met-rhPrPC: squares; Nle-rhPrPC: circles;
Mox-rhPrPC: triangles.
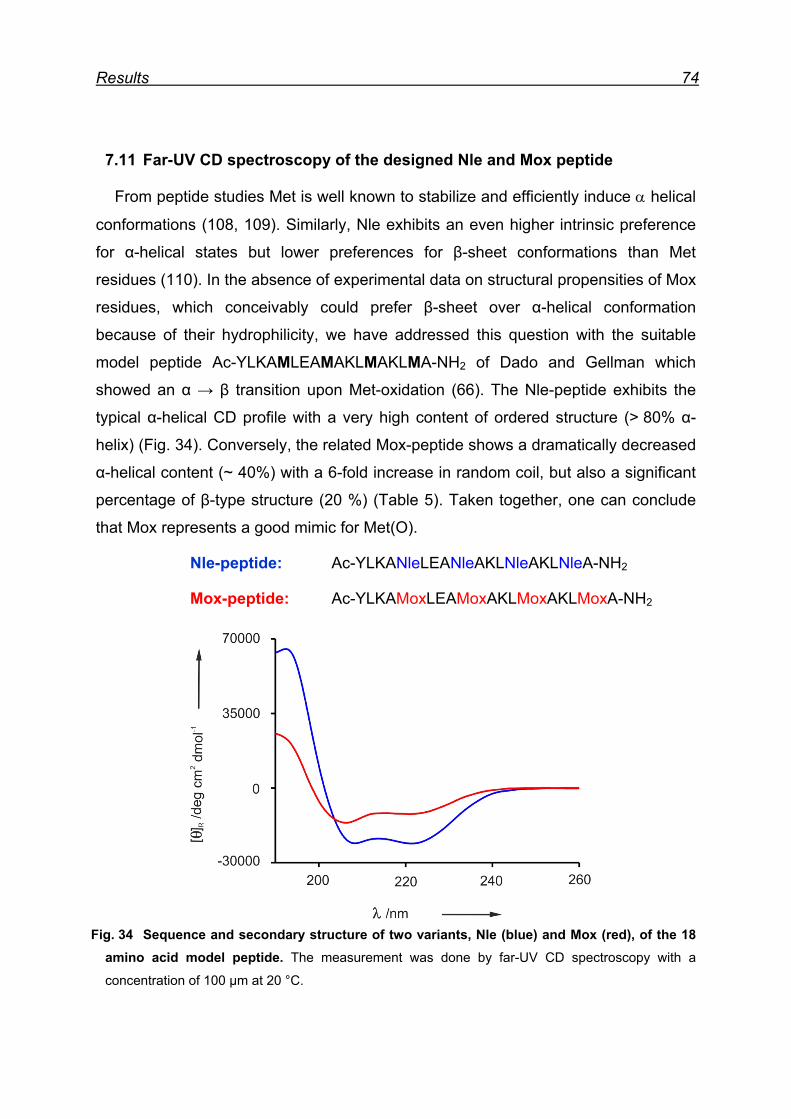
Results 74
7.11 Far-UV CD spectroscopy of the designed Nle and Mox peptide
From peptide studies Met is well known to stabilize and efficiently induce α helical
conformations (108, 109). Similarly, Nle exhibits an even higher intrinsic preference
for α-helical states but lower preferences for β-sheet conformations than Met
residues (110). In the absence of experimental data on structural propensities of Mox
residues, which conceivably could prefer β-sheet over α-helical conformation
because of their hydrophilicity, we have addressed this question with the suitable
model peptide Ac-YLKAMLEAMAKLMAKLMA-NH2 of Dado and Gellman which
showed an α → β transition upon Met-oxidation (66). The Nle-peptide exhibits the
typical α-helical CD profile with a very high content of ordered structure (> 80% α-
helix) (Fig. 34). Conversely, the related Mox-peptide shows a dramatically decreased
α-helical content (~ 40%) with a 6-fold increase in random coil, but also a significant
percentage of β-type structure (20 %) (Table 5). Taken together, one can conclude
that Mox represents a good mimic for Met(O).
Nle-peptide: Ac-YLKANleLEANleAKLNleAKLNleA-NH2
Mox-peptide: Ac-YLKAMoxLEAMoxAKLMoxAKLMoxA-NH2
Fig. 34 Sequence and secondary structure of two variants, Nle (blue) and Mox (red), of the 18
amino acid model peptide. The measurement was done by far-UV CD spectroscopy with a
concentration of 100 µm at 20 °C.
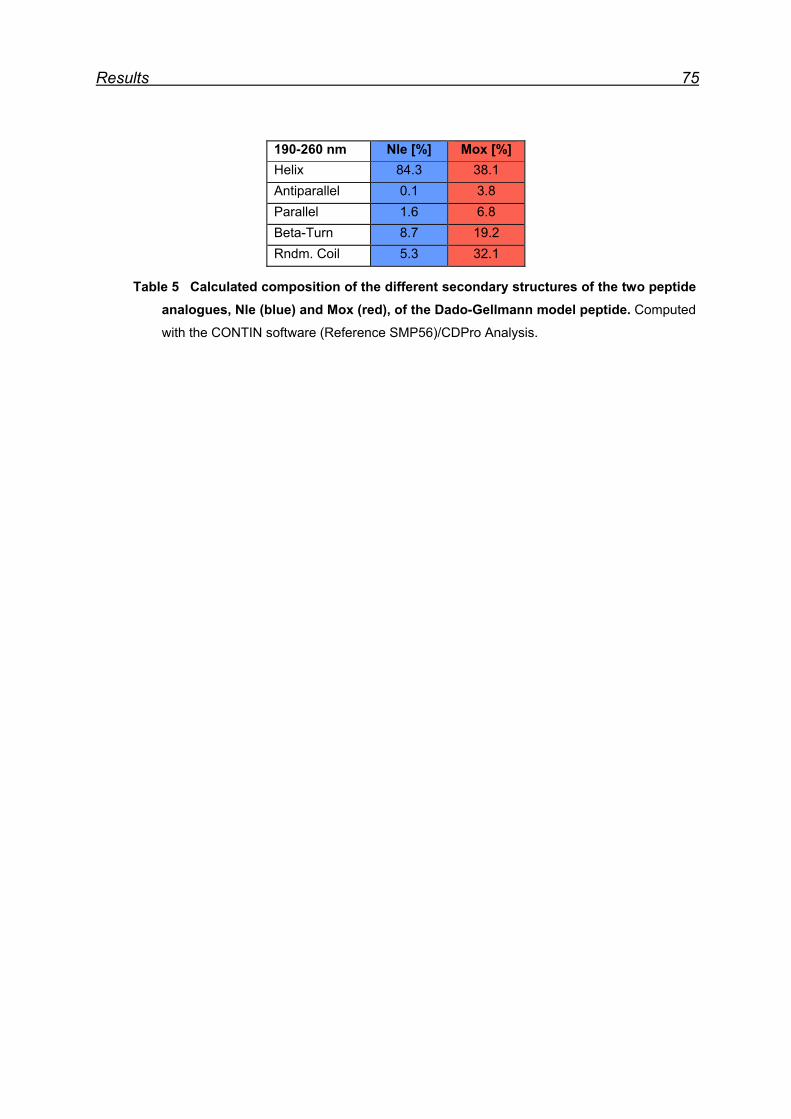
Results 75
190-260 nm Nle [%] Mox [%] Helix 84.3 38.1 Antiparallel 0.1 3.8 Parallel 1.6 6.8 Beta-Turn 8.7 19.2 Rndm. Coil 5.3 32.1
Table 5 Calculated composition of the different secondary structures of the two peptide analogues, Nle (blue) and Mox (red), of the Dado-Gellmann model peptide. Computed
with the CONTIN software (Reference SMP56)/CDPro Analysis.
Discussion 76
8 Discussion
8.1 Met oxidation as a possible origin of prion protein structural conversion
The formation of PrPSc from PrPC is a post-translational process that is believed to
follow an autocatalytic mechanism (82). The conversion involves a conformational
change in which the α-helical content of the protein decreases while the amount of β-
sheet dramatically increases (85). A chemical modification of particular residues
might trigger this α → β transition. Until now, no candidate for chemical modification
has been unambiguously identified. One suspicious candidate could be Met, since
the oxidation of its side chain changes the conformational preferences in model
peptides (66). Additionally, Met is readily oxidized by most reactive oxygen species.
Such chemical modification (induced by ROS) of all Met residues (especially buried
ones) might represent an initial event that leads to intramolecular α → β structural
conversion and subsequent fatal PrPC → PrPSc transition. Although there is
increasing evidence for an important role of PrPC in oxidative stress (83), a direct
correlation between PrPC oxidation and its conversion to a β-sheet rich form, so far,
was not clearly established. Therefore, the aim of this work was to shed light on this
hypothesis.
8.2 Recombinant hPrPC as model for structural conversion
In nature, the cellular prion protein is an N-linked glycoprotein normally bound to
the neuronal cell membrane by a GPI anchor (78). However, for structural studies
recombinant PrPC is favored, most notably because of the difficulty in isolating and
purifying the necessary amounts of PrPC from tissue. Moreover the combination of
circular dichroism, 1H-NMR spectroscopy (111), antibody-binding studies (112) as
well as molecular dynamics simulations (113), indicate that rPrPC (unglycosylated
and without GPI anchor) and the natural glycoprotein (glycosylated and with GPI
anchor) share similar structural characteristics. Furthermore, unglycosylated isoforms
of PrPC exist as well in vivo and their conversion to PrPSc is confirmed (114).
Recently a number of experimental and theoretical studies investigated the possible
Discussion 77
role of glycosylation and membrane anchoring on PrPc structure, as observed in the
work from Ollesch and associates (115), which found that membrane anchoring of
prion protein at high concentration profoundly alters its secondary structure.
However, other studies such as from DeMarco and Deggett (113) reported that
glycosylation and attachment of PrPC to the membrane surface via a GPI anchor,
does not significantly change the structure or dynamics of PrPC. Independent of this
unresolved issue, it is unlikely that the state of the protein in solution or in the
membrane-anchored form has an influence on possible structural perturbation
caused by the oxidation of Met residues localized in the folded, exposed part of the
protein. Accordingly, all experiments were performed with rhPrPC.
8.3 Protein damage caused by Met oxidation
Diverse human disorders, including several neurodegenerative diseases,
systematic amyloidoses and age-related diseases, arise from the misfolding and
aggregation of an underlying protein (53). The role of oxidative damage caused by
Met oxidation in these processes is scarcely appreciated in the contemporary
literature. However, since Met with its high oxidation propensity is one of the major
targets of ROS, the consequences of its oxidative modifications cannot easily be
neglected. The oxidation of surface-exposed Met residues was suggested to
represent an endogenous antioxidant defense (scavenger function) which protects
proteins against the oxidation by ROS (116). The degree of oxidized Met residues in
cells is controlled by the balance of the production of ROS and the reduction of
Met(O) back to Met by Mrs (Fig. 6) (57). Therefore, diseases related to protein
misfolding might be a logical consequence of an imbalance between cellular
oxidation and reduction reactions and/or a loss of other protective mechanisms.
The accumulation of oxidized proteins, especially those containing oxidized Met
residues is also a hallmark of aging (117). Notably, the performance of the Msr
enzymatic system (Fig. 6) determines aging, stress resistance and lifespan of
bacteria, yeast, insects and mammals (68). For example, in transgenic Drosophila
overexpression of MsrA extended the mean life span up to 70%, whereas mice
without this gene had on average about 40% shorter life spans (57, 58).
Discussion 78
8.4 Oxidation of Met residues in rhPrPC and structural conversion
8.4.1 Met residues in the prion protein
The Met residues in rhPrPC are mainly surface-exposed and located in the
structured globular part (125-231) as follows (Fig. 7): Met129 in the β-strand I,
Met134 in the loop between β-strand 1 and α-helix I, Met154 in α-helix I, and Met166
in β-strand II. Only Met109 and Met112 are located in the unstructured N-terminus
(23-124). However, Met205 and Met206 in α-helix III are buried, whereas Met213, as
well located in α-helix III, is only partially surface-exposed.
The left-handed β-helical model of the human PrP89-146 by Langedijk et al. (118)
places particular emphasis on the role of Met109 and Met129 in providing stability for
the formation of a stable left-handed β-helical structure. Interestingly, Met129 is as
well involved in prion protein polymorphism, Met or Val at codon 129 (Met129Val)
and Glu or Lys at codon 219 (Glu219Lys) (114). The common human Met–Val
polymorphism at position 129 has a profound influence on prion pathogenesis. For
instance, heterozygosity for Met and Val at position 129 is highly protective against
sporadic and acquired prion diseases in humans (119). On the contrary, nvCJD
occurs exclusively in Met129 homozygotes (120).
Position 205 is invariantly occupied by hydrophobic residues in prion proteins from
different species and is well conserved in all mammalian prion proteins. Met205 is
part of the hydrophobic face of helix III and is involved in a network of interactions
that stabilize the packing of this structural motif. Its replacement by hydrophilic Ser or
Arg prevents folding in vivo of the mutant protein (121), a fact which was confirmed
by molecular dynamic simulations (122). A similar structural role can possibly be
assigned to the vicinal Met206 residue. Indeed, by using molecular dynamics
simulations, Colombo and coworkers suggested recently that oxidation of helix III Met
residues (Met206, Met213) might be the switch triggering the initial α-fold
destabilization that is required for productive pathogenic conversion of prion protein
(123).
Discussion 79
8.4.2 Structural consequences of Met oxidation in the prion protein
The aforementioned facts led us to propose the following hypothesis: The
oxidation of PrPC, especially of Met205/206 in the hydrophobic core dramatically
changes the intrinsic local conformational preferences and facilitates global α → β
structural conversion in prion protein, which consequently leads to aggregation and
disease.
The distribution pattern of Met residues in the prion protein sequence certainly
contributes to the local organization of the secondary structure elements (α-helices
and β-sheets). It was shown, by Dado and Gellman, for model peptides that Met
favors α-helices whereas oxidized Met induces β-sheets (66). In order to assess
whether Met oxidation similarly triggers α → β conversion in prion protein, we
specifically oxidized (97) the Met residues in rhPrPC23-231 with increasing amounts
of sodium periodate (NaIO4).
8.4.3 Prion protein aggregation upon periodate oxidation
Protein aggregation is a central aspect, regarding neurodegenerative diseases in
general and prion disease in particular (124). Therefore we wanted to examine, if
specific oxidiation of the Met residues in rhPrPC with periodate (97), induces prion
protein aggregation. To achieve this, a de novo aggregation method developed by
the group of D. Riesner (101, 125) was employed. In recent years, FCS and SIFT
have been recognized as methods that allow highly sensitive analysis of protein
aggregation in neurodegenerative diseases such as prion diseases at the molecular
level.
The oxidation experiments showed not only an increase in aggregation tendency
of rhPrPC with increasing periodate concentration (Fig. 15), but also a higher
proportion of oxidized Met residues at elevated NaIO4 equiv. was observed (see
7.4.4). While at lower oxidant concentration, e.g., 5 equiv. NaIO4, mainly the surface-
exposed Met residues were oxidized to Met(O). With 25 equiv. NaIO4, in the soluble
fraction, even the buried Met205/206 residues were at least partially oxidized as was
assessed by the ESI-MS analysis of tryptic digests (Fig. 35).
Discussion 80
In the 25 equiv. NaIO4 pellet fraction the Met205/206 tryptic peptide was found to
contain one Met(O), as well as two Met(O)s (Fig. 35). Since we found the heavy
oxidation of Met205/206 predominantly in the pellet fraction we postulate that the
oxidation of these buried Met residues leads to precipitation of rhPrPC. The
concomitant relatively high proportion of unoxidized Met205/206 in the the same
fraction can be ascribed to the pull down effect of ‘healthy’ molecules during
precipitation.
From these results, it is conceivable that PrPC is tolerant toward individual Met-
oxidations substitution, especially at the surface. However, it might not be plastic
enough, to tolerate total oxidation of all individual Met residues, without devastating
consequences. Thus, we believe that once such profound chemical modification
(induced by ROS) occurs at all Met residues (especially buried ones) the
intramolecular α → β structural conversion inevitably takes place. Therefore, the
conversion of moderately hydrophobic Met to hydrophilic Met(O) causes the
secondary structure rearrangement in PrPC.
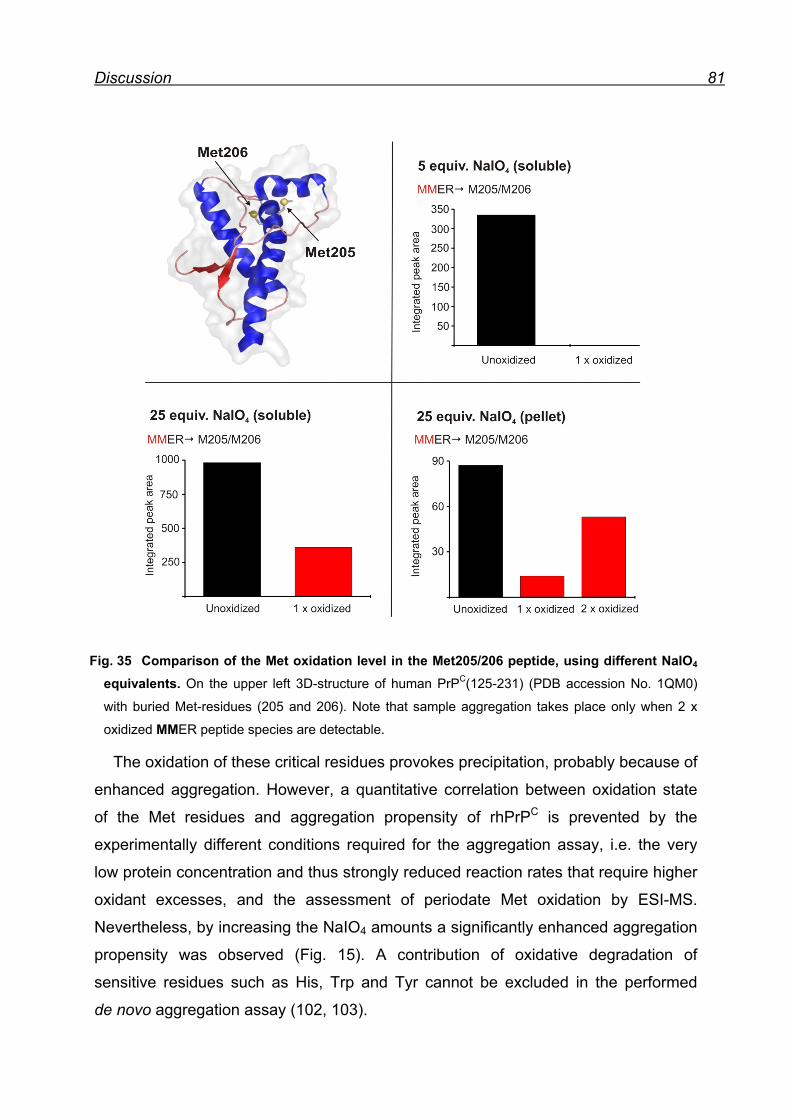
Discussion 81
Fig. 35 Comparison of the Met oxidation level in the Met205/206 peptide, using different NaIO4 equivalents. On the upper left 3D-structure of human PrPC(125-231) (PDB accession No. 1QM0)
with buried Met-residues (205 and 206). Note that sample aggregation takes place only when 2 x
oxidized MMER peptide species are detectable.
The oxidation of these critical residues provokes precipitation, probably because of
enhanced aggregation. However, a quantitative correlation between oxidation state
of the Met residues and aggregation propensity of rhPrPC is prevented by the
experimentally different conditions required for the aggregation assay, i.e. the very
low protein concentration and thus strongly reduced reaction rates that require higher
oxidant excesses, and the assessment of periodate Met oxidation by ESI-MS.
Nevertheless, by increasing the NaIO4 amounts a significantly enhanced aggregation
propensity was observed (Fig. 15). A contribution of oxidative degradation of
sensitive residues such as His, Trp and Tyr cannot be excluded in the performed
de novo aggregation assay (102, 103).
Discussion 82
8.5 Chemical model for α → β conversion in rhPrPC
After we had observed the intriguing aggregation effect that periodate oxidation of
Met residues produces on rhPrPC, we sought to delineate how we could induce the
intramolecular α → β structural conversion of rhPrPC in the frame of a well-defined
model system. The classical site directed mutagenesis is less suitable for that
purpose since observed folding properties cannot unambiguously be assigned to the
different shape of the new side chain or to its chemistry. Attempts to study the role of
Met residues in proteins by classical site directed mutagenesis in the frame of 20
canonical amino acids are often controversial. For example in a Met205Arg mutant
(122) it is difficult to assess, whether the observed folding properties are due to the
differences in the shape of the side chain or to the chemical differences of the atoms
involved.
In order to create a model system that allows a direct correlation between Met
oxidation and aggregation propensity, we first aimed at the quantitative substitution of
Met by Met(O) or Met(O2) in the prion protein. Unfortunately, due to the intracellular
catalytic activity of Msr, as well as general reducing features of cytosol, our attempts
to replace all Met residues in rhPrPC with Met(O) or Met(O2), respectively, by the SPI
method failed. Therefore, we selected the alternative approach of replacing the Met
residues with synthetic Met analogs. For our study we replaced the Met residues by
the significantly more hydrophilic Mox to mimic the Met(O)-rhPrPC form and
additionally combined it with the expression of the oxidation-insensitive Nle-variant
(Fig. 36). The residue specific replacement of these isosteric Met analogs in the prion
protein proved to be a suitable tool to study the effects of extreme hydropathy
changes (hydrophilic Mox mimicking Met(O) vs. hydrophobic Nle mimicking Met) on
protein aggregation. Both Mox and Nle have nearly identical chain lengths and are
resistant to chemical oxidation and reduction of their side chains. By introducing such
modest alterations into the studied protein structures, possible steric effects should
be minimized. Thus, any structural differences in the resulting Mox and Nle protein
variants reflect only the possible conformational preferences provoked by the
hydropathy change.
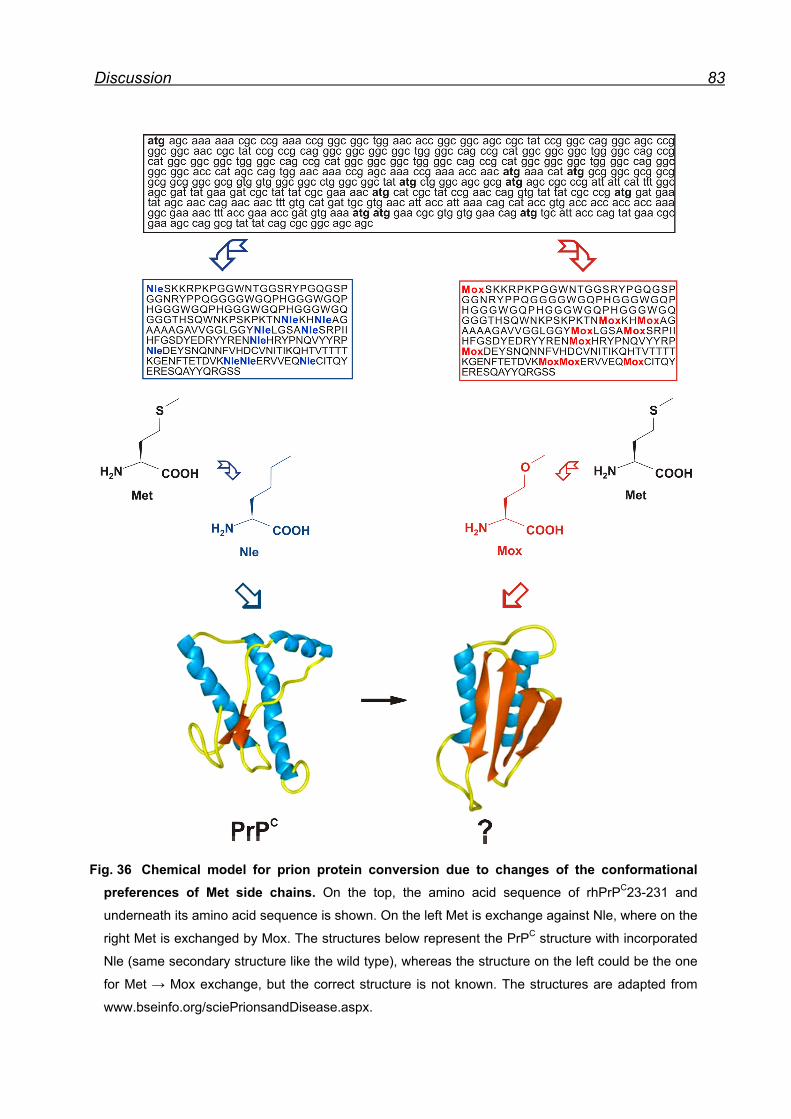
Discussion 83
Fig. 36 Chemical model for prion protein conversion due to changes of the conformational preferences of Met side chains. On the top, the amino acid sequence of rhPrPC23-231 and
underneath its amino acid sequence is shown. On the left Met is exchange against Nle, where on the
right Met is exchanged by Mox. The structures below represent the PrPC structure with incorporated
Nle (same secondary structure like the wild type), whereas the structure on the left could be the one
for Met → Mox exchange, but the correct structure is not known. The structures are adapted from
www.bseinfo.org/sciePrionsandDisease.aspx.
Discussion 84
8.6 Proof of principle of the newly developed chemical model
The first step to test for the accuracy of our chemical model was the secondary
structure observation of our new generated prion protein variants. Far-UV CD spectra
of Met-rhPrPC and Nle-rhPrPC exhibit the typical pattern for α + β proteins, with two
characteristic minima at 222 nm and at 208 nm of similar intensity (Fig. 30).
However, a stronger dichroic signal of Nle-rhPrPC might indicate additional protein
stabilization as confirmed by secondary structure changes as a function of
temperature increase. Interestingly, at 60 °C the secondary structure of Met-rhPrPC
was partly unfolded, where in contrast the secondary structure of Nle-rhPrPC seemed
to be unchanged (Fig. 31 B). Expectedly, this stabilizing effect could as well be
observed in the dramatic shift of the Tm value of about 10 °C (Fig. 32 A), by thermal
denaturation of the proteins.
Conversely, replacing the Met residues in rhPrPC by Mox a drastic change in the
overall spectral intensity as well as in curve shape was observed. Obviously, the
secondary structure of Mox-rhPrPC is quite different indicating predominant β-sheet
configuration (Fig. 30), with a cold denaturation like melting curve (Fig. 32 B).
The second step to test the functionality of our newly developed chemical model
was to perform de novo aggregation assays. The simulated Met oxidation effect can
be seen in Fig. 33 A, where the aggregation level of Mox-rhPrPC was three times
higher than that of Met-rhPrPC. Moreover, it was possible with the Nle-rhPrPC variant
to generate a protein that inhibits protein aggregation, since the aggregation level
was reduced to about 50% compared to Met-rhPrPC. In order to assess whether the
opposite aggregation tendency of the Mox-rhPrPC and Nle-rhPrPC variants is caused
directly by the incorporation of the two Met analogs we performed additional de novo
aggregation assays with increasing NaIO4 concentrations. The finding that the Nle
variant showed only a slight increase in the aggregation tendency indicates that the
comparably higher aggregation tendency of the parent protein results from the
oxidation of Met residues (Fig. 33 B). Additionally, the aggregation level of the Mox
variant remained unaltered during NaIO4 addition (Fig. 33 B). This indicates, as
aspected, that the oxidant does not have any effect on the Mox variant. Therefore,
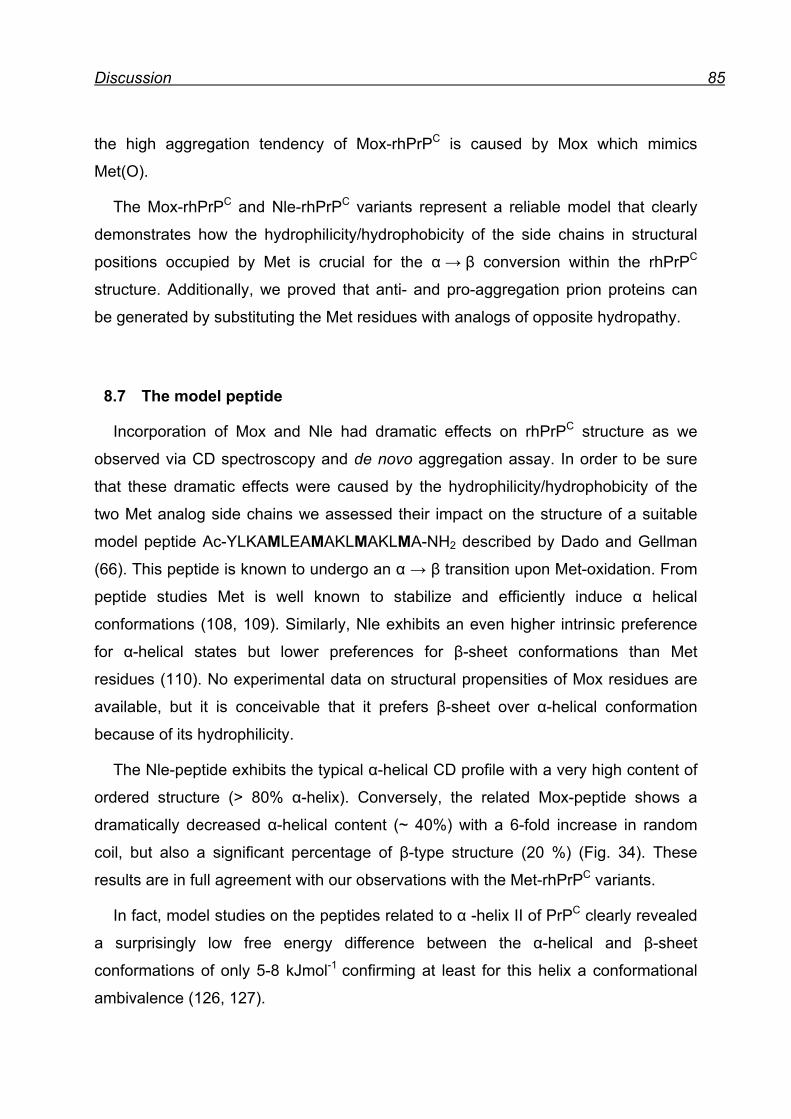
Discussion 85
the high aggregation tendency of Mox-rhPrPC is caused by Mox which mimics
Met(O).
The Mox-rhPrPC and Nle-rhPrPC variants represent a reliable model that clearly
demonstrates how the hydrophilicity/hydrophobicity of the side chains in structural
positions occupied by Met is crucial for the α → β conversion within the rhPrPC
structure. Additionally, we proved that anti- and pro-aggregation prion proteins can
be generated by substituting the Met residues with analogs of opposite hydropathy.
8.7 The model peptide
Incorporation of Mox and Nle had dramatic effects on rhPrPC structure as we
observed via CD spectroscopy and de novo aggregation assay. In order to be sure
that these dramatic effects were caused by the hydrophilicity/hydrophobicity of the
two Met analog side chains we assessed their impact on the structure of a suitable
model peptide Ac-YLKAMLEAMAKLMAKLMA-NH2 described by Dado and Gellman
(66). This peptide is known to undergo an α → β transition upon Met-oxidation. From
peptide studies Met is well known to stabilize and efficiently induce α helical
conformations (108, 109). Similarly, Nle exhibits an even higher intrinsic preference
for α-helical states but lower preferences for β-sheet conformations than Met
residues (110). No experimental data on structural propensities of Mox residues are
available, but it is conceivable that it prefers β-sheet over α-helical conformation
because of its hydrophilicity.
The Nle-peptide exhibits the typical α-helical CD profile with a very high content of
ordered structure (> 80% α-helix). Conversely, the related Mox-peptide shows a
dramatically decreased α-helical content (~ 40%) with a 6-fold increase in random
coil, but also a significant percentage of β-type structure (20 %) (Fig. 34). These
results are in full agreement with our observations with the Met-rhPrPC variants.
In fact, model studies on the peptides related to α -helix II of PrPC clearly revealed
a surprisingly low free energy difference between the α-helical and β-sheet
conformations of only 5-8 kJmol-1 confirming at least for this helix a conformational
ambivalence (126, 127).

Discussion 86
Taken together, one can conclude that Mox represents a good mimic for Met(O).
Nonetheless, we have to be aware that though Mox represents a perfect surrogate
for Met(O), the effect of a Met → Met(O) exchange on rhPrPC aggregation propensity
as well as secondary structure might have been even more dramatic possibly due to
steric effects in addition to the hydropathy change. From our results we strongly
believe that Met oxidation in the prion protein can induce the α → β transition, which
further leads to aggregation and finally to disease.
Conclusions 87
9 Conclusions
The conversion process of PrPC into its pathological isoform PrPSc is considered to
play a central role in prion associated disorders (71). Therefore in vitro transitions of
recombinant PrP into β-sheet enriched, aggregated structures, which mimic the
characteristics of infectious PrPSc is of fundamental importance to elucidate the initial
event in pathogenesis of prion diseases. Although the initial onset for the
conformational change is not known, there is increasing evidence that oxidative
stress plays an important role in prion infection. Moreover, ROS toxicity has been
implicated in several other neurological disorders as well as in aging (83). In this
context, the amino acid Met might be of particular importance, since it is readily
oxidized by most reactive species. In addition, the oxididation of Met side chains
changed the conformational preferences in model peptides (66). In the PrPC
structure, the Met residues are playing a crucial role in forming the hydrophobic core
of the globular (i.e. ordered) domain. Therefore, it is conceivable that oxidation of
these residues in the hydrophobic core destroys the amphipathic nature of the α-
helixes. In other words, the structural α → β transition of PrPC is directly related to the
conformational preferences of Met and Met(O) residues. In fribrillar PrPSc, such initial
chemical modification may be difficult to detect, as a small seed of modified
molecules may suffice for the onset of the process.
In experimental Met oxidation studies of PrPC, controllable and selective side
chain oxidation is difficult to achieve. Hence to study the role of Met oxidation in the
full length rhPrPC(23–231) and therefore the α → β structural conversion, the
residue-specific incorporation of Nle and Mox provided a useful chemical model. The
results we obtained with our experimental model strongly support a natural scenario
where oxidative conversion of Met residues, especially buried ones, into Met(O) may
act as primary event in sporadic prion disease induction, particularly taking into
account the pronounced structural ambivalence of PrPC.
The non-canonical amino acid incorporation of Nle and Mox provides a tool to
generate prion proteins that are arrested in conformational states and mimic PrPC or
even PrPSc. Thus, this approach might in general be a suitable tool to explore the
Conclusions 88
underlying mechanisms of crucial biological events, such as structural transitions in
many other pathophysiologically relevant proteins. This is demonstrated by an
excellent correlation between solution properties of Met/Nle/Mox side chains and the
conformational states of the related protein variants. Not surprisingly, this enabled us
to anticipate Met oxidation as an initial destabilizing event of the rhPrPC α-fold and its
subsequent transition and assembly into rhPrPSc.
Finally, recent evidence indicates that diverse neurodegenerative diseases might
have a common cause and pathological mechanism: first, the misfolding, second, the
aggregation and finally, the accumulation of proteins in the brain resulting in neuronal
apoptosis (64). Moreover, several studies coming from different research fields, as
well as distinct diseases, strongly support this hypothesis and suggest that a
common therapy for these devastating disorders might be possible. Consequently,
detailed understanding of the very early steps in the pathogenesis of these diseases
will certainly help to elucidate the crucial events in the disease process, towards
which suitable therapeutic strategies can be directed. In this context, it is conceivable
that the experimental approach, which was developed in this study, will be of prime
importance for studies of other proteins, highly relevant for neurodegenerative as well
as other aging-related diseases.
References 89
10 References
1. Miescher F (1871) Über Die Chemische Zusammensetzung Der Eiterzellen.
Hoppe-Seyler´s medizinisch-chemische Untersuchungen 4, 441-460.
2. Avery OT, MacLeod CM & McCarty M (1944) Studies on the Chemical
Nature of the Substance Inducing Transformation of Pneumococcal Types:
Induction of Transformation by a DNA Fraction Isolated from Pneumococcus
Type III. J. Exp. Med. 79, 137-158.
3. Franklin RE & Gosling RG (1953) Evidence for 2-Chain Helix in Crystalline
Structure of Sodium Deoxyribonucleate. Nature 172, 156-157.
4. Franklin RE & Gosling RG (1953) Molecular Configuration in Sodium
Thymonucleate. Nature 171, 740-741.
5. Watson JD & Crick FHC (1953) The Structure of DNA. Cold Spring Harb
Symp Quant Biol 18, 123-131.
6. Watson JD & Crick FHC (1953) Molecular Structure of Nucleic Acids: A
Structure for Deoxyribose Nucleic Acid. Nature 171, 737-738.
7. Watson JD & Crick FHC (1953) Genetical Implications of the Structure of
Deoxyribonucleic Acid. Nature 171, 964-967.
8. Crick FH (1957) On Protein Synthesis. Symp Soc Exp Biol 12, 138-63.
9. Stryer L, Tymoczko JL & Berg JM (2007) Stryer Biochemie (Elsevier GmbH,
Spektrum Akademischer Verlag).
10. Matthaei H & Nirenberg MW (1961) Dependence of Cell-Free Protein
Synthesis in E Coli Upon RNA Prepared from Ribosomes. Biochem Biophys
Res Commun 4, 404-&.
11. Knippers R (2006) Molekulare Genetik (Thieme, Stuttgart).
12. Hames D & Hooper N (2005) Biochemistry (Instant Notes) (Taylor & Francis
Group, Abingdon).
References 90
13. Kennell D & Riezman H (1977) Transcription and Translation Initiation
Frequencies of the Escherichia Coli Lac Operon. J Mol Biol 114, 1-21.
14. Budisa N (2006) Engineering the Genetic Code-Expanding the Amino Acid
Repertoire for the Design of Novel Proteins (WILEY-VCH Verlag, Weilheim).
15. Köhrer C & RajBhandary U (2009) Protein Engineering (Springer-Verlag,
Berlin).
16. Srinivasan G, James CM & Krzycki JA (2002) Pyrrolysine Encoded by UAG
in Archaea: Charging of a UAG-Decoding Specialized tRNA. Science 296,
1459-1462.
17. Cowie DB & Cohen GN (1957) Biosynthesis by Escherichia Coli of Active
Altered Proteins Containing Selenium Instead of Sulfur. Biochim Biophys
Acta 26, 252-261.
18. Hendrickson WA, Horton JR & Lemaster DM (1990) Selenomethionyl
Proteins Produced for Analysis by Multiwavelength Anomalous Diffraction
(Mad) - a Vehicle for Direct Determination of 3-Dimensional Structure. EMBO
J 9, 1665-1672.
19. Cohen GN & Munier R (1959) Effets Des Analogues Structuraux
D'aminoacids Sur La Croissance, La Synthèse De Protéines Et La Synthèse
D'enzymes Chez Escherichia Coli. Biochim Biophys Acta 31, 347-356.
20. Budisa N, Minks C, Alefelder S, Wenger W, Dong F, et al. (1999) Toward the
Experimental Codon Reassignment in Vivo: Protein Building with an
Expanded Amino Acid Repertoire. FASEB J 13, 41-51.
21. Weber P, Reznicek L, Mitteregger G, Kretzschmar H & Giese A (2008)
Differential Effects of Prion Particle Size on Infectivity in Vivo and in Vitro.
Biochem Biophys Res Commun 369, 924-928.
22. O'Brien PJ & Herschlag D (1999) Catalytic Promiscuity and the Evolution of
New Enzymatic Activities. Chem Biol 6, R91-R105.
References 91
23. Hartman MCT, Josephson K & Szostak JW (2006) Enzymatic Aminoacylation
of tRNA with Unnatural Amino Acids. Proc Natl Acad Sci USA 103, 4356-
4361.
24. Hartman MCT, Josephson K, Lin C-W & Szostak JW (2007) An Expanded
Set of Amino Acid Analogs for the Ribosomal Translation of Unnatural
Peptides. PLoS ONE 2, e972.
25. Fersht AR & Dingwall C (1979) Editing Mechanism for the Methionyl-Transfer
RNA-Synthetase in the Selection of Amino-Acids in Protein-Synthesis.
Biochemistry 18, 1250-1256.
26. Rose GD & Wolfenden R (1993) Hydrogen-Bonding, Hydrophobicity,
Packing, and Protein-Folding. Annu Rev Biophys Biomol Struct 22, 381-415.
27. Rubini M, Lepthien S, Golbik R & Budisa N (2006) Aminotryptophan-
Containing Barstar: Structure-Function Tradeoff in Protein Design and
Engineering with an Expanded Genetic Code. Biochim Biophys Acta 1764,
1147-1158.
28. Chapeville F, Lipmann F, von Ehrenstein G, Weisblum B, Ray WJ, et al.
(1962) On the Role of Soluble RNA in Coding for Amino Acids. Proc Natl
Acad Sci USA 48, 1086-1092.
29. Noren CJ, Anthony-Cahill SJ, Griffith MC & Schultz PG (1989) A General
Method for Site-Specific Incorporation of Unnatural Amino Acids into
Proteins. Science 244, 182-188.
30. Arslan T, Mamaev SV, Mamaeva NV & Hecht SM (1997) Structurally
Modified Firefly Luciferase. Effects of Amino Acid Substitution at Position
286. J Am Chem Soc 119, 10877-10887.
31. Bain JD, Diala ES, Glabe CG, Dix TA & Chamberlin AR (1989) Biosynthetic
Site-Specific Incorporation of a Non-Natural Amino Acid into a Polypeptide. J
Am Chem Soc 111, 8013-8014.
32. Mendel D, Cornish VW & Schultz PG (1995) Site-Directed Mutagenesis with
an Expanded Genetic Code. Annu Rev Biophys Biomol Struct 24, 435-462.
References 92
33. Kwon I, Kirshenbaum K & Tirrell DA (2003) Breaking the Degeneracy of the
Genetic Code. J Am Chem Soc 125, 7512-7513.
34. Hohsaka T, Kajihara D, Ashizuka Y, Murakami H & Sisido M (1999) Efficient
Incorporation of Nonnatural Amino Acids with Large Aromatic Groups into
Streptavidin in in Vitro Protein Synthesizing Systems. J Am Chem Soc 121,
34-40.
35. Breydo L, Bocharova OV, Makarava N, Salnikov VV, Anderson M, et al.
(2005) Methionine Oxidation Interferes with Conversion of the Prion Protein
into the Fibrillar Proteinase K-Resistant Conformation. Biochemistry 44,
15534-15543.
36. Tamura K & Schimmel P (2002) Ribozyme Programming Extends the Protein
Code. Nat Biotech 20, 669-670.
37. Bain JD, Switzer C, Chamberlin R & Bennert SA (1992) Ribosome-Mediated
Incorporation of a Non-Standard Amino Acid into a Peptide through
Expansion of the Genetic Code. Nature 356, 537-539.
38. Rackham O & Chin JW (2005) A Network of Orthogonal Ribosome-mRNA
Pairs. Nat Chem Biol 1, 159-166.
39. Wang K, Neumann H, Peak-Chew SY & Chin JW (2007) Evolved Orthogonal
Ribosomes Enhance the Efficiency of Synthetic Genetic Code Expansion.
Nat Biotech 25, 770-777.
40. Sisido, Sisido M, Hohsaka & Hohsaka T (2001) Introduction of Specialty
Functions by the Position-Specific Incorporation of Nonnatural Amino Acids
into Proteins through Four-Base Codon/Anticodon Pairs. Appl Microbiol
Biotechnol 57, 274-281.
41. Hohsaka T, Ashizuka Y, Taira H, Murakami H & Sisido M (2001)
Incorporation of Nonnatural Amino Acids into Proteins by Using Various
Four-Base Codons in an Escherichia Coli in Vitro Translation System.
Biochemistry 40, 11060-11064.
References 93
42. Magliery TJ, Anderson JC & Schultz PG (2001) Expanding the Genetic Code:
Selection of Efficient Suppressors of Four-Base Codons and Identification of
"Shifty" Four-Base Codons with a Library Approach in Escherichia Coli. J Mol
Biol 307, 755-769.
43. Hohsaka T & Sisido M (2002) Incorporation of Non-Natural Amino Acids into
Proteins. Curr Opin Chem Biol 6, 809-815.
44. Budisa N (2004) Prolegomena to Future Experimental Efforts on Genetic
Code Engineering by Expanding Its Amino Acid Repertoire. Angew Chem Int
Ed Engl 43, 6426-6463.
45. Vogt W (1995) Oxidation of Methionyl Residues in Proteins - Tools, Targets,
and Reversal. Free Radic. Biol. Med. 18, 93-105.
46. Brosnan JT & Brosnan ME (2006) The Sulfur-Containing Amino Acids: An
Overview. J. Nutr. 136, 1636S-1640.
47. Voet D, Voet JG & Pratt CW (2008) Fundamentals of Biochemistry (John
Wiley & Sons, Inc., Hoboken).
48. Drabkin HJ, Estrella M & Rajbhandary UL (1998) Initiator-Elongator
Discrimination in Vertebrate tRNAs for Protein Synthesis. Mol Cell Biol 18,
1459-1466.
49. Cantoni GL (1953) S-Adenosylmethionine; a New Intermediate Formed
Enzymatically from L-Methionine and Adenosinetriphosphate. J Biol Chem
204, 403-416.
50. Brosnan JT, Brosnan ME, Bertolo RFP & Brunton JA (2007) Methionine: A
Metabolically Unique Amino Acid. Livest Sci 112, 2-7.
51. Lagerwerf FM, van de Weert M, Heerma W & Haverkamp J (1996)
Identification of Oxidized Methionine in Peptides. Rapid Commun. Mass
Spectrom. 10, 1905-1910.
52. Levine RL, Moskovitz J & Stadtman ER (2000) Oxidation of Methionine in
Proteins: Roles in Antioxidant Defense and Cellular Regulation. Iubmb Life
50, 301-307.
References 94
53. Davies MJ (2005) The Oxidative Environment and Protein Damage. Biochim
Biophys Acta 1703, 93-109.
54. Petropoulos I & Friguet B (2005) Protein Maintenance in Aging and
Replicative Senescence: A Role for the Peptide Methionine Sulfoxide
Reductases. Biochim Biophys Acta 1703, 261-266.
55. Moskovitz J (2005) Methionine Sulfoxide Reductases: Ubiquitous Enzymes
Involved in Antioxidant Defense, Protein Regulation, and Prevention of
Aging-Associated Diseases. Biochim Biophys Acta 1703, 213– 219.
56. Moskovitz J (2005) Roles of Methionine Suldfoxide Reductases in
Antioxidant Defense, Protein Regulation and Survival. Curr Pharm Des 11,
1451-1457.
57. Moskovitz J, Bar-Noy S, Williams WM, Berlett BS & Stadtman ER (2001)
Methionine Sulfoxide Reductase (MsrA) Is a Regulator of Antioxidant
Defense and Lifespan in Mammals. Proc Natl Acad Sci USA 98, 12920-
12925.
58. Ruan H, Tang XD, Chen ML, Joiner MA, Sun G, et al. (2002) High-Quality
Life Extension by the Enzyme Peptide Methionine Sulfoxide Reductase. Proc
Natl Acad Sci USA 99, 2748-2753.
59. Dobson CM (2005) An Overview of Protein Misfolding Diseases (Wiley-VCH
Verlag GmbH & Co. KGaA, Weinheim).
60. Anfinsen CB, Redfield RR, Choate WL, Page J & Carroll WR (1954) Studies
on the Gross Structure, Cross-Linkages, and Terminal Sequences in
Ribonuclease. J Biol Chem 207, 201-210.
61. Dobson CM (2006) Protein Aggregation and Its Consequences for Human
Disease. Protein Pept. Lett. 13, 219-227.
62. Chiti F & Dobson CM (2006) Protein Misfolding, Functional Amyloid, and
Human Disease. Annu Rev Biochem 75, 333-366.
63. Soto C (2003) Unfolding the Role of Protein Misfolding in Neurodegenerative
Diseases. Nat Rev Neurosci 4, 49-60.
References 95
64. Soto C (2006) Prions-the New Biology of Proteins (Taylor & Francis Group,
Boca Raton).
65. Ehud G (2002) The 'Correctly Folded' State of Proteins: Is It a Metastable
State? Angew Chem Int Ed Engl 41, 257-259.
66. Dado GP & Gellman SH (1993) Redox Control of Secondary Structure in a
Designed Peptide. J Am Chem Soc 115, 12609-12610.
67. Dayhoff MO, Barker WC & Hunt LT (1983) Establishing Homologies in
Protein Sequences. Methods Enzymol 91, 524-545.
68. Petropoulos I & Friguet B (2006) Maintenance of Proteins and Aging: The
Role of Oxidized Protein Repair. Free Radic Res 40, 1269-1276.
69. Belay ED (1999) Transmissible Spongiform Encephalopathies in Humans.
Annu Rev Microbiol 53, 283-314.
70. Belay ED & Schonberger LB (2005) The Public Health Impact of Prion
Diseases 1. Annu Rev Public Health 26, 191–212.
71. Stanley B. Prusiner MRS, Stephen J. DeArmond, and Fred E. Cohen (1998)
Prion Protein Biology. Cell 93, 337–348.
72. Lysek DA, Schorn C, Nivon LG, Esteve-Moya V, Christen B, et al. (2005)
Prion Protein NMR Structures of Cats, Dogs, Pigs, and Sheep. Proc Natl
Acad Sci USA 102, 640-645.
73. Hornemann S, Korth C, Oesch B, Riek R, Wider G, et al. (1997)
Recombinant Full-Length Murine Prion Protein, mPrP(23-231): Purification
and Spectroscopic Characterization. FEBS Lett 413, 277-281.
74. Donne DG, Viles JH, Groth D, Mehlhorn I, James TL, et al. (1997) Structure
of the Recombinant Full-Length Hamster Prion Protein PrP(29-231): The N
Terminus Is Highly Flexible. Proc Natl Acad Sci USA 94, 13452-13457.
75. Weissmann C (2004) The State of the Prion. Nat Rev Microbiol 2, 861-871.
76. Pan K-M, Baldwin M, Nguyen J, Gasset M, Serban A, et al. (1993)
Conversion of Alpha-Helices into Beta-Sheets Features in the Formation of
the Scrapie Prion Proteins. Mol Biol Cell 4, 313A.
References 96
77. Prusiner SB (1991) Molecular-Biology of Prion Diseases. Science 252, 1515-
1522.
78. Prusiner SB (1997) Prion Diseases and the BSE Crisis. Science 278, 245-
251.
79. Mrak RE, Griffin WST & Graham DI (1997) Aging-Associated Changes in
Human Brain. J Neuropathol Exp Neurol 56, 1269-1275.
80. Martin JB (1999) Molecular Basis of the Neurodegenerative Disorders. N
Engl J Med 340, 1970-1980.
81. Barnham KJ, Cappai R, Beyreuther K, Masters CL & Hill AF (2006)
Delineating Common Molecular Mechanisms in Alzheimer's and Prion
Diseases. Trends Biochem Sci 31, 465-472.
82. Bieschke J, Weber P, Sarafoff N, Beekes M, Giese A, et al. (2004)
Autocatalytic Self-Propagation of Misfolded Prion Protein. Proc Natl Acad Sci
USA 101, 12207-12211.
83. Milhavet O, McMahon HEM, Rachidi W, Nishida N, Katamine S, et al. (2000)
Prion Infection Impairs the Cellular Response to Oxidative Stress. Proc Natl
Acad Sci USA 97, 13937-13942.
84. DeMarco ML & Daggett V (2005) Local Environmental Effects on the
Structure of the Prion Protein. Comptes Rendus Biologies 328, 847-862.
85. Prusiner SB (1998) Prions. Proc Natl Acad Sci USA 95, 13363-13383.
86. Budisa N, Steipe B, Demange P, Eckerskorn C, Kellermann J, et al. (1995)
High-Level Biosynthetic Substitution of Methionine in Proteins by Its Analogs
2-Aminohexanoic Acid, Selenomethionine, Telluromethionine and Ethionine
in Escherichia-Coli. Eur J Biochem 230, 788-796.
87. Giese A, Levin J, Bertsch U & Kretzschmar H (2004) Effect of Metal Ions on
De Novo Aggregation of Full-Length Prion Protein. Biochem Biophys Res
Commun 320, 1240-1246.
References 97
88. Hornemann S & Glockshuber R (1996) Autonomous and Reversible Folding
of a Soluble Amino-Terminally Truncated Segment of the Mouse Prion
Protein. J Mol Biol 261, 614-619.
89. Merkel L, Cheburkin Y, Wiltschi B & Budisa B (2007) In Vivo
Chemoenzymatic Control of N-Terminal Processing in Recombinant Human
Epidermal Growth Factor. Chembiochem 8, 2227-2232.
90. Varshavsky A (1992) The N-End Rule. Cell 69, 725-735.
91. Schwille P, MeyerAlmes FJ & Rigler R (1997) Dual-Color Fluorescence
Cross-Correlation Spectroscopy for Multicomponent Diffusional Analysis in
Solution. Biophys J 72, 1878-1886.
92. Liemann S & Glockshuber R (1999) Influence of Amino Acid Substitutions
Related to Inherited Human Prion Diseases on the Thermodynamic Stability
of the Cellular Prion Protein. Biochemistry 38, 3258-3267.
93. Gill SC & von Hippel PH (1989) Calculation of Protein Extinction Coefficients
from Amino Acid Sequence Data. Anal Biochem 182, 319-326.
94. Foster LJ, de Hoog CL & Mann M (2003) Unbiased Quantitative Proteomics
of Lipid Rafts Reveals High Specificity for Signaling Factors. Proc Natl Acad
Sci USA 100, 5813-5818.
95. Olsen JV, de Godoy LMF, Li G, Macek B, Mortensen P, et al. (2005) Parts
Per Million Mass Accuracy on an Orbitrap Mass Spectrometer Via Lock Mass
Injection into a C-Trap. Mol Cell Proteomics 4, 2010-2021.
96. Gruhler A, Olsen JV, Mohammed S, Mortensen P, Faergeman NJ, et al.
(2005) Quantitative Phosphoproteomics Applied to the Yeast Pheromone
Signaling Pathway. Mol Cell Proteomics 4, 310-327.
97. Knowles JR (1965) Role of Methionine in Alpha-Chymotrypsin-Catalysed
Reactions. Biochem J 95, 180-&.
References 98
98. Bieschke J, Giese A, Schulz-Schaeffer W, Zerr I, Poser S, et al. (2000)
Ultrasensitive Detection of Pathological Prion Protein Aggregates by Dual-
Color Scanning for Intensely Fluorescent Targets. Proc Natl Acad Sci USA
97, 5468-5473.
99. Giese A, Bieschke J, Eigen M & Kretzschmar HA (2000) Putting Prions into
Focus: Application of Single Molecule Detection to the Diagnosis of Prion
Diseases. Arch Virol, 161-171.
100. Schwille P, Bieschke J & Oehlenschlager F (1997) Kinetic Investigations by
Fluorescence Correlation Spectroscopy: The Analytical and Diagnostic
Potential of Diffusion Studies. Biophys Chem 66, 211-228.
101. Post K, Pitschke M, Schafer O, Wille H, Appel TR, et al. (1998) Rapid
Acquisition of Beta-Sheet Structure in the Prion Protein Prior to Multimer
Formation. Biol Chem 379, 1307-1317.
102. Requenaa JR, Dimitrovaa MN, Legnameb G, Teijeirae S, Prusiner SB, et al.
(2004) Oxidation of Methionine Residues in the Prion Protein by Hydrogen
Peroxide. Arch Biochem Biophys 432 188–195.
103. Redecke L, von Bergen M, Clos J, Konarev PV, Svergun DI, et al. (2007)
Structural Characterization of Beta-Sheeted Oligomers Formed on the
Pathway of Oxidative Prion Protein Aggregation in Vitro. J Struct Biol 157,
308-320.
104. Canello T, Engelstein R, Moshel O, Xanthopoulos K, Juanes ME, et al.
(2008) Methionine Sulfoxides on PrPSc: A Prion-Specific Covalent Signature.
Biochemistry 47, 8866-8873.
105. Budisa N, Huber R, Golbik R, Minks C, Weyher E, et al. (1998) Atomic
Mutations in Annexin V - Thermodynamic Studies of Isomorphous Protein
Variants. Eur J Biochem 253, 1-9.
106. Privalov PL (1990) Cold Denaturation of Proteins. Biophys J 57, A26-A26.
107. Blandamer MJ, Briggs B, Burgess J & Cullis PM (1990) Thermodynamic
Model for Isobaric Heat-Capacities Associated with Cold and Warm Thermal-
Denaturation of Proteins. J Chem Soc-Faraday Trans 86, 1437-1441.
References 99
108. Creamer TP & Rose GD (1994) Alpha-Helix-Forming Propensities in
Peptides and Proteins. Proteins 19, 85-97.
109. Minor DL & Kim PS (1994) Measurement of the Beta-Sheet-Forming
Propensities of Amino-Acids. Nature 367, 660-663.
110. Lyu PC, Sherman JC, Chen A & Kallenbach NR (1991) Alpha-Helix
Stabilization by Natural and Unnatural Amino-Acids with Alkyl Side-Chains.
Proc Natl Acad Sci USA 88, 5317-5320.
111. Hornemann S, Schorn C & Wuthrich K (2004) NMR Structure of the Bovine
Prion Protein Isolated from Healthy Calf Brains. EMBO Rep. 5, 1159-1164.
112. Leclerc E, Peretz D, Ball H, Solforosi L, Legname G, et al. (2003)
Conformation of PrPC on the Cell Surface as Probed by Antibodies. J Mol
Biol 326, 475-483.
113. Mari L. DeMarco VD (2009) Characterization of Cell-Surface Prion Protein
Relative to Its Recombinant Analogue: Insights from Molecular Dynamics
Simulations of Diglycosylated, Membrane-Bound Human Prion Protein. J
Neurochem 9999.
114. Parchi P, Capellari S, Chen SG, Petersen RB, Gambetti P, et al. (1997)
Typing Prion Isoforms. Nature 386, 232-233.
115. Elfrink K, Ollesch J, Stöhr J, Willbold D, Riesner D, et al. (2008) Structural
Changes of Membrane-Anchored Native Prpc. Proc Natl Acad Sci USA 105,
10815-10819.
116. Levine M & Tarver H (1951) Studies on Ethionine III. Incorporation of
Ethionine into Rat Proteins. J Biol Chem 192, 835-850.
117. Linton S, Davies MJ & Dean RT (2001) Protein Oxidation and Ageing. Exp
Gerontol 36, 1503-1518.
118. Langedijk JPM, Fuentes G, Boshuizen R & Bonvin AMJJ (2006) Two-Rung
Model of a Left-Handed [Beta]-Helix for Prions Explains Species Barrier and
Strain Variation in Transmissible Spongiform Encephalopathies. J Mol Biol
360, 907-920.
References 100
119. Palmer MS, Dryden AJ, Hughes JT & Collinge J (1991) Homozygous Prion
Protein Genotype Predisposes to Sporadic Creutzfeldt-Jakob Disease.
Nature 352, 340-342.
120. Lewis PA, Tattum MH, Jones S, Bhelt D, Batchelor M, et al. (2006) Codon
129 Polymorphism of the Human Prion Protein Influences the Kinetics of
Amyloid Formation. J Gen Virol 87, 2443-2449.
121. Winklhofer KF, Heske J, Heller U, Reintjes A, Muranyi W, et al. (2003)
Determinants of the in Vivo Folding of the Prion Protein - a Bipartite Function
of Helix 1 in Folding and Aggregation. J Biol Chem 278, 14961-14970.
122. Hirschberger T, Stork M, Schropp B, Winklhofer KF, Tatzelt J & Tavan P
(2006) Structural Instability of the Prion Protein Upon M205S/R Mutations
Revealed by Molecular Dynamics Simulations. Biophys J 90, 3908–3918
123. Colombo G, Meli M, Morra G, Gabizon R & Gasset Ma (2009) Methionine
Sulfoxides on Prion Protein Helix-3 Switch on the α-Fold Destabilization
Required for Conversion. PLoS ONE 4, e4296.
124. Ross CA & Poirier MA (2005) What Is the Role of Protein Aggregation in
Neurodegeneration? Nat Rev Mol Cell Biol 6, 891-898.
125. Jansen K, Schafer O, Birkmann E, Post K, Serban H, et al. (2001) Structural
Intermediates in the Putative Pathway from the Cellular Prion Protein to the
Pathogenic Form. Biol Chem 382, 683-691.
126. Ronga L, Tizzano B, Palladino P, Ragone R, Urso E, et al. (2006) The Prion
Protein: Structural Features and Related Toxic Peptides. Chem Biol Drug
Des 68, 139-147.
127. Ronga L, Palladino P, Saviano G, Tancredi T, Benedetti E, et al. (2008)
Structural Characterization of a Neurotoxic Threonine-Rich Peptide
Corresponding to the Human Prion Protein Alpha2-Helical 180-195 Segment,
and Comparison with Full-Length Alpha2-Helix-Derived Peptides. J Pept Sci
14, 1096-1102.
Figures and Tables 101
11 Figure List
Fig. 1 The standard genetic code (RNA format). .......................................... 6
Fig. 2 Basic prerequisites for noncanonical amino acid incorporation ........ 12
Fig. 3 The four sulfur containing amino acids ............................................. 15
Fig. 4 Met metabolism ................................................................................ 17
Fig. 5 Met oxidation to Met(O) and Met(O2) ............................................... 18
Fig. 6 Oxidation-reduction cycle ................................................................. 19
Fig. 7 Three-dimensional structure of human PrPC(125-231) ..................... 24
Fig. 8 Structure of PrPC and speculative structure of PrPSc ........................ 25
Fig. 9 Measuring systems of a dual color FCS reader with a scanning unit
for SIFT measurements and sample plate ............................................... 41
Fig. 10 Flow chart of the labeling procedure ................................................ 43
Fig. 11 Flow chart of dilution steps for aggregation measurements ............. 46
Fig. 12 Amino acid sequence of PrP23-231 M129. ...................................... 48
Fig. 13 Coomassie stained SDS-PAGE gels of different purification steps .. 49
Fig. 14 Deconvoluted mass spectrum of Met-rhPrPC. .................................. 50
Fig. 15 Periodate dependent aggregation of Met-rhPrPC determined by
cross-correlation amplitude G(0) ............................................................. 51
Fig. 16 Schematic representation of basic instrumental setup of Orbitrap ESI-
MS/MS and ESI-MS ................................................................................ 54
Fig. 17 Oxidation level of the Met-rhPrPC peptides using 5 equiv. NaIO4 ..... 56
Fig. 18 Secondary structure and thermally induced unfolding profile of Met-
rhPrPC ..................................................................................................... 57
Fig. 19 Secondary structure and thermally induced unfolding profile of NaIO4
with 0.5 equiv. treated Met-rhPrPC .......................................................... 57
Figures and Tables 102
Fig. 20 Secondary structure and thermally induced unfolding profile of Met-
rhPrPC treated with 5 equiv NaIO4 ........................................................... 58
Fig. 21 Oxidation level of the Met-rhPrPC peptides using 25 equiv. (soluble
fraction) NaIO4. ........................................................................................ 59
Fig. 22 Secondary structure and thermally induced unfolding profile of Met-
rhPrPC treated with 25 equiv. NaIO4 ........................................................ 60
Fig. 23 Oxidation level of the Met-rhPrPC peptides using 25 equiv. (pellet
fraction) NaIO4. ........................................................................................ 61
Fig. 24 Graphical representation of the overall oxidation results in Met
containing peptides ................................................................................. 62
Fig. 25 Deconvoluted mass spectrum of protein sample containing apportion
of fully labeled Met(O)-rhPrPC ................................................................. 63
Fig. 26 Methionine (Met) and its isosteric analogs norleucine (Nle) and
methoxinine (Mox). .................................................................................. 64
Fig. 29 Coomassie stained SDS-PAGE gels of Met-rhPrPC and analogs .... 67
Fig. 30 CD spectra of Met-rhPrPC and its Nle- and Mox-variants at 37 °C and
0.2 mg/mL in 10 mM MES pH 6.0. .......................................................... 68
Fig. 31 Secondary structure changes as a function of temperature increase,
in Met-rhPrPC and related variants .......................................................... 70
Fig. 32 Thermal denaturation monitored by the changes of dichroic
intensities at 222 nm in function of temperature ...................................... 71
Fig. 33 In vitro aggregation of Met-rhPrPC compared to Nle-rhPrPC and Mox-
rhPrPC ..................................................................................................... 73
Fig. 34 Sequence and secondary structure of two variants, Nle (blue) and
Mox (red), of the 18 amino acid model peptide ....................................... 74
Fig. 35 Comparison of the Met oxidation level in the Met205/206 peptide,
using different NaIO4 equivalents ............................................................ 81
Figures and Tables 103
Fig. 36 Chemical model for prion protein conversion due to changes of the
conformational preferences of Met side chains ....................................... 83
Fig. 37 Mass spectra containing peptide M109 .......................................... 105
Fig. 38 Mass spectra containing peptide M112/M129/M134. ..................... 106
Fig. 39 Mass spectra containing peptide M112/M129/M134 ...................... 107
Fig. 40 Mass spectra containing peptide M154 .......................................... 108
Fig. 41 Mass spectrum containing peptide M166 ....................................... 109
Fig. 42 Mass spectrum containing peptide M205/206. ............................... 110
Fig. 43 Mass spectra containing peptide M213 .......................................... 111
Fig. 44 Mass spectra containing peptide M109 .......................................... 112
Fig. 45 Mass spectra containing peptide M112/M129/M134 ...................... 113
Fig. 46 Mass spectra containing peptide M154 and mass spectra containing
peptide M166 ......................................................................................... 114
Fig. 47 Mass spectra containing peptide M205/M206 and mass spectra
containing peptide M213 ....................................................................... 115
Fig. 48 Mass spectra containing peptide M109 .......................................... 116
Fig. 49 Mass spectra containing peptide M112/M129/M134 ...................... 117
Fig. 50 Mass spectra containing peptide M154 and mass spectra containing
peptide M166. ........................................................................................ 118
Fig. 51 Mass spectra containing peptide M205/206 and mass spectra
containing peptide M213 ....................................................................... 119
Figures and Tables 104
12 Table List
Table 1 N values before PK digest. ........................................................... 44
Table 2 N values after PK digest. .............................................................. 45
Table 3 Primary sequences of the generated Met-PrPC fragments by trypsin
digestion. ................................................................................................. 52
Table 4 Comparison of the two instrumental approaches (Orbitrap ESI-
MS/MS and ESI-MS) using Met oxidation in fragment 6 as example. ..... 53
Table 5 Calculated composition of the different secondary structures of the
two peptide analogues, Nle (blue) and Mox (red), of the Dado-Gellmann
model peptide. ......................................................................................... 75
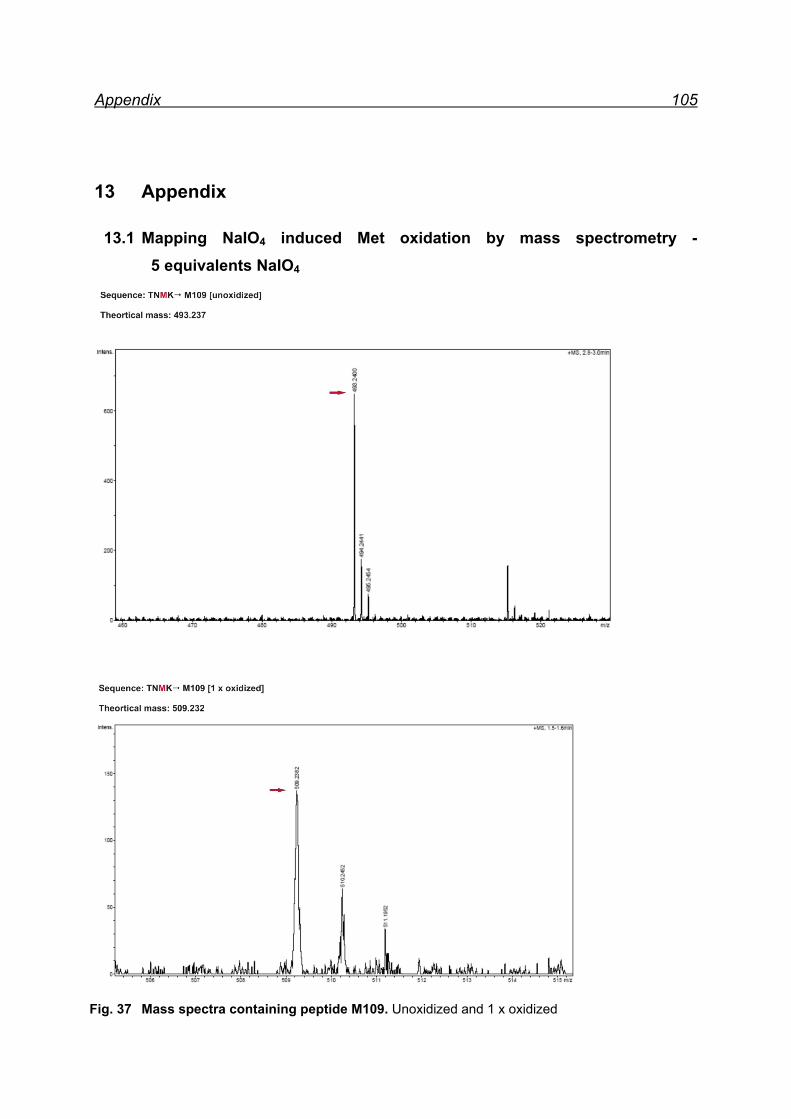
Appendix 105
13 Appendix
13.1 Mapping NaIO4 induced Met oxidation by mass spectrometry - 5 equivalents NaIO4
Fig. 37 Mass spectra containing peptide M109. Unoxidized and 1 x oxidized
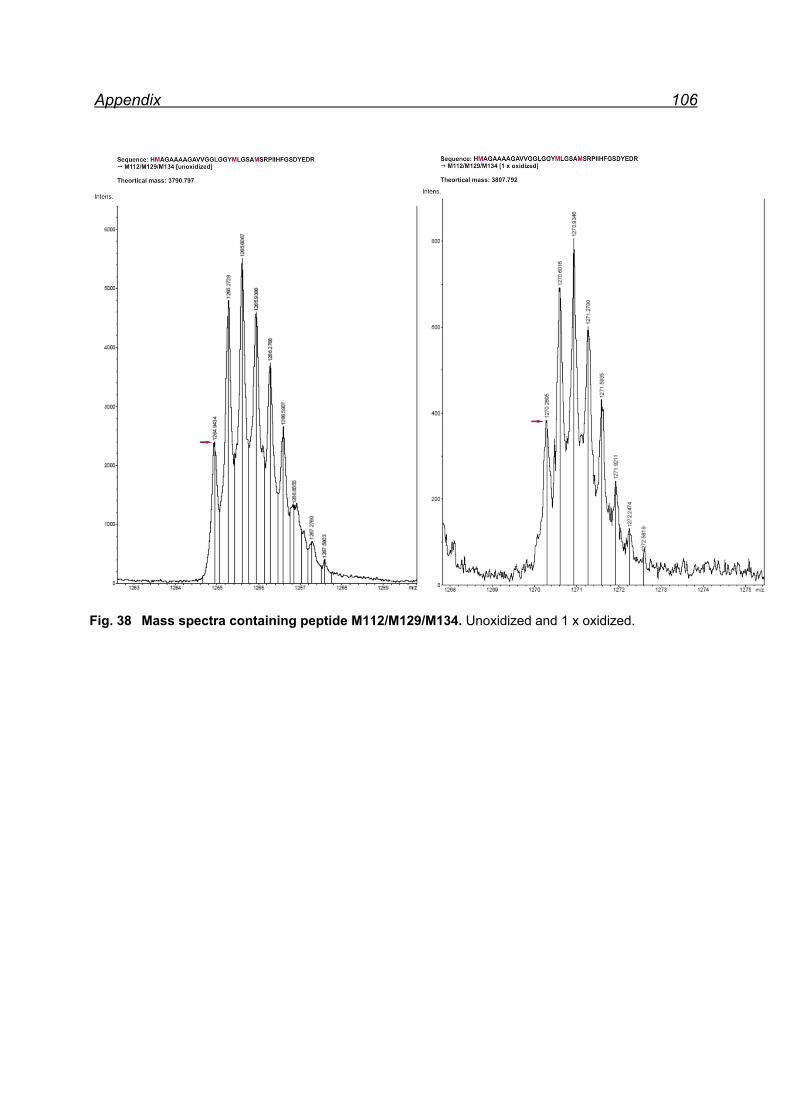
Appendix 106
Fig. 38 Mass spectra containing peptide M112/M129/M134. Unoxidized and 1 x oxidized.
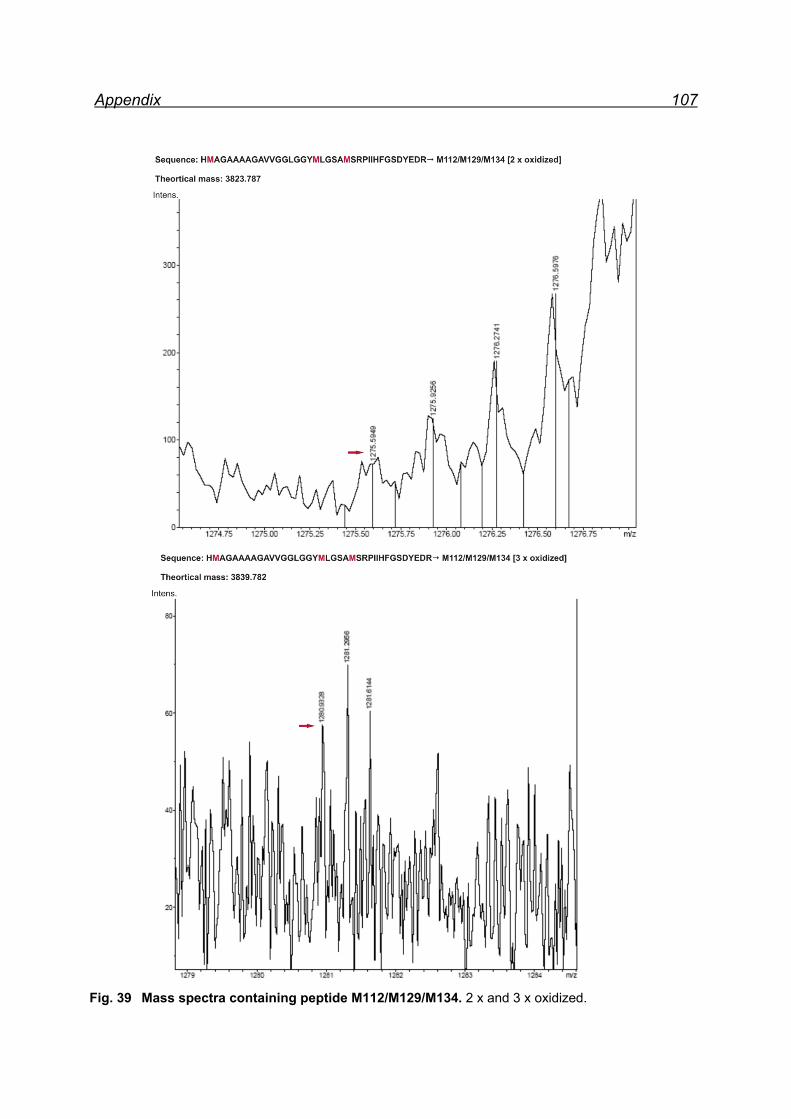
Appendix 107
Fig. 39 Mass spectra containing peptide M112/M129/M134. 2 x and 3 x oxidized.
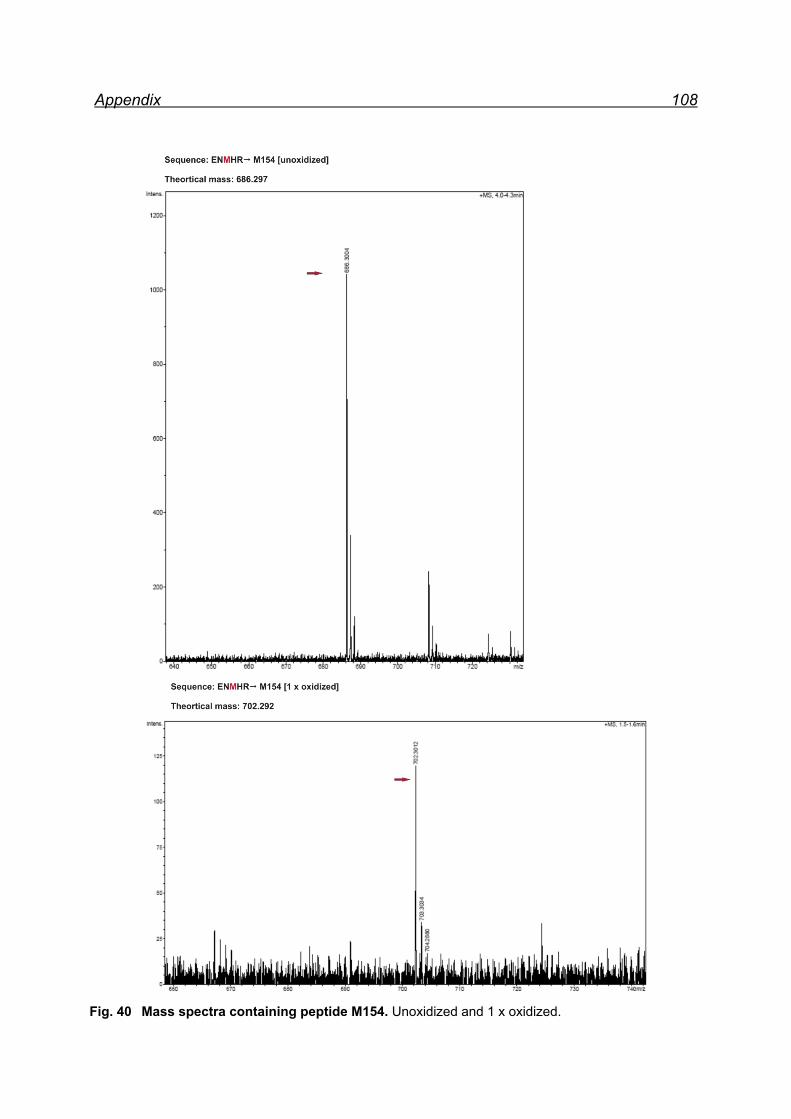
Appendix 108
Fig. 40 Mass spectra containing peptide M154. Unoxidized and 1 x oxidized.
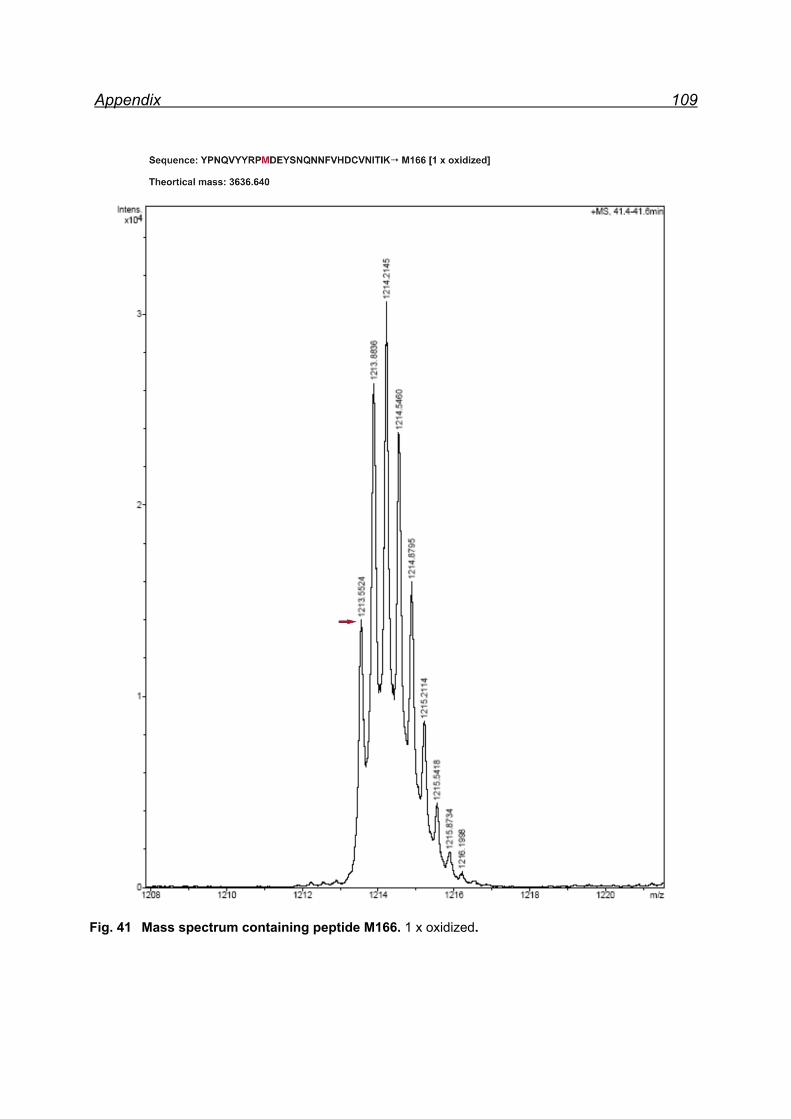
Appendix 109
Fig. 41 Mass spectrum containing peptide M166. 1 x oxidized.
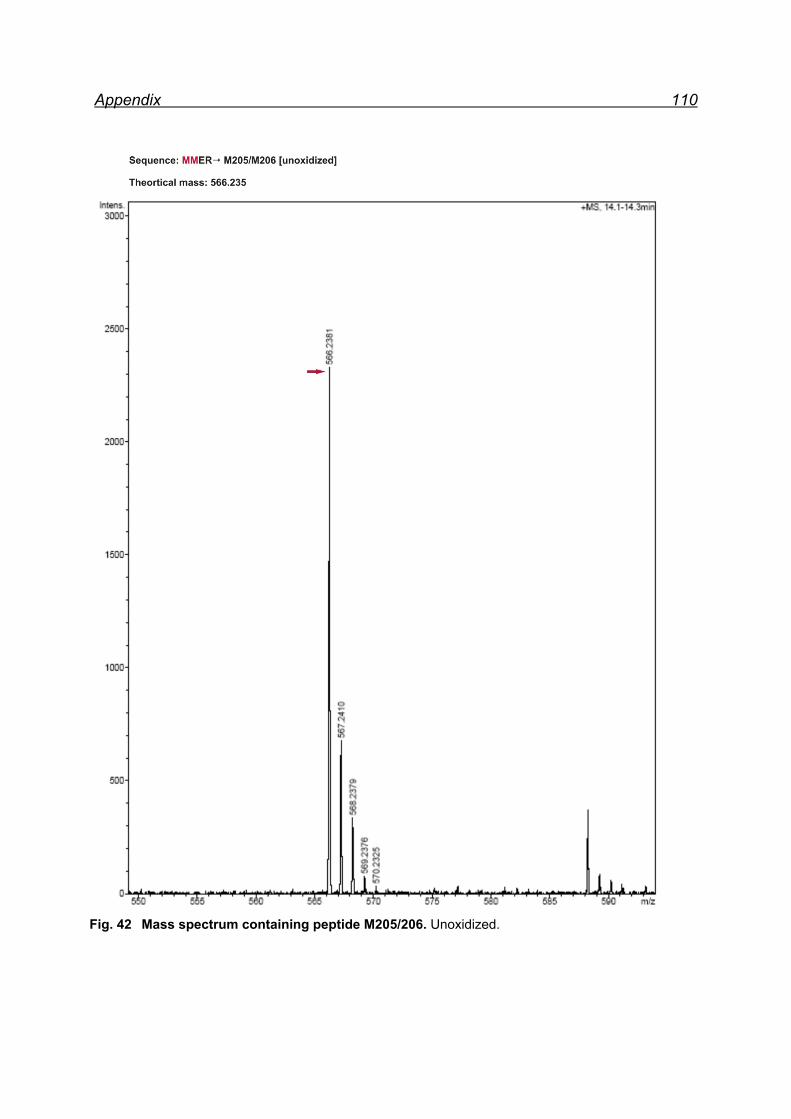
Appendix 110
Fig. 42 Mass spectrum containing peptide M205/206. Unoxidized.
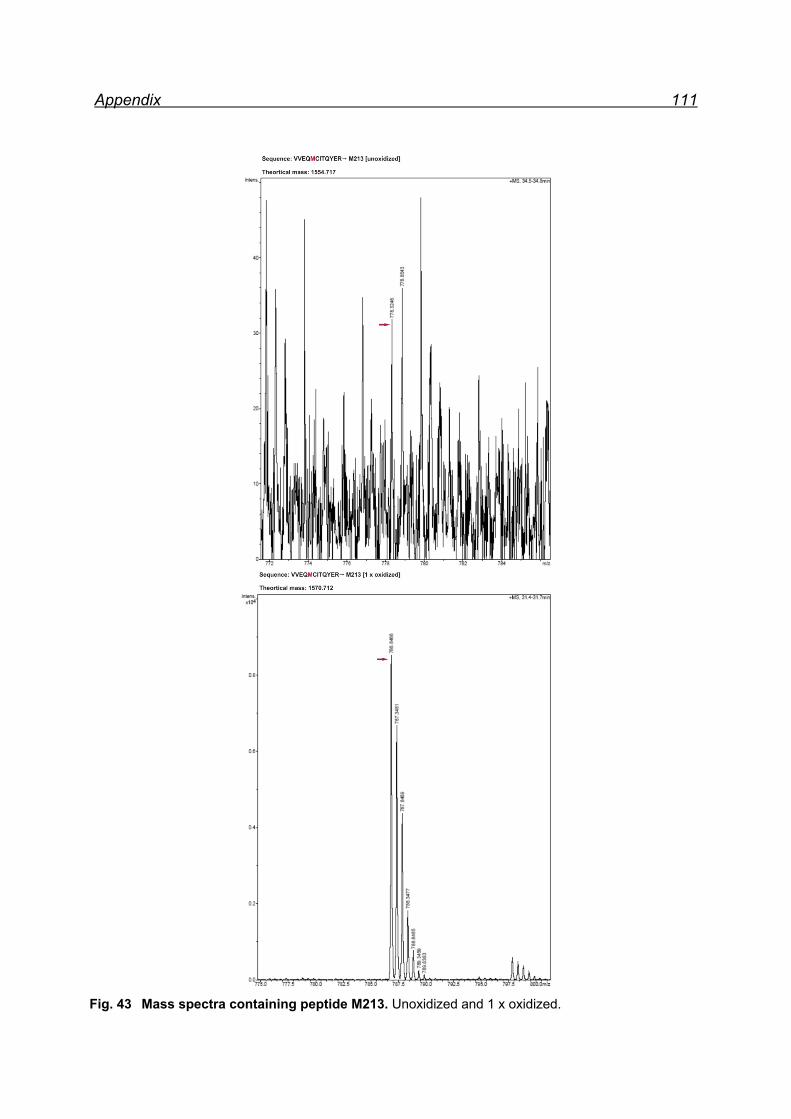
Appendix 111
Fig. 43 Mass spectra containing peptide M213. Unoxidized and 1 x oxidized.
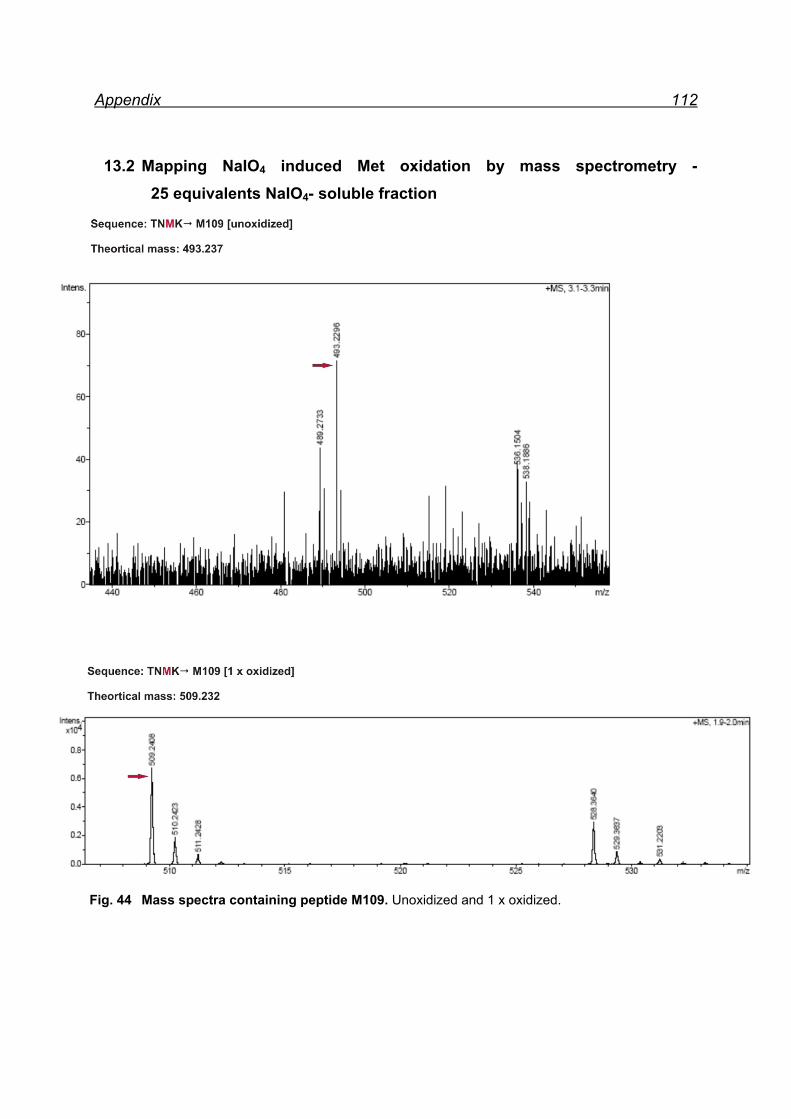
Appendix 112
13.2 Mapping NaIO4 induced Met oxidation by mass spectrometry - 25 equivalents NaIO4- soluble fraction
Fig. 44 Mass spectra containing peptide M109. Unoxidized and 1 x oxidized.
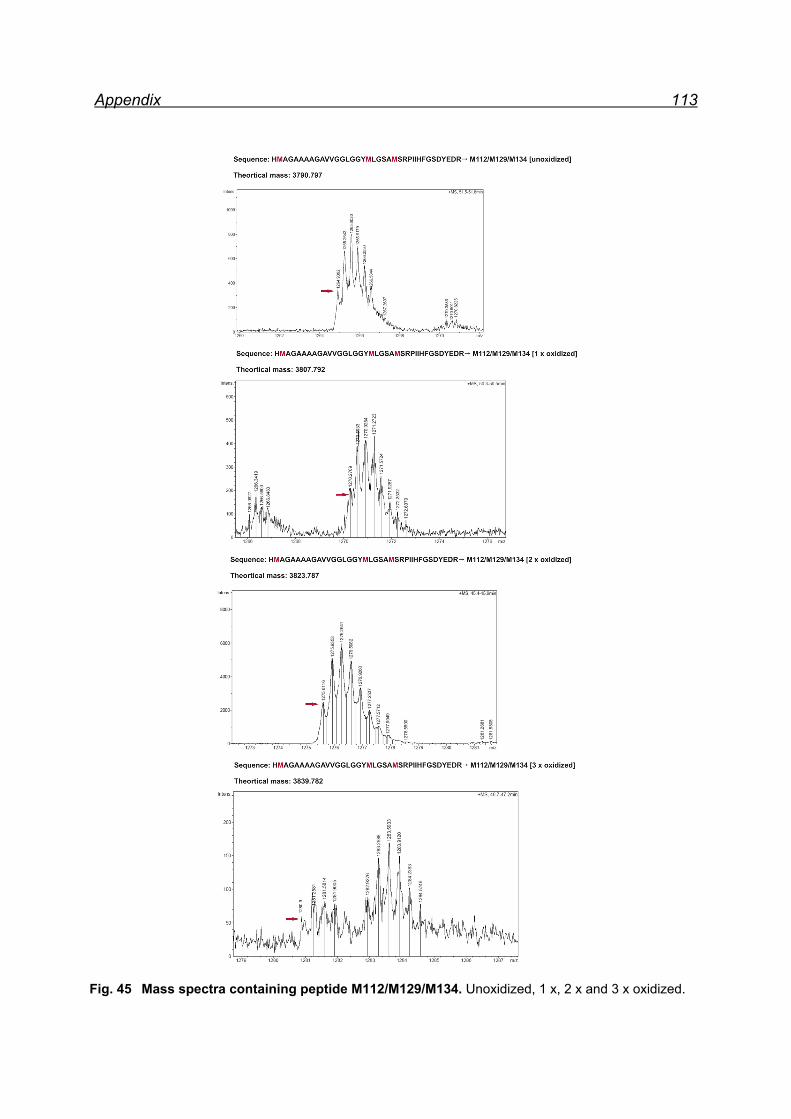
Appendix 113
Fig. 45 Mass spectra containing peptide M112/M129/M134. Unoxidized, 1 x, 2 x and 3 x oxidized.
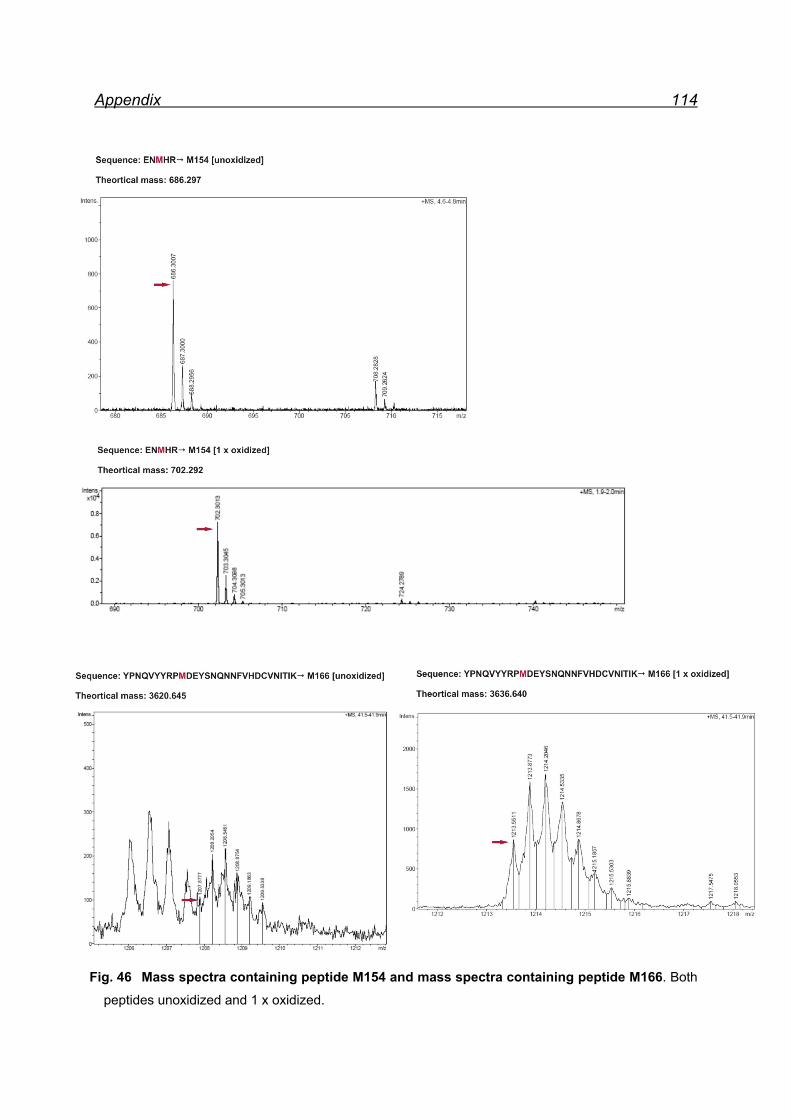
Appendix 114
Fig. 46 Mass spectra containing peptide M154 and mass spectra containing peptide M166. Both
peptides unoxidized and 1 x oxidized.
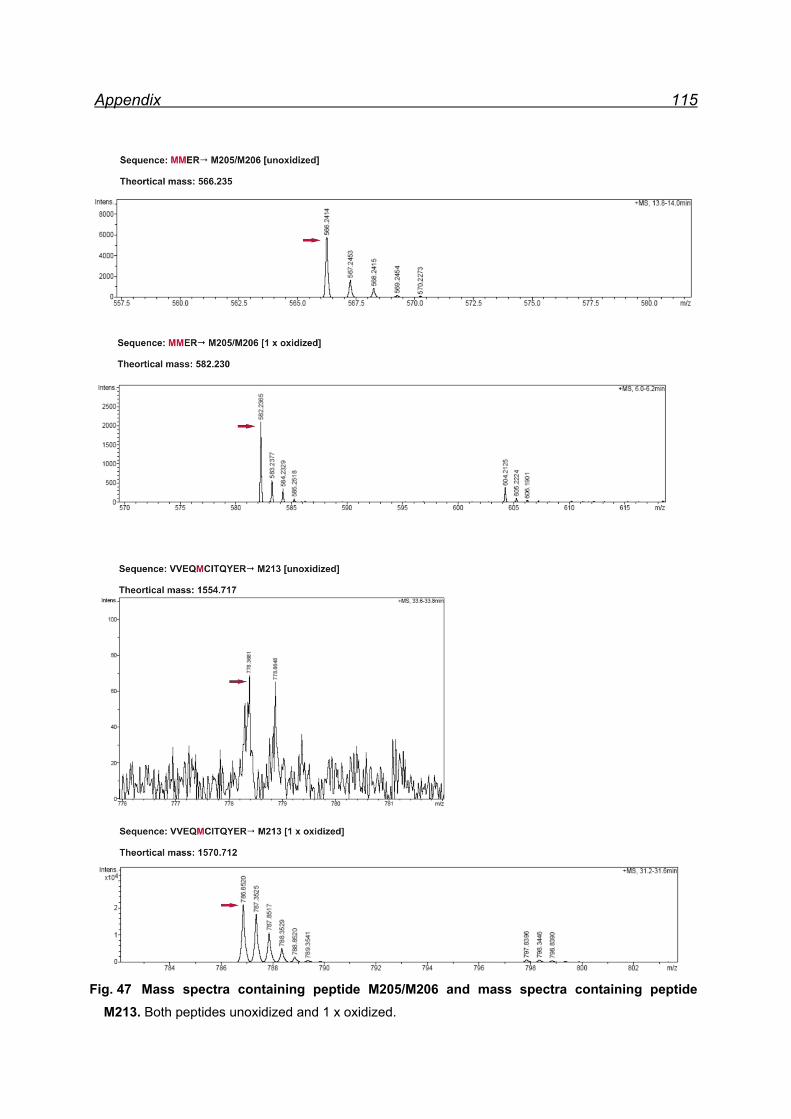
Appendix 115
Fig. 47 Mass spectra containing peptide M205/M206 and mass spectra containing peptide
M213. Both peptides unoxidized and 1 x oxidized.
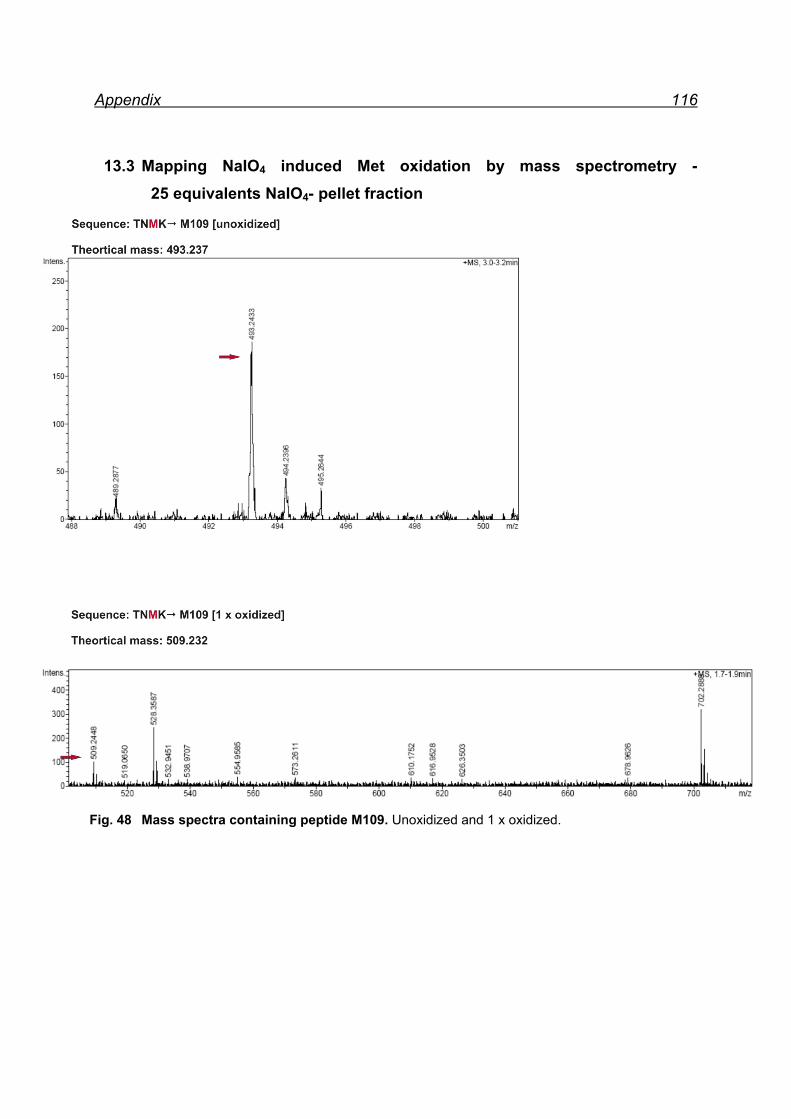
Appendix 116
13.3 Mapping NaIO4 induced Met oxidation by mass spectrometry - 25 equivalents NaIO4- pellet fraction
Fig. 48 Mass spectra containing peptide M109. Unoxidized and 1 x oxidized.
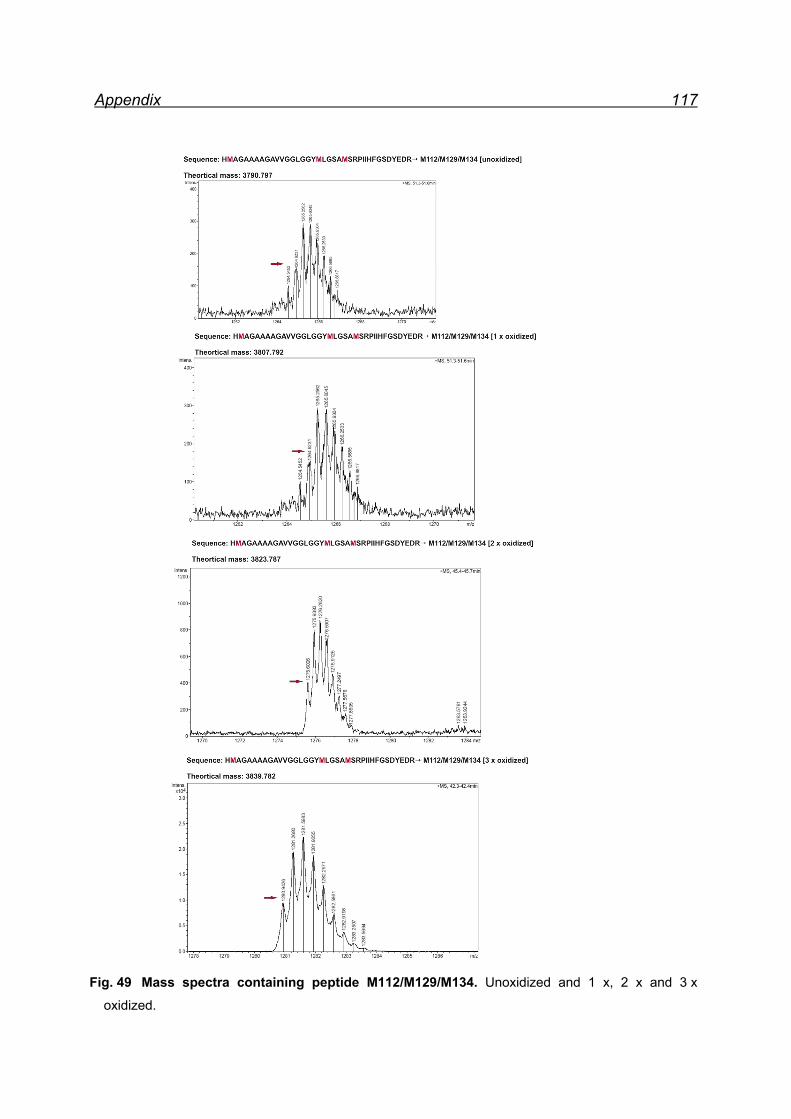
Appendix 117
Fig. 49 Mass spectra containing peptide M112/M129/M134. Unoxidized and 1 x, 2 x and 3 x
oxidized.
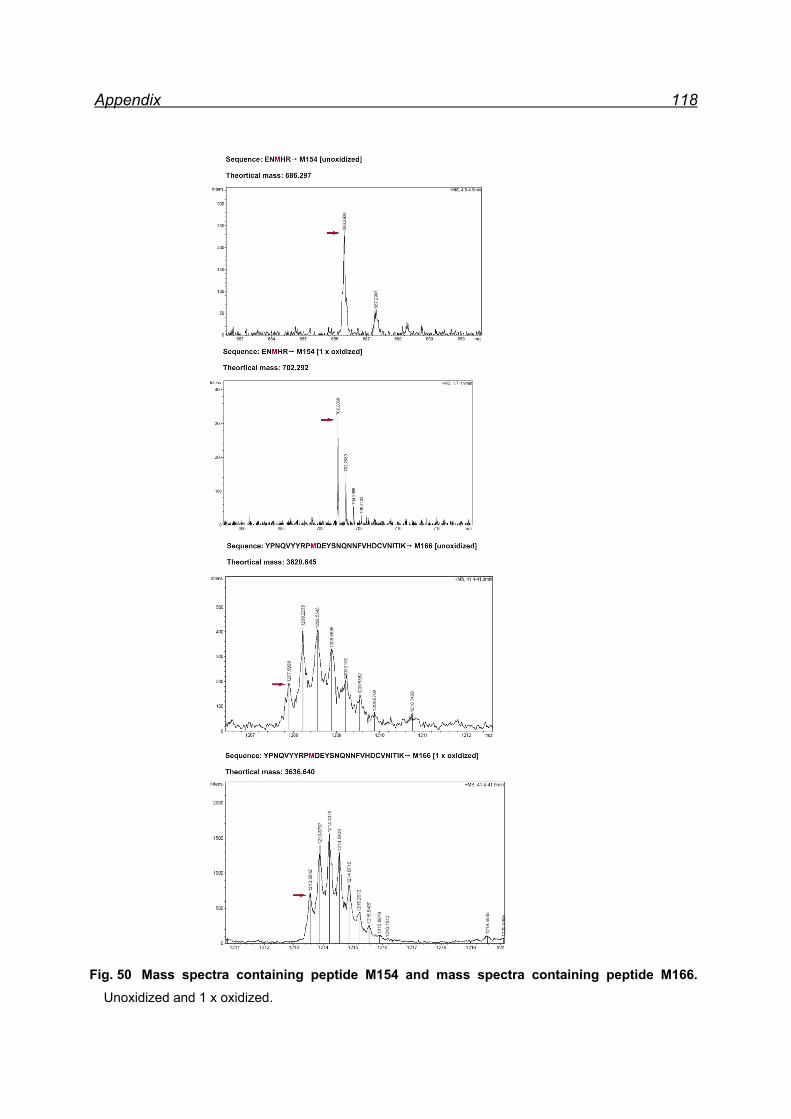
Appendix 118
Fig. 50 Mass spectra containing peptide M154 and mass spectra containing peptide M166. Unoxidized and 1 x oxidized.
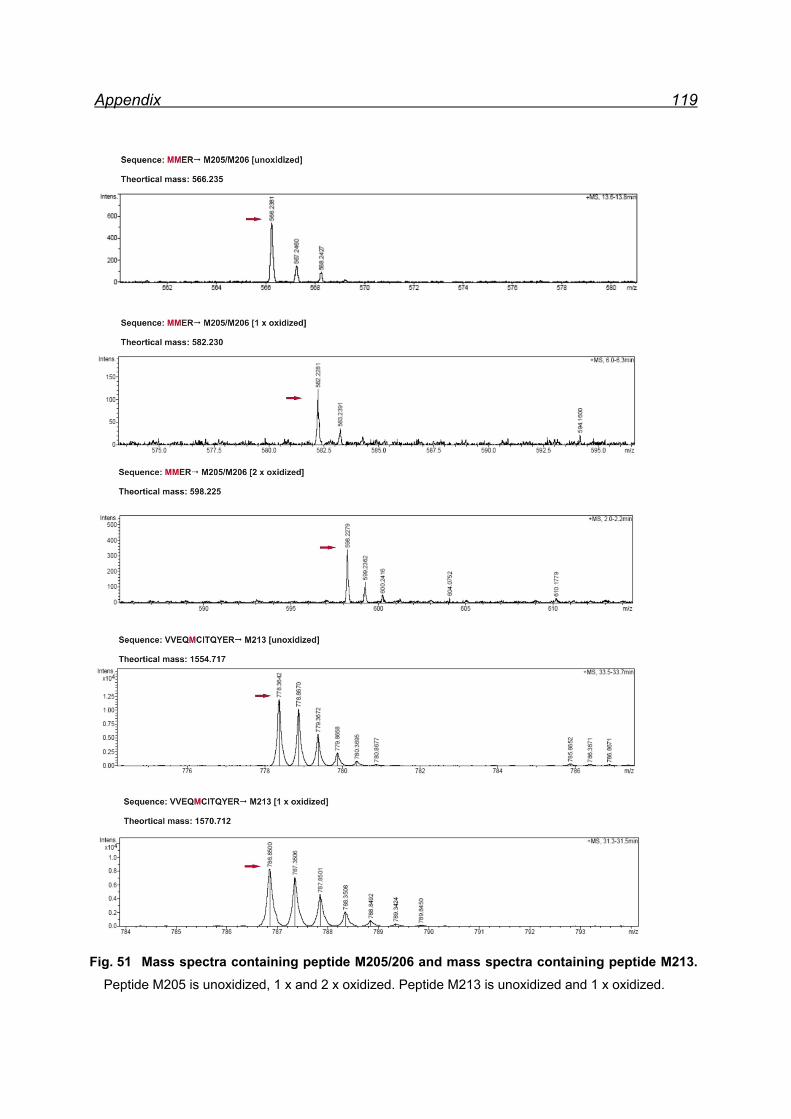
Appendix 119
Fig. 51 Mass spectra containing peptide M205/206 and mass spectra containing peptide M213. Peptide M205 is unoxidized, 1 x and 2 x oxidized. Peptide M213 is unoxidized and 1 x oxidized.


![Katalytische Oxidation 2 - b-t-u.com · Thermische Oxidation Konzen - tration : [mg/m 3] Schadstoffe: Volumen - strom: [m 3/h] Wirkung grad: Verfahren: Variante: 2. Abgasreinigungsverfahren](https://img.pdfslide.org/doc/110x75/5ec5938fe891380f13012833/katalytische-oxidation-2-b-t-ucom-thermische-oxidation-konzen-tration-mgm.jpg)