Embed Size (px)
Citation preview
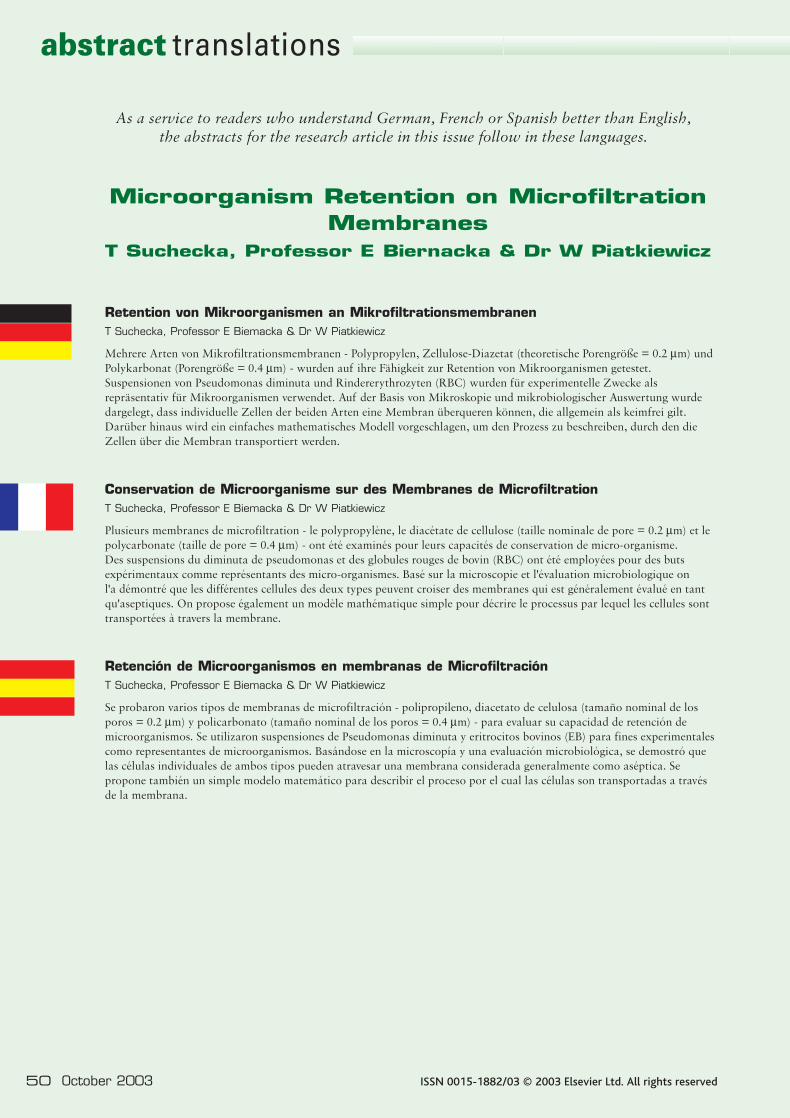
Retention von Mikroorganismen an MikrofiltrationsmembranenT Suchecka, Professor E Biemacka & Dr W Piatkiewicz
Mehrere Arten von Mikrofiltrationsmembranen - Polypropylen, Zellulose-Diazetat (theoretische Porengröße = 0.2 µm) undPolykarbonat (Porengröße = 0.4 µm) - wurden auf ihre Fähigkeit zur Retention von Mikroorganismen getestet.Suspensionen von Pseudomonas diminuta und Rindererythrozyten (RBC) wurden für experimentelle Zwecke alsrepräsentativ für Mikroorganismen verwendet. Auf der Basis von Mikroskopie und mikrobiologischer Auswertung wurdedargelegt, dass individuelle Zellen der beiden Arten eine Membran überqueren können, die allgemein als keimfrei gilt.Darüber hinaus wird ein einfaches mathematisches Modell vorgeschlagen, um den Prozess zu beschreiben, durch den dieZellen über die Membran transportiert werden.
Conservation de Microorganisme sur des Membranes de Microfiltration T Suchecka, Professor E Biemacka & Dr W Piatkiewicz
Plusieurs membranes de microfiltration - le polypropylène, le diacétate de cellulose (taille nominale de pore = 0.2 µm) et lepolycarbonate (taille de pore = 0.4 µm) - ont été examinés pour leurs capacités de conservation de micro-organisme. Des suspensions du diminuta de pseudomonas et des globules rouges de bovin (RBC) ont été employées pour des butsexpérimentaux comme représentants des micro-organismes. Basé sur la microscopie et l'évaluation microbiologique on l'a démontré que les différentes cellules des deux types peuvent croiser des membranes qui est généralement évalué en tantqu'aseptiques. On propose également un modèle mathématique simple pour décrire le processus par lequel les cellules sonttransportées à travers la membrane.
Retención de Microorganismos en membranas de MicrofiltraciónT Suchecka, Professor E Biemacka & Dr W Piatkiewicz
Se probaron varios tipos de membranas de microfiltración - polipropileno, diacetato de celulosa (tamaño nominal de losporos = 0.2 µm) y policarbonato (tamaño nominal de los poros = 0.4 µm) - para evaluar su capacidad de retención demicroorganismos. Se utilizaron suspensiones de Pseudomonas diminuta y eritrocitos bovinos (EB) para fines experimentalescomo representantes de microorganismos. Basándose en la microscopía y una evaluación microbiológica, se demostró quelas células individuales de ambos tipos pueden atravesar una membrana considerada generalmente como aséptica. Sepropone también un simple modelo matemático para describir el proceso por el cual las células son transportadas a travésde la membrana.
Microorganism Retention on MicrofiltrationMembranes
T Suchecka, Professor E Biernacka & Dr W Piatkiewicz
50 October 2003 ISSN 0015-1882/03 © 2003 Elsevier Ltd. All rights reserved
abstract translations
As a service to readers who understand German, French or Spanish better than English,the abstracts for the research article in this issue follow in these languages.
fise0903pg50.qxd 30/09/2003 16:03 Page 50
researcharticle
ISSN 0015-1882/03 © 2003 Elsevier Ltd. All rights reserved October 2003 51
M icrofiltration (MF) membranes are widely used formicroorganism removal [1, 2, 3, 4]. It is alsocommonly accepted that the log reduction parameter
is the right way to characterize a membrane’s ability to preventbacteria passage. There are a few problems related to suchapproach, including log reduction parameter only indicates theratio in log scale of bacteria suspended in the inflow comparedto that measured in the filtrate.
In many cases it is more important to be sure that nobacteria or microbial cells are present in the filtrate at all. It isespecially true for protozoa oocysts, as they are highlydangerous to man. Specifically speaking, Cryptosporidiumparvum is a good example of such a problem. Moreover,membranes manufactured based on phase inversion arestructured in such way that the pore size variation is significant.Traditionally, membranes are usually rated in respect to themean pore size. It means that a membrane rated 0.2 microns,which is considered a reliable microbial barrier, might havesome pores up to 0.8 microns. Taking into consideration thatthe microbe cells also display some variation in size, potential
leakage of microbes is possible. Moreover considering celldeformability we must recognize that cells under the fluidforces might change their shape and penetrate to the other sideof the membrane. The penetration process may take place evenif the nominal size of cell under no stress condition is largerthan the available pore size.
MATERIALS & METHODS
Experiments were conducted in order to investigate how themembrane pore size affects the cell passage to the other side of amembrane barrier. Suspensions of Pseudomonas diminuta andbovine Red Blood Cells [RBC] in PBS [phosphorous buffersolution], with the addition of heparin, were used. Pseudomonasdiminuta were chosen as a typical, widely accepted, bacterialtest. RBC were chosen as model cells for the Cryptosporidiumparvum oocyst becasue they are representative of animal cells,plus the methods of detecting, controlling and microscopicevaluation are well established.
Experimental Set-up
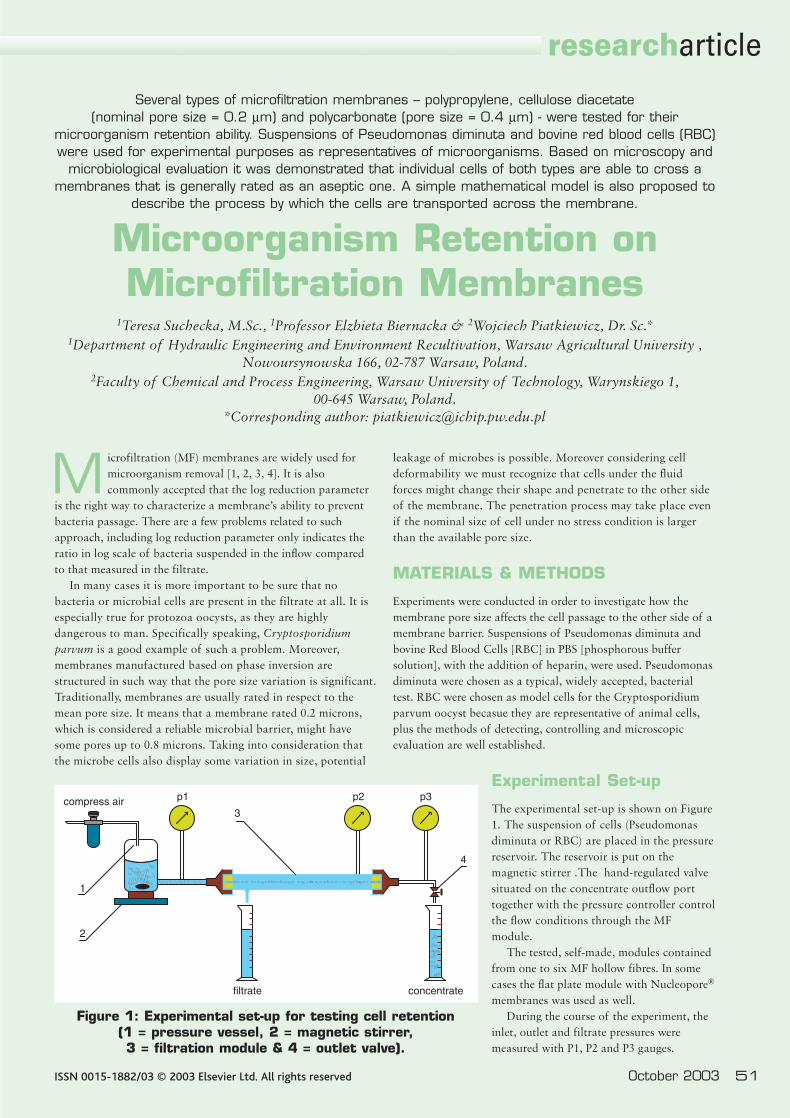
The experimental set-up is shown on Figure1. The suspension of cells (Pseudomonasdiminuta or RBC) are placed in the pressurereservoir. The reservoir is put on themagnetic stirrer .The hand-regulated valvesituated on the concentrate outflow porttogether with the pressure controller controlthe flow conditions through the MFmodule.
The tested, self-made, modules containedfrom one to six MF hollow fibres. In somecases the flat plate module with Nucleopore®
membranes was used as well.During the course of the experiment, the
inlet, outlet and filtrate pressures weremeasured with P1, P2 and P3 gauges.
Several types of microfiltration membranes – polypropylene, cellulose diacetate (nominal pore size = 0.2 µm) and polycarbonate (pore size = 0.4 µm) - were tested for their
microorganism retention ability. Suspensions of Pseudomonas diminuta and bovine red blood cells (RBC)were used for experimental purposes as representatives of microorganisms. Based on microscopy and
microbiological evaluation it was demonstrated that individual cells of both types are able to cross amembranes that is generally rated as an aseptic one. A simple mathematical model is also proposed to
describe the process by which the cells are transported across the membrane.
Microorganism Retention onMicrofiltration Membranes
1Teresa Suchecka, M.Sc., 1Professor Elzbieta Biernacka & 2Wojciech Piatkiewicz, Dr. Sc.*1Department of Hydraulic Engineering and Environment Recultivation, Warsaw Agricultural University ,
Nowoursynowska 166, 02-787 Warsaw, Poland.2Faculty of Chemical and Process Engineering, Warsaw University of Technology, Warynskiego 1,
00-645 Warsaw, Poland. *Corresponding author: [email protected]
compress air
filtrate concentrate
p1
3
4
2
1
p2 p3
Figure 1: Experimental set-up for testing cell retention (1 = pressure vessel, 2 = magnetic stirrer, 3 = filtration module & 4 = outlet valve).
fise0903pg51-55.qxd 30/09/2003 16:06 Page 51
researcharticle
Measuring cylinders were used to determine the filtrate andconcentrate flows.
Prior to making the modules, selected hollow fibres weretested according to ASTM, and designated F316-86 to determinethe maximum and average pore size. Having calibrated themembranes, small modules were prepared and tested accordingto the scheme presented in Figure 1.
Pseudomonas Diminuta Test
A water suspension of Pseudomonas diminuta cells is placed inthe pressure reservoir. The reservoir is located on a magneticstirrer. The hand-regulated valve, situated on the concentrateoutflow port, together with the pressure controller control theflow conditions through the MF module.
Initially, modules containing hydrophobic membranes(samples 1–24 in Table 1) were wetted with isopropanol andwashed with deionized (DI) water. This step was omitted for themodules containing hydrophilic membranes (samples 25 & 26 inTable 1). Prior to beginning the experiment, the whole system(Figure 1) was sterilized with Dialina® and washed with 4 l ofultra-pure water. After that, the bacteria suspension was locatedin the pressure vessel and the pressure valve providingcompressed air to the pressure vessel, as well as the outlet valve,was set to achieve the desired transmembrane pressure andconcentrate flow rate.
The experiment was conducted until the collected filtratevolume indicated that the membrane surface area wascontaminated with a minimum of 108 cells per cm2. The collectedfiltrate was forced through the analytical filter (0.2 µm), whichafterwards was placed on soybean casein digest agar andincubated for seven days, according to standard procedure. Finallythe filter disc was inspected for the presence of bacterial coloniesidentified as Pseudomonas diminuta.
Red Blood Cell Test
A 10% suspension of RBC in PBS solution, with the addition ofheparin, was used for the cell retention tests. Under air pressurethe suspension was forced away from the pressure vessel to thefilter. During the course of the experiment, the filtrate andconcentrate were collected in measuring cylinders, according tothe evaluation scheme presented in Figure 1. For eachexperiment, transmembrane pressure, as well as filtration rateand concentrate flow, were controlled. Two types of membraneswere used: 0.4 microns Nucleopore (track etching type) andcellulose diacetate (sponge type) membranes removed from anASAHI plasma separation module commonly used for plasmaexchange therapy. Once the volume of RBC suspension in thepressure vessel was near to the end, the PBS solution was rapidlyinjected (through the special connector located in betweenpressure vessel and the filter - not indicated in Figure 1) underthe same shearing condition as the RBC suspension in order towashout the RBC from the filter. Next, modules were washedwith 1% glutaraldehyde solution rapidly injected under the samecondition as PBS to fix the RBC onto the membrane surface.After treatment the modules were opened and the membraneswere send for microscopic evaluation.
52 October 2003 www.filtsep.com
Sample no. Average pore Maximum Source ofsize [µm] pore size [µm] membrane
1 0.15 0.49 IBiB2 0.18 0.51 IBiB3 0,18 0.54 IBiB4 0.19 0.54 IBiB5 0.20 0.58 Accurel6 0.20 0.57 Accurel7 0.19 0.50 Accurel8 0,19 0.50 Accurel9 0.20 0.50 Accurel10 0.19 0.52 Accurel11 0.20 0.56 Accurel12 0.18 0.52 Accurel13 0.21 0.56 Accurel14 0.20 0.56 Accurel15 0.20 0.56 Accurel16 0.21 0.59 Accurel17 0.21 0.53 Accurel18 0.20 0.63 Accurel19 0.21 0.63 Accurel20 0.20 0.63 Accurel21 0.22 0.78 IBiB22 0.22 0.77 IBiB23 0.22 0.68 IBiB24 0.21 0.70 IBiB25 0.3 0.75 Asahi Medical26 0.35 0.75 Asahi Medical
Table 1: Average and maximum pore size of testedmembranes
Sample no. Maximum pore No. of cells at No. of cells in Log reduction Rejection [%]size [µm] inlet filtrate
1 0.50 7.8 x 10¹³ 0 >13.9 1002 0.50 7.8 x 10¹³ 0 >13.9 1003 0.52 4.8 x 10¹¹ 0 >11.7 1004 0.52 3.9 x 10¹¹ 0 >11.6 1005 0.54 2.7 x 10⁹ 0 >9.4 1006 0.54 2.7 x 10¹³ 0 >13.4 1007 0.56 5.2 x 10¹¹ 0 >11.7 1008 0.59 3.7 x 10¹¹ 0 >11.6 1009 0.63 6.8 x 10¹¹ 0 >11.8 10010 0.68 6.9 x 10¹³ >330 <11.3 8211 0.70 5.0 x 10¹¹ >350 <9.15 7812 0.75 3.4 x10¹¹ >700 - 63
Table 2: Results of bacteria rejection due to the maximum pore size in cross flow filtration through the membranes listed in Table 1
fise0903pg51-55.qxd 01/10/2003 11:56 Page 52
researcharticle
Filtration+Separation October 2003 53
RESULTSObtained results of pore size determination are presented inTable 1. The rejection of Pseudomonas diminuta cells on MFmembranes, with different maximum pore size is summarized inTable 2. Selected data of RBC separation on different MFmembranes are presented in Figures 2, 3, 4 and 5.
DISCUSSION & CONCLUSIONS
It is evident from the obtained results that particular cells areable to cross a membrane barrier, even if the pore sizes aresignificantly smaller than the cell size.
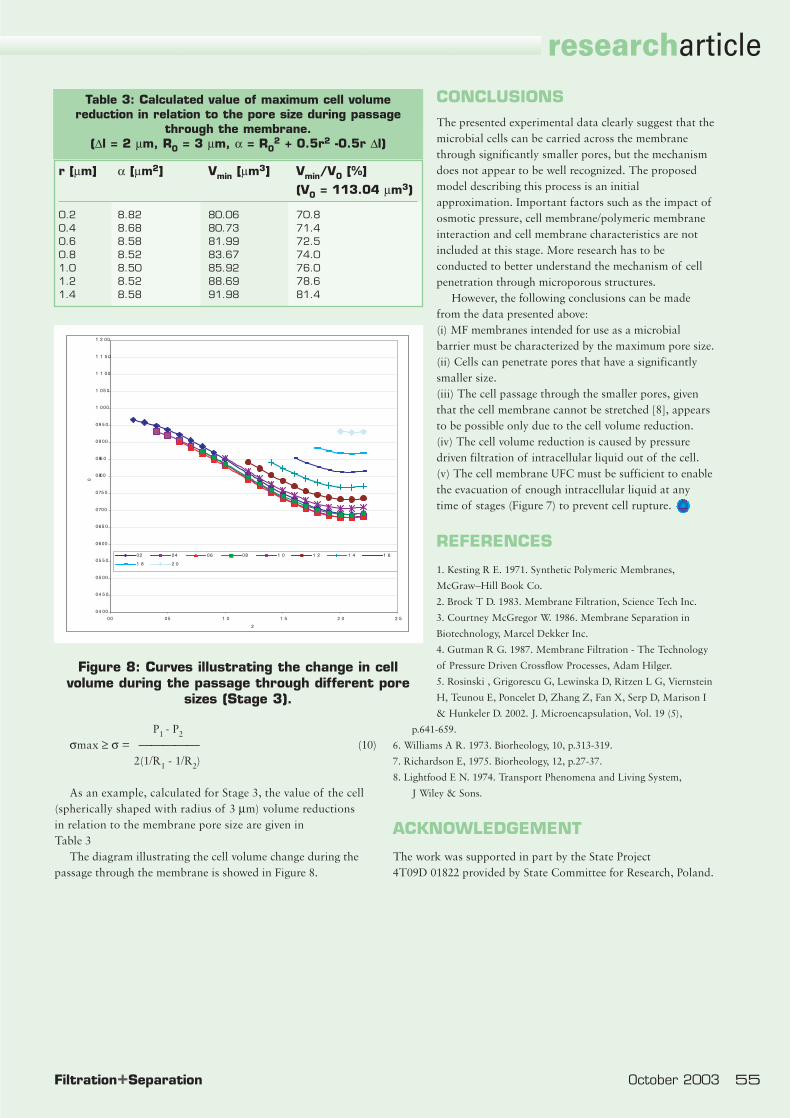
Such passage requires significant cell deformation. Forsimplicity we assume that the cells are ball shaped and thatexternal forces cause them to transfrom to the cylindrical form.The second assumption we make is that the external surface ofboth forms, as well as the volume, remain invariable (Figure 6).
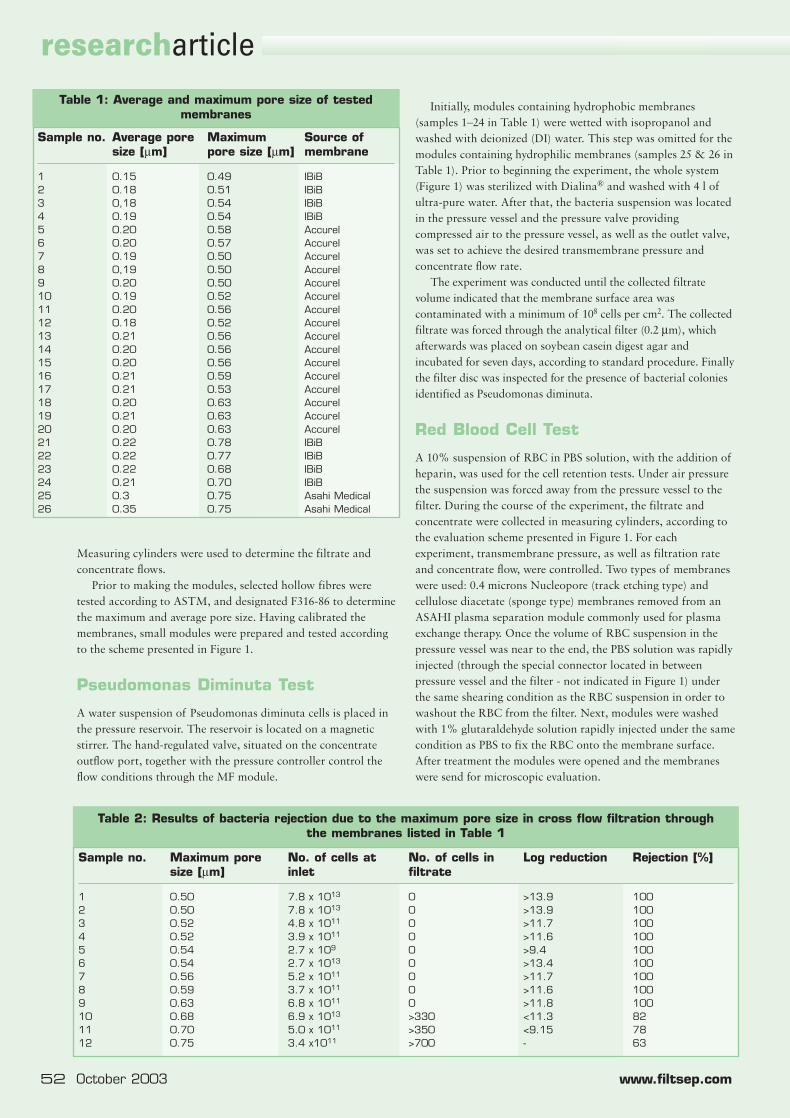
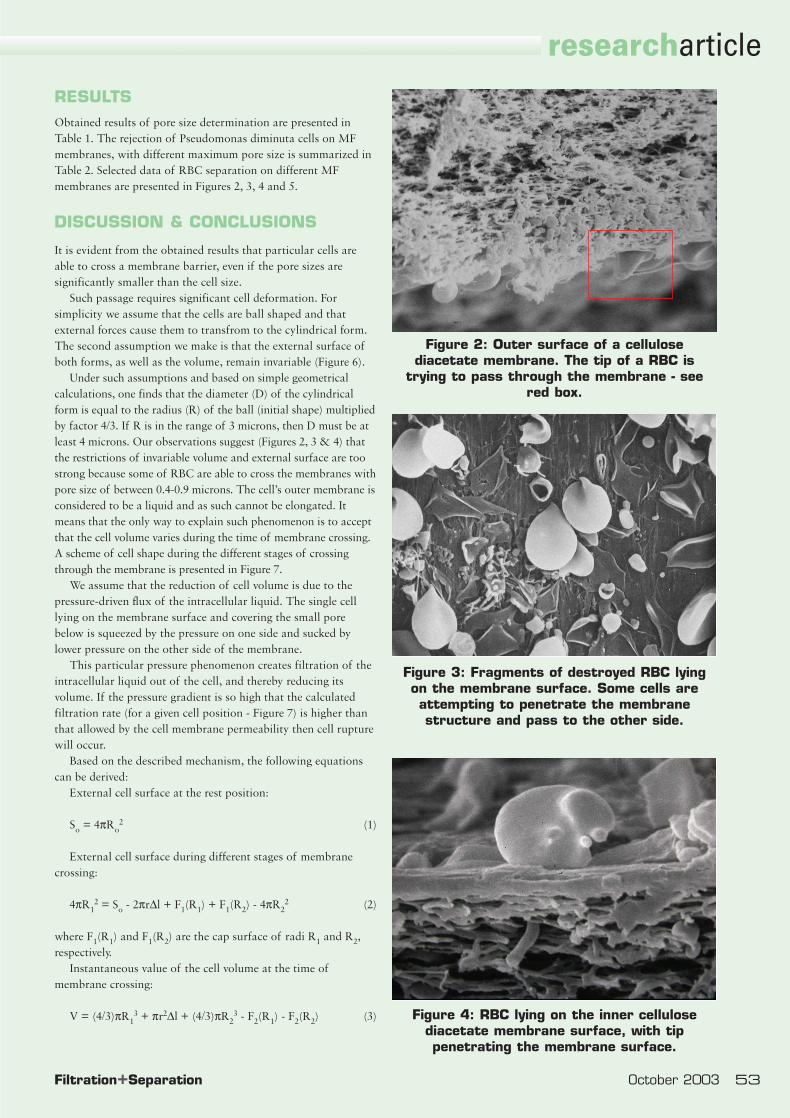
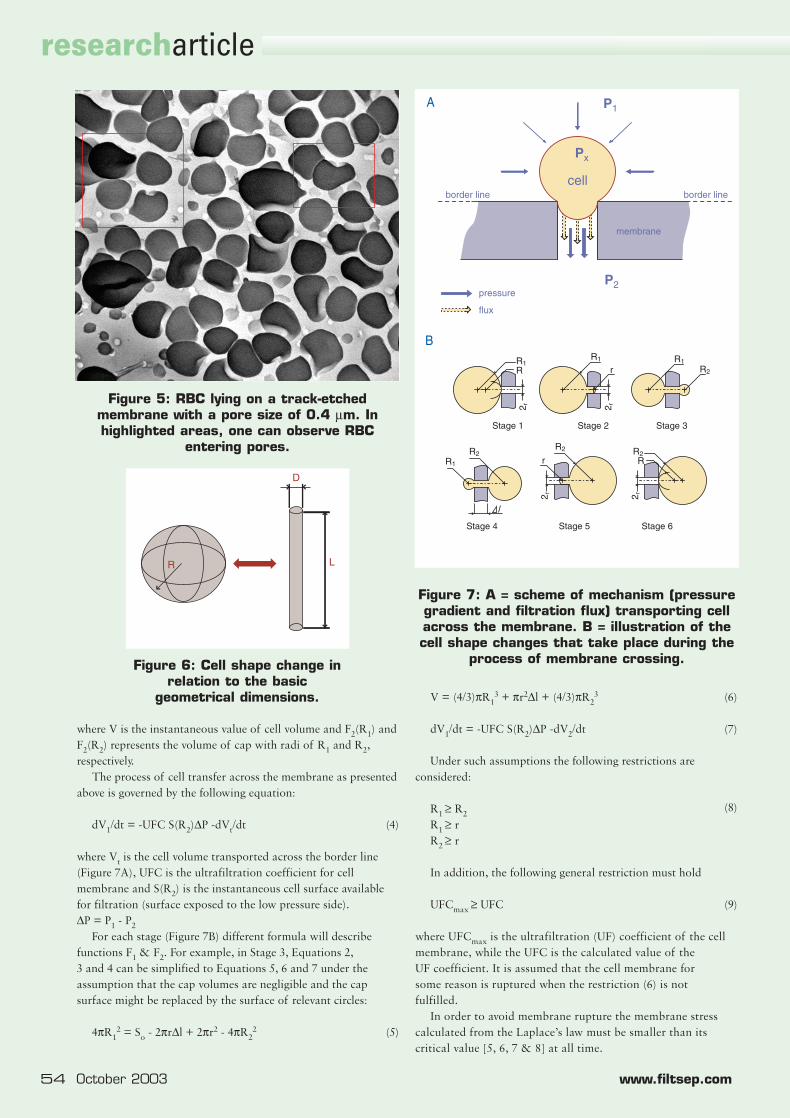
Under such assumptions and based on simple geometricalcalculations, one finds that the diameter (D) of the cylindricalform is equal to the radius (R) of the ball (initial shape) multipliedby factor 4/3. If R is in the range of 3 microns, then D must be atleast 4 microns. Our observations suggest (Figures 2, 3 & 4) thatthe restrictions of invariable volume and external surface are toostrong because some of RBC are able to cross the membranes withpore size of between 0.4-0.9 microns. The cell’s outer membrane isconsidered to be a liquid and as such cannot be elongated. Itmeans that the only way to explain such phenomenon is to acceptthat the cell volume varies during the time of membrane crossing.A scheme of cell shape during the different stages of crossingthrough the membrane is presented in Figure 7.
We assume that the reduction of cell volume is due to thepressure-driven flux of the intracellular liquid. The single celllying on the membrane surface and covering the small porebelow is squeezed by the pressure on one side and sucked bylower pressure on the other side of the membrane.
This particular pressure phenomenon creates filtration of theintracellular liquid out of the cell, and thereby reducing itsvolume. If the pressure gradient is so high that the calculatedfiltration rate (for a given cell position - Figure 7) is higher thanthat allowed by the cell membrane permeability then cell rupturewill occur.
Based on the described mechanism, the following equationscan be derived:
External cell surface at the rest position:
So = 4πRo2 (1)
External cell surface during different stages of membranecrossing:
4πR12 = So - 2πr∆l + F1(R1) + F1(R2) - 4πR2
2 (2)
where F1(R1) and F1(R2) are the cap surface of radi R1 and R2,respectively.
Instantaneous value of the cell volume at the time ofmembrane crossing:
V = (4/3)πR13 + πr2∆l + (4/3)πR2
3 - F2(R1) - F2(R2) (3)
Figure 2: Outer surface of a cellulosediacetate membrane. The tip of a RBC is
trying to pass through the membrane - seered box.
Figure 3: Fragments of destroyed RBC lyingon the membrane surface. Some cells areattempting to penetrate the membranestructure and pass to the other side.
Figure 4: RBC lying on the inner cellulosediacetate membrane surface, with tippenetrating the membrane surface.
fise0903pg51-55.qxd 30/09/2003 16:09 Page 53
where V is the instantaneous value of cell volume and F2(R1) andF2(R2) represents the volume of cap with radi of R1 and R2,respectively.
The process of cell transfer across the membrane as presentedabove is governed by the following equation:
dV1/dt = -UFC S(R2)∆P -dVt/dt (4)
where Vt is the cell volume transported across the border line(Figure 7A), UFC is the ultrafiltration coefficient for cellmembrane and S(R2) is the instantaneous cell surface availablefor filtration (surface exposed to the low pressure side). ∆P = P1 - P2
For each stage (Figure 7B) different formula will describefunctions F1 & F2. For example, in Stage 3, Equations 2, 3 and 4 can be simplified to Equations 5, 6 and 7 under theassumption that the cap volumes are negligible and the capsurface might be replaced by the surface of relevant circles:
4πR12 = So - 2πr∆l + 2πr2 - 4πR2
2 (5)
V = (4/3)πR13 + πr2∆l + (4/3)πR2
3 (6)
dV1/dt = -UFC S(R2)∆P -dV2/dt (7)
Under such assumptions the following restrictions are considered:
R1 ≥ R2R1 ≥ r
(8)
R2 ≥ r
In addition, the following general restriction must hold
UFCmax ≥ UFC (9)
where UFCmax is the ultrafiltration (UF) coefficient of the cellmembrane, while the UFC is the calculated value of the UF coefficient. It is assumed that the cell membrane for some reason is ruptured when the restriction (6) is not fulfilled.
In order to avoid membrane rupture the membrane stresscalculated from the Laplace’s law must be smaller than itscritical value [5, 6, 7 & 8] at all time.
54 October 2003 www.filtsep.com
researcharticle
Px
P2
P1
cellborder lineborder line
pressure
flux
membrane
Figure 7: A = scheme of mechanism (pressuregradient and filtration flux) transporting cellacross the membrane. B = illustration of thecell shape changes that take place during the
process of membrane crossing.
Figure 5: RBC lying on a track-etchedmembrane with a pore size of 0.4 µm. Inhighlighted areas, one can observe RBC
entering pores.
R1R1
R1
R1R2
R2R2 R2
r
r
2 r
2 r 2 r
2 r
R
R
Stage 1 Stage 2 Stage 3
Stage 4 Stage 5 Stage 6
D
LR
Figure 6: Cell shape change inrelation to the basic
geometrical dimensions.
A
B
fise0903pg51-55.qxd 03/10/2003 09:36 Page 54
researcharticle
Filtration+Separation October 2003 55
P1 - P2σmax ≥ σ = (10)
2(1/R1 - 1/R2)
As an example, calculated for Stage 3, the value of the cell(spherically shaped with radius of 3 µm) volume reductions in relation to the membrane pore size are given in Table 3
The diagram illustrating the cell volume change during thepassage through the membrane is showed in Figure 8.
CONCLUSIONSThe presented experimental data clearly suggest that themicrobial cells can be carried across the membranethrough significantly smaller pores, but the mechanismdoes not appear to be well recognized. The proposedmodel describing this process is an initialapproximation. Important factors such as the impact ofosmotic pressure, cell membrane/polymeric membraneinteraction and cell membrane characteristics are notincluded at this stage. More research has to beconducted to better understand the mechanism of cellpenetration through microporous structures.
However, the following conclusions can be madefrom the data presented above:(i) MF membranes intended for use as a microbialbarrier must be characterized by the maximum pore size. (ii) Cells can penetrate pores that have a significantlysmaller size.(iii) The cell passage through the smaller pores, giventhat the cell membrane cannot be stretched [8], appearsto be possible only due to the cell volume reduction.(iv) The cell volume reduction is caused by pressuredriven filtration of intracellular liquid out of the cell.(v) The cell membrane UFC must be sufficient to enablethe evacuation of enough intracellular liquid at anytime of stages (Figure 7) to prevent cell rupture.
REFERENCES
1. Kesting R E. 1971. Synthetic Polymeric Membranes,
McGraw–Hill Book Co.
2. Brock T D. 1983. Membrane Filtration, Science Tech Inc.
3. Courtney McGregor W. 1986. Membrane Separation in
Biotechnology, Marcel Dekker Inc.
4. Gutman R G. 1987. Membrane Filtration - The Technology
of Pressure Driven Crossflow Processes, Adam Hilger.
5. Rosinski , Grigorescu G, Lewinska D, Ritzen L G, Viernstein
H, Teunou E, Poncelet D, Zhang Z, Fan X, Serp D, Marison I
& Hunkeler D. 2002. J. Microencapsulation, Vol. 19 (5),
p.641-659.
6. Williams A R. 1973. Biorheology, 10, p.313-319.
7. Richardson E, 1975. Biorheology, 12, p.27-37.
8. Lightfood E N. 1974. Transport Phenomena and Living System,
J Wiley & Sons.
ACKNOWLEDGEMENT
The work was supported in part by the State Project 4T09D 01822 provided by State Committee for Research, Poland.
0 4 00
0 4 5 0
0 5 00
0 5 5 0
0 600
0 65 0
0 700
0 75 0
0 800
0 85 0
0 9 00
0 9 5 0
1 000
1 05 0
1 1 00
1 1 5 0
1 2 00
0 0 0 5 1 0 1 5 2 0 2 5
2
0
0 2 0 4 0 6 0 8 1 0 1 2 1 4 1 6
1 8 2 0
Figure 8: Curves illustrating the change in cellvolume during the passage through different pore
sizes (Stage 3).
r [µm] α [µm2] Vmin [µm3] Vmin/V0 [%]
(V0 = 113.04 µm3)
0.2 8.82 80.06 70.80.4 8.68 80.73 71.40.6 8.58 81.99 72.50.8 8.52 83.67 74.01.0 8.50 85.92 76.01.2 8.52 88.69 78.61.4 8.58 91.98 81.4
Table 3: Calculated value of maximum cell volumereduction in relation to the pore size during passage
through the membrane.(∆l = 2 µm, R0 = 3 µm, α = R0
2 + 0.5r2 -0.5r ∆l)
fise0903pg51-55.qxd 01/10/2003 11:56 Page 55