Embed Size (px)
Citation preview
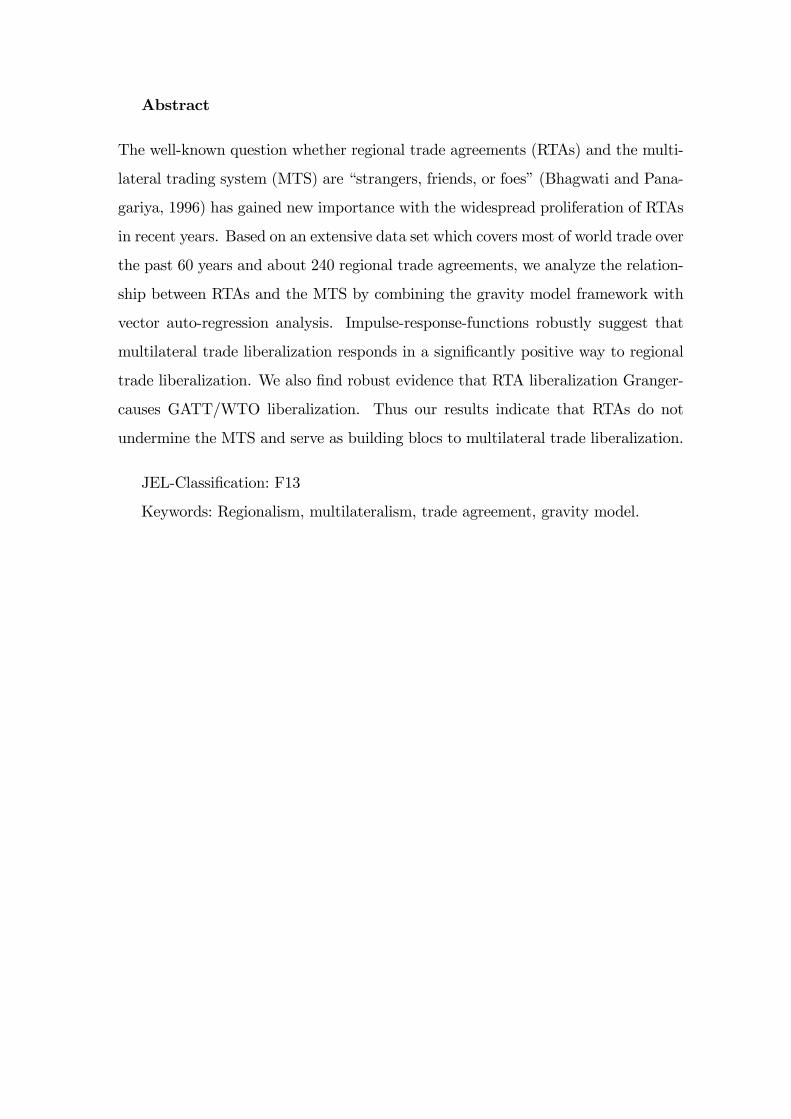
Universität Bayreuth
Rechts- und Wirtschaftswissenschaftliche Fakultät
Wirtschaftswissenschaftliche Diskussionspapiere
Multilateralism versus Regionalism!?
Bernhard Herz und Marco Wagner
Diskussionspapier 01-10
Januar 2010
ISSN 1611-3837
Adresse:
Prof. Dr. Bernhard Herz
Universität Bayreuth
Lehrstuhl VWL I (Geld und Internationale Wirtschaft)
95440 Bayreuth
Telefon: +49 (0) 921/55-2912
Fax: +49 (0) 921/55-2949
E-Mail: [email protected]
Abstract
The well-known question whether regional trade agreements (RTAs) and the multi-
lateral trading system (MTS) are �strangers, friends, or foes�(Bhagwati and Pana-
gariya, 1996) has gained new importance with the widespread proliferation of RTAs
in recent years. Based on an extensive data set which covers most of world trade over
the past 60 years and about 240 regional trade agreements, we analyze the relation-
ship between RTAs and the MTS by combining the gravity model framework with
vector auto-regression analysis. Impulse-response-functions robustly suggest that
multilateral trade liberalization responds in a signi�cantly positive way to regional
trade liberalization. We also �nd robust evidence that RTA liberalization Granger-
causes GATT/WTO liberalization. Thus our results indicate that RTAs do not
undermine the MTS and serve as building blocs to multilateral trade liberalization.
JEL-Classi�cation: F13
Keywords: Regionalism, multilateralism, trade agreement, gravity model.
1 Motivation
While the number of regional trade agreements (RTAs) grew only slowly until the
beginning of the 1990s, it has remarkably increased since then. In December 2008,
230 RTAs were noti�ed to the World Trade Organization (WTO) and the WTO
(2009c) expects close to 400 RTAs by 2010. At �rst sight, RTAs con�ict with the
most-favored nations clause (GATT Article I, GATS Article II) which prohibits
discriminatory behavior among WTO members. However, WTO members are per-
mitted to establish or enter regional arrangements under speci�c conditions which
are de�ned in GATT Article XXIV, the decision on �Di¤erential and more favorable
treatment reciprocity and fuller participation of developing countries�(the so-called
Enabling Clause), and GATS Article V (WTO, 2009c).
How does this wide proliferation of regionalism relate to global trade liberaliza-
tion? Following Bhagwati (1991) RTAs could be either stumbling or building blocs
to global trade liberalization, i. e. RTAs could contribute to further multilateral lib-
eralization by complementing GATT/WTO or they could impede multilateral trade
liberalization.
Baldwin (2004) summarizes the logic and fears which are associated with RTAs
as stumbling blocs to global trade liberalization and identi�es two key risks of region-
alism. Firstly, regional liberalization might be a substitute for multilateral liberal-
ization since it i) dampens nations�intentness for further multilateral liberalization
and ii) diverts policy makers�attention away from WTO negotiations (e. g. Bhag-
wati, 1992, and Krueger, 1995). Secondly, regionalism might alter the division of
power so that i) small nations are even more dominated by hegemonic powers and
ii) the possibility of tensions (and even trade wars) between trade blocs increases
(Panagariya, 1999). According to Baldwin (2004), these fears are mainly based on
the historical experience during the interwar period.
Summers (1991) rejects this pessimistic view and points out that after World
War II regionalism contributed to tari¤ liberalization and that there is no clear
evidence that regionalism has undermined multilateralism. Creamer (2003) and
Trejos (2005) emphasize that RTAs are not inherently protectionist, but instead
1
can even help reduce political tensions between countries.1 Additionally, RTAs
can stimulate both internal and international political dynamics by providing an
experimental ground for new liberalization ideas.2 Moreover, RTAs can improve the
stability and credibility of countries which should have positive e¤ects on multilateral
negotiations (Paiva and Gazel, 2003).
In contrast to the extensive theoretical literature, empirical research has so far
been rather limited. Limao (2006, 2007) studies the impact of US RTAs on the
evolution of the US external multilateral tari¤s before and after the Uruguay round
negotiations.3 In his regression analysis Limao (2006, 2007) �nds that, on similar
products, the US liberalized external multilateral tari¤s towards non-RTA partners
much more than towards regional trading partners. The rationale of this policy could
be that the US o¤ers preferences to receive concessions from the recipients. Since
the concessions are all the more valuable the larger the preference margin is, the
US tries to prevent the erosion of preferences by resisting multilateral liberalization.
Thus, he concludes that RTAs act as a stumbling bloc to US multilateral trade
liberalization.
Karacaovali and Limao (2008) study how RTAs4 a¤ect the EU�s external multi-
lateral tari¤s basically using the same methodology and time period as Limao (2006,
2007). They �nd that the EU cut its external multilateral tari¤s on imports from
regional trading partners merely by half as much as the external multilateral tari¤s
on products imported from non-members. Karacaovali and Limao (2008) conclude
that EU�s regional arrangements appear to be stumbling blocs to multilateral trade
liberalization.
Estevadeordal et al. (2008) focus on the impact of the Southern Common Mar-
ket (MERCOSUR) and the Andean Community (CAN) on the multilateral tari¤
setting behavior of ten Latin-American countries based on data on preferential an1Bergsten (1997) presents the example of France and Germany which are both members of the
European Union (EU).2See Trejos (2005), Pomfret (2006), Bergsten (1997), and Folsom (2008).3While Limao (2006) incorporates North American Free Trade Agreement (NAFTA), Andean
Trade Preference Act (ATPA), Caribbean Basin Initiative (CBI), Generalized System of Prefer-ences (GSP) and US-Israel in his analysis, Limao (2007) focuses only on CBI and ATPA.
4In particular, the Generalized System of Preferences (GSP), GSP for least developed countries(GSPL), African Caribbean & Paci�c states (ACP), Mediterranean countries (MED), Central &East European states (CEC), European Free Trade Association (EFTX).
2
MFN tari¤s over the period 1990-2001.5 In particular, they regress the change in
external multilateral tari¤s on several control variables, including membership in
MERCOSUR and the Andean Community. Their results indicate that RTAs act as
building blocs for multilateral trade liberalization in Latin America.
Magee and Lee (2001) examine how the formation of the European Economic
Community (EEC) a¤ected external tari¤s of its members. Using the ratio of EEC�s
external tari¤s in 1983 to external tari¤s in 1968 on the imports from 51 industries,
Magee and Lee (2001) �nd that the claim of a �Fortress Europe� is unfounded as
the common external tari¤s of the EEC continuously declined.
Foroutan (1998) carries out a descriptive analysis on the external trading behav-
ior of 50 developing countries over the period 1965-1995. Using trade �ows, import
tari¤s and trade liberalization indicators, she examines whether there is a systematic
relationship between developing countries�membership in a RTA and the external
liberalization of their trade. Her results reject such a systematic relationship.
Taken together, the empirical literature �as well as the theoretical literature �is
inconclusive as RTAs are sometimes found to be stumbling blocs and in some cases
to be building blocs for multilateral trade liberalization.
From a methodological point of view, these approaches are limited in several
ways. The studies investigate selected countries and regions only, thereby ignoring
the interactions with other RTAs these countries or their trading partners are mem-
bers of. The studies cover rather limited time periods which are generally too short
to account for the political dynamics between regionalism and multilateralism sum-
marized by Baldwin (2004) and emphasized by Bhagwati (1992) as well as Summers
(1991). The time periods are also too short to adequately account for the so-called
�rst wave of regionalism in the 1950s and more importantly the new developments
in regionalism since the 1990s and the 2000s (second and third wave of regionalism).
The studies focus only on the external tari¤ setting behavior of countries engaged in
regional arrangements thereby neglecting other dimensions of trade liberalization,
such as non-tari¤ barriers. Foroutan (1998) points out that other indicators, such
5In particular, Argentina, Brazil, Chile, Colombia, Ecuador, Mexico, Peru, Paraguay, Uruguay,and Venezuela.
3
as actual trade �ows and trade liberalization indicators, are also important.
This study adds to the literature in several ways. We examine a sample of 184
countries with 240 RTAs so that we can control for interactions between various re-
gional arrangements and a country�s membership in more than one RTA. Our data
set covers the period from 1953-2006 which is long enough to adequately account for
the political dynamics between regionalism and multilateralism, and to include the
beginnings of regional arrangements during the 1950s as well as more recent devel-
opments. Based on the building bloc/stumbling bloc discussion, we investigate the
relationship between multilateral and regional trade liberalization. The literature
so far has associated trade liberalization with the countries�external tari¤ setting
behavior. We follow Foroutan (1998) and measure trade liberalization by the actual
impact of regional and multilateral trade liberalization on trade �ows so that we can
account for the whole range of trade liberalizing measures.
To investigate the dynamic e¤ects of RTAs and especially the possibly causal
interrelation between regional and multilateral trade liberalization, we combine a
gravity model framework with vector auto-regressive (VAR) analysis. Using impulse-
response-functions, our study shows that trade liberalization on the multilateral
level responds signi�cantly positive to regional trade liberalization. Additionally, we
�nd that RTA liberalization Granger-causes multilateral liberalization. By contrast,
there is no robust evidence for such an e¤ect in the opposite direction. Thus, the
results suggest that regional trade liberalization does not undermine but rather
contributes to multilateral trade liberalization.
2 General Research Strategy
The �rst wave of regionalism in the 1950s and 1960s was accompanied by a vivid
discussion on the e¤ects of RTAs on trade. More speci�cally, the discussion was
driven by static analysis, i. e. the evaluation of trade creation and trade diversion
(Viner, 1950). With the second wave of regionalism, Summers (1991) and Bhagwati
(1991) initiated an important debate on the interrelation between regional trade
arrangements and the multilateral trading system that focused on the political dy-
4
namic dimension of the issue.6 Bhagwati (1991, p. 77) discussed the dichotomy of
RTAs as stumbling blocs or building blocs for the multilateral trade liberalization.
Bhagwati and Panagariya (1996) further re�ned this question and ask whether RTAs
and the multilateral trading system (MTS) are �strangers, friends, or foes�, adding
the possibility that RTAs and the MTS develop independently from each other.
In our analysis, we proceed in three steps. First, we estimate the time-speci�c
impact of both GATT/WTO and RTAs on international trade for each year us-
ing an extensive gravity model and �xed e¤ects Poisson maximum likelihood (FE-
PML) estimation to derive two time-series that measure the impact of multilateral
and regional liberalization on trade. Secondly, based on the two time-series we use
a vector auto-regressive (VAR) approach to estimate the e¤ect of multilateral on
regional trade liberalization and vice versa. Thirdly, we examine their causal inter-
relation based on impulse-response-functions and Granger-causality analysis, i. e.
we investigate whether and how regional trade liberalization reacts to multilateral
trade liberalization, and vice versa.
The Gravity Model
In a �rst step, we use a standard gravity model to obtain the time-speci�c e¤ects
of both multilateral (represented by GATT/WTO membership) and regional (rep-
resented by RTA membership) agreements on international trade. In particular, we
regress bilateral trade �ows on countries�membership in GATT/WTO and RTAs
together with standard gravity control variables to estimate the time-speci�c impact
of multilateral and regional trade liberalization on trade �ows for each year.
The basic model associates trade �ows with the distance of the trading partners
and their income. This standard model has been supplemented by additional inde-
pendent variables such as cultural, geographic, and historical factors to control for
other �natural�sources of trade. These determinants also include trade agreements
6During the �rst wave of regionalism, the only successful regional trade agreement was rep-resented by the European Community and regional trade agreements were evaluated in staticcomparative analysis. At the beginning of the 1980s, the United States recognized that multi-lateral trade liberalization was di¢ cult to achieve and departed from multilateralism by buildingup bilateral agreements with Israel (1985), Canada (1989) and Mexico (1994) (Panagariya, 1999).With this turn from multilateralism toward regionalism as an alternative way of reaching globalfree trade, Bhagwati (1993) introduced the dynamic time-path dimension.
5
like GATT/WTO and RTAs.7 In formal terms, the model is given by:
Importsijt = �+
2006Xt=1953
�tDt both partners inside GATT/WTO ijt (1)
+
2006Xt=1957
#tDt both partners inside same RTAijt
+polity it + polityjt
+�Xijt + �ij + �t + "ijt
where i and j denote the importing and exporting country, respectively, and t depicts
time. The vector Xijt represents the standard control variables in gravity models.8
� is the common intercept, �ij and �t represent country pair speci�c and time dum-
mies, respectively; "ijt is a white noise error term. The variable both partners inside
the GATT/WTO is a binary dummy variable that is de�ned as one if both trading
partners participate in GATT/WTO in year t, and zero otherwise.Similarly, both
partners inside RTA is a binary dummy variable that equals to one if both trading
partners belong to the same RTA in year t. The termP2006
t=1953 �tDt both partners in-
side GATT/WTO ijt generates 54 dummy variables that represent the time-speci�c
impact of multilateral trade liberalization. In particular, Dt is de�ned as one for
a speci�c year t, else zero, and is multiplied by the binary variable GATT/WTO
membership which is de�ned as one if both trading partners are GATT/WTO mem-
bers in year t, else zero. As an example, D1970 is one in year 1970, else zero. The
combined term D1970 both partners inside GATT/WTO ij1970 is one if both trading
partners are GATT/WTO members in 1970, else zero. Thus, �1970 represents the
impact of multilateral trade liberalization in year 1970.9 The same transformation
is undertaken for membership in RTAs using the termP2006
t=1957 #tDt both partners
inside same RTAijt.10 Generally, �t and #t represent the estimated coe¢ cients re-
7Regarding the theoretical foundation of the gravity model see among others Anderson (1979),Bergstrand (1985), Helpman and Krugman (1985), Deardor¤ (1998), and Anderson and van Win-coop (2003).
8See appendix for a description of the variables.9Note that this speci�cation does not consider the duration of GATT/WTO membership. We
have also taken the duration of GATT/WTO membership into account and found that it does notchange the results of the gravity model estimation signi�cantly.10Note that the variable both partners inside RTA only accounts for mere membership in regional
trade agreements. Additionally, we have also experimented with various dimensions of regional
6
garding the time-speci�c impact of multilateral (GATT/WTO) and regional (RTA)
trade liberalization for each year in the data set, respectively.
We account for these time-speci�c e¤ects of GATT/WTO and RTAs as these
institutions are subject to a continuous change, i. e. GATT/WTO and RTAs in 1970
are qualitatively not the same institutions as in 2009 �independent from the number
of member countries or the number of RTAs as such. For instance, GATT/WTO
currently regulates a much wider range of issues in more depth than in former times
with RTAs having changed in a similar way (WTO, 2007). Regionalism during
the 1950s/1960s is often characterized as �old�regionalism and so-called �shallow�
integration. This type of integration was regional in a geographical sense, did not get
beyond mere tari¤ liberalization and rarely took place between developed and less
developed countries (Limao, 2007). Today, the so-called �new�regionalism is much
more di¤erentiated. It goes well beyond mere tari¤ liberalization and features deeper
forms of integration, such as economic reforms, harmonization and coordination of
economic policies as well as factor market integration among others (Bur�sher et
al., 2003). As the impact of GATT/WTO and RTAs on trade liberalization has
changed over time, we estimate the time-speci�c impact for each year individually.
Note that we do not model membership in GATT/WTO or RTAs according
to Bayer and Bergstrand (2004, 2007, 2009) and Egger et al. (2008) who refer to
the endogeneity of RTAs. While our approach is a �rst solution to the multilater-
alism versus regionalism nexus, the implementation of endogenous membership in
international institutions will be an interesting enhancement for future research.
An immanent problem of estimating the impact of institutional variables is spu-
rious correlation and bias due to omitted (institutional) variables which might also
be important for international trade. The e¤ect of trade liberalization might not
only be driven by international trade agreements but also by national factors. The
trade agreements. In particular, we accounted for de facto RTA membership by using time lags(Tomz et al., 2007, who account for de facto membership of GATT/WTO members). Additionally,we di¤erentiated between pure bilateral (two single countries form a RTA), bilateral (a RTA formsan agreement with a single country) and plurilateral RTAs (two RTAs form an arrangement). Wealso accounted for the number of di¤erent RTAs one country is engaged in. Furthermore, wedi¤erentiated between WTO-noti�ed and non-noti�ed RTAs, regional and cross-regional RTAs,RTAs with only WTO members and RTAs with at least one non-member. Finally, we considerede¤ective RTAs according to Holmes (2005). Again, we �nd that the results of our study do notchange signi�cantly.
7
political system could be such a third factor which might have a positive or negative
impact on international trade, as discussed e. g. by Decker and Lim (2009), Eichen-
green and Leblang (2007), and Yu (2007). To control for this e¤ect, we include the
variable polity which is a measure for the political regime and is scaled between +10
(strongly democratic) and -10 (strongly autocratic).
We estimate the model using �xed e¤ect Poisson maximum likelihood (FE-PML)
estimation. Since comprehensive trade data sets are typically characterized by nu-
merous zero trade �ows, we have to take them into account to avoid biased esti-
mates.11 As the traditional log-linearization of the gravity model cannot account
for zero trade �ows, we follow Verbeek (2008)12 and apply the Poisson maximum
likelihood (PML) estimator.13 The (expected) trade �ows can then be modeled
using an exponential function:
E(yijt j xijt) = exp(x0ijt�); (2)
where yijt represents bilateral trade �ows and xijt denotes a vector of exogenous
variables. The non-negativity of the exponential function ensures that the predicted
values for yijt are also non-negative.14 As this approach does not require a log-
linearization of the variables, the problem of zero trade �ows can be avoided.
Step Two: The VAR-Model
In a second step, we use a vector auto-regressive (VAR) framework based on the
two time-series derived from the gravity model to estimate the e¤ect of GATT/WTO
(multilateral) trade liberalization on RTA (regional) trade liberalization and vice
versa.
As discussed above, the e¤ects of multilateral and regional liberalization on trade
11The current dataset comprises about 46% zero values.12While Verbeek (2008) provides an overview of the Poisson Maximum Likelihood estimation,
Cameron and Trivedi (1998) and Winkelmann (2008) discuss the econometric analysis of countdata more comprehensively.13Regarding the application of gravity models, several authors propose the estimation of the
gravity model in its genuine multiplicative, non-linear form using Poisson maximum likelihoodestimation (Henderson and Millimet, 2008, Westerlund and Wilhelmsson, 2009, Siliverstovs andSchumacher, 2009, Santos Silva and Tenreyro, 2006, or Martínez-Zarzoso et al., 2006).14According to Davidson and MacKinnon (2004), the index function x0ijt� need not be linear
either.
8
may be subject to various interrelations. In particular, we identify the following fac-
tors which might induce a dynamic political link between multilateral and regional
trade liberalization. As potentially negative e¤ects, regionalism might dampen na-
tions�enthusiasm for multilateral liberalization, divert policy makers�attention away
frommultilateral liberalization and create tensions between trading blocs. As poten-
tially positive e¤ects, regionalism might relax political resentments between trading
blocs, serve as an experimental ground for new or controversial issues and improve
a country�s international reputation.15
It is beyond the scope of this paper to solve for a full dynamic and game-theoretic
equilibrium based on these factors. By contrast, we presume two empirical reaction
functions for multilateral and regional liberalization. In particular, we are interested
in the question how multilateral liberalization responds to a regional trade liberaliza-
tion stimulus, and vice versa. Therefore, we construct a VARmodel consisting of the
auto-regressive processes of two time series, namely the yearly time-speci�c impact
of both GATT/WTO �t and RTAs #t on international trade.16 The corresponding
bivariate model can be formulated as24 �t#t
35 =24 c1c2
35+24 d1td2t
35+24 �11(L) �12(L)
�21(L) �22(L)
3524 �t#t
35+24 u1tu2t
35 (3)
where L is the backshift-operator with �ij(L) = �1ijL1 + ::: + �pijL
p for i; j =
1; 2; 3. p denotes the lag order, ci is a constant, while di;t is a time dummy, and ui;t
represents the error term with i = f1; 2g. The time series VAR model is assumed
to be covariance stationary. The error term vector is i.i.d. with mean zero and
unknown non-singular residual covariance matrix E(utu0t) =P
u and existing fourth
moments.17 Consequently, we allow for contemporaneous correlation in the residuals
but no auto-correlation.
Evidently, this is an inherently reduced-form approach. As has been discussed
above, we identify several mechanisms that can a¤ect the interrelation between re-
15For a discussion see e. g. Baldwin (2004), Bhagwati (1992), Krueger (1995), Panagariya (1999),Summers (1991), Creamer (2003), Pomfret (2006), Bergsten (1997), and Folsom (2008).16For a detailed discussion of VAR models see e. g. Lütkepohl and Krätzig (2004) or Hamilton
(1994).17See Lütkepohl and Krätzig, 2004, chapter 3.2.
9
gional and multilateral trade liberalization. We cannot determine the magnitude of
each e¤ect separately, but instead estimate the net e¤ect of the combined mecha-
nisms. For instance, if the sum of coe¢ cients �12(L)#t on �t is negative, then the
negative e¤ects, such as the diversion of policy makers� attention, dominate and
RTAs have a negative e¤ect on multilateral trade liberalization. If they are pos-
itive, then the positive in�uences, such as the generation of reputation, are more
important, i. e. RTAs have a positive e¤ect on multilateral trade liberalization.
Step Three: Impulse-Response-Functions and Granger-causality Analy-
sis
In a third step, we analyze the causal interrelation between regional and multi-
lateral trade liberalization. We investigate the reaction of GATT/WTO trade lib-
eralization on RTA liberalization and vice versa using impulse-response-functions.
Impulse-response-functions trace out the expected response of yit+s to a unit change
in yjt, holding constant all past values of yt.18 In particular, one can use impulse-
response-functions to investigate the response of one event to the impact of the
other.
While the signs of the individual coe¢ cients are of some interest, our primary
focus is testing � overall �whether trade liberalization on one institutional level
causes trade liberalization on the other institutional level. That is, can we reasonably
say that GATT/WTO liberalizes trade as a reaction to RTA trade liberalization,
and vice versa? Our main empirical tool for doing so is the Granger-causality test.
Following Granger (1969), variable X causes variable Y if the forecasting of the
latter is improved by incorporating in the analysis information concerning X and its
past.19 In our case, we test the following two null hypotheses:
H0: RTAs do not Granger-cause GATT/WTO, i. e. the coe¢ cients of
the matrix blocs �12(L) are zero.
H0: GATT/WTO does not Granger-cause RTAs, i. e. the coe¢ cients
of the matrix blocs �21(L) are zero.
18See Lütkepohl and Krätzig, 2004, chapter 4.3.19A Wald test statistic is used in conjunction with an F distribution for testing the restrictions
(Lütkepohl and Krätzig, 2004, chapter 3.7).
10
Data
Our gravity model analysis is based on a sample that covers 184 countries with 240
RTAs over the period from 1953 to 2006 with annual data.20 We de�ne GATT/WTO
membership according to Tomz et al. (2007) and include RTAs following WTO
(2009c) and McGill (2009). The democracy variable polity is taken from the Polity
IV data set by Marshall and Jaggers (2009).
For the VAR analysis, we use the two series obtained from the gravity model
estimation.21 The Akaike information criterion (AIC) (Akaike 1973, 1974) suggests
the endogenous lag order 3 for the bivariate model. In order to save degrees of
freedom, we take advantage of sequential elimination algorithms which preselect
the speci�c lagged variables that are to be estimated in the model (Lütkepohl and
Krätzig, 2004, and Brüggemann and Lütkepohl, 2001). The speci�ed VAR model is
estimated by OLS using the software package JMulti.
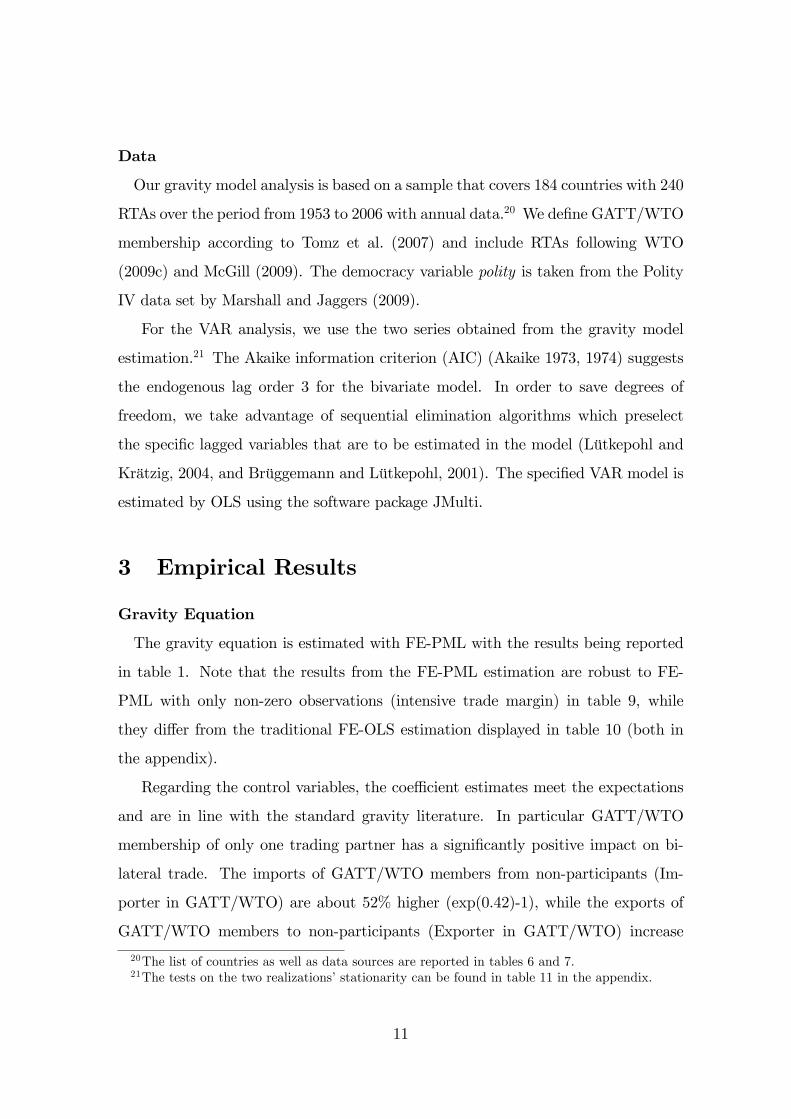
3 Empirical Results
Gravity Equation
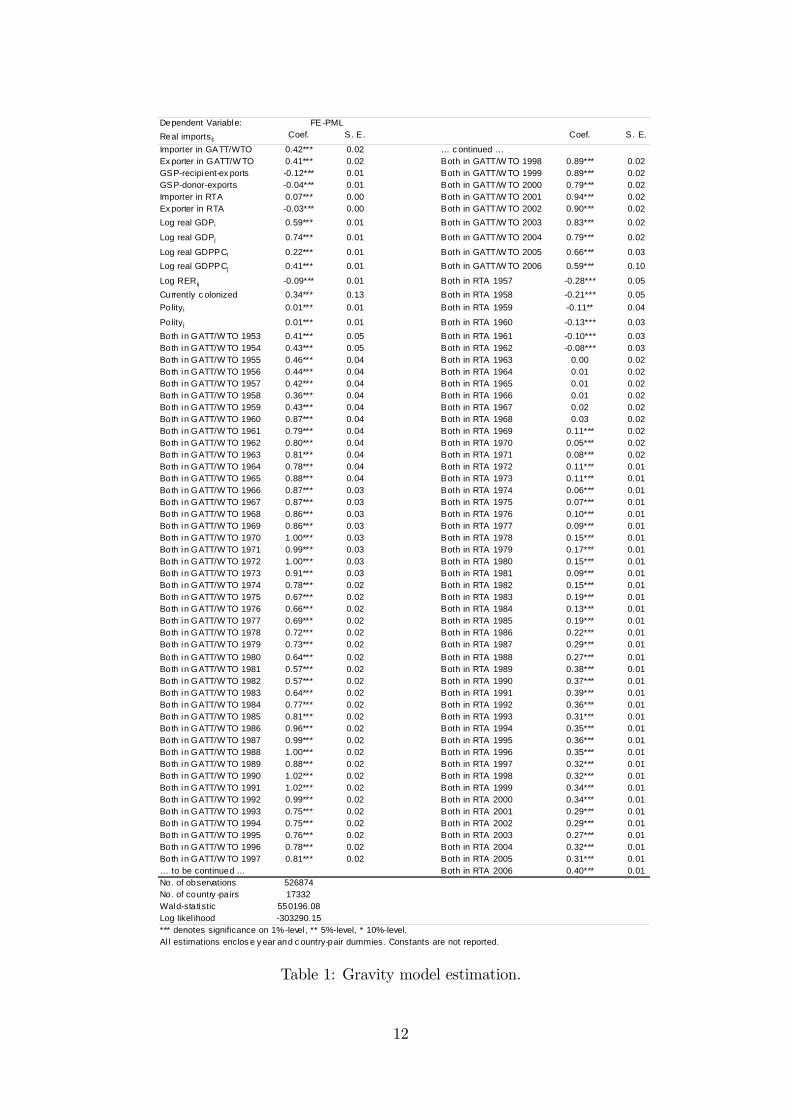
The gravity equation is estimated with FE-PML with the results being reported
in table 1. Note that the results from the FE-PML estimation are robust to FE-
PML with only non-zero observations (intensive trade margin) in table 9, while
they di¤er from the traditional FE-OLS estimation displayed in table 10 (both in
the appendix).
Regarding the control variables, the coe¢ cient estimates meet the expectations
and are in line with the standard gravity literature. In particular GATT/WTO
membership of only one trading partner has a signi�cantly positive impact on bi-
lateral trade. The imports of GATT/WTO members from non-participants (Im-
porter in GATT/WTO) are about 52% higher (exp(0.42)-1), while the exports of
GATT/WTO members to non-participants (Exporter in GATT/WTO) increase
20The list of countries as well as data sources are reported in tables 6 and 7.21The tests on the two realizations�stationarity can be found in table 11 in the appendix.
11
Dependent Variable:Real imports ij Coef. S. E. Coef. S. E.
Importer in GATT/WTO 0.42*** 0.02 … c ontinued …Ex porter in GATT/W TO 0.41*** 0.02 Both in GATT/W TO 1998 0.89*** 0.02GSPrecipientex ports 0.12*** 0.01 Both in GATT/W TO 1999 0.89*** 0.02GSPdonorexports 0.04*** 0.01 Both in GATT/W TO 2000 0.79*** 0.02Importer in RTA 0.07*** 0.00 Both in GATT/W TO 2001 0.94*** 0.02Ex porter in RTA 0.03*** 0.00 Both in GATT/W TO 2002 0.90*** 0.02Log real GDPi 0.59*** 0.01 Both in GATT/W TO 2003 0.83*** 0.02
Log real GDPj 0.74*** 0.01 Both in GATT/W TO 2004 0.79*** 0.02
Log real GDPPCi 0.22*** 0.01 Both in GATT/W TO 2005 0.66*** 0.03Log real GDPPCj 0.41*** 0.01 Both in GATT/W TO 2006 0.59*** 0.10
Log RER ij 0.09*** 0.01 Both in RTA 1957 0.28*** 0.05Currently c olonized 0.34*** 0.13 Both in RTA 1958 0.21*** 0.05Polity i 0.01*** 0.01 Both in RTA 1959 0.11** 0.04
Polity j 0.01*** 0.01 Both in RTA 1960 0.13*** 0.03Both in GATT/W TO 1953 0.41*** 0.05 Both in RTA 1961 0.10*** 0.03Both in GATT/W TO 1954 0.43*** 0.05 Both in RTA 1962 0.08*** 0.03Both in GATT/W TO 1955 0.46*** 0.04 Both in RTA 1963 0.00 0.02Both in GATT/W TO 1956 0.44*** 0.04 Both in RTA 1964 0.01 0.02Both in GATT/W TO 1957 0.42*** 0.04 Both in RTA 1965 0.01 0.02Both in GATT/W TO 1958 0.36*** 0.04 Both in RTA 1966 0.01 0.02Both in GATT/W TO 1959 0.43*** 0.04 Both in RTA 1967 0.02 0.02Both in GATT/W TO 1960 0.87*** 0.04 Both in RTA 1968 0.03 0.02Both in GATT/W TO 1961 0.79*** 0.04 Both in RTA 1969 0.11*** 0.02Both in GATT/W TO 1962 0.80*** 0.04 Both in RTA 1970 0.05*** 0.02Both in GATT/W TO 1963 0.81*** 0.04 Both in RTA 1971 0.08*** 0.02Both in GATT/W TO 1964 0.78*** 0.04 Both in RTA 1972 0.11*** 0.01Both in GATT/W TO 1965 0.88*** 0.04 Both in RTA 1973 0.11*** 0.01Both in GATT/W TO 1966 0.87*** 0.03 Both in RTA 1974 0.06*** 0.01Both in GATT/W TO 1967 0.87*** 0.03 Both in RTA 1975 0.07*** 0.01Both in GATT/W TO 1968 0.86*** 0.03 Both in RTA 1976 0.10*** 0.01Both in GATT/W TO 1969 0.86*** 0.03 Both in RTA 1977 0.09*** 0.01Both in GATT/W TO 1970 1.00*** 0.03 Both in RTA 1978 0.15*** 0.01Both in GATT/W TO 1971 0.99*** 0.03 Both in RTA 1979 0.17*** 0.01Both in GATT/W TO 1972 1.00*** 0.03 Both in RTA 1980 0.15*** 0.01Both in GATT/W TO 1973 0.91*** 0.03 Both in RTA 1981 0.09*** 0.01Both in GATT/W TO 1974 0.78*** 0.02 Both in RTA 1982 0.15*** 0.01Both in GATT/W TO 1975 0.67*** 0.02 Both in RTA 1983 0.19*** 0.01Both in GATT/W TO 1976 0.66*** 0.02 Both in RTA 1984 0.13*** 0.01Both in GATT/W TO 1977 0.69*** 0.02 Both in RTA 1985 0.19*** 0.01Both in GATT/W TO 1978 0.72*** 0.02 Both in RTA 1986 0.22*** 0.01Both in GATT/W TO 1979 0.73*** 0.02 Both in RTA 1987 0.29*** 0.01Both in GATT/W TO 1980 0.64*** 0.02 Both in RTA 1988 0.27*** 0.01Both in GATT/W TO 1981 0.57*** 0.02 Both in RTA 1989 0.38*** 0.01Both in GATT/W TO 1982 0.57*** 0.02 Both in RTA 1990 0.37*** 0.01Both in GATT/W TO 1983 0.64*** 0.02 Both in RTA 1991 0.39*** 0.01Both in GATT/W TO 1984 0.77*** 0.02 Both in RTA 1992 0.36*** 0.01Both in GATT/W TO 1985 0.81*** 0.02 Both in RTA 1993 0.31*** 0.01Both in GATT/W TO 1986 0.96*** 0.02 Both in RTA 1994 0.35*** 0.01Both in GATT/W TO 1987 0.99*** 0.02 Both in RTA 1995 0.36*** 0.01Both in GATT/W TO 1988 1.00*** 0.02 Both in RTA 1996 0.35*** 0.01Both in GATT/W TO 1989 0.88*** 0.02 Both in RTA 1997 0.32*** 0.01Both in GATT/W TO 1990 1.02*** 0.02 Both in RTA 1998 0.32*** 0.01Both in GATT/W TO 1991 1.02*** 0.02 Both in RTA 1999 0.34*** 0.01Both in GATT/W TO 1992 0.99*** 0.02 Both in RTA 2000 0.34*** 0.01Both in GATT/W TO 1993 0.75*** 0.02 Both in RTA 2001 0.29*** 0.01Both in GATT/W TO 1994 0.75*** 0.02 Both in RTA 2002 0.29*** 0.01Both in GATT/W TO 1995 0.76*** 0.02 Both in RTA 2003 0.27*** 0.01Both in GATT/W TO 1996 0.78*** 0.02 Both in RTA 2004 0.32*** 0.01Both in GATT/W TO 1997 0.81*** 0.02 Both in RTA 2005 0.31*** 0.01… to be continued … Both in RTA 2006 0.40*** 0.01No. of observations 526874No. of country pa irs 17332Waldsta tistic 550196.08Log likel ihood 303290.15*** denotes significance on 1%level , ** 5%level, * 10%level.Al l estimations enclos e y ear and c ountrypair dummies. Constants are not reported.
FEPML
Table 1: Gravity model estimation.
12
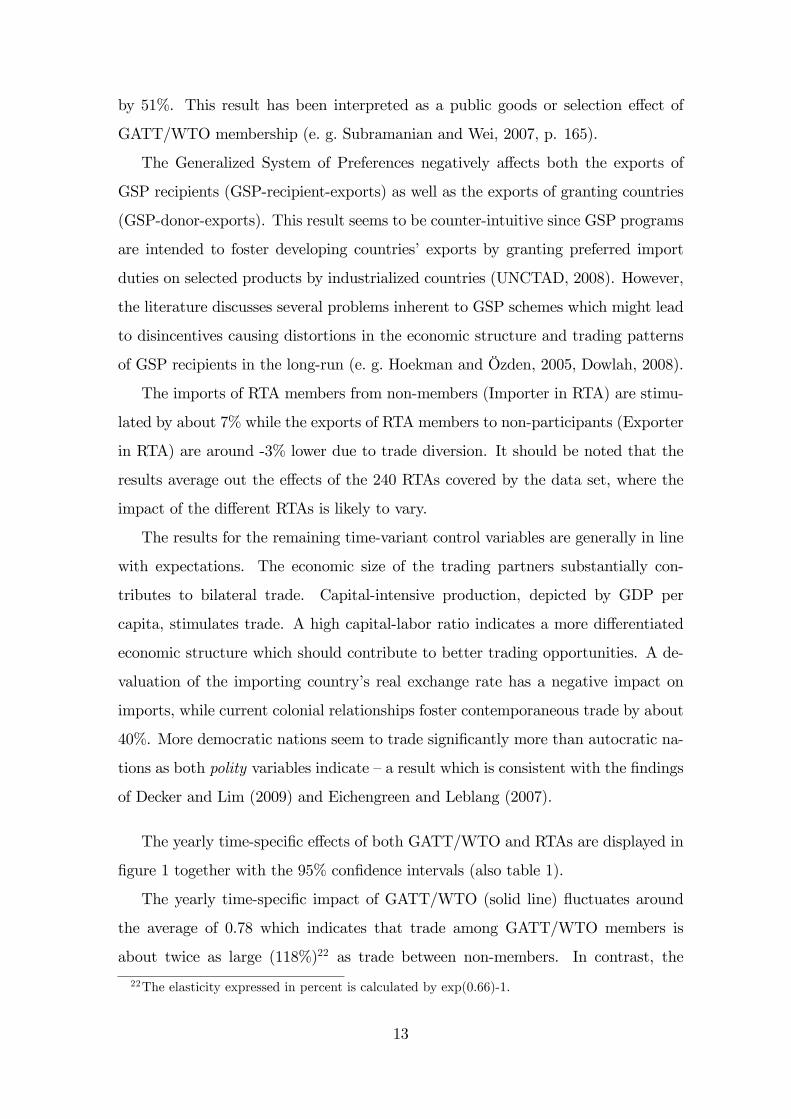
by 51%. This result has been interpreted as a public goods or selection e¤ect of
GATT/WTO membership (e. g. Subramanian and Wei, 2007, p. 165).
The Generalized System of Preferences negatively a¤ects both the exports of
GSP recipients (GSP-recipient-exports) as well as the exports of granting countries
(GSP-donor-exports). This result seems to be counter-intuitive since GSP programs
are intended to foster developing countries� exports by granting preferred import
duties on selected products by industrialized countries (UNCTAD, 2008). However,
the literature discusses several problems inherent to GSP schemes which might lead
to disincentives causing distortions in the economic structure and trading patterns
of GSP recipients in the long-run (e. g. Hoekman and Özden, 2005, Dowlah, 2008).
The imports of RTA members from non-members (Importer in RTA) are stimu-
lated by about 7% while the exports of RTA members to non-participants (Exporter
in RTA) are around -3% lower due to trade diversion. It should be noted that the
results average out the e¤ects of the 240 RTAs covered by the data set, where the
impact of the di¤erent RTAs is likely to vary.
The results for the remaining time-variant control variables are generally in line
with expectations. The economic size of the trading partners substantially con-
tributes to bilateral trade. Capital-intensive production, depicted by GDP per
capita, stimulates trade. A high capital-labor ratio indicates a more di¤erentiated
economic structure which should contribute to better trading opportunities. A de-
valuation of the importing country�s real exchange rate has a negative impact on
imports, while current colonial relationships foster contemporaneous trade by about
40%. More democratic nations seem to trade signi�cantly more than autocratic na-
tions as both polity variables indicate �a result which is consistent with the �ndings
of Decker and Lim (2009) and Eichengreen and Leblang (2007).
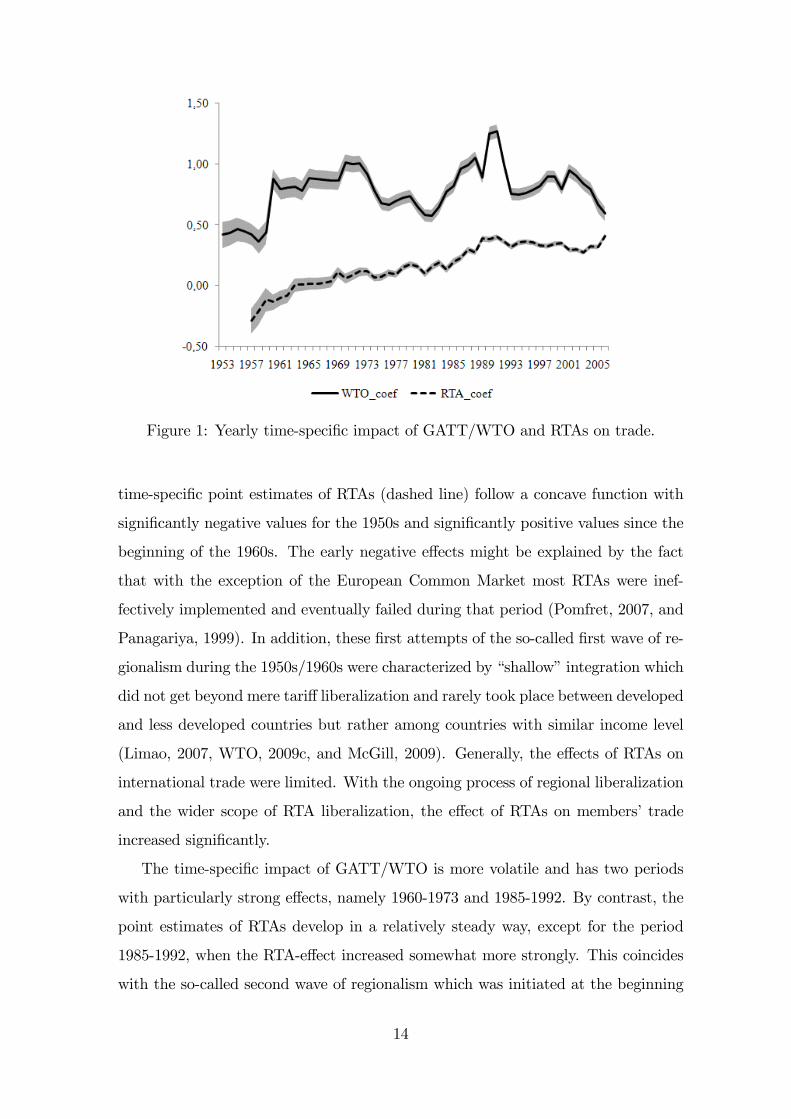
The yearly time-speci�c e¤ects of both GATT/WTO and RTAs are displayed in
�gure 1 together with the 95% con�dence intervals (also table 1).
The yearly time-speci�c impact of GATT/WTO (solid line) �uctuates around
the average of 0.78 which indicates that trade among GATT/WTO members is
about twice as large (118%)22 as trade between non-members. In contrast, the
22The elasticity expressed in percent is calculated by exp(0.66)-1.
13
Data Deterministic No. of ADFtransformation term Lags teststatistic 10% 5% 1%
GATT/WTOeffect level constant L 0 2.57* 2.57 2.86 3.43level constant L 1 2.83*level constant L 2 2.65*level constant L 3 2.73*
RTAeffect level constant, time trend L 0 3.41** 3.13 3.41 3.96level constant, time trend L 1 3.42**level constant, time trend L 2 3.66**level constant, time trend L 3 3.22*
*** denotes significance on 1%level, ** 5%level, * 10%level.
Critical values
Nullhypothesis Test statistics PvaluePortmanteautest no residual autocorrelation 8.07 0.78LMtest for autocorrelation in AR models
no residual autocorrelation 17.84 0.60
LomnickiJarqueBeratest for nonnormality
residuals are consistent witha standard normal distribution
u1 0.89 0.64 u2 0.94 0.62Multivariate ARCHLMtest no conditional heteroskedasticity 40.60 0.66Univariate ARCHLMtest no conditional heteroskedasticity u1 0.72 0.98 u2 1.24 0.94
Figure 1: Yearly time-speci�c impact of GATT/WTO and RTAs on trade.
time-speci�c point estimates of RTAs (dashed line) follow a concave function with
signi�cantly negative values for the 1950s and signi�cantly positive values since the
beginning of the 1960s. The early negative e¤ects might be explained by the fact
that with the exception of the European Common Market most RTAs were inef-
fectively implemented and eventually failed during that period (Pomfret, 2007, and
Panagariya, 1999). In addition, these �rst attempts of the so-called �rst wave of re-
gionalism during the 1950s/1960s were characterized by �shallow�integration which
did not get beyond mere tari¤ liberalization and rarely took place between developed
and less developed countries but rather among countries with similar income level
(Limao, 2007, WTO, 2009c, and McGill, 2009). Generally, the e¤ects of RTAs on
international trade were limited. With the ongoing process of regional liberalization
and the wider scope of RTA liberalization, the e¤ect of RTAs on members�trade
increased signi�cantly.
The time-speci�c impact of GATT/WTO is more volatile and has two periods
with particularly strong e¤ects, namely 1960-1973 and 1985-1992. By contrast, the
point estimates of RTAs develop in a relatively steady way, except for the period
1985-1992, when the RTA-e¤ect increased somewhat more strongly. This coincides
with the so-called second wave of regionalism which was initiated at the beginning
14
of the 1980s when the United States turned away from the multilateral approach
and promoted the North American Free Trade Agreement (NAFTA). The second
wave was also stimulated by the completion of the European Community�s (EC)
internal market in 1992 (Ethier, 1998, Pomfret, 2007, and Panagariya, 1999). The
third wave of regionalism started at the beginning of the 2000s and does not seem
to have any major e¤ects neither on the impact of RTAs on international trade nor
on the e¤ect of GATT/WTO.
VAR Estimation
We use the two time series obtained from the gravity analysis to estimate the e¤ect
of multilateral on regional trade liberalization and vice versa. In particular, we set
up a bivariate VAR model regressing the two variables on their past values. Due
to the limited number of observations, we employ sequential elimination algorithms
which preselect the speci�c lagged variables that are to be estimated in the model
(Lütkepohl and Krätzig, 2004, and Brüggemann and Lütkepohl, 2001).23
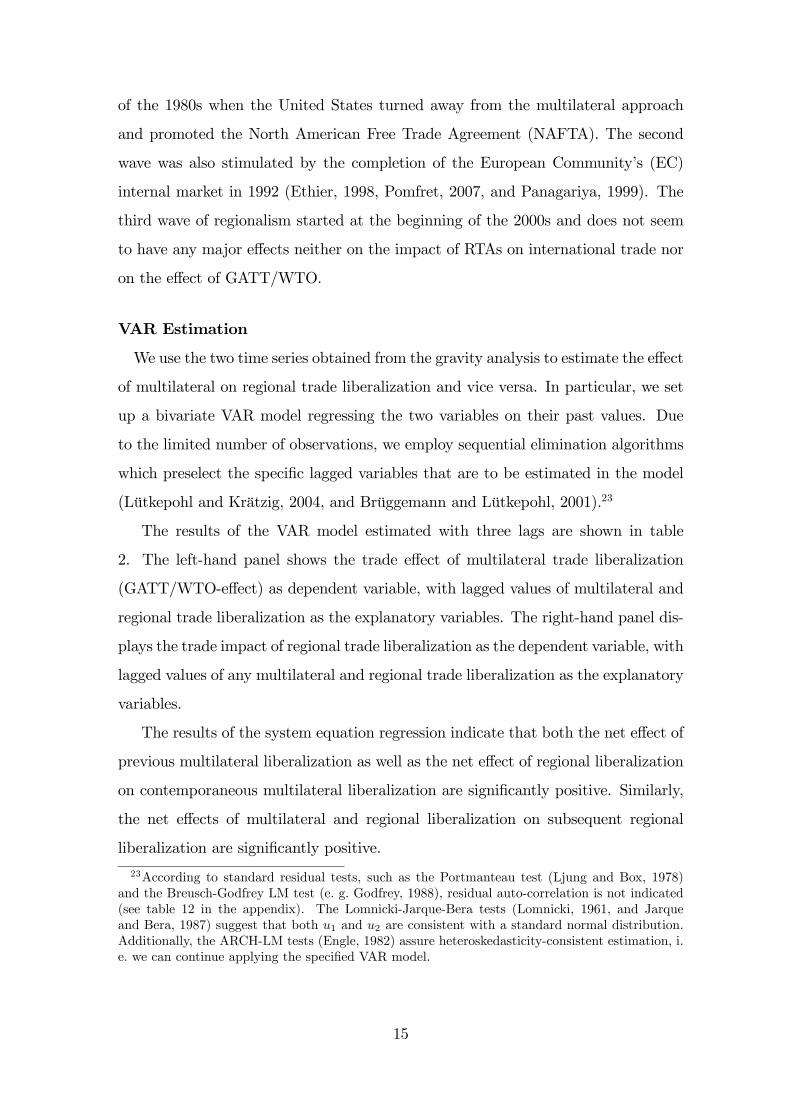
The results of the VAR model estimated with three lags are shown in table
2. The left-hand panel shows the trade e¤ect of multilateral trade liberalization
(GATT/WTO-e¤ect) as dependent variable, with lagged values of multilateral and
regional trade liberalization as the explanatory variables. The right-hand panel dis-
plays the trade impact of regional trade liberalization as the dependent variable, with
lagged values of any multilateral and regional trade liberalization as the explanatory
variables.
The results of the system equation regression indicate that both the net e¤ect of
previous multilateral liberalization as well as the net e¤ect of regional liberalization
on contemporaneous multilateral liberalization are signi�cantly positive. Similarly,
the net e¤ects of multilateral and regional liberalization on subsequent regional
liberalization are signi�cantly positive.
23According to standard residual tests, such as the Portmanteau test (Ljung and Box, 1978)and the Breusch-Godfrey LM test (e. g. Godfrey, 1988), residual auto-correlation is not indicated(see table 12 in the appendix). The Lomnicki-Jarque-Bera tests (Lomnicki, 1961, and Jarqueand Bera, 1987) suggest that both u1 and u2 are consistent with a standard normal distribution.Additionally, the ARCH-LM tests (Engle, 1982) assure heteroskedasticity-consistent estimation, i.e. we can continue applying the speci�ed VAR model.
15
GATT/WTOeffect
RTAeffect
GATT/WTOeffectt 1 0.807*** 0.102**(0.126) (0.050)
GATT/WTOeffectt 2 0.273** 0.095(0.119) (0.062)
GATT/WTOeffectt 3 0.081*(0.047)
RTAeffect t 1 1.600*** 0.635***(0.358) (0.111)
RTAeffect t 2 1.126***(0.361)
RTAeffect t 3
Constant 0.417*** 0.086**(0.116) (0.044)
Trend 0.005 0.003***(0.003) (0.001)
*** denotes significance on 1%level, ** 5%level, * 10%level.Sample range [1957, 2006]. SD in parentheses.
Model 1
Causality direction Model 1GATT/WTO => RTA Waldteststatistic1 1.32 Pvalue 0.27 ηGATT/WTO?RTAs (+)RTA => GATT/WTO Waldteststatistic2 5.65*** Pvalue 0.01 ηRTA s? GATT/WTO +1 Waldtest that GATT/WTO does not Grangercause RTAs.2 Waldtest that RTAs do not Grangercause GATT/WTO.*** denotes significance on 1%level, ** 5%level, * 10%level.
Table 2: VAR estimation, core model.
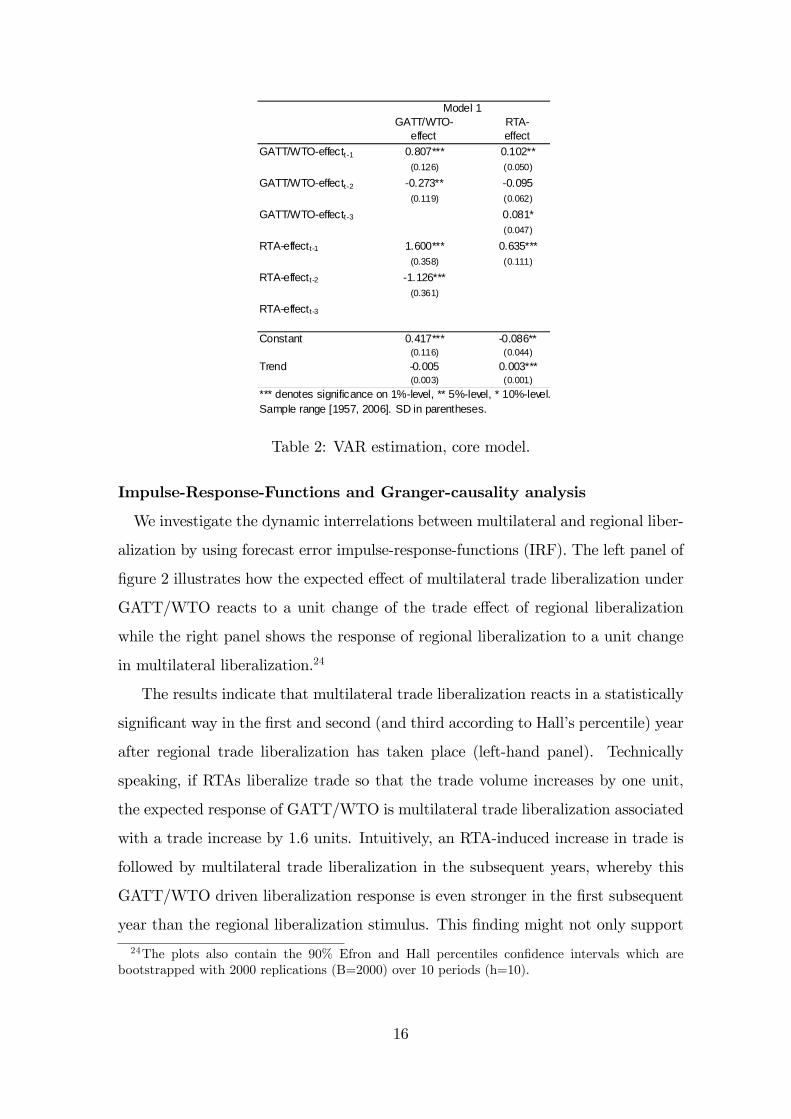
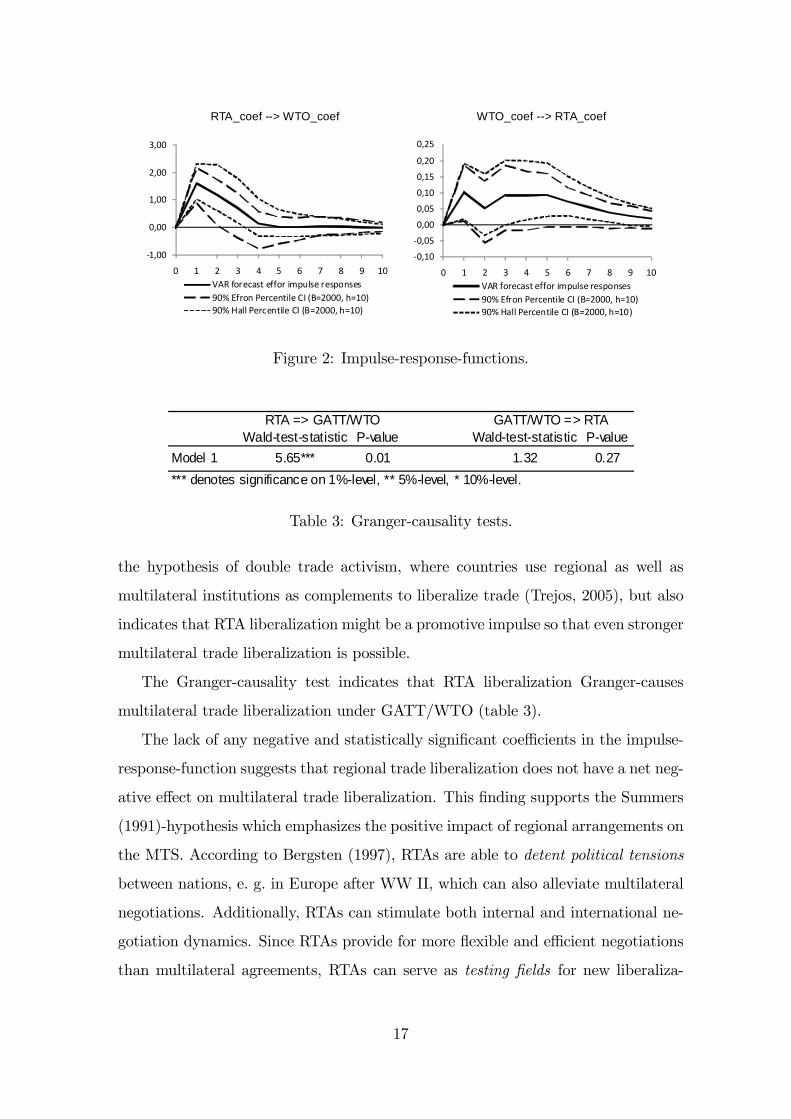
Impulse-Response-Functions and Granger-causality analysis
We investigate the dynamic interrelations between multilateral and regional liber-
alization by using forecast error impulse-response-functions (IRF). The left panel of
�gure 2 illustrates how the expected e¤ect of multilateral trade liberalization under
GATT/WTO reacts to a unit change of the trade e¤ect of regional liberalization
while the right panel shows the response of regional liberalization to a unit change
in multilateral liberalization.24
The results indicate that multilateral trade liberalization reacts in a statistically
signi�cant way in the �rst and second (and third according to Hall�s percentile) year
after regional trade liberalization has taken place (left-hand panel). Technically
speaking, if RTAs liberalize trade so that the trade volume increases by one unit,
the expected response of GATT/WTO is multilateral trade liberalization associated
with a trade increase by 1.6 units. Intuitively, an RTA-induced increase in trade is
followed by multilateral trade liberalization in the subsequent years, whereby this
GATT/WTO driven liberalization response is even stronger in the �rst subsequent
year than the regional liberalization stimulus. This �nding might not only support
24The plots also contain the 90% Efron and Hall percentiles con�dence intervals which arebootstrapped with 2000 replications (B=2000) over 10 periods (h=10).
16
RTA_coef > WTO_coef WTO_coef > RTA_coef
1,00
0,00
1,00
2,00
3,00
0 1 2 3 4 5 6 7 8 9 10VAR forecast effor impulse responses90% Efron Percentile CI (B=2000, h=10)90% Hall Percentile CI (B=2000, h=10)
0,10
0,05
0,00
0,05
0,10
0,15
0,20
0,25
0 1 2 3 4 5 6 7 8 9 10VAR forecast effor impulse responses90% Efron Percentile CI (B=2000, h=10)90% Hall Percentile CI (B=2000, h=10)
Causality direction Model 23 Model 34 Model 45 Model 56 Model 67
GATT/WTO => RTA Waldteststatistic1 5.31*** 1.77 5.78*** 3.01** 3.54** Pvalue 0.00 0.16 0.00 0.04 0.02 ηG ATT/WTO? RTAs + (+) + + +RTA => GATT/WTO Waldteststatistic2 6.54*** 7.42*** 7.55*** 5.20*** 9.09*** Pvalue 0.00 0.00 0.00 0.00 0.00 ηR TAs?G ATT/WTO + + + +1 Waldtest that GATT/WTO does not Grangercause RTAs.2 Waldtest that RTAs do not Grangercause GATT/WTO.*** denotes significance on 1%level, ** 5%level, * 10%level.3 Added variables: Number of GATT/WTO members, number of RTAs.4 Added variables: Real world GDP.5 Added variables: KOF globalization index6 Added variables: No. of GATT/WTO members, no. of RTAs, real world GDP.7 Added variables: No. of GATT/WTO members, no. of RTAs, real world GDP, globalization index.
Figure 2: Impulse-response-functions.
Model 7 Model 8 Model 9 Model 10GATT/WTO => RTA Waldteststatistic1 0.61 1.23 0.97 0.60 Pvalue 0.54 0.30 0.43 0.72 ηGA TT/WTO?R TA sRTA => GATT/WTO Waldteststatistic2 10.06*** 5.10*** 2.66** 2.20** Pvalue 0.00 0.00 0.03 0.05 ηRTAs?GA TT/WTO1 Waldtest that GATT/WTO does not Grangercause RTAs.2 Waldtest that RTAs do not Grangercause GATT/WTO.*** denotes significance on 1%level, ** 5%level, * 10%level.
Waldteststatistic Pvalue Waldteststatistic PvalueModel 1 5.65*** 0.01 1.32 0.27*** denotes significance on 1%level, ** 5%level, * 10%level.
GATT/WTO => RTARTA => GATT/WTO
Waldteststatistic Pvalue Waldteststatistic PvalueModel 2 6.54*** 0.00 5.31*** 0.00
Model 3 7.42*** 0.00 1.77 0.16
Model 4 7.55*** 0.00 5.78*** 0.00
Model 5 5.20*** 0.00 3.01** 0.04
Model 6 9.09*** 0.00 3.54** 0.02*** denotes significance on 1%level, ** 5%level, * 10%level.
GATT/WTO => RTARTA => GATT/WTO
Waldteststatistic Pvalue Waldteststatistic PvalueModel 7 10.06*** 0.00 0.61 0.54
Model 8 5.10*** 0.00 1.23 0.30
Model 9 2.66** 0.03 0.97 0.43
Model 10 2.20** 0.05 0.60 0.72*** denotes significance on 1%level, ** 5%level, * 10%level.
GATT/WTO => RTARTA => GATT/WTO
Table 3: Granger-causality tests.
the hypothesis of double trade activism, where countries use regional as well as
multilateral institutions as complements to liberalize trade (Trejos, 2005), but also
indicates that RTA liberalization might be a promotive impulse so that even stronger
multilateral trade liberalization is possible.
The Granger-causality test indicates that RTA liberalization Granger-causes
multilateral trade liberalization under GATT/WTO (table 3).
The lack of any negative and statistically signi�cant coe¢ cients in the impulse-
response-function suggests that regional trade liberalization does not have a net neg-
ative e¤ect on multilateral trade liberalization. This �nding supports the Summers
(1991)-hypothesis which emphasizes the positive impact of regional arrangements on
the MTS. According to Bergsten (1997), RTAs are able to detent political tensions
between nations, e. g. in Europe after WW II, which can also alleviate multilateral
negotiations. Additionally, RTAs can stimulate both internal and international ne-
gotiation dynamics. Since RTAs provide for more �exible and e¢ cient negotiations
than multilateral agreements, RTAs can serve as testing �elds for new liberaliza-
17
tion ideas which can subsequently be negotiated in the multilateral setting, e. g.
services or intellectual property rights (WTO, 2009c, Trejos, 2005, Pomfret, 2006,
Bergsten, 1997, and Folsom, 2008). Moreover, members of RTAs can gain stability
and reputation through their commitment to regional arrangements which is likely
to have positive e¤ects for negotiations on the multilateral level, like in the case of
the Southern Common Market (MERCOSUR) (Paiva and Gazel, 2003).
When analyzing possible e¤ecfs of multilateral on regional trade liberalization,
the right-hand panel of �gure 2 to some degree suggests that regional trade liberal-
ization might respond in a positive way to multilateral trade liberalization. However,
evidence on the causality tests (table 3) indicate that GATT/WTO liberalization
does not Granger-cause RTA liberalization, overall. This result might be interpreted
that regional liberalization additional to multilateral liberalization is not an attrac-
tive option.
Taken together, the Granger-causality analyses indicate an unidirectional causal-
ity relation from GATT/WTO to RTAs. An increase in RTA trade liberalization
stimulates multilateral trade liberalization by GATT/WTO, however not vice versa.
We can respond to the question of Bhagwati and Panagariya (1996) that the rela-
tionship between the multilateral system and regionalism is characterized by an
asymmetric friendship.
Are the Results Robust to Models Controlling for Global Developments?
Generally, causality in a bivariate analysis could be due to omitted variables. To
avoid incorrect inferences, we integrate several additional variables in our vector
auto-regressive (VAR) system and test the causality relations again. In particular,
we complement the VAR model with several variables controlling for the number of
GATT/WTOmembers and the number of RTAs (model 2), and indicators of general
globalization developments, such as world GDP (model 3) or the KOF globalization-
index (model 4). Since the KOF globalization-index is only available for the years
since 1970 and thus restricts the analysis to the period 1970-2006, we include all
control variables except the globalization-index in model 5, while we incorporate all
control variables together with the globalization-index in model 6. The results of
18
Model 7 Model 8 Model 9 Model 10GATT/WTO => RTA Waldteststatistic1 0.61 1.23 0.97 0.60 Pvalue 0.54 0.30 0.43 0.72 ηGA TT/WTO?R TA sRTA => GATT/WTO Waldteststatistic2 10.06*** 5.10*** 2.66** 2.20** Pvalue 0.00 0.00 0.03 0.05 ηRTAs?GA TT/WTO1 Waldtest that GATT/WTO does not Grangercause RTAs.2 Waldtest that RTAs do not Grangercause GATT/WTO.*** denotes significance on 1%level, ** 5%level, * 10%level.
Waldteststatistic Pvalue Waldteststatistic PvalueModel 1 5.65*** 0.01 1.32 0.27*** denotes significance on 1%level, ** 5%level, * 10%level.
GATT/WTO => RTARTA => GATT/WTO
Waldteststatistic Pvalue Waldteststatistic PvalueModel 2 6.54*** 0.00 5.31*** 0.00
Model 3 7.42*** 0.00 1.77 0.16
Model 4 7.55*** 0.00 5.78*** 0.00
Model 5 5.20*** 0.00 3.01** 0.04
Model 6 9.09*** 0.00 3.54** 0.02*** denotes significance on 1%level, ** 5%level, * 10%level.
GATT/WTO => RTARTA => GATT/WTO
Waldteststatistic Pvalue Waldteststatistic PvalueModel 7 10.06*** 0.00 0.61 0.54
Model 8 5.10*** 0.00 1.23 0.30
Model 9 2.66** 0.03 0.97 0.43
Model 10 2.20** 0.05 0.60 0.72*** denotes significance on 1%level, ** 5%level, * 10%level.
GATT/WTO => RTARTA => GATT/WTO
Table 4: Granger-causality tests for models with additional explanatory variables.
the IRFs are shown in �gure 3 while the corresponding Granger-causality tests are
reported in table 4.25
Generally, the impulse-response-fuctions support the �ndings obtained from the
core section. If RTAs liberalize trade, the expected response of GATT/WTO is mul-
tilateral trade liberalization (left-hand panel, �gure 3). According to the causality
tests, we �nd evidence that regional trade liberalization signi�cantly Granger-causes
multilateral trade liberalization (table 4). However, two results are of particular in-
terest. Regarding model 2, we �nd a signi�cantly positive response of GATT/WTO
liberalization initially, while it becomes signi�cantly negative in periods 3-4 (�gure
3). This might indicate that initially the positive implications of RTA liberalization
outweigh the negative transmission mechanisms so that the net e¤ect is positive,
while the net e¤ect becomes negative in later periods possibly because the e¤orts
associated with double trade activism are hard to maintain over a longer time pe-
riod. With respect to model 6, the reactions seem to emerge in cycles, i. e. in period
1, 4 and 8. This sawtooth pattern might indicate a liberalization process which
alternates between regional and multilateral trade liberalization.
The impulse-response-functions on the right hand-side indicate a positive re-
sponse of RTA liberalization on multilateral liberalization (�gure 3). In contrast
to the core analysis above, we �nd support for the hypothesis that GATT/WTO
liberalization Granger-causes regional trade liberalization (table 4), although the
response of GATT/WTO liberalization to RTA liberalization is much stronger than
vice versa. Three �ndings might be of interest. The IRF of model 2 indicates that
25The corresponding estimation results are reported in table 13 in the appendix.
19
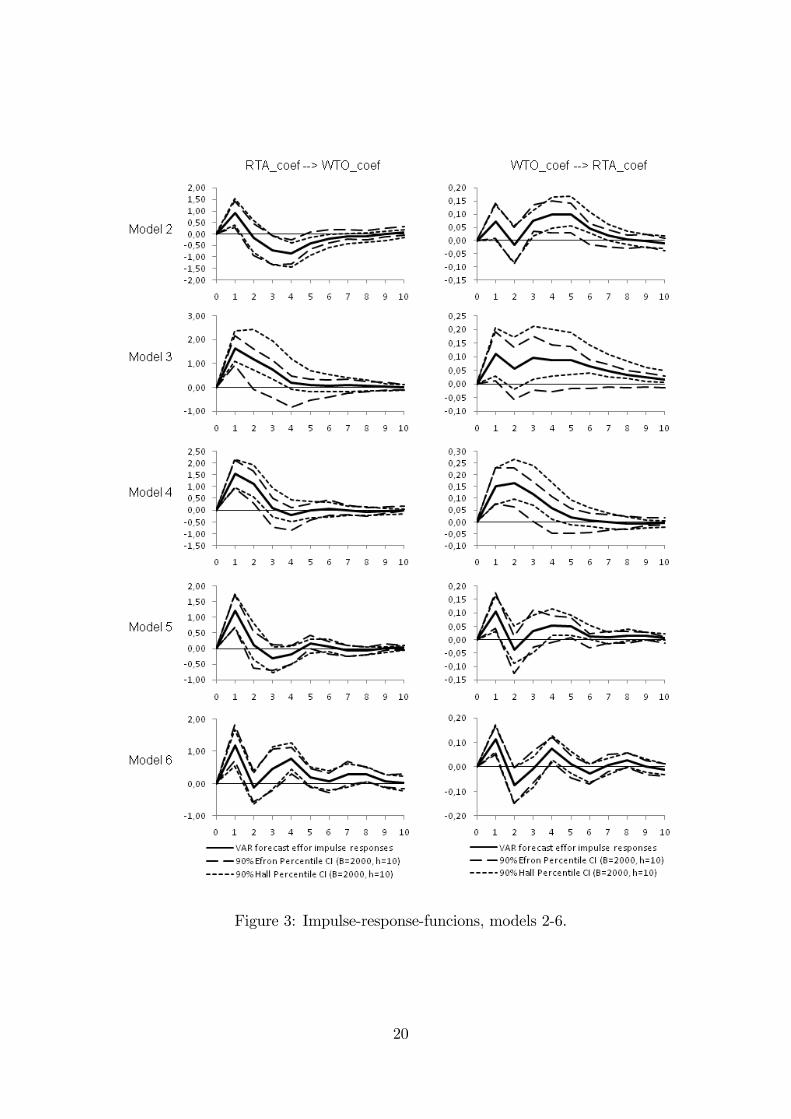
Figure 3: Impulse-response-funcions, models 2-6.
20
the reaction of regional liberalization on multilateral liberalization is positive in
the �rst subsequent year, and additionally in periods 3-5 with a break in period 2.
Regarding model 3, regional liberalization seems to respond to a certain degree to
multilateral liberalization (�gure 3), while we �nd no evidence of Granger-causality
(table 4). Referring to model 6, we �nd an alternating response of regional trade
liberalization on GATT/WTO liberalization �similar to the pattern in the opposite
direction.
Summarizing, we �nd �based on Granger-causality tests �a so-called feedback
relationship between multilateral and regional trade liberalization, overall. The re-
sults indicate that multilateral trade liberalization responds in a signi�cantly posi-
tive way during the �rst years after regional liberalization has taken place. Likewise,
RTA liberalization reactions are signi�cantly positive during the �rst periods after
multilateral liberalization has taken place. However, only in model 2 we �nd a sig-
ni�cantly negative response of GATT/WTO to RTA liberalization in a later period,
while GATT/WTO liberalization reacts positive on RTA liberalization also in later
periods. Additionally, multilateral liberalization seems not to Granger-cause RTA
liberalization in model 3.
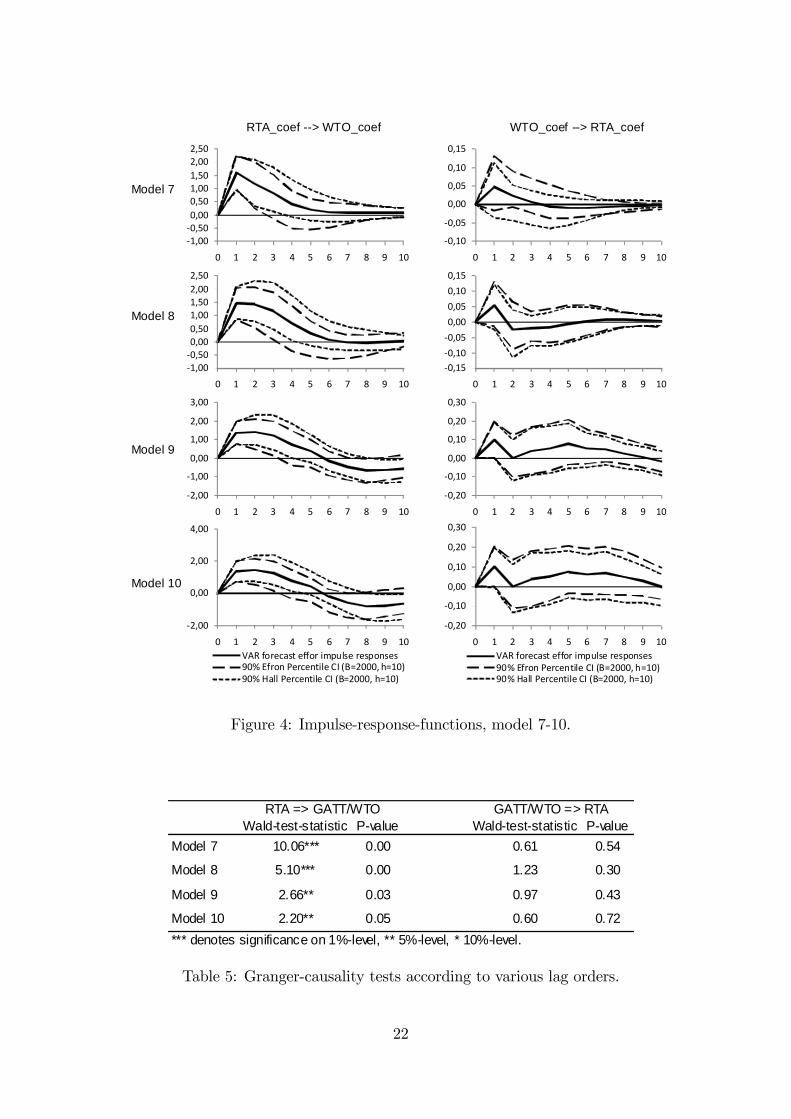
Are the Results Robust to Variation in the Model�s Lag-Length?
This section tests whether the results are robust to a variation in the VAR model�s
lag order. In particular, we consider a shorter model accounting for two lags (model
7) as well as models with higher order incorporating 4-6 lags (models 8-10). The IRFs
are displayed in �gure 4 while the corresponding results of the Granger-causality
tests are reported in table 5.26
The impulse-response-functions on the left hand-side clearly indicate that multi-
lateral liberalization responds in a signi�cantly positive way to regional trade liberal-
ization during the �rst two to three subsequent years across the various estimations.
Seemingly, the reaction e¤ect of WTO liberalization to RTA liberalization is not
sensitive to various lag orders of our VAR model, neither is the magnitude of the
reaction e¤ect. Generally, it seems that the duration of the reaction e¤ect tends to
26The estimation results of the corresponding VAR regressions are presented in table 14 (seeappendix).
21
RTA_coef > WTO_coef WTO_coef > RTA_coef
1,000,500,000,501,001,502,002,50
0 1 2 3 4 5 6 7 8 9 10
0,10
0,05
0,00
0,05
0,10
0,15
0 1 2 3 4 5 6 7 8 9 10
0,150,10
0,05
0,00
0,05
0,10
0,15
0 1 2 3 4 5 6 7 8 9 10
1,000,500,000,501,001,502,002,50
0 1 2 3 4 5 6 7 8 9 10
2,00
1,00
0,00
1,00
2,00
3,00
0 1 2 3 4 5 6 7 8 9 10
0,20
0,10
0,00
0,10
0,20
0,30
0 1 2 3 4 5 6 7 8 9 10
0,20
0,10
0,00
0,10
0,20
0,30
0 1 2 3 4 5 6 7 8 9 10VAR forecast effor impulse responses90% Efron Percentile CI (B=2000, h=10)90% Hall Percentile CI (B=2000, h=10)
2,00
0,00
2,00
4,00
0 1 2 3 4 5 6 7 8 9 10VAR forecast effor impulse responses90% Efron Percentile CI (B=2000, h=10)90% Hall Percentile CI (B=2000, h=10)
Model 7
Model 8
Model 9
Model 10
Figure 4: Impulse-response-functions, model 7-10.
Model 7 Model 8 Model 9 Model 10GATT/WTO => RTA Waldteststatistic1 0.61 1.23 0.97 0.60 Pvalue 0.54 0.30 0.43 0.72 ηGA TT/WTO?R TA sRTA => GATT/WTO Waldteststatistic2 10.06*** 5.10*** 2.66** 2.20** Pvalue 0.00 0.00 0.03 0.05 ηRTAs?GA TT/WTO1 Waldtest that GATT/WTO does not Grangercause RTAs.2 Waldtest that RTAs do not Grangercause GATT/WTO.*** denotes significance on 1%level, ** 5%level, * 10%level.
Waldteststatistic Pvalue Waldteststatistic PvalueModel 1 5.65*** 0.01 1.32 0.27*** denotes significance on 1%level, ** 5%level, * 10%level.
GATT/WTO => RTARTA => GATT/WTO
Waldteststatistic Pvalue Waldteststatistic PvalueModel 2 6.54*** 0.00 5.31*** 0.00
Model 3 7.42*** 0.00 1.77 0.16
Model 4 7.55*** 0.00 5.78*** 0.00
Model 5 5.20*** 0.00 3.01** 0.04
Model 6 9.09*** 0.00 3.54** 0.02*** denotes significance on 1%level, ** 5%level, * 10%level.
GATT/WTO => RTARTA => GATT/WTO
Waldteststatistic Pvalue Waldteststatistic PvalueModel 7 10.06*** 0.00 0.61 0.54
Model 8 5.10*** 0.00 1.23 0.30
Model 9 2.66** 0.03 0.97 0.43
Model 10 2.20** 0.05 0.60 0.72*** denotes significance on 1%level, ** 5%level, * 10%level.
GATT/WTO => RTARTA => GATT/WTO
Table 5: Granger-causality tests according to various lag orders.
22
last longer for VAR models with higher lag order: For models with two or three lags
(model 1 and 7), the response of multilateral liberalization is signi�cantly positive
during the �rst two subsequent years after RTA liberalization. In comparison, for
models with four or more lags (models 8-10), the response of multilateral liberal-
ization is signi�cantly positive during the �rst three subsequent years after RTA
liberalization. Additionally, we �nd robust evidence that regional trade liberaliza-
tion Granger-causes multilateral liberalization, although the signi�cance decreases
with an increase in the lag order.
The IRFs on the right hand-side robustly indicate that regional liberalization
does not respond to multilateral liberalization. In fact, none of the reactions are
signi�cantly di¤erent from zero. Additionally, we �nd no support for the hypothesis
that GATT/WTO liberalization Granger-causes RTA liberalization.
4 Conclusion
Since the �rst wave of regionalism until the 1980s, discussion on regionalism was
characterized by static trade creation and trade diversion e¤ects of regional trade
agreements (RTAs). With the second wave of regionalism during the 1990s, the
debate on regionalism turned to the dynamic interrelation between regional integra-
tion and multilateral trade liberalization. In this context, Bhagwati and Panagariya
(1996) ask whether RTAs and the multilateral trading system are �strangers, friends,
or foes�? We �nd robust evidence that multilateral trade liberalization responds in
a signi�cantly positive way during the �rst years after regional trade liberalization.
Additionally, we �nd robust evidence that RTA liberalization signi�cantly Granger-
causes GATT/WTO liberalization. A sensitivity analysis indicates that these results
are robust to changes in control variables an the VAR model�s lag order. In con-
trast, our results do not robustly indicate that regional trade liberalization responds
in a signi�cantly positive way to multilateral trade liberalization. Summarizing, our
results suggest an unidirectional relationship between multilateralism and regional-
ism. While multilateral trade liberalization reacts signi�cantly positive to regional
trade liberalization whereby Granger-causality is signi�cant, this result does not
23
hold in the opposite direction. Using the terms of Bhagwati and Panagariya (1996),
we might call this relation an asymmetric friendship. At least, we can ensure that
regional trade liberalization does not react in a signi�cantly negative way to multi-
lateral trade liberalization.
24
References
Akaike, H., �Information theory and an extension of the maximum likelihood
principle,� in B. Petrov and F. Csáki, eds., 2nd International Symposium of In-
formation Theory, Budapest: Académiai Kiadó, 1973, pp. 267�81.
, �A new look at the statistical model identi�cation,� IEEE Transactions on
Automatic Control AC-19, 1974, pp. 716�23.
Anderson, James, �A theoretical foundation for the gravity model,�American
Economic Review, 1979, 69, 106�16.
and Eric van Wincoop, �Gravity with gravitas: A solution to the border
puzzle,�American Economic Review, 2003, 93 (1), 170�92.
Baier, Scott and Je¤rey Bergstrand, �Economic Determinants of Free Trade
Agreements,�Journal of International Economics, 2004, 74 (1), 29�63.
and , �Do free trade agreements actually increase members� international
trade?,�Jounral of International Economics, 2007, 71, 72�95.
and , �Estimating the e¤ects of free trade agreements on international trade
�ows using matching econometrics,� Jounral of International Economics, 2009,
77, 63�76.
Baldwin, Richard, �Stepping stones or building blocs? Regional and multilateral
integration,�Graduate Institute of International Studies, Geneva, 2004.
Bergsten, Fred, �Open Regionalism,�The World Economy, 1997, 20 (5), 545�65.
Bergstrand, Je¤rey, �The gravity equation in international trade: Some micro-
economic foundations and empirical evidence,�Review of Economics and Statis-
tics, 1985, 67, 474�81.
Bhagwati, Jagdish, �Regionalism versus Multilateralism,�The World Economy,
1992, 15 (5), 535�555.
25
, �Regionalism and multilateralism: an overview,� in A. Panagariya and
J. de Melo, eds., New Dimensions in Regional Integration, Cambridge, Great
Britain: Cambridge University Press, 1993.
and Arvind Panagariya, �Preferential Trading Areas and Multilateralism:
Strangers, Friends or Foes?,� in Jagdish Bhagwati and Arvind Panagariya, eds.,
The Economics of Preferential Trading, Washington, D.C.: AEI Press, 1996,
pp. 1�78.
, ed., The world trading system at risk, New York, London, etc.: HarvesterWheat-
sheaf, 1991.
Brüggemann, R. and H. Lütkepohl, �Lag selection in subset VAR models with
an application to a U.S. monetary system,� in R. Friedmann, L. Knüppel, and
H. Lütkepohl, eds., Econometric Studies: A Festschrift in Honor of Joachim
Frohn, Münster: LIT Verlag, 2001, pp. 107�28.
Bur�sher, Mary, Sherman Robinson, and Karen Thierfelder, �Regionalism:
Old and New, Theory and Practice,�Paper prepared for presentation to The In-
ternational Agricultural Trade Research Consortium (IATRC) Conference, Capri,
Italy, 2003.
Cameron, Colin and Pravin Trivedi, eds, Regression analysis of count data,
Cambridge: Econometric Society Monographs No. 30, Cambridge University
Press, 1998.
CEPII, �Geodesic Distances,�CEPII Research Center, www.cepii.fr 2008.
CIA, The world factbook, Washington, D.C.: Central Intelligence Agency (CIA),
2007.
Creamer, Germán, �Open regionalism in the Andean Community: a trade �ow
analysis,�World Trade Review, 2003, 2 (1), 101�18.
Davidson, Russell and James MacKinnon, eds, Econometric theory and meth-
ods, New York, Oxford: Oxford University Press, Inc., 2004.
26
Deardor¤, Alan, �Does gravity work in a neoclassical world?,� in Je¤rey A.
Frankel, ed., The Regionalization of the World Economy, Chicago: The University
of Chicago Press, 1998.
Decker, Jessica Henson and Jamus Jerome Lim, �Democracy and Trade: An
Empirical Study,�Economics of Governance, 2009, 10 (2), 165�86.
Dowlah, Caf, �The Generalized System of Preferences of the United States: Does It
Promote Industrialization and Economic Growth in Least Developed Countries?,�
The Law and Development Review, 2008, 1 (1), 71�96.
Egger, Hartmut, Peter Egger, and David Greenaway, �Trade liberalization
with multinational �rms: E¤ects on welfare and intra-industry trade,�Journal of
International Economics, 2008, 74, 278�98.
Eichengreen, Barry and David Leblang, �Democracy and Globalization,�BIS
Working Paper No. 219, 2007.
Engle, R. F., �Autoregressive conditional heteroscedasticity, with estimates of the
variance of United Kingdoms�in�ations,�Econometrica, 1982, 50, 987�1007.
Estevadeordal, Antoni, Caroline Freund, and Emanuel Ornelas, �Does Re-
gionalism A¤ect Trade Liberalization toward Non-Members?,�World Bank Policy
Research Working Paper No. 4751, 2008.
Ethier, Wilfred J., �Regionalism in a multilateral world,�The Journal of Political
Economy, 1998, 106 (6), 1214�45.
Folsom, Ralph H., �Bilateral Free Trade Agreements: A Crucial Assessment and
WTO Regulatory Reform Proposal,� Legal Studies Research Paper Series, Re-
search Paper No. 08-070, 2008.
Foroutan, Faezeh, �Does membership in a regional preferential trade agreement
make a country more or less protectionist?,�The World Bank, Policy Research
Working Paper No. 1898, 1998.
Godfrey, L. G., ed., Misspeci�cation tests in Econometrics, Cambridge: Cam-
bridge University Press, 1988.
27
Granger, C. W. J., �Investigating Causal Relations by Econometric Models and
Cross Spectral Analysis,�Econometrica, 1969, 37 (3), 424�438.
Hamilton, J., ed., Time Series Analysis, Chichester, West Sussex: Princeton
University Press, 1994.
Helpman, Elhanan and Paul Krugman, �Market Structure and foreign trade,�
Cambridge, MA: MIT Press, 1985.
Henderson, Daniel and Daniel Millimet, �Is Gravity Linear?,�Journal of Ap-
plied Econometrics, 2008, 23 (2), 137�72.
Heston, Alan, Robert Summers, and Bettina Aten, eds, Pennn World Table
Version 6.2, University of Pennsylvania: Center for International Comparisons of
Production, Income and Prices at the University of Pennsylvania, 2006.
Hoekman, Bernard and Calgar Özden, �Trade Preferences and Di¤erential
Treatment of Developing Countries,�World Bank Policy Research Working Paper
No. 3566, 2005.
Holmes, Tammy, �What drives regional trade agreements that work?,� Grad-
uate Institute of International Studies, Geneva, 2005, (HEI Working Paper No
07/2005).
IMF, ed., Direction of Trade Statistics, Washington, D.C.: International Monetary
Fund, 2007.
, ed., Direction of Trade Statistics Historical, Washington, D.C.: International
Monetary Fund, 2007.
, ed., International Financial Statistics, Washington, D.C.: International Mone-
tary Fund, 2008.
Jarque, C. M. and A. K. Bera, �A test for normality of observations and re-
gression residuals,�International Statistical Review, 1987, 55, 163�72.
28
Karacaovali, Baybars and Nuno Limao, �The clash of liberalizations: Pref-
erential vs. multilateral trade liberalization in the European Union,�Journal of
International Economics, 2008, 74, 299�327.
KOF, �KOF Index of Globalization 2009,�KOF Swiss Economic Institute, Eid-
genössische Technische Hochschule (ETH), Zürich, 2009.
Krueger, Anne, �Free trade agreements versus customs unions,�NBER Working
Paper No. 5084, 1995.
Limao, Nuno, �Preferential Trade Agreements as Stumbling Blocks for Multilat-
eral Trade Liberalization: Evidence for the US,� American Economic Review,
2006, 96 (3), 896�914.
, �Are preferential trade agreements with non-trade objectives a stumbling block
for multilateral liberalization?,�The Review of Economic Studies, 2007, 74 (3),
821�55.
Ljung, G. M. and G. E. P. Box, �On a measure of lack of �t in time-series
models,�Biometrica, 1978, 65, 297�303.
Lomnicki, Z. A., �Tests for departure from normality in the case of linear stochas-
tic processes,�Metrica, 1961, 4, 37�62.
Lütkepohl, Helmut and Markus Kätzig, eds, Applied Time Series Economet-
rics, Cambridge: Cambridge University Press, 2004.
Maddison, Angus, �World Population, GDP and Per Capita GDP, 1-2003 AD,�
http://www.ggdc.net/maddison/, 2008.
Magee, P. and H. L. Lee, �Endogenous tari¤ creation and tari¤ diversion in a
customs union,�European Economic Review, 2001, 45 (3), 495�518.
Marshall, Monty G. and Keith Jaggers, �Political Regime Characteristics
and Transitions, 1800-2007,� Polity IV Project, Center for Systemic Peace,
www.systemicpeace.org, 2009.
29
Martínez-Zarzoso, Inmaculada, Felicitas Nowak-Lehmann, and Sebastian
Vollmer, �The Log of Gravity Revisited,�Center for European Governance and
Economic Development Research (CEGE), University of Göttingen, Discussion
Paper No. 64, 2006.
McGill, �PTAs - Preferential Trade Agreements Database,� McGill University,
Montreal, Canada, http://ptas.mcgill.ca/, 2009.
Paiva, Paulo and Ricardo Gazel, �Mercosur: past, present, and future,�Eco-
nomics Department, Universidade Federal de Minas Gerais (Brazil), in its journal
Nova Economia, 2003, 13 (2), 115�36.
Panagariya, Arvind, �The Regionalism Debate: An Overview,�The World Econ-
omy, 1999, 22 (4), 477�512.
Pomfret, Richard, �Regional Trade Agreements,�in Michele Fratianni and Alan
Rugman, eds., Regional Economic Integration, Amsterdam, Bosten, etc.: Elsevier,
2006.
, �Is Regionalism an Increasing Feature of the World Economy?,� The World
Economy, 2007, 30 (6), 923�47.
Santos Silva, J. M. C. and Silvana Tenreyro, �The Log of Gravity,�Review
of Economics and Statistics, 2006, 88 (4), 641�58.
Siliverstovs, Boriss and Dieter Schumacher, �Estimating Gravity Equations:
To Log or not to Log?,�Empirical Economics, 2009, 36 (3), 645�69.
Subramanian, Arvind and Shang-Jin Wei, �The WTO Promotes Trade,
Strongly but Unevenly,�Journal of International Economics, 2007, 72 (1), 151�
75.
Summers, Lawrence, �Regionalism and the World Trading System,�Symposium
sponsored by the Federal Reserve Bank of Kansas City, �Policy Implications of
Trade and Currency Zones�, 1991.
30
Tomz, Michael, Judith Goldstein, and Douglas Rivers, �Do We Really Know
That the WTO Increases Trade? Comment,�American Economic Review, 2007,
97 (5), 2005�18.
Trejos, Alberto, �Bilateral and Regional Free Trade Agreements, and Their Re-
lationship with the WTO and the Doha Development Agenda,�Global Economy
Journal, 2005, 5 (4), Article 18.
UNCTAD, �About GSP,�United Nations Conference on Trade and Development,
2008, http://www.unctad.org.
, ed., Operation and E¤ects of the Generalized System of Preferences. Reviews
1-10, Geneva: United Nations Conference on Trade and Development, 1973-1986.
, ed., Generalized System of Preferences List of Bene�ciaries, Geneva: United
Nations Conference on Trade and Development, 2001.
, ed., Generalized System of Preferences List of Bene�ciaries, Geneva: United
Nations Conference on Trade and Development, 2005.
Verbeek, Marno, ed., A Guide to Modern Econometrics, 3rd ed., Chichester:
John Wiley and Sons, Ltd., 2008.
Viner, Jacob, ed., The Customs Union Issue, New York: Carnegie Endowment
for International Peace, 1950.
Westerlund, Joakim and Fredrik Wilhelmsson, �Estimating the gravity model
without gravity using panel data,�Applied Economics, 2009, 41.
Winkelmann, Rainer, ed., Econometric Analysis of Count Data, 5th ed., Berlin,
Heidelberg: Springer, 2008.
World Bank, ed.,World Development Indicators, Washington, D.C.: World Bank,
2007.
WTO, �The GATT years: from Havana to Marrakesh,�World Trade Organization,
http://www.wto.org/english/thewto_e/whatis_e/tif_e/fact4_e.htm, 2007.
31
, �The 128 countries that had signed GATT by 1994,�World Trade Organization,
http://www.wto.org/English/thewto_e/gattmem_e.htm, 2009.
, �Members and Observers,� World Trade Organization,
http://www.wto.org/English/thewto_e/whatis_e/tif_e/org6_e.htm, 2009.
, �Regional trade agreements,� World Trade Organization,
http://www.wto.org/english/tratop_e/region_e/region_e.htm, 2009.
Yu, Miaojie, �Trade, Democracy, and the Gravity Equation,�China Center for
Economic Research (CCER), Peking University, Working Paper, 2007.
32
A Appendix
The control variables of the gravity model Xijt are de�ned as follows: Importer in
GATT/WTO (exporter in GATT/WTO) equals to one if only the importing (ex-
porting) country is a GATT/WTO member. GSP-recipient-exports (GSP-donor-
exports) accounts for a bilateral relationship under the Generalized System of Pref-
erences and is de�ned as one if the exporting (importing) country is granted the
GSP scheme from the importing (exporting) country. Importer in RTA (exporter in
RTA) is one for a pair of trading countries if only the importing (exporting) country
participates in a regional trade agreement. Log real GDP represents the economic
size of the trading partners measured as GDP in real terms. Log real GDPPC de-
notes real GDP per capita which can be interpreted as the capital-labour ratio. Log
RER depicts the logarithm of the bilateral real exchange rate de�ned in price nota-
tion. Currently colonized is de�ned as one if a country is currently colonized by its
trading partner. Polity is a measure for the polity regime and is scaled from +10
(strongly democratic) to -10 (strongly autocratic). Note that we do not include any
time-invariant variables as these drop out due to the �xed e¤ects estimation which
has emerged as the preferred model.
33
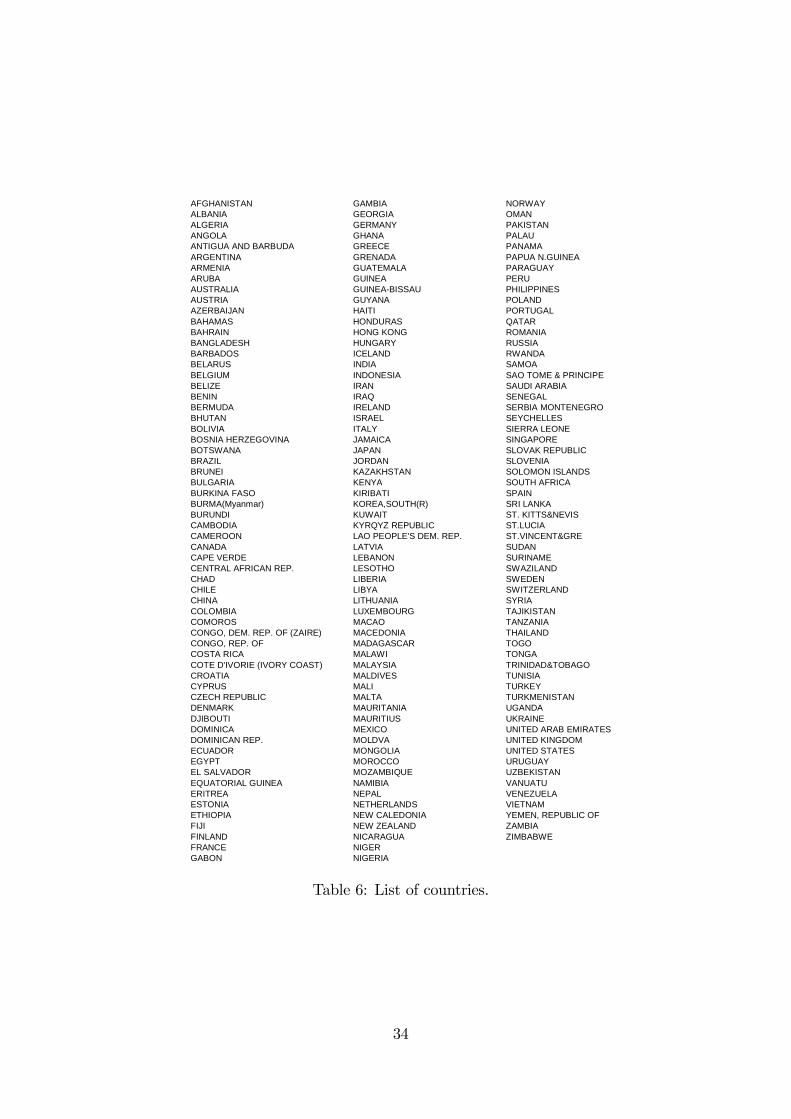
AFGHANISTAN GAMBIA NORWAYALBANIA GEORGIA OMANALGERIA GERMANY PAKISTANANGOLA GHANA PALAUANTIGUA AND BARBUDA GREECE PANAMAARGENTINA GRENADA PAPUA N.GUINEAARMENIA GUATEMALA PARAGUAYARUBA GUINEA PERUAUSTRALIA GUINEABISSAU PHILIPPINESAUSTRIA GUYANA POLANDAZERBAIJAN HAITI PORTUGALBAHAMAS HONDURAS QATARBAHRAIN HONG KONG ROMANIABANGLADESH HUNGARY RUSSIABARBADOS ICELAND RWANDABELARUS INDIA SAMOABELGIUM INDONESIA SAO TOME & PRINCIPEBELIZE IRAN SAUDI ARABIABENIN IRAQ SENEGALBERMUDA IRELAND SERBIA MONTENEGROBHUTAN ISRAEL SEYCHELLESBOLIVIA ITALY SIERRA LEONEBOSNIA HERZEGOVINA JAMAICA SINGAPOREBOTSWANA JAPAN SLOVAK REPUBLICBRAZIL JORDAN SLOVENIABRUNEI KAZAKHSTAN SOLOMON ISLANDSBULGARIA KENYA SOUTH AFRICABURKINA FASO KIRIBATI SPAINBURMA(Myanmar) KOREA,SOUTH(R) SRI LANKABURUNDI KUWAIT ST. KITTS&NEVISCAMBODIA KYRQYZ REPUBLIC ST.LUCIACAMEROON LAO PEOPLE'S DEM. REP. ST.VINCENT&GRECANADA LATVIA SUDANCAPE VERDE LEBANON SURINAMECENTRAL AFRICAN REP. LESOTHO SWAZILANDCHAD LIBERIA SWEDENCHILE LIBYA SWITZERLANDCHINA LITHUANIA SYRIACOLOMBIA LUXEMBOURG TAJIKISTANCOMOROS MACAO TANZANIACONGO, DEM. REP. OF (ZAIRE) MACEDONIA THAILANDCONGO, REP. OF MADAGASCAR TOGOCOSTA RICA MALAWI TONGACOTE D'IVORIE (IVORY COAST) MALAYSIA TRINIDAD&TOBAGOCROATIA MALDIVES TUNISIACYPRUS MALI TURKEYCZECH REPUBLIC MALTA TURKMENISTANDENMARK MAURITANIA UGANDADJIBOUTI MAURITIUS UKRAINEDOMINICA MEXICO UNITED ARAB EMIRATESDOMINICAN REP. MOLDVA UNITED KINGDOMECUADOR MONGOLIA UNITED STATESEGYPT MOROCCO URUGUAYEL SALVADOR MOZAMBIQUE UZBEKISTANEQUATORIAL GUINEA NAMIBIA VANUATUERITREA NEPAL VENEZUELAESTONIA NETHERLANDS VIETNAMETHIOPIA NEW CALEDONIA YEMEN, REPUBLIC OFFIJI NEW ZEALAND ZAMBIAFINLAND NICARAGUA ZIMBABWEFRANCE NIGERGABON NIGERIA
Table 6: List of countries.
34
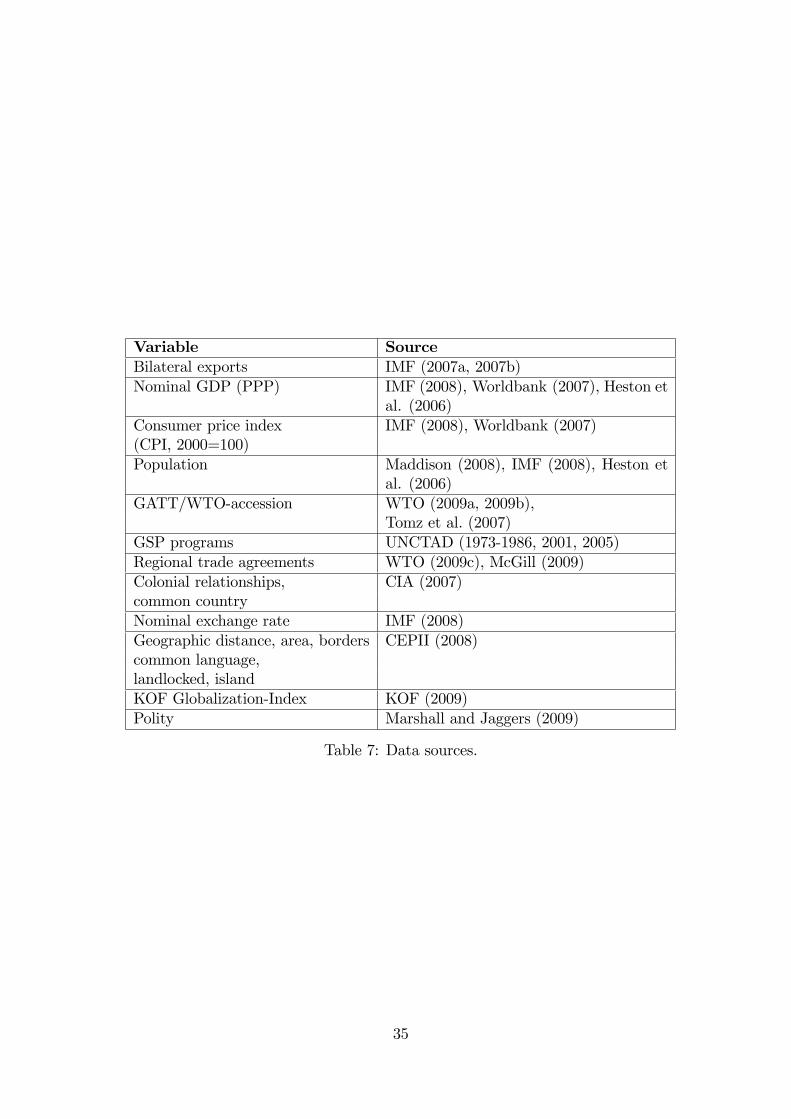
Variable SourceBilateral exports IMF (2007a, 2007b)Nominal GDP (PPP) IMF (2008), Worldbank (2007), Heston et
al. (2006)Consumer price index IMF (2008), Worldbank (2007)(CPI, 2000=100)Population Maddison (2008), IMF (2008), Heston et
al. (2006)GATT/WTO-accession WTO (2009a, 2009b),
Tomz et al. (2007)GSP programs UNCTAD (1973-1986, 2001, 2005)Regional trade agreements WTO (2009c), McGill (2009)Colonial relationships, CIA (2007)common countryNominal exchange rate IMF (2008)Geographic distance, area, borders CEPII (2008)common language,landlocked, islandKOF Globalization-Index KOF (2009)Polity Marshall and Jaggers (2009)
Table 7: Data sources.
35
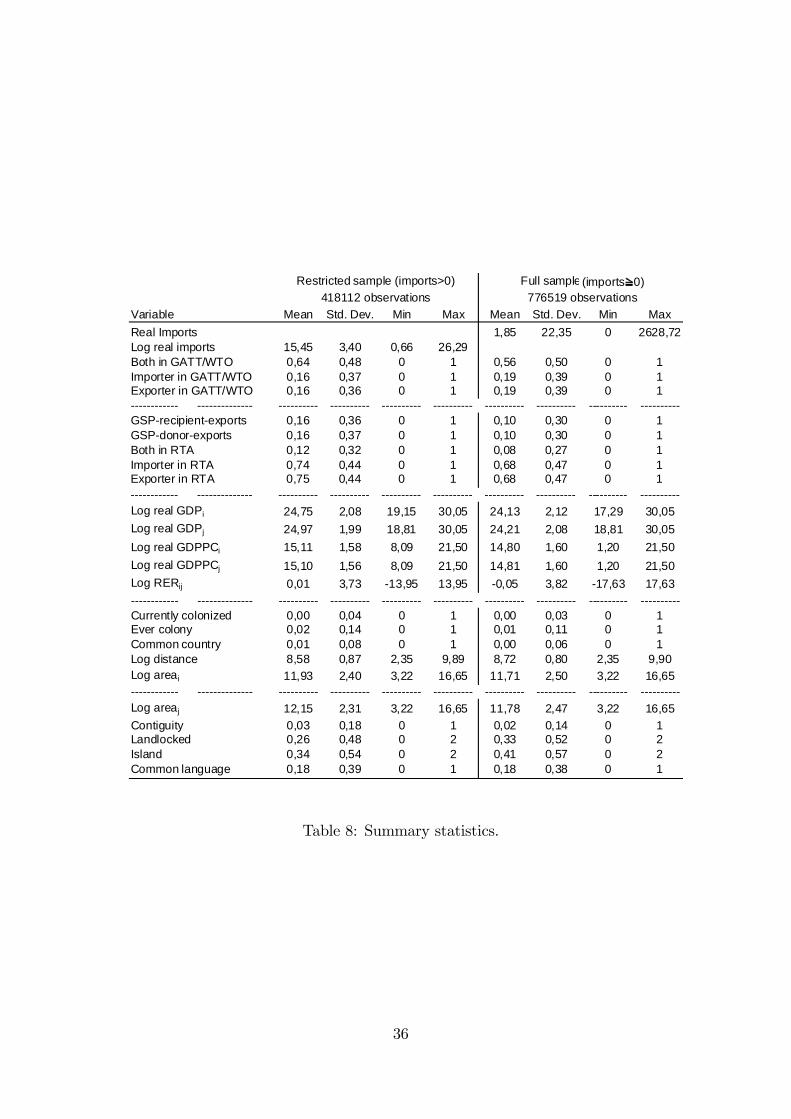
Variable Mean Std. Dev. Min Max Mean Std. Dev. Min MaxReal Imports 1,85 22,35 0 2628,72Log real imports 15,45 3,40 0,66 26,29Both in GATT/WTO 0,64 0,48 0 1 0,56 0,50 0 1Importer in GATT/WTO 0,16 0,37 0 1 0,19 0,39 0 1Exporter in GATT/WTO 0,16 0,36 0 1 0,19 0,39 0 1 GSPrecipientexports 0,16 0,36 0 1 0,10 0,30 0 1GSPdonorexports 0,16 0,37 0 1 0,10 0,30 0 1Both in RTA 0,12 0,32 0 1 0,08 0,27 0 1Importer in RTA 0,74 0,44 0 1 0,68 0,47 0 1Exporter in RTA 0,75 0,44 0 1 0,68 0,47 0 1 Log real GDPi 24,75 2,08 19,15 30,05 24,13 2,12 17,29 30,05Log real GDPj 24,97 1,99 18,81 30,05 24,21 2,08 18,81 30,05Log real GDPPCi 15,11 1,58 8,09 21,50 14,80 1,60 1,20 21,50Log real GDPPCj 15,10 1,56 8,09 21,50 14,81 1,60 1,20 21,50Log RERij 0,01 3,73 13,95 13,95 0,05 3,82 17,63 17,63 Currently colonized 0,00 0,04 0 1 0,00 0,03 0 1Ever colony 0,02 0,14 0 1 0,01 0,11 0 1Common country 0,01 0,08 0 1 0,00 0,06 0 1Log distance 8,58 0,87 2,35 9,89 8,72 0,80 2,35 9,90Log areai 11,93 2,40 3,22 16,65 11,71 2,50 3,22 16,65 Log areaj 12,15 2,31 3,22 16,65 11,78 2,47 3,22 16,65Contiguity 0,03 0,18 0 1 0,02 0,14 0 1Landlocked 0,26 0,48 0 2 0,33 0,52 0 2Island 0,34 0,54 0 2 0,41 0,57 0 2Common language 0,18 0,39 0 1 0,18 0,38 0 1
418112 observationsRestricted sample (imports>0) Full sample (imports?0)
776519 observations(imports 0)
Table 8: Summary statistics.
36

Dependent Variable:Real imports ij Coef. S. E. Coef. S. E.
Importer in GATT/WTO 0.26*** 0.02 … c ontinued …Ex porter in GATT/W TO 0.25*** 0.02 Both in GATT/W TO 1998 0.80*** 0.03GSPrecipientex ports 0.12*** 0.01 Both in GATT/W TO 1999 0.80*** 0.03GSPdonorexports 0.10*** 0.01 Both in GATT/W TO 2000 0.71*** 0.03Importer in RTA 0.05*** 0.00 Both in GATT/W TO 2001 0.85*** 0.03Ex porter in RTA 0.04*** 0.00 Both in GATT/W TO 2002 0.82*** 0.03Log real GDPi 0.50*** 0.01 Both in GATT/W TO 2003 0.75*** 0.03
Log real GDPj 0.71*** 0.01 Both in GATT/W TO 2004 0.64*** 0.03Log real GDPPCi 0.23*** 0.01 Both in GATT/W TO 2005 0.52*** 0.03
Log real GDPPCj 0.45*** 0.01 Both in GATT/W TO 2006 0.46*** 0.10
Log RER ij 0.13*** 0.01 Both in RTA 1957 0.33*** 0.05Currently c olonized 0.74*** 0.07 Both in RTA 1958 0.25*** 0.05Polity i 0.01*** 0.00 Both in RTA 1959 0.15*** 0.05
Polity j 0.01*** 0.00 Both in RTA 1960 0.14*** 0.03Both in GATT/W TO 1953 0.20*** 0.06 Both in RTA 1961 0.11*** 0.03Both in GATT/W TO 1954 0.23*** 0.05 Both in RTA 1962 0.10*** 0.03Both in GATT/W TO 1955 0.30*** 0.05 Both in RTA 1963 0.01 0.03Both in GATT/W TO 1956 0.32*** 0.05 Both in RTA 1964 0.01 0.03Both in GATT/W TO 1957 0.31*** 0.04 Both in RTA 1965 0.00 0.03Both in GATT/W TO 1958 0.27*** 0.05 Both in RTA 1966 0.01 0.03Both in GATT/W TO 1959 0.35*** 0.05 Both in RTA 1967 0.02 0.02Both in GATT/W TO 1960 0.62*** 0.04 Both in RTA 1968 0.02 0.02Both in GATT/W TO 1961 0.60*** 0.04 Both in RTA 1969 0.11*** 0.02Both in GATT/W TO 1962 0.60*** 0.04 Both in RTA 1970 0.06*** 0.02Both in GATT/W TO 1963 0.55*** 0.04 Both in RTA 1971 0.08*** 0.02Both in GATT/W TO 1964 0.58*** 0.04 Both in RTA 1972 0.11*** 0.02Both in GATT/W TO 1965 0.61*** 0.04 Both in RTA 1973 0.10*** 0.02Both in GATT/W TO 1966 0.59*** 0.04 Both in RTA 1974 0.05*** 0.02Both in GATT/W TO 1967 0.57*** 0.04 Both in RTA 1975 0.04*** 0.02Both in GATT/W TO 1968 0.62*** 0.04 Both in RTA 1976 0.08*** 0.02Both in GATT/W TO 1969 0.61*** 0.04 Both in RTA 1977 0.07*** 0.01Both in GATT/W TO 1970 0.73*** 0.04 Both in RTA 1978 0.12*** 0.01Both in GATT/W TO 1971 0.75*** 0.03 Both in RTA 1979 0.15*** 0.01Both in GATT/W TO 1972 0.76*** 0.03 Both in RTA 1980 0.12*** 0.01Both in GATT/W TO 1973 0.69*** 0.03 Both in RTA 1981 0.07*** 0.01Both in GATT/W TO 1974 0.57*** 0.03 Both in RTA 1982 0.13*** 0.01Both in GATT/W TO 1975 0.46*** 0.03 Both in RTA 1983 0.17*** 0.01Both in GATT/W TO 1976 0.45*** 0.03 Both in RTA 1984 0.12*** 0.01Both in GATT/W TO 1977 0.48*** 0.03 Both in RTA 1985 0.17*** 0.01Both in GATT/W TO 1978 0.56*** 0.03 Both in RTA 1986 0.19*** 0.01Both in GATT/W TO 1979 0.59*** 0.03 Both in RTA 1987 0.25*** 0.01Both in GATT/W TO 1980 0.51*** 0.03 Both in RTA 1988 0.23*** 0.01Both in GATT/W TO 1981 0.43*** 0.03 Both in RTA 1989 0.33*** 0.01Both in GATT/W TO 1982 0.42*** 0.03 Both in RTA 1990 0.31*** 0.01Both in GATT/W TO 1983 0.49*** 0.03 Both in RTA 1991 0.29*** 0.01Both in GATT/W TO 1984 0.62*** 0.03 Both in RTA 1992 0.28*** 0.01Both in GATT/W TO 1985 0.66*** 0.03 Both in RTA 1993 0.26*** 0.01Both in GATT/W TO 1986 0.81*** 0.03 Both in RTA 1994 0.30*** 0.01Both in GATT/W TO 1987 0.83*** 0.03 Both in RTA 1995 0.31*** 0.01Both in GATT/W TO 1988 0.89*** 0.03 Both in RTA 1996 0.30*** 0.01Both in GATT/W TO 1989 0.74*** 0.03 Both in RTA 1997 0.27*** 0.01Both in GATT/W TO 1990 0.74*** 0.03 Both in RTA 1998 0.27*** 0.01Both in GATT/W TO 1991 0.75*** 0.03 Both in RTA 1999 0.30*** 0.01Both in GATT/W TO 1992 0.73*** 0.03 Both in RTA 2000 0.29*** 0.01Both in GATT/W TO 1993 0.63*** 0.03 Both in RTA 2001 0.24*** 0.01Both in GATT/W TO 1994 0.66*** 0.03 Both in RTA 2002 0.24*** 0.01Both in GATT/W TO 1995 0.68*** 0.03 Both in RTA 2003 0.21*** 0.01Both in GATT/W TO 1996 0.70*** 0.03 Both in RTA 2004 0.26*** 0.01Both in GATT/W TO 1997 0.74*** 0.03 Both in RTA 2005 0.26*** 0.01… to be continued … Both in RTA 2006 0.35*** 0.01No. of observations 340415No. of country pairs 16482Waldstatistic 510323.71Log likel ihood 284063.38*** denotes significance on 1%level , ** 5%level, * 10%level.Al l estimations enclos e y ear and c ountrypair dummies. Constants are not reported.
FEPML (imports>0)
Table 9: Gravity model estimation; FE-PML intensive margin.
37
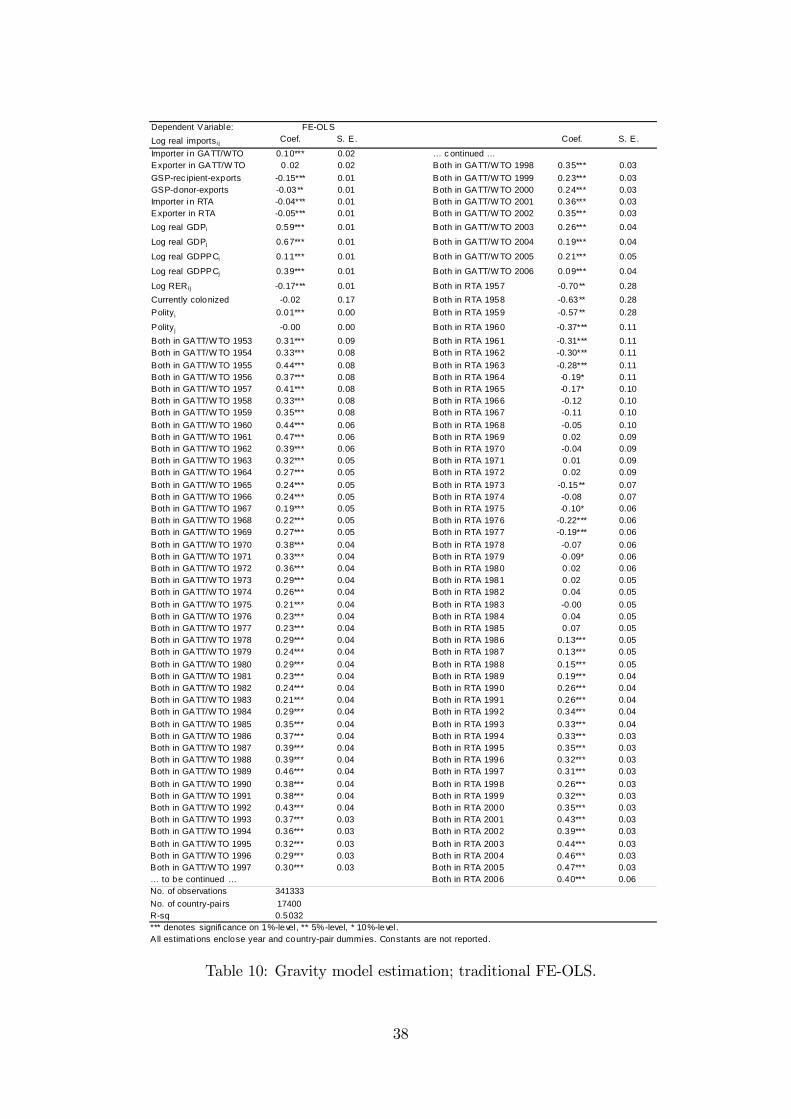
Dependent Variable:Log real imports i j Coef. S. E. Coef. S. E.
Importer in GATT/WTO 0.10*** 0.02 … c ontinued …Exporter in GATT/W TO 0.02 0.02 Both in GATT/W TO 1998 0.35*** 0.03GSPrec ipientexports 0.15*** 0.01 Both in GATT/W TO 1999 0.23*** 0.03GSPdonorexports 0.03** 0.01 Both in GATT/W TO 2000 0.24*** 0.03Importer in RTA 0.04*** 0.01 Both in GATT/W TO 2001 0.36*** 0.03Exporter in RTA 0.05*** 0.01 Both in GATT/W TO 2002 0.35*** 0.03Log real GDPi 0.59*** 0.01 Both in GATT/W TO 2003 0.26*** 0.04
Log real GDPj 0.67*** 0.01 Both in GATT/W TO 2004 0.19*** 0.04
Log real GDPPCi 0.11*** 0.01 Both in GATT/W TO 2005 0.21*** 0.05
Log real GDPPCj 0.39*** 0.01 Both in GATT/W TO 2006 0.09*** 0.04
Log RER i j 0.17*** 0.01 Both in RTA 1957 0.70** 0.28Currently colonized 0.02 0.17 Both in RTA 1958 0.63** 0.28Polity i 0.01*** 0.00 Both in RTA 1959 0.57** 0.28
Polity j 0.00 0.00 Both in RTA 1960 0.37*** 0.11Both in GATT/W TO 1953 0.31*** 0.09 Both in RTA 1961 0.31*** 0.11Both in GATT/W TO 1954 0.33*** 0.08 Both in RTA 1962 0.30*** 0.11Both in GATT/W TO 1955 0.44*** 0.08 Both in RTA 1963 0.28*** 0.11Both in GATT/W TO 1956 0.37*** 0.08 Both in RTA 1964 0.19* 0.11Both in GATT/W TO 1957 0.41*** 0.08 Both in RTA 1965 0.17* 0.10Both in GATT/W TO 1958 0.33*** 0.08 Both in RTA 1966 0.12 0.10Both in GATT/W TO 1959 0.35*** 0.08 Both in RTA 1967 0.11 0.10Both in GATT/W TO 1960 0.44*** 0.06 Both in RTA 1968 0.05 0.10Both in GATT/W TO 1961 0.47*** 0.06 Both in RTA 1969 0.02 0.09Both in GATT/W TO 1962 0.39*** 0.06 Both in RTA 1970 0.04 0.09Both in GATT/W TO 1963 0.32*** 0.05 Both in RTA 1971 0.01 0.09Both in GATT/W TO 1964 0.27*** 0.05 Both in RTA 1972 0.02 0.09Both in GATT/W TO 1965 0.24*** 0.05 Both in RTA 1973 0.15** 0.07Both in GATT/W TO 1966 0.24*** 0.05 Both in RTA 1974 0.08 0.07Both in GATT/W TO 1967 0.19*** 0.05 Both in RTA 1975 0.10* 0.06Both in GATT/W TO 1968 0.22*** 0.05 Both in RTA 1976 0.22*** 0.06Both in GATT/W TO 1969 0.27*** 0.05 Both in RTA 1977 0.19*** 0.06Both in GATT/W TO 1970 0.38*** 0.04 Both in RTA 1978 0.07 0.06Both in GATT/W TO 1971 0.33*** 0.04 Both in RTA 1979 0.09* 0.06Both in GATT/W TO 1972 0.36*** 0.04 Both in RTA 1980 0.02 0.06Both in GATT/W TO 1973 0.29*** 0.04 Both in RTA 1981 0.02 0.05Both in GATT/W TO 1974 0.26*** 0.04 Both in RTA 1982 0.04 0.05Both in GATT/W TO 1975 0.21*** 0.04 Both in RTA 1983 0.00 0.05Both in GATT/W TO 1976 0.23*** 0.04 Both in RTA 1984 0.04 0.05Both in GATT/W TO 1977 0.23*** 0.04 Both in RTA 1985 0.07 0.05Both in GATT/W TO 1978 0.29*** 0.04 Both in RTA 1986 0.13*** 0.05Both in GATT/W TO 1979 0.24*** 0.04 Both in RTA 1987 0.13*** 0.05Both in GATT/W TO 1980 0.29*** 0.04 Both in RTA 1988 0.15*** 0.05Both in GATT/W TO 1981 0.23*** 0.04 Both in RTA 1989 0.19*** 0.04Both in GATT/W TO 1982 0.24*** 0.04 Both in RTA 1990 0.26*** 0.04Both in GATT/W TO 1983 0.21*** 0.04 Both in RTA 1991 0.26*** 0.04Both in GATT/W TO 1984 0.29*** 0.04 Both in RTA 1992 0.34*** 0.04Both in GATT/W TO 1985 0.35*** 0.04 Both in RTA 1993 0.33*** 0.04Both in GATT/W TO 1986 0.37*** 0.04 Both in RTA 1994 0.33*** 0.03Both in GATT/W TO 1987 0.39*** 0.04 Both in RTA 1995 0.35*** 0.03Both in GATT/W TO 1988 0.39*** 0.04 Both in RTA 1996 0.32*** 0.03Both in GATT/W TO 1989 0.46*** 0.04 Both in RTA 1997 0.31*** 0.03Both in GATT/W TO 1990 0.38*** 0.04 Both in RTA 1998 0.26*** 0.03Both in GATT/W TO 1991 0.38*** 0.04 Both in RTA 1999 0.32*** 0.03Both in GATT/W TO 1992 0.43*** 0.04 Both in RTA 2000 0.35*** 0.03Both in GATT/W TO 1993 0.37*** 0.03 Both in RTA 2001 0.43*** 0.03Both in GATT/W TO 1994 0.36*** 0.03 Both in RTA 2002 0.39*** 0.03Both in GATT/W TO 1995 0.32*** 0.03 Both in RTA 2003 0.44*** 0.03Both in GATT/W TO 1996 0.29*** 0.03 Both in RTA 2004 0.46*** 0.03Both in GATT/W TO 1997 0.30*** 0.03 Both in RTA 2005 0.47*** 0.03… to be continued … Both in RTA 2006 0.40*** 0.06No. of observations 341333No. of countrypai rs 17400Rsq 0.5032*** denotes significance on 1%level , ** 5%level, * 10%level .A ll estimations enclose year and countrypair dummies. Constants are not reported.
FEOLS
Table 10: Gravity model estimation; traditional FE-OLS.
38
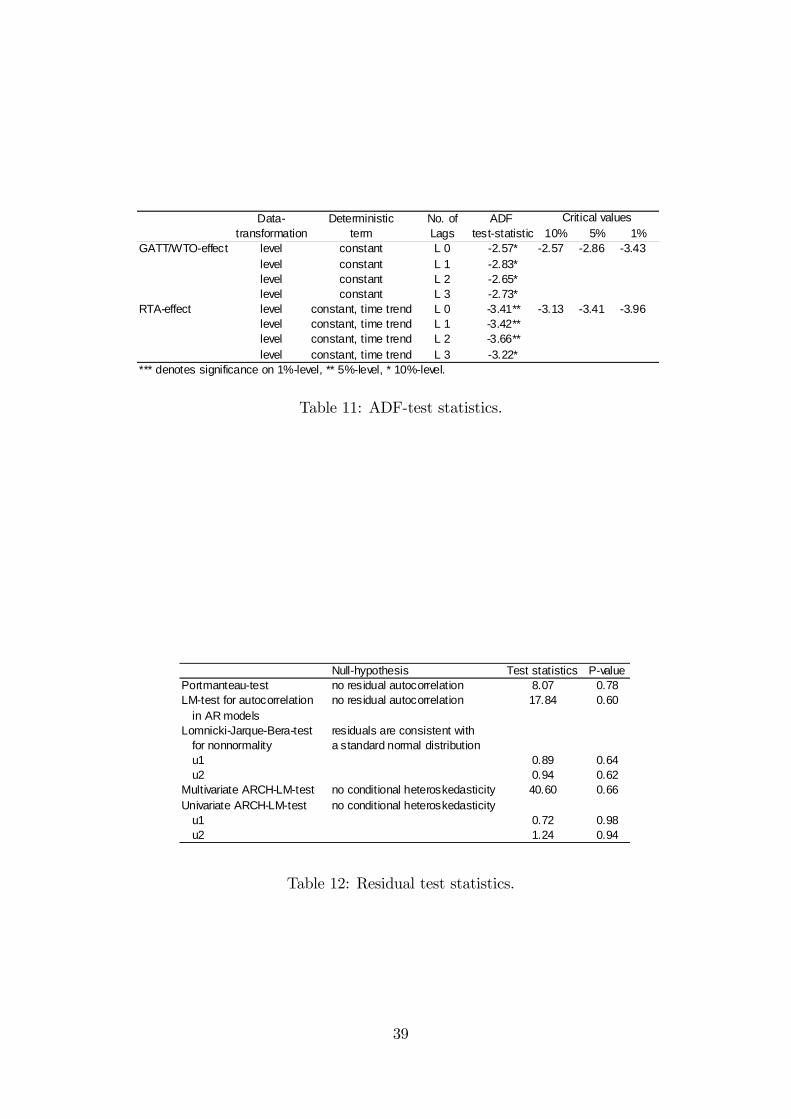
Data Deterministic No. of ADFtransformation term Lags teststatistic 10% 5% 1%
GATT/WTOeffect level constant L 0 2.57* 2.57 2.86 3.43level constant L 1 2.83*level constant L 2 2.65*level constant L 3 2.73*
RTAeffect level constant, time trend L 0 3.41** 3.13 3.41 3.96level constant, time trend L 1 3.42**level constant, time trend L 2 3.66**level constant, time trend L 3 3.22*
*** denotes significance on 1%level, ** 5%level, * 10%level.
Critical values
Nullhypothesis Test statistics PvaluePortmanteautest no residual autocorrelation 8.07 0.78LMtest for autocorrelation in AR models
no residual autocorrelation 17.84 0.60
LomnickiJarqueBeratest for nonnormality
residuals are consistent witha standard normal distribution
u1 0.89 0.64 u2 0.94 0.62Multivariate ARCHLMtest no conditional heteroskedasticity 40.60 0.66Univariate ARCHLMtest no conditional heteroskedasticity u1 0.72 0.98 u2 1.24 0.94
Table 11: ADF-test statistics.
Data Deterministic No. of ADFtransformation term Lags teststatistic 10% 5% 1%
GATT/WTOeffect level constant L 0 2.57* 2.57 2.86 3.43level constant L 1 2.83*level constant L 2 2.65*level constant L 3 2.73*
RTAeffect level constant, time trend L 0 3.41** 3.13 3.41 3.96level constant, time trend L 1 3.42**level constant, time trend L 2 3.66**level constant, time trend L 3 3.22*
*** denotes significance on 1%level, ** 5%level, * 10%level.
Critical values
Nullhypothesis Test statistics PvaluePortmanteautest no residual autocorrelation 8.07 0.78LMtest for autocorrelation in AR models
no residual autocorrelation 17.84 0.60
LomnickiJarqueBeratest for nonnormality
residuals are consistent witha standard normal distribution
u1 0.89 0.64 u2 0.94 0.62Multivariate ARCHLMtest no conditional heteroskedasticity 40.60 0.66Univariate ARCHLMtest no conditional heteroskedasticity u1 0.72 0.98 u2 1.24 0.94
Table 12: Residual test statistics.
39
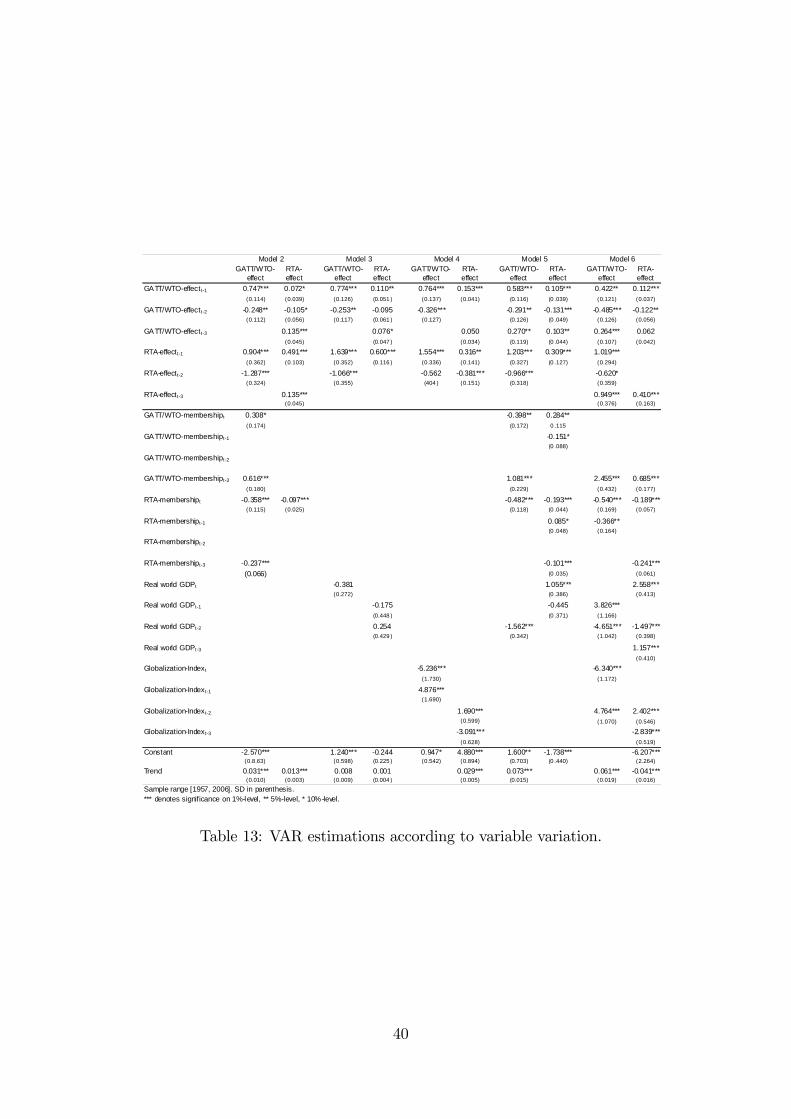
GATT/WTOeffect
RTAeffect
GATT/WTOeffect
RTAeffect
GATT/WTOeffect
RTAeffect
GATT/WTOeffect
RTAeffect
GATT/WTOeffect
RTAeffect
GATT/WTOeffect t1 0.747*** 0.072* 0.774*** 0.110** 0.764*** 0.153*** 0.583*** 0.105*** 0.422** 0.112***(0.114) (0.039) (0.126) (0.051 ) (0.137) (0.041) (0.116) (0 .039) (0.121) (0.037)
GATT/WTOeffect t2 0.248** 0.105* 0.253** 0.095 0.326*** 0.291** 0.131*** 0.485*** 0.122**(0.112) (0.056) (0.117) (0.061 ) (0.127) (0.126) (0 .049) (0.126) (0.056)
GATT/WTOeffect t3 0.135*** 0.076* 0.050 0.270** 0.103** 0.264*** 0.062(0.045) (0.047 ) (0.034) (0.119) (0 .044) (0.107) (0.042)
RTAeffect t1 0.904*** 0.491*** 1.639*** 0.600*** 1.554*** 0.316** 1.203*** 0.309*** 1.019***(0.362) (0.103) (0.352) (0.116 ) (0.336) (0.141) (0.327) (0 .127) (0.294)
RTAeffect t2 1.287*** 1.066*** 0.562 0.381*** 0.966*** 0.620*(0.324) (0.355) (404 ) (0.151) (0.318) (0.359)
RTAeffect t3 0.135*** 0.949*** 0.410***(0.045) (0.376) (0.163)
GATT/WTOmembershipt 0.308* 0.398** 0.284**(0.174) (0.172) 0 .115
GATT/WTOmembershipt1 0.151*(0 .088)
GATT/WTOmembershipt2
GATT/WTOmembershipt3 0.616*** 1.081*** 2.455*** 0.685***(0.180) (0.229) (0.432) (0.177)
RTAmembershipt 0.358*** 0.097*** 0.482*** 0.193*** 0.540*** 0.189***(0.115) (0.025) (0.118) (0 .044) (0.169) (0.057)
RTAmembershipt1 0.085* 0.366**(0 .048) (0.164)
RTAmembershipt2
RTAmembershipt3 0.237*** 0.101*** 0.241***(0.066) (0 .035) (0.061)
Real world GDPt 0.381 1.055*** 2.558***(0.272) (0 .386) (0.413)
Real world GDPt1 0.175 0.445 3.826***(0.448 ) (0 .371) (1.166)
Real world GDPt2 0.254 1.562*** 4.651*** 1.497***(0.429 ) (0.342) (1.042) (0.398)
Real world GDPt3 1.157***(0.410)
GlobalizationIndext 5.236*** 6.340***(1.730) (1.172)
GlobalizationIndext1 4.876***(1.690)
GlobalizationIndext2 1.690*** 4.764*** 2.402***(0.599) (1.070) (0.546)
GlobalizationIndext3 3.091*** 2.839***(0.628) (0.519)
Constant 2.570*** 1.240*** 0.244 0.947* 4.880*** 1.600** 1.738*** 6.207***(0.8.63) (0.598) (0.225 ) (0.542) (0.894) (0.703) (0 .440) (2.264)
Trend 0.031*** 0.013*** 0.008 0.001 0.029*** 0.073*** 0.061*** 0.041***(0.010) (0.003) (0.009) (0.004 ) (0.005) (0.015) (0.019) (0.016)
Sample range [1957, 2006]. SD in parenthesis.*** denotes significance on 1%level, ** 5%level, * 10%level.
Model 2 Model 3 Model 4 Model 6Model 5
Table 13: VAR estimations according to variable variation.
40

GATT/WTOeffect
RTAeffect
GATT/WTOeffect
RTAeffect
GATT/WTOeffect
RTAeffect
GATT/WTOeffect
RTAeffect
GATT/WTOeffect t1 0.805*** 0.48 0.805*** 0.54 0.879*** 0.100* 0.878*** 0.100*(0.126) (0.044) (0.125) (0.044) (0.137) (0.054) (0.141) (0.046)
GATT/WTOeffect t2 0.274** 0.045 0.195 0.109* 0.267** 0.163*** 0.279* 0.163**(0.119) (0.046) (0.121) (0.063) (0.135) (0.066) (0.146) (0.074)
GATT/WTOeffect t3 0.056 0.117*** 0.115**(0.045) (0.049) (0.056)
GATT/WTOeffect t4 0.075 0.075 0.067(0.090) (0.090) (0.102)
GATT/WTOeffect t5
GATT/WTOeffect t6 0.015(0.040)
RTAeffect t1 1.602*** 0.625*** 1.457*** 0.753*** 1.370*** 0.757*** 1.369*** 0.773***(0.358) (0.145) (0.352) (0.082) (0.356) (0.125) (0.362) (0.127)
RTAeffect t2 1.118*** 0.172 0.848*** 0.826** 0.792*(0.361) (0.133) (0.361) (0.361) (0.412)
RTAeffect t3
RTAeffect t4
RTAeffect t5 0.236** 0.271*(0.112) (0.147)
RTAeffect t6 0.045(0.297)
Constant 0.422*** 0.411*** 0.416*** 0.088* 0.409*** 0.103*(0.116) (0.135) (0.135) (0.047) (0.140) (0.062)
Trend 0.005 0.002** 0.005 0.002** 0.005 0.005*** 0.005 0.005***(0.003) (0.001) (0.003) (0.001) (0.003) (0.001) (0.004) (0.001)
*** denotes significance on 1%level, ** 5%level, * 10%level.Sample range [1957, 2006]. SD in parentheses.
Model 7 Model 8 Model 9 Model 10(Lag 2) (Lag 4) (Lag 5) (Lag 6)
Table 14: VAR estimations according to lag order variation.
41
Universität Bayreuth
Rechts- und Wirtschaftswissenschaftliche Fakultät
Wirtschaftswissenschaftliche Diskussionspapiere
Zuletzt erschienene Papiere:*
05-09 Erler, Alexander
Krizanac, Damir Taylor-Regel und Subprime-Krise – Eine empirische Analyse
der US-amerikanischen Geldpolitik
04-09 Woratschek, Herbert
Schafmeister, Guido
Schymetzki, Florian
International Ranking of Sport Management Journals
03-09 Schneider Udo
Zerth, Jürgen
Should I stay or should I go? On the relation between primary and
secondary prevention
02-09 Pfarr, Christian
Schneider Udo Angebotsinduzierung und Mitnahmeeffekt im Rahmen der Riester-
Rente. Eine empirische Analyse.
01-09 Schneider, Brit
Schneider Udo Willing to be healthy? On the health effects of smoking, drinking
and an unbalanced diet. A multivariate probit approach
03-08 Mookherjee, Dilip
Napel, Stefan
Ray, Debraj
Aspirations, Segregation and Occupational Choice
02-08 Schneider, Udo
Zerth, Jürgen
Improving Prevention Compliance through Appropriate
Incentives
01-08 Woratschek, Herbert
Brehm, Patrick
Kunz, Reinhard
International Marketing of the German Football Bundesliga -
Exporting a National Sport League to China
06-07 Bauer, Christian
Herz, Bernhard
Does it Pay to Defend? - The Dynamics of Financial Crises
05-07 Woratschek, Herbert
Horbel, Chris
Popp, Bastian
Roth, Stefan
A Videographic Analysis of "Weird Guys": What Do
Relationships Mean to Football Fans?
04-07 Schneider, Udo Demographie, Staatsfinanzen und die Systeme der Sozialen
Sicherung
03-07 Woratschek, Herbert
Schafmeister, Guido
The Export of National Sport Leagues
02-07 Woratschek, Herbert
Hannich, Frank M.
Ritchie, Brent
Motivations of Sports Tourists - An Empirical Analysis in
Several European Rock Climbing Regions
01-07 Herz, Bernhard
Wagner, Marco
Do the World Trade Organization and the Generalized System
of Preferences foster bilateral Trade?
* Weitere Diskussionspapiere finden Sie unter
http://www.fiwi.uni-bayreuth.de/de/research/Working_Paper_Series/index.html


![080605 Strauß Klimagerechte Räume [Kompatibilitätsmodus] · Wirtschaftswissenschaftliche Fakultät Institut für Stadtentwicklung und Bauwirtschaft Klima, Klimawandel Driving forces](https://img.pdfslide.org/doc/110x75/5d0c892c88c99379688b6629/080605-strauss-klimagerechte-raeume-kompatibilitaetsmodus-wirtschaftswissenschaftliche.jpg)