Embed Size (px)
Citation preview
Nanochemistry and Sensing
in Photonic Crystal Fibers
Photochemie und Spektroskopie im Nanoliter-Bereich
in Photonischen Kristallfasern
Der Naturwissenschaftlichen Fakultat
der Friedrich-Alexander-Universitat Erlangen-Nurnberg
zur
Erlangung des Doktorgrades Dr. rer. nat.
vorgelegt von
Jocelyn Ssu-Yin Chen
aus Taichung


Als Dissertation genehmigt von der Naturwissenschaftlichen Fakultat
der Friedrich-Alexander Universitat Erlangen-Nurnberg
Tag der mundlichen Prufung: 23 November 2010
Vorsitzender der Promotionskommission: Prof. Dr. Rainer Fink
Erstberichterstatter: Prof. Dr. Philip St.J. Russell
Zweitberichterstatter: Dr. Clemens F. Kaminski


For my family.

Zusammenfassung
Diese Arbeit handelt von Anwendungsmoglichkeiten photonischer Kristallfasern (PCF) im
Bereich der Photochemie und Spektroskopie im Nanoliter-Bereich. Photonische Kristall-
fasern haben die Fahigkeit, eine bestimmte Lichtmode uber sehr große Distanzen in
einem sehr kleinen Probe-Volumen zu fuhren. Diese einzigartige Eigenschaft photonischer
Kristallfasern erlaubt eine drastische Steigerung der erzielbaren Licht-Materie-Wechsel-
wirkung und ist Grundlage dieser Arbeit. Die Parameter, von denen optimale Bedingun-
gen fur Nachweisreaktionen sowie die Ausbeute photochemischer Reaktoren abhangen,
werden diskutiert. Außerdem werden verschiedene Verfahren zur Verwendung von PCF-
Sensoren in mikrofluidischen Systemen untersucht. Weiterhin wird ein hochgradig kon-
trollierbares photochemisches Reaktionsgefaß vorgestellt. Als prinzipieller Beweis seiner
Anwendbarkeit zur aktiven Herbeifuhrung und Beobachtung photochemischer Reaktionen
wird die Photolyse wassriger Cobalaminlosung im Kern einer PCF quantitativ gemessen.
Wegen der - fur diese Reaktion typischen - maßigen Quantenausbeute ware dies mit kon-
ventionellen Methoden schwierig oder unmoglich. Die dynamischen Vorgange wahrend
der aktiv herbeigefuhrten Reaktion konnten mittels Breitband-Absorptionsspektroskopie
in der Faser in Echtzeit aufgezeichnet werden. Die Ergebnisse wurden mit denen einer
herkommlichen Kuvettenmessung verglichen. Durch das verwendete Reaktionsgefaß kon-
nte das benotigte Probevolumen gegenuber konventionellen Techniken stark verkleinert
werden (in die Großenordnung von nL/cm). Die starke Licht-Materie-Wechselwirkung in
den mikrostrukturierten Fasern ermoglicht es, bei sehr niedrigen Lichtleistungen, kurzere
Reaktionszeiten zu erreichen. Weiterhin konnte das schnelle und reversible photoin-
duzierte Schalten eines Azobenzol-Derivats nachgewiesen und dadurch die Effizienz und
Reproduzierbarkeit des Reaktors bestatigt werden. Neben dem photochemischen Reaktor
wurde ein quantitativer breitbandiger Fasersensor entwickelt, basierend auf der Uberlap-
v
vi ZUSAMMENFASSUNG
pung evaneszenter Felder in den Mantellochern einer Vollkernfaser. Dabei wurde, trotz
des wesentlich verringerten Probevolumens, hervorragende ubereinstimmung mit dem
unter Verwendung einer gewohnlichen Kuvette erhaltenen Referenzspektrum festgestellt.
Zuletzt bieten PCF, neben großerer Licht-Materie-Wechselwirkung, auch ein großes Ober-
flachen-Volumen-Verhaltnis (∼ 105 m−1) fur Anwendungen, in denen Reaktionen mit
Oberflachengebundenen Probentypen von Interesse sind. Zu diesem Zweck wurden die
Selbstaggregation und das Photobleichen eines Thiazin-Farbstoffs in einer Index-leitenden
Faser mit “Mercedesstern”-Querschnitt untersucht. Durch Absorptionsspektroskopie an-
hand der evaneszenten Welle, die von der im Kern geleiteten Lichtmode in die Man-
tellocher der Faser ausstrahlt, konnte die Anzahl der, an der Oberflache der Faseradsor-
bierten, Molekule ermitteln werden.
Abstract
The work described in this thesis demonstrates the application of photonic crystal fibers
in nanochemistry and sensing. In the photonic crystal fiber, a well-defined optical mode
can propagate through a sample volume confined within the fiber’s microstructure over
very long distances. This property, unique to the photonic crystal fiber, offers greatly
enhanced figure of merit for light-matter interactions, and is the basis of this thesis. The
parameters governing the optimum sensing conditions and the figure of merit for photo-
chemical reactors are discussed and several fabrication techniques with the objective of
combining photonic crystal fiber sensors with microfluidics have also been investigated. A
highly-controlled photochemical reactor was proposed and demonstrated. As a proof-of-
principle for its application in actively inducing and monitoring photochemical reactions,
the photolysis of an aqueous cobalamin was quantitatively measured in a liquid-filled
hollow-core photonic crystal fiber. The reaction is characterized by modest quantum
yields which would otherwise be difficult or impossible to induce and monitor using con-
ventional methods. The dynamics of the actively induced reaction were monitored in
real-time by broadband absorption spectroscopy in the fiber. Results were compared to
those obtained using standard techniques in a cuvette. The reactor has greatly reduced
the sample volume requirement (in the order of nL/cm) compared to conventional tech-
niques. The strong light-matter interactions in the fiber microstructure allowed shorter
reaction times to be achieved at very low optical powers. Additionally, the fast and re-
versible photoswitching of an azobenzene derivative was demonstrated and confirmed the
effectiveness and reproducibility of the photochemical reactor. In addition to the photo-
chemical reactors, a quantitative broadband fiber sensor based on evanescent-field sensing
in the cladding holes of a suspended solid-core fiber was demonstrated. Excellent agree-
ment with the reference spectrum measured in a standard cuvette was obtained despite
vii

viii ABSTRACT
the much reduced sample volume used. Finally, in addition to enhancement in light-
matter interactions, the photonic crystal fiber also offers large surface-to-volume ratios
(∼ 105 m−1) for experiments in which reactions of surface-bound sample species are of
interest. To this end the self-aggregation and photobleaching of a thiazine dye was studied
in an index-guiding fiber with suspended solid core. It was shown that the amount of
molecules adsorbed onto the inner surfaces of the fiber could be obtained and monitored
by absorption spectroscopy via the evanescent wave of the core-guided mode that extends
into the cladding holes of the fiber.

Acknowledgments
This thesis would not have been possible without the scientific, technical and friendly
support from the following people:
Alexander Nazarkin Greg Pearce Myeong Soo Kang
Alexander Podlipensky Gustavo Wiederhecker Nicola Farrer
Amir Abdolvand Helga Hussy Nicolai Granzow
Amy Wan Hemant Tyagi Nicolas Joly
Andre Brenn Howard Lee Patrick Uebel
Andreas Walser Jerry Chen Pavel Marchenko
Aniruddha Ray Johannes Nold Peter Banzer
Anita Jones Konrad Heberlein Peter Sadler
Anna Butsch Lam Lee Philip Russell
Bastian Etzold Leonhard Heberlein Philipp Hoelzer
Bernhard Thomann Leyun Zang Ralf Keding
Bettina Schwender Luis Lorenzo Sanchez Soto Robert Fisher
Chris Poulton Luis Prill Sempere Robert Gall
Christine Kreuzer Marianne Heberlein Sarah Unterkofler
Christoph Heberlein Markus Schmidt Sebastian Stark
Daniel Ploß Marta Ziemienczuk Silke Rammler
Friedrich Heberlein Martin Butryn Stanislaw Dorschner
Gareth Williams Martin Garbos Thomas Spona
George Kakarantzas Matthias Schmidt Tijmen Euser
Gordon Wong Michael Scharrer Xin Jiang
Cheers, guys!
ix

Contents
Zusammenfassung v
Abstract vii
Acknowledgments ix
List of Figures xv
List of Tables xix
Abbreviations xxi
Preface xxiii
1 Photonic Crystal Fibers 1
1.1 Introduction . . . . . . . . . . . . . . . . . . . . . . . . . . . . . . . . . . . 1
1.2 Historical Overview . . . . . . . . . . . . . . . . . . . . . . . . . . . . . . . 2
1.3 Classification and Guidance Mechanisms . . . . . . . . . . . . . . . . . . . 4
1.3.1 Index-Guiding PCF . . . . . . . . . . . . . . . . . . . . . . . . . . . 5
1.3.2 Hollow-Core PCF . . . . . . . . . . . . . . . . . . . . . . . . . . . . 7
1.4 Fabrication . . . . . . . . . . . . . . . . . . . . . . . . . . . . . . . . . . . 9
1.5 Optical Sensing with PCF . . . . . . . . . . . . . . . . . . . . . . . . . . . 10
1.5.1 Index-Guiding PCF Sensors . . . . . . . . . . . . . . . . . . . . . . 11
1.5.2 Hollow-Core PCF Sensors . . . . . . . . . . . . . . . . . . . . . . . 13
2 Experimental Considerations and Techniques 15
2.1 Introduction . . . . . . . . . . . . . . . . . . . . . . . . . . . . . . . . . . . 15
xi
xii CONTENTS
2.2 Detection Strategies and Ideal Conditions . . . . . . . . . . . . . . . . . . 17
2.2.1 Ideal Conditions for Absorption-Based Sensors . . . . . . . . . . . . 17
2.2.2 Figure of Merit for Photochemistry . . . . . . . . . . . . . . . . . . 20
2.3 Experimental Setup and Instrumentation . . . . . . . . . . . . . . . . . . . 22
2.3.1 Transmission Properties of Liquid-Filled PCF . . . . . . . . . . . . 22
2.3.2 Microfluidic Flow in Confined Channels . . . . . . . . . . . . . . . . 25
2.3.3 Optical Setup . . . . . . . . . . . . . . . . . . . . . . . . . . . . . . 28
2.3.4 LabVIEW Automation . . . . . . . . . . . . . . . . . . . . . . . . . 32
2.4 Fabrication Techniques for PCF Devices . . . . . . . . . . . . . . . . . . . 32
2.4.1 Femtosecond Laser Ablation . . . . . . . . . . . . . . . . . . . . . . 32
2.4.2 Two-Photon Polymerization . . . . . . . . . . . . . . . . . . . . . . 38
2.4.3 Focused Ion Beam Micromachining . . . . . . . . . . . . . . . . . . 40
3 Photochemistry in PCF 43
3.1 Introduction . . . . . . . . . . . . . . . . . . . . . . . . . . . . . . . . . . . 43
3.2 Fiber Characteristics . . . . . . . . . . . . . . . . . . . . . . . . . . . . . . 44
3.3 Photolysis of Metal Complexes . . . . . . . . . . . . . . . . . . . . . . . . 49
3.3.1 Photoaquation of Cyanocobalamin . . . . . . . . . . . . . . . . . . 50
3.3.2 Experimental Results . . . . . . . . . . . . . . . . . . . . . . . . . . 51
3.3.3 Reaction Kinetics . . . . . . . . . . . . . . . . . . . . . . . . . . . . 53
3.3.4 Discussion . . . . . . . . . . . . . . . . . . . . . . . . . . . . . . . . 57
3.4 Photoswitching of Azobenzene Molecules . . . . . . . . . . . . . . . . . . . 57
3.4.1 Isomerization of Azo Dyes . . . . . . . . . . . . . . . . . . . . . . . 58
3.4.2 Reversible Isomerization in PCF . . . . . . . . . . . . . . . . . . . . 62
3.4.3 Reaction Kinetics . . . . . . . . . . . . . . . . . . . . . . . . . . . . 66
3.4.4 Discussion . . . . . . . . . . . . . . . . . . . . . . . . . . . . . . . . 67
4 Spectroscopy in PCF 69
4.1 Introduction . . . . . . . . . . . . . . . . . . . . . . . . . . . . . . . . . . . 69
4.2 Evanescent-Wave Sensing . . . . . . . . . . . . . . . . . . . . . . . . . . . . 70
4.2.1 Fiber Characteristics . . . . . . . . . . . . . . . . . . . . . . . . . . 70
4.2.2 Results . . . . . . . . . . . . . . . . . . . . . . . . . . . . . . . . . . 77
CONTENTS xiii
4.2.3 Discussion . . . . . . . . . . . . . . . . . . . . . . . . . . . . . . . . 79
4.3 Microscale Surface Chemistry . . . . . . . . . . . . . . . . . . . . . . . . . 79
4.3.1 Self-Aggregation and Photobleaching of Methylene Blue . . . . . . . 79
4.3.2 Discussion . . . . . . . . . . . . . . . . . . . . . . . . . . . . . . . . 87
5 Conclusions and Outlook 89
5.1 Optical Tweezers and Photodynamic Therapy . . . . . . . . . . . . . . . . 89
5.2 Microfluidic Flow Reactor . . . . . . . . . . . . . . . . . . . . . . . . . . . 90
5.3 Mass Spectrometry . . . . . . . . . . . . . . . . . . . . . . . . . . . . . . . 90
5.4 Surface Chemistry Using Higher-Order Modes . . . . . . . . . . . . . . . . 90
5.5 Final Remarks . . . . . . . . . . . . . . . . . . . . . . . . . . . . . . . . . . 91
A Counter-Propagating Pump-Probe Setup 93
List of Publications 97
Curriculum Vitae 121

List of Figures
1.1 Images showing the iridescence in the butterfly Morpho rhetenor and the
iridescent setae from polychaete worms. . . . . . . . . . . . . . . . . . . . . 3
1.2 Schematic illustration of the cross-section and the refractive index profile
for an index-guiding photonic crystal fiber. . . . . . . . . . . . . . . . . . . 5
1.3 Schematic illustrations of a hollow-core PBG-PCF, a kagome-lattice PCF
and a Bragg fiber. . . . . . . . . . . . . . . . . . . . . . . . . . . . . . . . . 8
1.4 Images of the cross-section of the cane for a hollow-core PBG-PCF and the
fabricated fiber. . . . . . . . . . . . . . . . . . . . . . . . . . . . . . . . . . 10
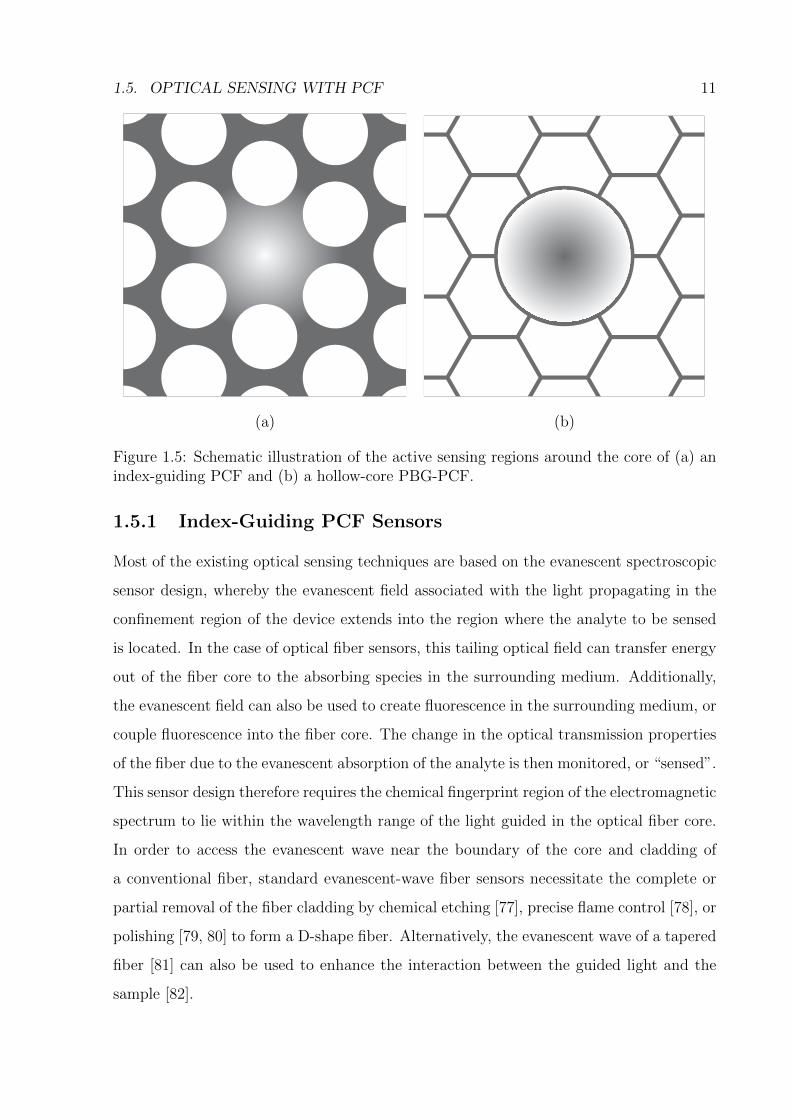
1.5 Schematic illustration of the active sensing regions around the core of an
index-guiding PCF and a hollow-core PBG-PCF. . . . . . . . . . . . . . . 11
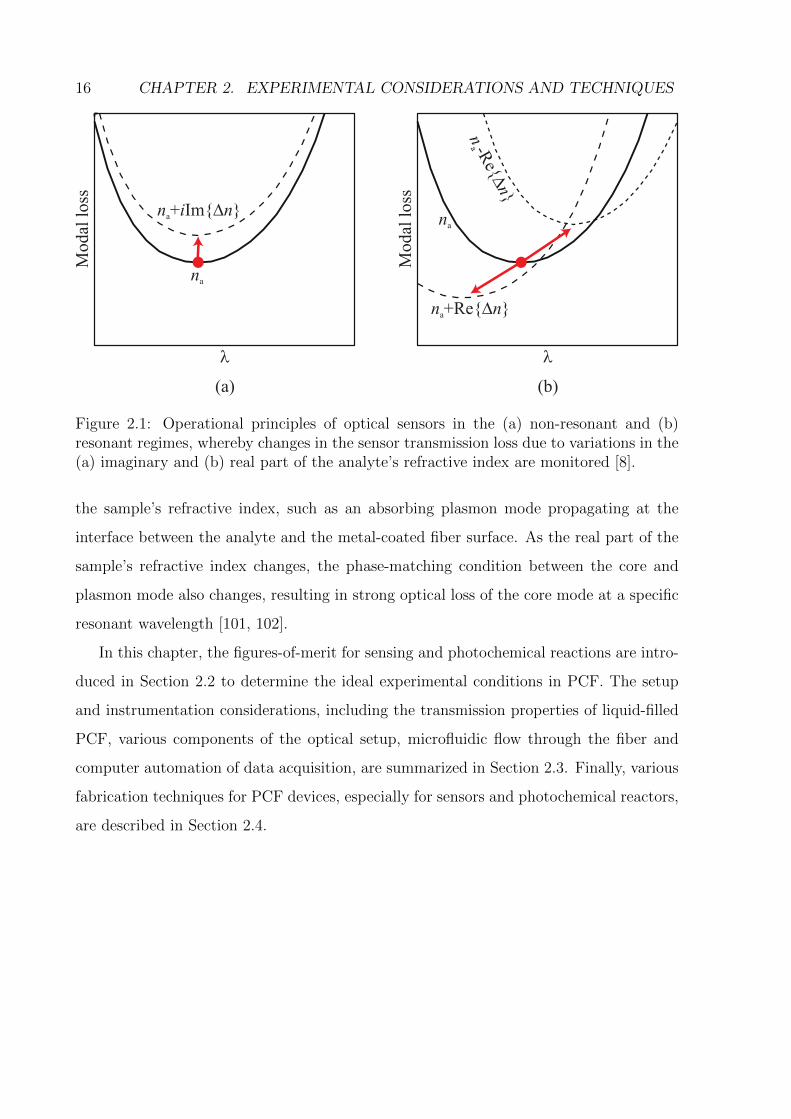
2.1 Operational principles of optical sensors in the non-resonant and resonant
regimes. . . . . . . . . . . . . . . . . . . . . . . . . . . . . . . . . . . . . . 16
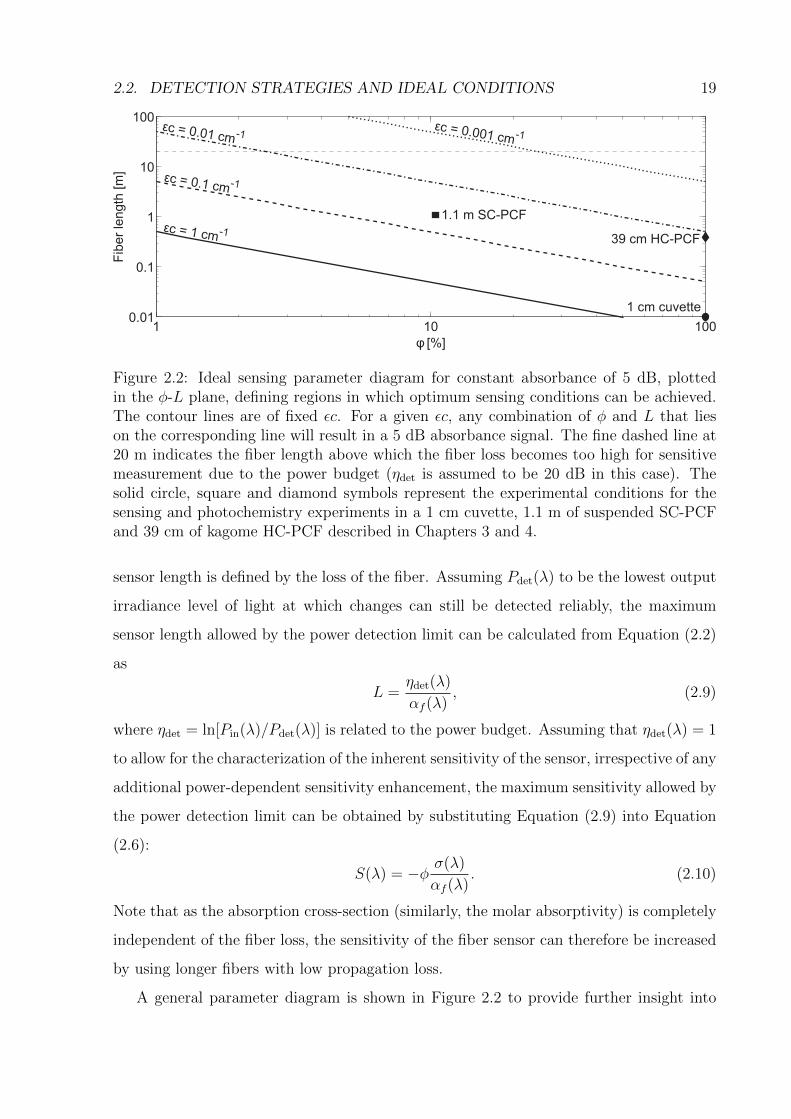
2.2 Ideal sensing parameter diagram for constant absorbance, defining regions
in which optimum sensing conditions can be achieved. . . . . . . . . . . . . 19
2.3 Schematics illustrating and comparing the geometries and sample volumes
in a conventional cuvette and a kagome PCF. . . . . . . . . . . . . . . . . 21
2.4 Shift in the central wavelength of the PBG as a result of infiltrating the
PBG-PCF with various solvents. . . . . . . . . . . . . . . . . . . . . . . . . 25
2.5 Cross-section of a capillary tube infiltrated with liquid. . . . . . . . . . . . 26
2.6 Simulated water filling time for silica microchannels of bore radii 1, 5 and
10 µm, with an applied pressure head of 1 bar. . . . . . . . . . . . . . . . . 28
2.7 Schematic diagram showing the experimental setup for sensing and photo-
chemistry experiments in PCF. . . . . . . . . . . . . . . . . . . . . . . . . 29
xv
xvi LIST OF FIGURES
2.8 Schematic diagram illustrating the increase in the effective N.A. as a result
of change in the interface medium of the objective (air) to that for the fiber
(liquid). . . . . . . . . . . . . . . . . . . . . . . . . . . . . . . . . . . . . . 31
2.9 Schematic diagram of photoionization regimes at low and high frequencies. 33
2.10 Schematic diagram of avalanche ionization. . . . . . . . . . . . . . . . . . . 34
2.11 Schematic diagram showing the experimental setup for femtosecond laser
ablation of side channels in PCF and the two-photon polymerization tech-
nique for selective blockage of microstructure holes. . . . . . . . . . . . . . 35
2.12 Diameter of ablated entry hole in the silica fiber as a function of pulse
energy incident on the fiber and the number of pulses. . . . . . . . . . . . . 36
2.13 Schematic showing the dependence of the diameter of laser-ablated entry
hole size on the peak irradiance, assuming a Gaussian irradiance distribution. 37
2.14 Examples of ablated side microchannel allowing access to one of the three
cladding holes in a suspended-core fiber and a damaged side microchannel
after applying 30 bar of water pressure. . . . . . . . . . . . . . . . . . . . . 38
2.15 Measured transmission losses as a function of the number of drilled side
channels in an ESM-PCF. . . . . . . . . . . . . . . . . . . . . . . . . . . . 38
2.16 Images of a HC-PCF infiltrated with acrylic resin, a SC-PCF with selec-
tively photopolymerized cladding holes, and a gold nanowire embedded
into the cladding hole of a PCF using TPP as the hole-collapsing technique. 39
2.17 SEM of the cross-section of the nanoweb fiber prior to FIB milling and
after a hole was milled through the silica jacket of a nanoweb fiber. . . . . 41
3.1 Images showing the cross-section of a kagome HC-PCF. . . . . . . . . . . . 45
3.2 Transmission and loss spectra of the kagome HC-PCF. . . . . . . . . . . . 46
3.3 Transmission and loss spectra of the kagome HC-PCF filled with de-ionized
water. . . . . . . . . . . . . . . . . . . . . . . . . . . . . . . . . . . . . . . 47
3.4 Transmission spectrum of the index-guiding kagome HC-PCF filled with
toluene. . . . . . . . . . . . . . . . . . . . . . . . . . . . . . . . . . . . . . 48
3.5 The photochemical conversion of CNCbl to [H2OCbl]+. . . . . . . . . . . . 50
LIST OF FIGURES xvii
3.6 Changes in the absorption spectrum as a result of the photochemical con-
version of CNCbl to [H2OCbl]+. . . . . . . . . . . . . . . . . . . . . . . . . 51
3.7 Spectral and temporal data for the photolysis of CNCbl in a kagome HC-PCF. 53
3.8 Comparison of the temporal evolution of molar absorptivity measured in a
kagome HC-PCF and a cuvette. . . . . . . . . . . . . . . . . . . . . . . . . 54
3.9 Configuration diagram depicting the photoaquation of CNCbl. . . . . . . . 55
3.10 Quantum yields for the photolysis of CNCbl obtained from measurements
in a kagome HC-PCF. . . . . . . . . . . . . . . . . . . . . . . . . . . . . . 56
3.11 Reversible isomerization between the trans (left) and the cis (right) geo-
metric isomers of azobenzene. . . . . . . . . . . . . . . . . . . . . . . . . . 58
3.12 Spectral and temporal data for the thermal back reaction of disperse orange
1 in toluene. . . . . . . . . . . . . . . . . . . . . . . . . . . . . . . . . . . . 59
3.13 Temporal evolution of molar absorptivity for the forward and back reaction
of disperse red 1 in cyclohexane. . . . . . . . . . . . . . . . . . . . . . . . . 61
3.14 Spectral and temporal data for the forward and back isomerization of dis-
perse orange 1 in toluene measured in a kagome HC-PCF. . . . . . . . . . 62
3.15 Temporal evolution of trans-DO1 in toluene irradiated with broadband
xenon lamp. . . . . . . . . . . . . . . . . . . . . . . . . . . . . . . . . . . . 65
3.16 Configuration diagram depicting the isomerization paths of trans ⇀↽ cis. . . 66
4.1 High resolution SEM of the core region of four different air-suspended solid-
core fibers. . . . . . . . . . . . . . . . . . . . . . . . . . . . . . . . . . . . . 71
4.2 Transmission and loss spectra for air-suspended SC-PCF with air- and
water-cladding. . . . . . . . . . . . . . . . . . . . . . . . . . . . . . . . . . 72
4.3 Normalized mode profiles of an air-suspended SC-PCF with water-filled
cladding. . . . . . . . . . . . . . . . . . . . . . . . . . . . . . . . . . . . . . 73
4.4 Dependence of calculated cladding power fraction on the effective core di-
ameter, wavelength and cladding medium. . . . . . . . . . . . . . . . . . . 75
4.5 Measured and calculated dispersion of air-suspended SC-PCFs. . . . . . . . 76
4.6 Absorption and molar absorptivity spectra of an aqueous NiCl2 solution. . 78
xviii LIST OF FIGURES
4.7 Molar absorptivity spectra of methylene blue in water, and photobleach-
ing of MB in suspended solid-core fiber induced by irradiation using the
broadband PCF SC source. . . . . . . . . . . . . . . . . . . . . . . . . . . 81
4.8 The calculated total surface density of MB along the inner surface of the
air-suspended SC-PCF cladding holes. . . . . . . . . . . . . . . . . . . . . 83
4.9 Photobleaching and surface adsorption of MB in kagome HC-PCF. . . . . . 85
A.1 Schematic diagram of the modified pump-probe setup with counter-propagating
beams for PCF photochemical reactors. . . . . . . . . . . . . . . . . . . . . 94
A.2 Schematic diagram showing the effect of refraction due to the tilted liquid
cell window. . . . . . . . . . . . . . . . . . . . . . . . . . . . . . . . . . . . 95
List of Tables
1.1 Overview of photonic crystal fiber development. . . . . . . . . . . . . . . . 4
2.1 Comparison between various sample cell configurations. . . . . . . . . . . . 23
3.1 Quantum yields for the photolysis of CNCbl at various pH values. . . . . . 56
xix

Abbreviations
CCD Charge coupled device
CNCbl Cyanocobalamin
CW Continuous wave
DBI Dimethylbenzimidazole
DO1 Disperse orange 1
DR1 Disperse red 1
FC Franck Condon
FIB Focused ion beam
HC-PCF Hollow-core photonic crystal fiber
HPLC High performance liquid chromatography
[H2OCbl]+ Hydroxocobalamin, aquacobalamin
LMB leuco methylene blue
MB Methylene blue
MMF Multimode fiber
OSA Optical spectrum analyzer
PBG Photonic bandgap
PCF Photonic crystal fiber
SC Supercontinuum
SC-PCF Solid-core photonic crystal fiber
SEM Scanning electron micrograph
TS Transition state
UV Ultraviolet
ZDW Zero dispersion wavelength
xxi

Preface
From artificial eyes [1] and ears [2] to electronic noses [3] and tongues [4], devices with
sensing capabilities mimicking the organs of the most sophisticated living creatures on
Earth are paving the ways to improve the living quality of many and simplify routine
analyses in industries as well as our daily lives. Such “senses of electronics”, or sensors,
are able not only to “feel” the materials but even to distinguish their chemical composition
beyond the range of human perception.
A substantial amount of effort has been made in the research and development of chem-
ical sensors in recent years [5], incorporating research fields such as electronics, optics,
biochemistry, material science, analytical, inorganic and organic chemistry. With tech-
nological applications to industrial, medical and environmental needs, this continuously
evolving field is pushing for better sensor designs featuring selectivity, low detection lim-
its, reversibility, robustness and portability. However, most of the existing configurations
still exhibit clear limitations.
Among the world of sensors, a host of sensing modalities exist and are currently being
investigated. In particular, sensing devices using optics and photonics have undergone
extensive research during the last two decades [6-8] due to the wide variety of optical
phenomena that one can exploit as sensing mechanisms. Luminescence, fluorescence,
phosphorescence, absorbance, elastic scattering, Raman scattering, surface plasmon res-
onance, guided-wave resonance, interference, and reflection/transmission microscopy ex-
emplify such phenomena. Different detection techniques and setup configurations are
constantly being developed and optimized to increase the detection sensitivity. An exam-
ple is cavity enhanced absorption spectroscopy (CEAS), whereby the probe light makes
multiple passes through the same sample, effectively increasing the absorption path by
orders of magnitude. While CEAS has proven to be effective in measuring trace samples
xxiii
xxiv PREFACE
[9], its intrinsically narrow bandwidth and the requirement for calibration measurements
pose limitations on the range of applications for this technique [10]. Furthermore, the
conventional monitoring methods based on free-space interferometry and spectroscopy
are effective only for the line of sight, and are therefore prone to undesirable misalign-
ments and external perturbations.
Over the last years, increasing research efforts in fiber- and integrated-optics tech-
nologies, which were primarily developed for the telecommunication industry, have been
injected into optical sensors research. With advances in the development of high quality
fiber-optic components at reasonable costs, the prospect of fiber-optic sensors to replace
conventional ones has been realized. Unlike standard communication fibers which act as
passive media for signals, the function of a sensing fiber is to produce sensitive responses
to various chemical and physical changes that take place in the vicinity of the fiber. Such
novel sensing devices are used for routine analyses, with applications in chemical [11-14],
biochemical [15-18], biomedical and environmental [18-21] sensing.
These fiber-optic chemical and biosensors have shown the potential of a promising
technological platform characterized by numerous intrinsic advantages over their conven-
tional electronic counterparts. The principal single attractive feature of fiber-optic sensors
is undoubtedly the intrinsic immunity to electromagnetic interferences and the absence
of electrical risks which is important for safety in explosive environments. Optical fibers
are capable of guiding the light beam in a confined and inaccessible medium over large
distances, allowing for more versatile and less perturbed in situ or remote monitoring of
environmental or medical parameters. In addition, they also offer the capability for long-
range distributed sensing and the ability to be multiplexed, as optical waves of different
frequencies do not interfere with one another. The optical fiber is lightweight and its
compact geometry implies small volume of analyte consumption, such that low-cost mea-
surements can be achieved with high specificity and sensitivity; its great flexibility also
offers the ability to be embedded into various structures and materials, including textiles
and fabrics [22]. Fiber-optic sensors have major advantages in many chemically aggres-
sive and ionizing environments, and can withstand large physical strain and substantial
temperature excursions. They also have the potential to be integrated in rapid, real-time
high-throughput analysis and be easily interfaced with optical data communication sys-
xxv
tems whereby high information density can be achieved. Furthermore, various system
configurations demonstrate the accessibility of the fiber sensors for flow cells or pipetting
devices, facilitating measurement in the presence of the sample without any rinsing.
Emerging technologies in the field of waveguide-based chemical and biosensors are con-
tinuously evolving, with new focuses on higher sensitivity and stability. This key demand
is stimulating further advancement in the exploration of new material and structural
concepts as alternative platforms for standard sensing technologies, which provide better
performance with the prospect for novel devices.
This thesis focuses on the demonstration of one such novelty in which the concept of
optical fiber sensing is further developed to accommodate active in-fiber (photo)chemical
reactor employing absorption spectrometry in photonic crystal fibers (PCFs) [23, 24].
These microstructured fibers have revolutionized optical fiber technology by enabling
light to be guided and manipulated within the fiber in ways not previously possible; the
new degrees of freedom in the fiber design and fabrication have been extensively exploited
to considerably improve the sensor performance in terms of accuracy and precision.
Outline of the Thesis
Chapter 1 provides a historical perspective on the progress in the field of photonic crystal
fibers, and discusses the classification of PCFs based on their waveguiding mechanisms.
Particular attention is paid to the strong light-matter interaction within the fiber’s mi-
crostructure because of its importance in the photochemical reactions and sensing exper-
iments performed in this thesis. A short overview of the novel sensing applications based
on various types of PCFs and sensing mechanisms to date is also presented.
Chapter 2 introduces the various modes of operation for optical snesors and presents
the concept of detection sensitivity for a fiber-optic sensor. The parameters dictating the
effectiveness of PCF-based sensors are discussed and a diagram relating these parameters
is constructed to facilitate the determination of optimum sensing conditions. In addition
to passive sensing in PCF, the strong light-matter interaction provided by the PCF can
also be utilized as a photochemical reactor to simultaneously induce and monitor reaction
kinetics. The figure of merit for photochemical reactors is therefore discussed in detail.
xxvi PREFACE
The transmission properties and microfluidic flow through the liquid-filled PCF, together
with the main components making up the experimental setup, are also described. The
chapter concludes with a presentation of the preliminary results from several fabrication
techniques investigated with the objective of combining PCF sensors with microfluidics.
Chapter 3 demonstrates the use of a liquid-filled hollow-core PCF (HC-PCF) as a
highly-controlled photochemical reactor. Photochemical reactions with very low quantum
yields are efficiently induced and monitored within the hollow core of the PCF reactor in
real-time. Quantitative absorption spectroscopy of the photo-excited chemical species can
be obtained within seconds. Orders of magnitude enhancement in the reaction kinetics
is obtained with strongly reduced sample volumes compared to conventional techniques.
The second part of the chapter demonstrates the effectiveness of the PCF reactor in
monitoring fast, reversible photochemical reactions. The reactions are monitored in real-
time and show complete reversibility of the system.
Chapter 4 presents quantitative broadband sensing based on the evanescent interaction
of the guided core mode in a solid-core PCF (SC-PCF) with the analyte in the fiber
cladding. Excellent agreements are obtained between the experimentally measured and
numerically calculated fiber sensor characteristics without the use of free parameters.
More importantly, the PCF sensor provides stronger signals and excellent agreement with
the reference spectrum measured using standard techniques, despite using three orders of
magnitude lower sample volume. The second part of the chapter focuses on the interaction
between the sample molecules with the inner surfaces of the PCF microchannels. Results
from both SC- and HC-PCFs demonstrate the affinity of the molecules to adsorb onto
the silica surfaces and self-aggregate, an effect which would otherwise be unobservable in
bulk under the same experimental conditions. The high surface-to-volume ratio provided
by the microchannels in PCF promises a novel platform for surface chemistry.
Chapter 5 concludes this thesis with a discussion on the prospective extensions to the
current work.
Chapter 1
Photonic Crystal Fibers
1.1 Introduction
Over the past four decades, optical fibers have revolutionized the field of telecommuni-
cations [25]. However, despite their excellent performance in the transmission of optical
signals, the advances made in fiber optic technology have been driven towards its ulti-
mate limit as the intrinsic properties of silica have imposed fundamental restrictions on
the performance of conventional optical fibers. Firstly, standard optical fibers have strict
design rules to fulfill, such as limited core diameter for single-mode operation, modal
cut-off wavelength, and limitation on material selection as the core and cladding materi-
als must have matching thermal properties. Secondly, restrictions on the geometry and
refractive index profile of optical fibers hinder the flexibility in engineering fiber proper-
ties such as dispersion, nonlinearity and birefringence for better performance and more
specialized applications. Finally, light propagating in an optical fiber suffers from losses.
Several factors contribute to the attenuation in optical fibers, with material absorption
and Rayleigh scattering being the major contributing sources. Material absorption arises
from electronic and vibrational resonances of silica glass or impurities such as the OH−
ions in the fiber. Rayleigh scattering refers to the scattering of light from local fluctua-
tions in the refractive index introduced by inhomogeneities in the fiber that are on a scale
much smaller than the optical wavelength.
These limitations stimulated the development of a new class of optical waveguides
known as the photonic crystal fiber (PCF). In a PCF the fiber core is surrounded by a
1
2 CHAPTER 1. PHOTONIC CRYSTAL FIBERS
microstructured cladding based on a two-dimensional periodic lattice consisting of air-
filled capillaries running parallel to the fiber axis along the entire length of the fiber [26,
27]. Unlike conventional optical fibers, the PCF is usually made of a single material (sil-
ica), eliminating the need for two thermally, chemically and optically compatible glasses
to form its core and cladding. In addition, the PCF has several structural parameters one
can manipulate, offering great design flexibility and a wealth of physical properties for
many interesting applications. For example, the PCF allows highly-engineerable refrac-
tive index profiles to develop fibers of desirable nonlinearity, birefringence and chromatic
dispersion. The possibility for light to be guided in a hollow core also implies that it is
possible to fabricate fibers with losses lower than that achievable in conventional fibers
at wavelengths limited by high material absorption.
In this chapter, a brief historical overview of the development of PCF is given in
Section 1.2, followed by the classification and guidance mechanisms of various classes of
PCF in Section 1.3. A description of the general fabrication process is outlined in Section
1.4. The chapter concludes with an overview of optical sensing applications in PCF in
Section 1.5.
1.2 Historical Overview
Like many scientific inventions which are either inspired by or akin to living beings found
in nature, the photonic crystals of PCF also find similarities in the photonic stopband-
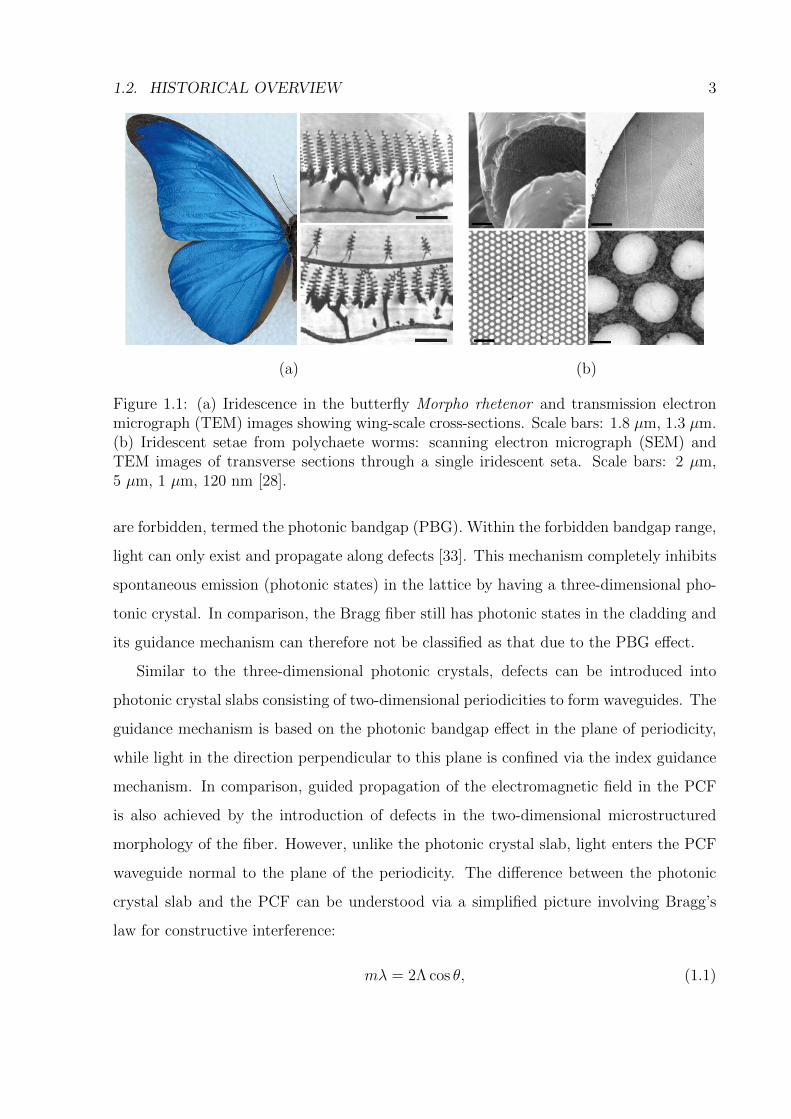
based nanostructures in the wings of butterflies (Figure 1.1(a)) and the iridescent setae
from polychaete worms (Figure 1.1(b)) [28]. The periodic variations in dielectric constant
in PCF also find analogy in semiconductor band structures in which electrons interact
with the periodic variation in the potential created by the atomic crystal lattice.
The idea of using periodic, one-dimensional variations in the dielectric constant to trap
light was first presented by Melekhin and Manenkov in 1968 [29] and Yeh et al. in 1978
[30], where it was proposed to clad a fiber core with a multilayer coating similar to that in
planar Bragg stacks. Light guidance in the Bragg fiber is therefore the result of a radial
stopband. The work by Yablonovitch [31, 32] predicted that certain three-dimensional
periodic dielectric structures can have a frequency band in which all propagation modes
1.2. HISTORICAL OVERVIEW 3
(a) (b)
Figure 1.1: (a) Iridescence in the butterfly Morpho rhetenor and transmission electronmicrograph (TEM) images showing wing-scale cross-sections. Scale bars: 1.8 µm, 1.3 µm.(b) Iridescent setae from polychaete worms: scanning electron micrograph (SEM) andTEM images of transverse sections through a single iridescent seta. Scale bars: 2 µm,5 µm, 1 µm, 120 nm [28].
are forbidden, termed the photonic bandgap (PBG). Within the forbidden bandgap range,
light can only exist and propagate along defects [33]. This mechanism completely inhibits
spontaneous emission (photonic states) in the lattice by having a three-dimensional pho-
tonic crystal. In comparison, the Bragg fiber still has photonic states in the cladding and
its guidance mechanism can therefore not be classified as that due to the PBG effect.
Similar to the three-dimensional photonic crystals, defects can be introduced into
photonic crystal slabs consisting of two-dimensional periodicities to form waveguides. The
guidance mechanism is based on the photonic bandgap effect in the plane of periodicity,
while light in the direction perpendicular to this plane is confined via the index guidance
mechanism. In comparison, guided propagation of the electromagnetic field in the PCF
is also achieved by the introduction of defects in the two-dimensional microstructured
morphology of the fiber. However, unlike the photonic crystal slab, light enters the PCF
waveguide normal to the plane of the periodicity. The difference between the photonic
crystal slab and the PCF can be understood via a simplified picture involving Bragg’s
law for constructive interference:
mλ = 2Λ cos θ, (1.1)
4 CHAPTER 1. PHOTONIC CRYSTAL FIBERS
Year PCF Development
1996 First solid-core PCF [26, 27]
1997 Endlessly single-mode PCF [34]
1998 Ultra-large mode area [35]
1999 PCF with photonic bandgap and air core [36]
2000 Supercontinuum generation with PCF [37]
2001 Four-wave mixing [38]
2002 Laser-tweezer guidance of particles in HC-PCF [39]
2003 Tellurite glass PCF [40]
2005 All-solid photonic bandgap fiber at 1% index contrast [41]
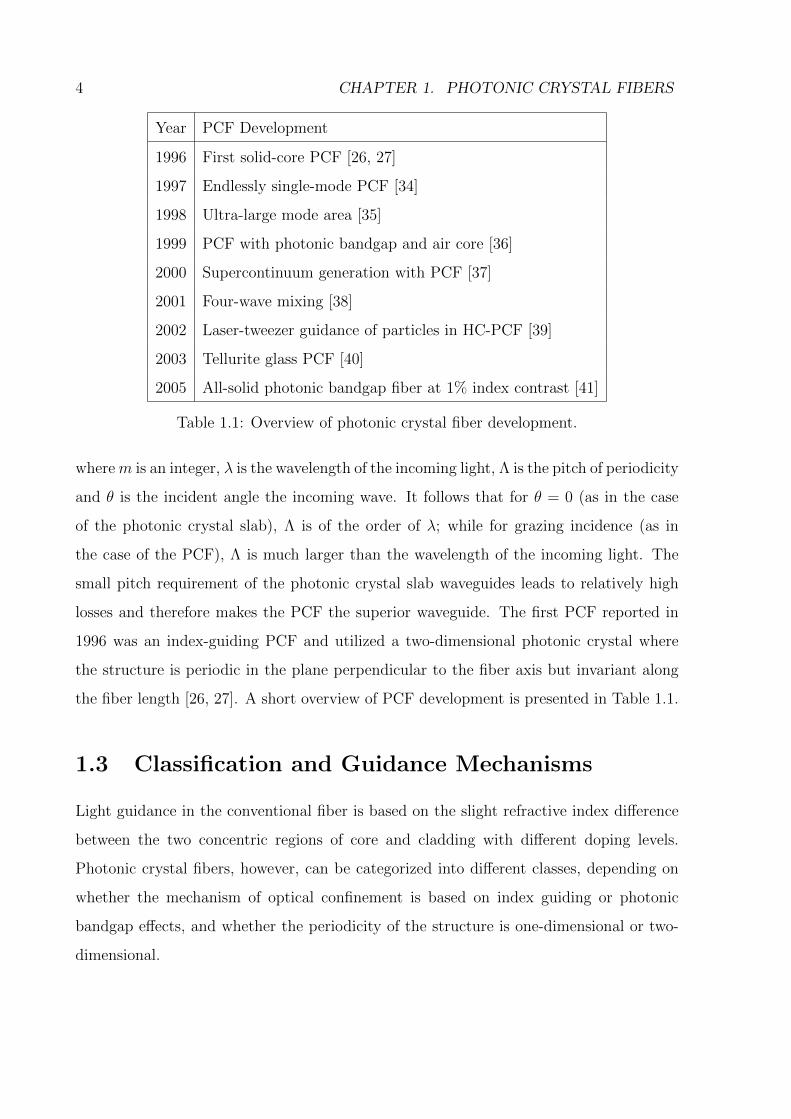
Table 1.1: Overview of photonic crystal fiber development.
wherem is an integer, λ is the wavelength of the incoming light, Λ is the pitch of periodicity
and θ is the incident angle the incoming wave. It follows that for θ = 0 (as in the case
of the photonic crystal slab), Λ is of the order of λ; while for grazing incidence (as in
the case of the PCF), Λ is much larger than the wavelength of the incoming light. The
small pitch requirement of the photonic crystal slab waveguides leads to relatively high
losses and therefore makes the PCF the superior waveguide. The first PCF reported in
1996 was an index-guiding PCF and utilized a two-dimensional photonic crystal where
the structure is periodic in the plane perpendicular to the fiber axis but invariant along
the fiber length [26, 27]. A short overview of PCF development is presented in Table 1.1.
1.3 Classification and Guidance Mechanisms
Light guidance in the conventional fiber is based on the slight refractive index difference
between the two concentric regions of core and cladding with different doping levels.
Photonic crystal fibers, however, can be categorized into different classes, depending on
whether the mechanism of optical confinement is based on index guiding or photonic
bandgap effects, and whether the periodicity of the structure is one-dimensional or two-
dimensional.
1.3. CLASSIFICATION AND GUIDANCE MECHANISMS 5
d
�
nair
neff
ncore
Rad
ial
dis
tance
Index
jacket
core
cladding�
d
(a) (b)
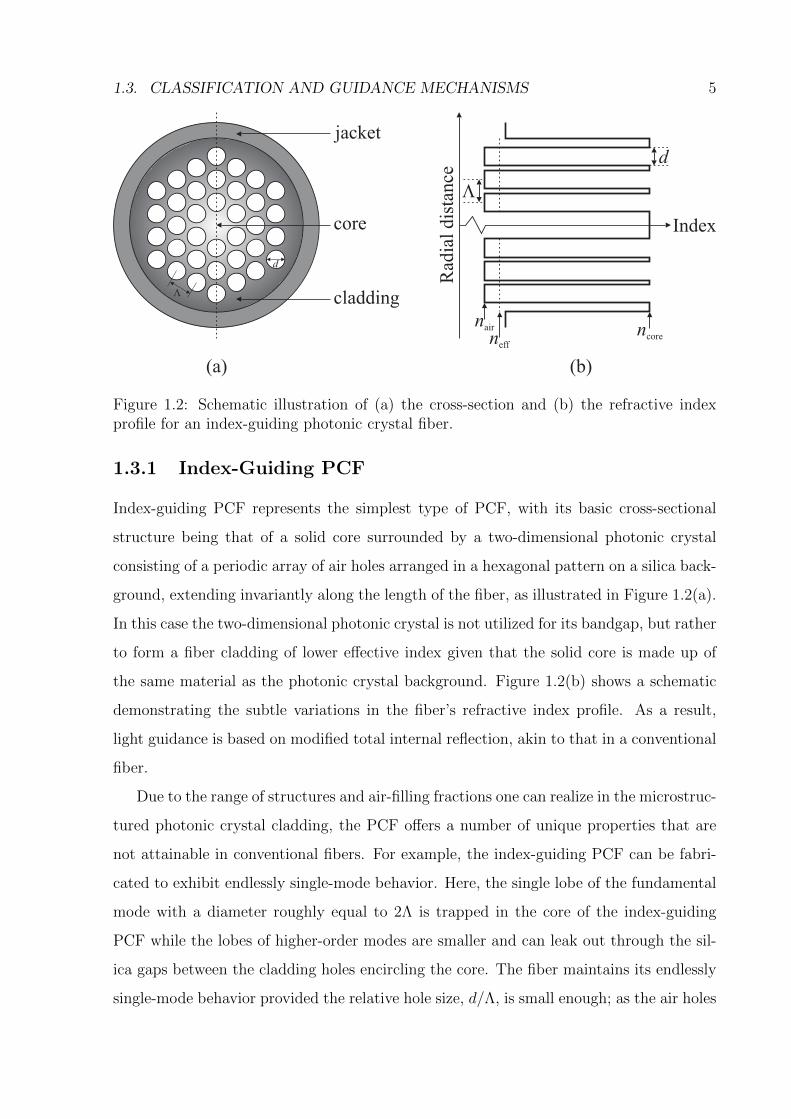
Figure 1.2: Schematic illustration of (a) the cross-section and (b) the refractive indexprofile for an index-guiding photonic crystal fiber.
1.3.1 Index-Guiding PCF
Index-guiding PCF represents the simplest type of PCF, with its basic cross-sectional
structure being that of a solid core surrounded by a two-dimensional photonic crystal
consisting of a periodic array of air holes arranged in a hexagonal pattern on a silica back-
ground, extending invariantly along the length of the fiber, as illustrated in Figure 1.2(a).
In this case the two-dimensional photonic crystal is not utilized for its bandgap, but rather
to form a fiber cladding of lower effective index given that the solid core is made up of
the same material as the photonic crystal background. Figure 1.2(b) shows a schematic
demonstrating the subtle variations in the fiber’s refractive index profile. As a result,
light guidance is based on modified total internal reflection, akin to that in a conventional
fiber.
Due to the range of structures and air-filling fractions one can realize in the microstruc-
tured photonic crystal cladding, the PCF offers a number of unique properties that are
not attainable in conventional fibers. For example, the index-guiding PCF can be fabri-
cated to exhibit endlessly single-mode behavior. Here, the single lobe of the fundamental
mode with a diameter roughly equal to 2Λ is trapped in the core of the index-guiding
PCF while the lobes of higher-order modes are smaller and can leak out through the sil-
ica gaps between the cladding holes encircling the core. The fiber maintains its endlessly
single-mode behavior provided the relative hole size, d/Λ, is small enough; as the air holes
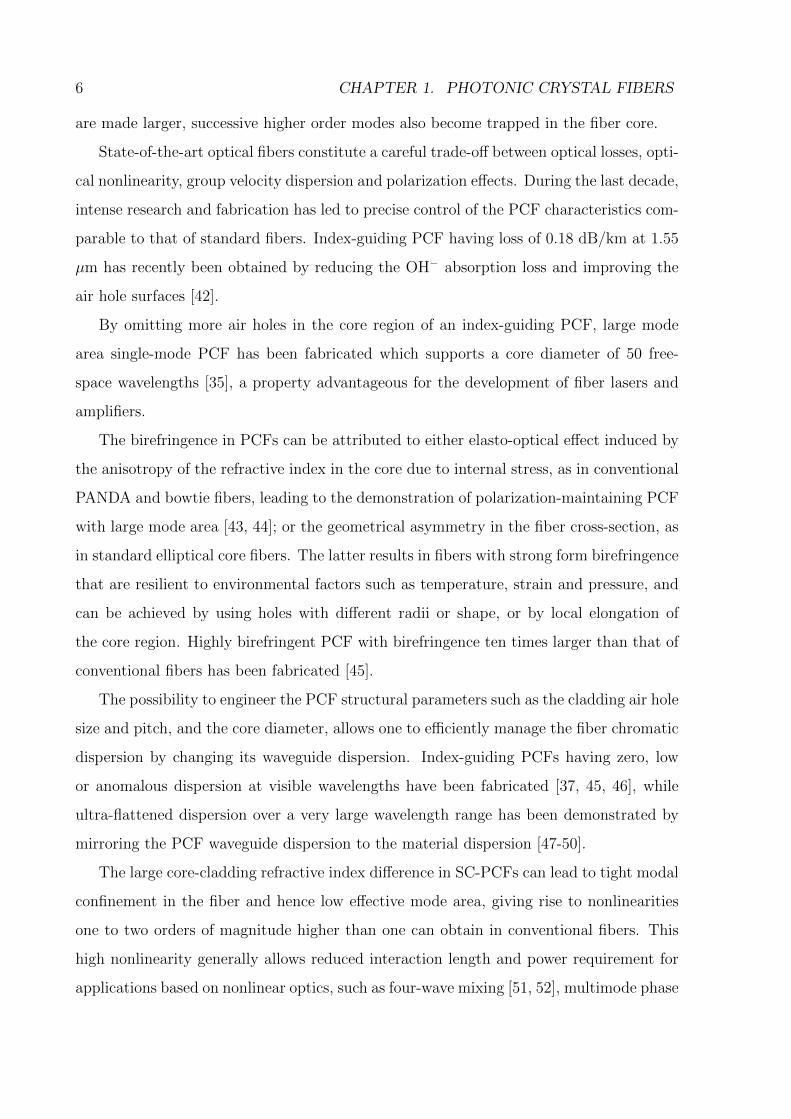
6 CHAPTER 1. PHOTONIC CRYSTAL FIBERS
are made larger, successive higher order modes also become trapped in the fiber core.
State-of-the-art optical fibers constitute a careful trade-off between optical losses, opti-
cal nonlinearity, group velocity dispersion and polarization effects. During the last decade,
intense research and fabrication has led to precise control of the PCF characteristics com-
parable to that of standard fibers. Index-guiding PCF having loss of 0.18 dB/km at 1.55
µm has recently been obtained by reducing the OH− absorption loss and improving the
air hole surfaces [42].
By omitting more air holes in the core region of an index-guiding PCF, large mode
area single-mode PCF has been fabricated which supports a core diameter of 50 free-
space wavelengths [35], a property advantageous for the development of fiber lasers and
amplifiers.
The birefringence in PCFs can be attributed to either elasto-optical effect induced by
the anisotropy of the refractive index in the core due to internal stress, as in conventional
PANDA and bowtie fibers, leading to the demonstration of polarization-maintaining PCF
with large mode area [43, 44]; or the geometrical asymmetry in the fiber cross-section, as
in standard elliptical core fibers. The latter results in fibers with strong form birefringence
that are resilient to environmental factors such as temperature, strain and pressure, and
can be achieved by using holes with different radii or shape, or by local elongation of
the core region. Highly birefringent PCF with birefringence ten times larger than that of
conventional fibers has been fabricated [45].
The possibility to engineer the PCF structural parameters such as the cladding air hole
size and pitch, and the core diameter, allows one to efficiently manage the fiber chromatic
dispersion by changing its waveguide dispersion. Index-guiding PCFs having zero, low
or anomalous dispersion at visible wavelengths have been fabricated [37, 45, 46], while
ultra-flattened dispersion over a very large wavelength range has been demonstrated by
mirroring the PCF waveguide dispersion to the material dispersion [47-50].
The large core-cladding refractive index difference in SC-PCFs can lead to tight modal
confinement in the fiber and hence low effective mode area, giving rise to nonlinearities
one to two orders of magnitude higher than one can obtain in conventional fibers. This
high nonlinearity generally allows reduced interaction length and power requirement for
applications based on nonlinear optics, such as four-wave mixing [51, 52], multimode phase
1.3. CLASSIFICATION AND GUIDANCE MECHANISMS 7
matching [53], pulse compression [54] and generation of ultra-broadband supercontinuum
(SC) [55]. In addition to strong confinement of the guided mode, PCF nonlinearity can
also be enhanced by fabricating fibers from a single material constituent with high intrinsic
nonlinearity such as chalcogenide [56], tellurite [57], bismuth silicate [58] and lead silicate
[59] glasses.
1.3.2 Hollow-Core PCF
Standard hollow waveguides confine light either by total internal reflection (attenuated
total reflection guides) [60, 61] or by reflection off a metallic surface (leaky guides) [62].
These waveguides are inherently weak and highly multimode, allowing the use of only
relatively short lengths [63]. In contrast, hollow-core PCFs (HC-PCFs) [36] offer quasi
single-mode operation despite supporting multiple optical modes, including guided and
surface modes, at any given wavelength, provided careful launching conditions are applied
to selectively excite the fundamental mode. Furthermore, higher-order modes usually have
much higher confinement and scattering losses compared to the fundamental mode [64],
allowing one to effectively achieve single-mode output at the desired wavelength by em-
ploying long length of fiber [65] or by bending the fiber. Finally, HC-PCFs facilitate the
delivery of light with low attenuation over kilometer length scales, an attribute unachiev-
able in conventional hollow waveguides. Losses as low as 1.2 dB/km in HC-PCF has
been achieved by enlarging the core from 7 to 19 unit cells to reduce the overlap of the
fundamental core mode with the glass-air surface modes [66].
1.3.2.1 Photonic Bandgap PCF
An index-guiding PCF cannot be formed with a hollow core, as total internal reflection
requires the effective cladding index to be lower than that of the core index. Light guidance
in this case, however, can be realized by coherent Bragg scattering, in which light within
finite frequency regions is prohibited from propagating in the photonic crystal cladding
and is confined to a defect at the fiber core. Each of these frequency regions corresponds to
the existence of a full two-dimensional PBG in the fiber cladding; low-loss guided modes
can therefore be formed where a core resonance coincides with a bandgap. These fibers
8 CHAPTER 1. PHOTONIC CRYSTAL FIBERS
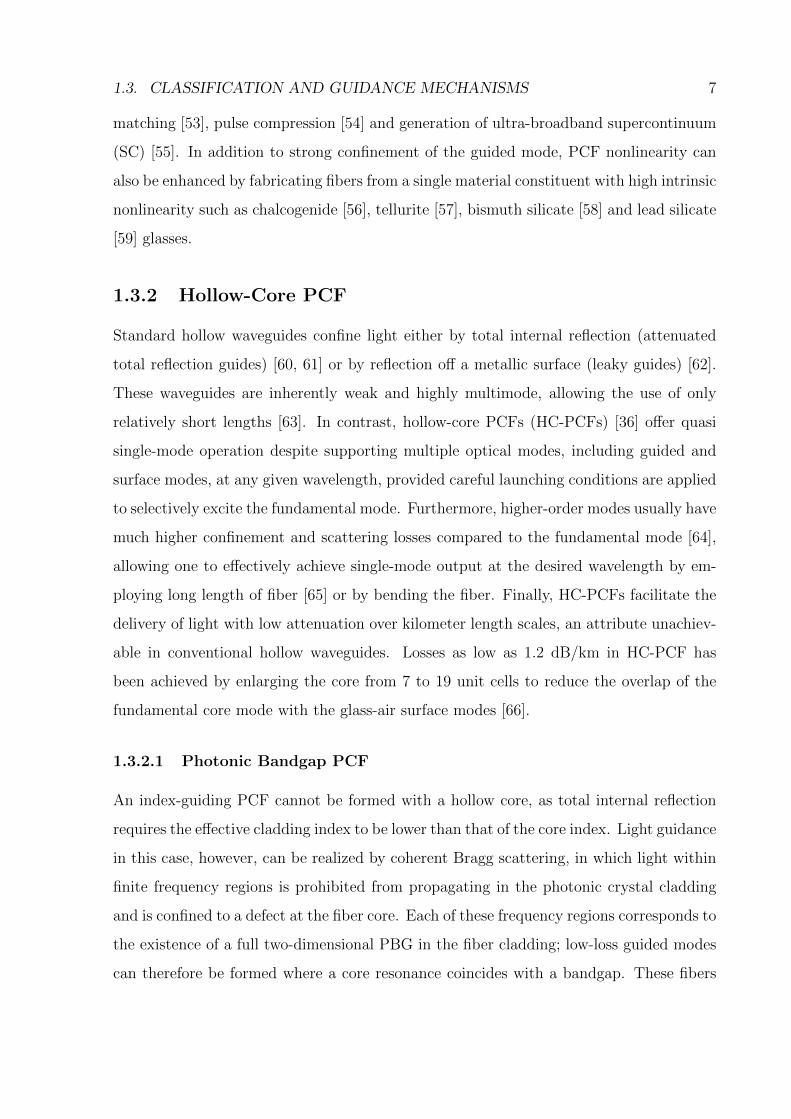
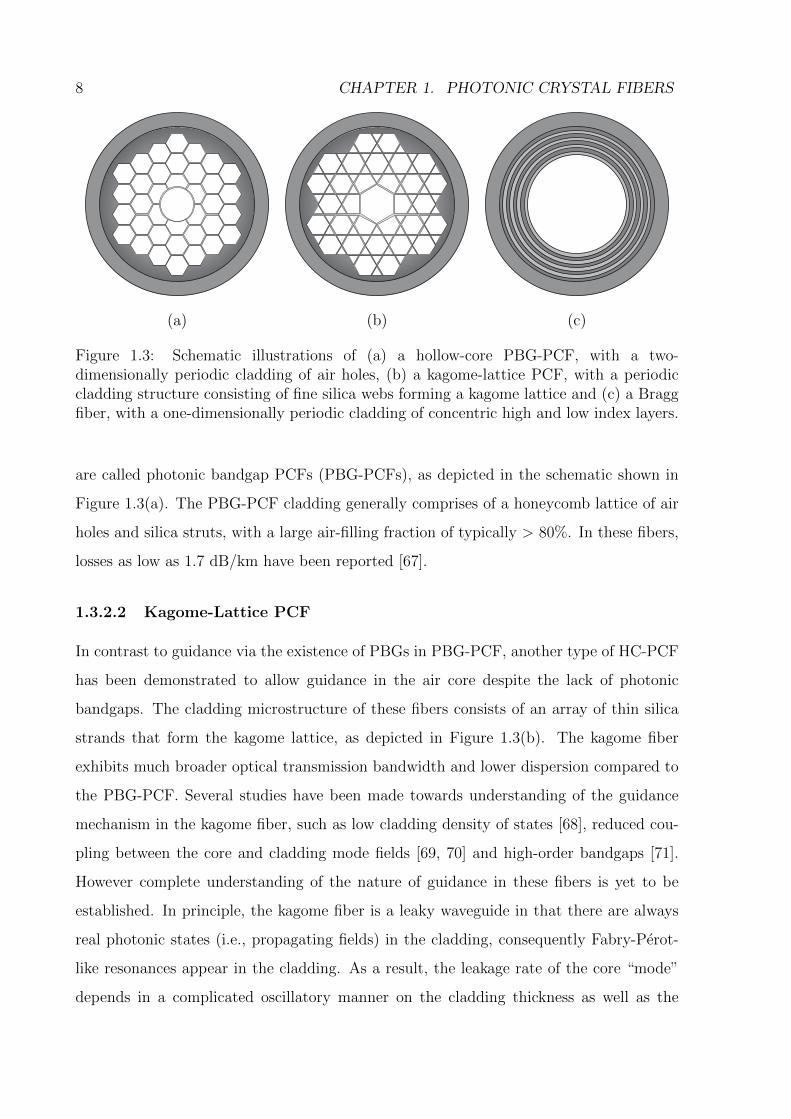
(a) (b) (c)
Figure 1.3: Schematic illustrations of (a) a hollow-core PBG-PCF, with a two-dimensionally periodic cladding of air holes, (b) a kagome-lattice PCF, with a periodiccladding structure consisting of fine silica webs forming a kagome lattice and (c) a Braggfiber, with a one-dimensionally periodic cladding of concentric high and low index layers.
are called photonic bandgap PCFs (PBG-PCFs), as depicted in the schematic shown in
Figure 1.3(a). The PBG-PCF cladding generally comprises of a honeycomb lattice of air
holes and silica struts, with a large air-filling fraction of typically > 80%. In these fibers,
losses as low as 1.7 dB/km have been reported [67].
1.3.2.2 Kagome-Lattice PCF
In contrast to guidance via the existence of PBGs in PBG-PCF, another type of HC-PCF
has been demonstrated to allow guidance in the air core despite the lack of photonic
bandgaps. The cladding microstructure of these fibers consists of an array of thin silica
strands that form the kagome lattice, as depicted in Figure 1.3(b). The kagome fiber
exhibits much broader optical transmission bandwidth and lower dispersion compared to
the PBG-PCF. Several studies have been made towards understanding of the guidance
mechanism in the kagome fiber, such as low cladding density of states [68], reduced cou-
pling between the core and cladding mode fields [69, 70] and high-order bandgaps [71].
However complete understanding of the nature of guidance in these fibers is yet to be
established. In principle, the kagome fiber is a leaky waveguide in that there are always
real photonic states (i.e., propagating fields) in the cladding, consequently Fabry-Perot-
like resonances appear in the cladding. As a result, the leakage rate of the core “mode”
depends in a complicated oscillatory manner on the cladding thickness as well as the
1.4. FABRICATION 9
properties of the external medium, making the leaky core mode look more like a Mie res-
onance than a bound mode [64]. The kagome fibers typically have larger core diameters
than the PBG-PCFs, hence allowing them to support several such leaky resonances or
“modes”, resulting in higher losses than the PBG-PCFs, with the lowest loss achieved
thus far being 0.25 dB/m [72].
1.3.2.3 Bragg Fiber
Instead of employing two-dimensional periodicity in the fiber cladding, a one-dimensional
periodicity comprising of alternating multilayer of high and low index glasses (see Figure
1.3(c)) can also be used to confine light within a hollow core, resulting in what is known as
Bragg fibers, which were first proposed by Melekhin and Manenkov in 1968 [29] and Yeh
et al. in 1978 [30]. Bragg fibers based on omnidirectional mirrors have been demonstrated
[73] and utilized for delivery of high power lasers in endoscopic surgeries [74]. Note that
although strictly speaking the Bragg fiber cannot be categorized under PCF, it is included
here for reference.
1.4 Fabrication
The stack-and-draw technique is the most commonly used process in PCF fabrication.
Initially, the stack is manually built on a macroscopic scale using capillaries with a ratio
of inner diameter to outer diameter (ID/OD) closely matching the air-filling fraction (d/Λ)
of the desired fiber microstructure. The completed stack (typically 1 meter long and a
few centimeters in diameter) is then inserted into a jacket tube and drawn into preforms
of a few millimeters in diameter. Subsequently, the preform is either drawn directly
into fibers using a conventional fiber drawing tower, or drawn into canes before being
drawn into fibers in case a large scale reduction factor is required, as shown in Figure 1.4
for a hollow-core PBG-PCF. The newly-drawn optical fibers are then coated with high
performance polymers cured by ultraviolet (UV) exposure to improve their mechanical
properties. Techniques such as extrusion [59], built-in-casting [75] and drilling [76] for
preform production allow fabrication of PCFs using materials with lower melting points.
10 CHAPTER 1. PHOTONIC CRYSTAL FIBERS
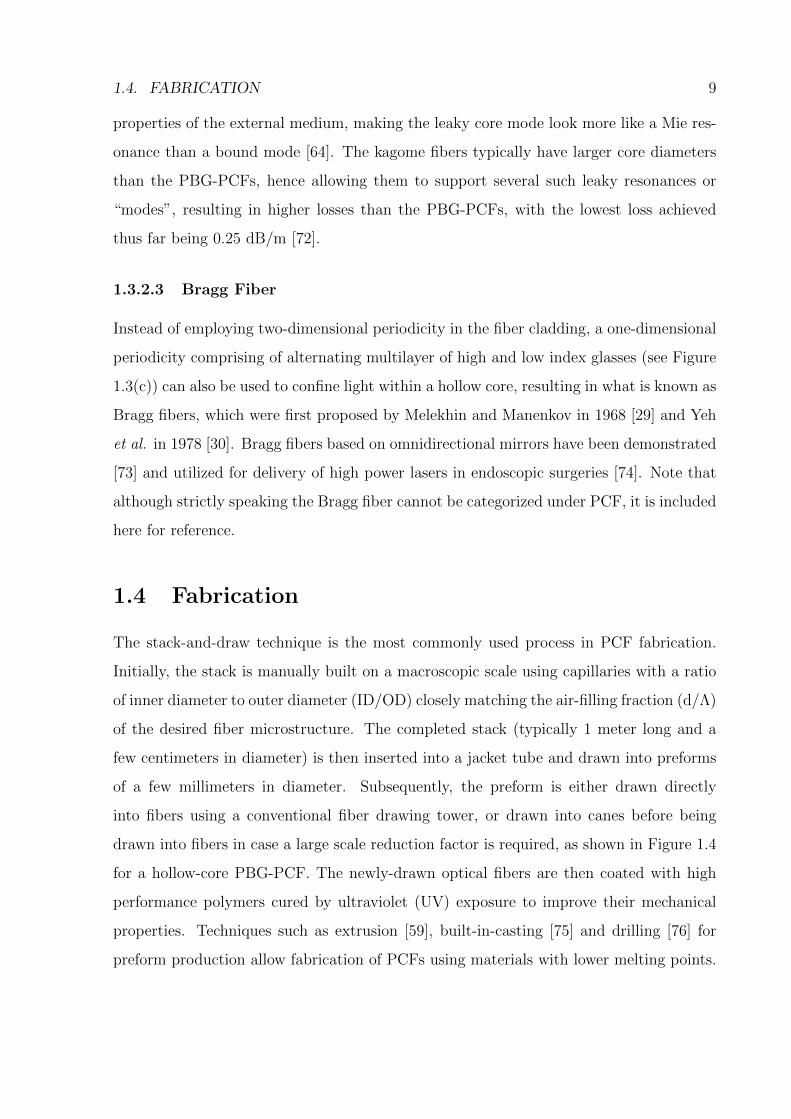
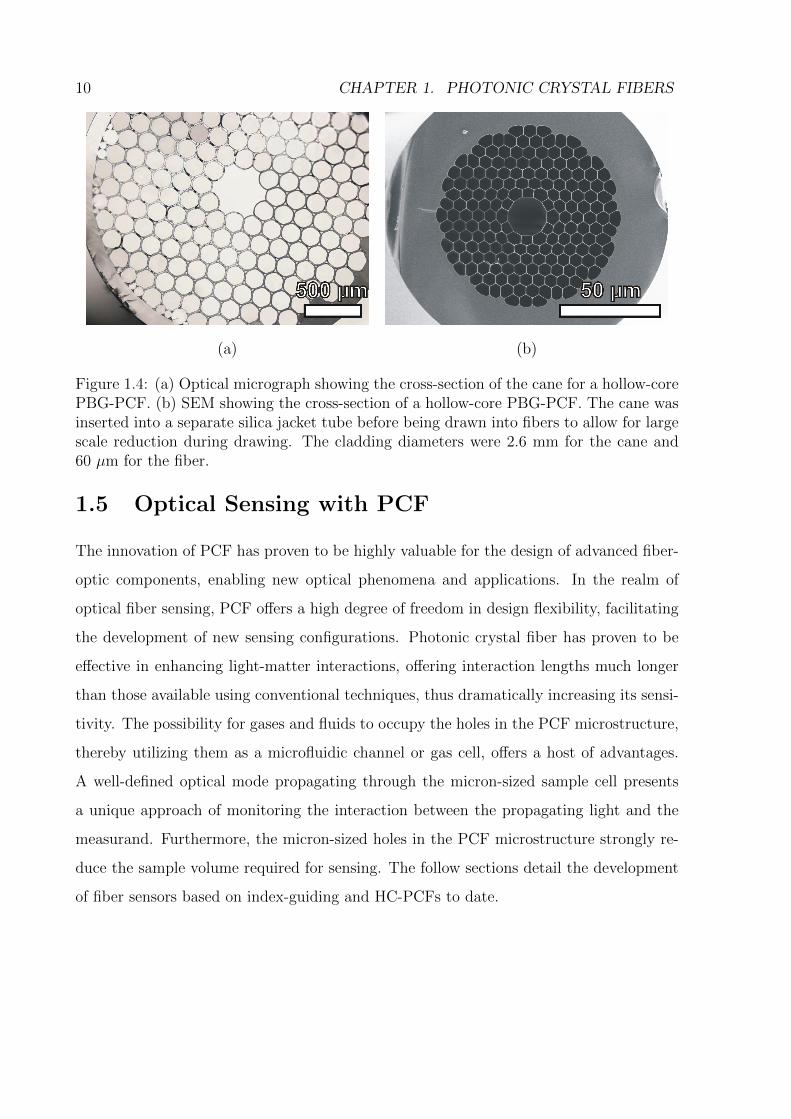
(a) (b)
Figure 1.4: (a) Optical micrograph showing the cross-section of the cane for a hollow-corePBG-PCF. (b) SEM showing the cross-section of a hollow-core PBG-PCF. The cane wasinserted into a separate silica jacket tube before being drawn into fibers to allow for largescale reduction during drawing. The cladding diameters were 2.6 mm for the cane and60 µm for the fiber.
1.5 Optical Sensing with PCF
The innovation of PCF has proven to be highly valuable for the design of advanced fiber-
optic components, enabling new optical phenomena and applications. In the realm of
optical fiber sensing, PCF offers a high degree of freedom in design flexibility, facilitating
the development of new sensing configurations. Photonic crystal fiber has proven to be
effective in enhancing light-matter interactions, offering interaction lengths much longer
than those available using conventional techniques, thus dramatically increasing its sensi-
tivity. The possibility for gases and fluids to occupy the holes in the PCF microstructure,
thereby utilizing them as a microfluidic channel or gas cell, offers a host of advantages.
A well-defined optical mode propagating through the micron-sized sample cell presents
a unique approach of monitoring the interaction between the propagating light and the
measurand. Furthermore, the micron-sized holes in the PCF microstructure strongly re-
duce the sample volume required for sensing. The follow sections detail the development
of fiber sensors based on index-guiding and HC-PCFs to date.
1.5. OPTICAL SENSING WITH PCF 11
(a) (b)
Figure 1.5: Schematic illustration of the active sensing regions around the core of (a) anindex-guiding PCF and (b) a hollow-core PBG-PCF.
1.5.1 Index-Guiding PCF Sensors
Most of the existing optical sensing techniques are based on the evanescent spectroscopic
sensor design, whereby the evanescent field associated with the light propagating in the
confinement region of the device extends into the region where the analyte to be sensed
is located. In the case of optical fiber sensors, this tailing optical field can transfer energy
out of the fiber core to the absorbing species in the surrounding medium. Additionally,
the evanescent field can also be used to create fluorescence in the surrounding medium, or
couple fluorescence into the fiber core. The change in the optical transmission properties
of the fiber due to the evanescent absorption of the analyte is then monitored, or “sensed”.
This sensor design therefore requires the chemical fingerprint region of the electromagnetic
spectrum to lie within the wavelength range of the light guided in the optical fiber core.
In order to access the evanescent wave near the boundary of the core and cladding of
a conventional fiber, standard evanescent-wave fiber sensors necessitate the complete or
partial removal of the fiber cladding by chemical etching [77], precise flame control [78], or
polishing [79, 80] to form a D-shape fiber. Alternatively, the evanescent wave of a tapered
fiber [81] can also be used to enhance the interaction between the guided light and the
sample [82].
12 CHAPTER 1. PHOTONIC CRYSTAL FIBERS
The sensing mechanism of index-guiding PCF sensors is also based on the evanescent
interaction between the guided optical field and the sample, akin to that in the conven-
tional sensors (as shown in Figure 1.5(a)). However, they do not require cumbersome
post-processing procedures, since the presence of air-holes in the cladding microstructure
allows the accommodation of biological and chemical samples in gaseous or liquid forms
in the immediate vicinity of the fiber core. In addition, PCFs naturally integrate opti-
cal detection with microfluidics, allowing for continuous on-line monitoring of samples in
real-time. The infiltration of sample into the PCF cladding holes also allows the fiber to
maintain its original structure, without the need to even remove the polymer coating of
the fiber. Consequently the index-guiding PCF provides superior structural robustness
compared to the conventional fiber sensors.
The evanescent-wave PCF sensor configuration was first theoretically and numerically
studied by Monro et al. [83, 84]. In principle, strong light-matter interaction requires a
significant modal power overlap with the fiber holes within the wavelength range of the
sample absorption spectrum. The power overlap decreases with core size and increases
with wavelength, as light of longer wavelength is less tightly confined in the solid core of
the index-guiding PCF. Therefore, a larger fraction of the guided mode extends into the
cladding holes. The first experimental demonstration of evanescent-wave gas detection
with PCF used an index-guiding PCF with a length of 75 cm for the detection of acetylene
[85, 86]. The fiber used had a relatively low power overlap (∼ 5.5 % at 1530 nm) of the
optical field with the sample; nevertheless the long interaction length provided by the
PCF was able to compensate for weak light-matter interaction. Several approaches have
been reported in order to improve sensitivity of PCF sensors. For example, dual-cladding
PCF in which the solid fiber core was fabricated with additional holes to increase the
interaction of the optical field with the sample (e.g. from 0.041% to 4.22% at 633 nm for
a water-filled fiber [87]). The relatively simple concept of suspended-core fiber in which
a small core is held in air by three thin silica struts was introduced by ref. [83]. These
fibers have demonstrated large modal overlap of 29% at 1550 nm, which can find useful
applications in gas sensing [88].
In addition to chemical sensing, the evanescent-wave configuration has also been ap-
plied to biosensing, whereby fluorescently labeled antibodies in aqueous solution were
1.5. OPTICAL SENSING WITH PCF 13
detected via absorption spectroscopy [89]. Furthermore, SC-PCF has demonstrated su-
perior performance in surface-specific spectroscopy, whereby fluorescence sensing can be
optimized with improved detection efficiency of biomolecules compared to conventional
single-mode fibers [90, 91]. Additionally, it is worth noting that an axially periodic re-
fractive index variation can be inscribed in the solid core of PCFs, known as long-period
gratings (LPGs). These LPGs written in PCF are highly sensitive to refractive index vari-
ations of the external medium [92], and have been demonstrated as a label-free technique
for detection of biomolecules [93], as well as for temperature and strain measurements [94].
Finally, structural rocking filters can be fabricated by periodically twisting birefringent
PCFs [95]. Measurements of the sensitivity of the resonance wavelengths of the rocking
filters to temperature, strain and hydrostatic pressure have demonstrated application in
hydrostatic pressure sensing with very low cross-sensitivity to temperature [96].
1.5.2 Hollow-Core PCF Sensors
In addition to the various advantages mentioned in the previous sections, HC-PCFs exhibit
a significant advantage for sensing applications over evanescent wave PCF sensors in that
the modal overlap with the sample is considerably improved, guiding more than 90% of
the power in the core defect of the fiber. The direct interaction of the light and the sample
within the hollow fiber core is depicted in Figure 1.5(b). Consequently, the strong light
confinement provided by the PBG and the possibility of tuning the PBG by tailoring the
structural parameters have attracted much attention in the field of fiber sensors.
It has been shown that the hollow core of the PBG-PCF selectively filled with a dye
solution achieved an almost 100% modal overlap with the sample material, surpassing the
performance of index-guiding PCFs [97]. In particular, the detection limit of fluorescence
sensing was demonstrated to improve by four orders of magnitude. The study of gas
characteristics using PBG-PCF has been performed using a light-emitting diode (LED)
to measure the absorption spectra of hazardous gases [98]. The results obtained demon-
strated that gas sensing in PCF is feasible using low-power, cost-effective light sources to
realize miniaturization of the system setup.
In terms of biosensing applications, HC-PCF Bragg fiber has been demonstrated for
the detection of single-stranded deoxyribonucleic acid (DNA) by monitoring the changes

14 CHAPTER 1. PHOTONIC CRYSTAL FIBERS
in the confinement loss of the Bragg fiber [99]. A Fabry-Perot strain sensor based on HC-
PCF has also been demonstrated to feature multiplexing capability, wide free-spectral
range, and insensitivity to temperature and fiber bending [100].
Chapter 2
Experimental Considerations and
Techniques
2.1 Introduction
Photonic crystal fiber sensors offer two modes of operation, namely, the resonant and non-
resonant regimes of sensing. In the non-resonant regime, one takes advantage of the large
optical modal overlap with the sample. Sensing is realized by monitoring changes in the
imaginary part of the sample’s refractive index, i.e., analyte absorption, by detecting the
presence and strength of the absorption bands within the fiber transmission spectrum, as
depicted in Figure 2.1(a). In this case, the absorption signal strength and sensor sensitivity
are directly proportional to the fiber sensor length, as will be shown in Section 2.2.
The second mode of operation of PCF-based sensor operates in the resonant regime
and can be categorized into two types. The first type relies on monitoring the changes in
the real part of the sample’s refractive index, by detecting the variations in the optical
confinement of a mode propagating inside a resonant fiber structure such as the PBG-PCF.
As the real part of the sample’s refractive index changes, the resonant condition for modal
confinement will also change, resulting in a strong variation of the fiber transmission loss,
as depicted in Figure 2.1(b). Such sensors can also operate in the non-resonant mode for
detection of changes in the imaginary part of the sample’s refractive index. The second
type of resonant sensors operate in the vicinity of a phase-matching wavelength between
a core-guided mode and a second mode which is sensitive to changes in the real part of
15
16 CHAPTER 2. EXPERIMENTAL CONSIDERATIONS AND TECHNIQUES
na
n i na+ Im{ }�
n na+Re{ }�
na
n
n
a -Re{
}�
(a)
Mo
dal
lo
ss
Mo
dal
lo
ss
�
(b)
�
Figure 2.1: Operational principles of optical sensors in the (a) non-resonant and (b)resonant regimes, whereby changes in the sensor transmission loss due to variations in the(a) imaginary and (b) real part of the analyte’s refractive index are monitored [8].
the sample’s refractive index, such as an absorbing plasmon mode propagating at the
interface between the analyte and the metal-coated fiber surface. As the real part of the
sample’s refractive index changes, the phase-matching condition between the core and
plasmon mode also changes, resulting in strong optical loss of the core mode at a specific
resonant wavelength [101, 102].
In this chapter, the figures-of-merit for sensing and photochemical reactions are intro-
duced in Section 2.2 to determine the ideal experimental conditions in PCF. The setup
and instrumentation considerations, including the transmission properties of liquid-filled
PCF, various components of the optical setup, microfluidic flow through the fiber and
computer automation of data acquisition, are summarized in Section 2.3. Finally, various
fabrication techniques for PCF devices, especially for sensors and photochemical reactors,
are described in Section 2.4.
2.2. DETECTION STRATEGIES AND IDEAL CONDITIONS 17
2.2 Detection Strategies and Ideal Conditions
2.2.1 Ideal Conditions for Absorption-Based Sensors
There are four major optical transduction mechanisms used in fiber-optic sensors, by
which the presence of a target analyte induces changes in the transmission of light through
the optical fiber, namely, absorbance, fluorescence or chemical luminescence, Raman scat-
tering, and surface plasmon resonance. The PCF sensors described in this thesis are based
on the exploitation of changes in the fiber transmission losses as a result of absorption by
the sample. The absorption-based sensing methodology can be based on both amplitude
and spectral interrogation.
In amplitude-based detection methodology, changes in the amplitude of an optical
signal at a given wavelength λ are used to deduce the changes in the analyte’s refractive
index. An amplitude sensitivity function S(λ, L) can be employed to characterize the
sensitivity of a fiber-optic sensor of length L [8]. S(λ, L) represents the relative change in
the irradiance P (δ, λ, L) of the transmitted light for an infinitesimal change in the measur-
and, δ, which can be any parameter capable of influencing the transmission properties of
a fiber sensor, such as the concentration and the real or imaginary parts of the refractive
index of the sample, and is defined as
S(λ, L) = limδ→0
P (δ, λ, L)− P (0, λ, L)
δ · P (0, λ, L)=∂P (δ, λ, L)/∂δ|δ=0
P (0, λ, L). (2.1)
The irradiance of light at the fiber output can be written as
P (δ, λ, L) = Pin(λ) exp[−α(δ, λ)L], (2.2)
where Pin(λ) is the light irradiance at the fiber input and α(δ, λ) is the fiber propaga-
tion loss. By substituting Equation (2.2) into Equation (2.1), the amplitude sensitivity
function can be rewritten as
S(λ, L) = − ∂α(δ, λ)
∂δ
∣∣∣∣δ=0
· L. (2.3)
According to classic perturbation theory, changes in the effective refractive index ∆neff
of a guided mode are related to the changes in the refractive index ∆na of the analyte
infiltrating the fiber,
∆neff = ∆na · φ = Re(∆na) · φ+ iIm(∆na) · φ, (2.4)
18 CHAPTER 2. EXPERIMENTAL CONSIDERATIONS AND TECHNIQUES
where φ is the fraction of power overlap in the analyte.
An important goal for non-resonant absorption-based sensors is the identification of
sample materials by the spectral shape of their absorption. Furthermore, the concentra-
tion of certain chemical compounds in the sample can be deduced from the magnitude of
the corresponding absorption peak. Defining N to be the number density of the absorbing
particles in the analyte, so that δ = N , it follows from Equation (2.4) that the total fiber
loss in the presence of absorbing sample can be written as
α(N, λ) = αf (λ) + σ(λ)Nφ, (2.5)
based on α(N, λ) ∼ Im(neff) and Im(∆na) ∼ σ(λ)N , where αf (λ) is the fiber loss in
the absence of the absorbing sample and σ(λ) is the absorption cross-section of a single
particle. Substituting Equation (2.5) into Equation (2.3) yields an expression for the
amplitude sensitivity function based on the experimental variables,
S(λ, L) = −σ(λ)φL. (2.6)
It follows from Equation (2.6) that the sensitivity of the fiber sensor is proportional to its
length and the fractional modal overlap of the guided mode with the sample analyte.
In fact, the absorption of light by a sample described in Equation (2.2) is the commonly
used Beer-Lambert law which relates the absorption of light to the properties of the
material through which it is traveling. Here, the conventional law is slightly modified to
take into account the fraction of the light φ that travels through the sample. The resulting
absorbance is
A(λ) = σ(λ)Nφ(λ)L = ln(10)ε(λ)cφ(λ)L, (2.7)
where ε(λ) is the molar absorptivity of the sample in Lmol−1cm−1, c is the molar concen-
tration of the sample in molL−1 (or simply in molar, M, as will be used interchangeably
throughout the thesis), and the mode-field overlap φ is wavelength dependent as will be
shown in Chapter 4. The convention of expressing the absorbance in dB, defined as
AdB(λ) = 10ε(λ)cφ(λ)L = 10 log10(e)σ(λ)Nφ(λ)L (2.8)
will be used throughout the thesis.
From Equations (2.6) and (2.7) one sees that the sensitivity is directly linked to the
absorbance signal amplitude, while Equation (2.2) signifies that the upper limit of the
2.2. DETECTION STRATEGIES AND IDEAL CONDITIONS 19
1 10 1000.01
0.1
1
10
100
φ [%]
Fib
er
length
[m
]
1 cm cuvette
1.1 m SC-PCF
39 cm HC-PCFεc = 1 cm-1
εc = 0.1 cm-1
εc = 0.01 cm-1εc = 0.001 cm-1
Figure 2.2: Ideal sensing parameter diagram for constant absorbance of 5 dB, plottedin the φ-L plane, defining regions in which optimum sensing conditions can be achieved.The contour lines are of fixed εc. For a given εc, any combination of φ and L that lieson the corresponding line will result in a 5 dB absorbance signal. The fine dashed line at20 m indicates the fiber length above which the fiber loss becomes too high for sensitivemeasurement due to the power budget (ηdet is assumed to be 20 dB in this case). Thesolid circle, square and diamond symbols represent the experimental conditions for thesensing and photochemistry experiments in a 1 cm cuvette, 1.1 m of suspended SC-PCFand 39 cm of kagome HC-PCF described in Chapters 3 and 4.
sensor length is defined by the loss of the fiber. Assuming Pdet(λ) to be the lowest output
irradiance level of light at which changes can still be detected reliably, the maximum
sensor length allowed by the power detection limit can be calculated from Equation (2.2)
as
L =ηdet(λ)
αf (λ), (2.9)
where ηdet = ln[Pin(λ)/Pdet(λ)] is related to the power budget. Assuming that ηdet(λ) = 1
to allow for the characterization of the inherent sensitivity of the sensor, irrespective of any
additional power-dependent sensitivity enhancement, the maximum sensitivity allowed by
the power detection limit can be obtained by substituting Equation (2.9) into Equation
(2.6):
S(λ) = −φ σ(λ)
αf (λ). (2.10)
Note that as the absorption cross-section (similarly, the molar absorptivity) is completely
independent of the fiber loss, the sensitivity of the fiber sensor can therefore be increased
by using longer fibers with low propagation loss.
A general parameter diagram is shown in Figure 2.2 to provide further insight into
20 CHAPTER 2. EXPERIMENTAL CONSIDERATIONS AND TECHNIQUES
the optimum design parameters for fiber sensors. The absorbance signal (and hence the
sensitivity) is kept constant at AdB = 5 dB, which is sufficiently large to be detected by
any spectrometer of adequate signal-to-noise ratio and dynamic range. The lines in the
φ-L plane indicate contours of constant εc obtained from Equation (2.8). For a given
εc, any combination of φ and L that lies on the corresponding line will result in a 5 dB
absorbance signal. The lines thus define regions in which optimum sensing conditions can
be achieved. The intrinsic fiber loss in the absence of the absorbing particles is assumed
to be 1 dBm−1 in the calculations, while the power budget ηdB is assumed to be 20 dB.
The figure clearly demonstrates that the minimum value of a measurand, in this case the
concentration of the absorbing particles in the analyte, that can be detected by such a
fiber sensor is limited by the fiber loss, as indicated by the fine dashed line (at 20 m of fiber
length), since the sensitivity is limited by αf (λ) as shown in Equation (2.10). Depending
on the characteristics of the fiber used, the maximum fractional power overlap with the
sample can also be limited by the slope dφ(λ)/dλ for large values of φ(λ), resulting in a
sensitivity gradient in the measured absorption spectra. While the gradient in φ(λ) can
be compensated for, it is preferable to operate at lower values of φ, where it does not vary
much with wavelength.
2.2.2 Figure of Merit for Photochemistry
Photonic crystal fibers also provide a platform for performing photochemical reactions
within the holes of its microstructure. It is useful to examine critically the advantages
that PCF offers over a conventional cuvette-based sample cell (see Figure 2.3). Two im-
portant parameters determine the effectiveness of a photochemical experiment. Firstly,
the effective path length of the probe light (defined as the length at which the irradiance
drops to 1/e of the initial value in the pure liquid host, that is, in the absence of any
absorbing particle) should be long enough to allow detection of low concentrations. Sec-
ondly, the cross-sectional area of the sample cell should be as small as possible, so as to
maximize the irrdiance of the optical pump field; high intensities are required to achieve
rapid conversion, in particular for reactions with low quantum yields. Assuming that the
objective is to achieve complete photolytic conversion of all the chemicals in the sample,
2.2. DETECTION STRATEGIES AND IDEAL CONDITIONS 21
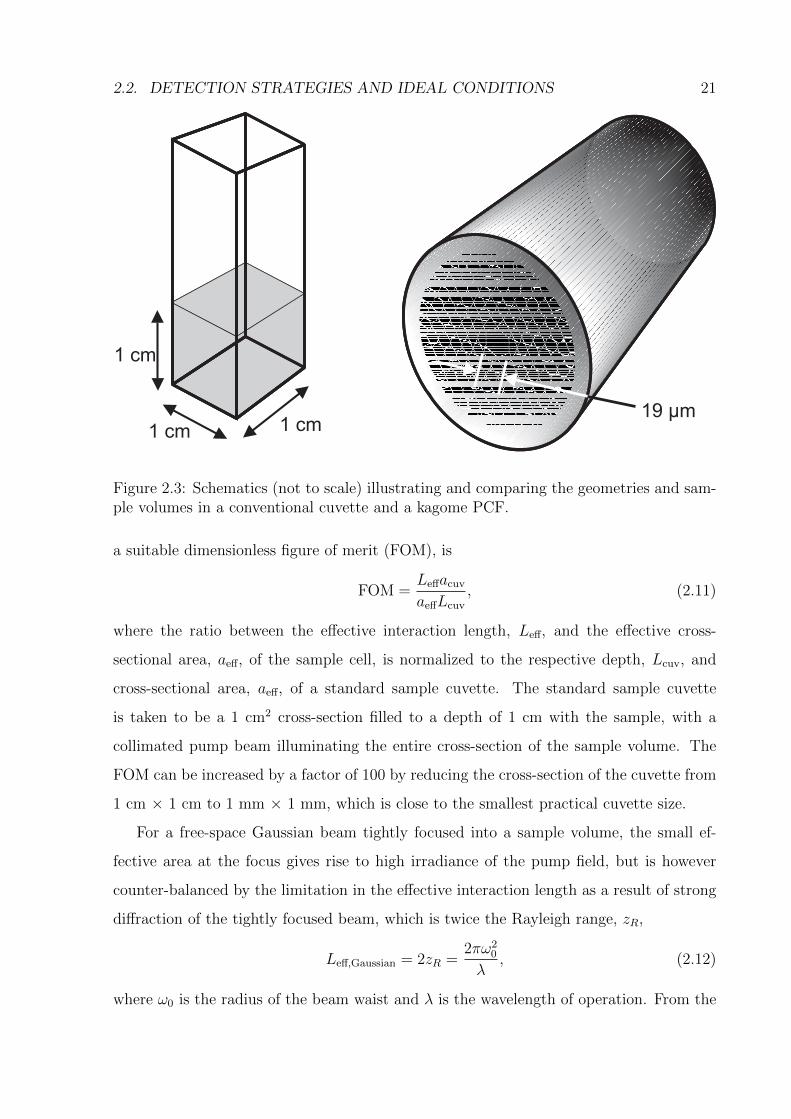
1 cm
1 cm 1 cm19 µm
Figure 2.3: Schematics (not to scale) illustrating and comparing the geometries and sam-ple volumes in a conventional cuvette and a kagome PCF.
a suitable dimensionless figure of merit (FOM), is
FOM =Leffacuv
aeffLcuv
, (2.11)
where the ratio between the effective interaction length, Leff, and the effective cross-
sectional area, aeff, of the sample cell, is normalized to the respective depth, Lcuv, and
cross-sectional area, aeff, of a standard sample cuvette. The standard sample cuvette
is taken to be a 1 cm2 cross-section filled to a depth of 1 cm with the sample, with a
collimated pump beam illuminating the entire cross-section of the sample volume. The
FOM can be increased by a factor of 100 by reducing the cross-section of the cuvette from
1 cm × 1 cm to 1 mm × 1 mm, which is close to the smallest practical cuvette size.
For a free-space Gaussian beam tightly focused into a sample volume, the small ef-
fective area at the focus gives rise to high irradiance of the pump field, but is however
counter-balanced by the limitation in the effective interaction length as a result of strong
diffraction of the tightly focused beam, which is twice the Rayleigh range, zR,
Leff,Gaussian = 2zR =2πω2
0
λ, (2.12)
where ω0 is the radius of the beam waist and λ is the wavelength of operation. From the
22 CHAPTER 2. EXPERIMENTAL CONSIDERATIONS AND TECHNIQUES
definition for FOM in Equation (2.11), the FOM for a tightly-focused Gaussian beam in
free space is therefore inversely proportional to the wavelength of operation.
Hollow capillaries could be used to further decrease the cross-section, allowing FOM
to be increased by a further three orders of magnitude. However, the effective length of
such a sample cell is limited by optical leakage losses. With the conventional notations for
the electric field and irradiance of the EHnm mode (n 6= 0) as Enm(z) = E0 exp(−αnmz)
and Inm(z) = I0 exp(−2αnmz), respectively, the attenuation coefficient αnm for a perfectly
straight hollow capillary is [103]
αnm =(unm
2π
)2 λ2
r3
ν2 + 1
2√ν2 − 1
, (2.13)
where r is the bore radius, ν = n2/n1 is the ratio of the refractive indices of the capillary
cladding to the material in the hollow bore, and unm is the mth root of the equation
Jn−1(unm) = 0. With unm = 2.405 for the EH11 mode, the 1/e decay length is therefore
given by
Leff,capillary = 6.83r3
λ2
√ν2 − 1
ν2 + 1. (2.14)
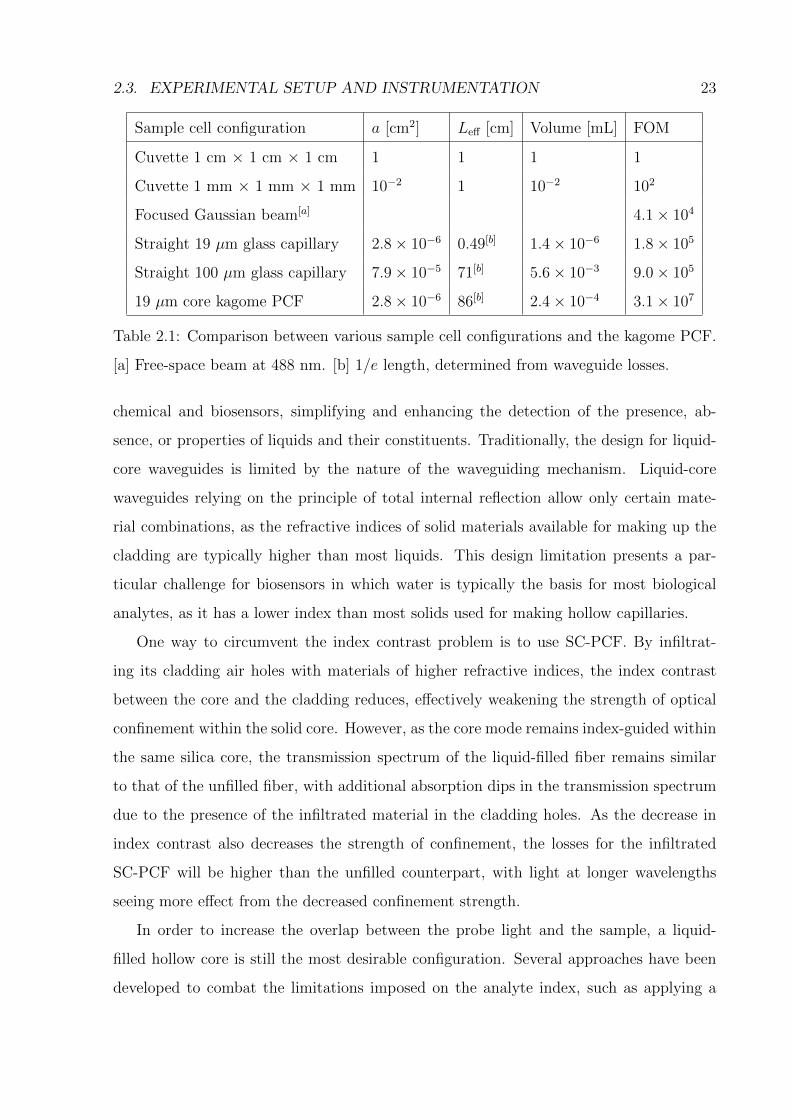
The HC-PCF provides a near-ideal sample cell for photochemical reactions in that it
allows for single-mode guidance in a hollow core and the FOM is only limited by the fiber
loss rate, which dictates Leff. Table 2.1 shows the comparison between hollow capillaries
and the kagome HC-PCF used in the experiments. It is worth noting that the losses in
hollow capillary waveguides are very sensitive to even slight bends, making the use of long
capillaries very difficult. In contrast, hollow-core PCFs are almost completely insensitive
to bend losses, and the measured waveguide loss of the PCF used in the experiments is
175 times lower than the calculated loss of a hollow capillary with the same core diameter.
As a result, FOM for the kagome PCF is 175 times higher than a capillary with similar
dimensions, and more than seven orders of magnitude higher than a standard cuvette.
2.3 Experimental Setup and Instrumentation
2.3.1 Transmission Properties of Liquid-Filled PCF
Liquids play a prominent role in the fields of chemistry and biology, and since the emer-
gence of PCF, it has been suggested to utilize these fibers for the miniaturization of
2.3. EXPERIMENTAL SETUP AND INSTRUMENTATION 23
Sample cell configuration a [cm2] Leff [cm] Volume [mL] FOM
Cuvette 1 cm × 1 cm × 1 cm 1 1 1 1
Cuvette 1 mm × 1 mm × 1 mm 10−2 1 10−2 102
Focused Gaussian beam[a] 4.1× 10⁴
Straight 19 µm glass capillary 2.8× 10⁻⁶ 0.49[b] 1.4× 10⁻⁶ 1.8× 10⁵
Straight 100 µm glass capillary 7.9× 10⁻⁵ 71[b] 5.6× 10⁻³ 9.0× 10⁵
19 µm core kagome PCF 2.8× 10⁻⁶ 86[b] 2.4× 10⁻⁴ 3.1× 10⁷
Table 2.1: Comparison between various sample cell configurations and the kagome PCF.
[a] Free-space beam at 488 nm. [b] 1/e length, determined from waveguide losses.
chemical and biosensors, simplifying and enhancing the detection of the presence, ab-
sence, or properties of liquids and their constituents. Traditionally, the design for liquid-
core waveguides is limited by the nature of the waveguiding mechanism. Liquid-core
waveguides relying on the principle of total internal reflection allow only certain mate-
rial combinations, as the refractive indices of solid materials available for making up the
cladding are typically higher than most liquids. This design limitation presents a par-
ticular challenge for biosensors in which water is typically the basis for most biological
analytes, as it has a lower index than most solids used for making hollow capillaries.
One way to circumvent the index contrast problem is to use SC-PCF. By infiltrat-
ing its cladding air holes with materials of higher refractive indices, the index contrast
between the core and the cladding reduces, effectively weakening the strength of optical
confinement within the solid core. However, as the core mode remains index-guided within
the same silica core, the transmission spectrum of the liquid-filled fiber remains similar
to that of the unfilled fiber, with additional absorption dips in the transmission spectrum
due to the presence of the infiltrated material in the cladding holes. As the decrease in
index contrast also decreases the strength of confinement, the losses for the infiltrated
SC-PCF will be higher than the unfilled counterpart, with light at longer wavelengths
seeing more effect from the decreased confinement strength.
In order to increase the overlap between the probe light and the sample, a liquid-
filled hollow core is still the most desirable configuration. Several approaches have been
developed to combat the limitations imposed on the analyte index, such as applying a
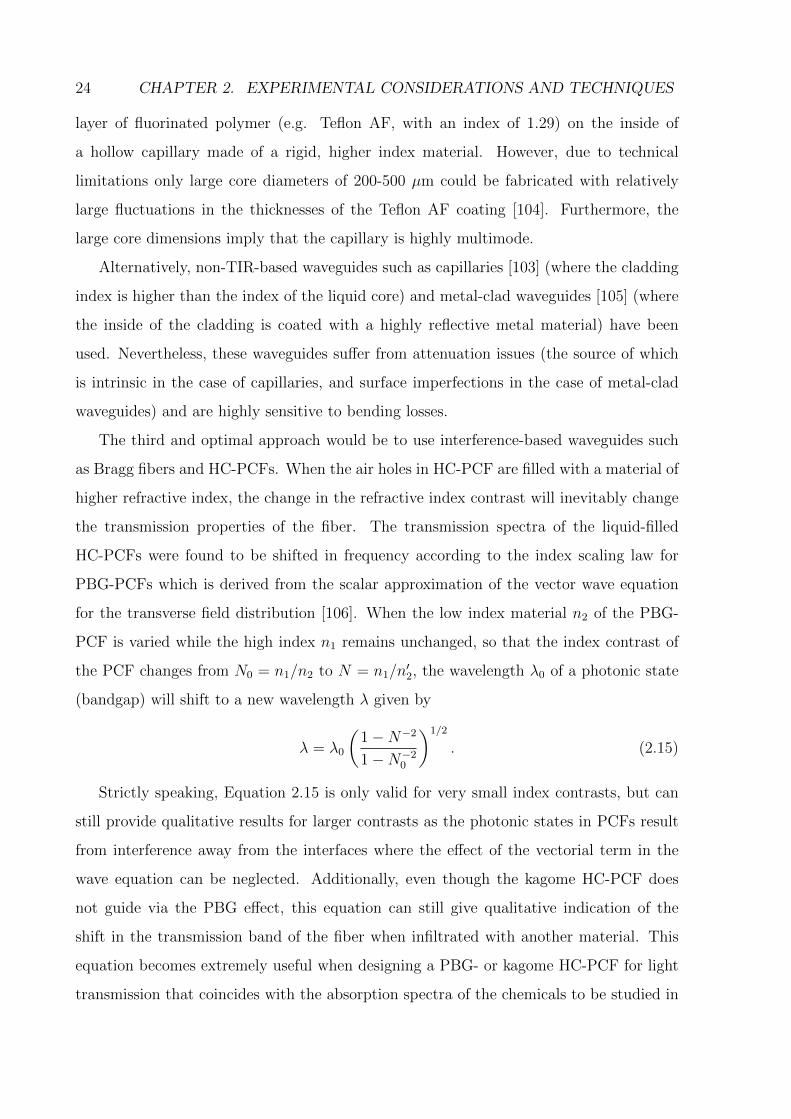
24 CHAPTER 2. EXPERIMENTAL CONSIDERATIONS AND TECHNIQUES
layer of fluorinated polymer (e.g. Teflon AF, with an index of 1.29) on the inside of
a hollow capillary made of a rigid, higher index material. However, due to technical
limitations only large core diameters of 200-500 µm could be fabricated with relatively
large fluctuations in the thicknesses of the Teflon AF coating [104]. Furthermore, the
large core dimensions imply that the capillary is highly multimode.
Alternatively, non-TIR-based waveguides such as capillaries [103] (where the cladding
index is higher than the index of the liquid core) and metal-clad waveguides [105] (where
the inside of the cladding is coated with a highly reflective metal material) have been
used. Nevertheless, these waveguides suffer from attenuation issues (the source of which
is intrinsic in the case of capillaries, and surface imperfections in the case of metal-clad
waveguides) and are highly sensitive to bending losses.
The third and optimal approach would be to use interference-based waveguides such
as Bragg fibers and HC-PCFs. When the air holes in HC-PCF are filled with a material of
higher refractive index, the change in the refractive index contrast will inevitably change
the transmission properties of the fiber. The transmission spectra of the liquid-filled
HC-PCFs were found to be shifted in frequency according to the index scaling law for
PBG-PCFs which is derived from the scalar approximation of the vector wave equation
for the transverse field distribution [106]. When the low index material n2 of the PBG-
PCF is varied while the high index n1 remains unchanged, so that the index contrast of
the PCF changes from N0 = n1/n2 to N = n1/n′2, the wavelength λ0 of a photonic state
(bandgap) will shift to a new wavelength λ given by
λ = λ0
(1−N−2
1−N−20
)1/2
. (2.15)
Strictly speaking, Equation 2.15 is only valid for very small index contrasts, but can
still provide qualitative results for larger contrasts as the photonic states in PCFs result
from interference away from the interfaces where the effect of the vectorial term in the
wave equation can be neglected. Additionally, even though the kagome HC-PCF does
not guide via the PBG effect, this equation can still give qualitative indication of the
shift in the transmission band of the fiber when infiltrated with another material. This
equation becomes extremely useful when designing a PBG- or kagome HC-PCF for light
transmission that coincides with the absorption spectra of the chemicals to be studied in
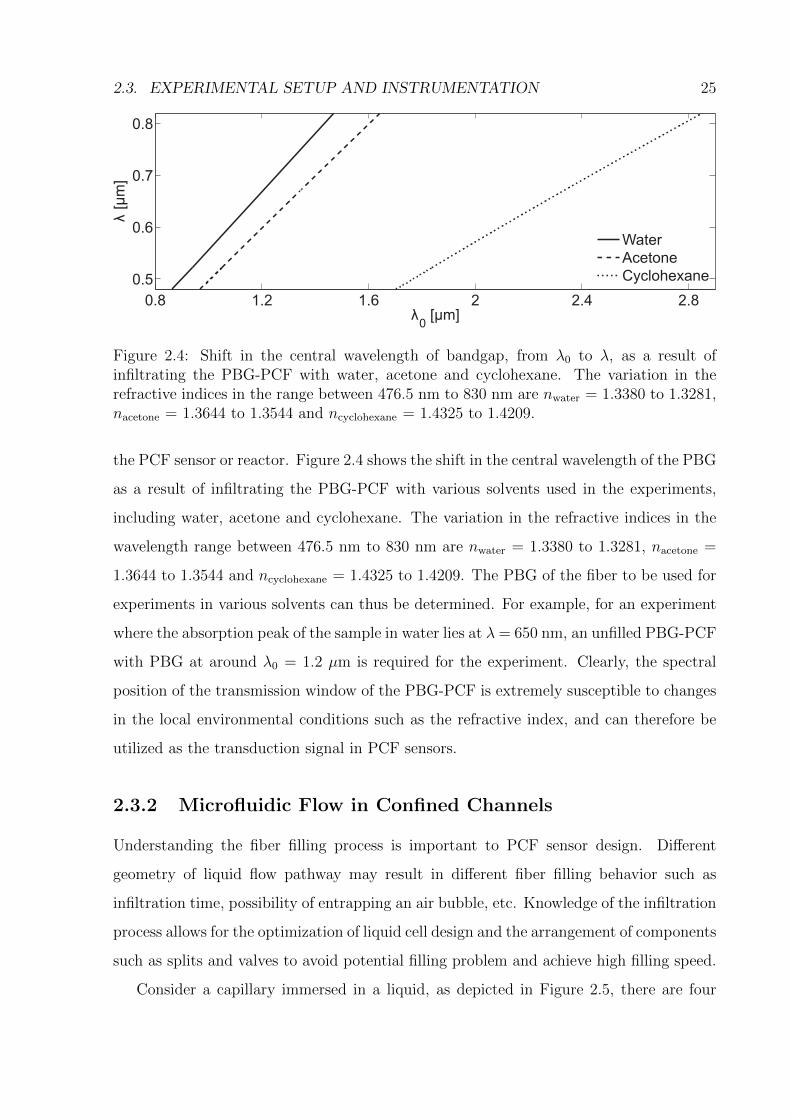
2.3. EXPERIMENTAL SETUP AND INSTRUMENTATION 25
0.8 1.2 1.6 2 2.4 2.8
0.5
0.6
0.7
0.8
λ0
[μm]
λ[μ
m]
Water
Acetone
Cyclohexane
Figure 2.4: Shift in the central wavelength of bandgap, from λ0 to λ, as a result ofinfiltrating the PBG-PCF with water, acetone and cyclohexane. The variation in therefractive indices in the range between 476.5 nm to 830 nm are nwater = 1.3380 to 1.3281,nacetone = 1.3644 to 1.3544 and ncyclohexane = 1.4325 to 1.4209.
the PCF sensor or reactor. Figure 2.4 shows the shift in the central wavelength of the PBG
as a result of infiltrating the PBG-PCF with various solvents used in the experiments,
including water, acetone and cyclohexane. The variation in the refractive indices in the
wavelength range between 476.5 nm to 830 nm are nwater = 1.3380 to 1.3281, nacetone =
1.3644 to 1.3544 and ncyclohexane = 1.4325 to 1.4209. The PBG of the fiber to be used for
experiments in various solvents can thus be determined. For example, for an experiment
where the absorption peak of the sample in water lies at λ = 650 nm, an unfilled PBG-PCF
with PBG at around λ0 = 1.2 µm is required for the experiment. Clearly, the spectral
position of the transmission window of the PBG-PCF is extremely susceptible to changes
in the local environmental conditions such as the refractive index, and can therefore be
utilized as the transduction signal in PCF sensors.
2.3.2 Microfluidic Flow in Confined Channels
Understanding the fiber filling process is important to PCF sensor design. Different
geometry of liquid flow pathway may result in different fiber filling behavior such as
infiltration time, possibility of entrapping an air bubble, etc. Knowledge of the infiltration
process allows for the optimization of liquid cell design and the arrangement of components
such as splits and valves to avoid potential filling problem and achieve high filling speed.
Consider a capillary immersed in a liquid, as depicted in Figure 2.5, there are four
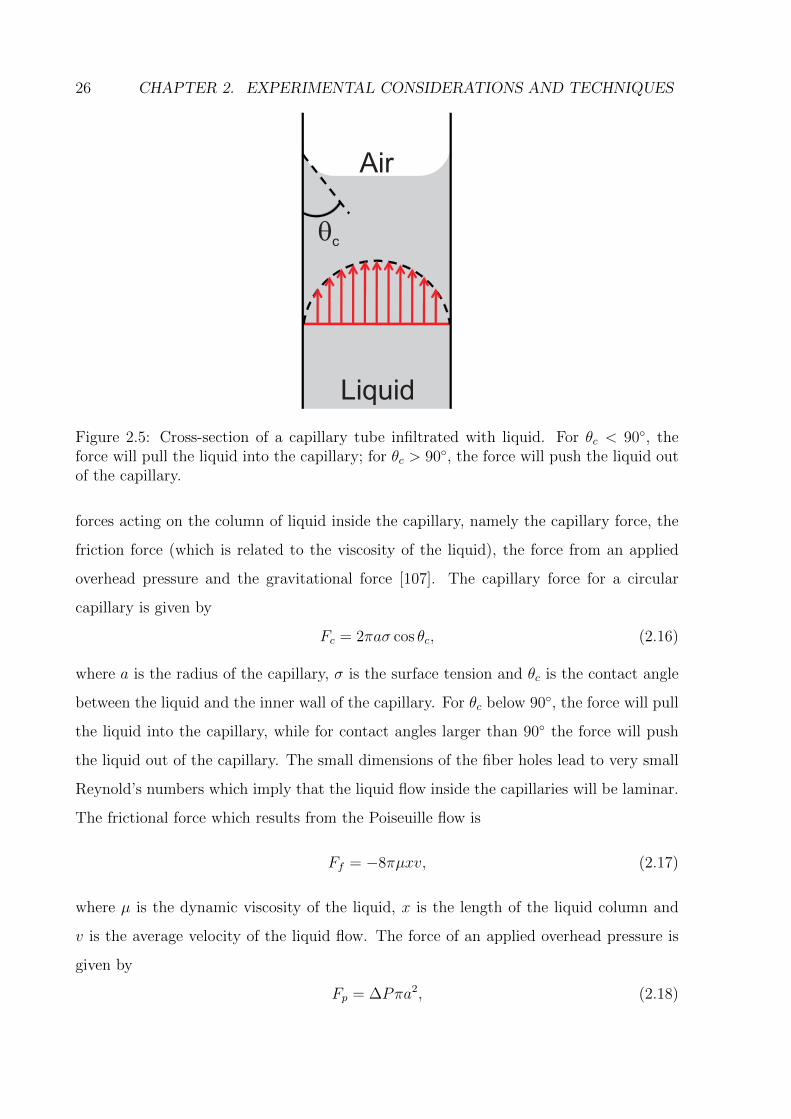
26 CHAPTER 2. EXPERIMENTAL CONSIDERATIONS AND TECHNIQUES
Air
Liquid
�c
Figure 2.5: Cross-section of a capillary tube infiltrated with liquid. For θc < 90◦, theforce will pull the liquid into the capillary; for θc > 90◦, the force will push the liquid outof the capillary.
forces acting on the column of liquid inside the capillary, namely the capillary force, the
friction force (which is related to the viscosity of the liquid), the force from an applied
overhead pressure and the gravitational force [107]. The capillary force for a circular
capillary is given by
Fc = 2πaσ cos θc, (2.16)
where a is the radius of the capillary, σ is the surface tension and θc is the contact angle
between the liquid and the inner wall of the capillary. For θc below 90◦, the force will pull
the liquid into the capillary, while for contact angles larger than 90◦ the force will push
the liquid out of the capillary. The small dimensions of the fiber holes lead to very small
Reynold’s numbers which imply that the liquid flow inside the capillaries will be laminar.
The frictional force which results from the Poiseuille flow is
Ff = −8πµxv, (2.17)
where µ is the dynamic viscosity of the liquid, x is the length of the liquid column and
v is the average velocity of the liquid flow. The force of an applied overhead pressure is
given by
Fp = ∆Pπa2, (2.18)
2.3. EXPERIMENTAL SETUP AND INSTRUMENTATION 27
where ∆P is the pressure difference between the liquid in the capillary and the open end
of the fiber. Finally, the gravitational force acting on the liquid column is
Fg = −ρgπa2x, (2.19)
where ρ is the density of the liquid and g is the gravitational constant. Balancing all four
forces acting on the liquid column yields
d
dt
(ρπa2xv
)= 2πaσ cos θc − 8πµxv + ∆Pπa2 − ρgπa2x. (2.20)
Noting that v = dx/dt and neglecting the gravitational term for a horizontally oriented
fiber, the equation can be expressed as
d2
dt2(x2)
+Bd
dt
(x2)
= A, (2.21)
where the constants A and B are
A =4σ cos θc + 2∆Pa
ρa, (2.22)
B =8µ
ρa2. (2.23)
The differential equation in Equation (2.21) has the solution
x(t) =
[A
B2exp(−Bt) +
A
Bt− A
B2
]1/2
. (2.24)
Figure 2.6 shows the simulated infiltration length as a function of filling time for water
in capillaries with bore radii of 1, 5 and 10 µm, with an applied pressure head of 1 bar.
The results clearly shows the strong dependence of the filling time on the size of the fiber
holes, with the larger core in the case of a HC-PCF being filled before the smaller holes
in the microstructured fiber cladding. In the case where the hollow core is completely
filled for the entire length of the fiber while the cladding holes are empty or only partially
filled, the fiber becomes index-guided as the core now has a higher index than the effective
index of the unfilled PCF cladding. The large index contrast and core size of the liquid-
filled fiber would lead to highly multimode guidance (∼ 103 for operation in the visible
wavelength region), resulting in difficult, if not impossible, coupling to the fundamental
mode, which is an undesirable effect especially if the measurements are phase-sensitive.
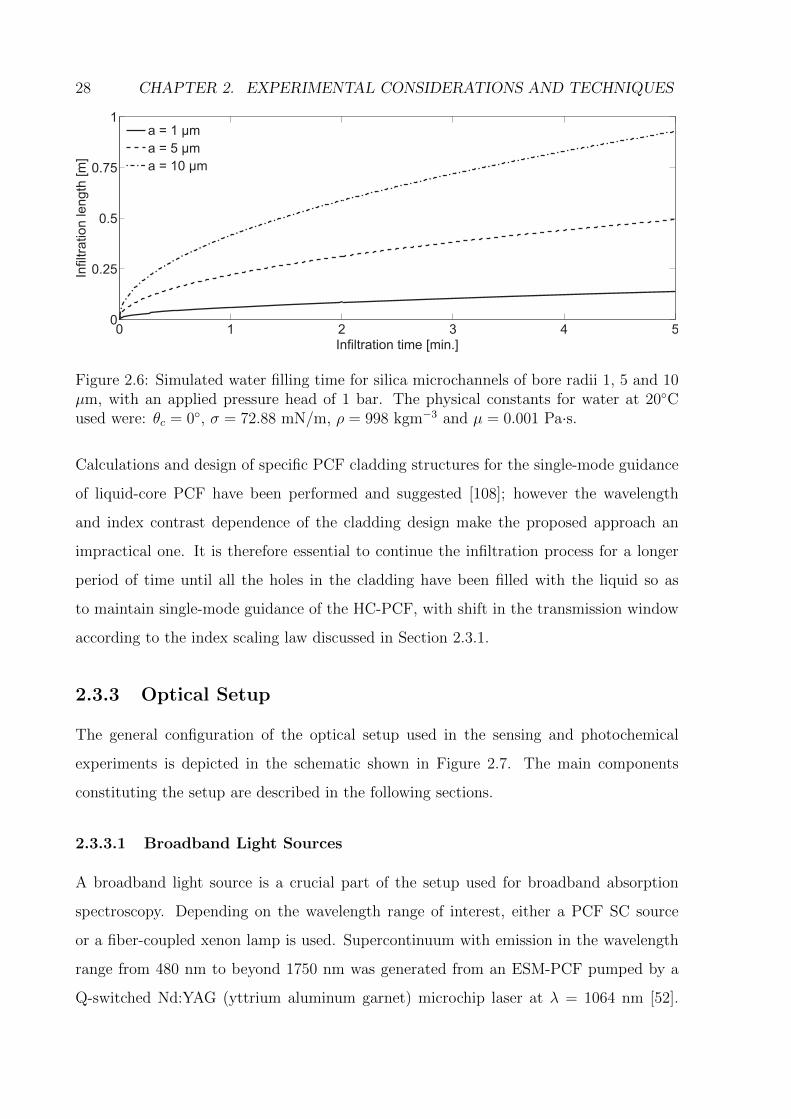
28 CHAPTER 2. EXPERIMENTAL CONSIDERATIONS AND TECHNIQUES
0 1 2 3 4 50
0.25
0.5
0.75
1
Infiltration time [min.]
Infiltra
tio
n le
ng
th [
m]
a = 1 µm
a = 5 µm
a = 10 µm
Figure 2.6: Simulated water filling time for silica microchannels of bore radii 1, 5 and 10µm, with an applied pressure head of 1 bar. The physical constants for water at 20◦Cused were: θc = 0◦, σ = 72.88 mN/m, ρ = 998 kgm−3 and µ = 0.001 Pa·s.
Calculations and design of specific PCF cladding structures for the single-mode guidance
of liquid-core PCF have been performed and suggested [108]; however the wavelength
and index contrast dependence of the cladding design make the proposed approach an
impractical one. It is therefore essential to continue the infiltration process for a longer
period of time until all the holes in the cladding have been filled with the liquid so as
to maintain single-mode guidance of the HC-PCF, with shift in the transmission window
according to the index scaling law discussed in Section 2.3.1.
2.3.3 Optical Setup
The general configuration of the optical setup used in the sensing and photochemical
experiments is depicted in the schematic shown in Figure 2.7. The main components
constituting the setup are described in the following sections.
2.3.3.1 Broadband Light Sources
A broadband light source is a crucial part of the setup used for broadband absorption
spectroscopy. Depending on the wavelength range of interest, either a PCF SC source
or a fiber-coupled xenon lamp is used. Supercontinuum with emission in the wavelength
range from 480 nm to beyond 1750 nm was generated from an ESM-PCF pumped by a
Q-switched Nd:YAG (yttrium aluminum garnet) microchip laser at λ = 1064 nm [52].
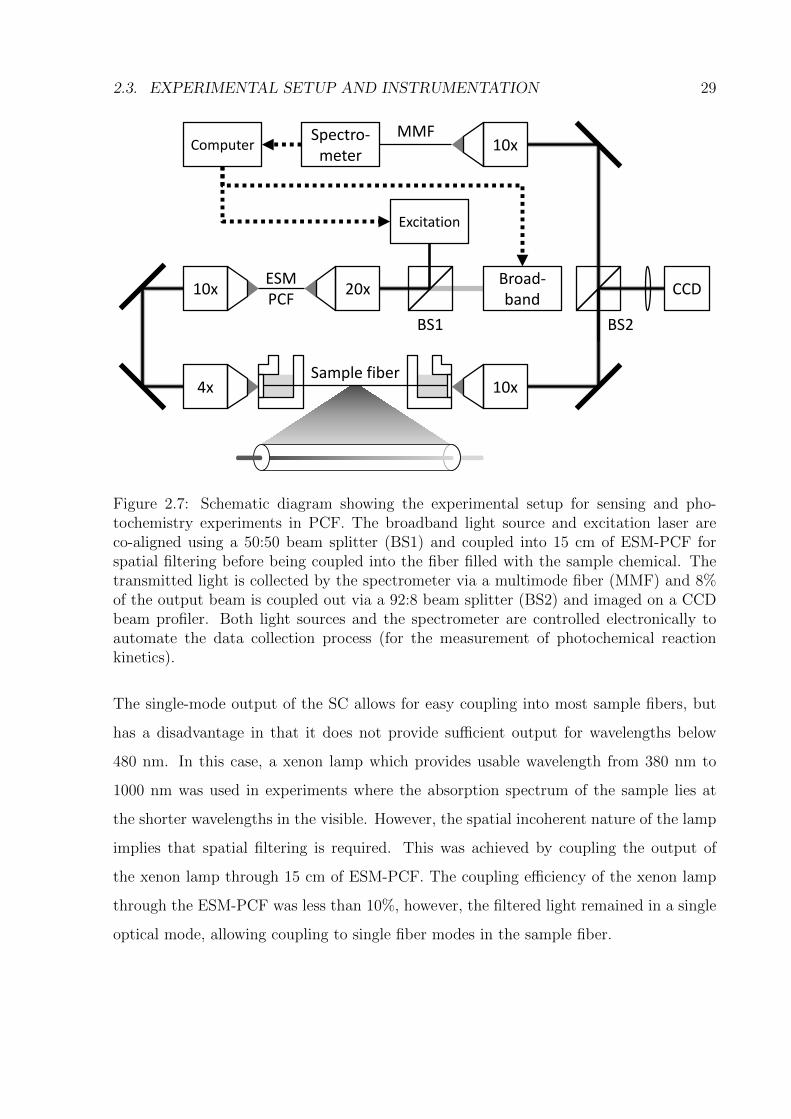
2.3. EXPERIMENTAL SETUP AND INSTRUMENTATION 29
10x4x
10x 20xBroad-band
10xSpectro-
meterComputer
Excitation
CCD
Sample fiber
ESM PCF
MMF
BS1 BS2
Figure 2.7: Schematic diagram showing the experimental setup for sensing and pho-tochemistry experiments in PCF. The broadband light source and excitation laser areco-aligned using a 50:50 beam splitter (BS1) and coupled into 15 cm of ESM-PCF forspatial filtering before being coupled into the fiber filled with the sample chemical. Thetransmitted light is collected by the spectrometer via a multimode fiber (MMF) and 8%of the output beam is coupled out via a 92:8 beam splitter (BS2) and imaged on a CCDbeam profiler. Both light sources and the spectrometer are controlled electronically toautomate the data collection process (for the measurement of photochemical reactionkinetics).
The single-mode output of the SC allows for easy coupling into most sample fibers, but
has a disadvantage in that it does not provide sufficient output for wavelengths below
480 nm. In this case, a xenon lamp which provides usable wavelength from 380 nm to
1000 nm was used in experiments where the absorption spectrum of the sample lies at
the shorter wavelengths in the visible. However, the spatial incoherent nature of the lamp
implies that spatial filtering is required. This was achieved by coupling the output of
the xenon lamp through 15 cm of ESM-PCF. The coupling efficiency of the xenon lamp
through the ESM-PCF was less than 10%, however, the filtered light remained in a single
optical mode, allowing coupling to single fiber modes in the sample fiber.
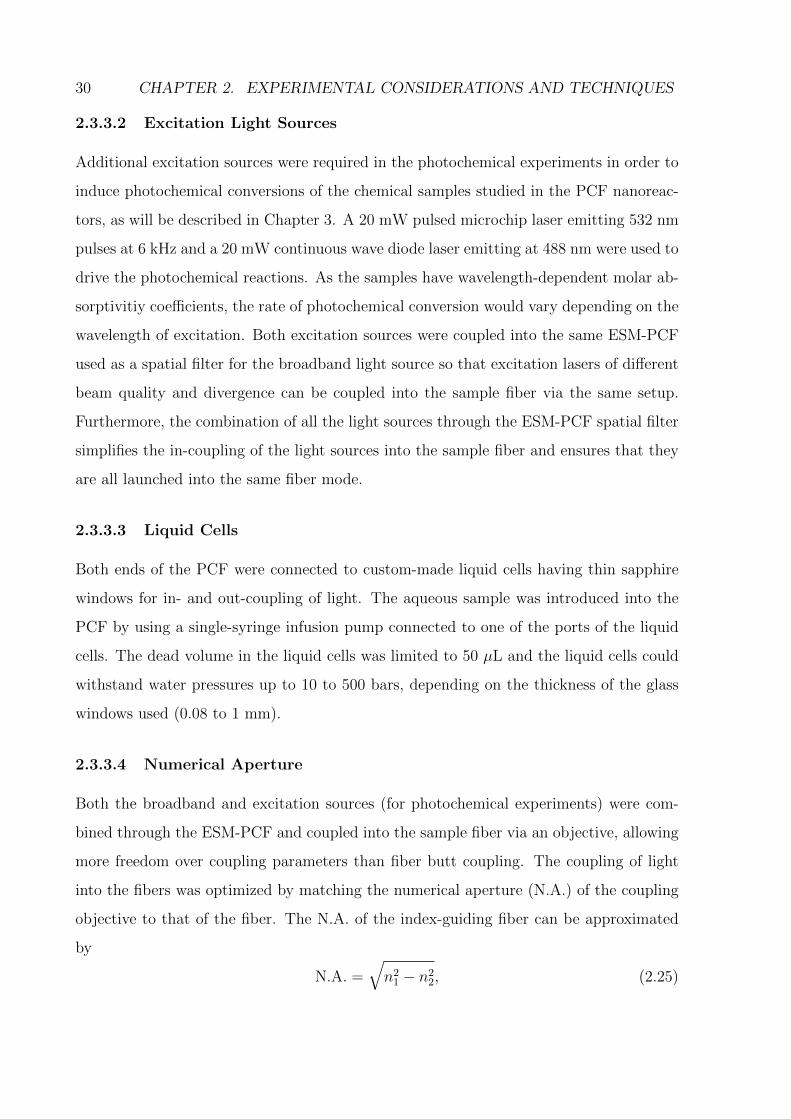
30 CHAPTER 2. EXPERIMENTAL CONSIDERATIONS AND TECHNIQUES
2.3.3.2 Excitation Light Sources
Additional excitation sources were required in the photochemical experiments in order to
induce photochemical conversions of the chemical samples studied in the PCF nanoreac-
tors, as will be described in Chapter 3. A 20 mW pulsed microchip laser emitting 532 nm
pulses at 6 kHz and a 20 mW continuous wave diode laser emitting at 488 nm were used to
drive the photochemical reactions. As the samples have wavelength-dependent molar ab-
sorptivitiy coefficients, the rate of photochemical conversion would vary depending on the
wavelength of excitation. Both excitation sources were coupled into the same ESM-PCF
used as a spatial filter for the broadband light source so that excitation lasers of different
beam quality and divergence can be coupled into the sample fiber via the same setup.
Furthermore, the combination of all the light sources through the ESM-PCF spatial filter
simplifies the in-coupling of the light sources into the sample fiber and ensures that they
are all launched into the same fiber mode.
2.3.3.3 Liquid Cells
Both ends of the PCF were connected to custom-made liquid cells having thin sapphire
windows for in- and out-coupling of light. The aqueous sample was introduced into the
PCF by using a single-syringe infusion pump connected to one of the ports of the liquid
cells. The dead volume in the liquid cells was limited to 50 µL and the liquid cells could
withstand water pressures up to 10 to 500 bars, depending on the thickness of the glass
windows used (0.08 to 1 mm).
2.3.3.4 Numerical Aperture
Both the broadband and excitation sources (for photochemical experiments) were com-
bined through the ESM-PCF and coupled into the sample fiber via an objective, allowing
more freedom over coupling parameters than fiber butt coupling. The coupling of light
into the fibers was optimized by matching the numerical aperture (N.A.) of the coupling
objective to that of the fiber. The N.A. of the index-guiding fiber can be approximated
by
N.A. =√n2
1 − n22, (2.25)
2.3. EXPERIMENTAL SETUP AND INSTRUMENTATION 31
n2
n2
n1
nliquid
nwindow
nair
Figure 2.8: Schematic diagram (not to scale) illustrating the increase in the effective N.A.as a result of change in the interface medium of the objective (air) to that for the fiber(liquid). The actual fiber N.A. and the effective N.A. are related via Snell’s law.
where n1 and n2 are the refractive indices of the core and cladding material, respectively.
The N.A. of the HC-PCF can be approximated by
N.A. =λ
2D, (2.26)
where λ is the wavelength of operation and D is the diameter of the hollow fiber core. It
is worth noting here that HC-PCF generally have very low N.A. in the order of 0.01.
The change in the interface medium of the objective (air) to that for the fiber (liquid)
will result in a higher effective N.A. (see Figure 2.8) given by
N.A.eff =nliquid
nair
N.A.. (2.27)
An objective with N.A. in accord with N.A.eff for the fiber/liquid-cell combination should
therefore be chosen for efficient coupling of light into the fiber.
2.3.3.5 Spectrum and Mode Profile
The transmitted light at the output facet of the fiber was collected and collimated by a
10×0.25NA objective. A 92:8 beam splitter imaged a small portion (8%) of the trans-
mitted light via a lens onto a charge coupled device (CCD) beam profiler to measure the
irradiance profile of the guided mode to ensure coupling to the fundamental core mode,
while the rest (92%) of the light was coupled to a multimode fiber (MMF) connected to
either an optical spectrum analyzer (OSA) or a USB spectrometer.
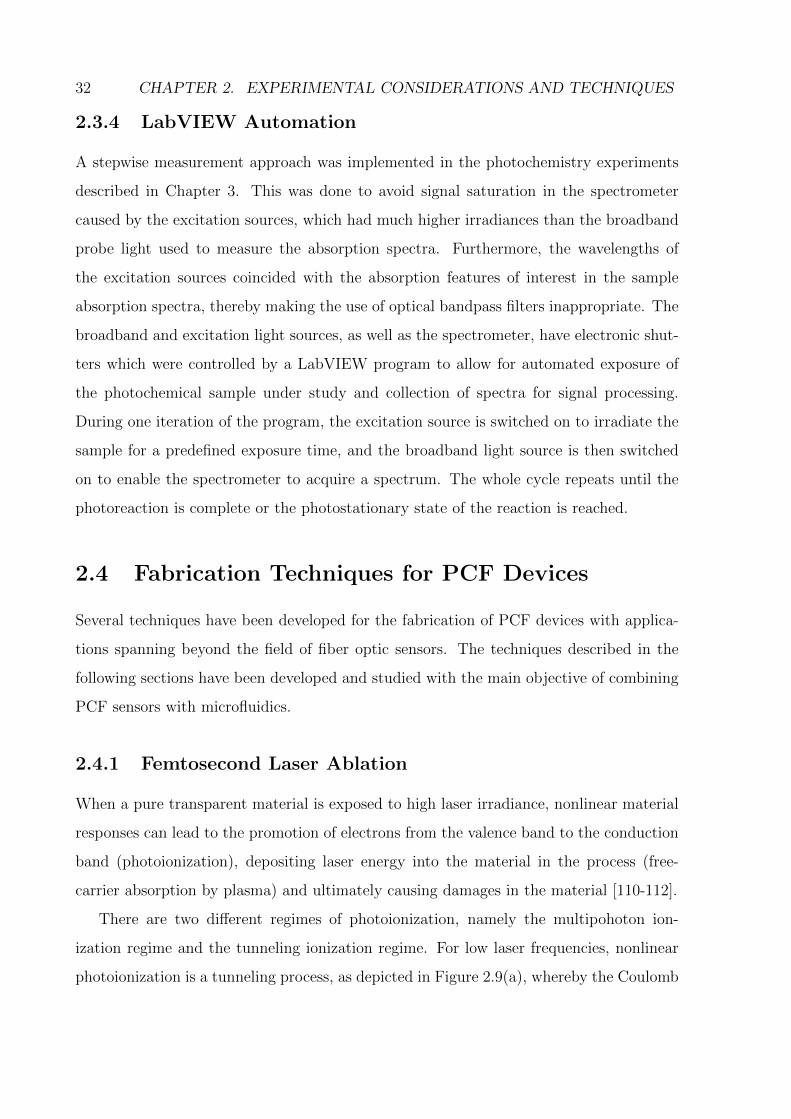
32 CHAPTER 2. EXPERIMENTAL CONSIDERATIONS AND TECHNIQUES
2.3.4 LabVIEW Automation
A stepwise measurement approach was implemented in the photochemistry experiments
described in Chapter 3. This was done to avoid signal saturation in the spectrometer
caused by the excitation sources, which had much higher irradiances than the broadband
probe light used to measure the absorption spectra. Furthermore, the wavelengths of
the excitation sources coincided with the absorption features of interest in the sample
absorption spectra, thereby making the use of optical bandpass filters inappropriate. The
broadband and excitation light sources, as well as the spectrometer, have electronic shut-
ters which were controlled by a LabVIEW program to allow for automated exposure of
the photochemical sample under study and collection of spectra for signal processing.
During one iteration of the program, the excitation source is switched on to irradiate the
sample for a predefined exposure time, and the broadband light source is then switched
on to enable the spectrometer to acquire a spectrum. The whole cycle repeats until the
photoreaction is complete or the photostationary state of the reaction is reached.
2.4 Fabrication Techniques for PCF Devices
Several techniques have been developed for the fabrication of PCF devices with applica-
tions spanning beyond the field of fiber optic sensors. The techniques described in the
following sections have been developed and studied with the main objective of combining
PCF sensors with microfluidics.
2.4.1 Femtosecond Laser Ablation
When a pure transparent material is exposed to high laser irradiance, nonlinear material
responses can lead to the promotion of electrons from the valence band to the conduction
band (photoionization), depositing laser energy into the material in the process (free-
carrier absorption by plasma) and ultimately causing damages in the material [110-112].
There are two different regimes of photoionization, namely the multipohoton ion-
ization regime and the tunneling ionization regime. For low laser frequencies, nonlinear
photoionization is a tunneling process, as depicted in Figure 2.9(a), whereby the Coulomb
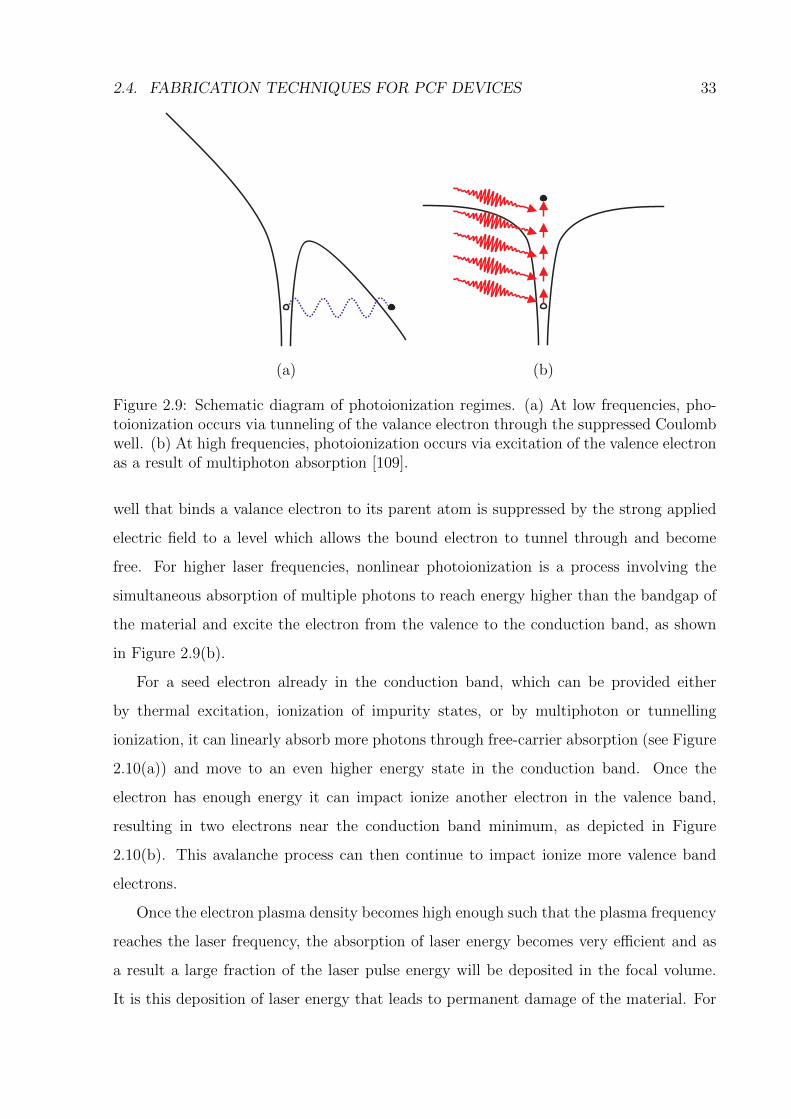
2.4. FABRICATION TECHNIQUES FOR PCF DEVICES 33
(a) (b)
Figure 2.9: Schematic diagram of photoionization regimes. (a) At low frequencies, pho-toionization occurs via tunneling of the valance electron through the suppressed Coulombwell. (b) At high frequencies, photoionization occurs via excitation of the valence electronas a result of multiphoton absorption [109].
well that binds a valance electron to its parent atom is suppressed by the strong applied
electric field to a level which allows the bound electron to tunnel through and become
free. For higher laser frequencies, nonlinear photoionization is a process involving the
simultaneous absorption of multiple photons to reach energy higher than the bandgap of
the material and excite the electron from the valence to the conduction band, as shown
in Figure 2.9(b).
For a seed electron already in the conduction band, which can be provided either
by thermal excitation, ionization of impurity states, or by multiphoton or tunnelling
ionization, it can linearly absorb more photons through free-carrier absorption (see Figure
2.10(a)) and move to an even higher energy state in the conduction band. Once the
electron has enough energy it can impact ionize another electron in the valence band,
resulting in two electrons near the conduction band minimum, as depicted in Figure
2.10(b). This avalanche process can then continue to impact ionize more valence band
electrons.
Once the electron plasma density becomes high enough such that the plasma frequency
reaches the laser frequency, the absorption of laser energy becomes very efficient and as
a result a large fraction of the laser pulse energy will be deposited in the focal volume.
It is this deposition of laser energy that leads to permanent damage of the material. For
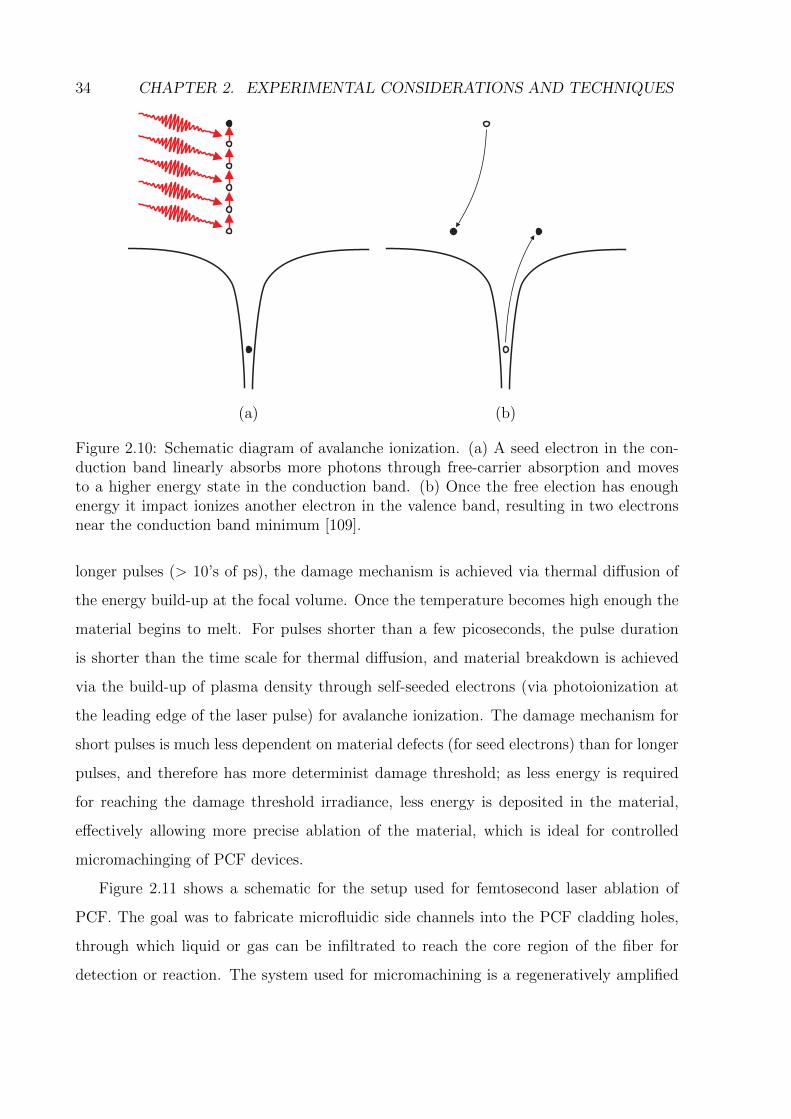
34 CHAPTER 2. EXPERIMENTAL CONSIDERATIONS AND TECHNIQUES
(a) (b)
Figure 2.10: Schematic diagram of avalanche ionization. (a) A seed electron in the con-duction band linearly absorbs more photons through free-carrier absorption and movesto a higher energy state in the conduction band. (b) Once the free election has enoughenergy it impact ionizes another electron in the valence band, resulting in two electronsnear the conduction band minimum [109].
longer pulses (> 10’s of ps), the damage mechanism is achieved via thermal diffusion of
the energy build-up at the focal volume. Once the temperature becomes high enough the
material begins to melt. For pulses shorter than a few picoseconds, the pulse duration
is shorter than the time scale for thermal diffusion, and material breakdown is achieved
via the build-up of plasma density through self-seeded electrons (via photoionization at
the leading edge of the laser pulse) for avalanche ionization. The damage mechanism for
short pulses is much less dependent on material defects (for seed electrons) than for longer
pulses, and therefore has more determinist damage threshold; as less energy is required
for reaching the damage threshold irradiance, less energy is deposited in the material,
effectively allowing more precise ablation of the material, which is ideal for controlled
micromachinging of PCF devices.
Figure 2.11 shows a schematic for the setup used for femtosecond laser ablation of
PCF. The goal was to fabricate microfluidic side channels into the PCF cladding holes,
through which liquid or gas can be infiltrated to reach the core region of the fiber for
detection or reaction. The system used for micromachining is a regeneratively amplified
2.4. FABRICATION TECHNIQUES FOR PCF DEVICES 35
BS
HeNe
Ti:S
CCD
50x
50x
Figure 2.11: Schematic diagram showing the experimental setup for femtosecond laserablation of side channels in PCF and the two-photon polymerization technique for selectiveblockage of microstructure holes. The system used for both experiments is a regenerativelyamplified Ti:Sapphire laser producing 150 fs pulses at 800 nm, with a maximum pulseenergy of 8 µJ at a repetition rate of 100 kHz.
Ti:Sapphire laser producing 150 fs pulses at 800 nm, with a maximum pulse energy of 8 µJ
at a repetition rate of 100 kHz. The laser pulses are co-aligned with a He-Ne laser used for
alignment and illumination, and focused through a 50×0.55N.A. Mitutoyo objective lens
with a working distance of 13 mm. The backscattered light re-enters the objective lens
and passes through a telescope for imaging on a CCD camera, allowing on-line monitoring
of the ablation process. Spatial characterization of the pump beam was performed by a
knife-edge measurement at the focus of the lens and the focal size of the laser beam was
measured to be 2.5 µm. The objective was measured to transmit 30% of the input power
for average power levels below 50 mW.
In order to determine the threshold energy required to achieve optical breakdown
in fused silica, varying laser powers were focused on the surface of bare capillary fiber
made of fused silica, the same glass as that used in the PCF. The formation of surface
void was monitored using the CCD camera. The damage threshold for fused silica was
determined to be 50 nJ, corresponding to a peak power of 0.3 MW and an irradiance of
1.7× 10¹² W/cm2.
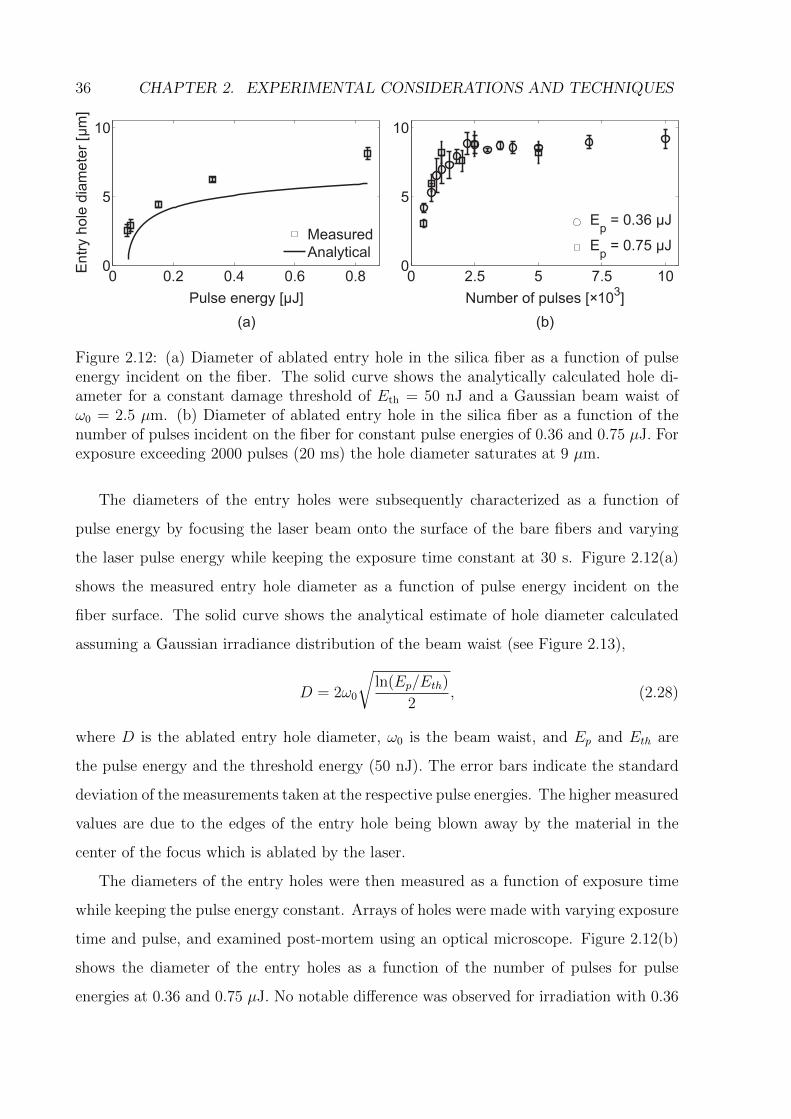
36 CHAPTER 2. EXPERIMENTAL CONSIDERATIONS AND TECHNIQUES
0 2.5 5 7.5 100
5
10
Number of pulses [×103]
Ep
= 0.36 µJ
Ep
= 0.75 µJ
(b)
0 0.2 0.4 0.6 0.80
5
10
En
try h
ole
dia
me
ter
[µm
]
Measured
Analytical
(a)
Pulse energy [µJ]
Figure 2.12: (a) Diameter of ablated entry hole in the silica fiber as a function of pulseenergy incident on the fiber. The solid curve shows the analytically calculated hole di-ameter for a constant damage threshold of Eth = 50 nJ and a Gaussian beam waist ofω0 = 2.5 µm. (b) Diameter of ablated entry hole in the silica fiber as a function of thenumber of pulses incident on the fiber for constant pulse energies of 0.36 and 0.75 µJ. Forexposure exceeding 2000 pulses (20 ms) the hole diameter saturates at 9 µm.
The diameters of the entry holes were subsequently characterized as a function of
pulse energy by focusing the laser beam onto the surface of the bare fibers and varying
the laser pulse energy while keeping the exposure time constant at 30 s. Figure 2.12(a)
shows the measured entry hole diameter as a function of pulse energy incident on the
fiber surface. The solid curve shows the analytical estimate of hole diameter calculated
assuming a Gaussian irradiance distribution of the beam waist (see Figure 2.13),
D = 2ω0
√ln(Ep/Eth)
2, (2.28)
where D is the ablated entry hole diameter, ω0 is the beam waist, and Ep and Eth are
the pulse energy and the threshold energy (50 nJ). The error bars indicate the standard
deviation of the measurements taken at the respective pulse energies. The higher measured
values are due to the edges of the entry hole being blown away by the material in the
center of the focus which is ablated by the laser.
The diameters of the entry holes were then measured as a function of exposure time
while keeping the pulse energy constant. Arrays of holes were made with varying exposure
time and pulse, and examined post-mortem using an optical microscope. Figure 2.12(b)
shows the diameter of the entry holes as a function of the number of pulses for pulse
energies at 0.36 and 0.75 µJ. No notable difference was observed for irradiation with 0.36
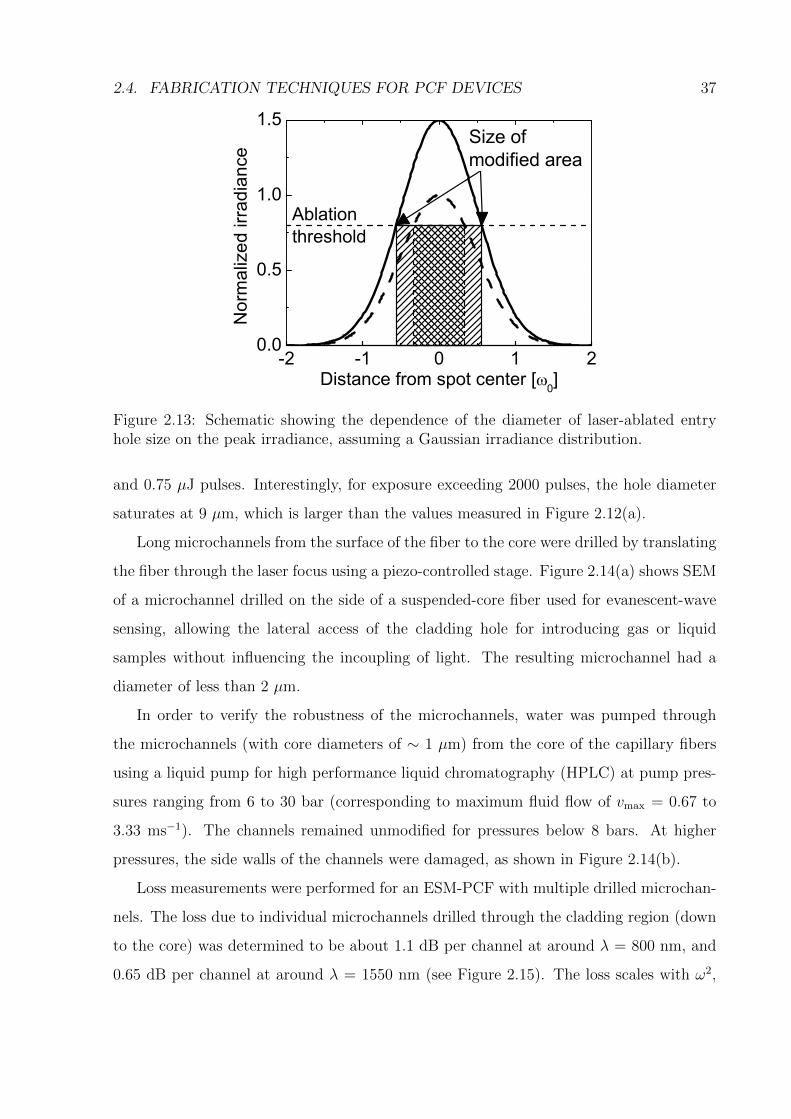
2.4. FABRICATION TECHNIQUES FOR PCF DEVICES 37
Figure 2.13: Schematic showing the dependence of the diameter of laser-ablated entryhole size on the peak irradiance, assuming a Gaussian irradiance distribution.
and 0.75 µJ pulses. Interestingly, for exposure exceeding 2000 pulses, the hole diameter
saturates at 9 µm, which is larger than the values measured in Figure 2.12(a).
Long microchannels from the surface of the fiber to the core were drilled by translating
the fiber through the laser focus using a piezo-controlled stage. Figure 2.14(a) shows SEM
of a microchannel drilled on the side of a suspended-core fiber used for evanescent-wave
sensing, allowing the lateral access of the cladding hole for introducing gas or liquid
samples without influencing the incoupling of light. The resulting microchannel had a
diameter of less than 2 µm.
In order to verify the robustness of the microchannels, water was pumped through
the microchannels (with core diameters of ∼ 1 µm) from the core of the capillary fibers
using a liquid pump for high performance liquid chromatography (HPLC) at pump pres-
sures ranging from 6 to 30 bar (corresponding to maximum fluid flow of vmax = 0.67 to
3.33 ms−1). The channels remained unmodified for pressures below 8 bars. At higher
pressures, the side walls of the channels were damaged, as shown in Figure 2.14(b).
Loss measurements were performed for an ESM-PCF with multiple drilled microchan-
nels. The loss due to individual microchannels drilled through the cladding region (down
to the core) was determined to be about 1.1 dB per channel at around λ = 800 nm, and
0.65 dB per channel at around λ = 1550 nm (see Figure 2.15). The loss scales with ω2,
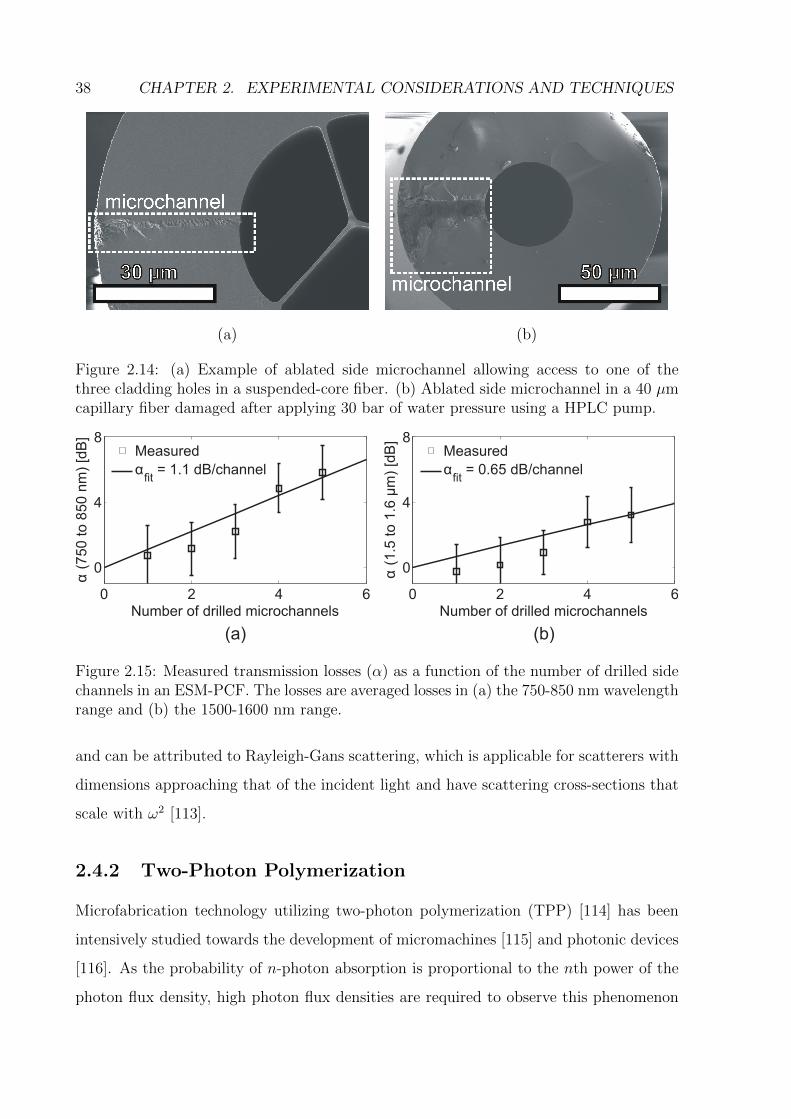
38 CHAPTER 2. EXPERIMENTAL CONSIDERATIONS AND TECHNIQUES
(a) (b)
Figure 2.14: (a) Example of ablated side microchannel allowing access to one of thethree cladding holes in a suspended-core fiber. (b) Ablated side microchannel in a 40 µmcapillary fiber damaged after applying 30 bar of water pressure using a HPLC pump.
0 2 4 6
0
4
8
Number of drilled microchannels
α(7
50 to 8
50 n
m)
[dB
]
Measured
αfit
= 1.1 dB/channel
0 2 4 6
0
4
8
Number of drilled microchannels
α(1
.5 to 1
.6μ
m)
[dB
]
Measured
αfit
= 0.65 dB/channel
(a) (b)
Figure 2.15: Measured transmission losses (α) as a function of the number of drilled sidechannels in an ESM-PCF. The losses are averaged losses in (a) the 750-850 nm wavelengthrange and (b) the 1500-1600 nm range.
and can be attributed to Rayleigh-Gans scattering, which is applicable for scatterers with
dimensions approaching that of the incident light and have scattering cross-sections that
scale with ω2 [113].
2.4.2 Two-Photon Polymerization
Microfabrication technology utilizing two-photon polymerization (TPP) [114] has been
intensively studied towards the development of micromachines [115] and photonic devices
[116]. As the probability of n-photon absorption is proportional to the nth power of the
photon flux density, high photon flux densities are required to observe this phenomenon
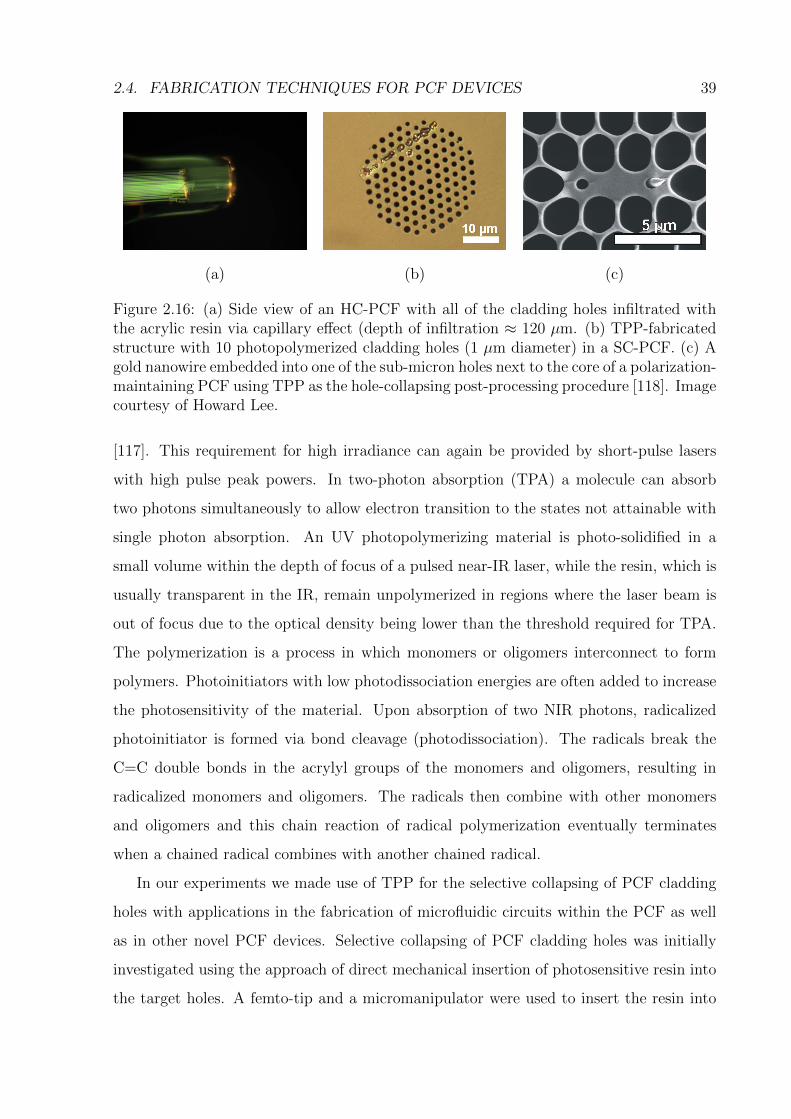
2.4. FABRICATION TECHNIQUES FOR PCF DEVICES 39
(a) (b) (c)
Figure 2.16: (a) Side view of an HC-PCF with all of the cladding holes infiltrated withthe acrylic resin via capillary effect (depth of infiltration ≈ 120 µm. (b) TPP-fabricatedstructure with 10 photopolymerized cladding holes (1 µm diameter) in a SC-PCF. (c) Agold nanowire embedded into one of the sub-micron holes next to the core of a polarization-maintaining PCF using TPP as the hole-collapsing post-processing procedure [118]. Imagecourtesy of Howard Lee.
[117]. This requirement for high irradiance can again be provided by short-pulse lasers
with high pulse peak powers. In two-photon absorption (TPA) a molecule can absorb
two photons simultaneously to allow electron transition to the states not attainable with
single photon absorption. An UV photopolymerizing material is photo-solidified in a
small volume within the depth of focus of a pulsed near-IR laser, while the resin, which is
usually transparent in the IR, remain unpolymerized in regions where the laser beam is
out of focus due to the optical density being lower than the threshold required for TPA.
The polymerization is a process in which monomers or oligomers interconnect to form
polymers. Photoinitiators with low photodissociation energies are often added to increase
the photosensitivity of the material. Upon absorption of two NIR photons, radicalized
photoinitiator is formed via bond cleavage (photodissociation). The radicals break the
C=C double bonds in the acrylyl groups of the monomers and oligomers, resulting in
radicalized monomers and oligomers. The radicals then combine with other monomers
and oligomers and this chain reaction of radical polymerization eventually terminates
when a chained radical combines with another chained radical.
In our experiments we made use of TPP for the selective collapsing of PCF cladding
holes with applications in the fabrication of microfluidic circuits within the PCF as well
as in other novel PCF devices. Selective collapsing of PCF cladding holes was initially
investigated using the approach of direct mechanical insertion of photosensitive resin into
the target holes. A femto-tip and a micromanipulator were used to insert the resin into
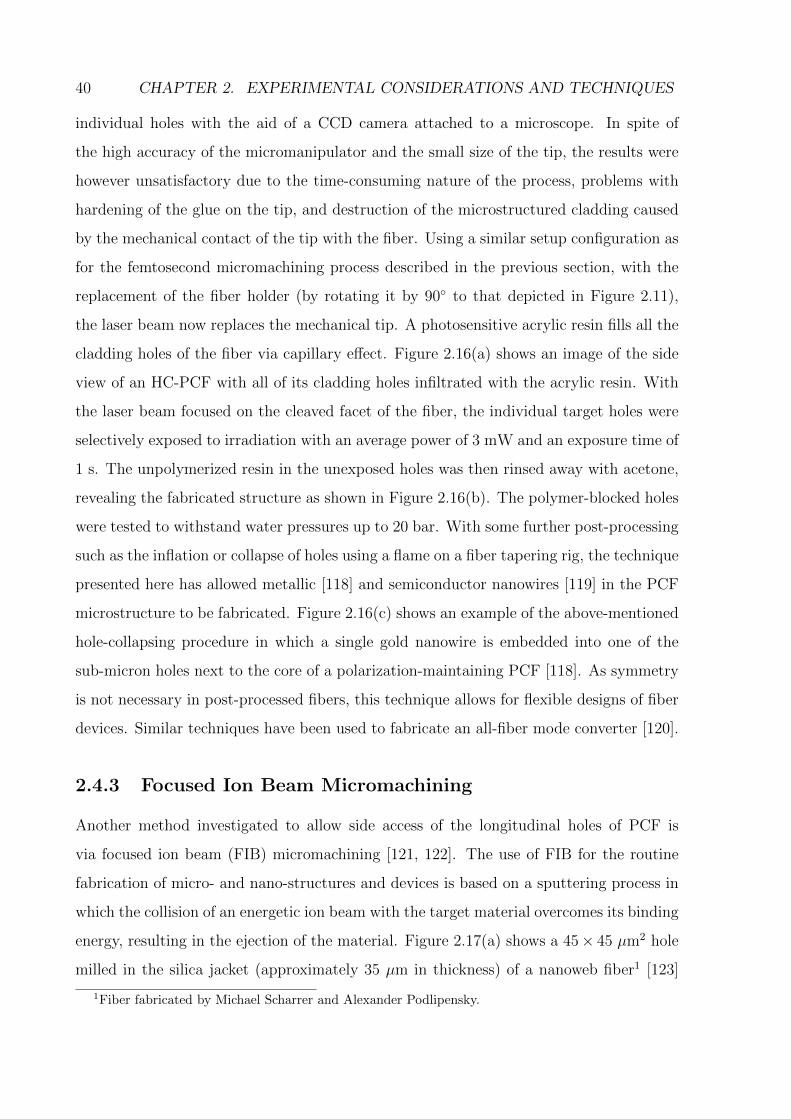
40 CHAPTER 2. EXPERIMENTAL CONSIDERATIONS AND TECHNIQUES
individual holes with the aid of a CCD camera attached to a microscope. In spite of
the high accuracy of the micromanipulator and the small size of the tip, the results were
however unsatisfactory due to the time-consuming nature of the process, problems with
hardening of the glue on the tip, and destruction of the microstructured cladding caused
by the mechanical contact of the tip with the fiber. Using a similar setup configuration as
for the femtosecond micromachining process described in the previous section, with the
replacement of the fiber holder (by rotating it by 90◦ to that depicted in Figure 2.11),
the laser beam now replaces the mechanical tip. A photosensitive acrylic resin fills all the
cladding holes of the fiber via capillary effect. Figure 2.16(a) shows an image of the side
view of an HC-PCF with all of its cladding holes infiltrated with the acrylic resin. With
the laser beam focused on the cleaved facet of the fiber, the individual target holes were
selectively exposed to irradiation with an average power of 3 mW and an exposure time of
1 s. The unpolymerized resin in the unexposed holes was then rinsed away with acetone,
revealing the fabricated structure as shown in Figure 2.16(b). The polymer-blocked holes
were tested to withstand water pressures up to 20 bar. With some further post-processing
such as the inflation or collapse of holes using a flame on a fiber tapering rig, the technique
presented here has allowed metallic [118] and semiconductor nanowires [119] in the PCF
microstructure to be fabricated. Figure 2.16(c) shows an example of the above-mentioned
hole-collapsing procedure in which a single gold nanowire is embedded into one of the
sub-micron holes next to the core of a polarization-maintaining PCF [118]. As symmetry
is not necessary in post-processed fibers, this technique allows for flexible designs of fiber
devices. Similar techniques have been used to fabricate an all-fiber mode converter [120].
2.4.3 Focused Ion Beam Micromachining
Another method investigated to allow side access of the longitudinal holes of PCF is
via focused ion beam (FIB) micromachining [121, 122]. The use of FIB for the routine
fabrication of micro- and nano-structures and devices is based on a sputtering process in
which the collision of an energetic ion beam with the target material overcomes its binding
energy, resulting in the ejection of the material. Figure 2.17(a) shows a 45× 45 µm2 hole
milled in the silica jacket (approximately 35 µm in thickness) of a nanoweb fiber1 [123]
1Fiber fabricated by Michael Scharrer and Alexander Podlipensky.
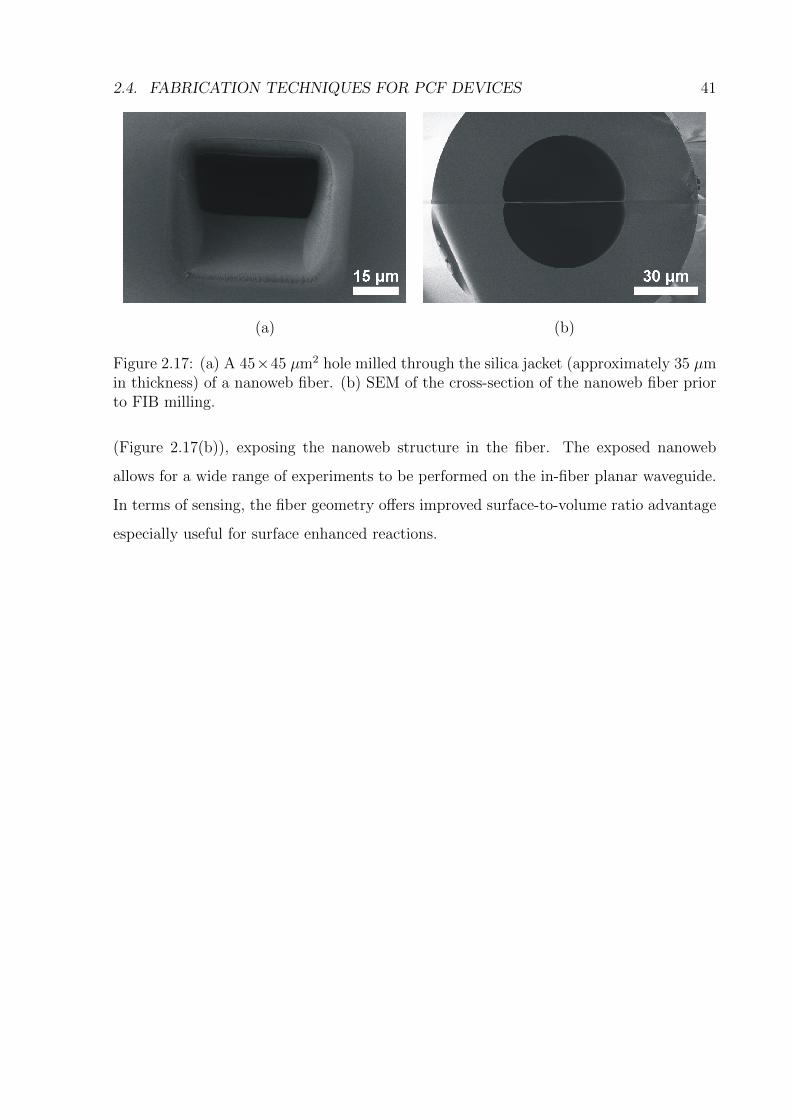
2.4. FABRICATION TECHNIQUES FOR PCF DEVICES 41
(a) (b)
Figure 2.17: (a) A 45×45 µm2 hole milled through the silica jacket (approximately 35 µmin thickness) of a nanoweb fiber. (b) SEM of the cross-section of the nanoweb fiber priorto FIB milling.
(Figure 2.17(b)), exposing the nanoweb structure in the fiber. The exposed nanoweb
allows for a wide range of experiments to be performed on the in-fiber planar waveguide.
In terms of sensing, the fiber geometry offers improved surface-to-volume ratio advantage
especially useful for surface enhanced reactions.

Chapter 3
Photochemistry in PCF
3.1 Introduction
There is rapid growth in the applications of photochemistry in many areas, including
medicine [124-127], chemical synthesis [128, 129], and the conversion and storage of solar
energy [130, 131]. Two important constraints currently limit many photochemical exper-
iments. As discussed in Section 2.2, if spectroscopy (e.g., in the UV/Vis) is to be used to
monitor reactions, the product of molar absorptivity and concentration, integrated over
the optical path length, must be above a certain value which is limited by the detection
limit of the system. For weakly absorbing or sparingly soluble samples, the only way to
satisfy this condition is to increase the optical path length; in a conventional cuvette this
implies large sample volumes, which is a major drawback for valuable samples such as
biological constructs or multistep synthetic products. Furthermore, high pump intensities
are required for rapid photochemical conversion, in particular for reactions with low quan-
tum yields. If modest laser powers are to be used, this means that the cross-sectional
area of the excitation beam should be as small as possible, and comparable with the
cross-sectional area of the sample cell. In systems with low quantum yields and weakly
absorbing or sparingly soluble samples, the ideal photochemical cell is therefore one that
combines long optical path length with small cross-sectional area which is comparable to
the size of the excitation beam.
There is no obvious way to satisfy these conditions in existing microfluidic and lab-
on-chip systems, in which fluid flow is manipulated and chemical reactions monitored in
43
44 CHAPTER 3. PHOTOCHEMISTRY IN PCF
sub-millimeter scale channels [132-135]. Some progress has been made in this direction
using SC-PCF, in which the sample is probed by the evanescent tailing field of the guided
mode [86, 87, 136, 137]. A more revolutionary approach exploits HC-PCFs for their ability
to maximize the interaction between the optical field and the low refractive index sample
at path lengths that are much longer than achievable in conventional single-pass sample
cells [98, 138]. Hollow-core PCFs have several major advantages over conventional sample
cells: the sample volume per optical path length is very small, long optical path lengths
are possible as a result of very low intrinsic waveguide loss, and furthermore the light can
travel in a diffractionless single mode with a constant transverse irradiance profile.
In this chapter, the demonstration of a liquid-filled HC-PCF as a highly-controlled
photochemical reactor is reported. In Section 3.2 the fiber characteristics of the HC-PCF
used in the experiments are presented. Two photochemical experiments were performed
to demonstrate the effectiveness of the PCF reactor in monitoring both irreversible and
reversible photochemical reactions, exemplified here by the photolysis of a cobalamin in
Section 3.3 and the photoswitching of an azo dye derivative in Section 3.4.
3.2 Fiber Characteristics
In HC-PCFs, guidance is achieved through two mechanisms, as described in Section 1.3.
In PBG-PCF, a core resonance coincides with a photonic bandgap in the microstructured
cladding, resulting in the formation of ultra-low loss (∼1 dBkm−1 in the best cases)
guided modes over restricted bandwidths of typically a few hundred nanometers. In
contrast, the guidance mechanism of kagome HC-PCF is based on the reduced coupling
between the core mode and the cladding modes [69, 70], resulting in higher losses in the
order of 1 dBm−1, nevertheless still better than in a capillary. The kagome HC-PCF
has a spectrally much broader guidance band than the PBG-PCF, making it the fiber
of choice for broadband spectral measurements. A scanning electron micrograph (SEM)
of the kagome HC-PCF used in the experiments is shown in Figure 3.1(a). The fiber
was made from fused silica, with a hollow core of 19 µm in diameter, surrounded by a
kagome lattice of thin silica webs with a cladding pitch of 10 µm that runs along the entire
length of the fiber. The structural parameters of the fiber correspond to an approximate

3.2. FIBER CHARACTERISTICS 45
50 µm 50 µm
(a) (b)
Figure 3.1: (a) Scanning electron micrograph showing the cross-section of the kagome HC-PCF used in the experiments. The fiber was made from fused silica, with a hollow coreof 19 µm in diameter, surrounded by a kagome lattice of thin silica webs with a claddingpitch of 10 µm that runs along the entire length of the fiber. (b) Optical micrograph of thelight emerging from 3 cm length of the fiber illuminated from below with a halogen lamp.The colors observed in the cladding holes are caused by long-lived Mie-like resonancesand are related to the slight nonuniformity in the air hole diameters.
sample cell cross-section of 284 µm2, giving an ultra low sample volume of 2.8 nLcm−1.
The enhanced sensitivity and pumping efficiency means that even systems with very
small quantum yields can be measured much faster than in conventional cuvettes, as will
be shown in the later sections. Figure 3.1(b) shows an optical micrograph of the light
emerging from 3 cm length of the fiber illuminated from below with a halogen lamp. The
colors observed in the cladding holes are caused by long-lived Mie-like resonances and are
related to the slight nonuniformity in the air hole diameters [64].
The transmission and attenuation spectra are important in the characterization of the
fiber as they provide guidelines for the the wavelength range and maximum fiber length
that can be used in the experiments. The spectral attenuation of the fiber was determined
via the conventional cut-back technique [139], in which the power transmitted through
a long length of fiber is measured and normalized to the power transmitted through a
shorter length of the same fiber without changing the incoupling condition. Figure 3.2
shows the transmission spectrum of the fiber, normalized to the spectrum of the SC
source described in Section 2.3, showing a transmission band of the fiber extending from
the visible to 960 nm. The inset shows the transverse irradiance profiles measured at the
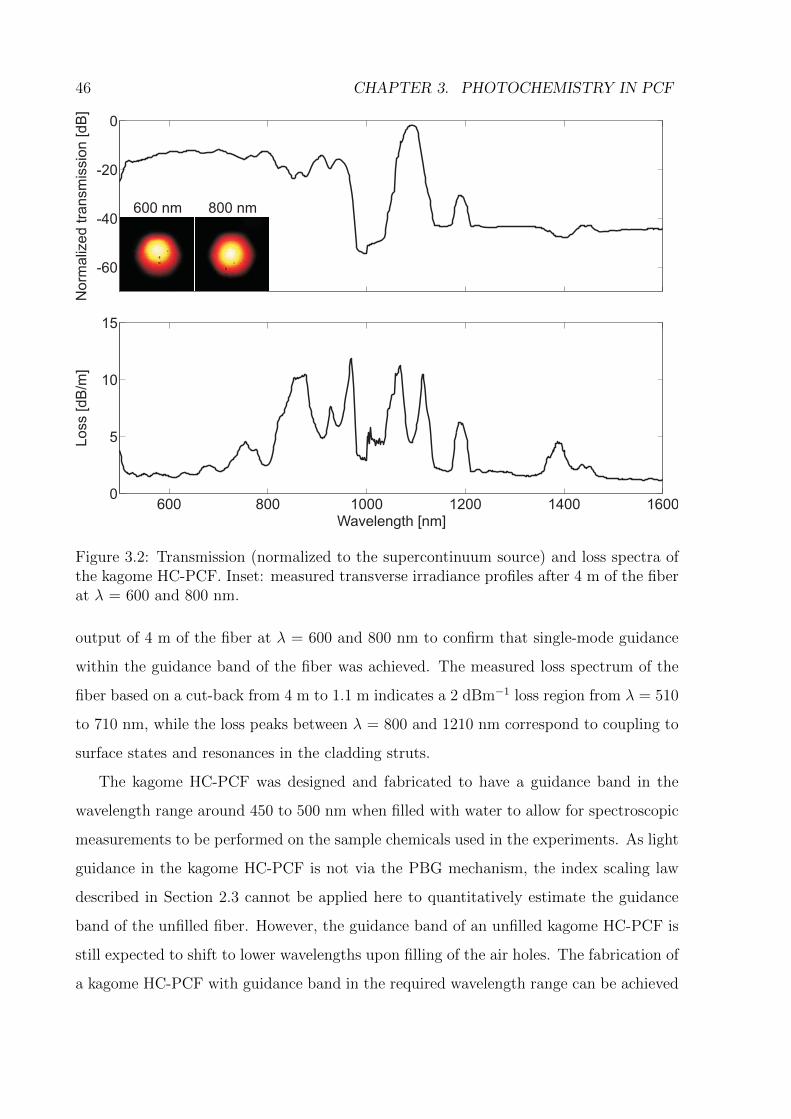
46 CHAPTER 3. PHOTOCHEMISTRY IN PCFN
orm
aliz
ed
tra
nsm
issio
n [
dB
]
-60
-40
-20
0
600 nm 800 nm
600 800 1000 1200 1400 16000
5
10
15
Wavelength [nm]
Lo
ss [
dB
/m]
Figure 3.2: Transmission (normalized to the supercontinuum source) and loss spectra ofthe kagome HC-PCF. Inset: measured transverse irradiance profiles after 4 m of the fiberat λ = 600 and 800 nm.
output of 4 m of the fiber at λ = 600 and 800 nm to confirm that single-mode guidance
within the guidance band of the fiber was achieved. The measured loss spectrum of the
fiber based on a cut-back from 4 m to 1.1 m indicates a 2 dBm−1 loss region from λ = 510
to 710 nm, while the loss peaks between λ = 800 and 1210 nm correspond to coupling to
surface states and resonances in the cladding struts.
The kagome HC-PCF was designed and fabricated to have a guidance band in the
wavelength range around 450 to 500 nm when filled with water to allow for spectroscopic
measurements to be performed on the sample chemicals used in the experiments. As light
guidance in the kagome HC-PCF is not via the PBG mechanism, the index scaling law
described in Section 2.3 cannot be applied here to quantitatively estimate the guidance
band of the unfilled fiber. However, the guidance band of an unfilled kagome HC-PCF is
still expected to shift to lower wavelengths upon filling of the air holes. The fabrication of
a kagome HC-PCF with guidance band in the required wavelength range can be achieved
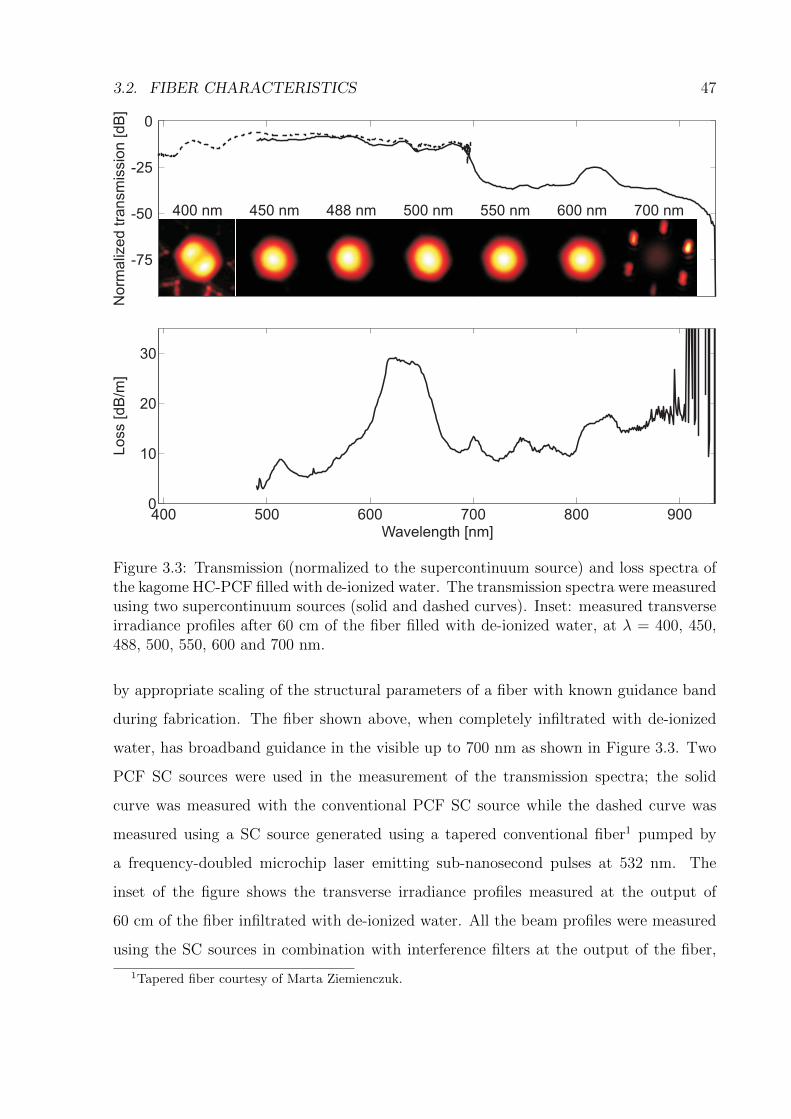
3.2. FIBER CHARACTERISTICS 47
-75
-50
-25
No
rma
lize
d t
ran
sm
issio
n [
dB
]0
400 nm 450 nm 488 nm 500 nm 550 nm 600 nm 700 nm
400 500 600 700 800 9000
10
20
30
Wavelength [nm]
Lo
ss [
dB
/m]
Figure 3.3: Transmission (normalized to the supercontinuum source) and loss spectra ofthe kagome HC-PCF filled with de-ionized water. The transmission spectra were measuredusing two supercontinuum sources (solid and dashed curves). Inset: measured transverseirradiance profiles after 60 cm of the fiber filled with de-ionized water, at λ = 400, 450,488, 500, 550, 600 and 700 nm.
by appropriate scaling of the structural parameters of a fiber with known guidance band
during fabrication. The fiber shown above, when completely infiltrated with de-ionized
water, has broadband guidance in the visible up to 700 nm as shown in Figure 3.3. Two
PCF SC sources were used in the measurement of the transmission spectra; the solid
curve was measured with the conventional PCF SC source while the dashed curve was
measured using a SC source generated using a tapered conventional fiber1 pumped by
a frequency-doubled microchip laser emitting sub-nanosecond pulses at 532 nm. The
inset of the figure shows the transverse irradiance profiles measured at the output of
60 cm of the fiber infiltrated with de-ionized water. All the beam profiles were measured
using the SC sources in combination with interference filters at the output of the fiber,
1Tapered fiber courtesy of Marta Ziemienczuk.
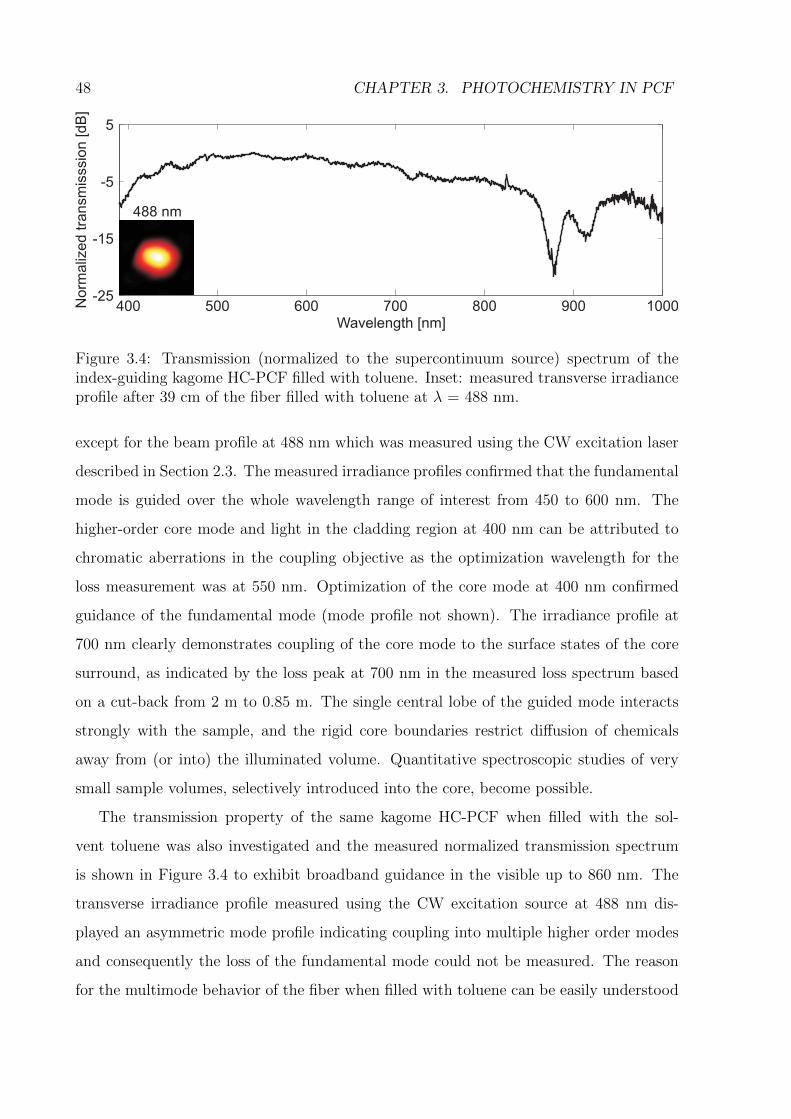
48 CHAPTER 3. PHOTOCHEMISTRY IN PCF
400 500 600 700 800 900 1000-25
-15
-5
Wavelength [nm]
No
rma
lize
d t
ran
sm
isssio
n [
dB
]
5
488 nm
Figure 3.4: Transmission (normalized to the supercontinuum source) spectrum of theindex-guiding kagome HC-PCF filled with toluene. Inset: measured transverse irradianceprofile after 39 cm of the fiber filled with toluene at λ = 488 nm.
except for the beam profile at 488 nm which was measured using the CW excitation laser
described in Section 2.3. The measured irradiance profiles confirmed that the fundamental
mode is guided over the whole wavelength range of interest from 450 to 600 nm. The
higher-order core mode and light in the cladding region at 400 nm can be attributed to
chromatic aberrations in the coupling objective as the optimization wavelength for the
loss measurement was at 550 nm. Optimization of the core mode at 400 nm confirmed
guidance of the fundamental mode (mode profile not shown). The irradiance profile at
700 nm clearly demonstrates coupling of the core mode to the surface states of the core
surround, as indicated by the loss peak at 700 nm in the measured loss spectrum based
on a cut-back from 2 m to 0.85 m. The single central lobe of the guided mode interacts
strongly with the sample, and the rigid core boundaries restrict diffusion of chemicals
away from (or into) the illuminated volume. Quantitative spectroscopic studies of very
small sample volumes, selectively introduced into the core, become possible.
The transmission property of the same kagome HC-PCF when filled with the sol-
vent toluene was also investigated and the measured normalized transmission spectrum
is shown in Figure 3.4 to exhibit broadband guidance in the visible up to 860 nm. The
transverse irradiance profile measured using the CW excitation source at 488 nm dis-
played an asymmetric mode profile indicating coupling into multiple higher order modes
and consequently the loss of the fundamental mode could not be measured. The reason
for the multimode behavior of the fiber when filled with toluene can be easily understood
3.3. PHOTOLYSIS OF METAL COMPLEXES 49
as the refractive index of toluene is higher than that of fused silica [140], the fiber becomes
index-guided with a V parameter given by VPCF(λ) = 2πΛ/λ√n2
core − n2eff, where λ is the
wavelength of operation, Λ is the pitch of the cladding structure and ncore and neff are
the effective refractive indices of the core and the cladding [141, 142]. The number of
guided modes can therefore be approximated by V 2PCF/2 ≈ 90 modes. With careful opti-
cal alignment, keeping the bend radius of the fiber large (≥ 15 cm) and avoiding twisting
of the fiber, it was possible to minimize the number of guided modes and maximize the
irradiance concentrated in the core region.
3.3 Photolysis of Metal Complexes
Platinum-based anticancer dugs such as cisplatin (cis-[PtIICl2(NH3)2]) are well-established
therapeutic compounds. However, as they do not discriminate between cancerous and
healthy tissues, their use is constrained by severe dose-limiting side effects [143], as well
as acquired resistance to the drug. In order to overcome these problems, research in the
field is moving towards the use of inert, nontoxic platinum complexes that can be locally
activated by light at the tumor site [127, 144]. Photoactivated drugs are routinely used
in photodynamic therapy for the effective treatment of a number of cancers, including
those of the skin, brain, lung and esophagus [145-147]. The ongoing research and de-
velopment of new metal-based complexes aim to provide more potent anticancer drugs
which are less oxygen dependent (due to the hypoxic nature of most tumor cells [145,
148]) and less biologically reactive in order to minimize the potential for cytotoxicity of
the inactive drug precursors. We demonstrate here a highly-controlled photochemical
reactor based on PCF with the prospect of simultaneously activating and monitoring
the reaction dynamics of such anitcancer drugs, combined with the advantages offered
by PCF-based sensors. The photoaquation of the readily available and nontoxic metal
complex vitamin B12 (cyanocobalamin, CNCbl) was studied as a proof of principle for the
PCF photochemical reactor.
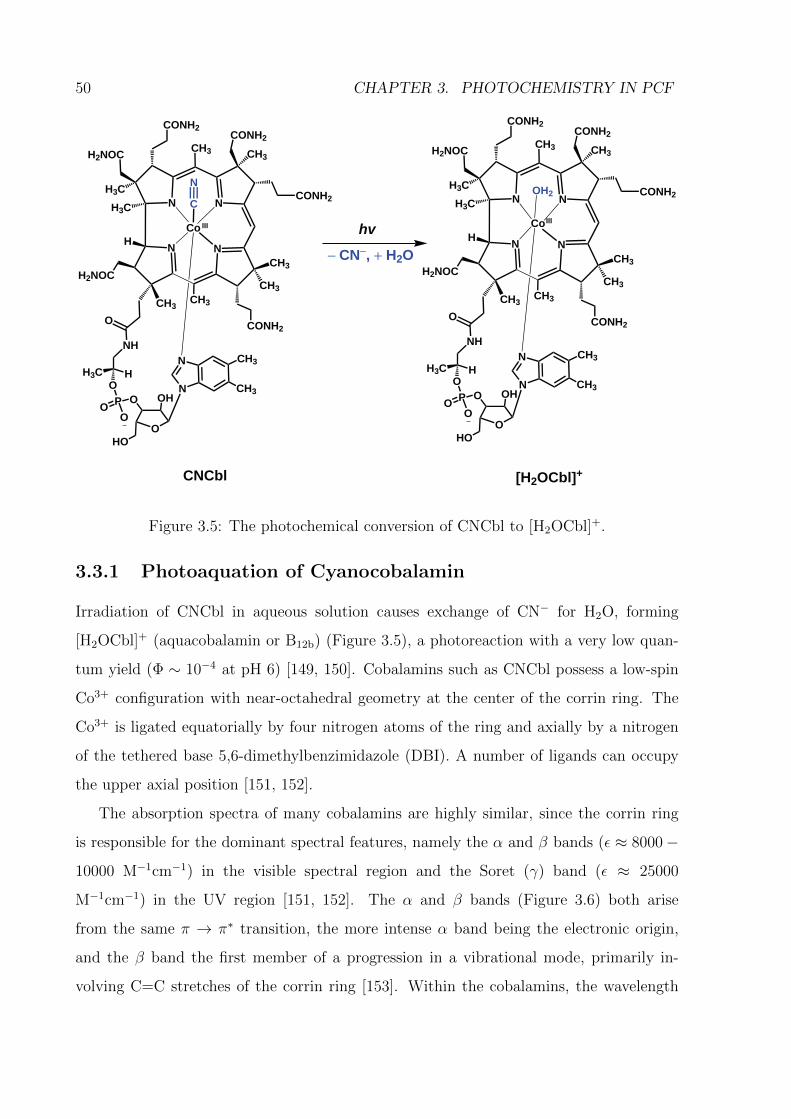
50 CHAPTER 3. PHOTOCHEMISTRY IN PCF
N N
NN
Co
CH3 CH3
H3C
H3C
CH3
CONH2
H2NOC
H
CONH2
CONH2
CH3
CONH2
CH3
H2NOC
CH3
O
NH
H3C HOPOO
O
O
OHN
N CH3
CH3
HO
C
N
N N
NN
Co
CH3 CH3
H3C
H3C
CH3
CONH2
H2NOC
H
CONH2
CONH2
CH3
CONH2
CH3
H2NOC
CH3
O
NH
H3C HOPOO
O
O
OHN
N CH3
CH3
HO
OH2
hv
− CN−, + H2O
IIIIII
CNCbl [H2OCbl]+
Figure 3.5: The photochemical conversion of CNCbl to [H2OCbl]+.
3.3.1 Photoaquation of Cyanocobalamin
Irradiation of CNCbl in aqueous solution causes exchange of CN− for H2O, forming
[H2OCbl]+ (aquacobalamin or B12b) (Figure 3.5), a photoreaction with a very low quan-
tum yield (Φ ∼ 10−4 at pH 6) [149, 150]. Cobalamins such as CNCbl possess a low-spin
Co3+ configuration with near-octahedral geometry at the center of the corrin ring. The
Co3+ is ligated equatorially by four nitrogen atoms of the ring and axially by a nitrogen
of the tethered base 5,6-dimethylbenzimidazole (DBI). A number of ligands can occupy
the upper axial position [151, 152].
The absorption spectra of many cobalamins are highly similar, since the corrin ring
is responsible for the dominant spectral features, namely the α and β bands (ε ≈ 8000−
10000 M−1cm−1) in the visible spectral region and the Soret (γ) band (ε ≈ 25000
M−1cm−1) in the UV region [151, 152]. The α and β bands (Figure 3.6) both arise
from the same π → π∗ transition, the more intense α band being the electronic origin,
and the β band the first member of a progression in a vibrational mode, primarily in-
volving C=C stretches of the corrin ring [153]. Within the cobalamins, the wavelength
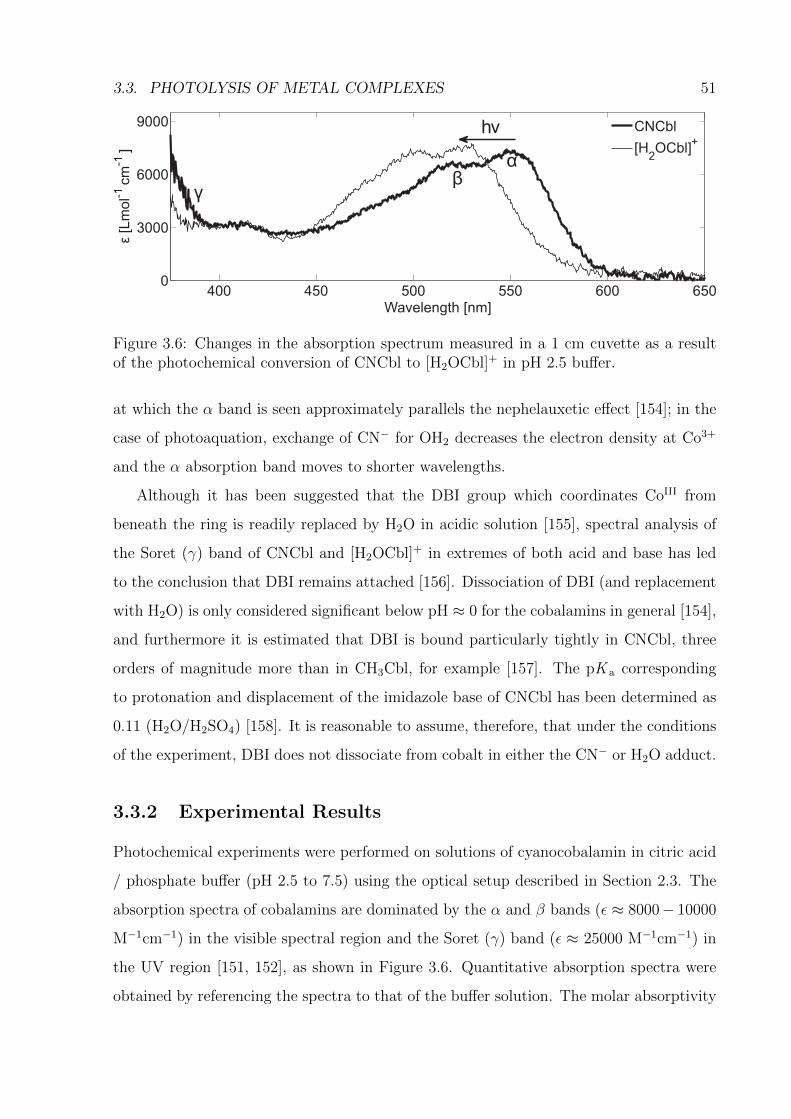
3.3. PHOTOLYSIS OF METAL COMPLEXES 51
400 450 500 550 600 6500
3000
6000
9000
Wavelength [nm]
ε[L
mol-1
cm
-1]
hν
αβ
γ
CNCbl
[H2OCbl]
+
Figure 3.6: Changes in the absorption spectrum measured in a 1 cm cuvette as a resultof the photochemical conversion of CNCbl to [H2OCbl]+ in pH 2.5 buffer.
at which the α band is seen approximately parallels the nephelauxetic effect [154]; in the
case of photoaquation, exchange of CN− for OH2 decreases the electron density at Co3+
and the α absorption band moves to shorter wavelengths.
Although it has been suggested that the DBI group which coordinates CoIII from
beneath the ring is readily replaced by H2O in acidic solution [155], spectral analysis of
the Soret (γ) band of CNCbl and [H2OCbl]+ in extremes of both acid and base has led
to the conclusion that DBI remains attached [156]. Dissociation of DBI (and replacement
with H2O) is only considered significant below pH ≈ 0 for the cobalamins in general [154],
and furthermore it is estimated that DBI is bound particularly tightly in CNCbl, three
orders of magnitude more than in CH3Cbl, for example [157]. The pK a corresponding
to protonation and displacement of the imidazole base of CNCbl has been determined as
0.11 (H2O/H2SO4) [158]. It is reasonable to assume, therefore, that under the conditions
of the experiment, DBI does not dissociate from cobalt in either the CN− or H2O adduct.
3.3.2 Experimental Results
Photochemical experiments were performed on solutions of cyanocobalamin in citric acid
/ phosphate buffer (pH 2.5 to 7.5) using the optical setup described in Section 2.3. The
absorption spectra of cobalamins are dominated by the α and β bands (ε ≈ 8000− 10000
M−1cm−1) in the visible spectral region and the Soret (γ) band (ε ≈ 25000 M−1cm−1) in
the UV region [151, 152], as shown in Figure 3.6. Quantitative absorption spectra were
obtained by referencing the spectra to that of the buffer solution. The molar absorptivity
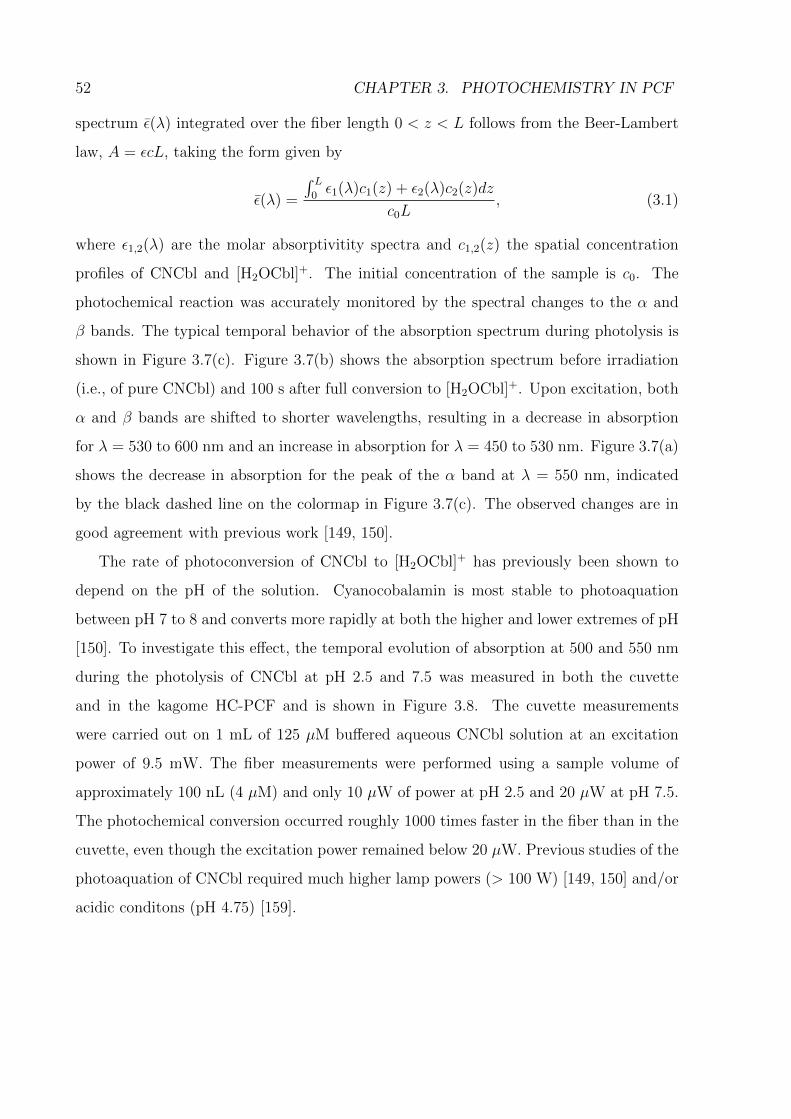
52 CHAPTER 3. PHOTOCHEMISTRY IN PCF
spectrum ε(λ) integrated over the fiber length 0 < z < L follows from the Beer-Lambert
law, A = εcL, taking the form given by
ε(λ) =
∫ L0ε1(λ)c1(z) + ε2(λ)c2(z)dz
c0L, (3.1)
where ε1,2(λ) are the molar absorptivitity spectra and c1,2(z) the spatial concentration
profiles of CNCbl and [H2OCbl]+. The initial concentration of the sample is c0. The
photochemical reaction was accurately monitored by the spectral changes to the α and
β bands. The typical temporal behavior of the absorption spectrum during photolysis is
shown in Figure 3.7(c). Figure 3.7(b) shows the absorption spectrum before irradiation
(i.e., of pure CNCbl) and 100 s after full conversion to [H2OCbl]+. Upon excitation, both
α and β bands are shifted to shorter wavelengths, resulting in a decrease in absorption
for λ = 530 to 600 nm and an increase in absorption for λ = 450 to 530 nm. Figure 3.7(a)
shows the decrease in absorption for the peak of the α band at λ = 550 nm, indicated
by the black dashed line on the colormap in Figure 3.7(c). The observed changes are in
good agreement with previous work [149, 150].
The rate of photoconversion of CNCbl to [H2OCbl]+ has previously been shown to
depend on the pH of the solution. Cyanocobalamin is most stable to photoaquation
between pH 7 to 8 and converts more rapidly at both the higher and lower extremes of pH
[150]. To investigate this effect, the temporal evolution of absorption at 500 and 550 nm
during the photolysis of CNCbl at pH 2.5 and 7.5 was measured in both the cuvette
and in the kagome HC-PCF and is shown in Figure 3.8. The cuvette measurements
were carried out on 1 mL of 125 µM buffered aqueous CNCbl solution at an excitation
power of 9.5 mW. The fiber measurements were performed using a sample volume of
approximately 100 nL (4 µM) and only 10 µW of power at pH 2.5 and 20 µW at pH 7.5.
The photochemical conversion occurred roughly 1000 times faster in the fiber than in the
cuvette, even though the excitation power remained below 20 µW. Previous studies of the
photoaquation of CNCbl required much higher lamp powers (> 100 W) [149, 150] and/or
acidic conditons (pH 4.75) [159].
3.3. PHOTOLYSIS OF METAL COMPLEXES 53
4000
5000
6000
7000
ε[L
mo
l-1cm
-1]
550 nm
ε[L
mo
l-1cm
-1]
0 10 20 30 40 50
1000
2000
3000
4000
5000
6000
Time of exposure at 488 nm [s]
450
500
550
600
0250050007500
Wa
ve
len
gth
[n
m]
ε [Lmol-1
cm-1
]
hν
α
β
CNCbl
[H2OCbl]
+
(a)
(b) (c)
Figure 3.7: Photolysis of CNCbl at pH 2.5 in 39 cm of kagome HC-PCF. (a) Measuredtemporal evolution of molar absorptivity at 550 nm taken at 500 ms intervals over aperiod of 50 s. (b) Molar absorptivity spectra of CNCbl before irradiation (thick curve)and after 100 s of irradiation at 488 nm (fine curve). (c) Colormap showing the measuredevolution of molar absorptivity spectrum with time of exposure at 488 nm using 10 µWof optical power.
3.3.3 Reaction Kinetics
The photochemical evolution of the absorption spectra upon excitation can be modeled
using the configuration diagram in Figure 3.9. The photophysical transitions and nature
of the excited electronic states of CNCbl have been investigated using TD-DFT [160,
161]. Irradiation of CNCbl results in excitation from the ground state (S0) to an initially
excited π-π∗ state, which is followed by (sub-picosecond) internal conversion to a lower
energy excited singlet state (S1) − a state best characterized as being of π3d character.
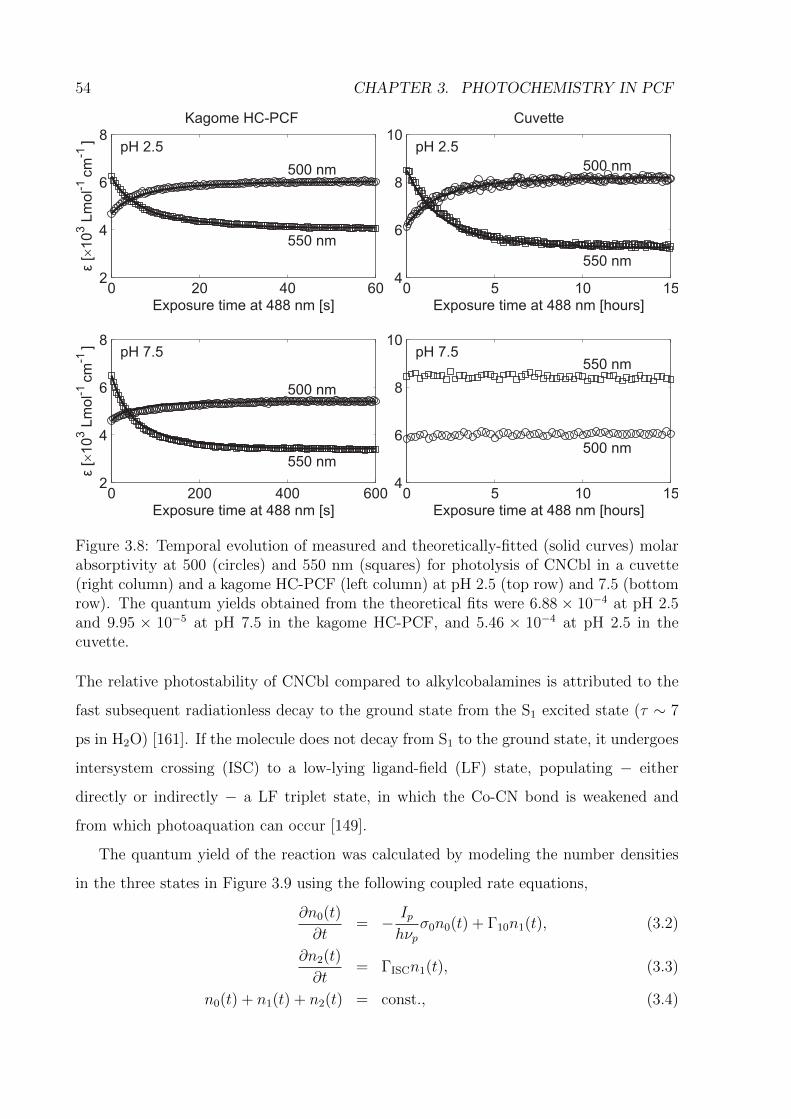
54 CHAPTER 3. PHOTOCHEMISTRY IN PCF
0 20 40 60Exposure time at 488 nm [s]
2
4
6
8
ε[�
10
3Lm
ol-1
cm
-1]
Kagome HC-PCF
500 nm
550 nm
pH 2.5
0 5 10 154
6
8
10
Exposure time at 488 nm [hours]
Cuvette
500 nm
550 nm
pH 2.5
10
0 200 400 600Exposure time at 488 nm [s]
2
4
6
8
ε[�
10
3Lm
ol-1
cm
-1]
500 nm
550 nm
pH 7.5
0 5 10 154
6
8
Exposure time at 488 nm [hours]
500 nm
550 nmpH 7.5
Figure 3.8: Temporal evolution of measured and theoretically-fitted (solid curves) molarabsorptivity at 500 (circles) and 550 nm (squares) for photolysis of CNCbl in a cuvette(right column) and a kagome HC-PCF (left column) at pH 2.5 (top row) and 7.5 (bottomrow). The quantum yields obtained from the theoretical fits were 6.88 × 10⁻⁴ at pH 2.5and 9.95 × 10⁻⁵ at pH 7.5 in the kagome HC-PCF, and 5.46 × 10⁻⁴ at pH 2.5 in thecuvette.
The relative photostability of CNCbl compared to alkylcobalamines is attributed to the
fast subsequent radiationless decay to the ground state from the S1 excited state (τ ∼ 7
ps in H2O) [161]. If the molecule does not decay from S1 to the ground state, it undergoes
intersystem crossing (ISC) to a low-lying ligand-field (LF) state, populating − either
directly or indirectly − a LF triplet state, in which the Co-CN bond is weakened and
from which photoaquation can occur [149].
The quantum yield of the reaction was calculated by modeling the number densities
in the three states in Figure 3.9 using the following coupled rate equations,
∂n0(t)
∂t= − Ip
hνpσ0n0(t) + Γ10n1(t), (3.2)
∂n2(t)
∂t= ΓISCn1(t), (3.3)
n0(t) + n1(t) + n2(t) = const., (3.4)
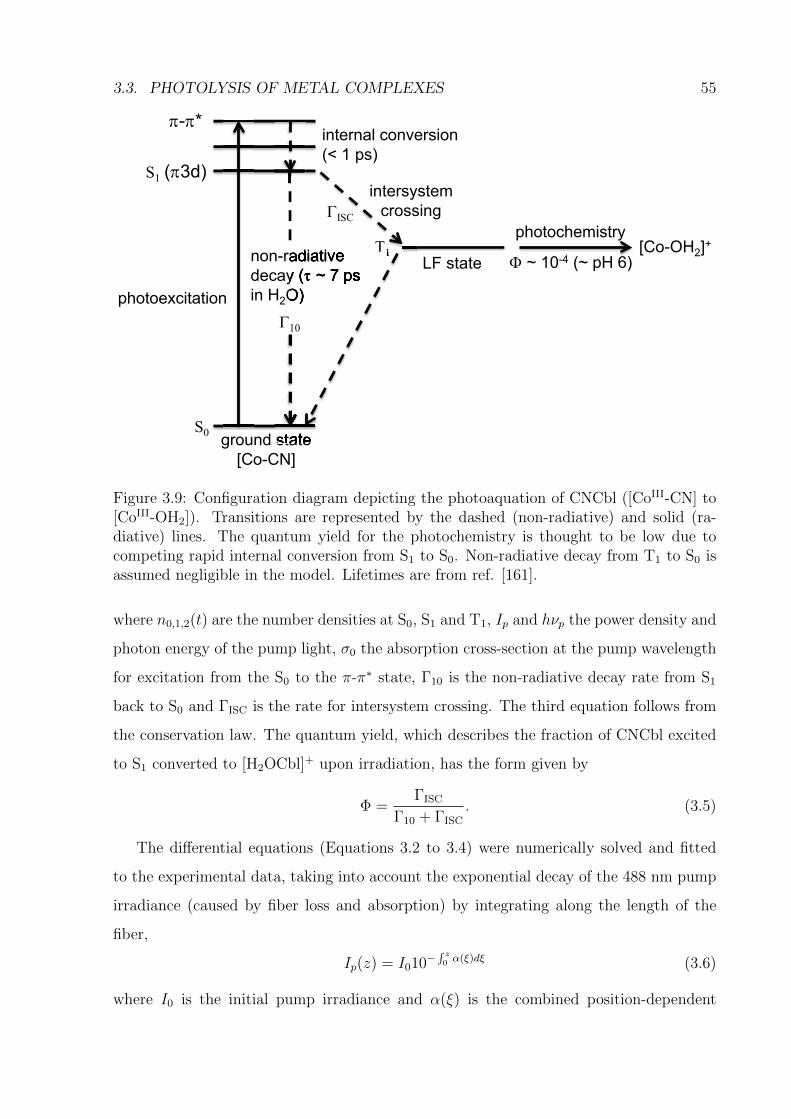
3.3. PHOTOLYSIS OF METAL COMPLEXES 55
ground state[Co-CN]
S0 ground state
photochemistry[Co-OH2]+non-radiative
decay (τ ~ 7 psin H2O)
intersystem crossing
T1 Φ ~ 10-4 (~ pH 6)
photoexcitation
ground stateground state
radiativeradiativedecay (τ ~ 7 ps
O)
T1
internal conversion (< 1 ps)
π-π*
S1 (π3d)
ΓISC
Γ10
LF state
Figure 3.9: Configuration diagram depicting the photoaquation of CNCbl ([CoIII-CN] to[CoIII-OH2]). Transitions are represented by the dashed (non-radiative) and solid (ra-diative) lines. The quantum yield for the photochemistry is thought to be low due tocompeting rapid internal conversion from S1 to S0. Non-radiative decay from T1 to S0 isassumed negligible in the model. Lifetimes are from ref. [161].
where n0,1,2(t) are the number densities at S0, S1 and T1, Ip and hνp the power density and
photon energy of the pump light, σ0 the absorption cross-section at the pump wavelength
for excitation from the S0 to the π-π∗ state, Γ10 is the non-radiative decay rate from S1
back to S0 and ΓISC is the rate for intersystem crossing. The third equation follows from
the conservation law. The quantum yield, which describes the fraction of CNCbl excited
to S1 converted to [H2OCbl]+ upon irradiation, has the form given by
Φ =ΓISC
Γ10 + ΓISC
. (3.5)
The differential equations (Equations 3.2 to 3.4) were numerically solved and fitted
to the experimental data, taking into account the exponential decay of the 488 nm pump
irradiance (caused by fiber loss and absorption) by integrating along the length of the
fiber,
Ip(z) = I010−∫ z0 α(ξ)dξ (3.6)
where I0 is the initial pump irradiance and α(ξ) is the combined position-dependent
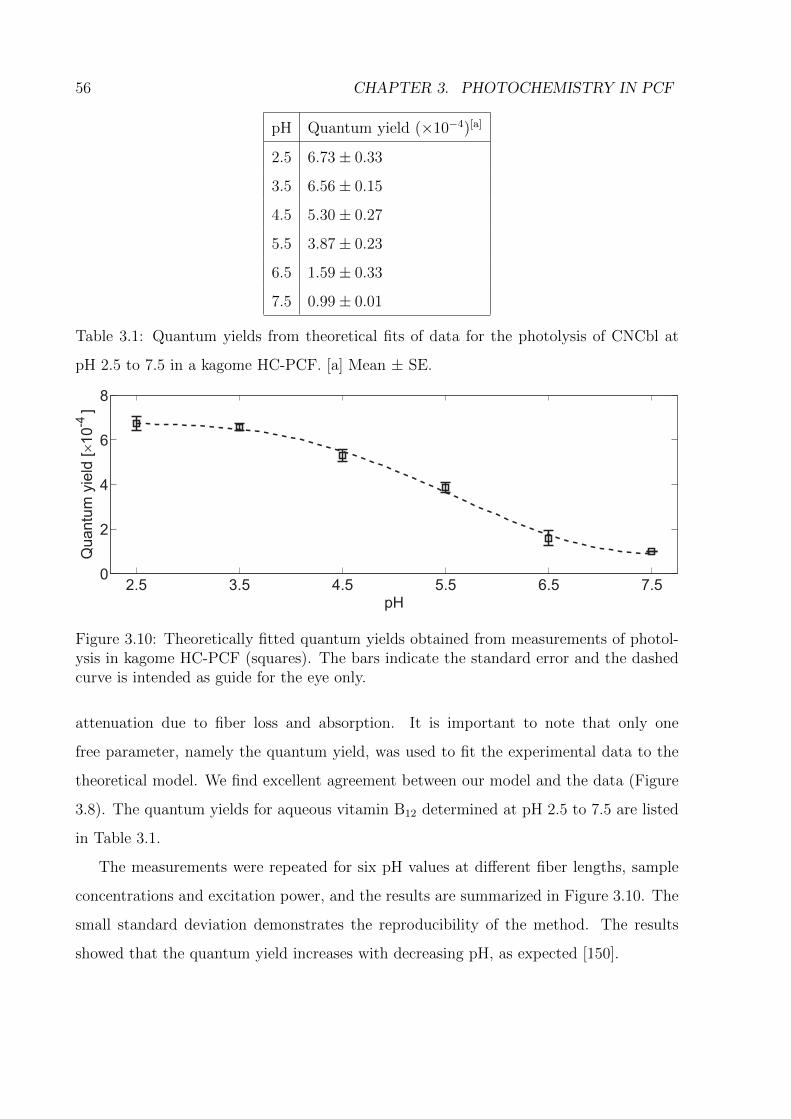
56 CHAPTER 3. PHOTOCHEMISTRY IN PCF
pH Quantum yield (×10−4)[a]
2.5 6.73± 0.33
3.5 6.56± 0.15
4.5 5.30± 0.27
5.5 3.87± 0.23
6.5 1.59± 0.33
7.5 0.99± 0.01
Table 3.1: Quantum yields from theoretical fits of data for the photolysis of CNCbl at
pH 2.5 to 7.5 in a kagome HC-PCF. [a] Mean ± SE.
2.5 3.5 4.5 5.5 6.5 7.50
2
4
6
8
pH
Qu
an
tum
yie
ld [
�1
0-4
]
Figure 3.10: Theoretically fitted quantum yields obtained from measurements of photol-ysis in kagome HC-PCF (squares). The bars indicate the standard error and the dashedcurve is intended as guide for the eye only.
attenuation due to fiber loss and absorption. It is important to note that only one
free parameter, namely the quantum yield, was used to fit the experimental data to the
theoretical model. We find excellent agreement between our model and the data (Figure
3.8). The quantum yields for aqueous vitamin B12 determined at pH 2.5 to 7.5 are listed
in Table 3.1.
The measurements were repeated for six pH values at different fiber lengths, sample
concentrations and excitation power, and the results are summarized in Figure 3.10. The
small standard deviation demonstrates the reproducibility of the method. The results
showed that the quantum yield increases with decreasing pH, as expected [150].
3.4. PHOTOSWITCHING OF AZOBENZENE MOLECULES 57
3.3.4 Discussion
In summary, the use of HC-PCF for the simultaneous quantitative assay of cyanocobal-
amin and aquacobalamin in aqueous solution has been demonstrated on a nanoliter scale.
Laser-driven changes in the absorption spectrum are monitored within the fiber. This
new method requires not only 104 times less sample volume compared to conventional
techniques, but also greatly reduced excitation power, allowing system minimization us-
ing cheap on-chip diode lasers. Furthermore, the reaction is 1000 times faster as a result
of the strong confinement of both sample and light in the hollow core. The procedure
should therefore find wide application, enabling rapid investigation of photochemical reac-
tions with modest quantum yields. Implementation of PCFs as flow reactors would allow
continuous optimization of exposure conditions and reagent parameters, and integration
of the reactor into an optical tweezer/particle guidance setup [162] would open up new
opportunities for in vitro investigation of photoactive anticancer complexes [126]. The ex-
ploitation of PCFs as optofluidic devices offers significant advantages including minimal
consumption of reagents and flexibility for integration into other microfluidic circuitry for
improved performance.
3.4 Photoswitching of Azobenzene Molecules
Azobenzene chromophores are widely recognized as one of the most important and ver-
satile classes of synthetic organic compounds, and have received much attention in both
fundamental and applied research. With two phenyl rings separated by an azo (−N=N−)
bond, azobenzene serves as the parent molecule for a host of aromatic azo compounds.
The strong electronic absorption maximum can be tuned via the combination of the prop-
erties of the azo group and the substitution of the aromatic ligands, resulting in intense
colors of dye over the whole visible range. Furthermore, the thermal and chemical robust-
ness of these azo compounds, combined with non-complex synthetic methodologies and
low production costs, has prompted extensive study of azobenzene-based structures as
dyes and colorants [163, 164]. The mesogenic shape of the molecule also finds holographic
applications in which azobenzene chromophores embedded in polymers (azo polymers) are
used in gratings and liquid crystalline media [165-167]. When azobenzene is push-pull sub-
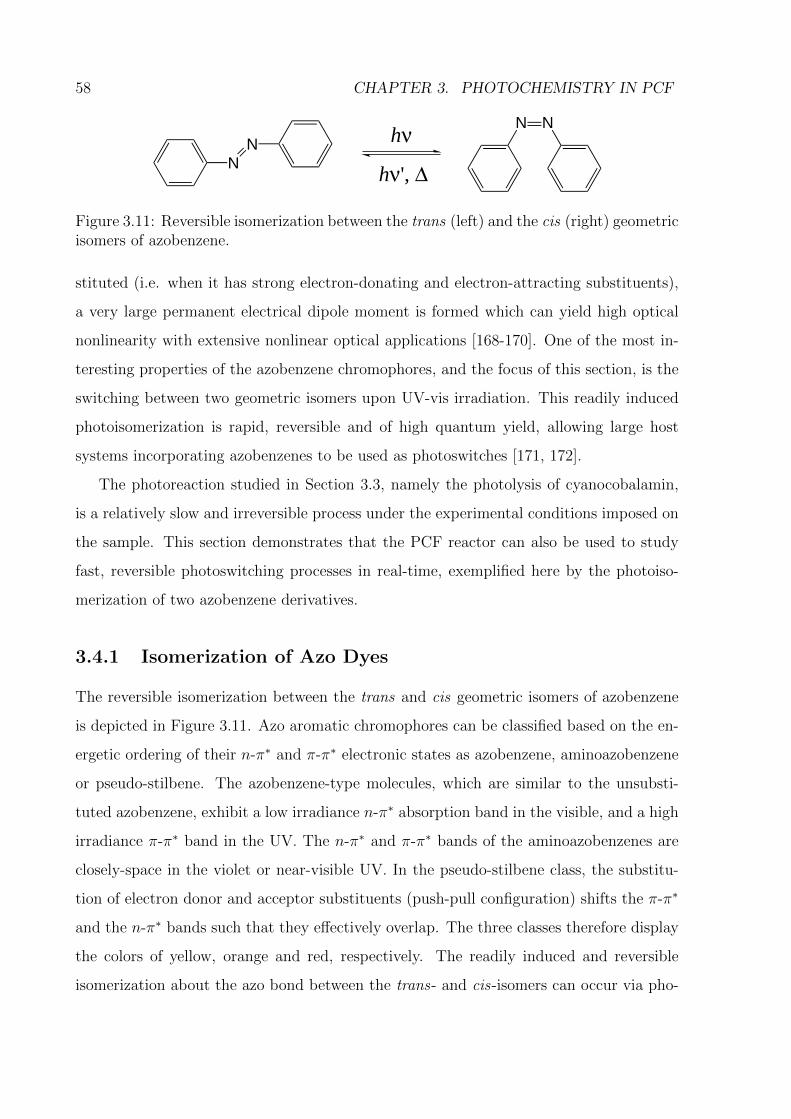
58 CHAPTER 3. PHOTOCHEMISTRY IN PCF
NN
N Nhν
hν', Δ
Figure 3.11: Reversible isomerization between the trans (left) and the cis (right) geometricisomers of azobenzene.
stituted (i.e. when it has strong electron-donating and electron-attracting substituents),
a very large permanent electrical dipole moment is formed which can yield high optical
nonlinearity with extensive nonlinear optical applications [168-170]. One of the most in-
teresting properties of the azobenzene chromophores, and the focus of this section, is the
switching between two geometric isomers upon UV-vis irradiation. This readily induced
photoisomerization is rapid, reversible and of high quantum yield, allowing large host
systems incorporating azobenzenes to be used as photoswitches [171, 172].
The photoreaction studied in Section 3.3, namely the photolysis of cyanocobalamin,
is a relatively slow and irreversible process under the experimental conditions imposed on
the sample. This section demonstrates that the PCF reactor can also be used to study
fast, reversible photoswitching processes in real-time, exemplified here by the photoiso-
merization of two azobenzene derivatives.
3.4.1 Isomerization of Azo Dyes
The reversible isomerization between the trans and cis geometric isomers of azobenzene
is depicted in Figure 3.11. Azo aromatic chromophores can be classified based on the en-
ergetic ordering of their n-π∗ and π-π∗ electronic states as azobenzene, aminoazobenzene
or pseudo-stilbene. The azobenzene-type molecules, which are similar to the unsubsti-
tuted azobenzene, exhibit a low irradiance n-π∗ absorption band in the visible, and a high
irradiance π-π∗ band in the UV. The n-π∗ and π-π∗ bands of the aminoazobenzenes are
closely-space in the violet or near-visible UV. In the pseudo-stilbene class, the substitu-
tion of electron donor and acceptor substituents (push-pull configuration) shifts the π-π∗
and the n-π∗ bands such that they effectively overlap. The three classes therefore display
the colors of yellow, orange and red, respectively. The readily induced and reversible
isomerization about the azo bond between the trans- and cis-isomers can occur via pho-
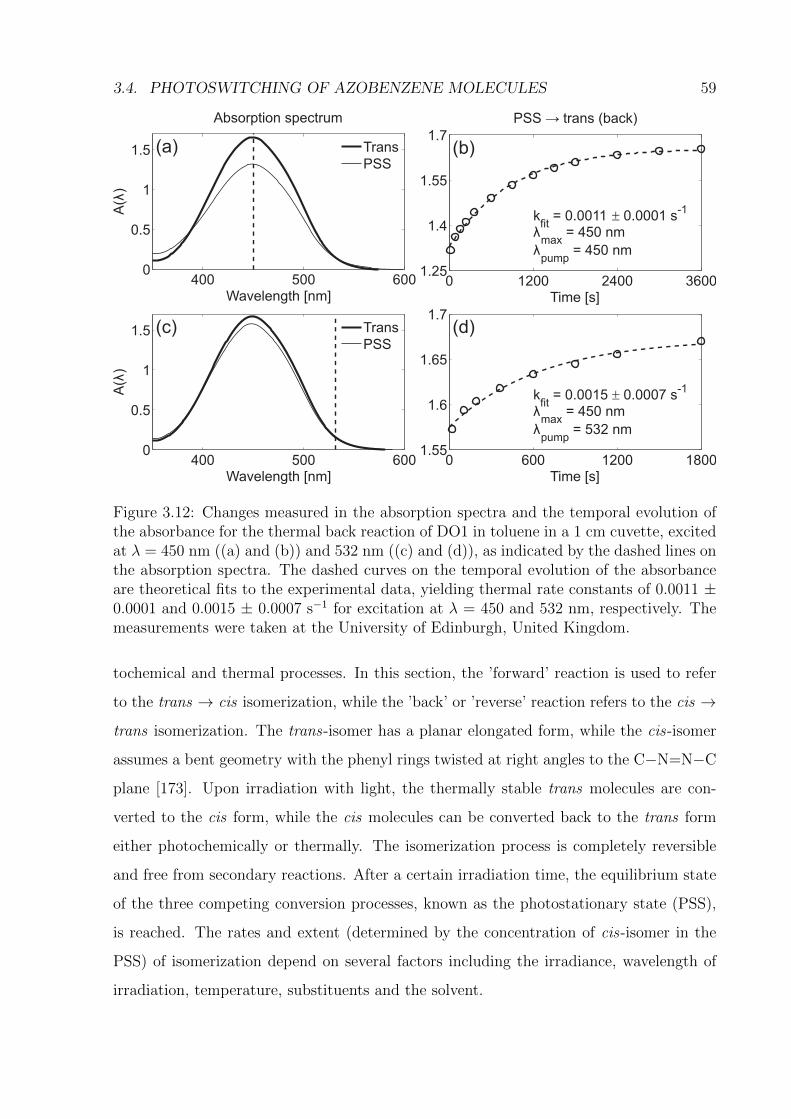
3.4. PHOTOSWITCHING OF AZOBENZENE MOLECULES 59
400 500 6000
0.5
1
1.5
Wavelength [nm]
A(λ
)Absorption spectrum
Trans
PSS
0 1200 2400 36001.25
1.4
1.55
1.7
Time [s]
PSS → trans (back)
kfit
= 0.0011 � 0.0001 s-1
λmax
= 450 nm
λpump
= 450 nm
400 500 6000
0.5
1
1.5
Wavelength [nm]
A(λ
)
Trans
PSS
0 600 1200 18001.55
1.6
1.65
1.7
Time [s]
kfit
= 0.0015 � 0.0007 s-1
λmax
= 450 nm
λpump
= 532 nm
(a) (b)
(c) (d)
Figure 3.12: Changes measured in the absorption spectra and the temporal evolution ofthe absorbance for the thermal back reaction of DO1 in toluene in a 1 cm cuvette, excitedat λ = 450 nm ((a) and (b)) and 532 nm ((c) and (d)), as indicated by the dashed lines onthe absorption spectra. The dashed curves on the temporal evolution of the absorbanceare theoretical fits to the experimental data, yielding thermal rate constants of 0.0011 ±0.0001 and 0.0015 ± 0.0007 s−1 for excitation at λ = 450 and 532 nm, respectively. Themeasurements were taken at the University of Edinburgh, United Kingdom.
tochemical and thermal processes. In this section, the ’forward’ reaction is used to refer
to the trans → cis isomerization, while the ’back’ or ’reverse’ reaction refers to the cis →
trans isomerization. The trans-isomer has a planar elongated form, while the cis-isomer
assumes a bent geometry with the phenyl rings twisted at right angles to the C−N=N−C
plane [173]. Upon irradiation with light, the thermally stable trans molecules are con-
verted to the cis form, while the cis molecules can be converted back to the trans form
either photochemically or thermally. The isomerization process is completely reversible
and free from secondary reactions. After a certain irradiation time, the equilibrium state
of the three competing conversion processes, known as the photostationary state (PSS),
is reached. The rates and extent (determined by the concentration of cis-isomer in the
PSS) of isomerization depend on several factors including the irradiance, wavelength of
irradiation, temperature, substituents and the solvent.
60 CHAPTER 3. PHOTOCHEMISTRY IN PCF
In order to demonstrate the effect of some of these factors, a series of forward and
thermal back reactions were undertaken for 4-(4-Nitrophenylazo)diphenylamine (disperse
orange 1, DO1) and N-Ethyl-N-(2-hydroxyethyl)-4-(4-nitrophenylazo)aniline (disperse red
1, DR1) in the solvents cyclohexane and toluene, irradiated with λ = 450, 488 and 532 nm
radiation. Figure 3.12 shows the changes in the absorption spectra and the temporal evo-
lution of the absorbance for the thermal back reaction of DO1 in toluene, measured in a
1 cm cuvette. The sample was excited at λ = 450 nm and 532 nm to demonstrate the
dependence of the concentration of the cis-isomer in the PSS on excitation wavelength.
The advantage of pumping near the absorption maximum of the trans-isomer was im-
mediately evident: the absorbance decreased by 20% for the PSS induced by 450 nm
radiation, indicating that at least 20% of the molecules had been converted to the cis
form; on the other hand, for PSS induced by 532 nm radiation, the absorbance has only
decreased by 5%.
As the thermal isomerization was the sole process taking place, it can be described by
a simple first-order kinetic equation written as
−dccis(t)
dt=dctrans(t)
dt= kccis(t) (3.7)
where ccis(t) and ctrans(t) are the concentrations of the cis- and trans-isomers after time t
of thermal back reaction, and k is the thermal rate constant. The temporal evolution of
the absorption spectrum for the thermal back reaction can therefore be derived by using
the Beer-Lambert law in Equation 3.7 as
A(t) = [A(0)− A(∞)] exp(−kT ) + A(∞), (3.8)
whereA(0) andA(∞) are the absorbance at the start and end of the thermal back reaction,
respectively. The dashed curves on the temporal evolution of the absorbance (Figure
3.12(b) and (d)) are the theoretical fits to the experimental data using Equation 3.7 with
fitted thermal rate constants of 0.0011 ± 0.0001 and 0.0015 ± 0.0007 s−1 for the excitation
at λ = 450 and 532 nm. The agreement in the fitted thermal rate constants within the
error margin is expected as the thermal back reaction rate should be independent of the
wavelength at which the sample had been excited to reach the PSS.
Figure 3.13 shows the measured temporal evolution of molar absorptivity for the for-
ward and thermal back reactions of 15 µM of DR1 in cyclohexane and toluene in a 1 cm
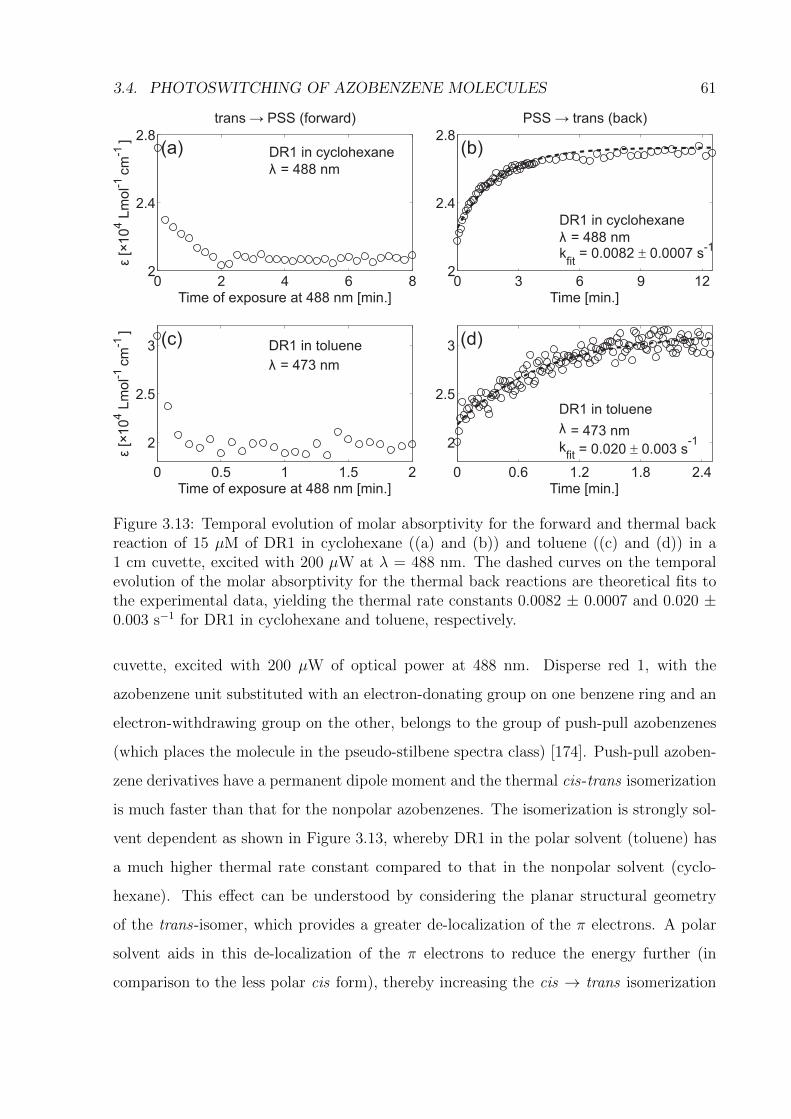
3.4. PHOTOSWITCHING OF AZOBENZENE MOLECULES 61
0 2 4 6 82
2.4
2.8
Time of exposure at 488 nm [min.]
ε[×
10
4Lm
ol-1
cm
-1]
trans → PSS (forward)
DR1 in cyclohexane
λ = 488 nm
0 3 6 9 122
2.4
2.8
Time [min.]
PSS → trans (back)
DR1 in cyclohexane
λ = 488 nmk
fit= 0.0082 � 0.0007 s
-1
0 0.5 1 1.5 2
2
2.5
3
Time of exposure at 488 nm [min.]
ε[×
10
4Lm
ol-1
cm
-1]
DR1 in toluene
λ = 473 nm
(a) (b)
(c)
0 0.6 1.2 1.8 2.4
2
2.5
3
Time [min.]
= 473 nm
= 0.020 � 0.003 s
DR1 in toluene
λ
kfit
-1
(d)
Figure 3.13: Temporal evolution of molar absorptivity for the forward and thermal backreaction of 15 µM of DR1 in cyclohexane ((a) and (b)) and toluene ((c) and (d)) in a1 cm cuvette, excited with 200 µW at λ = 488 nm. The dashed curves on the temporalevolution of the molar absorptivity for the thermal back reactions are theoretical fits tothe experimental data, yielding the thermal rate constants 0.0082 ± 0.0007 and 0.020 ±0.003 s−1 for DR1 in cyclohexane and toluene, respectively.
cuvette, excited with 200 µW of optical power at 488 nm. Disperse red 1, with the
azobenzene unit substituted with an electron-donating group on one benzene ring and an
electron-withdrawing group on the other, belongs to the group of push-pull azobenzenes
(which places the molecule in the pseudo-stilbene spectra class) [174]. Push-pull azoben-
zene derivatives have a permanent dipole moment and the thermal cis-trans isomerization
is much faster than that for the nonpolar azobenzenes. The isomerization is strongly sol-
vent dependent as shown in Figure 3.13, whereby DR1 in the polar solvent (toluene) has
a much higher thermal rate constant compared to that in the nonpolar solvent (cyclo-
hexane). This effect can be understood by considering the planar structural geometry
of the trans-isomer, which provides a greater de-localization of the π electrons. A polar
solvent aids in this de-localization of the π electrons to reduce the energy further (in
comparison to the less polar cis form), thereby increasing the cis → trans isomerization
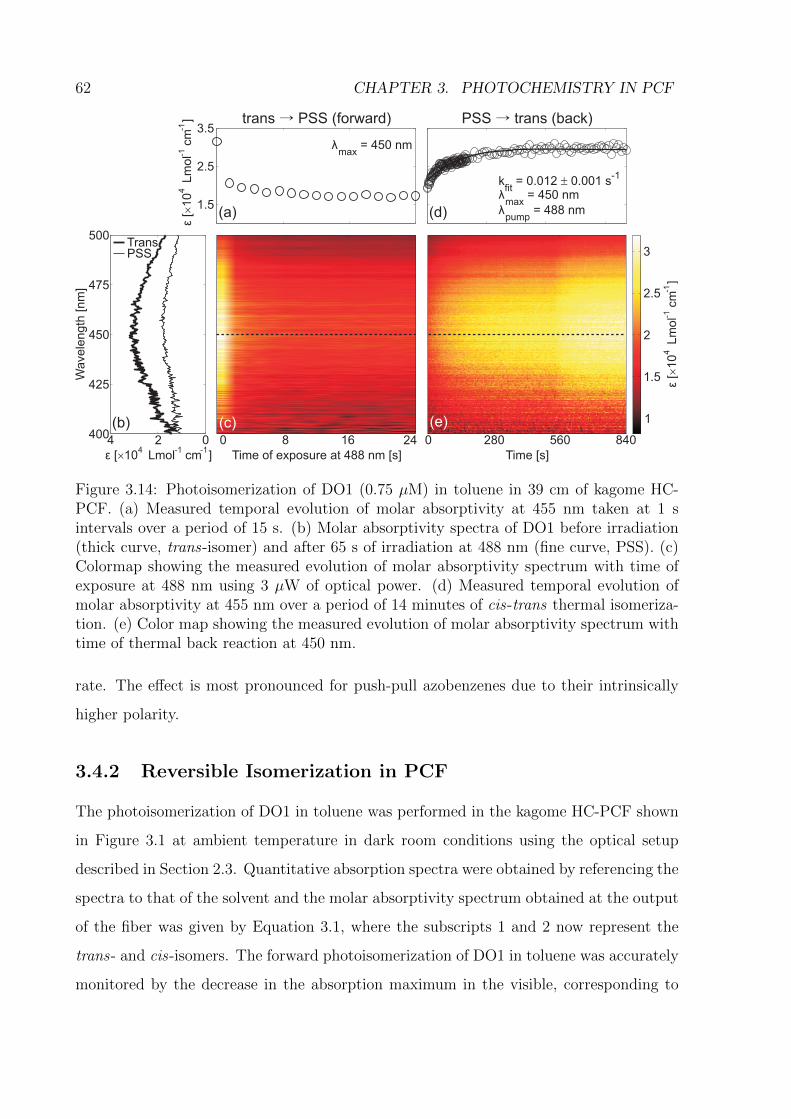
62 CHAPTER 3. PHOTOCHEMISTRY IN PCF
1.5
2.5
3.5
= 450 nm
PSS (forward)trans →
(a)
400
425
450
475
500
024
Wa
ve
len
gth
[n
m]
TransPSS
ε [ 10 Lmol cm ]�4 -1 -1
(b)0 8 16 24
Time of exposure at 488 nm [s]
(c)
trans (back)PSS →
0 280 560 840
1
2
3
2.5
1.5
Time [s]
ε[
10
L
mo
l
cm
]
�4
-1
-1
(e)
ε[
10
L
mo
l
cm
]
�4
-1
-1
(d)
kfit
= 0.012 � 0.001 s-1
λmax
= 450 nm
λpump
= 488 nm
λmax
Figure 3.14: Photoisomerization of DO1 (0.75 µM) in toluene in 39 cm of kagome HC-PCF. (a) Measured temporal evolution of molar absorptivity at 455 nm taken at 1 sintervals over a period of 15 s. (b) Molar absorptivity spectra of DO1 before irradiation(thick curve, trans-isomer) and after 65 s of irradiation at 488 nm (fine curve, PSS). (c)Colormap showing the measured evolution of molar absorptivity spectrum with time ofexposure at 488 nm using 3 µW of optical power. (d) Measured temporal evolution ofmolar absorptivity at 455 nm over a period of 14 minutes of cis-trans thermal isomeriza-tion. (e) Color map showing the measured evolution of molar absorptivity spectrum withtime of thermal back reaction at 450 nm.
rate. The effect is most pronounced for push-pull azobenzenes due to their intrinsically
higher polarity.
3.4.2 Reversible Isomerization in PCF
The photoisomerization of DO1 in toluene was performed in the kagome HC-PCF shown
in Figure 3.1 at ambient temperature in dark room conditions using the optical setup
described in Section 2.3. Quantitative absorption spectra were obtained by referencing the
spectra to that of the solvent and the molar absorptivity spectrum obtained at the output
of the fiber was given by Equation 3.1, where the subscripts 1 and 2 now represent the
trans- and cis-isomers. The forward photoisomerization of DO1 in toluene was accurately
monitored by the decrease in the absorption maximum in the visible, corresponding to
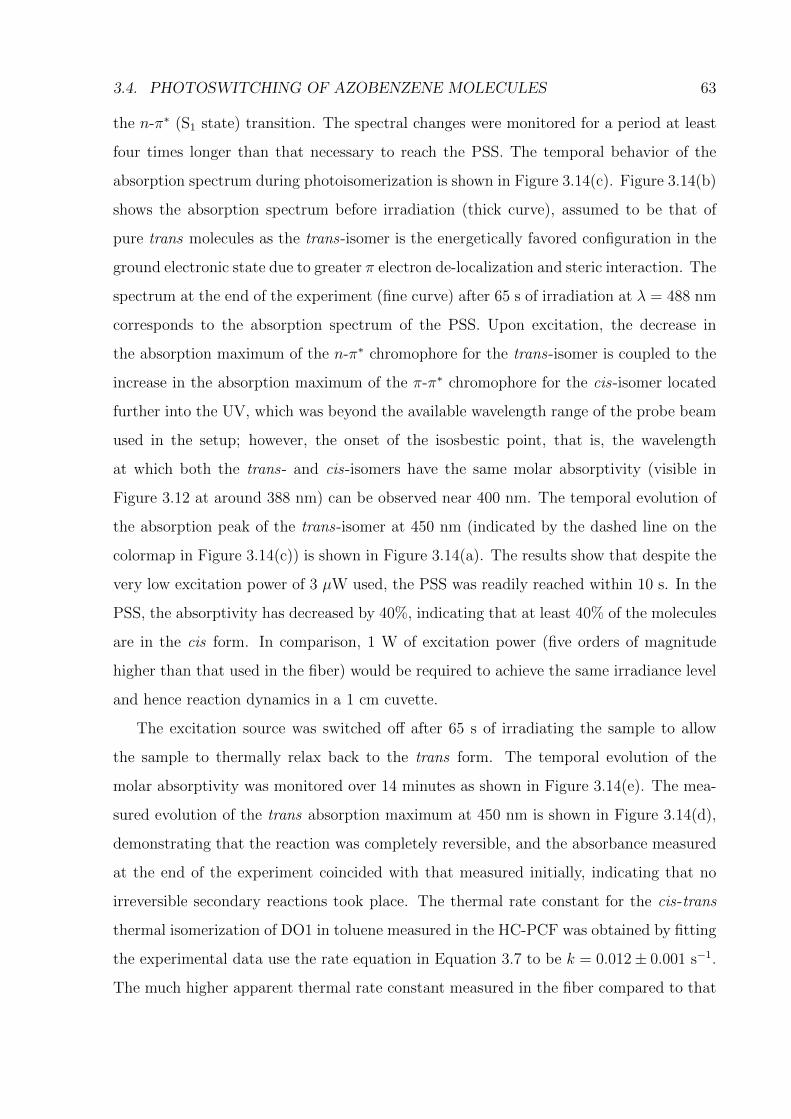
3.4. PHOTOSWITCHING OF AZOBENZENE MOLECULES 63
the n-π∗ (S1 state) transition. The spectral changes were monitored for a period at least
four times longer than that necessary to reach the PSS. The temporal behavior of the
absorption spectrum during photoisomerization is shown in Figure 3.14(c). Figure 3.14(b)
shows the absorption spectrum before irradiation (thick curve), assumed to be that of
pure trans molecules as the trans-isomer is the energetically favored configuration in the
ground electronic state due to greater π electron de-localization and steric interaction. The
spectrum at the end of the experiment (fine curve) after 65 s of irradiation at λ = 488 nm
corresponds to the absorption spectrum of the PSS. Upon excitation, the decrease in
the absorption maximum of the n-π∗ chromophore for the trans-isomer is coupled to the
increase in the absorption maximum of the π-π∗ chromophore for the cis-isomer located
further into the UV, which was beyond the available wavelength range of the probe beam
used in the setup; however, the onset of the isosbestic point, that is, the wavelength
at which both the trans- and cis-isomers have the same molar absorptivity (visible in
Figure 3.12 at around 388 nm) can be observed near 400 nm. The temporal evolution of
the absorption peak of the trans-isomer at 450 nm (indicated by the dashed line on the
colormap in Figure 3.14(c)) is shown in Figure 3.14(a). The results show that despite the
very low excitation power of 3 µW used, the PSS was readily reached within 10 s. In the
PSS, the absorptivity has decreased by 40%, indicating that at least 40% of the molecules
are in the cis form. In comparison, 1 W of excitation power (five orders of magnitude
higher than that used in the fiber) would be required to achieve the same irradiance level
and hence reaction dynamics in a 1 cm cuvette.
The excitation source was switched off after 65 s of irradiating the sample to allow
the sample to thermally relax back to the trans form. The temporal evolution of the
molar absorptivity was monitored over 14 minutes as shown in Figure 3.14(e). The mea-
sured evolution of the trans absorption maximum at 450 nm is shown in Figure 3.14(d),
demonstrating that the reaction was completely reversible, and the absorbance measured
at the end of the experiment coincided with that measured initially, indicating that no
irreversible secondary reactions took place. The thermal rate constant for the cis-trans
thermal isomerization of DO1 in toluene measured in the HC-PCF was obtained by fitting
the experimental data use the rate equation in Equation 3.7 to be k = 0.012± 0.001 s−1.
The much higher apparent thermal rate constant measured in the fiber compared to that
64 CHAPTER 3. PHOTOCHEMISTRY IN PCF
obtained from measurements in the cuvette shown in Figure 3.12 was unexpected as the
thermal back reaction is a first order process, independent of the concentration and volume
of sample used in the experiments. A possible factor which could induce the difference
in the thermal rate constant measured is the change in temperature. From the Arrhe-
nius equation, k(T ) = A exp(−EA/RT ), where R is the Boltzmann constant, and using
an activation energy EA of 72 kJ/mol and ln(A) of 22 [175], the temperature difference
between the two different laboratories in which the cuvette and fiber measurements were
performed would have to be ∼ 25 K to induce the difference in the measured thermal
rate constants. This seems unrealistically high. This discrepancy stimulated further in-
vestigations to establish plausible causes for the marked differences in the experimental
results.
Another possible source of discrepancy could come from the probe light. Without
making changes to the configuration of the experimental setup and dark room condi-
tions, the absorption spectrum of the azo molecule in its thermally stable trans form was
monitored using the broadband light source, namely the xenon lamp, at various average
lamp powers. Figure 3.15(a) shows the measured temporal evolution of the absorbance
at the n-π∗ absorption peak of the trans-isomer, for average lamp powers of 0.02, 0.55
and 1.15 µW between λ = 400 and 500 nm. It was observed that despite the very low
average lamp power used, the resulting irradiance in the 19 µm hollow fiber core was still
high enough to induce photoisomerization, ranging from I = 70.5 W/m2 (for P = 0.02
µW) to 4050 W/m2 (for P = 1.15 µW). The n-π∗ absorption of the cis-isomer, which
is non-zero in the wavelength range of 400 to 500 nm, would similarly cause the reverse
cis-trans photoisomerization. For the thermal isomerization measurement performed, the
xenon lamp was required to be on for the duration of the spectrometer integration time,
which was 500 ms in this case, during which sufficient (and undesirable) effect occurred
and could have led to the discrepancies in the rate constants measured in the cuvette
and the fiber. Another noticeable effect observed was the dependence of the extent of
photoisomerization on the irradiance. As shown in Figure 3.15(b), the relative change
in the absorbance at the PSS, given by [A(0)−A(PSS)]/A(0), increased with irradiance,
indicating increased fraction of cis-isomer in the PSS.
Due to the broadband nature of the pump source, which was originally intended as
3.4. PHOTOSWITCHING OF AZOBENZENE MOLECULES 65
0 0.4 0.8 1.20.43
0.46
0.49
Average power of xenon lamp [µW]
[A(0
)-A
(PS
S)]
/A(0
)
0 40 80 120
0.55
0.7
0.85
1
Exposure time [s]
Absorb
ance
0 4 8 120.5
0.65
0.8
0.95
Exposure time [s]
Absorb
ance
1.15 µW
0.55 µW
0.02 µW
(a)
(b)
Figure 3.15: (a) Measured temporal evolution of absorbance at the absorption peak oftrans-DO1 in toluene irradiated with a broadband xenon lamp with average powers of 1.15,0.55 and 0.02 µW. Inset: zoomed-in figure for the first 12 s. (b) Measured dependence ofthe relative change in the absorbance at the PSS on irradiance, extracted from the datain (a). The dashed curves are intended as guide for the eye only.
the probe beam, further analysis of the data would require knowledge of the cis-isomer
absorption spectrum and the spectral density of the xenon lamp in this wavelength range.
An accurate cis absorption spectrum could be extrapolated by the Fischer method [176],
which requires the measurements for temporal absorption dynamics at two different exci-
tation wavelengths. Due to the influence of the probe beam on the rate of photoisomer-
ization in both the forward and reverse directions, in addition to the stepwise pump-probe
cycle implemented for the measurements, solution to the coupled rate equations describing
the reaction kinetics becomes complicated and requires tedious numerical computation,
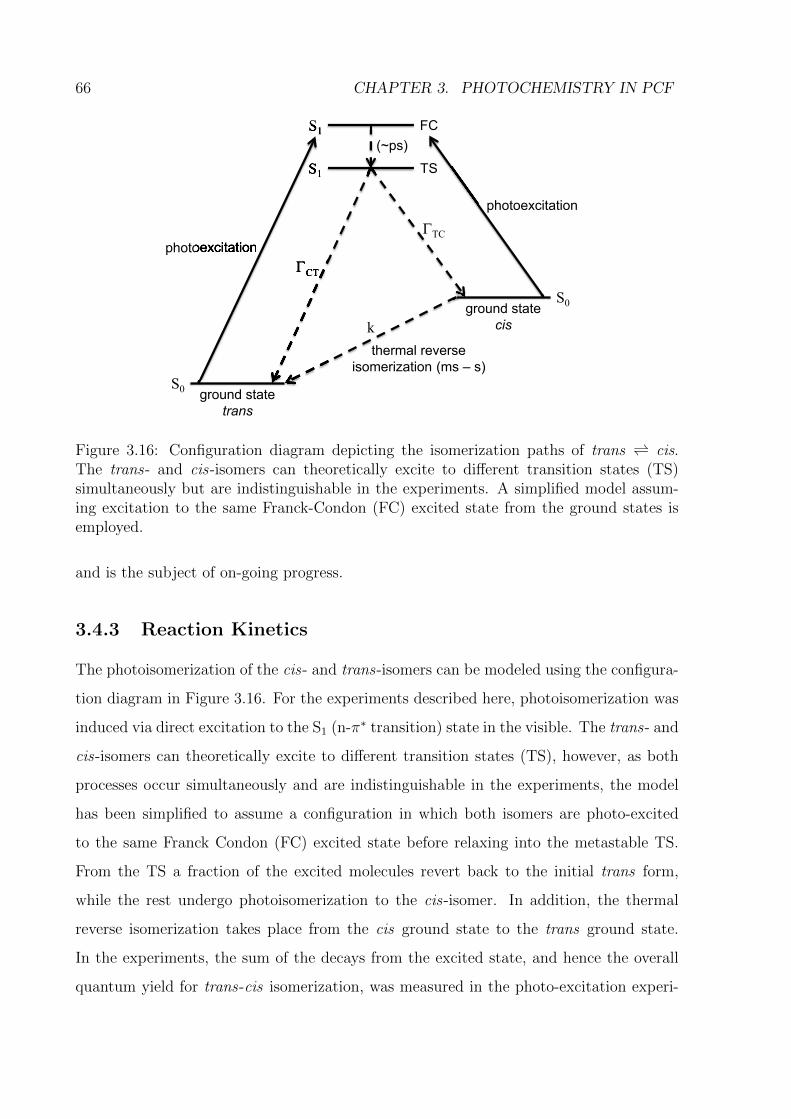
66 CHAPTER 3. PHOTOCHEMISTRY IN PCF
S0
S0
ground statetrans
S1
S1
FC
TS
photoexcitation
photoexcitation
thermal reverse isomerization (ms – s)
ground statecisk
ΓCT
ΓTC
(~ps)S1
SS1
photoexcitation ΓCT
Figure 3.16: Configuration diagram depicting the isomerization paths of trans ⇀↽ cis.The trans- and cis-isomers can theoretically excite to different transition states (TS)simultaneously but are indistinguishable in the experiments. A simplified model assum-ing excitation to the same Franck-Condon (FC) excited state from the ground states isemployed.
and is the subject of on-going progress.
3.4.3 Reaction Kinetics
The photoisomerization of the cis- and trans-isomers can be modeled using the configura-
tion diagram in Figure 3.16. For the experiments described here, photoisomerization was
induced via direct excitation to the S1 (n-π∗ transition) state in the visible. The trans- and
cis-isomers can theoretically excite to different transition states (TS), however, as both
processes occur simultaneously and are indistinguishable in the experiments, the model
has been simplified to assume a configuration in which both isomers are photo-excited
to the same Franck Condon (FC) excited state before relaxing into the metastable TS.
From the TS a fraction of the excited molecules revert back to the initial trans form,
while the rest undergo photoisomerization to the cis-isomer. In addition, the thermal
reverse isomerization takes place from the cis ground state to the trans ground state.
In the experiments, the sum of the decays from the excited state, and hence the overall
quantum yield for trans-cis isomerization, was measured in the photo-excitation experi-
3.4. PHOTOSWITCHING OF AZOBENZENE MOLECULES 67
ments, while the additional back reaction measurements allow the thermal rate constant
to be determined (see Equation 3.7). The reaction kinetics can be described by modeling
the number densities in the three states in Figure 3.16 using the following coupled rate
equations,
∂nT(t)
∂t= − Ip
hνpσTnT(t) + ΓCTnTS(t) + knC(t), (3.9)
∂nC(t)
∂t= − Ip
hνpσCnC(t) + ΓTCnTS(t)− knC(t), (3.10)
nT(t) + nTS(t) + nC(t) = 1, (3.11)
where nT,C,TS(t) are the normalized number densities in the trans, cis and transition
states, Ip and hνp the power density and photon energy of the pump light, σTC and σCT
the absorption cross-section at the pump wavelength for excitation from the trans and
cis states to the TS, ΓCT is the decay rate from TS to trans and ΓTC is the rate for
photoisomerization. The third equation follows from the conservation law. The quantum
yield, which describes the fraction of trans excited to TS which are converted to cis upon
irradiation, has the form given by
Φ =ΓTC
ΓTC + ΓCT
. (3.12)
Under the assumption that the molecules do not spend any time in TS, Equation 3.10
can be re-written as:
∂nC(t)
∂t= − Ip
hνpσCnC(t) + Φ
Iphνp
nT(t)− knC(t). (3.13)
In the photostationary state, ∂nC(t)/∂t = 0 and the fraction of molecules in the cis form
is given by
nC =ΦIp/hνp
(σT + σC)Ip/hνp + k. (3.14)
It can be seen from Equation 3.14 that in the limit of high irradiance Ip and excitation
at the isosbestic point, so that σT = σC, the quantum yield for the forward reaction can
be obtained from the fraction of cis-isomer in the photostationary state.
3.4.4 Discussion
The results have demonstrated real-time monitoring of fast, reversible photoswitching pro-
cesses induced in PCF photoreactors. The strong enhancement of light-matter interaction
68 CHAPTER 3. PHOTOCHEMISTRY IN PCF
in the tiny hollow fiber core has led to undesirable effects in which the broadband probe
beam also induces photoisomerization in both direction, therefore interfering with the ac-
tual pump-probe measurement and hindering the quantitative determination of reaction
rate constants. Implementation of the Fischer method to extrapolate the full absorption
spectrum of the cis-isomer and integration of the spectrum into the numerical computa-
tion of the solution to the coupled rate equations is in progress and should lead to further
insight into the reaction kinetics. Furthermore, by incorporating the experiment in a
femtosecond spectroscopy setup, the enhanced temporal resolution and the possibility for
two-photon photoisomerization could help clarify the on-going debate on the mechanism
of isomerization [177, 178]. In addition, the stepwise measurement approach has proven
to complicate the analyses of reaction dynamics in which thermally reversible back re-
actions retard the efficiency and rate of the photo-induced forward reaction. The huge
computational time required for modeling the stepwise reaction kinetics can be resolved
by implementing the experimental setup in a counter-propagating pump-probe configura-
tion to allow for continuous sample irradiation and spectra collection, and is detailed in
Appendix A.
Chapter 4
Spectroscopy in PCF
4.1 Introduction
As already addressed in Section 1.5, the advances in PCF design have generated much
interest in exploring its use as vehicles for optical sensors, in particular as the post-
processing step is no longer required thanks to the fiber microstructure. Additionally, PCF
sensors can strongly reduce the sample volume required for measurements and provide
the robustness and flexibility needed for fiber sensors. In the context of absorption-
based PCF sensor designs, hollow-core PBG-PCF offers an ideal environment for optical
spectroscopy by virtue of its ability to maximize light-matter interaction at path lengths
that are much longer than achievable in conventional sample cells. However, practical
application is limited to narrow-band spectroscopic gas sensing measurements [138, 179],
as the transmission bandwidth of the hollow-core PBG-PCF is typically narrower than
100 nm, impeding its competitiveness as liquid-based chemical sensors requiring detection
of broad spectral features.
In this chapter, a quantitative broadband fiber sensor based on evanescent-wave sens-
ing in the cladding holes of an air-suspended SC-PCF is demonstrated in Section 4.2.
As the evanescent-wave sensors preferentially probe surface effects, significant differences
between bulk and in-fiber measurements can result. Results from the investigation of sur-
face interactions between the fiber surfaces and the sample are presented and discussed
in Section 4.3, concluded with suggestions for further investigative ventures.
69
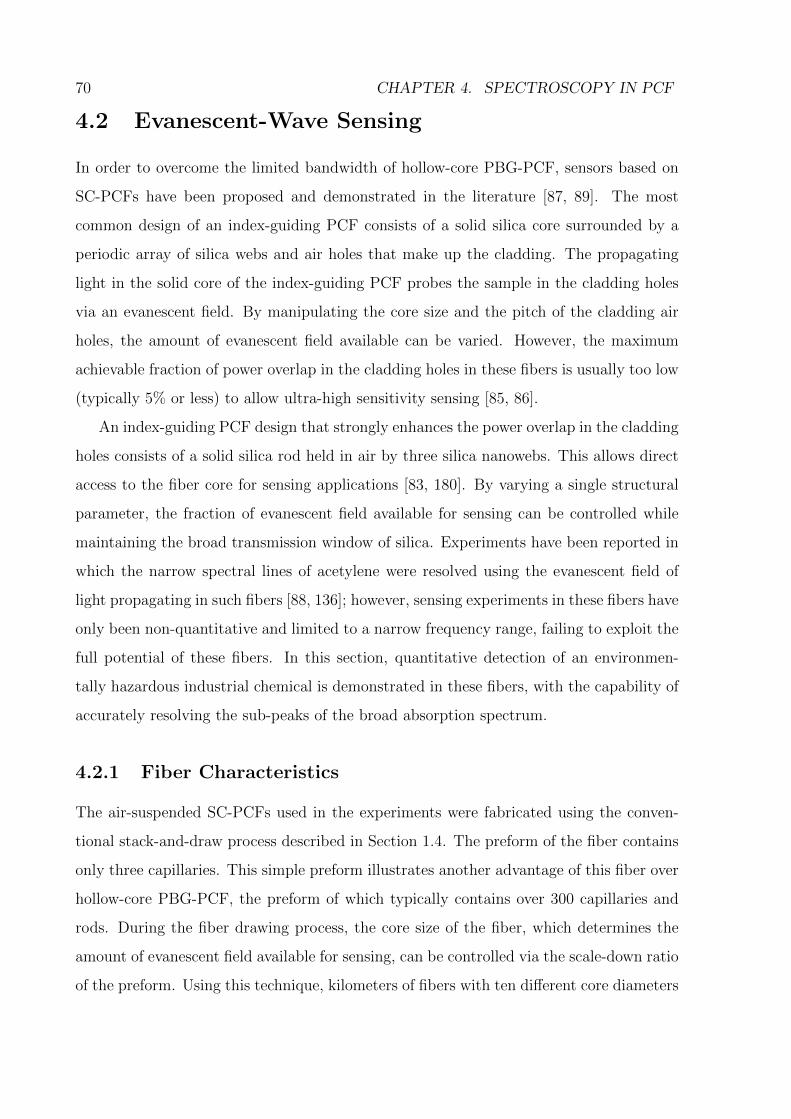
70 CHAPTER 4. SPECTROSCOPY IN PCF
4.2 Evanescent-Wave Sensing
In order to overcome the limited bandwidth of hollow-core PBG-PCF, sensors based on
SC-PCFs have been proposed and demonstrated in the literature [87, 89]. The most
common design of an index-guiding PCF consists of a solid silica core surrounded by a
periodic array of silica webs and air holes that make up the cladding. The propagating
light in the solid core of the index-guiding PCF probes the sample in the cladding holes
via an evanescent field. By manipulating the core size and the pitch of the cladding air
holes, the amount of evanescent field available can be varied. However, the maximum
achievable fraction of power overlap in the cladding holes in these fibers is usually too low
(typically 5% or less) to allow ultra-high sensitivity sensing [85, 86].
An index-guiding PCF design that strongly enhances the power overlap in the cladding
holes consists of a solid silica rod held in air by three silica nanowebs. This allows direct
access to the fiber core for sensing applications [83, 180]. By varying a single structural
parameter, the fraction of evanescent field available for sensing can be controlled while
maintaining the broad transmission window of silica. Experiments have been reported in
which the narrow spectral lines of acetylene were resolved using the evanescent field of
light propagating in such fibers [88, 136]; however, sensing experiments in these fibers have
only been non-quantitative and limited to a narrow frequency range, failing to exploit the
full potential of these fibers. In this section, quantitative detection of an environmen-
tally hazardous industrial chemical is demonstrated in these fibers, with the capability of
accurately resolving the sub-peaks of the broad absorption spectrum.
4.2.1 Fiber Characteristics
The air-suspended SC-PCFs used in the experiments were fabricated using the conven-
tional stack-and-draw process described in Section 1.4. The preform of the fiber contains
only three capillaries. This simple preform illustrates another advantage of this fiber over
hollow-core PBG-PCF, the preform of which typically contains over 300 capillaries and
rods. During the fiber drawing process, the core size of the fiber, which determines the
amount of evanescent field available for sensing, can be controlled via the scale-down ratio
of the preform. Using this technique, kilometers of fibers with ten different core diameters
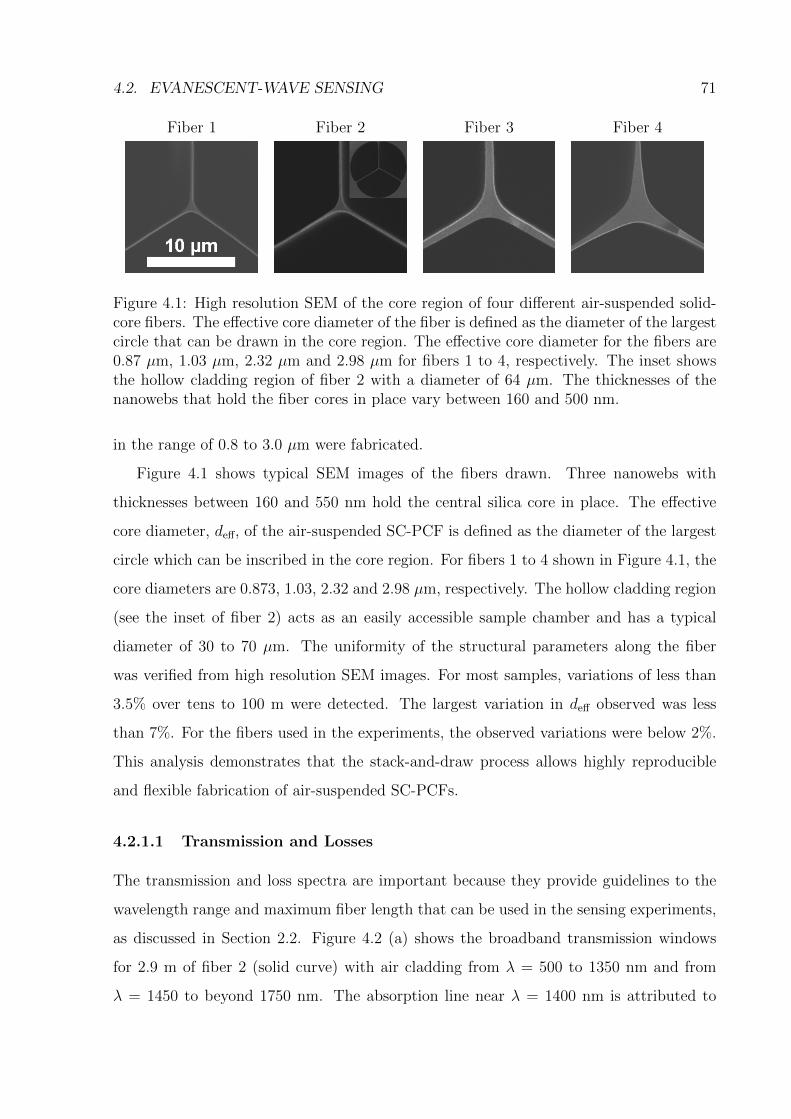
4.2. EVANESCENT-WAVE SENSING 71
Fiber 1 Fiber 2 Fiber 3 Fiber 4
Figure 4.1: High resolution SEM of the core region of four different air-suspended solid-core fibers. The effective core diameter of the fiber is defined as the diameter of the largestcircle that can be drawn in the core region. The effective core diameter for the fibers are0.87 µm, 1.03 µm, 2.32 µm and 2.98 µm for fibers 1 to 4, respectively. The inset showsthe hollow cladding region of fiber 2 with a diameter of 64 µm. The thicknesses of thenanowebs that hold the fiber cores in place vary between 160 and 500 nm.
in the range of 0.8 to 3.0 µm were fabricated.
Figure 4.1 shows typical SEM images of the fibers drawn. Three nanowebs with
thicknesses between 160 and 550 nm hold the central silica core in place. The effective
core diameter, deff, of the air-suspended SC-PCF is defined as the diameter of the largest
circle which can be inscribed in the core region. For fibers 1 to 4 shown in Figure 4.1, the
core diameters are 0.873, 1.03, 2.32 and 2.98 µm, respectively. The hollow cladding region
(see the inset of fiber 2) acts as an easily accessible sample chamber and has a typical
diameter of 30 to 70 µm. The uniformity of the structural parameters along the fiber
was verified from high resolution SEM images. For most samples, variations of less than
3.5% over tens to 100 m were detected. The largest variation in deff observed was less
than 7%. For the fibers used in the experiments, the observed variations were below 2%.
This analysis demonstrates that the stack-and-draw process allows highly reproducible
and flexible fabrication of air-suspended SC-PCFs.
4.2.1.1 Transmission and Losses
The transmission and loss spectra are important because they provide guidelines to the
wavelength range and maximum fiber length that can be used in the sensing experiments,
as discussed in Section 2.2. Figure 4.2 (a) shows the broadband transmission windows
for 2.9 m of fiber 2 (solid curve) with air cladding from λ = 500 to 1350 nm and from
λ = 1450 to beyond 1750 nm. The absorption line near λ = 1400 nm is attributed to
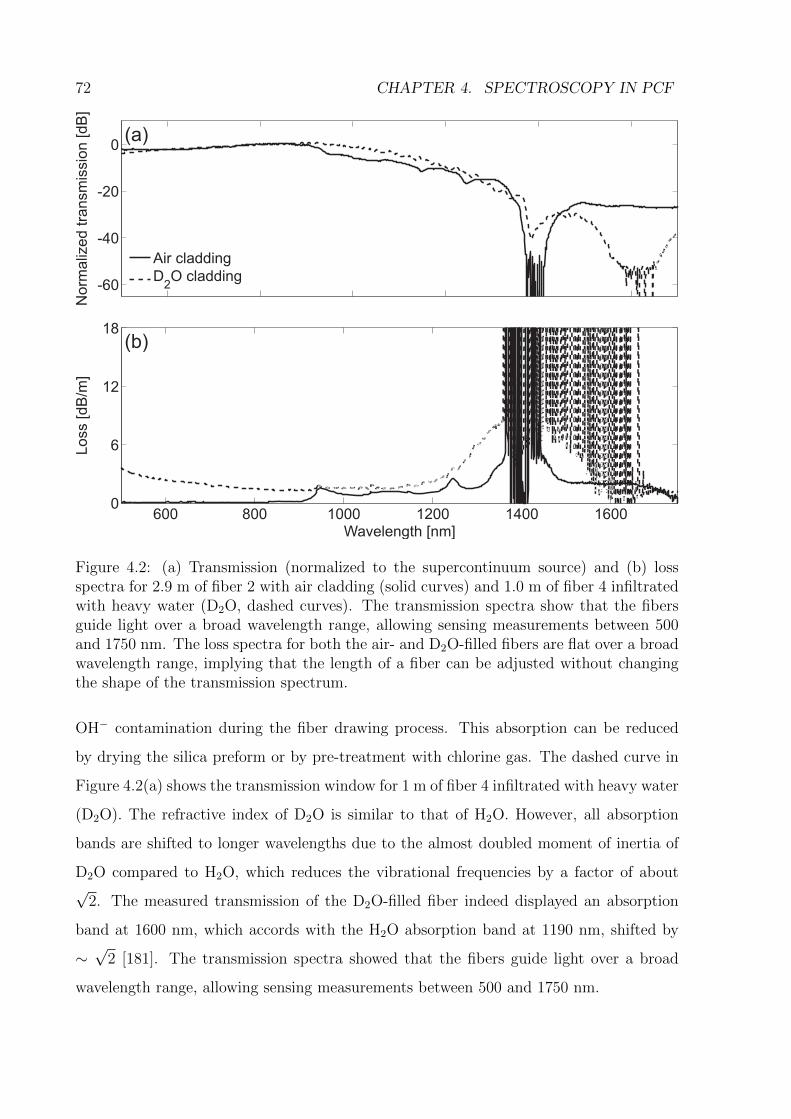
72 CHAPTER 4. SPECTROSCOPY IN PCF
-60
-40
-20
0
No
rma
lize
d t
ran
sm
issio
n [
dB
]
Air cladding
D2O cladding
(a)
600 800 1000 1200 1400 16000
6
12
18
Wavelength [nm]
Lo
ss [
dB
/m]
(b)
Figure 4.2: (a) Transmission (normalized to the supercontinuum source) and (b) lossspectra for 2.9 m of fiber 2 with air cladding (solid curves) and 1.0 m of fiber 4 infiltratedwith heavy water (D2O, dashed curves). The transmission spectra show that the fibersguide light over a broad wavelength range, allowing sensing measurements between 500and 1750 nm. The loss spectra for both the air- and D2O-filled fibers are flat over a broadwavelength range, implying that the length of a fiber can be adjusted without changingthe shape of the transmission spectrum.
OH− contamination during the fiber drawing process. This absorption can be reduced
by drying the silica preform or by pre-treatment with chlorine gas. The dashed curve in
Figure 4.2(a) shows the transmission window for 1 m of fiber 4 infiltrated with heavy water
(D2O). The refractive index of D2O is similar to that of H2O. However, all absorption
bands are shifted to longer wavelengths due to the almost doubled moment of inertia of
D2O compared to H2O, which reduces the vibrational frequencies by a factor of about√
2. The measured transmission of the D2O-filled fiber indeed displayed an absorption
band at 1600 nm, which accords with the H2O absorption band at 1190 nm, shifted by
∼√
2 [181]. The transmission spectra showed that the fibers guide light over a broad
wavelength range, allowing sensing measurements between 500 and 1750 nm.
4.2. EVANESCENT-WAVE SENSING 73
ca
lcu
late
dm
ea
su
red
� = 500 nm � = 700 nm � = 800 nm � = 975 nm � = 1000 nm1
0
0.5
Figure 4.3: Normalized mode profiles (time-averaged z-component of the Poynting vector,Sz) of fiber 2 with H2O-filled cladding. All images are 2.5 × 2.5 µm2. The white curvesoverlaying the images indicate the contours of the fiber structure obtained from SEM. Theimages show the measured (top row) and calculated (bottom row) Sz profiles at wave-lengths 500, 700, 800, 975 and 1000 nm. The contour lines are 0.1 apart (in normalizedunits).
A typical loss spectrum for fiber 2 with air cladding is shown in Figure 4.2 (b). The
spectrum reveals a low-loss region with losses below 0.2 dB/m between λ = 500 and
900 nm. The maximum observed loss within the transmission windows of this fiber was
4 dB/m. The loss spectrum was also measured in fiber 4 filled with D2O. The losses are
slightly higher than in the unfilled fiber 2 but remain below 3 dB/m over the wavelength
range between 500 and 1220 nm. For typical sensing measurements, fiber lengths of less
than 20 m suffice. It can therefore be concluded that losses do not limit the performance
of these fiber sensors. The loss spectra for both the air- and D2O-filled fibers are flat over
a broad wavelength range, which leads to the conclusion that the length of a fiber can be
adjusted without changing the shape of the transmission spectrum.
4.2.1.2 Mode Field Distribution
The sensing mechanism in air-suspended SC-PCFs is based on the overlap between the
evanescent field of the guided mode and the sample. In quantitative sensing experiments
it is essential to know the fraction of power, φ, in the cladding holes that is available for
interaction with the sample. Measurements of the mode profiles of the fibers at various
wavelengths were taken with a CCD beam profiler (WinCamD-UHR-1310) by imaging
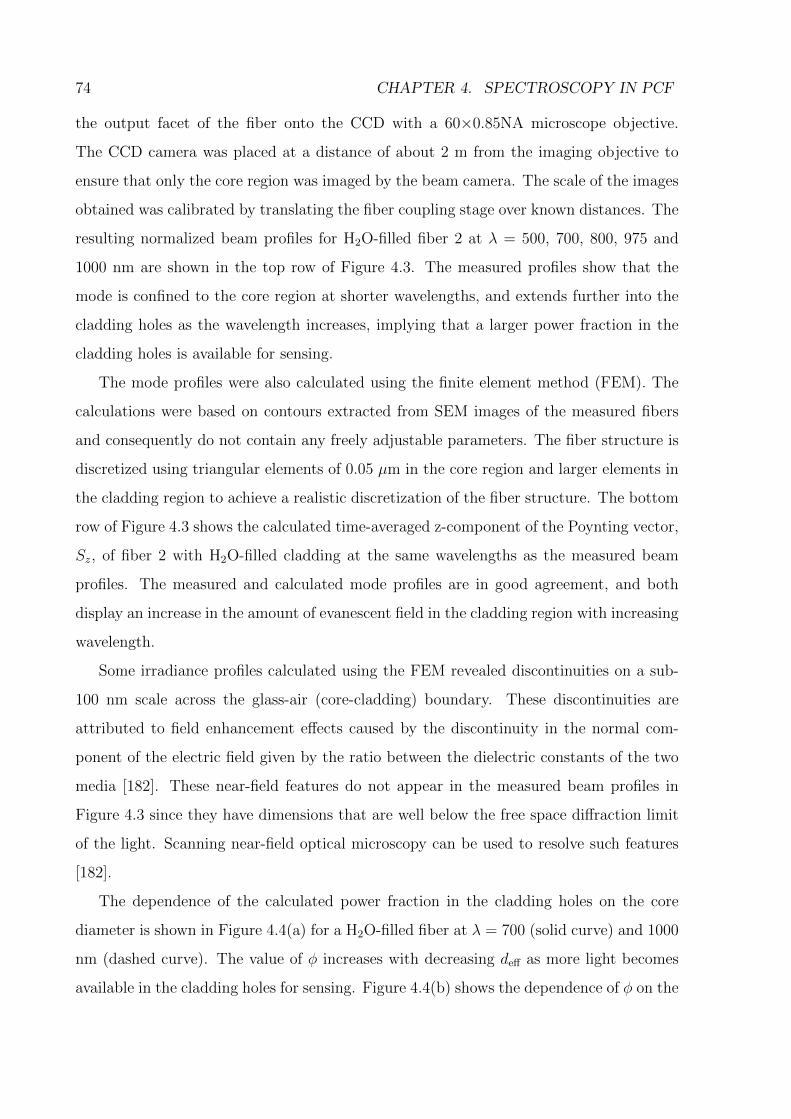
74 CHAPTER 4. SPECTROSCOPY IN PCF
the output facet of the fiber onto the CCD with a 60×0.85NA microscope objective.
The CCD camera was placed at a distance of about 2 m from the imaging objective to
ensure that only the core region was imaged by the beam camera. The scale of the images
obtained was calibrated by translating the fiber coupling stage over known distances. The
resulting normalized beam profiles for H2O-filled fiber 2 at λ = 500, 700, 800, 975 and
1000 nm are shown in the top row of Figure 4.3. The measured profiles show that the
mode is confined to the core region at shorter wavelengths, and extends further into the
cladding holes as the wavelength increases, implying that a larger power fraction in the
cladding holes is available for sensing.
The mode profiles were also calculated using the finite element method (FEM). The
calculations were based on contours extracted from SEM images of the measured fibers
and consequently do not contain any freely adjustable parameters. The fiber structure is
discretized using triangular elements of 0.05 µm in the core region and larger elements in
the cladding region to achieve a realistic discretization of the fiber structure. The bottom
row of Figure 4.3 shows the calculated time-averaged z-component of the Poynting vector,
Sz, of fiber 2 with H2O-filled cladding at the same wavelengths as the measured beam
profiles. The measured and calculated mode profiles are in good agreement, and both
display an increase in the amount of evanescent field in the cladding region with increasing
wavelength.
Some irradiance profiles calculated using the FEM revealed discontinuities on a sub-
100 nm scale across the glass-air (core-cladding) boundary. These discontinuities are
attributed to field enhancement effects caused by the discontinuity in the normal com-
ponent of the electric field given by the ratio between the dielectric constants of the two
media [182]. These near-field features do not appear in the measured beam profiles in
Figure 4.3 since they have dimensions that are well below the free space diffraction limit
of the light. Scanning near-field optical microscopy can be used to resolve such features
[182].
The dependence of the calculated power fraction in the cladding holes on the core
diameter is shown in Figure 4.4(a) for a H2O-filled fiber at λ = 700 (solid curve) and 1000
nm (dashed curve). The value of φ increases with decreasing deff as more light becomes
available in the cladding holes for sensing. Figure 4.4(b) shows the dependence of φ on the
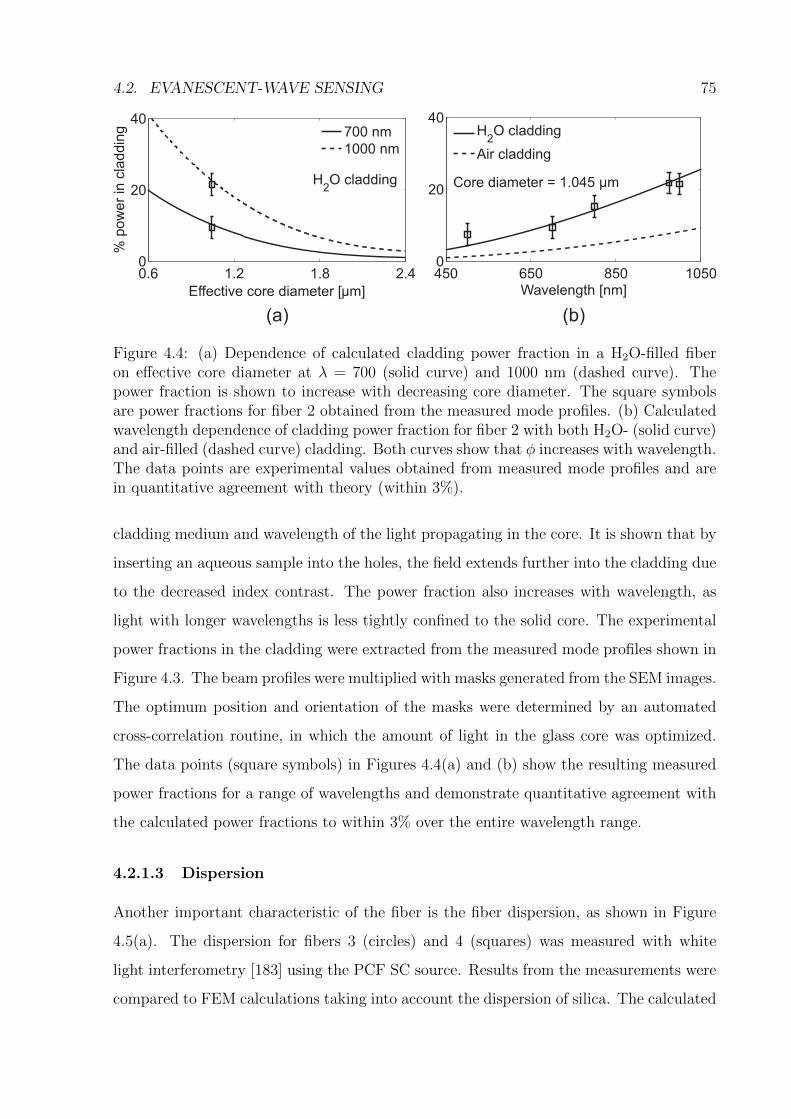
4.2. EVANESCENT-WAVE SENSING 75
0.6 1.2 1.8 2.40
20
40
Effective core diameter [µm]
% p
ow
er
in c
lad
din
g
H2O cladding
700 nm
1000 nm
(a)
450 650 850 10500
20
40
Wavelength [nm]
Core diameter = 1.045 µm
H2O cladding
Air cladding
(b)
Figure 4.4: (a) Dependence of calculated cladding power fraction in a H2O-filled fiberon effective core diameter at λ = 700 (solid curve) and 1000 nm (dashed curve). Thepower fraction is shown to increase with decreasing core diameter. The square symbolsare power fractions for fiber 2 obtained from the measured mode profiles. (b) Calculatedwavelength dependence of cladding power fraction for fiber 2 with both H2O- (solid curve)and air-filled (dashed curve) cladding. Both curves show that φ increases with wavelength.The data points are experimental values obtained from measured mode profiles and arein quantitative agreement with theory (within 3%).
cladding medium and wavelength of the light propagating in the core. It is shown that by
inserting an aqueous sample into the holes, the field extends further into the cladding due
to the decreased index contrast. The power fraction also increases with wavelength, as
light with longer wavelengths is less tightly confined to the solid core. The experimental
power fractions in the cladding were extracted from the measured mode profiles shown in
Figure 4.3. The beam profiles were multiplied with masks generated from the SEM images.
The optimum position and orientation of the masks were determined by an automated
cross-correlation routine, in which the amount of light in the glass core was optimized.
The data points (square symbols) in Figures 4.4(a) and (b) show the resulting measured
power fractions for a range of wavelengths and demonstrate quantitative agreement with
the calculated power fractions to within 3% over the entire wavelength range.
4.2.1.3 Dispersion
Another important characteristic of the fiber is the fiber dispersion, as shown in Figure
4.5(a). The dispersion for fibers 3 (circles) and 4 (squares) was measured with white
light interferometry [183] using the PCF SC source. Results from the measurements were
compared to FEM calculations taking into account the dispersion of silica. The calculated
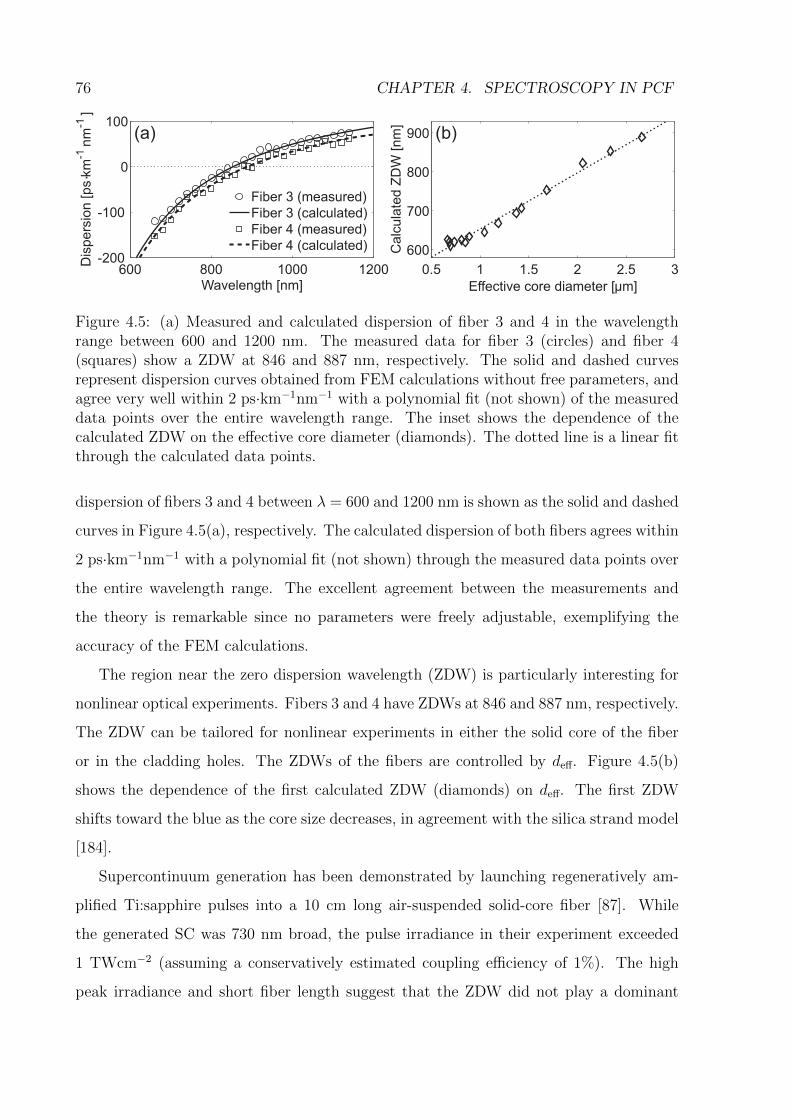
76 CHAPTER 4. SPECTROSCOPY IN PCF
600 800 1000 1200-200
-100
0
100
Wavelength [nm]
Dis
pe
rsio
n [
ps⋅km
-1n
m-1
]
(a)
Fiber 3 (measured)
Fiber 3 (calculated)
Fiber 4 (measured)
Fiber 4 (calculated)
0.5 1 1.5 2 2.5 3
600
700
800
900
Effective core diameter [µm]
Ca
lcu
late
d Z
DW
[n
m]
(b)
Figure 4.5: (a) Measured and calculated dispersion of fiber 3 and 4 in the wavelengthrange between 600 and 1200 nm. The measured data for fiber 3 (circles) and fiber 4(squares) show a ZDW at 846 and 887 nm, respectively. The solid and dashed curvesrepresent dispersion curves obtained from FEM calculations without free parameters, andagree very well within 2 ps·km−1nm−1 with a polynomial fit (not shown) of the measureddata points over the entire wavelength range. The inset shows the dependence of thecalculated ZDW on the effective core diameter (diamonds). The dotted line is a linear fitthrough the calculated data points.
dispersion of fibers 3 and 4 between λ = 600 and 1200 nm is shown as the solid and dashed
curves in Figure 4.5(a), respectively. The calculated dispersion of both fibers agrees within
2 ps·km−1nm−1 with a polynomial fit (not shown) through the measured data points over
the entire wavelength range. The excellent agreement between the measurements and
the theory is remarkable since no parameters were freely adjustable, exemplifying the
accuracy of the FEM calculations.
The region near the zero dispersion wavelength (ZDW) is particularly interesting for
nonlinear optical experiments. Fibers 3 and 4 have ZDWs at 846 and 887 nm, respectively.
The ZDW can be tailored for nonlinear experiments in either the solid core of the fiber
or in the cladding holes. The ZDWs of the fibers are controlled by deff. Figure 4.5(b)
shows the dependence of the first calculated ZDW (diamonds) on deff. The first ZDW
shifts toward the blue as the core size decreases, in agreement with the silica strand model
[184].
Supercontinuum generation has been demonstrated by launching regeneratively am-
plified Ti:sapphire pulses into a 10 cm long air-suspended solid-core fiber [87]. While
the generated SC was 730 nm broad, the pulse irradiance in their experiment exceeded
1 TWcm−2 (assuming a conservatively estimated coupling efficiency of 1%). The high
peak irradiance and short fiber length suggest that the ZDW did not play a dominant
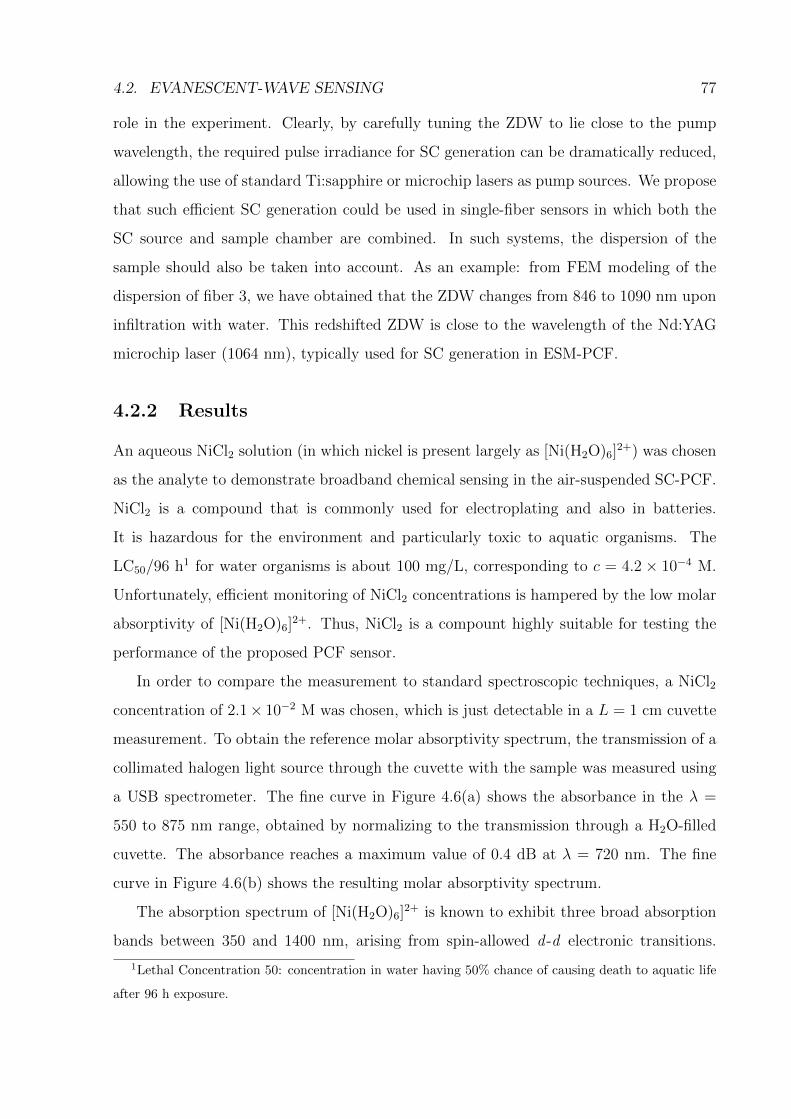
4.2. EVANESCENT-WAVE SENSING 77
role in the experiment. Clearly, by carefully tuning the ZDW to lie close to the pump
wavelength, the required pulse irradiance for SC generation can be dramatically reduced,
allowing the use of standard Ti:sapphire or microchip lasers as pump sources. We propose
that such efficient SC generation could be used in single-fiber sensors in which both the
SC source and sample chamber are combined. In such systems, the dispersion of the
sample should also be taken into account. As an example: from FEM modeling of the
dispersion of fiber 3, we have obtained that the ZDW changes from 846 to 1090 nm upon
infiltration with water. This redshifted ZDW is close to the wavelength of the Nd:YAG
microchip laser (1064 nm), typically used for SC generation in ESM-PCF.
4.2.2 Results
An aqueous NiCl2 solution (in which nickel is present largely as [Ni(H2O)6]2+) was chosen
as the analyte to demonstrate broadband chemical sensing in the air-suspended SC-PCF.
NiCl2 is a compound that is commonly used for electroplating and also in batteries.
It is hazardous for the environment and particularly toxic to aquatic organisms. The
LC50/96 h1 for water organisms is about 100 mg/L, corresponding to c = 4.2 × 10⁻⁴ M.
Unfortunately, efficient monitoring of NiCl2 concentrations is hampered by the low molar
absorptivity of [Ni(H2O)6]2+. Thus, NiCl2 is a compount highly suitable for testing the
performance of the proposed PCF sensor.
In order to compare the measurement to standard spectroscopic techniques, a NiCl2
concentration of 2.1× 10⁻² M was chosen, which is just detectable in a L = 1 cm cuvette
measurement. To obtain the reference molar absorptivity spectrum, the transmission of a
collimated halogen light source through the cuvette with the sample was measured using
a USB spectrometer. The fine curve in Figure 4.6(a) shows the absorbance in the λ =
550 to 875 nm range, obtained by normalizing to the transmission through a H2O-filled
cuvette. The absorbance reaches a maximum value of 0.4 dB at λ = 720 nm. The fine
curve in Figure 4.6(b) shows the resulting molar absorptivity spectrum.
The absorption spectrum of [Ni(H2O)6]2+ is known to exhibit three broad absorption
bands between 350 and 1400 nm, arising from spin-allowed d -d electronic transitions.
1Lethal Concentration 50: concentration in water having 50% chance of causing death to aquatic life
after 96 h exposure.
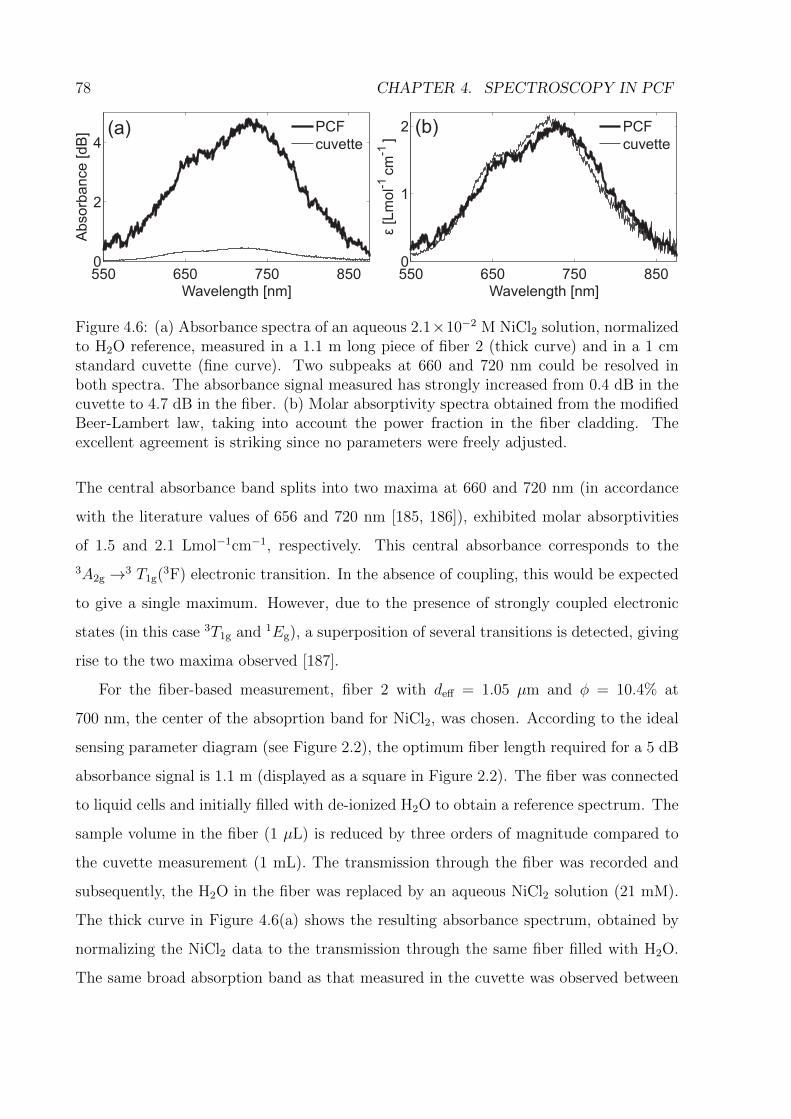
78 CHAPTER 4. SPECTROSCOPY IN PCF
550 650 750 8500
2
4
Wavelength [nm]
Absorb
ance [dB
] (a) PCF
cuvette
550 650 750 8500
1
2
Wavelength [nm]
ε[L
mol-1
cm
-1]
(b) PCF
cuvette
Figure 4.6: (a) Absorbance spectra of an aqueous 2.1×10⁻² M NiCl2 solution, normalizedto H2O reference, measured in a 1.1 m long piece of fiber 2 (thick curve) and in a 1 cmstandard cuvette (fine curve). Two subpeaks at 660 and 720 nm could be resolved inboth spectra. The absorbance signal measured has strongly increased from 0.4 dB in thecuvette to 4.7 dB in the fiber. (b) Molar absorptivity spectra obtained from the modifiedBeer-Lambert law, taking into account the power fraction in the fiber cladding. Theexcellent agreement is striking since no parameters were freely adjusted.
The central absorbance band splits into two maxima at 660 and 720 nm (in accordance
with the literature values of 656 and 720 nm [185, 186]), exhibited molar absorptivities
of 1.5 and 2.1 Lmol−1cm−1, respectively. This central absorbance corresponds to the
3A2g →3 T1g(3F) electronic transition. In the absence of coupling, this would be expected
to give a single maximum. However, due to the presence of strongly coupled electronic
states (in this case 3T1g and 1Eg), a superposition of several transitions is detected, giving
rise to the two maxima observed [187].
For the fiber-based measurement, fiber 2 with deff = 1.05 µm and φ = 10.4% at
700 nm, the center of the absoprtion band for NiCl2, was chosen. According to the ideal
sensing parameter diagram (see Figure 2.2), the optimum fiber length required for a 5 dB
absorbance signal is 1.1 m (displayed as a square in Figure 2.2). The fiber was connected
to liquid cells and initially filled with de-ionized H2O to obtain a reference spectrum. The
sample volume in the fiber (1 µL) is reduced by three orders of magnitude compared to
the cuvette measurement (1 mL). The transmission through the fiber was recorded and
subsequently, the H2O in the fiber was replaced by an aqueous NiCl2 solution (21 mM).
The thick curve in Figure 4.6(a) shows the resulting absorbance spectrum, obtained by
normalizing the NiCl2 data to the transmission through the same fiber filled with H2O.
The same broad absorption band as that measured in the cuvette was observed between
4.3. MICROSCALE SURFACE CHEMISTRY 79
λ = 600 and 800 nm. Importantly, the fiber spectrum also resolves the two peaks at
660 and 720 nm, illustrating that the fiber does not introduce spectral artifacts. The
maximum measured absorbance of 4.7 dB is in good agreement with the prediction. A
direct quantitative comparison between the fiber data and the reference sample is made in
Figure 4.6(b). Here, the ε(λ) spectrum of NiCl2 was extracted by applying the modified
Beer-Lambert law on the absorbance data, with φ = 10.4% at 700 nm also taken into
account. The striking agreement between the in-fiber measurement (thick curve) and
the reference spectrum measured in the the standard cuvette (fine curve) demonstrates
that the air-suspended SC-PCF can be used in quantitative broadband chemical-sensing
measurements.
4.2.3 Discussion
A quantitative broadband fiber sensor based on evanescent-wave sensing in the cladding
holes of an air-suspended SC-PCF has been demonstrated. The measured mode profiles
were in good agreement with numerical calculations based on the finite element method
made without free parameters. The fraction of light in the hollow cladding can be tuned
via the core diameter of the fiber. Dispersion measurements were in excellent agreement
with the theory and demonstrated tuning of the zero dispersion wavelength via the core di-
ameter. The applicability of the proposed evanescent-wave PCF sensor was demonstrated
by measuring the broad absorption peak of an aqueous NiCl2 solution and showing excel-
lent agreement with the reference spectrum measured in a standard cuvette despite three
orders of magnitude lower sample volume used.
4.3 Microscale Surface Chemistry
4.3.1 Self-Aggregation and Photobleaching of Methylene Blue
Methylene blue, MB, is a cationic thiazine dye with a broad spectrum of applications
ranging from antidote for cyanide poisoning [188], antiseptic in veterinary medicine, to in
vitro diagnostic in biology, cytology, hematology and histology [189, 190]. Furthermore,
its photochemical activity is well-established, given its common role as a sensitizer in
80 CHAPTER 4. SPECTROSCOPY IN PCF
various areas of photochemistry including photogalvanic cells [191, 192], singlet oxygen
production [193] and reductive electron transfer [194], as a result of the relatively long-
lived triplet state (450 µs in the triplet state, compared to 30 to 390 ps of the singlet
state) and high quantum yield (φT = 0.52) [194, 195].
Like many thiazine dyes, MB readily undergo self-aggregation to form dimers (and
higher aggregates) [196] in aqueous solution in spite of like-charge repulsion. The reaction
for dimerization takes the following form
2MBKD⇀↽ (MB)2, (4.1)
where KD is the equilibrium constant of the dimerization process given by
KD =[(MB)2]
[MB]2. (4.2)
[MB] and [(MB)2] are the concentrations of the MB monomer and dimer, and KD is
reported in literature to vary between 2000 and 6000 Lmol−1 [197-200], the variation in
the values obtained was mainly due to the differences between the actual experimental
conditions under which the experiments were performed, such as the temperature and the
pH of the buffer. The main forces responsible for the aggregation of the dye molecules are
hydrogen bonding, van der Waals forces and the predominant force due to hydrophobic
interactions (i.e. water acts as a catalyst in inducing aggregation) [201]. We assumed that
dimerization is the only self-aggregation process MB can undergo under the experimental
conditions here. Therefore [MB]total = [MB] + 2[(MB)2], and from Equation 4.2 it follows
that the concentration of the monomer, [MB], can be obtained by solving the following
quadratic equation,
2KD[MB]2 + [MB]− [MB]total = 0. (4.3)
Solutions of methylene blue in de-ionized water were prepared with concentrations
ranging from 0.415 to 20.8 µM by serial dilutions from a stock solution. From Equation 4.2
and taking the median of KD = 3000 Lmol−1 reported in various literature sources [197-
200], approximately 87% of the 20.8 µM sample is in its monomer form. Figure 4.7(a)
shows the molar absorptivity spectrum of a 20.8 µM MB sample in water, measured in a
standard 1 cm cuvette. The absorption peaks at λ = 612 and 665 nm have the coefficients
ε = 2.46 × 10⁴ and 4.48 × 10⁴ Lmol−1cm−1, respectively. The peak near λ = 660 nm is
attributed to the monomer, while the peak near λ = 610 nm is due to the dimer.
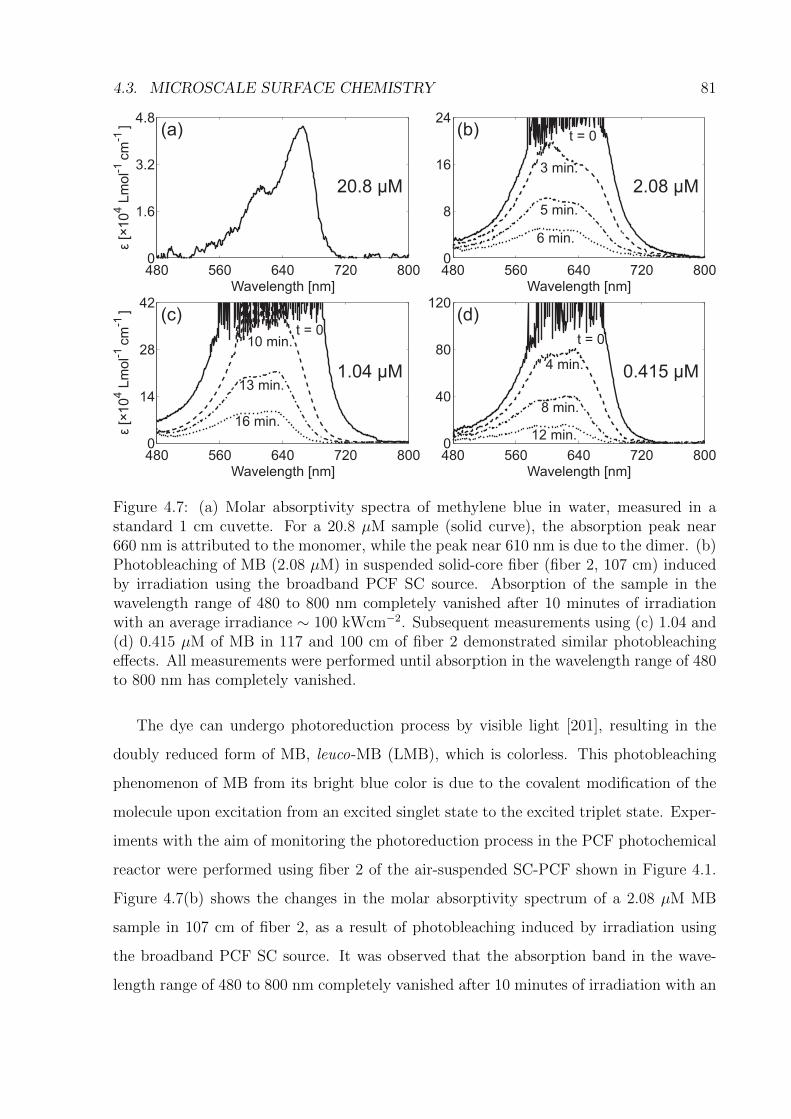
4.3. MICROSCALE SURFACE CHEMISTRY 81
480 560 640 720 8000
1.6
3.2
4.8
Wavelength [nm]
ε[×
10
4L
mo
l-1cm
-1] (a)
20.8 μM
480 560 640 720 8000
8
16
24
Wavelength [nm]
(b) t = 0
3 min.
5 min.
6 min.
2.08 μM
480 560 640 720 8000
14
28
42
Wavelength [nm]
(c)t = 0
10 min.
13 min.
16 min.
ε[×
10
4L
mo
l-1cm
-1]
1.04 μM
480 560 640 720 8000
40
80
120
Wavelength [nm]
(d)
t = 0
4 min.
8 min.
12 min.
0.415 μM
Figure 4.7: (a) Molar absorptivity spectra of methylene blue in water, measured in astandard 1 cm cuvette. For a 20.8 µM sample (solid curve), the absorption peak near660 nm is attributed to the monomer, while the peak near 610 nm is due to the dimer. (b)Photobleaching of MB (2.08 µM) in suspended solid-core fiber (fiber 2, 107 cm) inducedby irradiation using the broadband PCF SC source. Absorption of the sample in thewavelength range of 480 to 800 nm completely vanished after 10 minutes of irradiationwith an average irradiance ∼ 100 kWcm−2. Subsequent measurements using (c) 1.04 and(d) 0.415 µM of MB in 117 and 100 cm of fiber 2 demonstrated similar photobleachingeffects. All measurements were performed until absorption in the wavelength range of 480to 800 nm has completely vanished.
The dye can undergo photoreduction process by visible light [201], resulting in the
doubly reduced form of MB, leuco-MB (LMB), which is colorless. This photobleaching
phenomenon of MB from its bright blue color is due to the covalent modification of the
molecule upon excitation from an excited singlet state to the excited triplet state. Exper-
iments with the aim of monitoring the photoreduction process in the PCF photochemical
reactor were performed using fiber 2 of the air-suspended SC-PCF shown in Figure 4.1.
Figure 4.7(b) shows the changes in the molar absorptivity spectrum of a 2.08 µM MB
sample in 107 cm of fiber 2, as a result of photobleaching induced by irradiation using
the broadband PCF SC source. It was observed that the absorption band in the wave-
length range of 480 to 800 nm completely vanished after 10 minutes of irradiation with an
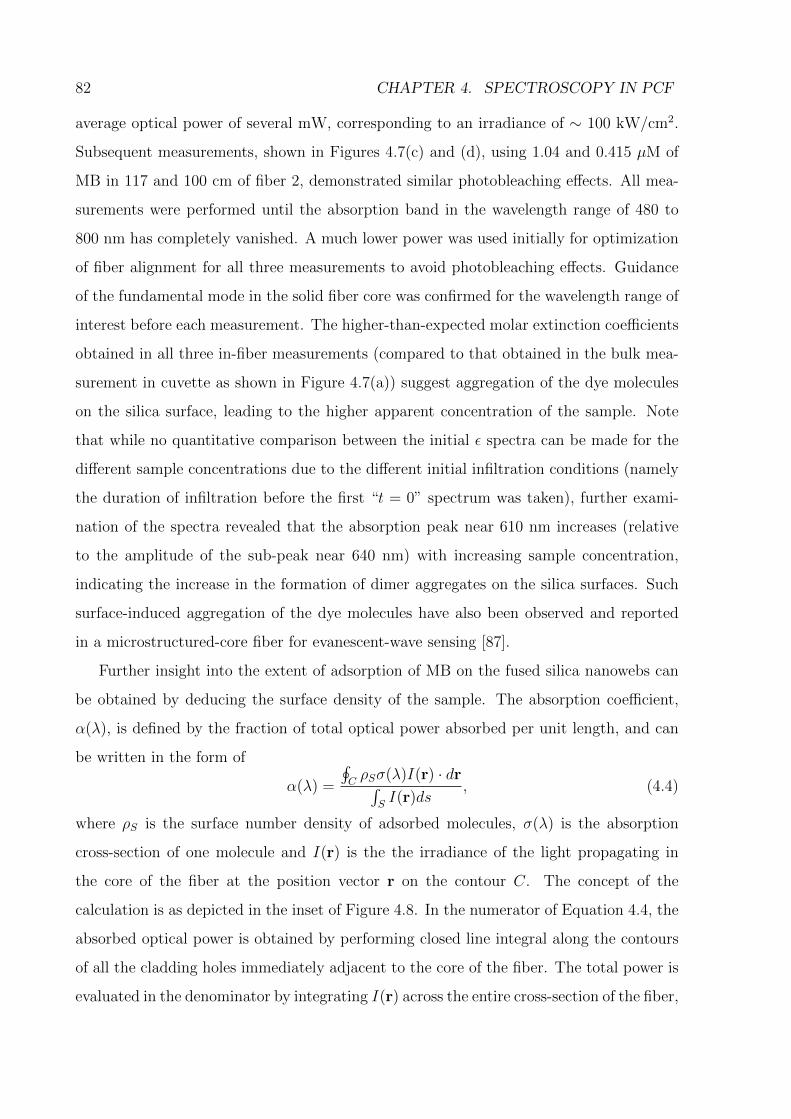
82 CHAPTER 4. SPECTROSCOPY IN PCF
average optical power of several mW, corresponding to an irradiance of ∼ 100 kW/cm2.
Subsequent measurements, shown in Figures 4.7(c) and (d), using 1.04 and 0.415 µM of
MB in 117 and 100 cm of fiber 2, demonstrated similar photobleaching effects. All mea-
surements were performed until the absorption band in the wavelength range of 480 to
800 nm has completely vanished. A much lower power was used initially for optimization
of fiber alignment for all three measurements to avoid photobleaching effects. Guidance
of the fundamental mode in the solid fiber core was confirmed for the wavelength range of
interest before each measurement. The higher-than-expected molar extinction coefficients
obtained in all three in-fiber measurements (compared to that obtained in the bulk mea-
surement in cuvette as shown in Figure 4.7(a)) suggest aggregation of the dye molecules
on the silica surface, leading to the higher apparent concentration of the sample. Note
that while no quantitative comparison between the initial ε spectra can be made for the
different sample concentrations due to the different initial infiltration conditions (namely
the duration of infiltration before the first “t = 0” spectrum was taken), further exami-
nation of the spectra revealed that the absorption peak near 610 nm increases (relative
to the amplitude of the sub-peak near 640 nm) with increasing sample concentration,
indicating the increase in the formation of dimer aggregates on the silica surfaces. Such
surface-induced aggregation of the dye molecules have also been observed and reported
in a microstructured-core fiber for evanescent-wave sensing [87].
Further insight into the extent of adsorption of MB on the fused silica nanowebs can
be obtained by deducing the surface density of the sample. The absorption coefficient,
α(λ), is defined by the fraction of total optical power absorbed per unit length, and can
be written in the form of
α(λ) =
∮CρSσ(λ)I(r) · dr∫
SI(r)ds
, (4.4)
where ρS is the surface number density of adsorbed molecules, σ(λ) is the absorption
cross-section of one molecule and I(r) is the the irradiance of the light propagating in
the core of the fiber at the position vector r on the contour C. The concept of the
calculation is as depicted in the inset of Figure 4.8. In the numerator of Equation 4.4, the
absorbed optical power is obtained by performing closed line integral along the contours
of all the cladding holes immediately adjacent to the core of the fiber. The total power is
evaluated in the denominator by integrating I(r) across the entire cross-section of the fiber,
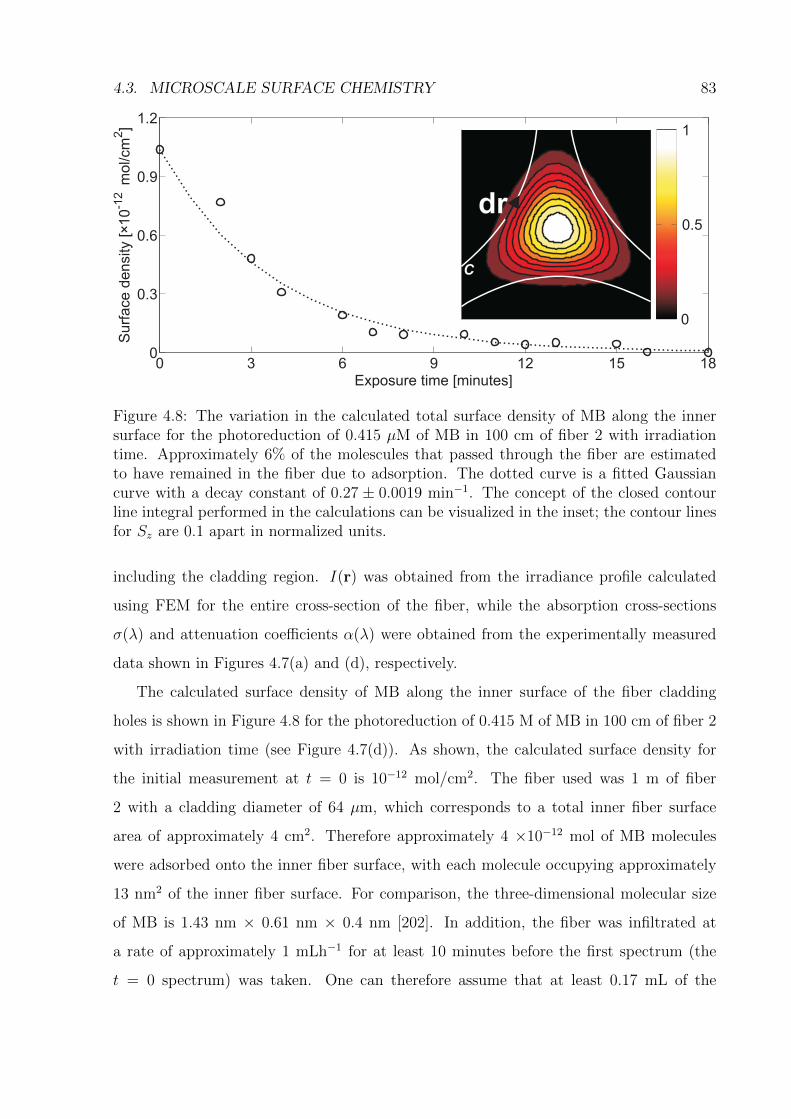
4.3. MICROSCALE SURFACE CHEMISTRY 83
0 3 6 9 12 15 180
0.3
0.6
0.9
1.2S
urf
ace d
ensity [×10
-12
mol/cm
2]
Exposure time [minutes]
dr
C
1
0
0.5
Figure 4.8: The variation in the calculated total surface density of MB along the innersurface for the photoreduction of 0.415 µM of MB in 100 cm of fiber 2 with irradiationtime. Approximately 6% of the molescules that passed through the fiber are estimatedto have remained in the fiber due to adsorption. The dotted curve is a fitted Gaussiancurve with a decay constant of 0.27 ± 0.0019 min−1. The concept of the closed contourline integral performed in the calculations can be visualized in the inset; the contour linesfor Sz are 0.1 apart in normalized units.
including the cladding region. I(r) was obtained from the irradiance profile calculated
using FEM for the entire cross-section of the fiber, while the absorption cross-sections
σ(λ) and attenuation coefficients α(λ) were obtained from the experimentally measured
data shown in Figures 4.7(a) and (d), respectively.
The calculated surface density of MB along the inner surface of the fiber cladding
holes is shown in Figure 4.8 for the photoreduction of 0.415 M of MB in 100 cm of fiber 2
with irradiation time (see Figure 4.7(d)). As shown, the calculated surface density for
the initial measurement at t = 0 is 10−12 mol/cm2. The fiber used was 1 m of fiber
2 with a cladding diameter of 64 µm, which corresponds to a total inner fiber surface
area of approximately 4 cm2. Therefore approximately 4 ×10⁻¹² mol of MB molecules
were adsorbed onto the inner fiber surface, with each molecule occupying approximately
13 nm2 of the inner fiber surface. For comparison, the three-dimensional molecular size
of MB is 1.43 nm × 0.61 nm × 0.4 nm [202]. In addition, the fiber was infiltrated at
a rate of approximately 1 mLh−1 for at least 10 minutes before the first spectrum (the
t = 0 spectrum) was taken. One can therefore assume that at least 0.17 mL of the
84 CHAPTER 4. SPECTROSCOPY IN PCF
sample has passed through the fiber. This corresponds to approximately 7 ×10⁻¹¹ mol
of total MB molecues that have “seen” the surface of the fiber. From the 4 ×10⁻¹² mol
of MB molecules which were adsorbed onto the inner fiber surface, one can estimate that
approximately 6% of the molecules that passed through the fiber have remained in the
fiber. It is therefore possible to quantify the decrease in the surface density of MB due
to photoreduction as a function of exposure time. The MB was determined to reduce to
the colorless LMB form (undetectable via absorption spectroscopy within the operating
wavelength range) at a rate of 0.27 ± 0.0019 min−1. Further quantitative analysis of
the adsorption dynamics would require controlled infiltration conditions. However, the
preliminary result has clearly demonstrated the affinity of the MB molecules to adsorb
onto the fiber surfaces.
In order to further investigate the affinity of the MB molecules to adsorb on the silica
surfaces, the photobleaching experiments were performed in a hollow-core kagome PCF.
Figure 4.9(a) shows the photobleaching of a 20.8 µM MB sample in ∼ 30 cm of the
kagome fiber induced by irradiation using the broadband PCF SC source. The measured
spectral shape agrees with that of the same sample measured in the cuvette (solid curve
in Figure 4.7(a)). Initial inspection of the result reveals that the molar absorptivity of
the dye molecule measured in the HC-PCF is lower than that measured in bulk. This
suggests that some molecules may have moved out of the active sensing region of the fiber
core and adsorbed onto the surface surrounding the core where they are only very weakly
detectable by light.
Figure 4.9(b) shows the variation in the molar absorptivity spectrum demonstrating
effect of adsorption in 36 cm of the kagome fiber. The spectrum taken after the initial
infiltration of 0.415 µM of MB sample (at t = 0, curve 1) shows approximately 78%
lower absorption at the absorption peak than expected from bulk measurement in the
cuvette. This indicates that at least 78% of the dye molecules were adsorbed on the silica
surface surrounding the hollow fiber core, where the irradiance of the core mode is low
and could not detect the sample efficiently. The high concentration of adsorbed molecules
is a result of the large surface-to-volume ratio (which is inversely proportional to the
core diameter and in this case ∼ 105 m−1, three orders of magnitude higher than the
conventional 1 cm cuvette) provided by the microstructured fiber. Continuous infiltration
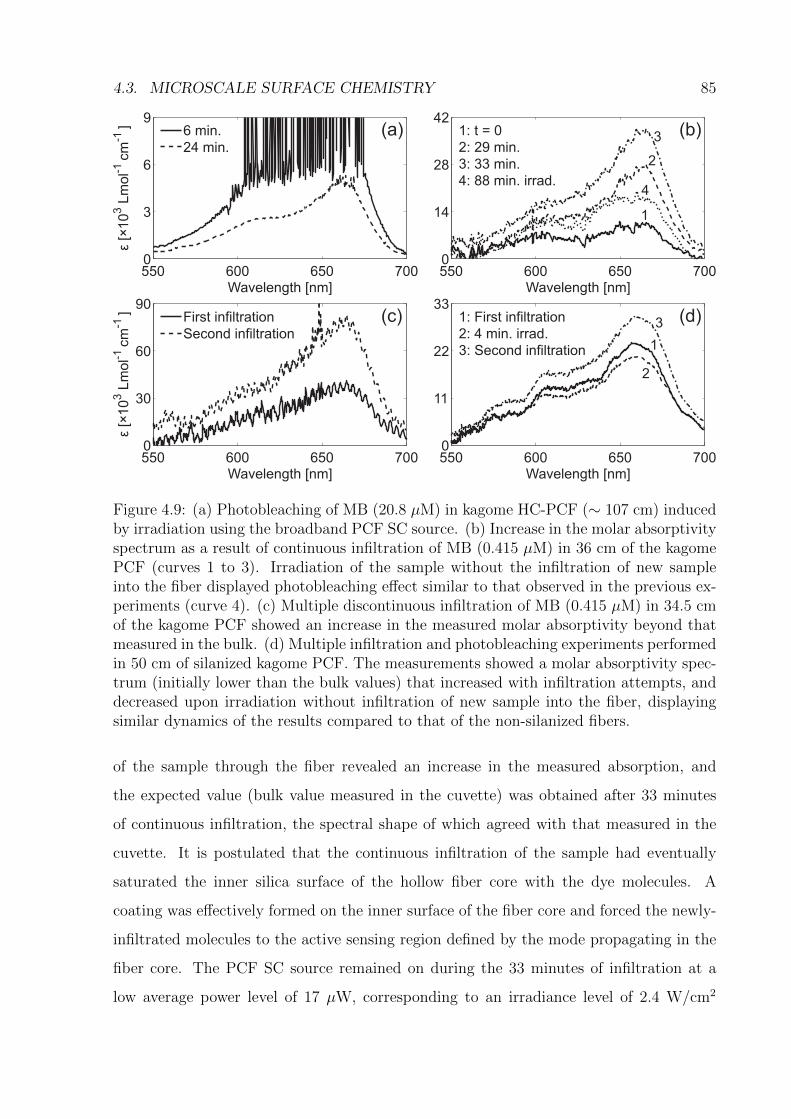
4.3. MICROSCALE SURFACE CHEMISTRY 85
550 600 650 7000
30
60
90
Wavelength [nm]
ε[×
10
3L
mo
l-1cm
-1] (c)First infiltration
Second infiltration
550 600 650 7000
3
6
9
Wavelength [nm]
(a)6 min.
24 min.
ε[×
10
3L
mo
l-1cm
-1]
550 600 650 7000
11
22
33
Wavelength [nm]
(d)1: First infiltration
2: 4 min. irrad.
3: Second infiltration 1
2
3
550 600 650 7000
14
28
42
Wavelength [nm]
(b)1: t = 0
2: 29 min.
3: 33 min.
4: 88 min. irrad.
2
3
4
1
Figure 4.9: (a) Photobleaching of MB (20.8 µM) in kagome HC-PCF (∼ 107 cm) inducedby irradiation using the broadband PCF SC source. (b) Increase in the molar absorptivityspectrum as a result of continuous infiltration of MB (0.415 µM) in 36 cm of the kagomePCF (curves 1 to 3). Irradiation of the sample without the infiltration of new sampleinto the fiber displayed photobleaching effect similar to that observed in the previous ex-periments (curve 4). (c) Multiple discontinuous infiltration of MB (0.415 µM) in 34.5 cmof the kagome PCF showed an increase in the measured molar absorptivity beyond thatmeasured in the bulk. (d) Multiple infiltration and photobleaching experiments performedin 50 cm of silanized kagome PCF. The measurements showed a molar absorptivity spec-trum (initially lower than the bulk values) that increased with infiltration attempts, anddecreased upon irradiation without infiltration of new sample into the fiber, displayingsimilar dynamics of the results compared to that of the non-silanized fibers.
of the sample through the fiber revealed an increase in the measured absorption, and
the expected value (bulk value measured in the cuvette) was obtained after 33 minutes
of continuous infiltration, the spectral shape of which agreed with that measured in the
cuvette. It is postulated that the continuous infiltration of the sample had eventually
saturated the inner silica surface of the hollow fiber core with the dye molecules. A
coating was effectively formed on the inner surface of the fiber core and forced the newly-
infiltrated molecules to the active sensing region defined by the mode propagating in the
fiber core. The PCF SC source remained on during the 33 minutes of infiltration at a
low average power level of 17 µW, corresponding to an irradiance level of 2.4 W/cm2
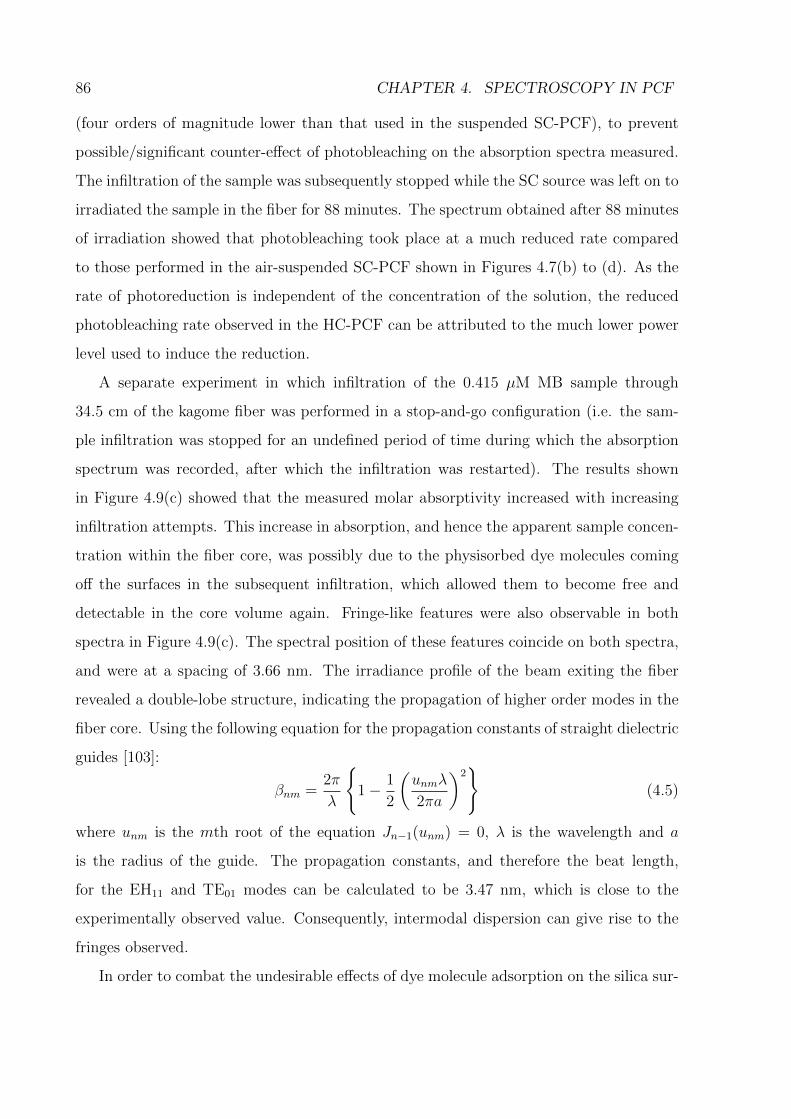
86 CHAPTER 4. SPECTROSCOPY IN PCF
(four orders of magnitude lower than that used in the suspended SC-PCF), to prevent
possible/significant counter-effect of photobleaching on the absorption spectra measured.
The infiltration of the sample was subsequently stopped while the SC source was left on to
irradiated the sample in the fiber for 88 minutes. The spectrum obtained after 88 minutes
of irradiation showed that photobleaching took place at a much reduced rate compared
to those performed in the air-suspended SC-PCF shown in Figures 4.7(b) to (d). As the
rate of photoreduction is independent of the concentration of the solution, the reduced
photobleaching rate observed in the HC-PCF can be attributed to the much lower power
level used to induce the reduction.
A separate experiment in which infiltration of the 0.415 µM MB sample through
34.5 cm of the kagome fiber was performed in a stop-and-go configuration (i.e. the sam-
ple infiltration was stopped for an undefined period of time during which the absorption
spectrum was recorded, after which the infiltration was restarted). The results shown
in Figure 4.9(c) showed that the measured molar absorptivity increased with increasing
infiltration attempts. This increase in absorption, and hence the apparent sample concen-
tration within the fiber core, was possibly due to the physisorbed dye molecules coming
off the surfaces in the subsequent infiltration, which allowed them to become free and
detectable in the core volume again. Fringe-like features were also observable in both
spectra in Figure 4.9(c). The spectral position of these features coincide on both spectra,
and were at a spacing of 3.66 nm. The irradiance profile of the beam exiting the fiber
revealed a double-lobe structure, indicating the propagation of higher order modes in the
fiber core. Using the following equation for the propagation constants of straight dielectric
guides [103]:
βnm =2π
λ
{1− 1
2
(unmλ
2πa
)2}
(4.5)
where unm is the mth root of the equation Jn−1(unm) = 0, λ is the wavelength and a
is the radius of the guide. The propagation constants, and therefore the beat length,
for the EH11 and TE01 modes can be calculated to be 3.47 nm, which is close to the
experimentally observed value. Consequently, intermodal dispersion can give rise to the
fringes observed.
In order to combat the undesirable effects of dye molecule adsorption on the silica sur-
4.3. MICROSCALE SURFACE CHEMISTRY 87
face surrounding the hollow fiber core, surface-treated fiber samples were prepared by infil-
trating the fiber with a 2% v/v solution of dimethyldichlorosilane in 1,1,1-trichloroethane
and left to stand for several hours to achieve hydrophobic surfaces. The fiber was rinsed
with isopropyl alcohol and then dried by purging with air before use. The photobleaching
and multiple sample infiltration experiments were repeated in 50 cm of the silanized fiber.
Figure 4.9(d) shows that irradiation of the sample (without infiltration of new sample
into the fiber) decreased the absorption signal (curve 1→2), while multiple infiltration of
the 0.415 µM MB sample increased the molar absorptivity towards the expected value
measured in bulk, as indicated by the progression from curve 2 to 3. The results displayed
similar dynamics to that of the unsilanized fiber, indicating that the initial attempt in
surface treament of the fiber was unsuccessful. Several ideas have been recently proposed
to reduce or completely eliminate the effect of adsorption on the silica surface: as the
polarity of the aqueous sample and the surface is the key factor, it has been suggested
that the interaction potential between the molecules and the silica surface can be tuned
by replacing water with an inorganic salt as the buffer solution.
4.3.2 Discussion
Efficient adsorption of methylene blue dye molecules on the inner silica surfaces was ob-
served. Opposite effects on the magnitude of the measured molar absorptivity spectra were
demonstrated in the solid and hollow-core of two types of PCF. In particular, an index-
guiding PCF design with moderate evanescent field extending into the cladding region can
provide novel platforms for interrogating surface-bound molecules on the nanoscale. De-
velopment of such devices necessitates further quantitative analyses of the adsorption and
desorption processes, including well-controlled sample infiltration and residence time. It is
instructive to perform bulk measurements using planar fused silica substrate as reference
for comparison with the in-fiber measurements.
It has been demonstrated that several phenothiazines such as methylene blue were able
to form oligomeric tau species upon binding to inhibit neurodegeneration in vitro [203,
204]. The development of methylene blue as an Alzheimer drug to prevent the aggregation
of tau and amyloid proteins can be efficiently studied in PCF. Furthermore, the possibility
to use methylene blue to generate singlet oxygen which then photochemically changes the

88 CHAPTER 4. SPECTROSCOPY IN PCF
vitamin B12 [205] can aid towards optimization of photoactivated anticancer drugs.
Chapter 5
Conclusions and Outlook
The enhanced light-matter interaction made possible by the photonic crystal fiber offers
a multitude of applications in various branches of chemistry. In particular, the novel
demonstration of utilizing the photonic crystal fiber as a highly efficient photochemical
reactor opens up new regimes of “doing chemistry”, many of which may one day find their
permanent place in common measurement equipments or as routine laboratory techniques.
Here we discuss possible applications of the work presented in this thesis.
5.1 Optical Tweezers and Photodynamic Therapy
The work on the photoaquation of vitamin B12 presented in Chapter 3 was intended
to study the feasibility of efficiently inducing and monitoring photochemical processes
in the photonic crystal fiber chemical reactor. These reactions are similar to that of the
photoactivated anticancer drugs currently under intensive research and development. The
success in this initial case study suggests that the photonic crystal fiber is a well-suited
candidate for testing the effectiveness of these drugs. The next stage would involve testing
these drugs on cancer cells in a well-controlled environment. Recently, precise control over
a particle against fluidic counterflow was demonstrated in a liquid-filled photonic bandgap
fiber [162]. By combining a photonic crystal fiber chemical reactor with an in-fiber cell
guidance setup, the optical and mechanical response of a cancer cell to the synthetic drugs
under test can immediately be obtained via a range of sensing modalities available for
photonic crystal fiber sensors.
89
90 CHAPTER 5. CONCLUSIONS AND OUTLOOK
5.2 Microfluidic Flow Reactor
The small dimensions of the microfluidic channels in the fiber’s microstructure provide
unique opportunities for the implementation of photonic crystal fibers as miniature flow
reactors. Such flow reactors would allow continuous on-line optimization of the expo-
sure conditions and reagent parameters in a reaction. In addition, most biochemical
experiments are performed in fluidic environments. The exploitation of photonic crystal
fibers as optofluidic devices offers significant advantages including minimal consumption
of reagents and mechanical flexibility. Furthermore, recent experiments have shown that
photonic crystal fibers can be integrated into existing planar microfluidic circuitry [206].
5.3 Mass Spectrometry
Mass spectrometry is a common analytical technique used in the laboratories to deter-
mine the elemental composition of a sample, and is an integral routine used in chemical
synthesis, including the development of therapeutical anticancer complexes. It is there-
fore of great interest to incorporate microfluidic photonic crystal fiber circuitry in a mass
spectrometer setup to accommodate direct measurements of the products of photochem-
ical reactions. Such a setup could also allow for the quantitative spectroscopic assay of
reaction products and monitoring of the reaction kinetics. Preliminary results from a
separate project have already confirmed the feasibility of such a setup configuration.
5.4 Surface Chemistry Using Higher-Order Modes
The experiments on the self-aggregation and photobleaching of methylene blue in Chap-
ter 4 have demonstrated that the reaction kinetics of molecules with high affinity to ad-
sorb onto the fiber surfaces can be efficiently studied by taking the advantage of the high
surface-to-volume ratio offered by the microstructure of the photonic crystal fibers. A well-
defined optical mode propagating in the fiber is capable of detecting minute changes in the
composition of the sample via, for example, absorption spectroscopy. It has been demon-
strated that higher-order modes propagating in hollow-core photonic crystal fibers can be
selectively excited by using holograms electronically generated by a spatial light modu-
5.5. FINAL REMARKS 91
lator [64]. By careful excitation of both the fundamental mode and a surface-sensitive
higher order mode in a hollow-core photonic crystal fiber, it is possible to measure the
local concentration gradients across the core volume of the fiber.
5.5 Final Remarks
The examples outlined above give a clear indication to the breadth of research possibilities
in photonic crystal fibers, utilizing the unprecedented interplay between light and matter
within the fiber’s microstructure. The novelty in the development of photonic crystal fiber
lies in its cross-disciplinary applications, bridging different fields in science and technology.
With no foreseeable limitation to the future prospects in sight, the continual development
in the novel applications of photonic crystal fiber devices is to be anticipated.

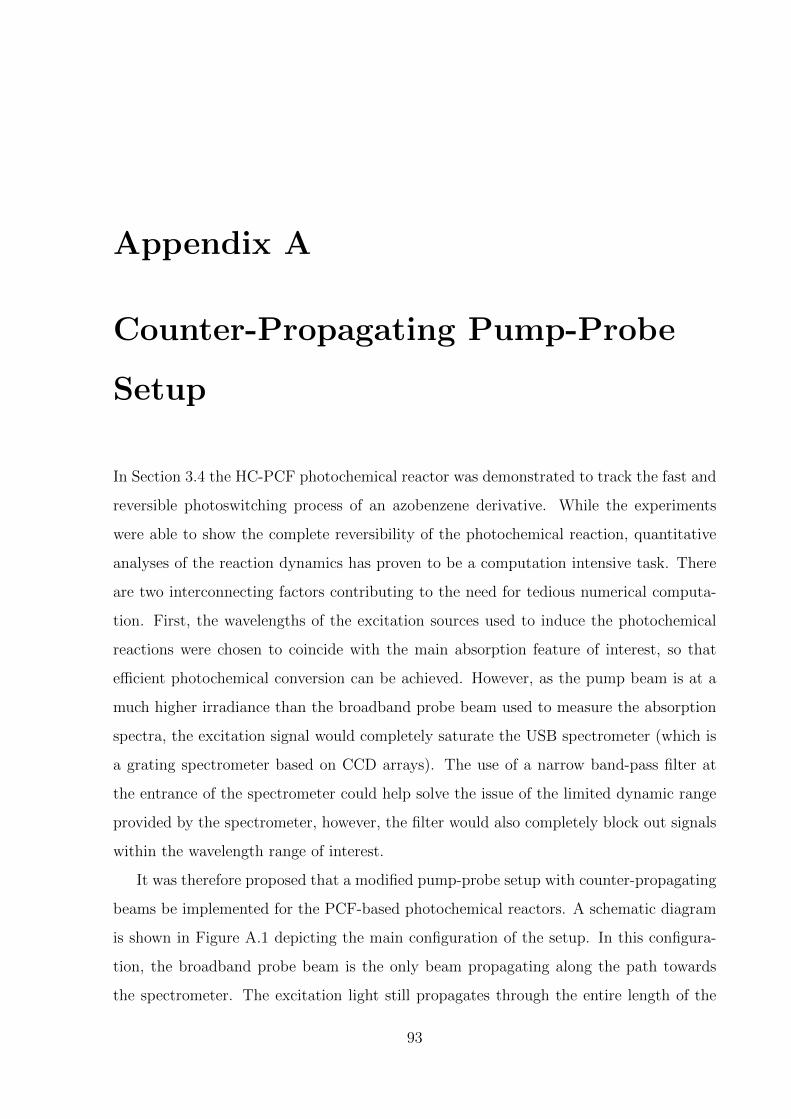
Appendix A
Counter-Propagating Pump-Probe
Setup
In Section 3.4 the HC-PCF photochemical reactor was demonstrated to track the fast and
reversible photoswitching process of an azobenzene derivative. While the experiments
were able to show the complete reversibility of the photochemical reaction, quantitative
analyses of the reaction dynamics has proven to be a computation intensive task. There
are two interconnecting factors contributing to the need for tedious numerical computa-
tion. First, the wavelengths of the excitation sources used to induce the photochemical
reactions were chosen to coincide with the main absorption feature of interest, so that
efficient photochemical conversion can be achieved. However, as the pump beam is at a
much higher irradiance than the broadband probe beam used to measure the absorption
spectra, the excitation signal would completely saturate the USB spectrometer (which is
a grating spectrometer based on CCD arrays). The use of a narrow band-pass filter at
the entrance of the spectrometer could help solve the issue of the limited dynamic range
provided by the spectrometer, however, the filter would also completely block out signals
within the wavelength range of interest.
It was therefore proposed that a modified pump-probe setup with counter-propagating
beams be implemented for the PCF-based photochemical reactors. A schematic diagram
is shown in Figure A.1 depicting the main configuration of the setup. In this configura-
tion, the broadband probe beam is the only beam propagating along the path towards
the spectrometer. The excitation light still propagates through the entire length of the
93
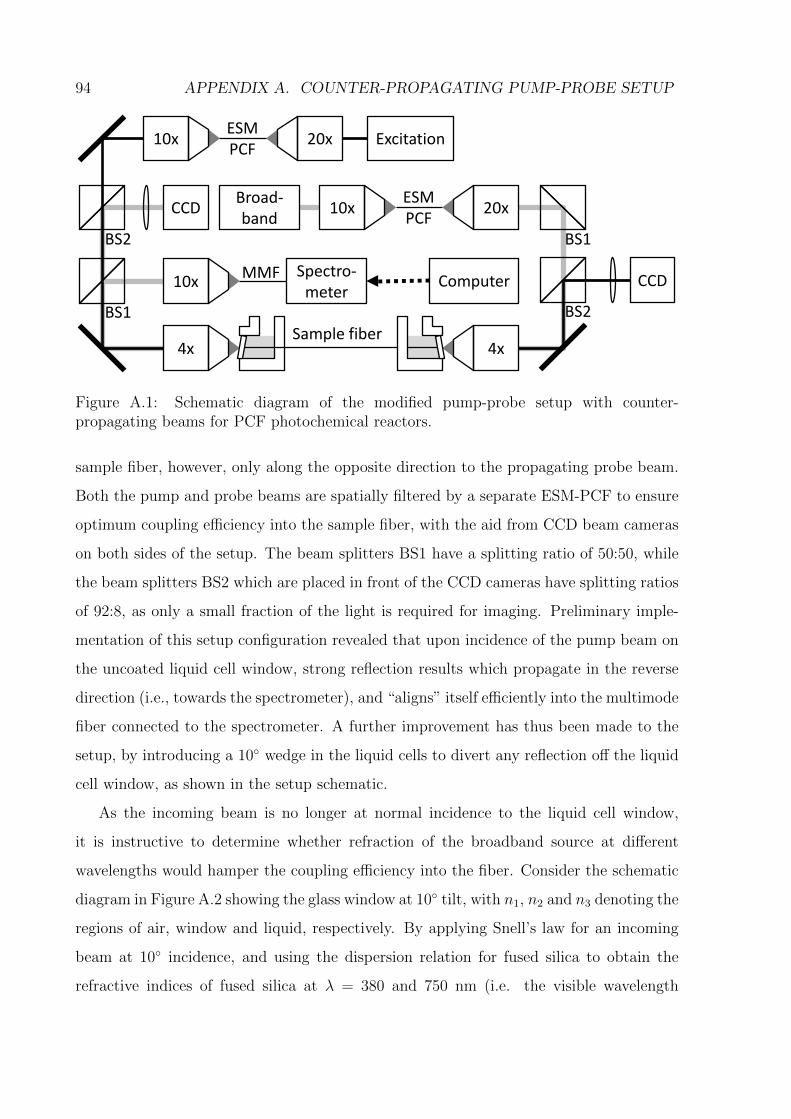
94 APPENDIX A. COUNTER-PROPAGATING PUMP-PROBE SETUP
4x4x
10x 20x
Broad-band
Spectro-meter
Computer
Excitation
CCD
Sample fiber
ESM PCF
MMF
BS1
BS2
10x 20xESM PCF
BS1
10x
BS2
CCD
Figure A.1: Schematic diagram of the modified pump-probe setup with counter-propagating beams for PCF photochemical reactors.
sample fiber, however, only along the opposite direction to the propagating probe beam.
Both the pump and probe beams are spatially filtered by a separate ESM-PCF to ensure
optimum coupling efficiency into the sample fiber, with the aid from CCD beam cameras
on both sides of the setup. The beam splitters BS1 have a splitting ratio of 50:50, while
the beam splitters BS2 which are placed in front of the CCD cameras have splitting ratios
of 92:8, as only a small fraction of the light is required for imaging. Preliminary imple-
mentation of this setup configuration revealed that upon incidence of the pump beam on
the uncoated liquid cell window, strong reflection results which propagate in the reverse
direction (i.e., towards the spectrometer), and “aligns” itself efficiently into the multimode
fiber connected to the spectrometer. A further improvement has thus been made to the
setup, by introducing a 10◦ wedge in the liquid cells to divert any reflection off the liquid
cell window, as shown in the setup schematic.
As the incoming beam is no longer at normal incidence to the liquid cell window,
it is instructive to determine whether refraction of the broadband source at different
wavelengths would hamper the coupling efficiency into the fiber. Consider the schematic
diagram in Figure A.2 showing the glass window at 10◦ tilt, with n1, n2 and n3 denoting the
regions of air, window and liquid, respectively. By applying Snell’s law for an incoming
beam at 10◦ incidence, and using the dispersion relation for fused silica to obtain the
refractive indices of fused silica at λ = 380 and 750 nm (i.e. the visible wavelength
95
�380
�750
10°
nwindow
nair
d
d·tan�750d·tan�
380
Figure A.2: Schematic diagram showing the effect of refraction due to the tilted liquidcell window. Diagram exaggerated and not to scale.
range), nfused silica(380 nm) = 1.4725 and nfused silica(750 nm) = 1.4542. The refracted
angles are calculated to be at 2.1611◦ and 2.1883◦. For window thicknesses ranging from
0.08 to 1 mm used in the experiments, the separation of the longer and shorter wavelength
components varies between 38 to 475 nm and should pose no problem in the coupling of
the broadband source into the hollow fiber core.

List of Publications
1. J. S. Y. Chen, T. G. Euser, N. J. Farrer, P. J. Sadler, M. Scharrer, and P. St.J.
Russell, “Photochemistry in Photonic Crystal Fiber Nanoreactors,” Chemistry - A
European Journal, 16(19), 5607-5612 (2010).
2. T. G. Euser, M. K. Garbos, J. S. Y. Chen, and P. St.J. Russell, “Precise balancing of
viscous and radiation forces on a particle in a liquid-filled photonic bandgap fiber,”
Optics Letters, 34(23), 3674-3676 (2009).
3. T. G. Euser, G. Whyte, M. Scharrer, J. S. Y. Chen, A. Abdolvand, J. Nold, C. F.
Kaminski, and P. St.J. Russell, “Dynamic control of higher-order modes in hollow-
core photonic crystal fibers,” Optics Express 16(22), 17972-17981 (2008).
4. T. G. Euser, J. S. Y. Chen, M. Scharrer, P. St.J. Russell, N. J. Farrer, and P.
J. Sadler, “Quantitative broadband chemical sensing in air-suspended solid-core
fibers,” Journal of Applied Physics 103, 103108 (2008).
5. J. S. Y. Chen, T. G. Euser, G. O. S. Williams, A. C. Jones, and P. St.J. Russell,
“Photoswitching in Photonic Crystal Fiber,” in Advanced Photonics: OSA Optics &
Photonics Congress (EurOPC), SThB3. Karlsruhe, Germany. 21 - 24 June 2010.
6. J. Chen, A. Hangauer, R. Strzoda, T. G. Euser, J. S. Y. Chen, M. Scharrer, P. St.J.
Russell, and M. Amann, “Sensitivity Limits for Near- Infrared Gas Sensing with
Suspended-core PCFs directly coupled with VCSELs,” in Conference on Lasers and
Electro-Optics (CLEO), JThB7. San Jose, USA. 16 - 21 May 2010.
7. J. Chen, A. Hangauer, R. Strzoda, M. Amann, T. Euser, J. S. Y. Chen, M. Schar-
rer, P. Russell, “Near-infrared gas sensing using hollow waveguides and PCFs di-
97
98 LIST OF PUBLICATIONS
rectly coupled to VCSELs,” in Field Laser Applications in Industry and Research
(FLAIR). Grainau, Germany. 6 - 11 September 2009.
8. J. S. Y. Chen, T. G. Euser, N. J. Farrer, P. J. Sadler, and P. St.J. Russell, “Photo-
chemistry in photonic crystal fibers,” in European Conference on Lasers and Electro-
Optics (CLEO-Europe), CH1.3. Munich, Germany. 14 - 19 June 2009.
9. M. K. Garbos, T. G. Euser, J. S. Y. Chen, and P. St.J. Russell, “Controlled particle
guidance in a liquid-filled single-mode hollow-core photonic crystal fiber,” in Optical
Trapping Applications (OTA), OMA6. Vancouver, Canada. 26 - 30 April 2009.
10. T. G. Euser, J. S. Y. Chen, M. Scharrer, and P. St.J. Russell, “Quantitative broad-
band chemical sensing in air-suspended solid-core fibers,” in Conference on Lasers
and Electro-Optics (CLEO), CMZ6. San Jose, USA. 4 - 9 May 2008.
Bibliography
[1] J. D. Loudin, D. M. Simanovskii, K. Vijayraghavan, C. K. Sramek, A. F. Butterwick,
P. Huie, G. Y. McLean and D. V. Palanker, “Optoelectronic retinal prosthesis:
system design and performance,” Journal of Neural Engineering 4, S72-S84 (2007).
[2] J. K. Niparko, Cochlear Implants: Principles & Practices, Second ed. (Lippincott
Williams & Wilkins, Philadelphia, 2009).
[3] J. W. Gardner and P. N. Bartlett, Electronic Noses: Principles and Applications,
First ed. (Oxford University Press, New York, 1999).
[4] F. Winquist, P. Wide and I. Lundstrom, “An electronic tongue based on voltam-
metry,” Analytica Chimica Acta 357, 21-31 (1997).
[5] R. W. Cattrall, Chemical Sensors, Illustrated ed. (Oxford University Press, New
York, 1997).
[6] G. Orellana and M. C. Moreno-Bondi, Frontiers in chemical sensors: novel princi-
ples and techniques, (Springer, Berlin, 2005).
[7] M. Zourob and A. Lakhtakia, Optical Guided-Wave Chemical and Biosensors I,
(Springer, Berlin, 2010).
[8] M. Zourob and A. Lakhtakia, Optical Guided-Wave Chemical and Biosensors II,
(Springer, Berlin, 2010).
[9] S.-S. Kiwanuka, T. Laurila and C. F. Kaminski, “Sensitive Method for the Kinetic
Measurement of Trace Species in Liquids Using Cavity Enhanced Absorption Spec-
troscopy with Broad Bandwidth Supercontinuum Radiation,” Analytical Chemistry
82, 7498-7501 (2010).
99
100 BIBLIOGRAPHY
[10] T. Laurila, I. S. Burns, J. Hult, J. H. Miller and C. F. Kaminski, “A calibration
method for broad-bandwidth cavity enhanced absorption spectroscopy performed
with supercontinuum radiation,” Applied Physics B 1-8 (2010).
[11] K. Chan, H. Ito and H. Inaba, “An optical-fiber-based gas sensor for remote ab-
sorption measurement of low-level CH4 gas in the near-infrared region,” Journal of
Lightwave Technology 2, 234-237 (1984).
[12] G. Stewart, W. Jin and B. Culshaw, “Prospects for fibre-optic evanescent-field gas
sensors using absorption in the near-infrared,” Sensors and Actuators B: Chemical
38, 42-47 (1997).
[13] O. S. Wolfbeis, “Fiber-Optic Chemical Sensors and Biosensors,” Analytical Chem-
istry 76, 3269-3284 (2004).
[14] O. S. Wolfbeis and H. E. Posch, “Fibre-optic fluorescing sensor for ammonia,” An-
alytica Chimica Acta 185, 321-327 (1986).
[15] S. L. R. Barker, R. Kopelman, T. E. Meyer and M. A. Cusanovich, “Fiber-Optic
Nitric Oxide-Selective Biosensors and Nanosensors,” Analytical Chemistry 70, 971-
976 (1998).
[16] B. G. Healey, L. Li and D. R. Walt, “Multianalyte biosensors on optical imaging
bundles,” Biosensors and Bioelectronics 12, 521-529 (1997).
[17] J. A. Ferguson, T. C. Boles, C. P. Adams and D. R. Walt, “A fiber-optic DNA
biosensor microarray for the analysis of gene expression,” Nature Biotechnology 14,
1681-1684 (1996).
[18] J. M. Lopez-Higuera, Handbook of Optical Fibre Sensing Technology, (Wiley, Chich-
ester, 2002).
[19] A. M. Dietrich, J. N. Jensen and W. F. da Costa, “Chemical Species,” Water
Environment Research 68, 391-406 (1996).
[20] B. Mizaikoff, K. Taga and R. Kellner, “Infrared fiber optic gas sensor for chloroflu-
orohydrocarbons,” Vibrational Spectroscopy 8, 103-108 (1995).
BIBLIOGRAPHY 101
[21] G. Schweizer, I. Latka, H. Lehmann and R. Willsch, “Optical sensing of hydro-
carbons in air or in water using UV absorption in the evanescent field of fibers,”
Sensors and Actuators B: Chemical 38, 150-153 (1997).
[22] M. A. El-Sherif, “Smart Textiles Created with Embedded Sensors,” MRS Bulletin
Technology Advances 28, 101-102 (2003).
[23] P. Russell, “Photonic Crystal Fibers,” Science 299, 358-362 (2003).
[24] P. S. J. Russell, “Photonic-Crystal Fibers,” Journal of Lightwave Technology 24,
4729-4749 (2006).
[25] K. C. Kao and G. A. Hockham, “Dielectric-fibre surface waveguides for optical
frequencies,” Proceedings of the IEEE 113, 1151-1158 (1966).
[26] J. C. Knight, T. A. Birks, P. S. J. Russell and D. M. Atkin, “All-silica single-mode
optical fiber with photonic crystal cladding,” Optics Letters 21, 1547-1549 (1996).
[27] J. C. Knight, T. A. Birks, P. S. J. Russell and D. M. Atkin, “All-silica single-mode
optical fiber with photonic crystal cladding: errata,” Optics Letters 22, 484-485
(1997).
[28] P. Vukusic and J. R. Sambles, “Photonic structures in biology,” Nature 424, 852-855
(2003).
[29] V. N. Melekhin and A. B. Manenkov, “Dielectric tube as a low-loss waveguide,”
Zhurnal Tekhnicheskoi Fiziki 38, 2113-2115 (1968).
[30] P. Yeh, A. Yariv and E. Marom, “Theory of Bragg fiber,” Journal of the Optical
Society of America 68, 1196-1201 (1978).
[31] E. Yablonovitch, “Inhibited Spontaneous Emission in Solid-State Physics and Elec-
tronics,” Physical Review Letters 58, 2059-2059 (1987).
[32] E. Yablonovitch, “Photonic band-gap structures,” Journal of the Optical Society of
America B 10, 283-295 (1993).
102 BIBLIOGRAPHY
[33] S. John, “Strong localization of photons in certain disordered dielectric superlat-
tices,” Physical Review Letters 58, 2486-2486 (1987).
[34] T. A. Birks, J. C. Knight and P. S. J. Russell, “Endlessly single-mode photonic
crystal fiber,” Optics Letters 22, 961-963 (1997).
[35] J. C. Knight, T. A. Birks, R. F. Cregan, P. S. J. Russell and P. D. de Sandro, “Large
mode area photonic crystal fibre,” Electronics Letters 34, 1347-1348 (1998).
[36] R. F. Cregan, B. J. Mangan, J. C. Knight, T. A. Birks, P. S. J. Russell, P. J.
Roberts and D. C. Allan, “Single-Mode Photonic Band Gap Guidance of Light in
Air,” Science 285, 1537-1539 (1999).
[37] J. K. Ranka, R. S. Windeler and A. J. Stentz, “Visible continuum generation in air-
silica microstructure optical fibers with anomalous dispersion at 800 nm,” Optics
Letters 25, 25-27 (2000).
[38] J. E. Sharping, M. Fiorentino, A. Coker, P. Kumar and R. S. Windeler, “Four-wave
mixing in microstructure fiber,” Optics Letters 26, 1048-1050 (2001).
[39] F. Benabid, J. Knight and P. Russell, “Particle levitation and guidance in hollow-
core photonic crystal fiber,” Optics Express 10, 1195-1203 (2002).
[40] V. V. R. K. Kumar, A. George, J. Knight and P. Russell, “Tellurite photonic crystal
fiber,” Optics Express 11, 2641-2645 (2003).
[41] A. Argyros, T. Birks, S. Leon-Saval, C. M. Cordeiro, F. Luan and P. S. J. Russell,
“Photonic bandgap with an index step of one percent,” Optics Express 13, 309-314
(2005).
[42] K. Kurokawa, K. Nakajima, K. Tsujikawa, T. Yamamoto and K. Tajima, “Ultra-
Wideband Transmission Over Low Loss PCF,” Journal of Lightwave Technology
27, 1653-1662 (2009).
[43] J. Folkenberg, M. Nielsen, N. Mortensen, C. Jakobsen and H. Simonsen, “Polar-
ization maintaining large mode area photonic crystal fiber,” Optics Express 12,
956-960 (2004).
BIBLIOGRAPHY 103
[44] J. R. Folkenberg, M. D. Nielsen and C. Jakobsen, “Broadband single-polarization
photonic crystal fiber,” Optics Letters 30, 1446-1448 (2005).
[45] A. Ortigosa-Blanch, J. C. Knight, W. J. Wadsworth, J. Arriaga, B. J. Mangan,
T. A. Birks and P. S. J. Russell, “Highly birefringent photonic crystal fibers,” Optics
Letters 25, 1325-1327 (2000).
[46] J. C. Knight, J. Arriaga, T. A. Birks, A. Ortigosa-Blanch, W. J. Wadsworth and
P. S. J. Russell, “Anomalous dispersion in photonic crystal fiber,” Photonics Tech-
nology Letters, IEEE 12, 807-809 (2000).
[47] A. Ferrando, E. Silvestre, J. J. Miret, J. A. Monsoriu, M. V. Andres and P. S. J.
Russell, “Designing a photonic crystal fibre with flattened chromatic dispersion,”
Electronics Letters 35, 325-327 (1999).
[48] A. Ferrando, E. Silvestre, J. J. Miret and P. Andres, “Nearly zero ultraflattened
dispersion in photonic crystal fibers,” Optics Letters 25, 790-792 (2000).
[49] A. Ferrando, E. Silvestre, P. Andres, J. Miret and M. Andres, “Designing the prop-
erties of dispersion-flattened photonic crystal fibers,” Optics Express 9, 687-697
(2001).
[50] W. Reeves, J. Knight, P. Russell and P. Roberts, “Demonstration of ultra-flattened
dispersion in photonic crystal fibers,” Optics Express 10, 609-613 (2002).
[51] A. Cerqueira Sodre, J. M. Chavez Boggio, A. A. Rieznik, H. E. Hernandez-Figueroa,
H. L. Fragnito and J. C. Knight, “Highly efficient generation of broadband cascaded
four-wave mixing products,” Optics Express 16, 2816-2828 (2008).
[52] W. Wadsworth, N. Joly, J. Knight, T. Birks, F. Biancalana and P. Russell, “Super-
continuum and four-wave mixing with Q-switched pulses in endlessly single-mode
photonic crystal fibres,” Optics Express 12, 299-309 (2004).
[53] J. K. Ranka, R. S. Windeler and A. J. Stentz, “Optical properties of high-delta air
silica microstructure optical fibers,” Optics Letters 25, 796-798 (2000).
104 BIBLIOGRAPHY
[54] J. C. Travers, J. M. Stone, A. B. Rulkov, B. A. Cumberland, A. K. George, S. V.
Popov, J. C. Knight and J. R. Taylor, “Optical pulse compression in dispersion
decreasing photonic crystal fiber,” Optics Express 15, 13203-13211 (2007).
[55] W. J. Wadsworth, A. Ortigosa-Blanch, J. C. Knight, T. A. Birks, T. P. M. Man and
P. S. J. Russell, “Supercontinuum generation in photonic crystal fibers and optical
fiber tapers: a novel light source,” Journal of the Optical Society of America B 19,
2148-2155 (2002).
[56] T. M. Monro, Y. D. West, D. W. Hewak, N. G. R. Broderick and D. J. Richardson,
“Chalcogenide holey fibres,” Electronics Letters 36, 1998-2000 (2000).
[57] J. Y. Y. Leong, P. Petropoulos, J. H. V. Price, H. Ebendorff-Heidepriem, S. Asi-
makis, R. C. Moore, K. E. Frampton, V. Finazzi, X. Feng, T. M. Monro and D. J.
Richardson, “High-nonlinearity dispersion-shifted lead-silicate holey fibers for effi-
cient 1-µm pumped supercontinuum generation,” Lightwave Technology, Journal of
24, 183-190 (2006).
[58] H. Ebendorff-Heidepriem, P. Petropoulos, S. Asimakis, V. Finazzi, R. Moore, K.
Frampton, F. Koizumi, D. Richardson and T. Monro, “Bismuth glass holey fibers
with high nonlinearity,” Optics Express 12, 5082-5087 (2004).
[59] V. V. R. Kumar, A. George, W. Reeves, J. Knight, P. Russell, F. Omenetto and A.
Taylor, “Extruded soft glass photonic crystal fiber for ultrabroad supercontinuum
generation,” Optics Express 10, 1520-1525 (2002).
[60] J. A. Harrington and C. C. Gregory, “Hollow sapphire fibers for the delivery of CO2
laser energy,” Optics Letters 15, 541-543 (1990).
[61] T. Hidaka, “GeO2-ZnO-K2O glass as the cladding material of 940-cm1 CO2 laser-
light transmitting hollow-core waveguide,” Journal of Applied Physics 53, 5484-5484
(1982).
[62] T. Abel, J. Hirsch and J. A. Harrington, “Hollow glass waveguides for broadband
infrared transmission,” Optics Letters 19, 1034-1036 (1994).
BIBLIOGRAPHY 105
[63] J. Dai and J. A. Harrington, “High-peak-power, pulsed CO2 laser light delivery by
hollow glass waveguides,” Applied Optics 36, 5072-5077 (1997).
[64] T. G. Euser, G. Whyte, M. Scharrer, J. S. Y. Chen, A. Abdolvand, J. Nold, C. F.
Kaminski and P. S. J. Russell, “Dynamic control of higher-order modes inhollow-
core photonic crystal fibers,” Optics Express 16, 17972-17981 (2008).
[65] M. N. Petrovich, F. Poletti, A. van Brakel and D. J. Richardson, “Robustly single
mode hollow core photonic bandgap fiber,” Optics Express 16, 4337-4346 (2008).
[66] P. Roberts, F. Couny, H. Sabert, B. Mangan, D. Williams, L. Farr, M. Mason, A.
Tomlinson, T. Birks, J. Knight and P. St. J. Russell, “Ultimate low loss of hollow-
core photonic crystal fibres,” Optics Express 13, 236-244 (2005).
[67] B. J. Mangan, L. Farr, A. Langford, P. J. Roberts, D. P. Williams, F. Couny, M.
Lawman, M. Mason, S. Coupland, R. Flea, H. Sabert, T. A. Birks, J. C. Knight
and P. S. J. Russell, “Low loss (1.7 dB/km) hollow core photonic bandgap fiber,”
in Optical Fiber Communication Conference and Exposition (OFC), PD24. Los
Angeles, USA. 22-27 February 2004.
[68] T. D. Hedley, D. M. Bird, F. Benabid, J. C. Knight and P. S. J. Russell, “Modelling
of a novel hollow-core photonic crystal fibre,” in Quantum Electronics and Laser
Science (QELS), 2. Baltimore, USA. 1-6 June 2003.
[69] G. J. Pearce, G. S. Wiederhecker, C. G. Poulton, S. Burger and P. S. J. Russell,
“Models for guidance in kagome-structured hollow-core photonic crystal fibres,”
Optics Express 15, 12680-12685 (2007).
[70] A. Argyros and J. Pla, “Hollow-core polymer fibres with a kagome lattice: potential
for transmission in the infrared,” Optics Express 15, 7713-7719 (2007).
[71] F. Couny, F. Benabid and P. S. Light, “Large-pitch kagome-structured hollow-core
photonic crystal fiber,” Optics Letters 31, 3574-3576 (2006).
[72] Y. Y. Wang, F. Couny, P. J. Roberts and F. Benabid, “Low loss broadband trans-
mission in optimized core-shape Kagome hollow-core PCF,” in Conference on Lasers
and Electro-Optics (CLEO), CPDB4. San Jose, USA. 18-20 May 2010.
106 BIBLIOGRAPHY
[73] Y. Fink, D. J. Ripin, S. Fan, C. Chen, J. D. Joannepoulos and E. L. Thomas,
“Guiding optical light in air using an all-dielectric structure,” Journal of Lightwave
Technology 17, 2039-2041 (1999).
[74] D. Torres, O. Weisberg, G. Shapira, C. Anastassiou, B. Temelkuran, M. Shurgalin,
S. A. Jacobs, R. U. Ahmad, T. Wang, U. Kolodny, S. M. Shapshay, Z. Wang,
A. K. Devaiah, U. D. Upadhyay and J. A. Koufman, “OmniGuide photonic bandgap
fibers for flexible delivery of CO2 laser energy for laryngeal and airway surgery,”
Proceedings of SPIE 5686, 310-321 (2005).
[75] X. Feng, A. K. Mairaj, D. W. Hewak and T. M. Monro, “Towards high-index glass
based monomode holey fibre with large mode area,” Electronics Letters 40, 167-169
(2004).
[76] A. Mori, K. Shikano, K. Enbutsu, K. Oikawa, K. Naganuma, M. Kato and S. Aozasa,
“1.5 µm band zero-dispersion shifted tellurite photonic crystal fibre with a nonlinear
coefficient γ of 675 W−1km−1,” in European Conference on Optical Communication
(ECOC), TH3.3.6. Stockholm, Sweden. 5-9 September 2004.
[77] M. Kanso, S. Cuenot and G. Louarn, “Sensitivity of Optical Fiber Sensor Based
on Surface Plasmon Resonance: Modeling and Experiments,” Plasmonics 3, 49-57
(2008).
[78] Z. Zhang, P. Zhao, F. Sun, G. Xiao and Y. Wu, “Self-Referencing in Optical-
Fiber Surface Plasmon Resonance Sensors,” Photonics Technology Letters, IEEE
19, 1958-1960 (2007).
[79] S.-M. Tseng and C.-L. Chen, “Side-polished fibers,” Applied Optics 31, 3438-3447
(1992).
[80] S. M. Chandani and N. A. F. Jaeger, “Fiber-optic temperature sensor using evanes-
cent fields in D fibers,” Photonics Technology Letters, IEEE 17, 2706-2708 (2005).
[81] J. Villatoro, D. Monzon-Hernandez and E. Mejıa, “Fabrication and Modeling of
Uniform-Waist Single-Mode Tapered Optical Fiber Sensors,” Applied Optics 42,
2278-2283 (2003).
BIBLIOGRAPHY 107
[82] D. Monzon-Hernandez and J. Villatoro, “High-resolution refractive index sensing by
means of a multiple-peak surface plasmon resonance optical fiber sensor,” Sensors
and Actuators B: Chemical 115, 227-231 (2006).
[83] T. M. Monro, D. J. Richardson and P. J. Bennett, “Developing holey fibres for
evanescent field devices,” Electronics Letters 35, 1188-1189 (1999).
[84] T. M. Monro, W. Belardi, K. Furusawa, J. C. Baggett, N. G. R. Broderick and D. J.
Richardson, “Sensing with microstructured optical fibres,” Measurement Science
and Technology 12, 854-854 (2001).
[85] Y. L. Hoo, W. Jin, H. L. Ho, D. N. Wang and R. S. Windele, “Evanescent wave
gas sensing using microstructure fibre,” in Pacific Rim Conference on Lasers and
Electro-Optics (CLEO/PACIFIC RIM), 8-9. Chiba, Japan. 15-19 July 2001.
[86] Y. L. Hoo, W. Jin, H. L. Ho, D. N. Wang and R. S. Windeler, “Evanescent-wave
gas sensing using microstructure fiber,” Optical Engineering 41, 8-9 (2002).
[87] C. M. B. Cordeiro, M. A. R. Franco, G. Chesini, E. C. S. Barretto, R. Lwin,
C. H. Brito Cruz and M. C. J. Large, “Microstructured-core optical fibre for evanes-
cent sensing applications,” Optics Express 14, 13056-13066 (2006).
[88] A. S. Webb, F. Poletti, D. J. Richardson and J. K. Sahu, “Suspended-core holey
fiber for evanescent-field sensing,” Optical Engineering 46, 010503-010503 (2007).
[89] J. B. Jensen, L. H. Pedersen, P. E. Høiby, L. B. Nielsen, T. P. Hansen, J. R.
Folkenberg, J. Riishede, D. Noordegraaf, K. Nielsen, A. Carlsen and A. Bjarklev,
“Photonic crystal fiber based evanescent-wave sensor for detection ofbiomolecules
in aqueous solutions,” Optics Letters 29, 1974-1976 (2004).
[90] M. T. Myaing, J. Y. Ye, T. B. Norris, T. Thomas, Jr. Baker, W. J. Wadsworth,
G. Bouwmans, J. C. Knight and P. S. J. Russell, “Enhanced two-photon biosensing
with double-clad photonic crystal fibers,” Optics Letters 28, 1224-1226 (2003).
[91] S. Afshar V, S. C. Warren-Smith and T. M. Monro, “Enhancement of fluorescence-
based sensing using microstructured optical fibres,” Optics Express 15, 17891-17901
(2007).
108 BIBLIOGRAPHY
[92] L. Rindorf and O. Bang, “Highly sensitive refractometer with a photonic-crystal-
fiber long-period grating,” Optics Letters 33, 563-565 (2008).
[93] L. Rindorf, J. B. Jensen, M. Dufva, L. H. Pedersen, P. E. Høiby and O. Bang, “Pho-
tonic crystal fiber long-period gratings for biochemical sensing,” Optics Express 14,
8224-8231 (2006).
[94] Y.-G. Han, S. Song, G. H. Kim, K. Lee, S. B. Lee, J. H. Lee, C. H. Jeong, C. H. Oh
and H. J. Kang, “Simultaneous independent measurement of strain and temperature
based on long-period fiber gratings inscribed in holey fibers depending on air-hole
size,” Optics Letters 32, 2245-2247 (2007).
[95] G. Kakarantzas, A. Ortigosa-Blanch, T. A. Birks, P. S. J. Russell, L. Farr, F. Couny
and B. J. Mangan, “Structural rocking filters in highly birefringent photonic crystal
fiber,” Optics Letters 28, 158-160 (2003).
[96] G. Statkiewicz-Barabach, A. Anuszkiewicz, W. Urbanczyk and J. Wojcik, “Sensing
characteristics of rocking filter fabricated in microstructured birefringent fiber using
fusion arc splicer,” Optics Express 16, 17249-17257 (2008).
[97] S. Smolka, M. Barth and O. Benson, “Highly efficient fluorescence sensing with
hollow core photonic crystal fibers,” Optics Express 15, 12783-12791 (2007).
[98] T. Ritari, J. Tuominen, H. Ludvigsen, J. Petersen, T. Sørensen, T. Hansen and H.
Simonsen, “Gas sensing using air-guiding photonic bandgap fibers,” Optics Express
12, 4080-4087 (2004).
[99] D. Passaro, M. Foroni, F. Poli, A. Cucinotta, S. Selleri, J. Lægsgaard and A. O.
Bjarklev, “All-Silica Hollow-Core Microstructured Bragg Fibers for Biosensor Ap-
plication,” Sensors Journal, IEEE 8, 1280-1286 (2008).
[100] Q. Shi, Z. Wang, L. Jin, Y. Li, H. Zhang, F. Lu, G. Kai and X. Dong, “A Hollow-
Core Photonic Crystal Fiber Cavity Based Multiplexed FabryPerot Interferometric
Strain Sensor System,” Photonics Technology Letters, IEEE 20, 1329-1331 (2008).
BIBLIOGRAPHY 109
[101] A. Hassani and M. Skorobogatiy, “Design of the microstructured optical fiber-based
surface plasmon resonance sensors with enhanced microfluidics,” Optics Express 14,
11616-11621 (2006).
[102] B. Gauvreau, A. Hassani, M. Fassi Fehri, A. Kabashin and M. A. Skorobogatiy,
“Photonic bandgap fiber-based Surface Plasmon Resonance sensors,” Optics Ex-
press 15, 11413-11426 (2007).
[103] E. A. J. Marcatili and R. A. Schmeltzer, “Hollow Metallic and Dieletric Waveguides
for Long Distance Optical Transmission and Lasers,” Bell System Technical Journal
43, 1783-1809 (1964).
[104] A. Datta, I.-Y. Eom, A. Dhar, P. Kuban, R. Manor, I. Ahmad, S. Gangopadhyay,
T. Dallas, M. Holtz, H. Temkin and P. K. Dasgupta, “Microfabrication and char-
acterization of teflon AF-coated liquid core waveguide channels in silicon,” Sensors
Journal, IEEE 3, 788-795 (2003).
[105] M. Mohebbi, R. Fedosejevs, V. Gopal and J. A. Harrington, “Silver-coated hollow-
glass waveguide for applications at 800 nm,” Applied Optics 41, 7031-7035 (2002).
[106] G. Antonopoulos, F. Benabid, T. A. Birks, D. M. Bird, J. C. Knight and P. S. J.
Russell, “Experimental demonstration of the frequency shift of bandgaps in photonic
crystal fibers due to refractive index scaling,” Optics Express 14, 3000-3006 (2006).
[107] K. Nielsen, D. Noordegraaf, T. Sørensen, A. Bjarklev and T. P. Hansen, “Selective
filling of photonic crystal fibres,” Journal of Optics A: Pure and Applied Optics 7,
L13-L20 (2005).
[108] J. M. Fini, “Microstructure fibres for optical sensing in gases and liquids,” Mea-
surement Science and Technology 15, 1120-1128 (2004).
[109] C. B. Schaffer, Interaction of femtosecond laser pulses with transparent materi-
als,(Harvard University, 2001).
[110] N. Bloembergen, “Laser-induced electric breakdown in solids,” Quantum Electron-
ics, IEEE Journal of 10, 375-386 (1974).
110 BIBLIOGRAPHY
[111] M. H. Niemz, “Threshold dependence of laser-induced optical breakdown on pulse
duration,” Applied Physics Letters 66, 1181-1181 (1995).
[112] M. Lenzner, J. Krger, S. Sartania, Z. Cheng, C. Spielmann, G. Mourou, W. Kautek
and F. Krausz, “Femtosecond Optical Breakdown in Dielectrics,” Physical Review
Letters 80, 4076-4076 (1998).
[113] C. F. Bohren and D. R. Huffman, Absorption and scattering of light by small par-
ticles, (Wiley, Weinheim, 1983).
[114] S. Maruo, O. Nakamura and S. Kawata, “Three-dimensional microfabrication with
two-photon-absorbed photopolymerization,” Optics Letters 22, 132-134 (1997).
[115] S. Kawata, H.-B. Sun, T. Tanaka and K. Takada, “Finer features for functional
microdevices,” Nature 412, 697-698 (2001).
[116] B. H. Cumpston, S. P. Ananthavel, S. Barlow, D. L. Dyer, J. E. Ehrlich, L. L.
Erskine, A. A. Heikal, S. M. Kuebler, I. Y. S. Lee, D. McCord-Maughon, J. Qin, H.
Rockel, M. Rumi, X.-L. Wu, S. R. Marder and J. W. Perry, “Two-photon polymer-
ization initiators for three-dimensional optical data storage and microfabrication,”
Nature 398, 51-54 (1999).
[117] A. Korkin and F. Rosei, Nanoelectronics and photonics: from atoms to materials,
devices, and architectures, 1 ed. (Springer, New York, 2009).
[118] H. W. Lee, M. A. Schmidt, H. K. Tyagi, L. P. Sempere and P. S. J. Russell,
“Polarization-dependent coupling to plasmon modes on submicron gold wire in pho-
tonic crystal fiber,” Applied Physics Letters 93, 111102-111102 (2008).
[119] H. K. Tyagi, M. A. Schmidt, L. Prill Sempere and P. S. Russell, “Optical properties
of photonic crystal fiber with integral micron-sized Ge wire,” Optics Express 16,
17227-17236 (2008).
[120] K. Lai, S. G. Leon-Saval, A. Witkowska, W. J. Wadsworth and T. A. Birks,
“Wavelength-independent all-fiber mode converters,” Optics Letters 32, 328-330
(2007).
BIBLIOGRAPHY 111
[121] C. M. B. Cordeiro, C. J. S. de Matos, E. M. dos Santos, A. Bozolan, J. S. K. Ong,
T. Facincani, G. Chesini, A. R. Vaz and C. H. Brito Cruz, “Towards practical liquid
and gas sensing with photonic crystal fibres: side access to the fibre microstructure
and single-mode liquid-core fibre,” Measurement Science and Technology 18, 3075-
3081 (2007).
[122] C. Martelli, P. Olivero, J. Canning, N. Groothoff, B. Gibson and S. Huntington,
“Micromachining structured optical fibers using focused ion beam milling,” Optics
Letters 32, 1575-1577 (2007).
[123] N. Y. Joly, T. A. Birks, A. Yulin, J. C. Knight and P. S. J. Russell, “Linear and
nonlinear guidance in an ultralow loss planar glass membrane,” Optics Letters 30,
2469-2471 (2005).
[124] G. Stochel, A. Wanat, E. Kulis and Z. Stasicka, “Light and metal complexes in
medicine,” Coordination Chemistry Reviews 171, 203-220 (1998).
[125] Z. Huang, “A review of progress in clinical photodynamic therapy,” Technology in
Cancer Research & Treatment 4, 283-293 (2005).
[126] N. J. Farrer, J. A. Woods, V. P. Munk, F. S. Mackay and P. J. Sadler, “Photocyto-
toxic trans-Diam(m)ine Platinum(IV) Diazido Complexes More Potent than Their
cis Isomers,” Chemical Research in Toxicology 23, 413-421 (2010).
[127] F. S. Mackay, J. A. Woods, P. Heringova, J. Kasparkova, A. M. Pizarro, S. A.
Moggach, S. Parsons, V. Brabec and P. J. Sadler, “A potent cytotoxic photoacti-
vated platinum complex,” Proceedings of the National Academy of Sciences 104,
20743-20748 (2007).
[128] N. Hoffmann, “Photochemical Reactions as Key Steps in Organic Synthesis,” Chem-
ical Reviews 108, 1052-1103 (2008).
[129] J. Iriondo-Alberdi and M. F. Greaney, “Photocycloaddition in natural product syn-
thesis,” European Journal of Organic Chemistry 2007, 4801-4815 (2007).
[130] M. Gratzel, “Solar Energy Conversion by Dye-Sensitized Photovoltaic Cells,” Inor-
ganic Chemistry 44, 6841-6851 (2005).
112 BIBLIOGRAPHY
[131] N. Robertson, “Catching the rainbow: Light harvesting in dye-sensitized solar cells,”
Angewandte Chemie International Edition 47, 1012-1014 (2008).
[132] A. Huebner, S. Sharma, M. Srisa-Art, F. Hollfelder, J. B. Edel and A. J. deMello,
“Microdroplets: A sea of applications?,” Lab on a Chip 8, 1244-1254 (2008).
[133] C. Monat, P. Domachuk and B. J. Eggleton, “Integrated optofluidics: A new river
of light,” Nat Photon 1, 106-114 (2007).
[134] P. Anzenbacher and M. A. Palacios, “Polymer nanofibre junctions of attolitre vol-
ume serve as zeptomole-scale chemical reactors,” Nat Chem 1, 80-86 (2009).
[135] S. M. Matthews, A. D. Elder, K. Yunus, C. F. Kaminski, C. M. Brennan and A. C.
Fisher, “Quantitative Kinetic Analysis in a Microfluidic Device Using Frequency-
Domain Fluorescence Lifetime Imaging,” Analytical Chemistry 79, 4101-4109
(2007).
[136] C. M. Cordeiro, M. A. Franco, C. J. Matos, F. Sircilli, V. A. Serro and C. H. Cruz,
“Single-design-parameter microstructured optical fiber for chromatic dispersion tai-
loring and evanescent field enhancement,” Optics Letters 32, 3324-3326 (2007).
[137] T. G. Euser, J. S. Y. Chen, M. Scharrer, P. S. J. Russell, N. J. Farrer and P. J. Sadler,
“Quantitative broadband chemical sensing in air-suspended solid-core fibers,” Jour-
nal of Applied Physics 103, 103108-103108 (2008).
[138] L. W. Kornaszewski, N. Gayraud, J. M. Stone, W. N. MacPherson, A. K. George,
J. C. Knight, D. P. Hand and D. T. Reid, “Mid-infrared methane detection in a
photonic bandgap fiber using a broadband optical parametric oscillator,” Optics
Express 15, 11219-11224 (2007).
[139] D. Marcuse, Principles of Optical Fiber Measurements, (Academic Press, New York,
1981).
[140] H. El-Kashef, “Study of the refractive properties of laser dye solvents: toluene,
carbon disulphide, chloroform, and benzene,” Optical Materials 20, 81-86 (2002).
BIBLIOGRAPHY 113
[141] N. A. Mortensen, J. R. Folkenberg, M. D. Nielsen and K. P. Hansen, “Modal cut-
off and the V parameter in photonic crystal fibers,” Optics Letters 28, 1879-1881
(2003).
[142] M. D. Nielsen, N. A. Mortensen, J. R. Folkenberg and A. Bjarklev, “Mode-field
radius of photonic crystal fibers expressed by the V parameter,” Optics Letters 28,
2309-2311 (2003).
[143] Z. H. Siddik, “Cisplatin: mode of cytotoxic action and molecular basis of resistance,”
Oncogene 22, 7265-7279 (2003).
[144] W. M. Sharman, C. M. Allen and J. E. van Lier, “Photodynamic therapeutics: basic
principles and clinical applications,” Drug Discovery Today 4, 507-517 (1999).
[145] S. B. Brown, E. A. Brown and I. Walker, “The present and future role of photody-
namic therapy in cancer treatment,” The Lancet Oncology 5, 497-508 (2004).
[146] S. H. Ibbotson, H. Moseley, L. Brancaleon, M. Padgett, M. O’Dwyer, J. A. Woods,
A. Lesar, C. Goodman and J. Ferguson, “Photodynamic therapy in dermatology:
Dundee clinical and research experience,” Photodiagnosis and Photodynamic Ther-
apy 1, 211-223 (2004).
[147] R. A. Hsi, D. I. Rosenthal and E. Glatstein, “Photodynamic therapy in the treat-
ment of cancer: current state of the art,” Drugs 57, 725-734 (1999).
[148] A. L. Harris, “Hypoxia - a key regulatory factor in tumour growth,” Nat Rev Cancer
2, 38-47 (2002).
[149] A. Vogler, R. Hirschmann, H. Otto and H. Kunkely, “Photochemistry of Biologi-
cally Important Transition Metal Complexes. I. Cyanocobalamin and Related Cor-
rin Complexes of Rhodium(III),” Berichte der Bunsengesellschaft fr physikalische
Chemie 80, 420-424 (1976).
[150] I. Ahmad, W. Hussain and A. A. Fareedi, “Photolysis of cyanocobalamin in aqueous
solution,” Journal of Pharmaceutical and Biomedical Analysis 10, 9-15 (1992).
114 BIBLIOGRAPHY
[151] K. L. Brown, “Chemistry and Enzymology of Vitamin B12,” Chemical Reviews 105,
2075-2150 (2005).
[152] J. M. Pratt, Inorganic Chemistry of Vitamin B12, (Academic Press Inc, New York,
1972).
[153] T. A. Stich, A. J. Brooks, N. R. Buan and T. C. Brunold, “Spectroscopic and
Computational Studies of Co3+-Corrinoids: Spectral and Electronic Properties of
the B12 Cofactors and Biologically Relevant Precursors,” Journal of the American
Chemical Society 125, 5897-5914 (2003).
[154] R. A. Firth, H. A. O. Hill, J. M. Pratt, R. J. P. Williams and W. R. Jackson,
“The Circular Dichroism and Absorption Spectra of Some Vitamin B12 Derivatives,”
Biochemistry 6, 2178-2189 (1967).
[155] T. Andruniow, P. M. Kozlowski and M. Z. Zgierski, “Theoretical analysis of elec-
tronic absorption spectra of vitamin B12 models,” The Journal of Chemical Physics
115, 7522-7522 (2001).
[156] J. A. Hill, J. M. Pratt and R. J. P. Williams, “The corphyrins,” Journal of Theo-
retical Biology 3, 423-445 (1962).
[157] K. L. Brown, J. M. Hakimi and D. W. Jacobsen, “Heteronuclear NMR studies of
cobalamins. 3. Phosphorus-31 NMR of aquocobalamin and various organocobal-
amins,” Journal of the American Chemical Society 106, 7894-7899 (1984).
[158] K. L. Brown and J. M. Hakimi, “Heteronuclear NMR studies of cobalamins. 2.
Carbon-13 and phosphorus-31 NMR studies of [13C]cyanocobalamin,” Inorganic
Chemistry 23, 1756-1764 (1984).
[159] J. M. Pratt, “The chemistry of vitamin B12. Part II. Photochemical reactions,”
Journal of the Chemical Society 5154-5154 (1964).
[160] J. J. Shiang, A. G. Cole, R. J. Sension, K. Hang, Y. Weng, J. S. Trommel, L. G.
Marzilli and T. Lian, “Ultrafast Excited-State Dynamics in Vitamin B12 and Related
Cob(III)alamins,” Journal of the American Chemical Society 128, 801-808 (2006).
BIBLIOGRAPHY 115
[161] D. A. Harris, A. B. Stickrath, E. C. Carroll and R. J. Sension, “Influence of Envi-
ronment on the Electronic Structure of Cob(III)alamins: Time-Resolved Absorption
Studies of the S1 State Spectrum and Dynamics,” Journal of the American Chemical
Society 129, 7578-7585 (2007).
[162] T. G. Euser, M. K. Garbos, J. S. Y. Chen and P. S. J. Russell, “Precise balancing
of viscous and radiation forces on a particle in liquid-filled photonic bandgap fiber,”
Optics Letters 34, 3674-3676 (2009).
[163] R. M. Christie, Colour Chemistry, (Royal Society of Chemistry, Cambridge, 2001).
[164] H. Zollinger, Color Chemistry, (Wiley-VCH, Weinheim, 2001).
[165] F. Lagugne Labarthet, J. L. Bruneel, T. Buffeteau and C. Sourisseau, “Chromophore
Orientations upon Irradiation in Gratings Inscribed on Azo-Dye Polymer Films: A
Combined AFM and Confocal Raman Microscopic Study,” The Journal of Physical
Chemistry B 108, 6949-6960 (2004).
[166] C. B. McArdle, Side chain liquid crystal polymers, (Chapman and Hall, New York,
1989).
[167] T. Todorov, L. Nikolova and N. Tomova, “Polarization holography. 1: A new high-
efficiency organic material with reversible photoinduced birefringence,” Applied Op-
tics 23, 4309-4312 (1984).
[168] D. M. Burland, R. D. Miller and C. A. Walsh, “Second-order nonlinearity in poled-
polymer systems,” Chemical Reviews 94, 31-75 (1994).
[169] L. R. Dalton, A. W. Harper, R. Ghosn, W. H. Steier, M. Ziari, H. Fetterman, Y.
Shi, R. V. Mustacich, A. K. Y. Jen and K. J. Shea, “Synthesis and Processing of
Improved Organic Second-Order Nonlinear Optical Materials for Applications in
Photonics,” Chemistry of Materials 7, 1060-1081 (1995).
[170] S. K. Yesodha, C. K. Sadashiva Pillai and N. Tsutsumi, “Stable polymeric materials
for nonlinear optics: a review based on azobenzene systems,” Progress in Polymer
Science 29, 45-74 (2004).
116 BIBLIOGRAPHY
[171] G. Fuchsel, T. Klamroth, J. Dokic and P. Saalfrank, “On the Electronic Structure
of Neutral and Ionic Azobenzenes and Their Possible Role as Surface Mounted
Molecular Switches,” The Journal of Physical Chemistry B 110, 16337-16345 (2006).
[172] M. J. Comstock, N. Levy, A. Kirakosian, J. Cho, F. Lauterwasser, J. H. Harvey,
D. A. Strubbe, J. M. J. Frchet, D. Trauner, S. G. Louie and M. F. Crommie,
“Reversible Photomechanical Switching of Individual Engineered Molecules at a
Metallic Surface,” Physical Review Letters 99, 038301-038301 (2007).
[173] T. Naito, K. Horie and I. Mita, “The Effect of Polymer Rigidity on Photoisomeriza-
tion of 4-Dimethylamino-4-nitroazobenzene,” Polymer Journal 23, 809-813 (1991).
[174] M. Poprawa-Smoluch, J. Baggerman, H. Zhang, H. P. A. Maas, L. De Cola and
A. M. Brouwer, “Photoisomerization of Disperse Red 1 Studied with Transient
Absorption Spectroscopy and Quantum Chemical Calculations,” The Journal of
Physical Chemistry A 110, 11926-11937 (2006).
[175] S. R. Hair, G. A. Taylor and L. W. Schultz, “An easily implemented flash photolysis
experiment for the physical chemistry laboratory: The isomerization of 4-anilino-
4’-nitroazobenzene,” Journal of Chemical Education 67, 709-709 (1990).
[176] E. Fischer, “Calculation of photostationary states in systems A ⇀↽ B when only A
is known,” The Journal of Physical Chemistry 71, 3704-3706 (1967).
[177] T. Asano and T. Okada, “Thermal Z-E isomerization of azobenzenes. The pressure,
solvent, and substituent effects,” The Journal of Organic Chemistry 49, 4387-4391
(1984).
[178] J. Dokic, M. Gothe, J. Wirth, M. V. Peters, J. Schwarz, S. Hecht and P. Saal-
frank, “Quantum Chemical Investigation of Thermal Cis-to-Trans Isomerization of
Azobenzene Derivatives: Substituent Effects, Solvent Effects, and Comparison to
Experimental Data,” The Journal of Physical Chemistry A 113, 6763-6773 (2009).
[179] F. Benabid, F. Couny, J. C. Knight, T. A. Birks and P. S. J. Russell, “Compact, sta-
ble and efficient all-fibre gas cells using hollow-core photonic crystal fibres,” Nature
434, 488-491 (2005).
BIBLIOGRAPHY 117
[180] K. M. Kiang, K. Frampton, T. M. Monro, R. Moore, J. Tucknott, D. W. Hewak,
D. J. Richardson and H. N. Rutt, “Extruded singlemode non-silica glass holey op-
tical fibres,” Electronics Letters 38, 546-547 (2002).
[181] G. M. Hale and M. R. Querry, “Optical Constants of Water in the 200-nm to 200-µm
Wavelength Region,” Applied Optics 12, 555-563 (1973).
[182] G. S. Wiederhecker, C. M. B. Cordeiro, F. Couny, F. Benabid, S. A. Maier, J. C.
Knight, C. H. B. Cruz and H. L. Fragnito, “Field enhancement within an optical
fibre with a subwavelength air core,” Nature Photonics 1, 115-118 (2007).
[183] S. C. Rashleigh and R. Ulrich, “Polarization mode dispersion in single-mode fibers,”
Optics Letters 3, 60-62 (1978).
[184] T. A. Birks, D. Mogilevtsev, J. C. Knight and P. St. J. Russell, “Dispersion com-
pensation using single-material fibers,” Photonics Technology Letters, IEEE 11,
674-676 (1999).
[185] H. C. Egghart, “A study of nickel-azido complex formation in aqueous solution,”
Journal of Inorganic and Nuclear Chemistry 31, 1538-1541 (1969).
[186] G. Bussiere and C. Reber, “Coupled Excited States in Nickel(II) Complexes Probed
by Polarized Absorption Spectroscopy,” Journal of the American Chemical Society
120, 6306-6315 (1998).
[187] M. Triest, G. Bussiere, H. Belisle and C. Reber, “Why Does the Middle Band in
the Absorption Spectrum of Ni(H2O)62+ Have Two Maxima?,” Journal of Chemical
Education 77, 670-670 (2000).
[188] M. M. Brooks, “Methylene Blue as an Antidote for Cyanide and Carbon Monoxide
Poisoning,” The Scientific Monthly 43, 585-586 (1936).
[189] R. E. Lee, R. H. Young and B. Castleman, “James Homer Wright: A Biography of
the Enigmatic Creator of the Wright Stain on the Occasion of Its Centennial,” The
American Journal of Surgical Pathology 26, (2002).
118 BIBLIOGRAPHY
[190] J. H. Bruce-Gregorios, Histophatologic Techniques, (Goodwill Trading Co., Inc.,
Quezon City, 2006).
[191] A. S. N. Murthy and K. S. Reddy, “Photochemical energy conversion studies in
systems containing methylene blue,” International Journal of Energy Research 3,
205-210 (1979).
[192] I. S. Bayer, I. Eroglu and L. Turker, “Photogalvanic effect in aqueous Methylene
blue nickel mesh systems: Conversion of light into electricity,” International Journal
of Energy Research 25, 207-222 (2001).
[193] D. R. Kearns, “Physical and chemical properties of singlet molecular oxygen,”
Chemical Reviews 71, 395-427 (1971).
[194] S. L. Murov, I. Carmichael and G. L. Hug, Handbook of Photochemistry, (CRC
Press, New York, 1993).
[195] E. M. Tuite and J. M. Kelly, “New trends in photobiology: Photochemical interac-
tions of methylene blue and analogues with DNA and other biological substrates,”
Journal of Photochemistry and Photobiology B: Biology 21, 103-124 (1993).
[196] J. F. Padday, “The halide ion activity of dyes and organic salts in aqueous solution,”
The Journal of Physical Chemistry 71, 3488-3493 (1967).
[197] E. Rabinowitch and L. F. Epstein, “Polymerization of Dyestuffs in Solution. Thio-
nine and Methylene Blue 1,” Journal of the American Chemical Society 63, 69-78
(1941).
[198] K. Bergmann and C. T. O’Konski, “A Spectroscopic Study of Methylene Blue
Monomer, Dimer, and Complexes with Montmorillonite,” The Journal of Physi-
cal Chemistry 67, 2169-2177 (1963).
[199] E. Braswell, “Evidence for trimerization in aqueous solutions of methylene blue,”
The Journal of Physical Chemistry 72, 2477-2483 (1968).
BIBLIOGRAPHY 119
[200] P. Mukerjee and A. K. Ghosh, “Multiple association equilibria in the self-association
of methylene blue and other dyes,” Journal of the American Chemical Society 92,
6408-6412 (1970).
[201] K. Patil, R. Pawar and P. Talap, “Self-aggregation of Methylene Blue in aqueous
medium and aqueous solutions of Bu4NBr and urea,” Physical Chemistry Chemical
Physics 2, 4313-4317 (2000).
[202] S. Lei, J. Miyamoto, H. Kanoh, Y. Nakahigashi and K. Kaneko, “Enhancement of
the methylene blue adsorption rate for ultramicroporous carbon fiber by addition
of mesopores,” Carbon 44, 1884-1890 (2006).
[203] S. Taniguchi, N. Suzuki, M. Masuda, S. i. Hisanaga, T. Iwatsubo, M. Goedert
and M. Hasegawa, “Inhibition of Heparin-induced Tau Filament Formation by Phe-
nothiazines, Polyphenols, and Porphyrins,” Journal of Biological Chemistry 280,
7614-7623 (2005).
[204] M. Necula, L. Breydo, S. Milton, R. Kayed, W. E. van der Veer, P. Tone and
C. G. Glabe, “Methylene Blue Inhibits Amyloid A Oligomerization by Promoting
Fibrillization,” Biochemistry 46, 8850-8860 (2007).
[205] B. Krautler and R. e. Stepanek, “Photooxygenolytic Degradation of the Vitamin-
B12 Derivative Heptamethyl Coα,Coβ-Dicyanocobyrinate. Efficient Preparation of
Bicyclic Fragments,” Helvetica Chimica Acta 68, 1079-1088 (1985).
[206] P. C. Ashok, R. F. Marchington, P. Mthunzi, T. F. Krauss and K. Dholakia, “Optical
chromatography using a photonic crystal fiber with on-chip fluorescence excitation,”
Optics Express 18, 6396-6407 (2010).

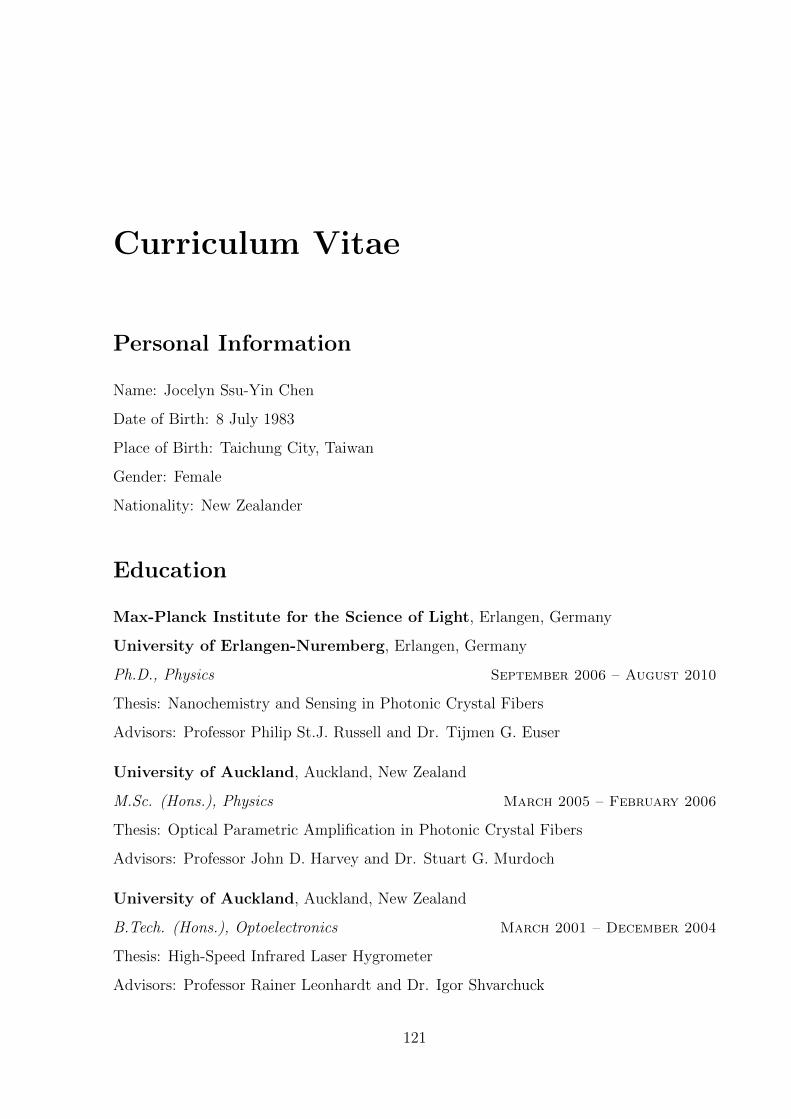
Curriculum Vitae
Personal Information
Name: Jocelyn Ssu-Yin Chen
Date of Birth: 8 July 1983
Place of Birth: Taichung City, Taiwan
Gender: Female
Nationality: New Zealander
Education
Max-Planck Institute for the Science of Light, Erlangen, Germany
University of Erlangen-Nuremberg, Erlangen, Germany
Ph.D., Physics September 2006 – August 2010
Thesis: Nanochemistry and Sensing in Photonic Crystal Fibers
Advisors: Professor Philip St.J. Russell and Dr. Tijmen G. Euser
University of Auckland, Auckland, New Zealand
M.Sc. (Hons.), Physics March 2005 – February 2006
Thesis: Optical Parametric Amplification in Photonic Crystal Fibers
Advisors: Professor John D. Harvey and Dr. Stuart G. Murdoch
University of Auckland, Auckland, New Zealand
B.Tech. (Hons.), Optoelectronics March 2001 – December 2004
Thesis: High-Speed Infrared Laser Hygrometer
Advisors: Professor Rainer Leonhardt and Dr. Igor Shvarchuck
121