Embed Size (px)
Citation preview
New Natural Products from Endophytic Fungi from Mangrove Plants – Structure Elucidation and
Biological Screening
Neue Naturstoffe aus endophytischen Pilzen aus Mangroven – Strukturaufklärung und Evaluierung
der biologischen Aktivität
Inaugural-Dissertation
zur Erlangung des Doktorgrades der Mathematisch-Naturwissenschaftlichen Fakultät
der Heinrich-Heine-Universität Düsseldorf
vorgelegt von
Julia Kjer aus Fulda
Düsseldorf, November 2009
Aus dem Institut für Pharmazeutische Biologie und Biotechnologie der Heinrich-Heine Universität Düsseldorf Gedruckt mit der Genehmigung der Mathematisch-Naturwissenschaftlichen Fakultät der Heinrich-Heine-Universität Düsseldorf Referent: Prof. Dr. Peter Proksch Koreferent: Dr. Rainer Ebel Tag der mündlichen Prüfung: 14.01.2010

Für meine Lieben


Die Entdeckung, dass es so einfach nicht ist, wie man gedacht hat,
ist als Gewinn anzusehen.
Carl Friedrich von Weizsäcker (1912-2007)
Erklärung Ich versichere, dass ich die vorliegende Dissertation mit dem Titel “ Neue Naturstoffe aus endophytischen Pilzen aus Mangroven – Strukturaufklärung und Evaluierung der biologischen Aktivität“ selbständig angefertigt habe und keine anderen als die angegebenen Quellen und Hilfsmittel verwendet habe. Die eingereichte Arbeit habe ich in dieser oder ähnlicher Form noch keinem anderen Prüfungsausschuss vorgelegt. Düsseldorf, den 25.11.2009 Julia Kjer
Table of Contents
Table of Contents 1. Introduction 1
1.1. Natural products in drug discovery 11.2. Fungi as sources of bioactive products 31.3. Endophytic fungi 61.4. Selection of promising sources for the isolation of endophytic fungi 91.5. Mangroves 101.6. Regulation of secondary metabolite production by endophytic fungi 121.7. Aim and scope of this study 14
2. Materials and Methods 152.1. Biological material 15
2.1.1. Field trip and sample collection 152.1.2. Taxonomy of collected mangrove plants 152.1.3. Taxonomy of isolated fungi 172.1.4. Endophytic fungi worked on during the study 18
2.2. Isolation and cultivation of endophytic fungi 212.2.1. Composition of media 212.2.2. Isolation of pure fungal strains 222.2.3. Long term storage of pure fungal strains 222.2.4. Cultivation for screening and isolation 22
2.3. Identification of microbes 242.3.1. Fungal identification 242.3.2. Investigation for bacteria 24
2.4. Extraction of fungal cultures 252.4.1. Extraction of small scale cultures grown in liquid Wickerham medium
25
2.4.2. Extraction of large scale cultures grown in liquid Wickerham medium
25
2.4.3. Extraction of fungi grown on solid rice medium 252.4.4. Extraction and fractionation of mangrove plant material 26
2.5. Isolation of secondary natural products 262.5.1. Thin layer chromatography (TLC) 262.5.2. Vacuum liquid chromatography (VLC) 272.5.3. Low pressure liquid chromatography (LC) 282.5.4. High pressure liquid chromatography (HPLC) 29
2.5.4.1. Semi preparative HPLC 292.5.4.2. Analytical HPLC 29
2.5.5. Isolation and purification of fungal extracts 312.5.5.1. Secondary metabolites isolated from fermentation of Cladosporium sphaerospermum in liquid Wickerham medium
32
2.5.5.2. Secondary metabolites isolated from fermentation of Fusarium incarnatum on solid rice medium
32
2.5.5.3. Isolation of secondary metabolites from Nigrospora sp.
33
2.5.5.3.1. Secondary metabolites isolated from fermentation of Nigrospora sp. in liquid Wickerham medium
33
2.5.5.3.2. Secondary metabolites isolated from fermentation of Nigrospora sp. on solid rice medium
34
2.5.5.4. Isolation of secondary metabolites from Alternaria sp. 352.5.5.4.1. Secondary metabolites isolated from fermentation 35
Table of Contents
of Alternaria sp. in liquid Wickerham medium 2.5.5.4.2. Secondary metabolites isolated from fermentation of Alternaria sp. on solid rice medium
36
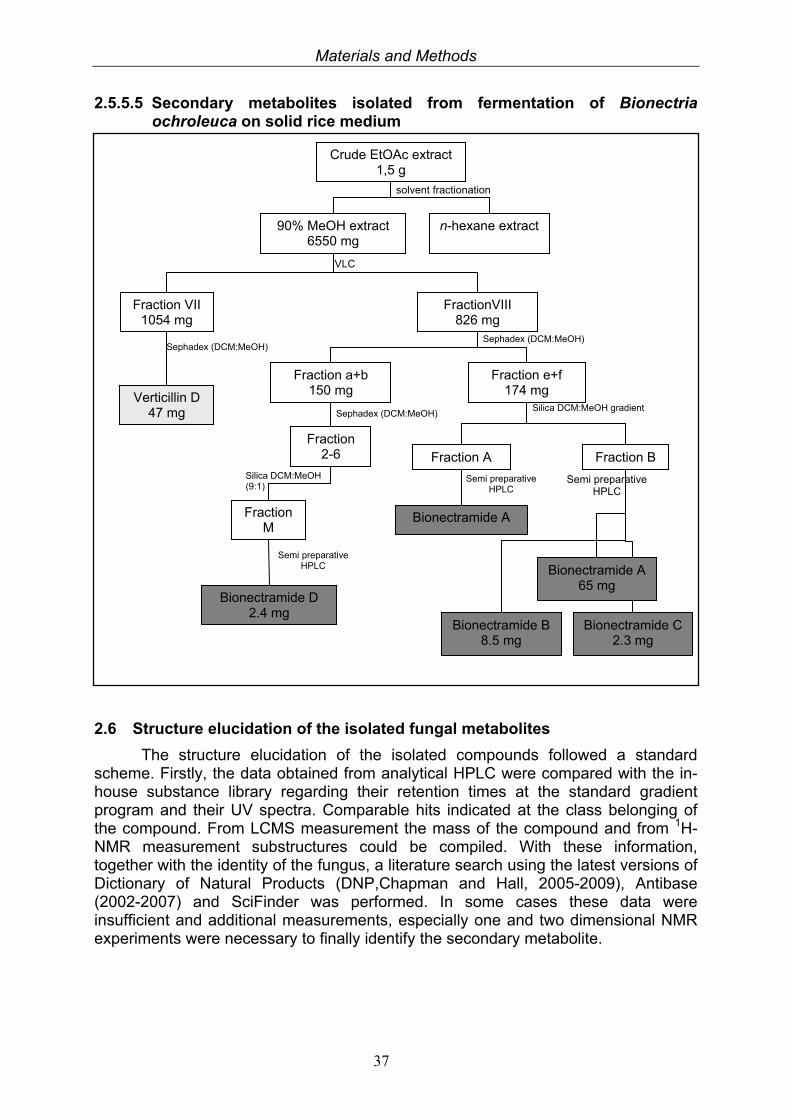
2.5.5.5. Secondary metabolites isolated from fermentation of Bionectria ochroleuca on solid rice medium
37
2.6. Structure elucidation of the isolated fungal metabolites 372.6.1. Mass spectrometry (MS) 38
2.6.1.1. Electron spray ionization mass spectrometry (ESIMS) 382.6.1.2. Liquid chromatography mass spectrometry (LC-MS) 382.6.1.3. High resolution mass spectrometry (HR-MS) 38
2.6.2. Nuclear magnetic resonance spectroscopy (NMR) 392.6.3. Optical activity 392.6.4. Determination of the absolute configuration of amino acids by Marfey’s analysis
40
2.6.5. Determination of absolute stereochemistry by Mosher reaction
40
2.7. Biological assays 412.7.1. Antimicrobial and antifungal activity 412.7.2. Antiviral activity 412.7.3. Toxicity 422.7.4. Biofilm inhibition and anti-infective assay 422.7.5. Cytotoxicity test: Microculture tetrazolium (MTT) assay 422.7.6. Protein kinase assay 43
2.8. Laboratory instruments and chemicals 442.8.1. Laboratory instruments 442.8.2. Laboratory chemicals 46
3. Results 473.1. Bioactivity screening of fungal extracts 483.2. Compounds isolated from the endophytic fungus Cladosporium
sphaerospermum 49
3.2.1. Citrinin (1, known compound) 503.2.2. Quinolactacin A1 (2, known compound) and quinolactacin A2 (3, known compound)
52
3.2.3. Bioactivity test results for compounds isolated from Cladosporium sphaerospermum
54
3.3. Compound isolated from the endophytic fungus Fusarium incarnatum
55
3.3.1. Equisetin (4, known compound) 553.3.2. Bioactivity test results for the isolated compound from Fusarium incarnatum
58
3.4. Compounds isolated from the endophytic fungus Nigrospora sp. 593.4.1. Aloesol (5, known compound) 613.4.2. 8-Hydroxytetrahydroaltersolanol B (6, new compound) 633.4.3. Deoxybostrycin (7, known compound) 673.4.4. Bostrycin (8, known compound) 693.4.5. Tenuazonic acid (9, known compound) 713.4.6. Indole-3-carbaldehyde (10, known compound) 733.4.7. Cyclo(threonylisoleucinyl) (11, new compound) 753.4.8. Bioactivity test results for compounds isolated from Nigrospora sp.
79
3.5. Compounds isolated from the endophytic fungus Alternaria sp. 81
Table of Contents
3.5.1. 2,5-Dimethyl-7-hydroxychromone (12, known compound) 833.5.2. Alternarian acid (13, known compound) 853.5.3. Altenusin (14, known compound) 873.5.4. Altenuene (15, known compound) 893.5.5. 4’-Epialtenuene (16, known compound) 913.5.6. Alternarienonic acid (17, known compound) 933.5.7. Alternariol (18, known compound) 953.5.8. Alternariol-5-methylether (19, known compound) 973.5.9. Altertoxin I (20, known compound) 993.5.10. Alterperylenol (21, known compound) 1013.5.11. Stemphyperylenol (22, known compound) 1033.5.12. Xanalteric acid I (23, new compound) 1063.5.13. Xanalteric acid II (24, new compound) 1083.5.14. Bioactivity test results for compounds isolated from Alternaria sp.
111
3.6. Proof of the fungal origin of the new compounds xanalteric acid I and II
112
3.6.1. Metabolite profiling of Alternaria sp. upon addition of different antibiotics
113
3.6.2. Results of the investigation for bacterial DNA in Alternaria sp. via PCR
114
3.7. Tracing of Alternaria metabolites in the corresponding plant extracts
115
3.8. Results of the fermentation experiments upon addition of epigenetic modifiers
116
3.9. Compounds isolated from the endophytic fungus Bionectria ochroleuca
120
3.9.1. Verticillin D (25, known compound) 1213.9.2. Bionectramide A (26, new compound) 1243.9.3. Bionectramide B (27, new compound) 1293.9.4. Bionectramide C (28, new compound) 1343.9.5. Bionectramide D (29, new compound) 1383.9.6. Bioactivity test results for compounds isolated from Bionectria ochroleuca
141
4. Discussion 1424.1. Endophytic fungi isolated from Chinese mangrove plants 1424.2. Isolated compounds from endophytic fungi 142
4.2.1. Alkaloids 1424.2.1.1. Quinolactacin A1 and A2 1424.2.1.2. Tetramic acids: Tenuazonic acid and equisetin 142
4.2.2. Polyketides 1434.2.2.1. Citrinin 1434.2.2.2. Chromones: Aloesol and 4,5-dimethyl-7- hydroxychromone
144
4.2.2.3. Anthraquinone derivatives 1454.2.2.4. Dibenzopyrones and biphenic acids 1464.2.2.5. Reduced perylenequinones 1474.2.2.6. New xanalteric acids 148
4.2.3. Depsipeptides 1514.3. Endosymbiont-host interactions 1534.4. Regulation of secondary metabolite production by endophytic fungi 154
Table of Contents
5. Summary 1566. Zusammenfassung 1587. List of the isolated compounds 1608. References 1659. Abbreviations 17310. Attachment 17511. Acknowledgements 20112. Curriculum vitae 203
Introduction
1
1. Introduction
1.1 Natural products in drug discovery
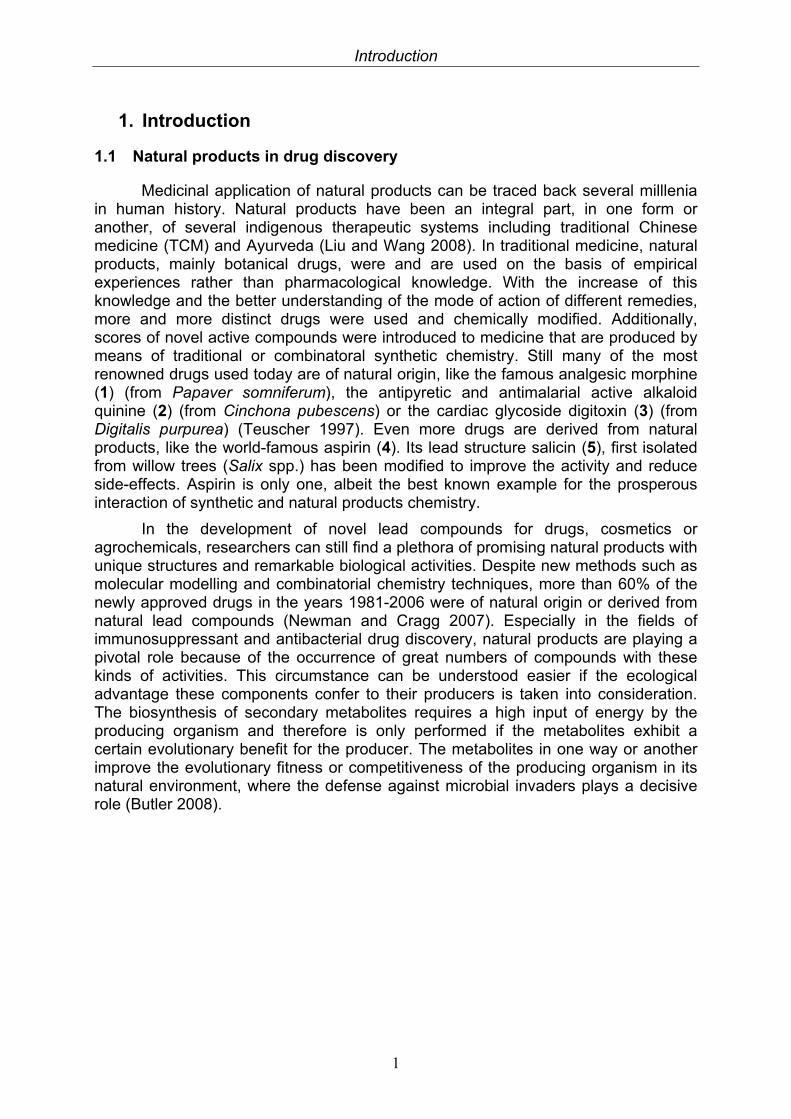
Medicinal application of natural products can be traced back several milllenia in human history. Natural products have been an integral part, in one form or another, of several indigenous therapeutic systems including traditional Chinese medicine (TCM) and Ayurveda (Liu and Wang 2008). In traditional medicine, natural products, mainly botanical drugs, were and are used on the basis of empirical experiences rather than pharmacological knowledge. With the increase of this knowledge and the better understanding of the mode of action of different remedies, more and more distinct drugs were used and chemically modified. Additionally, scores of novel active compounds were introduced to medicine that are produced by means of traditional or combinatoral synthetic chemistry. Still many of the most renowned drugs used today are of natural origin, like the famous analgesic morphine (1) (from Papaver somniferum), the antipyretic and antimalarial active alkaloid quinine (2) (from Cinchona pubescens) or the cardiac glycoside digitoxin (3) (from Digitalis purpurea) (Teuscher 1997). Even more drugs are derived from natural products, like the world-famous aspirin (4). Its lead structure salicin (5), first isolated from willow trees (Salix spp.) has been modified to improve the activity and reduce side-effects. Aspirin is only one, albeit the best known example for the prosperous interaction of synthetic and natural products chemistry.
In the development of novel lead compounds for drugs, cosmetics or agrochemicals, researchers can still find a plethora of promising natural products with unique structures and remarkable biological activities. Despite new methods such as molecular modelling and combinatorial chemistry techniques, more than 60% of the newly approved drugs in the years 1981-2006 were of natural origin or derived from natural lead compounds (Newman and Cragg 2007). Especially in the fields of immunosuppressant and antibacterial drug discovery, natural products are playing a pivotal role because of the occurrence of great numbers of compounds with these kinds of activities. This circumstance can be understood easier if the ecological advantage these components confer to their producers is taken into consideration. The biosynthesis of secondary metabolites requires a high input of energy by the producing organism and therefore is only performed if the metabolites exhibit a certain evolutionary benefit for the producer. The metabolites in one way or another improve the evolutionary fitness or competitiveness of the producing organism in its natural environment, where the defense against microbial invaders plays a decisive role (Butler 2008).
Introduction
2
HO
O
HO
H
HO
H3CO
N
COOH
O O
CH2OH
O
b-D-Glc
O
O
HOOxDxDxD
N
H
N
H
Figure 1.1. Natural products of medicinal importance.
morphine (1) quinine (2)
digitoxin (3)
aspirin (4) salicin (5)
Introduction
3
1.2 Fungi as sources of bioactive products
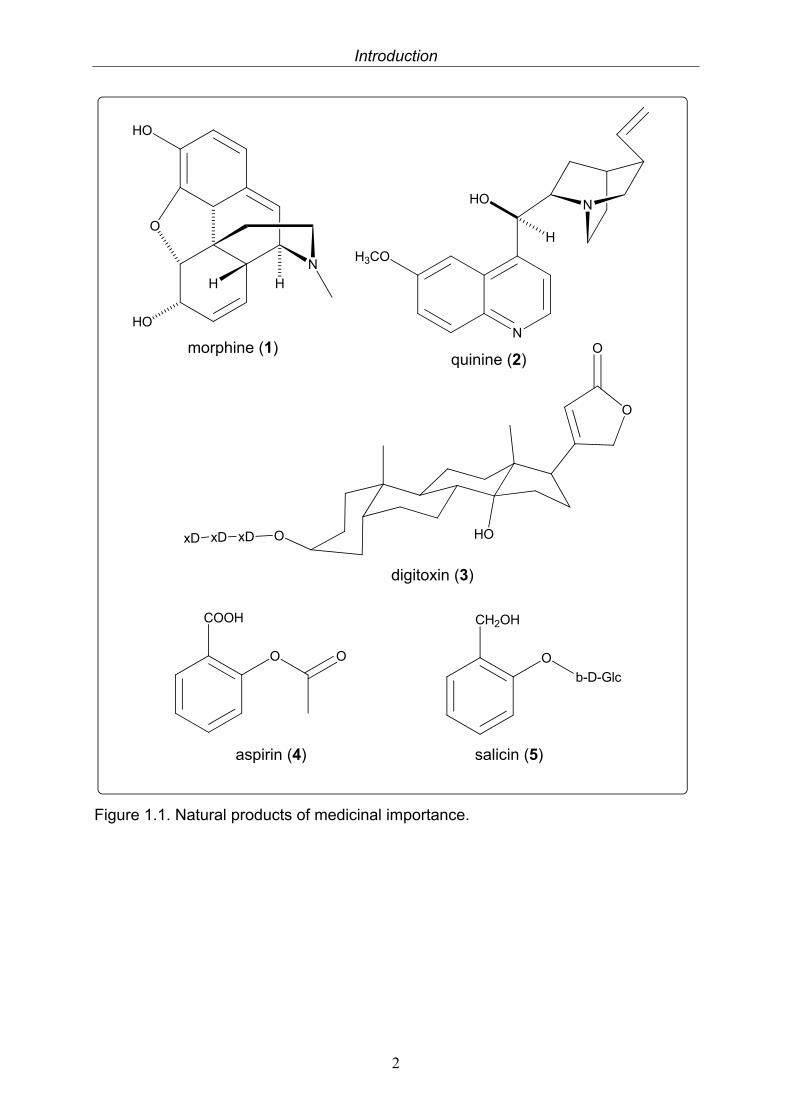
Fungi are ubiquitous occurring, eukaryotic, heterotrophic organisms. Beside the well-known mushrooms, fungal life is found worldwide, in soil samples as well as deep sea vents and arctic ice, and often reveals symbiotic traits. Similar to plants, there is a long history of the utilisation of fungi by mankind as remedies and in every-day life. Nearly 3000 years ago the Mayans used fungi to treat intestinal ailments (Strobel et al. 2004). Without deeper knowledge about the mode of action the transformation by fungi has been used for food production since Neolithic times. The earliest types of fermented food were beer, wine, and leavened bread, followed by the early Chinese who produced fermented soy foods. Since Pasteur’s discovery that fermentation is caused by living cells, investigation of microbes as natural products resources sprung up. But it was not until the discovery of penicillin (6) isolated from Penicillium notatum by Sir Alexander Fleming in 1928 which resulted in a breakthrough in the treatment of bacterial infections, that fungi became an important source of drugs for the treatment of a variety of diseases.
Since then, especially fungi isolated from soil samples have been identified as a rich source of biologically active secondary metabolites. Beside other well known antimicrobial agents like fusidic acid (7) (Godtfredsen et al. 1962) and griseofulvin (8) (Grove et al. 1952), novel semisynthetic antifungal drugs like anidulafungin (9) (Eraxis®) and caspafungin (Cancidas®) are likewise derived from fungal metabolites (Butler 2004). With the discovery of cyclosporine (10, also known as ciclosporin or cylosporin) isolated from Tolypocladium inflatum in 1971, an important step in immunopharmacology was made because this substance prevents rejection after organ or tissue transplantations. Improvements in the field of organ transplantations and treatment of autoimmune diseases are still in progress with the discovery that also known substances such as the fungal metabolite mycophenolic acid (11) (Myfortic®) possess immunosuppressive activities. Cyclosporine exhibits, in addition to its potent immunosuppressant activity pronounced antiviral activity. Therefore it furthermore served as a model for the design of substances like Debio-025, a potential antiviral drug that has successfully passed clinical trials (Butler 2004, Flisiak et al. 2008).
Probably the most economical important fungal metabolites represent antilipidemic drugs collectively known as “statins”, with their parent compounds mevastatin and lovastatin (12) isolated from Penicillium citrinum and Aspergillus terreus, respectively. Statins reduce blood cholesterol levels by inhibiting the rate-limiting enzyme HMG-CoA reductase in the mevalonate pathway of cholesterol synthesis, and are used for the treatment of cardiovascular diseases (Butler 2004, Dewick 2006).
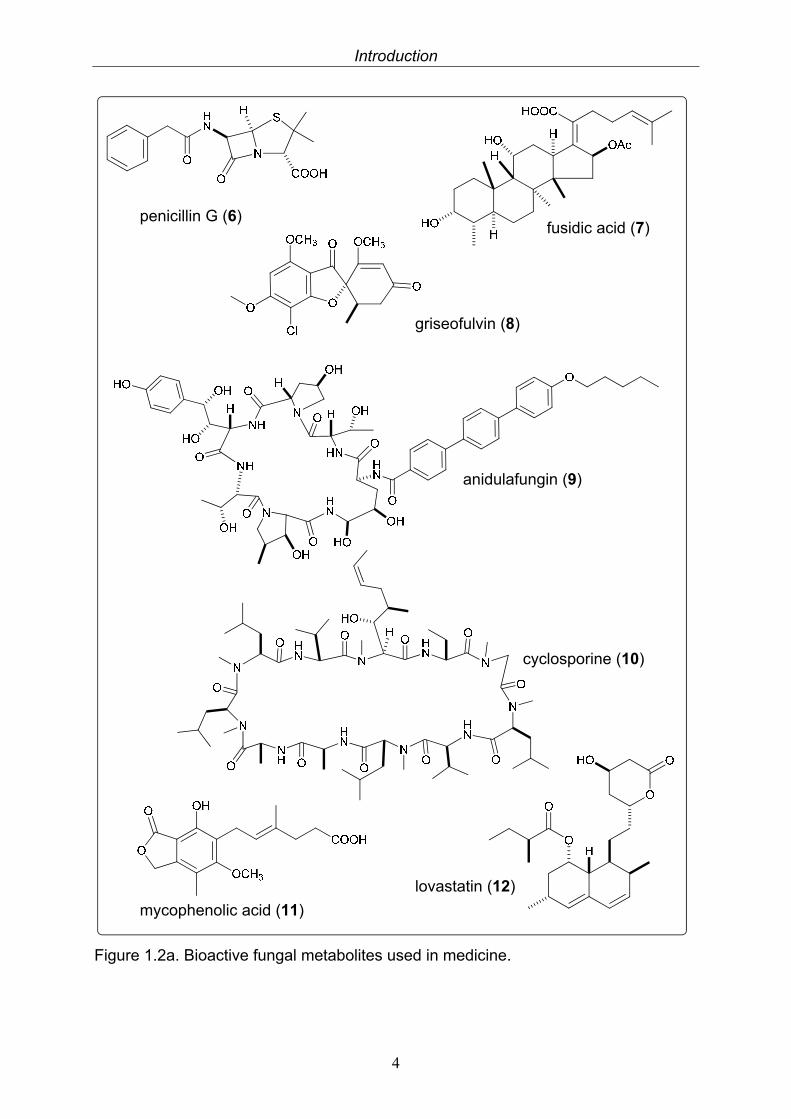
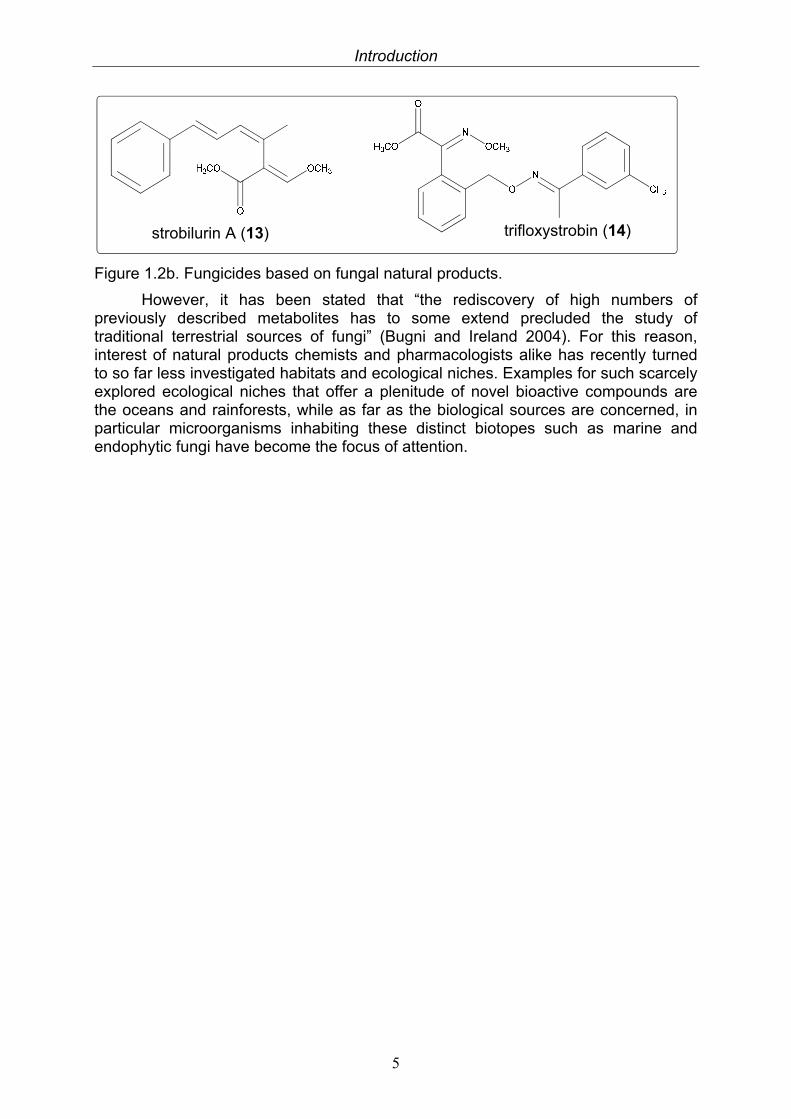
Fungal metabolites are, however, not only indispensable for medicine but are also important for plant protection as demonstrated by the discovery of the strobilurines (13), that were first isolated from Strobilurus sp. and served as lead compounds for synthetic fungicidals such as trifloxystrobin (14) (Flint®) (Balba 2007). The demand for new highly effective agricultural agents to control farm pests and pathogens is enormous, and partly arises from the removal of synthetic compounds from the market because of their toxicity towards the environment, but also from the rising need for food due to a stringent population growth.
Introduction
4
Figure 1.2a. Bioactive fungal metabolites used in medicine.
penicillin G (6) fusidic acid (7)
griseofulvin (8)
anidulafungin (9)
cyclosporine (10)
mycophenolic acid (11)
lovastatin (12)
Introduction
5
Figure 1.2b. Fungicides based on fungal natural products.
However, it has been stated that “the rediscovery of high numbers of previously described metabolites has to some extend precluded the study of traditional terrestrial sources of fungi” (Bugni and Ireland 2004). For this reason, interest of natural products chemists and pharmacologists alike has recently turned to so far less investigated habitats and ecological niches. Examples for such scarcely explored ecological niches that offer a plenitude of novel bioactive compounds are the oceans and rainforests, while as far as the biological sources are concerned, in particular microorganisms inhabiting these distinct biotopes such as marine and endophytic fungi have become the focus of attention.
strobilurin A (13) trifloxystrobin (14)
Introduction
6
1.3 Endophytic fungi
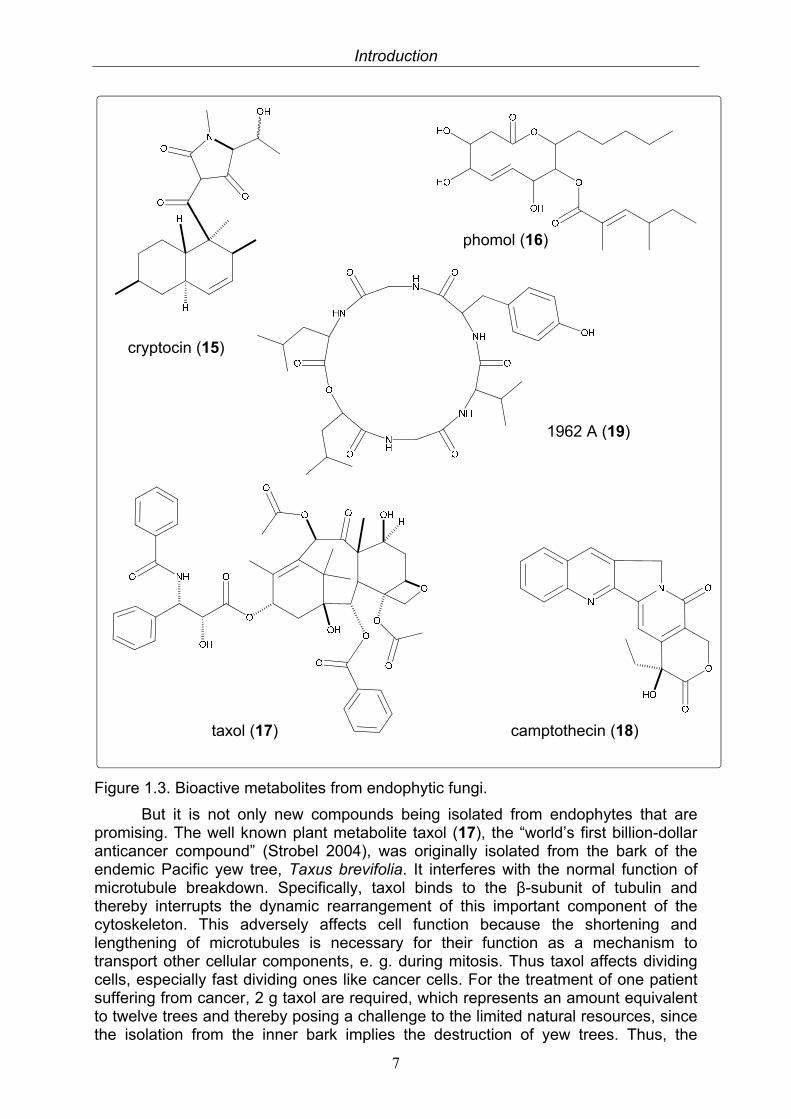
Endophytes are microbes that colonize living, internal tissues of plants without causing any immediate, overt negative effects (Bacon 2000). As almost all vascular plant species appear to be inhabited by endophytic bacteria or fungi, these represent important components of microbial diversity. The relationship between the host plant and its endophyte shows symbiotic characteristics as the endophytic occupant usually obtains nutritients and protection from the host plant and in return profoundly enhances the fitness of the host by producing certain functional metabolites (Tan and Zou 2001). Still, if the host plant is weakened, the endophyte can also become an aggressive saprophyte and thereby reveal the smooth transition between symbiont and opportunistic pathogen (Schulz and Boyle 2005). Fungal endophytes are a polyphyletic group of primarily ascomycetous fungi, whereas basidiomycetes, deuteromycetes and oomycetes are rarely found (Saikonnen et al. 1998, Arnold 2007). Although they do not show host specifity, certain fungal lineages appear with greater frequency in plants representing particular families and thus denote host preference (Cannon and Simmons 2002, Arnold 2007). Consistent with the tremendous diversity of endophytic fungi and their ecological roles is the astounding chemical variety of their secondary metabolites, which often display promising pharmaceutically or agrochemically exploitable activities when tested in various bioassays (Strobel et al. 2004). Due to the world’s urgent need for new antibiotics, chemotherapeutic agents and agrochemicals to cope with the growing medicinal and environmental problems facing mankind, growing interest is taken into the research on the chemistry of endophytic fungi. Whereas between 1987 and 2000 approximately 140 new natural products were isolated from endophytic fungi (Tan and Zou 2001), a similar number was subsequently characterised in half of this time span, i.e. between 2000 and 2006 (Zhang et al. 2006). Many of these exhibit interesting activity profiles. Cryptocin (15), for example, is an tetramic acid isolated from the endophytic fungus Cryptosporiopsis quercina, an endophyte of Tripterigeum wilfordii, that possesses potent activity against the world’s worst plant pests Pyricularia oryzae and other plant pathogenic fungi, advocating it for possible agrochemical usage (Li et al. 2000). From the medicinal plant Erythrina crista-galli the endophyte Phomopsis sp. was isolated, which produced the anti-inflammatoriy as well as antifungally and antibacterially active polyketide lactone, phomol (16) (Weber et al. 2004).
Introduction
7
Figure 1.3. Bioactive metabolites from endophytic fungi.
But it is not only new compounds being isolated from endophytes that are promising. The well known plant metabolite taxol (17), the “world’s first billion-dollar anticancer compound” (Strobel 2004), was originally isolated from the bark of the endemic Pacific yew tree, Taxus brevifolia. It interferes with the normal function of microtubule breakdown. Specifically, taxol binds to the β-subunit of tubulin and thereby interrupts the dynamic rearrangement of this important component of the cytoskeleton. This adversely affects cell function because the shortening and lengthening of microtubules is necessary for their function as a mechanism to transport other cellular components, e. g. during mitosis. Thus taxol affects dividing cells, especially fast dividing ones like cancer cells. For the treatment of one patient suffering from cancer, 2 g taxol are required, which represents an amount equivalent to twelve trees and thereby posing a challenge to the limited natural resources, since the isolation from the inner bark implies the destruction of yew trees. Thus, the
taxol (17) camptothecin (18)
1962 A (19)
cryptocin (15)
phomol (16)
Introduction
8
demand for taxol greatly exceeds the supply that can be sustained by isolation from its natural source and alternative sources of the drug have been sought for a long time. Although the highly functionalized, polycyclic diterpene has been prepared by total synthesis, the process is too complex and not economically feasible. Currently, the supply of the compound is achieved by a successfully implied partial synthetic route based on baccatin III or its 10-deacetyl congener, which are isolated from the needles of other Taxus species and thus from a renewable resource. However, the extraction process of these precursors is tedious and costly. In the ongoing search for alternative sources of taxol, the group of Gary Strobel discovered taxol production in a hitherto undescribed endophytic fungus associated with Taxus brevifolia, identified as Taxomyces andreanae (Stierle et al. 1993). Although initially controversial, these findings prompted further studies, and it is nowadays an emerging picture that the ability to produce taxol upon fermentation seems to be a rather widespread feature among endophytic fungi. So far, more than 10 different fungal strains from at least 6 different host plants, most of them only distantly (if at all) related to Taxus, have been identified. However, it is worth mentioning that in all cases the resulting yields are minuscule, so far preventing any commercial exploitation (Strobel et al. 2004).
Similar to the taxol case, the endophytic fungus Entrophospora sp. associated with Nothapodytes foetida was found to produce the cytotoxic plant alkaloid camptothecin (18) (Puri et al. 2005). The substance which was first described from the Chinese medicinal plant Camptotheca acuminata in 1966, exhibits remarkable anticancer activity by inhibition of the DNA enzyme topoisomerase I. Due to its low solubility and adverse drug reaction it is not used as an anticancer drug itself, but served as a drug lead and precursor for the semi-synthetic antiproliferatic drugs topotecan and irinotecan. Optimization of the fermentation conditions of the endophytic fungus may lead to the development of an economically and eco-friendly process for the production of camptothecin that could overcome the ever demanding supply problem (Puri et al. 2005)
Thus, the ability to produce pharmacologically important natural products previously only known from plant sources is occasionally also inherent to endophytic fungi, whith further examples including podophyllotoxin (Puri et al. 2006, Kour et al. 2008) which will undoubtedly prompt future research into endophytic fungi.
Introduction
9
1.4 Selection of promising sources for the isolation of endophytic fungi
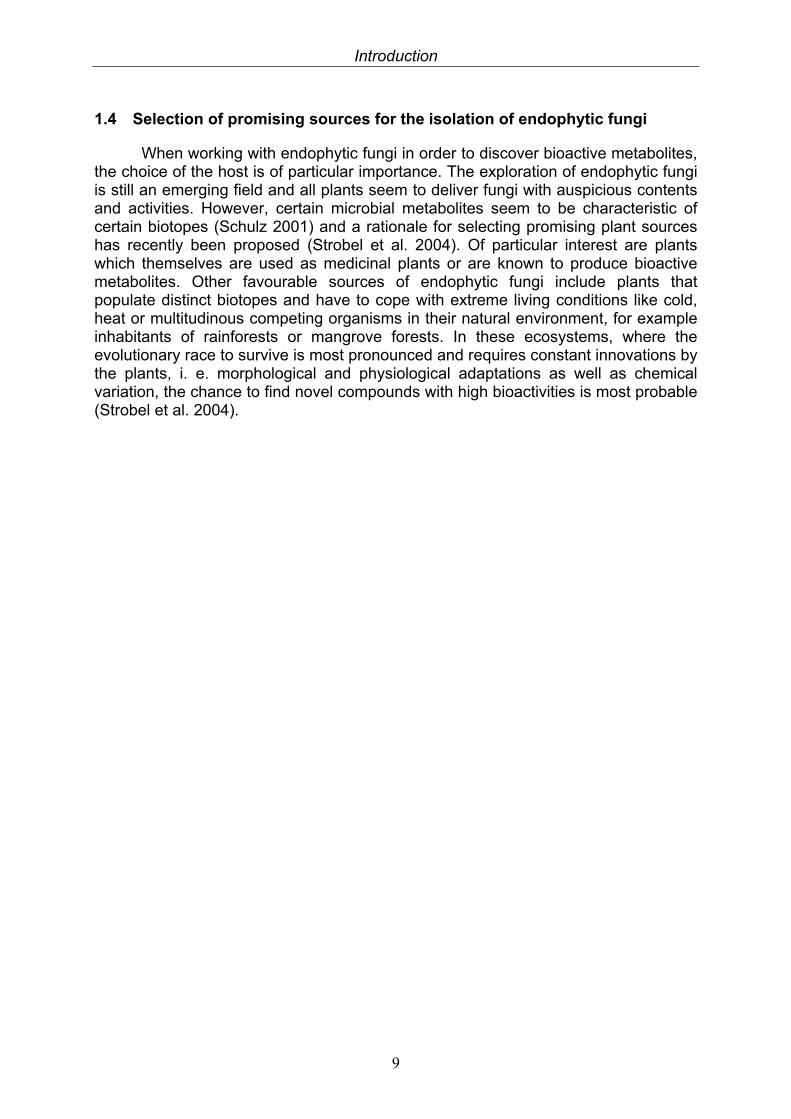
When working with endophytic fungi in order to discover bioactive metabolites, the choice of the host is of particular importance. The exploration of endophytic fungi is still an emerging field and all plants seem to deliver fungi with auspicious contents and activities. However, certain microbial metabolites seem to be characteristic of certain biotopes (Schulz 2001) and a rationale for selecting promising plant sources has recently been proposed (Strobel et al. 2004). Of particular interest are plants which themselves are used as medicinal plants or are known to produce bioactive metabolites. Other favourable sources of endophytic fungi include plants that populate distinct biotopes and have to cope with extreme living conditions like cold, heat or multitudinous competing organisms in their natural environment, for example inhabitants of rainforests or mangrove forests. In these ecosystems, where the evolutionary race to survive is most pronounced and requires constant innovations by the plants, i. e. morphological and physiological adaptations as well as chemical variation, the chance to find novel compounds with high bioactivities is most probable (Strobel et al. 2004).
Introduction
10
1.5 Mangroves
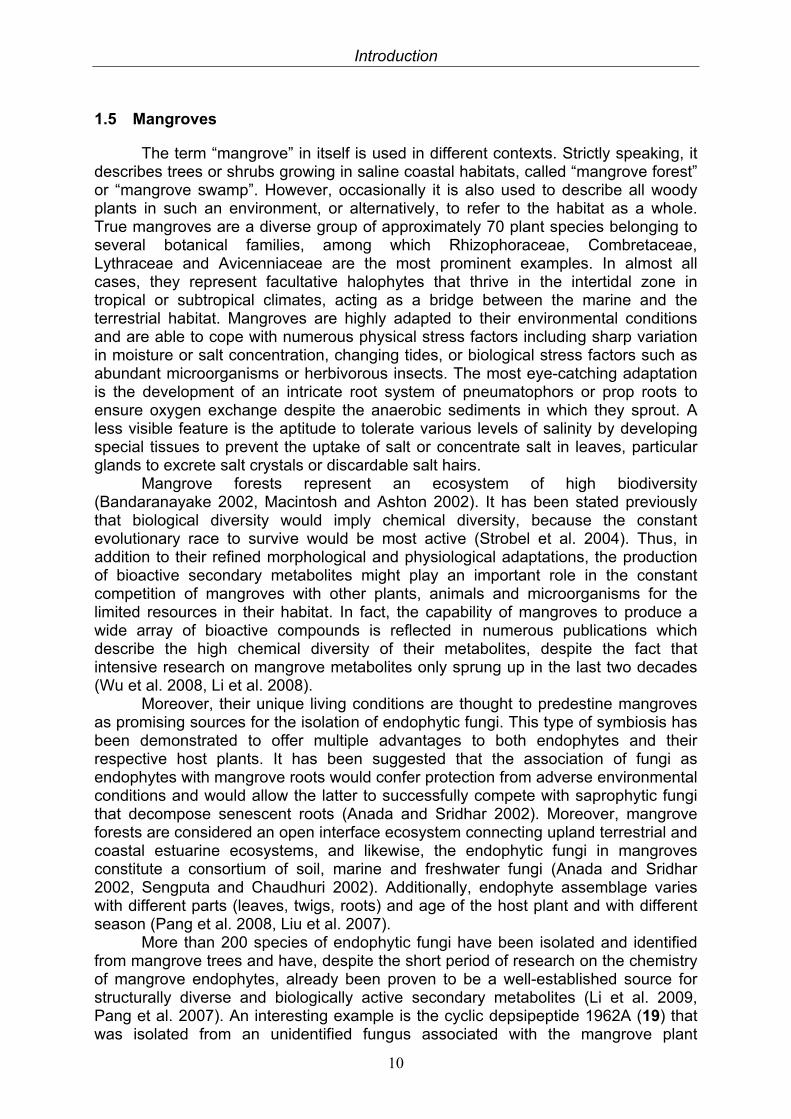
The term “mangrove” in itself is used in different contexts. Strictly speaking, it describes trees or shrubs growing in saline coastal habitats, called “mangrove forest” or “mangrove swamp”. However, occasionally it is also used to describe all woody plants in such an environment, or alternatively, to refer to the habitat as a whole. True mangroves are a diverse group of approximately 70 plant species belonging to several botanical families, among which Rhizophoraceae, Combretaceae, Lythraceae and Avicenniaceae are the most prominent examples. In almost all cases, they represent facultative halophytes that thrive in the intertidal zone in tropical or subtropical climates, acting as a bridge between the marine and the terrestrial habitat. Mangroves are highly adapted to their environmental conditions and are able to cope with numerous physical stress factors including sharp variation in moisture or salt concentration, changing tides, or biological stress factors such as abundant microorganisms or herbivorous insects. The most eye-catching adaptation is the development of an intricate root system of pneumatophors or prop roots to ensure oxygen exchange despite the anaerobic sediments in which they sprout. A less visible feature is the aptitude to tolerate various levels of salinity by developing special tissues to prevent the uptake of salt or concentrate salt in leaves, particular glands to excrete salt crystals or discardable salt hairs.
Mangrove forests represent an ecosystem of high biodiversity (Bandaranayake 2002, Macintosh and Ashton 2002). It has been stated previously that biological diversity would imply chemical diversity, because the constant evolutionary race to survive would be most active (Strobel et al. 2004). Thus, in addition to their refined morphological and physiological adaptations, the production of bioactive secondary metabolites might play an important role in the constant competition of mangroves with other plants, animals and microorganisms for the limited resources in their habitat. In fact, the capability of mangroves to produce a wide array of bioactive compounds is reflected in numerous publications which describe the high chemical diversity of their metabolites, despite the fact that intensive research on mangrove metabolites only sprung up in the last two decades (Wu et al. 2008, Li et al. 2008).
Moreover, their unique living conditions are thought to predestine mangroves as promising sources for the isolation of endophytic fungi. This type of symbiosis has been demonstrated to offer multiple advantages to both endophytes and their respective host plants. It has been suggested that the association of fungi as endophytes with mangrove roots would confer protection from adverse environmental conditions and would allow the latter to successfully compete with saprophytic fungi that decompose senescent roots (Anada and Sridhar 2002). Moreover, mangrove forests are considered an open interface ecosystem connecting upland terrestrial and coastal estuarine ecosystems, and likewise, the endophytic fungi in mangroves constitute a consortium of soil, marine and freshwater fungi (Anada and Sridhar 2002, Sengputa and Chaudhuri 2002). Additionally, endophyte assemblage varies with different parts (leaves, twigs, roots) and age of the host plant and with different season (Pang et al. 2008, Liu et al. 2007).
More than 200 species of endophytic fungi have been isolated and identified from mangrove trees and have, despite the short period of research on the chemistry of mangrove endophytes, already been proven to be a well-established source for structurally diverse and biologically active secondary metabolites (Li et al. 2009, Pang et al. 2007). An interesting example is the cyclic depsipeptide 1962A (19) that was isolated from an unidentified fungus associated with the mangrove plant
Introduction
11
Kandelia candel. It exhibited cytotoxic activity against human breast cancer MCF-7 cells when tested in the MTT assay (Huang et al. 2007). Other examples are new polyketides that were isolated from a Penicillium sp. associated with the mangrove plant Aegiceras corniculatum. Upon biological screening, two of them exhibited cytotoxic activities (Lin et al. 2007).
These examples illustrate the enormous chemical diversity and biological potential of endophytic, particularly mangrove-derived, endophytic fungi. Thus they represent an interesting source of new lead structures for medical and agrochemical applications.
Introduction
12
1.6 Regulation of secondary metabolite production by endophytic fungi
Fungi are known to synthesize a wide variety of secondary metabolites, low molecular weight molecules that are thought to aid the fungus in competing successfully with other organisms in its natural habitat. Many of these substances exhibit bioactive properties and have therefore been adopted by humans for use as pharmaceuticals such as antibiotics, cholesterol-lowering agents, tumor inhibitors and immunosuppressants for organ transplantations. Hence there is a particular desire to achieve high productivity of fungal fermentation. However, typical fungal fermentation methods such as axenic shake or static cultures on artificially defined media are poor surrogates for mimicking an organism's native habitat. The majority of these compounds, especially those having toxic or inhibitory effects to other organisms, is not required for growth or development of the producing organism under laboratory conditions. Fungi are able to turn off the energetically costly process of secondary metabolite production under certain environmental conditions (Shwab 2007).
In order to exploit the true biochemical potential of fungi, the effect of physiological growth conditions have long been studied. However, they are still far from completely explained. Optimal conditions for biosynthesis of secondary metabolites have been found to be not necessarily identical to those for growth, and to vary among different microorganisms and different metabolic pathways. The regulation of fungal secondary metabolism appears to be responsive to general environmental factors, such as carbon and nitrogen sources, temperature, light, and pH (Knight 2003).
An attempt to describe and take advantage of this phenomenon is the so-called “OSMAC”-approach (One Strain, Many Compounds). The idea of this approach is that the systematic alteration of easily accessible cultivation parameters like media composition, aeration and temperature increases the number of secondary metabolites available from one microbial source (Bode et al. 2002). The growth of mangrove-derived endophytic fungi in particular has been demonstrated to be dependent on the salinity of the fermentation medium (Teuscher 2005). Another example is the advantageous effect of treatment with metal ions, especially zinc, on Aspergillus flavus: It was shown in an experiment to not only stimulate the fungal growth, but also its aflatoxin production (Cuero et al. 2003). The goal of investigation of microorganisms is not only a high production of known metabolites, but even more the detection of new bioactive compounds. Accordingly, strategies that discover and exploit the full metabolic potential of newly investigated microorganisms are being developed in order to maximize their chemical diversity. Investigations of bacteria have revealed that antibiotics act not only as growth inhibitors of bacteria, but that subinhibitory doses can also exhibit more diverse effects on other microorganisms. The addition of specific antibiotics, namely tobramycin, tetracycline and norfloxacin, in concentrations below their minimal inhibitory concentrations (MICs), to cultures of Pseudomonas aeruginosa was proven to induce the formation of biofilm, a behavior that could be beneficial for the microbe in its natural environment (Linares 2006). Comparable mechanisms have been shown for other bacteria and antibiotics in recent years. More and more evidence is found to prove the suggestion that antibiotics, especially when applied at subinhibitory concentrations, could promote metabolic variability of bacteria (Couce 2009), possibly mimicking the presence of other competing microorganisms. A recent study investigated the effect of supplement with subinhibitory concentrations of antibiotics on the metabolism of a marine Streptomyces sp. The pattern of secondary
Introduction
13
metabolites produced depended on the applied antibiotic. New phenazines were produced by the actinomycete, and one of them, streptophenazine E, only in the presence of tetracycline. Upon addition of tetracycline streptoephenazines F and G were induced, while mainly streptophenazine H was formed when applying bacitracin (Mitova et al. 2008).
Similar effects were examined in cultures of Candida albicans. Exposure to subinhibitory concentrations of the antifungal agent fluconazole resulted in enhanced extracellular production of secreted aspartyl proteinase (SAP) and thus in an increased virulence of the fungus (Wu et al. 2000, Barelle et al. 2008). Green fluorescent protein (GFP)-tagged promoters showed that the presence of subinhibitory concentrations of fluconazole also lead to an increase of the fluorescence in the filaments.
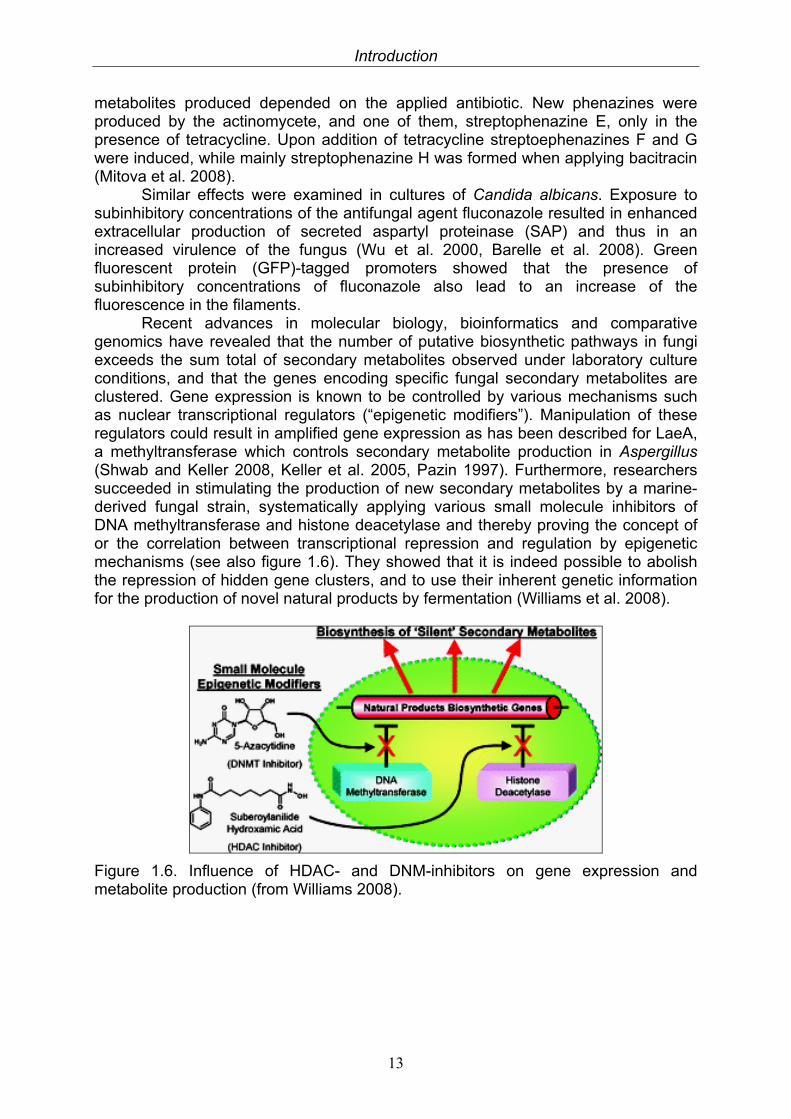
Recent advances in molecular biology, bioinformatics and comparative genomics have revealed that the number of putative biosynthetic pathways in fungi exceeds the sum total of secondary metabolites observed under laboratory culture conditions, and that the genes encoding specific fungal secondary metabolites are clustered. Gene expression is known to be controlled by various mechanisms such as nuclear transcriptional regulators (“epigenetic modifiers”). Manipulation of these regulators could result in amplified gene expression as has been described for LaeA, a methyltransferase which controls secondary metabolite production in Aspergillus (Shwab and Keller 2008, Keller et al. 2005, Pazin 1997). Furthermore, researchers succeeded in stimulating the production of new secondary metabolites by a marine-derived fungal strain, systematically applying various small molecule inhibitors of DNA methyltransferase and histone deacetylase and thereby proving the concept of or the correlation between transcriptional repression and regulation by epigenetic mechanisms (see also figure 1.6). They showed that it is indeed possible to abolish the repression of hidden gene clusters, and to use their inherent genetic information for the production of novel natural products by fermentation (Williams et al. 2008).
Figure 1.6. Influence of HDAC- and DNM-inhibitors on gene expression and metabolite production (from Williams 2008).
Introduction
14
1.7 Aim and scope of this study
Mangrove-derived fungi so far are still poorly investigated and thus represent a promising source of chemically new compounds with huge pharmaceutical and agrochemical potential.
The aim of this study was the investigation of bioactive metabolites of endophytic fungi derived from mangrove plants of the South Chinese Sea. In order to select the most promising fungal strains, the isolated fungi were grown on a small scale basis in liquid Wickerham medium and extracted with EtOAc. Based on the results of chemical and biological screening, five fungal strains, Cladosporium sphaerospermum, Fusarium incarnatum, Nigrospora sp., Alternaria sp. and Bionectria ochroleuca were chosen for further workup.
The selected strains were grown in liquid Wickerham medium and on solid rice medium and extracted with organic solvents, followed by fractionation and purification using various chromatographic techniques. Fractions and pure compounds were analyzed by HPLC-DAD and LSMS for their purity, UV spectra, molecular weights and fragmentation patterns. The structures of the metabolites were elucidated using state-of-the-art one- and two-dimensional NMR techniques. Additionally, selected compounds were derivatized to identify their absolute stereochemistry.
Pure compounds were subjected to various bioassays such as antimicrobial, cytotoxic and protein kinase inhibitory activities to determine their pharmaceutical potential. Bioassays were conducted in cooperation with SeaLife Pharma, Austria, Prof. U. Hentschel, Würzburg, Prof. W. E. G. Müller, Mainz and ProQinase, Freiburg.
In order to evaluate the effects of altering fermentation conditions on the productivity of endophytic fungi, substances that are known to be epigenetic modifiers were added to the cultures of two selected strains.
Materials and Methods
15
2. Materials and Methods
2.1 Biological material
2.1.1 Field trip and sample collection
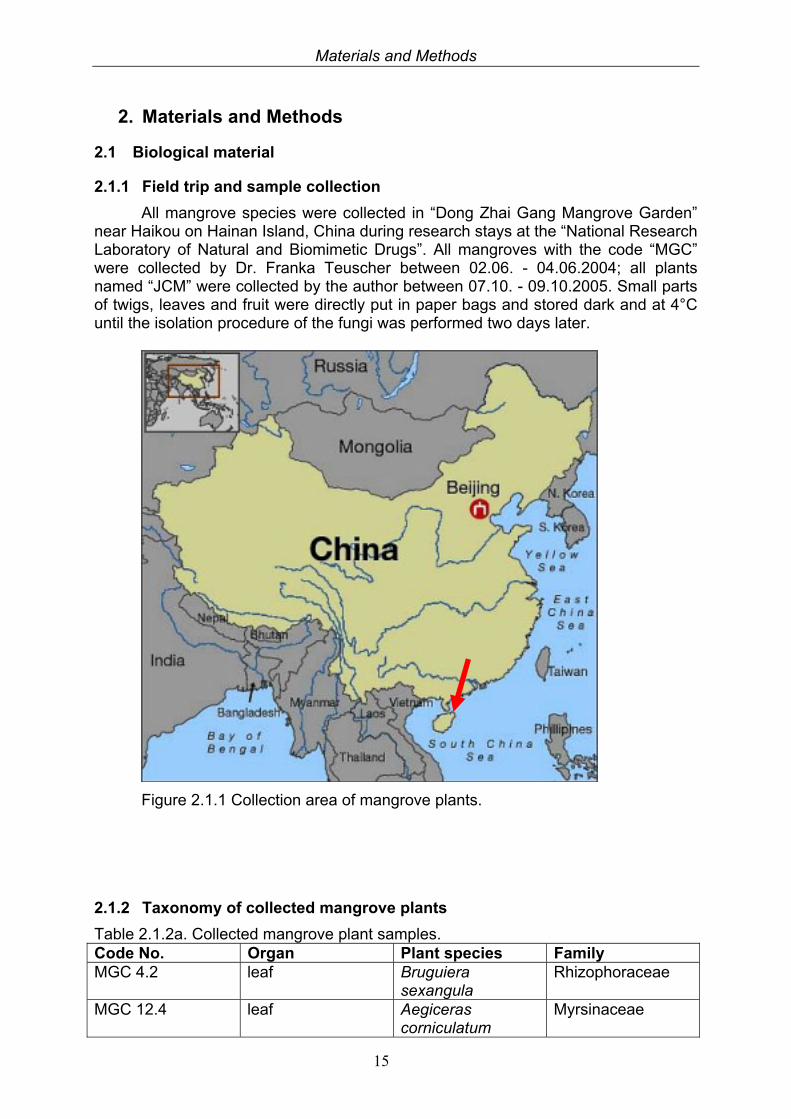
All mangrove species were collected in “Dong Zhai Gang Mangrove Garden” near Haikou on Hainan Island, China during research stays at the “National Research Laboratory of Natural and Biomimetic Drugs”. All mangroves with the code “MGC” were collected by Dr. Franka Teuscher between 02.06. - 04.06.2004; all plants named “JCM” were collected by the author between 07.10. - 09.10.2005. Small parts of twigs, leaves and fruit were directly put in paper bags and stored dark and at 4°C until the isolation procedure of the fungi was performed two days later.
Figure 2.1.1 Collection area of mangrove plants.
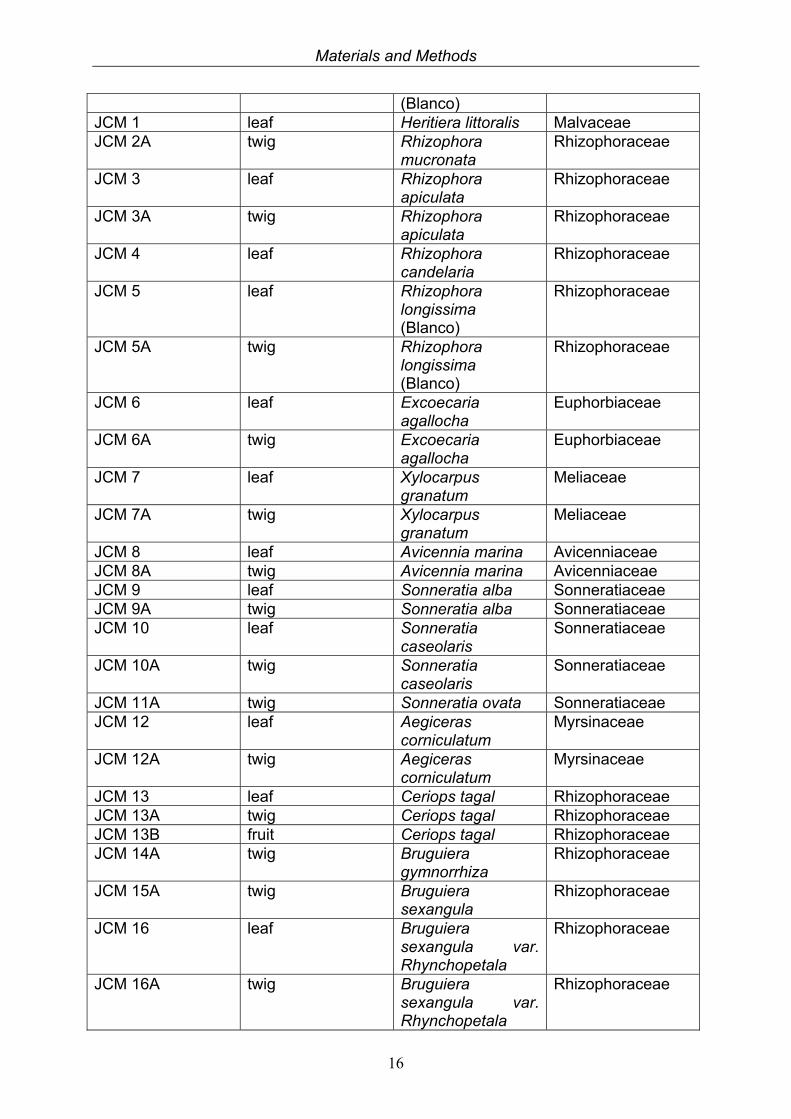
2.1.2 Taxonomy of collected mangrove plants
Table 2.1.2a. Collected mangrove plant samples. Code No. Organ Plant species Family MGC 4.2 leaf Bruguiera
sexangula Rhizophoraceae
MGC 12.4 leaf Aegiceras corniculatum
Myrsinaceae
Materials and Methods
16
(Blanco) JCM 1 leaf Heritiera littoralis Malvaceae JCM 2A twig Rhizophora
mucronata Rhizophoraceae
JCM 3 leaf Rhizophora apiculata
Rhizophoraceae
JCM 3A twig Rhizophora apiculata
Rhizophoraceae
JCM 4 leaf Rhizophora candelaria
Rhizophoraceae
JCM 5 leaf Rhizophora longissima (Blanco)
Rhizophoraceae
JCM 5A twig Rhizophora longissima (Blanco)
Rhizophoraceae
JCM 6 leaf Excoecaria agallocha
Euphorbiaceae
JCM 6A twig Excoecaria agallocha
Euphorbiaceae
JCM 7 leaf Xylocarpus granatum
Meliaceae
JCM 7A twig Xylocarpus granatum
Meliaceae
JCM 8 leaf Avicennia marina Avicenniaceae JCM 8A twig Avicennia marina Avicenniaceae JCM 9 leaf Sonneratia alba Sonneratiaceae JCM 9A twig Sonneratia alba Sonneratiaceae JCM 10 leaf Sonneratia
caseolaris Sonneratiaceae
JCM 10A twig Sonneratia caseolaris
Sonneratiaceae
JCM 11A twig Sonneratia ovata Sonneratiaceae JCM 12 leaf Aegiceras
corniculatum Myrsinaceae
JCM 12A twig Aegiceras corniculatum
Myrsinaceae
JCM 13 leaf Ceriops tagal Rhizophoraceae JCM 13A twig Ceriops tagal Rhizophoraceae JCM 13B fruit Ceriops tagal Rhizophoraceae JCM 14A twig Bruguiera
gymnorrhiza Rhizophoraceae
JCM 15A twig Bruguiera sexangula
Rhizophoraceae
JCM 16 leaf Bruguiera sexangula var. Rhynchopetala
Rhizophoraceae
JCM 16A twig Bruguiera sexangula var. Rhynchopetala
Rhizophoraceae
Materials and Methods
17
JCM 17 leaf Kandelia candel Rhizophoraceae JCM 18 leaf Lumnitzera littorea Combretaceae JCM 19 leaf Lumnitzera
racemosa Combretaceae
JCM 19A twig Lumnitzera racemosa
Combretaceae
JCM 20 leaf Barringtonia racemosa Roxb.
Lecythidaceae
JCM 20A twig Barringtonia racemosa Roxb.
Lecythidaceae
JCM 21 leaf Nypa futicans Arecaceae
Table 2.1.2b. Collected mangrove associated plant samples. Code No. Organ Plant species Family JCM 22 leaf Pluchea indica Asteraceae JCM 23 leaf La gong mu
2.1.3 Taxonomy of isolated fungi
Table 2.1.3. Taxonomy of isolated fungi. Code No. Fungal species Synonyms Family
MGC 4.2 Nigrospora sp. Khuskia sp.,
Basisporium sp., Dichotomella sp.
Trichosphaeriaceae
MGC 12.4 Cladosporium
sphaerospermum Davidiellaceae
JCM 2A4 Pestalotiopsis sp. Pestalotia sp., Broomella
sp., Monochaetia sp., Truncatella sp.
Amphisphaeriaceae
JCM 3A3 Pestalotiopsis sp. Amphisphaeriaceae JCM 9.2 Alternaria sp. Lewia sp. Pleosporaceae
JCM 9.4 Phoma sp. Leptosphaerulina sp.,
Didymella sp., Pseudoplea sp.
Pleosporaceae
JCM 10.2 Pestalotiopsis
virgatula Pestalotia virgatula Amphisphaeriaceae
JCM 10.3 Bionectria sp. Hypocreaceae
JCM 10.4 Glomerella cingulata
Colletotrichum gloeosporioides
Glomerellaceae
JCM 19.1 Alternaria sp. Lewia sp. Pleosporaceae JCM 19.2 JCM 19.7
Phomopsis sp. Diaporthe sp. Pleosporaceae
JCM 19.4 Glomerella sp. Colletotrichum sp. Glomerellaceae JCM 19.6 Corynespora sp. Corynesporascaceae
JCM 19.8 Neofusicoccum
parvum Fusicoccum parvum Botryosphaeriaceae
JCM 22.1 Fusarium F. semitectum, F. Hypocreaceae
Materials and Methods
18
incarnatum pallidoroseum
JCM 23.3 Corynespora
cassiicola Helminthosporium vignicola Corynesporascaceae
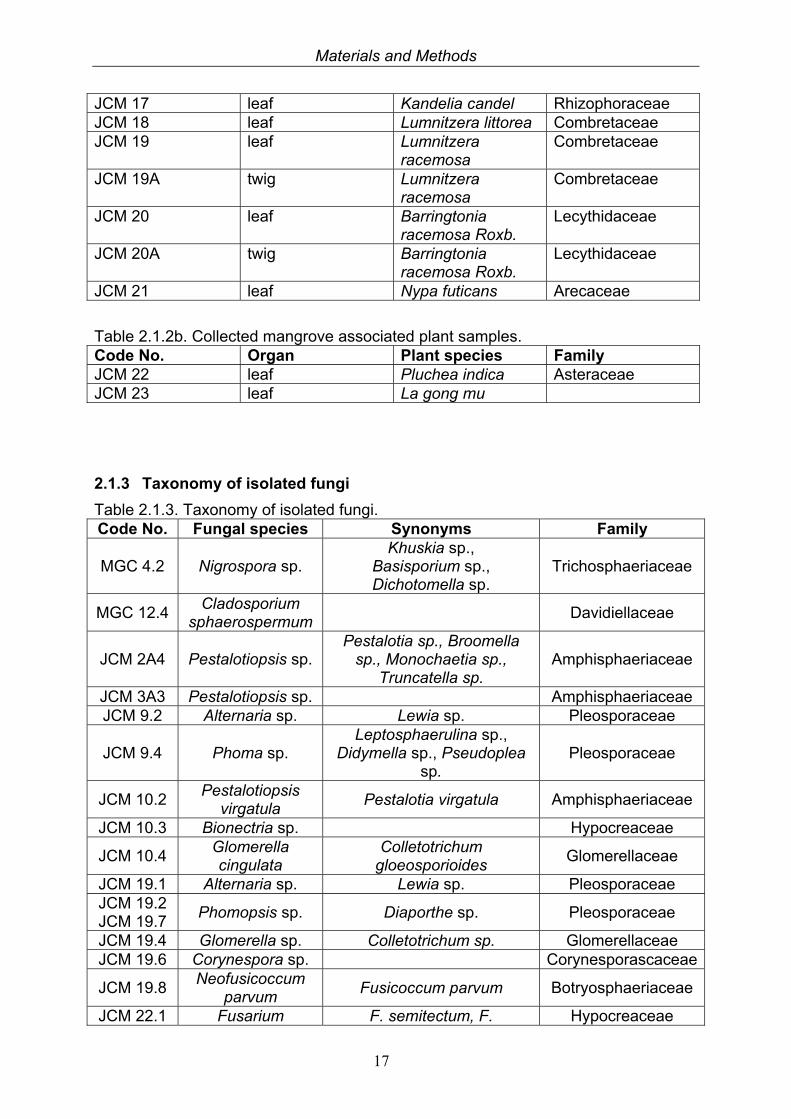
2.1.4 Endophytic fungi worked on during the study
Figure 2.1.4a. Cladosporium sphaerospermum (A: Aegiceras corniculatum B: pure strain in liquid Wickerham medium).
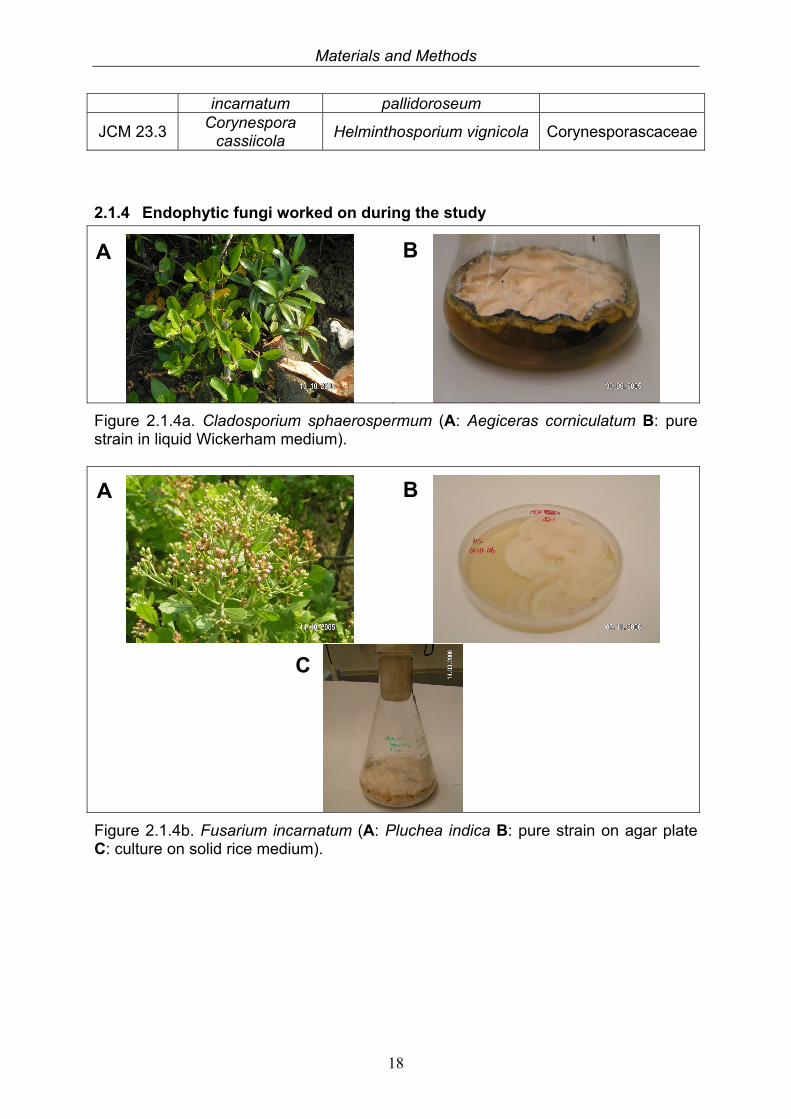
Figure 2.1.4b. Fusarium incarnatum (A: Pluchea indica B: pure strain on agar plate C: culture on solid rice medium).
A B
C
A B
Materials and Methods
19
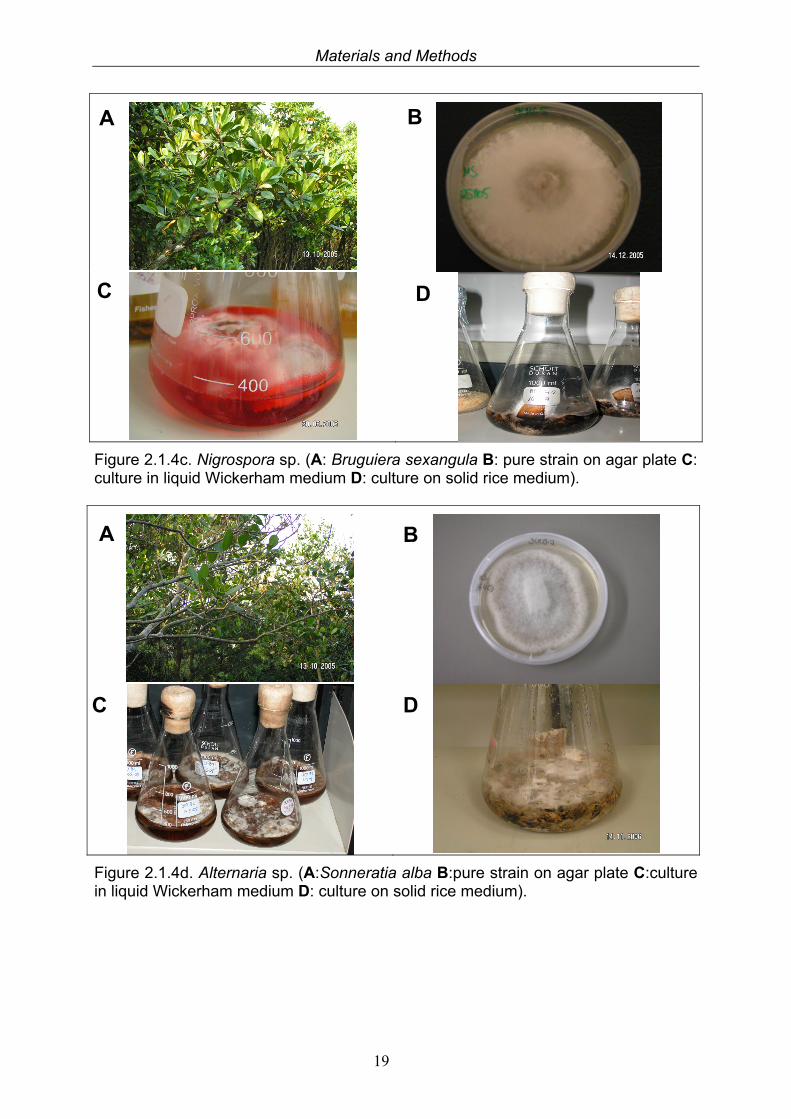
Figure 2.1.4c. Nigrospora sp. (A: Bruguiera sexangula B: pure strain on agar plate C: culture in liquid Wickerham medium D: culture on solid rice medium).
Figure 2.1.4d. Alternaria sp. (A:Sonneratia alba B:pure strain on agar plate C:culture in liquid Wickerham medium D: culture on solid rice medium).
A B
C D
A B
DC
Materials and Methods
20
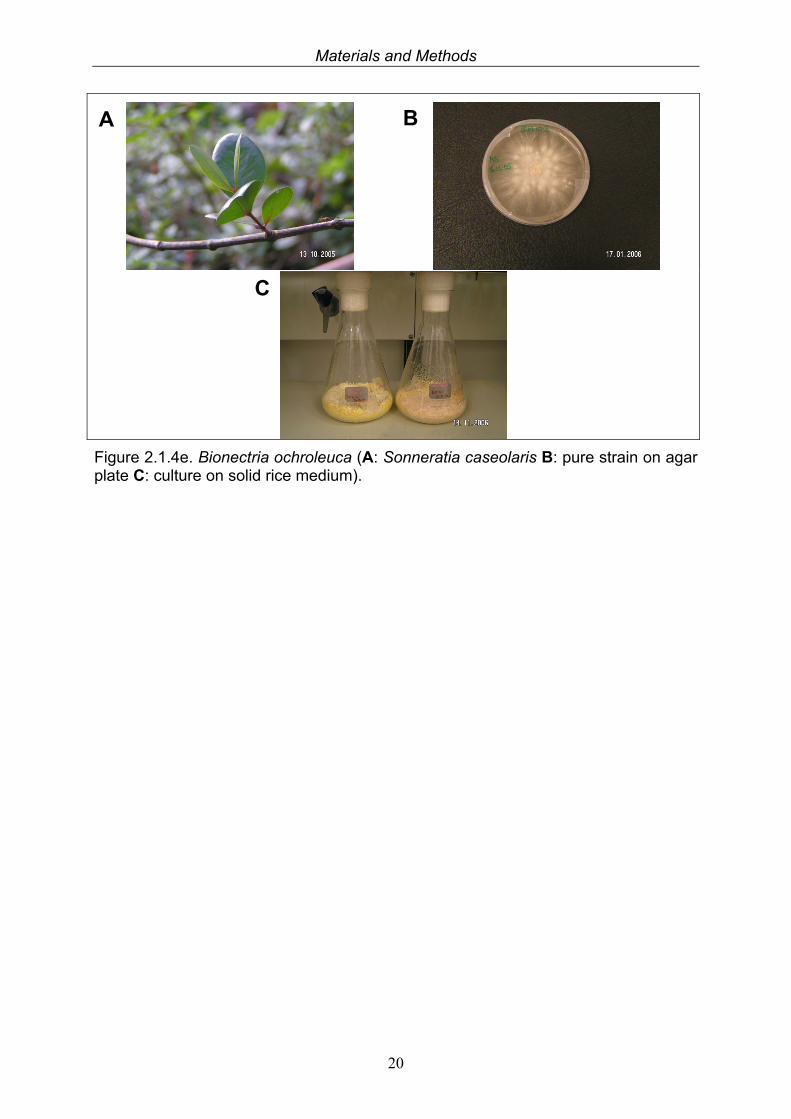
Figure 2.1.4e. Bionectria ochroleuca (A: Sonneratia caseolaris B: pure strain on agar plate C: culture on solid rice medium).
A B
C
Materials and Methods
21
2.2 Isolation and cultivation of endophytic fungi
2.2.1 Composition of media
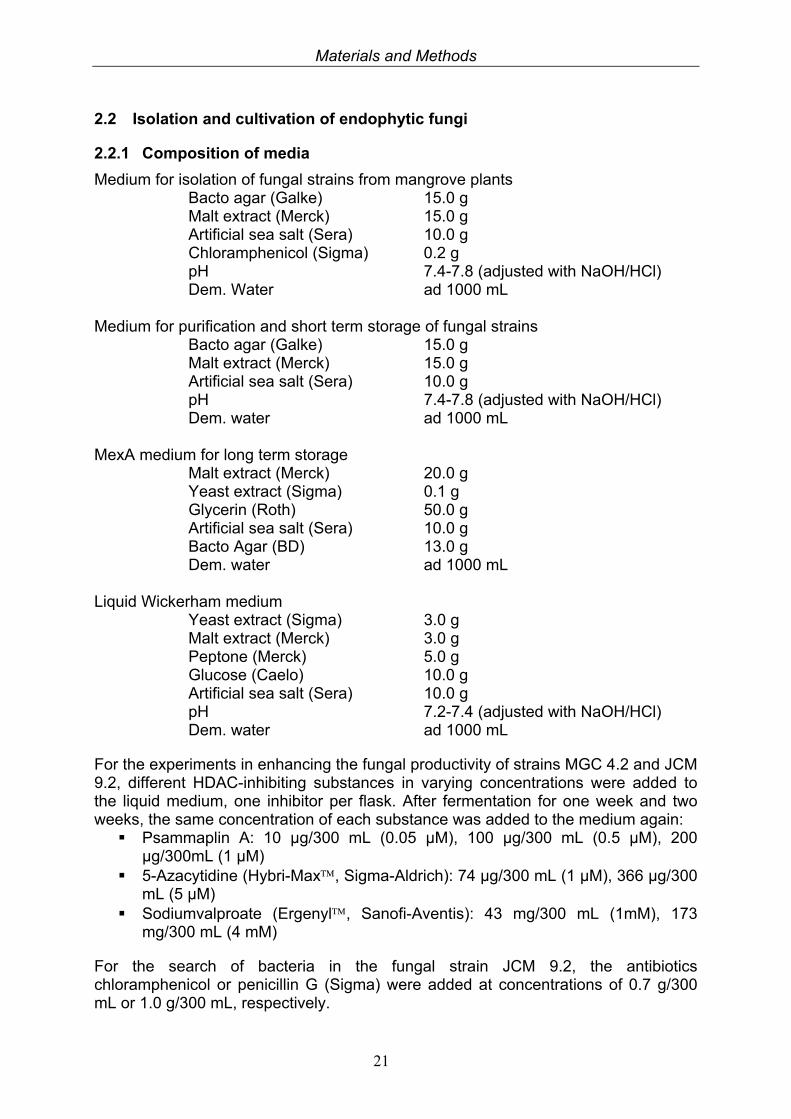
Medium for isolation of fungal strains from mangrove plants Bacto agar (Galke) 15.0 g Malt extract (Merck) 15.0 g Artificial sea salt (Sera) 10.0 g Chloramphenicol (Sigma) 0.2 g pH 7.4-7.8 (adjusted with NaOH/HCl) Dem. Water ad 1000 mL Medium for purification and short term storage of fungal strains
Bacto agar (Galke) 15.0 g Malt extract (Merck) 15.0 g Artificial sea salt (Sera) 10.0 g pH 7.4-7.8 (adjusted with NaOH/HCl) Dem. water ad 1000 mL MexA medium for long term storage
Malt extract (Merck) 20.0 g Yeast extract (Sigma) 0.1 g Glycerin (Roth) 50.0 g
Artificial sea salt (Sera) 10.0 g Bacto Agar (BD) 13.0 g Dem. water ad 1000 mL Liquid Wickerham medium Yeast extract (Sigma) 3.0 g Malt extract (Merck) 3.0 g Peptone (Merck) 5.0 g Glucose (Caelo) 10.0 g Artificial sea salt (Sera) 10.0 g pH 7.2-7.4 (adjusted with NaOH/HCl) Dem. water ad 1000 mL
For the experiments in enhancing the fungal productivity of strains MGC 4.2 and JCM 9.2, different HDAC-inhibiting substances in varying concentrations were added to the liquid medium, one inhibitor per flask. After fermentation for one week and two weeks, the same concentration of each substance was added to the medium again: Psammaplin A: 10 μg/300 mL (0.05 μM), 100 μg/300 mL (0.5 μM), 200
μg/300mL (1 μM) 5-Azacytidine (Hybri-Max, Sigma-Aldrich): 74 μg/300 mL (1 μM), 366 μg/300
mL (5 μM) Sodiumvalproate (Ergenyl, Sanofi-Aventis): 43 mg/300 mL (1mM), 173
mg/300 mL (4 mM)
For the search of bacteria in the fungal strain JCM 9.2, the antibiotics chloramphenicol or penicillin G (Sigma) were added at concentrations of 0.7 g/300 mL or 1.0 g/300 mL, respectively.
Materials and Methods
22
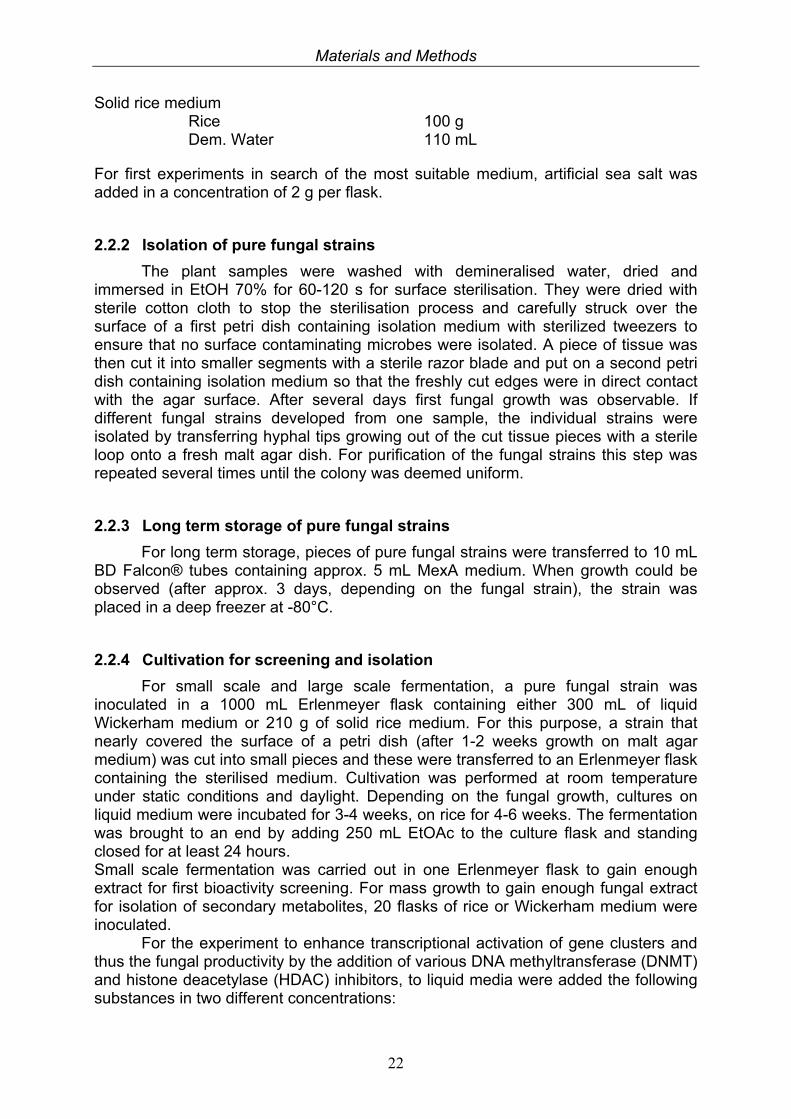
Solid rice medium Rice 100 g Dem. Water 110 mL
For first experiments in search of the most suitable medium, artificial sea salt was added in a concentration of 2 g per flask.
2.2.2 Isolation of pure fungal strains
The plant samples were washed with demineralised water, dried and immersed in EtOH 70% for 60-120 s for surface sterilisation. They were dried with sterile cotton cloth to stop the sterilisation process and carefully struck over the surface of a first petri dish containing isolation medium with sterilized tweezers to ensure that no surface contaminating microbes were isolated. A piece of tissue was then cut it into smaller segments with a sterile razor blade and put on a second petri dish containing isolation medium so that the freshly cut edges were in direct contact with the agar surface. After several days first fungal growth was observable. If different fungal strains developed from one sample, the individual strains were isolated by transferring hyphal tips growing out of the cut tissue pieces with a sterile loop onto a fresh malt agar dish. For purification of the fungal strains this step was repeated several times until the colony was deemed uniform.
2.2.3 Long term storage of pure fungal strains
For long term storage, pieces of pure fungal strains were transferred to 10 mL BD Falcon® tubes containing approx. 5 mL MexA medium. When growth could be observed (after approx. 3 days, depending on the fungal strain), the strain was placed in a deep freezer at -80°C.
2.2.4 Cultivation for screening and isolation
For small scale and large scale fermentation, a pure fungal strain was inoculated in a 1000 mL Erlenmeyer flask containing either 300 mL of liquid Wickerham medium or 210 g of solid rice medium. For this purpose, a strain that nearly covered the surface of a petri dish (after 1-2 weeks growth on malt agar medium) was cut into small pieces and these were transferred to an Erlenmeyer flask containing the sterilised medium. Cultivation was performed at room temperature under static conditions and daylight. Depending on the fungal growth, cultures on liquid medium were incubated for 3-4 weeks, on rice for 4-6 weeks. The fermentation was brought to an end by adding 250 mL EtOAc to the culture flask and standing closed for at least 24 hours. Small scale fermentation was carried out in one Erlenmeyer flask to gain enough extract for first bioactivity screening. For mass growth to gain enough fungal extract for isolation of secondary metabolites, 20 flasks of rice or Wickerham medium were inoculated.
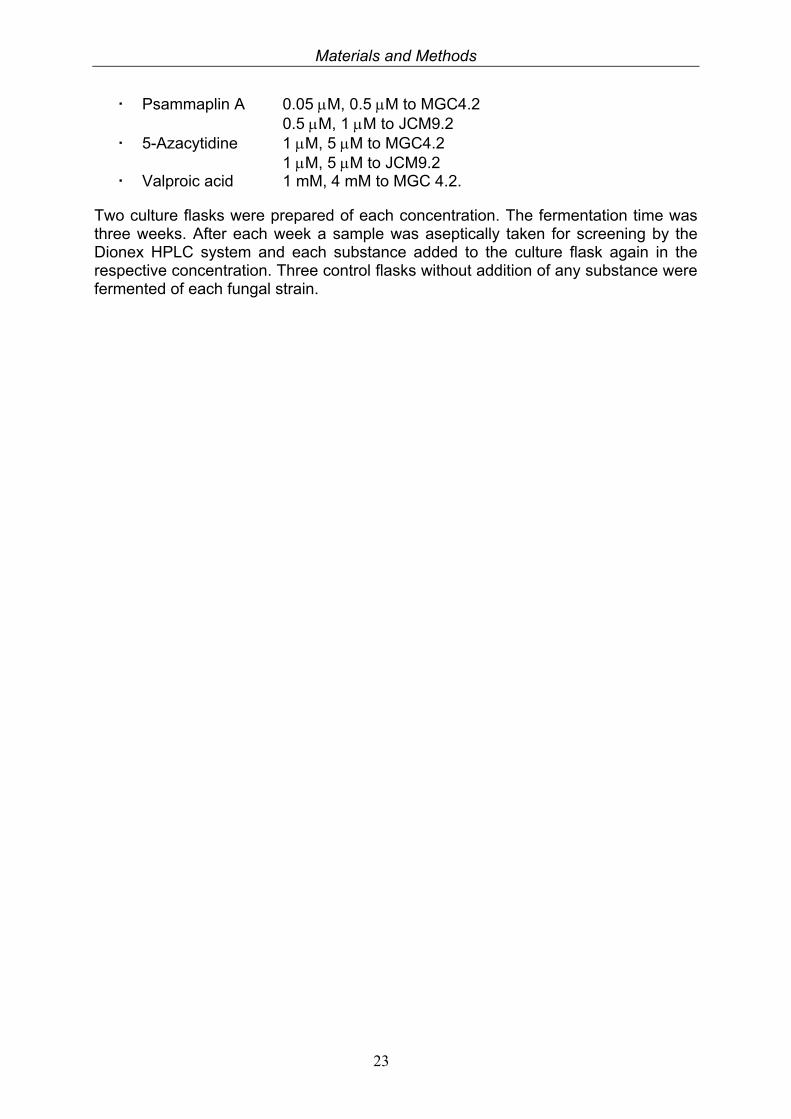
For the experiment to enhance transcriptional activation of gene clusters and thus the fungal productivity by the addition of various DNA methyltransferase (DNMT) and histone deacetylase (HDAC) inhibitors, to liquid media were added the following substances in two different concentrations:
Materials and Methods
23
Psammaplin A 0.05 M, 0.5 M to MGC4.2 0.5 M, 1 M to JCM9.2 5-Azacytidine 1 M, 5 M to MGC4.2 1 M, 5 M to JCM9.2 Valproic acid 1 mM, 4 mM to MGC 4.2.
Two culture flasks were prepared of each concentration. The fermentation time was three weeks. After each week a sample was aseptically taken for screening by the Dionex HPLC system and each substance added to the culture flask again in the respective concentration. Three control flasks without addition of any substance were fermented of each fungal strain.
Materials and Methods
24
2.3 Identification of microbes
Fungi that showed promising results in biological and chemical screening were identified by molecular biology methods. These methods were also used to examine the fungal culture JCM 9.2 for bacterial growth.
2.3.1 Fungal identification
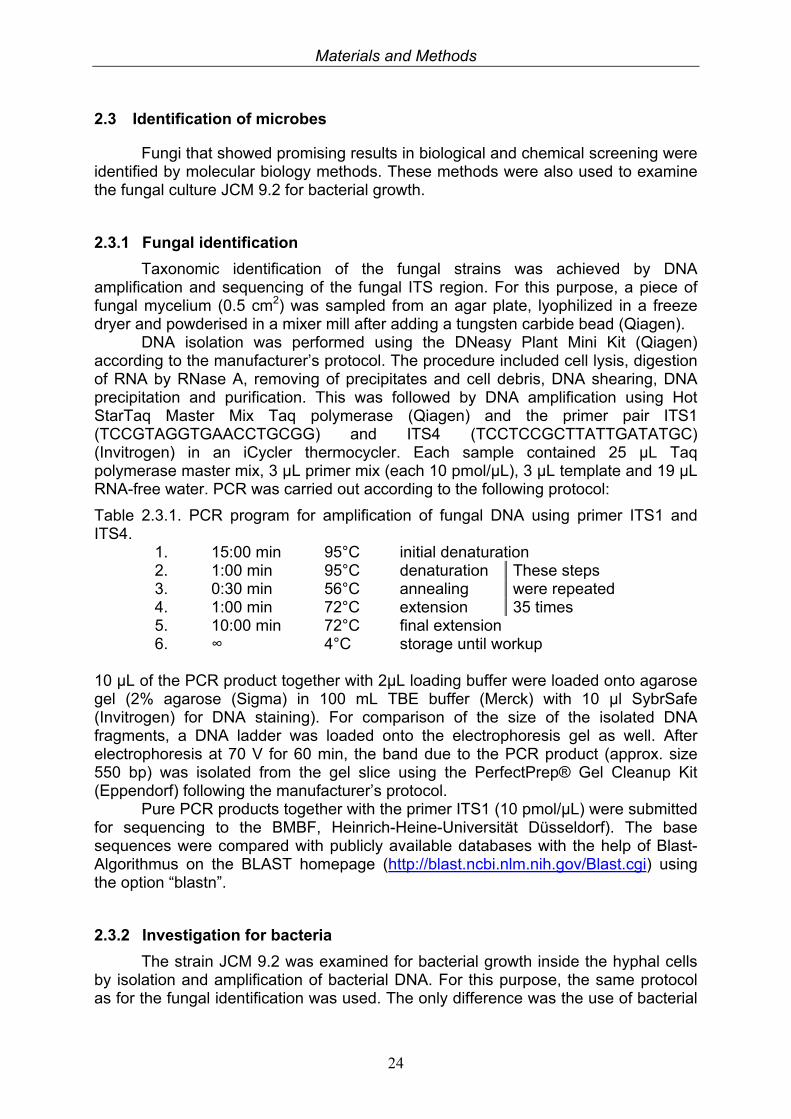
Taxonomic identification of the fungal strains was achieved by DNA amplification and sequencing of the fungal ITS region. For this purpose, a piece of fungal mycelium (0.5 cm2) was sampled from an agar plate, lyophilized in a freeze dryer and powderised in a mixer mill after adding a tungsten carbide bead (Qiagen).
DNA isolation was performed using the DNeasy Plant Mini Kit (Qiagen) according to the manufacturer’s protocol. The procedure included cell lysis, digestion of RNA by RNase A, removing of precipitates and cell debris, DNA shearing, DNA precipitation and purification. This was followed by DNA amplification using Hot StarTaq Master Mix Taq polymerase (Qiagen) and the primer pair ITS1 (TCCGTAGGTGAACCTGCGG) and ITS4 (TCCTCCGCTTATTGATATGC) (Invitrogen) in an iCycler thermocycler. Each sample contained 25 μL Taq polymerase master mix, 3 μL primer mix (each 10 pmol/μL), 3 μL template and 19 μL RNA-free water. PCR was carried out according to the following protocol:
Table 2.3.1. PCR program for amplification of fungal DNA using primer ITS1 and ITS4.
1. 15:00 min 95°C initial denaturation 2. 1:00 min 95°C denaturation 3. 0:30 min 56°C annealing 4. 1:00 min 72°C extension
These steps were repeated 35 times
5. 10:00 min 72°C final extension 6. ∞ 4°C storage until workup
10 μL of the PCR product together with 2μL loading buffer were loaded onto agarose gel (2% agarose (Sigma) in 100 mL TBE buffer (Merck) with 10 µl SybrSafe (Invitrogen) for DNA staining). For comparison of the size of the isolated DNA fragments, a DNA ladder was loaded onto the electrophoresis gel as well. After electrophoresis at 70 V for 60 min, the band due to the PCR product (approx. size 550 bp) was isolated from the gel slice using the PerfectPrep® Gel Cleanup Kit (Eppendorf) following the manufacturer’s protocol.
Pure PCR products together with the primer ITS1 (10 pmol/μL) were submitted for sequencing to the BMBF, Heinrich-Heine-Universität Düsseldorf). The base sequences were compared with publicly available databases with the help of Blast-Algorithmus on the BLAST homepage (http://blast.ncbi.nlm.nih.gov/Blast.cgi) using the option “blastn”.
2.3.2 Investigation for bacteria
The strain JCM 9.2 was examined for bacterial growth inside the hyphal cells by isolation and amplification of bacterial DNA. For this purpose, the same protocol as for the fungal identification was used. The only difference was the use of bacterial
Materials and Methods
25
primers 149r (GGTTACCTTGTTACGACTT) and 27f (AGAGTTTGATCCTGGCTCAG) and a PCR protocol suitable for these primers:
Table 2.3.2. PCR program for amplification of bacterial DNA using primer 27f and 149r.
1. 5:00 min 95°C initial denaturation 2. 1:00 min 95°C denaturation 3. 1:00 min 56°C annealing 4. 1:30 min 72°C extension
These steps were repeated 30 times
5. 5:00 min 72°C final extension 6. ∞ 4°C storage until workup
The Gram-positive bacterium Bacillus subtilis and the Gram-negative Escheirichia coli served as positive controls.
2.4 Extraction of fungal cultures
2.4.1 Extraction of small scale cultures grown in liquid Wickerham medium
The content of the culture flask including the added 250 mL of EtOAc was thoroughly mixed in an Ultraturrax at 4000 u/min for cell destruction and extraction for 10 min and filtered under vacuum using a Buchner funnel. The mycelium was discarded and the culture filtrate transferred to a separation funnel. The EtOAc and H2O phases were separated and the aqueous phase extracted two more times with 300 mL EtOAc each. The combined EtOAc phases were washed with 100 mL dem. water to eliminate any remaining sea salt.
2.4.2 Extraction of large scale cultures grown in liquid Wickerham medium
For the workup of the large scale fermentation of fungal strain JCM 9.2 grown in liquid medium, mycelia were separated from culture media, covered with approx. 5 L MeOH and left standing overnight followed by extraction for 10 min at 4000 u/min using an Ultraturrax. The mixture was filtered under Vacuum using a Buchner funnel and the extraction repeated two times until exhaustion. The obtained extract was taken to dryness and re-extracted successively with n-hexane, EtOAc, BuOH and dem. water. The culture media were extracted in the same manner as described for the extraction of small scale cultures to obtain the EtOAc extract.
2.4.3 Extraction of fungi grown on solid rice medium
The culture medium containing the mycelium was cut into small pieces to allow exhaustive extraction with EtOAc. The contents were filtered under vacuum using a Buchner funnel and the extraction repeated two times with EtOAc until exhaustion. The combined EtOAc phases were washed with 300 mL demineralised water to eliminate remaining sugar and starch.
All obtained extracts were taken to dryness under reduced pressure at 40°C and partitioned between 90% MeOH and n-hexane to remove the fatty acids. After evaporating the solvent, these crude extracts were submitted to TLC, analytical HPLC, LC-MS and also to bioactivity screening including cytotoxicity and antimicrobial assays.
Materials and Methods
26
Based on these results, promising extracts were processed in order to isolate and identify pure secondary products.
2.4.4 Extraction and fractionation of mangrove plant material
Leaves from Sonneratia alba (JCM 9) were extracted overnight with Ethanol 96% (V/V) and the resulting extract was dried. The dried residue was partitioned between EtOAc and water. The EtOAc soluble fraction was dried again and subjected to fractionation over Diaion HP-20 using H2O:MeOH step gradient elution.
2.5 Isolation of secondary natural products
For the isolation of natural products different chromatographic methods depending on the nature of the product can be used. A chromatographic system comprises two phases, a stationary phase absorbing the compounds according to their physical properties, e. g. polarity (silica gel, normal or reversed phase), size (Sephadex LH-20) or charge (Diaion), whereas the mobile phase moves through the stationary phase and gradually elutes the compounds according to their affinity from it.
2.5.1 Thin layer chromatography (TLC)
Analytical TLC is an inexpensive, fast and qualitatively relevant technique for screening of the chemical profiles of crude extracts or fractions as well as for choosing appropriate conditions for column chromatography. During this work, TLC was performed on pre-coated TLC plates using the following systems: TLC on silica gel 60 F254, layer thickness 0.2 mm (Merck): n-hexane:EtOAc [90:10, 80:20 and 70:30 (V/V)] and n-hexane:MeOH [95:5
and 90:10 (V/V)] for non-polar compounds DCM:MeOH [95:5, 90:10, 85:15, 80:20 and 70:30 (V/V)] for semi-polar
compounds EtOAc:MeOH:H2O[30:5:4, 30:65 and 30:7:6 (V/V)] for polar compounds
TLC on Diol F254S, layer thickness 0.25 mm (Merck): n-hexane:EtOAc [90:10, 80:20 and 70:30 (v/v)] EtOAc:acetone [95:5 and
90:10 (V/V)] TLC on reversed phase RP-18, F254 S, layer thickness 0.25 mm (Merck): MeOH:H2O (90:10, 80:20, 70:30 and 60:40 (V/V).
The band separation on TLC was observed under a UV lamp at 254 or 366 nm, followed by spraying TLC plates with anisaldehyde/sulphuric acid or ninhydrin spraying reagent and heating plates at 110°C. The different compounds could be compared and identified due to their specific retention factors in defined chromatographic systems. These so-called Rf-values can be calculated as
migration distance of compound Rf =
migration distance of solvent frontWith ninhydrin spray reagent (0.2 % in MeOH, m/V) amino acids, amines and amino sugars can be detected. The composition of anisaldehyde/sulphuric acid spray reagent, useful for the detection of phenols, steroids, sugars and terpenes, was
Materials and Methods
27
Methanol 85 mL
Glacial acetic acid 10 mL
Conc. sulphuric acid 5 mL
Anisaldehyde 0.5 mL
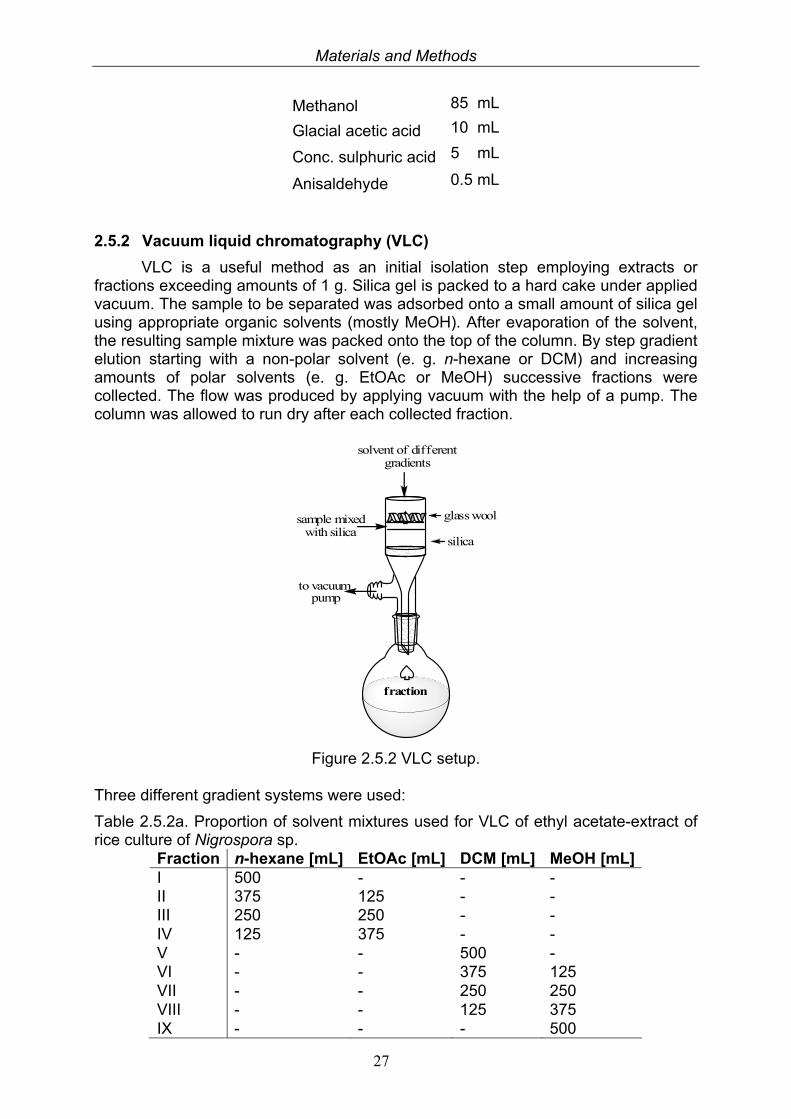
2.5.2 Vacuum liquid chromatography (VLC)
VLC is a useful method as an initial isolation step employing extracts or fractions exceeding amounts of 1 g. Silica gel is packed to a hard cake under applied vacuum. The sample to be separated was adsorbed onto a small amount of silica gel using appropriate organic solvents (mostly MeOH). After evaporation of the solvent, the resulting sample mixture was packed onto the top of the column. By step gradient elution starting with a non-polar solvent (e. g. n-hexane or DCM) and increasing amounts of polar solvents (e. g. EtOAc or MeOH) successive fractions were collected. The flow was produced by applying vacuum with the help of a pump. The column was allowed to run dry after each collected fraction.
to vacuumpump
silica
sample mixedwith silica
fraction
solvent of differentgradients
glasswool
Figure 2.5.2 VLC setup.
Three different gradient systems were used:
Table 2.5.2a. Proportion of solvent mixtures used for VLC of ethyl acetate-extract of rice culture of Nigrospora sp.
Fraction n-hexane [mL] EtOAc [mL] DCM [mL] MeOH [mL] I 500 - - - II 375 125 - - III 250 250 - - IV 125 375 - - V - - 500 - VI - - 375 125 VII - - 250 250 VIII - - 125 375 IX - - - 500
Materials and Methods
28
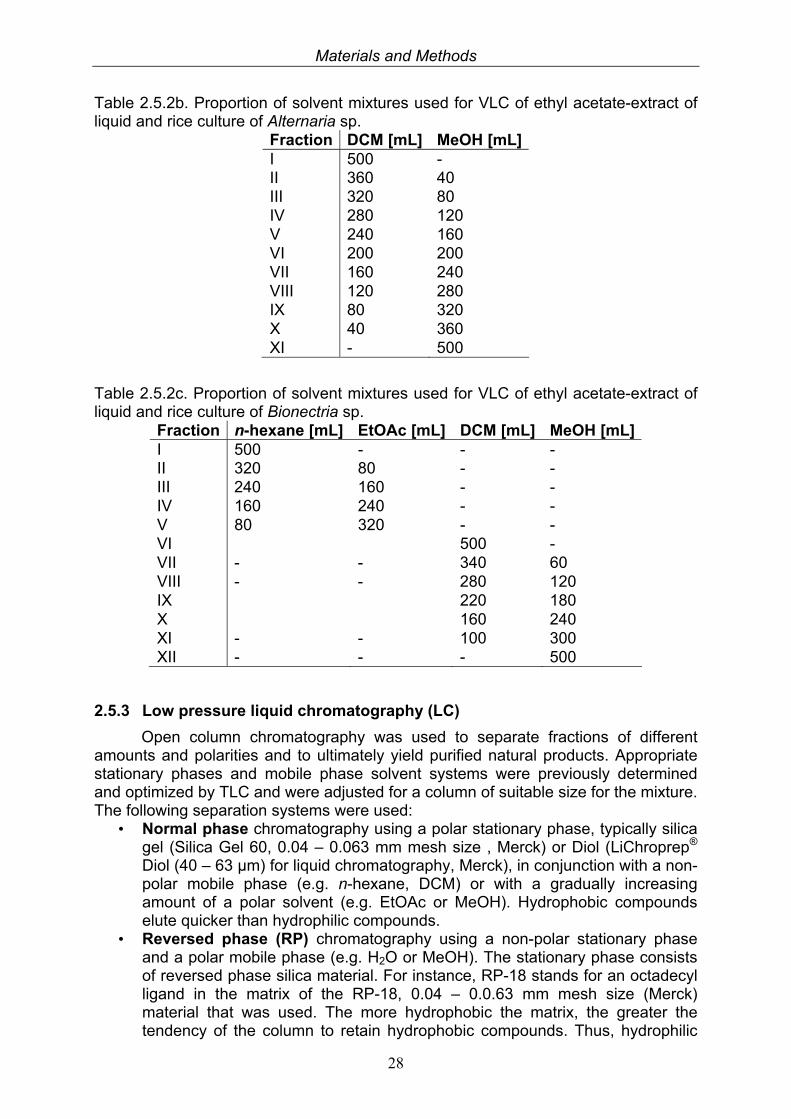
Table 2.5.2b. Proportion of solvent mixtures used for VLC of ethyl acetate-extract of liquid and rice culture of Alternaria sp.
Fraction DCM [mL] MeOH [mL]I 500 - II 360 40 III 320 80 IV 280 120 V 240 160 VI 200 200 VII 160 240 VIII 120 280 IX 80 320 X 40 360 XI - 500
Table 2.5.2c. Proportion of solvent mixtures used for VLC of ethyl acetate-extract of liquid and rice culture of Bionectria sp.
Fraction n-hexane [mL] EtOAc [mL] DCM [mL] MeOH [mL] I 500 - - - II 320 80 - - III 240 160 - - IV 160 240 - - V 80 320 - - VI 500 - VII - - 340 60 VIII - - 280 120 IX 220 180 X 160 240 XI - - 100 300 XII - - - 500
2.5.3 Low pressure liquid chromatography (LC)
Open column chromatography was used to separate fractions of different amounts and polarities and to ultimately yield purified natural products. Appropriate stationary phases and mobile phase solvent systems were previously determined and optimized by TLC and were adjusted for a column of suitable size for the mixture. The following separation systems were used:
• Normal phase chromatography using a polar stationary phase, typically silica gel (Silica Gel 60, 0.04 – 0.063 mm mesh size , Merck) or Diol (LiChroprep® Diol (40 – 63 µm) for liquid chromatography, Merck), in conjunction with a non-polar mobile phase (e.g. n-hexane, DCM) or with a gradually increasing amount of a polar solvent (e.g. EtOAc or MeOH). Hydrophobic compounds elute quicker than hydrophilic compounds.
• Reversed phase (RP) chromatography using a non-polar stationary phase and a polar mobile phase (e.g. H2O or MeOH). The stationary phase consists of reversed phase silica material. For instance, RP-18 stands for an octadecyl ligand in the matrix of the RP-18, 0.04 – 0.0.63 mm mesh size (Merck) material that was used. The more hydrophobic the matrix, the greater the tendency of the column to retain hydrophobic compounds. Thus, hydrophilic
Materials and Methods
29
compounds elute more quickly than do hydrophobic compounds. Elution was performed using H2O with gradually increasing amounts of MeOH or acetonitrile.
• Size exclusion chromatography involves separations based on molecular sizes of analyzed compounds. The stationary phase consists of porous beads (Sephadex LH-20, 0.25 – 0.1 mm mesh size, GE Healthcare). Compounds having larger molecular diameter are excluded from the interior of the bead and thus elute firstly, while compounds with smaller molecular diameters enter the beads and elute according to their ability to exit from the small sized pores where they are trapped. Elution was performed using MeOH or MeOH:DCM [1:1 (V/V)] as mobile phases.
• Ion exclusion chromatography uses ion exchange resin beds (Diaion HP-20, Supelco) that act as a charged solid separation medium. The components of the processed sample have different electrical affinities to this medium and consequently are differently retained by the resin according to their different affinities.
The eluted fractions were collected by an automate fraction collector and combined according to TLC results.
2.5.4 High pressure liquid chromatography (HPLC)
High pressure liquid chromatography (HPLC) is a high resolution chromatographic technique, where the mobile phase is forced through the column containing the stationary pharse by a pump, resulting in a fast separation. The high resolution is achieved by the use of small particle size of the absorbent material, which mostly is RP silica material. Adjacent to the HPLC a UV detector is connected for monitoring the separation of the eluted compounds shown in a chromatogram. The method can be used for semi preparative or analytical purposes.
2.5.4.1 Semi preparative HPLC
This technique was used for isolation and purification of compounds from fractions previously pre-purified using column chromatographic separation. The most appropriate solvent systems were determined by analytical HPLC before running the preparative HPLC separation. The mobile phase consisted of MeOH and nanopure H2O. Each injection consisted of 1–3 mg of the fraction dissolved in 100 µL of the solvent system. The solvent system was pumped through the column at a rate of 5 mL/min. The eluted peaks were detected by the online UV detector and collected separately in Erlenmeyer flasks.
2.5.4.2 Analytical HPLC
All extracts, fractions and pure compounds were monitored by anylytical HPLC to determine the composition of the fractions, the purity of the isolated substances and the optimum conditions for semi preparative HPLC. Additionally, known substances could be identified by comparison of the obtained UV spectra with the internal UV-spectra library using the online software. For the routine analytical HPLC detection a solvent system of nanopure water adjusted to pH 2.0 by addition of
Materials and Methods
30
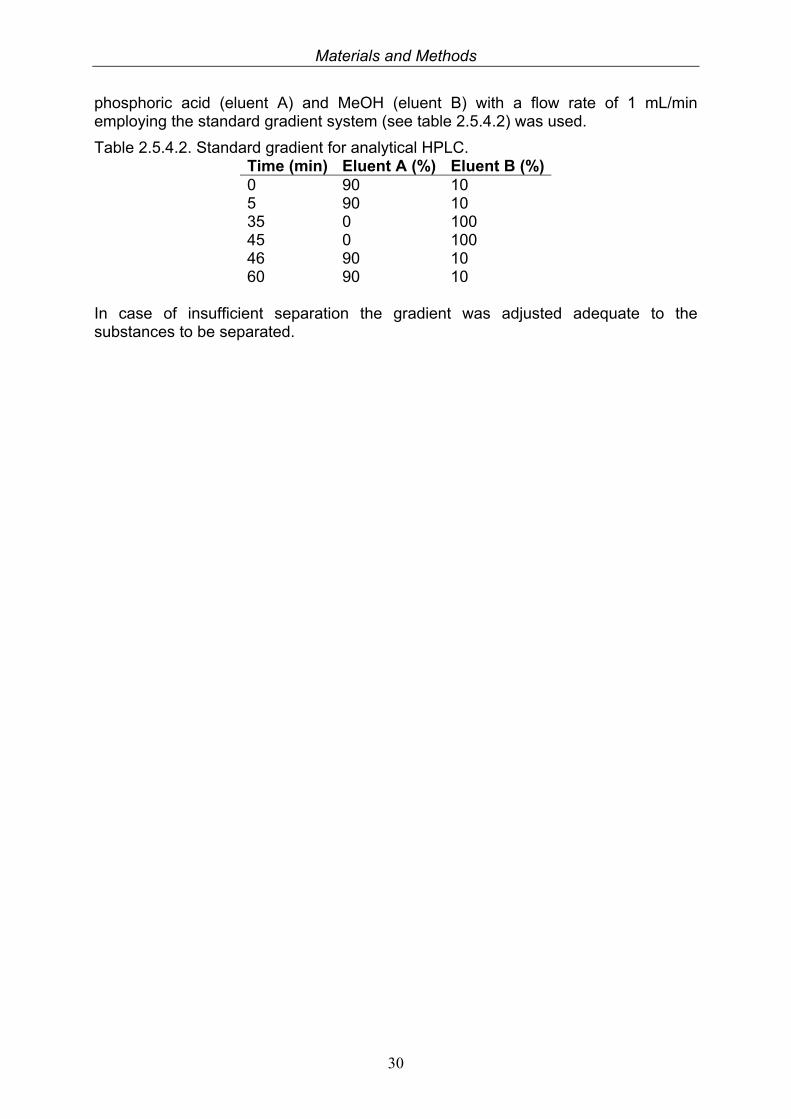
phosphoric acid (eluent A) and MeOH (eluent B) with a flow rate of 1 mL/min employing the standard gradient system (see table 2.5.4.2) was used.
Table 2.5.4.2. Standard gradient for analytical HPLC. Time (min) Eluent A (%) Eluent B (%)0 90 10 5 90 10 35 0 100 45 0 100 46 90 10 60 90 10
In case of insufficient separation the gradient was adjusted adequate to the substances to be separated.
Materials and Methods
31
2.5.5 Isolation and purification of fungal extracts
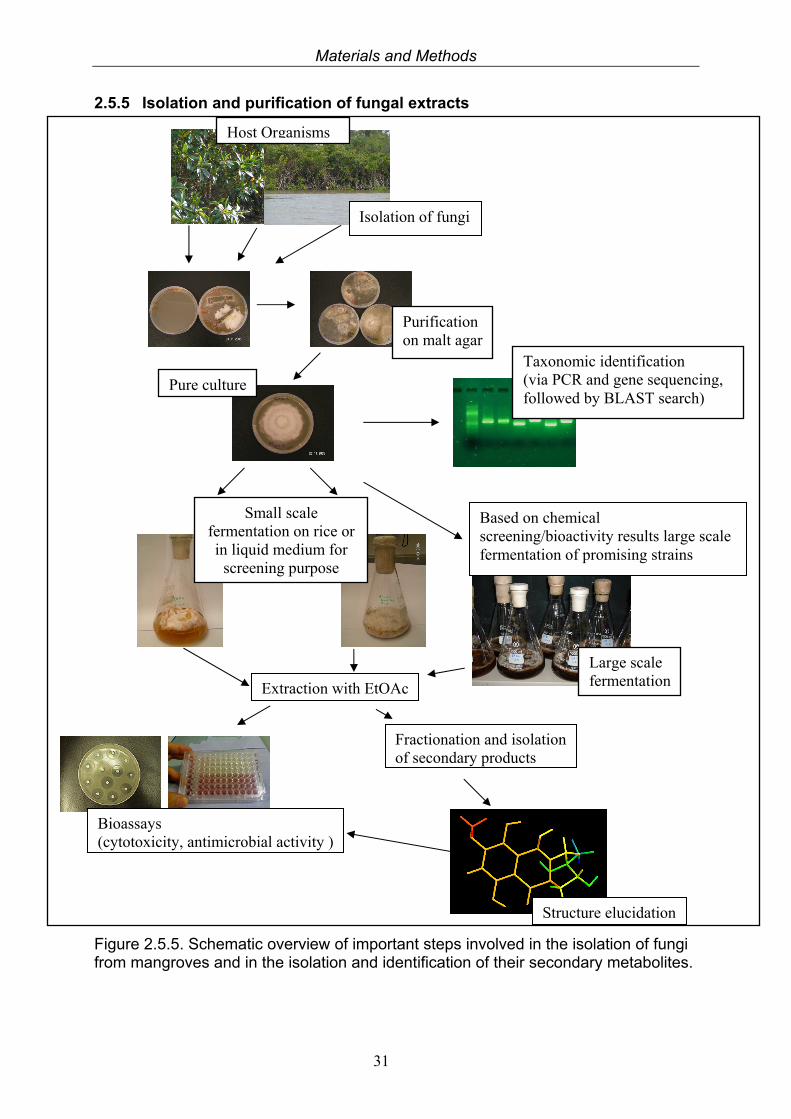
Figure 2.5.5. Schematic overview of important steps involved in the isolation of fungi from mangroves and in the isolation and identification of their secondary metabolites.
Purification on malt agar
Pure culture
Taxonomic identification (via PCR and gene sequencing, followed by BLAST search)
Small scale fermentation on rice or in liquid medium for
screening purpose
Large scale fermentation
Bioassays (cytotoxicity, antimicrobial activity )
Extraction with EtOAc
Fractionation and isolation of secondary products
Structure elucidation
Based on chemical screening/bioactivity results large scale fermentation of promising strains
Host Organisms
Isolation of fungi
Materials and Methods
32
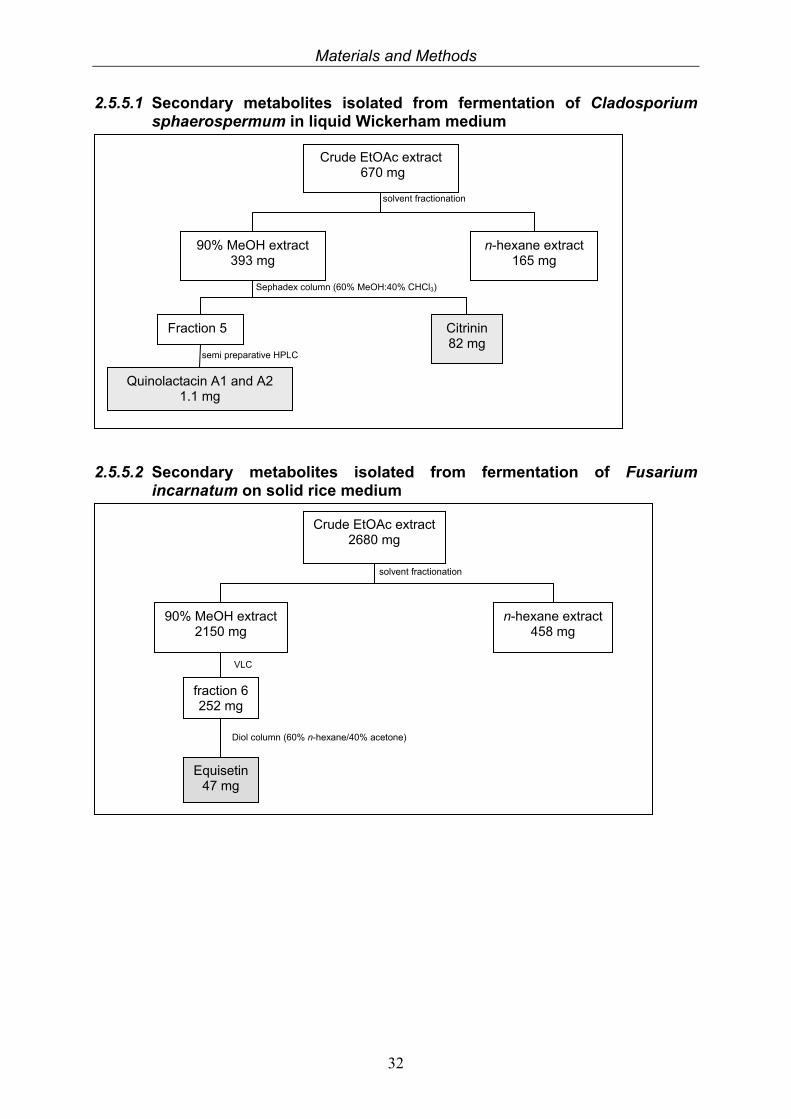
2.5.5.1 Secondary metabolites isolated from fermentation of Cladosporium sphaerospermum in liquid Wickerham medium
2.5.5.2 Secondary metabolites isolated from fermentation of Fusarium incarnatum on solid rice medium
Crude EtOAc extract 2680 mg
90% MeOH extract 2150 mg
n-hexane extract 458 mg
solvent fractionation
fraction 6 252 mg
Equisetin 47 mg
VLC
Diol column (60% n-hexane/40% acetone)
Crude EtOAc extract 670 mg
90% MeOH extract 393 mg
n-hexane extract 165 mg
solvent fractionation
Fraction 5 Citrinin 82 mg
Sephadex column (60% MeOH:40% CHCl3)
Quinolactacin A1 and A2 1.1 mg
semi preparative HPLC
Materials and Methods
33
2.5.5.3 Isolation of secondary metabolites from Nigrospora sp.
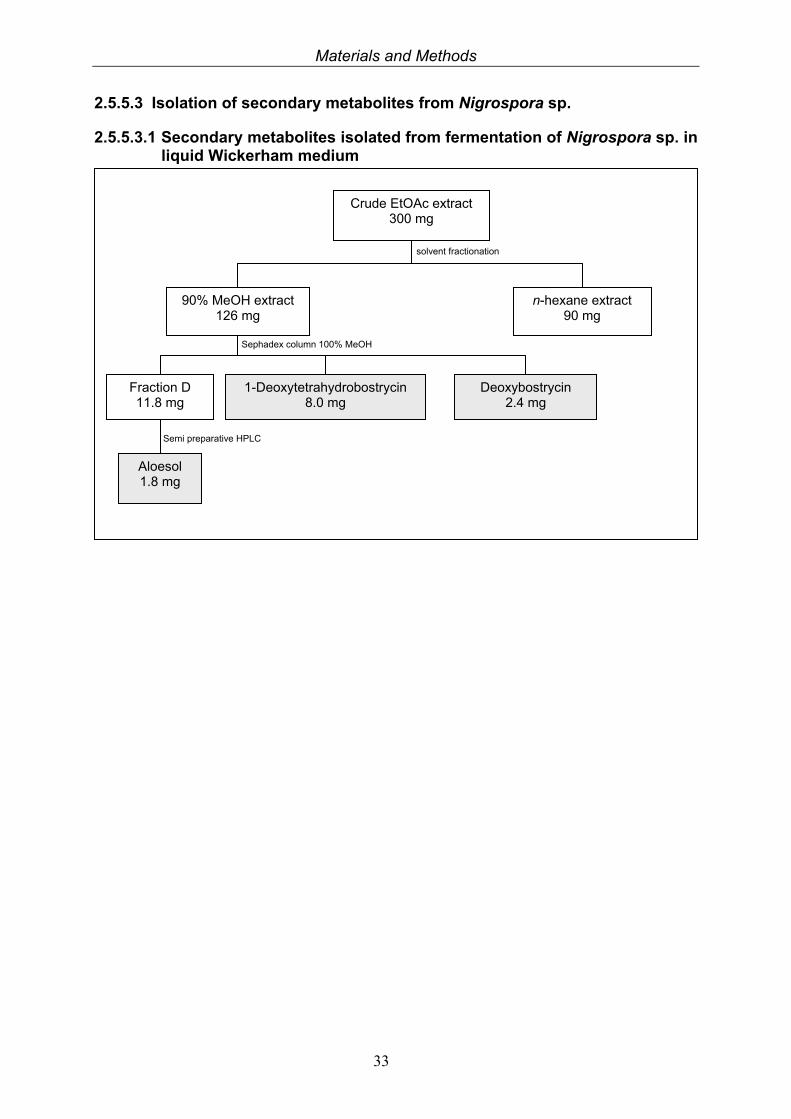
2.5.5.3.1 Secondary metabolites isolated from fermentation of Nigrospora sp. in liquid Wickerham medium
Crude EtOAc extract 300 mg
90% MeOH extract 126 mg
n-hexane extract 90 mg
solvent fractionation
Sephadex column 100% MeOH
Fraction D 11.8 mg
1-Deoxytetrahydrobostrycin 8.0 mg
Deoxybostrycin 2.4 mg
Aloesol 1.8 mg
Semi preparative HPLC
Materials and Methods
34
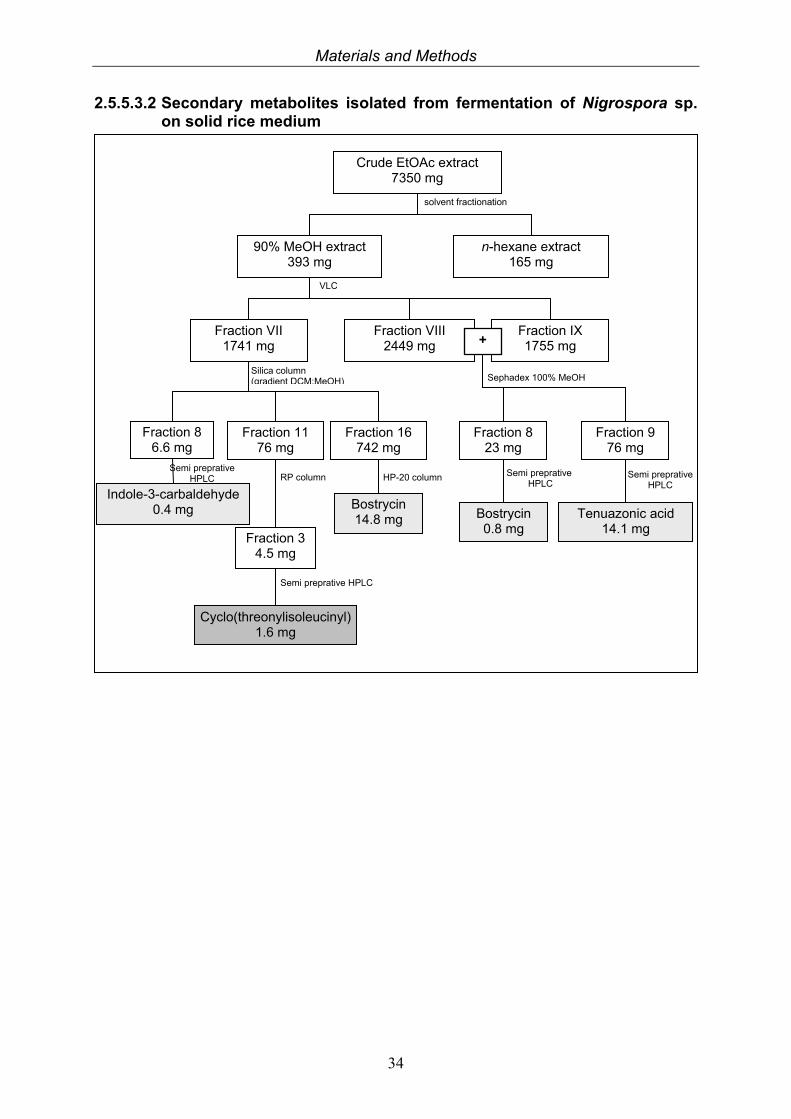
2.5.5.3.2 Secondary metabolites isolated from fermentation of Nigrospora sp. on solid rice medium
Crude EtOAc extract 7350 mg
90% MeOH extract 393 mg
n-hexane extract 165 mg
solvent fractionation
Fraction VII 1741 mg
Fraction VIII 2449 mg
Fraction IX 1755 mg
VLC
+
Fraction 8 6.6 mg
Fraction 11 76 mg
Fraction 16 742 mg
Silica column (gradient DCM:MeOH)
Fraction 3 4.5 mg
Indole-3-carbaldehyde 0.4 mg
Cyclo(threonylisoleucinyl)1.6 mg
Bostrycin 14.8 mg
Semi preprative HPLC
Semi preprative HPLC
RP column HP-20 column
Fraction 9 76 mg
Tenuazonic acid 14.1 mg
Fraction 8 23 mg
Sephadex 100% MeOH
Bostrycin 0.8 mg
Semi preprative HPLC
Semi preprative HPLC
Materials and Methods
35
2.5.5.4 Isolation of secondary metabolites from Alternaria sp.
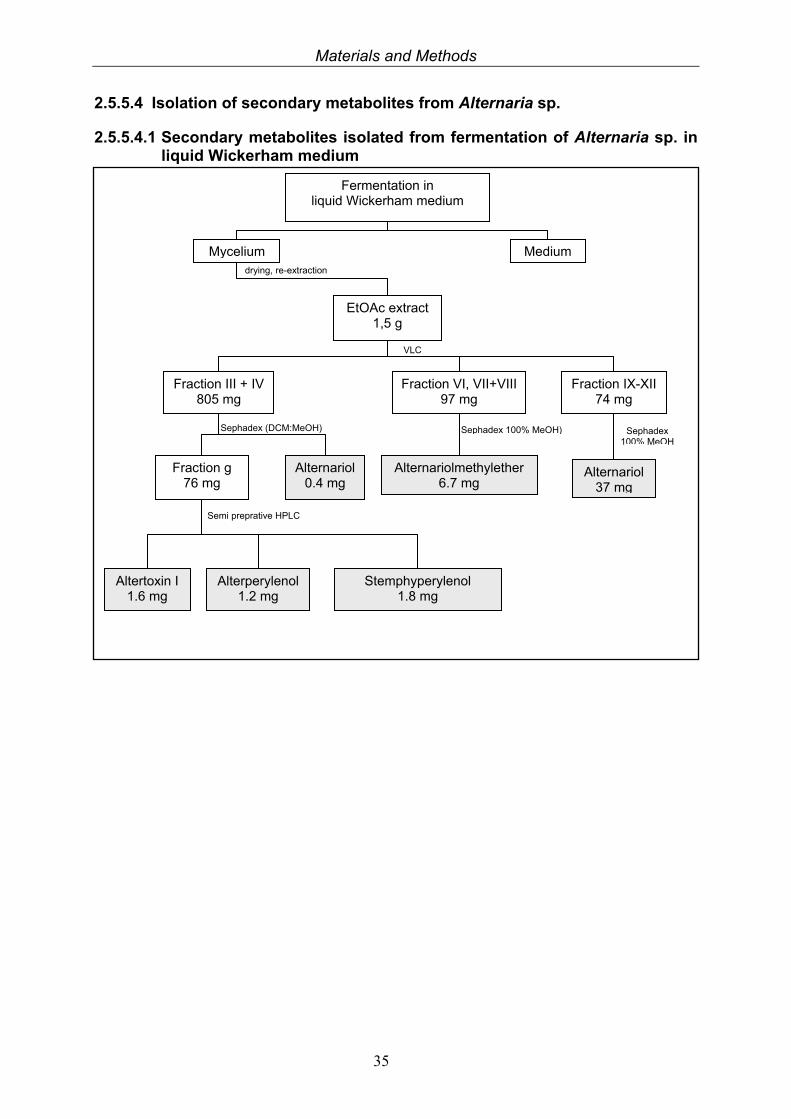
2.5.5.4.1 Secondary metabolites isolated from fermentation of Alternaria sp. in liquid Wickerham medium
Fermentation in liquid Wickerham medium
Mycelium Medium drying, re-extraction
EtOAc extract 1,5 g
VLC
Fraction III + IV 805 mg
Fraction IX-XII 74 mg
Alternariol 37 mg
Alternariol 0.4 mg
Fraction g 76 mg
Alterperylenol 1.2 mg
Altertoxin I 1.6 mg
Semi preprative HPLC
Fraction VI, VII+VIII 97 mg
Sephadex (DCM:MeOH)
Stemphyperylenol 1.8 mg
Alternariolmethylether 6.7 mg
Sephadex 100% MeOH) Sephadex 100% MeOH
Materials and Methods
36
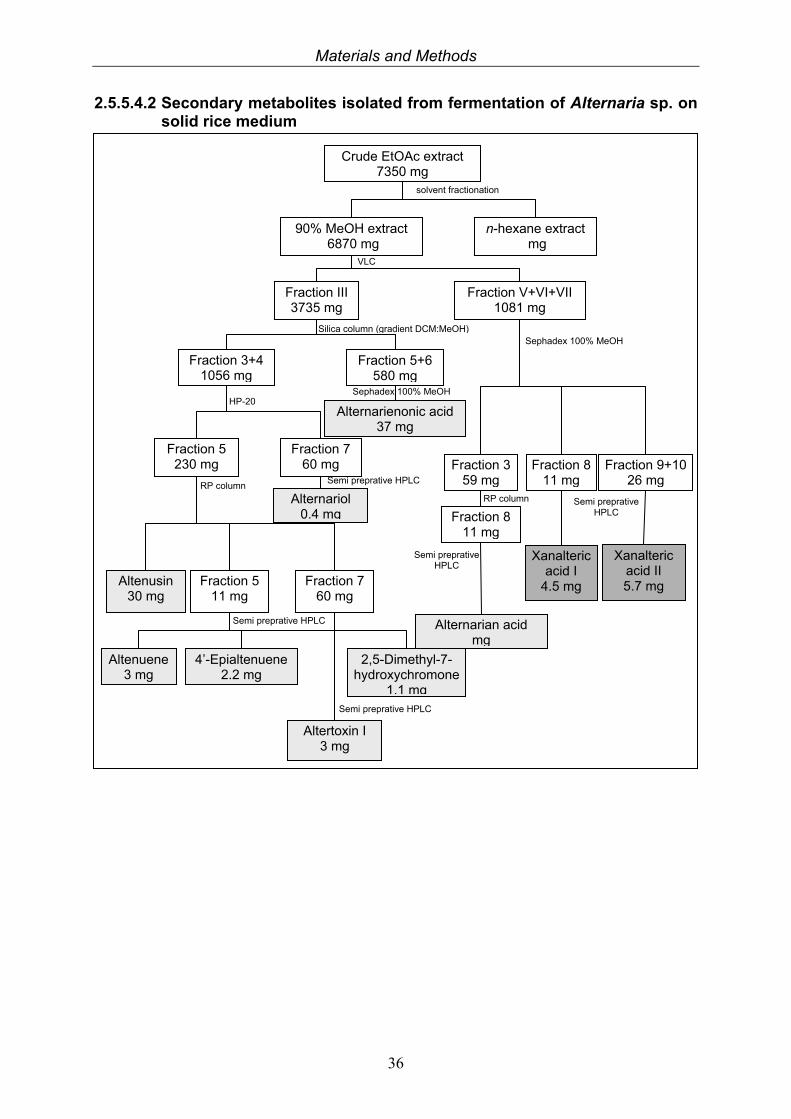
2.5.5.4.2 Secondary metabolites isolated from fermentation of Alternaria sp. on solid rice medium
Crude EtOAc extract 7350 mg
90% MeOH extract 6870 mg
n-hexane extract mg
solvent fractionation
Fraction III 3735 mg
Fraction V+VI+VII 1081 mg
VLC
Fraction 3+4 1056 mg
Fraction 5+6 580 mg
Silica column (gradient DCM:MeOH)
Alternariol 0.4 mg
Alternarienonic acid 37 mg
HP-20
Semi preprative HPLC
Sephadex 100% MeOH
Fraction 9+1026 mg
Xanalteric acid II 5.7 mg
Fraction 8 11 mg
Sephadex 100% MeOH
Xanalteric acid I
4.5 mg
Semi preprative HPLC Fraction 8
11 mg
Alternarian acid mg
Semi preprative HPLC
Fraction 3 59 mg
RP column
Fraction 7 60 mg
Fraction 5 230 mg
Fraction 5 11 mg
Altenusin 30 mg
Altenuene 3 mg
4’-Epialtenuene 2.2 mg
2,5-Dimethyl-7- hydroxychromone
1.1 mg
Fraction 7 60 mg
Altertoxin I 3 mg
RP column
Semi preprative HPLC
Semi preprative HPLC
Materials and Methods
37
2.5.5.5 Secondary metabolites isolated from fermentation of Bionectria ochroleuca on solid rice medium
2.6 Structure elucidation of the isolated fungal metabolites
The structure elucidation of the isolated compounds followed a standard scheme. Firstly, the data obtained from analytical HPLC were compared with the in-house substance library regarding their retention times at the standard gradient program and their UV spectra. Comparable hits indicated at the class belonging of the compound. From LCMS measurement the mass of the compound and from 1H-NMR measurement substructures could be compiled. With these information, together with the identity of the fungus, a literature search using the latest versions of Dictionary of Natural Products (DNP,Chapman and Hall, 2005-2009), Antibase (2002-2007) and SciFinder was performed. In some cases these data were insufficient and additional measurements, especially one and two dimensional NMR experiments were necessary to finally identify the secondary metabolite.
90% MeOH extract 6550 mg
VLC
Fraction VII 1054 mg
Verticillin D 47 mg
FractionVIII 826 mg
Sephadex (DCM:MeOH) Sephadex (DCM:MeOH)
n-hexane extract
Crude EtOAc extract 1,5 g
Fraction a+b 150 mg
Fraction e+f 174 mg
Fraction 2-6
Fraction M
Fraction B
Silica DCM:MeOH gradient
Bionectramide D 2.4 mg
Bionectramide A
Bionectramide B 8.5 mg
Fraction A
Sephadex (DCM:MeOH)
Silica DCM:MeOH (9:1)
Semi preparative HPLC
Semi preparative HPLC
Semi preparative HPLC
solvent fractionation
Bionectramide C 2.3 mg
Bionectramide A 65 mg
Materials and Methods
38
2.6.1 Mass spectrometry (MS)
Mass spectrometry (MS) determines the molecular weights of pure compounds or compounds in a mixture. It is a very sensitive technique and even from micro gram amounts good spectra can be obtained. The sample is ionized in the ionization source and the rising ions ions are sorted and separated according to their mass (m) to charge (z) ratio (m/z) in the mass analyser. Both negative and positive charged ions can be observed. The molecular ion (parent ion) has to be identified giving the molecular weight of the compound. From the fragmentation patterns of each compound information about substructures can be attained.
2.6.1.1 Electron spray ionization mass spectrometry (ESIMS)
ESIMS is a gentle ionization method where the sample is passed through a high voltage metal capillary. At the end of this capillary it is sprayed by a flow of nitrogen gas at atmospheric pressure to form an aerosol. Together with heating, the nitrogen evaporates the emerging droplets forcing the ions in each droplet together until repulsion causes them to eject from the surface. The ions are extracted into the vacuum of the mass analyzer where they are detected. Additionally to the molecular ion peaks [M+H]+ or [M-H]- fragments of these can detected.
2.6.1.2 Liquid chromatography mass spectrometry (LC-MS)
The combination of HPLC to an MS enables the recording of mass spectra of components of mixtures that elute successively from the LC column. Thus, quick characterisation of the components is greatly facilitated. Typically this LC-MS system also contains a UV detector so that from each peak found in the chromatogram a mass spectrum and a UV spectrum can be obtained. For the routine measurements a solvent system of 0.1% formic acid (eluent A) and acetonitrile (eluent B) with a flow rate of 0.4 mL/min employing the standard gradient system (see table 2.6.1) was used. Detection was achieved by an ion trap mass filter together with a UV photodiode array detector.
Table 2.6.1. Standard gradient for LCMS system. Time (min) Eluent A (%) Eluent B (%)0 90 10 5 90 10 35 0 100 45 0 100 46 90 10 60 90 10
2.6.1.3 High resolution mass spectrometry (HR-MS)
Combination of mass filters (double focusing) gives rise to high resolution measurement with an accuracy of about 1ppm. Thus not only a specific molecular mass value is provided, but also the molecular formula of an unknown compound can be established.
Materials and Methods
39
2.6.2 Nuclear magnetic resonance spectroscopy (NMR)
This technique utilizes the atomic nuclei spinning behavior of atoms with an odd number of nucleons, e. g. 1H and 13C. An NMR spectrum is acquired by varying the magnetic field that is applied to the sample dissolved in a deuterated solvent over a small range while observing the resonance signal from the sample. Depending on the electron density around each proton they obtain different shielding and deshielding effects appearing in different parts of the resulting NMR spectrum and thus provide information about the environment of each proton. The resulting frequency where the nuclei resonate, the so-called chemical shift, is given in ppm and the coupling constants between adjacent nuclei in Hertz (Hz). NMR experiments can be conducted in a one (1D) or two (2D) dimensional manner. 2D NMR spectra can be either measured between two equal (H, H-COSY, correlated spectroscopy) or two different (H;C-COSY) frequency axes. For the H-H 2D experiments the connection between two adjacent protons (COSY), between two protons through space (NOESY, nuclear Overhauser enhancement spectroscopy; ROESY, rotating-frame enhancement spectroscopy) or between all protons in one spin system (TOCSY, total correlation spectroscopy) are given. H-C 2D experiments measure the direct correlation between a proton and a carbon (HMQC, heteronuclear multiple quantum correlation) or the connection of protons over two, three and even four bonds to carbon atoms, so-called long range coupling (HMBC, heteronuclear multiple bond correlation). Correlations are shown as cross peaks in the plane between two axes containing the 1D NMR shifts. Most NMR spectra were measured at Institut für Anorganische Chemie und Strukturaufklärung, Heinrich-Heine Universität, Düsseldorf with a Bruker ARX-500, by Dr. Peters and co-workers. Further measurements were at Helmholtz Zenter für Infektionsforschung, Braunschweig with Bruker AM-300, ARX-400 and DMX-600 by Dr. Wray. Citrinin was measured at Beijing Normal University, Beijing, China with a Bruker 500 Ultra Shield by Prof. Deng.
2.6.3 Optical activity
Molecules that possess at least one chiral center interact with linearly polarized light. Enantiomeres can be differentiated as the D- or (+)-isomer of a molecule rotates the orientation of linearly polarized light clockwise whereas the L- or (-) isomer counterclockwise. Thus it allows the determination of the absolute stereochemistry. The specific optical rotation at the wavelength of the sodium D-line, 589 nm at 20°C can be calculated as
100 * []D
20 =l*c
where = the measured angle of rotation in degrees ° l = the length in dm of the polarimeter tube (typically = 1) c = concentration of the substance in g/100 mL.
Pure substances were dissolved in appropriate spectroscopic grade solvent. The optical rotation of known compounds was compared to literature data.
Materials and Methods
40
2.6.4 Determination of the absolute configuration of amino acids by Marfey’s analysis
Marfey’s method was used to determine the absolute configurations of the dipeptide cyclothreonylisoleucin and the bionectramides A – D.
In general, Marfey’s reagent (FDAA = 1-fluor-dinitrophenyl-5-L-alanine amide, TCI) is used as reagent for derivatization of D- and L-amino acids that are obtained after hydrolysis of cyclic or linear peptides in order to determine their absolute configuration. The obtained diastereoisomers can be easily differentiated and identified by their retention times following HPLC analysis on RP columns and comparison with commercially available D- and L-amino acids (ICN) that have been treated in the same way (Marfey 1984, Ashour 2006). 50 µl of 50 mM of each commercially available standard amino acid (D- or L-form) that is of interest in H2O was mixed with 100 µl of 1% Marfey’s reagent in acetone and heated at 40°C for one hour. The reaction was stopped by addition of 10 µl of 2M HCl and the derivatized product dried in a freeze dryer, re-dissolved in MeOH and analysed by HPLC and by LC-MS. The isolated peptide was hydrolysed (0.5 – 1 mg) with 1 – 2 ml 6N-HCl at 110°C for 24 h under N2 atmosphere. The hydrolysate containing a mixture of free amino acids was cooled, dried and re-dissolved in water. Derivatization was achieved in the same manner as applied to standard amino acids.
The retention times of the derivatized standard amino acids and of the derivatized amino acids obtained following hydrolysis of the peptide were compared to distinguish D- and L-amino acids.
2.6.5 Determination of absolute stereochemistry by Mosher reaction
The reaction was planned according to a modified Mosher ester procedure described before (Su et al. 2002) to assign the absolute stereochemistry of compound 7. In preparation for this method, other hydroxyl groups than the wanted had to be protected as acetonides or esters according to the following procedures: Formation of acetonides 10 mg of the compound were treated with 0.75 mL acetone containing 0.4% (V/V) H2SO4 at ice temperature for 90 min and another 90 min at room temperature. The reaction product was extracted into EtOAc from aqueous solution (Stoessel and Stothers 1983). Formation of aromatic ester by Schotten-Baumann reaction 10 mg of the compound, well-dried under nitrogen atmosphere and dissolved in 1M NaOH, were stirred with 25 mg benzoyl chloride at ice temperature for 5 hrs and the reaction products extracted with EtOAc. As both methods failed to be successful, the actual Mosher reaction to assign the absolute conformation of compound 7 was not performed.
Materials and Methods
41
2.7 Biological assays
2.7.1 Antimicrobial and antifungal activity
Extracts and pure substances were tested in a 96 well plates primary screening assay against the following resistant pathogens: Escherichia coli (VR), Enterococcus faecium (BR) , Staphylococcus aureus (MRSA), Streptococcus pneumonia (BR), Pseudomonas aeruginosa (VR), Klebsiella pneumonia (VR), Candida albicans (KR), Candida krusei (KR), Aspergillus fumigatus (VR), Aspergillus faecius (VR). Pure compounds were diluted from 250 to 62.5 μg/mL and extracts from 1250 to 312 μg/mL in Müller Hinton Bouillon (Merck, Germany) for bacterial screening and in RPMI (PAA, Austria), enriched with 2% glucose (PAA, Austria), for fungal screening. Afterwards the substance/extract solution was overlaid with the microbes (105 CFU/mL) and cultivated for bacteria 24 h for fungi 48h at 35°C. As negative control an antibiotic/antimycotic mix (PAA, Austria) was used in addition to a non treated infected control (positive). The test was analysed by checking the microbial growth with the visible eye and by measurement of the turbidity at 650 nm. All procedures were done under aseptic conditions in a sterile laminar air flow according to good laboratory practice. Substances with an activity around 125 g/ml and extracts with 625µg/ml were considered as possible candidates for further antimicrobial screening. With these positive candidates a MIC (minimal inhibition concentration) assay was performed to identify the exactly minimal inhibition concentration. Therefore the substances/extracts were diluted from 250g/mL to 0.24g/mL and screened in the same manner as in the primary screening.
2.7.2 Antiviral activity
Antiviral properties of several pure compounds at concentrations from 250 to 3.9μg/mL were tested against two different groups of respiratory virus (HRV = human rhino virus; RSV = respiratory syncytial virus). In these two groups the followed serotypes were tested: HRV 2, HRV 8, HRV 16, HRV39, RSV B and RSV A2. As host cell line HeLa cells were cultivated in DMEM (PAA, Austria), with 2% fetal calve serum (PAA, Austria), 1% antibiotic/antimycotic solution (PAA, Austria) and 1mMol MgCl2 in a 37°C incubator (5% CO2, 95% humidity). The cells were sowed in a 96 well plate so that they had a confluence of 70-80% at the day of the experiment. The cells were infected with 100 L of a viral/substance solution. This viral/substance solution was prepared before by mixing virus (MOI = 10; [Multiplicity of Infection = ratio of infectious virus particles to cells]) with different substances at concentrations between 250 and 3.9g/mL. Before infecting the cells the mixture was incubated for 20 minutes to allow virus/substance interaction. The infected cells were incubated for 72h at 37°C (5% CO2, 95% humidity). Additionally non-infected cells (negative control) and infected cells (positive control) were included. Data were analyzed by checking the grade of infection in the wells with optical evaluation and staining of the living cells with crystal violet at the end of the test. The stained cells were analyzed by followed measurement of the optical density at 490 nm.
Materials and Methods
42
2.7.3 Toxicity
Compound with a promising bioactivity were examined for their toxicity profile. HeLa cells were sowed the day before the start of the experiment in a 96 well plate to give a confluence of approximately 60-70%. The cells were overlaid with the substances diluted in medium (250, 125 and 62 μg/mL) and incubated for 48 hours. Viability of cells was defined by staining with crystal violet and measuring at 450 nm. Data points were taken five times to calculate an average. The toxicity profile was deemed positive if the concentration of the living cells reached 80% of the negative control. Antimicrobial, antifungal, antiviral and toxicity tests were performed by Dr. Alexander Pretsch at SeaLife Pharma GmbH in Tulln, Austria.
2.7.4 Biofilm inhibition and anti-infective assay
Both tests were performed in the laboratory of Prof. U. Hentschel, Zentrum für Infektionsforschung, Würzburg. Biofilm formation was determined by an adhesion assay in polystyrene microtiter plates. For this purpose, cultures of Staphylococcus epidermidis were diluted appropriately in TBS medium (17 g peptone from casein, 3 g peptone from soy meal, 2.5 g glucose 5 g NaCl and 2.5 g K2HPO4 in 1 L demineralised water with an adjusted pH of 7.3), pipetted into the wells and incubated at 37°C for 18 hours. Samples were added to growing or already formed biofilm in concentration of 50μg/mL (n=8). After incubation, the wells were carefully emptied and rinsed prior to heat –fixing of the remaining biofilm on a hotplate at about 60°C and subsequent staining with crystal violet. After washing off the excess dye and drying, the optical density of the adhering biofilm was determined at 490 nm. S. epidermidis RP62A (wild type) served as positive, S. carnosus TM300 as negative control.
2.7.5 Cytotoxicity test: Microculture tetrazolium (MTT) assay
MTT (3-(4, 5-dimethylthiazol-2-yl)-2, 5-diphenyltetrazolium bromide) is a yellow coloured compound that is converted by mitochondrial reductase into a blue formazan derivative. MTT assay was performed following the method described 1987 by Carmichael (Carmichael et al. 1987), and % cell viability was determined by spectrophotometric determination of accumulated formazan derivative in treated cells at 560 nm in comparison to control cells (Ashour et al. 2006).
L5178Y mouse lymphoma cells were grown in Eagle’s minimal essential medium supplement with 10% horse serum in roller tube culture. The medium contained 100 units/mL penicillin and 100 units/mL streptomycin. The cells were maintained in a humidified atmosphere at 37°C with 5% CO2. Of the test samples to be analyzed in the bioassay, stock solutions in EtOH 96% (v/v) were prepared. Exponentially growing cells were harvested, counted and diluted appropriately. Of the cell suspension, 50 µl containing 3750 cells were pipetted in 96-well microtiter plates. Subsequently, 50 µl of a solution of the test samples containing the appropriate concentration was added to each well. The concentration range for initial experiments should be 3 and 10 µg/ml of pure compounds, fractions or crude extracts. The test plates were incubated at 37°C with 5% CO2 for 72 h. A solution of MTT was prepared at 5 µg/ml in phosphate buffered saline (PBS; 1.5 mM KH2PO4, 6.5 mM
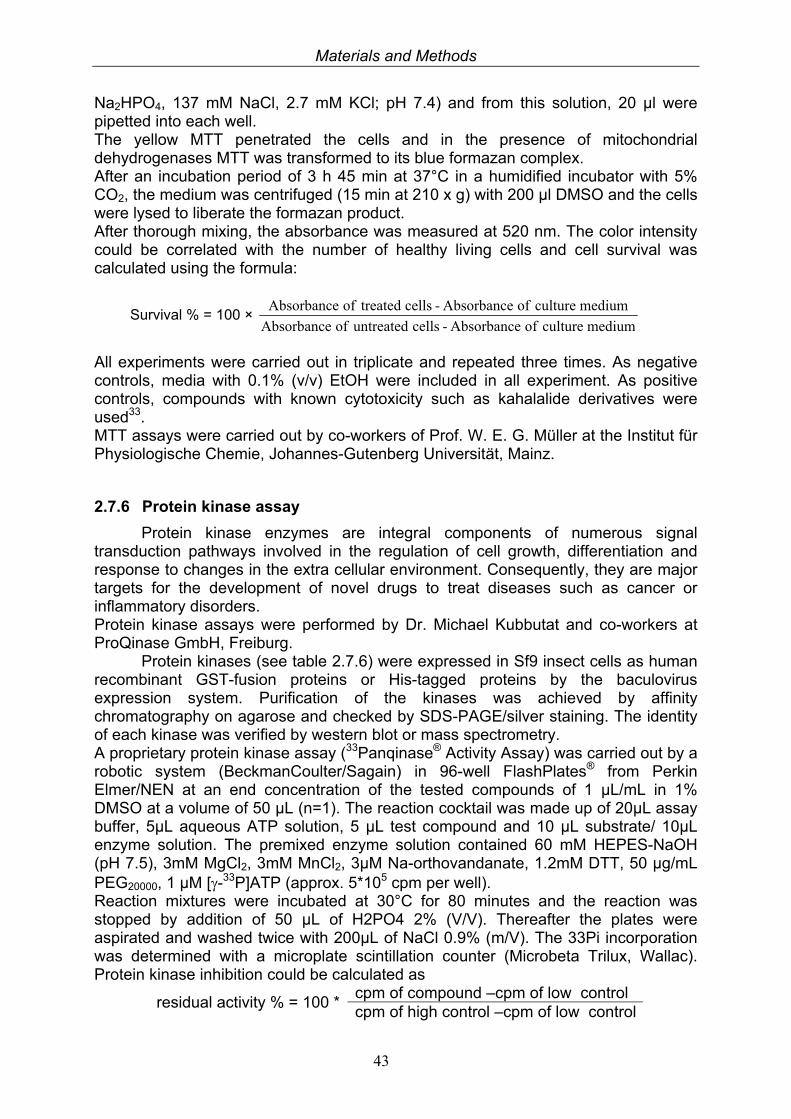
Materials and Methods
43
Na2HPO4, 137 mM NaCl, 2.7 mM KCl; pH 7.4) and from this solution, 20 µl were pipetted into each well. The yellow MTT penetrated the cells and in the presence of mitochondrial dehydrogenases MTT was transformed to its blue formazan complex. After an incubation period of 3 h 45 min at 37°C in a humidified incubator with 5% CO2, the medium was centrifuged (15 min at 210 x g) with 200 µl DMSO and the cells were lysed to liberate the formazan product. After thorough mixing, the absorbance was measured at 520 nm. The color intensity could be correlated with the number of healthy living cells and cell survival was calculated using the formula:
Survival % = 100 × medium cultureofAbsorbance-cellsuntreatedofAbsorbance
medium culture of Absorbance - cells treatedof Absorbance
All experiments were carried out in triplicate and repeated three times. As negative controls, media with 0.1% (v/v) EtOH were included in all experiment. As positive controls, compounds with known cytotoxicity such as kahalalide derivatives were used33. MTT assays were carried out by co-workers of Prof. W. E. G. Müller at the Institut für Physiologische Chemie, Johannes-Gutenberg Universität, Mainz.
2.7.6 Protein kinase assay
Protein kinase enzymes are integral components of numerous signal transduction pathways involved in the regulation of cell growth, differentiation and response to changes in the extra cellular environment. Consequently, they are major targets for the development of novel drugs to treat diseases such as cancer or inflammatory disorders. Protein kinase assays were performed by Dr. Michael Kubbutat and co-workers at ProQinase GmbH, Freiburg.
Protein kinases (see table 2.7.6) were expressed in Sf9 insect cells as human recombinant GST-fusion proteins or His-tagged proteins by the baculovirus expression system. Purification of the kinases was achieved by affinity chromatography on agarose and checked by SDS-PAGE/silver staining. The identity of each kinase was verified by western blot or mass spectrometry. A proprietary protein kinase assay (33Panqinase® Activity Assay) was carried out by a robotic system (BeckmanCoulter/Sagain) in 96-well FlashPlates® from Perkin Elmer/NEN at an end concentration of the tested compounds of 1 μL/mL in 1% DMSO at a volume of 50 μL (n=1). The reaction cocktail was made up of 20μL assay buffer, 5μL aqueous ATP solution, 5 μL test compound and 10 μL substrate/ 10μL enzyme solution. The premixed enzyme solution contained 60 mM HEPES-NaOH (pH 7.5), 3mM MgCl2, 3mM MnCl2, 3μM Na-orthovandanate, 1.2mM DTT, 50 μg/mL PEG20000, 1 μM [-33P]ATP (approx. 5*105 cpm per well). Reaction mixtures were incubated at 30°C for 80 minutes and the reaction was stopped by addition of 50 μL of H2PO4 2% (V/V). Thereafter the plates were aspirated and washed twice with 200μL of NaCl 0.9% (m/V). The 33Pi incorporation was determined with a microplate scintillation counter (Microbeta Trilux, Wallac). Protein kinase inhibition could be calculated as
cpm of compound –cpm of low control residual activity % = 100 *
cpm of high control –cpm of low control
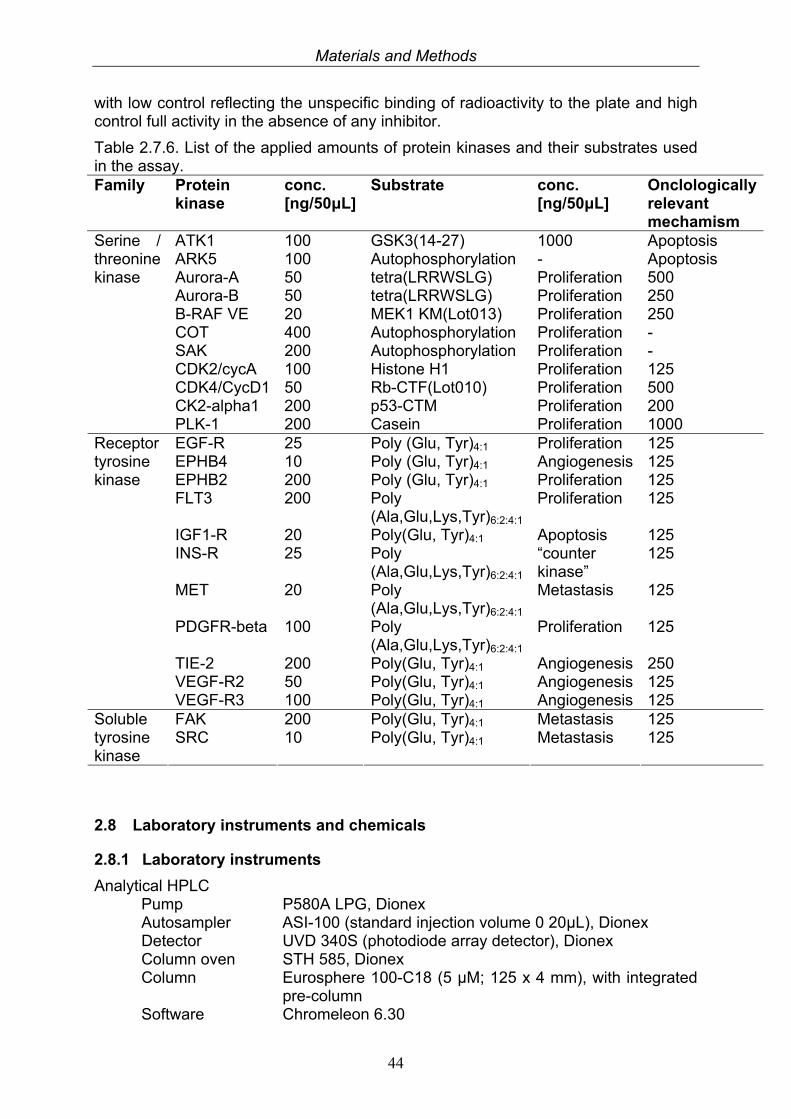
Materials and Methods
44
with low control reflecting the unspecific binding of radioactivity to the plate and high control full activity in the absence of any inhibitor.
Table 2.7.6. List of the applied amounts of protein kinases and their substrates used in the assay. Family Protein
kinase conc. [ng/50μL]
Substrate conc. [ng/50μL]
Onclologically relevant mechamism
ATK1 100 GSK3(14-27) 1000 Apoptosis ARK5 100 Autophosphorylation - Apoptosis Aurora-A 50 tetra(LRRWSLG) Proliferation 500 Aurora-B 50 tetra(LRRWSLG) Proliferation 250 B-RAF VE 20 MEK1 KM(Lot013) Proliferation 250 COT 400 Autophosphorylation Proliferation - SAK 200 Autophosphorylation Proliferation - CDK2/cycA 100 Histone H1 Proliferation 125 CDK4/CycD1 50 Rb-CTF(Lot010) Proliferation 500 CK2-alpha1 200 p53-CTM Proliferation 200
Serine / threonine kinase
PLK-1 200 Casein Proliferation 1000 EGF-R 25 Poly (Glu, Tyr)4:1 Proliferation 125 EPHB4 10 Poly (Glu, Tyr)4:1 Angiogenesis 125 EPHB2 200 Poly (Glu, Tyr)4:1 Proliferation 125 FLT3 200 Poly
(Ala,Glu,Lys,Tyr)6:2:4:1
Proliferation 125
IGF1-R 20 Poly(Glu, Tyr)4:1 Apoptosis 125 INS-R 25 Poly
(Ala,Glu,Lys,Tyr)6:2:4:1
“counter kinase”
125
MET 20 Poly (Ala,Glu,Lys,Tyr)6:2:4:1
Metastasis 125
PDGFR-beta 100 Poly (Ala,Glu,Lys,Tyr)6:2:4:1
Proliferation 125
TIE-2 200 Poly(Glu, Tyr)4:1 Angiogenesis 250 VEGF-R2 50 Poly(Glu, Tyr)4:1 Angiogenesis 125
Receptor tyrosine kinase
VEGF-R3 100 Poly(Glu, Tyr)4:1 Angiogenesis 125 FAK 200 Poly(Glu, Tyr)4:1 Metastasis 125 Soluble
tyrosine kinase
SRC 10 Poly(Glu, Tyr)4:1 Metastasis 125
2.8 Laboratory instruments and chemicals
2.8.1 Laboratory instruments
Analytical HPLC Pump P580A LPG, Dionex Autosampler ASI-100 (standard injection volume 0 20μL), Dionex Detector UVD 340S (photodiode array detector), Dionex Column oven STH 585, Dionex Column Eurosphere 100-C18 (5 μM; 125 x 4 mm), with integrated pre-column Software Chromeleon 6.30
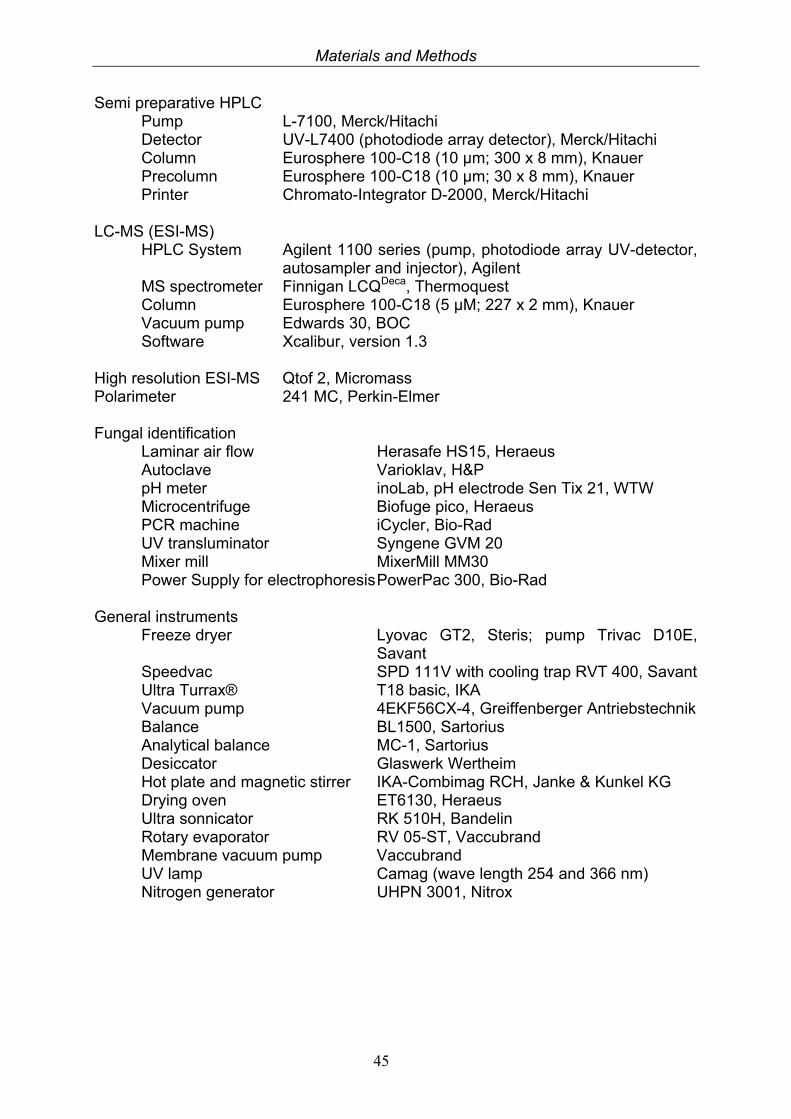
Materials and Methods
45
Semi preparative HPLC Pump L-7100, Merck/Hitachi Detector UV-L7400 (photodiode array detector), Merck/Hitachi Column Eurosphere 100-C18 (10 μm; 300 x 8 mm), Knauer Precolumn Eurosphere 100-C18 (10 μm; 30 x 8 mm), Knauer Printer Chromato-Integrator D-2000, Merck/Hitachi LC-MS (ESI-MS) HPLC System Agilent 1100 series (pump, photodiode array UV-detector, autosampler and injector), Agilent MS spectrometer Finnigan LCQDeca, Thermoquest Column Eurosphere 100-C18 (5 μM; 227 x 2 mm), Knauer Vacuum pump Edwards 30, BOC Software Xcalibur, version 1.3 High resolution ESI-MS Qtof 2, Micromass Polarimeter 241 MC, Perkin-Elmer Fungal identification Laminar air flow Herasafe HS15, Heraeus Autoclave Varioklav, H&P pH meter inoLab, pH electrode Sen Tix 21, WTW Microcentrifuge Biofuge pico, Heraeus PCR machine iCycler, Bio-Rad UV transluminator Syngene GVM 20 Mixer mill MixerMill MM30 Power Supply for electrophoresis PowerPac 300, Bio-Rad General instruments Freeze dryer Lyovac GT2, Steris; pump Trivac D10E, Savant Speedvac SPD 111V with cooling trap RVT 400, Savant Ultra Turrax® T18 basic, IKA Vacuum pump 4EKF56CX-4, Greiffenberger Antriebstechnik Balance BL1500, Sartorius Analytical balance MC-1, Sartorius Desiccator Glaswerk Wertheim Hot plate and magnetic stirrer IKA-Combimag RCH, Janke & Kunkel KG Drying oven ET6130, Heraeus Ultra sonnicator RK 510H, Bandelin Rotary evaporator RV 05-ST, Vaccubrand Membrane vacuum pump Vaccubrand UV lamp Camag (wave length 254 and 366 nm) Nitrogen generator UHPN 3001, Nitrox
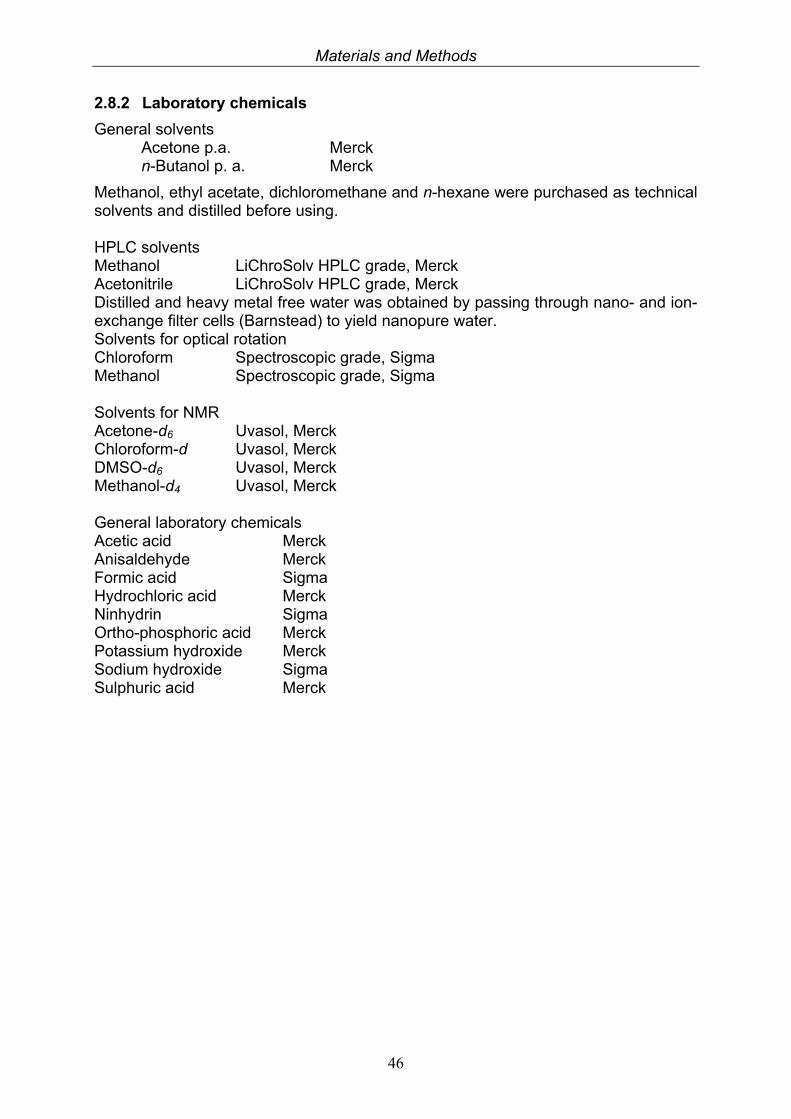
Materials and Methods
46
2.8.2 Laboratory chemicals
General solvents Acetone p.a. Merck
n-Butanol p. a. Merck
Methanol, ethyl acetate, dichloromethane and n-hexane were purchased as technical solvents and distilled before using. HPLC solvents Methanol LiChroSolv HPLC grade, Merck Acetonitrile LiChroSolv HPLC grade, Merck Distilled and heavy metal free water was obtained by passing through nano- and ion-exchange filter cells (Barnstead) to yield nanopure water. Solvents for optical rotation Chloroform Spectroscopic grade, Sigma Methanol Spectroscopic grade, Sigma Solvents for NMR Acetone-d6 Uvasol, Merck Chloroform-d Uvasol, Merck DMSO-d6 Uvasol, Merck Methanol-d4 Uvasol, Merck General laboratory chemicals Acetic acid Merck Anisaldehyde Merck Formic acid Sigma Hydrochloric acid Merck Ninhydrin Sigma Ortho-phosphoric acid Merck Potassium hydroxide Merck Sodium hydroxide Sigma Sulphuric acid Merck
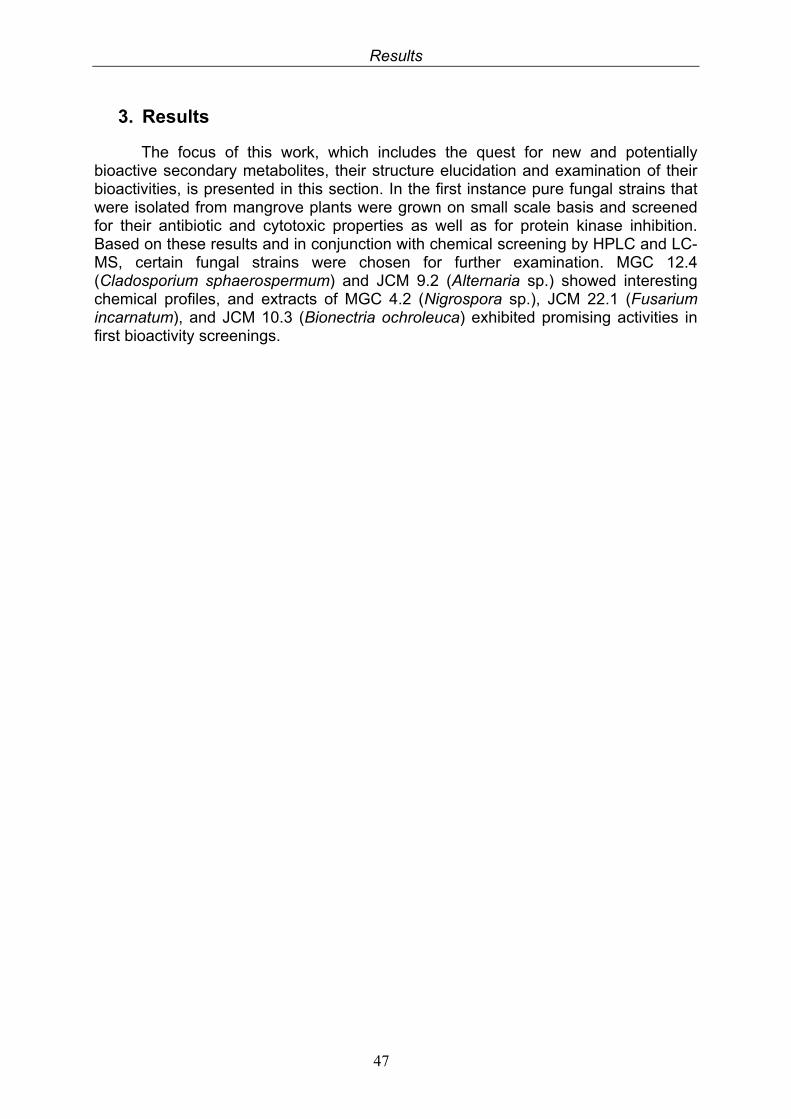
Results
47
3. Results
The focus of this work, which includes the quest for new and potentially bioactive secondary metabolites, their structure elucidation and examination of their bioactivities, is presented in this section. In the first instance pure fungal strains that were isolated from mangrove plants were grown on small scale basis and screened for their antibiotic and cytotoxic properties as well as for protein kinase inhibition. Based on these results and in conjunction with chemical screening by HPLC and LC-MS, certain fungal strains were chosen for further examination. MGC 12.4 (Cladosporium sphaerospermum) and JCM 9.2 (Alternaria sp.) showed interesting chemical profiles, and extracts of MGC 4.2 (Nigrospora sp.), JCM 22.1 (Fusarium incarnatum), and JCM 10.3 (Bionectria ochroleuca) exhibited promising activities in first bioactivity screenings.
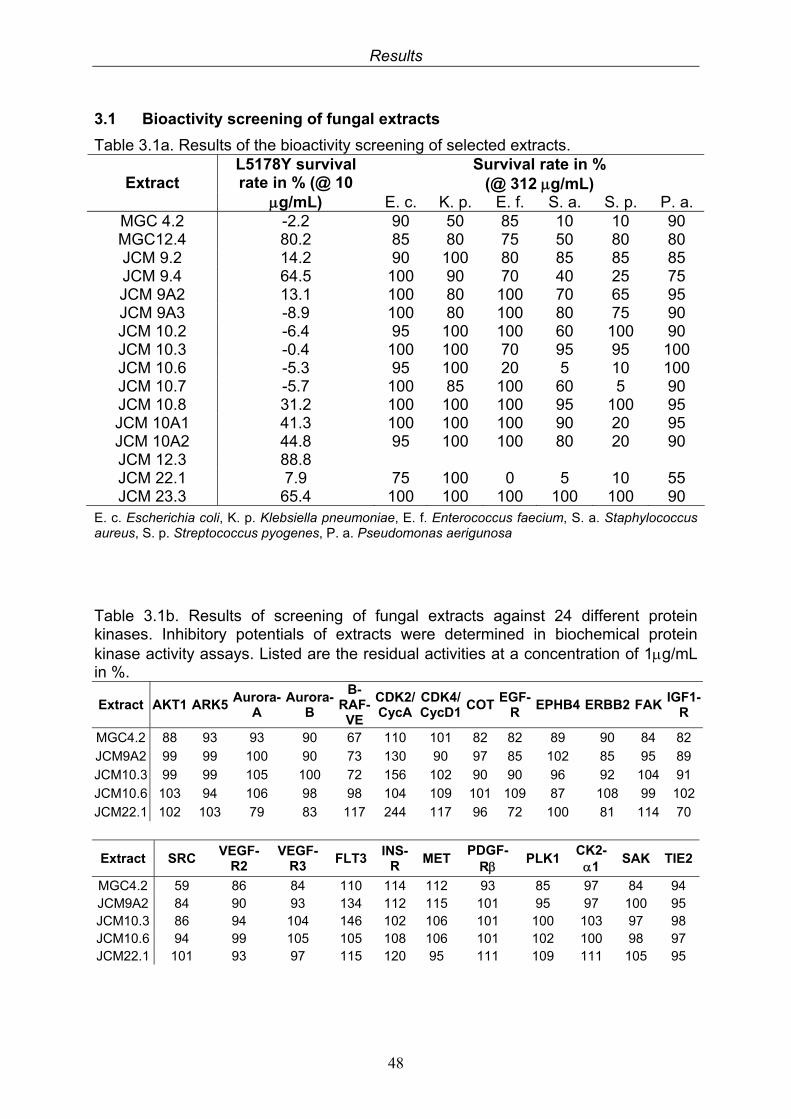
Results
48
3.1 Bioactivity screening of fungal extracts
Table 3.1a. Results of the bioactivity screening of selected extracts. Survival rate in %
(@ 312 g/mL) Extract L5178Y survival rate in % (@ 10
g/mL) E. c. K. p. E. f. S. a. S. p. P. a. MGC 4.2 -2.2 90 50 85 10 10 90 MGC12.4 80.2 85 80 75 50 80 80 JCM 9.2 14.2 90 100 80 85 85 85 JCM 9.4 64.5 100 90 70 40 25 75 JCM 9A2 13.1 100 80 100 70 65 95 JCM 9A3 -8.9 100 80 100 80 75 90 JCM 10.2 -6.4 95 100 100 60 100 90 JCM 10.3 -0.4 100 100 70 95 95 100 JCM 10.6 -5.3 95 100 20 5 10 100 JCM 10.7 -5.7 100 85 100 60 5 90 JCM 10.8 31.2 100 100 100 95 100 95 JCM 10A1 41.3 100 100 100 90 20 95 JCM 10A2 44.8 95 100 100 80 20 90 JCM 12.3 88.8 JCM 22.1 7.9 75 100 0 5 10 55 JCM 23.3 65.4 100 100 100 100 100 90
E. c. Escherichia coli, K. p. Klebsiella pneumoniae, E. f. Enterococcus faecium, S. a. Staphylococcus aureus, S. p. Streptococcus pyogenes, P. a. Pseudomonas aerigunosa
Table 3.1b. Results of screening of fungal extracts against 24 different protein kinases. Inhibitory potentials of extracts were determined in biochemical protein kinase activity assays. Listed are the residual activities at a concentration of 1g/mL in %.
Extract AKT1 ARK5 Aurora-
A Aurora-
B
B-RAF-VE
CDK2/CycA
CDK4/CycD1
COTEGF-
R EPHB4 ERBB2 FAK
IGF1-R
MGC4.2 88 93 93 90 67 110 101 82 82 89 90 84 82
JCM9A2 99 99 100 90 73 130 90 97 85 102 85 95 89
JCM10.3 99 99 105 100 72 156 102 90 90 96 92 104 91
JCM10.6 103 94 106 98 98 104 109 101 109 87 108 99 102
JCM22.1 102 103 79 83 117 244 117 96 72 100 81 114 70
Extract SRC VEGF-
R2 VEGF-
R3 FLT3
INS-R
METPDGF-
R PLK1
CK2- 1
SAK TIE2
MGC4.2 59 86 84 110 114 112 93 85 97 84 94 JCM9A2 84 90 93 134 112 115 101 95 97 100 95 JCM10.3 86 94 104 146 102 106 101 100 103 97 98 JCM10.6 94 99 105 105 108 106 101 102 100 98 97 JCM22.1 101 93 97 115 120 95 111 109 111 105 95
Results
49
3.2 Compounds isolated from the endophytic fungus Cladosporium sphaerospermum
The ethyl acetate extract obtained after fermentation of C. sphaerospermum was isolated from the mangrove plant Aegiceras corniculatum. Fermentation of the fungus in liquid medium yielded three known fungal metabolites. Beside the major compound citrinin (1) an inseparable mixture of the diastereomers quinolactacin A1 (2) and quinolactacin A2 (3) was obtained.
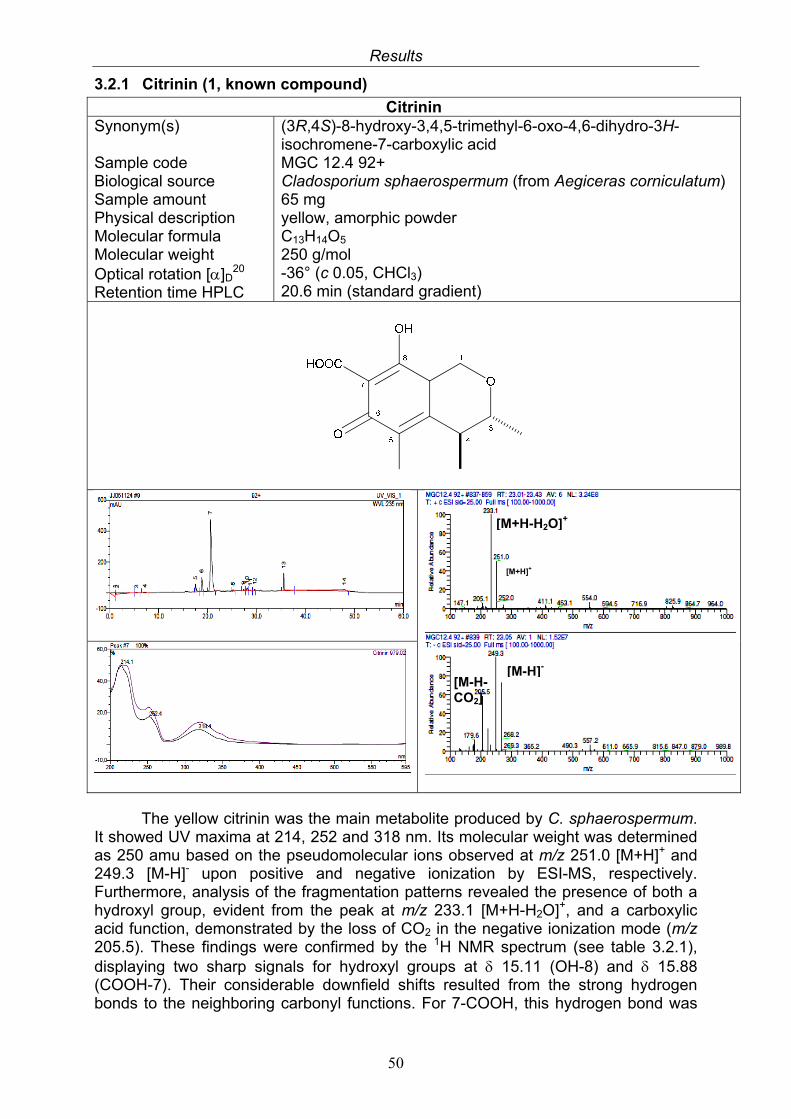
Results
50
3.2.1 Citrinin (1, known compound)
Citrinin Synonym(s) Sample code Biological source Sample amount Physical description Molecular formula Molecular weight Optical rotation []D
20 Retention time HPLC
(3R,4S)-8-hydroxy-3,4,5-trimethyl-6-oxo-4,6-dihydro-3H-isochromene-7-carboxylic acid MGC 12.4 92+ Cladosporium sphaerospermum (from Aegiceras corniculatum) 65 mg yellow, amorphic powder C13H14O5 250 g/mol -36° (c 0.05, CHCl3) 20.6 min (standard gradient)
The yellow citrinin was the main metabolite produced by C. sphaerospermum. It showed UV maxima at 214, 252 and 318 nm. Its molecular weight was determined as 250 amu based on the pseudomolecular ions observed at m/z 251.0 [M+H]+ and 249.3 [M-H]- upon positive and negative ionization by ESI-MS, respectively. Furthermore, analysis of the fragmentation patterns revealed the presence of both a hydroxyl group, evident from the peak at m/z 233.1 [M+H-H2O]+, and a carboxylic acid function, demonstrated by the loss of CO2 in the negative ionization mode (m/z 205.5). These findings were confirmed by the 1H NMR spectrum (see table 3.2.1), displaying two sharp signals for hydroxyl groups at 15.11 (OH-8) and 15.88 (COOH-7). Their considerable downfield shifts resulted from the strong hydrogen bonds to the neighboring carbonyl functions. For 7-COOH, this hydrogen bond was
[M-H-CO2]
-
[M+H-H2O]+
[M+H]+
[M-H]-
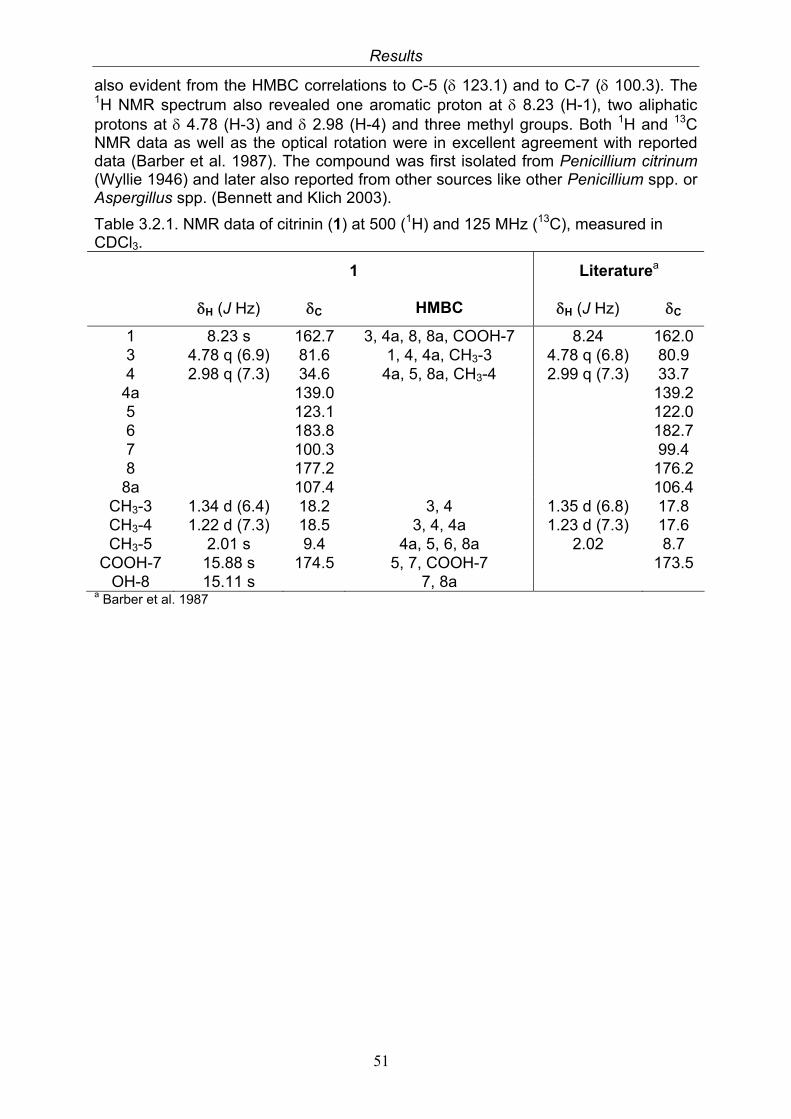
Results
51
also evident from the HMBC correlations to C-5 ( 123.1) and to C-7 ( 100.3). The 1H NMR spectrum also revealed one aromatic proton at 8.23 (H-1), two aliphatic protons at 4.78 (H-3) and 2.98 (H-4) and three methyl groups. Both 1H and 13C NMR data as well as the optical rotation were in excellent agreement with reported data (Barber et al. 1987). The compound was first isolated from Penicillium citrinum (Wyllie 1946) and later also reported from other sources like other Penicillium spp. or Aspergillus spp. (Bennett and Klich 2003).
Table 3.2.1. NMR data of citrinin (1) at 500 (1H) and 125 MHz (13C), measured in CDCl3.
1 Literaturea
H (J Hz) C HMBC H (J Hz) C
1 8.23 s 162.7 3, 4a, 8, 8a, COOH-7 8.24 162.0 3 4.78 q (6.9) 81.6 1, 4, 4a, CH3-3 4.78 q (6.8) 80.9 4 2.98 q (7.3) 34.6 4a, 5, 8a, CH3-4 2.99 q (7.3) 33.7
4a 139.0 139.2 5 123.1 122.0 6 183.8 182.7 7 100.3 99.4 8 177.2 176.2
8a 107.4 106.4 CH3-3 1.34 d (6.4) 18.2 3, 4 1.35 d (6.8) 17.8 CH3-4 1.22 d (7.3) 18.5 3, 4, 4a 1.23 d (7.3) 17.6 CH3-5 2.01 s 9.4 4a, 5, 6, 8a 2.02 8.7
COOH-7 15.88 s 174.5 5, 7, COOH-7 173.5 OH-8 15.11 s 7, 8a
a Barber et al. 1987
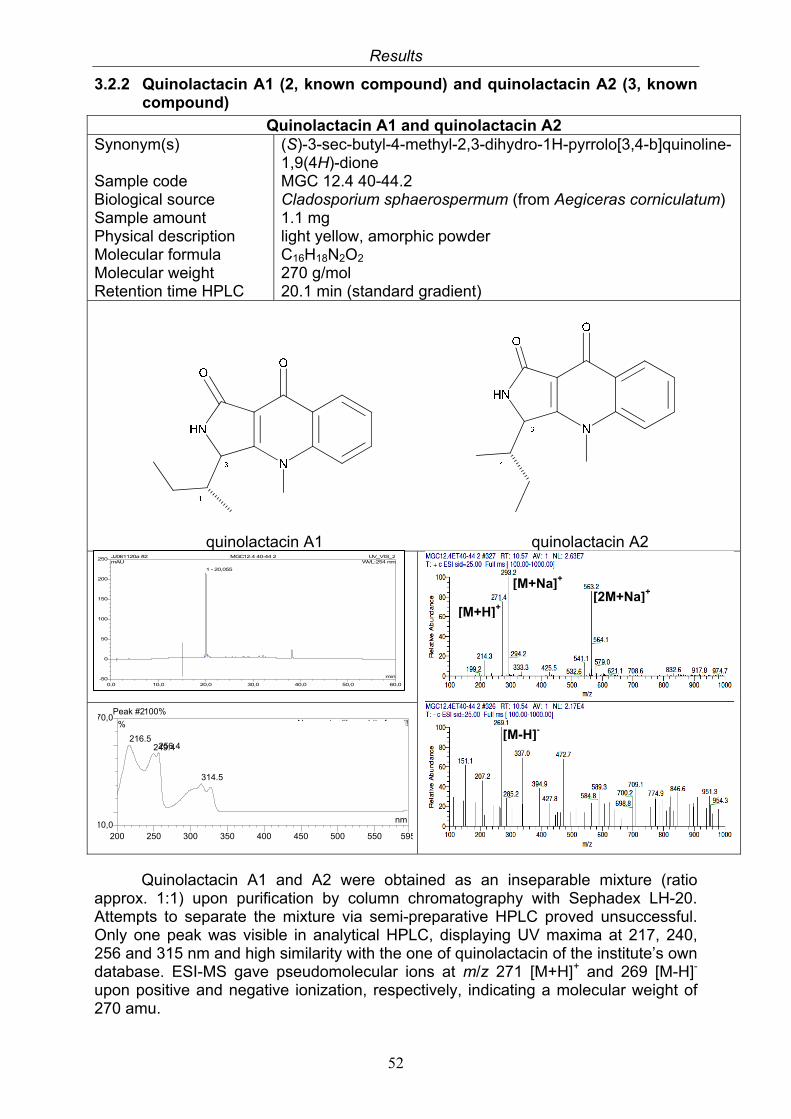
Results
52
3.2.2 Quinolactacin A1 (2, known compound) and quinolactacin A2 (3, known compound)
Quinolactacin A1 and quinolactacin A2 Synonym(s) Sample code Biological source Sample amount Physical description Molecular formula Molecular weight Retention time HPLC
(S)-3-sec-butyl-4-methyl-2,3-dihydro-1H-pyrrolo[3,4-b]quinoline-1,9(4H)-dione MGC 12.4 40-44.2 Cladosporium sphaerospermum (from Aegiceras corniculatum) 1.1 mg light yellow, amorphic powder C16H18N2O2 270 g/mol 20.1 min (standard gradient)
quinolactacin A1 quinolactacin A2
Quinolactacin A1 and A2 were obtained as an inseparable mixture (ratio approx. 1:1) upon purification by column chromatography with Sephadex LH-20. Attempts to separate the mixture via semi-preparative HPLC proved unsuccessful. Only one peak was visible in analytical HPLC, displaying UV maxima at 217, 240, 256 and 315 nm and high similarity with the one of quinolactacin of the institute’s own database. ESI-MS gave pseudomolecular ions at m/z 271 [M+H]+ and 269 [M-H]- upon positive and negative ionization, respectively, indicating a molecular weight of 270 amu.
Peak #2100%
10,0
70,0
200 250 300 350 400 450 500 550 595
%
nm
216.5256.4249.4
314.5
No spectra library hits found!
0,0 10,0 20,0 30,0 40,0 50,0 60,0-50
0
50
100
150
200
250 JJ061120a #2 MGC12.4 40-44 2 UV_VIS_2mAU
min
1 - 20,055
WVL:254 nm
[M-H]-
[M+H]+
[M+Na]+ [2M+Na]+
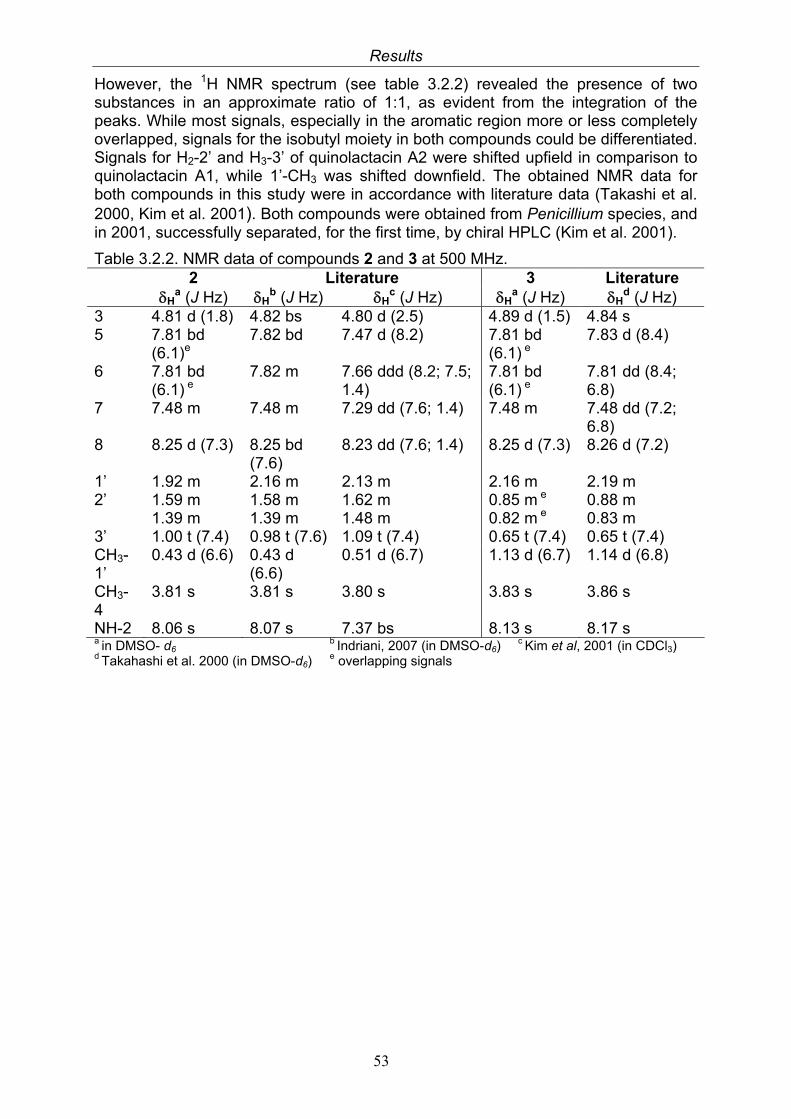
Results
53
However, the 1H NMR spectrum (see table 3.2.2) revealed the presence of two substances in an approximate ratio of 1:1, as evident from the integration of the peaks. While most signals, especially in the aromatic region more or less completely overlapped, signals for the isobutyl moiety in both compounds could be differentiated. Signals for H2-2’ and H3-3’ of quinolactacin A2 were shifted upfield in comparison to quinolactacin A1, while 1’-CH3 was shifted downfield. The obtained NMR data for both compounds in this study were in accordance with literature data (Takashi et al. 2000, Kim et al. 2001). Both compounds were obtained from Penicillium species, and in 2001, successfully separated, for the first time, by chiral HPLC (Kim et al. 2001).
Table 3.2.2. NMR data of compounds 2 and 3 at 500 MHz. 2 Literature 3 Literature H
a (J Hz) Hb (J Hz) H
c (J Hz) Ha (J Hz) H
d (J Hz) 3 4.81 d (1.8) 4.82 bs 4.80 d (2.5) 4.89 d (1.5) 4.84 s 5 7.81 bd
(6.1)e 7.82 bd 7.47 d (8.2) 7.81 bd
(6.1) e 7.83 d (8.4)
6 7.81 bd (6.1) e
7.82 m 7.66 ddd (8.2; 7.5; 1.4)
7.81 bd (6.1) e
7.81 dd (8.4; 6.8)
7 7.48 m 7.48 m 7.29 dd (7.6; 1.4) 7.48 m 7.48 dd (7.2; 6.8)
8 8.25 d (7.3) 8.25 bd (7.6)
8.23 dd (7.6; 1.4) 8.25 d (7.3) 8.26 d (7.2)
1’ 1.92 m 2.16 m 2.13 m 2.16 m 2.19 m 2’ 1.59 m
1.39 m 1.58 m 1.39 m
1.62 m 1.48 m
0.85 m e 0.82 m e
0.88 m 0.83 m
3’ 1.00 t (7.4) 0.98 t (7.6) 1.09 t (7.4) 0.65 t (7.4) 0.65 t (7.4) CH3-1’
0.43 d (6.6) 0.43 d (6.6)
0.51 d (6.7) 1.13 d (6.7) 1.14 d (6.8)
CH3-4
3.81 s 3.81 s 3.80 s 3.83 s 3.86 s
NH-2 8.06 s 8.07 s 7.37 bs 8.13 s 8.17 s a in DMSO- d6
b Indriani, 2007 (in DMSO-d6) c Kim et al, 2001 (in CDCl3)
d Takahashi et al. 2000 (in DMSO-d6) e overlapping signals
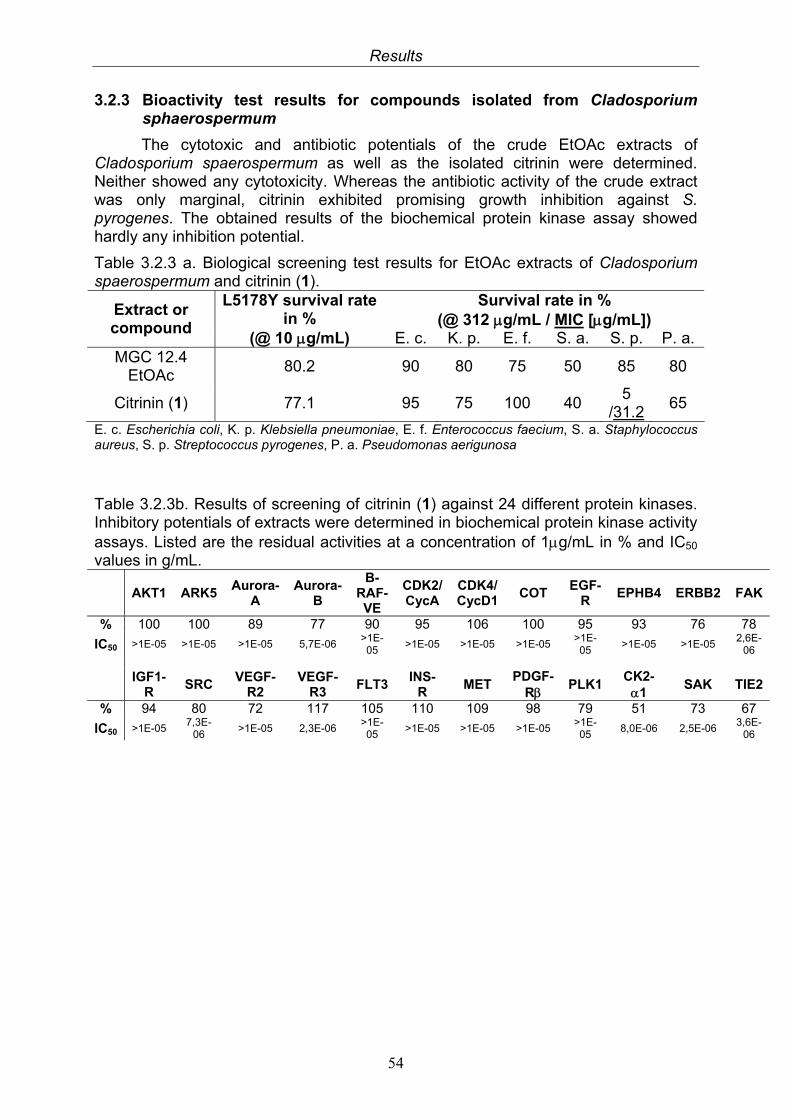
Results
54
3.2.3 Bioactivity test results for compounds isolated from Cladosporium sphaerospermum
The cytotoxic and antibiotic potentials of the crude EtOAc extracts of Cladosporium spaerospermum as well as the isolated citrinin were determined. Neither showed any cytotoxicity. Whereas the antibiotic activity of the crude extract was only marginal, citrinin exhibited promising growth inhibition against S. pyrogenes. The obtained results of the biochemical protein kinase assay showed hardly any inhibition potential.
Table 3.2.3 a. Biological screening test results for EtOAc extracts of Cladosporium spaerospermum and citrinin (1).
Survival rate in % (@ 312 g/mL / MIC [g/mL])
Extract or compound
L5178Y survival rate in %
(@ 10 g/mL) E. c. K. p. E. f. S. a. S. p. P. a. MGC 12.4
EtOAc 80.2 90 80 75 50 85 80
Citrinin (1) 77.1 95 75 100 40 5
/31.2 65
E. c. Escherichia coli, K. p. Klebsiella pneumoniae, E. f. Enterococcus faecium, S. a. Staphylococcus aureus, S. p. Streptococcus pyrogenes, P. a. Pseudomonas aerigunosa
Table 3.2.3b. Results of screening of citrinin (1) against 24 different protein kinases. Inhibitory potentials of extracts were determined in biochemical protein kinase activity assays. Listed are the residual activities at a concentration of 1g/mL in % and IC50 values in g/mL.
AKT1 ARK5 Aurora-
A Aurora-
B
B-RAF-VE
CDK2/CycA
CDK4/CycD1
COT EGF-
R EPHB4 ERBB2 FAK
% 100 100 89 77 90 95 106 100 95 93 76 78
IC50 >1E-05 >1E-05 >1E-05 5,7E-06 >1E-05
>1E-05 >1E-05 >1E-05 >1E-05
>1E-05 >1E-05 2,6E-
06
IGF1-
R SRC
VEGF- R2
VEGF-R3
FLT3INS-
R MET
PDGF-R
PLK1 CK2- 1
SAK TIE2
% 94 80 72 117 105 110 109 98 79 51 73 67
IC50 >1E-05 7,3E-
06 >1E-05 2,3E-06
>1E-05
>1E-05 >1E-05 >1E-05 >1E-05
8,0E-06 2,5E-06 3,6E-
06
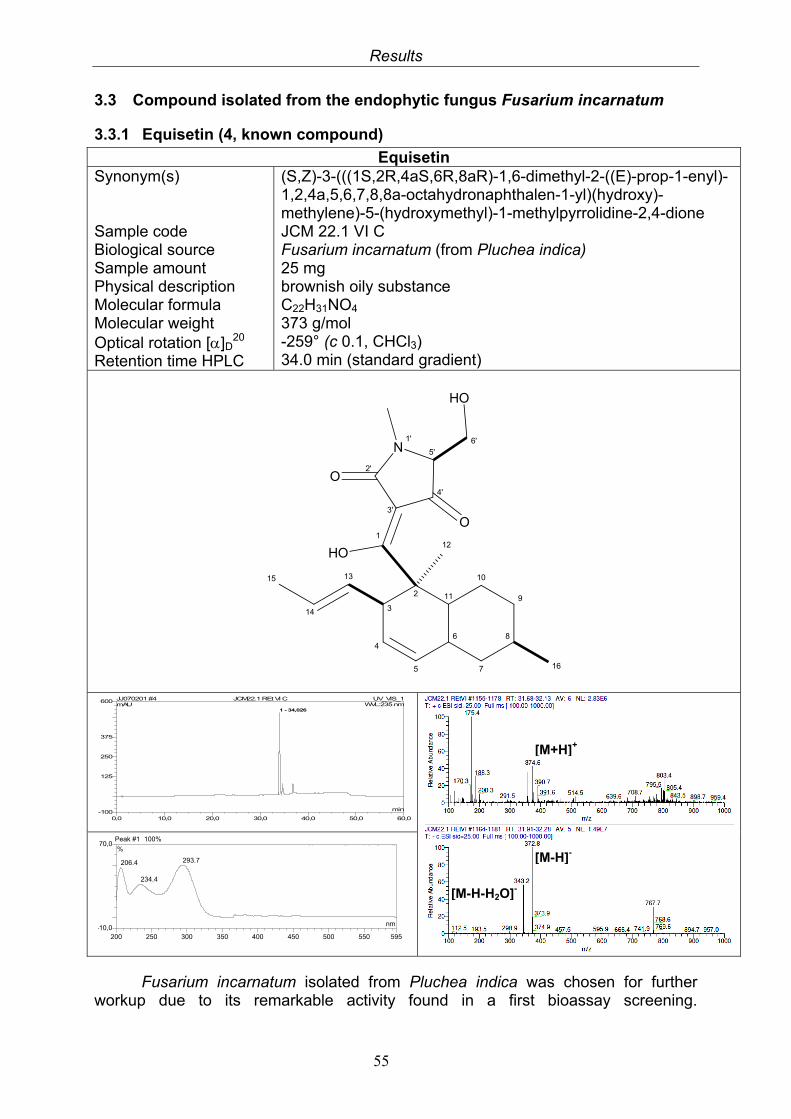
Results
55
3.3 Compound isolated from the endophytic fungus Fusarium incarnatum
3.3.1 Equisetin (4, known compound)
Equisetin Synonym(s) Sample code Biological source Sample amount Physical description Molecular formula Molecular weight Optical rotation []D
20 Retention time HPLC
(S,Z)-3-(((1S,2R,4aS,6R,8aR)-1,6-dimethyl-2-((E)-prop-1-enyl)-1,2,4a,5,6,7,8,8a-octahydronaphthalen-1-yl)(hydroxy)-methylene)-5-(hydroxymethyl)-1-methylpyrrolidine-2,4-dione JCM 22.1 VI C Fusarium incarnatum (from Pluchea indica) 25 mg brownish oily substance C22H31NO4
373 g/mol -259° (c 0.1, CHCl3) 34.0 min (standard gradient)
3
4
5
6
112
7
8
9
10
1
3'
4'
5'N1'
2'O
O
6'
HO
12HO
16
13
14
15
Fusarium incarnatum isolated from Pluchea indica was chosen for further workup due to its remarkable activity found in a first bioassay screening.
Peak #1 100%
-10,0
70,0
200 250 300 350 400 450 500 550 595
%
nm
293.7206.4
234.4
No spectra library hits found!
0,0 10,0 20,0 30,0 40,0 50,0 60,0-100
125
250
375
600 JJ070201 #4 JCM22.1 REt VI C UV_VIS_1mAU
min
1 - 34,026WVL:235 nm
[M-H]-
[M+H]+
[M+H-C9H9NO4]+
[M+H-C15H23]+
[M-H-COH2]-
[M-H]-
[M-H-H2O]-
[M+H]+
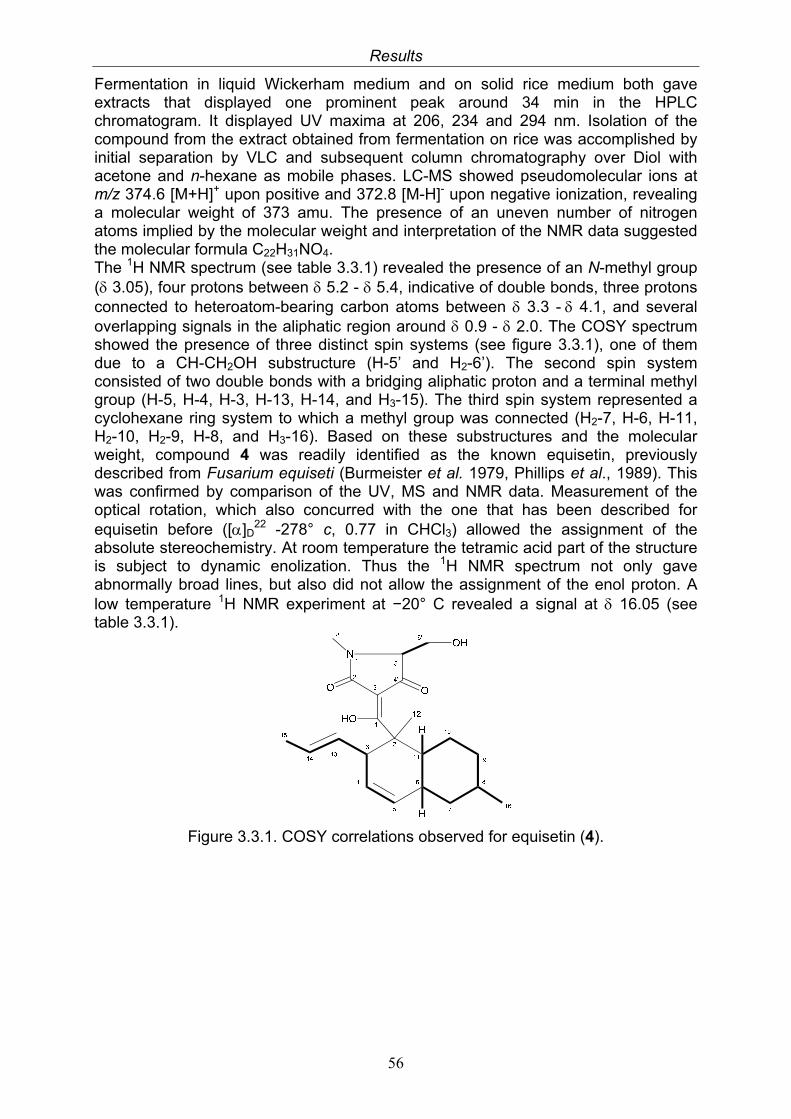
Results
56
Fermentation in liquid Wickerham medium and on solid rice medium both gave extracts that displayed one prominent peak around 34 min in the HPLC chromatogram. It displayed UV maxima at 206, 234 and 294 nm. Isolation of the compound from the extract obtained from fermentation on rice was accomplished by initial separation by VLC and subsequent column chromatography over Diol with acetone and n-hexane as mobile phases. LC-MS showed pseudomolecular ions at m/z 374.6 [M+H]+ upon positive and 372.8 [M-H]- upon negative ionization, revealing a molecular weight of 373 amu. The presence of an uneven number of nitrogen atoms implied by the molecular weight and interpretation of the NMR data suggested the molecular formula C22H31NO4. The 1H NMR spectrum (see table 3.3.1) revealed the presence of an N-methyl group ( 3.05), four protons between 5.2 - 5.4, indicative of double bonds, three protons connected to heteroatom-bearing carbon atoms between 3.3 - 4.1, and several overlapping signals in the aliphatic region around 0.9 - 2.0. The COSY spectrum showed the presence of three distinct spin systems (see figure 3.3.1), one of them due to a CH-CH2OH substructure (H-5’ and H2-6’). The second spin system consisted of two double bonds with a bridging aliphatic proton and a terminal methyl group (H-5, H-4, H-3, H-13, H-14, and H3-15). The third spin system represented a cyclohexane ring system to which a methyl group was connected (H2-7, H-6, H-11, H2-10, H2-9, H-8, and H3-16). Based on these substructures and the molecular weight, compound 4 was readily identified as the known equisetin, previously described from Fusarium equiseti (Burmeister et al. 1979, Phillips et al., 1989). This was confirmed by comparison of the UV, MS and NMR data. Measurement of the optical rotation, which also concurred with the one that has been described for equisetin before ([]D
22 -278° c, 0.77 in CHCl3) allowed the assignment of the absolute stereochemistry. At room temperature the tetramic acid part of the structure is subject to dynamic enolization. Thus the 1H NMR spectrum not only gave abnormally broad lines, but also did not allow the assignment of the enol proton. A low temperature 1H NMR experiment at −20° C revealed a signal at 16.05 (see table 3.3.1).
Figure 3.3.1. COSY correlations observed for equisetin (4).
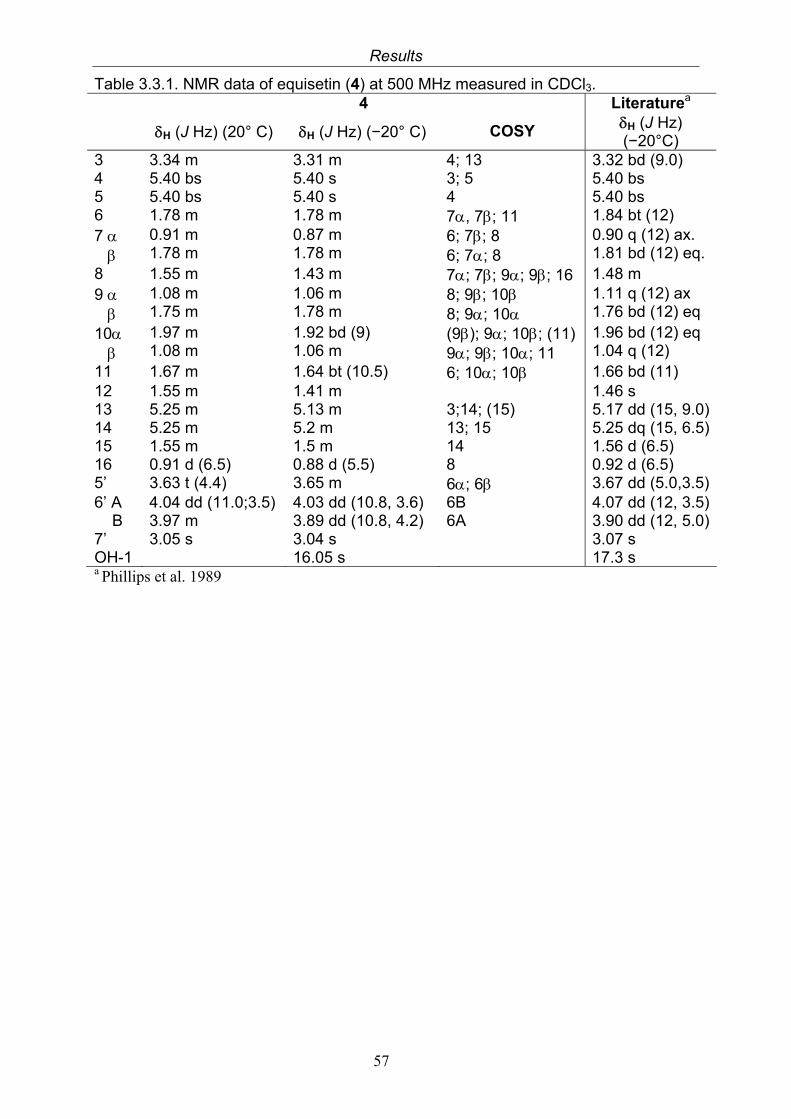
Results
57
Table 3.3.1. NMR data of equisetin (4) at 500 MHz measured in CDCl3. 4 Literaturea
H (J Hz) (20° C) H (J Hz) (−20° C) COSY H (J Hz) (−20°C)
3 3.34 m 3.31 m 4; 13 3.32 bd (9.0) 4 5.40 bs 5.40 s 3; 5 5.40 bs 5 5.40 bs 5.40 s 4 5.40 bs 6 1.78 m 1.78 m 7, 7; 11 1.84 bt (12) 7
0.91 m 1.78 m
0.87 m 1.78 m
6; 7; 8 6; 7; 8
0.90 q (12) ax. 1.81 bd (12) eq.
8 1.55 m 1.43 m 7; 7; 9; 9; 16 1.48 m 9
1.08 m 1.75 m
1.06 m 1.78 m
8; 9; 10 8; 9; 10
1.11 q (12) ax 1.76 bd (12) eq
10
1.97 m 1.08 m
1.92 bd (9) 1.06 m
(9); 9; 10; (11) 9; 9; 10; 11
1.96 bd (12) eq 1.04 q (12)
11 1.67 m 1.64 bt (10.5) 6; 10; 10 1.66 bd (11) 12 1.55 m 1.41 m 1.46 s 13 5.25 m 5.13 m 3;14; (15) 5.17 dd (15, 9.0)14 5.25 m 5.2 m 13; 15 5.25 dq (15, 6.5)15 1.55 m 1.5 m 14 1.56 d (6.5) 16 0.91 d (6.5) 0.88 d (5.5) 8 0.92 d (6.5) 5’ 3.63 t (4.4) 3.65 m 6; 6 3.67 dd (5.0,3.5)6’ A B
4.04 dd (11.0;3.5) 3.97 m
4.03 dd (10.8, 3.6) 3.89 dd (10.8, 4.2)
6B 6A
4.07 dd (12, 3.5)3.90 dd (12, 5.0)
7’ 3.05 s 3.04 s 3.07 s OH-1 16.05 s 17.3 s a Phillips et al. 1989
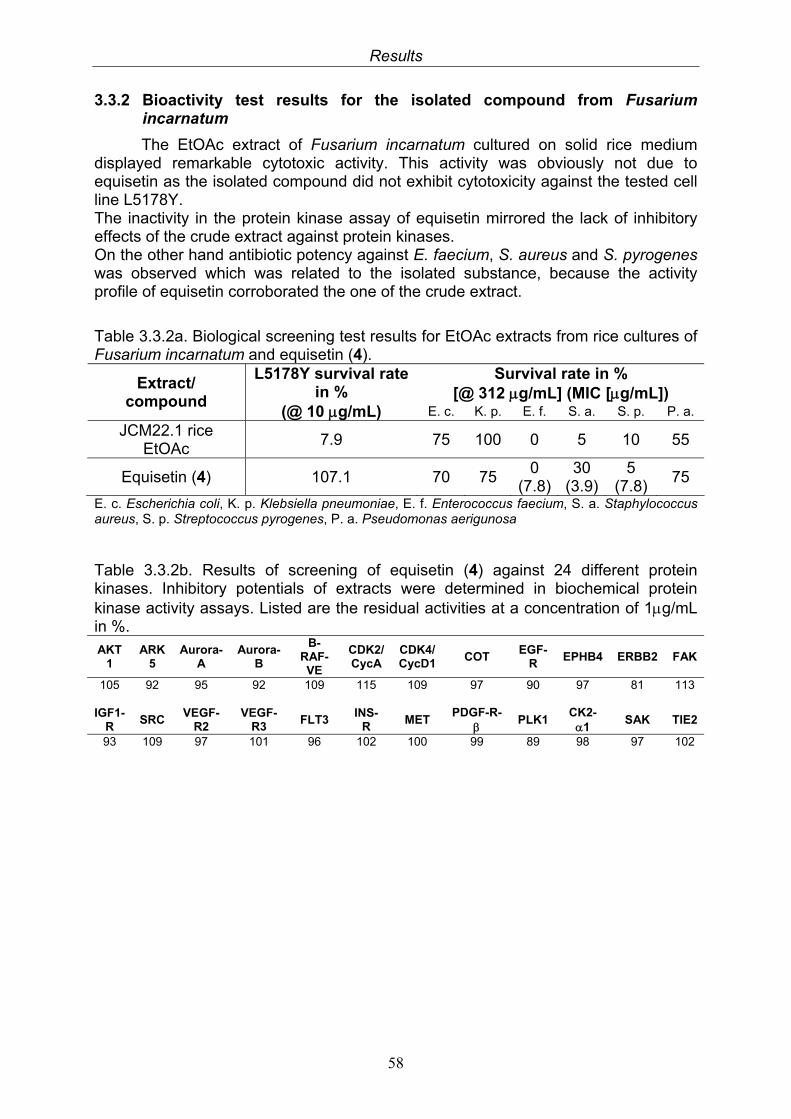
Results
58
3.3.2 Bioactivity test results for the isolated compound from Fusarium incarnatum
The EtOAc extract of Fusarium incarnatum cultured on solid rice medium displayed remarkable cytotoxic activity. This activity was obviously not due to equisetin as the isolated compound did not exhibit cytotoxicity against the tested cell line L5178Y. The inactivity in the protein kinase assay of equisetin mirrored the lack of inhibitory effects of the crude extract against protein kinases. On the other hand antibiotic potency against E. faecium, S. aureus and S. pyrogenes was observed which was related to the isolated substance, because the activity profile of equisetin corroborated the one of the crude extract.
Table 3.3.2a. Biological screening test results for EtOAc extracts from rice cultures of Fusarium incarnatum and equisetin (4).
Survival rate in % [@ 312 g/mL] (MIC [g/mL])
Extract/ compound
L5178Y survival rate in %
(@ 10 g/mL) E. c. K. p. E. f. S. a. S. p. P. a.
JCM22.1 rice EtOAc
7.9 75 100 0 5 10 55
Equisetin (4) 107.1 70 75 0
(7.8)30
(3.9) 5
(7.8) 75
E. c. Escherichia coli, K. p. Klebsiella pneumoniae, E. f. Enterococcus faecium, S. a. Staphylococcus aureus, S. p. Streptococcus pyrogenes, P. a. Pseudomonas aerigunosa
Table 3.3.2b. Results of screening of equisetin (4) against 24 different protein kinases. Inhibitory potentials of extracts were determined in biochemical protein kinase activity assays. Listed are the residual activities at a concentration of 1g/mL in %. AKT
1 ARK
5 Aurora-
A Aurora-
B
B-RAF- VE
CDK2/CycA
CDK4/CycD1
COT EGF-
R EPHB4 ERBB2 FAK
105 92 95 92 109 115 109 97 90 97 81 113
IGF1- R
SRC VEGF-
R2 VEGF-
R3 FLT3
INS- R
MET PDGF-R-
PLK1
CK2- 1
SAK TIE2
93 109 97 101 96 102 100 99 89 98 97 102
Results
59
3.4 Compounds isolated from the endophytic fungus Nigrospora sp.
The endophyte Nigrospora sp. was isolated from the mangrove plant Bruguiera sexangula. Fermentation in liquid Wickerham medium and on solid rice medium afforded ethyl acetate extracts of different composition. Grown in liquid medium, the fungus yielded two known compounds, aloesol (5) and deoxybostrycin (7), and the new natural product 8-hydroxytetrahydroaltersolanol B (6). Fermentation on rice medium rendered three known secondary metabolites, bostrycin (8), tenuazonic acid (9) and indole-3-carbaldehyde (10) and the new cyclic dipeptide cyclo(threonylisoleucinyl) (11). Comparison of the HPLC chromatograms of the ethyl acetate extracts (see figure 3.4) revealed a difference in the chemical patterns, whereas deoxybostrycin (7) and 8-hydroxytetrahydroaltersolanol B (6) were the main constituents of the liquid EtOAc extract, bostrycin (8), tenuazonic acid (9) were found to be the main components of the rice EtOAc extract. Both crude extracts were submitted to cytotoxicity and antibacterial screening. They both exhibited a strong inhibition against L5187Y cell line. The antibacterial profile on the other hand, revealed slight differences. No inhibition to marginal inhibition was found against E. coli, K. pneumoniae, E. faecium and P. aeruginosa. The liquid extract also exhibited only moderate antibiotic activity against S. aureus and S. pyrogenes, whereas the rice extract showed strong inhibition against these germs.
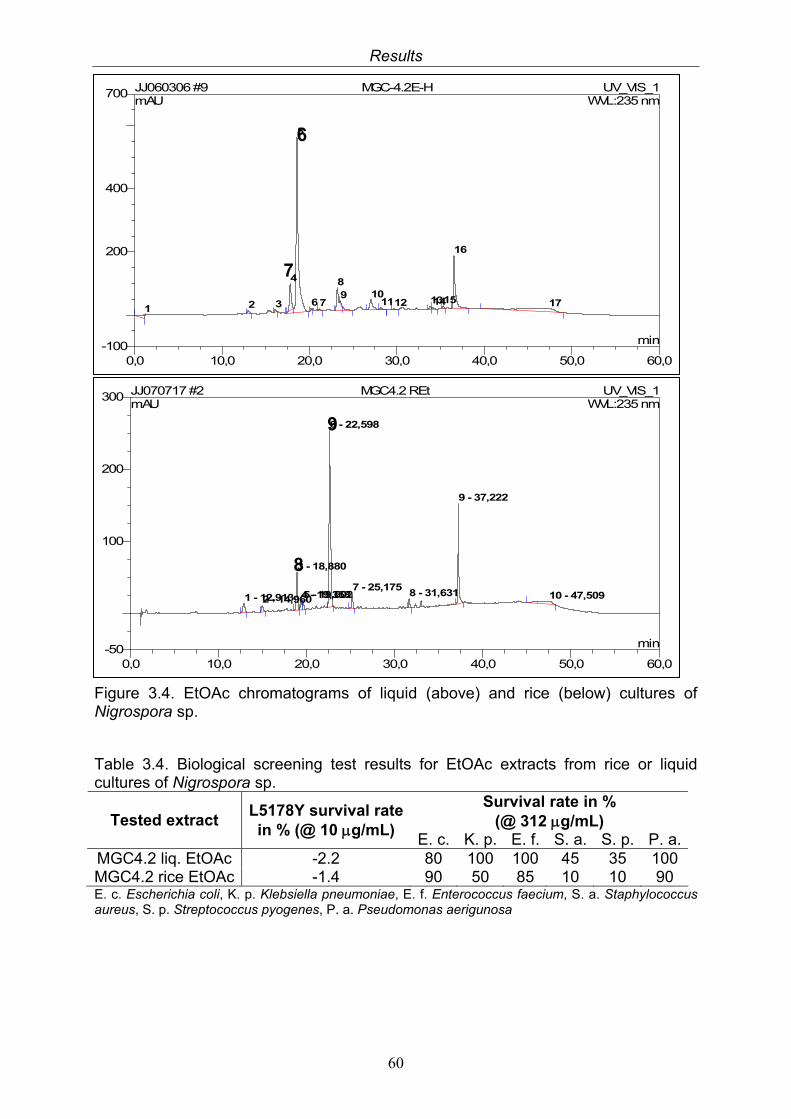
Results
60
Figure 3.4. EtOAc chromatograms of liquid (above) and rice (below) cultures of Nigrospora sp.
Table 3.4. Biological screening test results for EtOAc extracts from rice or liquid cultures of Nigrospora sp.
Survival rate in % (@ 312 g/mL) Tested extract
L5178Y survival ratein % (@ 10 g/mL)
E. c. K. p. E. f. S. a. S. p. P. a.MGC4.2 liq. EtOAc -2.2 80 100 100 45 35 100 MGC4.2 rice EtOAc -1.4 90 50 85 10 10 90 E. c. Escherichia coli, K. p. Klebsiella pneumoniae, E. f. Enterococcus faecium, S. a. Staphylococcus aureus, S. p. Streptococcus pyogenes, P. a. Pseudomonas aerigunosa
0,0 10,0 20,0 30,0 40,0 50,0 60,0-50
100
200
300 JJ070717 #2 MGC4.2 REt UV_VIS_1mAU
min
1 - 12,9132 - 14,960
3 - 18,880
4 - 19,3585 - 19,602
6 - 22,598
7 - 25,1758 - 31,631
9 - 37,222
10 - 47,509
WVL:235 nm
0,0 10,0 20,0 30,0 40,0 50,0 60,0-100
200
400
700 JJ060306 #9 MGC-4.2E-H UV_VIS_1mAU
min
1 2 3
4
5
67
89 10
1112 131415
16
17
WVL:235 nm
7
6
8
9
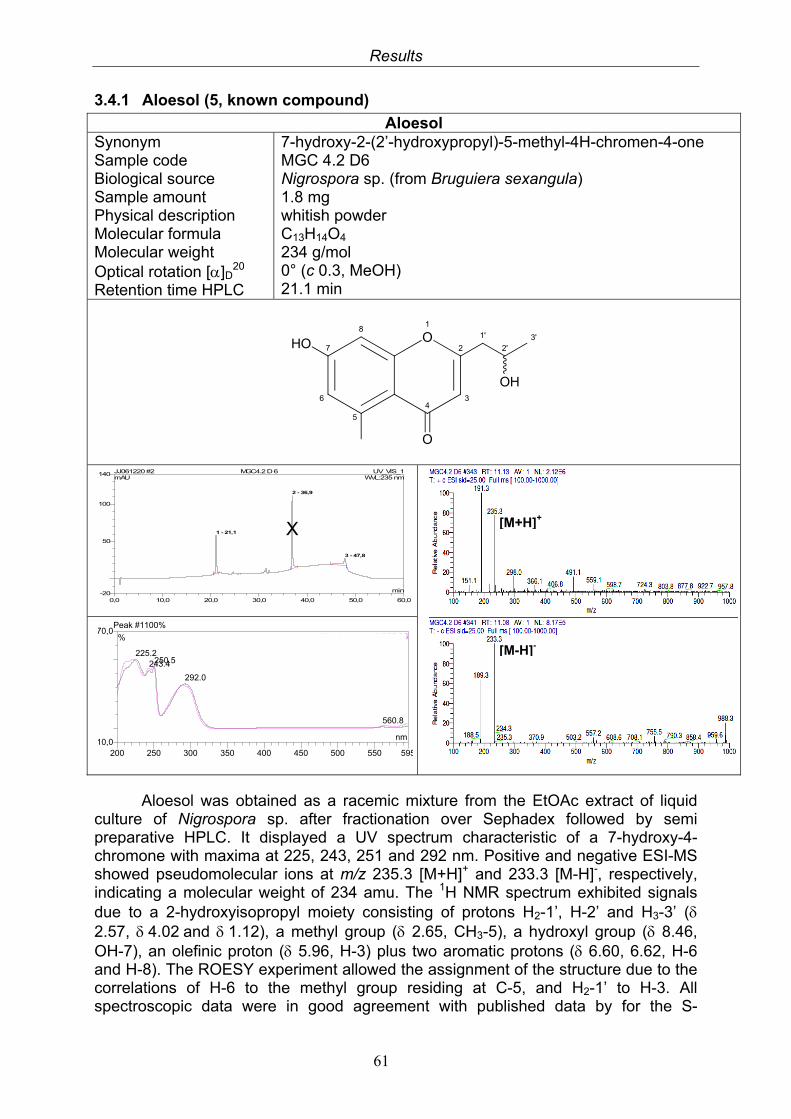
Results
61
3.4.1 Aloesol (5, known compound)
Aloesol Synonym Sample code Biological source Sample amount Physical description Molecular formula Molecular weight Optical rotation []D
20 Retention time HPLC
7-hydroxy-2-(2’-hydroxypropyl)-5-methyl-4H-chromen-4-one MGC 4.2 D6 Nigrospora sp. (from Bruguiera sexangula) 1.8 mg whitish powder C13H14O4 234 g/mol 0° (c 0.3, MeOH) 21.1 min
7
6
5
8
43
2O1
O
HO1'
2'3'
OH
Aloesol was obtained as a racemic mixture from the EtOAc extract of liquid culture of Nigrospora sp. after fractionation over Sephadex followed by semi preparative HPLC. It displayed a UV spectrum characteristic of a 7-hydroxy-4-chromone with maxima at 225, 243, 251 and 292 nm. Positive and negative ESI-MS showed pseudomolecular ions at m/z 235.3 [M+H]+ and 233.3 [M-H]-, respectively, indicating a molecular weight of 234 amu. The 1H NMR spectrum exhibited signals due to a 2-hydroxyisopropyl moiety consisting of protons H2-1’, H-2’ and H3-3’ ( 2.57, 4.02and 1.12), a methyl group ( 2.65, CH3-5), a hydroxyl group ( 8.46, OH-7), an olefinic proton ( 5.96, H-3) plus two aromatic protons ( 6.60, 6.62, H-6 and H-8). The ROESY experiment allowed the assignment of the structure due to the correlations of H-6 to the methyl group residing at C-5, and H2-1’ to H-3. All spectroscopic data were in good agreement with published data by for the S-
Peak #1100%
10,0
70,0
200 250 300 350 400 450 500 550 595
%
nm
225.2250.5243.4
292.0
560.8
Altechromone A 992.96
0,0 10,0 20,0 30,0 40,0 50,0 60,0-20
50
100
140 JJ061220 #2 MGC4.2 D 6 UV_VIS_1mAU
min
1 - 21,1
2 - 36,9
3 - 47,8
WVL:235 nm
X
[M-H]-
[M+H]+
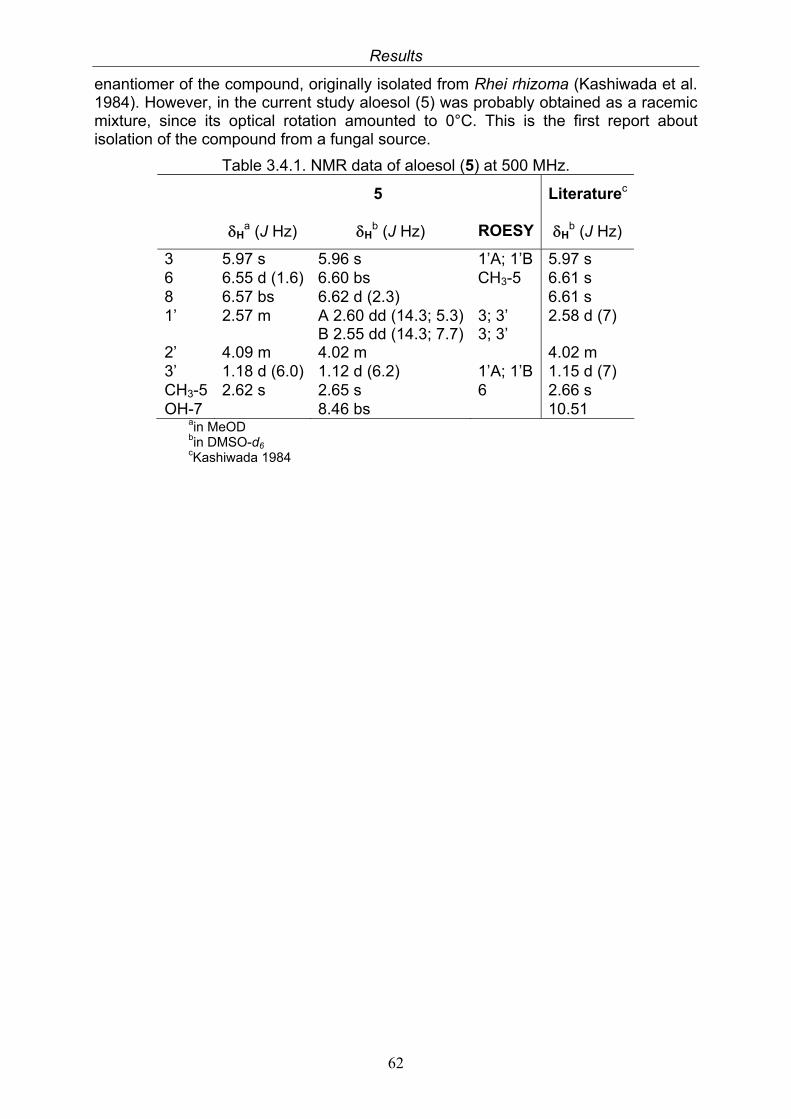
Results
62
enantiomer of the compound, originally isolated from Rhei rhizoma (Kashiwada et al. 1984). However, in the current study aloesol (5) was probably obtained as a racemic mixture, since its optical rotation amounted to 0°C. This is the first report about isolation of the compound from a fungal source.
Table 3.4.1. NMR data of aloesol (5) at 500 MHz.
5 Literaturec
Ha (J Hz) H
b (J Hz) ROESY Hb (J Hz)
3 5.97 s 5.96 s 1’A; 1’B 5.97 s 6 6.55 d (1.6) 6.60 bs CH3-5 6.61 s 8 6.57 bs 6.62 d (2.3) 6.61 s 1’ 2.57 m A 2.60 dd (14.3; 5.3)
B 2.55 dd (14.3; 7.7)3; 3’ 3; 3’
2.58 d (7)
2’ 4.09 m 4.02 m 4.02 m 3’ 1.18 d (6.0) 1.12 d (6.2) 1’A; 1’B 1.15 d (7) CH3-5 2.62 s 2.65 s 6 2.66 s OH-7 8.46 bs 10.51
ain MeOD bin DMSO-d6 cKashiwada 1984
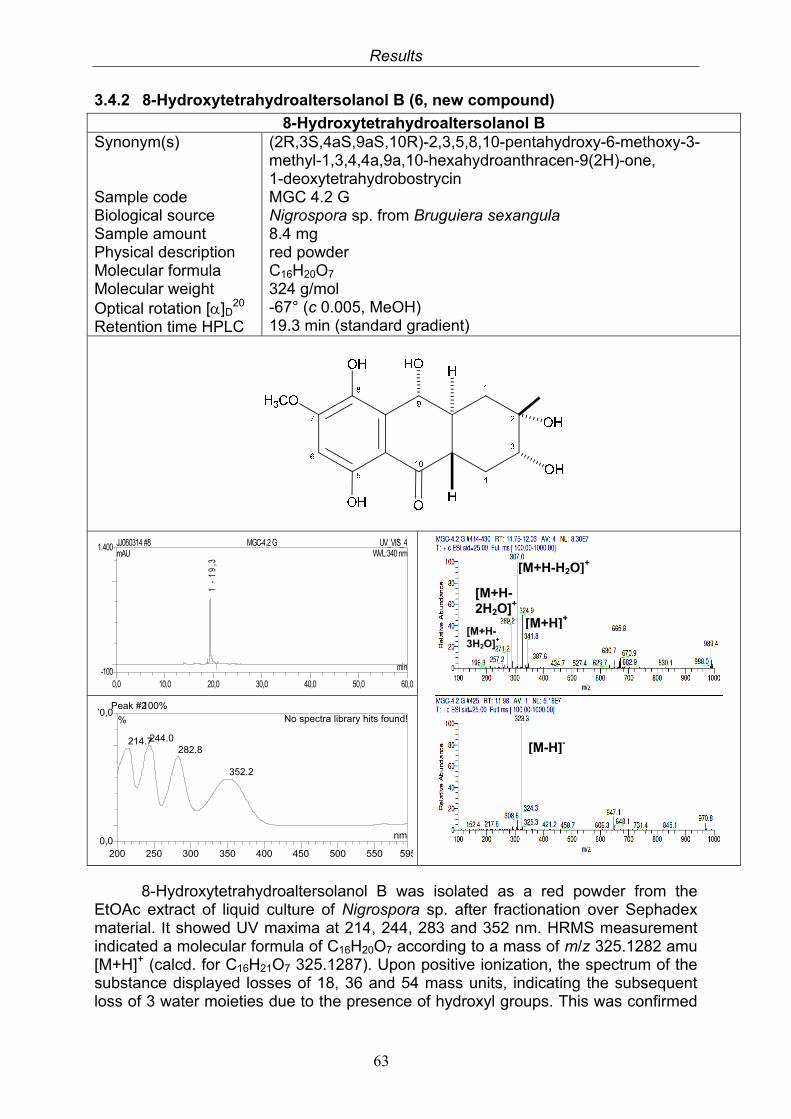
Results
63
3.4.2 8-Hydroxytetrahydroaltersolanol B (6, new compound)
8-Hydroxytetrahydroaltersolanol B Synonym(s) Sample code Biological source Sample amount Physical description Molecular formula Molecular weight Optical rotation []D
20 Retention time HPLC
(2R,3S,4aS,9aS,10R)-2,3,5,8,10-pentahydroxy-6-methoxy-3-methyl-1,3,4,4a,9a,10-hexahydroanthracen-9(2H)-one, 1-deoxytetrahydrobostrycin MGC 4.2 G Nigrospora sp. from Bruguiera sexangula 8.4 mg red powder C16H20O7 324 g/mol -67° (c 0.005, MeOH) 19.3 min (standard gradient)
8-Hydroxytetrahydroaltersolanol B was isolated as a red powder from the EtOAc extract of liquid culture of Nigrospora sp. after fractionation over Sephadex material. It showed UV maxima at 214, 244, 283 and 352 nm. HRMS measurement indicated a molecular formula of C16H20O7 according to a mass of m/z 325.1282 amu [M+H]+ (calcd. for C16H21O7 325.1287). Upon positive ionization, the spectrum of the substance displayed losses of 18, 36 and 54 mass units, indicating the subsequent loss of 3 water moieties due to the presence of hydroxyl groups. This was confirmed
0,0 10,0 20,0 30,0 40,0 50,0 60,0-100
1.400 JJ060314 #8 MGC-4.2 G UV_VIS_4mAU
min
1 -
19
,3
WVL:340 nm
Peak #2100%
0,0
70,0
200 250 300 350 400 450 500 550 595
%
nm
244.0214.7282.8
352.2
No spectra library hits found!
[M+H-H2O]+
[M-H]-
[M+H-2H2O]+
[M+H-3H2O]+
[M+H]+
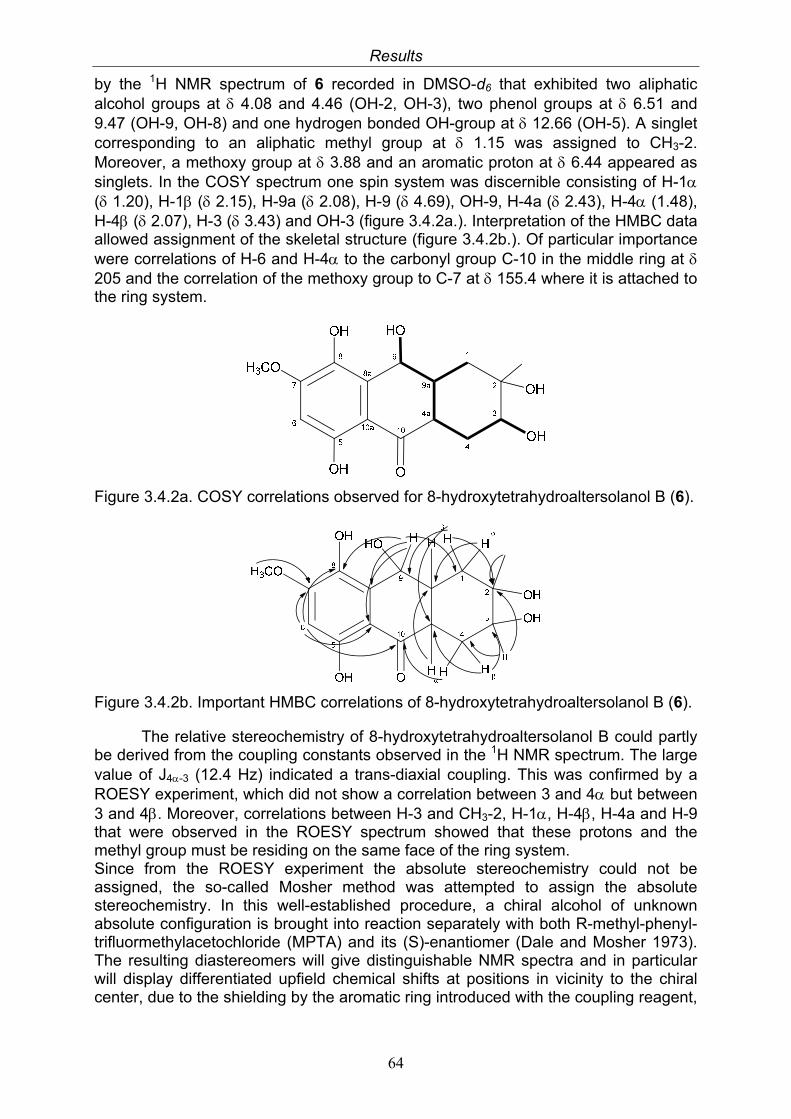
Results
64
by the 1H NMR spectrum of 6 recorded in DMSO-d6 that exhibited two aliphatic alcohol groups at 4.08 and 4.46 (OH-2, OH-3), two phenol groups at 6.51 and 9.47 (OH-9, OH-8) and one hydrogen bonded OH-group at 12.66 (OH-5). A singlet corresponding to an aliphatic methyl group at 1.15 was assigned to CH3-2. Moreover, a methoxy group at 3.88 and an aromatic proton at 6.44 appeared as singlets. In the COSY spectrum one spin system was discernible consisting of H-1 ( 1.20), H-1 ( 2.15), H-9a ( 2.08), H-9 ( 4.69), OH-9, H-4a ( 2.43), H-4 (1.48), H-4 ( 2.07), H-3 ( 3.43) and OH-3 (figure 3.4.2a.). Interpretation of the HMBC data allowed assignment of the skeletal structure (figure 3.4.2b.). Of particular importance were correlations of H-6 and H-4 to the carbonyl group C-10 in the middle ring at 205 and the correlation of the methoxy group to C-7 at 155.4 where it is attached to the ring system.
Figure 3.4.2a. COSY correlations observed for 8-hydroxytetrahydroaltersolanol B (6).
Figure 3.4.2b. Important HMBC correlations of 8-hydroxytetrahydroaltersolanol B (6).
The relative stereochemistry of 8-hydroxytetrahydroaltersolanol B could partly be derived from the coupling constants observed in the 1H NMR spectrum. The large value of J4-3 (12.4 Hz) indicated a trans-diaxial coupling. This was confirmed by a ROESY experiment, which did not show a correlation between 3 and 4 but between 3 and 4. Moreover, correlations between H-3 and CH3-2, H-1, H-4, H-4a and H-9 that were observed in the ROESY spectrum showed that these protons and the methyl group must be residing on the same face of the ring system. Since from the ROESY experiment the absolute stereochemistry could not be assigned, the so-called Mosher method was attempted to assign the absolute stereochemistry. In this well-established procedure, a chiral alcohol of unknown absolute configuration is brought into reaction separately with both R-methyl-phenyl-trifluormethylacetochloride (MPTA) and its (S)-enantiomer (Dale and Mosher 1973). The resulting diastereomers will give distinguishable NMR spectra and in particular will display differentiated upfield chemical shifts at positions in vicinity to the chiral center, due to the shielding by the aromatic ring introduced with the coupling reagent,
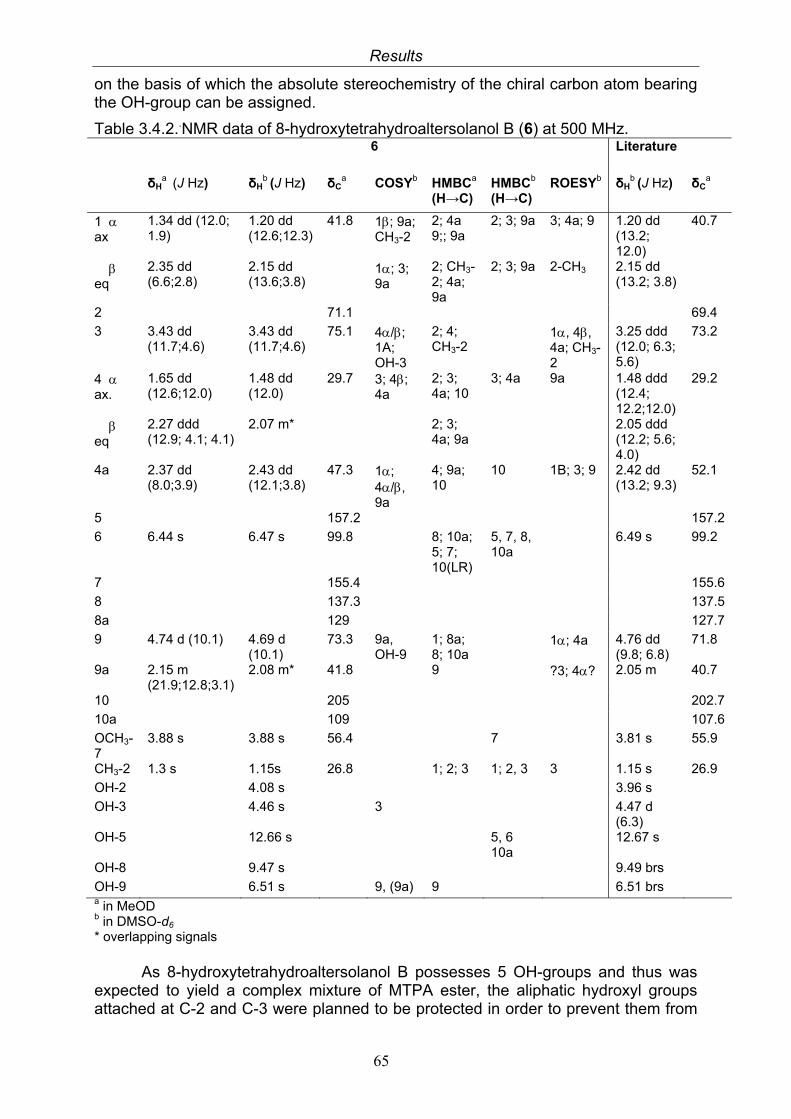
Results
65
on the basis of which the absolute stereochemistry of the chiral carbon atom bearing the OH-group can be assigned.
Table 3.4.2..NMR data of 8-hydroxytetrahydroaltersolanol B (6) at 500 MHz. 6 Literature
δHa (J Hz) δH
b (J Hz) δC
a COSYb HMBCa
(H→C) HMBCb (H→C)
ROESYb δHb (J Hz) δC
a
1 ax eq
1.34 dd (12.0; 1.9) 2.35 dd (6.6;2.8)
1.20 dd (12.6;12.3) 2.15 dd (13.6;3.8)
41.8 1; 9a; CH3-2 1; 3; 9a
2; 4a 9;; 9a 2; CH3-2; 4a; 9a
2; 3; 9a 2; 3; 9a
3; 4a; 9 2-CH3
1.20 dd (13.2; 12.0) 2.15 dd (13.2; 3.8)
40.7
2 71.1 69.4
3 3.43 dd (11.7;4.6)
3.43 dd (11.7;4.6)
75.1 4/; 1A; OH-3
2; 4; CH3-2
1, 4, 4a; CH3-2
3.25 ddd (12.0; 6.3; 5.6)
73.2
4 ax. eq
1.65 dd (12.6;12.0) 2.27 ddd (12.9; 4.1; 4.1)
1.48 dd (12.0) 2.07 m*
29.7 3; 4; 4a
2; 3; 4a; 10 2; 3; 4a; 9a
3; 4a
9a
1.48 ddd (12.4; 12.2;12.0) 2.05 ddd (12.2; 5.6; 4.0)
29.2
4a
2.37 dd (8.0;3.9)
2.43 dd (12.1;3.8)
47.3 1; 4/, 9a
4; 9a; 10
10 1B; 3; 9 2.42 dd (13.2; 9.3)
52.1
5 157.2 157.2
6 6.44 s 6.47 s 99.8 8; 10a; 5; 7; 10(LR)
5, 7, 8, 10a
6.49 s 99.2
7 155.4 155.6
8 137.3 137.5
8a 129 127.7
9 4.74 d (10.1) 4.69 d (10.1)
73.3 9a, OH-9
1; 8a; 8; 10a
1; 4a 4.76 dd (9.8; 6.8)
71.8
9a 2.15 m (21.9;12.8;3.1)
2.08 m* 41.8 9 ?3; 4? 2.05 m 40.7
10 205 202.7
10a 109 107.6
OCH3-7
3.88 s 3.88 s 56.4 7 3.81 s 55.9
CH3-2 1.3 s 1.15s 26.8 1; 2; 3 1; 2, 3 3 1.15 s 26.9
OH-2 4.08 s 3.96 s
OH-3 4.46 s 3 4.47 d (6.3)
OH-5 12.66 s 5, 6 10a
12.67 s
OH-8 9.47 s 9.49 brs
OH-9 6.51 s 9, (9a) 9 6.51 brs a in MeOD b in DMSO-d6 * overlapping signals
As 8-hydroxytetrahydroaltersolanol B possesses 5 OH-groups and thus was
expected to yield a complex mixture of MTPA ester, the aliphatic hydroxyl groups attached at C-2 and C-3 were planned to be protected in order to prevent them from
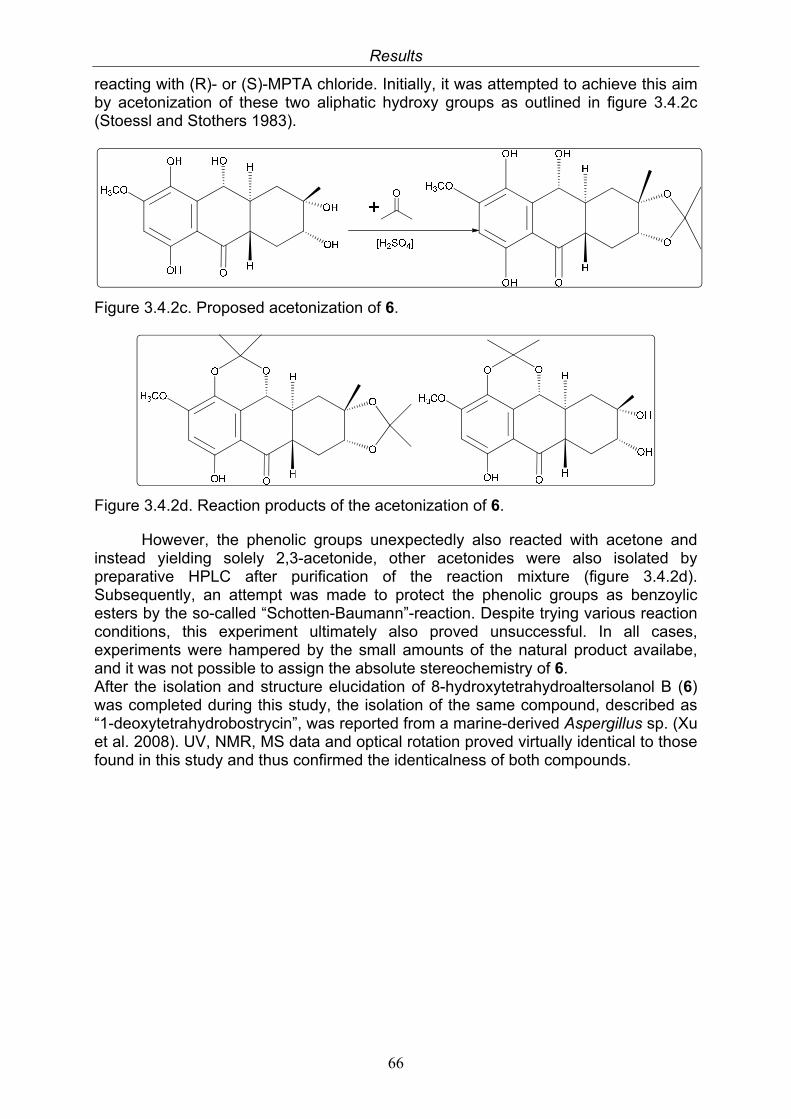
Results
66
reacting with (R)- or (S)-MPTA chloride. Initially, it was attempted to achieve this aim by acetonization of these two aliphatic hydroxy groups as outlined in figure 3.4.2c (Stoessl and Stothers 1983).
Figure 3.4.2c. Proposed acetonization of 6.
Figure 3.4.2d. Reaction products of the acetonization of 6.
However, the phenolic groups unexpectedly also reacted with acetone and instead yielding solely 2,3-acetonide, other acetonides were also isolated by preparative HPLC after purification of the reaction mixture (figure 3.4.2d). Subsequently, an attempt was made to protect the phenolic groups as benzoylic esters by the so-called “Schotten-Baumann”-reaction. Despite trying various reaction conditions, this experiment ultimately also proved unsuccessful. In all cases, experiments were hampered by the small amounts of the natural product availabe, and it was not possible to assign the absolute stereochemistry of 6. After the isolation and structure elucidation of 8-hydroxytetrahydroaltersolanol B (6) was completed during this study, the isolation of the same compound, described as “1-deoxytetrahydrobostrycin”, was reported from a marine-derived Aspergillus sp. (Xu et al. 2008). UV, NMR, MS data and optical rotation proved virtually identical to those found in this study and thus confirmed the identicalness of both compounds.
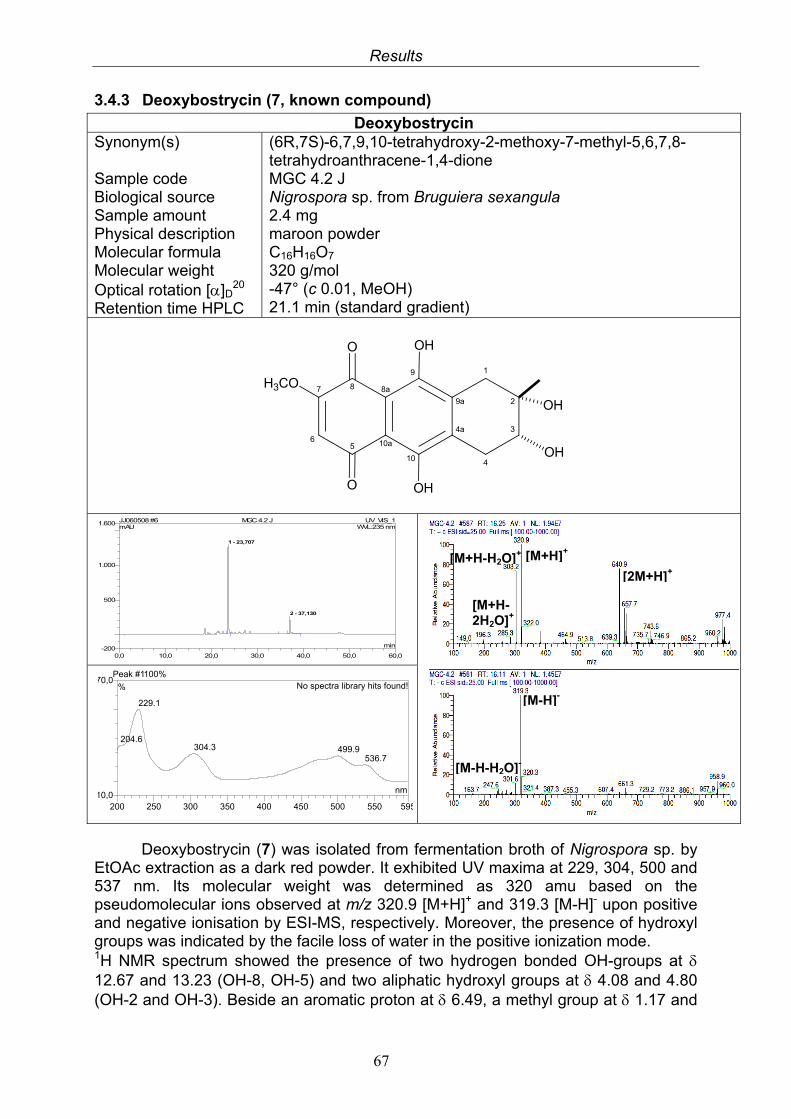
Results
67
3.4.3 Deoxybostrycin (7, known compound)
Deoxybostrycin Synonym(s) Sample code Biological source Sample amount Physical description Molecular formula Molecular weight Optical rotation []D
20 Retention time HPLC
(6R,7S)-6,7,9,10-tetrahydroxy-2-methoxy-7-methyl-5,6,7,8-tetrahydroanthracene-1,4-dione MGC 4.2 J Nigrospora sp. from Bruguiera sexangula 2.4 mg maroon powder C16H16O7 320 g/mol -47° (c 0.01, MeOH) 21.1 min (standard gradient)
10a
10
4a
9a
8a
9
5
1
2
4
36
8
OH
7
O
OH
OH
OH
H3CO
O
Deoxybostrycin (7) was isolated from fermentation broth of Nigrospora sp. by EtOAc extraction as a dark red powder. It exhibited UV maxima at 229, 304, 500 and 537 nm. Its molecular weight was determined as 320 amu based on the pseudomolecular ions observed at m/z 320.9 [M+H]+ and 319.3 [M-H]- upon positive and negative ionisation by ESI-MS, respectively. Moreover, the presence of hydroxyl groups was indicated by the facile loss of water in the positive ionization mode. 1H NMR spectrum showed the presence of two hydrogen bonded OH-groups at 12.67 and 13.23 (OH-8, OH-5) and two aliphatic hydroxyl groups at 4.08 and 4.80 (OH-2 and OH-3). Beside an aromatic proton at 6.49, a methyl group at 1.17 and
Peak #1100%
10,0
70,0
200 250 300 350 400 450 500 550 595
%
nm
229.1
204.6304.3 499.9
536.7
No spectra library hits found!
0,0 10,0 20,0 30,0 40,0 50,0 60,0-200
500
1.000
1.600 JJ060508 #6 MGC 4.2 J UV_VIS_1mAU
min
1 - 23,707
2 - 37,130
WVL:235 nm
[M+H]+ [M+H-H2O]+
[2M+H]+
[M-H-H2O]-
[M-H]-
[M+H-2H2O]+
Results
68
a methoxy group at 3.90 were also observable. Compared to the spectrum of 6, with otherwise very similar chemical shifts and coupling constants, one proton signal and one hydroxyl signal were missing. Together with the difference of 14 amu found in the MS, this indicated a higher oxygenized substance. Based on these results and the high similarity with data found in literature (Noda et al. 1970), 7 was identified as the deoxybostrycin. This phytotoxin was previously reported from Bostryconema alpestre and endophytic Alternaria eichorniae (Noda et al. 1970, Charudattan 1982)
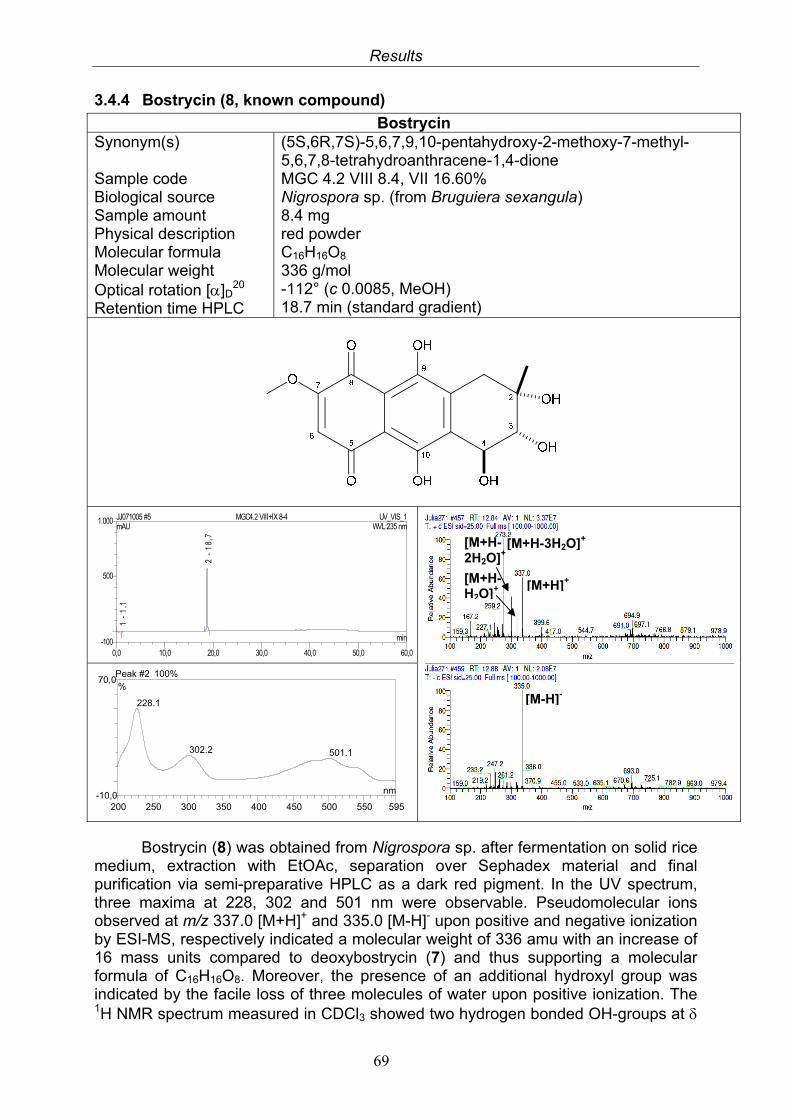
Results
69
3.4.4 Bostrycin (8, known compound)
Bostrycin Synonym(s) Sample code Biological source Sample amount Physical description Molecular formula Molecular weight Optical rotation []D
20 Retention time HPLC
(5S,6R,7S)-5,6,7,9,10-pentahydroxy-2-methoxy-7-methyl-5,6,7,8-tetrahydroanthracene-1,4-dione MGC 4.2 VIII 8.4, VII 16.60% Nigrospora sp. (from Bruguiera sexangula) 8.4 mg red powder C16H16O8 336 g/mol -112° (c 0.0085, MeOH) 18.7 min (standard gradient)
Bostrycin (8) was obtained from Nigrospora sp. after fermentation on solid rice medium, extraction with EtOAc, separation over Sephadex material and final purification via semi-preparative HPLC as a dark red pigment. In the UV spectrum, three maxima at 228, 302 and 501 nm were observable. Pseudomolecular ions observed at m/z 337.0 [M+H]+ and 335.0 [M-H]- upon positive and negative ionization by ESI-MS, respectively indicated a molecular weight of 336 amu with an increase of 16 mass units compared to deoxybostrycin (7) and thus supporting a molecular formula of C16H16O8. Moreover, the presence of an additional hydroxyl group was indicated by the facile loss of three molecules of water upon positive ionization. The 1H NMR spectrum measured in CDCl3 showed two hydrogen bonded OH-groups at
0,0 10,0 20,0 30,0 40,0 50,0 60,0-100
500
1.000 JJ071005 #5 MGC4.2 VIII+IX 8-4 UV_VIS_1mAU
min
1 -
1,1
2 -
18
,7
WVL:235 nm
[M+H]+
[M+H-3H2O]+
[M-H]-
[M+H-2H2O]+
[M+H-H2O]+
Peak #2 100%
-10,0
70,0
200 250 300 350 400 450 500 550 595
%
nm
228.1
302.2 501.1
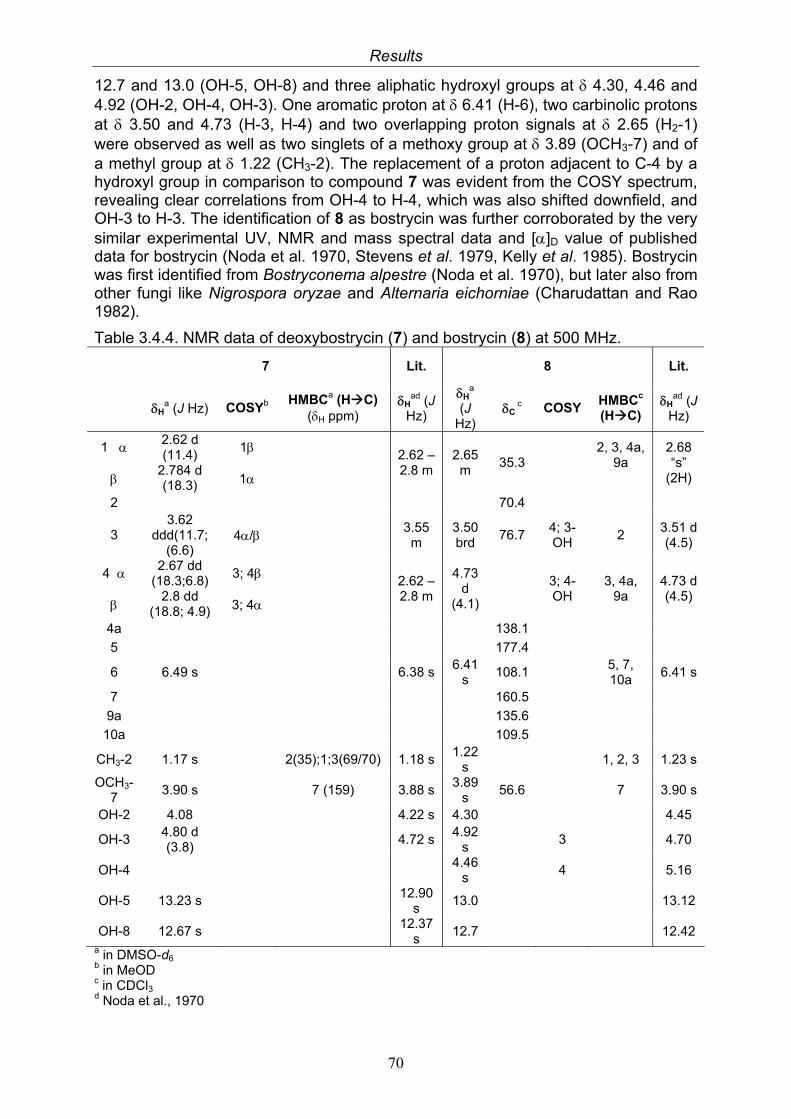
Results
70
12.7 and 13.0 (OH-5, OH-8) and three aliphatic hydroxyl groups at 4.30, 4.46 and 4.92 (OH-2, OH-4, OH-3). One aromatic proton at 6.41 (H-6), two carbinolic protons at 3.50 and 4.73 (H-3, H-4) and two overlapping proton signals at 2.65 (H2-1) were observed as well as two singlets of a methoxy group at 3.89 (OCH3-7) and of a methyl group at 1.22 (CH3-2). The replacement of a proton adjacent to C-4 by a hydroxyl group in comparison to compound 7 was evident from the COSY spectrum, revealing clear correlations from OH-4 to H-4, which was also shifted downfield, and OH-3 to H-3. The identification of 8 as bostrycin was further corroborated by the very similar experimental UV, NMR and mass spectral data and []D value of published data for bostrycin (Noda et al. 1970, Stevens et al. 1979, Kelly et al. 1985). Bostrycin was first identified from Bostryconema alpestre (Noda et al. 1970), but later also from other fungi like Nigrospora oryzae and Alternaria eichorniae (Charudattan and Rao 1982).
Table 3.4.4. NMR data of deoxybostrycin (7) and bostrycin (8) at 500 MHz.
7 Lit. 8 Lit.
H
a (J Hz) COSYb HMBCa (HC)
(H ppm) H
ad (J Hz)
Ha
(J Hz)
C c COSY
HMBCc (HC)
Had (J
Hz)
1
2.62 d (11.4)
2.784 d (18.3)
1
1
2.62 – 2.8 m
2.65 m
35.3 2, 3, 4a,
9a
2.68 “s”
(2H)
2 70.4
3 3.62
ddd(11.7; (6.6)
4/ 3.55
m 3.50 brd
76.7 4; 3-OH
2 3.51 d (4.5)
4
2.67 dd (18.3;6.8)
2.8 dd (18.8; 4.9)
3; 4
3; 4
2.62 – 2.8 m
4.73 d
(4.1)
3; 4-OH
3, 4a, 9a
4.73 d (4.5)
4a 138.1
5 177.4
6 6.49 s 6.38 s 6.41
s 108.1
5, 7, 10a
6.41 s
7 160.5
9a 135.6
10a 109.5
CH3-2 1.17 s 2(35);1;3(69/70) 1.18 s 1.22
s 1, 2, 3 1.23 s
OCH3-7
3.90 s 7 (159) 3.88 s 3.89
s 56.6 7 3.90 s
OH-2 4.08 4.22 s 4.30 4.45
OH-3 4.80 d (3.8)
4.72 s 4.92
s 3 4.70
OH-4 4.46
s 4 5.16
OH-5 13.23 s 12.90
s 13.0 13.12
OH-8 12.67 s 12.37
s 12.7 12.42
a in DMSO-d6 b in MeOD c in CDCl3 d Noda et al., 1970
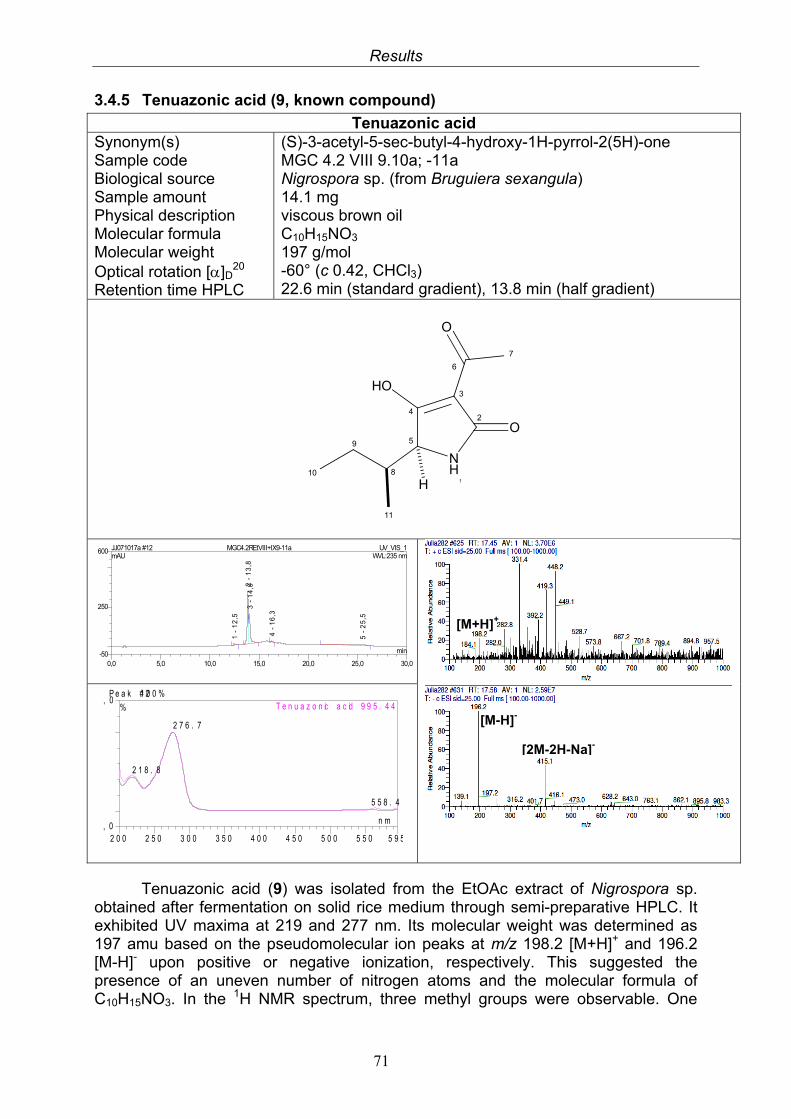
Results
71
3.4.5 Tenuazonic acid (9, known compound)
Tenuazonic acid Synonym(s) Sample code Biological source Sample amount Physical description Molecular formula Molecular weight Optical rotation []D
20 Retention time HPLC
(S)-3-acetyl-5-sec-butyl-4-hydroxy-1H-pyrrol-2(5H)-one MGC 4.2 VIII 9.10a; -11a Nigrospora sp. (from Bruguiera sexangula) 14.1 mg viscous brown oil C10H15NO3 197 g/mol -60° (c 0.42, CHCl3) 22.6 min (standard gradient), 13.8 min (half gradient)
4
5
NH
1
3
8
9
10
6
O
7
O
HO
11
H
2
Tenuazonic acid (9) was isolated from the EtOAc extract of Nigrospora sp. obtained after fermentation on solid rice medium through semi-preparative HPLC. It exhibited UV maxima at 219 and 277 nm. Its molecular weight was determined as 197 amu based on the pseudomolecular ion peaks at m/z 198.2 [M+H]+ and 196.2 [M-H]- upon positive or negative ionization, respectively. This suggested the presence of an uneven number of nitrogen atoms and the molecular formula of C10H15NO3. In the 1H NMR spectrum, three methyl groups were observable. One
P e a k # 21 0 0 %
, 0
, 0
2 0 0 2 5 0 3 0 0 3 5 0 4 0 0 4 5 0 5 0 0 5 5 0 5 9 5
%
n m
2 7 6 . 7
2 1 8 . 8
5 5 8 . 4
T e n u a z o n ic a c id 9 9 5 . 4 4
0,0 5,0 10,0 15,0 20,0 25,0 30,0-50
250
600 JJ071017a #12 MGC4.2REtVIII+IX9-11a UV_VIS_1mAU
min
1 -
12
,5
2 -
13
,83
- 1
4,0
4 -
16
,3
5 -
25
,5
WVL:235 nm
[M+H]+
[M-H]-
[2M-2H-Na]-
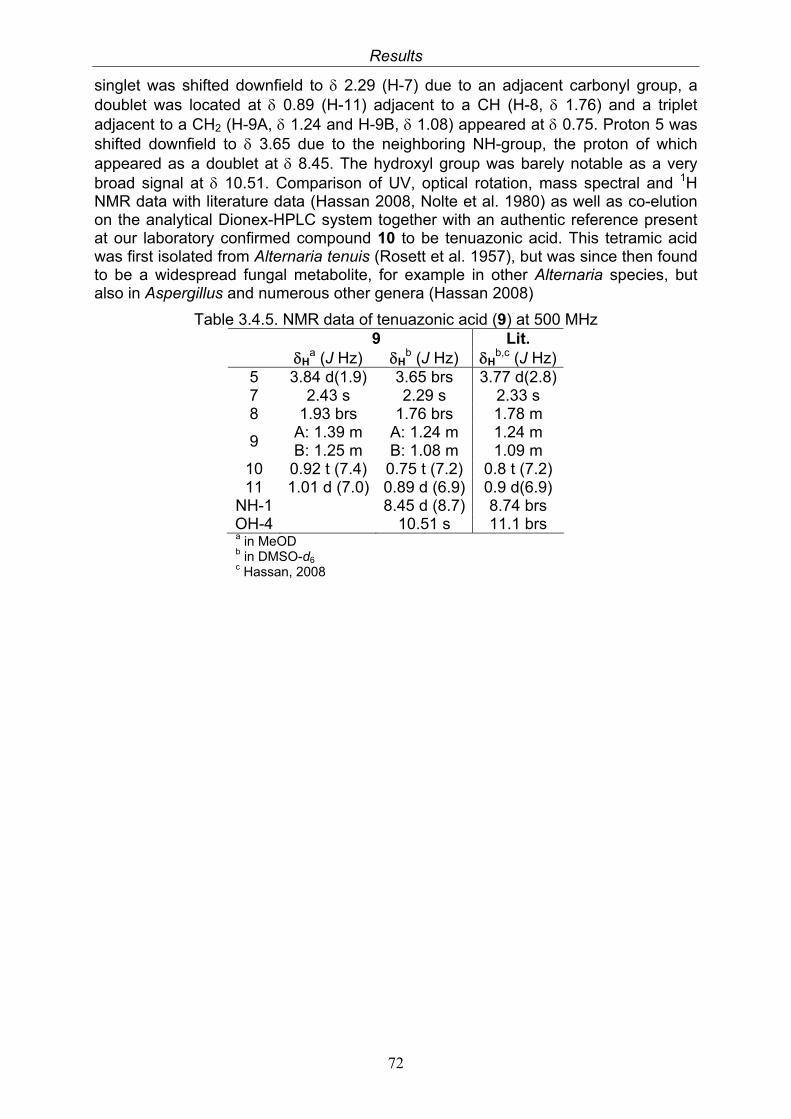
Results
72
singlet was shifted downfield to 2.29 (H-7) due to an adjacent carbonyl group, a doublet was located at 0.89 (H-11) adjacent to a CH (H-8, 1.76) and a triplet adjacent to a CH2 (H-9A, 1.24 and H-9B, 1.08) appeared at 0.75. Proton 5 was shifted downfield to 3.65 due to the neighboring NH-group, the proton of which appeared as a doublet at 8.45. The hydroxyl group was barely notable as a very broad signal at 10.51. Comparison of UV, optical rotation, mass spectral and 1H NMR data with literature data (Hassan 2008, Nolte et al. 1980) as well as co-elution on the analytical Dionex-HPLC system together with an authentic reference present at our laboratory confirmed compound 10 to be tenuazonic acid. This tetramic acid was first isolated from Alternaria tenuis (Rosett et al. 1957), but was since then found to be a widespread fungal metabolite, for example in other Alternaria species, but also in Aspergillus and numerous other genera (Hassan 2008)
Table 3.4.5. NMR data of tenuazonic acid (9) at 500 MHz 9 Lit. H
a (J Hz) Hb (J Hz) H
b,c (J Hz)5 3.84 d(1.9) 3.65 brs 3.77 d(2.8)7 2.43 s 2.29 s 2.33 s 8 1.93 brs 1.76 brs 1.78 m
9 A: 1.39 m B: 1.25 m
A: 1.24 m B: 1.08 m
1.24 m 1.09 m
10 0.92 t (7.4) 0.75 t (7.2) 0.8 t (7.2) 11 1.01 d (7.0) 0.89 d (6.9) 0.9 d(6.9)
NH-1 8.45 d (8.7) 8.74 brs OH-4 10.51 s 11.1 brs
a in MeOD b in DMSO-d6 c Hassan, 2008
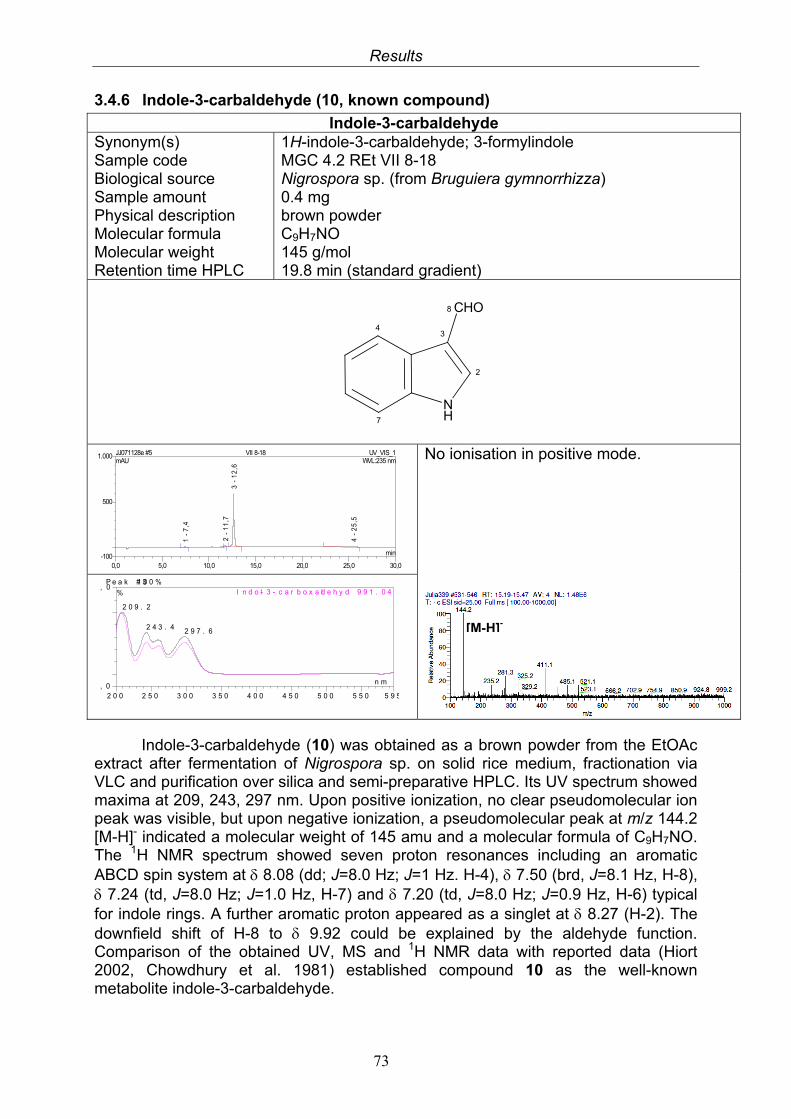
Results
73
3.4.6 Indole-3-carbaldehyde (10, known compound)
Indole-3-carbaldehyde Synonym(s) Sample code Biological source Sample amount Physical description Molecular formula Molecular weight Retention time HPLC
1H-indole-3-carbaldehyde; 3-formylindole MGC 4.2 REt VII 8-18 Nigrospora sp. (from Bruguiera gymnorrhizza) 0.4 mg brown powder C9H7NO 145 g/mol 19.8 min (standard gradient)
NH
2
34
7
CHO8
No ionisation in positive mode.
Indole-3-carbaldehyde (10) was obtained as a brown powder from the EtOAc extract after fermentation of Nigrospora sp. on solid rice medium, fractionation via VLC and purification over silica and semi-preparative HPLC. Its UV spectrum showed maxima at 209, 243, 297 nm. Upon positive ionization, no clear pseudomolecular ion peak was visible, but upon negative ionization, a pseudomolecular peak at m/z 144.2 [M-H]- indicated a molecular weight of 145 amu and a molecular formula of C9H7NO. The 1H NMR spectrum showed seven proton resonances including an aromatic ABCD spin system at 8.08 (dd; J=8.0 Hz; J=1 Hz. H-4), 7.50 (brd, J=8.1 Hz, H-8), 7.24 (td, J=8.0 Hz; J=1.0 Hz, H-7) and 7.20 (td, J=8.0 Hz; J=0.9 Hz, H-6) typical for indole rings. A further aromatic proton appeared as a singlet at 8.27 (H-2). The downfield shift of H-8 to 9.92 could be explained by the aldehyde function. Comparison of the obtained UV, MS and 1H NMR data with reported data (Hiort 2002, Chowdhury et al. 1981) established compound 10 as the well-known metabolite indole-3-carbaldehyde.
P e a k # 31 0 0 %
, 0
, 0
2 0 0 2 5 0 3 0 0 3 5 0 4 0 0 4 5 0 5 0 0 5 5 0 5 9 5
%
n m
2 0 9 . 2
2 4 3 . 4 2 9 7 . 6
I n d o l- 3 - c a r b o x a ld e h y d 9 9 1 . 0 4
0,0 5,0 10,0 15,0 20,0 25,0 30,0-100
500
1.000 JJ071128e #5 VII 8-18 UV_VIS_1mAU
min
1 -
7,4
2 -
11
,73
- 1
2,6
4 -
25
,5
WVL:235 nm
[M-H]-
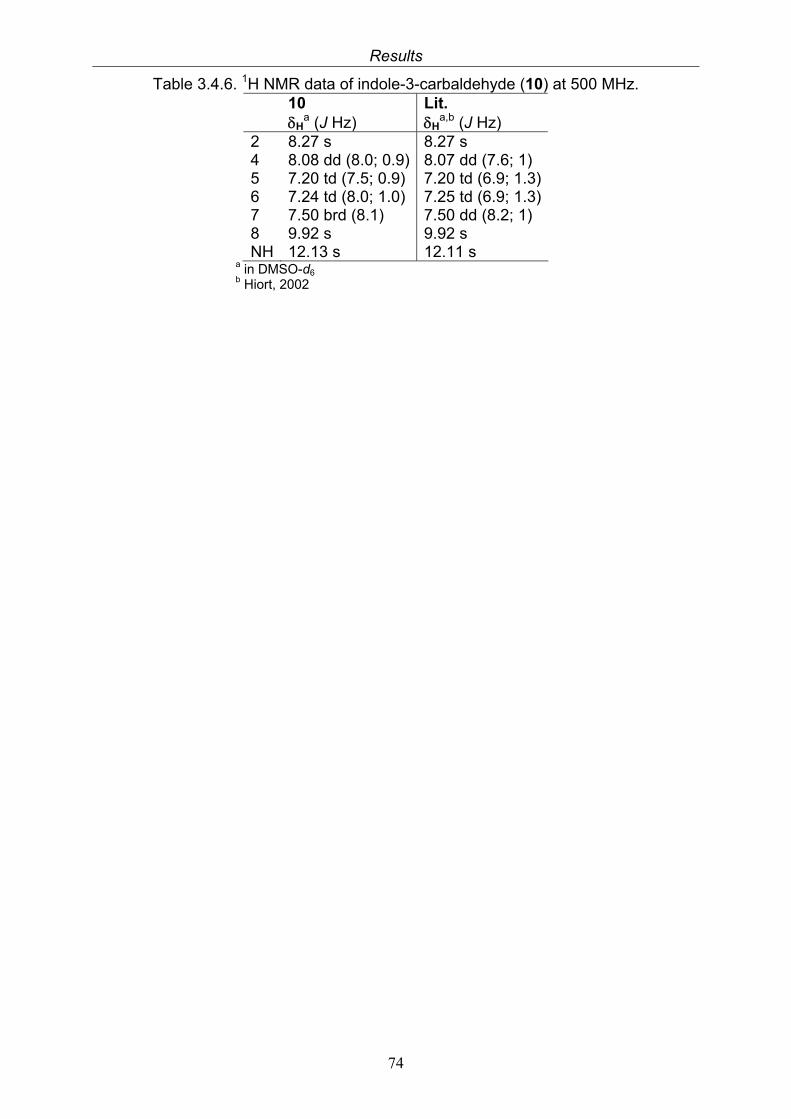
Results
74
Table 3.4.6. 1H NMR data of indole-3-carbaldehyde (10) at 500 MHz. 10 Lit. H
a (J Hz) Ha,b (J Hz)
2 8.27 s 8.27 s 4 8.08 dd (8.0; 0.9) 8.07 dd (7.6; 1) 5 7.20 td (7.5; 0.9) 7.20 td (6.9; 1.3)6 7.24 td (8.0; 1.0) 7.25 td (6.9; 1.3)7 7.50 brd (8.1) 7.50 dd (8.2; 1) 8 9.92 s 9.92 s NH 12.13 s 12.11 s
a in DMSO-d6 b Hiort, 2002
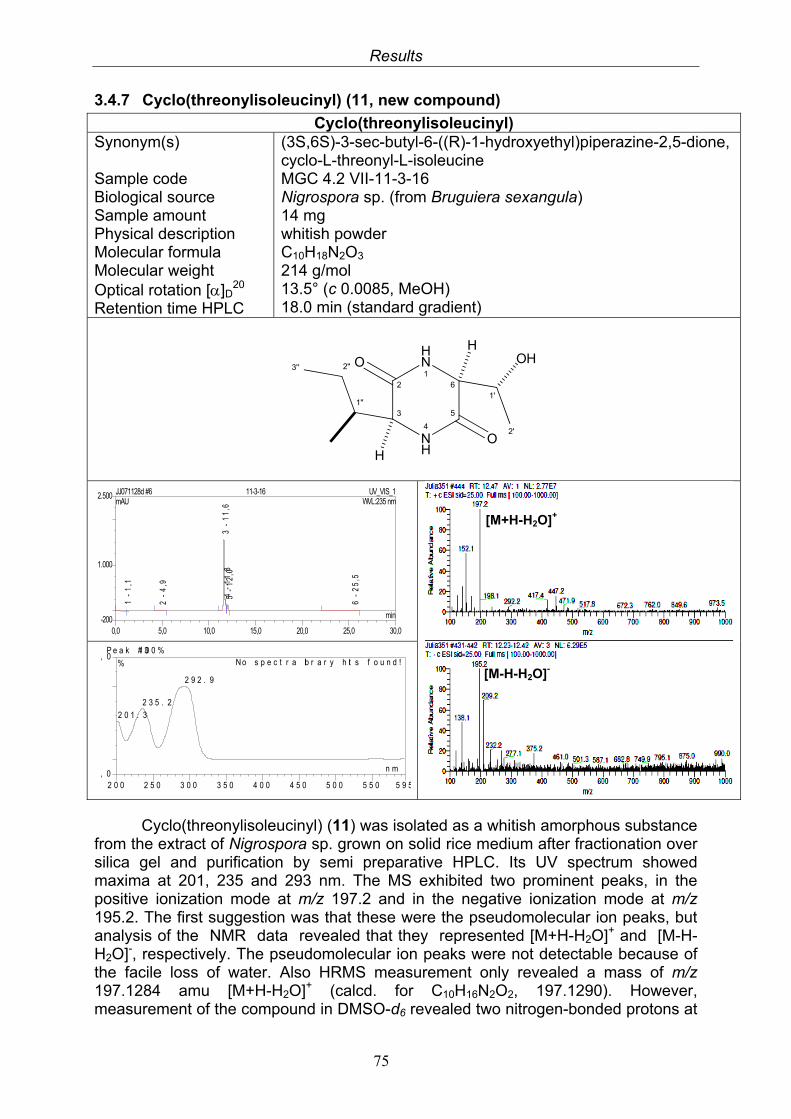
Results
75
3.4.7 Cyclo(threonylisoleucinyl) (11, new compound)
Cyclo(threonylisoleucinyl) Synonym(s) Sample code Biological source Sample amount Physical description Molecular formula Molecular weight Optical rotation []D
20 Retention time HPLC
(3S,6S)-3-sec-butyl-6-((R)-1-hydroxyethyl)piperazine-2,5-dione, cyclo-L-threonyl-L-isoleucine MGC 4.2 VII-11-3-16 Nigrospora sp. (from Bruguiera sexangula) 14 mg whitish powder C10H18N2O3 214 g/mol 13.5° (c 0.0085, MeOH) 18.0 min (standard gradient)
5
HN1
2
NH
4
31''
2''3''
61'
2'
OH
O
O
H
H
Cyclo(threonylisoleucinyl) (11) was isolated as a whitish amorphous substance from the extract of Nigrospora sp. grown on solid rice medium after fractionation over silica gel and purification by semi preparative HPLC. Its UV spectrum showed maxima at 201, 235 and 293 nm. The MS exhibited two prominent peaks, in the positive ionization mode at m/z 197.2 and in the negative ionization mode at m/z 195.2. The first suggestion was that these were the pseudomolecular ion peaks, but analysis of the NMR data revealed that they represented [M+H-H2O]+ and [M-H-H2O]-, respectively. The pseudomolecular ion peaks were not detectable because of the facile loss of water. Also HRMS measurement only revealed a mass of m/z 197.1284 amu [M+H-H2O]+ (calcd. for C10H16N2O2, 197.1290). However, measurement of the compound in DMSO-d6 revealed two nitrogen-bonded protons at
P e a k # 31 0 0 %
, 0
, 0
2 0 0 2 5 0 3 0 0 3 5 0 4 0 0 4 5 0 5 0 0 5 5 0 5 9 5
%
n m
2 9 2 . 9
2 3 5 . 2
2 0 1 . 3
N o s p e c t r a lib r a r y h it s f o u n d !
0,0 5,0 10,0 15,0 20,0 25,0 30,0-200
1.000
2.500 JJ071128d #6 11-3-16 UV_VIS_1mAU
min
1 -
1,1
2 -
4,9
3 -
11
,64
- 1
1,8
5 -
12
,0
6 -
25
,5
WVL:235 nm
[M-H-H2O]-
[M+H-H2O]+
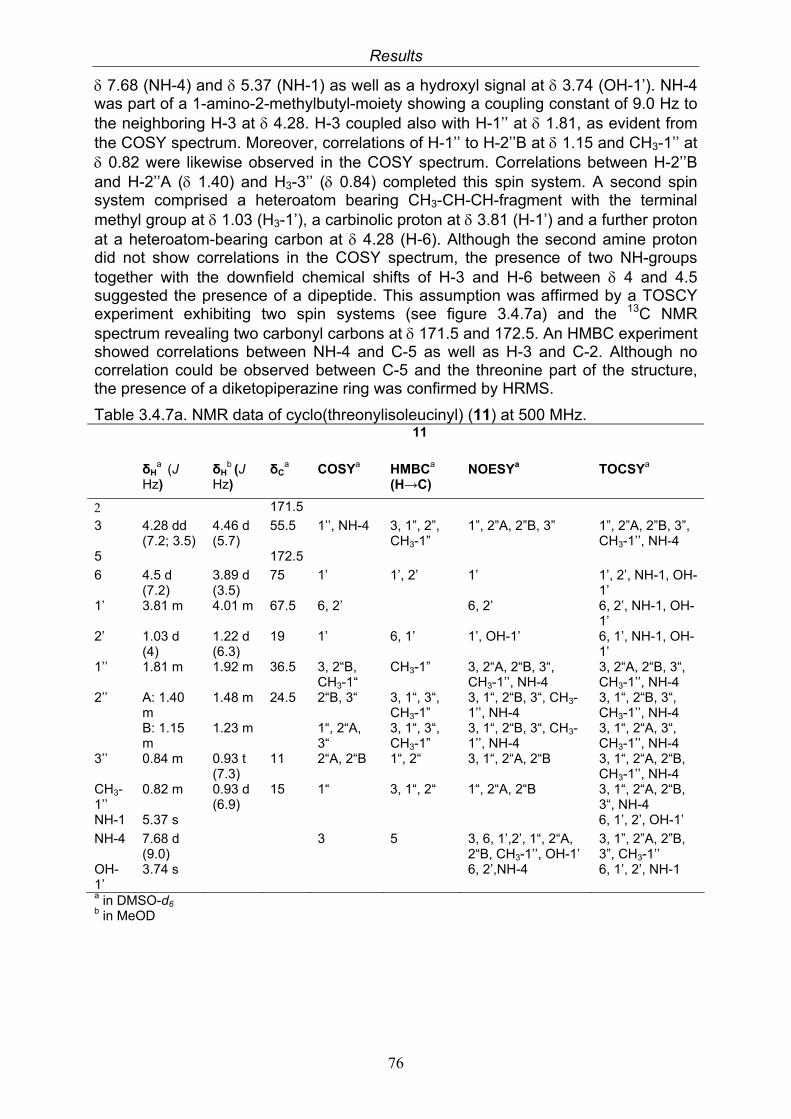
Results
76
7.68 (NH-4) and 5.37 (NH-1) as well as a hydroxyl signal at 3.74 (OH-1’). NH-4 was part of a 1-amino-2-methylbutyl-moiety showing a coupling constant of 9.0 Hz to the neighboring H-3 at 4.28. H-3 coupled also with H-1’’ at 1.81, as evident from the COSY spectrum. Moreover, correlations of H-1’’ to H-2’’B at 1.15 and CH3-1’’ at 0.82 were likewise observed in the COSY spectrum. Correlations between H-2’’B and H-2’’A ( 1.40) and H3-3’’ ( 0.84) completed this spin system. A second spin system comprised a heteroatom bearing CH3-CH-CH-fragment with the terminal methyl group at 1.03 (H3-1’), a carbinolic proton at 3.81 (H-1’) and a further proton at a heteroatom-bearing carbon at 4.28 (H-6). Although the second amine proton did not show correlations in the COSY spectrum, the presence of two NH-groups together with the downfield chemical shifts of H-3 and H-6 between 4 and 4.5 suggested the presence of a dipeptide. This assumption was affirmed by a TOSCY experiment exhibiting two spin systems (see figure 3.4.7a) and the 13C NMR spectrum revealing two carbonyl carbons at 171.5 and 172.5. An HMBC experiment showed correlations between NH-4 and C-5 as well as H-3 and C-2. Although no correlation could be observed between C-5 and the threonine part of the structure, the presence of a diketopiperazine ring was confirmed by HRMS.
Table 3.4.7a. NMR data of cyclo(threonylisoleucinyl) (11) at 500 MHz. 11
δHa (J
Hz) δH
b (J
Hz) δC
a COSYa HMBCa
(H→C) NOESYa TOCSYa
171.5
3 4.28 dd (7.2; 3.5)
4.46 d (5.7)
55.5 1’’, NH-4 3, 1”, 2”, CH3-1”
1”, 2”A, 2”B, 3” 1”, 2”A, 2”B, 3”, CH3-1’’, NH-4
5 172.5
6 4.5 d (7.2)
3.89 d (3.5)
75 1’ 1’, 2’ 1’ 1’, 2’, NH-1, OH-1’
1’ 3.81 m 4.01 m 67.5 6, 2’ 6, 2’ 6, 2’, NH-1, OH-1’
2’ 1.03 d (4)
1.22 d (6.3)
19 1’ 6, 1’ 1’, OH-1’ 6, 1’, NH-1, OH-1’
1’’ 1.81 m 1.92 m 36.5 3, 2“B, CH3-1“
CH3-1” 3, 2“A, 2“B, 3“, CH3-1’’, NH-4
3, 2“A, 2“B, 3“, CH3-1’’, NH-4
2’’ A: 1.40 m B: 1.15 m
1.48 m 1.23 m
24.5 2“B, 3“ 1“, 2“A, 3“
3, 1“, 3“, CH3-1” 3, 1“, 3“, CH3-1”
3, 1“, 2“B, 3“, CH3-1’’, NH-4 3, 1“, 2“B, 3“, CH3-1’’, NH-4
3, 1“, 2“B, 3“, CH3-1’’, NH-4 3, 1“, 2“A, 3“, CH3-1’’, NH-4
3’’ 0.84 m 0.93 t (7.3)
11 2“A, 2“B 1“, 2“ 3, 1“, 2“A, 2“B 3, 1“, 2“A, 2“B, CH3-1’’, NH-4
CH3-1’’
0.82 m 0.93 d (6.9)
15 1“ 3, 1“, 2“ 1“, 2“A, 2“B 3, 1“, 2“A, 2“B, 3“, NH-4
NH-1 5.37 s 6, 1’, 2’, OH-1’
NH-4 7.68 d (9.0)
3 5 3, 6, 1’,2’, 1“, 2“A, 2“B, CH3-1’’, OH-1’
3, 1”, 2”A, 2”B, 3”, CH3-1’’
OH-1’
3.74 s 6, 2’,NH-4 6, 1’, 2’, NH-1
a in DMSO-d6 b in MeOD
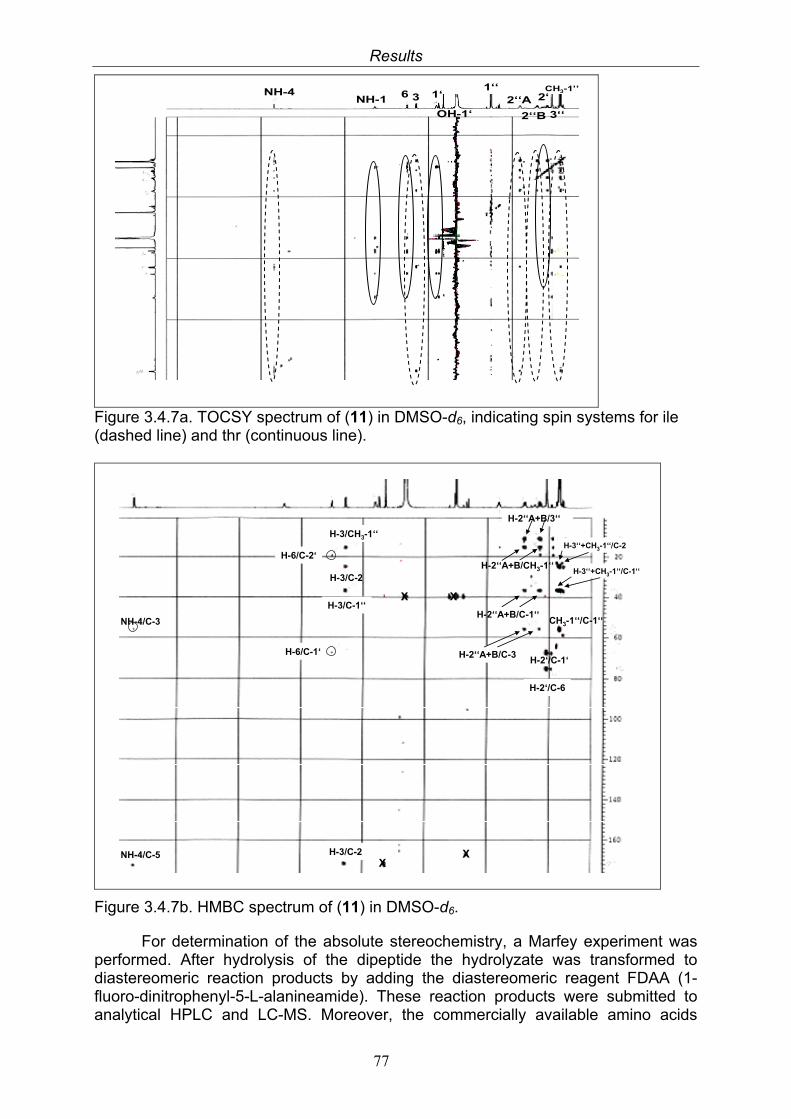
Results
77
NH-4 3
OH-1‘
NH-1 6 1‘1‘‘ CH3-1’’
3‘‘
2‘‘A 2‘
2‘‘B
Figure 3.4.7a. TOCSY spectrum of (11) in DMSO-d6, indicating spin systems for ile (dashed line) and thr (continuous line).
NH-4/C-5X
H-6/C-2‘
NH-4/C-3
H-3/C-1‘‘
H-3/C-2
H-3/C-2
H-3/CH3-1‘‘
H-2‘‘A+B/CH3-1‘‘
H-2‘‘A+B/3‘‘
H-2‘‘A+B/C-1‘‘
H-2‘‘A+B/C-3
H-3‘‘+CH3-1‘‘/C-2
H-3‘‘+CH3-1‘‘/C-1‘‘
CH3-1‘‘/C-1‘‘
H-2‘/C-1‘
H-2‘/C-6
X
X X
H-6/C-1‘
Figure 3.4.7b. HMBC spectrum of (11) in DMSO-d6.
For determination of the absolute stereochemistry, a Marfey experiment was performed. After hydrolysis of the dipeptide the hydrolyzate was transformed to diastereomeric reaction products by adding the diastereomeric reagent FDAA (1-fluoro-dinitrophenyl-5-L-alanineamide). These reaction products were submitted to analytical HPLC and LC-MS. Moreover, the commercially available amino acids
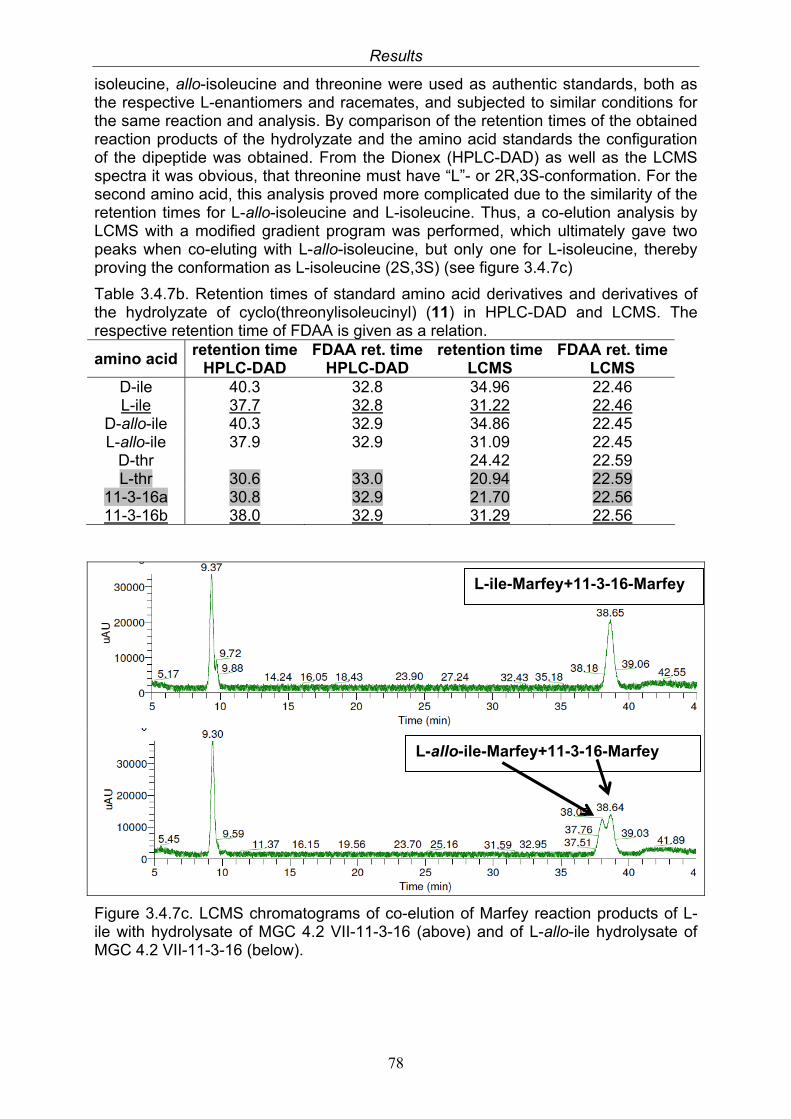
Results
78
isoleucine, allo-isoleucine and threonine were used as authentic standards, both as the respective L-enantiomers and racemates, and subjected to similar conditions for the same reaction and analysis. By comparison of the retention times of the obtained reaction products of the hydrolyzate and the amino acid standards the configuration of the dipeptide was obtained. From the Dionex (HPLC-DAD) as well as the LCMS spectra it was obvious, that threonine must have “L”- or 2R,3S-conformation. For the second amino acid, this analysis proved more complicated due to the similarity of the retention times for L-allo-isoleucine and L-isoleucine. Thus, a co-elution analysis by LCMS with a modified gradient program was performed, which ultimately gave two peaks when co-eluting with L-allo-isoleucine, but only one for L-isoleucine, thereby proving the conformation as L-isoleucine (2S,3S) (see figure 3.4.7c)
Table 3.4.7b. Retention times of standard amino acid derivatives and derivatives of the hydrolyzate of cyclo(threonylisoleucinyl) (11) in HPLC-DAD and LCMS. The respective retention time of FDAA is given as a relation.
amino acid retention time
HPLC-DAD FDAA ret. time
HPLC-DAD retention time
LCMS FDAA ret. time
LCMS D-ile 40.3 32.8 34.96 22.46 L-ile 37.7 32.8 31.22 22.46
D-allo-ile 40.3 32.9 34.86 22.45 L-allo-ile 37.9 32.9 31.09 22.45
D-thr 24.42 22.59 L-thr 30.6 33.0 20.94 22.59
11-3-16a 30.8 32.9 21.70 22.56 11-3-16b 38.0 32.9 31.29 22.56
Figure 3.4.7c. LCMS chromatograms of co-elution of Marfey reaction products of L-ile with hydrolysate of MGC 4.2 VII-11-3-16 (above) and of L-allo-ile hydrolysate of MGC 4.2 VII-11-3-16 (below).
L-ile-Marfey+11-3-16-Marfey
L-allo-ile-Marfey+11-3-16-Marfey
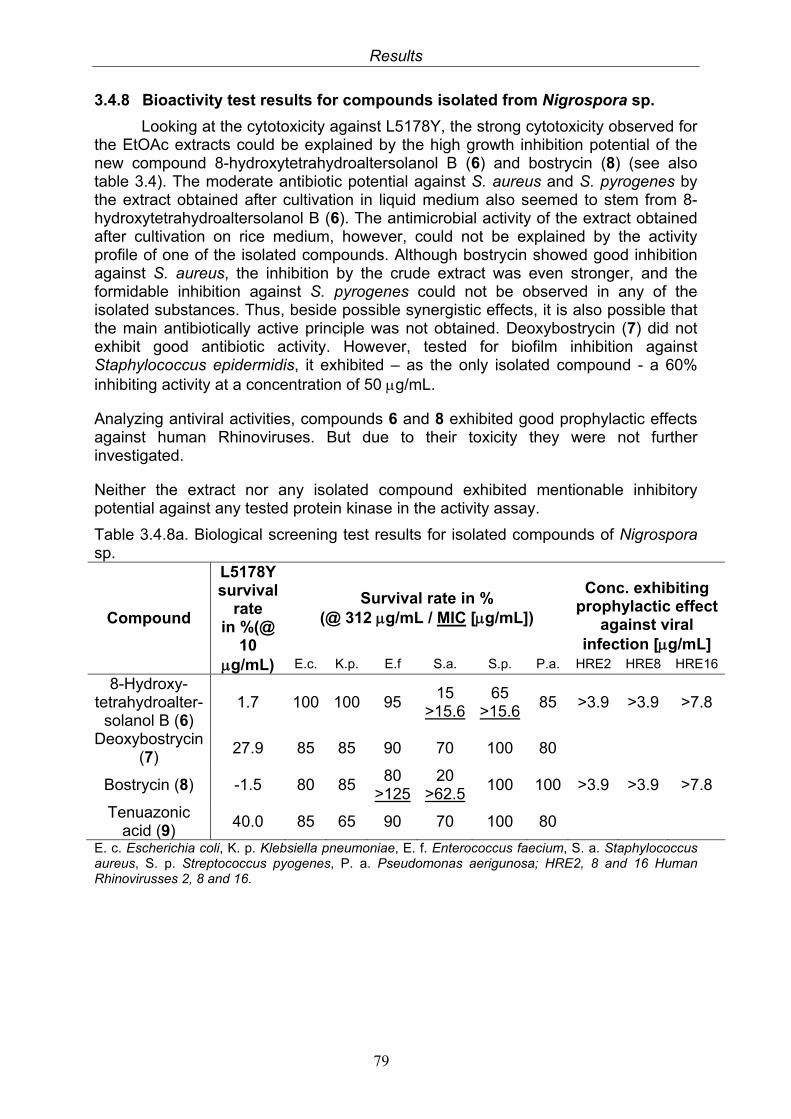
Results
79
3.4.8 Bioactivity test results for compounds isolated from Nigrospora sp.
Looking at the cytotoxicity against L5178Y, the strong cytotoxicity observed for the EtOAc extracts could be explained by the high growth inhibition potential of the new compound 8-hydroxytetrahydroaltersolanol B (6) and bostrycin (8) (see also table 3.4). The moderate antibiotic potential against S. aureus and S. pyrogenes by the extract obtained after cultivation in liquid medium also seemed to stem from 8-hydroxytetrahydroaltersolanol B (6). The antimicrobial activity of the extract obtained after cultivation on rice medium, however, could not be explained by the activity profile of one of the isolated compounds. Although bostrycin showed good inhibition against S. aureus, the inhibition by the crude extract was even stronger, and the formidable inhibition against S. pyrogenes could not be observed in any of the isolated substances. Thus, beside possible synergistic effects, it is also possible that the main antibiotically active principle was not obtained. Deoxybostrycin (7) did not exhibit good antibiotic activity. However, tested for biofilm inhibition against Staphylococcus epidermidis, it exhibited – as the only isolated compound - a 60% inhibiting activity at a concentration of 50 g/mL.
Analyzing antiviral activities, compounds 6 and 8 exhibited good prophylactic effects against human Rhinoviruses. But due to their toxicity they were not further investigated.
Neither the extract nor any isolated compound exhibited mentionable inhibitory potential against any tested protein kinase in the activity assay.
Table 3.4.8a. Biological screening test results for isolated compounds of Nigrospora sp.
Survival rate in % (@ 312 g/mL / MIC [g/mL])
Conc. exhibiting prophylactic effect
against viral infection [g/mL]
Compound
L5178Y survival
rate in %(@
10 g/mL) E.c. K.p. E.f S.a. S.p. P.a. HRE2 HRE8 HRE16
8-Hydroxy-tetrahydroalter-
solanol B (6) 1.7 100 100 95
15 >15.6
65 >15.6
85 >3.9 >3.9 >7.8
Deoxybostrycin (7)
27.9 85 85 90 70 100 80
Bostrycin (8) -1.5 80 85 80
>12520
>62.5100 100 >3.9 >3.9 >7.8
Tenuazonic acid (9)
40.0 85 65 90 70 100 80
E. c. Escherichia coli, K. p. Klebsiella pneumoniae, E. f. Enterococcus faecium, S. a. Staphylococcus aureus, S. p. Streptococcus pyogenes, P. a. Pseudomonas aerigunosa; HRE2, 8 and 16 Human Rhinovirusses 2, 8 and 16.
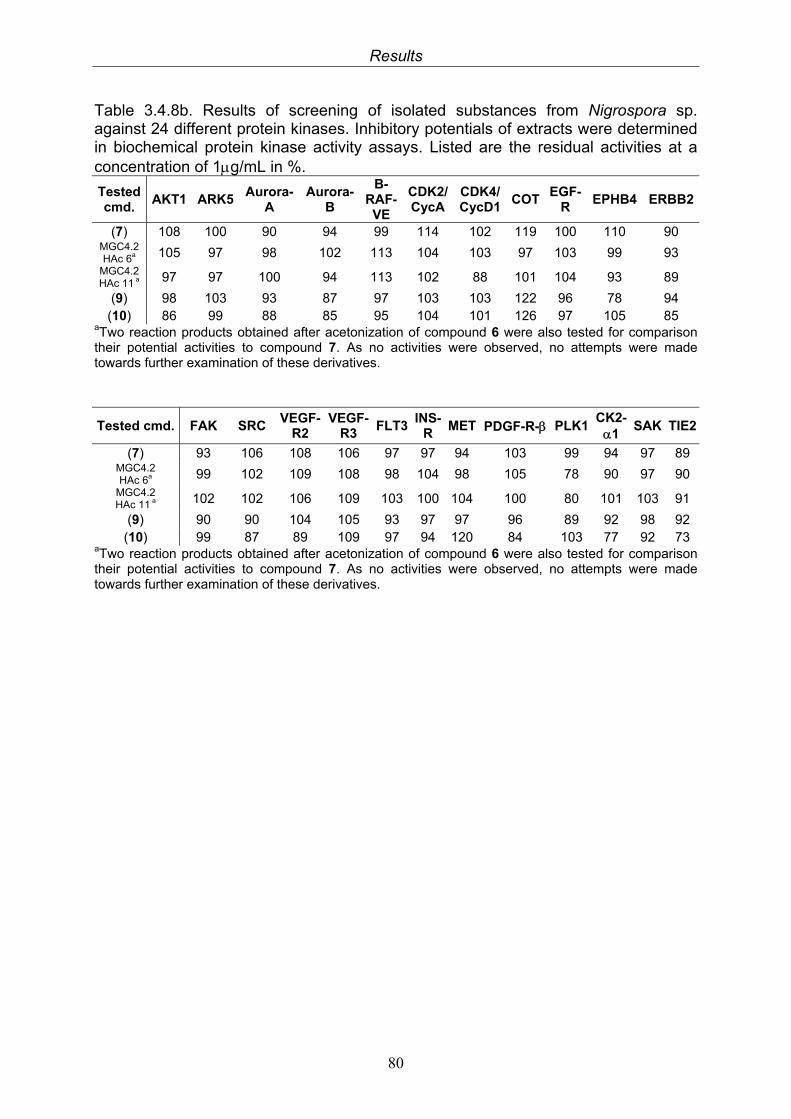
Results
80
Table 3.4.8b. Results of screening of isolated substances from Nigrospora sp. against 24 different protein kinases. Inhibitory potentials of extracts were determined in biochemical protein kinase activity assays. Listed are the residual activities at a concentration of 1g/mL in %.
Tested cmd.
AKT1 ARK5Aurora-
A Aurora-
B
B-RAF-VE
CDK2/CycA
CDK4/CycD1
COTEGF-
R EPHB4 ERBB2
(7) 108 100 90 94 99 114 102 119 100 110 90 MGC4.2 HAc 6a 105 97 98 102 113 104 103 97 103 99 93
MGC4.2 HAc 11 a 97 97 100 94 113 102 88 101 104 93 89
(9) 98 103 93 87 97 103 103 122 96 78 94 (10) 86 99 88 85 95 104 101 126 97 105 85
aTwo reaction products obtained after acetonization of compound 6 were also tested for comparison their potential activities to compound 7. As no activities were observed, no attempts were made towards further examination of these derivatives.
Tested cmd. FAK SRC VEGF-
R2 VEGF-
R3 FLT3
INS-R
MET PDGF-R- PLK1 CK2- 1
SAK TIE2
(7) 93 106 108 106 97 97 94 103 99 94 97 89 MGC4.2 HAc 6a 99 102 109 108 98 104 98 105 78 90 97 90
MGC4.2 HAc 11 a 102 102 106 109 103 100 104 100 80 101 103 91
(9) 90 90 104 105 93 97 97 96 89 92 98 92 (10) 99 87 89 109 97 94 120 84 103 77 92 73
aTwo reaction products obtained after acetonization of compound 6 were also tested for comparison their potential activities to compound 7. As no activities were observed, no attempts were made towards further examination of these derivatives.
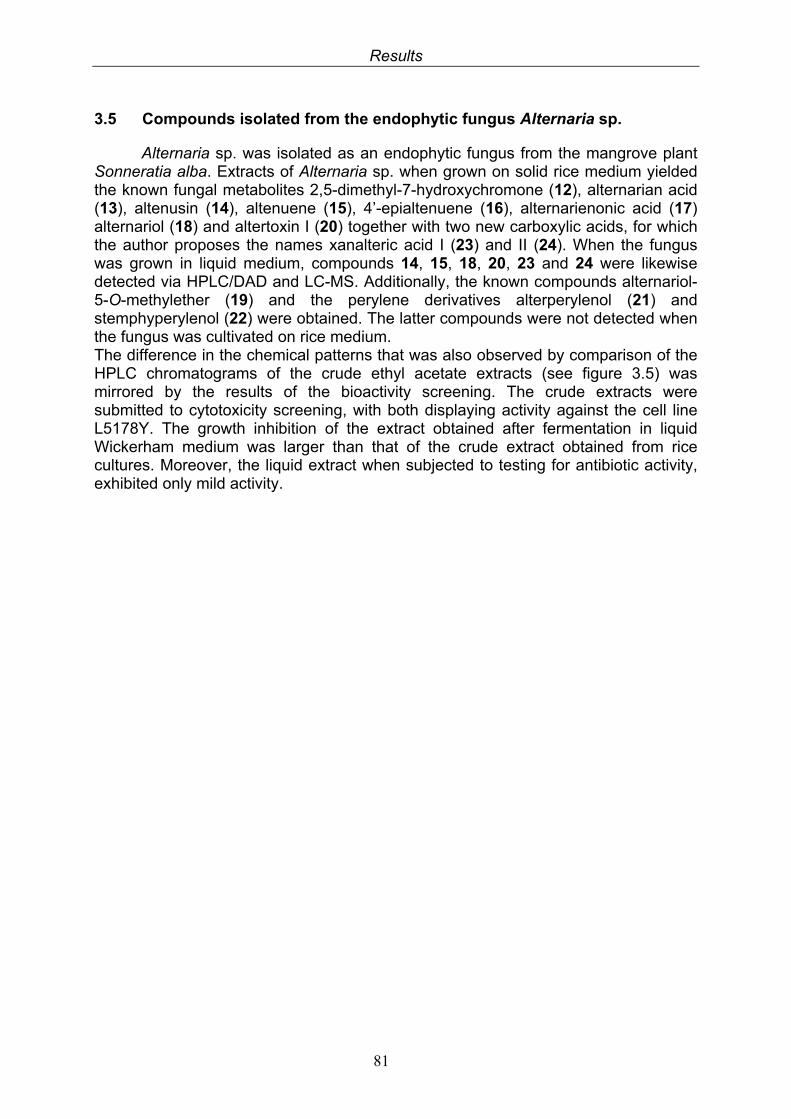
Results
81
3.5 Compounds isolated from the endophytic fungus Alternaria sp.
Alternaria sp. was isolated as an endophytic fungus from the mangrove plant Sonneratia alba. Extracts of Alternaria sp. when grown on solid rice medium yielded the known fungal metabolites 2,5-dimethyl-7-hydroxychromone (12), alternarian acid (13), altenusin (14), altenuene (15), 4’-epialtenuene (16), alternarienonic acid (17) alternariol (18) and altertoxin I (20) together with two new carboxylic acids, for which the author proposes the names xanalteric acid I (23) and II (24). When the fungus was grown in liquid medium, compounds 14, 15, 18, 20, 23 and 24 were likewise detected via HPLC/DAD and LC-MS. Additionally, the known compounds alternariol-5-O-methylether (19) and the perylene derivatives alterperylenol (21) and stemphyperylenol (22) were obtained. The latter compounds were not detected when the fungus was cultivated on rice medium. The difference in the chemical patterns that was also observed by comparison of the HPLC chromatograms of the crude ethyl acetate extracts (see figure 3.5) was mirrored by the results of the bioactivity screening. The crude extracts were submitted to cytotoxicity screening, with both displaying activity against the cell line L5178Y. The growth inhibition of the extract obtained after fermentation in liquid Wickerham medium was larger than that of the crude extract obtained from rice cultures. Moreover, the liquid extract when subjected to testing for antibiotic activity, exhibited only mild activity.
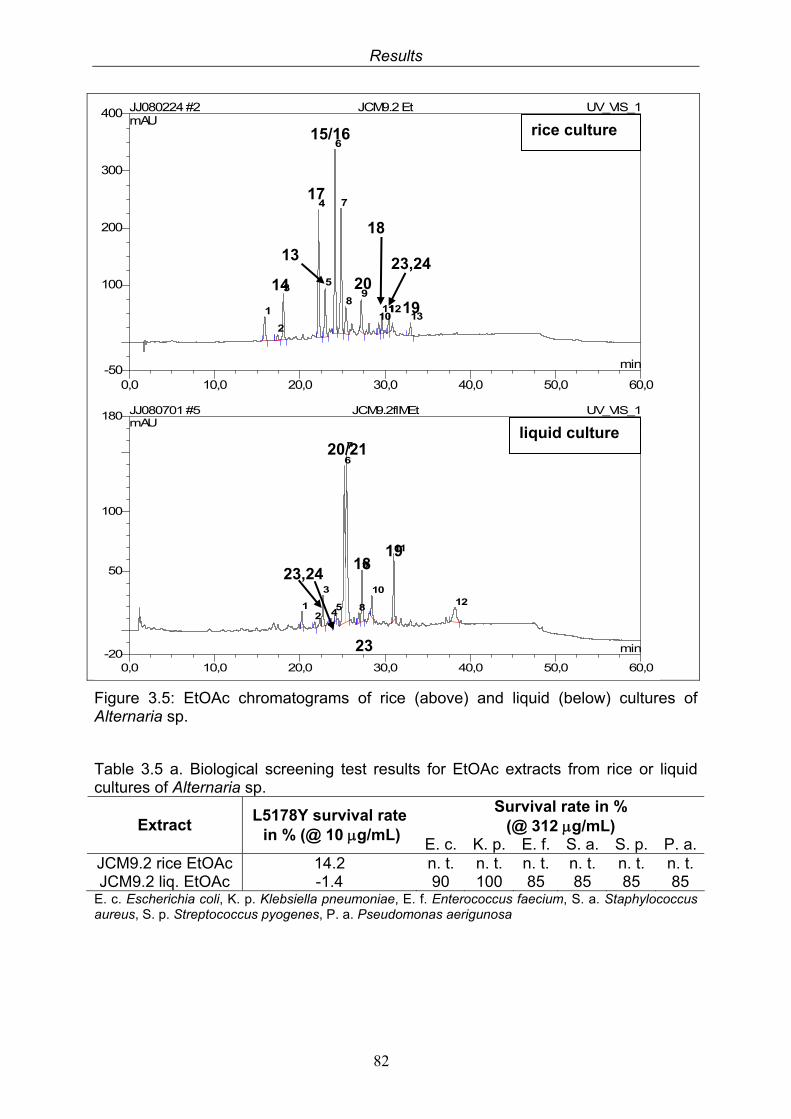
Results
82
Figure 3.5: EtOAc chromatograms of rice (above) and liquid (below) cultures of Alternaria sp.
Table 3.5 a. Biological screening test results for EtOAc extracts from rice or liquid cultures of Alternaria sp.
Survival rate in % (@ 312 g/mL) Extract
L5178Y survival rate in % (@ 10 g/mL)
E. c. K. p. E. f. S. a. S. p. P. a.JCM9.2 rice EtOAc 14.2 n. t. n. t. n. t. n. t. n. t. n. t. JCM9.2 liq. EtOAc -1.4 90 100 85 85 85 85
E. c. Escherichia coli, K. p. Klebsiella pneumoniae, E. f. Enterococcus faecium, S. a. Staphylococcus aureus, S. p. Streptococcus pyogenes, P. a. Pseudomonas aerigunosa
0,0 10,0 20,0 30,0 40,0 50,0 60,0-50
100
200
300
400 JJ080224 #2 JCM9.2 Et UV_VIS_1mAU
min
1
2
3
4
5
6
7
89
101112
13
WVL:235 nm
0,0 10,0 20,0 30,0 40,0 50,0 60,0-20
50
100
180 JJ080701 #5 JCM9.2flMEt UV_VIS_1mAU
min
12
3
45
6
7
8
9
10
11
12
WVL:235 nm
23
17
13
15/16
20
18
19
23,24
23,24
20/21
18 19
liquid culture
rice culture
14
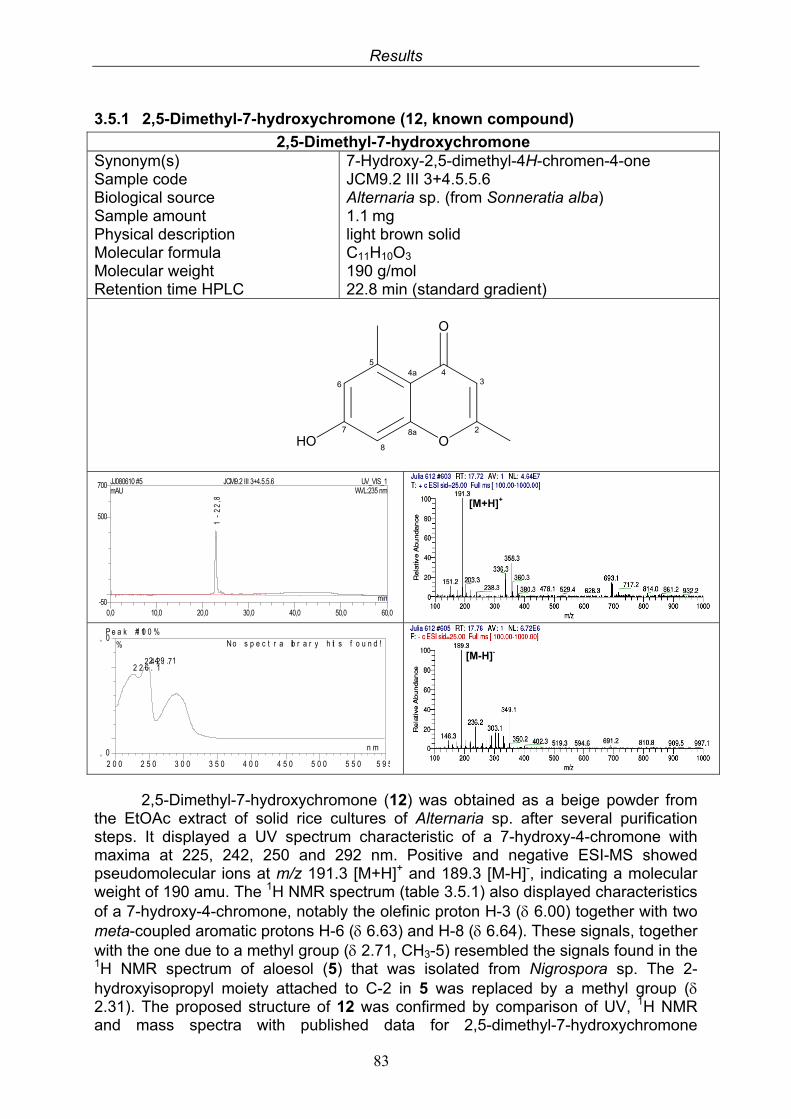
Results
83
3.5.1 2,5-Dimethyl-7-hydroxychromone (12, known compound)
2,5-Dimethyl-7-hydroxychromone Synonym(s) Sample code Biological source Sample amount Physical description Molecular formula Molecular weight Retention time HPLC
7-Hydroxy-2,5-dimethyl-4H-chromen-4-one JCM9.2 III 3+4.5.5.6 Alternaria sp. (from Sonneratia alba) 1.1 mg light brown solid C11H10O3 190 g/mol 22.8 min (standard gradient)
6
7
8
8a
4a5
O2
34
O
HO
2,5-Dimethyl-7-hydroxychromone (12) was obtained as a beige powder from the EtOAc extract of solid rice cultures of Alternaria sp. after several purification steps. It displayed a UV spectrum characteristic of a 7-hydroxy-4-chromone with maxima at 225, 242, 250 and 292 nm. Positive and negative ESI-MS showed pseudomolecular ions at m/z 191.3 [M+H]+ and 189.3 [M-H]-, indicating a molecular weight of 190 amu. The 1H NMR spectrum (table 3.5.1) also displayed characteristics of a 7-hydroxy-4-chromone, notably the olefinic proton H-3 ( 6.00) together with two meta-coupled aromatic protons H-6 ( 6.63) and H-8 ( 6.64). These signals, together with the one due to a methyl group ( 2.71, CH3-5) resembled the signals found in the 1H NMR spectrum of aloesol (5) that was isolated from Nigrospora sp. The 2-hydroxyisopropyl moiety attached to C-2 in 5 was replaced by a methyl group ( 2.31). The proposed structure of 12 was confirmed by comparison of UV, 1H NMR and mass spectra with published data for 2,5-dimethyl-7-hydroxychromone
P e a k # 11 0 0 %
, 0
0 , 0
2 0 0 2 5 0 3 0 0 3 5 0 4 0 0 4 5 0 5 0 0 5 5 0 5 9 5
%
n m
2 4 9 . 12 4 2 . 72 2 6 . 1
No s p e c t r a lib r a r y h it s f o u n d !
0,0 10,0 20,0 30,0 40,0 50,0 60,0-50
500
700 JJ080610 #5 JCM9.2 III 3+4.5.5.6 UV_VIS_1mAU
min
1 -
22
,8
WVL:235 nm
[M+H]+
[M-H]-
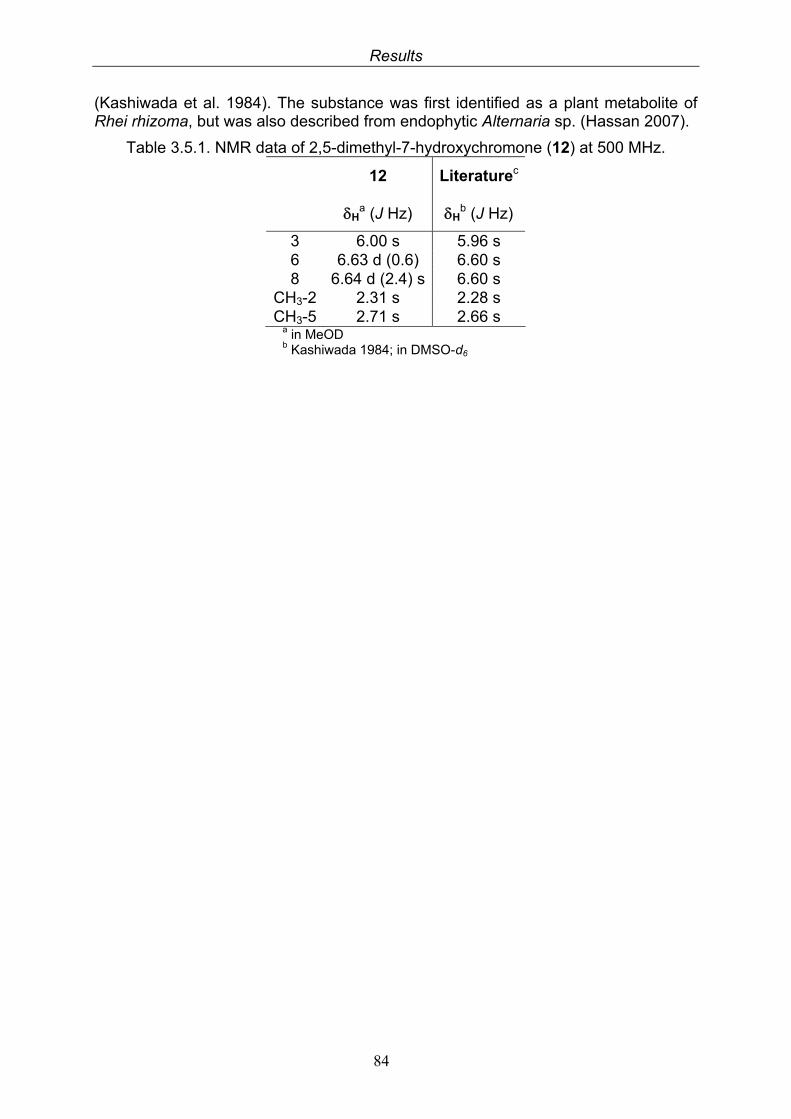
Results
84
(Kashiwada et al. 1984). The substance was first identified as a plant metabolite of Rhei rhizoma, but was also described from endophytic Alternaria sp. (Hassan 2007).
Table 3.5.1. NMR data of 2,5-dimethyl-7-hydroxychromone (12) at 500 MHz.
12 Literaturec
Ha (J Hz) H
b (J Hz)
3 6.00 s 5.96 s 6 6.63 d (0.6) 6.60 s 8 6.64 d (2.4) s 6.60 s
CH3-2 2.31 s 2.28 s CH3-5 2.71 s 2.66 s
a in MeOD b Kashiwada 1984; in DMSO-d6
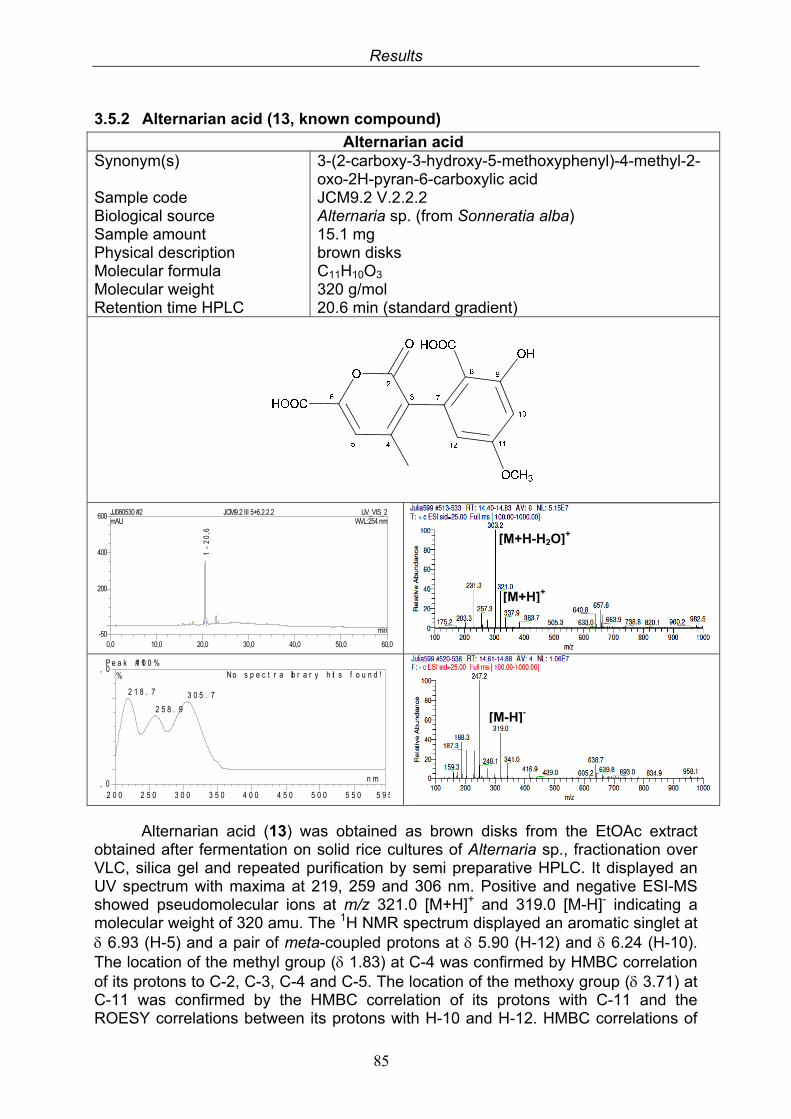
Results
85
3.5.2 Alternarian acid (13, known compound)
Alternarian acid Synonym(s) Sample code Biological source Sample amount Physical description Molecular formula Molecular weight Retention time HPLC
3-(2-carboxy-3-hydroxy-5-methoxyphenyl)-4-methyl-2-oxo-2H-pyran-6-carboxylic acid JCM9.2 V.2.2.2 Alternaria sp. (from Sonneratia alba) 15.1 mg brown disks C11H10O3 320 g/mol 20.6 min (standard gradient)
Alternarian acid (13) was obtained as brown disks from the EtOAc extract obtained after fermentation on solid rice cultures of Alternaria sp., fractionation over VLC, silica gel and repeated purification by semi preparative HPLC. It displayed an UV spectrum with maxima at 219, 259 and 306 nm. Positive and negative ESI-MS showed pseudomolecular ions at m/z 321.0 [M+H]+ and 319.0 [M-H]- indicating a molecular weight of 320 amu. The 1H NMR spectrum displayed an aromatic singlet at 6.93 (H-5) and a pair of meta-coupled protons at 5.90 (H-12) and 6.24 (H-10). The location of the methyl group ( 1.83) at C-4 was confirmed by HMBC correlation of its protons to C-2, C-3, C-4 and C-5. The location of the methoxy group ( 3.71) at C-11 was confirmed by the HMBC correlation of its protons with C-11 and the ROESY correlations between its protons with H-10 and H-12. HMBC correlations of
P e a k # 11 0 0 %
, 0
0 , 0
2 0 0 2 5 0 3 0 0 3 5 0 4 0 0 4 5 0 5 0 0 5 5 0 5 9 5
%
n m
2 1 8 . 7 3 0 5 . 7
2 5 8 . 9
No s p e c t r a lib r a r y h it s f o u n d !
0,0 10,0 20,0 30,0 40,0 50,0 60,0-50
200
400
600 JJ080530 #2 JCM9.2 III 5+6.2.2.2 UV_VIS_2mAU
min
1 -
20
,6
WVL:254 nm
[M+H]+
[M-H]-
[M+H-H2O]+
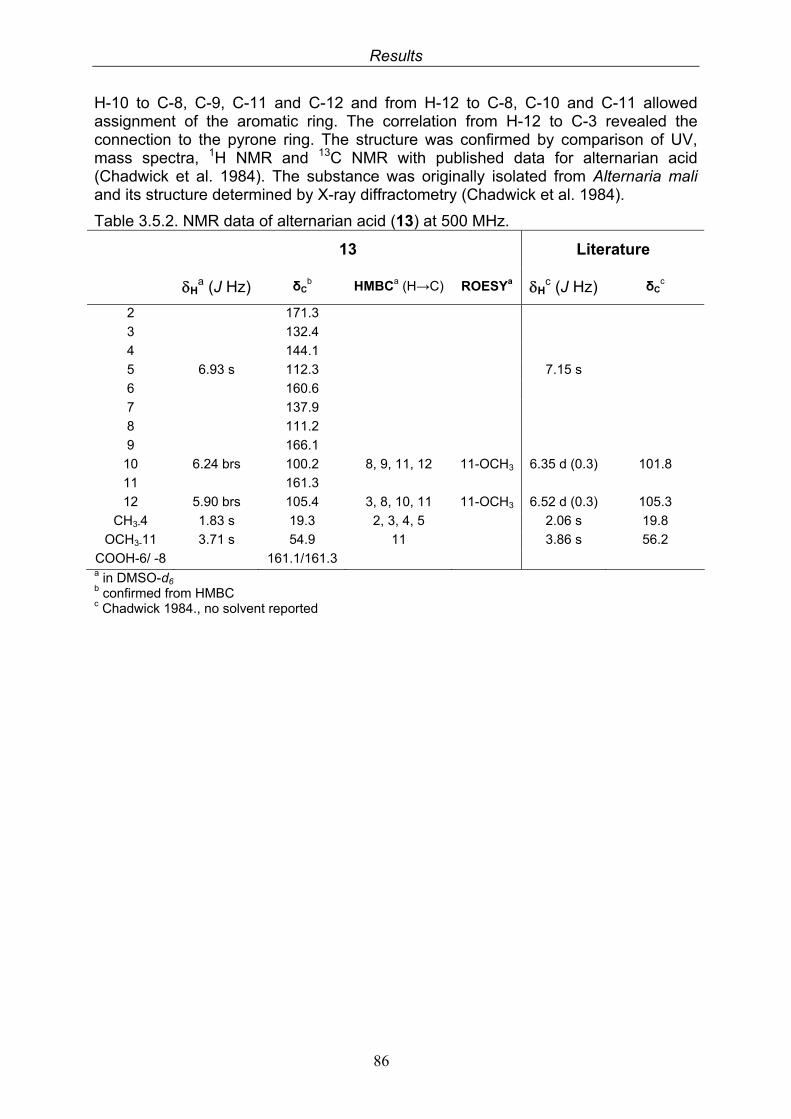
Results
86
H-10 to C-8, C-9, C-11 and C-12 and from H-12 to C-8, C-10 and C-11 allowed assignment of the aromatic ring. The correlation from H-12 to C-3 revealed the connection to the pyrone ring. The structure was confirmed by comparison of UV, mass spectra, 1H NMR and 13C NMR with published data for alternarian acid (Chadwick et al. 1984). The substance was originally isolated from Alternaria mali and its structure determined by X-ray diffractometry (Chadwick et al. 1984).
Table 3.5.2. NMR data of alternarian acid (13) at 500 MHz.
13 Literature
Ha (J Hz) δC
b HMBCa (H→C) ROESYa H
c (J Hz) δCc
2 171.3 3 132.4 4 144.1 5 6.93 s 112.3 7.15 s 6 160.6 7 137.9 8 111.2 9 166.1
10 6.24 brs 100.2 8, 9, 11, 12 11-OCH3 6.35 d (0.3) 101.8
11 161.3
12 5.90 brs 105.4 3, 8, 10, 11 11-OCH3 6.52 d (0.3) 105.3
CH3-4 1.83 s 19.3 2, 3, 4, 5 2.06 s 19.8
OCH3-11 3.71 s 54.9 11 3.86 s 56.2
COOH-6/ -8 161.1/161.3 a in DMSO-d6 b confirmed from HMBC c Chadwick 1984., no solvent reported
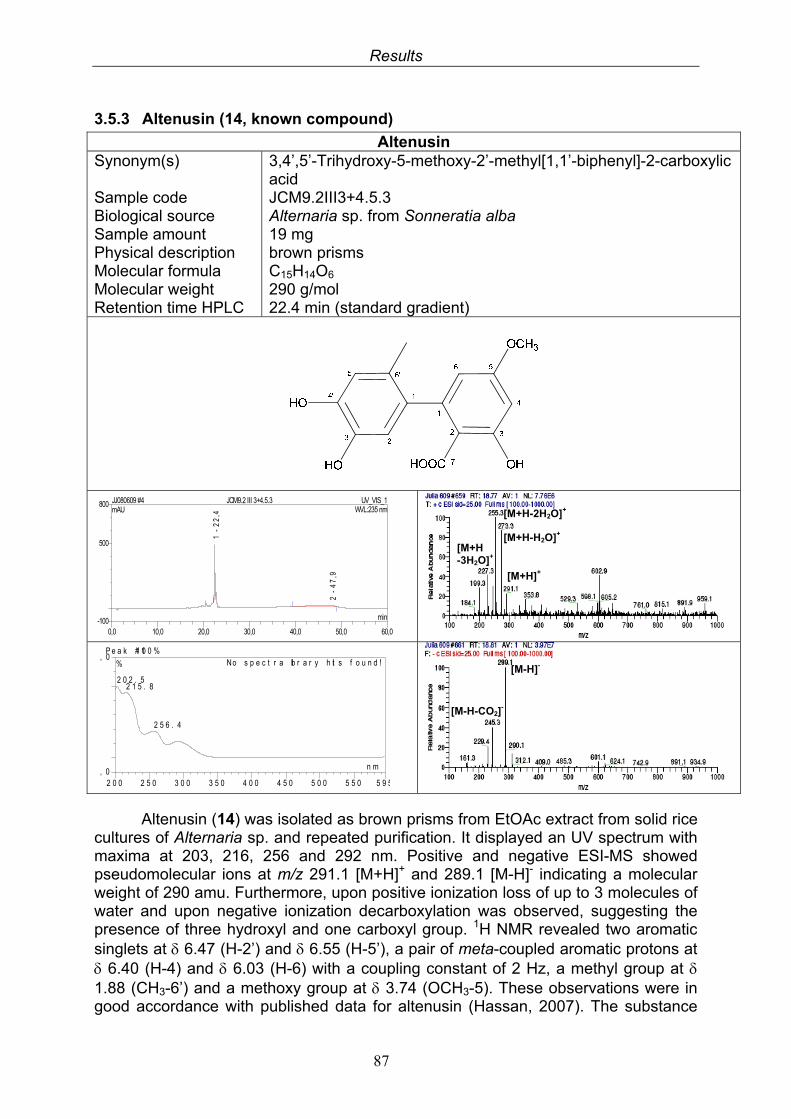
Results
87
3.5.3 Altenusin (14, known compound)
Altenusin Synonym(s) Sample code Biological source Sample amount Physical description Molecular formula Molecular weight Retention time HPLC
3,4’,5’-Trihydroxy-5-methoxy-2’-methyl[1,1’-biphenyl]-2-carboxylic acid JCM9.2III3+4.5.3 Alternaria sp. from Sonneratia alba 19 mg brown prisms C15H14O6 290 g/mol 22.4 min (standard gradient)
Altenusin (14) was isolated as brown prisms from EtOAc extract from solid rice cultures of Alternaria sp. and repeated purification. It displayed an UV spectrum with maxima at 203, 216, 256 and 292 nm. Positive and negative ESI-MS showed pseudomolecular ions at m/z 291.1 [M+H]+ and 289.1 [M-H]- indicating a molecular weight of 290 amu. Furthermore, upon positive ionization loss of up to 3 molecules of water and upon negative ionization decarboxylation was observed, suggesting the presence of three hydroxyl and one carboxyl group. 1H NMR revealed two aromatic singlets at 6.47 (H-2’) and 6.55 (H-5’), a pair of meta-coupled aromatic protons at 6.40 (H-4) and 6.03 (H-6) with a coupling constant of 2 Hz, a methyl group at 1.88 (CH3-6’) and a methoxy group at 3.74 (OCH3-5). These observations were in good accordance with published data for altenusin (Hassan, 2007). The substance
P e a k # 11 0 0 %
, 0
0 , 0
2 0 0 2 5 0 3 0 0 3 5 0 4 0 0 4 5 0 5 0 0 5 5 0 5 9 5
%
n m
2 0 2 . 52 1 5 . 8
2 5 6 . 4
No s p e c t r a lib r a r y h it s f o u n d !
0,0 10,0 20,0 30,0 40,0 50,0 60,0-100
500
800 JJ080609 #4 JCM9.2 III 3+4.5.3 UV_VIS_1mAU
min
1 -
22
,4
2 -
47
,9
WVL:235 nm
[M+H-H2O]+
[M+H]+
[M-H]-
[M+H-2H2O]+
[M-H-CO2]-
[M+H -3H2O]+
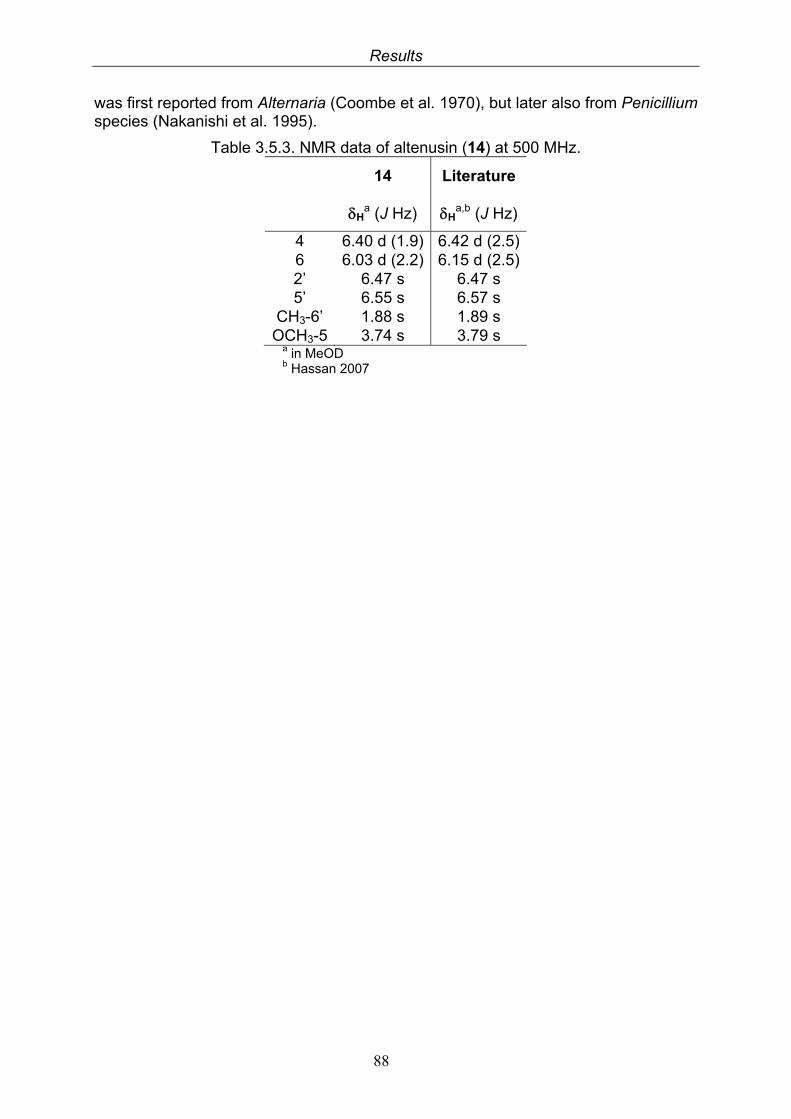
Results
88
was first reported from Alternaria (Coombe et al. 1970), but later also from Penicillium species (Nakanishi et al. 1995).
Table 3.5.3. NMR data of altenusin (14) at 500 MHz.
14 Literature
Ha (J Hz) H
a,b (J Hz)
4 6.40 d (1.9) 6.42 d (2.5)6 6.03 d (2.2) 6.15 d (2.5)2’ 6.47 s 6.47 s 5’ 6.55 s 6.57 s
CH3-6’ 1.88 s 1.89 s OCH3-5 3.74 s 3.79 s
a in MeOD b Hassan 2007
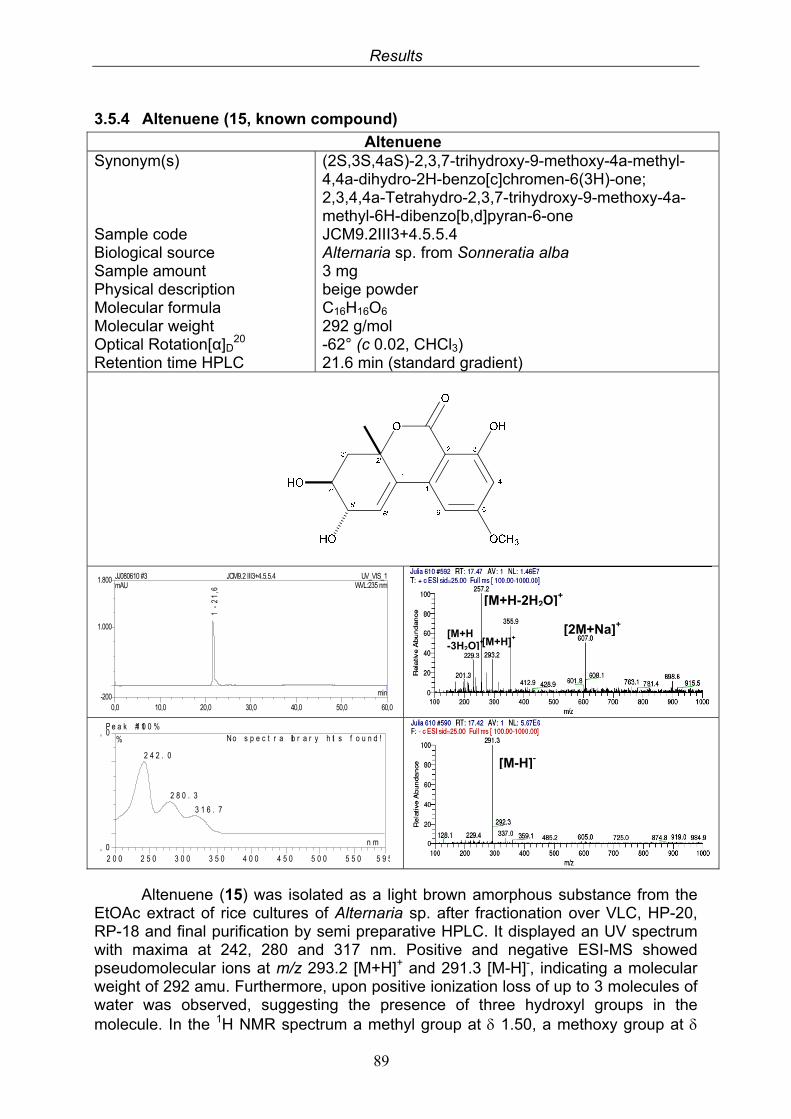
Results
89
3.5.4 Altenuene (15, known compound)
Altenuene Synonym(s) Sample code Biological source Sample amount Physical description Molecular formula Molecular weight Optical Rotation[α]D
20 Retention time HPLC
(2S,3S,4aS)-2,3,7-trihydroxy-9-methoxy-4a-methyl-4,4a-dihydro-2H-benzo[c]chromen-6(3H)-one; 2,3,4,4a-Tetrahydro-2,3,7-trihydroxy-9-methoxy-4a-methyl-6H-dibenzo[b,d]pyran-6-one JCM9.2III3+4.5.5.4 Alternaria sp. from Sonneratia alba 3 mg beige powder C16H16O6 292 g/mol -62° (c 0.02, CHCl3) 21.6 min (standard gradient)
Altenuene (15) was isolated as a light brown amorphous substance from the EtOAc extract of rice cultures of Alternaria sp. after fractionation over VLC, HP-20, RP-18 and final purification by semi preparative HPLC. It displayed an UV spectrum with maxima at 242, 280 and 317 nm. Positive and negative ESI-MS showed pseudomolecular ions at m/z 293.2 [M+H]+ and 291.3 [M-H]-, indicating a molecular weight of 292 amu. Furthermore, upon positive ionization loss of up to 3 molecules of water was observed, suggesting the presence of three hydroxyl groups in the molecule. In the 1H NMR spectrum a methyl group at 1.50, a methoxy group at
P e a k # 11 0 0 %
, 0
0 , 0
2 0 0 2 5 0 3 0 0 3 5 0 4 0 0 4 5 0 5 0 0 5 5 0 5 9 5
%
n m
2 4 2 . 0
2 8 0 . 3
3 1 6 . 7
No s p e c t r a lib r a r y h it s f o u n d !
0,0 10,0 20,0 30,0 40,0 50,0 60,0-200
1.000
1.800 JJ080610 #3 JCM9.2 III3+4.5.5.4 UV_VIS_1mAU
min
1 -
21
,6
WVL:235 nm
[M+H-2H2O]+
[M-H]-
[M+H]+ [2M+Na]+ [M+H
-3H2O]+
Results
90
3.87 and two meta-coupled aromatic protons at 6.47 (H-4) and 6.66 (H-6) are visible. Moreover, the spectrum revealed a spin system consisting of five protons. A vinyl proton at 6.22 (H-6’) shared a coupling constant of 2.8 Hz with a carbinolic proton at 4.07 (H-5’). H-5’ also showed a coupling of 6.0 Hz to the second carbinolic proton in the molecule, resonating at 3.78 (H-4’). From the coupling constants of the diastereotopic methylene protons CH2-3’ to H-4’ their orientation was deduced. H-3’ ( 2.41, 3.8 Hz) was found to be situated equatorial, while H-3’ ( 1.97, 9.2 Hz) was oriented axial. These data were in accordance with previously published data for altenuene (see table 3.5.5) (Bradburn 1994, Hassan 2007), revealing the half-chair conformation of the molecule. The structure was furthermore confirmed by matching UV, MS and D data. Altenuene was first isolated from Alternaria tenuis and its configuration assigned by X-ray crystallographic data (McPhail 1973). Previously the compound was also described from a freshwater fungus belonging to the family Tubeufiaceae (Jiao 2006).
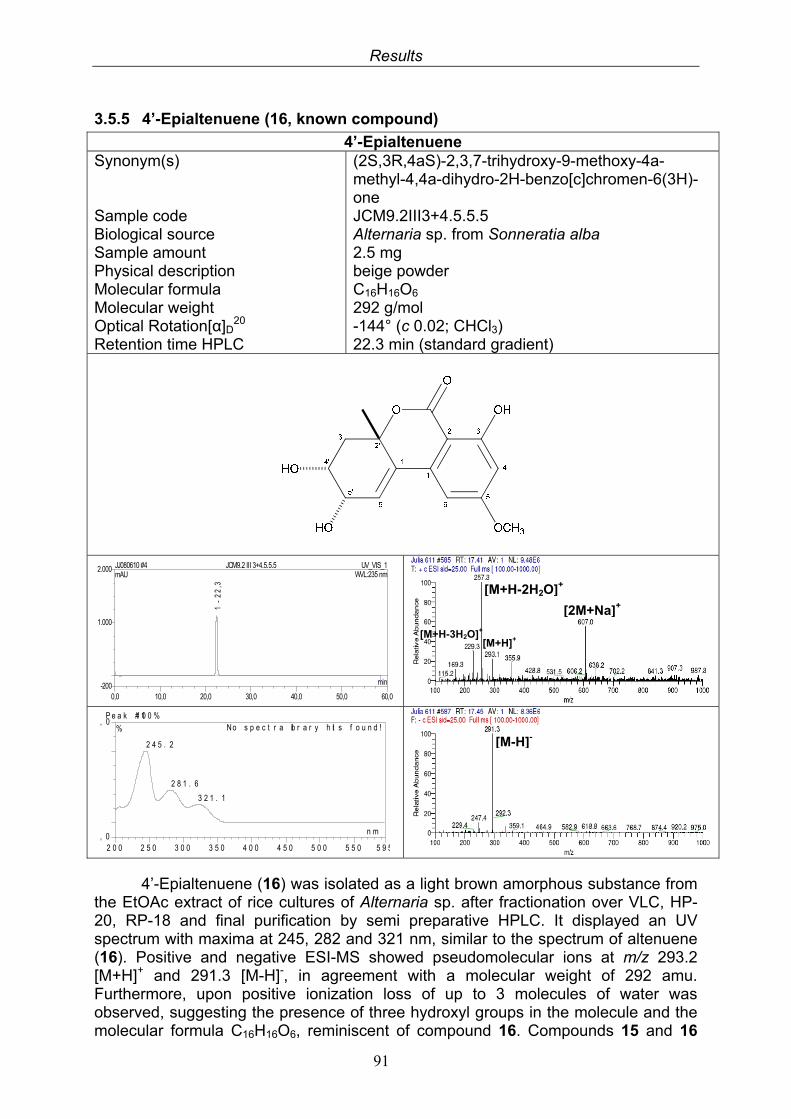
Results
91
3.5.5 4’-Epialtenuene (16, known compound)
4’-Epialtenuene Synonym(s) Sample code Biological source Sample amount Physical description Molecular formula Molecular weight Optical Rotation[α]D
20 Retention time HPLC
(2S,3R,4aS)-2,3,7-trihydroxy-9-methoxy-4a-methyl-4,4a-dihydro-2H-benzo[c]chromen-6(3H)-one JCM9.2III3+4.5.5.5 Alternaria sp. from Sonneratia alba 2.5 mg beige powder C16H16O6 292 g/mol -144° (c 0.02; CHCl3) 22.3 min (standard gradient)
4’-Epialtenuene (16) was isolated as a light brown amorphous substance from the EtOAc extract of rice cultures of Alternaria sp. after fractionation over VLC, HP-20, RP-18 and final purification by semi preparative HPLC. It displayed an UV spectrum with maxima at 245, 282 and 321 nm, similar to the spectrum of altenuene (16). Positive and negative ESI-MS showed pseudomolecular ions at m/z 293.2 [M+H]+ and 291.3 [M-H]-, in agreement with a molecular weight of 292 amu. Furthermore, upon positive ionization loss of up to 3 molecules of water was observed, suggesting the presence of three hydroxyl groups in the molecule and the molecular formula C16H16O6, reminiscent of compound 16. Compounds 15 and 16
P e a k # 11 0 0 %
, 0
0 , 0
2 0 0 2 5 0 3 0 0 3 5 0 4 0 0 4 5 0 5 0 0 5 5 0 5 9 5
%
n m
2 4 5 . 2
2 8 1 . 6
3 2 1 . 1
No s p e c t r a lib r a r y h it s f o u n d !
0,0 10,0 20,0 30,0 40,0 50,0 60,0-200
1.000
2.000 JJ080610 #4 JCM9.2 III 3+4.5.5.5 UV_VIS_1mAU
min
1 -
22
,3
WVL:235 nm
[M+H-2H2O]+
[M+H]+
[M-H]-
[M+H-3H2O]+
[2M+Na]+
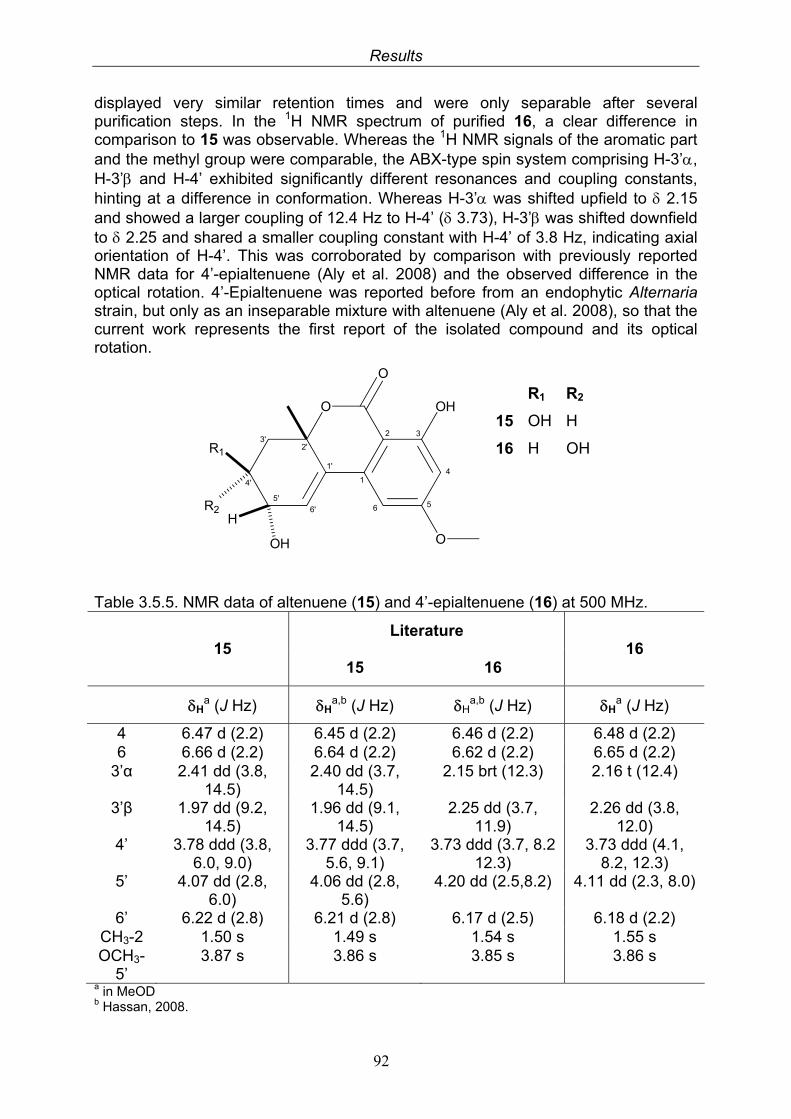
Results
92
displayed very similar retention times and were only separable after several purification steps. In the 1H NMR spectrum of purified 16, a clear difference in comparison to 15 was observable. Whereas the 1H NMR signals of the aromatic part and the methyl group were comparable, the ABX-type spin system comprising H-3’, H-3’ and H-4’ exhibited significantly different resonances and coupling constants, hinting at a difference in conformation. Whereas H-3’ was shifted upfield to 2.15 and showed a larger coupling of 12.4 Hz to H-4’ ( 3.73), H-3’ was shifted downfield to 2.25 and shared a smaller coupling constant with H-4’ of 3.8 Hz, indicating axial orientation of H-4’. This was corroborated by comparison with previously reported NMR data for 4’-epialtenuene (Aly et al. 2008) and the observed difference in the optical rotation. 4’-Epialtenuene was reported before from an endophytic Alternaria strain, but only as an inseparable mixture with altenuene (Aly et al. 2008), so that the current work represents the first report of the isolated compound and its optical rotation.
R1
R2
15 OH H
1'
1
2
O
2'
6 5
4
33'
4'
5'
6'
O
R1
OH O
OH
HR2
16 H OH
Table 3.5.5. NMR data of altenuene (15) and 4’-epialtenuene (16) at 500 MHz.
Literature
15
15 16 16
Ha (J Hz) H
a,b (J Hz) Ha,b (J Hz) H
a (J Hz)
4 6.47 d (2.2) 6.45 d (2.2) 6.46 d (2.2) 6.48 d (2.2) 6 6.66 d (2.2) 6.64 d (2.2) 6.62 d (2.2) 6.65 d (2.2)
3’α 2.41 dd (3.8, 14.5)
2.40 dd (3.7, 14.5)
2.15 brt (12.3) 2.16 t (12.4)
3’β 1.97 dd (9.2, 14.5)
1.96 dd (9.1, 14.5)
2.25 dd (3.7, 11.9)
2.26 dd (3.8, 12.0)
4’ 3.78 ddd (3.8, 6.0, 9.0)
3.77 ddd (3.7, 5.6, 9.1)
3.73 ddd (3.7, 8.2 12.3)
3.73 ddd (4.1, 8.2, 12.3)
5’ 4.07 dd (2.8, 6.0)
4.06 dd (2.8, 5.6)
4.20 dd (2.5,8.2) 4.11 dd (2.3, 8.0)
6’ 6.22 d (2.8) 6.21 d (2.8) 6.17 d (2.5) 6.18 d (2.2) CH3-2 1.50 s 1.49 s 1.54 s 1.55 s OCH3-
5’ 3.87 s 3.86 s 3.85 s 3.86 s
a in MeOD b Hassan, 2008.
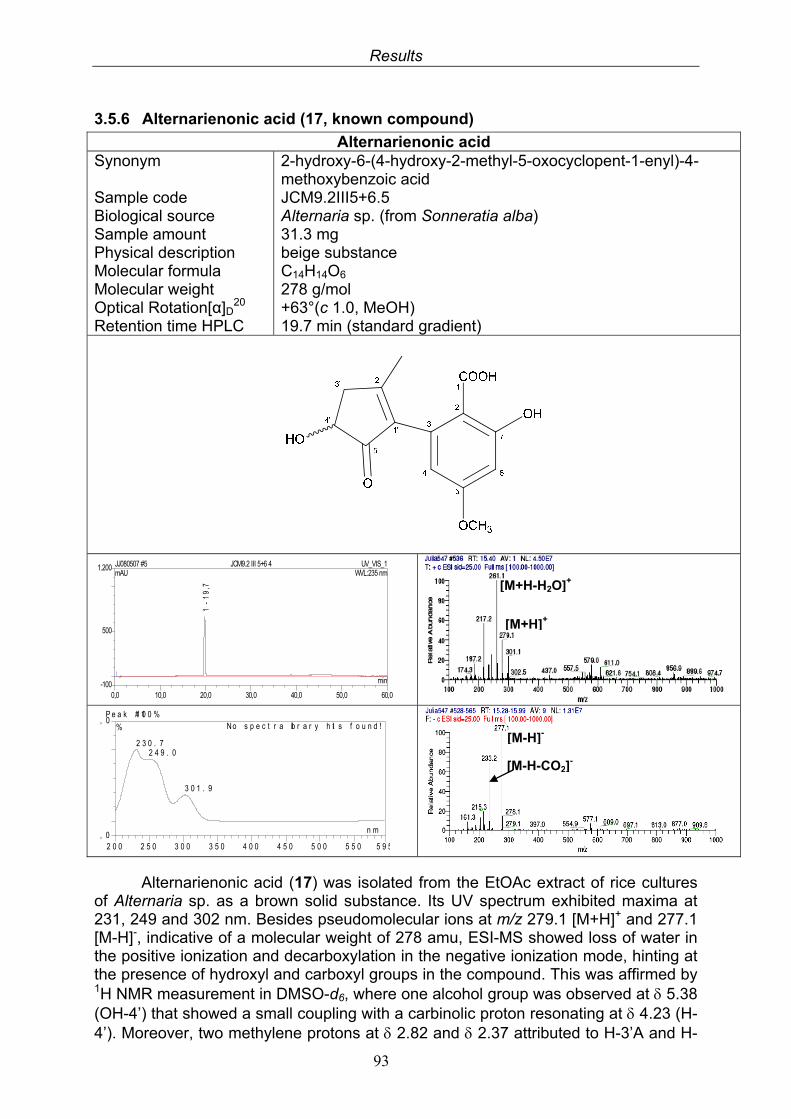
Results
93
3.5.6 Alternarienonic acid (17, known compound)
Alternarienonic acid Synonym Sample code Biological source Sample amount Physical description Molecular formula Molecular weight Optical Rotation[α]D
20 Retention time HPLC
2-hydroxy-6-(4-hydroxy-2-methyl-5-oxocyclopent-1-enyl)-4-methoxybenzoic acid JCM9.2III5+6.5 Alternaria sp. (from Sonneratia alba) 31.3 mg beige substance C14H14O6 278 g/mol +63°(c 1.0, MeOH) 19.7 min (standard gradient)
Alternarienonic acid (17) was isolated from the EtOAc extract of rice cultures of Alternaria sp. as a brown solid substance. Its UV spectrum exhibited maxima at 231, 249 and 302 nm. Besides pseudomolecular ions at m/z 279.1 [M+H]+ and 277.1 [M-H]-, indicative of a molecular weight of 278 amu, ESI-MS showed loss of water in the positive ionization and decarboxylation in the negative ionization mode, hinting at the presence of hydroxyl and carboxyl groups in the compound. This was affirmed by 1H NMR measurement in DMSO-d6, where one alcohol group was observed at 5.38 (OH-4’) that showed a small coupling with a carbinolic proton resonating at 4.23 (H-4’). Moreover, two methylene protons at 2.82 and 2.37 attributed to H-3’A and H-
P e a k # 11 0 0 %
, 0
0 , 0
2 0 0 2 5 0 3 0 0 3 5 0 4 0 0 4 5 0 5 0 0 5 5 0 5 9 5
%
n m
2 3 0 . 72 4 9 . 0
3 0 1 . 9
No s p e c t r a lib r a r y h it s f o u n d !
0,0 10,0 20,0 30,0 40,0 50,0 60,0-100
500
1.200 JJ080507 #5 JCM9.2 III 5+6 4 UV_VIS_1mAU
min
1 -
19
,7
WVL:235 nm
[M-H]-
[M+H]+
[M-H-CO2]-
[M+H-H2O]+
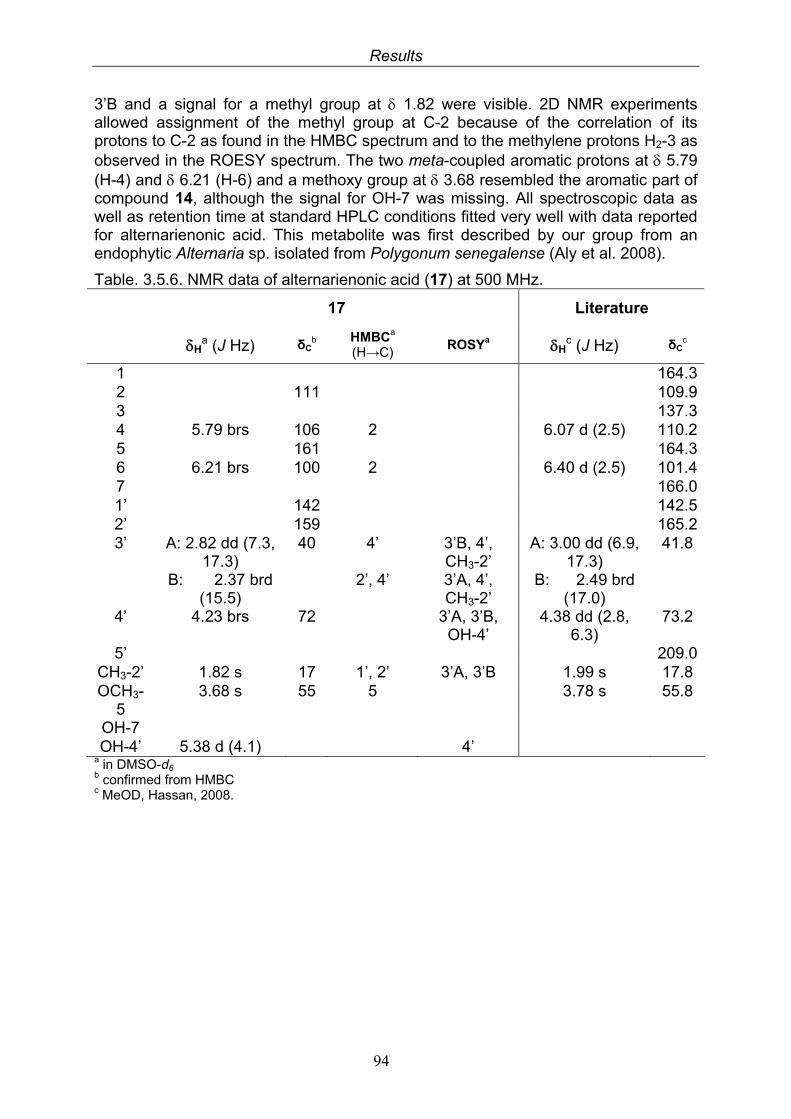
Results
94
3’B and a signal for a methyl group at 1.82 were visible. 2D NMR experiments allowed assignment of the methyl group at C-2 because of the correlation of its protons to C-2 as found in the HMBC spectrum and to the methylene protons H2-3 as observed in the ROESY spectrum. The two meta-coupled aromatic protons at 5.79 (H-4) and 6.21 (H-6) and a methoxy group at 3.68 resembled the aromatic part of compound 14, although the signal for OH-7 was missing. All spectroscopic data as well as retention time at standard HPLC conditions fitted very well with data reported for alternarienonic acid. This metabolite was first described by our group from an endophytic Alternaria sp. isolated from Polygonum senegalense (Aly et al. 2008).
Table. 3.5.6. NMR data of alternarienonic acid (17) at 500 MHz.
17 Literature
Ha (J Hz) δC
b
HMBCa (H→C)
ROSYa Hc (J Hz) δC
c
1 164.32 111 109.93 137.34 5.79 brs 106 2 6.07 d (2.5) 110.25 161 164.36 6.21 brs 100 2 6.40 d (2.5) 101.47 166.01’ 142 142.52’ 159 165.23’ A: 2.82 dd (7.3,
17.3) B: 2.37 brd
(15.5)
40 4’
2’, 4’
3’B, 4’, CH3-2’ 3’A, 4’, CH3-2’
A: 3.00 dd (6.9, 17.3)
B: 2.49 brd (17.0)
41.8
4’ 4.23 brs 72 3’A, 3’B, OH-4’
4.38 dd (2.8, 6.3)
73.2
5’ 209.0CH3-2’ 1.82 s 17 1’, 2’ 3’A, 3’B 1.99 s 17.8 OCH3-
5 3.68 s 55 5 3.78 s 55.8
OH-7 OH-4’ 5.38 d (4.1) 4’
a in DMSO-d6 b confirmed from HMBC c MeOD, Hassan, 2008.
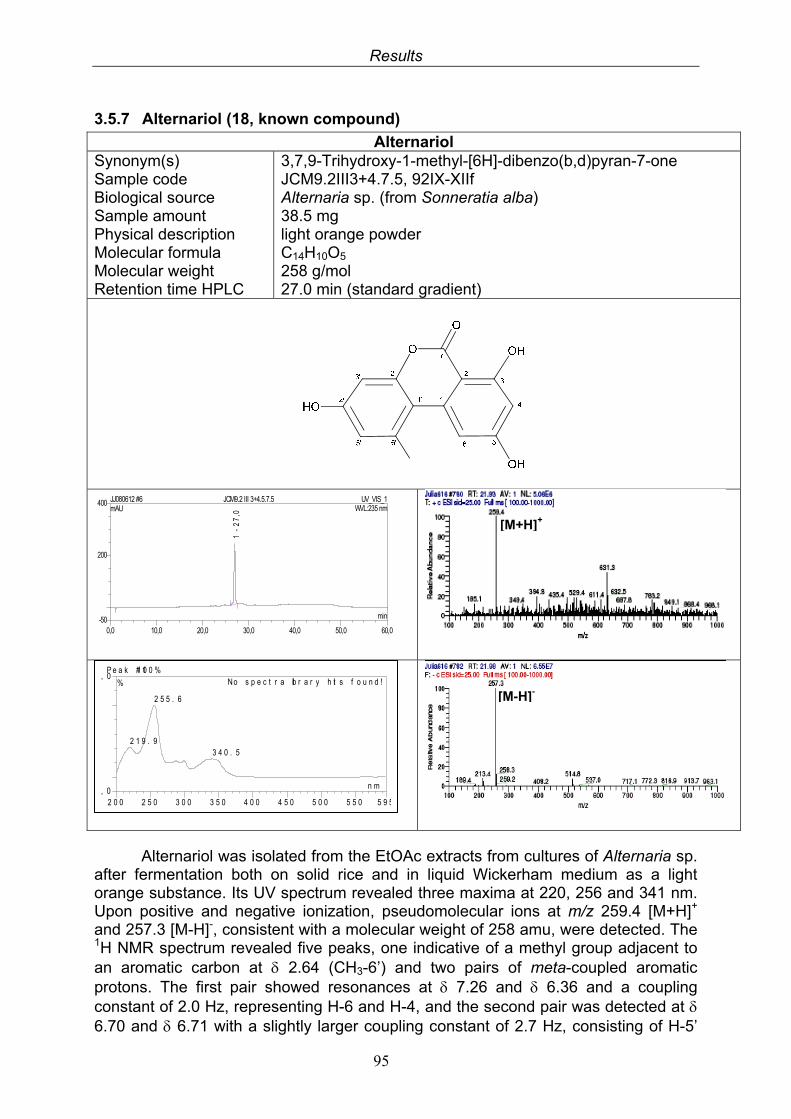
Results
95
3.5.7 Alternariol (18, known compound)
Alternariol Synonym(s) Sample code Biological source Sample amount Physical description Molecular formula Molecular weight Retention time HPLC
3,7,9-Trihydroxy-1-methyl-[6H]-dibenzo(b,d)pyran-7-one JCM9.2III3+4.7.5, 92IX-XIIf Alternaria sp. (from Sonneratia alba) 38.5 mg light orange powder C14H10O5 258 g/mol 27.0 min (standard gradient)
Alternariol was isolated from the EtOAc extracts from cultures of Alternaria sp. after fermentation both on solid rice and in liquid Wickerham medium as a light orange substance. Its UV spectrum revealed three maxima at 220, 256 and 341 nm. Upon positive and negative ionization, pseudomolecular ions at m/z 259.4 [M+H]+ and 257.3 [M-H]-, consistent with a molecular weight of 258 amu, were detected. The 1H NMR spectrum revealed five peaks, one indicative of a methyl group adjacent to an aromatic carbon at 2.64 (CH3-6’) and two pairs of meta-coupled aromatic protons. The first pair showed resonances at 7.26 and 6.36 and a coupling constant of 2.0 Hz, representing H-6 and H-4, and the second pair was detected at 6.70 and 6.71 with a slightly larger coupling constant of 2.7 Hz, consisting of H-5’
P e a k # 11 0 0 %
, 0
0 , 0
2 0 0 2 5 0 3 0 0 3 5 0 4 0 0 4 5 0 5 0 0 5 5 0 5 9 5
%
n m
2 5 5 . 6
2 1 9 . 93 4 0 . 5
No s p e c t r a lib r a r y h it s f o u n d !
0,0 10,0 20,0 30,0 40,0 50,0 60,0-50
200
400 JJ080612 #6 JCM9.2 III 3+4.5.7.5 UV_VIS_1mAU
min
1 -
27
,0
WVL:235 nm
[M-H]-
[M+H]+
Results
96
and H-3’. The spectral data were found to be identical to published data of alternariol (Raistrick et al. 1953, Coombe et al. 1970, Hassan 2007) and thus proved the structure of compound 18. Alternariol was first reported from Alternaria tenuis but since then described from several Alternaria species (Raistrick et al. 1953, Coombe et al. 1970, Bradburn et al 1994).
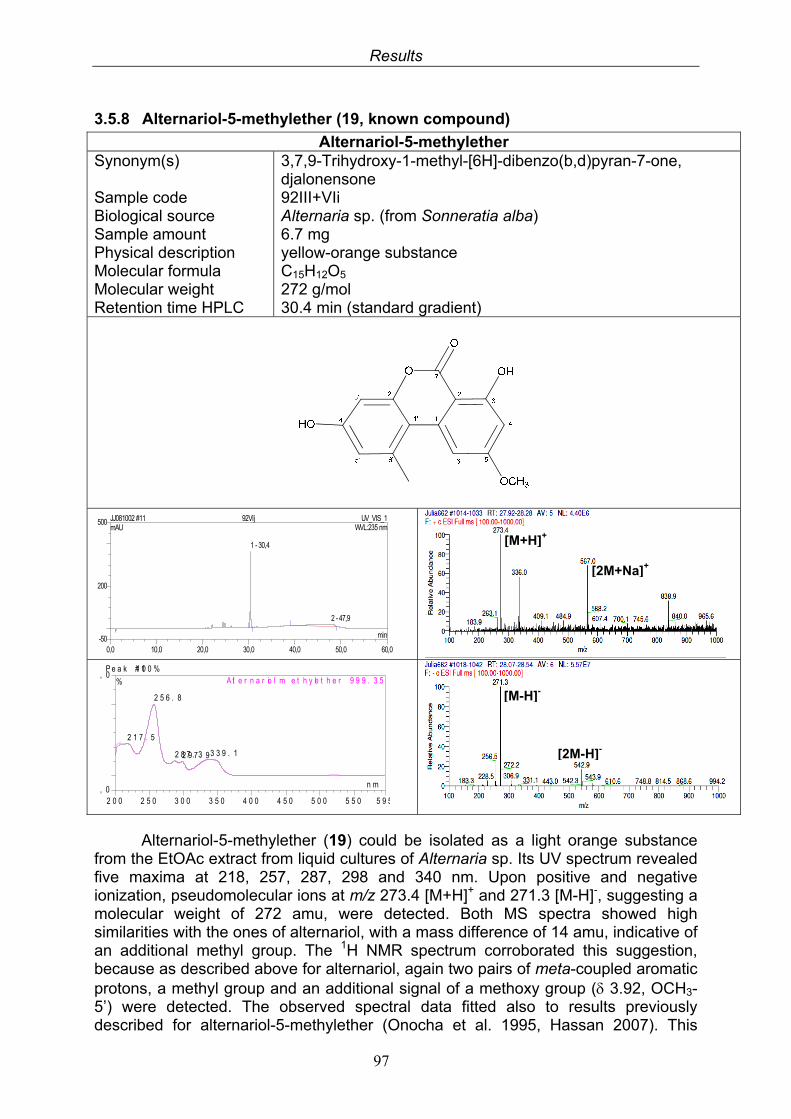
Results
97
3.5.8 Alternariol-5-methylether (19, known compound)
Alternariol-5-methylether Synonym(s) Sample code Biological source Sample amount Physical description Molecular formula Molecular weight Retention time HPLC
3,7,9-Trihydroxy-1-methyl-[6H]-dibenzo(b,d)pyran-7-one, djalonensone 92III+VIi Alternaria sp. (from Sonneratia alba) 6.7 mg yellow-orange substance C15H12O5 272 g/mol 30.4 min (standard gradient)
Alternariol-5-methylether (19) could be isolated as a light orange substance from the EtOAc extract from liquid cultures of Alternaria sp. Its UV spectrum revealed five maxima at 218, 257, 287, 298 and 340 nm. Upon positive and negative ionization, pseudomolecular ions at m/z 273.4 [M+H]+ and 271.3 [M-H]-, suggesting a molecular weight of 272 amu, were detected. Both MS spectra showed high similarities with the ones of alternariol, with a mass difference of 14 amu, indicative of an additional methyl group. The 1H NMR spectrum corroborated this suggestion, because as described above for alternariol, again two pairs of meta-coupled aromatic protons, a methyl group and an additional signal of a methoxy group ( 3.92, OCH3-5’) were detected. The observed spectral data fitted also to results previously described for alternariol-5-methylether (Onocha et al. 1995, Hassan 2007). This
P e a k # 11 0 0 %
, 0
0 , 0
2 0 0 2 5 0 3 0 0 3 5 0 4 0 0 4 5 0 5 0 0 5 5 0 5 9 5
%
n m
2 5 6 . 8
2 1 7 . 5
3 3 9 . 12 8 7 . 32 9 7 . 9
A lt e r n a r io l m e t h y le t h e r 9 9 9 . 3 5
0,0 10,0 20,0 30,0 40,0 50,0 60,0-50
200
500 JJ081002 #11 92VIj UV_VIS_1mAU
min
1 - 30,4
2 - 47,9
WVL:235 nm
[M+H]+
[2M+Na]+
[M-H]-
[2M-H]-
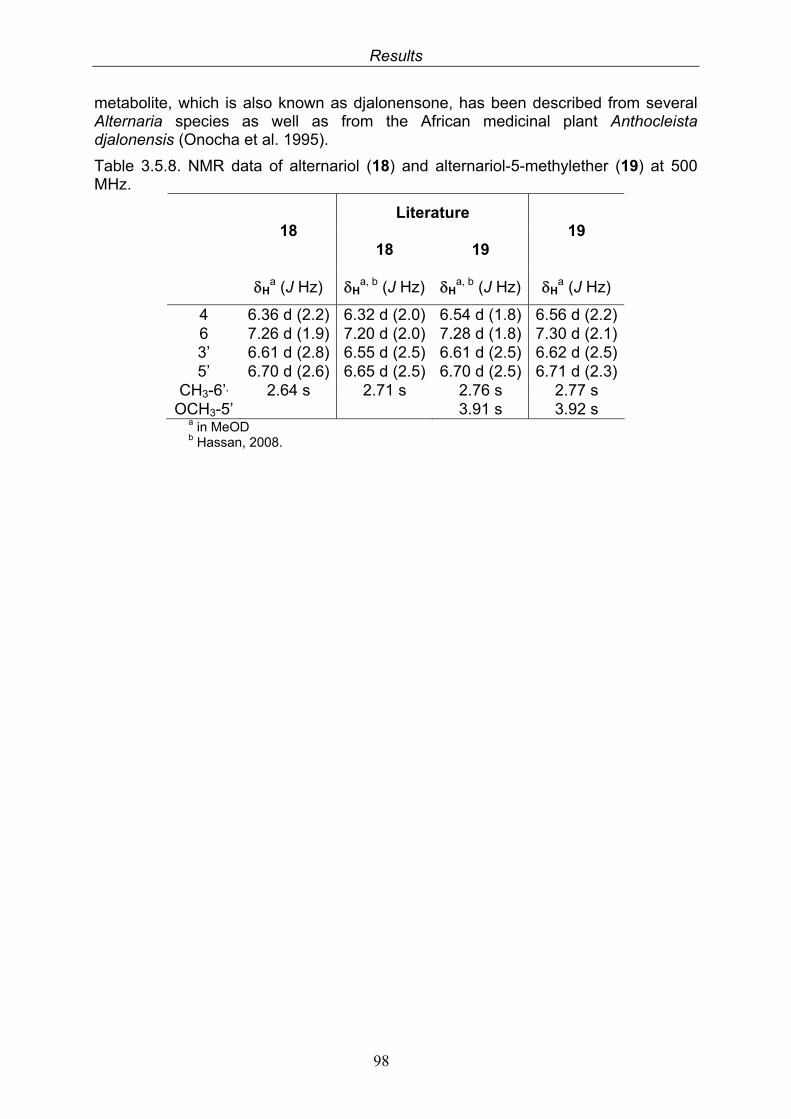
Results
98
metabolite, which is also known as djalonensone, has been described from several Alternaria species as well as from the African medicinal plant Anthocleista djalonensis (Onocha et al. 1995).
Table 3.5.8. NMR data of alternariol (18) and alternariol-5-methylether (19) at 500 MHz.
Literature
18
18 19 19
Ha (J Hz) H
a, b (J Hz) Ha, b (J Hz) H
a (J Hz)
4 6.36 d (2.2) 6.32 d (2.0) 6.54 d (1.8) 6.56 d (2.2) 6 7.26 d (1.9) 7.20 d (2.0) 7.28 d (1.8) 7.30 d (2.1) 3’ 6.61 d (2.8) 6.55 d (2.5) 6.61 d (2.5) 6.62 d (2.5) 5’ 6.70 d (2.6) 6.65 d (2.5) 6.70 d (2.5) 6.71 d (2.3)
CH3-6’’ 2.64 s 2.71 s 2.76 s 2.77 s OCH3-5’ 3.91 s 3.92 s
a in MeOD b Hassan, 2008.
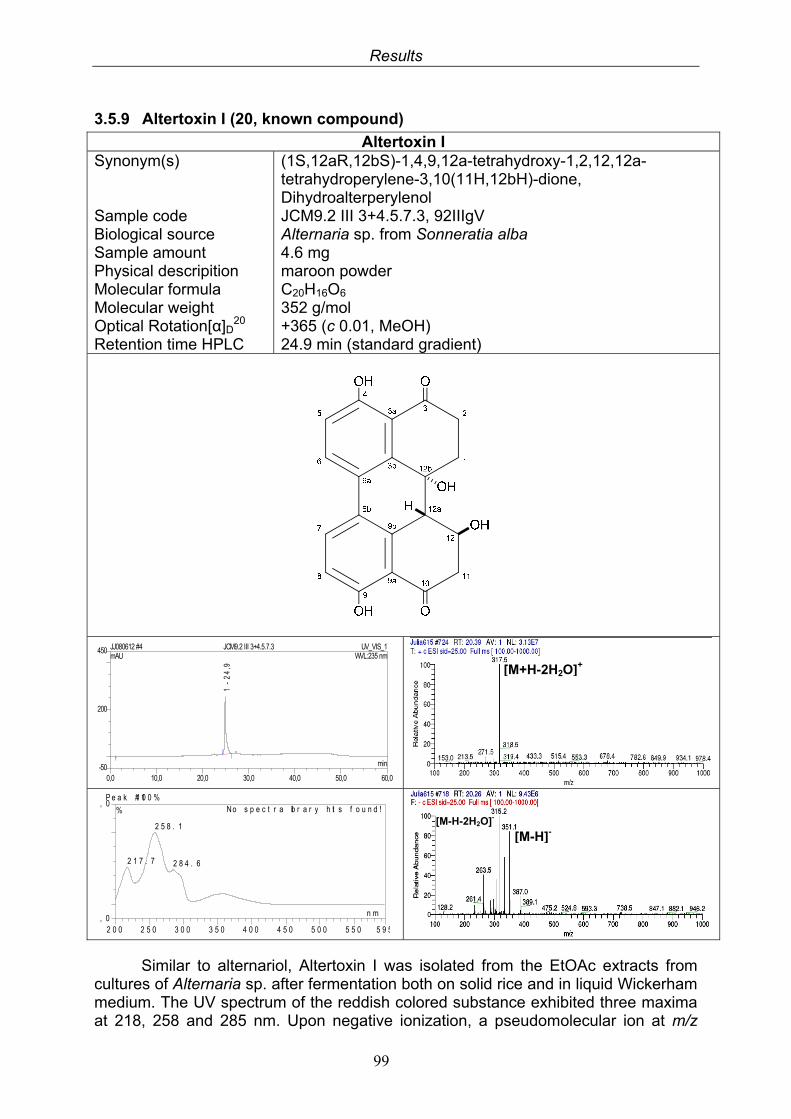
Results
99
3.5.9 Altertoxin I (20, known compound)
Altertoxin I Synonym(s) Sample code Biological source Sample amount Physical descripition Molecular formula Molecular weight Optical Rotation[α]D
20 Retention time HPLC
(1S,12aR,12bS)-1,4,9,12a-tetrahydroxy-1,2,12,12a-tetrahydroperylene-3,10(11H,12bH)-dione, Dihydroalterperylenol JCM9.2 III 3+4.5.7.3, 92IIIgV Alternaria sp. from Sonneratia alba 4.6 mg maroon powder C20H16O6 352 g/mol +365 (c 0.01, MeOH) 24.9 min (standard gradient)
Similar to alternariol, Altertoxin I was isolated from the EtOAc extracts from cultures of Alternaria sp. after fermentation both on solid rice and in liquid Wickerham medium. The UV spectrum of the reddish colored substance exhibited three maxima at 218, 258 and 285 nm. Upon negative ionization, a pseudomolecular ion at m/z
P e a k # 11 0 0 %
, 0
0 , 0
2 0 0 2 5 0 3 0 0 3 5 0 4 0 0 4 5 0 5 0 0 5 5 0 5 9 5
%
n m
2 5 8 . 1
2 1 7 . 7 2 8 4 . 6
No s p e c t r a lib r a r y h it s f o u n d !
0,0 10,0 20,0 30,0 40,0 50,0 60,0-50
200
450 JJ080612 #4 JCM9.2 III 3+4.5.7.3 UV_VIS_1mAU
min
1 -
24
,9
WVL:235 nm
[M+H-2H2O]+
[M-H]-[M-H-2H2O]-
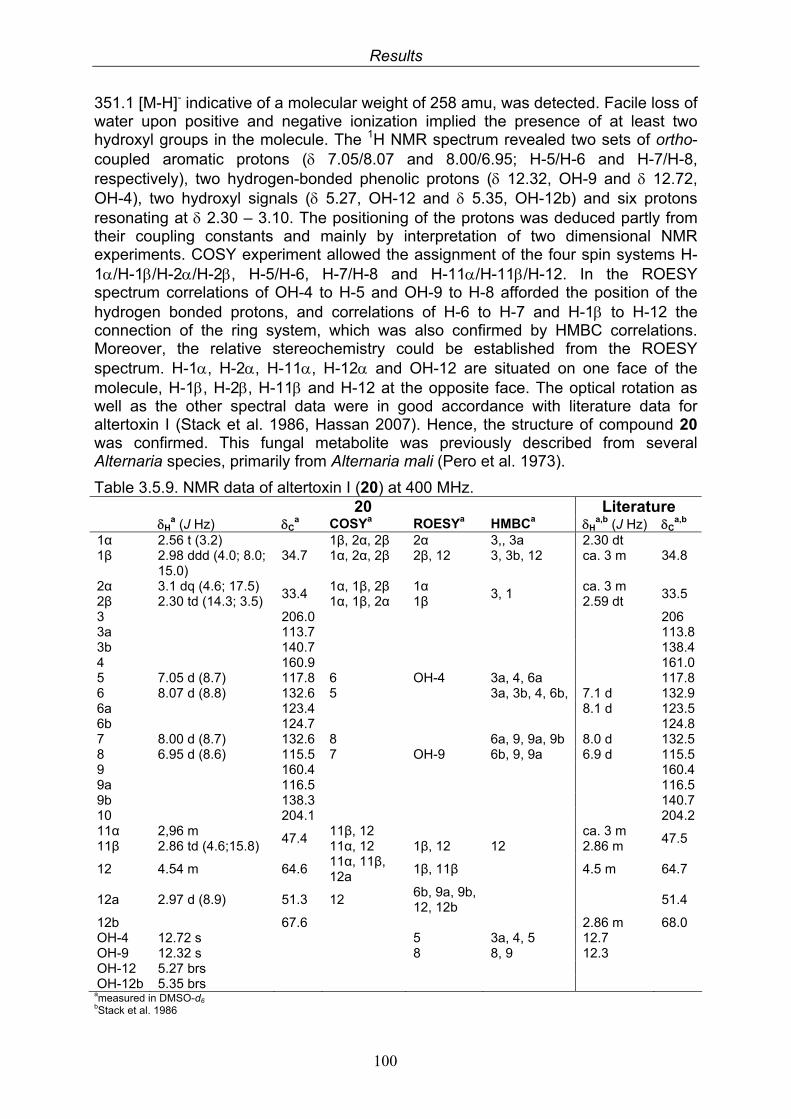
Results
100
351.1 [M-H]- indicative of a molecular weight of 258 amu, was detected. Facile loss of water upon positive and negative ionization implied the presence of at least two hydroxyl groups in the molecule. The 1H NMR spectrum revealed two sets of ortho-coupled aromatic protons ( 7.05/8.07 and 8.00/6.95; H-5/H-6 and H-7/H-8, respectively), two hydrogen-bonded phenolic protons ( 12.32, OH-9 and 12.72, OH-4), two hydroxyl signals ( 5.27, OH-12 and 5.35, OH-12b) and six protons resonating at 2.30 – 3.10. The positioning of the protons was deduced partly from their coupling constants and mainly by interpretation of two dimensional NMR experiments. COSY experiment allowed the assignment of the four spin systems H-1/H-1/H-2/H-2, H-5/H-6, H-7/H-8 and H-11/H-11/H-12. In the ROESY spectrum correlations of OH-4 to H-5 and OH-9 to H-8 afforded the position of the hydrogen bonded protons, and correlations of H-6 to H-7 and H-1 to H-12 the connection of the ring system, which was also confirmed by HMBC correlations. Moreover, the relative stereochemistry could be established from the ROESY spectrum. H-1, H-2, H-11, H-12 and OH-12 are situated on one face of the molecule, H-1, H-2, H-11 and H-12 at the opposite face. The optical rotation as well as the other spectral data were in good accordance with literature data for altertoxin I (Stack et al. 1986, Hassan 2007). Hence, the structure of compound 20 was confirmed. This fungal metabolite was previously described from several Alternaria species, primarily from Alternaria mali (Pero et al. 1973).
Table 3.5.9. NMR data of altertoxin I (20) at 400 MHz. 20 Literature H
a (J Hz) Ca COSYa ROESYa HMBCa H
a,b (J Hz) Ca,b
1α 1β
2.56 t (3.2) 2.98 ddd (4.0; 8.0; 15.0)
34.7 1β, 2α, 2β 1α, 2α, 2β
2α 2β, 12
3,, 3a 3, 3b, 12
2.30 dt ca. 3 m
34.8
2α 2β
3.1 dq (4.6; 17.5) 2.30 td (14.3; 3.5)
33.4 1α, 1β, 2β 1α, 1β, 2α
1α 1β
3, 1 ca. 3 m 2.59 dt
33.5
3 206.0 206 3a 113.7 113.83b 140.7 138.44 160.9 161.05 7.05 d (8.7) 117.8 6 OH-4 3a, 4, 6a 117.86 8.07 d (8.8) 132.6 5 3a, 3b, 4, 6b, 7.1 d 132.96a 123.4 8.1 d 123.56b 124.7 124.87 8.00 d (8.7) 132.6 8 6a, 9, 9a, 9b 8.0 d 132.58 6.95 d (8.6) 115.5 7 OH-9 6b, 9, 9a 6.9 d 115.59 160.4 160.49a 116.5 116.59b 138.3 140.710 204.1 204.211α 11β
2,96 m 2.86 td (4.6;15.8)
47.4 11β, 12 11α, 12
1β, 12
12
ca. 3 m 2.86 m
47.5
12 4.54 m 64.6 11α, 11β, 12a
1β, 11β 4.5 m 64.7
12a 2.97 d (8.9) 51.3 12 6b, 9a, 9b, 12, 12b
51.4
12b 67.6 2.86 m 68.0 OH-4 12.72 s 5 3a, 4, 5 12.7 OH-9 12.32 s 8 8, 9 12.3 OH-12 5.27 brs OH-12b 5.35 brs
ameasured in DMSO-d6 bStack et al. 1986
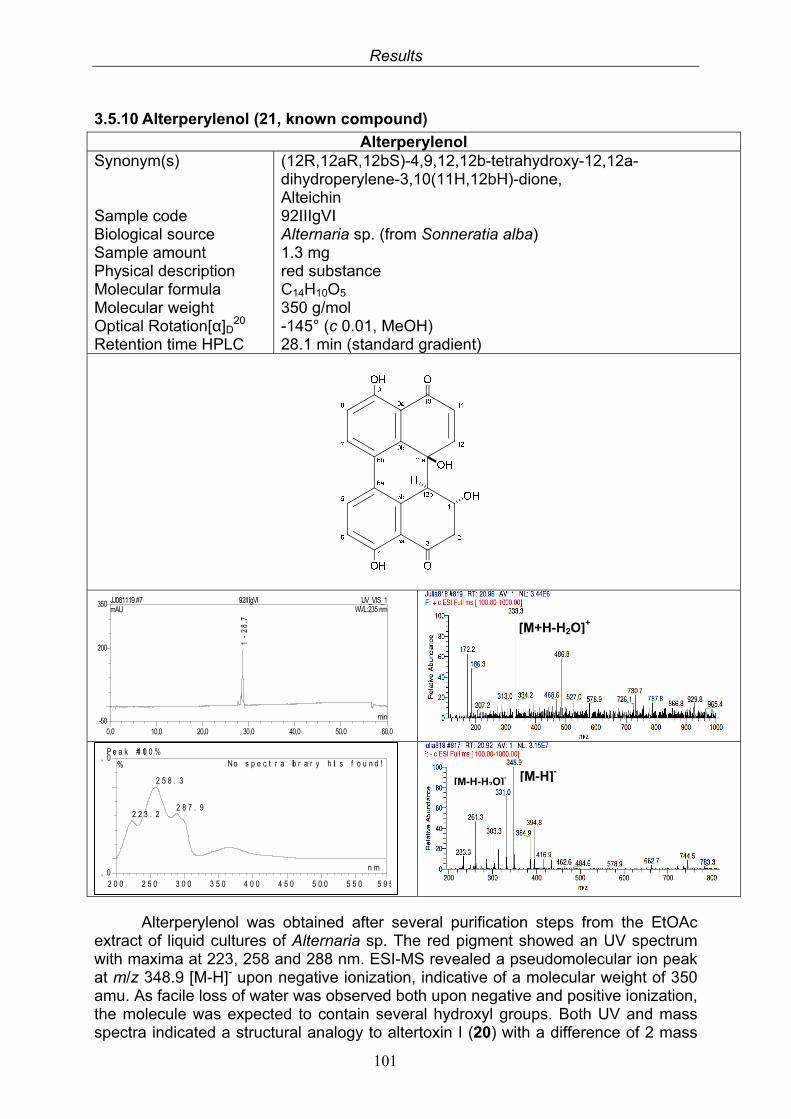
Results
101
3.5.10 Alterperylenol (21, known compound)
Alterperylenol Synonym(s) Sample code Biological source Sample amount Physical description Molecular formula Molecular weight Optical Rotation[α]D
20 Retention time HPLC
(12R,12aR,12bS)-4,9,12,12b-tetrahydroxy-12,12a-dihydroperylene-3,10(11H,12bH)-dione, Alteichin 92IIIgVI Alternaria sp. (from Sonneratia alba) 1.3 mg red substance C14H10O5 350 g/mol -145° (c 0.01, MeOH) 28.1 min (standard gradient)
Alterperylenol was obtained after several purification steps from the EtOAc extract of liquid cultures of Alternaria sp. The red pigment showed an UV spectrum with maxima at 223, 258 and 288 nm. ESI-MS revealed a pseudomolecular ion peak at m/z 348.9 [M-H]- upon negative ionization, indicative of a molecular weight of 350 amu. As facile loss of water was observed both upon negative and positive ionization, the molecule was expected to contain several hydroxyl groups. Both UV and mass spectra indicated a structural analogy to altertoxin I (20) with a difference of 2 mass
P e a k # 11 0 0 %
, 0
0 , 0
2 0 0 2 5 0 3 0 0 3 5 0 4 0 0 4 5 0 5 0 0 5 5 0 5 9 5
%
n m
2 5 8 . 3
2 8 7 . 92 2 3 . 2
No s p e c t r a lib r a r y h it s f o u n d !
0,0 10,0 20,0 30,0 40,0 50,0 60,0-50
200
350 JJ081119 #7 92IIIgVI UV_VIS_1mAU
min
1 -
28
,7
WVL:235 nm
[M-H]-[M-H-H2O]-
[M+H-H2O]+
Results
102
units. This was confirmed by 1H NMR and two dimensional NMR experiments. Two sets of ortho-coupled aromatic protons and two hydrogen bonded protons were observed, similar to the aromatic part of altertoxin I. The carbinolic proton H-1 and the protons H-2 and H-2 were equal to H-12, H-11 and H-11. Instead of four aliphatic protons, only two protons, shifted downfield in comparison to 20, were attached at C-11 ( 6.34, H-11) and C-12 ( 7.89, H-12) and exhibited a coupling constant of 10.4 Hz, consistent with a cis-double bond. The relative stereochemistry could be deduced after close examination of the ROESY spectrum. H-1 ( 4.51) showed correlations to both hydroxyl groups OH-1 ( 5.71) and OH-12b ( 5.73), but not to H-12b ( 3.11). All data were in accordance with literature data of the plant pathogenic and antifungal metabolite alterperylenol, also known as alteichin, which was previously reported from several Alternaria species (Okuno et al. 1983, Robeson et al. 1984, Stack et al. 1986, Hradil et al. 1989). Comparison with literature data is also the reason for the inconsistent numbering of the similar compounds 20 and 21.
Table 3.5.10. NMR data of alterperylenol (21) at 400 MHz. 21 Literature
Ha (J Hz) COSYa NOESYa H
a,b (J Hz)
Ha,c (J Hz)
1 4,51 m 2α, 2β, 12b,
OH-1 12, OH-1, OH-12a
4,74 td (10, 5)
4.50 m
2α 2β
2.95 d (11.9) 2.90 dd (5.0;
15.8)
1, 2β 1, 2α
1
3.01 m 3.26 t (10)
2.97 dd (16, 6.3)
2.89 dd (16, 11.7)
5 7.06 d (8.7) 6 7.04 d (8.7) 7.06 d (8.8) 6 8.02 d (8.7) 5 8.01 d (8.7) 8.02 d (8.8) 7 8.08 d (8.6) 8 8.05 d (8.7) 8.08 d (8.8) 8 6.96 d (8.5) 7 6.95 d (8.7) 6.96 d (8.8)
11 6.34 d (10.4) 12 6.31 d (10) 6.35 d (10.5)
12 7.89 d (10.4) 11 1, 11, OH-1, OH-
12a 8.04 d (10) 7.89 d (10.5)
12b 3.11 d (9.5) 3.01 3.10 dd (9.7,
1.7) OH-1 5.71 brs 1, 12 5.73 d (6.3) OH-4 12.39 s 12.4 12.36 s OH-9 12.47 s 12.5 12.72 s
OH-12a 5.73 s 1, 12 5.76 d (1.7) ameasured in DMSO-d6 bRobeson et al. 1984 cOkuno et al. 1983
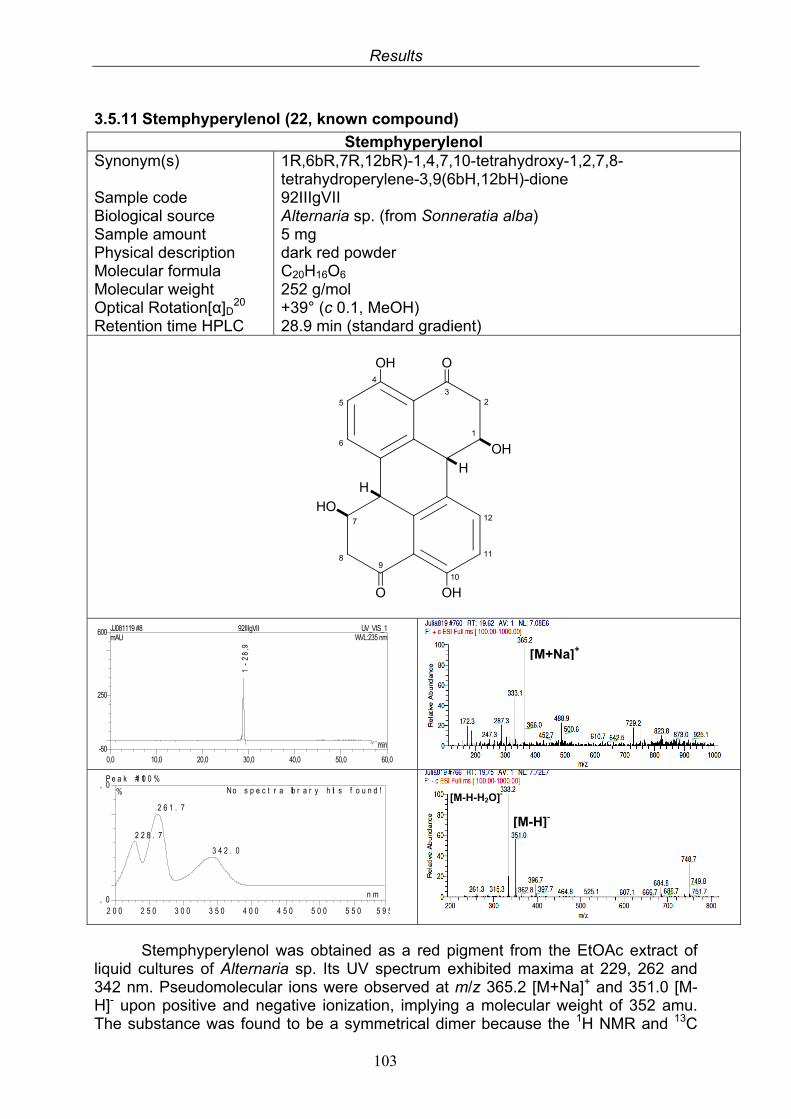
Results
103
3.5.11 Stemphyperylenol (22, known compound)
Stemphyperylenol Synonym(s) Sample code Biological source Sample amount Physical description Molecular formula Molecular weight Optical Rotation[α]D
20 Retention time HPLC
1R,6bR,7R,12bR)-1,4,7,10-tetrahydroxy-1,2,7,8-tetrahydroperylene-3,9(6bH,12bH)-dione 92IIIgVII Alternaria sp. (from Sonneratia alba) 5 mg dark red powder C20H16O6 252 g/mol +39° (c 0.1, MeOH) 28.9 min (standard gradient)
5
6
4
1
23
7
89
10
11
12
OH O
OHO
HO
OH
H
H
Stemphyperylenol was obtained as a red pigment from the EtOAc extract of liquid cultures of Alternaria sp. Its UV spectrum exhibited maxima at 229, 262 and 342 nm. Pseudomolecular ions were observed at m/z 365.2 [M+Na]+ and 351.0 [M-H]- upon positive and negative ionization, implying a molecular weight of 352 amu. The substance was found to be a symmetrical dimer because the 1H NMR and 13C
P e a k # 11 0 0 %
, 0
0 , 0
2 0 0 2 5 0 3 0 0 3 5 0 4 0 0 4 5 0 5 0 0 5 5 0 5 9 5
%
n m
2 6 1 . 7
2 2 8 . 7
3 4 2 . 0
No s p e c t r a lib r a r y h it s f o u n d !
0,0 10,0 20,0 30,0 40,0 50,0 60,0-50
250
600 JJ081119 #8 92IIIgVII UV_VIS_1mAU
min
1 -
28
,9
WVL:235 nm
[M-H]-
[M-H-H2O]-
[M+Na]+
Results
104
NMR spectra only revealed signals for eight protons and ten carbons. A pair of aromatic protons ( 8.04, H-6/H-12 and 6.86, H-5/H-11) exhibited an ortho-coupling (J = 8.7 Hz), while a chelated phenolic hydroxyl proton (OH-4/OH-10) resonanted at 12.02, and another hydroxyl proton at 3.3 (OH-1/OH-7) was part of an ABMXY spin system comprising signals at 4.60 (H-1/H-7), 3.73 (H-6b/H-12b), 3.15 (H-2b/H-11b) and 2.92 (H-2a/H-11a). The spin systems that were deduced from the 1H NMR spectrum could be connected after examination of COSY, HMBC and ROESY spectra. 13C NMR also revealed typical signals of a reduced perylenequinone derivative with similarities to altertoxin I (20). Comparison of the obtained results with literature data identified compound 22 as stemphyperylenol, a metabolite that has been described from Stemphylium botryosum and several Alternaria species (Arnone et al. 1986, Hradil et al 1989).
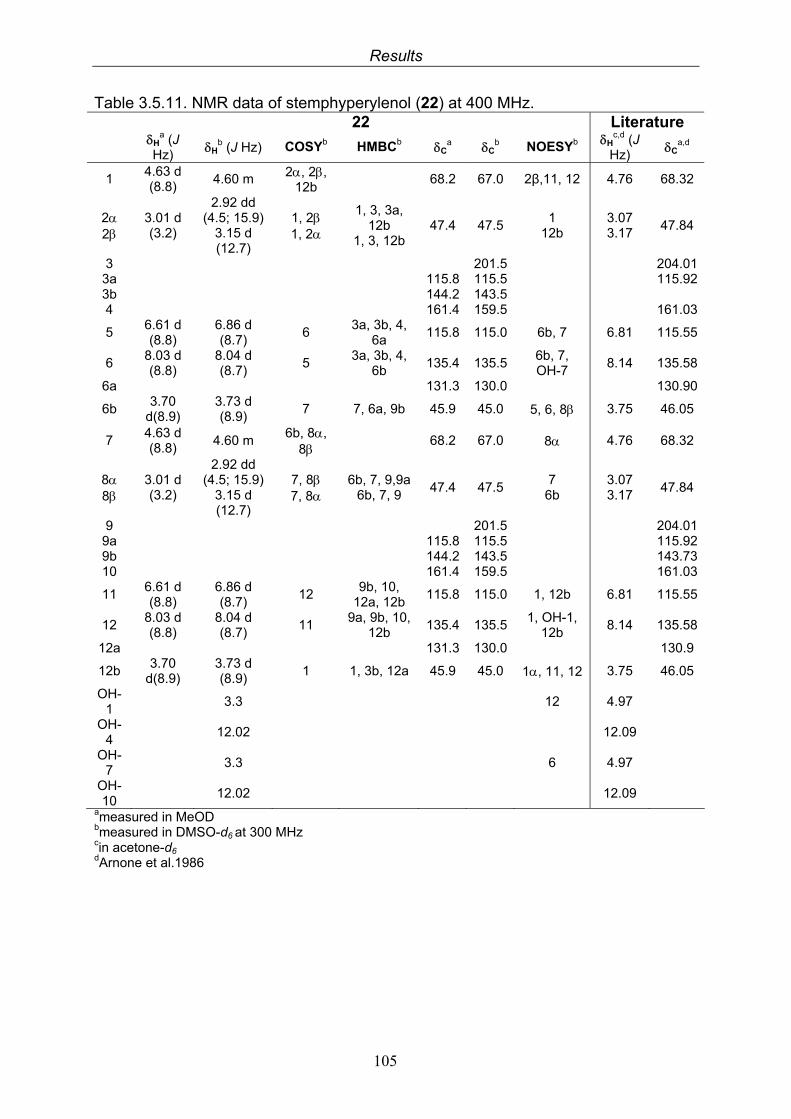
Results
105
Table 3.5.11. NMR data of stemphyperylenol (22) at 400 MHz. 22 Literature
Ha (J
Hz) H
b (J Hz) COSYb HMBCb Ca C
b NOESYb Hc,d (J Hz)
Ca,d
1 4.63 d (8.8)
4.60 m 2, 2, 12b
68.2 67.0 2β,11, 12 4.76 68.32
2 2
3.01 d (3.2)
2.92 dd (4.5; 15.9)
3.15 d (12.7)
1, 2 1, 2
1, 3, 3a, 12b
1, 3, 12b 47.4 47.5
1 12b
3.07 3.17
47.84
3 201.5 204.013a 115.8 115.5 115.923b 144.2 143.5 4 161.4 159.5 161.03
5 6.61 d (8.8)
6.86 d (8.7)
6 3a, 3b, 4,
6a 115.8 115.0 6b, 7 6.81 115.55
6 8.03 d (8.8)
8.04 d (8.7)
5 3a, 3b, 4,
6b 135.4 135.5
6b, 7, OH-7
8.14 135.58
6a 131.3 130.0 130.90
6b 3.70
d(8.9) 3.73 d (8.9)
7 7, 6a, 9b 45.9 45.0 5, 6, 8 3.75 46.05
7 4.63 d (8.8)
4.60 m 6b, 8,
8 68.2 67.0 8 4.76 68.32
8 8
3.01 d (3.2)
2.92 dd (4.5; 15.9)
3.15 d (12.7)
7, 8 7, 8
6b, 7, 9,9a 6b, 7, 9
47.4 47.5 7 6b
3.07 3.17
47.84
9 201.5 204.019a 115.8 115.5 115.929b 144.2 143.5 143.7310 161.4 159.5 161.03
11 6.61 d (8.8)
6.86 d (8.7)
12 9b, 10,
12a, 12b 115.8 115.0 1, 12b 6.81 115.55
12 8.03 d (8.8)
8.04 d (8.7)
11 9a, 9b, 10,
12b 135.4 135.5
1, OH-1, 12b
8.14 135.58
12a 131.3 130.0 130.9
12b 3.70
d(8.9) 3.73 d (8.9)
1 1, 3b, 12a 45.9 45.0 1, 11, 12 3.75 46.05
OH-1
3.3 12 4.97
OH-4
12.02 12.09
OH-7
3.3 6 4.97
OH-10
12.02 12.09 ameasured in MeOD bmeasured in DMSO-d6 at 300 MHz cin acetone-d6 dArnone et al.1986
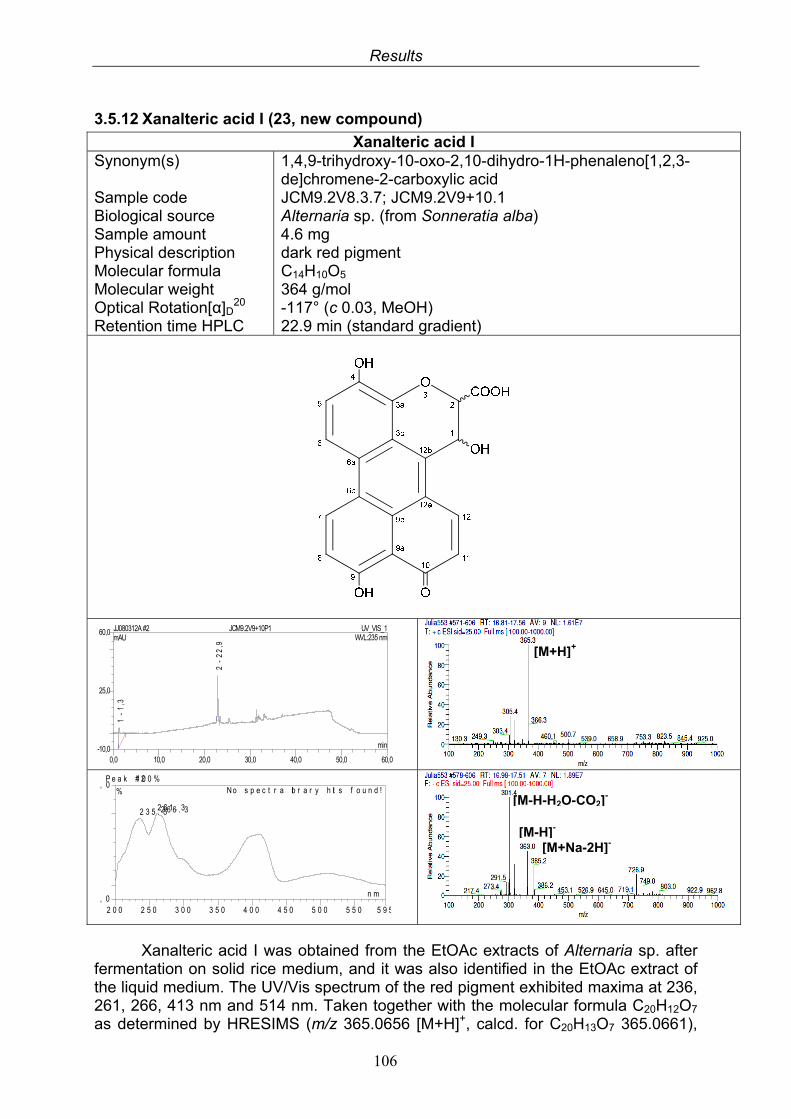
Results
106
3.5.12 Xanalteric acid I (23, new compound)
Xanalteric acid I Synonym(s) Sample code Biological source Sample amount Physical description Molecular formula Molecular weight Optical Rotation[α]D
20 Retention time HPLC
1,4,9-trihydroxy-10-oxo-2,10-dihydro-1H-phenaleno[1,2,3-de]chromene-2-carboxylic acid JCM9.2V8.3.7; JCM9.2V9+10.1 Alternaria sp. (from Sonneratia alba) 4.6 mg dark red pigment C14H10O5 364 g/mol -117° (c 0.03, MeOH) 22.9 min (standard gradient)
Xanalteric acid I was obtained from the EtOAc extracts of Alternaria sp. after fermentation on solid rice medium, and it was also identified in the EtOAc extract of the liquid medium. The UV/Vis spectrum of the red pigment exhibited maxima at 236, 261, 266, 413 nm and 514 nm. Taken together with the molecular formula C20H12O7 as determined by HRESIMS (m/z 365.0656 [M+H]+, calcd. for C20H13O7 365.0661),
P e a k # 21 0 0 %
, 0
, 0
2 0 0 2 5 0 3 0 0 3 5 0 4 0 0 4 5 0 5 0 0 5 5 0 5 9 5
%
n m
2 6 1 . 32 6 6 . 32 3 5 . 5
N o s p e c t r a lib r a r y h it s f o u n d !
0,0 10,0 20,0 30,0 40,0 50,0 60,0-10,0
25,0
60,0 JJ080312A #2 JCM9.2V9+10P1 UV_VIS_1mAU
min
1 -
1,3
2 -
22
,9
WVL:235 nm
[M-H]-
[M+Na-2H]-
[M-H-H2O-CO2]-
[M+H]+
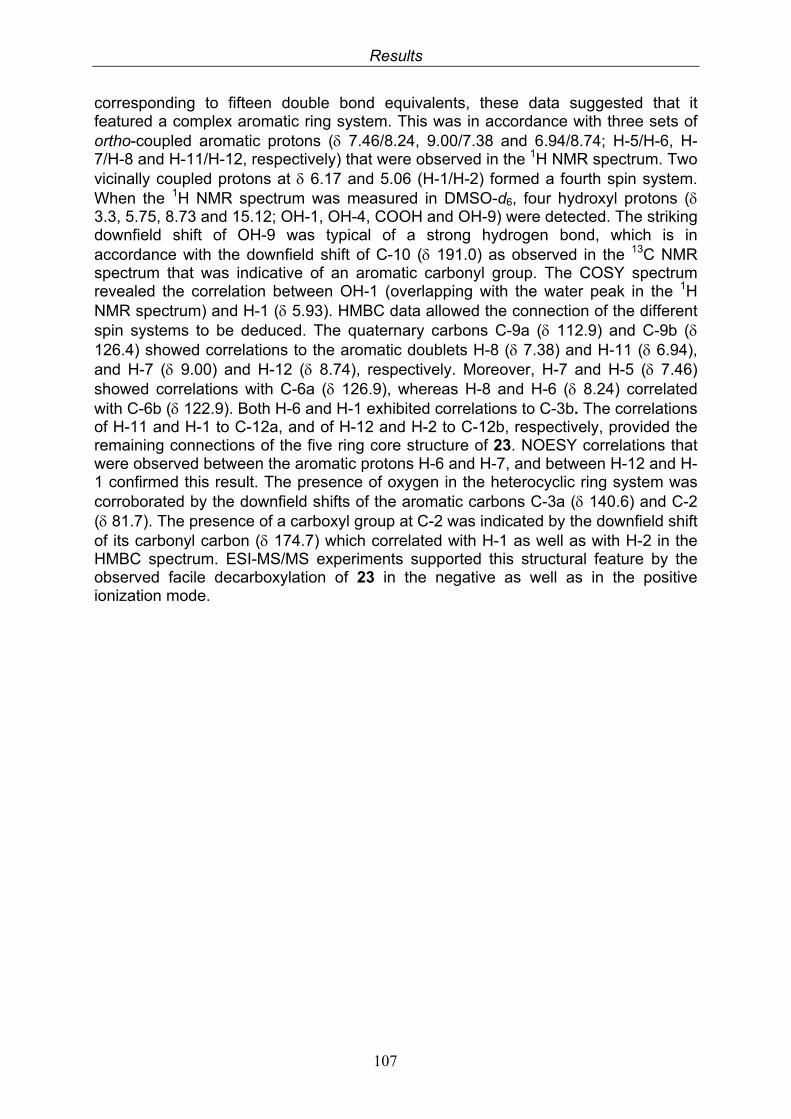
Results
107
corresponding to fifteen double bond equivalents, these data suggested that it featured a complex aromatic ring system. This was in accordance with three sets of ortho-coupled aromatic protons ( 7.46/8.24, 9.00/7.38 and 6.94/8.74; H-5/H-6, H-7/H-8 and H-11/H-12, respectively) that were observed in the 1H NMR spectrum. Two vicinally coupled protons at 6.17 and 5.06 (H-1/H-2) formed a fourth spin system. When the 1H NMR spectrum was measured in DMSO-d6, four hydroxyl protons ( 3.3, 5.75, 8.73 and 15.12; OH-1, OH-4, COOH and OH-9) were detected. The striking downfield shift of OH-9 was typical of a strong hydrogen bond, which is in accordance with the downfield shift of C-10 ( 191.0) as observed in the 13C NMR spectrum that was indicative of an aromatic carbonyl group. The COSY spectrum revealed the correlation between OH-1 (overlapping with the water peak in the 1H NMR spectrum) and H-1 ( 5.93). HMBC data allowed the connection of the different spin systems to be deduced. The quaternary carbons C-9a ( 112.9) and C-9b ( 126.4) showed correlations to the aromatic doublets H-8 ( 7.38) and H-11 ( 6.94), and H-7 ( 9.00) and H-12 ( 8.74), respectively. Moreover, H-7 and H-5 ( 7.46) showed correlations with C-6a ( 126.9), whereas H-8 and H-6 ( 8.24) correlated with C-6b ( 122.9). Both H-6 and H-1 exhibited correlations to C-3b. The correlations of H-11 and H-1 to C-12a, and of H-12 and H-2 to C-12b, respectively, provided the remaining connections of the five ring core structure of 23. NOESY correlations that were observed between the aromatic protons H-6 and H-7, and between H-12 and H-1 confirmed this result. The presence of oxygen in the heterocyclic ring system was corroborated by the downfield shifts of the aromatic carbons C-3a ( 140.6) and C-2 ( 81.7). The presence of a carboxyl group at C-2 was indicated by the downfield shift of its carbonyl carbon ( 174.7) which correlated with H-1 as well as with H-2 in the HMBC spectrum. ESI-MS/MS experiments supported this structural feature by the observed facile decarboxylation of 23 in the negative as well as in the positive ionization mode.
Results
108
3.5.13 Xanalteric acid II (24, new compound)
Xanalteric acid II Synonym(s) Sample code Biological source Sample amount Physical description Molecular formula Molecular weight Optical Rotation[α]D
20 Retention time HPLC
2,4,9-trihydroxy-10-oxo-2,10-dihydro-1H-phenaleno[1,2,3-de]chromene-2-carboxylic acid JCM9.2V9+10.3, JCM9.2V9+11.2 Alternaria sp. (from Sonneratia alba) 5 mg dark red substance C14H10O5 364 g/mol +43° (c 0.019, MeOH) 27.0 min (standard gradient)
7
8
9
9a
9b
6b
1011
1212a
OOH
12b
3b
6a
3a
4
5
6 1
2
O3
OH
OH
COOH
Xanalteric acid II, also obtained as a red powder, displayed physical characteristics comparable to those of compound 23. The HRESIMS again exhibited a peak at m/z 365.0656 [M+H]+, and in the MS/MS experiment a facile decarboxylation of the compound was observed. 1H-NMR and HMBC spectra revealed very similar signals for the three spin systems of the aromatic protons H-
P e a k # 11 0 0 %
, 0
0 , 0
2 0 0 2 5 0 3 0 0 3 5 0 4 0 0 4 5 0 5 0 0 5 5 0 5 9 5
%
n m
2 6 1 . 22 3 0 . 32 3 5 . 4
No s p e c t r a lib r a r y h it s f o u n d !
0,0 10,0 20,0 30,0 40,0 50,0 60,0-30
140 JJ080312 #2 JCM9.2V9+10P3 UV_VIS_1mAU
min
1 -
28
,0
WVL:235 nm
[M+H]+
[M-H]-
[M-H-CO2]-
[M-H-CO2-H2O]- [2M-H]-
Results
109
5/H-6, H-7/H-8 and H-11/H-12 as found for xanalteric acid I (23), whereas the fourth spin system due to its upfield shift (compared to 23, see table 3.5.13) and the large coupling constant of 17.3 Hz indicated the presence of geminal protons. This observation was confirmed by a HMQC experiment, which displayed correlations of protons H-1A and H-1B to C-1 at δC 34.8. Accordingly, 24 (2,4,9-trihydroxy-10-oxo-2,10-dihydro-1H-phenaleno[1,2,3-de]chromene-2-carboxylic acid) is an isomer of 23, for which the name xanalteric acid II was proposed.
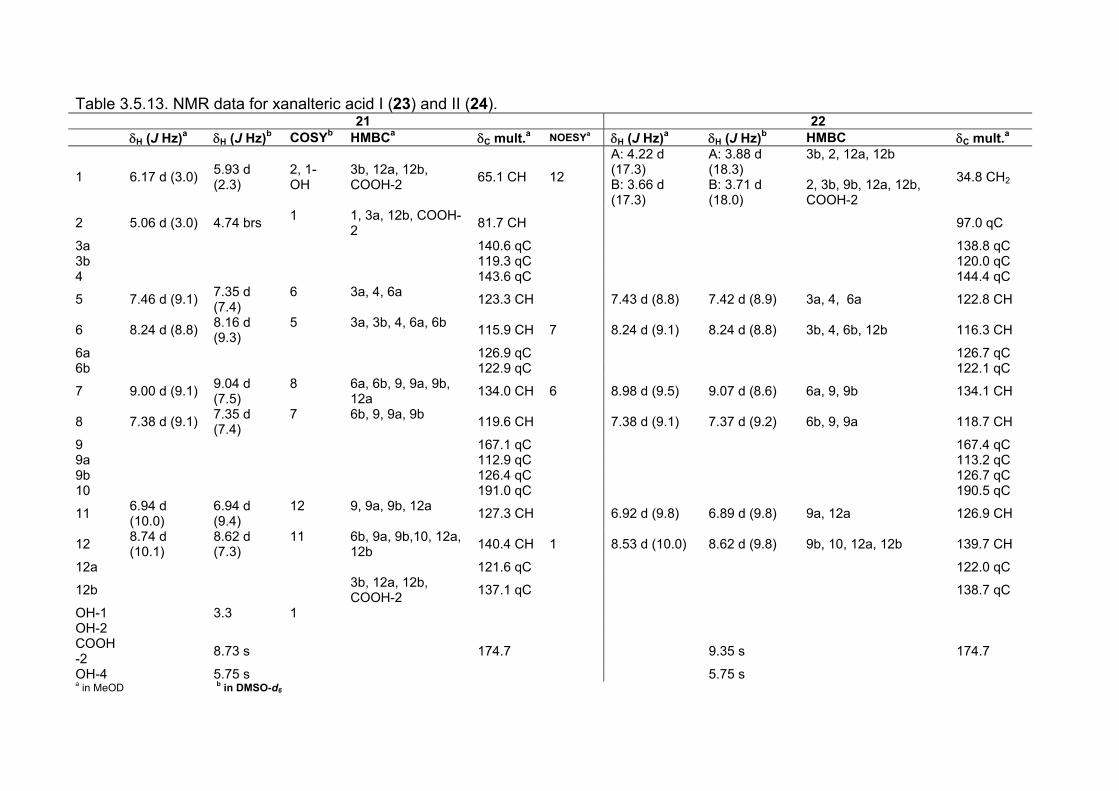
Table 3.5.13. NMR data for xanalteric acid I (23) and II (24). 21 22 H (J Hz)a H (J Hz)b COSYb HMBCa C mult.a NOESYa H (J Hz)a H (J Hz)b HMBC C mult.a
1 6.17 d (3.0) 5.93 d (2.3)
2, 1-OH
3b, 12a, 12b, COOH-2
65.1 CH 12
A: 4.22 d (17.3) B: 3.66 d (17.3)
A: 3.88 d (18.3) B: 3.71 d (18.0)
3b, 2, 12a, 12b 2, 3b, 9b, 12a, 12b, COOH-2
34.8 CH2
2 5.06 d (3.0) 4.74 brs 1 1, 3a, 12b, COOH-
2 81.7 CH 97.0 qC
3a 140.6 qC 138.8 qC 3b 119.3 qC 120.0 qC 4 143.6 qC 144.4 qC
5 7.46 d (9.1) 7.35 d (7.4)
6 3a, 4, 6a 123.3 CH 7.43 d (8.8) 7.42 d (8.9) 3a, 4, 6a 122.8 CH
6 8.24 d (8.8) 8.16 d (9.3)
5 3a, 3b, 4, 6a, 6b 115.9 CH 7 8.24 d (9.1) 8.24 d (8.8) 3b, 4, 6b, 12b 116.3 CH
6a 126.9 qC 126.7 qC 6b 122.9 qC 122.1 qC
7 9.00 d (9.1) 9.04 d (7.5)
8 6a, 6b, 9, 9a, 9b, 12a
134.0 CH 6 8.98 d (9.5) 9.07 d (8.6) 6a, 9, 9b 134.1 CH
8 7.38 d (9.1) 7.35 d (7.4)
7 6b, 9, 9a, 9b 119.6 CH 7.38 d (9.1) 7.37 d (9.2) 6b, 9, 9a 118.7 CH
9 167.1 qC 167.4 qC 9a 112.9 qC 113.2 qC 9b 126.4 qC 126.7 qC 10 191.0 qC 190.5 qC
11 6.94 d (10.0)
6.94 d (9.4)
12 9, 9a, 9b, 12a 127.3 CH 6.92 d (9.8) 6.89 d (9.8) 9a, 12a 126.9 CH
12 8.74 d (10.1)
8.62 d (7.3)
11 6b, 9a, 9b,10, 12a, 12b
140.4 CH 1 8.53 d (10.0) 8.62 d (9.8) 9b, 10, 12a, 12b 139.7 CH
12a 121.6 qC 122.0 qC
12b 3b, 12a, 12b,
COOH-2 137.1 qC 138.7 qC
OH-1 3.3 1 OH-2 COOH -2
8.73 s
174.7 9.35 s 174.7
OH-4 5.75 s 5.75 s a in MeOD b in DMSO-d6
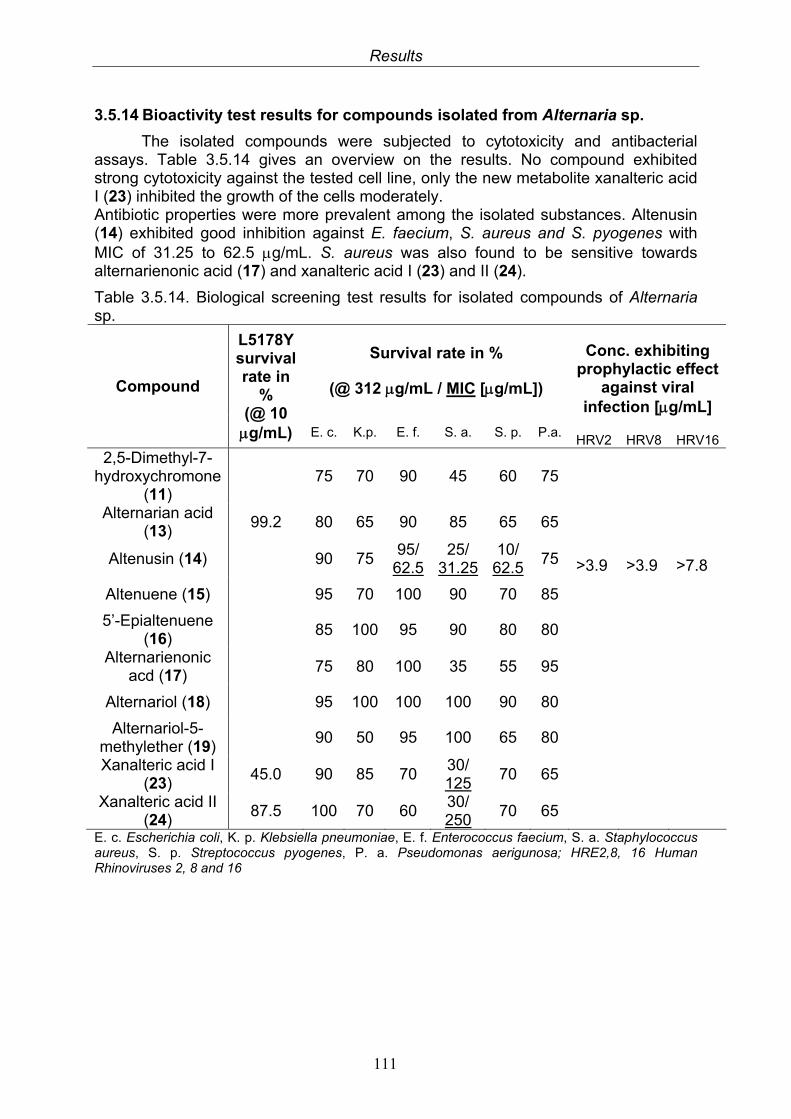
Results
111
3.5.14 Bioactivity test results for compounds isolated from Alternaria sp.
The isolated compounds were subjected to cytotoxicity and antibacterial assays. Table 3.5.14 gives an overview on the results. No compound exhibited strong cytotoxicity against the tested cell line, only the new metabolite xanalteric acid I (23) inhibited the growth of the cells moderately. Antibiotic properties were more prevalent among the isolated substances. Altenusin (14) exhibited good inhibition against E. faecium, S. aureus and S. pyogenes with MIC of 31.25 to 62.5 g/mL. S. aureus was also found to be sensitive towards alternarienonic acid (17) and xanalteric acid I (23) and II (24).
Table 3.5.14. Biological screening test results for isolated compounds of Alternaria sp.
Survival rate in %
(@ 312 g/mL / MIC [g/mL])
Conc. exhibiting prophylactic effect
against viral infection [g/mL]
Compound
L5178Y survival rate in
% (@ 10 g/mL) E. c. K.p. E. f. S. a. S. p. P.a.
HRV2 HRV8 HRV162,5-Dimethyl-7-
hydroxychromone (11)
75 70 90 45 60 75
Alternarian acid (13)
99.2 80 65 90 85 65 65
Altenusin (14) 90 75 95/
62.525/
31.2510/
62.575 >3.9 >3.9 >7.8
Altenuene (15) 95 70 100 90 70 85 5’-Epialtenuene
(16) 85 100 95 90 80 80
Alternarienonic acd (17)
75 80 100 35 55 95
Alternariol (18) 95 100 100 100 90 80 Alternariol-5-
methylether (19) 90 50 95 100 65 80
Xanalteric acid I (23)
45.0 90 85 70 30/ 125
70 65 Xanalteric acid II
(24) 87.5 100 70 60
30/ 250
70 65 E. c. Escherichia coli, K. p. Klebsiella pneumoniae, E. f. Enterococcus faecium, S. a. Staphylococcus aureus, S. p. Streptococcus pyogenes, P. a. Pseudomonas aerigunosa; HRE2,8, 16 Human Rhinoviruses 2, 8 and 16
Results
112
3.6 Proof of the fungal origin of the new compounds xanalteric acid I and II
To prove the fungal origin of the new compounds xanalteric acid I (23) and II (24), two different approaches were undertaken. Firstly, Alternaria sp. was fermented in liquid Wickerham medium upon addition of two different antibiotics, penicillin G or chloramphenicol. The obtained extracts still contained the two new compounds that could be unambiguously identified by their characteristic UV and mass spectra. In a second experiment PCR with DNA fragments of freeze-dried pieces of the fungal strain JCM9.2 (Alternaria sp.) was performed using the bacterial primers 27f and 149r. No bacterial DNA was identified in the sample of Alternaria sp.
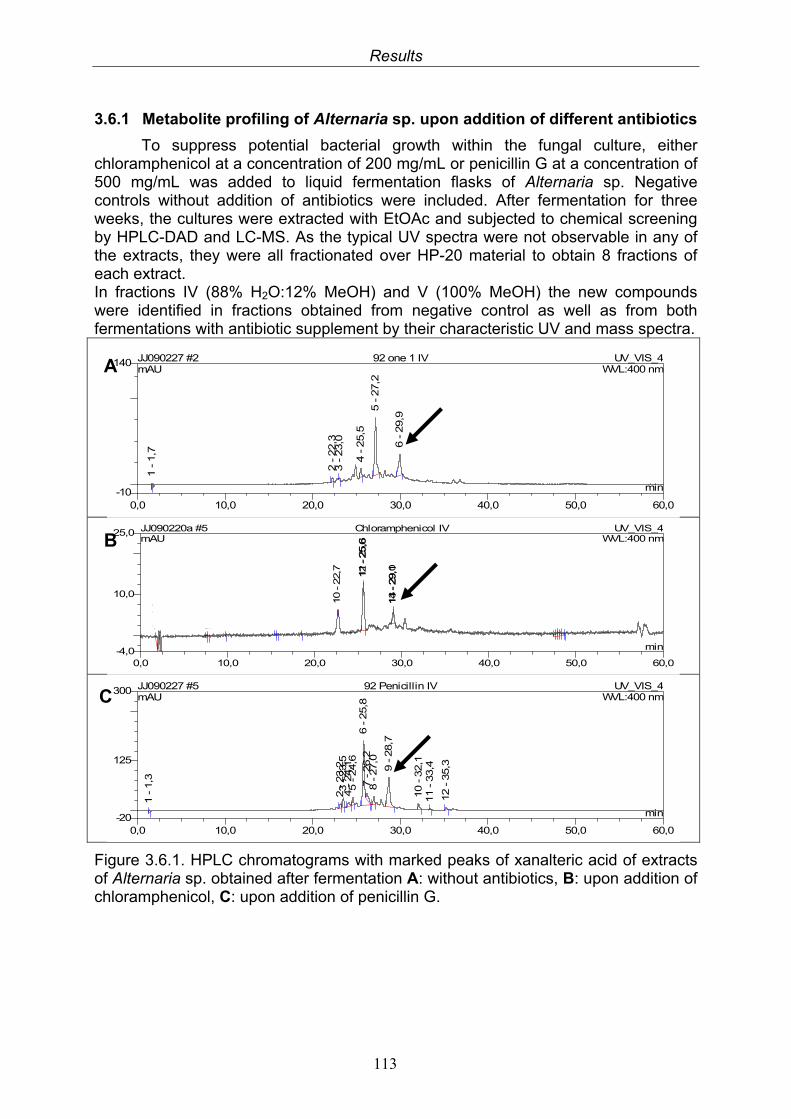
Results
113
3.6.1 Metabolite profiling of Alternaria sp. upon addition of different antibiotics
To suppress potential bacterial growth within the fungal culture, either chloramphenicol at a concentration of 200 mg/mL or penicillin G at a concentration of 500 mg/mL was added to liquid fermentation flasks of Alternaria sp. Negative controls without addition of antibiotics were included. After fermentation for three weeks, the cultures were extracted with EtOAc and subjected to chemical screening by HPLC-DAD and LC-MS. As the typical UV spectra were not observable in any of the extracts, they were all fractionated over HP-20 material to obtain 8 fractions of each extract. In fractions IV (88% H2O:12% MeOH) and V (100% MeOH) the new compounds were identified in fractions obtained from negative control as well as from both fermentations with antibiotic supplement by their characteristic UV and mass spectra.
Figure 3.6.1. HPLC chromatograms with marked peaks of xanalteric acid of extracts of Alternaria sp. obtained after fermentation A: without antibiotics, B: upon addition of chloramphenicol, C: upon addition of penicillin G.
0,0 10,0 20,0 30,0 40,0 50,0 60,0-10
140 JJ090227 #2 92 one 1 IV UV_VIS_4mAU
min
1 - 1
,7
2 - 2
2,3
3 - 2
3,0
4 - 2
5,5
5 - 2
7,2
6 - 2
9,9
WVL:400 nm
0,0 10,0 20,0 30,0 40,0 50,0 60,0-20
125
300 JJ090227 #5 92 Penicillin IV UV_VIS_4mAU
min
1 - 1
,3
2 - 2
3,2
3 - 2
3,5
4 - 2
4,1
5 - 2
4,6
6 - 2
5,8
7 - 2
6,2
8 - 2
7,0
9 - 2
8,7
10 - 3
2,1
11 - 3
3,4
12 - 3
5,3
WVL:400 nm
0,0 10,0 20,0 30,0 40,0 50,0 60,0-4,0
10,0
25,0 JJ090220a #5 Chloramphenicol IV UV_VIS_4mAU
min
1 - 1
,92 - 2
,13 - 2
,3
4 - 7
,55 - 7
,9
6 - 9
,8
7 - 1
5,4
8 - 1
5,8
9 - 1
8,6 10 - 2
2,7 11 - 2
5,6
12 - 2
5,6
13 - 2
9,0
14 - 2
9,1
15 - 4
7,5
16 - 4
7,7
17 - 4
7,9
18 - 4
8,2
19 - 4
8,4
20 - 4
8,8
WVL:400 nm
A
B
C
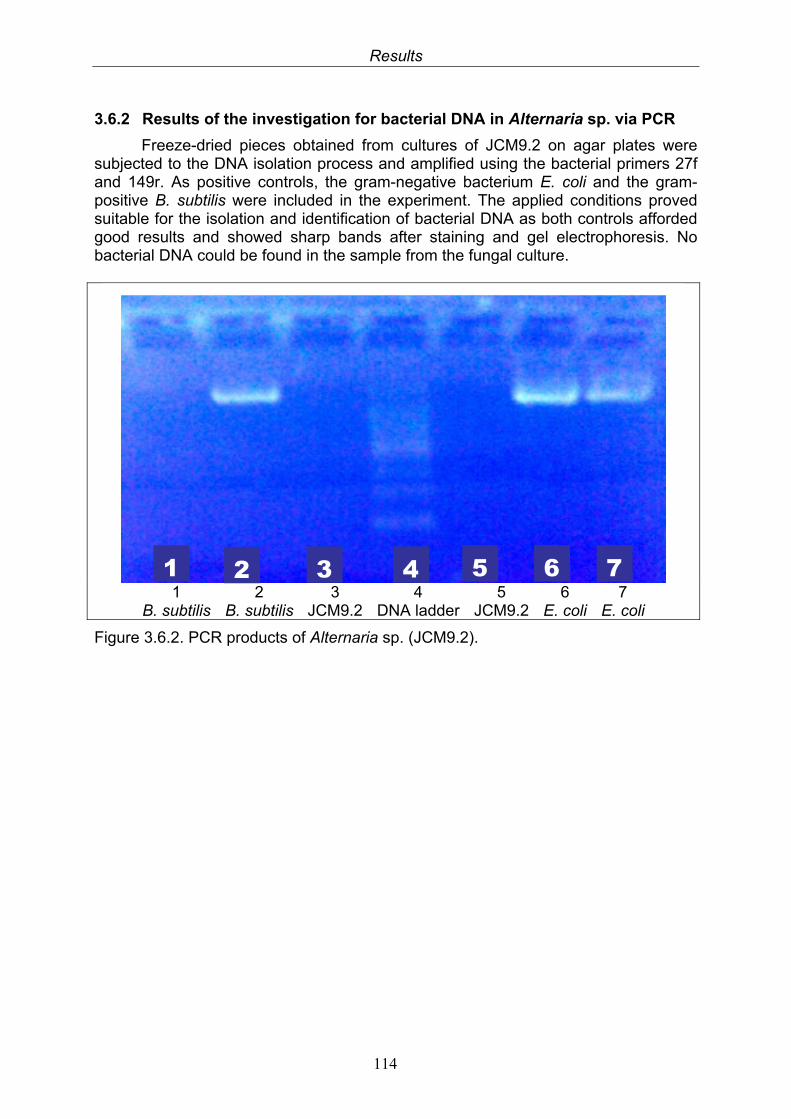
Results
114
3.6.2 Results of the investigation for bacterial DNA in Alternaria sp. via PCR
Freeze-dried pieces obtained from cultures of JCM9.2 on agar plates were subjected to the DNA isolation process and amplified using the bacterial primers 27f and 149r. As positive controls, the gram-negative bacterium E. coli and the gram-positive B. subtilis were included in the experiment. The applied conditions proved suitable for the isolation and identification of bacterial DNA as both controls afforded good results and showed sharp bands after staining and gel electrophoresis. No bacterial DNA could be found in the sample from the fungal culture.
1 2 3 4 5 6 7
B. subtilis B. subtilis JCM9.2 DNA ladder JCM9.2 E. coli E. coli
Figure 3.6.2. PCR products of Alternaria sp. (JCM9.2).
1 7 2 3 4 5 6
Results
115
3.7 Tracing of fungal metabolites in the corresponding plant extracts
All of the compounds isolated from Alternaria sp., besides 12 and 22, were detected in the crude extracts of the fungus, either from liquid fermentation or from fermentation on rice medium. As our group was recently able to detect fungal compounds in their respective host plants, the crude extract of Sonneratia alba was also analyzed for fungal substances. As no positive results were obtained after analysis of the crude extract of the plant (Hassan 2007), a fractionation over Diaion material was performed in order to concentrate the potential compounds for further investigation. However, it was not possible to detect any of the secondary metabolites in any of the host-plant derived fractions.
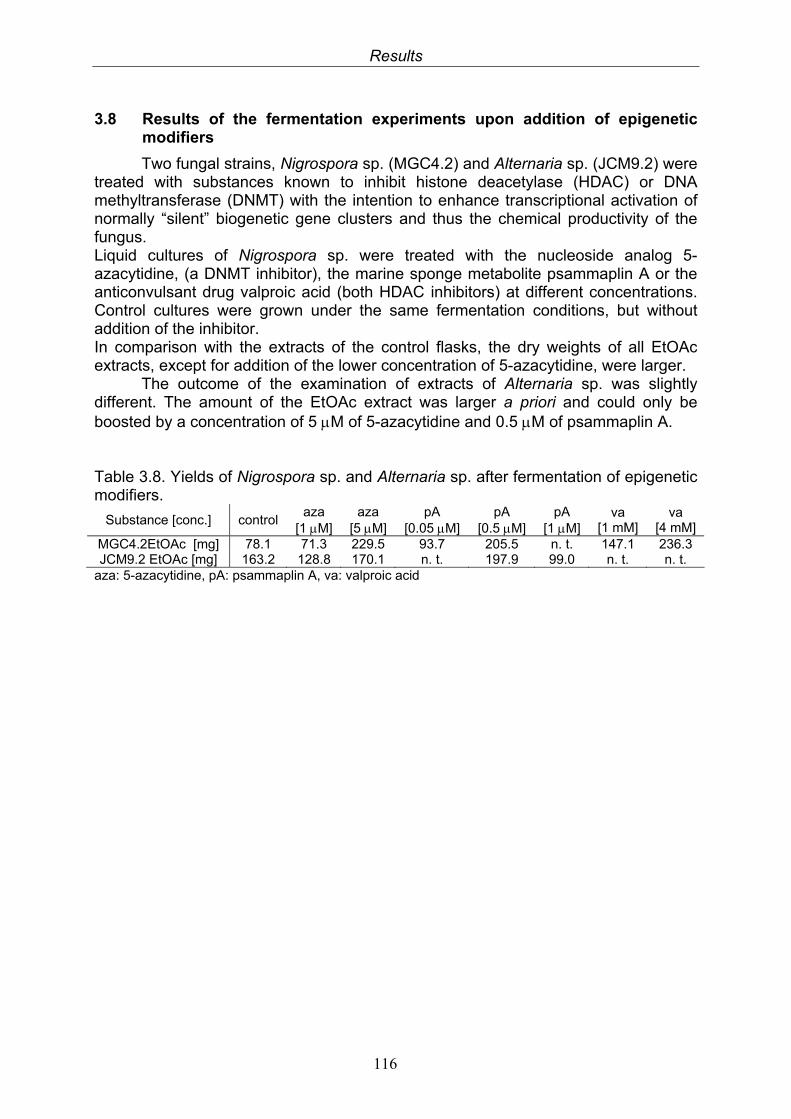
Results
116
3.8 Results of the fermentation experiments upon addition of epigenetic modifiers
Two fungal strains, Nigrospora sp. (MGC4.2) and Alternaria sp. (JCM9.2) were treated with substances known to inhibit histone deacetylase (HDAC) or DNA methyltransferase (DNMT) with the intention to enhance transcriptional activation of normally “silent” biogenetic gene clusters and thus the chemical productivity of the fungus. Liquid cultures of Nigrospora sp. were treated with the nucleoside analog 5-azacytidine, (a DNMT inhibitor), the marine sponge metabolite psammaplin A or the anticonvulsant drug valproic acid (both HDAC inhibitors) at different concentrations. Control cultures were grown under the same fermentation conditions, but without addition of the inhibitor. In comparison with the extracts of the control flasks, the dry weights of all EtOAc extracts, except for addition of the lower concentration of 5-azacytidine, were larger.
The outcome of the examination of extracts of Alternaria sp. was slightly different. The amount of the EtOAc extract was larger a priori and could only be boosted by a concentration of 5 M of 5-azacytidine and 0.5 M of psammaplin A. Table 3.8. Yields of Nigrospora sp. and Alternaria sp. after fermentation of epigenetic modifiers.
Substance [conc.] control aza
[1 M] aza
[5 M] pA
[0.05 M] pA
[0.5 M] pA
[1 M] va
[1 mM] va
[4 mM] MGC4.2EtOAc [mg] 78.1 71.3 229.5 93.7 205.5 n. t. 147.1 236.3 JCM9.2 EtOAc [mg] 163.2 128.8 170.1 n. t. 197.9 99.0 n. t. n. t.
aza: 5-azacytidine, pA: psammaplin A, va: valproic acid
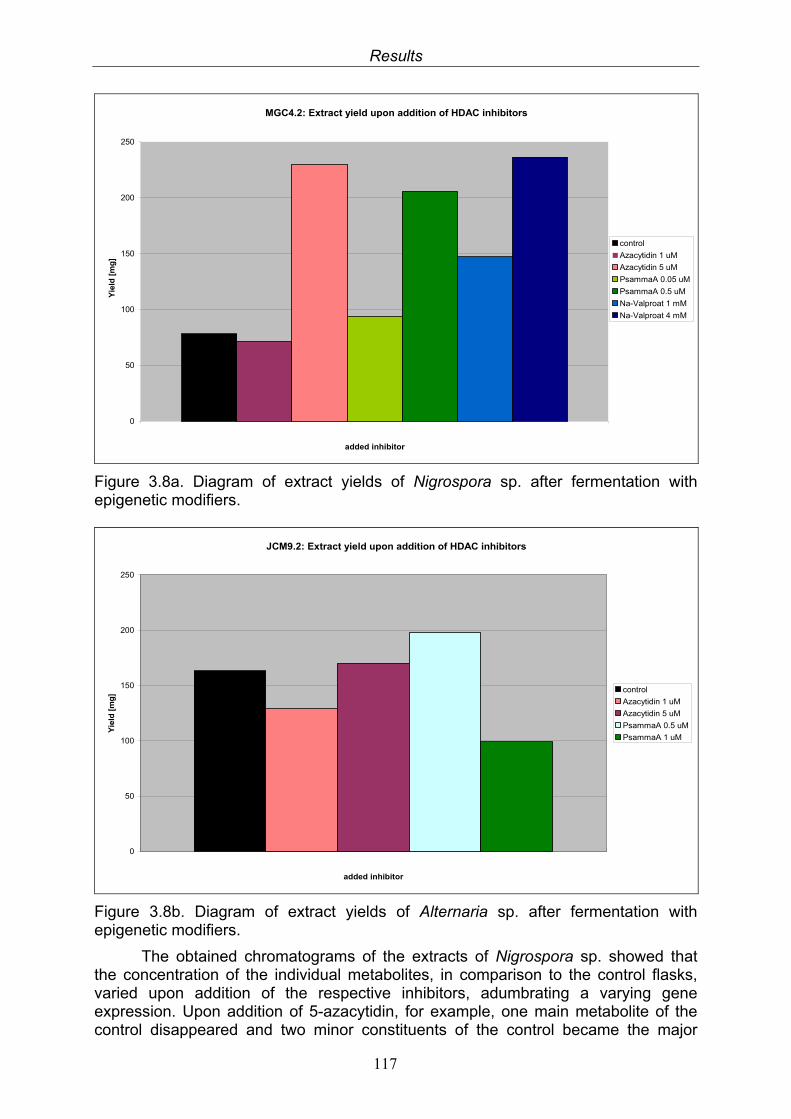
Results
117
MGC4.2: Extract yield upon addition of HDAC inhibitors
0
50
100
150
200
250
added inhibitor
Yie
ld [
mg
]
control
Azacytidin 1 uM
Azacytidin 5 uM
PsammaA 0.05 uM
PsammaA 0.5 uM
Na-Valproat 1 mM
Na-Valproat 4 mM
Figure 3.8a. Diagram of extract yields of Nigrospora sp. after fermentation with epigenetic modifiers.
JCM9.2: Extract yield upon addition of HDAC inhibitors
0
50
100
150
200
250
added inhibitor
Yie
ld [
mg
] control
Azacytidin 1 uM
Azacytidin 5 uM
PsammaA 0.5 uM
PsammaA 1 uM
Figure 3.8b. Diagram of extract yields of Alternaria sp. after fermentation with epigenetic modifiers.
The obtained chromatograms of the extracts of Nigrospora sp. showed that the concentration of the individual metabolites, in comparison to the control flasks, varied upon addition of the respective inhibitors, adumbrating a varying gene expression. Upon addition of 5-azacytidin, for example, one main metabolite of the control disappeared and two minor constituents of the control became the major
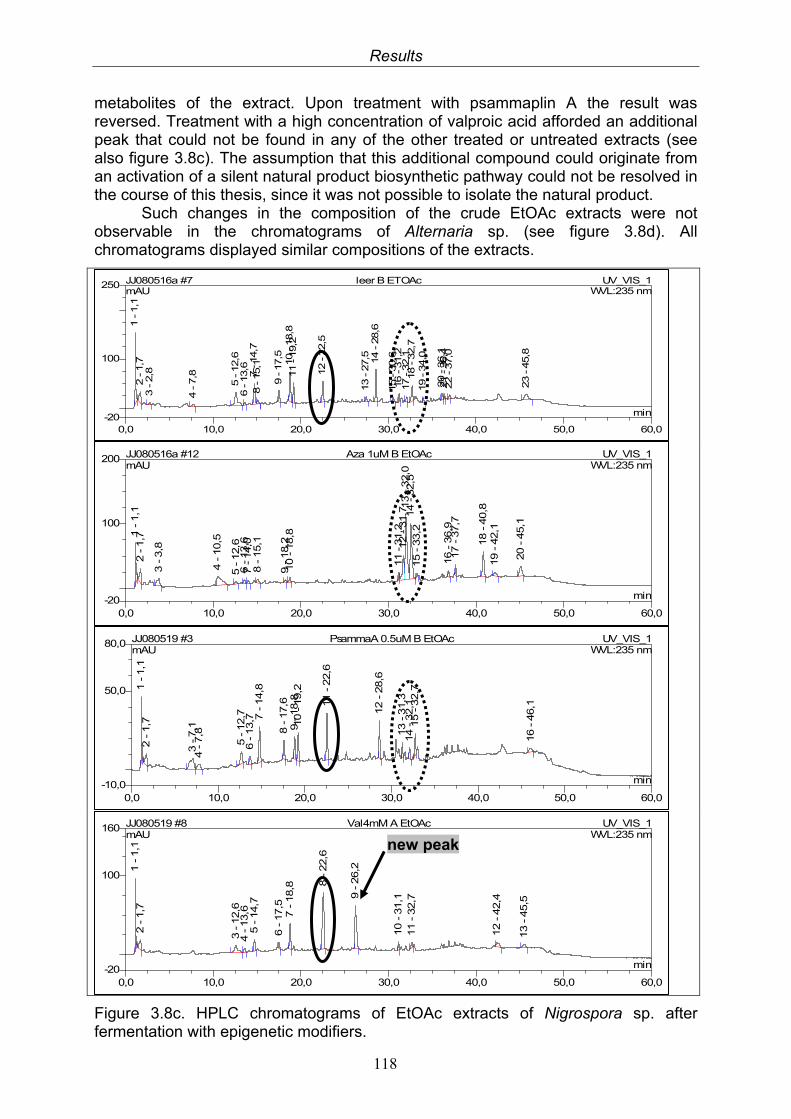
Results
118
metabolites of the extract. Upon treatment with psammaplin A the result was reversed. Treatment with a high concentration of valproic acid afforded an additional peak that could not be found in any of the other treated or untreated extracts (see also figure 3.8c). The assumption that this additional compound could originate from an activation of a silent natural product biosynthetic pathway could not be resolved in the course of this thesis, since it was not possible to isolate the natural product.
Such changes in the composition of the crude EtOAc extracts were not observable in the chromatograms of Alternaria sp. (see figure 3.8d). All chromatograms displayed similar compositions of the extracts.
Figure 3.8c. HPLC chromatograms of EtOAc extracts of Nigrospora sp. after fermentation with epigenetic modifiers.
0,0 10,0 20,0 30,0 40,0 50,0 60,0-20
100
160 JJ080519 #8 Val4mM A EtOAc UV_VIS_1mAU
min
1 - 1
,12 - 1
,7
3 - 1
2,6
4 - 1
3,6
5 - 1
4,7
6 - 1
7,5
7 - 1
8,8 8
- 2
2,6
9 - 2
6,2
10 - 3
1,1
11 - 3
2,7
12 - 4
2,4
13 - 4
5,5
WVL:235 nm
0,0 10,0 20,0 30,0 40,0 50,0 60,0-10,0
50,0
80,0 JJ080519 #3 PsammaA 0.5uM B EtOAc UV_VIS_1mAU
min
1 - 1
,12 - 1
,7
3 - 7
,14 - 7
,8
5 - 1
2,7
6 - 1
3,7 7
- 1
4,8
8 - 1
7,6
9 - 1
8,8
10 - 1
9,2
11 - 2
2,6
12 - 2
8,6
13 - 3
1,3
14 - 3
2,1
15 - 3
2,7
16 - 4
6,1
WVL:235 nm
0,0 10,0 20,0 30,0 40,0 50,0 60,0-20
100
200 JJ080516a #12 Aza 1uM B EtOAc UV_VIS_1mAU
min
1 - 1
,12 - 1
,7
3 - 3
,8
4 - 1
0,5
5 - 1
2,6
6 - 1
3,6
7 - 1
4,0
8 - 1
5,1
9 - 1
8,2
10 - 1
8,8
11 - 3
1,2
12 - 3
1,7
13 - 3
2,0
14 - 3
2,5
15 - 3
3,2
16 - 3
6,9
17 - 3
7,7
18 - 4
0,8
19 - 4
2,1
20 - 4
5,1
WVL:235 nm
0,0 10,0 20,0 30,0 40,0 50,0 60,0-20
100
250 JJ080516a #7 leer B ETOAc UV_VIS_1mAU
min
1 - 1
,12 - 1
,73 - 2
,8
4 - 7
,8
5 - 1
2,6
6 - 1
3,6
7 - 1
4,7
8 - 1
5,1
9 - 1
7,5
10 - 1
8,8
11 - 1
9,2
12 - 2
2,5
13 - 2
7,5 14 - 2
8,6
15 - 3
0,6
16 - 3
1,2
17 - 3
2,1
18 - 3
2,7
19 - 3
4,0
20 - 3
6,1
21 - 3
6,4
22 - 3
7,0
23 - 4
5,8
WVL:235 nm
new peak
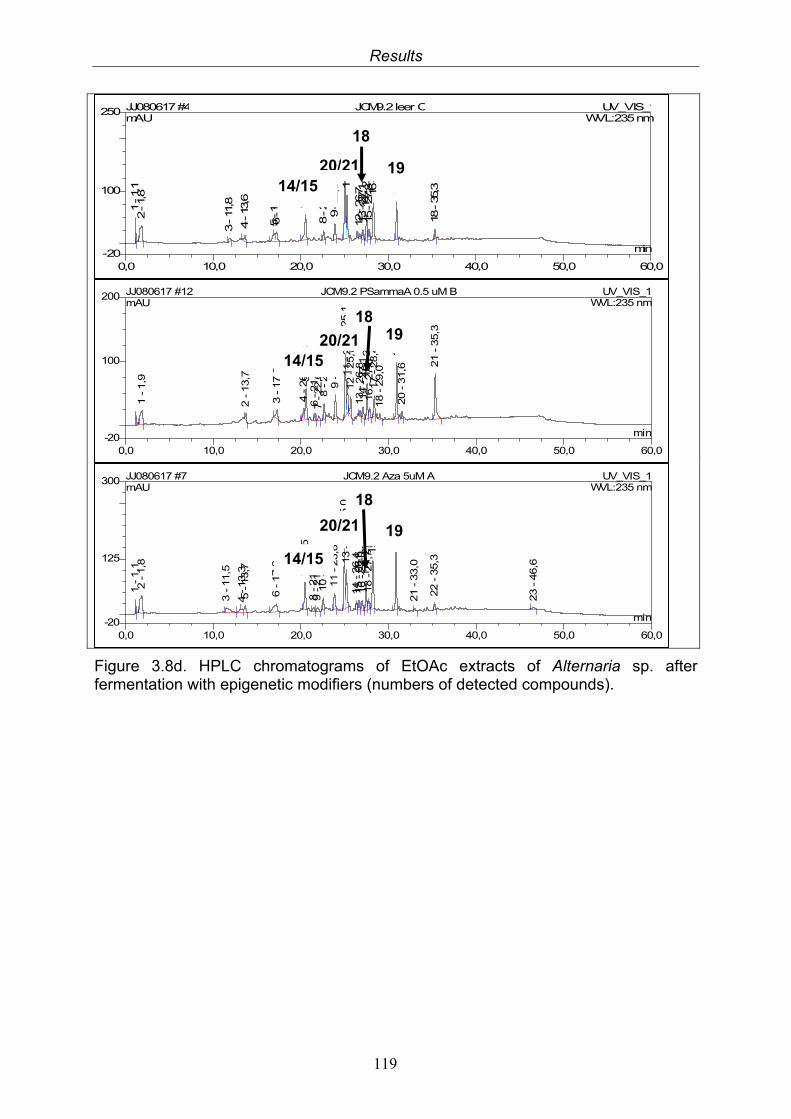
Results
119
Figure 3.8d. HPLC chromatograms of EtOAc extracts of Alternaria sp. after fermentation with epigenetic modifiers (numbers of detected compounds).
0,0 10,0 20,0 30,0 40,0 50,0 60,0-20
125
300 JJ080617 #7 JCM9.2 Aza 5uM A UV_VIS_1mAU
min
1 - 1
,12 - 1
,8
3 - 1
1,5
4 - 1
3,3
5 - 1
3,7
6 - 1
7,2
7 - 2
0,5
8 - 2
1,5
9 - 2
1,9
10 - 2
2,6
11 - 2
3,8
12 - 2
5,0
13 - 2
5,2
14 - 2
6,4
15 - 2
6,6
16 - 2
7,0
17 - 2
7,4
18 - 2
7,719 - 2
8,2
20 - 3
0,9
21 - 3
3,0
22 - 3
5,3
23 - 4
6,6
WVL:235 nm
0,0 10,0 20,0 30,0 40,0 50,0 60,0-20
100
200 JJ080617 #12 JCM9.2 PSammaA 0.5 uM B UV_VIS_1mAU
min
1 - 1
,9
2 - 1
3,7
3 - 1
7,3
4 - 2
0,3
5 - 2
0,6
6 - 2
1,6
7 - 2
2,0
8 - 2
2,7
9 - 2
3,9
10 - 2
5,1
11 - 2
5,3
12 - 2
5,7
13 - 2
6,8
14 - 2
7,1
15 - 2
7,5
16 - 2
7,8
17 - 2
8,4
18 - 2
9,0
19 - 3
0,9
20 - 3
1,6 2
1 - 3
5,3
WVL:235 nm
0,0 10,0 20,0 30,0 40,0 50,0 60,0-20
100
250 JJ080617 #4 JCM9.2 leer C UV_VIS_1mAU
min
1 - 1,1
2 - 1,8
3 - 11
,8
4 - 13
,6
5 - 17
,06 - 17
,2
7 - 20
,5
8 - 22
,69 - 23
,910
- 25,0
11 - 25,3
12 - 26,7
13 - 27,1
14 - 27,5
15 - 27,8 16 - 28,3
17 - 30,9
18 - 35,3
WVL:235 nm
18
18
18
14/15 20/21 19
19
19
20/21
20/21
14/15
14/15
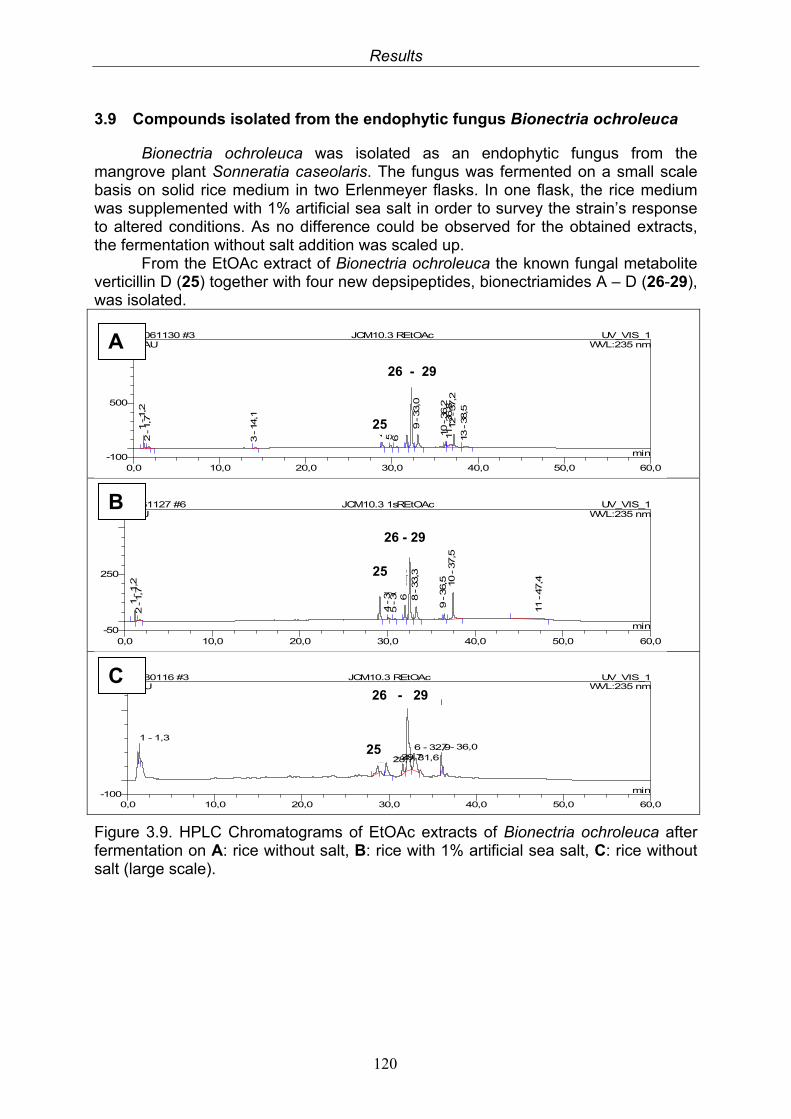
Results
120
3.9 Compounds isolated from the endophytic fungus Bionectria ochroleuca
Bionectria ochroleuca was isolated as an endophytic fungus from the mangrove plant Sonneratia caseolaris. The fungus was fermented on a small scale basis on solid rice medium in two Erlenmeyer flasks. In one flask, the rice medium was supplemented with 1% artificial sea salt in order to survey the strain’s response to altered conditions. As no difference could be observed for the obtained extracts, the fermentation without salt addition was scaled up.
From the EtOAc extract of Bionectria ochroleuca the known fungal metabolite verticillin D (25) together with four new depsipeptides, bionectriamides A – D (26-29), was isolated.
Figure 3.9. HPLC Chromatograms of EtOAc extracts of Bionectria ochroleuca after fermentation on A: rice without salt, B: rice with 1% artificial sea salt, C: rice without salt (large scale).
0,0 10,0 20,0 30,0 40,0 50,0 60,0-100
700 JJ080116 #3 JCM10.3 REtOAc UV_VIS_1mAU
min
1 - 1,3
2 - 28,73 - 29,74 - 31,6
5 - 32,1
6 - 32,97 - 36,0
WVL:235 nm
0,0 10,0 20,0 30,0 40,0 50,0 60,0-50
250
600 JJ061127 #6 JCM10.3 1sREtOAc UV_VIS_1mAU
min
1 - 1
,22 - 1
,7
3 - 2
9,1
4 - 3
0,1
5 - 3
0,8
6 - 3
2,0
7 - 3
2,5
8 - 3
3,3
9 - 3
6,5 10 - 3
7,5
11 - 4
7,4
WVL:235 nm
0,0 10,0 20,0 30,0 40,0 50,0 60,0-100
500
1.200 JJ061130 #3 JCM10.3 REtOAc UV_VIS_1mAU
min
1 - 1
,22 - 1
,7
3 - 1
4,1
4 - 2
8,9
5 - 2
9,8
6 - 3
0,6
7 - 3
1,7
8 - 3
2,3
9 - 3
3,0
10 - 3
6,2
11 - 3
6,8
12 - 3
7,2
13 - 3
8,5
WVL:235 nm
25
26 - 29
26 - 29 25
26 - 29
25
B
C
A
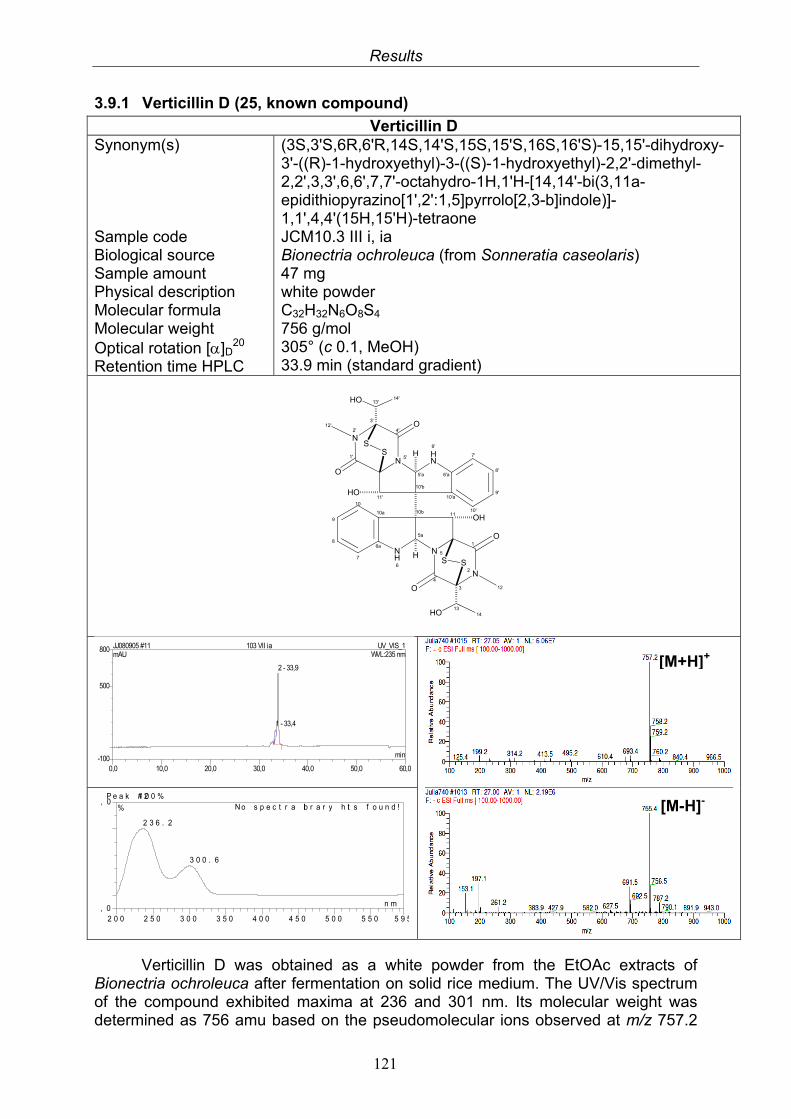
Results
121
3.9.1 Verticillin D (25, known compound)
Verticillin D Synonym(s) Sample code Biological source Sample amount Physical description Molecular formula Molecular weight Optical rotation []D
20 Retention time HPLC
(3S,3'S,6R,6'R,14S,14'S,15S,15'S,16S,16'S)-15,15'-dihydroxy-3'-((R)-1-hydroxyethyl)-3-((S)-1-hydroxyethyl)-2,2'-dimethyl-2,2',3,3',6,6',7,7'-octahydro-1H,1'H-[14,14'-bi(3,11a-epidithiopyrazino[1',2':1,5]pyrrolo[2,3-b]indole)]-1,1',4,4'(15H,15'H)-tetraone JCM10.3 III i, ia Bionectria ochroleuca (from Sonneratia caseolaris) 47 mg white powder C32H32N6O8S4 756 g/mol 305° (c 0.1, MeOH) 33.9 min (standard gradient)
N 5
N5'
10'b
10b
3'
3
N2'
N2
5'a
5a
4'
4
1'
1
11'
11
S
S
S
S
NH6
HN
6'
10'a
10a
6a
6'a
O
O
O
O
13'
13
12
12'
HO
OH
HO
HO
1010'
7'
7
14'
14
9
9'
8
8'
H
H
Verticillin D was obtained as a white powder from the EtOAc extracts of Bionectria ochroleuca after fermentation on solid rice medium. The UV/Vis spectrum of the compound exhibited maxima at 236 and 301 nm. Its molecular weight was determined as 756 amu based on the pseudomolecular ions observed at m/z 757.2
P e a k # 21 0 0 %
, 0
, 0
2 0 0 2 5 0 3 0 0 3 5 0 4 0 0 4 5 0 5 0 0 5 5 0 5 9 5
%
n m
2 3 6 . 2
3 0 0 . 6
N o s p e c t r a lib r a r y h it s f o u n d !
0,0 10,0 20,0 30,0 40,0 50,0 60,0-100
500
800 JJ080905 #11 103 VII ia UV_VIS_1mAU
min
1 - 33,4
2 - 33,9
WVL:235 nm[M+H]+
[M-H]-
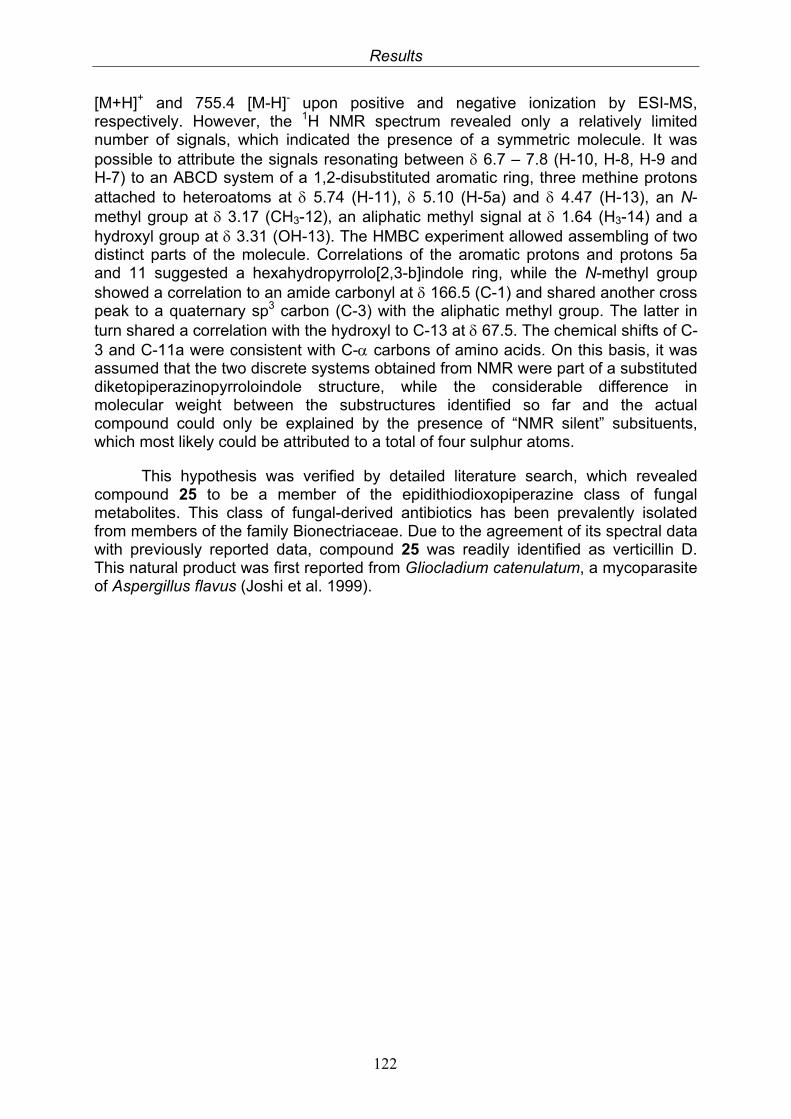
Results
122
[M+H]+ and 755.4 [M-H]- upon positive and negative ionization by ESI-MS, respectively. However, the 1H NMR spectrum revealed only a relatively limited number of signals, which indicated the presence of a symmetric molecule. It was possible to attribute the signals resonating between 6.7 – 7.8 (H-10, H-8, H-9 and H-7) to an ABCD system of a 1,2-disubstituted aromatic ring, three methine protons attached to heteroatoms at 5.74 (H-11), 5.10 (H-5a) and 4.47 (H-13), an N-methyl group at 3.17 (CH3-12), an aliphatic methyl signal at 1.64 (H3-14) and a hydroxyl group at 3.31 (OH-13). The HMBC experiment allowed assembling of two distinct parts of the molecule. Correlations of the aromatic protons and protons 5a and 11 suggested a hexahydropyrrolo[2,3-b]indole ring, while the N-methyl group showed a correlation to an amide carbonyl at 166.5 (C-1) and shared another cross peak to a quaternary sp3 carbon (C-3) with the aliphatic methyl group. The latter in turn shared a correlation with the hydroxyl to C-13 at 67.5. The chemical shifts of C-3 and C-11a were consistent with C- carbons of amino acids. On this basis, it was assumed that the two discrete systems obtained from NMR were part of a substituted diketopiperazinopyrroloindole structure, while the considerable difference in molecular weight between the substructures identified so far and the actual compound could only be explained by the presence of “NMR silent” subsituents, which most likely could be attributed to a total of four sulphur atoms.
This hypothesis was verified by detailed literature search, which revealed compound 25 to be a member of the epidithiodioxopiperazine class of fungal metabolites. This class of fungal-derived antibiotics has been prevalently isolated from members of the family Bionectriaceae. Due to the agreement of its spectral data with previously reported data, compound 25 was readily identified as verticillin D. This natural product was first reported from Gliocladium catenulatum, a mycoparasite of Aspergillus flavus (Joshi et al. 1999).
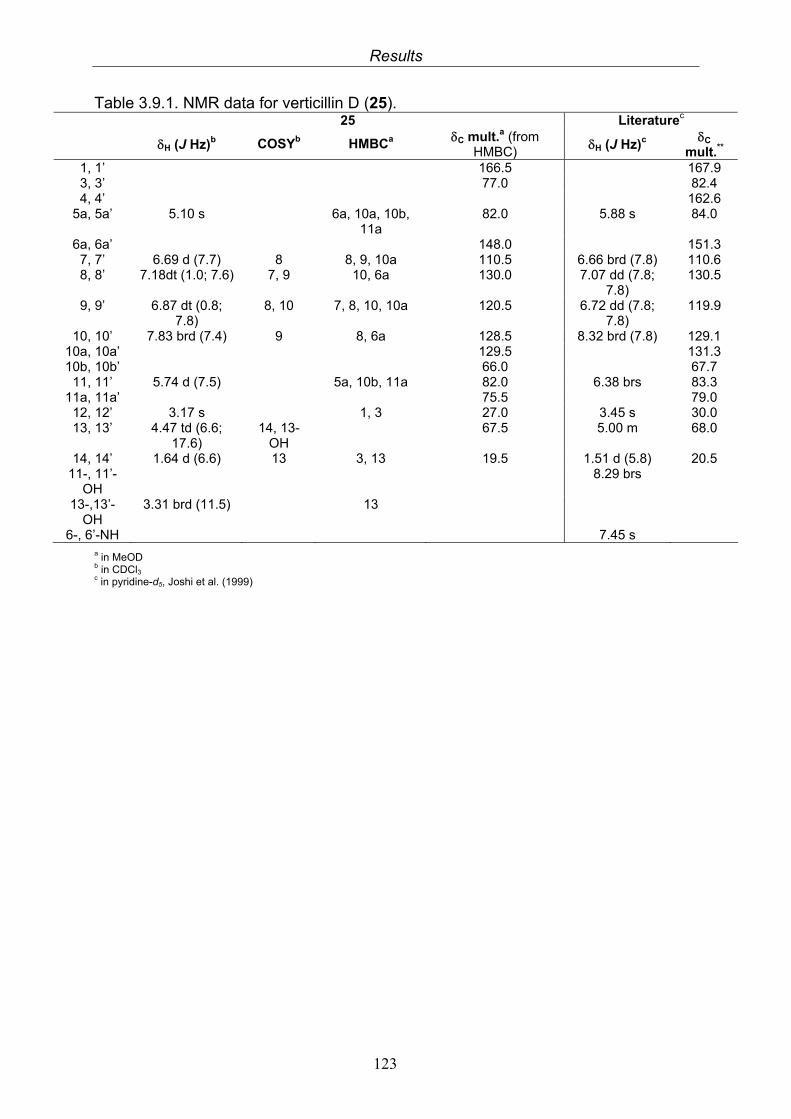
Results
123
Table 3.9.1. NMR data for verticillin D (25). 25 Literaturec
H (J Hz)b COSYb HMBCa C mult.a (from HMBC)
H (J Hz)c C
mult.** 1, 1’ 166.5 167.9 3, 3’ 77.0 82.4 4, 4’ 162.6
5a, 5a’ 5.10 s 6a, 10a, 10b, 11a
82.0 5.88 s 84.0
6a, 6a’ 148.0 151.3 7, 7’ 6.69 d (7.7) 8 8, 9, 10a 110.5 6.66 brd (7.8) 110.6 8, 8’ 7.18dt (1.0; 7.6) 7, 9 10, 6a 130.0 7.07 dd (7.8;
7.8) 130.5
9, 9’ 6.87 dt (0.8; 7.8)
8, 10 7, 8, 10, 10a 120.5 6.72 dd (7.8; 7.8)
119.9
10, 10’ 7.83 brd (7.4) 9 8, 6a 128.5 8.32 brd (7.8) 129.1 10a, 10a’ 129.5 131.3 10b, 10b’ 66.0 67.7
11, 11’ 5.74 d (7.5) 5a, 10b, 11a 82.0 6.38 brs 83.3 11a, 11a’ 75.5 79.0
12, 12’ 3.17 s 1, 3 27.0 3.45 s 30.0 13, 13’ 4.47 td (6.6;
17.6) 14, 13-
OH 67.5 5.00 m 68.0
14, 14’ 1.64 d (6.6) 13 3, 13 19.5 1.51 d (5.8) 20.5 11-, 11’-
OH 8.29 brs
13-,13’-OH
3.31 brd (11.5) 13
6-, 6’-NH 7.45 s a in MeOD b in CDCl3 c in pyridine-d5, Joshi et al. (1999)
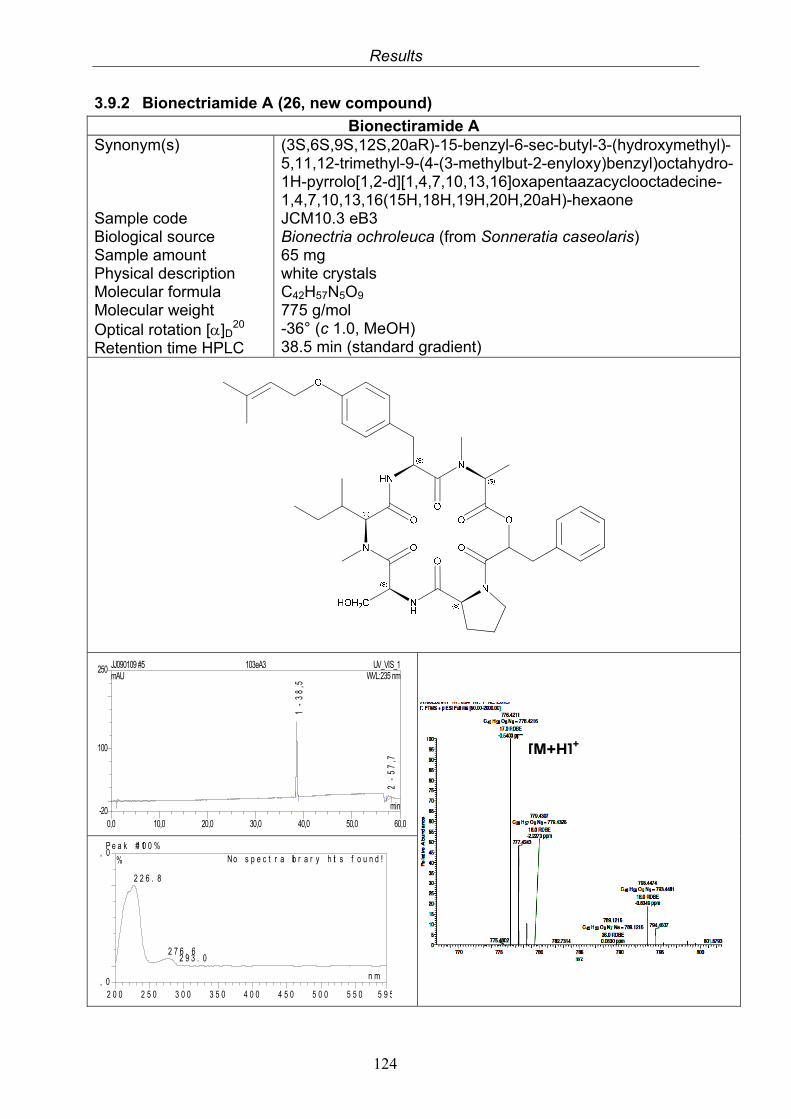
Results
124
3.9.2 Bionectriamide A (26, new compound)
Bionectiramide A Synonym(s) Sample code Biological source Sample amount Physical description Molecular formula Molecular weight Optical rotation []D
20 Retention time HPLC
(3S,6S,9S,12S,20aR)-15-benzyl-6-sec-butyl-3-(hydroxymethyl)-5,11,12-trimethyl-9-(4-(3-methylbut-2-enyloxy)benzyl)octahydro-1H-pyrrolo[1,2-d][1,4,7,10,13,16]oxapentaazacyclooctadecine-1,4,7,10,13,16(15H,18H,19H,20H,20aH)-hexaone JCM10.3 eB3 Bionectria ochroleuca (from Sonneratia caseolaris) 65 mg white crystals C42H57N5O9 775 g/mol -36° (c 1.0, MeOH) 38.5 min (standard gradient)
P e a k # 11 0 0 %
, 0
, 0
2 0 0 2 5 0 3 0 0 3 5 0 4 0 0 4 5 0 5 0 0 5 5 0 5 9 5
%
n m
2 2 6 . 8
2 7 6 . 62 9 3 . 0
No s p e c t r a lib r a r y h it s f o u n d !
0,0 10,0 20,0 30,0 40,0 50,0 60,0-20
100
250 JJ090109 #5 103eA3 UV_VIS_1mAU
min
1 -
38
,5
2 -
57
,7
WVL:235 nm
[M+H]+
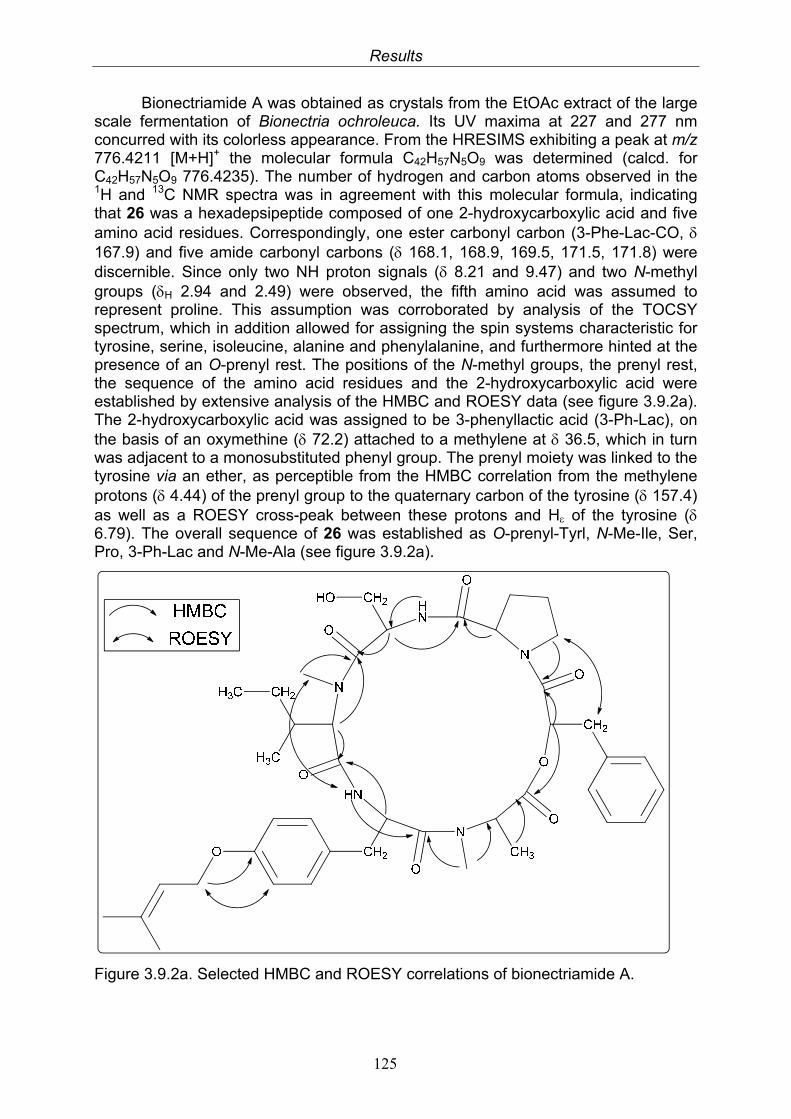
Results
125
Bionectriamide A was obtained as crystals from the EtOAc extract of the large scale fermentation of Bionectria ochroleuca. Its UV maxima at 227 and 277 nm concurred with its colorless appearance. From the HRESIMS exhibiting a peak at m/z 776.4211 [M+H]+ the molecular formula C42H57N5O9 was determined (calcd. for C42H57N5O9 776.4235). The number of hydrogen and carbon atoms observed in the 1H and 13C NMR spectra was in agreement with this molecular formula, indicating that 26 was a hexadepsipeptide composed of one 2-hydroxycarboxylic acid and five amino acid residues. Correspondingly, one ester carbonyl carbon (3-Phe-Lac-CO, 167.9) and five amide carbonyl carbons ( 168.1, 168.9, 169.5, 171.5, 171.8) were discernible. Since only two NH proton signals ( 8.21 and 9.47) and two N-methyl groups (H 2.94 and 2.49) were observed, the fifth amino acid was assumed to represent proline. This assumption was corroborated by analysis of the TOCSY spectrum, which in addition allowed for assigning the spin systems characteristic for tyrosine, serine, isoleucine, alanine and phenylalanine, and furthermore hinted at the presence of an O-prenyl rest. The positions of the N-methyl groups, the prenyl rest, the sequence of the amino acid residues and the 2-hydroxycarboxylic acid were established by extensive analysis of the HMBC and ROESY data (see figure 3.9.2a). The 2-hydroxycarboxylic acid was assigned to be 3-phenyllactic acid (3-Ph-Lac), on the basis of an oxymethine ( 72.2) attached to a methylene at 36.5, which in turn was adjacent to a monosubstituted phenyl group. The prenyl moiety was linked to the tyrosine via an ether, as perceptible from the HMBC correlation from the methylene protons ( 4.44) of the prenyl group to the quaternary carbon of the tyrosine ( 157.4) as well as a ROESY cross-peak between these protons and H of the tyrosine ( 6.79). The overall sequence of 26 was established as O-prenyl-Tyrl, N-Me-Ile, Ser, Pro, 3-Ph-Lac and N-Me-Ala (see figure 3.9.2a).
Figure 3.9.2a. Selected HMBC and ROESY correlations of bionectriamide A.
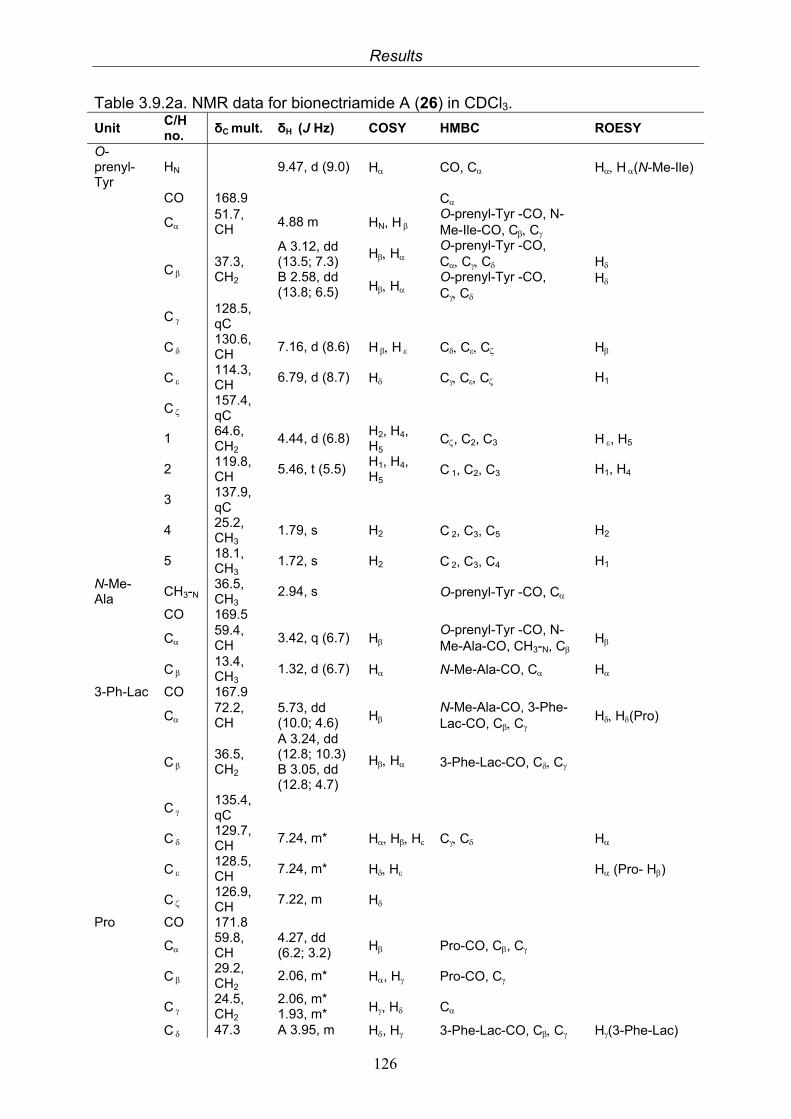
Results
126
Table 3.9.2a. NMR data for bionectriamide A (26) in CDCl3.
Unit C/H no.
δC mult. δH (J Hz) COSY HMBC ROESY
O-prenyl-Tyr
HN 9.47, d (9.0) H CO, C HH(N-Me-Ile)
CO 168.9 C
C51.7, CH
4.88 m HN, H O-prenyl-Tyr -CO, N-Me-Ile-CO, CC
C37.3, CH2
A 3.12, dd (13.5; 7.3) B 2.58, dd (13.8; 6.5)
H H
H H
O-prenyl-Tyr -CO, CCC
O-prenyl-Tyr -CO, CC
H
H
C128.5, qC
C130.6, CH
7.16, d (8.6) HH CCC H
C114.3, CH
6.79, d (8.7) H CCC H1
C157.4, qC
1 64.6, CH2
4.44, d (6.8) H2, H4, H5
C, C2, C3 H, H5
2 119.8, CH
5.46, t (5.5) H1, H4, H5
C1, C2, C3 H1, H4
3 137.9, qC
4 25.2, CH3
1.79, s H2 C2, C3, C5 H2
5 18.1, CH3
1.72, s H2 C2, C3, C4 H1
N-Me-Ala
CH3-N 36.5, CH3
2.94, s O-prenyl-Tyr -CO, C
CO 169.5
C59.4, CH
3.42, q (6.7) H O-prenyl-Tyr -CO, N-Me-Ala-CO, CH3-N, C
H
C13.4, CH3
1.32, d (6.7) H N-Me-Ala-CO, C H
3-Ph-Lac CO 167.9
C72.2, CH
5.73, dd (10.0; 4.6) H
N-Me-Ala-CO, 3-Phe-Lac-CO, CC
HH(Pro)
C36.5, CH2
A 3.24, dd (12.8; 10.3) B 3.05, dd (12.8; 4.7)
H H
3-Phe-Lac-CO, CC
C135.4, qC
C129.7, CH
7.24, m* HHH CC H
C128.5, CH
7.24, m* HH H (Pro- H)
C126.9, CH
7.22, m H
Pro CO 171.8
C59.8, CH
4.27, dd (6.2; 3.2) H Pro-CO, C, C
C29.2, CH2
2.06, m* H, H Pro-CO, C
C24.5, CH2
2.06, m* 1.93, m* H, H C
C 47.3 A 3.95, m H, H 3-Phe-Lac-CO, CC H(3-Phe-Lac)
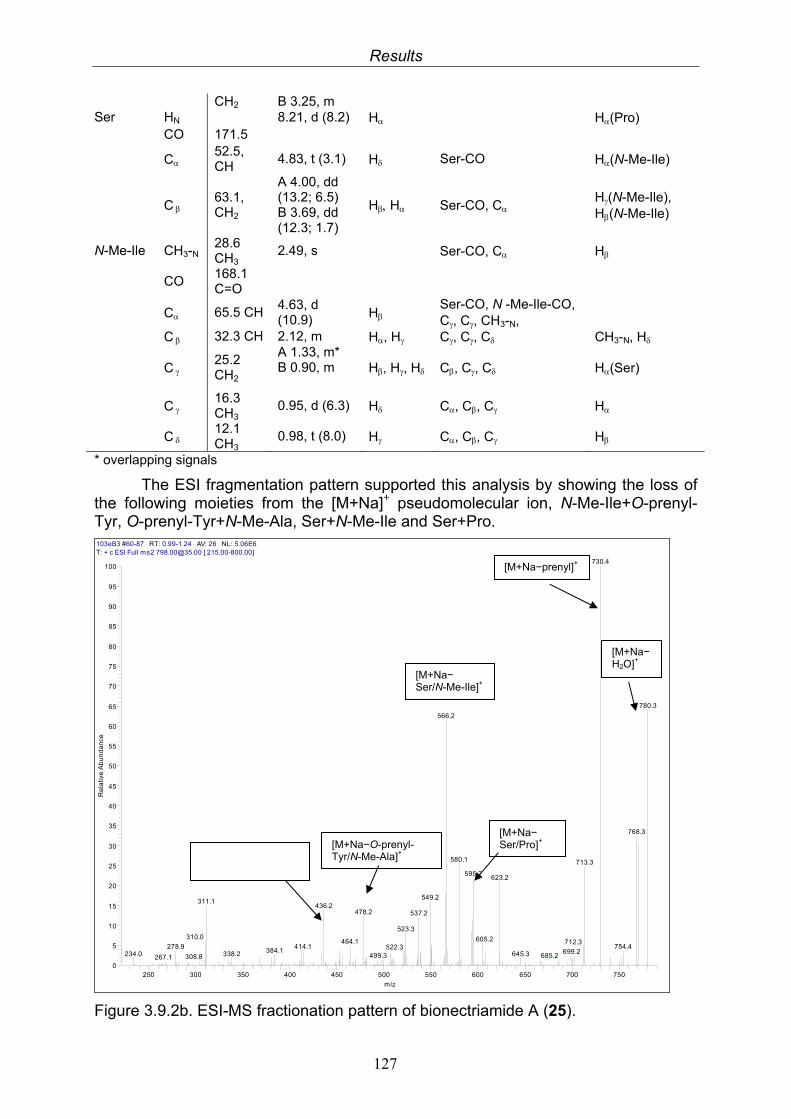
Results
127
CH2 B 3.25, m Ser HN 8.21, d (8.2) H H(Pro) CO 171.5
C52.5, CH
4.83, t (3.1) H Ser-CO H(N-Me-Ile)
C63.1, CH2
A 4.00, dd (13.2; 6.5) B 3.69, dd (12.3; 1.7)
H H Ser-CO, C H(N-Me-Ile), H(N-Me-Ile)
N-Me-Ile CH3-N 28.6 CH3
2.49, s Ser-CO, C H
CO 168.1 C=O
C 65.5 CH 4.63, d (10.9) H
Ser-CO, N -Me-Ile-CO, C, C, CH3-N,
C 32.3 CH 2.12, m H, H C, C, C CH3-N, H
C25.2 CH2
A 1.33, m* B 0.90, m
H, H, H C, C, C H(Ser)
C16.3 CH3
0.95, d (6.3) H C, C, C H
C12.1 CH3
0.98, t (8.0) H C, C, C H
* overlapping signals
The ESI fragmentation pattern supported this analysis by showing the loss of the following moieties from the [M+Na]+ pseudomolecular ion, N-Me-Ile+O-prenyl-Tyr, O-prenyl-Tyr+N-Me-Ala, Ser+N-Me-Ile and Ser+Pro. 103eB3 #60-87 RT: 0.99-1.24 AV: 26 NL: 5.06E6T: + c ESI Full ms2 [email protected] [ 215.00-800.00]
250 300 350 400 450 500 550 600 650 700 750
m/z
0
5
10
15
20
25
30
35
40
45
50
55
60
65
70
75
80
85
90
95
100
Re
lativ
e A
bu
nd
an
ce
730.4
780.3
566.2
768.3
580.1 713.3
595.2623.2
549.2311.1
436.2478.2 537.2
523.3310.0 605.2464.1 712.3
278.9 414.1 754.4522.3384.1 699.2234.0 338.2 645.3 685.2499.3308.8267.1
Figure 3.9.2b. ESI-MS fractionation pattern of bionectriamide A (25).
[M+Na−H2O]+
[M+Na−prenyl]+
[M+Na− Ser/Pro]+
[M+Na− Ser/N-Me-Ile]+
[M+Na−O-prenyl-Tyr/N-Me-Ala]+
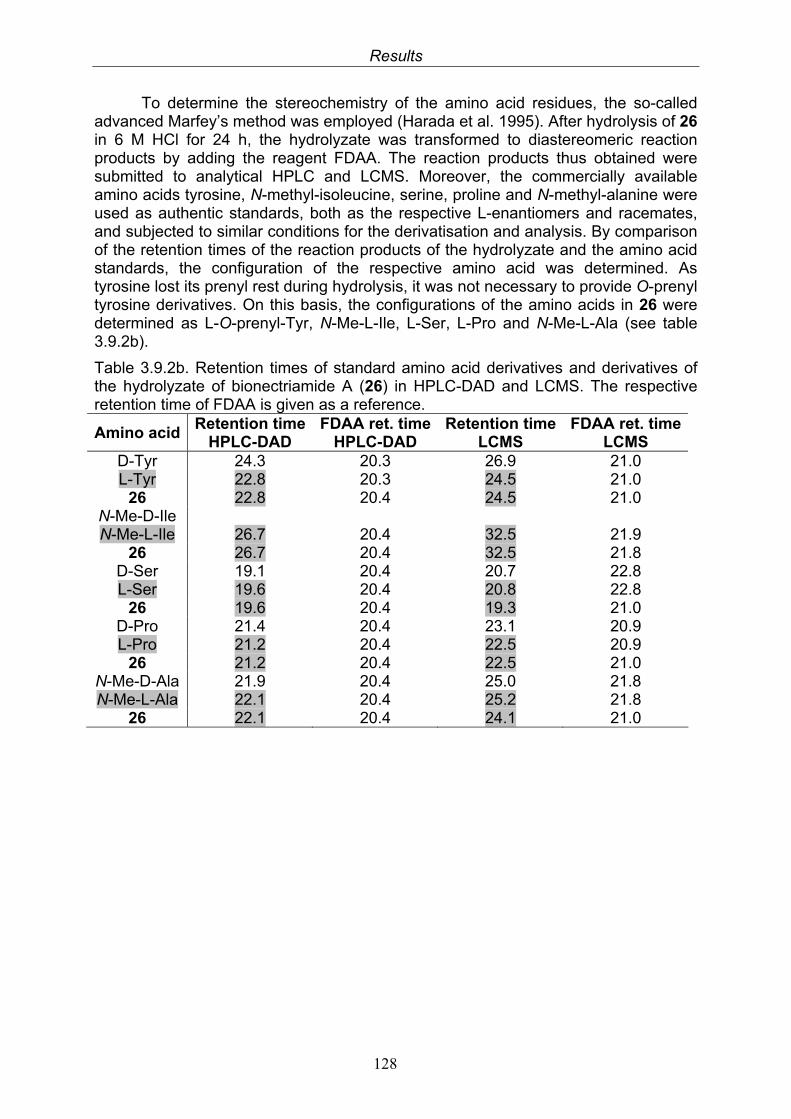
Results
128
To determine the stereochemistry of the amino acid residues, the so-called advanced Marfey’s method was employed (Harada et al. 1995). After hydrolysis of 26 in 6 M HCl for 24 h, the hydrolyzate was transformed to diastereomeric reaction products by adding the reagent FDAA. The reaction products thus obtained were submitted to analytical HPLC and LCMS. Moreover, the commercially available amino acids tyrosine, N-methyl-isoleucine, serine, proline and N-methyl-alanine were used as authentic standards, both as the respective L-enantiomers and racemates, and subjected to similar conditions for the derivatisation and analysis. By comparison of the retention times of the reaction products of the hydrolyzate and the amino acid standards, the configuration of the respective amino acid was determined. As tyrosine lost its prenyl rest during hydrolysis, it was not necessary to provide O-prenyl tyrosine derivatives. On this basis, the configurations of the amino acids in 26 were determined as L-O-prenyl-Tyr, N-Me-L-Ile, L-Ser, L-Pro and N-Me-L-Ala (see table 3.9.2b).
Table 3.9.2b. Retention times of standard amino acid derivatives and derivatives of the hydrolyzate of bionectriamide A (26) in HPLC-DAD and LCMS. The respective retention time of FDAA is given as a reference.
Amino acid Retention time
HPLC-DAD FDAA ret. time
HPLC-DAD Retention time
LCMS FDAA ret. time
LCMS D-Tyr 24.3 20.3 26.9 21.0 L-Tyr 22.8 20.3 24.5 21.0
26 22.8 20.4 24.5 21.0 N-Me-D-Ile N-Me-L-Ile 26.7 20.4 32.5 21.9
26 26.7 20.4 32.5 21.8 D-Ser 19.1 20.4 20.7 22.8 L-Ser 19.6 20.4 20.8 22.8
26 19.6 20.4 19.3 21.0 D-Pro 21.4 20.4 23.1 20.9 L-Pro 21.2 20.4 22.5 20.9
26 21.2 20.4 22.5 21.0 N-Me-D-Ala 21.9 20.4 25.0 21.8 N-Me-L-Ala 22.1 20.4 25.2 21.8
26 22.1 20.4 24.1 21.0
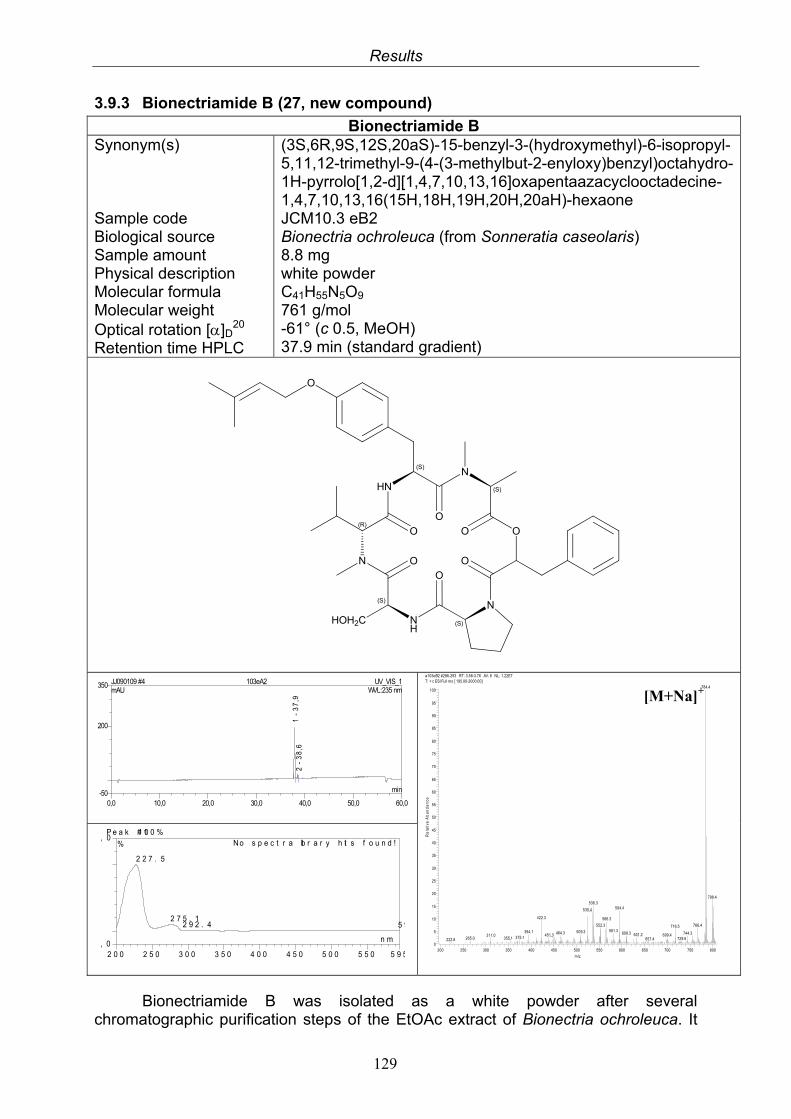
Results
129
3.9.3 Bionectriamide B (27, new compound)
Bionectriamide B Synonym(s) Sample code Biological source Sample amount Physical description Molecular formula Molecular weight Optical rotation []D
20 Retention time HPLC
(3S,6R,9S,12S,20aS)-15-benzyl-3-(hydroxymethyl)-6-isopropyl-5,11,12-trimethyl-9-(4-(3-methylbut-2-enyloxy)benzyl)octahydro-1H-pyrrolo[1,2-d][1,4,7,10,13,16]oxapentaazacyclooctadecine-1,4,7,10,13,16(15H,18H,19H,20H,20aH)-hexaone JCM10.3 eB2 Bionectria ochroleuca (from Sonneratia caseolaris) 8.8 mg white powder C41H55N5O9 761 g/mol -61° (c 0.5, MeOH) 37.9 min (standard gradient)
(S)
N
HN
(S)
N
(R)O
N
(S)NH
(S)
O
OO
O
O
O
HOH2C
O
a103eB2 #286-293 RT: 3.58-3.76 AV: 8 NL: 1.22E7T: + c ESI Full ms [ 195.00-2000.00]
200 250 300 350 400 450 500 550 600 650 700 750 800
m/z
0
5
10
15
20
25
30
35
40
45
50
55
60
65
70
75
80
85
90
95
100
Re
lativ
e A
bu
nd
an
ce
784.4
798.4536.3
594.4535.4
422.3 566.3
552.3 766.4716.5581.3394.1 509.3464.3 609.3 744.3631.2451.3 699.4311.0 375.1265.0 355.1 729.6657.4222.8
Bionectriamide B was isolated as a white powder after several chromatographic purification steps of the EtOAc extract of Bionectria ochroleuca. It
P e a k # 11 0 0 %
, 0
, 0
2 0 0 2 5 0 3 0 0 3 5 0 4 0 0 4 5 0 5 0 0 5 5 0 5 9 5
%
n m
2 2 7 . 5
2 7 5 . 12 9 2 . 4 5 9
N o s p e c t r a lib r a r y h it s f o u n d !
0,0 10,0 20,0 30,0 40,0 50,0 60,0-50
200
350 JJ090109 #4 103eA2 UV_VIS_1mAU
min
1 -
37
,92
- 3
8,6
WVL:235 nm [M+Na]+
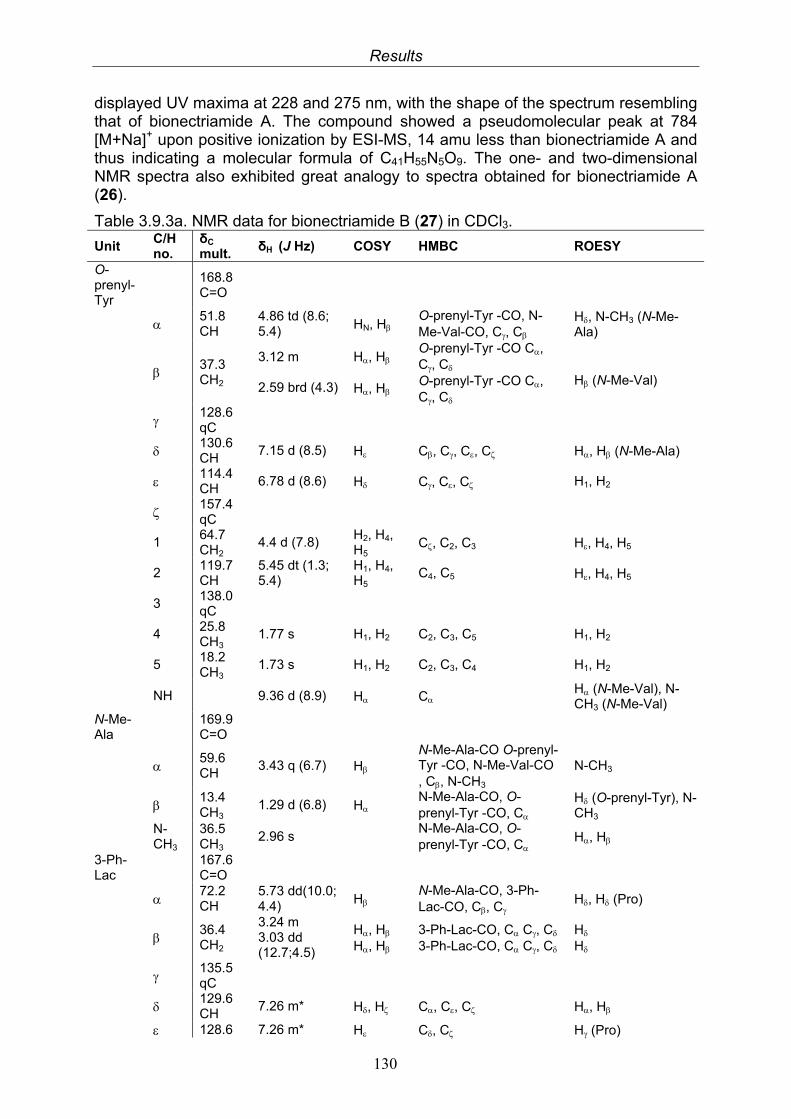
Results
130
displayed UV maxima at 228 and 275 nm, with the shape of the spectrum resembling that of bionectriamide A. The compound showed a pseudomolecular peak at 784 [M+Na]+ upon positive ionization by ESI-MS, 14 amu less than bionectriamide A and thus indicating a molecular formula of C41H55N5O9. The one- and two-dimensional NMR spectra also exhibited great analogy to spectra obtained for bionectriamide A (26).
Table 3.9.3a. NMR data for bionectriamide B (27) in CDCl3.
Unit C/H no.
δC
mult. δH (J Hz) COSY HMBC ROESY
O-prenyl-Tyr
168.8 C=O
51.8 CH
4.86 td (8.6; 5.4) HN, H
O-prenyl-Tyr -CO, N-Me-Val-CO, C, C
H, N-CH3 (N-Me-Ala)
37.3 CH2
3.12 m 2.59 brd (4.3)
H, H
H, H
O-prenyl-Tyr -CO C, C, C O-prenyl-Tyr -CO C, C, C
H (N-Me-Val)
128.6 qC
130.6 CH
7.15 d (8.5) H C, C, C, C H, H (N-Me-Ala)
114.4 CH
6.78 d (8.6) H C, C, C H1, H2
157.4 qC
1 64.7 CH2
4.4 d (7.8) H2, H4, H5
C, C2, C3 H, H4, H5
2 119.7 CH
5.45 dt (1.3; 5.4)
H1, H4, H5
C4, C5 H, H4, H5
3 138.0 qC
4 25.8 CH3
1.77 s H1, H2 C2, C3, C5 H1, H2
5 18.2 CH3
1.73 s H1, H2 C2, C3, C4 H1, H2
NH 9.36 d (8.9) H C H (N-Me-Val), N-CH3 (N-Me-Val)
N-Me-Ala
169.9 C=O
59.6 CH
3.43 q (6.7) H N-Me-Ala-CO O-prenyl-Tyr -CO, N-Me-Val-CO , C, N-CH3
N-CH3
13.4 CH3
1.29 d (6.8) H N-Me-Ala-CO, O-prenyl-Tyr -CO, C
H (O-prenyl-Tyr), N-CH3
N-CH3
36.5 CH3
2.96 s N-Me-Ala-CO, O-prenyl-Tyr -CO, C
H, H
3-Ph-Lac
167.6 C=O
72.2 CH
5.73 dd(10.0; 4.4) H
N-Me-Ala-CO, 3-Ph-Lac-CO, C, C
H, H (Pro)
36.4 CH2
3.24 m 3.03 dd (12.7;4.5)
H, H H, H
3-Ph-Lac-CO, C C, C 3-Ph-Lac-CO, C C, C
H H
135.5 qC
129.6 CH
7.26 m* H, H C, C, C H, H
128.6 7.26 m* H C, C H (Pro)
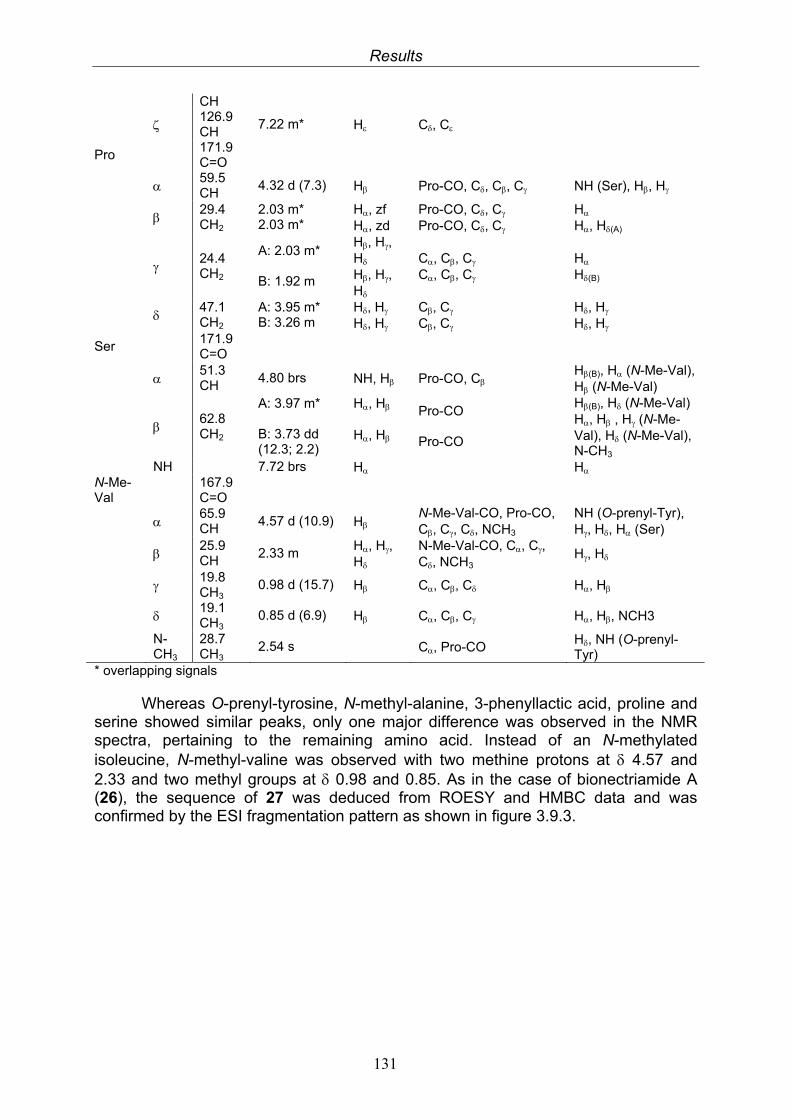
Results
131
CH
126.9 CH
7.22 m* H C, C
Pro 171.9 C=O
59.5 CH
4.32 d (7.3) H Pro-CO, C, C, C NH (Ser), H, H
29.4 CH2
2.03 m* 2.03 m*
H, zf H, zd
Pro-CO, C, C Pro-CO, C, C
H H, H(A)
24.4 CH2
A: 2.03 m* B: 1.92 m
H, H, H H, H, H
C, C, C C, C, C
H H(B)
47.1 CH2
A: 3.95 m* B: 3.26 m
H, H H, H
C, C C, C
H, H H, H
Ser 171.9 C=O
51.3 CH
4.80 brs NH, H Pro-CO, C H(B), H (N-Me-Val), H (N-Me-Val)
62.8 CH2
A: 3.97 m* B: 3.73 dd (12.3; 2.2)
H, H H, H
Pro-CO Pro-CO
H(B), H (N-Me-Val) H, H , H (N-Me-Val), H (N-Me-Val), N-CH3
NH 7.72 brs H H N-Me-Val
167.9 C=O
65.9 CH
4.57 d (10.9) H N-Me-Val-CO, Pro-CO, C, C, C, NCH3
NH (O-prenyl-Tyr), H, H, H (Ser)
25.9 CH
2.33 m H, H, H
N-Me-Val-CO, C, C, C, NCH3
H, H
19.8 CH3
0.98 d (15.7) H C, C, C H, H
19.1 CH3
0.85 d (6.9) H C, C, C H, H, NCH3
N-CH3
28.7 CH3
2.54 s C, Pro-CO H, NH (O-prenyl-Tyr)
* overlapping signals
Whereas O-prenyl-tyrosine, N-methyl-alanine, 3-phenyllactic acid, proline and serine showed similar peaks, only one major difference was observed in the NMR spectra, pertaining to the remaining amino acid. Instead of an N-methylated isoleucine, N-methyl-valine was observed with two methine protons at 4.57 and 2.33 and two methyl groups at 0.98 and 0.85. As in the case of bionectriamide A (26), the sequence of 27 was deduced from ROESY and HMBC data and was confirmed by the ESI fragmentation pattern as shown in figure 3.9.3.
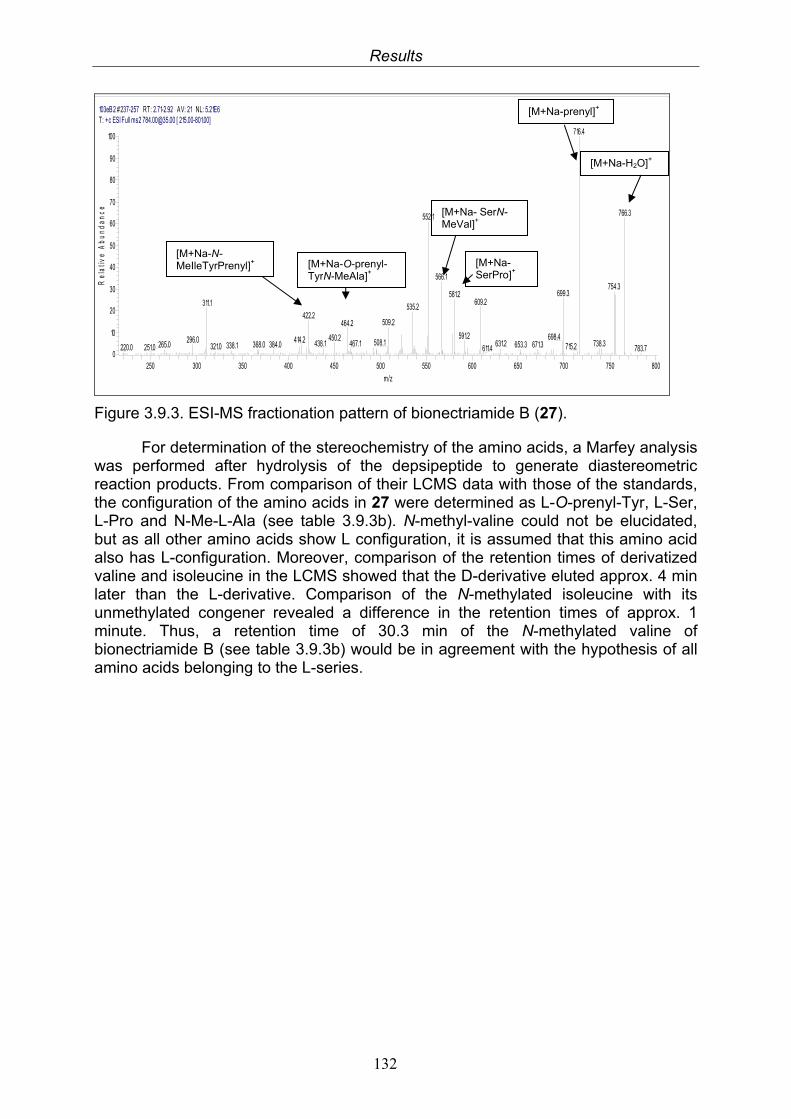
Results
132
103eB2 #237-257 RT: 2.71-2.92 AV: 21 NL: 5.21E6T: + c ESI Full ms2 [email protected] [ 215.00-801.00]
250 300 350 400 450 500 550 600 650 700 750 800
m/z
0
10
20
30
40
50
60
70
80
90
100
Rel
ativ
e A
bu
nda
nce
716.4
766.3552.1
566.1754.3
699.3581.2609.2311.1 535.2
422.2509.2464.2
591.2 698.4450.2296.0 414.2 508.1467.1 738.3631.2438.1265.0 653.3368.0 384.0 671.3338.1 715.2321.0251.0220.0 783.7611.4
Figure 3.9.3. ESI-MS fractionation pattern of bionectriamide B (27).
For determination of the stereochemistry of the amino acids, a Marfey analysis was performed after hydrolysis of the depsipeptide to generate diastereometric reaction products. From comparison of their LCMS data with those of the standards, the configuration of the amino acids in 27 were determined as L-O-prenyl-Tyr, L-Ser, L-Pro and N-Me-L-Ala (see table 3.9.3b). N-methyl-valine could not be elucidated, but as all other amino acids show L configuration, it is assumed that this amino acid also has L-configuration. Moreover, comparison of the retention times of derivatized valine and isoleucine in the LCMS showed that the D-derivative eluted approx. 4 min later than the L-derivative. Comparison of the N-methylated isoleucine with its unmethylated congener revealed a difference in the retention times of approx. 1 minute. Thus, a retention time of 30.3 min of the N-methylated valine of bionectriamide B (see table 3.9.3b) would be in agreement with the hypothesis of all amino acids belonging to the L-series.
[M+Na-H2O]+
[M+Na-prenyl]+
[M+Na- SerPro]+
[M+Na- SerN-MeVal]+
[M+Na-O-prenyl-TyrN-MeAla]+
[M+Na-N-MeIleTyrPrenyl]+
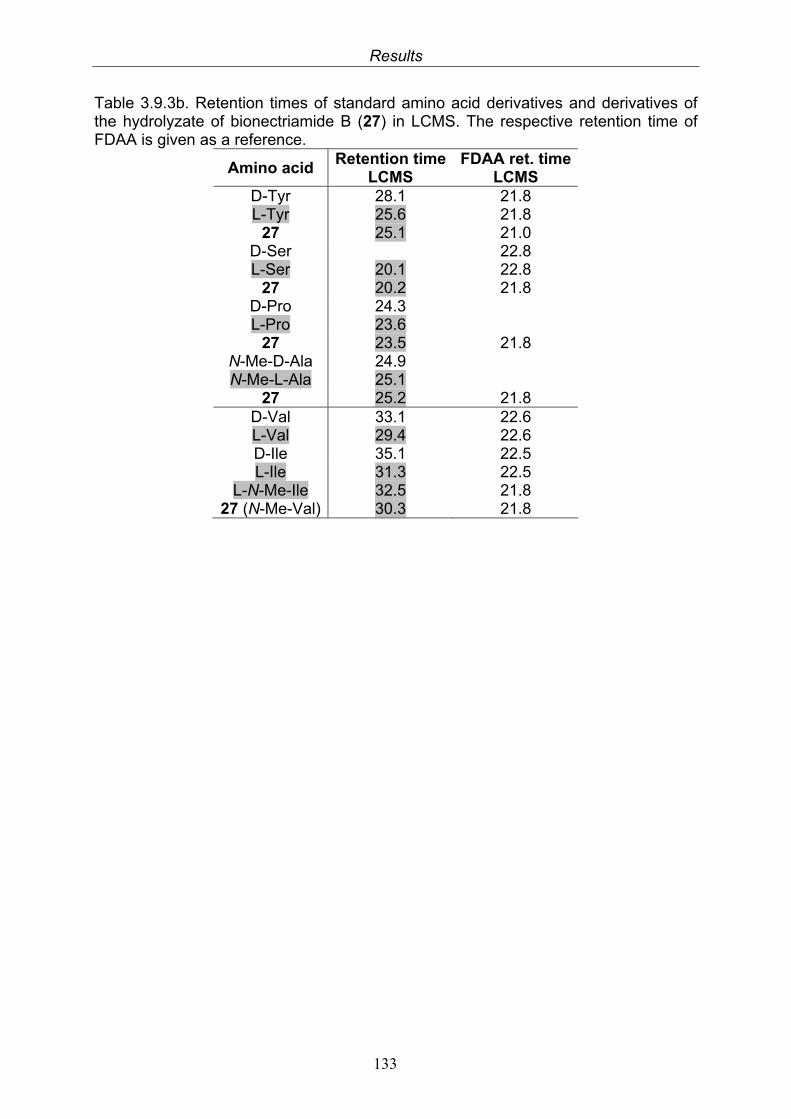
Results
133
Table 3.9.3b. Retention times of standard amino acid derivatives and derivatives of the hydrolyzate of bionectriamide B (27) in LCMS. The respective retention time of FDAA is given as a reference.
Amino acid Retention time
LCMS FDAA ret. time
LCMS D-Tyr 28.1 21.8 L-Tyr 25.6 21.8
27 25.1 21.0 D-Ser 22.8 L-Ser 20.1 22.8
27 20.2 21.8 D-Pro 24.3 L-Pro 23.6
27 23.5 21.8 N-Me-D-Ala 24.9 N-Me-L-Ala 25.1
27 25.2 21.8 D-Val 33.1 22.6 L-Val 29.4 22.6 D-Ile 35.1 22.5 L-Ile 31.3 22.5
L-N-Me-Ile 32.5 21.8 27 (N-Me-Val) 30.3 21.8
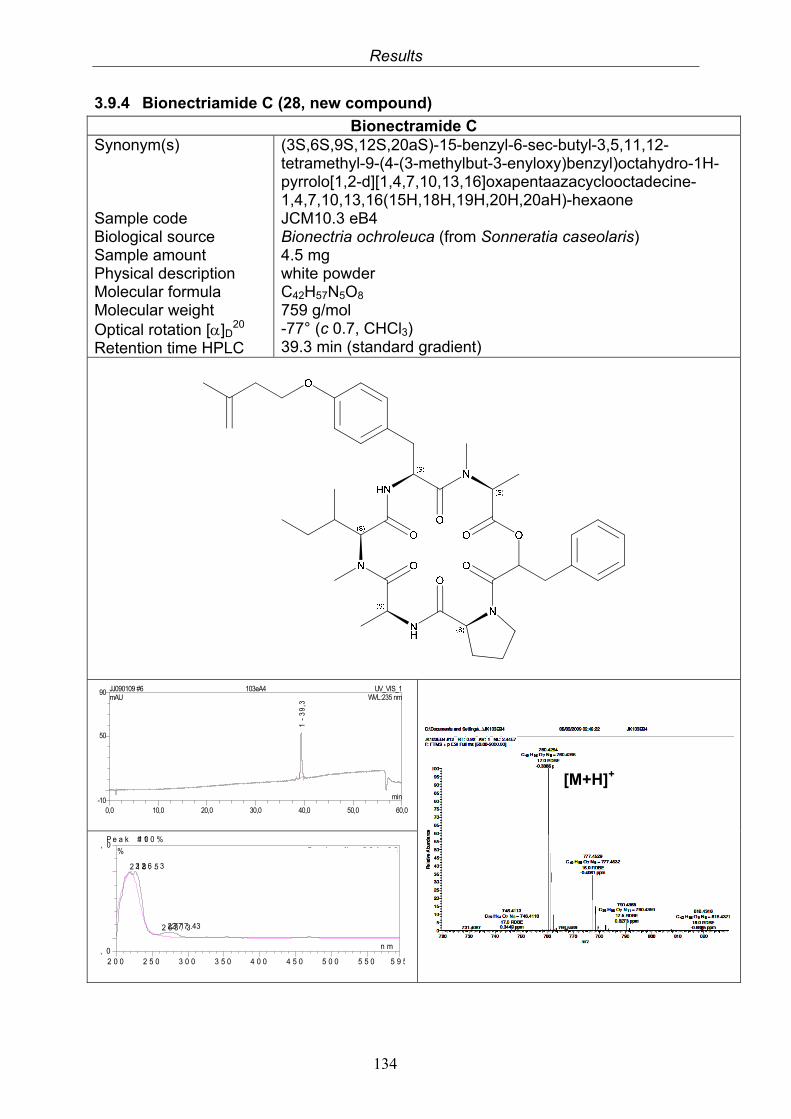
Results
134
3.9.4 Bionectriamide C (28, new compound)
Bionectramide C Synonym(s) Sample code Biological source Sample amount Physical description Molecular formula Molecular weight Optical rotation []D
20 Retention time HPLC
(3S,6S,9S,12S,20aS)-15-benzyl-6-sec-butyl-3,5,11,12-tetramethyl-9-(4-(3-methylbut-3-enyloxy)benzyl)octahydro-1H-pyrrolo[1,2-d][1,4,7,10,13,16]oxapentaazacyclooctadecine-1,4,7,10,13,16(15H,18H,19H,20H,20aH)-hexaone JCM10.3 eB4 Bionectria ochroleuca (from Sonneratia caseolaris) 4.5 mg white powder C42H57N5O8 759 g/mol -77° (c 0.7, CHCl3) 39.3 min (standard gradient)
P e a k # 11 0 0 %
, 0
, 0
2 0 0 2 5 0 3 0 0 3 5 0 4 0 0 4 5 0 5 0 0 5 5 0 5 9 5
%
n m
2 2 6 . 32 1 8 . 5
2 7 7 . 32 7 1 . 42 6 3 . 3
S c a la r o lid e 9 6 4 . 0 3
0,0 10,0 20,0 30,0 40,0 50,0 60,0-10
50
90 JJ090109 #6 103eA4 UV_VIS_1mAU
min
1 -
39
,3
WVL:235 nm
[M+H]+
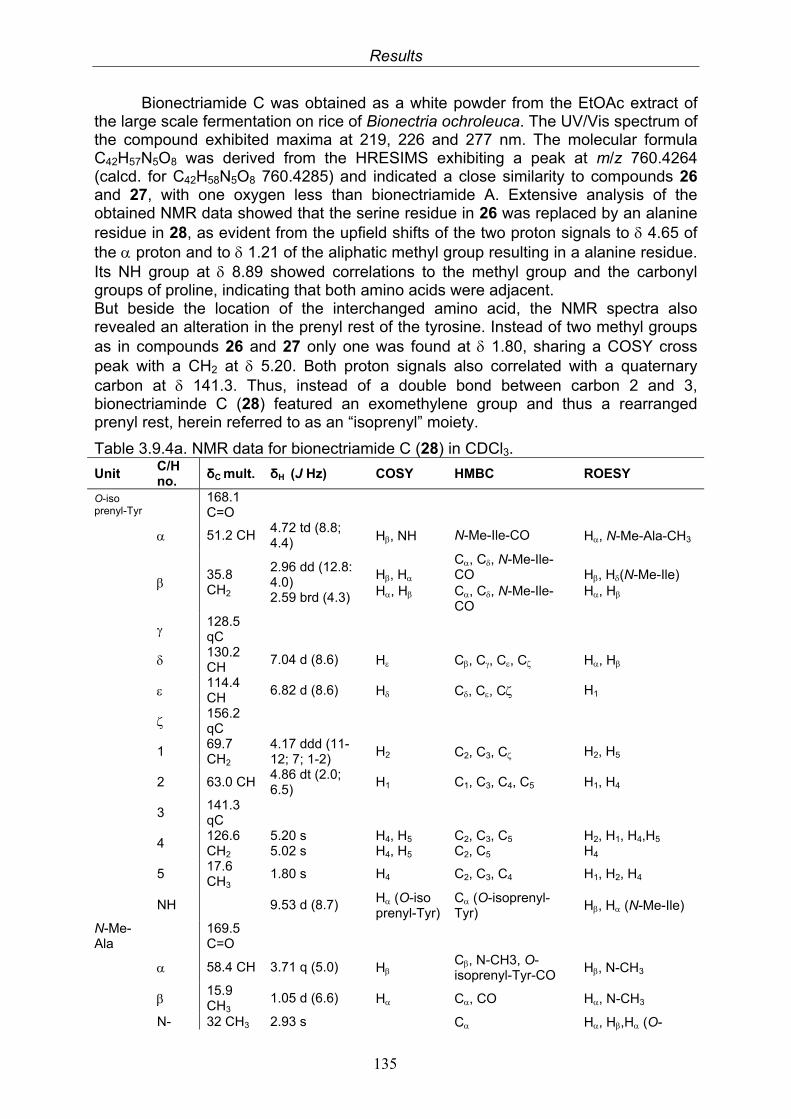
Results
135
Bionectriamide C was obtained as a white powder from the EtOAc extract of the large scale fermentation on rice of Bionectria ochroleuca. The UV/Vis spectrum of the compound exhibited maxima at 219, 226 and 277 nm. The molecular formula C42H57N5O8 was derived from the HRESIMS exhibiting a peak at m/z 760.4264 (calcd. for C42H58N5O8 760.4285) and indicated a close similarity to compounds 26 and 27, with one oxygen less than bionectriamide A. Extensive analysis of the obtained NMR data showed that the serine residue in 26 was replaced by an alanine residue in 28, as evident from the upfield shifts of the two proton signals to 4.65 of the proton and to 1.21 of the aliphatic methyl group resulting in a alanine residue. Its NH group at 8.89 showed correlations to the methyl group and the carbonyl groups of proline, indicating that both amino acids were adjacent. But beside the location of the interchanged amino acid, the NMR spectra also revealed an alteration in the prenyl rest of the tyrosine. Instead of two methyl groups as in compounds 26 and 27 only one was found at 1.80, sharing a COSY cross peak with a CH2 at 5.20. Both proton signals also correlated with a quaternary carbon at 141.3. Thus, instead of a double bond between carbon 2 and 3, bionectriaminde C (28) featured an exomethylene group and thus a rearranged prenyl rest, herein referred to as an “isoprenyl” moiety.
Table 3.9.4a. NMR data for bionectriamide C (28) in CDCl3.
Unit C/H no.
δC mult. δH (J Hz) COSY HMBC ROESY
O-iso prenyl-Tyr
168.1 C=O
51.2 CH 4.72 td (8.8; 4.4) H, NH N-Me-Ile-CO H, N-Me-Ala-CH3
35.8 CH2
2.96 dd (12.8: 4.0) 2.59 brd (4.3)
H, H H, H
C, C, N-Me-Ile-CO C, C, N-Me-Ile-CO
H, H(N-Me-Ile) H, H
128.5 qC
130.2 CH
7.04 d (8.6) H C, C, C, C H, H
114.4 CH
6.82 d (8.6) H C, C, C H1
156.2 qC
1 69.7 CH2
4.17 ddd (11-12; 7; 1-2)
H2 C2, C3, C H2, H5
2 63.0 CH 4.86 dt (2.0; 6.5)
H1 C1, C3, C4, C5 H1, H4
3 141.3 qC
4 126.6 CH2
5.20 s 5.02 s
H4, H5 H4, H5
C2, C3, C5 C2, C5
H2, H1, H4,H5 H4
5 17.6 CH3
1.80 s H4 C2, C3, C4 H1, H2, H4
NH 9.53 d (8.7) H (O-iso prenyl-Tyr)
C (O-isoprenyl-Tyr)
H, H (N-Me-Ile)
N-Me-Ala
169.5 C=O
58.4 CH 3.71 q (5.0) H C, N-CH3, O-isoprenyl-Tyr-CO
H, N-CH3
15.9 CH3
1.05 d (6.6) H C, CO H, N-CH3
N- 32 CH3 2.93 s C H, H,H (O-
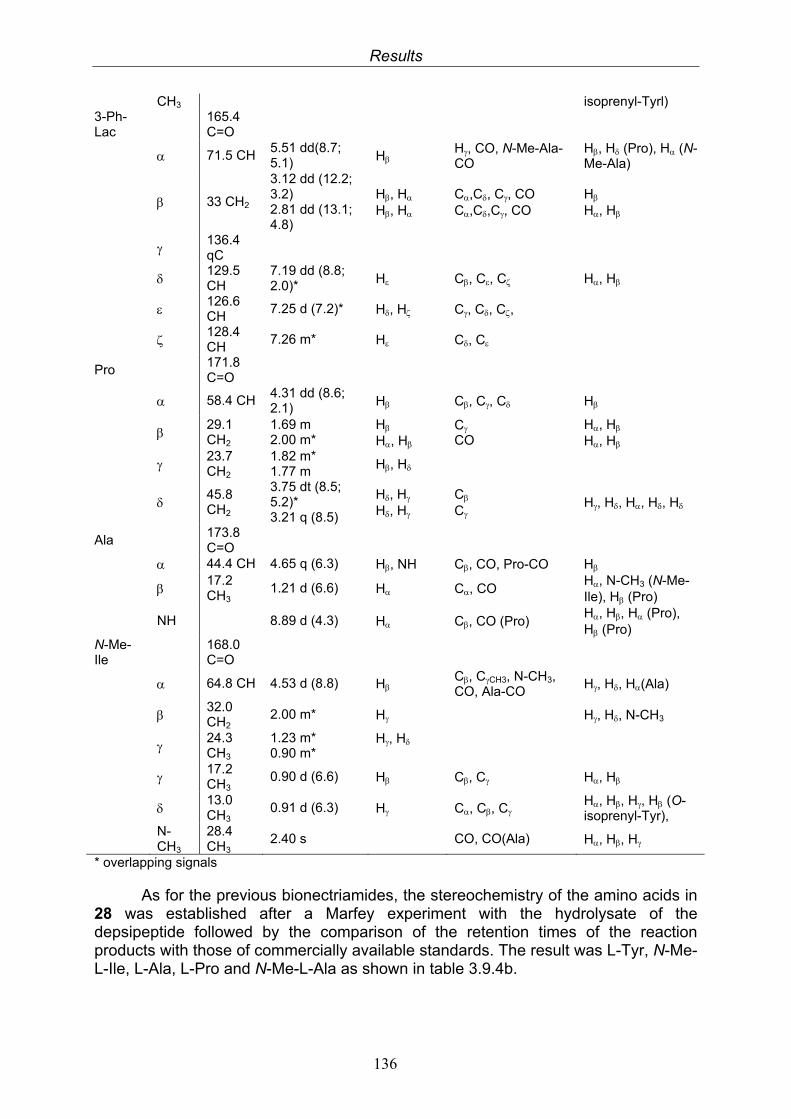
Results
136
CH3 isoprenyl-Tyrl) 3-Ph-Lac
165.4 C=O
71.5 CH 5.51 dd(8.7; 5.1) H
H, CO, N-Me-Ala-CO
H, H (Pro), H (N-Me-Ala)
33 CH2
3.12 dd (12.2; 3.2) 2.81 dd (13.1; 4.8)
H, H H, H
C,C, C, CO C,C,C, CO
H H, H
136.4 qC
129.5 CH
7.19 dd (8.8; 2.0)* H C, C, C H, H
126.6 CH
7.25 d (7.2)* H, H C, C, C,
128.4 CH
7.26 m* H C, C
Pro 171.8 C=O
58.4 CH 4.31 dd (8.6; 2.1) H C, C, C H
29.1 CH2
1.69 m 2.00 m*
H H, H
C CO
H, H H, H
23.7 CH2
1.82 m* 1.77 m H, H
45.8 CH2
3.75 dt (8.5; 5.2)* 3.21 q (8.5)
H, H H, H
C C
H, H, H, H, H
Ala 173.8 C=O
44.4 CH 4.65 q (6.3) H, NH C, CO, Pro-CO H
17.2 CH3
1.21 d (6.6) H C, CO H, N-CH3 (N-Me-Ile), H (Pro)
NH 8.89 d (4.3) H C, CO (Pro) H, H, H (Pro), H (Pro)
N-Me-Ile
168.0 C=O
64.8 CH 4.53 d (8.8) H C, CCH3, N-CH3, CO, Ala-CO
H, H, H(Ala)
32.0 CH2
2.00 m* H H, H, N-CH3
24.3 CH3
1.23 m* 0.90 m*
H, H
17.2 CH3
0.90 d (6.6) H C, C H, H
13.0 CH3
0.91 d (6.3) H C, C, C H, H, H, H (O-isoprenyl-Tyr),
N-CH3
28.4 CH3
2.40 s CO, CO(Ala) H, H, H
* overlapping signals
As for the previous bionectriamides, the stereochemistry of the amino acids in 28 was established after a Marfey experiment with the hydrolysate of the depsipeptide followed by the comparison of the retention times of the reaction products with those of commercially available standards. The result was L-Tyr, N-Me-L-Ile, L-Ala, L-Pro and N-Me-L-Ala as shown in table 3.9.4b.
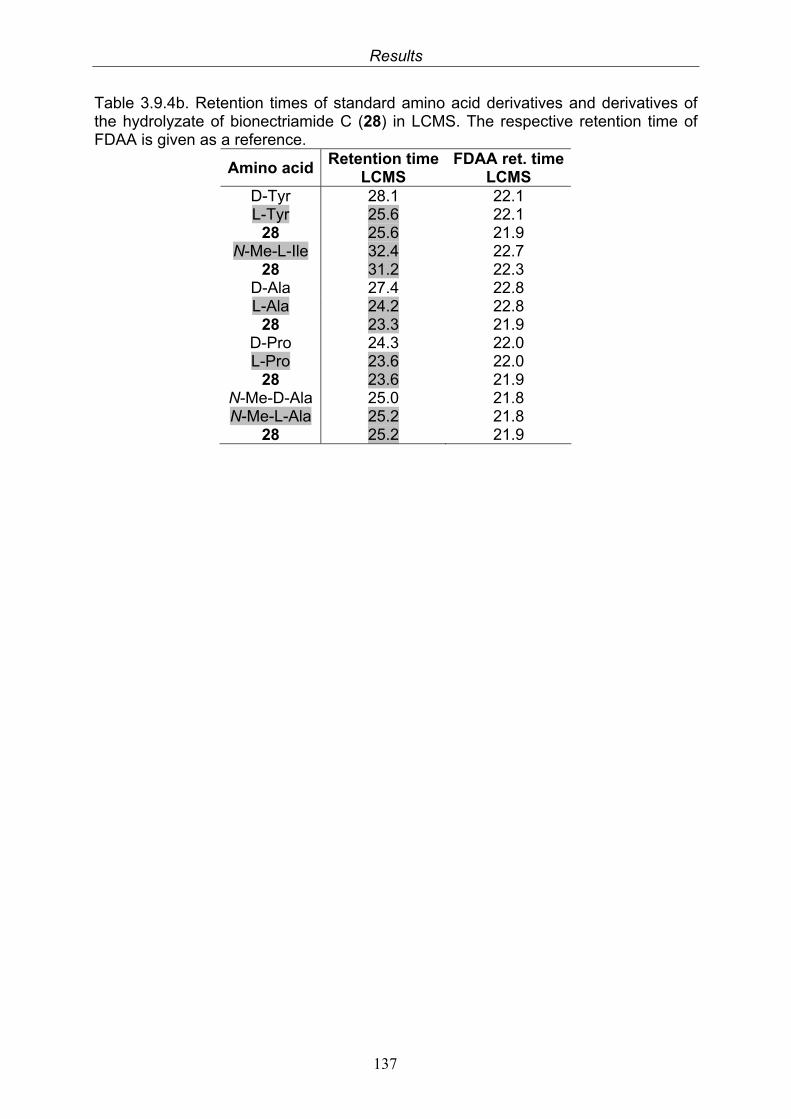
Results
137
Table 3.9.4b. Retention times of standard amino acid derivatives and derivatives of the hydrolyzate of bionectriamide C (28) in LCMS. The respective retention time of FDAA is given as a reference.
Amino acid Retention time
LCMS FDAA ret. time
LCMS D-Tyr 28.1 22.1 L-Tyr 25.6 22.1
28 25.6 21.9 N-Me-L-Ile 32.4 22.7
28 31.2 22.3 D-Ala 27.4 22.8 L-Ala 24.2 22.8
28 23.3 21.9 D-Pro 24.3 22.0 L-Pro 23.6 22.0
28 23.6 21.9 N-Me-D-Ala 25.0 21.8 N-Me-L-Ala 25.2 21.8
28 25.2 21.9
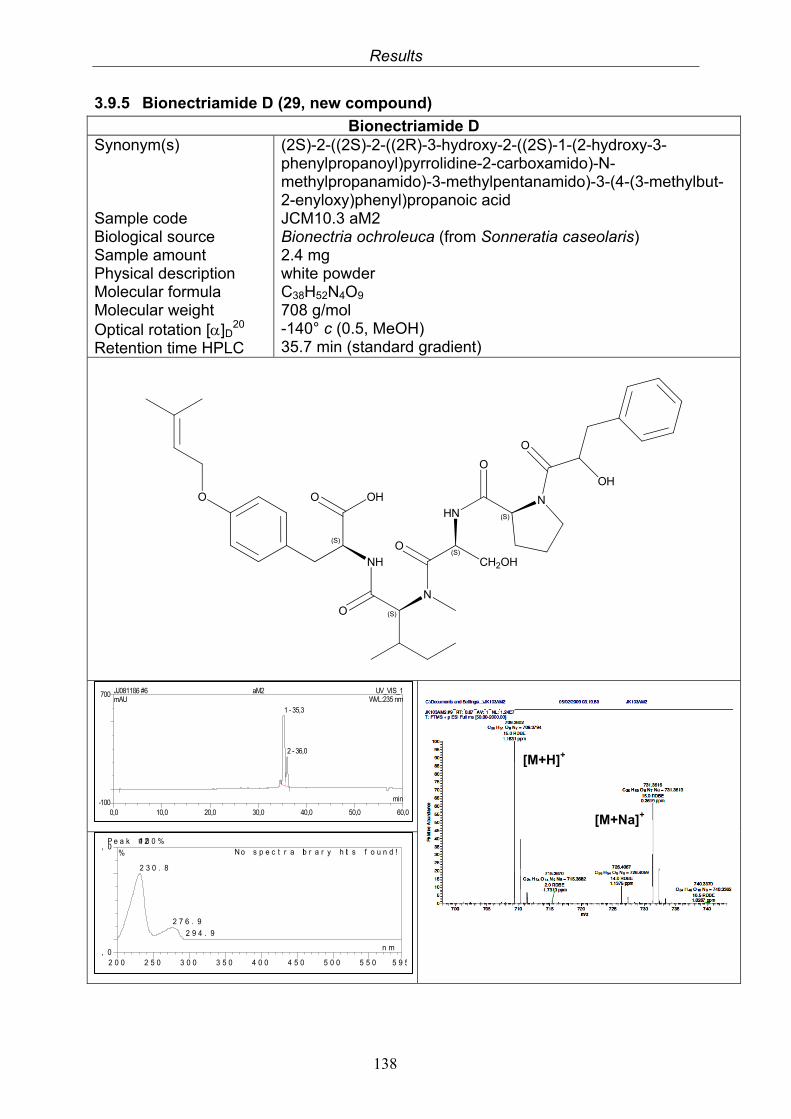
Results
138
3.9.5 Bionectriamide D (29, new compound)
Bionectriamide D Synonym(s) Sample code Biological source Sample amount Physical description Molecular formula Molecular weight Optical rotation []D
20 Retention time HPLC
(2S)-2-((2S)-2-((2R)-3-hydroxy-2-((2S)-1-(2-hydroxy-3-phenylpropanoyl)pyrrolidine-2-carboxamido)-N-methylpropanamido)-3-methylpentanamido)-3-(4-(3-methylbut-2-enyloxy)phenyl)propanoic acid JCM10.3 aM2 Bionectria ochroleuca (from Sonneratia caseolaris) 2.4 mg white powder C38H52N4O9 708 g/mol -140° c (0.5, MeOH) 35.7 min (standard gradient)
NH
(S)
N
(S)
OH
N(S)HN
(S)
O
O
O
O
O
CH2OH
O OH
P e a k # 21 0 0 %
, 0
, 0
2 0 0 2 5 0 3 0 0 3 5 0 4 0 0 4 5 0 5 0 0 5 5 0 5 9 5
%
n m
2 3 0 . 8
2 7 6 . 9
2 9 4 . 9
N o s p e c t r a lib r a r y h it s f o u n d !
0,0 10,0 20,0 30,0 40,0 50,0 60,0-100
700 JJ0811ß6 #6 aM2 UV_VIS_1mAU
min
1 - 35,3
2 - 36,0
WVL:235 nm
[M+H]+
[M+Na]+
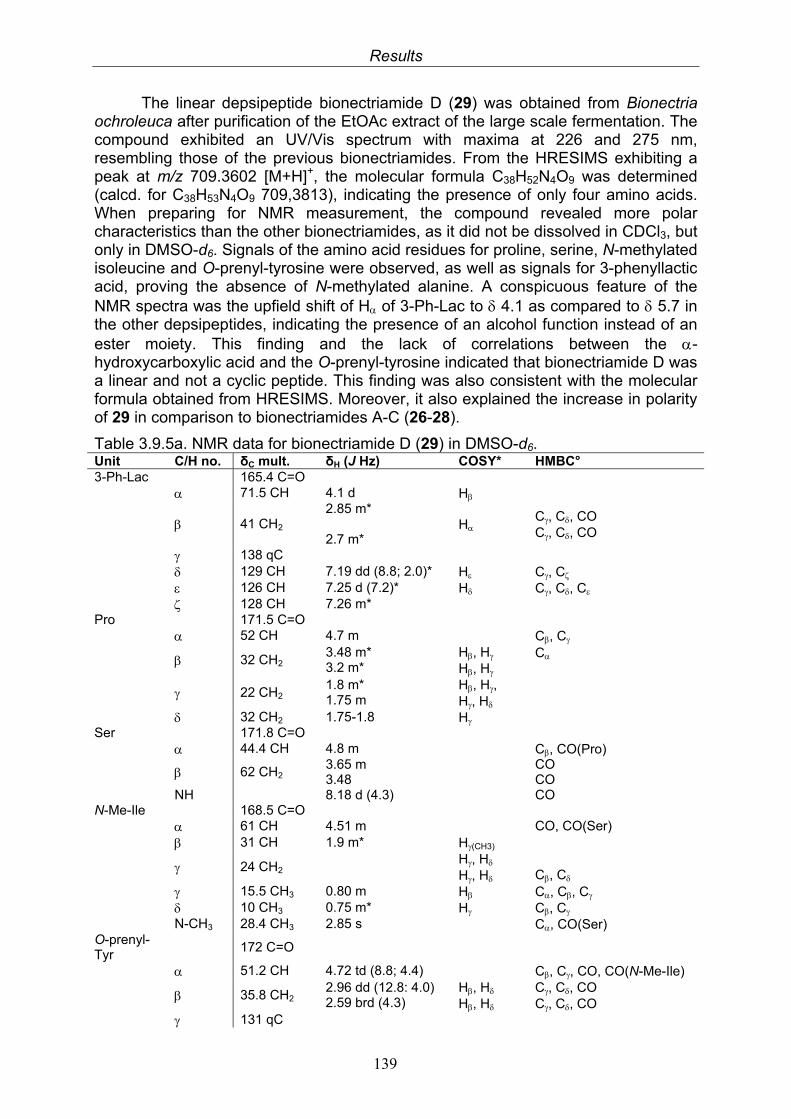
Results
139
The linear depsipeptide bionectriamide D (29) was obtained from Bionectria ochroleuca after purification of the EtOAc extract of the large scale fermentation. The compound exhibited an UV/Vis spectrum with maxima at 226 and 275 nm, resembling those of the previous bionectriamides. From the HRESIMS exhibiting a peak at m/z 709.3602 [M+H]+, the molecular formula C38H52N4O9 was determined (calcd. for C38H53N4O9 709,3813), indicating the presence of only four amino acids. When preparing for NMR measurement, the compound revealed more polar characteristics than the other bionectriamides, as it did not be dissolved in CDCl3, but only in DMSO-d6. Signals of the amino acid residues for proline, serine, N-methylated isoleucine and O-prenyl-tyrosine were observed, as well as signals for 3-phenyllactic acid, proving the absence of N-methylated alanine. A conspicuous feature of the NMR spectra was the upfield shift of H of 3-Ph-Lac to 4.1 as compared to 5.7 in the other depsipeptides, indicating the presence of an alcohol function instead of an ester moiety. This finding and the lack of correlations between the -hydroxycarboxylic acid and the O-prenyl-tyrosine indicated that bionectriamide D was a linear and not a cyclic peptide. This finding was also consistent with the molecular formula obtained from HRESIMS. Moreover, it also explained the increase in polarity of 29 in comparison to bionectriamides A-C (26-28).
Table 3.9.5a. NMR data for bionectriamide D (29) in DMSO-d6. Unit C/H no. δC mult. δH (J Hz) COSY* HMBC° 3-Ph-Lac 165.4 C=O 71.5 CH 4.1 d H
41 CH2 2.85 m* 2.7 m*
H C, C, CO C, C, CO
138 qC 129 CH 7.19 dd (8.8; 2.0)* H C, C 126 CH 7.25 d (7.2)* H C, C, C 128 CH 7.26 m* Pro 171.5 C=O 52 CH 4.7 m C, C
32 CH2 3.48 m* 3.2 m*
H, H H, H
C
22 CH2 1.8 m* 1.75 m
H, H, H, H
32 CH2 1.75-1.8 H Ser 171.8 C=O 44.4 CH 4.8 m C, CO(Pro)
62 CH2 3.65 m 3.48
CO CO
NH 8.18 d (4.3) CO N-Me-Ile 168.5 C=O 61 CH 4.51 m CO, CO(Ser) 31 CH 1.9 m* H(CH3)
24 CH2 H, H H, H
C, C
15.5 CH3 0.80 m H C, C, C 10 CH3 0.75 m* H C, C N-CH3 28.4 CH3 2.85 s C, CO(Ser) O-prenyl-Tyr
172 C=O
51.2 CH 4.72 td (8.8; 4.4) C, C, CO, CO(N-Me-Ile)
35.8 CH2 2.96 dd (12.8: 4.0) 2.59 brd (4.3)
H, H H, H
C, C, CO C, C, CO
131 qC
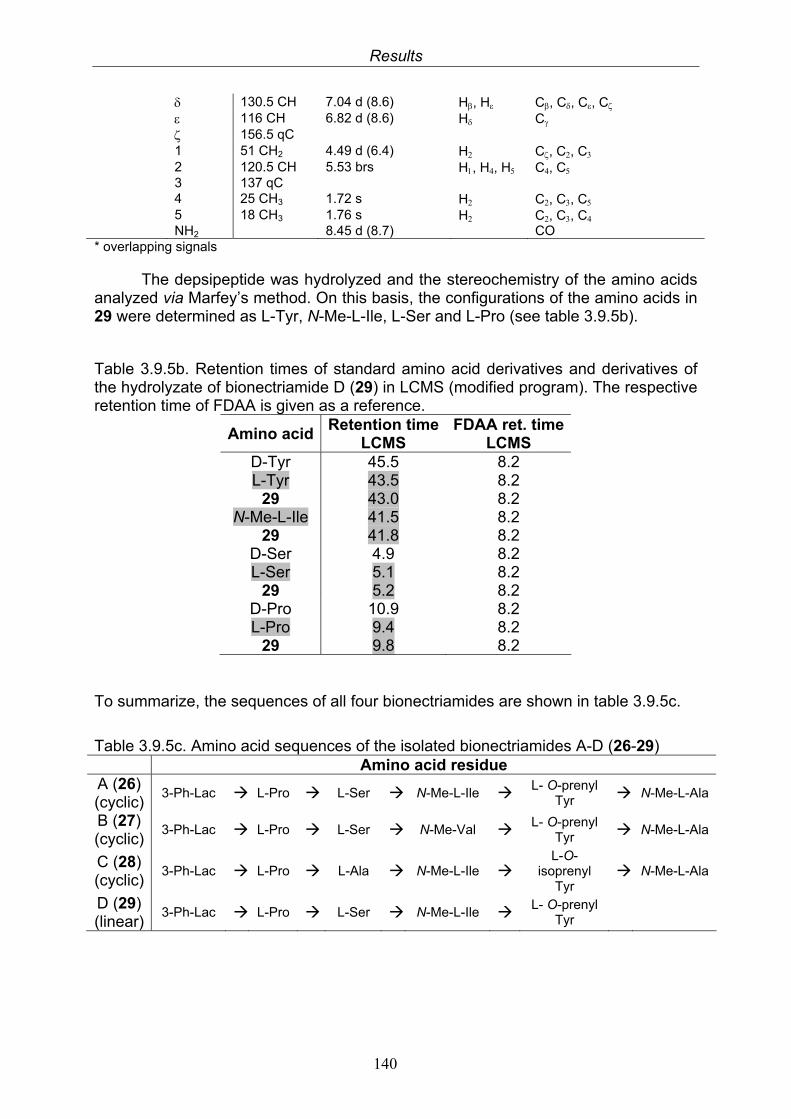
Results
140
130.5 CH 7.04 d (8.6) H, H C, C, C, C 116 CH 6.82 d (8.6) H C 156.5 qC 1 51 CH2 4.49 d (6.4) H C, C, C 2 120.5 CH 5.53 brs H, H, H C, C 3 137 qC 4 25 CH3 1.72 s H C, C, C 5 18 CH3 1.76 s H C, C, C NH2 8.45 d (8.7) CO * overlapping signals
The depsipeptide was hydrolyzed and the stereochemistry of the amino acids analyzed via Marfey’s method. On this basis, the configurations of the amino acids in 29 were determined as L-Tyr, N-Me-L-Ile, L-Ser and L-Pro (see table 3.9.5b).
Table 3.9.5b. Retention times of standard amino acid derivatives and derivatives of the hydrolyzate of bionectriamide D (29) in LCMS (modified program). The respective retention time of FDAA is given as a reference.
Amino acid Retention time
LCMS FDAA ret. time
LCMS D-Tyr 45.5 8.2 L-Tyr 43.5 8.2
29 43.0 8.2 N-Me-L-Ile 41.5 8.2
29 41.8 8.2 D-Ser 4.9 8.2 L-Ser 5.1 8.2
29 5.2 8.2 D-Pro 10.9 8.2 L-Pro 9.4 8.2
29 9.8 8.2 To summarize, the sequences of all four bionectriamides are shown in table 3.9.5c.
Table 3.9.5c. Amino acid sequences of the isolated bionectriamides A-D (26-29) Amino acid residue
A (26) (cyclic)
3-Ph-Lac L-Pro L-Ser N-Me-L-Ile L- O-prenyl Tyr N-Me-L-Ala
B (27) (cyclic)
3-Ph-Lac L-Pro L-Ser N-Me-Val L- O-prenyl Tyr N-Me-L-Ala
C (28) (cyclic)
3-Ph-Lac L-Pro L-Ala N-Me-L-Ile L-O-
isoprenyl Tyr
N-Me-L-Ala
D (29) (linear)
3-Ph-Lac L-Pro L-Ser N-Me-L-Ile L- O-prenyl Tyr
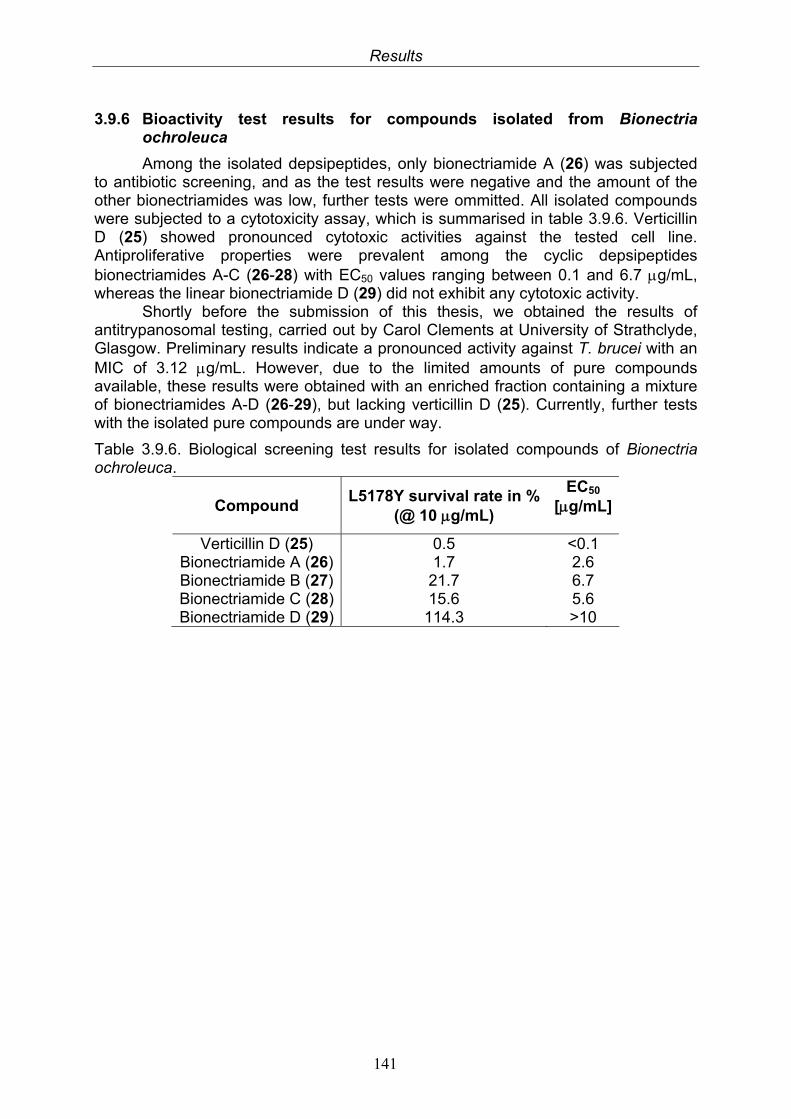
Results
141
3.9.6 Bioactivity test results for compounds isolated from Bionectria ochroleuca
Among the isolated depsipeptides, only bionectriamide A (26) was subjected to antibiotic screening, and as the test results were negative and the amount of the other bionectriamides was low, further tests were ommitted. All isolated compounds were subjected to a cytotoxicity assay, which is summarised in table 3.9.6. Verticillin D (25) showed pronounced cytotoxic activities against the tested cell line. Antiproliferative properties were prevalent among the cyclic depsipeptides bionectriamides A-C (26-28) with EC50 values ranging between 0.1 and 6.7 g/mL, whereas the linear bionectriamide D (29) did not exhibit any cytotoxic activity.
Shortly before the submission of this thesis, we obtained the results of antitrypanosomal testing, carried out by Carol Clements at University of Strathclyde, Glasgow. Preliminary results indicate a pronounced activity against T. brucei with an MIC of 3.12 g/mL. However, due to the limited amounts of pure compounds available, these results were obtained with an enriched fraction containing a mixture of bionectriamides A-D (26-29), but lacking verticillin D (25). Currently, further tests with the isolated pure compounds are under way.
Table 3.9.6. Biological screening test results for isolated compounds of Bionectria ochroleuca.
Compound L5178Y survival rate in %
(@ 10 g/mL)
EC50 [g/mL]
Verticillin D (25) 0.5 <0.1 Bionectriamide A (26) 1.7 2.6 Bionectriamide B (27) 21.7 6.7 Bionectriamide C (28) 15.6 5.6 Bionectriamide D (29) 114.3 >10
Discussion
142
4. Discussion
4.1 Endophytic fungi isolated from Chinese mangrove plants
Mangrove plants from the South Chinese Sea proved to be a very fruitful source of endophytic fungi. From 20 different plants, more than 90 fungal strains could be isolated. Due to that enormous amount, only the most promising fungi could be identified. Despite the possibility that some of these isolates might actually represent the same fungal strains, halotolerant plants were thus confirmed as a reliable source for the isolation of endophytes.
4.2 Isolated compounds from endophytic fungi
From the selected species, 29 compounds, including alkaloids, polyketides and depsipeptides, were isolated. A closer look will be taken at their structural features, their biogenetic origin, and biological activities.
4.2.1 Alkaloids
4.2.1.1 Quinolactacin A1 and A2
The diastereomeric pyrroloquinolone alkaloids were first isolated from an insect-derived Penicillium sp. and were shown to possess inhibitory activity against tumour necrosis factor (TNF) (Takahashi et al. 2000). Their biosynthesis was investigated by feeding experiments using 13C-labelled precursors and proven to comprise several steps, including incorporation of acetate-, isoleucine-, methionine- and glucose units (Sasaki et al. 2006).
4.2.1.2 Tetramic acids: Tenuazonic acid and equisetin
Tetramic acids, i.e. substituted pyrrolidine-2,4-diones acylated at the 3-position, constitute an important group of secondary metabolites exhibiting diverse bioactivities. In the course of this study, I was able to isolate two tetramic acids, tenuazonic acid (9) from Nigrospora sp. and equisetin (4) from Fusarium incarnatum.
Tenuazonic acid has been found in several Alternaria, Aspergillus and Sphaeopsidales strains. The pyrrolidine-2,4-dione is biosynthesized from L-isoleucine and 2 molecules of acetate, by elimination of 2 molecules of water (Nolte et al. 1980, Royles 1995). Equisetin is frequently found in Fusarium species. It is composed of a partially reduced polyketide and a serine residue. Both substances display keto-enol tautomery as depicted in figure 4.2.1.2, and these different tautomeric forms of the tetramic acids in solution must be considered in the course of the structure determination of the substances. Low temperature measurement made possible the assignment of the enol structure of the tetramic acid heterocycle in equisetin, which was not amendable to 1H NMR analysis at room temperature.
Both compounds are notorious for causing several diseases in crops like rice and tobacco such as sheet rot disease, but have also been described as possessing insecticidal, antibacterial, antineoplastic and antiviral activity (Vesonder et al 1979, Cole et al. 1981, Phillips et al. 1989, Royles 1995).
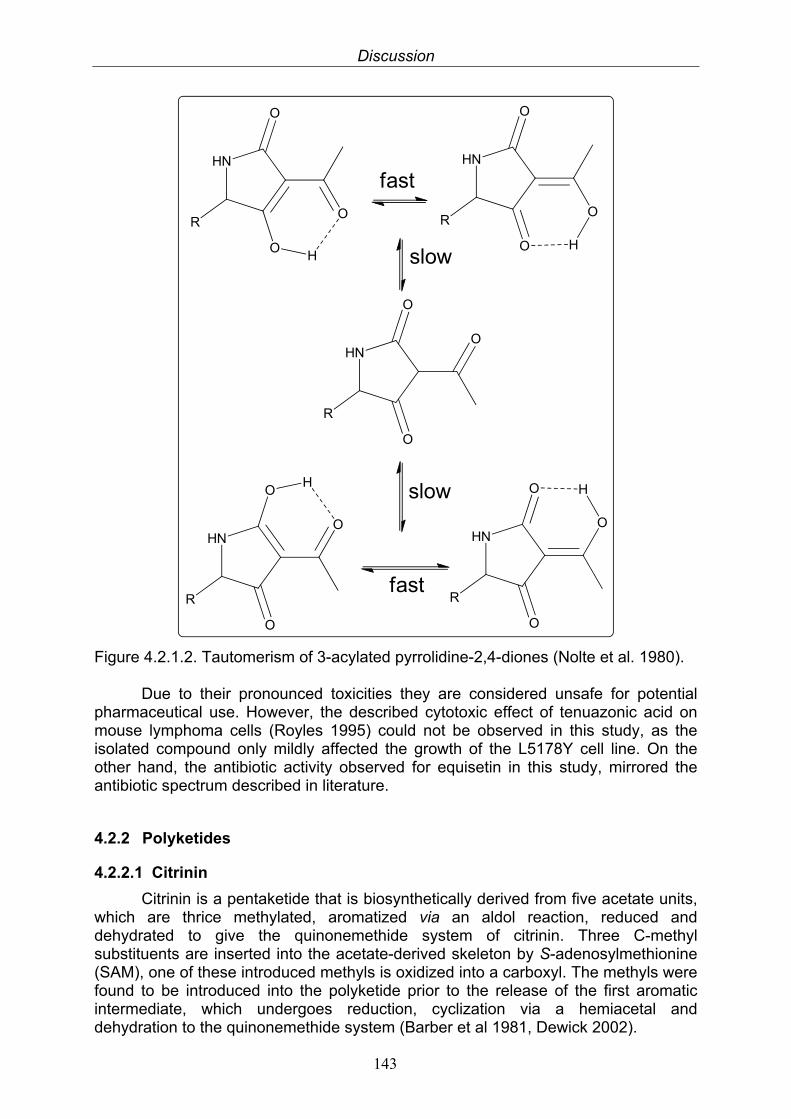
Discussion
143
HN
OH
O
O
R
HN
O
O
O
R
H
HN
O
O
O
R
H
HN
O
O
O
R
H
HN
O
O
O
R
fast
slow
slow
fast
Figure 4.2.1.2. Tautomerism of 3-acylated pyrrolidine-2,4-diones (Nolte et al. 1980). Due to their pronounced toxicities they are considered unsafe for potential
pharmaceutical use. However, the described cytotoxic effect of tenuazonic acid on mouse lymphoma cells (Royles 1995) could not be observed in this study, as the isolated compound only mildly affected the growth of the L5178Y cell line. On the other hand, the antibiotic activity observed for equisetin in this study, mirrored the antibiotic spectrum described in literature.
4.2.2 Polyketides
4.2.2.1 Citrinin
Citrinin is a pentaketide that is biosynthetically derived from five acetate units, which are thrice methylated, aromatized via an aldol reaction, reduced and dehydrated to give the quinonemethide system of citrinin. Three C-methyl substituents are inserted into the acetate-derived skeleton by S-adenosylmethionine (SAM), one of these introduced methyls is oxidized into a carboxyl. The methyls were found to be introduced into the polyketide prior to the release of the first aromatic intermediate, which undergoes reduction, cyclization via a hemiacetal and dehydration to the quinonemethide system (Barber et al 1981, Dewick 2002).
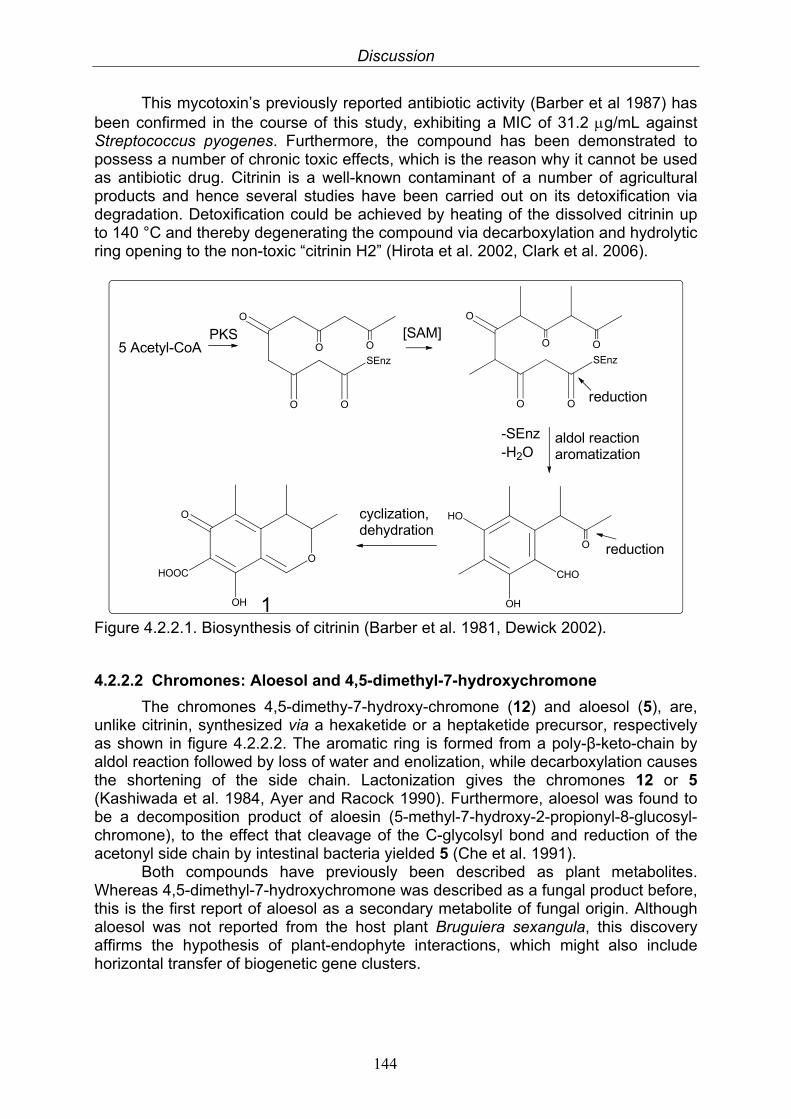
Discussion
144
This mycotoxin’s previously reported antibiotic activity (Barber et al 1987) has been confirmed in the course of this study, exhibiting a MIC of 31.2 g/mL against Streptococcus pyogenes. Furthermore, the compound has been demonstrated to possess a number of chronic toxic effects, which is the reason why it cannot be used as antibiotic drug. Citrinin is a well-known contaminant of a number of agricultural products and hence several studies have been carried out on its detoxification via degradation. Detoxification could be achieved by heating of the dissolved citrinin up to 140 °C and thereby degenerating the compound via decarboxylation and hydrolytic ring opening to the non-toxic “citrinin H2” (Hirota et al. 2002, Clark et al. 2006).
SEnz
O
O O
O O5 Acetyl-CoAPKS [SAM]
O
O
OH
HOOC
SEnz
O
O O
O
reduction
reduction
CHO
HO
OH
O
aldol reactionaromatization
cyclization,dehydration
1
O
-SEnz-H2O
Figure 4.2.2.1. Biosynthesis of citrinin (Barber et al. 1981, Dewick 2002).
4.2.2.2 Chromones: Aloesol and 4,5-dimethyl-7-hydroxychromone
The chromones 4,5-dimethy-7-hydroxy-chromone (12) and aloesol (5), are, unlike citrinin, synthesized via a hexaketide or a heptaketide precursor, respectively as shown in figure 4.2.2.2. The aromatic ring is formed from a poly-β-keto-chain by aldol reaction followed by loss of water and enolization, while decarboxylation causes the shortening of the side chain. Lactonization gives the chromones 12 or 5 (Kashiwada et al. 1984, Ayer and Racock 1990). Furthermore, aloesol was found to be a decomposition product of aloesin (5-methyl-7-hydroxy-2-propionyl-8-glucosyl-chromone), to the effect that cleavage of the C-glycolsyl bond and reduction of the acetonyl side chain by intestinal bacteria yielded 5 (Che et al. 1991).
Both compounds have previously been described as plant metabolites. Whereas 4,5-dimethyl-7-hydroxychromone was described as a fungal product before, this is the first report of aloesol as a secondary metabolite of fungal origin. Although aloesol was not reported from the host plant Bruguiera sexangula, this discovery affirms the hypothesis of plant-endophyte interactions, which might also include horizontal transfer of biogenetic gene clusters.
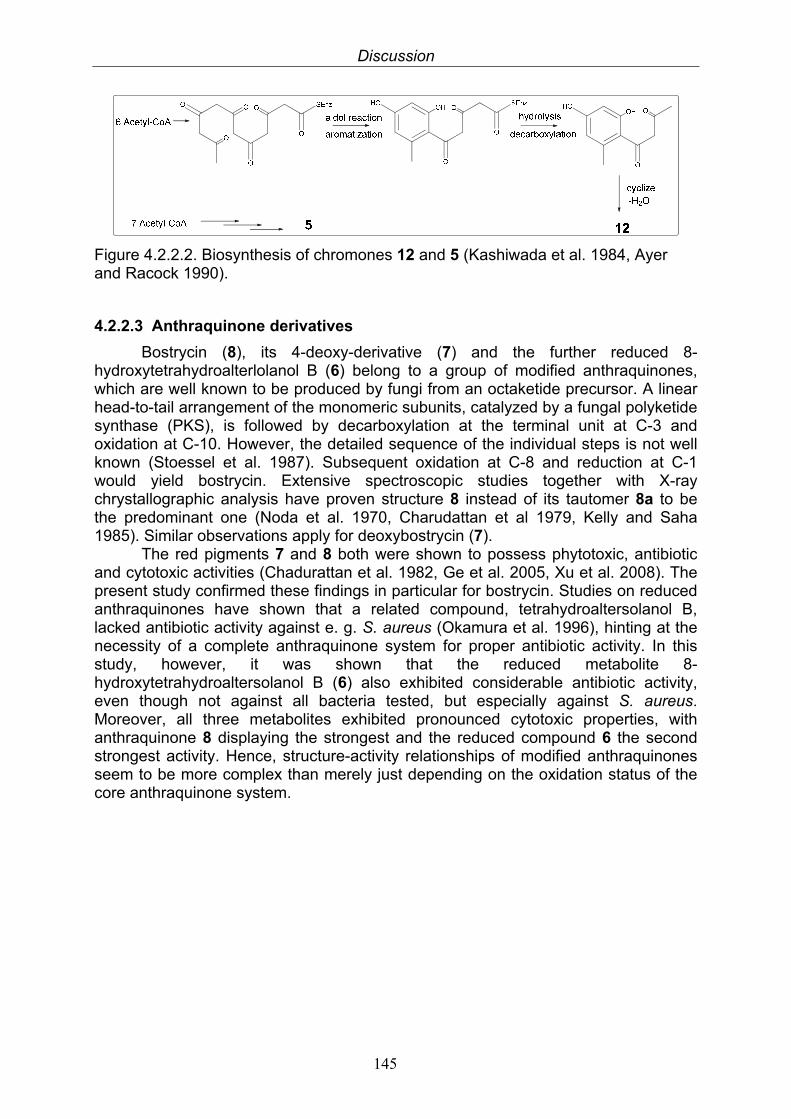
Discussion
145
Figure 4.2.2.2. Biosynthesis of chromones 12 and 5 (Kashiwada et al. 1984, Ayer and Racock 1990).
4.2.2.3 Anthraquinone derivatives
Bostrycin (8), its 4-deoxy-derivative (7) and the further reduced 8-hydroxytetrahydroalterlolanol B (6) belong to a group of modified anthraquinones, which are well known to be produced by fungi from an octaketide precursor. A linear head-to-tail arrangement of the monomeric subunits, catalyzed by a fungal polyketide synthase (PKS), is followed by decarboxylation at the terminal unit at C-3 and oxidation at C-10. However, the detailed sequence of the individual steps is not well known (Stoessel et al. 1987). Subsequent oxidation at C-8 and reduction at C-1 would yield bostrycin. Extensive spectroscopic studies together with X-ray chrystallographic analysis have proven structure 8 instead of its tautomer 8a to be the predominant one (Noda et al. 1970, Charudattan et al 1979, Kelly and Saha 1985). Similar observations apply for deoxybostrycin (7).
The red pigments 7 and 8 both were shown to possess phytotoxic, antibiotic and cytotoxic activities (Chadurattan et al. 1982, Ge et al. 2005, Xu et al. 2008). The present study confirmed these findings in particular for bostrycin. Studies on reduced anthraquinones have shown that a related compound, tetrahydroaltersolanol B, lacked antibiotic activity against e. g. S. aureus (Okamura et al. 1996), hinting at the necessity of a complete anthraquinone system for proper antibiotic activity. In this study, however, it was shown that the reduced metabolite 8-hydroxytetrahydroaltersolanol B (6) also exhibited considerable antibiotic activity, even though not against all bacteria tested, but especially against S. aureus. Moreover, all three metabolites exhibited pronounced cytotoxic properties, with anthraquinone 8 displaying the strongest and the reduced compound 6 the second strongest activity. Hence, structure-activity relationships of modified anthraquinones seem to be more complex than merely just depending on the oxidation status of the core anthraquinone system.
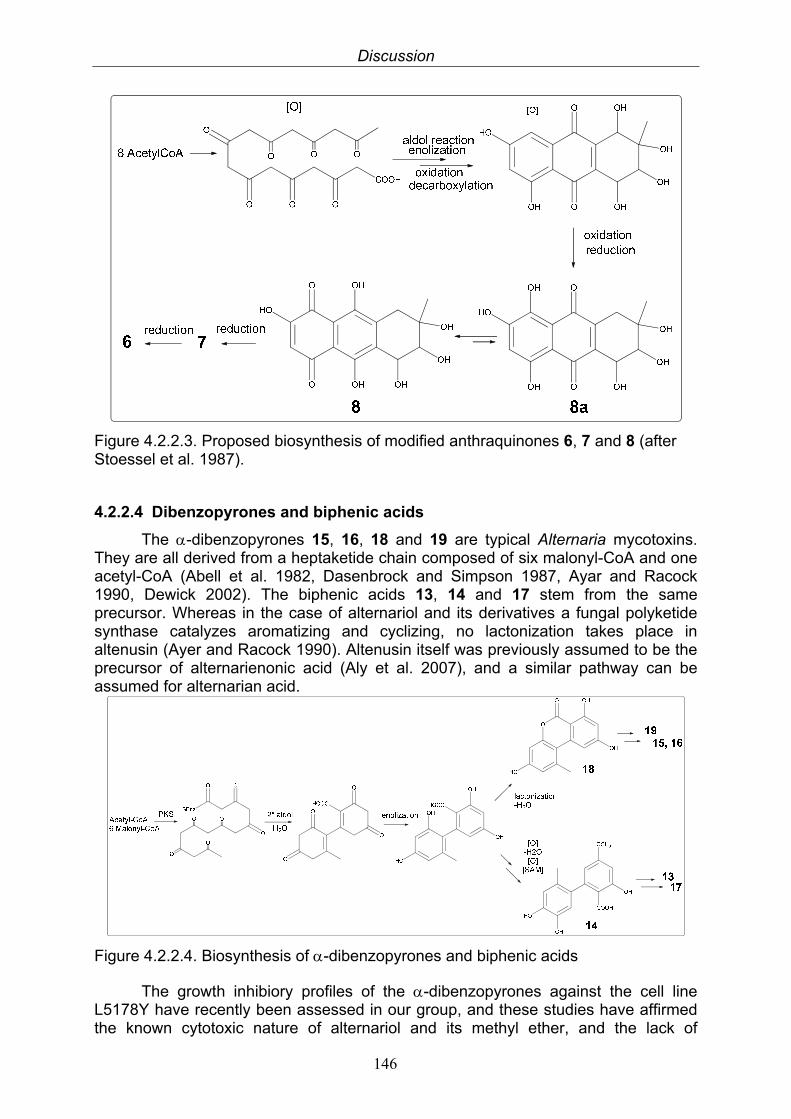
Discussion
146
Figure 4.2.2.3. Proposed biosynthesis of modified anthraquinones 6, 7 and 8 (after Stoessel et al. 1987).
4.2.2.4 Dibenzopyrones and biphenic acids
The -dibenzopyrones 15, 16, 18 and 19 are typical Alternaria mycotoxins. They are all derived from a heptaketide chain composed of six malonyl-CoA and one acetyl-CoA (Abell et al. 1982, Dasenbrock and Simpson 1987, Ayar and Racock 1990, Dewick 2002). The biphenic acids 13, 14 and 17 stem from the same precursor. Whereas in the case of alternariol and its derivatives a fungal polyketide synthase catalyzes aromatizing and cyclizing, no lactonization takes place in altenusin (Ayer and Racock 1990). Altenusin itself was previously assumed to be the precursor of alternarienonic acid (Aly et al. 2007), and a similar pathway can be assumed for alternarian acid.
Figure 4.2.2.4. Biosynthesis of -dibenzopyrones and biphenic acids
The growth inhibiory profiles of the -dibenzopyrones against the cell line L5178Y have recently been assessed in our group, and these studies have affirmed the known cytotoxic nature of alternariol and its methyl ether, and the lack of
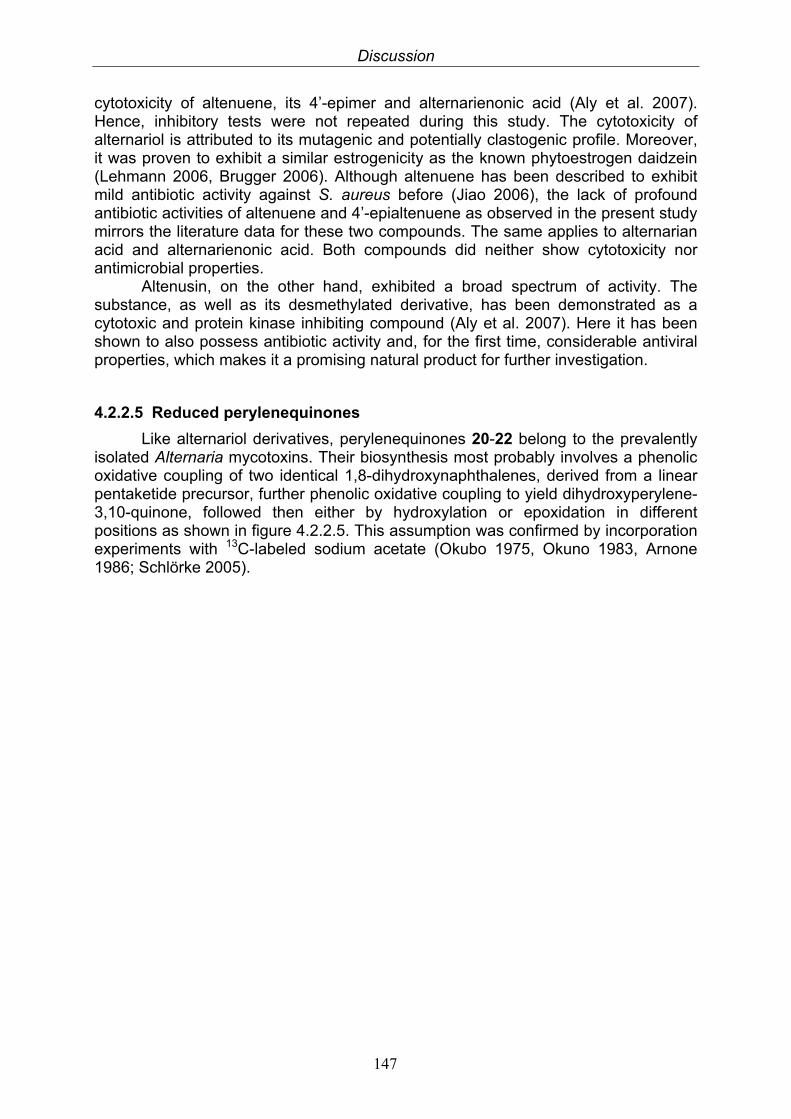
Discussion
147
cytotoxicity of altenuene, its 4’-epimer and alternarienonic acid (Aly et al. 2007). Hence, inhibitory tests were not repeated during this study. The cytotoxicity of alternariol is attributed to its mutagenic and potentially clastogenic profile. Moreover, it was proven to exhibit a similar estrogenicity as the known phytoestrogen daidzein (Lehmann 2006, Brugger 2006). Although altenuene has been described to exhibit mild antibiotic activity against S. aureus before (Jiao 2006), the lack of profound antibiotic activities of altenuene and 4’-epialtenuene as observed in the present study mirrors the literature data for these two compounds. The same applies to alternarian acid and alternarienonic acid. Both compounds did neither show cytotoxicity nor antimicrobial properties.
Altenusin, on the other hand, exhibited a broad spectrum of activity. The substance, as well as its desmethylated derivative, has been demonstrated as a cytotoxic and protein kinase inhibiting compound (Aly et al. 2007). Here it has been shown to also possess antibiotic activity and, for the first time, considerable antiviral properties, which makes it a promising natural product for further investigation.
4.2.2.5 Reduced perylenequinones
Like alternariol derivatives, perylenequinones 20-22 belong to the prevalently isolated Alternaria mycotoxins. Their biosynthesis most probably involves a phenolic oxidative coupling of two identical 1,8-dihydroxynaphthalenes, derived from a linear pentaketide precursor, further phenolic oxidative coupling to yield dihydroxyperylene-3,10-quinone, followed then either by hydroxylation or epoxidation in different positions as shown in figure 4.2.2.5. This assumption was confirmed by incorporation experiments with 13C-labeled sodium acetate (Okubo 1975, Okuno 1983, Arnone 1986; Schlörke 2005).
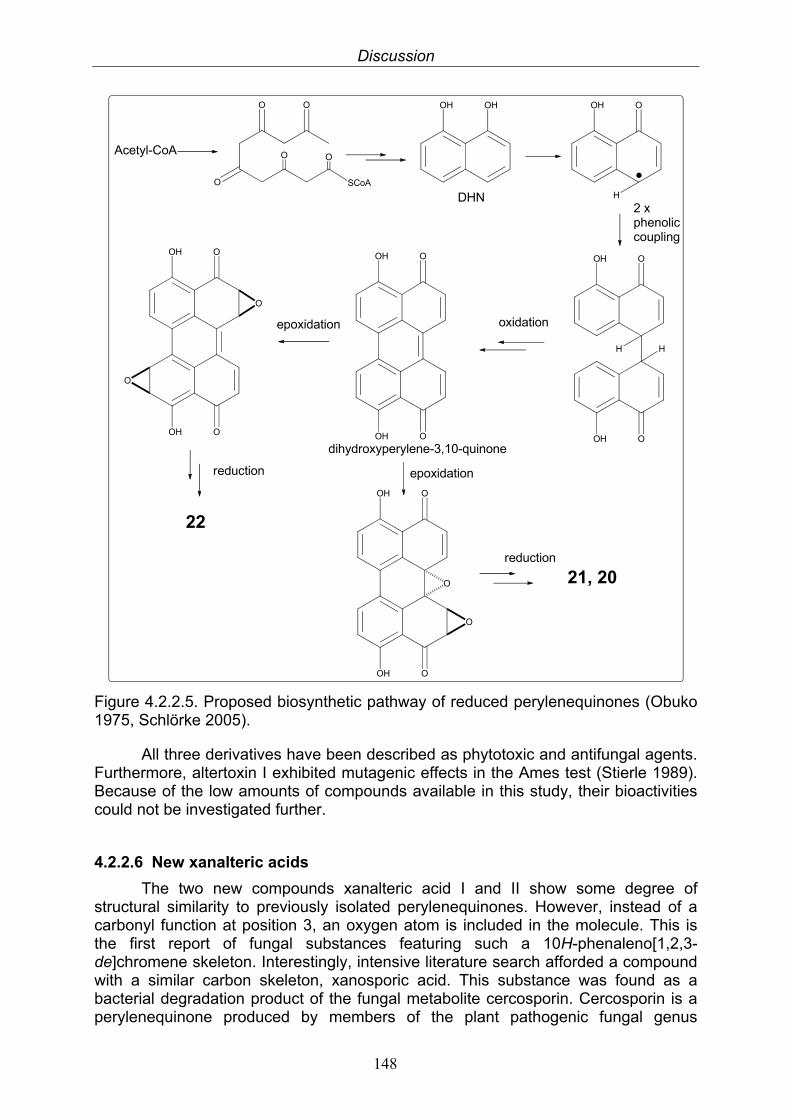
Discussion
148
Acetyl-CoA
O O
O SCoA
O O
OH OH O
H
OH
OOH
OOH
H H
OOH
OOH
OOH
OOH
OOH
OOH
DHN2 xphenoliccoupling
oxidationepoxidation
epoxidation
O
O
O
O
reduction
reduction
22
21, 20
dihydroxyperylene-3,10-quinone
Figure 4.2.2.5. Proposed biosynthetic pathway of reduced perylenequinones (Obuko 1975, Schlörke 2005).
All three derivatives have been described as phytotoxic and antifungal agents. Furthermore, altertoxin I exhibited mutagenic effects in the Ames test (Stierle 1989). Because of the low amounts of compounds available in this study, their bioactivities could not be investigated further.
4.2.2.6 New xanalteric acids
The two new compounds xanalteric acid I and II show some degree of structural similarity to previously isolated perylenequinones. However, instead of a carbonyl function at position 3, an oxygen atom is included in the molecule. This is the first report of fungal substances featuring such a 10H-phenaleno[1,2,3-de]chromene skeleton. Interestingly, intensive literature search afforded a compound with a similar carbon skeleton, xanosporic acid. This substance was found as a bacterial degradation product of the fungal metabolite cercosporin. Cercosporin is a perylenequinone produced by members of the plant pathogenic fungal genus
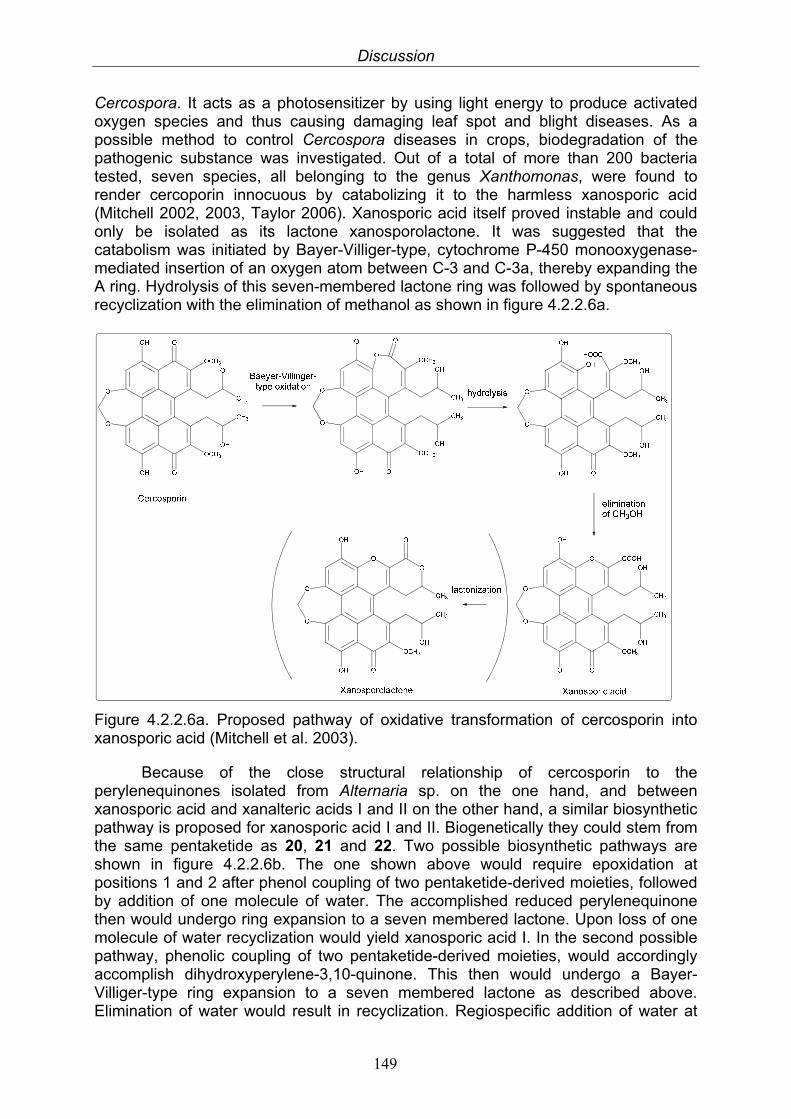
Discussion
149
Cercospora. It acts as a photosensitizer by using light energy to produce activated oxygen species and thus causing damaging leaf spot and blight diseases. As a possible method to control Cercospora diseases in crops, biodegradation of the pathogenic substance was investigated. Out of a total of more than 200 bacteria tested, seven species, all belonging to the genus Xanthomonas, were found to render cercoporin innocuous by catabolizing it to the harmless xanosporic acid (Mitchell 2002, 2003, Taylor 2006). Xanosporic acid itself proved instable and could only be isolated as its lactone xanosporolactone. It was suggested that the catabolism was initiated by Bayer-Villiger-type, cytochrome P-450 monooxygenase-mediated insertion of an oxygen atom between C-3 and C-3a, thereby expanding the A ring. Hydrolysis of this seven-membered lactone ring was followed by spontaneous recyclization with the elimination of methanol as shown in figure 4.2.2.6a.
Figure 4.2.2.6a. Proposed pathway of oxidative transformation of cercosporin into xanosporic acid (Mitchell et al. 2003).
Because of the close structural relationship of cercosporin to the perylenequinones isolated from Alternaria sp. on the one hand, and between xanosporic acid and xanalteric acids I and II on the other hand, a similar biosynthetic pathway is proposed for xanosporic acid I and II. Biogenetically they could stem from the same pentaketide as 20, 21 and 22. Two possible biosynthetic pathways are shown in figure 4.2.2.6b. The one shown above would require epoxidation at positions 1 and 2 after phenol coupling of two pentaketide-derived moieties, followed by addition of one molecule of water. The accomplished reduced perylenequinone then would undergo ring expansion to a seven membered lactone. Upon loss of one molecule of water recyclization would yield xanosporic acid I. In the second possible pathway, phenolic coupling of two pentaketide-derived moieties, would accordingly accomplish dihydroxyperylene-3,10-quinone. This then would undergo a Bayer-Villiger-type ring expansion to a seven membered lactone as described above. Elimination of water would result in recyclization. Regiospecific addition of water at
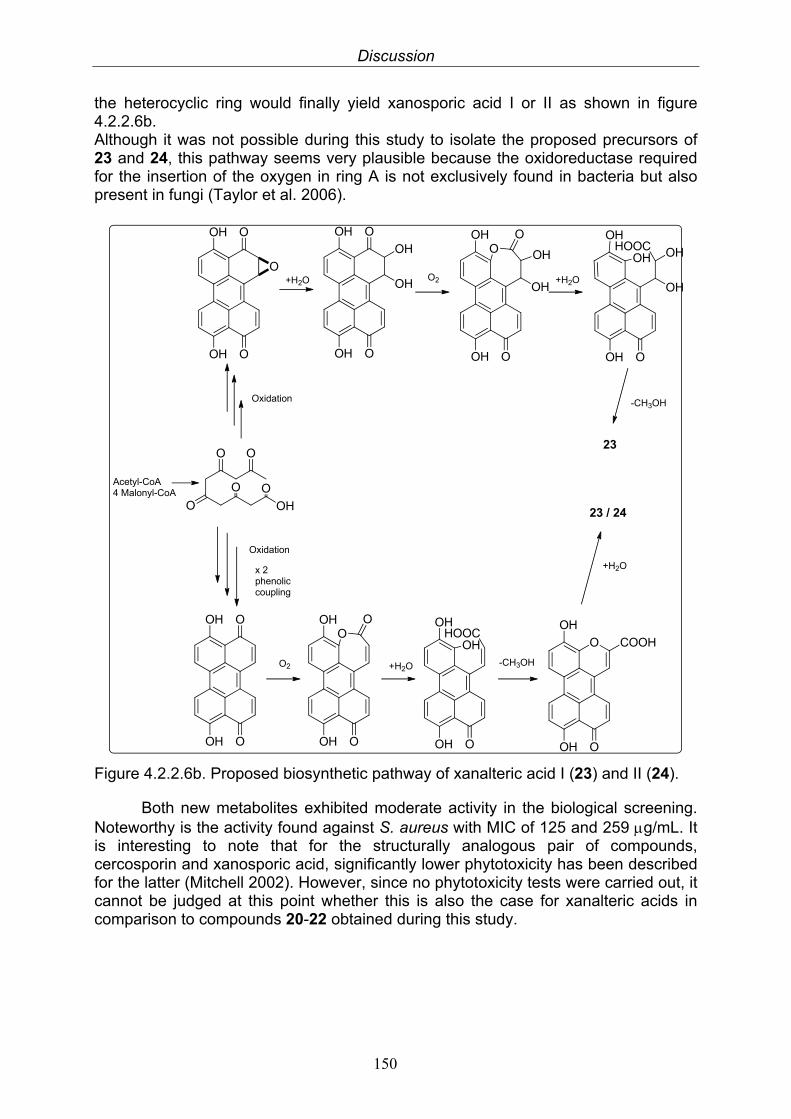
Discussion
150
the heterocyclic ring would finally yield xanosporic acid I or II as shown in figure 4.2.2.6b. Although it was not possible during this study to isolate the proposed precursors of 23 and 24, this pathway seems very plausible because the oxidoreductase required for the insertion of the oxygen in ring A is not exclusively found in bacteria but also present in fungi (Taylor et al. 2006).
O
O
OH
OH
O
OOH
OH
OH
OH
O
OOH
OH
OH
OH
OO
OOH
OH
OH
OH
OHHOOC
Acetyl-CoA4 Malonyl-CoA
O O
O OH
O O
+H2O O2 +H2O
-CH3OH
23
Oxidation
x 2phenoliccoupling
OOH
OH O
OOH
OH OO
OOH
OH
OHHOOC
OOH
O
OH
COOH
O2 +H2O -CH3OH
+H2O
23 / 24
Oxidation
Figure 4.2.2.6b. Proposed biosynthetic pathway of xanalteric acid I (23) and II (24).
Both new metabolites exhibited moderate activity in the biological screening. Noteworthy is the activity found against S. aureus with MIC of 125 and 259 g/mL. It is interesting to note that for the structurally analogous pair of compounds, cercosporin and xanosporic acid, significantly lower phytotoxicity has been described for the latter (Mitchell 2002). However, since no phytotoxicity tests were carried out, it cannot be judged at this point whether this is also the case for xanalteric acids in comparison to compounds 20-22 obtained during this study.
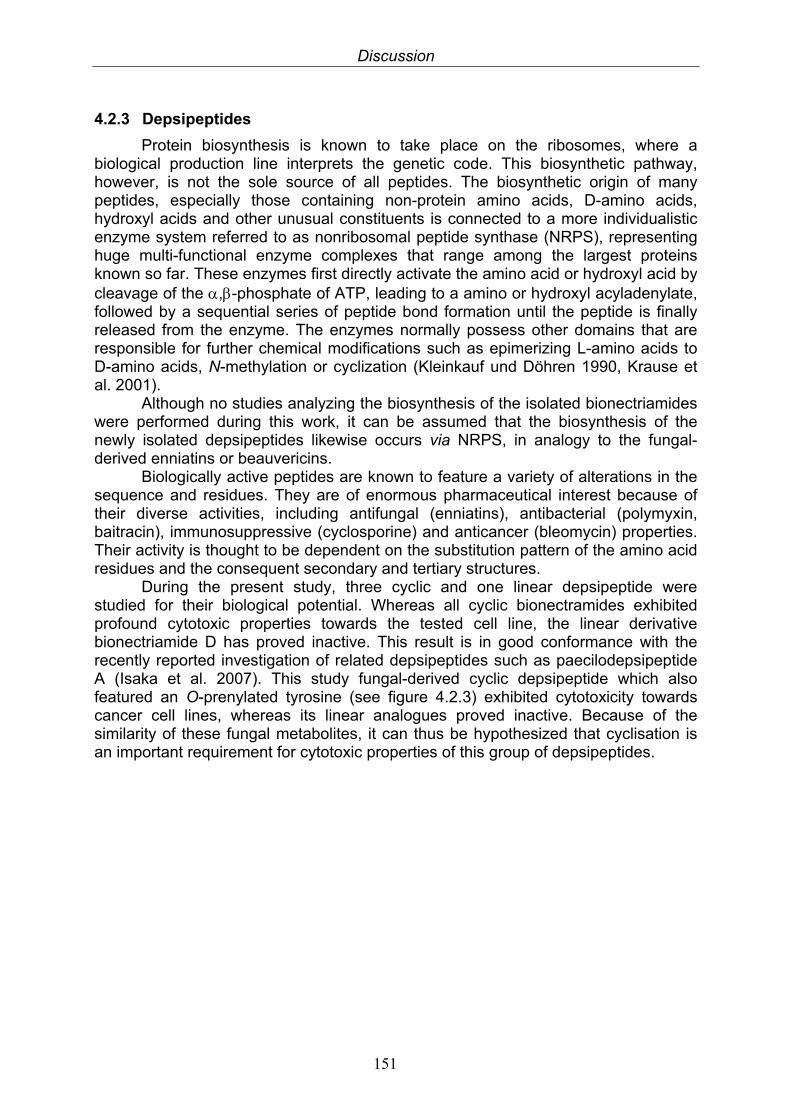
Discussion
151
4.2.3 Depsipeptides
Protein biosynthesis is known to take place on the ribosomes, where a biological production line interprets the genetic code. This biosynthetic pathway, however, is not the sole source of all peptides. The biosynthetic origin of many peptides, especially those containing non-protein amino acids, D-amino acids, hydroxyl acids and other unusual constituents is connected to a more individualistic enzyme system referred to as nonribosomal peptide synthase (NRPS), representing huge multi-functional enzyme complexes that range among the largest proteins known so far. These enzymes first directly activate the amino acid or hydroxyl acid by cleavage of the ,-phosphate of ATP, leading to a amino or hydroxyl acyladenylate, followed by a sequential series of peptide bond formation until the peptide is finally released from the enzyme. The enzymes normally possess other domains that are responsible for further chemical modifications such as epimerizing L-amino acids to D-amino acids, N-methylation or cyclization (Kleinkauf und Döhren 1990, Krause et al. 2001).
Although no studies analyzing the biosynthesis of the isolated bionectriamides were performed during this work, it can be assumed that the biosynthesis of the newly isolated depsipeptides likewise occurs via NRPS, in analogy to the fungal-derived enniatins or beauvericins.
Biologically active peptides are known to feature a variety of alterations in the sequence and residues. They are of enormous pharmaceutical interest because of their diverse activities, including antifungal (enniatins), antibacterial (polymyxin, baitracin), immunosuppressive (cyclosporine) and anticancer (bleomycin) properties. Their activity is thought to be dependent on the substitution pattern of the amino acid residues and the consequent secondary and tertiary structures.
During the present study, three cyclic and one linear depsipeptide were studied for their biological potential. Whereas all cyclic bionectramides exhibited profound cytotoxic properties towards the tested cell line, the linear derivative bionectriamide D has proved inactive. This result is in good conformance with the recently reported investigation of related depsipeptides such as paecilodepsipeptide A (Isaka et al. 2007). This study fungal-derived cyclic depsipeptide which also featured an O-prenylated tyrosine (see figure 4.2.3) exhibited cytotoxicity towards cancer cell lines, whereas its linear analogues proved inactive. Because of the similarity of these fungal metabolites, it can thus be hypothesized that cyclisation is an important requirement for cytotoxic properties of this group of depsipeptides.
Discussion
152
Figure 4.2.3. Examples of bioactive cyclic peptides.
Enniatin A Bleomycin A2
Paecilodepsipeptide A
Bionectramide A
Discussion
153
4.3 Endosymbiont-host interactions
During the workup of the extract obtained from Alternaria sp. the question emerged whether or not bacteria could be the actual producers of some of the compounds. This hypothesis was based on ubiquitous endosymbiotic bacterial-fungal interactions that have been described for more than three decades in general (Kobayashi and Crouch 2009), and the discovery of an endosymbiotic bacterium producing a “fungal” toxin in particular (Partida-Martinez and Hartweck 2005). However, the presence of bacteria residing inter- or intracellularly in Alternaria sp. could be excluded, a hypothesis that came to mind when considering the structures of xanalteric acids, which exhibit a close similarity to the bacterial compound cercosporin, itself derived from metabolization of a fungal precursor. Fermentation upon addition of antibiotics still afforded the metabolites, and in addition, PCR amplification of total DNA extracted from the culture with bacteria-specific primers gave no sign of bacterial growth in the fungal culture
Interactions between host plant and endophyte are far from being understood, and the same applies for interactions between bacteria and fungi. Culture experiments together with the benefits of studying these systems at the molecular level would help to understand these interactions.
Discussion
154
4.4 Regulation of secondary metabolite production by endophytic fungi
In the course of this study it was found that the productivity and metabolite profiles of the isolated endophytic fungi Alternaria sp. and Nigrospora sp. changed upon fermentation in different media. This observation confirms the concept of the OSMAC (One Strain, Many Compounds) approach (Bode et al. 2002) and suggested these two fungal strains to be ideal candidates for exemplary investigation of the effect of the supplementation of the fermentation medium. Among the various biotic and abiotic culture parameters that have been described in the literature, the application of epigenetic modifiers, namely histone deacetylase (HDAC) and DNA methyltransferase (DNMT) inhibitors (Williams et al. 2008), was chosen.
The nucleoside analogue 5-azacytidine is a DNMT-inhibitor that is mainly used in the treatment of several kinds of leukemia. It was shown to elicit de novo synthesis of several oxylipins in Cladosporium cladosporioides (Williams et al. 2008). In the present study, Alternaria sp. was not responsive to addition of 5-azacytidine, whereas Nigrospora sp. revealed a more than doubled total extract yield (see table 3.8.1 and figures 3.8.1-3.8.2) upon exposure to a concentration of 5 M of the substance, and a distinct shift in the metabolite profile towards an induced synthesis of more lipophilic metabolites (see figure 3.8.3, around 30 min). As the UV spectra corresponding to these compounds (peaks 12-15) show high similarities it is reasonable to assume that they are chemically closely related compounds and might possibly be derived from the same biogenetic gene cluster and are thus co-regulated.
Due to the low extract yields obtained after fermentation of only one Erlenmeyer flask, however, it was not possible to isolate and elucidate the structures of the newly produced metabolites.
In the context of the development of new anticancer agents, the sponge metabolite psammaplin A was proven to be a potent inhibitor of histone deacetylase at nanomolar concentrations (Kim 2007). In the present study, the exposure to a concentration of 0.5 M of this marine metabolite resulted in an increase of total extract in both fungal strains, whereas at a lower concentration only a slight increase of the extract amount was observed. At a higher concentration, even a decrease in the extract amounts was detected (see table 3.8.1). As the HPLC chromatograms of the extracts of both investigated endophytes did not exhibit an altered metabolite profile, it can be assumed that in this particular case, psammaplin A might boost a more general effect on gene transcription rather than deregulating individual biogenetic gene clusters.
Valproic acid is a short-chained fatty acid widely used as an anticonvulsant and mood stabilizer. In recent years it has attracted scientists’ interest because it was shown to activate gene expression by inhibition of histone decetylase in vitro and thus commending itself as potential anticancer drug (Phiel 2001, Segura-Pacheo 2007). Application of 1 and 4 mM of this anticonvulsant drug to the liquid medium resulted in an up to threefold increase of obtained yields of the fungal strain Nigrospora sp. Moreover, a new peak appeared in the HPLC chromatogram. This promising result was only diminished by the need of the application of a rather high concentration of the compound. Nevertheless the activating effect of this compound of comparably low toxicity should warrant further investigation in this specific field.
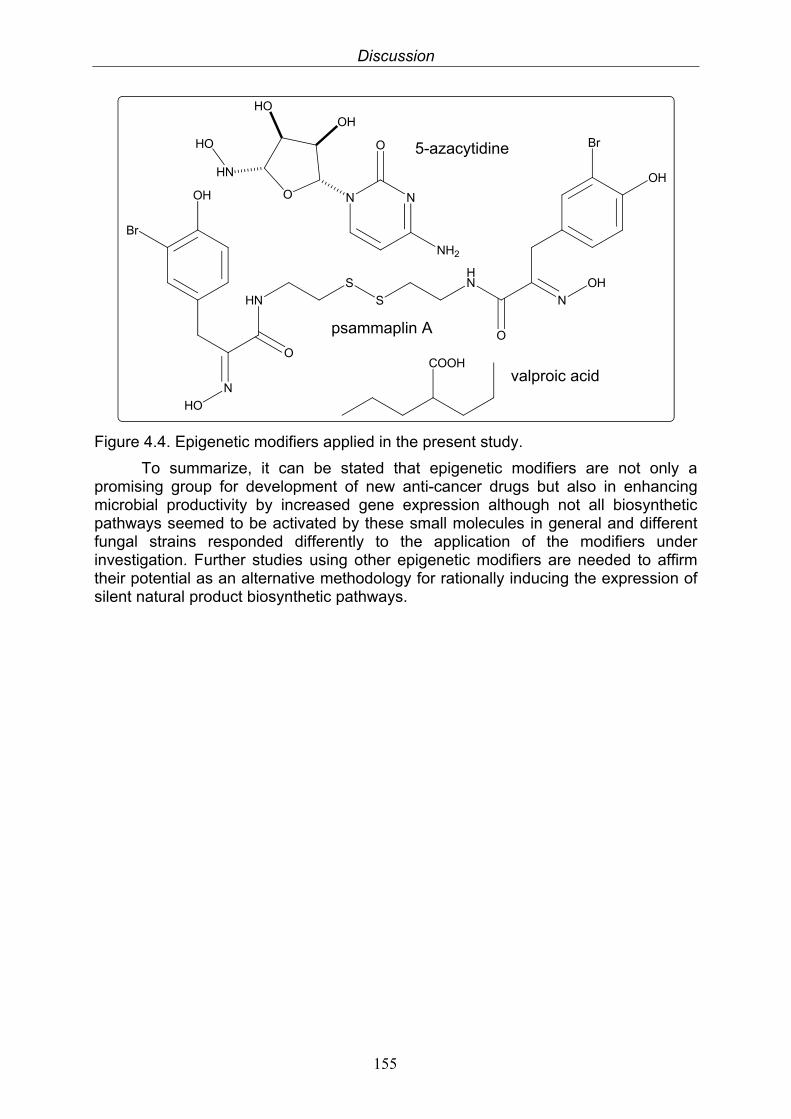
Discussion
155
COOH
HO
HN
HOOH
O N
O
N
NH2
HN
S
S
HN
N
O
O
N
OH
Br
Br
OH
OH
HO
Figure 4.4. Epigenetic modifiers applied in the present study.
To summarize, it can be stated that epigenetic modifiers are not only a promising group for development of new anti-cancer drugs but also in enhancing microbial productivity by increased gene expression although not all biosynthetic pathways seemed to be activated by these small molecules in general and different fungal strains responded differently to the application of the modifiers under investigation. Further studies using other epigenetic modifiers are needed to affirm their potential as an alternative methodology for rationally inducing the expression of silent natural product biosynthetic pathways.
valproic acid
5-azacytidine
psammaplin A
Summary
156
5. Summary
Natural products play a major role in the objective to meet the general demand for new pharmaceutically or biologically active substances. This is particularly true for metabolites from microorganisms, especially endophytic fungi, microorganisms that reside in the tissues of living plants, and which are known to produce a plethora of secondary metabolites. Many of these compounds exhibit biological activities in pharmaceutically relevant bioassay systems and thus represent potential lead structures which could be optimized for medicinal or agrochemical applications.
This thesis focused on the isolation of secondary metabolites from mangrove-derived endophytic fungi, followed by structure elucidation and examination of their pharmacological potential. After biological and chemical screening, five of the more than ninety obtained fungal strains were chosen for detailed examination. Therefore they were grown in liquid Wickerham medium and on solid rice medium for three to five weeks and extracted with organic solvents, followed by fractionation and purification of the secondary metabolites using various chromatographic techniques.
Structure elucidation was performed using state-of-the-art analytical techniques, including mass spectrometry (MS) and one- and two-dimensional nuclear magnetic resonance (NMR) experiments. Furthermore, selected optically active compounds were derivatized in order to determine their absolute configuration.
Pure compounds were subjected to various bioassays to examine their antimicrobial, antiviral, antifungal, cytotoxic and protein kinase inhibitory properties. Finally, two fungal strains were fermented upon addition of substances that are known to be epigenetic modifiers in order to evaluate the effects of altering growth conditions on the chemical productivity of endophytic fungi.
A total of twenty-nine secondary metabolites were isolated in this study, seven of which were identified as new natural products. Known and new compounds were tested for their biological activities using different bioassay systems.
1. Cladosporium sphaerospermum Cladosporium sphaerospermum, isolated from the mangrove plant Aegiceras corniculatum, was grown in liquid medium and yielded three known fungal metabolites. Beside the major compound citrinin, which showed antibiotic activity against Streptococcus pyrogenes, an inseparable mixture of the diastereomers quinolactacin A1 and quinolactacin A2 was obtained.
2. Fusarium incarnatum Equisetin was isolated as the main metabolite of Fusarium incarnatum that was isolated from Pluchea indica. The compound exhibited pronounced antibiotic activity against several selected bacterial strains.
3. Nigrospora sp. Nigrospora sp. was isolated from Bruguiera sexangula. Beside five known metabolites, one new diketopiperazine and one new anthraquinones derivative were isolated. Two of the anthraquinones exhibited moderate antibacterial and good prophylactic effects against human rhinoviruses, but also profound cytotoxic properties.
Summary
157
4. Alternaria sp. Thirteen metabolites were obtained from Alternaria sp., which was isolated from Sonneratia alba. Most of them represent derivatives of alternariol or perylenequinones, while in addition two new natural products were obtained. They feature a 10H-phenaleno[1,2,3-de]chromene skeleton hitherto unknown for fungal metabolites, displaying structural similarity to the perylenequinones, but with an oxygen atom incorporated into the ring system. The new compounds showed antibacterial properties against S. aureus. Altenusin was likewise active, but exhibited a broader antibacterial spectrum and additionally, prophylactic effects against infection by selected human rhinoviruses.
5. Bionectria ochloleuca Bionectria ochroleuca obtained from the mangrove Sonneratia caseolaris was investigated and yielded several new depsipeptides, featuring an O-prenylated tyrosine which is most unusual for fungal secondary metabolites. Whereas the linear derivative bionectriamide D proved inactive when tested against L5178Y mouse lymphoma cell line, the remaining three cyclic depsipeptides bionectriamides A-C displayed pronounced cytotoxic activities with EC50 values between 2.5 and 8 g/mL. In addition, an enriched fraction containing all four depsipeptides exhibited antitryponosomal activity against T. brucei with an MIC of 3.12 g/mL.
Furthermore, the fungal strains Nigrospora sp. and Alternaria sp. were selected for fermentation upon addition of substances that are known to be epigenetic modifiers in order to evaluate the effects of altering fermentation conditions on the chemical productivity of endophytic fungi. For both strains examined, alterations of the amounts of the obtained extracts and their composition were observed. The most effective additive was valproic acid, inducing up to threefold increase of obtained yields of the fungal strain Nigrospora sp. and the appearance of an additional peak in the HPLC chromatogram.
Zusamenfassung
158
6. Zusammenfassung
Im Bestreben, den ausgeprägten Bedarf an neuen pharmazeutisch und biologisch aktiven Substanzen zu decken, spielen Naturstoffe eine große Rolle, was im Besonderen für mikrobielle Sekundärstoffe gilt. Vor allem endophytische Pilze, die im Gewebe lebender Pflanzen wachsen, produzieren eine Fülle von Sekundärstoffen, von denen zahlreiche viel versprechende biologische Aktivitäten in pharmazeutisch relevanten Testsystemen aufweisen und sich so als zu optimierende Leitstrukturen für medizinische oder landwirtschaftliche Nutzung anbieten.
Der Schwerpunkt dieser Doktorarbeit lag in der Isolierung von Sekundärstoffen aus endophytischen Pilzen aus Mangroven, ihrer Strukturaufklärung und der Untersuchung ihres pharmakologischen Potentials. Nach ersten Aktivitätsuntersuchungen und chemischem Screening wurden fünf der über neunzig isolierten Pilzstämme zur eingehenden Untersuchung ausgewählt. Dafür wurden diese für drei bis fünf Wochen in Flüssigmedium oder auf Reis kultiviert, die Kulturen mit organischen Lösungsmitteln extrahiert und die Reinsubstanzen mittels verschiedener chromatographischer Methoden isoliert.
Die Strukturaufklärung erfolgte mit Hilfe moderner Analysemethoden, darunter Massenspektrometrie und Kernspinresonanzspektroskopie. Zudem wurden ausgewählte optisch aktive Substanzen derivatisiert, um ihre absolute Konformation zu ermitteln. Die Reinsubstanzen wurden verschiedenen biologischen Testsystemen, darunter auf antibiotische, antivirale, cytotoxische Aktivität sowie Inhibierung verschiedener Proteinkinasen, unterworfen.
Außerdem wurden zwei der Pilzstämme ausgewählt und unter Zugabe von Substanzen fermentiert, die als epigenetische Modifikatoren der Genregulation beschrieben wurden, um den Effekt veränderter Wachstumsbedingungen auf die chemische Produktivität der Endophyten zu untersuchen.
Insgesamt wurden in dieser Arbeit neunundzwanzig Sekundärstoffe isoliert, von denen sieben neue Naturstoffe darstellen. Sowohl die neuen als auch die bekannten Stoffe wurden mittels unterschiedlicher Testsysteme auf ihre biologische Aktivität hin untersucht.
1. Cladosporium sphaerospermum C. sphaerospermum aus der Mangrovenpflanze Aegiceras corniculatum wurde auf Flüssigmedium fermentiert und lieferte drei Naturstoffe. Neben der Hauptsubstanz Citrinin, welche antibiotische Aktivität gegen Streptococcus pyrogenes aufwies, wurde eine nicht weiter aufzutrennende Mischung der diastereomeren Quinolactacin A1 und Quinolactacin A2 erhalten.
2. Fusarium incarnatum Das Alkaloid Equisetin war der Hauptinhaltsstoff von Fusarium incarnatum, welcher aus Pluchea indica isoliert wurde. Die Substanz zeigte eine ausgeprägte antibiotische Aktivität gegen verschiedene Bakterienstämme.
3. Nigrospora sp. Nigrospora sp. wurde aus der Mangrove Bruguiera sexangula erhalten. Neben fünf bekannten Substanzen wurden ein neues Anthrachinonderivat und ein neues Diketopiperazinderivat isoliert. Zwei der isolierten Anthrachinone zeigten moderate
Zusammenfassung
159
antibakterielle Aktivität und wirkten prophylaktisch gegenüber Infektionen mit Rhinoviren. Sie wiesen auch eine starke Zytotoxizität auf.
4. Alternaria sp. Aus dem Endophyten Alternaria sp. aus der Mangrovenpflanze Sonneratia alba wurden dreizehn Sekundärstoffe erhalten, darunter Alternariolderivate und Perylenchinone sowie zwei neue Naturstoffe. Diese weisen ein 10H-phenaleno[1,2,3]chromen-Grundgerüst auf, das bisher für Naturstoffe aus Pilzen noch nie beobachtet wurde, und das strukturelle Verwandtschaft zu den Perylenchinonen aufweist, wobei sich allerdings ein Sauerstoffatom im Ringsystem befindet. Die neuen Naturstoffe zeigten antibakterielle Eigenschaften gegenüber S. aureus. Dies wurde auch für Altenusin beobachtet, das allerdings noch ein breiteres antibiotisches Spektrum und zudem prophylaktische Wirkung gegenüber Infektion mit Rhinoviren besaß.
5. Bionectria ochroleuca Außerdem wurde Bionectria ochroleuca aus Sonneratia caseolaris untersucht. Aus diesem Endophyten wurden vier neue Depsipeptide isoliert, die ein für Naturstoffe aus Pilzen äußerst ungewöhnliches O-prenyliertes Tyrosin enthalten. Während das lineare Depsipeptid Bionectriamid D keinen inhibierenden Effekt auf das Wachstum der untersuchten Mauslymphomzelllinie L5178Y entwickelte, zeigten die drei zyklischen Derivate Bionectriamid A-C eine ausgeprägte Zytotoxizität mit EC50-Werten zwischen 2.5 und 8 g/ml. Zudem wurde für ein angereichertes Gemisch der vier Depsipeptide eine antitrypanosomale Aktivität gegenüber T. brucei mit einer MIC von 3.12 g/ml festgestellt.
Schließlich wurden die Pilzstämme Nigrospora sp. und Alternaria sp. unter Zugabe von sogenannten epigenetischen Modifikatoren fermentiert, um die Auswirkung dieser Substanzen auf die chemische Produktivität der Pilzkulturen zu ermitteln. Bei beiden untersuchten Pilzkulturen zeigten sich Veränderungen in der Menge der erhaltenen Extrakte sowie in deren Zusammensetzung. Die stärksten Veränderungen bewirkte die Zugabe von Valproinsäure, die für die dreifache Extraktmenge aus Nigrospora sp. und das Auftauchen eines zusätzlichen Peaks im HPLC-Chromatogramm verantwortlich zeichnete.
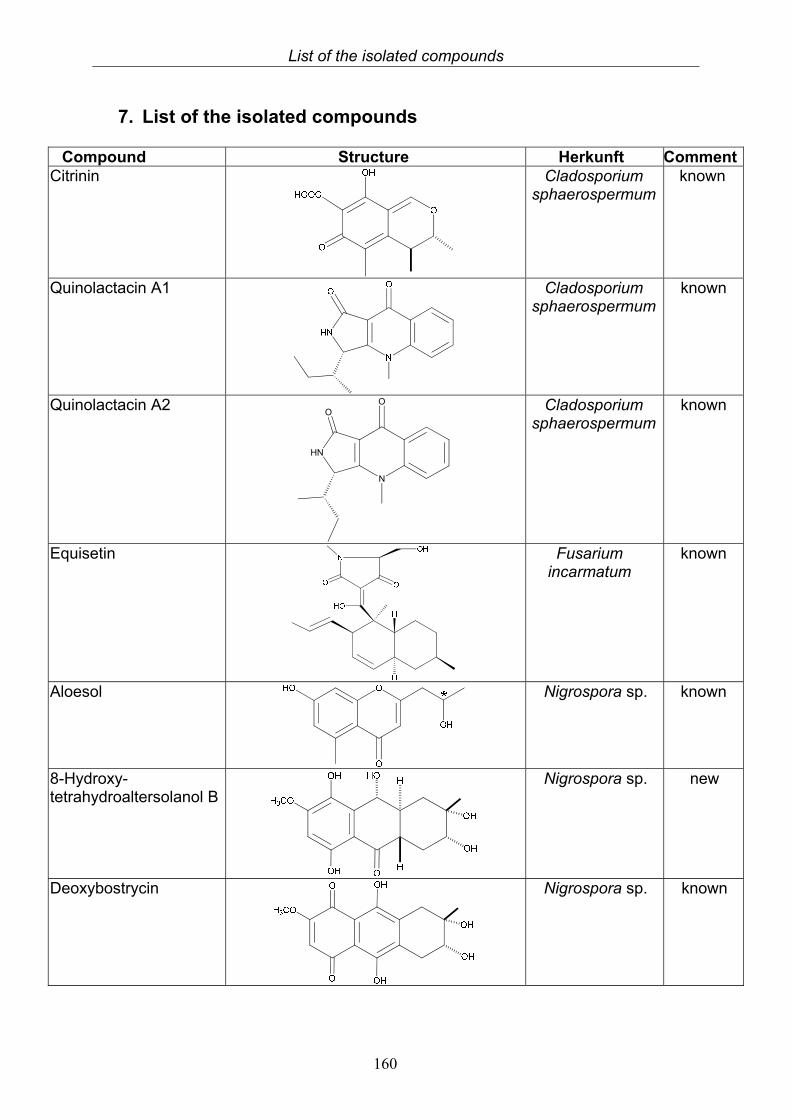
List of the isolated compounds
160
7. List of the isolated compounds
Compound Structure Herkunft CommentCitrinin
Cladosporium sphaerospermum
known
Quinolactacin A1
Cladosporium sphaerospermum
known
Quinolactacin A2
N
HN
OO
Cladosporium sphaerospermum
known
Equisetin
Fusarium incarmatum
known
Aloesol
Nigrospora sp. known
8-Hydroxy-tetrahydroaltersolanol B
Nigrospora sp. new
Deoxybostrycin
Nigrospora sp. known
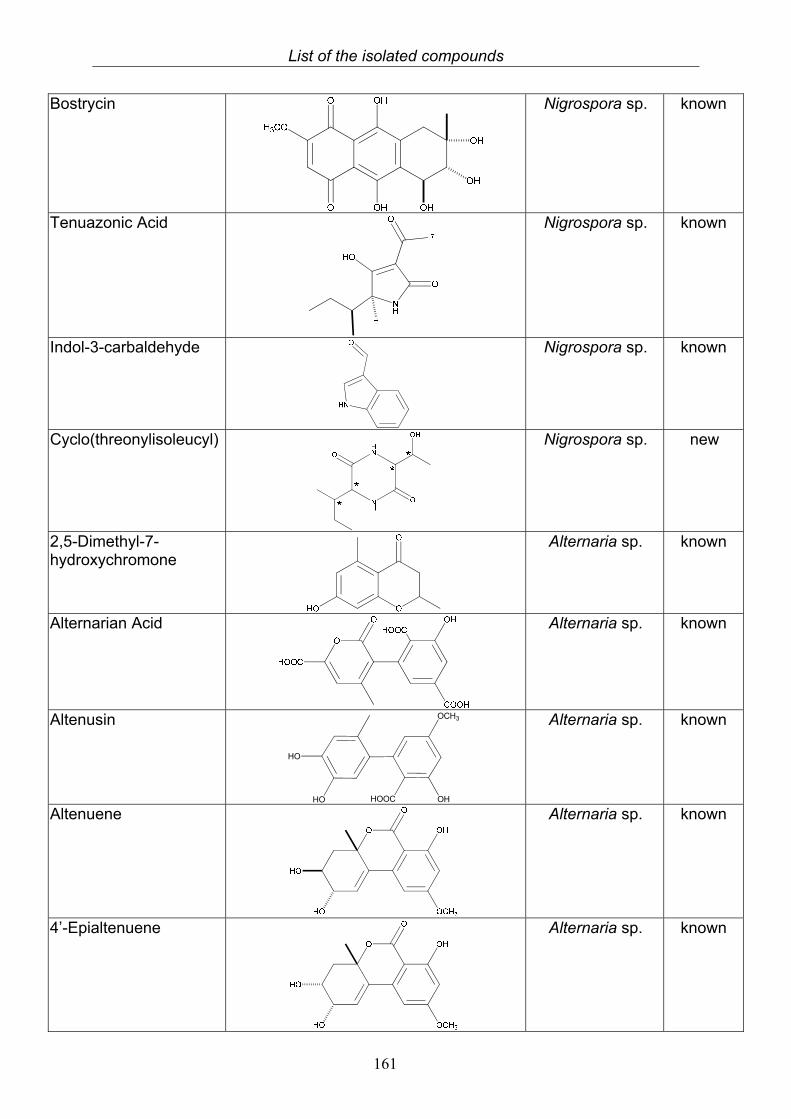
List of the isolated compounds
161
Bostrycin
Nigrospora sp. known
Tenuazonic Acid
Nigrospora sp. known
Indol-3-carbaldehyde
Nigrospora sp. known
Cyclo(threonylisoleucyl)
Nigrospora sp. new
2,5-Dimethyl-7-hydroxychromone
Alternaria sp. known
Alternarian Acid
Alternaria sp. known
Altenusin
HOOC OHHO
HO
OCH3
Alternaria sp. known
Altenuene
Alternaria sp. known
4’-Epialtenuene
Alternaria sp. known
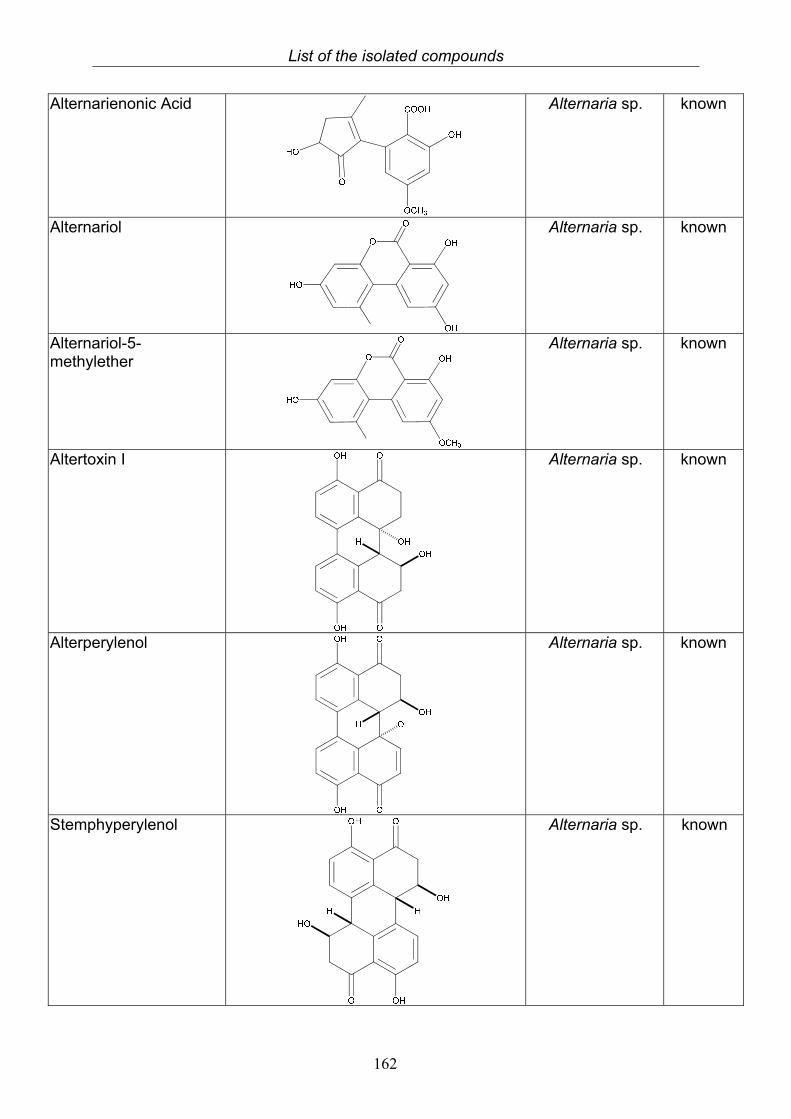
List of the isolated compounds
162
Alternarienonic Acid
Alternaria sp. known
Alternariol
Alternaria sp. known
Alternariol-5-methylether
Alternaria sp. known
Altertoxin I
Alternaria sp. known
Alterperylenol
Alternaria sp. known
Stemphyperylenol
Alternaria sp. known
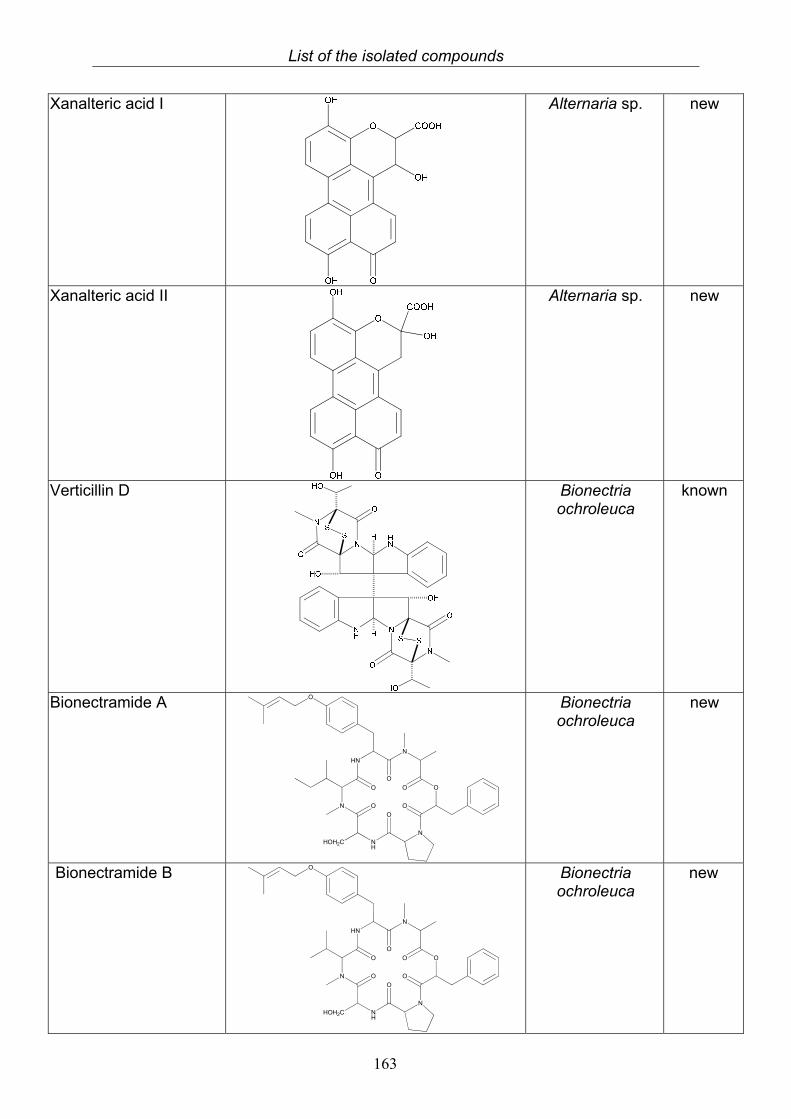
List of the isolated compounds
163
Xanalteric acid I
Alternaria sp. new
Xanalteric acid II
Alternaria sp. new
Verticillin D
Bionectria ochroleuca
known
Bionectramide A
N
HN
N
O
N
NH
O
O
O
O
O
O
HOH2C
O
Bionectria ochroleuca
new
Bionectramide B
N
HN
N
O
N
NH
O
O
O
O
O
O
HOH2C
O
Bionectria ochroleuca
new
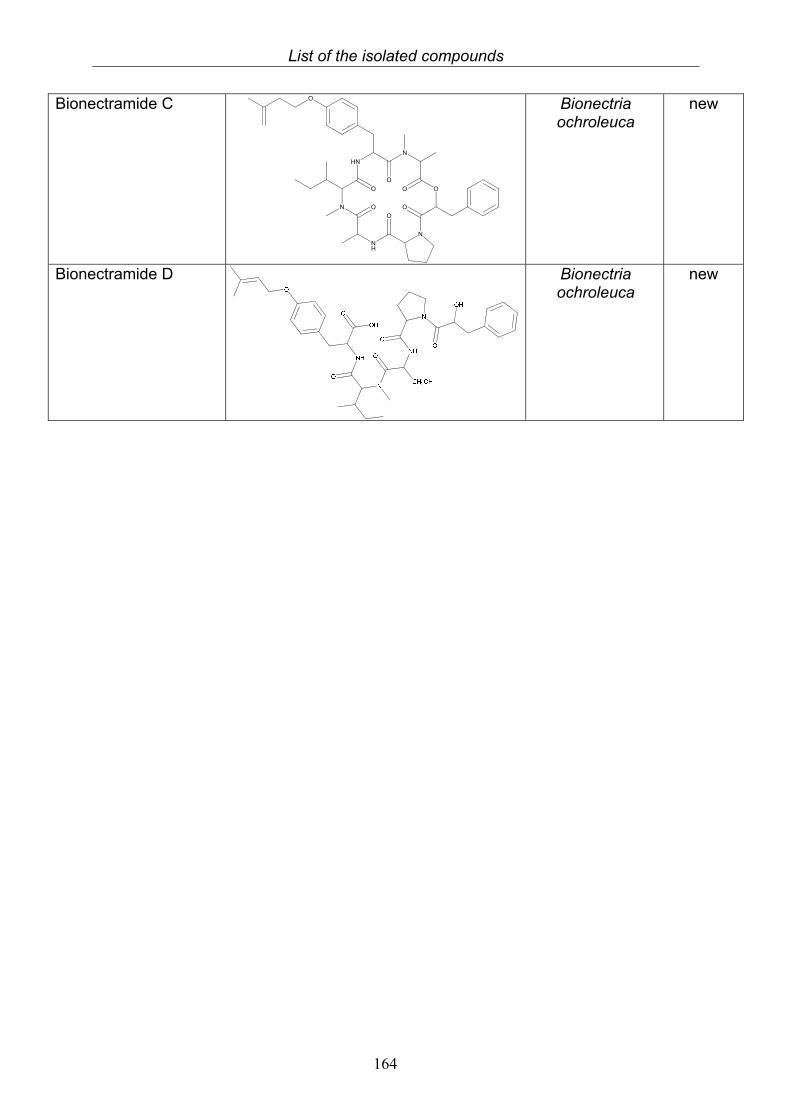
List of the isolated compounds
164
Bionectramide C
N
HN
N
O
N
NH
O
O
O
O
O
O
O
Bionectria ochroleuca
new
Bionectramide D Bionectria ochroleuca
new
References
165
8. References
Abell, C.; Garson, M. J.; Leeper, F. J.; Staunton, J. Biosynthesis of the fungal metabolites alternariol, mellein, rubrofusarin, and 6-methylsalicylic acid from CD3CO2H J. Chem. Soc., Chem. Commun. 17, 1011-1013 (1982).
Aly, A. H. Edrada-Ebel, R.; Wray, V.; Müller, W. E.; Kozytska, S.; Hentschel, U.; Proksch, P.; Ebel, R. Bioactive metabolites from the endophytic fungus Ampelomyces sp. isolated from the medicinal plant Urospermum picroides. Phytochemistry. 69(8) 1716-1725 (2008).
Aly, A. H. Edrada-Ebel, R.; Indriani, I. D.; Wray, V.; Müller, W. E.; Totzke, F.; Zirrgiebel, U.; Schächtele, C.; Kubbutat, M. H.; Lin, W. H.; Proksch, P.; Ebel, R. Cytotoxic metabolites from the fungal endophyte Alternaria sp. and their subsequent detection in its host plant Polygonum senegalense. J. Nat. Prod. 71, 972-980 (2008).
Anada, K.; Sridhar, K. R. Diversity of endophytic fungi in the roots f mangrove species on the west coast of India, Can. J. Microbiol. 48, 871-878 (2002).
Arnold, A. E. Understanding the diversity of foliar endophytic fungi: progress, challenges, and frontiers. Fungal Biology Reviews 2, 51-66 (2007).
Arnone, A.; Nasini, G. Secondary Mould Metabolites. Part 16. Stemphyltoxins, new Reduced Perylenequinone Metabolites from Stemphylium botryosum var. Lactucum. J. Chem. Soc. Perkin. Trans. I, 525-530 (1986).
Ashour, M.; Edrada-Ebel, R. A.; Ebel R.; Wray, V.; Waetjen, W.; Padmakumar, K.; Mueller, W. E. G.; Lin, W.; Proksch, P. Kahalalide derivatives from the Indian sacoglossan mollusk Elysia grandifolia. J. Nat. Prod. 69, 1547-1553 (2006).
Ayar, W. A.; Racock, J. S. The metabolites of Talaromyces flavus: Part 1. Metabolites of the organic extracts. Can. J. Chem. 68, 2085-2094 (1990).
Bacon, C. W.; White, J. F. Microbial Endophytes, Marcel Dekker inc. New York (2000).
Bandaranayake, W. M. Traditional and medicinal uses of mangroves. Mangroves and Salt Marshes 2, 133-148, (1998).
Bandaranayake, W. M. Bioactivities, bioactive compounds and chemical constituents of mangrove plants Wetlands Ecology and Management 10, 421-452 (2002).
Barber, J.; Carter, R. H.; Garson, M. J.; Staunton, J. The biosynthesis of citrinin by Penicillium citrinum. J. Chem. Soc. Perkin Trans. I, 2577-2583 (1981).
Barelle, C. J.; Duncan, V. M.; Brown, A. J.; Gow, N. A.; Odds, F. C. Azole antifungals induce up-regulation of SAP4, SAP5 and SAP6 secreted proteinase genes in filamentous Candida albicans cells in vitro and in vivo. J. Antimicrob. Chemother. 61(2) 315-322 (2008).
Beagley, B.; Larsen, D. S.; Pritchard, R. G.; Stoodley, R. J. Revision of the absolute configuration of (–)-bostrycin. J. Chem. Soc. Chem. Commun., 17-19 (1989).
References
166
Bennett J. W.; Klich, M. Mycotoxins. Clin. Microbiol. Rev. 16(3), 497-516 (2003).
Bode, H. B.;. Bethe, B.; Höfs, R.; Zeeck, A. Big Effects from Small Changes: Possible Ways to Explore Nature's Chemical Diversity. ChemBioChem, 3, 619-627 (2002).
Bradburn, N.; Coker, R. D.; Blunden, G.; Turner, C. H.; Crabb, T. A. 5′-epialtenuene and neoaltenuene, dibenzo-α-pyrones from Alternaria alternata cultured on rice. Phytochemistry, 35, 665-669 (1994).
Brugger, E. M.; Wagner, J.; Schumacher, D. Mm.; Koch, K.; Podlech, J.; Metzler, M.; Lehmann, L. Mutagenicity of the mycotoxin alternariol in cultured mammalian cells. Toxicol Lett. 164(3), 221-230 (2006).
Cannon, P. F.; Simmons, C. M. Diversity and host preference of leaf endophytic fungi in the Iwokrama Forest Reserve, Guyana. Mycologia 94 (2), 210-220 (2002).
Carmichael, J.; DeGraff, W. G.; Gazdar, A. F.; Minna, J. D.; Mitchell, J. B. Evaluation of a tetrazolium-based semiautomated colorimetric assay: Assessment of radiosensitivity. Cancer Res. 1987 47, 943-946.
Chadwick, D. J.; Easton, I. W.; Johnstone, A. W. Fungal metabolites part 9. Isolation and x-ray structure determination of alternarian acid from Alternaria mali sp. Tetrahedron 40, 2451-2455 (1984).
Charudattan, R.; Rao, K. V. Bostrycin and 4-deoxybostrycin: two nonspecific phytotoxins produced by Alternaria eichhorniae. Appl. Environ. Microbiol. 43(4) 846–849 (1982).
Che, Q. M.; Akao, T.; Hattori, M.; Kobayashi, K.; Namba, T. Metabolism of aloesin and related compounds by human intestinal bacteria: A bacterial cleavage of the C-glucosyl bond and the subsequent reduction of the acetonyl side chain. Chem. Pharm. Bull. 39, 704-708 (1991).
Cheng, Z.; Pan, J.; Tang, W.; Chen, Q.; Lin, Y. Biodiversity and biotechnological potential of mangrove-associated fungi. J. Forest. Res. 20(1), 63-72 (2009).
Clark, B. A.; Capon, R. J.; Lacey, E.; Tennant, S.; Gill, J. H. Citrinin revisited: from monomers to dimers and beyond. Org. Biomol. Chem. 4, 1520-1528 (2006).
Coombe, R. G.; Jacobs, J. J.; Watson, T. R. Metbolites of some Alternaria species. The structures of altenusin and dehydroaltenusin. Aust. J. Chem., 23, 2342-2351 (1970).
Couce, A.; Blázquez, J. Side effects of antibiotics on genetic variability. FEMS. Microbiol. Rev. 33, 531-538 (2009).
Cuero, R.; Ouellet, T.; Yu, J.; Mogongwa, N. Metal ion enhancement of fungal growth, gene expression and aflatoxin synthesis in Aspergillus flavus: RT-PCR characterization. J. Appl. Microbiol. 94, 953–961 (2003).
Dale, J. A.; Mosher, H. S.; Nuclear magnetic resonance enantiomer reagents. Configural correlations via nuclear magnetic resonance chemical shifts of diastereometroc mandelate, O-mandelate and a-methoxy-a-trifluormethylphenylacetate(MPTA)esters. J. Am. Chem. Soc. 95(2), 512-519 (1973).
References
167
Dewick, P. M. Medicinal natural products: A biosynthetic approach. John Wiley & Sons Ltd., Chichester, England (2002).
Dasenbrock, J.; Simpson, T. J. Alternariol is not biosynthesised via Norlichexanthone. J. Chem. Soc., Chem. Commun. 1235-1236 (1987).
Ge, H. M.; Song, Y. C.; Shan, C. Y.; Ye, Y. H.; Tan, R. X. New and Cytotoxic anthraquinones from Pleospora sp. IFB-E006, an endophytic fungus in Imperata cylindrical. Planta Med. 71, 1063-1065 (2005).
Harada, K.; Kiyonga, F.; Mayuni, T.; Hibino, Y.; Suzuki, M.; Ikai, Y, Oka, H. A method using LCMS for determination of absolute configuration of constituent amino acids in peptide – advanced method. Tetrahedron Lett. 35, 1515-1518 (1995).
Hassan, E. H. A. Novel Natural Products from Endophytic Fungi of Egyptian Medicinal Plants – Chemical and Biological Characterization. Dissertation 2007.
Hiort, J. Neue Naturstoffe aus schwamm-assoziierten Pilzen des Mittelmeeres, Dissertation, 2002.
Hirota, M.; Mehta, A.; Yoneyama, K.; Kitabatake, N. A major decomposition product, citrinin H2, from citrinin on heating with moisture. Biosci. Biotechnol. Biochem. 66, 206-210 (2002).
Hradil, C. M.; Hallock, Y. F.; Clardy, J.;. Kenfield, D. S.; Strobel, G. Phytotoxins from Alternaria cassiae. Phytochemistry 28, 73-75 (1989).
Huang, H.; She, Z.; Lin, Y.; Vrijmoed, L. L. P.; Lin W. Cyclic peptides from an endophytic fungus obtained from a mangrove leaf (Kandelia candel). J. Nat. Prod. 70, 1696-1699 (2007).
Isaka, M.; Palasarn, S.; Lapanun, S.; Sriklung, K. Paecilodepsipeptide A, an antimalarial and antitumor Cyclohexadepsipeptide from the insect pathogenic fungus Paecilomyces cinnamomeus BCC 9616. J. Nat. Prod. 70, 675-678 (2007).
Jiao, P.; Gloer, J. B.; Campbell, J.; Shearer, C. A. Altenuene Derivatives from an Unidentified Freshwater Fungus in the Family Tubeufiaceae. J. Nat. Prod., 69, 612-615 (2006).
Kashiwada, Y.; Nonaka, G.-I.; Nishioka, I. Studies on Rhubarb (Rhei rhizoma). V. Isolation and characterization of chromone and chromanone derivatives. Chem. Pharm. Bull. 32(9), 3493-3500 (1984).
Keller, N. P.; Turner, G.; Bennett, J. W Fungal secondary metabolism - from biochemistry to genomics. Nat. Rev. Microbiol., 3(12), 937-947 (2005).
Kelly, T. R.; Saha, J. K.; Whittle, R. R. Bostrycin: structure correction and synthesis. J. Org. Chem. 50(20) 3679–3685 (1985).
Kim, D. H.; Shin, J.; Kwon, H. J. Psammaplin A is a natural prodrug that inhibits class I histone deacetylase. Exp. Mol. Med., 39(1), 47-55 (2007).
References
168
Kim, W. G.; Song, N. K., Yoo, I. D. Quinolactacins A1 and A2, new acetylcholinesterase inhibitors from Penicillium citrinum. J. Antibiot. 54, 831-835 (2001).
Kimura, Y.; Kozawa, M.; Baba, K.; Hata, K. New Constitutents of Roots of Polygonum cuspidatum Planta Medica 48, 164-169 (1983).
Kleinkauf, H.; Döhren von, H. Nonribosomal biosynthesis of peptide antibiotics. Eur. J. Biochem. 192, 1-15 (1990).
Knight, V.; Sanglier, J. J.; DiTullio, D.; Braccili, S.; Bonner, P.; Waters, J.; Hughes, D.; Zhang, L. Diversifying microbial natural products for drug discovery. Appl. Microbiol. Biotechnol. 62(5-6), 446-458 (2003).
Kobayashi, D. Y., Crouch, J.A. Bacterial/Fungal Interactions: From Pathogens to Mutualistic Endosymbionts. Annu. Rev. Phytopathol. 47, 63-82 (2009).
Kour, A.; Shawl, A. S.; Rehman, S.; Sultan, S.; Qazi, P. H.; Suden, P.; Khajuria, R. K.; Verma, V. Isolation and identification of an endophytic strain of Fusarium oxysporum producing podophyllotoxin from Juniperus recurva. 24, 1115-1121 (2008).
Krause, M.; Lindemann, A.; Glinski, M.; Hornbogen, T.; Bonse, G.; Jeschke, P.;, Thielking, G.;, Gau, W.; Kleinkauf, H.; Zocher, R. Directed biosynthesis of new enniatins. J. Antibiot. 54, 797-804 (2001).
Kusari, S.; Lamshöft, M.; Zühlke, S.; Spiteller, M. An endophytic fungus from Hypericum perforatum that produces hypericin. J. Nat. Prod. 71(2), 159-162 (2008).
Lehmann, L.; Wagner, J.; Metzler, M. Estrogenic and clastogenic potential of the mycotoxin alternariol in cultured mammalian cells. Food Chem Toxicol. 44(3):398-408 (2006).
Li, D. L.; Li, X. M.; Li, T. G.; Dang, H. Y.; Proksch, P.; Wang, B. G.; Benzaldehyde derivatives from Eurotium rubrum, an endophytic fungus derived from the mangrove plant Hibiscus tiliaceus. Chem. Pharm. Bull. 56(9), 1282-1285 (2008).
Li, J. Y.; Strobel, G.; Harper, J.; Lobkovsky, E.; Clardy, J. Cryptocin, a potent tetramic acid antimycotic from the endophytic fungus Cryptosporiopsis cf. quercina. Org. Lett. 2(6) 767-770 (2000).
Li, M. Y.; Xiao, Q.; Pan, J. Y.; Wu, J. Natural products from semi-mangrove flora: source, chemistry and bioactivities. Nat. Prod. Rep. 26(2), 281-298 (2009).
Lin, Z.; Zhu, T.; Fang, Y.; Gu, Q.; Zhu, W. Polyketides from Penicillium sp. JP-1, an endophytic fungus associated with the mangrove plant Aegiceras corniculatum. Phytochemistry. 69(5), 1273-1278 (2008).
Linares, J. F.; Gustafsson, I.; Baquero, F.; Martinez, J. L. Antibiotics as intermicrobial signaling agents instead of weapons. Proc. Natl. Acad. Sci. U. S. A. 103, 19484-19489 (2006).
Macintosh, D. J.; Ashton, E. C. A review of mangrove biodiversity conversation and management.http://mit.biology.au.dk/cenTER/MCB_Files/2002_Review_WB_MCB_Final.pdf (2002).
References
169
Marfey, P. Determination of D-amino acids. Part II: Use of a bifunctional reagent 1,5-difluoro-2,4-dinitrobenzene. Carlsberg Res.Com. 49, 591–596, (1984).
McPhail, A. T.; Miller, R. W.; Harvan, D.; Pero, R. W. X-Ray crystal structure revision for the fungal metabolite (±)-altenuene. J. Chem. Soc., Chem. Commun., 682 (1973).
Mitchell, T. K.; Chilton, W. S.; Daub, M. E. Biodegradation of the Polyketide Toxin Cercosporin. Appl. Environ. Microbiol. 68, 4173-4181 (2002).
Mitchell, T. K.; Alejos-Gonzales, F.; Gracz, H. S.; Danehower, D. A.; Daub, M. E.; Chilton, W. S. Xanosporic acid, an intermediate in bacterial degradation of the fungal phototoxin cercosporin. Phytochemistry 62, 723-732 (2003).
Mitova, M. I.; Lang, G.; Wiese, J.; Imhoff, J. F. Subinhibitory concentrations of antibiotics induce phenazine production in a marine Streptomyces sp. J. Nat. Prod. 71(5), 824-827 (2008).
Nakanishi, S.; Toki, S.; Saitoh, Y.; Tsukuda, E.; Kawahara,K.; Ando, K.; Matsuda, Y. Isolation of Myosin Light Chain Kinase Inhibitors from Microorganisms : Dehydroaltenusin, Altenusin, Atrovenetinone, and Cyclooctasulfur. Biosci. Biotech. Biochem., 59, 1333-1335 (1995).
Noda T, Take T, Watanabe T, Abe J. The structure of bostrycin. Tetrahedron 26(5) 1339-1346 (1970).
Okamura, K.; Mimura, K.; Haraguchi, H.; Shingu, K.;Miyahara, K.;Yagi, A. Altersolanol-related compounds from the culture liquid of Alternaria solani. Phytochemistry 42, 77-80 (1996).
Okubo, A.; Yamazaki, S.; Fuwa, K. Biosynthesis of cercosporin. Agr. Biol. Chem. 39, 1173-1175 (1975).
Okuno, T.; Natsume, I.; Sawai, K.; Sawamura, K.; Furusaki, A.; Matsumoto, T. Structure of antifungal and phytotoxic pigments produced by alternaria sps. Tetrahedron Lett. 24 (50), 5653-5656 (1983).
Pang, K.-L.; Vrijmoed, L. L. P.; Goh, T. K.; Plaingam, N.; Jones, G. E. B. Fungal endophytes associated with Kandelia candel (Rhizophoraceae) in Mai Po Nature Reserve, Hong Kong. Botanica Marina 51, 171-178 (2008).
Partida-Martinez, L. P.; Hertweck, C. Pathogenic fungus harbours endosymbiotic bacteria for toxin production. Nature 437, 884-888 (2005).
Partida-Martinez, L. P.; Bandemer, S.; Ruechel, R.; Dannaoui, E.; Hertweck, C. Lack of evidence of endosymbiotic toxin-producing bacteria in clinical Rhizopus isolates Mycoses 51, 266–269 (2008).
Pazin, M. J.; Kadonaga, J. T. What's up and down with histone deacetylation and transcription? Cell. 89(3), 325-328 (1997).
Pero, R. W.; Posner, H.; Blois, M.; Harvan, D.; Spalding, J. W. Toxicity of metabolites produced by the "Alternaria". Environ. Health Perspect. 4, 87-94 (1973).
References
170
Phiel, C. J.; Zhang, F.; Huang, E. Y.; Guenther, M. G.; Lazar, M. A.; Klein, P. S. Histone deacetylase is a direct target of valproic acid, a potent anticonvulsant, mood stabilizer, and teratogen. J. Biol. Chem. 276, 36734-3641 (2001).
Phillips, N. J.; Goodwin, J. T.; Fraiman, A.; Cole, R. J.; Lynn, D. G. Characterization of the Fusarium toxin equisetin: the use of phenylboronates in structure assignment. J. Am. Chem. Soc. 111, 8223–8231 (1989).
Puri, S. C.; Verma, V.; Amna, T.; Qazi, G. N.; Spiteller, M. An endophytic fungus from Nothapodytes foetida that produces camptothecin. J Nat Prod. 68(12), 1717-1719 (2005).
Puri, S. C.; Nazir, A.; Chawla, R.; Arora, R.; Riyaz-Ul-Hasan, S.; Amna, T.; Ahmed, B.; Verma, V.; Singh, S.; Sagar, R.; Sharma, A.; Kumar, R.; Sharma, R. K.; Qazi, G. N. The endophytic fungus Trametes hirsuta as a novel alternative source of podophyllotoxin and related aryl tetralin lignans. J. Biotechnol. 122(4) 494-510 (2006).
Raistrick, H.; Stickings, C. E.;. Thomas, R. Studies in the biochemistry of micro-organisms. 90. Alternariol and alternariol monomethyl ether, metabolic products of Alternaria tenuis. Biochem. J., 55, 421-433 (1953).
Robeson, D.; Strobel, G.; Matusumoto, G. K.; Fisher, E. L.; H. Chen, M. H.; Clardy, J. Alteichin: an unusual phytotoxin from Alternaria eichorniae, a fungal pathogen of water hyacinth. Experimentia 40, 1248-1250 (1984).
Rodriguez, R. J.; White, J. F. Jr.; Arnold, A. E.; Redman, R. S. Fungal endophytes: diversity and functional roles. New Phytol. 182(2), 314-30 (2009).
Rosett, T.; Sankhala, R. H.; Stickings, C. E.; Taylor, M. E. U.; Thomas, R. Biochem. J. 67, 390 (1959).
Royles, B.J.L. Naturally occuring tetramic acids: structure, isolation and synthesis. Chem. Rev., 95, 1981-2001 (1995).
Sasaki, T.; Takahashi, S.; Uchida, K.; Funayama, S.; Kainosho, M.; Nakagawa, A. Biosynthesis of Quinolactacin A, a TNF Production Inhibitor. J. Antibiot. 59, 418-427 (2006).
Schlörke, O. Isolierung, Strukturaufklärung und Biosynthese von Sekundärmetaboliten endophytischer Pilze aus Algen und Pflanzen mariner Habitate. Dissertation Göttingen, http://webdoc.sub.gwdg.de/diss/2005/schloerke/schloerke.pdf 2005.
Segura-Pacheco, B.; Avalos, B.; Rangel, E.; Velazquez, D.; Cabrera, G. HDAC inhibitor valproic acid upregulates CAR in vitro and in vivo. Genet. Vaccines. Ther. 5, 10 (2007).
Sengputa, A.; Chaudhuri, S. Arbuscular mycorrhizal relations of mangrove plant community at the Ganges river estuary in India. Mycorrhiza 12, 169-174 (2002).
Shwab, E. K.; Keller, N. P. Regulation of secondary metabolite production in filamentous ascomycetes. Mycol. Res. 112, 225-230 (2008).
References
171
Sims, J. W.; Fillmore, J. P,; Warner, D. D.; Schmidt, E. W. Equisetin biosynthesis in Fusarium heterosporum. Chem. Commun. 14, 186-188 (2005).
Stack, M. E.; Mazzola, E. P.; Page, S. W.; Pohland, A. E.; Highet, R. J.; Tempesta, M. S.; Corley D. G. Mutagenic Perylenequinone Metabolites of Alternaria alternata: Altertoxins I, II, and III. J. Nat. Prod. 49, 866–871(1986).
Stevens, K. L.; Badar-Ud-Din, Ashfaq Ahmad, A.; Ahmad, M. The antibiotic bostrycin from Alternaria eichhorniae. Phytochemistry 18, 1579-1580 (1979).
Stickings, C. E. Studies in the biochemistry of micro-organisms. 106. Metabolites of Alternaria tenuis auct.: the structure of tenuazonic acid. Biochem. J. 72(2), 332-340 (1959).
Stickings, C. E.; Townsend, R. J. Studies in the biochemistry of micro-organisms. 108. Metabolites of Alternaria tenuis Auct.: the biosynthesis of tenuazonic acid. Biochem. J. 78(2), 412-418 (1961).
Stierle, A.; Cardellina, J. H.; Strobel, G. Phytotoxins from Alternaria alternata, a pathogen of spotted knapweed. J. Nat. Prod. 52, 42-47 (1989).
Stierle, A.; Strobel, G.; Stierle, D. Taxol and taxane production by Taxomyces andreanae, an endophytic fungus of Pacific yew. Science 260(5105), 214-6 (1993).
Stoessel, A.; Stothers, J. B. Tetrahydroaltersolanol B, a hexahyroxoanthrol from Alternaria solani. Can. J. Chem. 61, 378–382 (1983).
Stoessel, A.; Unwin, C. H.; Stothers, J. B. On the biosynthesis of some polyketide metabolites in Alternaria solani: 13C and 'Hmr studies. Can. J. Chem. 61, 372-377 (1983).
Strobel. G.; Daisy, B. Bioprospecting for microbial endophytes and their natural products. Microbiol. Mol. Biol. Rev. 67(4) 491-502 (2003).
Strobel, G.; Daisy, B.; Castillo, U.; Harper, J. Natural products from endophytic microorganisms. J. Nat. Prod. 67(2) 257-268 (2004).
Takahashi, S.; Kakinuma, N.; Iwai, H.; Yanagisawa, T.; Nagai, K.; Suzuki, K.; Tokunaga, T, Nakagawa, A. Quinolactacin A, B and C: novel quinolone compounds from Penilillium sp. EPF-6, physico.chemical properties and structure elucidation. J. Antibiot. 53, 1252-1256 (2000).
Taylor, T. V.; Mitchell, T. K.; Daub, M. E. An oxidoreductase is involved in cercosporin degradation by the bacterium Xanthomonas campestris pv. Zinniae. Appl. Environ. Microbiol. 72, 6070-6078 (2006).
Teuscher, F. Bioaktie Naturstoffe aus marinen endophytischen und schwammassoziierten Pilzen des Indischen und Pazifischen Ozeans. Dissertation, 2005.
Vesonder, R. F.; Tjarks, L. W.; Rohwedder, W. K.; Burmeister, H. R.; Laugal, J. A. Equisetin, an antibiotic from Fusarium equiseti NRRL 5537, identified as a derivative of N-methyl-2,4-pyrollidone. J. Antibiot. 32, 759-761 (1979).
References
172
Wang, S.; Li, X. M.; Teuscher, F.; Li, D. L.; Diesel, A.; Ebel, R.; Proksch, P.; Wang, B. G. Chaetopyranin, a benzaldehyde derivative, and other related metabolites from Chaetomium globosum, an endophytic fungus derived from the marine red alga Polysiphonia urceolata. J. Nat. Prod. 69, 1622-1625 (2006).
Weber, D.; Sterner, O.; Anke, T.; Gorzalczancy, S.; Martino, V.; Acevedo, C. Phomol, a new antiinflammatory metabolite from an endophyte of the medicinal plant Erythrina crista-galli. J. Antibiot. 57(9), 559-563 (2004).
Williams, R. B.; Henrikson, J. C.; Hoover, A. R.; Lee, A. E.; Cichewicz; R. H. Epigenetic remodeling of the fungal secondary metabolome. Org. Biomol. Chem. 6, 1895-1897 (2008).
Wyllie, J. CA 40, 2190 (1946)
Xu, J.; Nakazawa, T.; Ukai, K.; Kobayashi, H.; Mangindaan, R. E.; Wewengkang, D. S.; Rotinsulu, H.; Namikoshi, M. Tetrahydrobostrycin and 1-deoxytetrahydrobostrycin, two new hexahydroanthrone derivatives, from a marine-derived fungus Aspergillus sp. J Antibiot.. 61(7) 415-419 (2008).
Zhang, X.; Jiang, W.; Sui, J. Concise Enantioselective Syntheses of Quinolactacins A and B through Alternative Winterfeldt Oxidation. J. Org. Chem. 68, 4523-4526 (2003).
Zhang, P.; Zhou, P., P.; Jiang, C.; Yu. H,: Yu L. J. Screening of Taxol-producing fungi based on PCR amplification. Biotechnol. Lett. 30(12), 2119-2123 (2008).
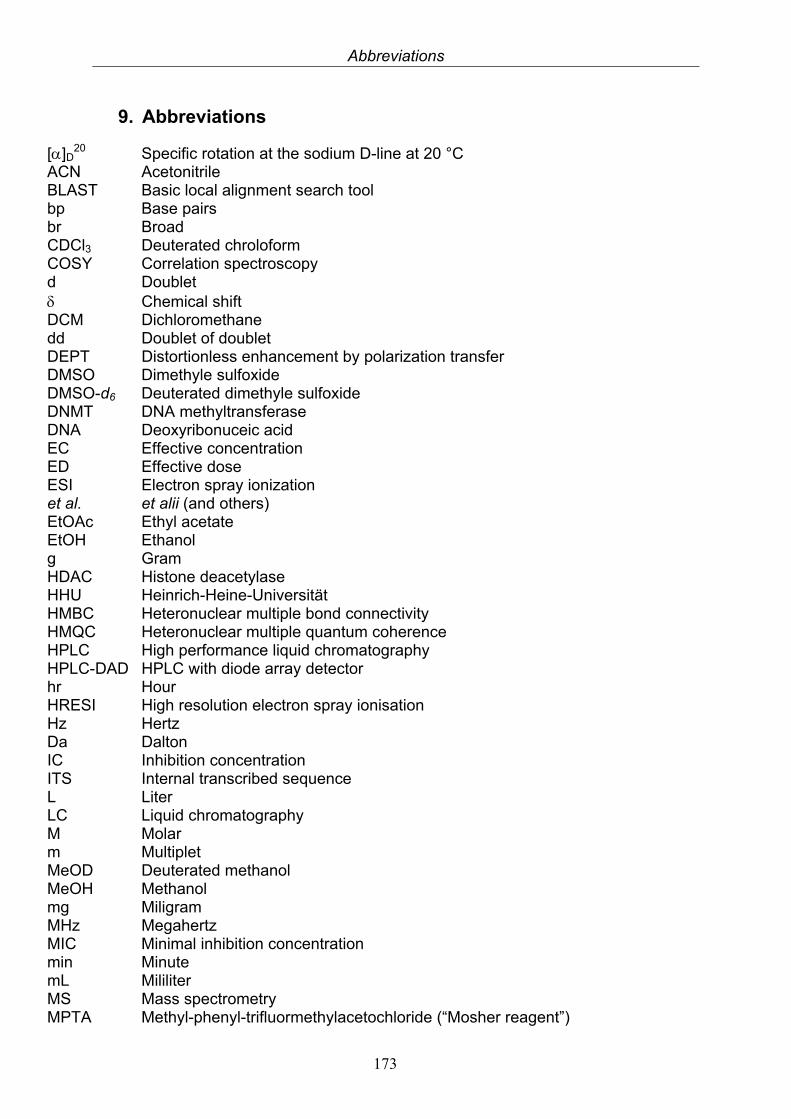
Abbreviations
173
9. Abbreviations
[]D20 Specific rotation at the sodium D-line at 20 °C
ACN Acetonitrile BLAST Basic local alignment search tool bp Base pairs br Broad CDCl3 Deuterated chroloform COSY Correlation spectroscopy d Doublet Chemical shift DCM Dichloromethane dd Doublet of doublet DEPT Distortionless enhancement by polarization transfer DMSO Dimethyle sulfoxide DMSO-d6 Deuterated dimethyle sulfoxide DNMT DNA methyltransferase DNA Deoxyribonuceic acid EC Effective concentration ED Effective dose ESI Electron spray ionization et al. et alii (and others) EtOAc Ethyl acetate EtOH Ethanol g Gram HDAC Histone deacetylase HHU Heinrich-Heine-Universität HMBC Heteronuclear multiple bond connectivity HMQC Heteronuclear multiple quantum coherence HPLC High performance liquid chromatography HPLC-DAD HPLC with diode array detector hr Hour HRESI High resolution electron spray ionisation Hz Hertz Da Dalton IC Inhibition concentration ITS Internal transcribed sequence L Liter LC Liquid chromatography M Molar m Multiplet MeOD Deuterated methanol MeOH Methanol mg Miligram MHz Megahertz MIC Minimal inhibition concentration min Minute mL Mililiter MS Mass spectrometry MPTA Methyl-phenyl-trifluormethylacetochloride (“Mosher reagent”)
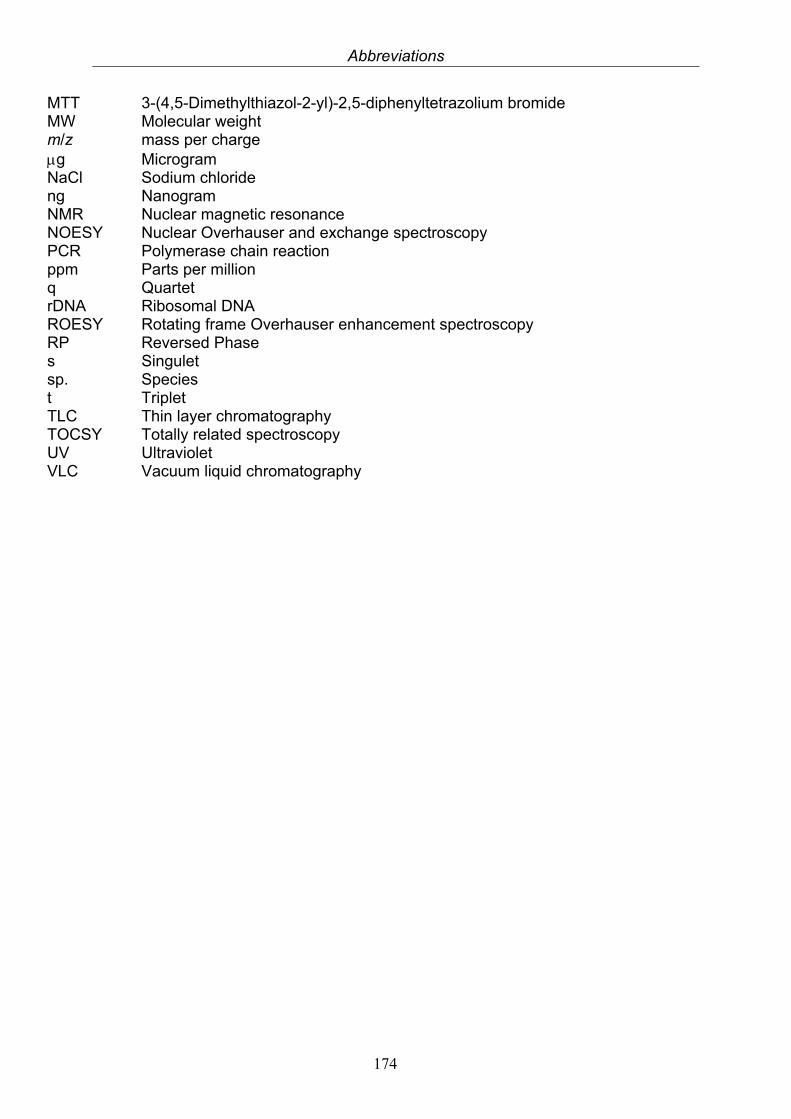
Abbreviations
174
MTT 3-(4,5-Dimethylthiazol-2-yl)-2,5-diphenyltetrazolium bromide MW Molecular weight m/z mass per charge g Microgram NaCl Sodium chloride ng Nanogram NMR Nuclear magnetic resonance NOESY Nuclear Overhauser and exchange spectroscopy PCR Polymerase chain reaction ppm Parts per million q Quartet rDNA Ribosomal DNA ROESY Rotating frame Overhauser enhancement spectroscopy RP Reversed Phase s Singulet sp. Species t Triplet TLC Thin layer chromatography TOCSY Totally related spectroscopy UV Ultraviolet VLC Vacuum liquid chromatography
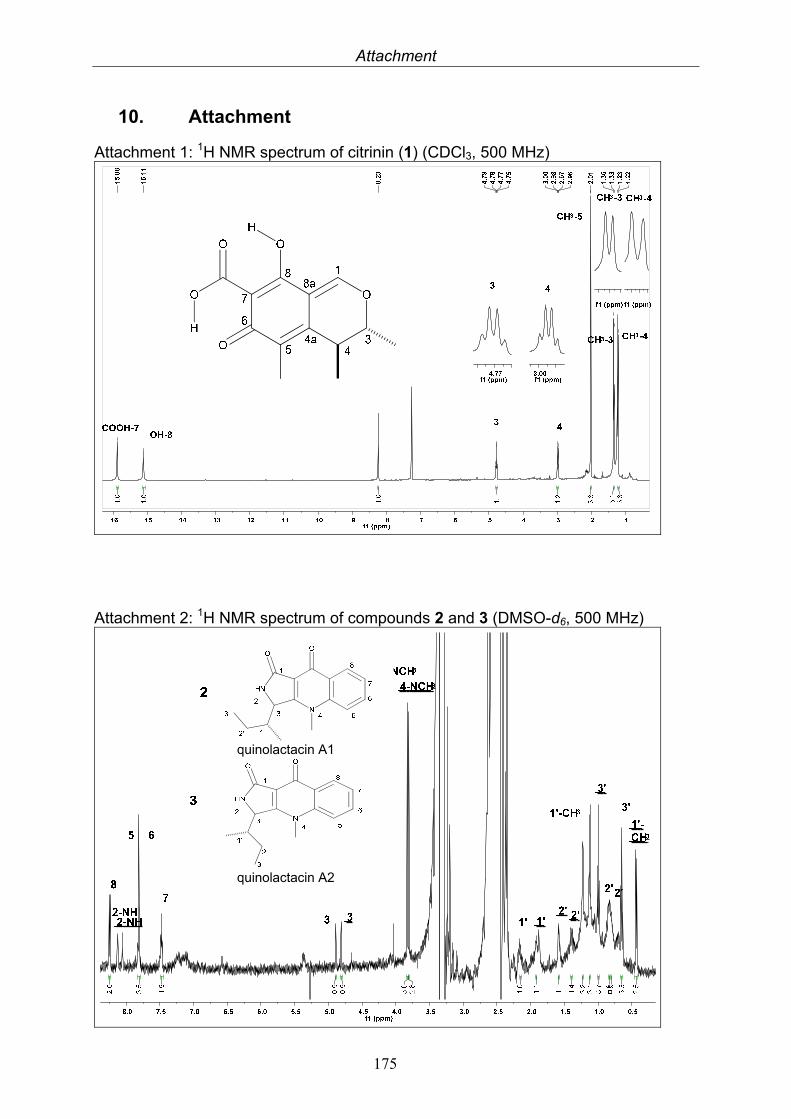
Attachment
175
10. Attachment
Attachment 1: 1H NMR spectrum of citrinin (1) (CDCl3, 500 MHz)
Attachment 2: 1H NMR spectrum of compounds 2 and 3 (DMSO-d6, 500 MHz)
quinolactacin A1
quinolactacin A2
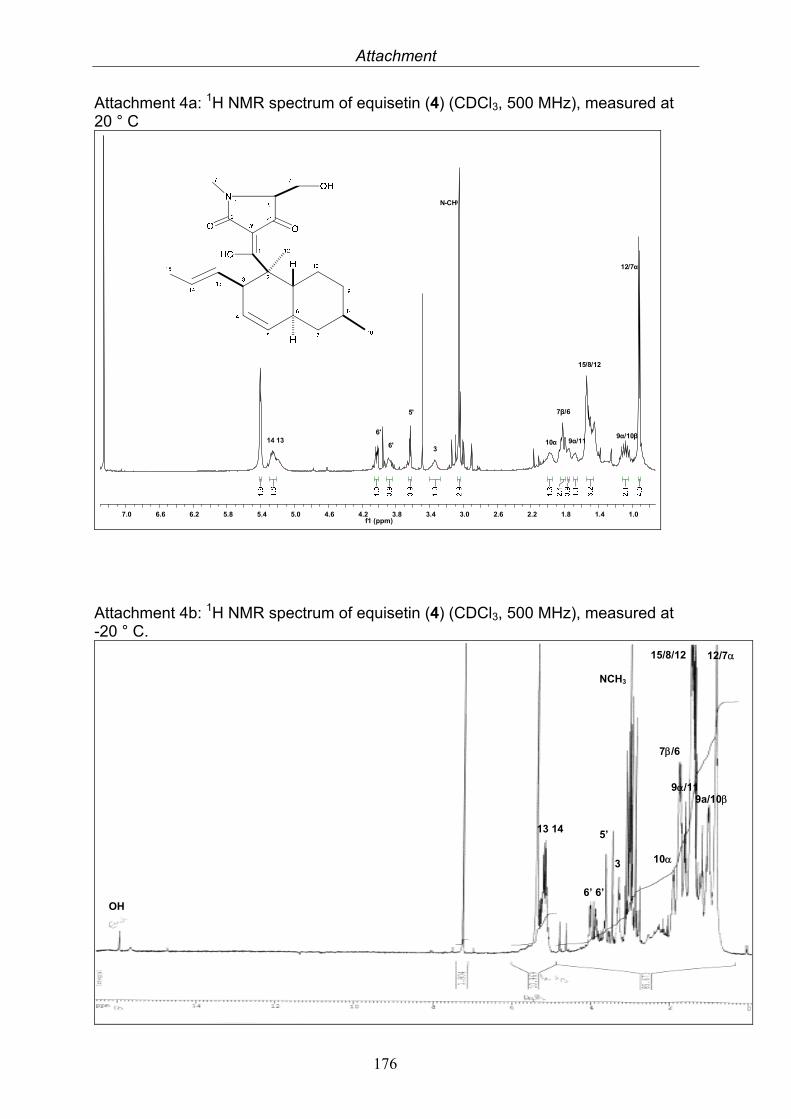
Attachment
176
Attachment 4a: 1H NMR spectrum of equisetin (4) (CDCl3, 500 MHz), measured at 20 ° C
1.01.41.82.22.63.03.43.84.24.65.05.45.86.26.67.0f1 (ppm)
6'
4/5
5'
10α
7β/6
N-CH3
14 136'
9α/11
15/8/12
9α/10β
12/7α
3
Attachment 4b: 1H NMR spectrum of equisetin (4) (CDCl3, 500 MHz), measured at -20 ° C.
13 14 5’
6’ 6’
NCH3
10 3
9a/10
7/6
9/11
15/8/12 12/7
OH
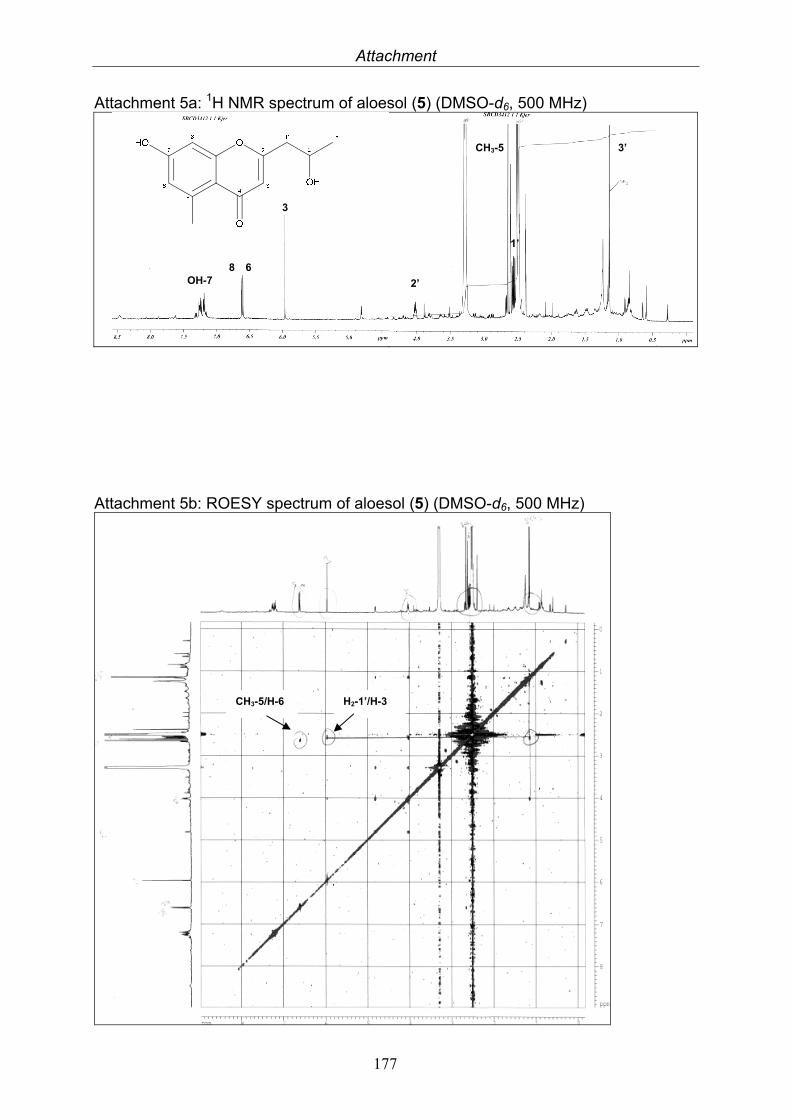
Attachment
177
Attachment 5a: 1H NMR spectrum of aloesol (5) (DMSO-d6, 500 MHz)
Attachment 5b: ROESY spectrum of aloesol (5) (DMSO-d6, 500 MHz)
3
8 6 OH-7
1’
3’
2’
CH3-5
CH3-5/H-6 H2-1’/H-3
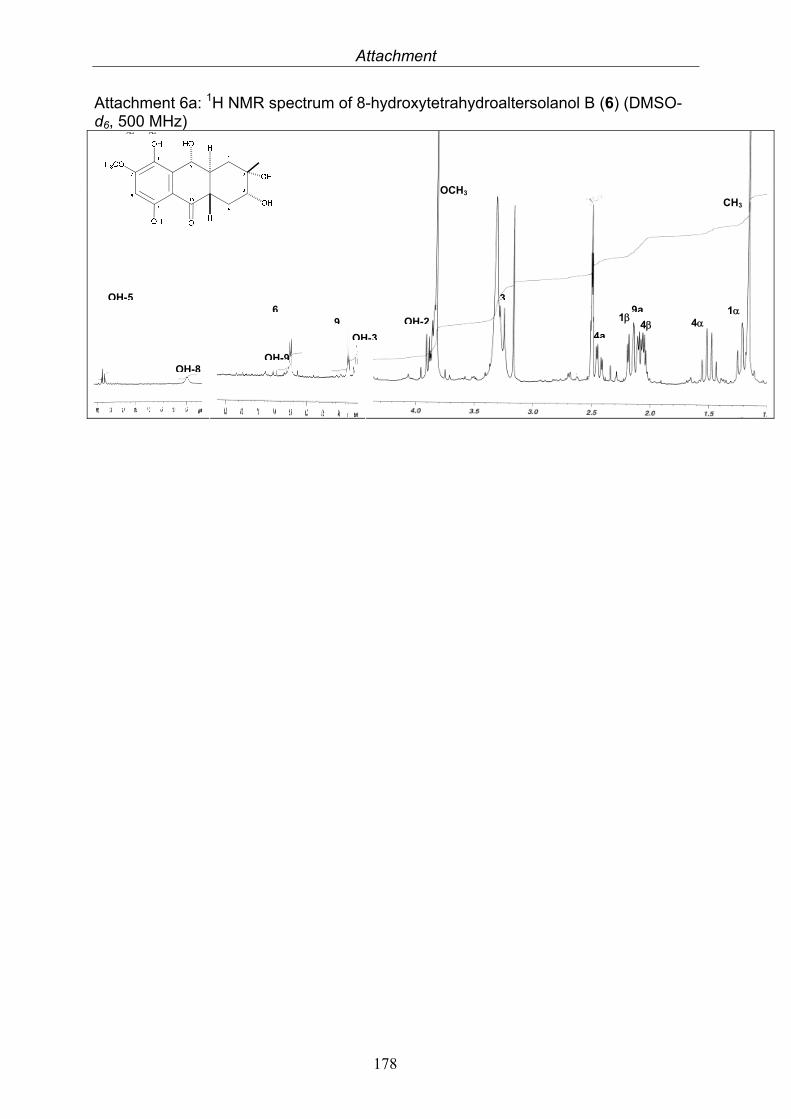
Attachment
178
Attachment 6a: 1H NMR spectrum of 8-hydroxytetrahydroaltersolanol B (6) (DMSO-d6, 500 MHz)
OH
H3CO
OH O
OH
OH
OH1
2
34
4a
9a
1056
78 9
OH-5
OH-8
6
OH-9
9
OH-3
3
4a4
CH3
1 9a
4 1
OCH3
OH-2
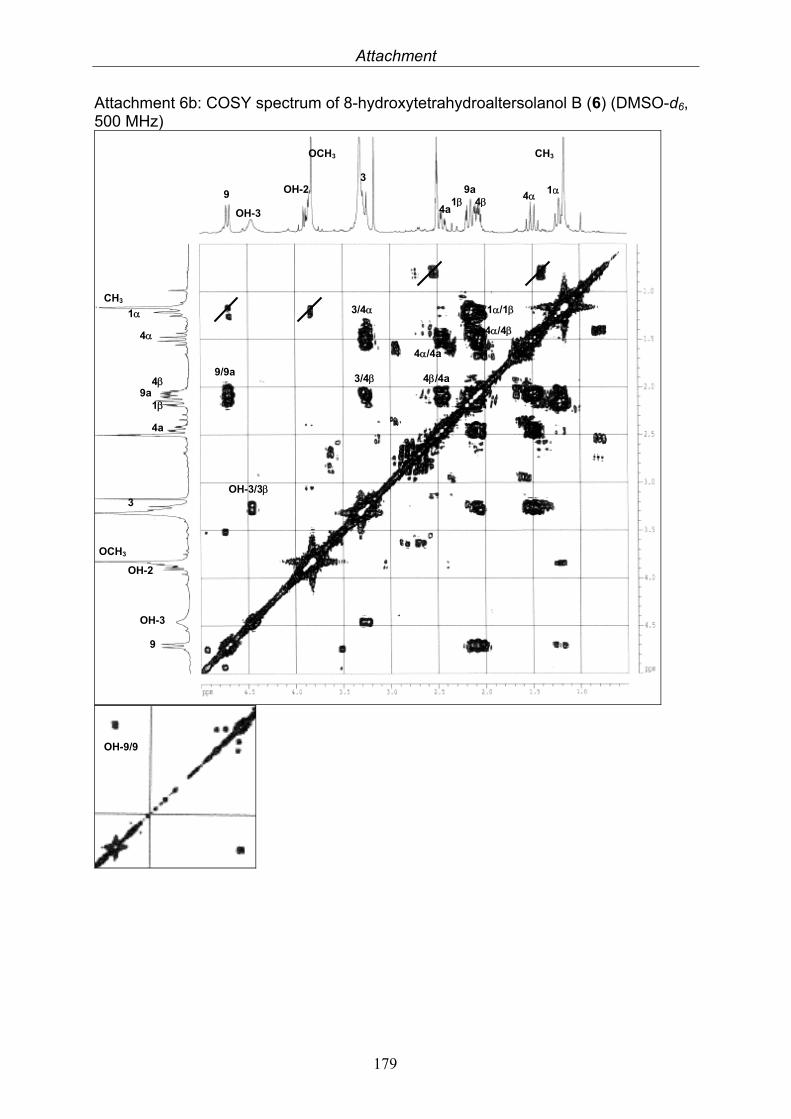
Attachment
179
Attachment 6b: COSY spectrum of 8-hydroxytetrahydroaltersolanol B (6) (DMSO-d6, 500 MHz)
4
1
9/9a 3/4
4
OH-3/3
1 1/1
4/4
4/4a
3/4
4/4a 9a
4a
3
9
OH-3
OH-2
CH3
OCH3
OH-9/9
CH3 OCH3
1 4
4 1 9a
4a
OH-2
OH-3
9
3
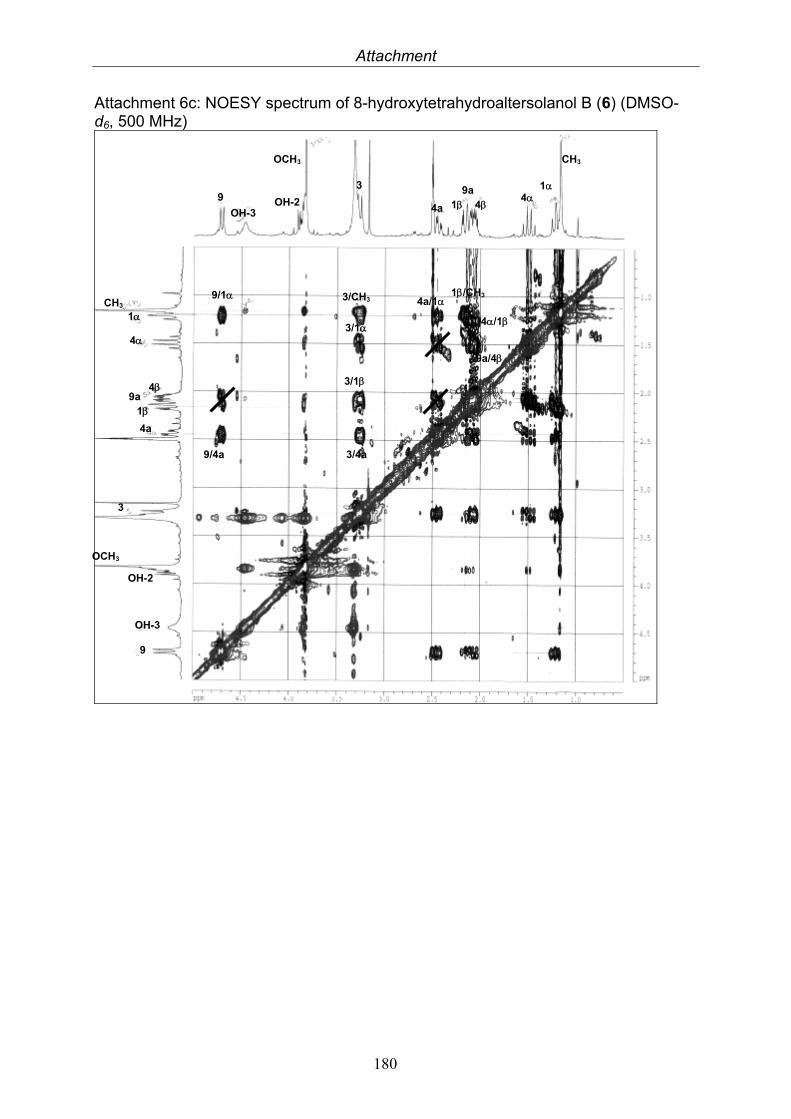
Attachment
180
Attachment 6c: NOESY spectrum of 8-hydroxytetrahydroaltersolanol B (6) (DMSO-d6, 500 MHz)
9/1
3/1
4a/1
9/4a
3/CH3
3/1
3/4a
1/CH3
4/1
9a/4
9
9
OH-3
OH-3
OH-2
OH-2
OCH3
OCH3
3
3
4a
4a
4
4
1
1
CH3
CH3
4
4
1
1 9a
9a

Attachment
181
Attachment 6d: HMBC spectrum of 8-hydroxytetrahydroaltersolanol B (6) (DMSO-d6, 500 MHz)
1.52.02.53.03.54.04.55.05.56.06.5f2 (ppm)
30
40
50
60
70
80
90
100
110
120
130
140
150
160
170
180
190
200
6/10a
6
6/10
6/7 7
6/5
6/8
1+9a
OCH3
CH3/4
CH3/9a
OCH3/7
CH3/2
CH3/3
2
3
5
8
4alpha/4a
4alpha/2
4alpha/3
4a4beta/4a
3/4
10a
1beta/9+4beta/2
1+4beta/4a
1beta/9a
9/7
9/8
9/8a
9/10a
9/9a 9a
4a/4
3/29
4beta/10 4alpha/1010
8a
Attachment 7a: 1H NMR spectrum of deoxybostrycin (7) (DMSO-d6, 500 MHz)
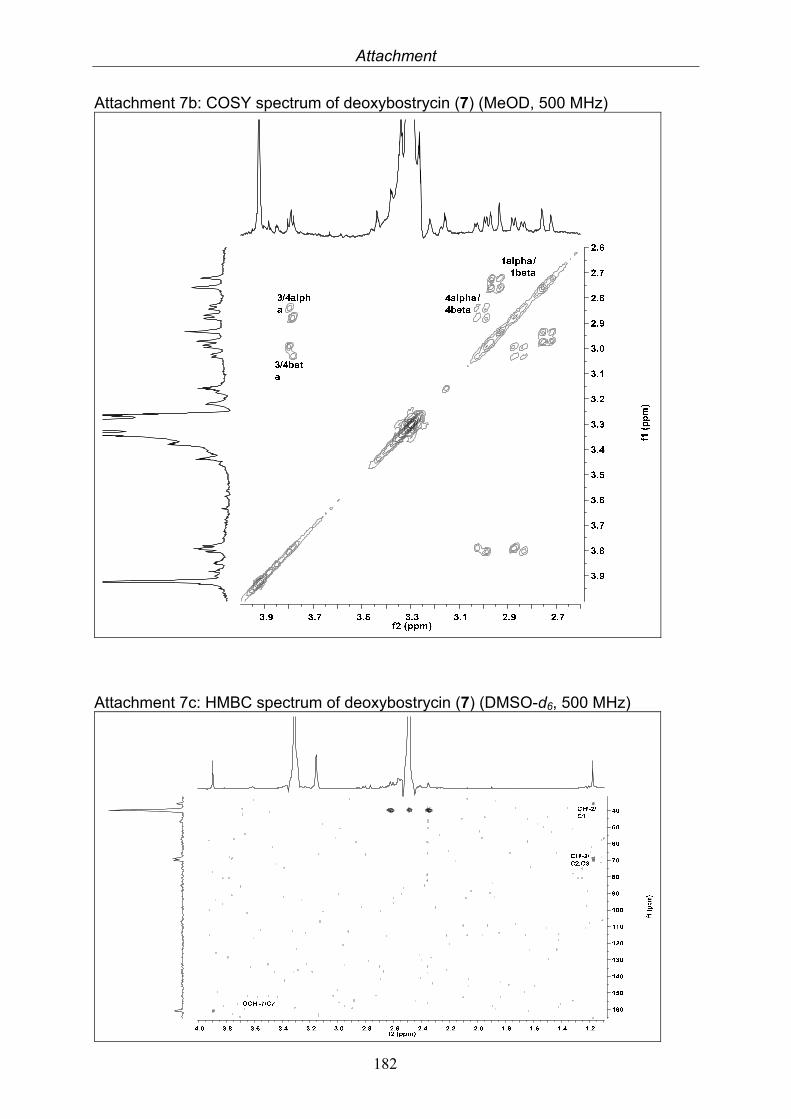
Attachment
182
Attachment 7b: COSY spectrum of deoxybostrycin (7) (MeOD, 500 MHz)
Attachment 7c: HMBC spectrum of deoxybostrycin (7) (DMSO-d6, 500 MHz)
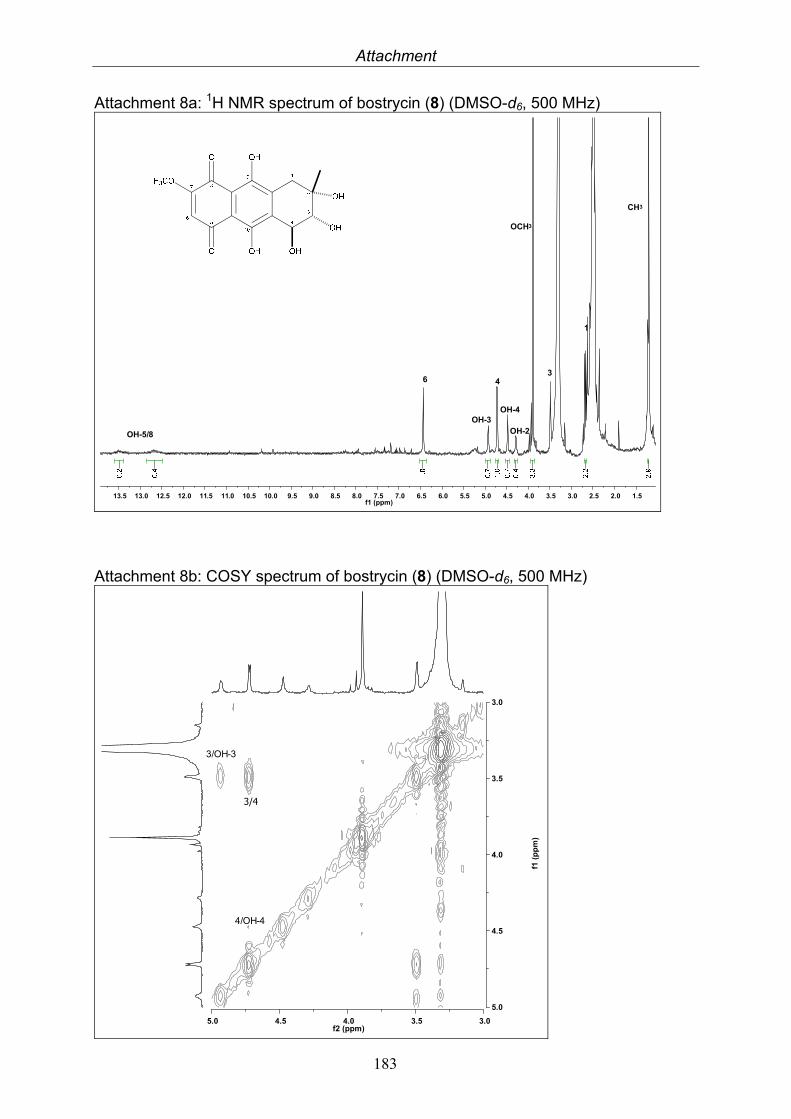
Attachment
183
Attachment 8a: 1H NMR spectrum of bostrycin (8) (DMSO-d6, 500 MHz)
1.52.02.53.03.54.04.55.05.56.06.57.07.58.08.59.09.510.010.511.011.512.012.513.013.5f1 (ppm)
OH-4
OH-2OH-3
OH-5/8
1
36 4
CH3
OCH3
Attachment 8b: COSY spectrum of bostrycin (8) (DMSO-d6, 500 MHz)
3.03.54.04.55.0f2 (ppm)
3.0
3.5
4.0
4.5
5.0
f1 (
pp
m)
3/4
3/OH-3
4/OH-4
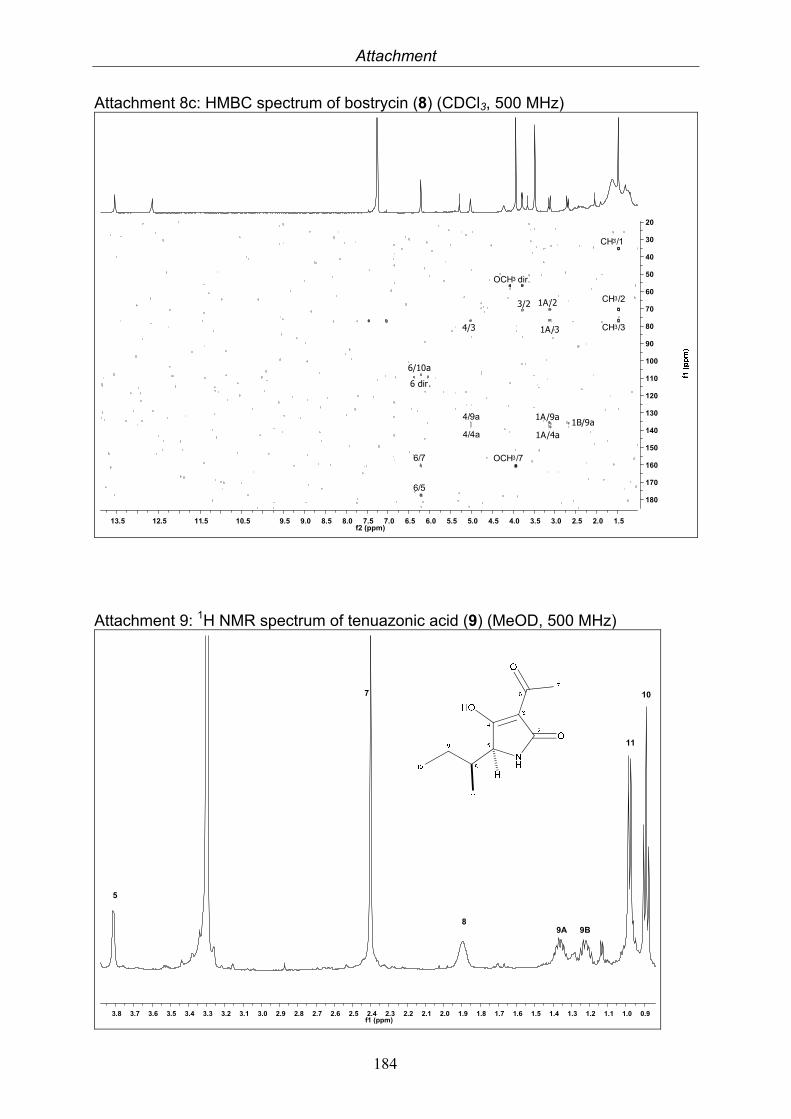
Attachment
184
Attachment 8c: HMBC spectrum of bostrycin (8) (CDCl3, 500 MHz)
1.52.02.53.03.54.04.55.05.56.06.57.07.58.08.59.09.510.511.512.513.5f2 (ppm)
20
30
40
50
60
70
80
90
100
110
120
130
140
150
160
170
180
CH3/1
CH3/3
CH3/2
OCH3 dir.
1A/2
1A/9a
1A/4a
1A/3
1B/9a
OCH3/7
6/10a
6 dir.
4/3
4/9a
4/4a
6/7
6/5
3/2
Attachment 9: 1H NMR spectrum of tenuazonic acid (9) (MeOD, 500 MHz)
0.91.01.11.21.31.41.51.61.71.81.92.02.12.22.32.42.52.62.72.82.93.03.13.23.33.43.53.63.73.8f1 (ppm)
5
7
89A 9B
11
10
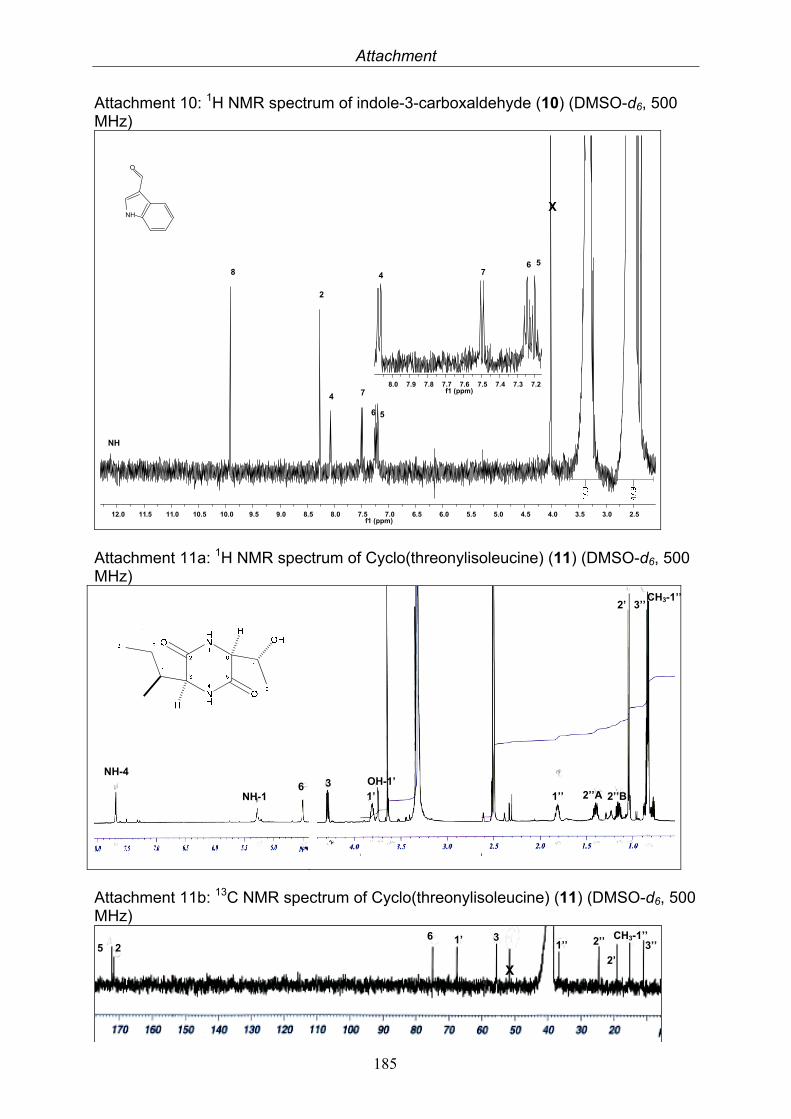
Attachment
185
Attachment 10: 1H NMR spectrum of indole-3-carboxaldehyde (10) (DMSO-d6, 500 MHz)
2.53.03.54.04.55.05.56.06.57.07.58.08.59.09.510.010.511.011.512.0f1 (ppm)
7.27.37.47.57.67.77.87.98.0f1 (ppm)
8
2
NH
6 5
74
4 756
XNH
O
Attachment 11a: 1H NMR spectrum of Cyclo(threonylisoleucine) (11) (DMSO-d6, 500 MHz)
Attachment 11b: 13C NMR spectrum of Cyclo(threonylisoleucine) (11) (DMSO-d6, 500 MHz)
2’
2’’ 1’’ 1’ 3
X
NH-4
NH-1 6 3 OH-1’
1’
2’
2’’B 2’’A
3’’ CH3-1’’
1’’
5 2 3’’ CH3-1’’ 6
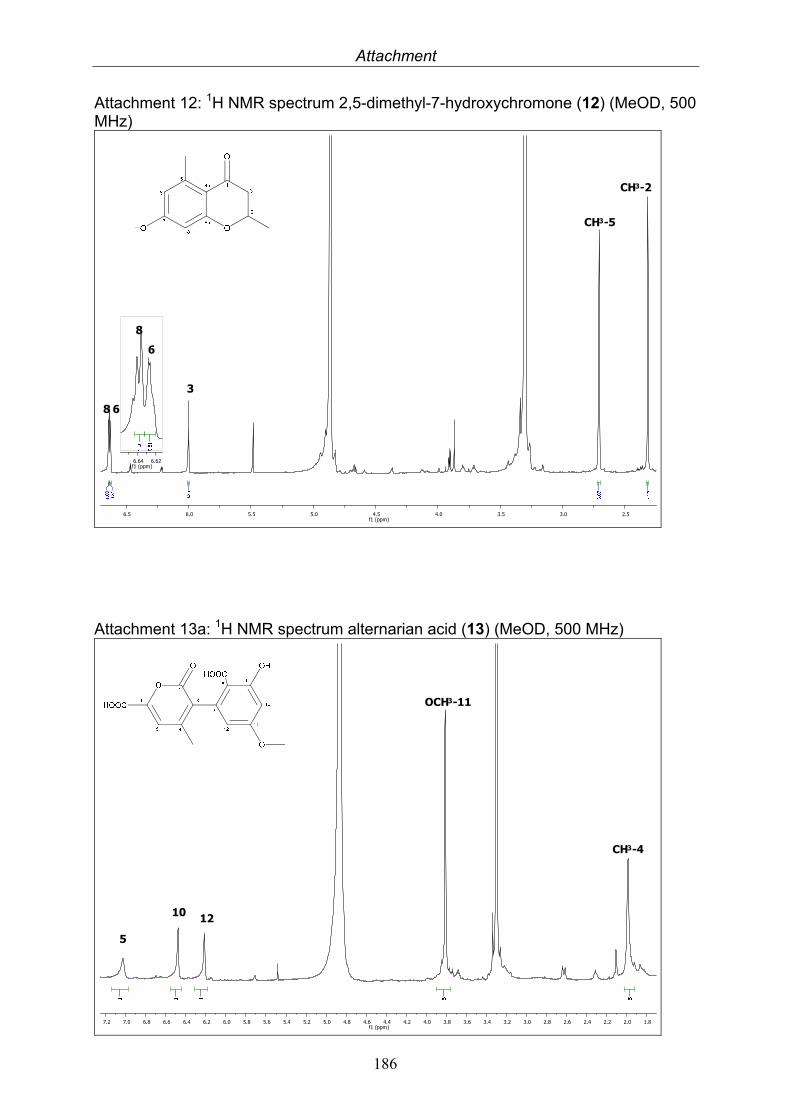
Attachment
186
Attachment 12: 1H NMR spectrum 2,5-dimethyl-7-hydroxychromone (12) (MeOD, 500 MHz)
2.53.03.54.04.55.05.56.06.5f1 (ppm)
6.626.64f1 (ppm)
6
3
8
CH3-5
CH3-2
68
Attachment 13a: 1H NMR spectrum alternarian acid (13) (MeOD, 500 MHz)
1.82.02.22.42.62.83.03.23.43.63.84.04.24.44.64.85.05.25.45.65.86.06.26.46.66.87.07.2f1 (ppm)
5
1210
OCH3-11
CH3-4
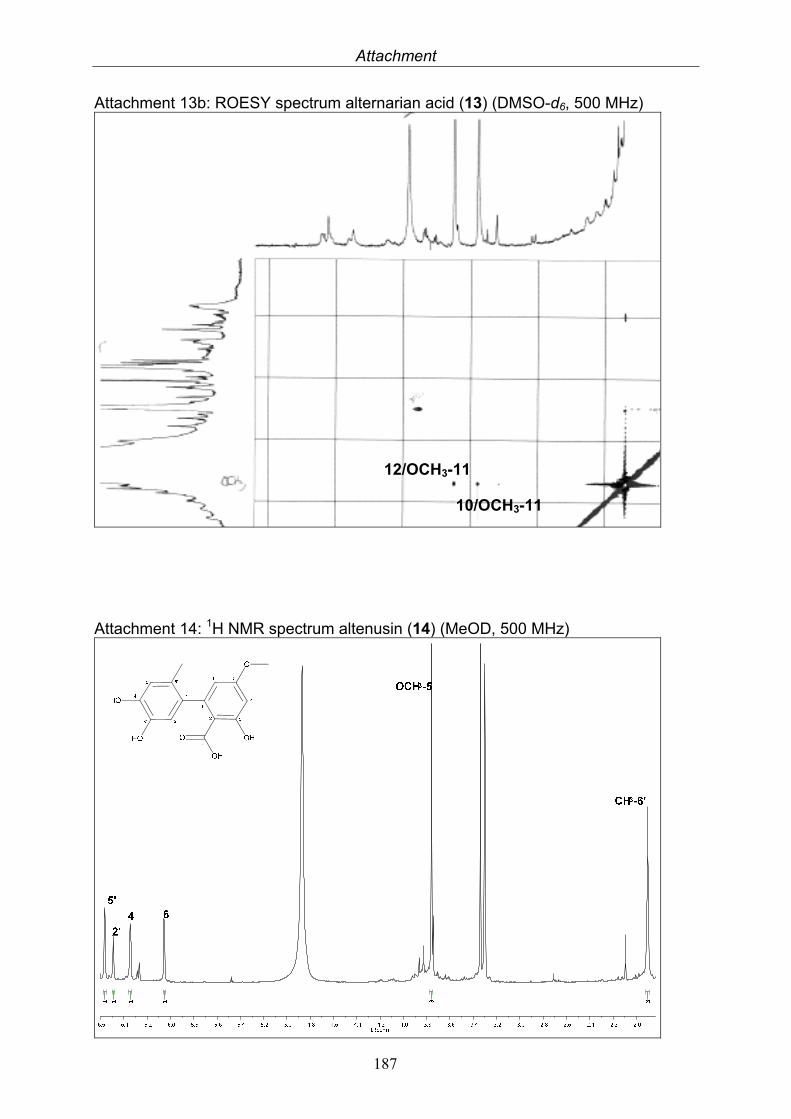
Attachment
187
Attachment 13b: ROESY spectrum alternarian acid (13) (DMSO-d6, 500 MHz)
Attachment 14: 1H NMR spectrum altenusin (14) (MeOD, 500 MHz)
12/OCH3-11
10/OCH3-11
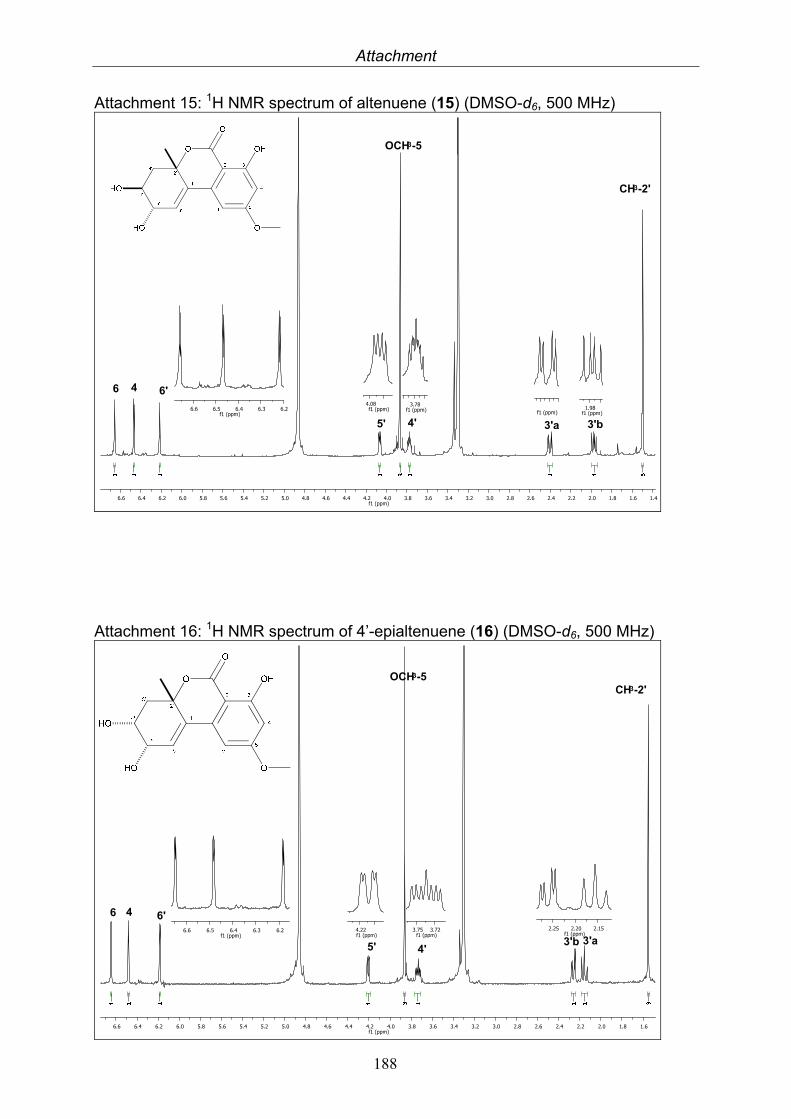
Attachment
188
Attachment 15: 1H NMR spectrum of altenuene (15) (DMSO-d6, 500 MHz)
1.41.61.82.02.22.42.62.83.03.23.43.63.84.04.24.44.64.85.05.25.45.65.86.06.26.46.6f1 (ppm)
6.26.36.46.56.6f1 (ppm)
4.08f1 (ppm)
3.78f1 (ppm) f1 (ppm)
1.98f1 (ppm)
6 4 6'
5' 4' 3'b3'a
CH3-2'
OCH3-5
Attachment 16: 1H NMR spectrum of 4’-epialtenuene (16) (DMSO-d6, 500 MHz)
1.61.82.02.22.42.62.83.03.23.43.63.84.04.24.44.64.85.05.25.45.65.86.06.26.46.6f1 (ppm)
6.26.36.46.56.6f1 (ppm)
4.22f1 (ppm)
3.723.75f1 (ppm)
2.152.202.25f1 (ppm)
6 4
5'
CH3-2'
4'
6'
OCH3-5
3'a3'b
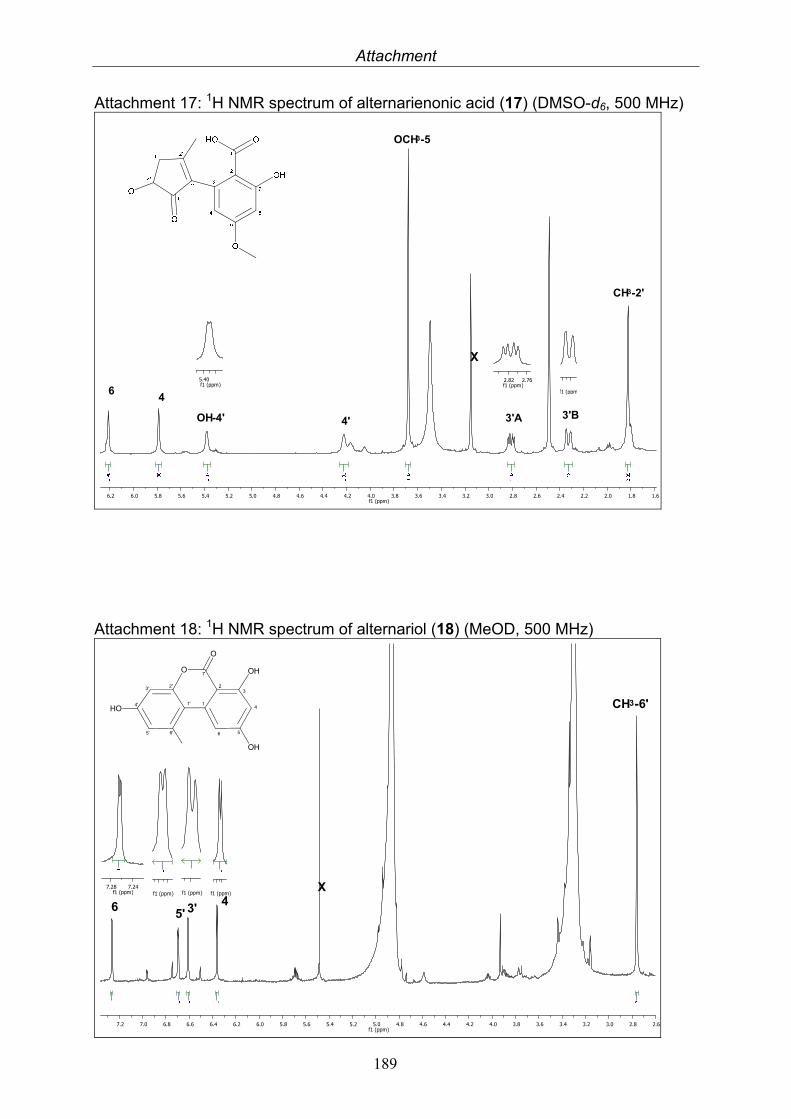
Attachment
189
Attachment 17: 1H NMR spectrum of alternarienonic acid (17) (DMSO-d6, 500 MHz)
1.61.82.02.22.42.62.83.03.23.43.63.84.04.24.44.64.85.05.25.45.65.86.06.2f1 (ppm)
5.40f1 (ppm)
2.762.82f1 (ppm)
f1 (ppm6
3'B3'A
4
OH-4'
CH3-2'
OCH3-5
4'
X
Attachment 18: 1H NMR spectrum of alternariol (18) (MeOD, 500 MHz)
2.62.83.03.23.43.63.84.04.24.44.64.85.05.25.45.65.86.06.26.46.66.87.07.2f1 (ppm)
7.247.28f1 (ppm) f1 (ppm) f1 (ppm) f1 (ppm)
6 5' 3'4
CH3-6'
X
2
7
1
O
2'
1'
3
6'
3'
4
6
O
5' 5
4'
OH
HO
OH
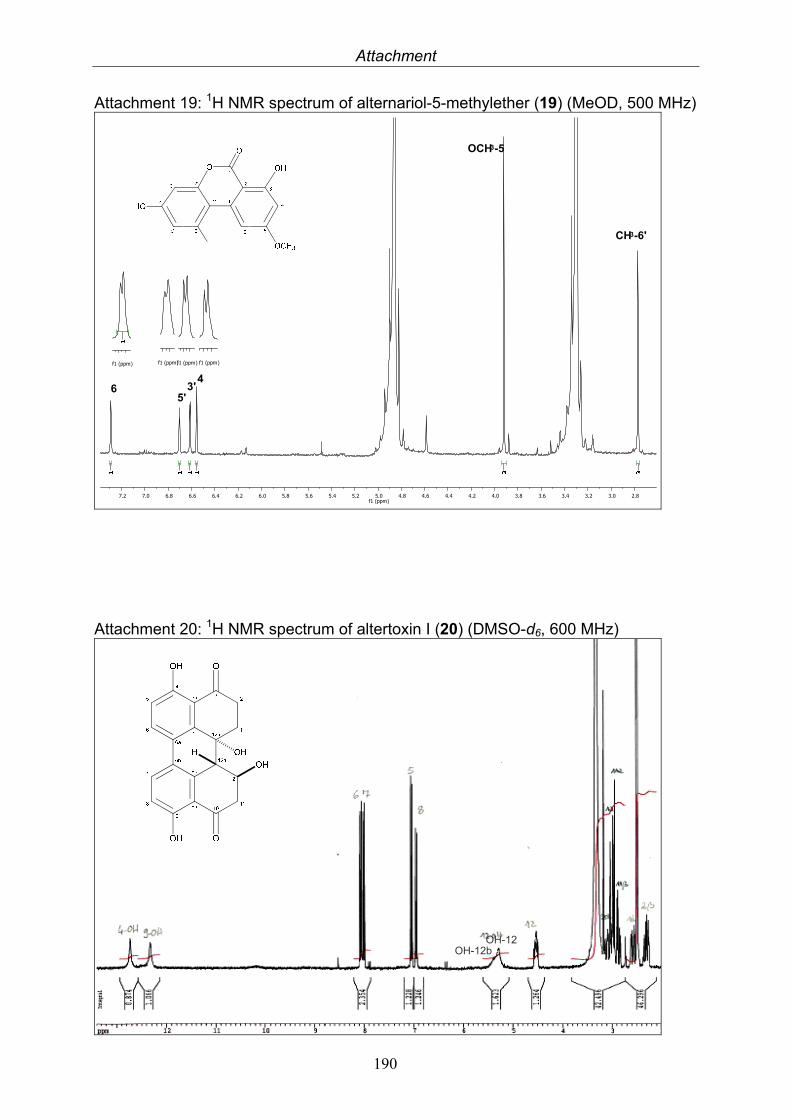
Attachment
190
Attachment 19: 1H NMR spectrum of alternariol-5-methylether (19) (MeOD, 500 MHz)
2.83.03.23.43.63.84.04.24.44.64.85.05.25.45.65.86.06.26.46.66.87.07.2f1 (ppm)
f1 (ppm) f1 (ppm)f1 (ppm) f1 (ppm)
5'6
43'
CH3-6'
OCH3-5
Attachment 20: 1H NMR spectrum of altertoxin I (20) (DMSO-d6, 600 MHz)
OH-12b OH-12
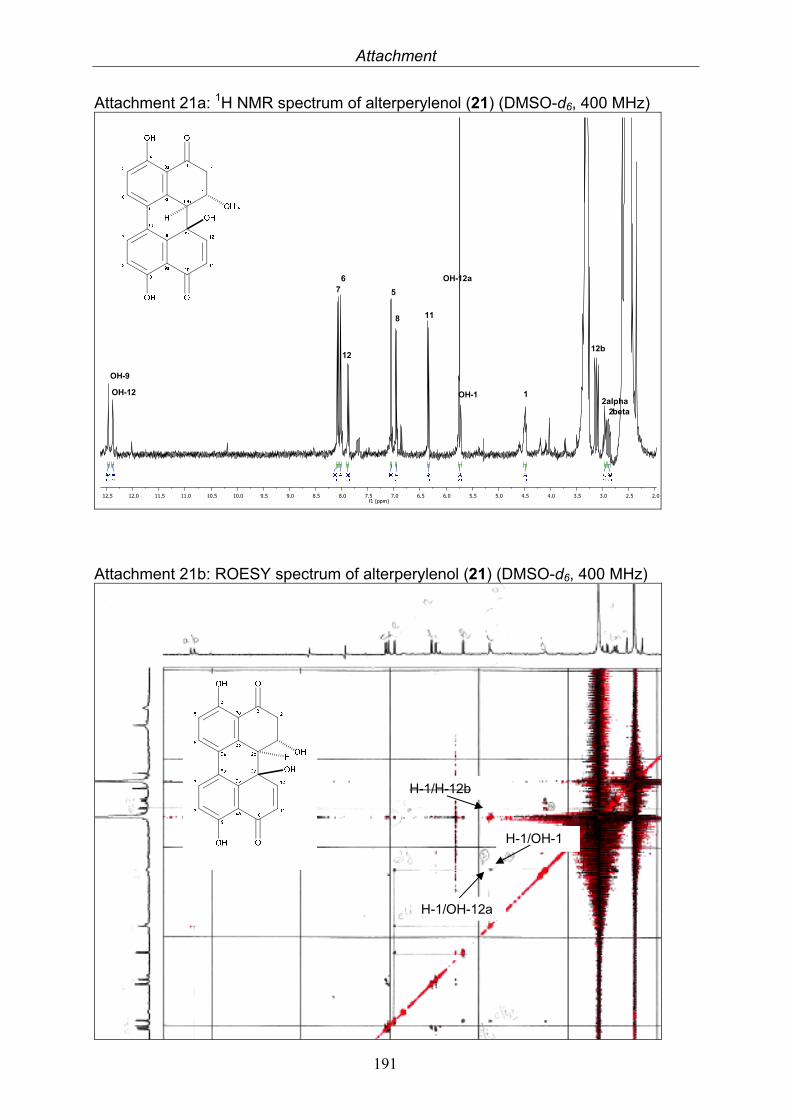
Attachment
191
Attachment 21a: 1H NMR spectrum of alterperylenol (21) (DMSO-d6, 400 MHz)
2.02.53.03.54.04.55.05.56.06.57.07.58.08.59.09.510.010.511.011.512.012.5f1 (ppm)
OH-12
OH-9
76
8
5
11
12
1OH-1
OH-12a
2alpha2beta
12b
Attachment 21b: ROESY spectrum of alterperylenol (21) (DMSO-d6, 400 MHz)
H-1/OH-1
H-1/OH-12a
H-1/H-12b
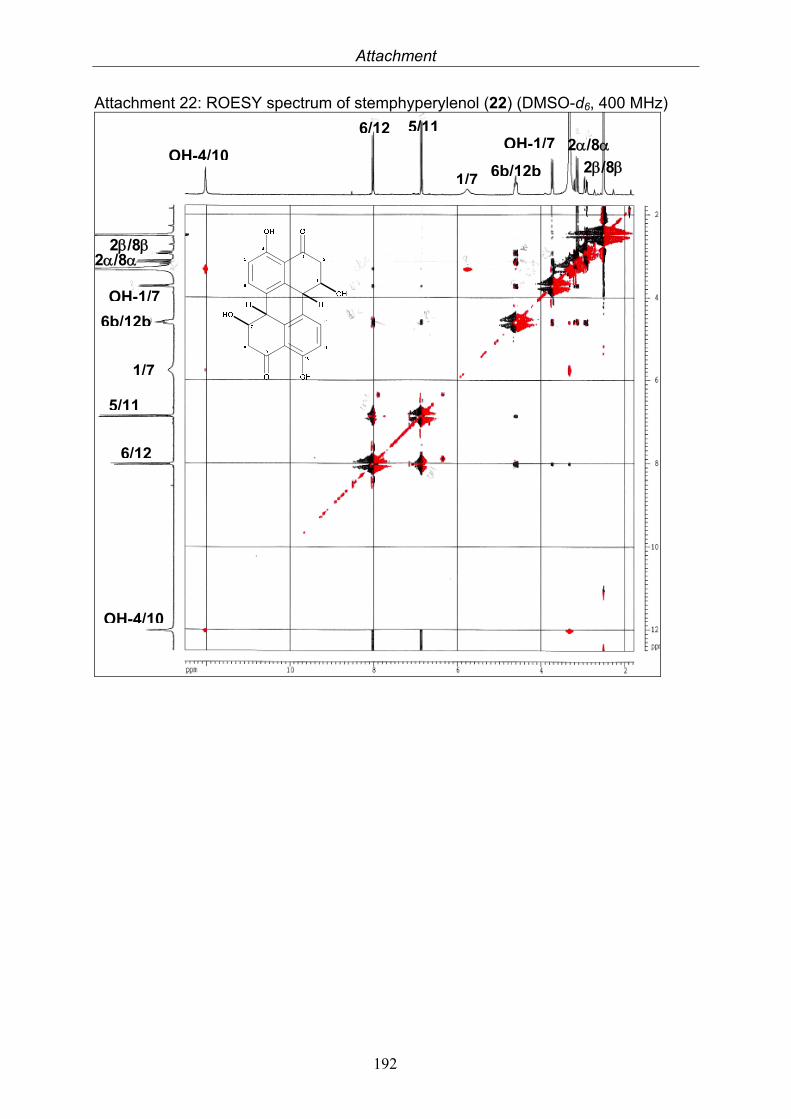
Attachment
192
Attachment 22: ROESY spectrum of stemphyperylenol (22) (DMSO-d6, 400 MHz)
OH-4/10
6/12 5/11OH-1/7
1/7 6b/12b 2/8
2/8
OH-4/10
6/12
5/11
1/7
6b/12b
OH-1/7
2/8 2/8
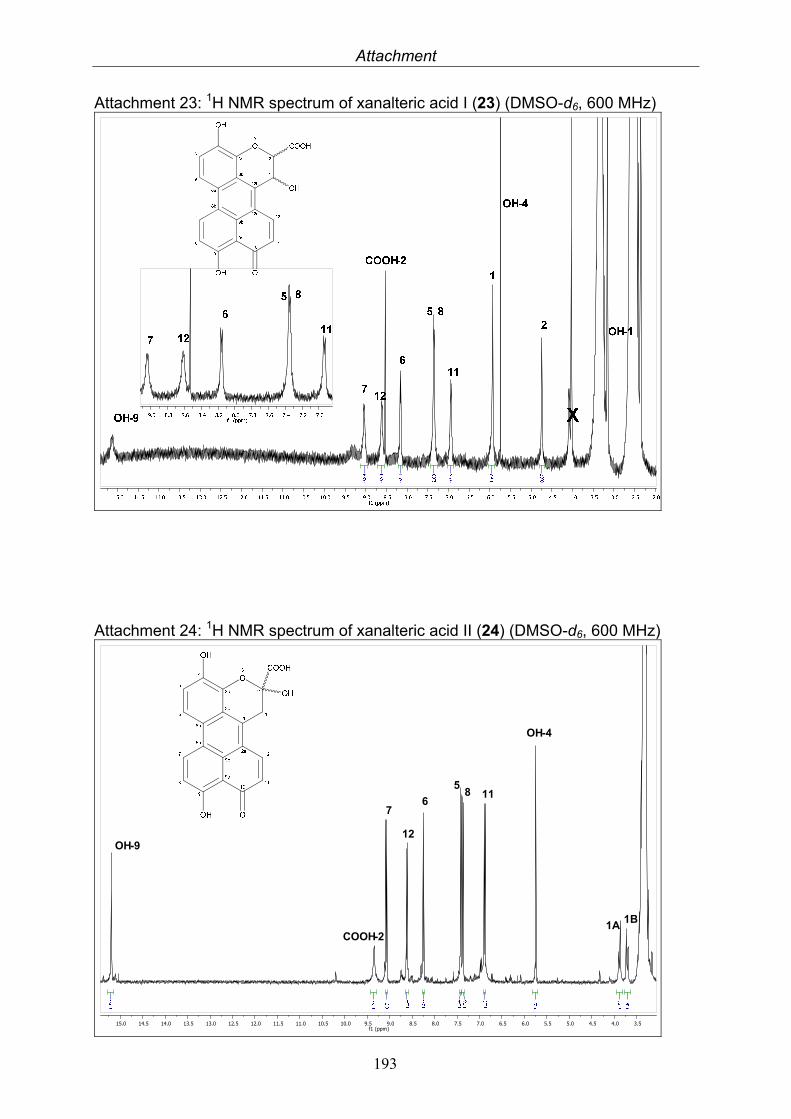
Attachment
193
Attachment 23: 1H NMR spectrum of xanalteric acid I (23) (DMSO-d6, 600 MHz)
Attachment 24: 1H NMR spectrum of xanalteric acid II (24) (DMSO-d6, 600 MHz)
3.54.04.55.05.56.06.57.07.58.08.59.09.510.010.511.011.512.012.513.013.514.014.515.0f1 (ppm)
76
12
511
1A1B
COOH-2
OH-4
OH-9
8
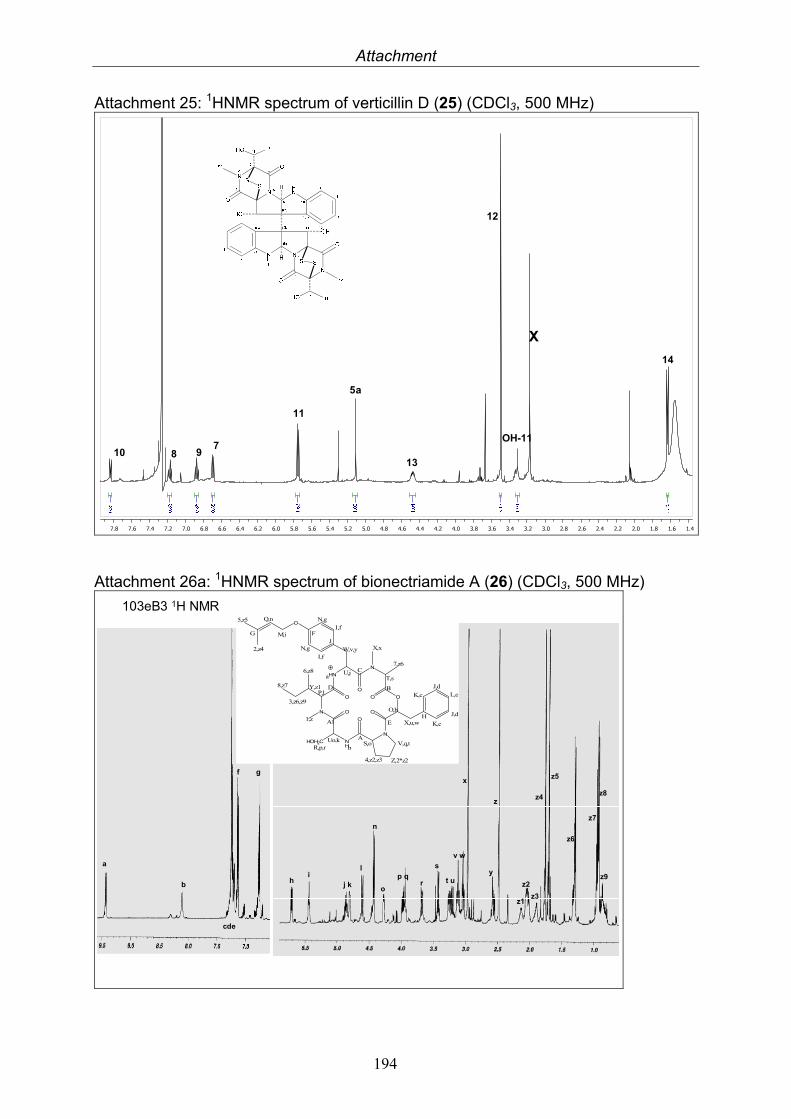
Attachment
194
Attachment 25: 1HNMR spectrum of verticillin D (25) (CDCl3, 500 MHz)
1.41.61.82.02.22.42.62.83.03.23.43.63.84.04.24.44.64.85.05.25.45.65.86.06.26.46.66.87.07.27.47.67.8
1013
11
987
14
12
5a
X
OH-11
Attachment 26a: 1HNMR spectrum of bionectriamide A (26) (CDCl3, 500 MHz)
103eB3 1H NMR
a
cde
b
f g
hi
j k
l
n
o
p qr
s
t u
v w
x
y
z
z1
z2
z3
z4
z5
z6
z7
z8
z9
N
HN
N
O
N
NH
O
O
O
O
O
O
HOH2C
O
S,o
4,z2,z3 Z,2*z2
V,q,tUo,k
R,p,r
2,z4
5,z5
G
Q,n
M,i F
N,g
N,gI,f
I,f
JW,v,y
U,j
L,e
K,c
K,c
J,d
J,dHX,u,w
O,h
B
T,s
7,z6
8,z7
3,z6,z9
6,z8
Y,z1P,l
X,x
1,z
a
D
C
E
A
A1
b
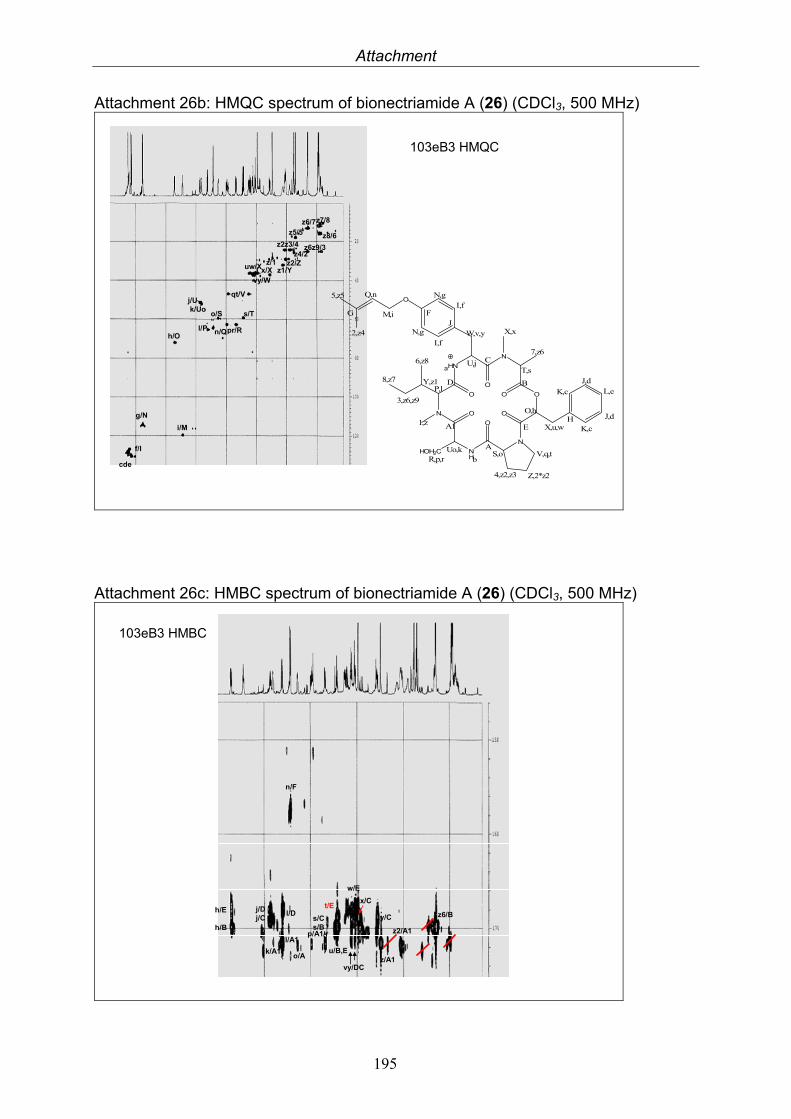
Attachment
195
Attachment 26b: HMQC spectrum of bionectriamide A (26) (CDCl3, 500 MHz)
cde
f/I
g/N
h/O
i/M
j/Uk/Uo
l/P n/Q
o/S
pr/R
qt/V
s/T
uw/X
vy/Wx/X
z/1z1/Y
z2/Z
z2z3/4z4/2
z5/5z6/7z7/8
z8/6
z6z9/3
N
HN
N
O
N
NH
O
O
O
O
O
O
HOH2C
O
S,o
4,z2,z3 Z,2*z2
V,q,tUo,k
R,p,r
2,z4
5,z5
G
Q,n
M,i F
N,g
N,gI,f
I,f
JW,v,y
U,j
L,e
K,c
K,c
J,d
J,dHX,u,w
O,h
B
T,s
7,z6
8,z7
3,z6,z9
6,z8
Y,z1P,l
X,x
1,z
a
D
C
E
A
A1
b
103eB3 HMQC
Attachment 26c: HMBC spectrum of bionectriamide A (26) (CDCl3, 500 MHz)
103eB3 HMBC
h/E
h/B
j/Dj/C
l/D
l/A1
k/A1
p/A1/r
t/E
s/Cs/B
u/B,E
vy/DC
x/C
z/A1
z2/A1
n/F
z6/B
o/A
y/C
w/E
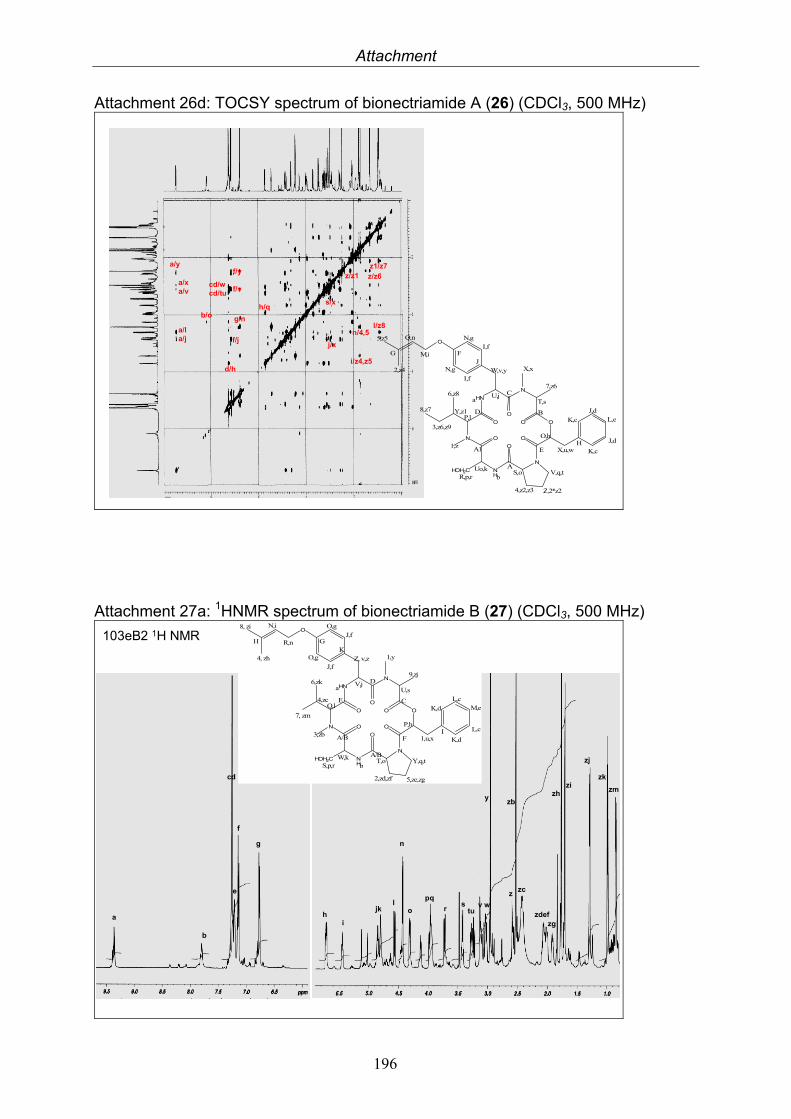
Attachment
196
Attachment 26d: TOCSY spectrum of bionectriamide A (26) (CDCl3, 500 MHz)
a/xa/v
a/y
a/la/j
d/h
f/y
f/vcd/wcd/tu
b/o g/n
h/q
f/j
s/x
z/z1 z/z6z1/z7
l/z8n/4,5
i/z4,z5
j/x
N
HN
N
O
N
NH
O
O
O
O
O
O
HOH2C
O
S,o
4,z2,z3 Z,2*z2
V,q,tUo,k
R,p,r
2,z4
5,z5
G
Q,n
M,i F
N,g
N,gI,f
I,f
JW,v,y
U,j
L,e
K,c
K,c
J,d
J,dHX,u,w
O,h
B
T,s
7,z6
8,z7
3,z6,z9
6,z8
Y,z1P,l
X,x
1,z
a
D
C
E
A
A1
b
Attachment 27a: 1HNMR spectrum of bionectriamide B (27) (CDCl3, 500 MHz)
o
g
f
e
cd
b
n
ljk
ih
v wtu
sr
pq
zgzdef
zc
zb
z
yzm
zk
zj
zizh
a
103eB2 1H NMR
N
HN
N
O
N
NH
O
O
O
O
O
O
HOH2C
O
T,o Y,q,t
5,ze,zg2,zd,zf
W,kS,p,r
4, zh
8, zi N,i
R,n G
O,g
O,gJ,f
J,fZ, v,z
V,j
M,e
K,d
K,d
L,c
L,cI1,u,x
P,h
C
U,s
9,zj
7, zm
6,zk
4,zcQ,l
1,y
3,zb
a
E
D
A/B
A/B
b
KH
F
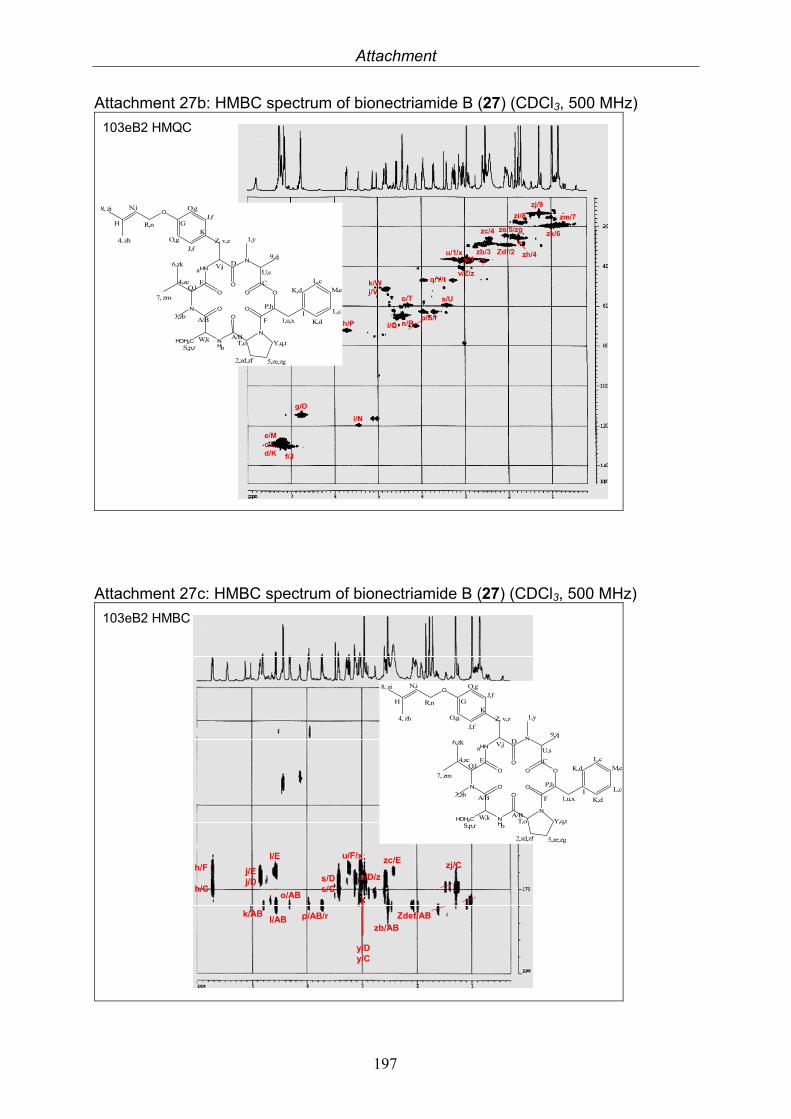
Attachment
197
Attachment 27b: HMBC spectrum of bionectriamide B (27) (CDCl3, 500 MHz)
103eB2 HMQC
o/T
g/O
f/J
e/Mc/Ld/K
n/Rl/Q
k/Wj/V
i/N
h/P
v/Z/zq/Y/t
s/U
p/S/r
ze/5/zg
Zdf/2
zc/4
zb/3y/1
u/1/x
zm/7
zk/6
zj/9
zi/8
?N
HN
N
O
N
NH
O
O
O
O
O
O
HOH2C
O
T,o Y,q,t
5,ze,zg2,zd,zf
W,kS,p,r
4, zh
8, zi N,i
R,n G
O,g
O,gJ,f
J,fZ, v,z
V,j
M,e
K,d
K,d
L,c
L,cI1,u,x
P,h
C
U,s
9,zj
7, zm
6,zk
4,zcQ,l
1,y
3,zb
a
E
D
A/B
A/B
b
KH
F
zh/4
Attachment 27c: HMBC spectrum of bionectriamide B (27) (CDCl3, 500 MHz)
103eB2 HMBC
N
HN
N
O
N
NH
O
O
O
O
O
O
HOH2C
O
T,o Y,q,t
5,ze,zg2,zd,zf
W,kS,p,r
4, zh
8, zi N,i
R,n G
O,g
O,gJ,f
J,fZ, v,z
V,j
M,e
K,d
K,d
L,c
L,cI1,u,x
P,h
C
U,s
9,zj
7, zm
6,zk
4,zcQ,l
1,y
3,zb
a
E
D
A/B
A/B
b
KH
F
h/F
h/C
j/Ej/D
l/E
l/ABk/AB
o/AB
zc/E
s/Ds/C
p/AB/rzb/AB
Zdef/AB
y/Dy/C
v/D/z
u/F/xzj/C
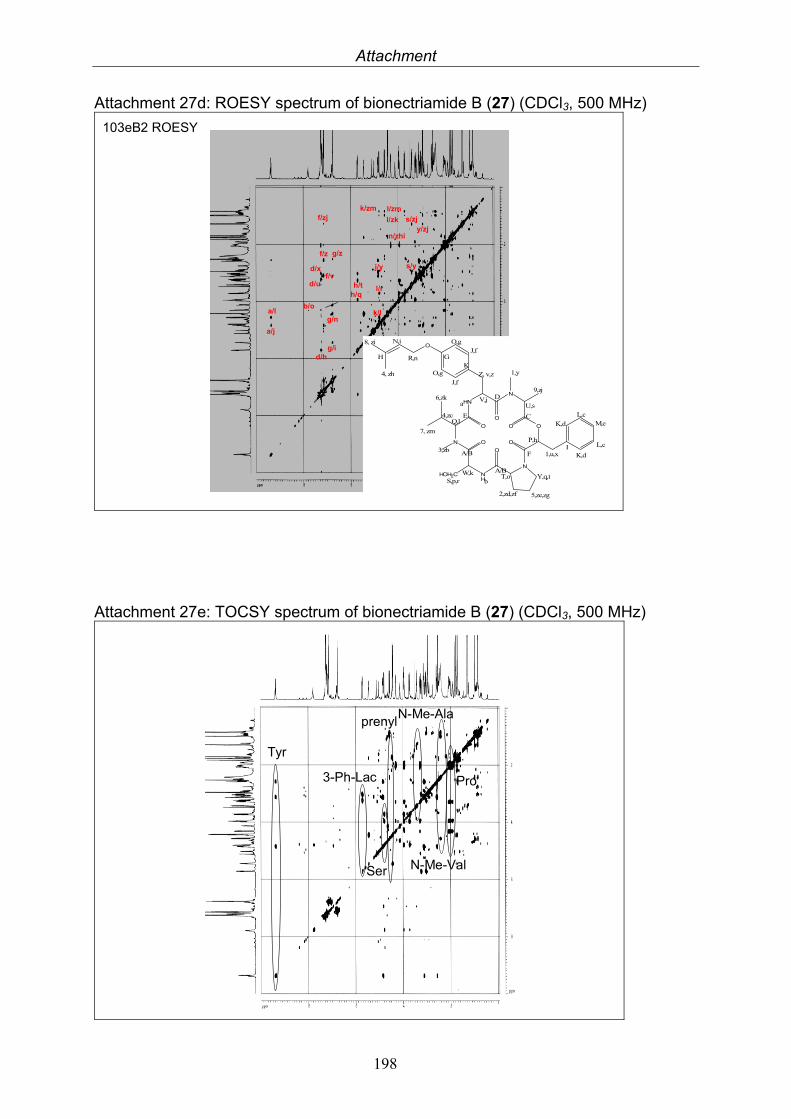
Attachment
198
Attachment 27d: ROESY spectrum of bionectriamide B (27) (CDCl3, 500 MHz)
g/n
d/x
b/o
n/zhi
l/r
j/y
k/l
h/qh/t
s/zj
s/y
k/zm
l/zky/zj
a/j
g/id/h
d/u
f/zj
f/v
f/z g/z
a/l
l/zm
103eB2 ROESY
N
HN
N
O
N
NH
O
O
O
O
O
O
HOH2C
O
T,o Y,q,t
5,ze,zg2,zd,zf
W,kS,p,r
4, zh
8, zi N,i
R,n G
O,g
O,gJ,f
J,fZ, v,z
V,j
M,e
K,d
K,d
L,c
L,cI1,u,x
P,h
C
U,s
9,zj
7, zm
6,zk
4,zcQ,l
1,y
3,zb
a
E
D
A/B
A/B
b
KH
F
Attachment 27e: TOCSY spectrum of bionectriamide B (27) (CDCl3, 500 MHz)
N-Me-Val
prenyl
Ser
Tyr
3-Ph-Lac
N-Me-Ala
Pro
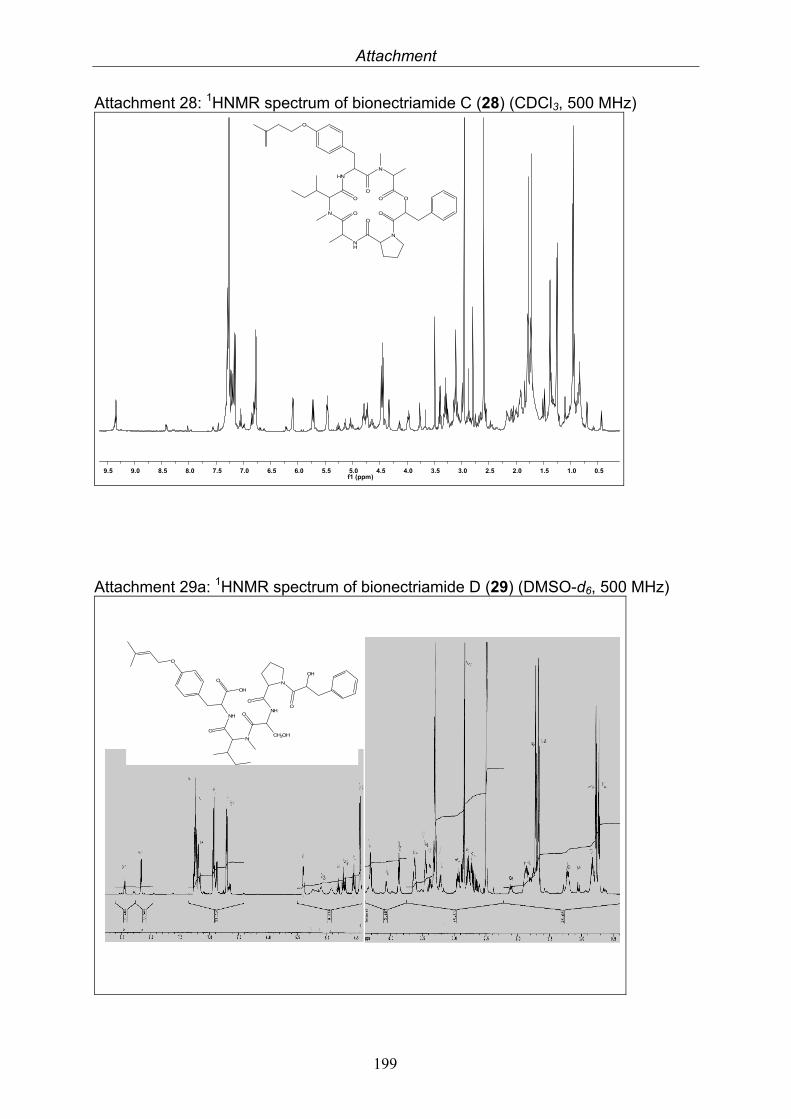
Attachment
199
Attachment 28: 1HNMR spectrum of bionectriamide C (28) (CDCl3, 500 MHz)
0.51.01.52.02.53.03.54.04.55.05.56.06.57.07.58.08.59.09.5f1 (ppm)
Attachment 29a: 1HNMR spectrum of bionectriamide D (29) (DMSO-d6, 500 MHz)
NH
N
OH
N
NHO
O
O
O
O
CH2OH
O
OH
N
HN
N
O
N
NH
O
O
O
O
O
O
O
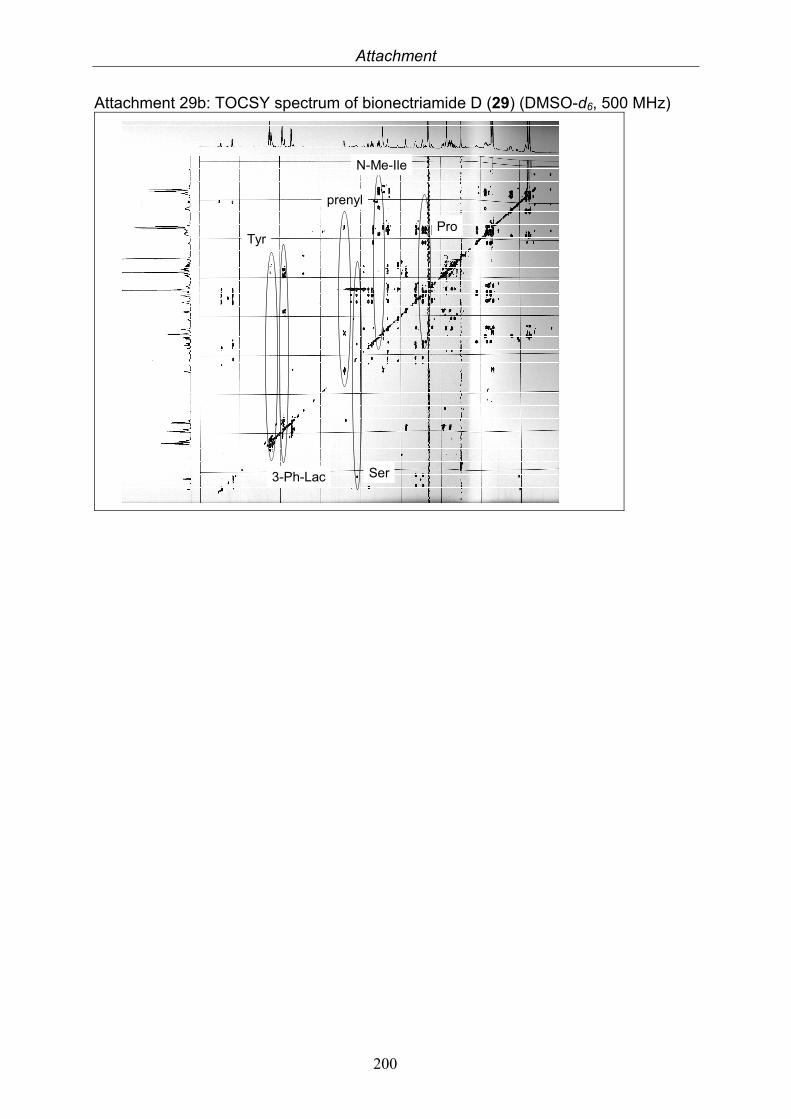
Attachment
200
Attachment 29b: TOCSY spectrum of bionectriamide D (29) (DMSO-d6, 500 MHz)
N-Me-Ile
Pro
Ser
prenyl
Tyr
3-Ph-Lac
Acknowledgements
201
11. Acknowledgments
It is a pleasure to find the chance to thank all people that directly or indirectly were involved in the success of this doctoral thesis.
First of all, I wish to acknowledge Prof. Dr. Peter Proksch for giving me the opportunity to pursue my doctoral research at your institute, for the excellent working conditions, for your patience and encouragement during my first steps in the field of natural product research, for taking over the supervision of my work and your steady support until the completion of this thesis. I’m indebted especially for the unforgettable opportunities to gain experience in work and of life in East Asia.
I would further like to express my cordiac gratitude to Dr. Rainer Ebel for your instructive supervision, valuable suggestions, fruitful discussions about natural products in the lab and everything else outside the lab and your continuous support even from far away until the very end.
My special thanks go to Dr. RuAngelie Edrada-Ebel for HRMS measurement and bioactivity screening, but also for your ability to face and solve all problems with a smile.
I’m indebted to Prof. Dr. Wenhan Lin for the opportunity to work in your lab, collection of the mangrove plants in Hainan and many unforgettable impressions in China as well as sharing your genius in NMR data interpretation.
Thank you to all colleagues in Beijing for a friendly working atmosphere, infinite helpfulness, the exciting joint adventures and the most colorful birthday cake of my life. A special thank you to Prof. Dr. Deng for measuring my first isolated compound.
Dr. Nutan Kaushik, Susheel Kumar and all my Indian colleagues at TERI, thank you for your hospitality, skillful cooperation as well as unforgettable cultural and amicable experiences during my stay in Delhi – and the suit fits very well!
My thanks go to Dr. Tu Ngoc Dong, Prof. Anh Tuan Dong and your whole family for making me feel like a family member during my working stay in Hanoi.
I appreciate the sincere cooperation of Dr. W. Peters and coworkers (Institut für anorganische Chemie und Strukturchemie, HHU Düsseldorf) for NMR measurements and Dr. Victor Wray (Helmholtz Center for Infection Research, Braunschweig) for conducting NMR and HRMS measurements, sharing his expertise in NMR data interpretation.
I would like to express my special thanks to the working groups of Prof. W. E. G. Müller (Physiologische Chemie und Pathobiochemie, Universität Mainz), Prof. U. Hentschel (Zentrum für Infektionsforschung, Universität Würzburg), Dr. M. Kubbutat (ProQinase GmbH, Freiburg) and Dr. Alexander Pretsch (SeaLife Pharma, Tulln, Austria) for the conduction of bioassays.
A huge thank you, my dear lab mates in 26.23.U1.25, Dr. Bimbo Sowemimo, Sherif Ebada, Dr. Sofia Ortlepp, Yaming Zhou and Dr. Yao Wang for creating an atmosphere where everybody helped each other out so that research as well as enjoyable more or less scientific discussions. To my long term lab mates and friends Sofia and Yao, with you even the mouldy taste of desperation tasted “so lecker” as you were always able to put a smile (even if sometimes only was a bitter one) on my face.
Thank you Drs. Ine Dewi Indriani and Amal Hassan for teaching and taking care of me (not only) in the beginning, for returning to the institute and being such lovely persons.
I am grateful for the nice working atmosphere in the fungi room, thanks to the former members of the fungi group, Clecia Freitas-Richter, Drs. Abdessamad Debbab, Amal
Acknowledgements
202
Hassan, Arnulf Diesel, Franka Teuscher, Ine Dewi Indriani, Yudi Rusman for the mutual help and support and to the “new” members David Rönsberg, Mustapha ElAmrani and Weeam Ebrahim for their fresh enthusiasm.
I enjoyed being a member of the PB3 group, thank you Dr. Annika Putz for being a great colleague, travel companion, flat mate, Arnulf for molecular biology and diving lessons and getting the students “ordentlich schubbern”, Dr. Bärbel Hiort for facilitating my start and passing me on her place in lab U1.25, Abdessamad for keeping me updated with expertise and latest gossip, Klaus-Dieter Jansen and Eva Müller for their constant cooperativeness and early morning smiles, Drs. Jandirk Sendker and Mirko Bayer for their collegiality.
A huge thank you to the LCMS team: RuAn, without you we’d been helpless, but luckily the gap you’ve left was filled by the LCMS-fan and ever patient and helpful Jandirk; Yao, Sven, David and Sherif, you really were team workers who could rely on each other.
I am grateful to the technical staff Waltraud Schlag, Katrin Rohde, Simone Miljanovic and Heike Goldbach-Gecke for supplying me with laboratory materials and your patience for an ever absent collegue in the end.
Mareike Thiel, thank you so much for al the organization if my trips and more, good music, exhausting and refreshing work outs, good music and hilarious stories from Australia.
I appreciate Claudia Eckelskemper’s help in administration and being a lovely collegue.
Thank you Prof. Dr. Claus Paßreiter for keeping my safety updated and for merry singing hours in Kleinwalsertal.
What would I’ve been without SOS coffees and sweet Thank you Edyta Stec, Ole Rigbers, Sven Ruhl, Wera Hauschild, Drs. Alexander Grundmann, Anke Suckow-Schnitker, Nadine Weber, Nicola Steffan and Triana Hadna for daily sweet and refreshing moments.
Thank you to all present and former members of the institute for creating an international and exciting working atmosphere, Andrea Derksen, Barbara Kalisch, Bartosz Lipowicz, Clara Grüning, Edi Sri Mulyono, Frank Riebe, Drs. Ashraf Hamed, Ehab Moustafa, Mohamed Ashour, Sabry Younes, Yasman, Yosi Murti and Prof. Dr. Shu-Ming Li.
A huge thank you to all “outside” the laboratory’s world who supported me and tried to understand what I was doing with my fungi.
Special thanks to Beate Bussmann-Keidel for flexible working hours in the pharmacy and for waiting patiently for my return, and to all pharmacy and teaching colleagues for their understanding especially during the crucial phase.
A huge thank you to my best friend Dr. Sonja Schleich for being who you are and always being there, even in the middle of the night for a good song.
My dear girls Franziska Dürigen (and your three boys!) and Ruth Kullmann for your true friendship.
A huge thank you to my “old” family (the Junks) and “new” family (all Kjers and Dieter) for always being there and trying to understand what I do and why.
Mum, you’ve always supported my ideas and encouraged me in going my own way. You’re the best Mum one can wish, I’m lucky we’ve had innumerable diners at our little family table.
Björn, you know how to drive me crazy, when to stop and how to give me all that I need when I need it. I love you!
Curriculum vitae
203
12. CURRICULUM VITAE
Name Julia Kjer, nee Jacob Address Westerholter Weg 87 45657 Recklinghausen Date of birth 06.10.1976 Place of birth Fulda Nationality deutsch Civil status married
Education
1983 – 1987 Schlossschule, Neuhof (Primary school) 1987 – 1996 Winfriedschule, Fulda (Secondary school) 1997 – 2001 Julius-Maximilians-Universität, Würzburg Studies of Pharmacy 24.07.2002 License to practise pharmacy
Practical Work
Jan. - March 2000 Julius-von-Sachs-Institut, Würzburg Scientific assistant in pharmaceutical development and validation September 2000 Julius-Maximilians-Universität, Würzburg – Institut für
Pharmakologie und Toxikologie Traineeship in the research of gene-toxicity of phytoestrogenes
Nov. 01 - April 02 Pharmacy Department, RD & E Hospital, Exeter, England 2001-2005 Work as pharmacist in retail pharmacies Since June 05 Heinrich-Heine-Universität, Düsseldorf – Institut für
Pharmazeutische Biologie und Biotechnologie PhD studies, isolation und examination of endophytic fungi Since February 09 Staatlich anerkannte Lehranstalt für pharmazeutisch-technische
Assistenten, Essen (assistant headteacher) Since October 09 Rats Apotheke, Recklinghausen
Work abroad
October 2005 National Research Laboratories of Natural and Biometric Drugs, Beijing, China March 2007 Vietnamese Academy of Science and Technology, Institute of Chemistry, Hanoi, Vietnam November 2007 TERI - The Energy and Resources Institute Bioresources and Biotechnology Division, New-Delhi, India
Congresses
September 2007 European Conference on Marine Natural Products, Ischia, Italy (Oral presentation) September 2007 1st Sino-German Workshop on Bioactive Marine Products, Düsseldorf (Oral presentation) February 2008 20. Irseer Naturstofftage (Poster presentation)
Curriculum vitae
204
Publications
Kjer, J.; Wray, V.; Edrada-Ebel, R. A.; Ebel, R.; Pretsch, A.; Lin, W.; Proksch, P. Xanalteric Acids I and II and Related Phenolic Compounds from an Endophytic Alternaria sp. Isolated from the Mangrove Plant Sonneratia alba. J. Nat. Prod. (Oct. 2009, epub ahead of print).
Kjer, J.; Debbab, A.; Aly, A. H.; Proksch, P. Methods for Isolation of Marine-derived Endophytic Fungi and Their Bioactive Secondary Products Nat. Protoc., accepted.
Xu, J.; Kjer, J.; Sendker, J.; Wray, V.; Guan, H.; Edrada, R. A.; Lin, W.; Wu, J.; Proksch, P. Chromones from the Endophytic Fungus Pestalotiopsis sp. Isolated from the Chinese Mangrove Plant Rhizophora mucronata. J. Nat. Prod. 72, 662-665 (2009).
Xu, J.; Kjer, J.; Sendker, J.; Wray, V.; Guan, H.; Edrada, R. A.; Müller, W. E. G.; Bayer, M.; Lin, W.; Wu, J.; Proksch, P. Cytosporones, coumarins, and an alkaloid from the endophytic fungus Pestalotiopsis sp. isolated from the Chinese mangrove plant Rhizophora mucronata. Bioorg. Med. Chem. 17, 7362-7367 (2009).