Embed Size (px)
Citation preview
Object-Oriented Reverse Engineering
Coarse-grained, Fine-grained, and EvolutionarySoftware Visualization
Inauguraldissertationder Philosophisch-naturwissenschaftlichen Fakultat
der Universitat Bern
vorgelegt von
Michele Lanzavon Italien
Leiter der Arbeit: Prof. Dr. S. Ducasse, Prof. Dr. O. NierstraszInstitut fur Informatik und angewandte Mathematik
Von der Philosophisch-naturwissenschaftlichen Fakultat angenommen.
Bern, 06.05.2003 Der Dekan:
Prof. G. Jager

Abstract
The maintenance, reengineering, and evolution of object-oriented software systems has become a vitalmatter in today’s software industry. Although most systems start off in a clean and well-designed state,with time they tend to gradually decay in quality, unless the systems are reengineered and adapted to theevolving requirements. However, before suchlegacysoftware systems can be reengineered and evolved,they must be reverse engineered,i.e., their structure and inner working must be understood. This is difficultbecause of several factors, such as the sheer size of the systems, their complexity, their domain specificity,and in general the bad state legacy software systems are in.
In this thesis we propose a visual approach to the reverse engineering of object-oriented software sys-tems by means ofpolymetric views, lightweight visualizations of software enriched with metrics and othertypes of semantic information about the software,e.g., its age, version, abstractness, location, structure,function, etc.
We present and discuss several polymetric views which allow us to understand three different aspectsof object-oriented software, namely
1. coarse-grained aspects which allow for the understanding of very large systems,
2. fine-grained aspects which allow for the understanding of classes and class hierarchies,
3. and evolutionary aspects, which enable us to recover and understand the evolution of a softwaresystem.
The combination of these three types of information can greatly reduce the time needed to gain anunderstanding of an object-oriented software system.
Based on the application of our polymetric views, we present our reverse engineering methodologywhich we validated and refined on several occasions in industrial settings. It allows us to explore andcombine these three approaches into one single visual approach tounderstand software.
i
Contents
Abstract i
1 Introduction 11.1 The Problem . . . . . . . . . . . . . . . . . . . . . . . . . . . . . . . . . . . . . . . . . . 11.2 A Short Reverse Engineering State-of-the-Art . . . . . . . . . . . . . . . . . . . . . . . . 21.3 Our Approach . . . . . . . . . . . . . . . . . . . . . . . . . . . . . . . . . . . . . . . . . 31.4 Contributions . . . . . . . . . . . . . . . . . . . . . . . . . . . . . . . . . . . . . . . . . 51.5 Thesis Outline . . . . . . . . . . . . . . . . . . . . . . . . . . . . . . . . . . . . . . . . . 5
2 Object-Oriented Reverse Engineering 72.1 Introduction . . . . . . . . . . . . . . . . . . . . . . . . . . . . . . . . . . . . . . . . . . 72.2 Object-Oriented Reverse Engineering . . . . . . . . . . . . . . . . . . . . . . . . . . . . 8
2.2.1 General Approaches to Reverse Engineering . . . . . . . . . . . . . . . . . . . . 82.2.2 Challenges and Goals in Object-Oriented Reverse Engineering . . . . . . . . . . . 10
2.3 Our Work: Scope, Constraints, and Goals . . . . . . . . . . . . . . . . . . . . . . . . . . 112.3.1 Scope . . . . . . . . . . . . . . . . . . . . . . . . . . . . . . . . . . . . . . . . . 112.3.2 Constraints . . . . . . . . . . . . . . . . . . . . . . . . . . . . . . . . . . . . . . 132.3.3 Goals . . . . . . . . . . . . . . . . . . . . . . . . . . . . . . . . . . . . . . . . . 13
2.4 Conclusions . . . . . . . . . . . . . . . . . . . . . . . . . . . . . . . . . . . . . . . . . . 14
3 The Polymetric View 153.1 The Principle . . . . . . . . . . . . . . . . . . . . . . . . . . . . . . . . . . . . . . . . . 153.2 Software Metrics . . . . . . . . . . . . . . . . . . . . . . . . . . . . . . . . . . . . . . . 163.3 The Actual Visualization: A Polymetric View . . . . . . . . . . . . . . . . . . . . . . . . 183.4 Two Example Polymetric Views . . . . . . . . . . . . . . . . . . . . . . . . . . . . . . . 193.5 Interpretation of a Polymetric View . . . . . . . . . . . . . . . . . . . . . . . . . . . . . . 203.6 Useful Polymetric Views . . . . . . . . . . . . . . . . . . . . . . . . . . . . . . . . . . . 213.7 Discussion . . . . . . . . . . . . . . . . . . . . . . . . . . . . . . . . . . . . . . . . . . . 21
4 Coarse-grained Software Visualization 224.1 Introduction . . . . . . . . . . . . . . . . . . . . . . . . . . . . . . . . . . . . . . . . . . 224.2 The Reverse Engineering Process . . . . . . . . . . . . . . . . . . . . . . . . . . . . . . . 23
4.2.1 A Reverse Engineering Approach Based on Clusters of Polymetric Views . . . . . 234.2.2 The Need for a Reverse Engineering Approach . . . . . . . . . . . . . . . . . . . 24
4.3 A Reverse Engineering Scenario . . . . . . . . . . . . . . . . . . . . . . . . . . . . . . . 254.3.1 Reverse Engineering a System . . . . . . . . . . . . . . . . . . . . . . . . . . . . 264.3.2 First Contact Views . . . . . . . . . . . . . . . . . . . . . . . . . . . . . . . . . . 284.3.3 Inheritance Assessment Views . . . . . . . . . . . . . . . . . . . . . . . . . . . . 374.3.4 Candidate Detection Views . . . . . . . . . . . . . . . . . . . . . . . . . . . . . . 434.3.5 Case Study Evaluation . . . . . . . . . . . . . . . . . . . . . . . . . . . . . . . . 524.3.6 Industrial Experiences . . . . . . . . . . . . . . . . . . . . . . . . . . . . . . . . 52
4.4 Related Work . . . . . . . . . . . . . . . . . . . . . . . . . . . . . . . . . . . . . . . . . 54
ii
CONTENTS iii
4.5 Conclusion . . . . . . . . . . . . . . . . . . . . . . . . . . . . . . . . . . . . . . . . . . 554.5.1 Summary . . . . . . . . . . . . . . . . . . . . . . . . . . . . . . . . . . . . . . . 554.5.2 Benefits . . . . . . . . . . . . . . . . . . . . . . . . . . . . . . . . . . . . . . . . 554.5.3 Limits . . . . . . . . . . . . . . . . . . . . . . . . . . . . . . . . . . . . . . . . . 564.5.4 Future Work . . . . . . . . . . . . . . . . . . . . . . . . . . . . . . . . . . . . . 56
5 Fine-grained Software Visualization: The Class Blueprint 575.1 Introduction . . . . . . . . . . . . . . . . . . . . . . . . . . . . . . . . . . . . . . . . . . 575.2 The Challenge of Supporting Class Understanding . . . . . . . . . . . . . . . . . . . . . . 585.3 The Class Blueprint . . . . . . . . . . . . . . . . . . . . . . . . . . . . . . . . . . . . . . 60
5.3.1 The Layered Structure of a Class Blueprint . . . . . . . . . . . . . . . . . . . . . 605.3.2 Representing Methods and Attributes . . . . . . . . . . . . . . . . . . . . . . . . 615.3.3 The Layout Algorithm of a Class Blueprint . . . . . . . . . . . . . . . . . . . . . 63
5.4 Detailing Blueprints . . . . . . . . . . . . . . . . . . . . . . . . . . . . . . . . . . . . . . 645.4.1 Example 1: An Abstract Class . . . . . . . . . . . . . . . . . . . . . . . . . . . . 645.4.2 Example 2: An Algorithm . . . . . . . . . . . . . . . . . . . . . . . . . . . . . . 665.4.3 Class Blueprints and Inheritance . . . . . . . . . . . . . . . . . . . . . . . . . . . 67
5.5 A Vocabulary based on Patterns in the Class Blueprints . . . . . . . . . . . . . . . . . . . 695.6 Single Class Blueprint Patterns . . . . . . . . . . . . . . . . . . . . . . . . . . . . . . . . 70
5.6.1 Size-based Blueprint Patterns . . . . . . . . . . . . . . . . . . . . . . . . . . . . 715.6.2 Layer Distribution-based Blueprint Patterns . . . . . . . . . . . . . . . . . . . . . 745.6.3 Semantics-based Blueprint Patterns . . . . . . . . . . . . . . . . . . . . . . . . . 765.6.4 Call-flow-based Blueprint Patterns . . . . . . . . . . . . . . . . . . . . . . . . . . 805.6.5 State Usage-based Blueprint Patterns . . . . . . . . . . . . . . . . . . . . . . . . 84
5.7 Blueprint Patterns in the Context of Inheritance . . . . . . . . . . . . . . . . . . . . . . . 865.8 Analysis of Blueprint Patterns . . . . . . . . . . . . . . . . . . . . . . . . . . . . . . . . 89
5.8.1 Frequent Blueprint Pattern Combinations . . . . . . . . . . . . . . . . . . . . . . 895.8.2 Rare Blueprint Pattern Combinations . . . . . . . . . . . . . . . . . . . . . . . . 90
5.9 Tool Support: CodeCrawler and Moose . . . . . . . . . . . . . . . . . . . . . . . . . . . 915.10 Related Work . . . . . . . . . . . . . . . . . . . . . . . . . . . . . . . . . . . . . . . . . 925.11 Conclusion . . . . . . . . . . . . . . . . . . . . . . . . . . . . . . . . . . . . . . . . . . 92
5.11.1 Summary . . . . . . . . . . . . . . . . . . . . . . . . . . . . . . . . . . . . . . . 925.11.2 Benefits . . . . . . . . . . . . . . . . . . . . . . . . . . . . . . . . . . . . . . . . 925.11.3 Limits . . . . . . . . . . . . . . . . . . . . . . . . . . . . . . . . . . . . . . . . . 935.11.4 Future work . . . . . . . . . . . . . . . . . . . . . . . . . . . . . . . . . . . . . . 93
6 Evolutionary Software Visualization: The Evolution Matrix 956.1 Introduction . . . . . . . . . . . . . . . . . . . . . . . . . . . . . . . . . . . . . . . . . . 956.2 The Evolution Matrix . . . . . . . . . . . . . . . . . . . . . . . . . . . . . . . . . . . . . 96
6.2.1 The Layout Algorithm of the Evolution Matrix . . . . . . . . . . . . . . . . . . . 966.2.2 Characteristics at System Level . . . . . . . . . . . . . . . . . . . . . . . . . . . 976.2.3 The Difference Evolution Matrix . . . . . . . . . . . . . . . . . . . . . . . . . . . 98
6.3 A Categorization of Classes based on the Evolution Matrix . . . . . . . . . . . . . . . . . 986.3.1 Presence-based Patterns . . . . . . . . . . . . . . . . . . . . . . . . . . . . . . . 986.3.2 Shape-based Patterns . . . . . . . . . . . . . . . . . . . . . . . . . . . . . . . . . 99
6.4 Illustration of the Approach . . . . . . . . . . . . . . . . . . . . . . . . . . . . . . . . . . 1016.4.1 MooseFinder . . . . . . . . . . . . . . . . . . . . . . . . . . . . . . . . . . . . . 1016.4.2 Supremo . . . . . . . . . . . . . . . . . . . . . . . . . . . . . . . . . . . . . . . 101
6.5 Tool Support: CodEVolver . . . . . . . . . . . . . . . . . . . . . . . . . . . . . . . . . . 1026.6 Related Work . . . . . . . . . . . . . . . . . . . . . . . . . . . . . . . . . . . . . . . . . 1026.7 Conclusion . . . . . . . . . . . . . . . . . . . . . . . . . . . . . . . . . . . . . . . . . . 104
6.7.1 Benefits . . . . . . . . . . . . . . . . . . . . . . . . . . . . . . . . . . . . . . . . 1046.7.2 Limits . . . . . . . . . . . . . . . . . . . . . . . . . . . . . . . . . . . . . . . . . 1056.7.3 Future Work . . . . . . . . . . . . . . . . . . . . . . . . . . . . . . . . . . . . . 106
iii
iv CONTENTS
7 Conclusions 1077.1 Contributions . . . . . . . . . . . . . . . . . . . . . . . . . . . . . . . . . . . . . . . . . 1077.2 Future Work . . . . . . . . . . . . . . . . . . . . . . . . . . . . . . . . . . . . . . . . . . 1087.3 Closing Words . . . . . . . . . . . . . . . . . . . . . . . . . . . . . . . . . . . . . . . . . 110
8 Epilogue 111
A CodeCrawler - Implementation 112A.1 Introduction . . . . . . . . . . . . . . . . . . . . . . . . . . . . . . . . . . . . . . . . . . 112A.2 CodeCrawler . . . . . . . . . . . . . . . . . . . . . . . . . . . . . . . . . . . . . . . . . 113
A.2.1 Overall Architecture . . . . . . . . . . . . . . . . . . . . . . . . . . . . . . . . . 114A.2.2 Internal Architecture . . . . . . . . . . . . . . . . . . . . . . . . . . . . . . . . . 115A.2.3 Visualization Engine . . . . . . . . . . . . . . . . . . . . . . . . . . . . . . . . . 117A.2.4 Metamodel . . . . . . . . . . . . . . . . . . . . . . . . . . . . . . . . . . . . . . 117A.2.5 Interactive Facilities . . . . . . . . . . . . . . . . . . . . . . . . . . . . . . . . . 118
A.3 Lessons Learned . . . . . . . . . . . . . . . . . . . . . . . . . . . . . . . . . . . . . . . 119A.3.1 Overall architecture . . . . . . . . . . . . . . . . . . . . . . . . . . . . . . . . . . 120A.3.2 The Internal Architecture . . . . . . . . . . . . . . . . . . . . . . . . . . . . . . . 121A.3.3 The Visualization Engine . . . . . . . . . . . . . . . . . . . . . . . . . . . . . . . 122A.3.4 The Metamodel . . . . . . . . . . . . . . . . . . . . . . . . . . . . . . . . . . . . 122A.3.5 The Interactive Facilities . . . . . . . . . . . . . . . . . . . . . . . . . . . . . . . 123
A.4 Conclusion . . . . . . . . . . . . . . . . . . . . . . . . . . . . . . . . . . . . . . . . . . 123
iv
List of Figures
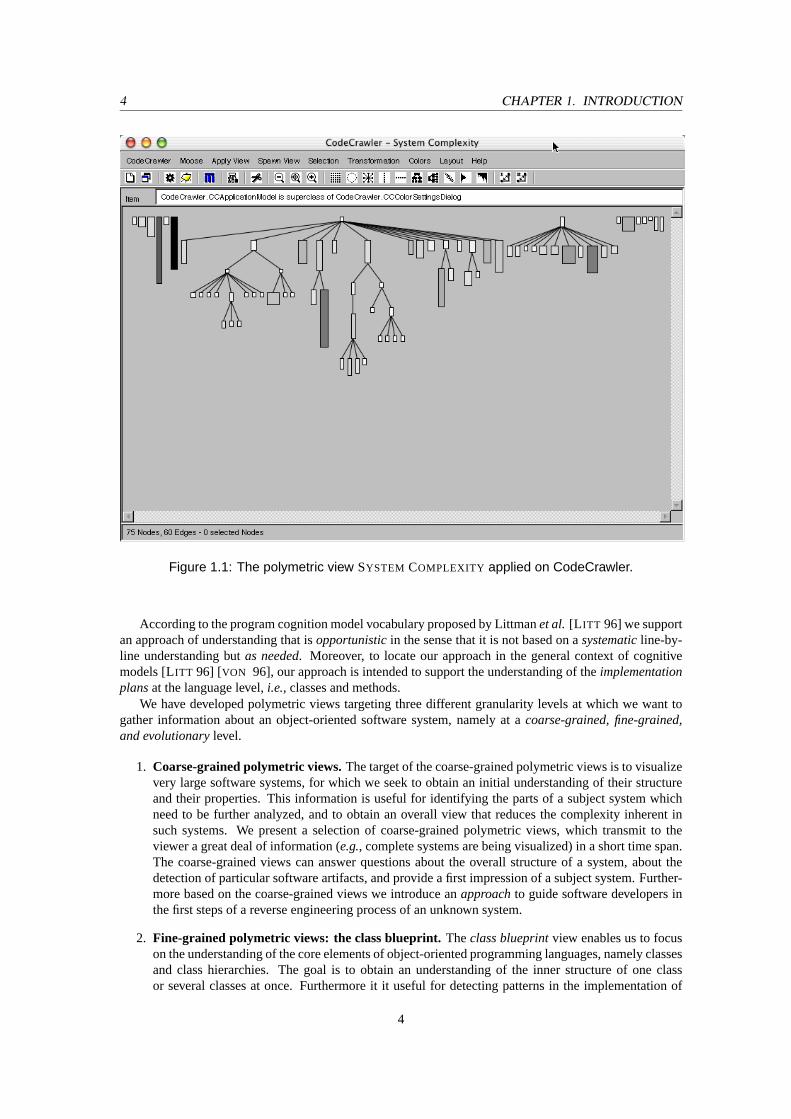
1.1 The polymetric view SYSTEM COMPLEXITY applied on CodeCrawler. . . . . . . . . . . . 4
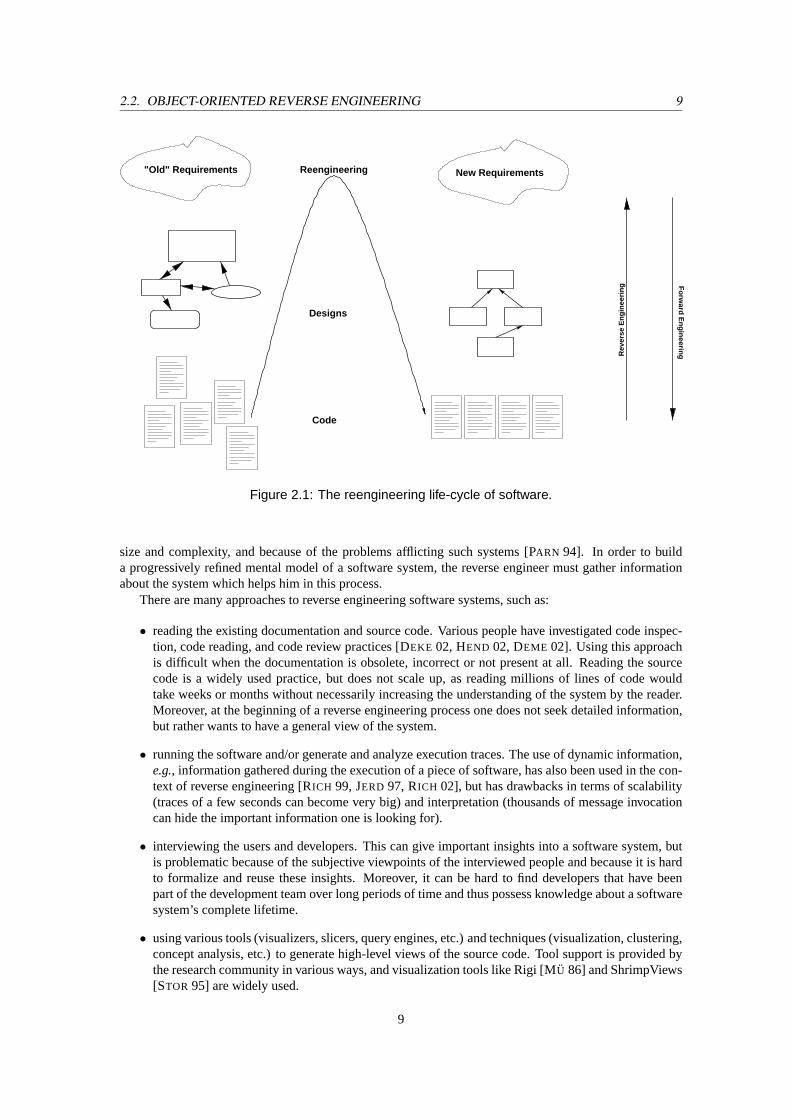
2.1 The reengineering life-cycle of software. . . . . . . . . . . . . . . . . . . . . . . . . . . . 9
3.1 Up to 5 metrics can be visualized on one node. . . . . . . . . . . . . . . . . . . . . . . . 153.2 The polymetric view SYSTEM COMPLEXITY. . . . . . . . . . . . . . . . . . . . . . . . . 193.3 The polymetric view METHOD EFFICIENCY CORRELATION. . . . . . . . . . . . . . . . . 20
4.1 A schematic view of our reverse engineering approach. . . . . . . . . . . . . . . . . . . . 244.2 A screenshot from the Duploc case study. . . . . . . . . . . . . . . . . . . . . . . . . . . 264.3 The SYSTEM HOTSPOTSview of Duploc. . . . . . . . . . . . . . . . . . . . . . . . . . . 304.4 The SYSTEM COMPLEXITY view of Duploc. . . . . . . . . . . . . . . . . . . . . . . . . 324.5 The ROOT CLASS DETECTION view of Duploc. . . . . . . . . . . . . . . . . . . . . . . . 334.6 The IMPLEMENTATION WEIGHT DISTRIBUTION view of Duploc. . . . . . . . . . . . . . 354.7 The INHERITANCE CLASSIFICATION view of Duploc. . . . . . . . . . . . . . . . . . . . 384.8 The INHERITANCE CARRIER view applied on Duploc. . . . . . . . . . . . . . . . . . . . 404.9 The DATA STORAGE CLASS DETECTION view applied on Duploc. . . . . . . . . . . . . 444.10 The METHOD EFFICIENCY CORRELATION view applied on Duploc. . . . . . . . . . . . . 464.11 The DIRECT ATTRIBUTE ACCESSview applied on Duploc. . . . . . . . . . . . . . . . . 494.12 The METHOD LENGTH DISTRIBUTION view applied on one class of Duploc. . . . . . . . 504.13 The METHOD LENGTH DISTRIBUTION view applied on one class of Duploc. . . . . . . . 514.14 The SYSTEM HOTSPOTSview applied on 1.2 million lines of code of C++. . . . . . . . . 534.15 The SYSTEM COMPLEXITY view applied on a C++ hierarchy yields aflying saucerhierarchy. 54
5.1 A class blueprint decomposes a class into layers. . . . . . . . . . . . . . . . . . . . . . . 605.2 A graphical representation of methods and attributes using metrics: the metrics are mapped
on the width and the height of a node. . . . . . . . . . . . . . . . . . . . . . . . . . . . . 625.3 The caller has outgoing edges at the bottom, while the callee has in-going edges at the top. 625.4 The methods and attributes are positioned according to the layer they have been assigned to. 645.5 Left: An blueprint of the classJunOpenGL3dGraphAbstract, which represents OpenGL
three-dimensional graphs. Right: The same class displayed with method names. . . . . . . 655.6 A blueprint of the classJunSVD. This class blueprint shows patterns of the typeSingle
Entry, Structured FlowandAll State. . . . . . . . . . . . . . . . . . . . . . . . . . . . . . 665.7 A class blueprint visualization of an inheritance hierarchy with the classJunColorChoice
as root class. The root class contains anInterfacepattern, while each of the subclasses is apureOverrider. Furthermore, each subclass is a pureSiamese Twin. . . . . . . . . . . . . 68
5.8 A class blueprint visualization of an inheritance hierarchy with the classJunPrologEntityas root class. . . . . . . . . . . . . . . . . . . . . . . . . . . . . . . . . . . . . . . . . . . 71
5.9 The blueprint of the classJunSourceCodeSavercontains aLarge Implementation, aSingleEntry, and aStructured Flowpattern at the bottom. . . . . . . . . . . . . . . . . . . . . . 72
5.10 The root class is a combination of a nearly pureInterfaceand aConstant Definerpattern,while the subclass (JunAngle) is a combination of aWide Interfaceand aFunnelpattern. . 74
v
vi LIST OF FIGURES
5.11 The class blueprint of the classJunOpenGL3dGraphAbstract: it mainly consists of aDel-egatepattern. . . . . . . . . . . . . . . . . . . . . . . . . . . . . . . . . . . . . . . . . . 76
5.12 The class blueprint of the classJunJfifColorComponent: it contains aData Storageand aThree Layerspattern. . . . . . . . . . . . . . . . . . . . . . . . . . . . . . . . . . . . . . 77
5.13 The class blueprint of the classJunAngleAbstract: it contains a distinctConstant Definerpattern. . . . . . . . . . . . . . . . . . . . . . . . . . . . . . . . . . . . . . . . . . . . . 78
5.14 A class blueprint visualization of an inheritance hierarchy with the classJunPrologEntityas root class. . . . . . . . . . . . . . . . . . . . . . . . . . . . . . . . . . . . . . . . . . . 79
5.15 The class blueprint of the classJunBmpImageStreamwith two Single Entrypatterns. . . . 805.16 TheStructured Flowpattern of the classJunSourceCodeSaver. . . . . . . . . . . . . . . . 815.17 TheMethod Clumpspattern of the classJunGNUDiff. . . . . . . . . . . . . . . . . . . . . 825.18 AFunnelpattern in the class blueprint of the classJunMovieHandle. . . . . . . . . . . . . 835.19 ASharing Entriespattern in the class blueprint of the classJunMovieHandle. . . . . . . . 845.20 The class blueprint of the classJunBmpImageStreamwith anAll Statepattern. . . . . . . . 855.21 A class blueprint visualization of an inheritance hierarchy with the classJunColorChoice
as root class. Each subclass contains a pureSiamese Twinpattern. . . . . . . . . . . . . . 865.22 The subclass in this case shows anIslandpattern, as it does not communicate at all with its
superclass. . . . . . . . . . . . . . . . . . . . . . . . . . . . . . . . . . . . . . . . . . . . 875.23 A nearly pureTemplateclass blueprint of the root classJunParametricSection. The two
subclasses are both heavyOverriderblueprints. . . . . . . . . . . . . . . . . . . . . . . . 885.24 A nearly pureInterfaceclass blueprint of the root classJunGeometry. The first subclass
is a nearly pureTemplateblueprint, while the two leaf classes are combinations of theOverrider, andAll Stateblueprint. Moreover they areSiamese Twinblueprints comparedwith each other. . . . . . . . . . . . . . . . . . . . . . . . . . . . . . . . . . . . . . . . . 90
6.1 A schematic display of the Evolution Matrix. Classes A,D and F are alphabetically orderedand stay since version 1. Classes B and C appeared after version 2. . . . . . . . . . . . . . 96
6.2 System level evolution aspects using the Evolution Matrix. . . . . . . . . . . . . . . . . . 976.3 The visualization ofDayflyandPersistentclasses. . . . . . . . . . . . . . . . . . . . . . . 996.4 The Visualization of aPulsarclass.Note that the shape may change depending on the met-
rics associated with the representation. . . . . . . . . . . . . . . . . . . . . . . . . . . . . 996.5 The visualization of aSupernovaclass. . . . . . . . . . . . . . . . . . . . . . . . . . . . . 1006.6 The visualization of aWhite Dwarfclass. . . . . . . . . . . . . . . . . . . . . . . . . . . 1006.7 The visualization of aRed Giantclass. . . . . . . . . . . . . . . . . . . . . . . . . . . . . 1016.8 The visualization of anIdle class. . . . . . . . . . . . . . . . . . . . . . . . . . . . . . . . 1016.9 The Evolution Matrix of MooseFinder. . . . . . . . . . . . . . . . . . . . . . . . . . . . . 1026.10 The Difference Evolution Matrix of MooseFinder. . . . . . . . . . . . . . . . . . . . . . . 1036.11 The Evolution Matrix of Supremo. . . . . . . . . . . . . . . . . . . . . . . . . . . . . . . 1046.12 The Difference Evolution Matrix of Supremo. . . . . . . . . . . . . . . . . . . . . . . . . 105
A.1 A snapshot of CodeCrawler’s main window. The visualized system in this case is Code-Crawler itself. . . . . . . . . . . . . . . . . . . . . . . . . . . . . . . . . . . . . . . . . . 114
A.2 The general architecture of CodeCrawler. . . . . . . . . . . . . . . . . . . . . . . . . . . 115A.3 The core model of CodeCrawler. . . . . . . . . . . . . . . . . . . . . . . . . . . . . . . . 116A.4 CodeCrawler’s ViewEditor. . . . . . . . . . . . . . . . . . . . . . . . . . . . . . . . . . . 117A.5 The visualization engine of CodeCrawler. . . . . . . . . . . . . . . . . . . . . . . . . . . 118A.6 The architecture of Moose, CodeCrawler’s metamodel. . . . . . . . . . . . . . . . . . . . 119A.7 The core of the FAMIX metamodel. . . . . . . . . . . . . . . . . . . . . . . . . . . . . . 119A.8 A screenshot of CodeCrawler at work. . . . . . . . . . . . . . . . . . . . . . . . . . . . . 120
vi
List of Tables
3.1 An exemplification of our measurement mapping function based on a minimal node size(MNS) of 4. . . . . . . . . . . . . . . . . . . . . . . . . . . . . . . . . . . . . . . . . . . 16
3.2 A list of the class metrics used in this thesis. . . . . . . . . . . . . . . . . . . . . . . . . . 173.3 A list of the method metrics used in this thesis. . . . . . . . . . . . . . . . . . . . . . . . 173.4 A list of the attribute metrics used in this thesis. . . . . . . . . . . . . . . . . . . . . . . . 18
4.1 An overview of the size of the Duploc case study. . . . . . . . . . . . . . . . . . . . . . . 264.2 A list of some of the industrial case studies to which CodeCrawler was applied to. . . . . . 53
5.1 In a class blueprint semantic information is mapped on the colors of the nodes and edges. . 63
vii

viii LIST OF TABLES
viii
Chapter 1
Introduction
Reverse engineering existing software systems has become an important problem that needs to be tack-led. It is defined by Chikosfky and Cross as “the process of analyzing a subject system to identify thesystem’s components and their relationships, and to create representations of the system in another form orat a higher level of abstraction” [CHIK 90]. It is the prerequisite for the maintenance, reengineering, andevolution of software systems. Since an unwary modification of one part of a system can have a negativeimpact,e.g., break, other parts of the system, one needs first to reverse engineer,e.g., have an informedmental model of the software, before the software system can be modified or reengineered.
Sommerville [SOMM 00] and Davis [DAVI 95] estimate that the cost of software maintenance accountsfor 50% to 75% of the overall cost of a software system. It would thus seem advisable to rewrite softwaresystems as soon as they fail to fulfill their requirements. However, certain software systems are too valuableto be replaced or to be rewritten, because their sheer size and complexity makes such a feat too expensivefor the owning company in terms of time and money. In the case of suchlegacysoftware systems it is moreadvisable to first reverse engineer and then maintain, reengineer, and evolve such systems. By adaptingthem to new requirements [CASA 98, RUGA 98] the lifetime of these systems can be extended and thusincrease the return of investment of their owners. Indeed, the longer a software system can be used, thebetter it pays off for the company that developed it.
We have focused ourselves on the reverse engineering ofobject-orientedlegacy systems, mainly be-cause most current software systems are written in languages implementing this paradigm, and because itis notagethat turns a piece of software into a legacy system, but therate at which it has been developedand adapted [DEME 02]. Moreover, early adopters of object-oriented technology are discovering that thebenefits they expected to achieve by switching to objects have been very difficult to realize [DEME 02]and find themselves with present and future legacy systems implemented with object-oriented technol-ogy. Moreover, reverse engineering object-oriented software systems comes with additional challenges[W ILD 92] compared to non-object-oriented systems, such as polymorphism, late-binding, incrementalclass definitions, etc.
1.1 The Problem
Reverse engineering software systems, especially large legacy systems, is technically difficult, becausethey typically suffer from several problems, such as developers no longer available, outdated developmentmethods that have been used to write the software, oudated or completely missing documentation, and ingeneral a progressive degradation of design and quality.
The goal of a person who is reverse engineering a software system is to build progressively refinedmental models of the system [STOR 99] to be able to make informed decisions regarding the software.While this is not a complex problem for small software systems, where code reading and inspection isoften enough, in the case of legacy software systems which tend to be large – hundreds of thousands ormillions of lines of poorly documented code are no exception – this becomes a hard problem becauseof their sheer size and complexity, and because of the problems afflicting such systems [PARN 94]. In
1
2 CHAPTER 1. INTRODUCTION
order to build a progressively refined mental model of a software system, the reverse engineer must gatherinformation about the system which helps him in this process.
This leads us to the following research question:How does a reverse engineer gather the kind of information that he needs in order to build a mental
model of an object-oriented software system which allows him to make informed decisions regarding itsmaintenance, reengineering, and evolution?In other words,what do we need to know about a softwaresystem to understand it?
We argue that the necessary information resides at various granularity levels,e.g., we need to knowand combine information at a coarse-grained level (information about the whole system and its overallstructure), at a fine-grained level (information about the structure of classes and class hierarchies), andinformation at an evolutionary level (information about the evolution of the system and the classes). Ourresearch question can thus be broken down into concrete and simpler research questions, such as:
• How big is the software system and how is it structured?
• What is the architecture of the system and what are the subsystems?
• Where are the most important classes and class hierarchies which represent the problem domain andmake the whole software work?
• How are class hierarchies built?
• What is the quality of the software, are all subsystems and/or classes of the same quality, or are therebetter and worse parts in terms of implementation and reusability?
• What are the design and implementation plans of classes and class hierarchies,i.e, how do these lookfrom the inside?
• Where have design patterns [GAMM 95] been used and which ones?
• How did a class or a set of classes or a complete system evolve until its present state?
The goal of this thesis is to provide answers for these and other questions listed in Chapter 2 by usinga lightweight approach based on software visualization enriched with software metrics information. Wecall these visualizationspolymetric views. The polymetric views we present in this thesis reside at thegranularity levels mentioned previously and aim at providing concrete information about a software systemuseful for its reverse engineering. Moreover, our approach aims at supporting existing reverse engineeringapproaches and not to replace them.
1.2 A Short Reverse Engineering State-of-the-Art
There are many approaches to reverse engineering software systems, such as:
• reading the existing documentation and source code. This is difficult when the documentation isobsolete, incorrect or not present at all. Reading the source code is a widely used practice, but doesnot scale up, as reading millions of lines of code would take weeks or months without necessarilyincreasing the understanding of the system by the reader. Moreover, at the beginning of a reverseengineering process one does not seek detailed information, but rather wants to have a general viewof the system.
• running the software and/or generate and analyze execution traces. The use of dynamic information,e.g., information gathered during the execution of a piece of software, has also been used in thecontext of reverse engineering [RICH 99], but has drawbacks in terms of scalability (traces of a fewseconds can become very big) and interpretation (thousands of message invocation can hide theimportant information one is looking for).
2
1.3. OUR APPROACH 3
• interviewing the users and developers. This can give important insights into a software system, butis problematic because of the subjective viewpoints of the interviewed people and because it is hardto formalize and reuse these insights.
• using various tools (visualizers, slicers, query engines, etc.) to generate high-level views of thesource code. Tool support is provided by the research community in various ways, and visualizationtools like Rigi [MU 86] and ShrimpViews [STOR 95] are widely used.
• analyzing the version history. Still a young research field, understanding the evolution of a piece ofsoftware is done using techniques like graph rewriting, visualization, concept analysis, clustering,and data mining. The insights gained is useful to understand the past of a piece of software and topossibly predict its future.
• assessing a software system and its quality by using software metrics. Software metrics tools areused to assess the quality and quantity of source code by computing various metrics which can beused to detect outliers and other parts of interest, for example cohesive classes, coupled subsystems,etc.
Several of these approaches succeed in tackling various problems, but come with advantages and dis-advantages due to the challenges they all face: They mustscale up, because legacy software systems tendto be very large, and they must be flexible and applicable in different contexts, as there is no such thing asa standard reverse engineering context,i.e., every legacy system comes with its own problems and flaws.Moreover, they must be simple and straight-forward to use, because in the fast-paced software industrythere is little time to reverse engineer software systems,i.e., reverse engineering did not yet receive seriousattention, as is also underlined by the scarce application of these approaches in the development process ofsoftware companies.
This is bound to change, as software maintenance is regarded more and more as part of the life-cycleof software systems,e.g, the boundary between software development and software maintenance is be-coming fuzzy. This is also further emphasized by the recent emergence of lightweight, agile, and iterativedevelopment methodologies like eXtreme Programming [COCK 01, BECK 00] that support anevolution-ary view of software: software systems are never finished, they are rather constantly under development.Lehman’s software evolution laws state that software systems must be continually adapted else they be-come progressively less satisfactory [LEHM 85]. Put in simpler words, only dead software systems do notevolve.
1.3 Our Approach
In this thesis we propose a lightweight reverse engineering approach based on simple software visualiza-tions enriched with software metrics, which we callpolymetric views. Polymetric views permit to enricha visualization with up to five different software metrics, two for the size, two for the position, and onefor the color of each node. We implemented a tool calledCodeCrawler[L ANZ 03] which supports thepolymetric views.
In Figure 1.1 we see CodeCrawler showing an example polymetric view called SYSTEM COMPLEXITY.It visualizes classes as nodes and inheritance relationships as edges. The class nodes are enriched with themetrics NOA (number of attributes) for the width, NOM (number of methods) for the height, and LOC(lines of code) for the color. This view permits us to answer questions about the size of the system, aboutthe location of big classes, about the size of classes, etc.
Moreover, our visualizations are interactive,e.g., the user can not only see but also interact (zoom,move, remove, hide, etc.) with the polymetric views. We believe that by making such interactions possible,the gap between the software and the reverse engineer’s mental model of the software can be further nar-rowed. We do not think that our software visualizations alone are enough to tackle the problems of reverseengineering, but claim that our approach is aimed at supporting and complementing other techniques, likethe ones listed above, in order to enhance and facilitate the comprehension of software systems. We ar-gue that simple and lightweight reverse engineering approaches can be exploited faster than heavyweightapproaches, and support existing practices instead of replacing them.
3
4 CHAPTER 1. INTRODUCTION
Figure 1.1: The polymetric view SYSTEM COMPLEXITY applied on CodeCrawler.
According to the program cognition model vocabulary proposed by Littmanet al. [L ITT 96] we supportan approach of understanding that isopportunisticin the sense that it is not based on asystematicline-by-line understanding butas needed. Moreover, to locate our approach in the general context of cognitivemodels [LITT 96] [VON 96], our approach is intended to support the understanding of theimplementationplansat the language level,i.e., classes and methods.
We have developed polymetric views targeting three different granularity levels at which we want togather information about an object-oriented software system, namely at acoarse-grained, fine-grained,and evolutionarylevel.
1. Coarse-grained polymetric views.The target of the coarse-grained polymetric views is to visualizevery large software systems, for which we seek to obtain an initial understanding of their structureand their properties. This information is useful for identifying the parts of a subject system whichneed to be further analyzed, and to obtain an overall view that reduces the complexity inherent insuch systems. We present a selection of coarse-grained polymetric views, which transmit to theviewer a great deal of information (e.g., complete systems are being visualized) in a short time span.The coarse-grained views can answer questions about the overall structure of a system, about thedetection of particular software artifacts, and provide a first impression of a subject system. Further-more based on the coarse-grained views we introduce anapproachto guide software developers inthe first steps of a reverse engineering process of an unknown system.
2. Fine-grained polymetric views: the class blueprint.Theclass blueprintview enables us to focuson the understanding of the core elements of object-oriented programming languages, namely classesand class hierarchies. The goal is to obtain an understanding of the inner structure of one classor several classes at once. Furthermore it it useful for detecting patterns in the implementation of
4
1.4. CONTRIBUTIONS 5
classes and class hierarchies. These patterns help to answer questions regarding the internal structureof classes and class hierarchies and are also useful for the detection of design patterns.
3. Evolutionary software polymetric views: the evolution matrix. Theevolution matrixview visu-alizes the evolution of classes and of software systems by displaying several versions of a softwaresystem at once, thus simplifying the interpretation of the displayed information. Furthermore it isuseful for detecting patterns in the evolution of classes and software systems.
In this thesis we claim that the presented polymetric views enhance the reverse engineering processand provide insights into the structure of object-oriented software software systems at various levels ofunderstanding, namely coarse-grained understanding of large software systems, fine-grained understandingof classes and class hierarchies, and the understanding of the evolution of software systems and classes.
1.4 Contributions
The contributions of this thesis can be summarized as follows:
• The concept of apolymetric view, a lightweight software visualization technique enriched with soft-ware metrics information. At one glance polymetric views can transmit a great deal of informationto a reverse engineer that would otherwise be hard to retrieve and/or combine.
• The presentation and discussion of several polymetric views which all target coarse-grained reverseengineering. These views help to answer questions regarding the overall structure and architectureof a system, help to detect outliers, and give a first general impression of a subject system.
• The development of a reverse engineering methodology based on the coarse-grained polymetricviews which is applicable during the first stages of a reverse engineering process.
• The concept of theclass blueprintview, a fine-grained polymetric view that visualizes the internalstructure of one or more classes.
• Based on our blueprint visualization we identify and categorize several types of patterns that revealinformation about implementation aspects of the classes. These patterns help to answer questionsregarding the fine-grained details of an object-oriented system and provide information about classesand class hierarchies in terms of code quality, coding conventions, detection of design patterns, etc.
• The concept of theevolution matrixview, an evolutionary polymetric view targeted at the visualiza-tion of the evolution of object-oriented software systems.
• The evolution matrix enables us to identify patterns that reveal information about the evolution ofclasses and of systems.
1.5 Thesis Outline
This dissertation is structured as follows:
• In Chapter 2 we introduce the problem domains of reverse engineering and software visualization indetail and point out current approaches, as well as advantages and drawbacks of those solutions.
• In Chapter 3 we introduce and discuss the concept of thepolymetric views. Polymetric views arelightweight software visualizations enriched with metrics information.
• In Chapter 4 we present a reverse engineering approach based on coarse-grained software visualiza-tion which mainly targets large scale software systems by means ofpolymetric views. We call thepresented viewscoarse-grained, because they are mainly applicable to large software systems,i.e.,many of the views scale up. We present several views and discuss them in the context of a reverseengineering methodology which can be used to reverse engineer large software systems.
5
6 CHAPTER 1. INTRODUCTION
• In Chapter 5 we present a fine-grained approach which aims at understanding single classes andclass hierarchies by means of a specific visualization calledclass blueprint. The class blueprintview supports opportunistic code-reading,i.e., it helps us to understand the inner structure of oneor several classes by visualizing a semantically augmented call- and access-graph of the methodsand the attributes of classes. Besides the technical aspects that the class blueprint implies, we es-tablish a vocabulary which identifies the most common and specificvisual patterns, i.e., recurrentgraphical situations. This vocabulary is the basis of a language that reverse engineers can use whencommunicating with each other.
• In Chapter 6 we provide an approach which takes into account the evolution of software systems andis able to visualize it by means of a visualization calledevolution matrix. The evolution matrix allowsfor a quick understanding of (1) the evolution of classes within object-oriented software systems andthe (2) the evolution of the systems themselves. Furthermore we provide a vocabulary of classevolution behavior based onvisual patternswe detect in the evolution matrix view.
• In Chapter 7 we conclude by summarizing the main contributions of our work and give also anoutlook on possible future work in this research field.
• In Appendix A we then add some technical discussions, mainly about the implementation of our toolCodeCrawlerandthe Moose Reengineering Environment.
6
Chapter 2
Object-Oriented Reverse Engineering
2.1 Introduction
The maintenance, reengineering, and evolution of software systems has become a vital matter in today’ssoftware industry. The law ofsoftware entropydictates that most systems with time tend to graduallydecay in quality, unless the systems are maintained and adapted to the evolving requirements. However,many requirements (changing platforms, new functionalities demanded by the users, the fixing of errors,etc.) cannot be anticipated and are hard to fulfill because of the system’s original design and architecture:systems are not prepared to support new platforms, embrace emerging standards, satisfy new customerneeds, and leverage better understood technological advancements. Therefore they must be adapted to doso.
When companies face the decision to maintain and/or reengineer a software system, they must evaluatewhether to rewrite the system from scratch. Sommerville [SOMM 00] and Davis [DAVI 95] estimate thatthe cost of software maintenance accounts for 50% to 75% of the overall cost of a software system, andit would thus seem advisable to rewrite software systems as soon as they fail to fulfill their requirements.Moreover, a lot of software systems can be upgraded, or simply be thrown away and be replaced when theyno longer serve their purposes.
However, certain software systems (legacysoftware systems) are too valuable to be replaced or to berewritten, because their sheer size and complexity makes such a feat too expensive for the owning companyin terms of time and money. In such cases it is more advisable to maintain, reengineer, and evolve suchsystems by adapting them to new requirements [CASA 98, RUGA 98] in order to extend their lifetime andto increase the return of investment of their owners. Indeed, the longer a software system can be used, thebetter it pays off for the company that developed it.
The lifetime of a software system can be extended by maintaining and/or reengineering it. Both soft-ware maintenance and reengineering can be seen as part of a general software evolution process,e.g., thesoftware is evolved in order to keep its value and to cope with new requirements: Lehman’s softwareevolution laws state software systems must be continually adapted else they become progressively lesssatisfactory [LEHM 85].
Before a software system can be reengineered and/or maintained the system must bereverse engineered,e.g., a mental model of the software needs to be built which allows for taking informed decisions. Reverseengineering software systems is difficult due to their sheer size and complexity. However, it is aprerequisitefor their maintenance, reengineering and evolution.
Maintaining and evolving existing software systems is difficult because of several reasons, such asthe accelerating turnover of developers, the increasing size and complexity of software systems, and theconstantly changing requirements of software systems. Theselegacy systemsare large, mature, and com-plex software systems, which are valuable to a company and must therefore be maintained and evolved[CASA 98, RUGA 98].
However, as Parnas [PARN 94] assessed, most legacy systems suffer from typical problems:
• The original developers are no longer available, and often inexperienced developers without system
7
8 CHAPTER 2. OBJECT-ORIENTED REVERSE ENGINEERING
or domain knowledge are assigned to maintain and evolve the systems.
• Outdated software development methods and/or programming languages have been used to originallydevelop the system, and it is hard to find people knowing these techniques or willing to learn them.
• Extensive modifications and patches have been applied to the system, triggering a phenomenon calledarchitectural drift, which makes it hard to understand the original design of the system.
• The documentation is outdated, incomplete or completely missing.
Since legacy systems tend to be large – hundreds of thousands of lines of poorly documented codeare no exception – there is a definite need for effective approaches which help in program understandingand problem detection. We have focused ourselves on object-oriented legacy systems [WILD 92], mainlybecause most current systems are written using this paradigm, and because it is notagethat turns a pieceof software into a legacy system, but therateat which it has been developed and adapted [DEME 02].
Moreover, compared with procedural systems, the reengineering and reverse engineering ofobject-oriented software systems poses many additional challenges [WILD 92], such as polymorphism, late-binding, incremental class definitions by means of inheritance, the dynamic semantics ofself and this.Furthermore, in object-oriented systems the domain model is spread over classes residing in different hi-erarchies and/or subsystems. Indeed, the problem of reverse engineering object-oriented software systemsneeds to be tackled.
Structure of the chapter. In Section 2.2 we discuss reverse engineering as part of the reengineeringlife-cycle of software, present a state-of-the-art and discuss the problems and challenges that reverse engi-neering poses, as well as the constraints it has. We then introduce our approach based on a combination ofsoftware visualization and software metrics in Section 2.3.
2.2 Object-Oriented Reverse Engineering
Reverse engineering is part of thereengineering life-cycle[RAJL 00] [DEME 02]. Chikofsky and Cross de-fine reengineering as “the examination and the alteration of a subject system to reconstitute it in a new formand the subsequent implementation of the new form.” [CHIK 90]. Forward engineering, on the other hand,is defined as “the traditional process of moving from high-level abstractions and logical, implementation-independent designs to the physical implementation of a system” [CHIK 90].
Therefore, if forward engineering is about moving from high-level views of requirements and modelstoward concrete realizations, then reverse engineering is about going backward from some concrete real-ization to more abstract models, and reengineering is about transforming concrete implementations to otherconcrete implementations.
Figure 2.1 illustrates this idea:
• Forward engineeringcan be understood as being a process that moves from high-level and abstractmodels and artifacts to increasingly concrete ones.
• Reverse engineeringreconstructs higher-level models and artifacts from code.
• Reengineeringis a process that transforms one low-level representation to another, while recreatingthe higher-level artifacts along the way [DEME 02].
2.2.1 General Approaches to Reverse Engineering
The goal of a person that is reverse engineering a software system is to build progressively refined mentalmodels of the system [STOR 99] to be able to make informed decisions regarding the software. While thisis not a complex problem for small software systems, where code reading and inspection is often enough,in the case of legacy software systems which tend to be large – hundreds of thousands or millions oflines of poorly documented code are no exception – this becomes a hard problem because of their sheer
8
2.2. OBJECT-ORIENTED REVERSE ENGINEERING 9
Rev
erse
En
gin
eeri
ng F
orw
ard E
ng
ineerin
g
Code
Designs
New RequirementsReengineering"Old" Requirements
Figure 2.1: The reengineering life-cycle of software.
size and complexity, and because of the problems afflicting such systems [PARN 94]. In order to builda progressively refined mental model of a software system, the reverse engineer must gather informationabout the system which helps him in this process.
There are many approaches to reverse engineering software systems, such as:
• reading the existing documentation and source code. Various people have investigated code inspec-tion, code reading, and code review practices [DEKE 02, HEND 02, DEME 02]. Using this approachis difficult when the documentation is obsolete, incorrect or not present at all. Reading the sourcecode is a widely used practice, but does not scale up, as reading millions of lines of code wouldtake weeks or months without necessarily increasing the understanding of the system by the reader.Moreover, at the beginning of a reverse engineering process one does not seek detailed information,but rather wants to have a general view of the system.
• running the software and/or generate and analyze execution traces. The use of dynamic information,e.g., information gathered during the execution of a piece of software, has also been used in the con-text of reverse engineering [RICH 99, JERD 97, RICH 02], but has drawbacks in terms of scalability(traces of a few seconds can become very big) and interpretation (thousands of message invocationcan hide the important information one is looking for).
• interviewing the users and developers. This can give important insights into a software system, butis problematic because of the subjective viewpoints of the interviewed people and because it is hardto formalize and reuse these insights. Moreover, it can be hard to find developers that have beenpart of the development team over long periods of time and thus possess knowledge about a softwaresystem’s complete lifetime.
• using various tools (visualizers, slicers, query engines, etc.) and techniques (visualization, clustering,concept analysis, etc.) to generate high-level views of the source code. Tool support is provided bythe research community in various ways, and visualization tools like Rigi [MU 86] and ShrimpViews[STOR 95] are widely used.
9
10 CHAPTER 2. OBJECT-ORIENTED REVERSE ENGINEERING
• analyzing the version history, as for example done by Jazayeri [JAZA 99]. Still a young researchfield, understanding the evolution of a piece of software is done using techniques like graph rewrit-ing, visualization, concept analysis, clustering, and data mining. The insights gained are useful tounderstand the past of a piece of software and to possibly predict its evolution in the future.
• assessing a software system and its quality by using software metrics. Software metrics tools areused to assess the quality and quantity of source code by computing various metrics which can beused to detect outliers and other parts of interest, for example cohesive classes, coupled subsystems,etc.
In this thesis we present an approach which using software visualization enriched with metrics infor-mation enables us to generate high-level views and thus build a mental model of a system.
Although the term ’legacy system’ is often associated with systems written in older programming lan-guages, recent object-oriented systems suffer from similar problems. Moreover, reengineering is becomingpart of modern software development processes and thus also plays a major role in the development ofsystems written in recent object-oriented programming languages like Java.
2.2.2 Challenges and Goals in Object-Oriented Reverse Engineering
Challenges
Compared with procedural systems, the reverse engineering of object-oriented software systems posesmany additional challenges [WILD 92]. We list some of them:
• Polymorphism and late-binding make traditional tool analyzers like program slicers inadequate.Data-flow analyzers are more complex to build especially in presence of dynamically typed lan-guages.
• The use of inheritance and incremental class definitions, together with the dynamic semantics ofselfandthis, make applications more difficult to understand.
• The domain model of the applications is spread over classes residing in different hierarchies and/orsubsystems and it is difficult to pinpoint the location of a certain functionality.
• Contrary to procedural systems, where a top-down reverse engineering approach can work becauseof the structured decomposition of an application, in the case of object-oriented systems the firstquestion a reverse engineer has to answer is where to start the reverse engineering process.
Apart from these problems, the increased power and flexibility that object-oriented programming broughtto developers can also be harmful, as in the case of misuse of inheritance or the violation of encapsulation.This is mainly due to the fact that programmers still have problems to completely understand the conceptsbehind object-oriented programming. Casais [CASA 98] states that “[...] experience demonstrates thatsoftware developers have trouble imparting object-oriented applications or components with the generalityand adaptability needed for diverse and changing requirements.”
Goals
Chikofsky and Cross state that“The primary purpose ofreverse engineeringa software system is to in-crease the overall comprehensibility of the system for both maintenance and new development”[CHIK 90].They list six key reverse engineering objectives:
1. Cope with complexity
2. Generate alternate views
3. Recover lost information
4. Detect side effects
10
2.3. OUR WORK: SCOPE, CONSTRAINTS, AND GOALS 11
5. Synthesize higher abstractions
6. Facilitate reuse
Before starting a reverse engineering process it is therefore essential to decide which primary goals topursue and which ones are only of secondary importance. Moreover, the listed objectives must be brokendown into concrete research questions whose answer we are seeking. The approaches listed previouslyare useful to follow one or more of these key objectives, for example visualization can generate alternateviews, while software metrics can recover lost information. We argue that these objectives are too generalto be realistic goals, but are composed of smaller and much more concrete objectives.
2.3 Our Work: Scope, Constraints, and Goals
As we have seen, the goal of reverse engineering a large legacy software system is to build a progressivelyrefined mental model of the system in order to make informed decisions regarding the system. Buildingsuch a mental model requires gathering information about the system. We have seen that there are variousapproaches to gather the needed information. We argue that the necessary information resides at variousgranularity levels. In the case of object-oriented systems we think there are three complementary granu-larity levels, namely coarse-grained information about large software systems, fine-grained information ofclasses and class hierarchies, and the information about the evolution of software systems and classes.
In this thesis we propose a lightweight approach that permits to retrieve the information at these variouslevels. We think the approach must be lightweight at this time, as industry is resistant against disruptingtheir development process with new approaches. A lightweight approach, which does not replace existingapproaches, but complements them, has a greater chance of success.
2.3.1 Scope
Our work combines the two techniques of software visualization and software metrics and uses this com-bination to enable us to reverse engineer object-oriented software systems.
Software Visualization
Software visualization is defined as “the use of the crafts of typography, graphic design, animation, andcinematography with modern human-computer interaction and computer graphics technology to facilitateboth the human understanding and effective use of computer software.” [Sta 98]. It is a specialization ofin-formation visualization, whose goal is to visualize any kind of abstract data, while in software visualizationthe sole focus lies on visualizing software.
Information Visualization. Information visualization is defined as “the use of computer-supported,interactive, visual representations of abstract data to amplify cognition.” [Car 99]. It derives from severalcommunities. Starting with Playfair (1786), the classical methods of plotting data were developed. In1967, Jacques Bertin, a French cartographer, published his theory inthe semiology of graphics[BERT 74].This theory identifies the basic elements of diagrams and describes a framework for their design. EdwardTufte published a theory of data graphics that emphasized maximizing the density of useful information[TUFT 90, TUFT 97]. Both Bertin’s and Tufte’s theories have been influential in the various communitiesthat led to the development of information visualization.
The goal of information visualization is tovisualize any kind of data. Note that the above definitionof information visualization does not necessarily imply the use of vision for perception: visualizing doesnot necessarily involvevisualapproaches, but any kind ofperceptiveapproach. Data can be perceived bya person by using the senses at our disposition,i.e., apart from seeing the data, a person can also hear it(information auralization) and/or touch it (by using virtual reality technology). It must be emphasized thatmost information visualization systems involve using computer graphics which render the data using 2D-and/or 3D-views of the data. Applications in information visualization are so frequent and common, thatmost people do not notice them: examples include metereology (weather maps), geography (street maps),
11
12 CHAPTER 2. OBJECT-ORIENTED REVERSE ENGINEERING
geology, medicine (computer-aided displays to show the inner of the human body), transportation (traintables and metro maps), etc.
In short, information visualization is about visualizing almost any kind of data in almost any kind ofway, while software visualization is about visualizing software.
The field of software visualization can be divided in two separate areas [Sta 98]:
1. Program visualizationis the visualization of actual program code or data structures in either static ordynamic form. The approach of the polymetric views presented in this thesis belongs to a sub-areaof program visualization, namelystatic code visualization, because we visualize (object-oriented)source code by using only information which can bestaticallyextracted from the source code withoutthe need to actually run the system.
2. Algorithm visualizationis the visualization of higher-level abstractions which describe software. Agood example isalgorithm animation, which is the dynamic visualization of an algorithm and itsexecution. This was mainly done to explain the inner working of algorithms like sort-algorithms.In the meantime this discipline has lost importance, mainly because the advancement in computerhardware and the possibility to use standard libraries containing such algorithms have shifted thefocus away from the implementation of such algorithms.
Software visualization and reverse engineering.Software visualization has been widely used bythe reverse engineering research community during the past two decades [Sta 98, STOR 97, STOR 98,M.-A 01]. Many of them provide ways to uncover and navigate information about software systems.We omit an in-depth discussion about software visualization work here, as we discuss it in the subsequentchapters in a more context-relevant way. Our approach does not differ very much from existing softwarevisualization techniques, but adds a dimension of understanding more by allowing us to enrich the visual-ization with software metrics information.
Software Metrics
“What is not measurable make measurable.” (Galileo Galilei)
Metrics have long been studied as a way to assess the quality and complexity of software [FENT 96],and recently this has been applied to object-oriented software as well [LORE 94] [HEND 96].
In a reverse engineering context software metrics are interesting because they can be used to assessthe quality and complexity of a system and because they are known to scale up. Furthermore, metrics area good means to control the quality and the state of a software system during the development process[FENT 96]. However, metric measurements often come in huge tables that are hard to interpret, and this iseven more difficult when metrics are combined to generate yet other metrics.
Formally, metrics measure certain properties of a software system by mapping them to numbers (orother symbols) according to well-defined, objective measurement rules. The measurement results are thenused to describe, judge, or predict characteristics of the software system with respect to the property thathas been measured. Usually, measurements are made to provide a foundation of information upon whichdecisions about software engineering tasks can both be planned and performed better.
Metrics can be divided in two groups [LORE 94]:
1. Design Metrics.These metrics are used to assess the size and in some cases the quality, size andcomplexity of software. They take a look at the quality of the project’s design at a particular point inthe development cycle. Design metrics tend to be more locally focused and more specific, therebyallowing them to be used effectively to directly examine and improve the quality of the productcomponents.
2. Project Metrics.They deal with the dynamics of a project, with what it takes to get to a certain pointin the development life cycle and how to know you’re there. They can be used in a predictive manner,for example to estimate staffing requirements. Being at a higher level of abstraction, they are lessprescriptive and more fuzzy but are more important from an overall project perspective.
12
2.3. OUR WORK: SCOPE, CONSTRAINTS, AND GOALS 13
In this work we have decided to usedirect measurementmetrics,e.g., metrics which can be computeddirectly from the source code without using any other kind of information. We have taken choice in orderto comply with the principle to use a lightweight approach.
2.3.2 Constraints
We developed our approach in the context of the European Esprit project FAMOOS, whose main resultshave been summarized in a reengineering handbook [Duc 99] which was the basis for a book on object-oriented reengineering patterns [DEME 02]. The goal of the project was to reengineer several large in-dustrial object-oriented software systems. The industrial setting of the FAMOOS project introduced thefollowing constraints:
• Simplicity. In software industry, reengineers face many problems,i.e., short time constraints, littletool support, and limited manpower. It is for this reason that we wanted our results to be reproduce-able by software engineers at their workplace, without having to rely on complex or expensive tools.Moreover, by choosing a simple, lightweight approach, we were able to get results quickly, in orderto evaluate whether certain ideas were viable or not.
• Scalability. We wanted to make sure that our approach could handle the size of industrial systems,which can be of several millions of lines of code. Scalability is on one hand guaranteed by theuse of software metrics, since metrics can be computed independently from the size of the system.On the other hand our approach allowed us to generate, test and accept/reject new ideas in shortiteration cycles. After starting the development of our approach and the implementation of our toolsto validate the approach, we repeatedly tested them in industrial settings to see whether they wereactually viable and could indeed scale up.
• Language Independence.In order to handle software systems written in different languages, wedeveloped FAMIX [DEME 01, TICH 01], a language independent metamodel. Our implementationin Smalltalk of the FAMIX metamodel, called the Moose Reengineering Environment [DUCA 00],is discussed in Appendix A.
• Short Time. The amount of time to reverse engineer the subject systems was very short, and rangedfrom one or two days to maximum one week. This is too short for a complete reverse engineering,and we thus aimed more at getting araw understandingof the systems.
2.3.3 Goals
When reverse engineering a software system it is of key importance to have clear goals in mind. The sixobjectives listed by Chikofsky and Cross [CHIK 90] are too general to be directly usable as concrete goals.We make here a canonical list of goals we want to achieve when reverse engineering a system,e.g., thefollowing is a list of questions and goals we want to test our approach against. Moreover, we can divide thegoals in three complementary sets which target different levels of understanding, namely coarse-grained,fine-grained, and evolutionary understanding.
In the context of object-oriented legacy systems we settled on the following goals:
• Coarse-grained Goals:
1. Assess the overall quality of the system.
2. Gain an overview of the system in terms of size, complexity, and structure.
3. Locate and understand the most important classes and inheritance hierarchies,i.e., find theclasses and hierarchies that represent a core part of the system’s domain and understand theirdesign, structure in terms of implementation, and purpose in terms of functionality.
4. Identify exceptional classes in terms of size and/or complexity compared to all classes in thesubject system. These may be candidates for a further inspection or for the application ofrefactorings.
13
14 CHAPTER 2. OBJECT-ORIENTED REVERSE ENGINEERING
5. Identify exceptional methods in terms of size and/or complexity compared to the average ofthe methods in the subject system. These may be candidates for a further inspection regardingduplicated code or for the application of refactorings.
6. Locate unused,e.g., dead code. This can be unused attributes, methods that are never invokedor that have commented method bodies, unreferenced classes, etc.
• Fine-grained Goals:
1. Understand the concrete implementation of classes and class hierarchies, and detect commonpatterns or coding styles. Look for signs of inconsistencies like the use of accessors.
2. Identify the possible presence of design patterns or occasions where design patterns could beintroduced to ameliorate the system’s structure.
3. Build a mental image of a class in terms of method invocations and state access.
4. Understand the class/subclass roles.
5. Identify key methods in a class.
• Evolutionary Goals:
1. Understand the evolution of object-oriented software systems in terms of size and growth rate.
2. Understand at which point in time classes have been introduced into a system and at whichmoment they have been removed.
3. Understand how classes grow and shrink in terms of the number of methods and the number ofattributes.
4. See if there are patterns in the evolution of classes. Such patterns help to understand the con-dition of a class in a time perspective,e.g., how resistant to software evolution processes isa class, is it changed with every release of a system, or are there classes which are virtuallyimmune to software evolution?
The result of a reverse engineering process is therefore not necessarily a list of problematic classes orsubsystems, even if the identification of possible design defects is a valuable piece of information. The goalof a reverse engineer is to understand the overall structure of the application, to gain a better understandingof the inheritance relationships between classes, and to gain an overview of the methods and the way theyare organized. Indeed, we are looking for the bad use as well as the good use of object-oriented design. Inthat sense, knowing that an inheritance hierarchy is well designed is also valuable information.
Moreover, in a reengineering context the fact that a class may have a design problem does not necessar-ily imply that the class should be redesigned. Indeed, if a badly designed class or subsystem accomplishesthe work it has been assigned to, without having a negative impact on the overall working of the system,there is no point in changing it. However, being aware of such information is still valuable for getting abetter mental model of the system.
2.4 Conclusions
In this chapter we analyzed the problems of reverse engineering in general and of reverse engineering forobject-oriented systems in particular. We have seen that the maintenance and evolution of legacy softwaresystems constitute major problems that software engineers need to tackle, because the systems in questionare too complex and too valuable to be replaced or to be rewritten from scratch. We discussed the limits andbenefits of present approaches to solve those problems and then positioned our own approach (presented indetail in Chapter 3), which is a lightweight combination of software visualization and software metrics.
From a common set of abstract reverse engineering objectives we derived a set of goals that we want toobtain and against which we will evaluate our work.
14
Chapter 3
The Polymetric View
In this chapter we present the different aspects of our approach, which ultimately leads to the constructionof lightweight software visualizations enriched with software metrics. We call these visualizationspoly-metric views.
Structure of the chapter. First we present how we use metrics to enrich our visualizations (Sec-tion 3.1). Then we present a selection of the metrics at our disposal (Section 3.2). Finally we presentwhich ingredients are needed to yield visualizations, illustrate two examples of such polymetric views, anddiscuss how a polymetric view is to be interpreted.
3.1 The Principle
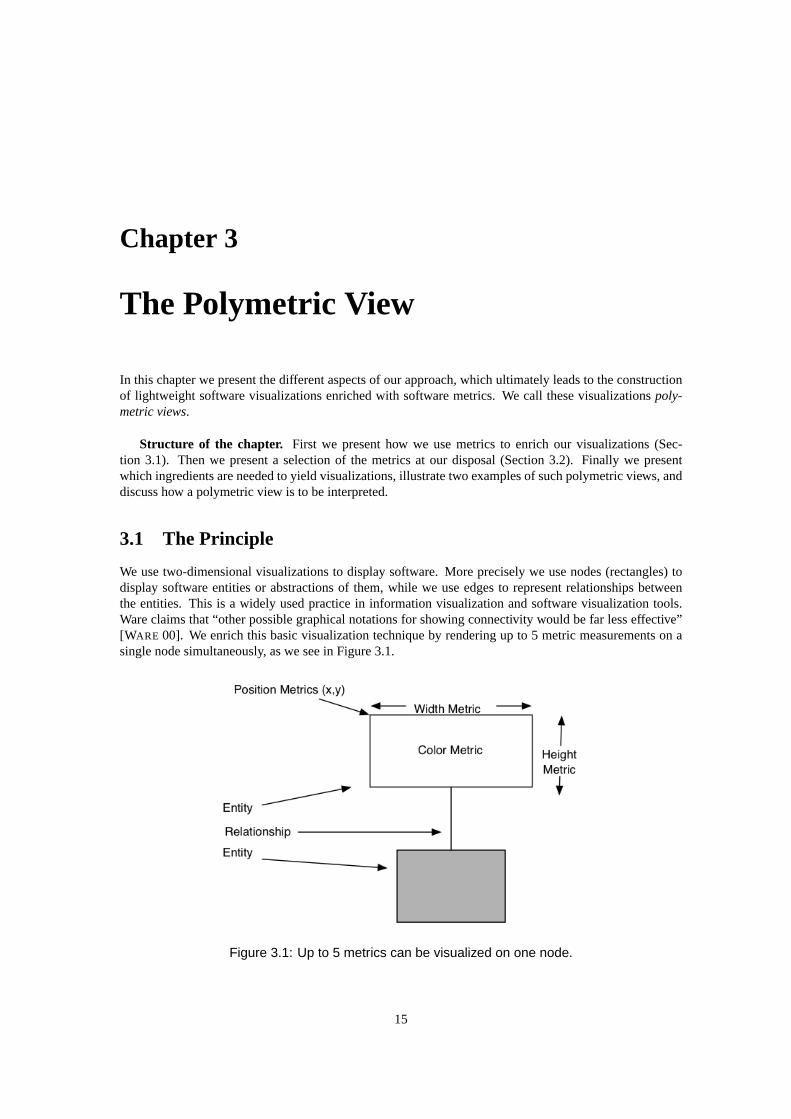
We use two-dimensional visualizations to display software. More precisely we use nodes (rectangles) todisplay software entities or abstractions of them, while we use edges to represent relationships betweenthe entities. This is a widely used practice in information visualization and software visualization tools.Ware claims that “other possible graphical notations for showing connectivity would be far less effective”[WARE 00]. We enrich this basic visualization technique by rendering up to 5 metric measurements on asingle node simultaneously, as we see in Figure 3.1.
Figure 3.1: Up to 5 metrics can be visualized on one node.
15
16 CHAPTER 3. THE POLYMETRIC VIEW
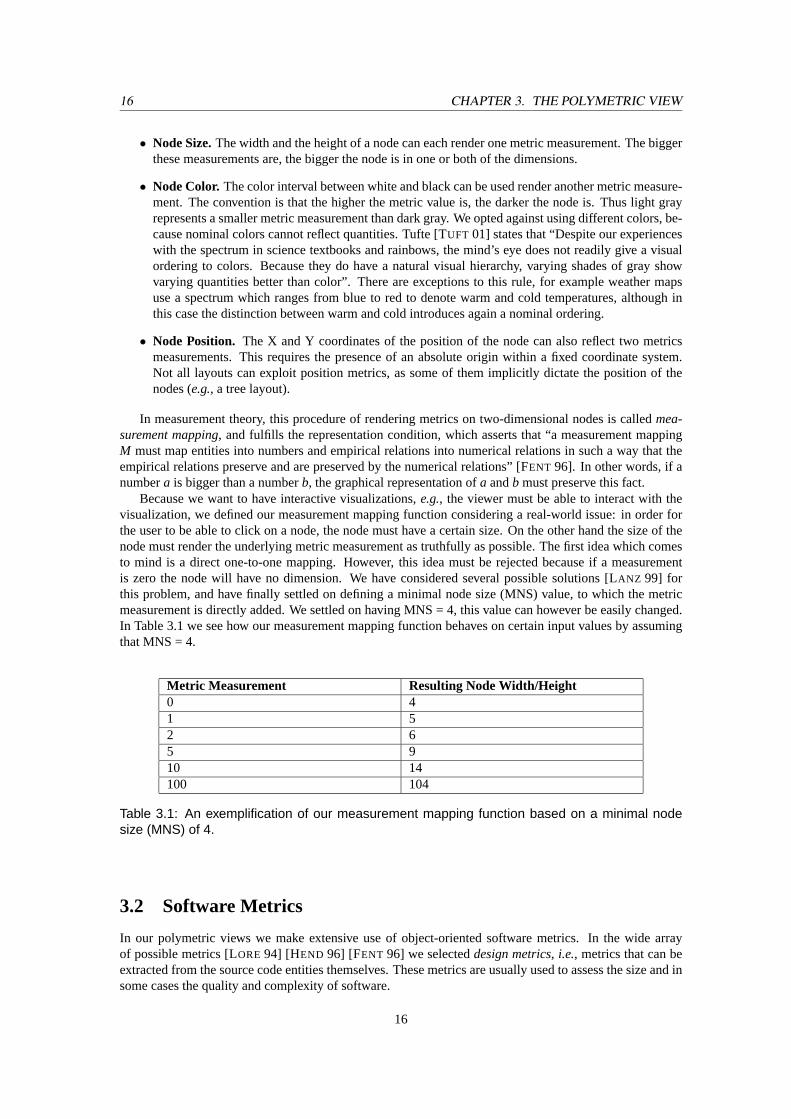
• Node Size.The width and the height of a node can each render one metric measurement. The biggerthese measurements are, the bigger the node is in one or both of the dimensions.
• Node Color. The color interval between white and black can be used render another metric measure-ment. The convention is that the higher the metric value is, the darker the node is. Thus light grayrepresents a smaller metric measurement than dark gray. We opted against using different colors, be-cause nominal colors cannot reflect quantities. Tufte [TUFT 01] states that “Despite our experienceswith the spectrum in science textbooks and rainbows, the mind’s eye does not readily give a visualordering to colors. Because they do have a natural visual hierarchy, varying shades of gray showvarying quantities better than color”. There are exceptions to this rule, for example weather mapsuse a spectrum which ranges from blue to red to denote warm and cold temperatures, although inthis case the distinction between warm and cold introduces again a nominal ordering.
• Node Position. The X and Y coordinates of the position of the node can also reflect two metricsmeasurements. This requires the presence of an absolute origin within a fixed coordinate system.Not all layouts can exploit position metrics, as some of them implicitly dictate the position of thenodes (e.g., a tree layout).
In measurement theory, this procedure of rendering metrics on two-dimensional nodes is calledmea-surement mapping, and fulfills the representation condition, which asserts that “a measurement mappingM must map entities into numbers and empirical relations into numerical relations in such a way that theempirical relations preserve and are preserved by the numerical relations” [FENT 96]. In other words, if anumbera is bigger than a numberb, the graphical representation ofa andb must preserve this fact.
Because we want to have interactive visualizations,e.g., the viewer must be able to interact with thevisualization, we defined our measurement mapping function considering a real-world issue: in order forthe user to be able to click on a node, the node must have a certain size. On the other hand the size of thenode must render the underlying metric measurement as truthfully as possible. The first idea which comesto mind is a direct one-to-one mapping. However, this idea must be rejected because if a measurementis zero the node will have no dimension. We have considered several possible solutions [LANZ 99] forthis problem, and have finally settled on defining a minimal node size (MNS) value, to which the metricmeasurement is directly added. We settled on having MNS = 4, this value can however be easily changed.In Table 3.1 we see how our measurement mapping function behaves on certain input values by assumingthat MNS = 4.
Metric Measurement Resulting Node Width/Height0 41 52 65 910 14100 104
Table 3.1: An exemplification of our measurement mapping function based on a minimal nodesize (MNS) of 4.
3.2 Software Metrics
In our polymetric views we make extensive use of object-oriented software metrics. In the wide arrayof possible metrics [LORE 94] [HEND 96] [FENT 96] we selecteddesign metrics, i.e., metrics that can beextracted from the source code entities themselves. These metrics are usually used to assess the size and insome cases the quality and complexity of software.
16
3.2. SOFTWARE METRICS 17
The metrics we use are termeddirect measurementmetrics because their computation involves no otherattributes or entities [FENT 96]. We don’t make use ofindirect measurementwhere metrics are combinedto generate new ones, because themeasurement mappingpresented in the previous section works bestwith direct measurements. Examples of indirect metrics includeprogrammer productivity, defect detectiondensityor module defect density, as well as more code-oriented ones likeCBO and RFC, presented in[CHID 94]. We chose to use metrics that can be extracted from source code entities, and which have asimple and clear definition. As such we don’t usecomposite metrics, which raise the issue of dimensionalconsistency [HEND 96].
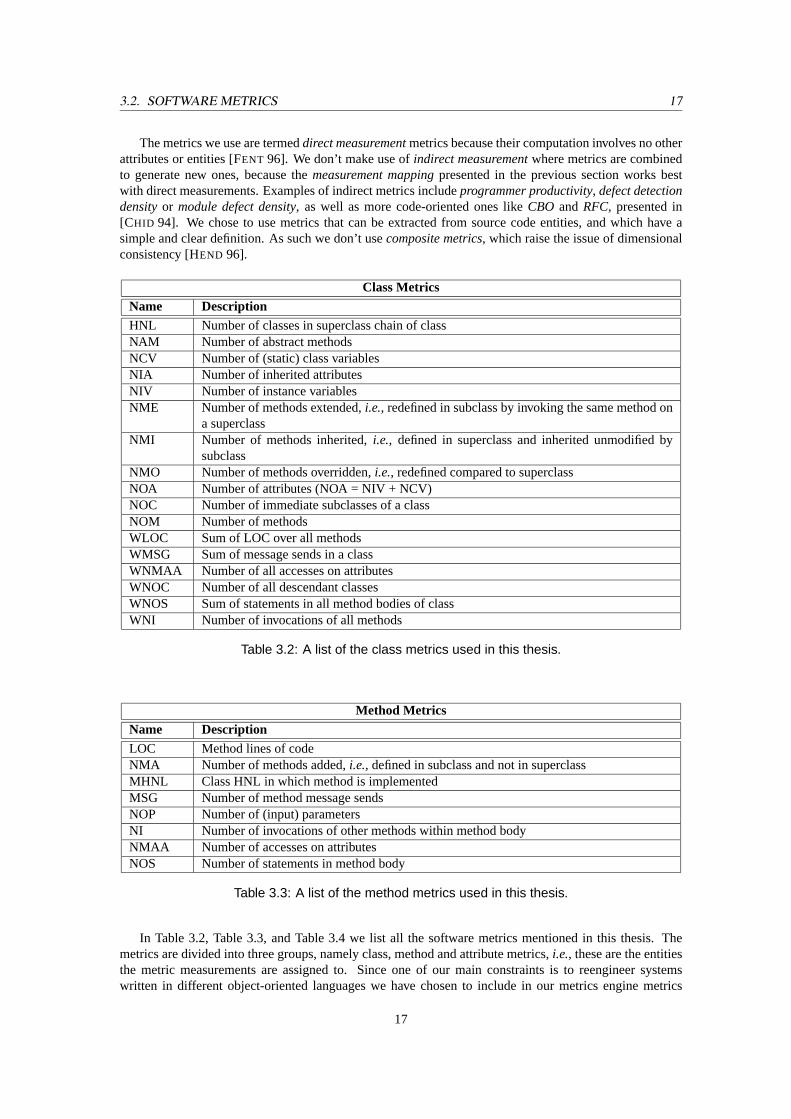
Class MetricsName DescriptionHNL Number of classes in superclass chain of classNAM Number of abstract methodsNCV Number of (static) class variablesNIA Number of inherited attributesNIV Number of instance variablesNME Number of methods extended,i.e., redefined in subclass by invoking the same method on
a superclassNMI Number of methods inherited,i.e., defined in superclass and inherited unmodified by
subclassNMO Number of methods overridden,i.e., redefined compared to superclassNOA Number of attributes (NOA = NIV + NCV)NOC Number of immediate subclasses of a classNOM Number of methodsWLOC Sum of LOC over all methodsWMSG Sum of message sends in a classWNMAA Number of all accesses on attributesWNOC Number of all descendant classesWNOS Sum of statements in all method bodies of classWNI Number of invocations of all methods
Table 3.2: A list of the class metrics used in this thesis.
Method MetricsName DescriptionLOC Method lines of codeNMA Number of methods added,i.e., defined in subclass and not in superclassMHNL Class HNL in which method is implementedMSG Number of method message sendsNOP Number of (input) parametersNI Number of invocations of other methods within method bodyNMAA Number of accesses on attributesNOS Number of statements in method body
Table 3.3: A list of the method metrics used in this thesis.
In Table 3.2, Table 3.3, and Table 3.4 we list all the software metrics mentioned in this thesis. Themetrics are divided into three groups, namely class, method and attribute metrics,i.e., these are the entitiesthe metric measurements are assigned to. Since one of our main constraints is to reengineer systemswritten in different object-oriented languages we have chosen to include in our metrics engine metrics
17
18 CHAPTER 3. THE POLYMETRIC VIEW
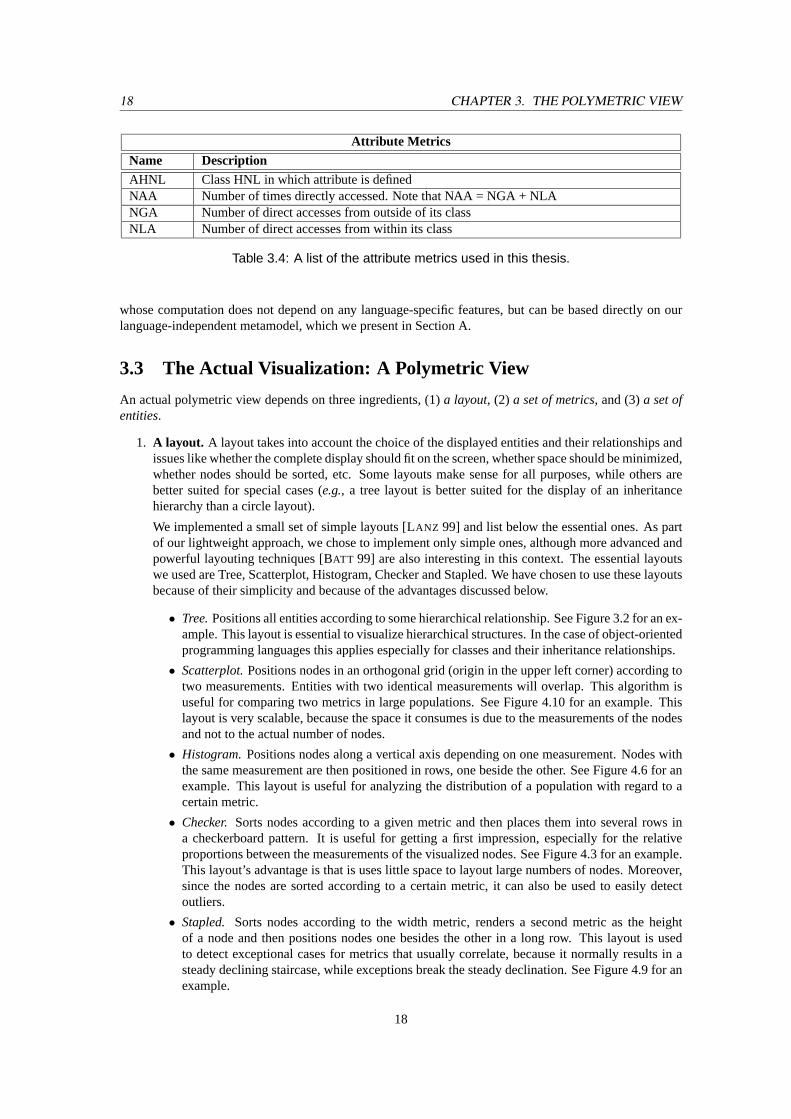
Attribute MetricsName DescriptionAHNL Class HNL in which attribute is definedNAA Number of times directly accessed. Note that NAA = NGA + NLANGA Number of direct accesses from outside of its classNLA Number of direct accesses from within its class
Table 3.4: A list of the attribute metrics used in this thesis.
whose computation does not depend on any language-specific features, but can be based directly on ourlanguage-independent metamodel, which we present in Section A.
3.3 The Actual Visualization: A Polymetric View
An actual polymetric view depends on three ingredients, (1)a layout, (2) a set of metrics, and (3)a set ofentities.
1. A layout. A layout takes into account the choice of the displayed entities and their relationships andissues like whether the complete display should fit on the screen, whether space should be minimized,whether nodes should be sorted, etc. Some layouts make sense for all purposes, while others arebetter suited for special cases (e.g., a tree layout is better suited for the display of an inheritancehierarchy than a circle layout).
We implemented a small set of simple layouts [LANZ 99] and list below the essential ones. As partof our lightweight approach, we chose to implement only simple ones, although more advanced andpowerful layouting techniques [BATT 99] are also interesting in this context. The essential layoutswe used are Tree, Scatterplot, Histogram, Checker and Stapled. We have chosen to use these layoutsbecause of their simplicity and because of the advantages discussed below.
• Tree.Positions all entities according to some hierarchical relationship. See Figure 3.2 for an ex-ample. This layout is essential to visualize hierarchical structures. In the case of object-orientedprogramming languages this applies especially for classes and their inheritance relationships.
• Scatterplot.Positions nodes in an orthogonal grid (origin in the upper left corner) according totwo measurements. Entities with two identical measurements will overlap. This algorithm isuseful for comparing two metrics in large populations. See Figure 4.10 for an example. Thislayout is very scalable, because the space it consumes is due to the measurements of the nodesand not to the actual number of nodes.
• Histogram.Positions nodes along a vertical axis depending on one measurement. Nodes withthe same measurement are then positioned in rows, one beside the other. See Figure 4.6 for anexample. This layout is useful for analyzing the distribution of a population with regard to acertain metric.
• Checker. Sorts nodes according to a given metric and then places them into several rows ina checkerboard pattern. It is useful for getting a first impression, especially for the relativeproportions between the measurements of the visualized nodes. See Figure 4.3 for an example.This layout’s advantage is that is uses little space to layout large numbers of nodes. Moreover,since the nodes are sorted according to a certain metric, it can also be used to easily detectoutliers.
• Stapled. Sorts nodes according to the width metric, renders a second metric as the heightof a node and then positions nodes one besides the other in a long row. This layout is usedto detect exceptional cases for metrics that usually correlate, because it normally results in asteady declining staircase, while exceptions break the steady declination. See Figure 4.9 for anexample.
18
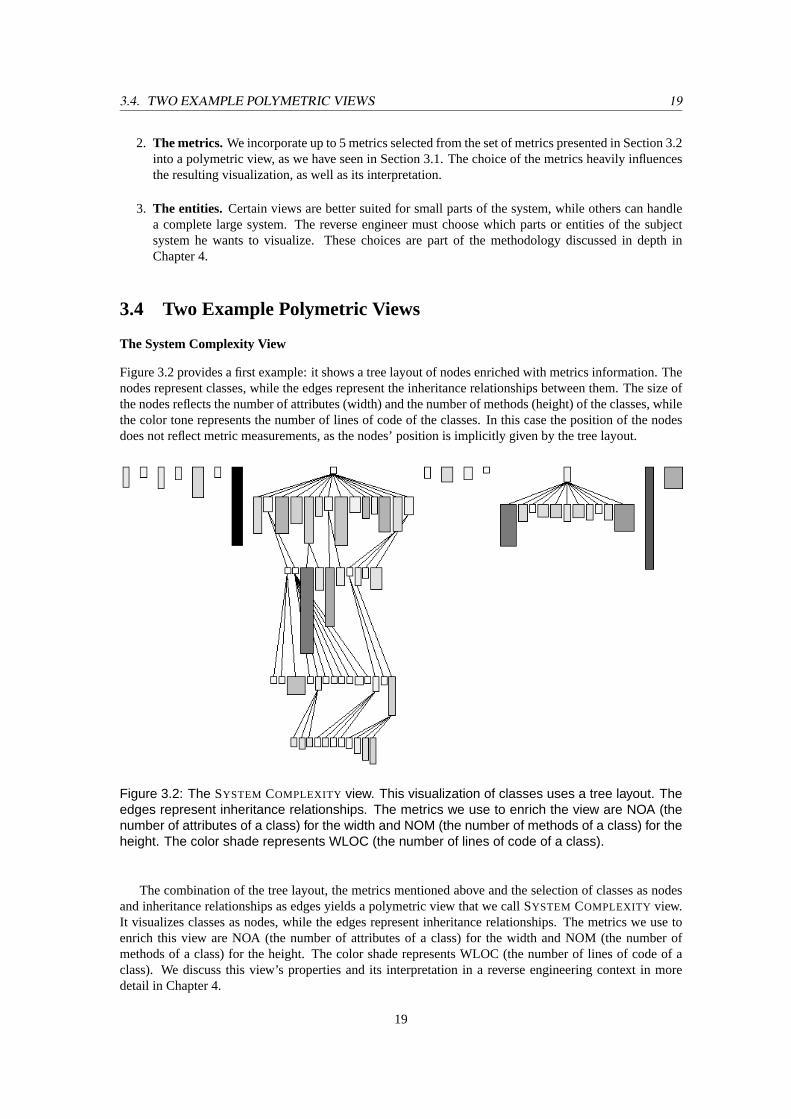
3.4. TWO EXAMPLE POLYMETRIC VIEWS 19
2. The metrics. We incorporate up to 5 metrics selected from the set of metrics presented in Section 3.2into a polymetric view, as we have seen in Section 3.1. The choice of the metrics heavily influencesthe resulting visualization, as well as its interpretation.
3. The entities. Certain views are better suited for small parts of the system, while others can handlea complete large system. The reverse engineer must choose which parts or entities of the subjectsystem he wants to visualize. These choices are part of the methodology discussed in depth inChapter 4.
3.4 Two Example Polymetric Views
The System Complexity View
Figure 3.2 provides a first example: it shows a tree layout of nodes enriched with metrics information. Thenodes represent classes, while the edges represent the inheritance relationships between them. The size ofthe nodes reflects the number of attributes (width) and the number of methods (height) of the classes, whilethe color tone represents the number of lines of code of the classes. In this case the position of the nodesdoes not reflect metric measurements, as the nodes’ position is implicitly given by the tree layout.
Figure 3.2: The SYSTEM COMPLEXITY view. This visualization of classes uses a tree layout. Theedges represent inheritance relationships. The metrics we use to enrich the view are NOA (thenumber of attributes of a class) for the width and NOM (the number of methods of a class) for theheight. The color shade represents WLOC (the number of lines of code of a class).
The combination of the tree layout, the metrics mentioned above and the selection of classes as nodesand inheritance relationships as edges yields a polymetric view that we call SYSTEM COMPLEXITY view.It visualizes classes as nodes, while the edges represent inheritance relationships. The metrics we use toenrich this view are NOA (the number of attributes of a class) for the width and NOM (the number ofmethods of a class) for the height. The color shade represents WLOC (the number of lines of code of aclass). We discuss this view’s properties and its interpretation in a reverse engineering context in moredetail in Chapter 4.
19
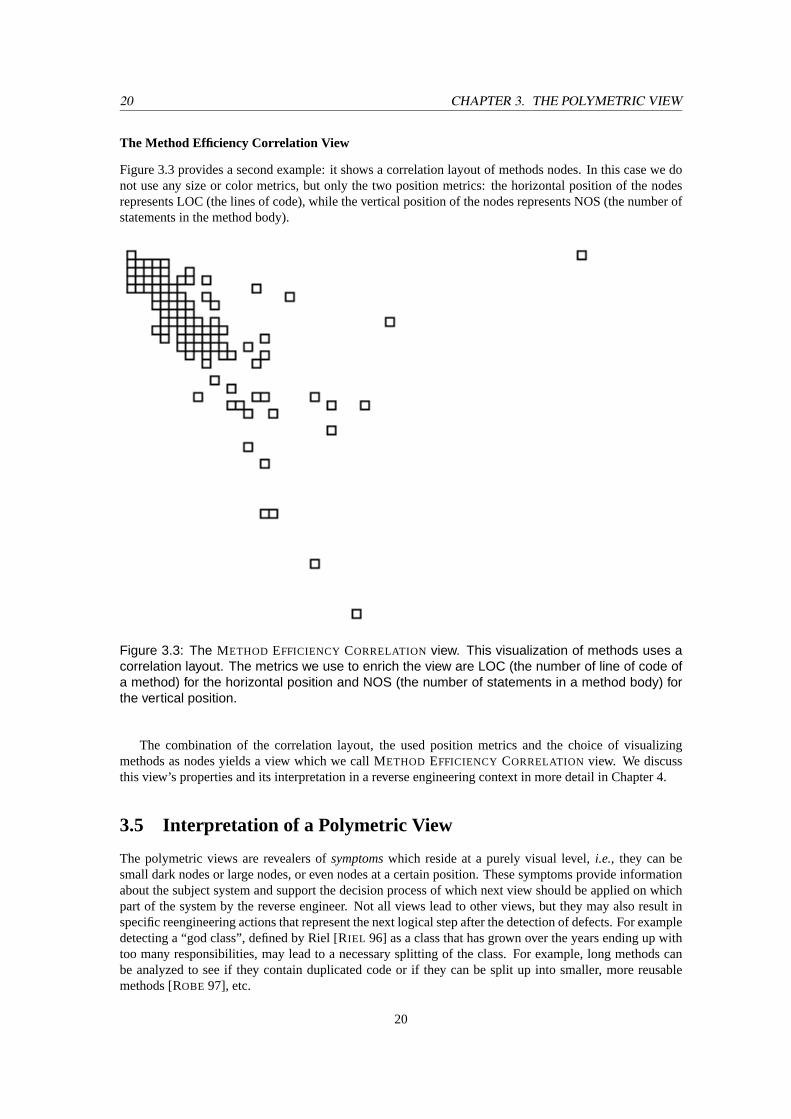
20 CHAPTER 3. THE POLYMETRIC VIEW
The Method Efficiency Correlation View
Figure 3.3 provides a second example: it shows a correlation layout of methods nodes. In this case we donot use any size or color metrics, but only the two position metrics: the horizontal position of the nodesrepresents LOC (the lines of code), while the vertical position of the nodes represents NOS (the number ofstatements in the method body).
Figure 3.3: The METHOD EFFICIENCY CORRELATION view. This visualization of methods uses acorrelation layout. The metrics we use to enrich the view are LOC (the number of line of code ofa method) for the horizontal position and NOS (the number of statements in a method body) forthe vertical position.
The combination of the correlation layout, the used position metrics and the choice of visualizingmethods as nodes yields a view which we call METHOD EFFICIENCY CORRELATION view. We discussthis view’s properties and its interpretation in a reverse engineering context in more detail in Chapter 4.
3.5 Interpretation of a Polymetric View
The polymetric views are revealers ofsymptomswhich reside at a purely visual level,i.e., they can besmall dark nodes or large nodes, or even nodes at a certain position. These symptoms provide informationabout the subject system and support the decision process of which next view should be applied on whichpart of the system by the reverse engineer. Not all views lead to other views, but they may also result inspecific reengineering actions that represent the next logical step after the detection of defects. For exampledetecting a “god class”, defined by Riel [RIEL 96] as a class that has grown over the years ending up withtoo many responsibilities, may lead to a necessary splitting of the class. For example, long methods canbe analyzed to see if they contain duplicated code or if they can be split up into smaller, more reusablemethods [ROBE 97], etc.
20
3.6. USEFUL POLYMETRIC VIEWS 21
3.6 Useful Polymetric Views
Since our approach allows one to combine a subset of the presented metrics with a layout algorithm onany kind of software artifacts, there is a great number of possible views. However, many of those aresimilar to others (e.g., by exchanging the width and height metrics) and many others do not help the reverseengineering process. We identified a number ofusefulviews, i.e., polymetric views that are useful for thereverse engineering process, and present a subset of them in the next chapter.
3.7 Discussion
We shortly discuss several questions that may arise regarding the polymetric views.
• 2D vs 3D.One may argue that using three-dimensional displays instead of two-dimensional onescould further increase the amount of information conveyed by the polymetric views. Brown andNajork [Sta 98] advocate the use of 3D over 2D in software visualizations for the following reasons:
1. Expressing fundamental information about structures that are inherently two-dimensional.Thismeans we could visualize yet another metric. However, our experiments and experience haveshown that the meaningful combination of metrics and visualization techniques already put astrain on the viewer, the gain that would result from having the possibility to visualize a metricmore would thus only be marginal.
2. Uniting multiple views of an object.This means that 3D can be used as a multiple 2D view. Inour visualizations we use multiple windows to reach the same effect.
3. Capturing a history of a two-dimensional view.In Chapter 6 we present and discuss a polymet-ric view which allows us to visualize the evolution of software entities without needing to usethe third dimension.
The main reason why we chose not to use three-dimensional displays is that we consistently wantedto use lightweight approaches, and the added complexity in terms of graphical output and navigationwould have contradicted this.
• Composite metrics. One could argue that the more complex and expressive the metrics are, themore they information they convey. For example we could use metrics like LCOM (low cohesion ofmethods) [CHID 94] to display classes.
However, although this may yield interesting results (as we discuss in the chapter on future work), webelieve that using direct measurement metrics which can be extracted from the source code withoutneeding other information complies more with our lightweight approach and also prevents us frommeddling with composite metrics, many of which still lack a clear and widely recognized definition.Moreover, composite metrics are often not natural numbers, but only fractions (for example between0 and 1), and such numbers would need to be multiplied in order to have a visual impact on ourviews. However, this would not fit our measurement mapping approach described previously.
• Other Visual Variables. Bertin [BERT 74] established a vocabulary of visual variables which can beused to encode information. In the polymetric views we use for example the variables of size, color,and position. We could enhance the polymetric views even further by using other visual variables likeshape (class nodes look differently than method nodes, for example with rounded corners), texturedesign, texture orientation, etc.
This is part of our future work, Bertin and Tufte have both shown that one can find a better-than-average way of displaying information. Moreover, the number of polymetric views that we found byusing 5 visual variables is already great, and adding more visual variables must be done carefully toprevent a visual overload.
21
Chapter 4
Coarse-grained Software Visualization
4.1 Introduction
Reverse engineering large object-oriented software systems is a task which needs to be performed sys-tematically, otherwise one risks getting lost in unimportant details. Since the systems in question are toolarge to be understood by reading the code, there is a need for a systematic approach. Moreover, sincethe object-oriented paradigm does not support a reading order (i.e., the domain model is distributed acrossclasses, hierarchies, and subsystems without an explicit beginning or end), as in the case of proceduralprogramming languages, the reverse engineer needs to know where to start looking into the system in orderto understand its structure. The goal of the first phase of a reverse engineering (e.g., the first week) is togain a general impression of the system (what are we looking at?) and to get to know the particularitiesof the system (what are we looking for?). This goal can be broken down into concrete questions whoseanswer we are seeking at the beginning, which is a subset of the goals identified in Chapter 2.
Summary. In this chapter we try to answer a set of concrete reverse engineering questions by usingcoarse-grained polymetric views. We present several polymetric views1, grouped in clusters, which areuseful for the reverse engineering of large object-oriented software systems. With these coarse-grainedpolymetric views we are targeting the first phase (e.g., the first week) of a reverse engineering process,because in this phase a reverse engineer forms his first mental picture of the system [STOR 99]. We call theviews presented herecoarse-grained, because they are mainly applicable to complete and large softwaresystems,i.e., many of these views scale up. The grouping of the views into clusters eases the reading, butdoes also provide guidelines of the context in which certain polymetric views can be applied. Moreover,we present a reverse engineering approach based on the polymetric views, which not only discusses whatto look for in certain views, but also suggests which polymetric views to apply in which situations.
Contributions. The contributions of this chapter are the following:
• The definition and description of several coarse-grainedpolymetric views, lightweight software visu-alizations enriched with software metrics information. By applying these views to an object-orientedsoftware system, we show that we can answer a set of concrete reverse engineering questions.
• The presentation of a reverse engineering approach based on these polymetric views, which targetsthe first phase of a reverse engineering process, and which is useful to guide a reverse engineer.
Structure of the chapter. In Section 4.2 we start by discussing the goals of the process that musttake place in order to reverse engineer a large software system. We then motivate the need for a reverseengineering approach and introduce our own approach. In Section 4.3 we exemplify it by applying severalpolymetric views on the same case study and by discussing the views in detail. We then make an evaluation
1This chapter is an extended version of the articlePolymetric Views - A Lightweight Visual Approach to Reverse Engineering,accepted for publication in the journal IEEE Transactions on Software Engineering, IEEE Press.
22
4.2. THE REVERSE ENGINEERING PROCESS 23
of the case study and report on our industrial experiences. Finally we discuss related work (Section 4.4)and then conclude in Section 4.5 by discussing our findings and evaluating future work.
4.2 The Reverse Engineering Process
Before starting a reverse engineering, it is essential to decide which primary goals to pursue and whichones are only of secondary importance. In the following, we present a short canonical list of primary goalswe have inferred from our own reverse engineering experience, and which is a subset of the goals listed inChapter 2. From the first phase of a reverse engineering process we expect to obtain the following results:
• Assess the overall quality of the system
• Gain an overview of the system in terms of size, complexity, and structure.
• Locate and understand the most important classes and inheritance hierarchies,i.e., find the classesand hierarchies that represent a core part of the system’s domain and understand their design, struc-ture in terms of implementation, and purpose in terms of functionality.
• Identify exceptional classes in terms of size and/or complexity compared to all classes in the subjectsystem. These may be candidates for a further inspection or for the application of refactorings.
• Identify exceptional methods in terms of size and/or complexity compared to the average of themethods in the subject system. These may be candidates for a further inspection regarding duplicatedcode or for the application of refactorings.
• Locate unused,e.g., dead code. This can be unused attributes, methods that are never invoked or thathave commented method bodies, unreferenced classes, etc.
We would like to stress that the result of a reverse engineering process is therefore not necessarily alist of problematic classes or subsystems, even if the identification of possible design defects is a valuablepiece of information. The goal of a reverse engineer is to understand the overall structure of the application,to gain a better understanding of the inheritance relationships between classes, and to gain an overview ofthe methods and the way they are organized. Indeed, we are looking for the bad use as well as the gooduse of object-oriented design. In that sense, knowing that an inheritance hierarchy is well designed is alsovaluable information.
Moreover, in a reengineering context the fact that a class may have a design problem does not necessar-ily imply that the class should be redesigned. Indeed, if a badly designed class or subsystem accomplishesthe work it has been assigned to, without having a negative impact on the overall working of the system,there is no point in changing it. However, since reengineers are often not the original developers of thesystem they are maintaining, being aware of such information is still valuable for getting a better mentalmodel of the system.
4.2.1 A Reverse Engineering Approach Based on Clusters of Polymetric Views
Our approach is based on clusters that loosely group coarse-grained polymetric views depending on thesituation encountered by the reverse engineer and the information provided by the view. Each of theseclusters is presented in detail in the following sections. We identified four clusters: First Contact, Inheri-tance Assessment, Candidate Detection, and Class Internal which is discussed in Chapter 5. The views ineach cluster provide answers to the questions listed previously, and also answer minor questions that canbe derived from those.
In Figure 4.1 we have represented the four clusters of useful views in the context of time. Note thatduring the process the reverse engineer navigates back and forth from view to view, depending on theencountered symptoms and on the goals of the reverse engineering process. The primary goal is to get aninitial understanding of the system which helps the reverse engineer to develop a first mental model of thelegacy system [DEME 02].
23
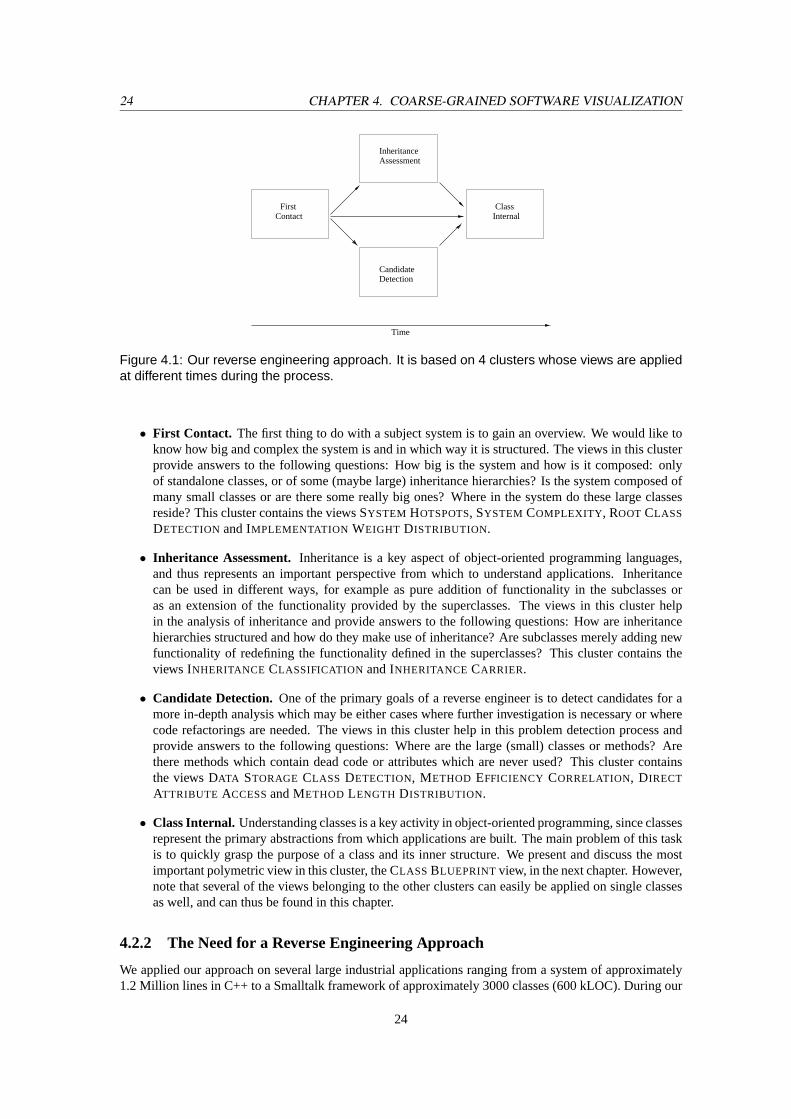
24 CHAPTER 4. COARSE-GRAINED SOFTWARE VISUALIZATION
Time
DetectionCandidate
FirstContact
InheritanceAssessment
ClassInternal
Figure 4.1: Our reverse engineering approach. It is based on 4 clusters whose views are appliedat different times during the process.
• First Contact. The first thing to do with a subject system is to gain an overview. We would like toknow how big and complex the system is and in which way it is structured. The views in this clusterprovide answers to the following questions: How big is the system and how is it composed: onlyof standalone classes, or of some (maybe large) inheritance hierarchies? Is the system composed ofmany small classes or are there some really big ones? Where in the system do these large classesreside? This cluster contains the views SYSTEM HOTSPOTS, SYSTEM COMPLEXITY, ROOT CLASS
DETECTION and IMPLEMENTATION WEIGHT DISTRIBUTION.
• Inheritance Assessment.Inheritance is a key aspect of object-oriented programming languages,and thus represents an important perspective from which to understand applications. Inheritancecan be used in different ways, for example as pure addition of functionality in the subclasses oras an extension of the functionality provided by the superclasses. The views in this cluster helpin the analysis of inheritance and provide answers to the following questions: How are inheritancehierarchies structured and how do they make use of inheritance? Are subclasses merely adding newfunctionality of redefining the functionality defined in the superclasses? This cluster contains theviews INHERITANCE CLASSIFICATION and INHERITANCE CARRIER.
• Candidate Detection. One of the primary goals of a reverse engineer is to detect candidates for amore in-depth analysis which may be either cases where further investigation is necessary or wherecode refactorings are needed. The views in this cluster help in this problem detection process andprovide answers to the following questions: Where are the large (small) classes or methods? Arethere methods which contain dead code or attributes which are never used? This cluster containsthe views DATA STORAGE CLASS DETECTION, METHOD EFFICIENCY CORRELATION, DIRECT
ATTRIBUTE ACCESSand METHOD LENGTH DISTRIBUTION.
• Class Internal. Understanding classes is a key activity in object-oriented programming, since classesrepresent the primary abstractions from which applications are built. The main problem of this taskis to quickly grasp the purpose of a class and its inner structure. We present and discuss the mostimportant polymetric view in this cluster, the CLASS BLUEPRINT view, in the next chapter. However,note that several of the views belonging to the other clusters can easily be applied on single classesas well, and can thus be found in this chapter.
4.2.2 The Need for a Reverse Engineering Approach
We applied our approach on several large industrial applications ranging from a system of approximately1.2 Million lines in C++ to a Smalltalk framework of approximately 3000 classes (600 kLOC). During our
24
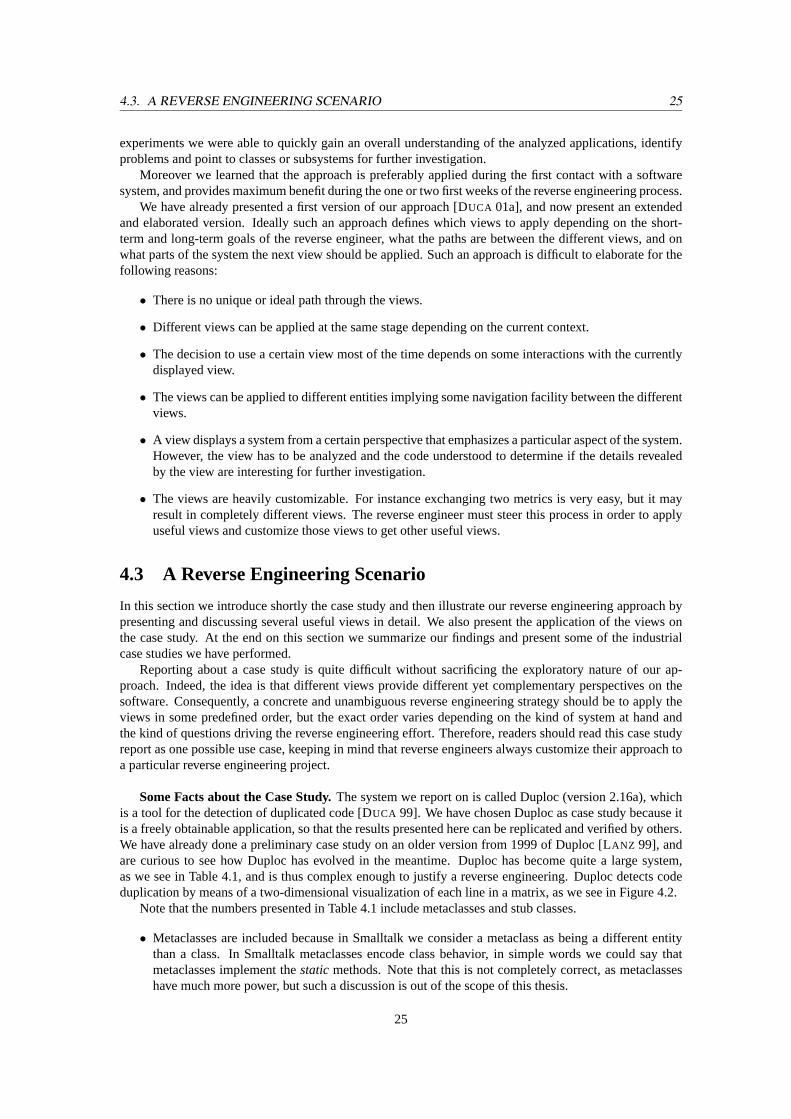
4.3. A REVERSE ENGINEERING SCENARIO 25
experiments we were able to quickly gain an overall understanding of the analyzed applications, identifyproblems and point to classes or subsystems for further investigation.
Moreover we learned that the approach is preferably applied during the first contact with a softwaresystem, and provides maximum benefit during the one or two first weeks of the reverse engineering process.
We have already presented a first version of our approach [DUCA 01a], and now present an extendedand elaborated version. Ideally such an approach defines which views to apply depending on the short-term and long-term goals of the reverse engineer, what the paths are between the different views, and onwhat parts of the system the next view should be applied. Such an approach is difficult to elaborate for thefollowing reasons:
• There is no unique or ideal path through the views.
• Different views can be applied at the same stage depending on the current context.
• The decision to use a certain view most of the time depends on some interactions with the currentlydisplayed view.
• The views can be applied to different entities implying some navigation facility between the differentviews.
• A view displays a system from a certain perspective that emphasizes a particular aspect of the system.However, the view has to be analyzed and the code understood to determine if the details revealedby the view are interesting for further investigation.
• The views are heavily customizable. For instance exchanging two metrics is very easy, but it mayresult in completely different views. The reverse engineer must steer this process in order to applyuseful views and customize those views to get other useful views.
4.3 A Reverse Engineering Scenario
In this section we introduce shortly the case study and then illustrate our reverse engineering approach bypresenting and discussing several useful views in detail. We also present the application of the views onthe case study. At the end on this section we summarize our findings and present some of the industrialcase studies we have performed.
Reporting about a case study is quite difficult without sacrificing the exploratory nature of our ap-proach. Indeed, the idea is that different views provide different yet complementary perspectives on thesoftware. Consequently, a concrete and unambiguous reverse engineering strategy should be to apply theviews in some predefined order, but the exact order varies depending on the kind of system at hand andthe kind of questions driving the reverse engineering effort. Therefore, readers should read this case studyreport as one possible use case, keeping in mind that reverse engineers always customize their approach toa particular reverse engineering project.
Some Facts about the Case Study.The system we report on is called Duploc (version 2.16a), whichis a tool for the detection of duplicated code [DUCA 99]. We have chosen Duploc as case study because itis a freely obtainable application, so that the results presented here can be replicated and verified by others.We have already done a preliminary case study on an older version from 1999 of Duploc [LANZ 99], andare curious to see how Duploc has evolved in the meantime. Duploc has become quite a large system,as we see in Table 4.1, and is thus complex enough to justify a reverse engineering. Duploc detects codeduplication by means of a two-dimensional visualization of each line in a matrix, as we see in Figure 4.2.
Note that the numbers presented in Table 4.1 include metaclasses and stub classes.
• Metaclasses are included because in Smalltalk we consider a metaclass as being a different entitythan a class. In Smalltalk metaclasses encode class behavior, in simple words we could say thatmetaclasses implement thestaticmethods. Note that this is not completely correct, as metaclasseshave much more power, but such a discussion is out of the scope of this thesis.
25
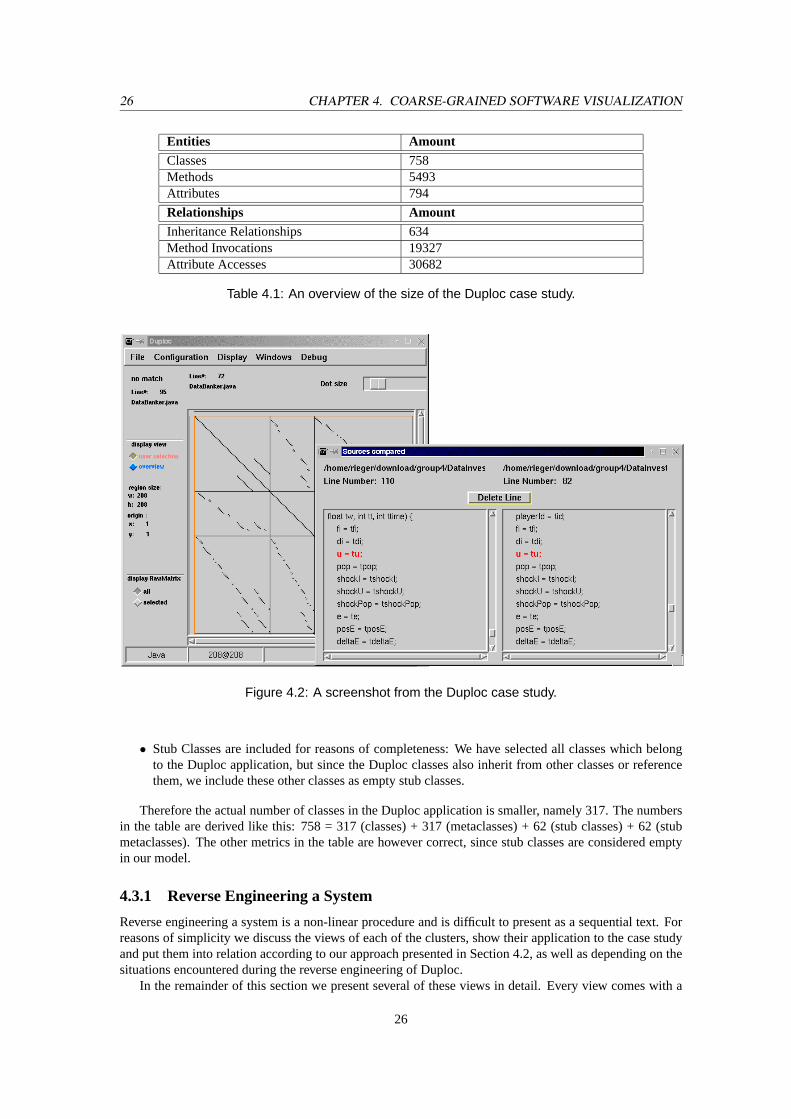
26 CHAPTER 4. COARSE-GRAINED SOFTWARE VISUALIZATION
Entities AmountClasses 758Methods 5493Attributes 794
Relationships AmountInheritance Relationships 634Method Invocations 19327Attribute Accesses 30682
Table 4.1: An overview of the size of the Duploc case study.
Figure 4.2: A screenshot from the Duploc case study.
• Stub Classes are included for reasons of completeness: We have selected all classes which belongto the Duploc application, but since the Duploc classes also inherit from other classes or referencethem, we include these other classes as empty stub classes.
Therefore the actual number of classes in the Duploc application is smaller, namely 317. The numbersin the table are derived like this: 758 = 317 (classes) + 317 (metaclasses) + 62 (stub classes) + 62 (stubmetaclasses). The other metrics in the table are however correct, since stub classes are considered emptyin our model.
4.3.1 Reverse Engineering a System
Reverse engineering a system is a non-linear procedure and is difficult to present as a sequential text. Forreasons of simplicity we discuss the views of each of the clusters, show their application to the case studyand put them into relation according to our approach presented in Section 4.2, as well as depending on thesituations encountered during the reverse engineering of Duploc.
In the remainder of this section we present several of these views in detail. Every view comes with a
26

4.3. A REVERSE ENGINEERING SCENARIO 27
small description which includes the name of the view, the used layout, the scope of the view, the entitieswhich it visualizes, and a list of the used metrics, and an optional sort criterion according to which the nodeshave been sorted, and which in some cases influences the position of the nodes. Moreover, we provide adetailed description of the view which includes the following: First a short presentation of the idea behindthe view, then a list of the symptoms the viewer should watch out for, and finally possible variations of aview and their effects. Interspersed in the text we also point out other related views which could be applied.Then we apply the views on the case study and discuss the findings.
27

28 CHAPTER 4. COARSE-GRAINED SOFTWARE VISUALIZATION
4.3.2 First Contact Views
The main purpose of these views is to obtain a first overview of a subject system. This cluster contains thefollowing views:
1. SYSTEM HOTSPOTSV IEW
2. SYSTEM COMPLEXITY V IEW
3. ROOT CLASS DETECTION V IEW
4. IMPLEMENTATION WEIGHT DISTRIBUTION V IEW
28

4.3. A REVERSE ENGINEERING SCENARIO 29
SYSTEM HOTSPOTSV IEW
Layout CheckerNodes ClassesEdges -Scope Full SystemMetricsSize NOA (number of attributes) NOM (number of methods)Color -Position - -Sort WidthExample Figure 4.3
Description
This simple view helps to identify large and small classes and scales up to very large systems. It relatesthe number of methods with the number of attributes of a class. The nodes are sorted according to thenumber of methods, which makes the identification of outliers easy.
Reverse Engineering Goals
This view gives a general impression of the system in terms of overall size (how many nodes are there?)and in terms of the size of the classes (are there any really large nodes and how many large nodes are there?)
Symptoms
1. Large nodes represent voluminous classes that may be further investigated.
2. Tall, narrow nodes represent classes which define many methods and few or no attributes.
3. Wide nodes are classes with many attributes. When such nodes show a 1:2 width-height ratio itmay represent a class whose main purpose is to be a data structure implementing mostly accessormethods.
Variations
1. If we use the lines of code (WLOC) or the number of methods (NOM), as we see in Figure 4.3 forrendering both the width and height of the nodes, we obtain a slightly different view which helpsto assess the whole system in terms of raw measure: are there any big classes and how big are theyactually?
2. In the case of Smalltalk classes, we can color metaclasses differently and check how they distributethemselves across the display. Should there now be large, colored nodes at the bottom of the display,it may be a sign that these metaclasses have too many responsibilities or that they function facadesor as bridges to other classes [GAMM 95].
3. Further evidence can be gained from the color, which can be used to reflect the number of lines ofcode of a class. Should a tall class have a light color it means that the class contains mostly shortmethods.
Scenario
In Figure 4.3 we see all the Duploc classes. The classes in the bottom row contain more than 100methods and should be further investigated. They areDuplocPresentationModelController (107 methods),
29
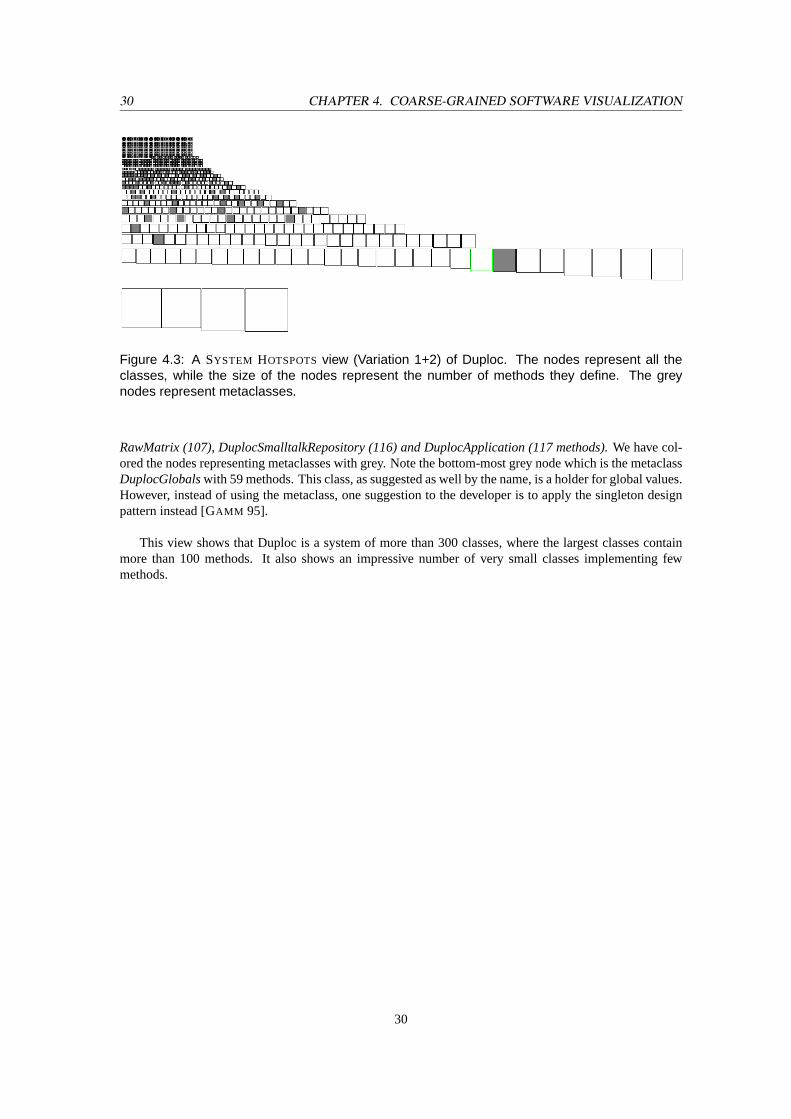
30 CHAPTER 4. COARSE-GRAINED SOFTWARE VISUALIZATION
Figure 4.3: A SYSTEM HOTSPOTSview (Variation 1+2) of Duploc. The nodes represent all theclasses, while the size of the nodes represent the number of methods they define. The greynodes represent metaclasses.
RawMatrix (107), DuplocSmalltalkRepository (116) and DuplocApplication (117 methods).We have col-ored the nodes representing metaclasses with grey. Note the bottom-most grey node which is the metaclassDuplocGlobalswith 59 methods. This class, as suggested as well by the name, is a holder for global values.However, instead of using the metaclass, one suggestion to the developer is to apply the singleton designpattern instead [GAMM 95].
This view shows that Duploc is a system of more than 300 classes, where the largest classes containmore than 100 methods. It also shows an impressive number of very small classes implementing fewmethods.
30
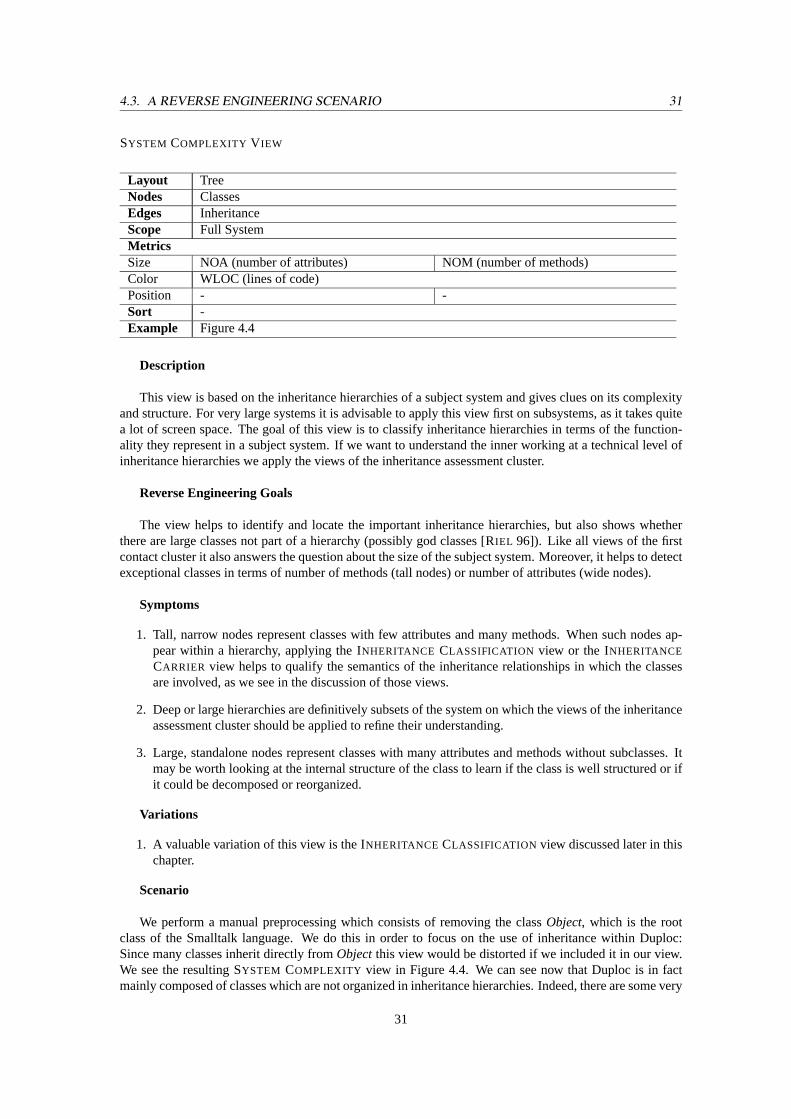
4.3. A REVERSE ENGINEERING SCENARIO 31
SYSTEM COMPLEXITY V IEW
Layout TreeNodes ClassesEdges InheritanceScope Full SystemMetricsSize NOA (number of attributes) NOM (number of methods)Color WLOC (lines of code)Position - -Sort -Example Figure 4.4
Description
This view is based on the inheritance hierarchies of a subject system and gives clues on its complexityand structure. For very large systems it is advisable to apply this view first on subsystems, as it takes quitea lot of screen space. The goal of this view is to classify inheritance hierarchies in terms of the function-ality they represent in a subject system. If we want to understand the inner working at a technical level ofinheritance hierarchies we apply the views of the inheritance assessment cluster.
Reverse Engineering Goals
The view helps to identify and locate the important inheritance hierarchies, but also shows whetherthere are large classes not part of a hierarchy (possibly god classes [RIEL 96]). Like all views of the firstcontact cluster it also answers the question about the size of the subject system. Moreover, it helps to detectexceptional classes in terms of number of methods (tall nodes) or number of attributes (wide nodes).
Symptoms
1. Tall, narrow nodes represent classes with few attributes and many methods. When such nodes ap-pear within a hierarchy, applying the INHERITANCE CLASSIFICATION view or the INHERITANCE
CARRIER view helps to qualify the semantics of the inheritance relationships in which the classesare involved, as we see in the discussion of those views.
2. Deep or large hierarchies are definitively subsets of the system on which the views of the inheritanceassessment cluster should be applied to refine their understanding.
3. Large, standalone nodes represent classes with many attributes and methods without subclasses. Itmay be worth looking at the internal structure of the class to learn if the class is well structured or ifit could be decomposed or reorganized.
Variations
1. A valuable variation of this view is the INHERITANCE CLASSIFICATION view discussed later in thischapter.
Scenario
We perform a manual preprocessing which consists of removing the classObject, which is the rootclass of the Smalltalk language. We do this in order to focus on the use of inheritance within Duploc:Since many classes inherit directly fromObjectthis view would be distorted if we included it in our view.We see the resulting SYSTEM COMPLEXITY view in Figure 4.4. We can see now that Duploc is in factmainly composed of classes which are not organized in inheritance hierarchies. Indeed, there are some very
31
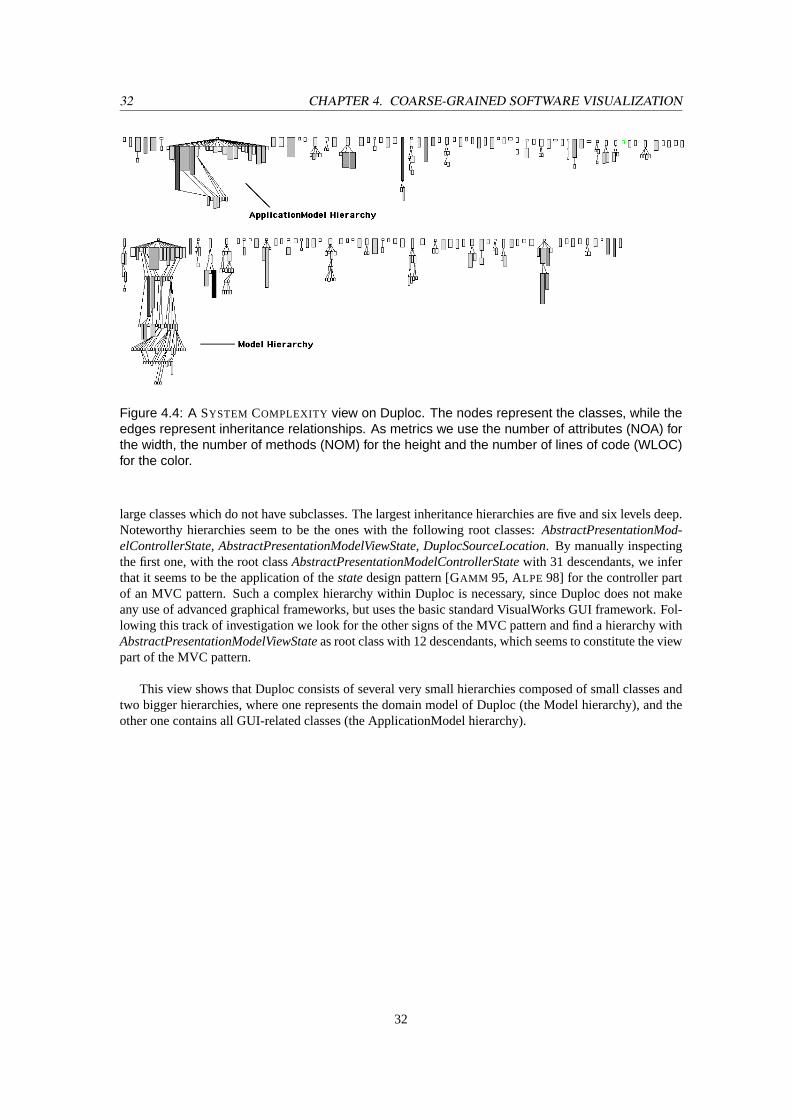
32 CHAPTER 4. COARSE-GRAINED SOFTWARE VISUALIZATION
Figure 4.4: A SYSTEM COMPLEXITY view on Duploc. The nodes represent the classes, while theedges represent inheritance relationships. As metrics we use the number of attributes (NOA) forthe width, the number of methods (NOM) for the height and the number of lines of code (WLOC)for the color.
large classes which do not have subclasses. The largest inheritance hierarchies are five and six levels deep.Noteworthy hierarchies seem to be the ones with the following root classes:AbstractPresentationMod-elControllerState, AbstractPresentationModelViewState, DuplocSourceLocation. By manually inspectingthe first one, with the root classAbstractPresentationModelControllerStatewith 31 descendants, we inferthat it seems to be the application of thestatedesign pattern [GAMM 95, ALPE 98] for the controller partof an MVC pattern. Such a complex hierarchy within Duploc is necessary, since Duploc does not makeany use of advanced graphical frameworks, but uses the basic standard VisualWorks GUI framework. Fol-lowing this track of investigation we look for the other signs of the MVC pattern and find a hierarchy withAbstractPresentationModelViewStateas root class with 12 descendants, which seems to constitute the viewpart of the MVC pattern.
This view shows that Duploc consists of several very small hierarchies composed of small classes andtwo bigger hierarchies, where one represents the domain model of Duploc (the Model hierarchy), and theother one contains all GUI-related classes (the ApplicationModel hierarchy).
32
4.3. A REVERSE ENGINEERING SCENARIO 33
ROOT CLASS DETECTION V IEW
Layout ScatterplotNodes ClassesEdges -Scope Full SystemMetricsSize - -Color -Position WNOC (number of descendants) NOC (number of subclasses)Sort -Example Figure 4.5
Description
This view helps in identifying therootsof inheritance hierarchies by putting in relation the number ofdirect subclasses with the number of descendant classes,i.e., all direct and indirect subclasses. This viewis mainly useful for very large systems, where a view like SYSTEM COMPLEXITY may have problems torepresent the whole system on one screen.
Reverse Engineering Goals
This view helps to identify the roots of the large inheritance hierarchies, and depending on the numberof nodes that are more to the right also gives an impression of the overall use of inheritance in the system.
Symptoms
1. Nodes to the right of the display have many descendants.
2. Nodes to the bottom of the display have many direct subclasses.
Figure 4.5: A ROOT CLASS DETECTION view (Variation 1) of Duploc. The horizontal position of theclass nodes renders the number of descendants of each class, while the vertical position rendersthe number of immediate subclasses of each class.
Variations
1. If we use a different color to denote abstract classes, we are able to see whether the top-level classes(the nodes to the right and bottom of the display) are declared as such, as we would expect.
33
34 CHAPTER 4. COARSE-GRAINED SOFTWARE VISUALIZATION
Scenario
We expect that this view will confirm our findings obtained with the SYSTEM COMPLEXITY view.Indeed, as we see in Figure 4.5 there are two classes which stand out from the others,AbstractPresenta-tionModelControllerState, PMCSwith 31 and 30 descendants, The latter is the sole direct subclass of theformer. We have colored the classes in case they are abstract, and see thatPMCSis not abstract, although atthe top of the largest inheritance hierarchy. After a short verification, we see that in factPMCShas in turnabstract subclasses. Note that this is possible – although not advisable – in Smalltalk, because there are noconstructs at the language level which declare a class as being abstract, like in the case of C++ and Java. InSmalltalk the abstractness of a class is implied by declaring one of its methods as abstract. However, thisis an idiom and not enforced at a language level.
This view shows that Duploc has only two major inheritance hierarchies, as is denoted by only twooutlying nodes.
34
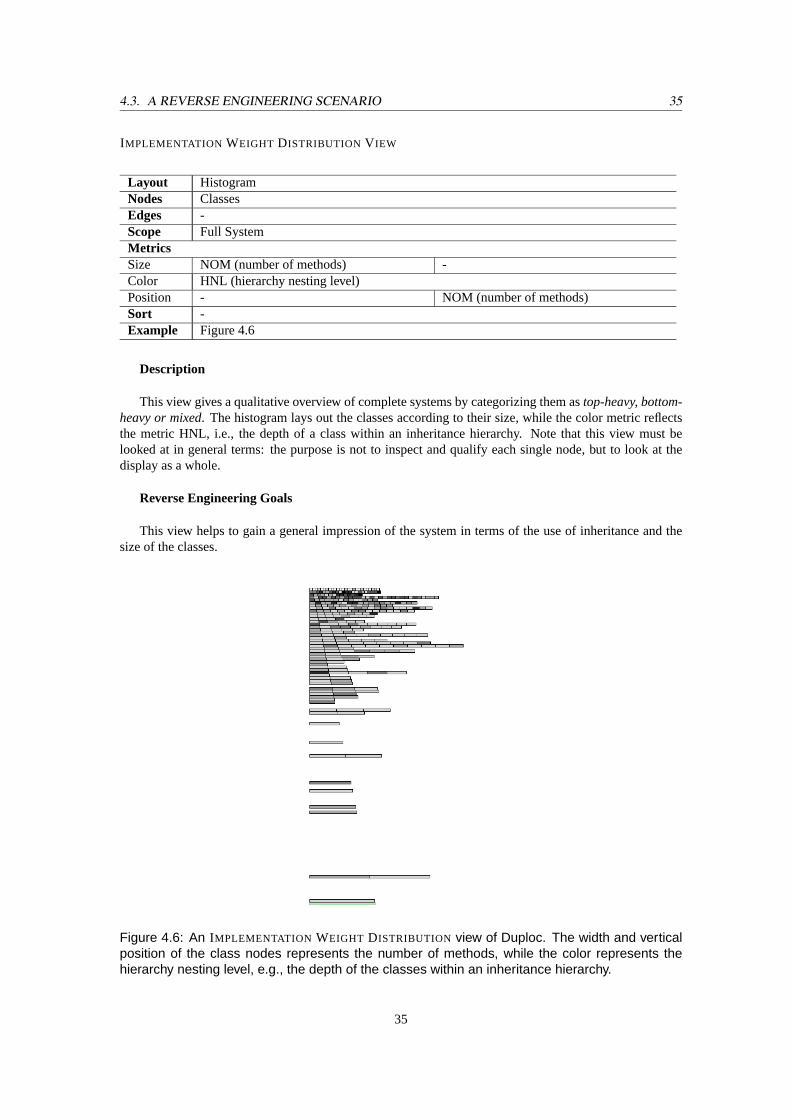
4.3. A REVERSE ENGINEERING SCENARIO 35
IMPLEMENTATION WEIGHT DISTRIBUTION V IEW
Layout HistogramNodes ClassesEdges -Scope Full SystemMetricsSize NOM (number of methods) -Color HNL (hierarchy nesting level)Position - NOM (number of methods)Sort -Example Figure 4.6
Description
This view gives a qualitative overview of complete systems by categorizing them astop-heavy, bottom-heavy or mixed. The histogram lays out the classes according to their size, while the color metric reflectsthe metric HNL, i.e., the depth of a class within an inheritance hierarchy. Note that this view must belooked at in general terms: the purpose is not to inspect and qualify each single node, but to look at thedisplay as a whole.
Reverse Engineering Goals
This view helps to gain a general impression of the system in terms of the use of inheritance and thesize of the classes.
Figure 4.6: An IMPLEMENTATION WEIGHT DISTRIBUTION view of Duploc. The width and verticalposition of the class nodes represents the number of methods, while the color represents thehierarchy nesting level, e.g., the depth of the classes within an inheritance hierarchy.
35

36 CHAPTER 4. COARSE-GRAINED SOFTWARE VISUALIZATION
Symptoms
1. Dark nodes at the bottom of the display represent large classes deep within a hierarchy. Such systemsare bottom-heavy, because these symptoms reveal that the larger classes in the system are mainly atthe bottom of inheritance hierarchies, which may be a result of abuse of abstraction mechanisms.
2. Light nodes at the bottom of the display reveal that the large classes in the system reside in the higherlevels of the inheritance hierarchies, which may be also a problem, as subclassing large and complexclasses can be difficult.
3. The light and dark nodes are evenly distributed across the display, which classifies the system asbeing mixed.
Variations
None
Scenario
We gather from Figure 4.6 that according to the definition of this view, Duploc is a top-heavy system,i.e., the main weight of its implementation resides in the top-level classes.
This view shows that Duploc does not have very large classes, because the histogram would have beentaller then. It also shows that there are few large classes towards the bottom of the inheritance hierarchies.This is also due to the fact that Duploc consists mostly of small inheritance hierarchies.
36

4.3. A REVERSE ENGINEERING SCENARIO 37
4.3.3 Inheritance Assessment Views
These views help to understand and qualify the use of inheritance in a subject system. This cluster containsthe following views:
1. INHERITANCE CLASSIFICATION V IEW
2. INHERITANCE CARRIER V IEW
3. INTERMEDIATE ABSTRACT V IEW
37
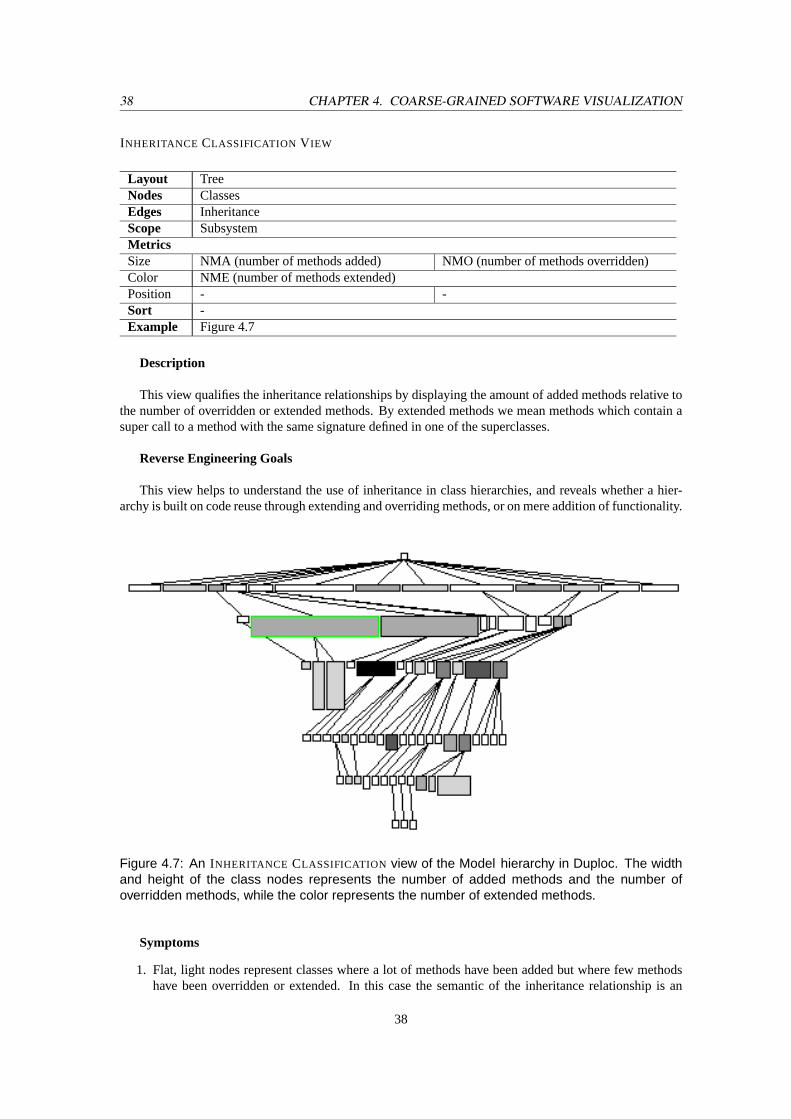
38 CHAPTER 4. COARSE-GRAINED SOFTWARE VISUALIZATION
INHERITANCE CLASSIFICATION V IEW
Layout TreeNodes ClassesEdges InheritanceScope SubsystemMetricsSize NMA (number of methods added) NMO (number of methods overridden)Color NME (number of methods extended)Position - -Sort -Example Figure 4.7
Description
This view qualifies the inheritance relationships by displaying the amount of added methods relative tothe number of overridden or extended methods. By extended methods we mean methods which contain asuper call to a method with the same signature defined in one of the superclasses.
Reverse Engineering Goals
This view helps to understand the use of inheritance in class hierarchies, and reveals whether a hier-archy is built on code reuse through extending and overriding methods, or on mere addition of functionality.
Figure 4.7: An INHERITANCE CLASSIFICATION view of the Model hierarchy in Duploc. The widthand height of the class nodes represents the number of added methods and the number ofoverridden methods, while the color represents the number of extended methods.
Symptoms
1. Flat, light nodes represent classes where a lot of methods have been added but where few methodshave been overridden or extended. In this case the semantic of the inheritance relationship is an
38
4.3. A REVERSE ENGINEERING SCENARIO 39
addition of functionality by the subclasses.
2. Tall, possibly darker nodes represent classes where a lot of methods have been overridden and/orextended. They may represent classes that have specialized hook methods [GAMM 95]. If the nodesare dark, it means that many methods have been extended, which hints at a higher degree of reuse offunctionality.
Variations
None
Scenario
We have selected only one hierarchy, the one indicated as theModelhierarchy in Figure 4.4, to demon-strate the application of this view. We see in Figure 4.7 that theModelhierarchy is mainly composed of flat,lightly colored nodes: these classes mainly add functionality (denoted by their width) without really over-riding or extending functionality defined in the superclasses. We also see there are some exceptions: thesubclasses of the two widest class nodes (RawMatrixandAbstractRawSubMatrix) with 96 and 72 addedmethods define several methods which are then overridden or extended by their subclasses. For exam-ple the two subclasses (SymmetricRawMatrixandAsymmetricRawMatrix) of RawMatrixheavily overridefunctionality, as is indicated by their tall, narrow shape: both override 33 methods and add only 4, respec-tively 9, methods.
This view applied on theModelhierarchy of Duploc shows that inheritance is used in both senses,e.g.,there are parts of this hierarchy where classes add new methods, and other parts where classes reuse andcomplement the functionality defined in their superclasses by extending or overriding methods.
39
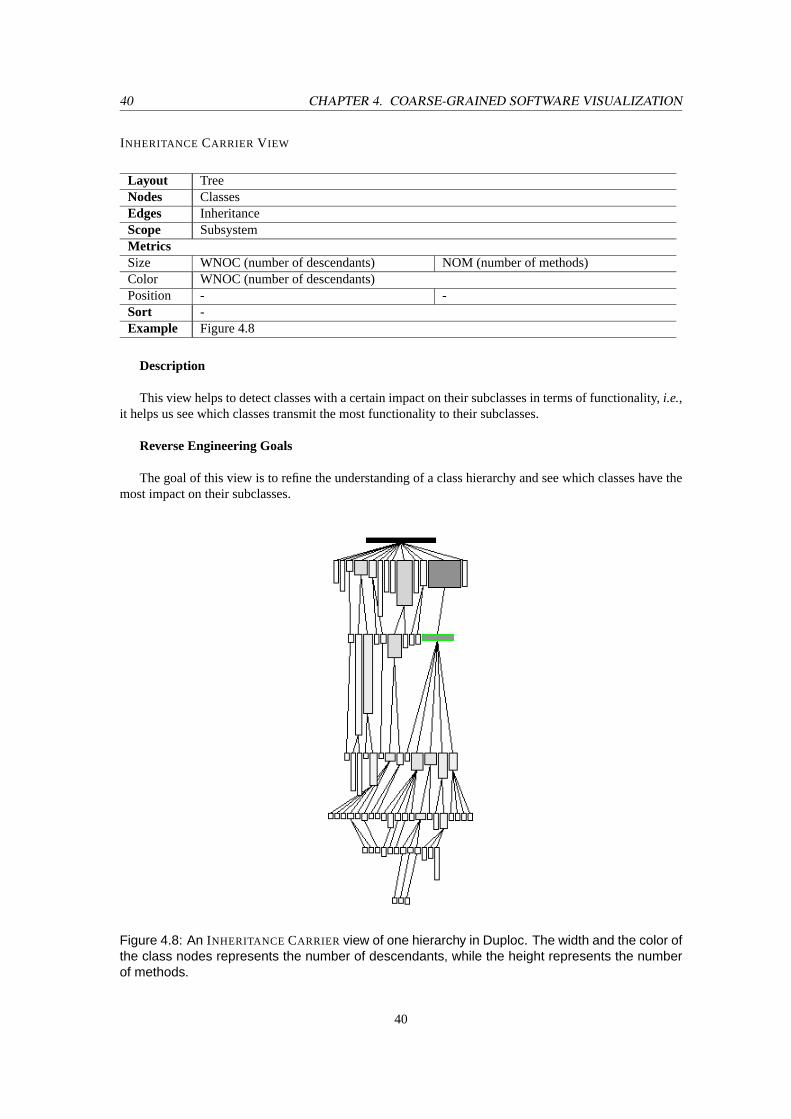
40 CHAPTER 4. COARSE-GRAINED SOFTWARE VISUALIZATION
INHERITANCE CARRIER V IEW
Layout TreeNodes ClassesEdges InheritanceScope SubsystemMetricsSize WNOC (number of descendants) NOM (number of methods)Color WNOC (number of descendants)Position - -Sort -Example Figure 4.8
Description
This view helps to detect classes with a certain impact on their subclasses in terms of functionality,i.e.,it helps us see which classes transmit the most functionality to their subclasses.
Reverse Engineering Goals
The goal of this view is to refine the understanding of a class hierarchy and see which classes have themost impact on their subclasses.
Figure 4.8: An INHERITANCE CARRIER view of one hierarchy in Duploc. The width and the color ofthe class nodes represents the number of descendants, while the height represents the numberof methods.
40
4.3. A REVERSE ENGINEERING SCENARIO 41
Symptoms
1. Tall, dark nodes represent classes that define a lot of behavior and have many descendants. Thereforethese classes have a certain importance for the (sub)system in question.
2. Flat, light nodes represent classes with little behavior and few descendants.
3. Flat, dark nodes represent classes with little behavior and many descendants. They can be the idealplace to put code factored out from the subclasses.
Variations
None
Scenario
Figure 4.8 shows this view for theModel hierarchy. It shows that the classes which are carrying theweight of the implementation in this hierarchy are first of all the classesAbstractPresentationModelCon-trollerStateandPMCS, where the latter is the sole subclass of the former. These classes are emphasized inthis view because of their darker color.
This view helped us to identify in the largest class hierarchy of Duploc those two classes which havethe most impact on the subclasses of this hierarchy and therefore constitute important information aboutthis hierarchy.
41
42 CHAPTER 4. COARSE-GRAINED SOFTWARE VISUALIZATION
INTERMEDIATE ABSTRACT V IEW
Layout TreeNodes ClassesEdges InheritanceScope SubsystemMetricsSize NOM (number of methods) NMA (number of methods added)Color NOC (number of subclasses)Position - -Sort -Example -
Description
This view identifies classes that are nearly empty in the middle of inheritance hierarchies. It uses thenumber of subclasses (NOC) as color metric, while for the size metrics we use the number of methods(NOM) and the number of methods which have been added compared to the superclass (NMA). Suchclasses are of some interest, because functionality defined in their subclasses can be pushed up into theintermediate abstract classes, in order to prevent or reduce code duplication.
Reverse Engineering Goals
This view helps to locate within inheritance hierarchies classes which are nearly empty and thereforeconstitute places where one could factor code out from their subclasses into those intermediate classes.
Symptoms
1. Flat, dark nodes represent classes in which few or no methods have been added, but which havemany direct subclasses. Further investigation may reveal that these classes implement some abstractbehavior.
Variations
1. Instead of NOC, one could also use WNOC (the number of descendants) for the color, although inlarge hierarchies the noise generated by other classes may obfuscate the detection of an intermediateabstract class.
Scenario
This view did not yield results in the case of Duploc,i.e., Duploc does not contain an intermediateabstract class.
42

4.3. A REVERSE ENGINEERING SCENARIO 43
4.3.4 Candidate Detection Views
These views help to identify candidates for further inspection,e.g., interesting software artifacts likeclasses, methods, and attributes in terms of size, complexity, and other particularities. Often these can-didates represent places where it is useful to apply refactorings. This cluster contains the following views:
1. DATA STORAGE CLASS DETECTION V IEW
2. METHOD EFFICIENCY CORRELATION V IEW
3. DIRECT ATTRIBUTE ACCESSV IEW
4. METHOD LENGTH DISTRIBUTION V IEW
43
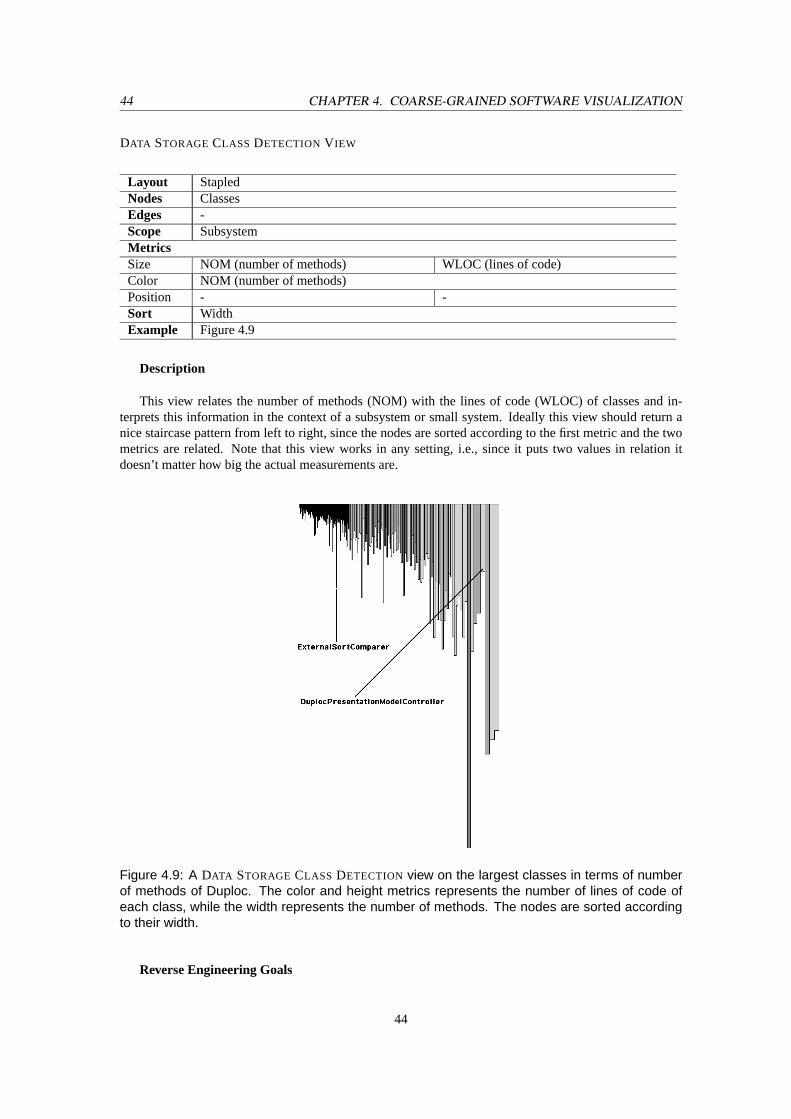
44 CHAPTER 4. COARSE-GRAINED SOFTWARE VISUALIZATION
DATA STORAGE CLASS DETECTION V IEW
Layout StapledNodes ClassesEdges -Scope SubsystemMetricsSize NOM (number of methods) WLOC (lines of code)Color NOM (number of methods)Position - -Sort WidthExample Figure 4.9
Description
This view relates the number of methods (NOM) with the lines of code (WLOC) of classes and in-terprets this information in the context of a subsystem or small system. Ideally this view should return anice staircase pattern from left to right, since the nodes are sorted according to the first metric and the twometrics are related. Note that this view works in any setting, i.e., since it puts two values in relation itdoesn’t matter how big the actual measurements are.
Figure 4.9: A DATA STORAGE CLASS DETECTION view on the largest classes in terms of numberof methods of Duploc. The color and height metrics represents the number of lines of code ofeach class, while the width represents the number of methods. The nodes are sorted accordingto their width.
Reverse Engineering Goals
44
4.3. A REVERSE ENGINEERING SCENARIO 45
This view helps to detect data storage classes,e.g., classes which mainly hold data and do not havecomplex behavior. Such classes are normally heavily used by other classes which want to access the infor-mation contained in the data storage classes. Moreover, it also helps to detect classes with an exceptionalaverage length of the methods compared to the rest of the subject system.
Symptoms
1. The staircase effect is broken by nodes which are too tall. These represent classes which have longmethods compared to the classes which comply with the staircase pattern.
2. The staircase pattern is broken by nodes which are too short. These classes, given a certain numberof methods, do not have the expected length in terms of lines of code. Such classes are often datastorage classes,i.e., classes which have short, simple methods, possibly only accessor methods. Datastorage classes may point to sets of coupled classes being brittle to changes.
Variations
1. To enhance the detection of data storage classes we can use the number of attributes (NOA) as colormetric, because data storage classes often have many attributes.
Scenario
We see in Figure 4.9 that the fourth class from the right,DuplocPresentationModelControlleris veryshort (265 line of code) compared to the great number of methods (107) indicated by the position on theright. Upon closer inspection we see that the class contains dozens of one-line methods which return con-stant values. We also see the inverse case for the first tall class on the left namedExternalSortComparerwhich contains 12 methods for a total length of 330 lines. Through a manual verification by code readingwe have indeed assessed that this class contains methods which can be refactored by splitting them up insmaller, more reusable pieces.
This view helped us to identify several candidates which are possibly data storage classes, and manualverifications have proved us right in most of the cases. Moreover it also helped us to identify classes withoverly long methods which are candidates for method splitting refactorings.
45

46 CHAPTER 4. COARSE-GRAINED SOFTWARE VISUALIZATION
METHOD EFFICIENCY CORRELATION V IEW
Layout CorrelationNodes MethodsEdges -Scope Full SystemMetricsSize - -Color -Position LOC (lines of code) NOS (number of statements)Sort -Example Figure 4.10
Description
This very scalable view shows all methods using a scatterplot layout with the lines of code (LOC) andthe number of statements (NOS) as position metrics. As the two metrics are related (each line may containstatements) we end up with a display of all methods, many of which align themselves along a certain cor-relation axis.
Reverse Engineering Goals
The goal of this view is to help detect (1) overly long methods, (2) methods with dead code, (3) badlyformatted methods.
Figure 4.10: A METHOD EFFICIENCY CORRELATION view of Duploc. As horizontal position metricwe use the lines of code, while for vertical metrics we use the number of statements.
Symptoms
1. Nodes to the right of the display represent long methods and should be further investigated as candi-dates for split method refactorings [FOWL 99, BECK 97].
2. Nodes to the very left and top of the display represent empty methods.
3. Nodes to the top of the display, but not necessarily to the left, represent methods containing onlycommented lines and thus possibly represent dead code.
4. Nodes to the left and more to the bottom of the display represent methods which are probably hardto read, as they contain several statements on each line. In this case one should check whether thereare formatting rules within the application which are being violated.
Variations
46
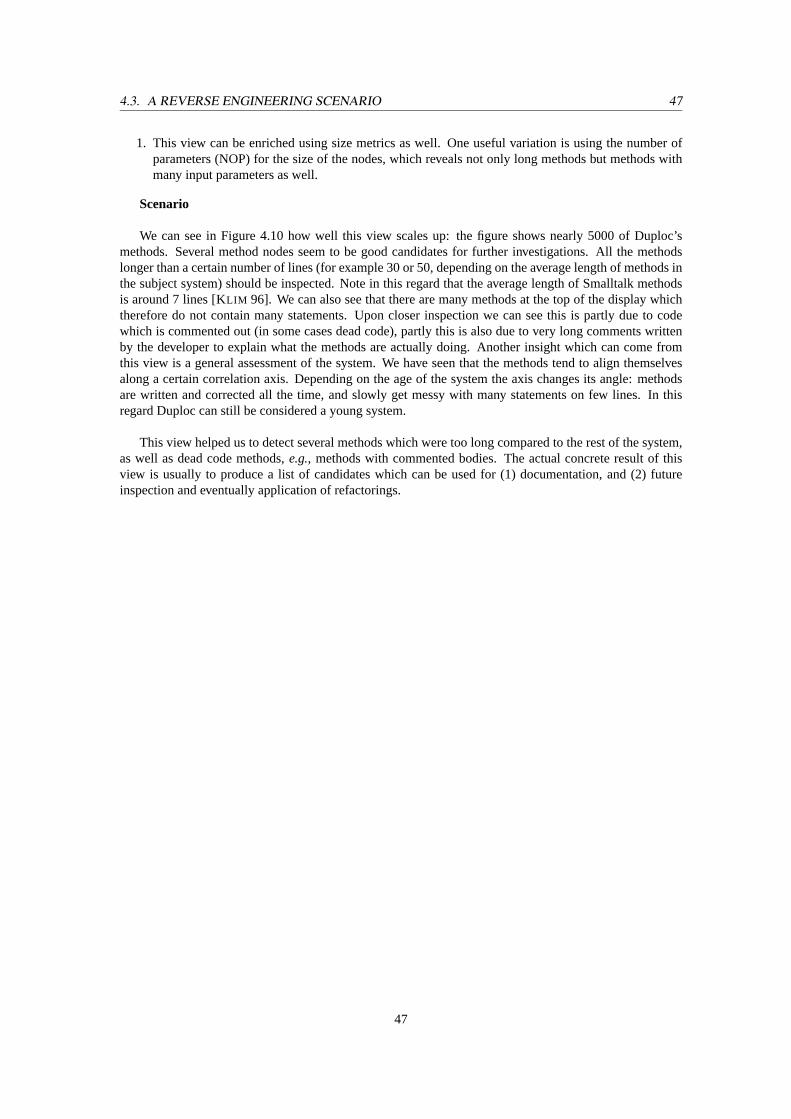
4.3. A REVERSE ENGINEERING SCENARIO 47
1. This view can be enriched using size metrics as well. One useful variation is using the number ofparameters (NOP) for the size of the nodes, which reveals not only long methods but methods withmany input parameters as well.
Scenario
We can see in Figure 4.10 how well this view scales up: the figure shows nearly 5000 of Duploc’smethods. Several method nodes seem to be good candidates for further investigations. All the methodslonger than a certain number of lines (for example 30 or 50, depending on the average length of methods inthe subject system) should be inspected. Note in this regard that the average length of Smalltalk methodsis around 7 lines [KLIM 96]. We can also see that there are many methods at the top of the display whichtherefore do not contain many statements. Upon closer inspection we can see this is partly due to codewhich is commented out (in some cases dead code), partly this is also due to very long comments writtenby the developer to explain what the methods are actually doing. Another insight which can come fromthis view is a general assessment of the system. We have seen that the methods tend to align themselvesalong a certain correlation axis. Depending on the age of the system the axis changes its angle: methodsare written and corrected all the time, and slowly get messy with many statements on few lines. In thisregard Duploc can still be considered a young system.
This view helped us to detect several methods which were too long compared to the rest of the system,as well as dead code methods,e.g., methods with commented bodies. The actual concrete result of thisview is usually to produce a list of candidates which can be used for (1) documentation, and (2) futureinspection and eventually application of refactorings.
47
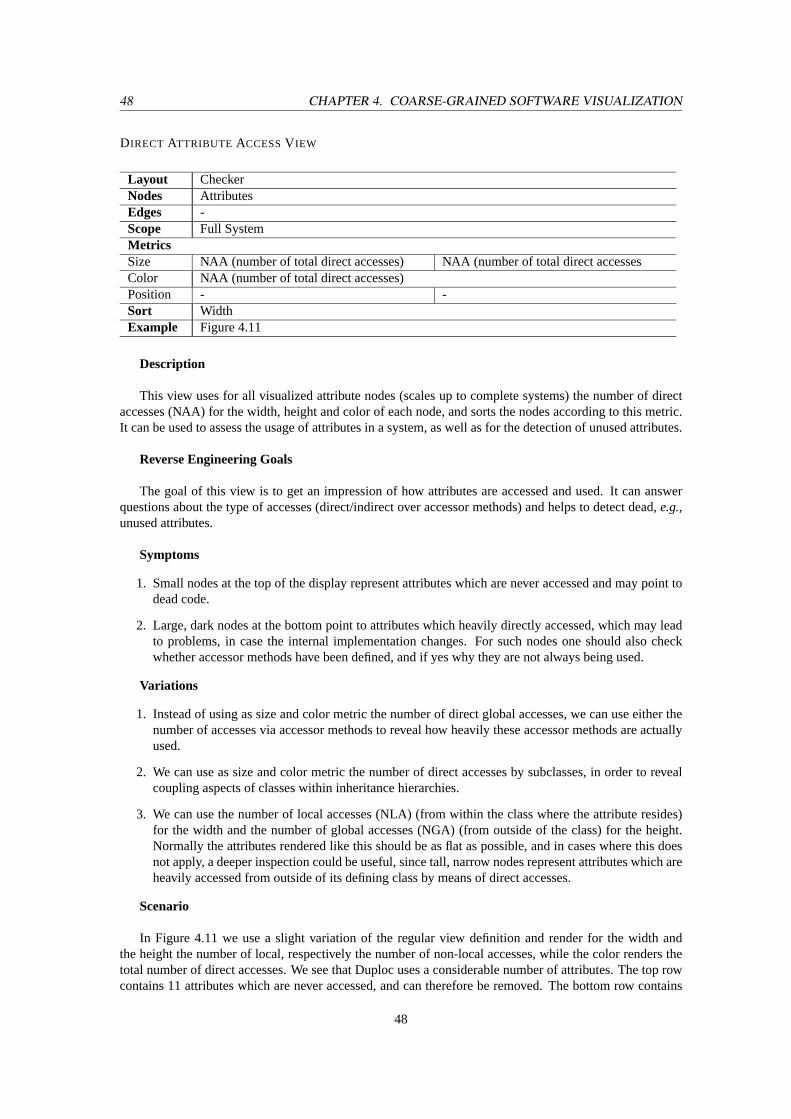
48 CHAPTER 4. COARSE-GRAINED SOFTWARE VISUALIZATION
DIRECT ATTRIBUTE ACCESSV IEW
Layout CheckerNodes AttributesEdges -Scope Full SystemMetricsSize NAA (number of total direct accesses) NAA (number of total direct accessesColor NAA (number of total direct accesses)Position - -Sort WidthExample Figure 4.11
Description
This view uses for all visualized attribute nodes (scales up to complete systems) the number of directaccesses (NAA) for the width, height and color of each node, and sorts the nodes according to this metric.It can be used to assess the usage of attributes in a system, as well as for the detection of unused attributes.
Reverse Engineering Goals
The goal of this view is to get an impression of how attributes are accessed and used. It can answerquestions about the type of accesses (direct/indirect over accessor methods) and helps to detect dead,e.g.,unused attributes.
Symptoms
1. Small nodes at the top of the display represent attributes which are never accessed and may point todead code.
2. Large, dark nodes at the bottom point to attributes which heavily directly accessed, which may leadto problems, in case the internal implementation changes. For such nodes one should also checkwhether accessor methods have been defined, and if yes why they are not always being used.
Variations
1. Instead of using as size and color metric the number of direct global accesses, we can use either thenumber of accesses via accessor methods to reveal how heavily these accessor methods are actuallyused.
2. We can use as size and color metric the number of direct accesses by subclasses, in order to revealcoupling aspects of classes within inheritance hierarchies.
3. We can use the number of local accesses (NLA) (from within the class where the attribute resides)for the width and the number of global accesses (NGA) (from outside of the class) for the height.Normally the attributes rendered like this should be as flat as possible, and in cases where this doesnot apply, a deeper inspection could be useful, since tall, narrow nodes represent attributes which areheavily accessed from outside of its defining class by means of direct accesses.
Scenario
In Figure 4.11 we use a slight variation of the regular view definition and render for the width andthe height the number of local, respectively the number of non-local accesses, while the color renders thetotal number of direct accesses. We see that Duploc uses a considerable number of attributes. The top rowcontains 11 attributes which are never accessed, and can therefore be removed. The bottom row contains
48
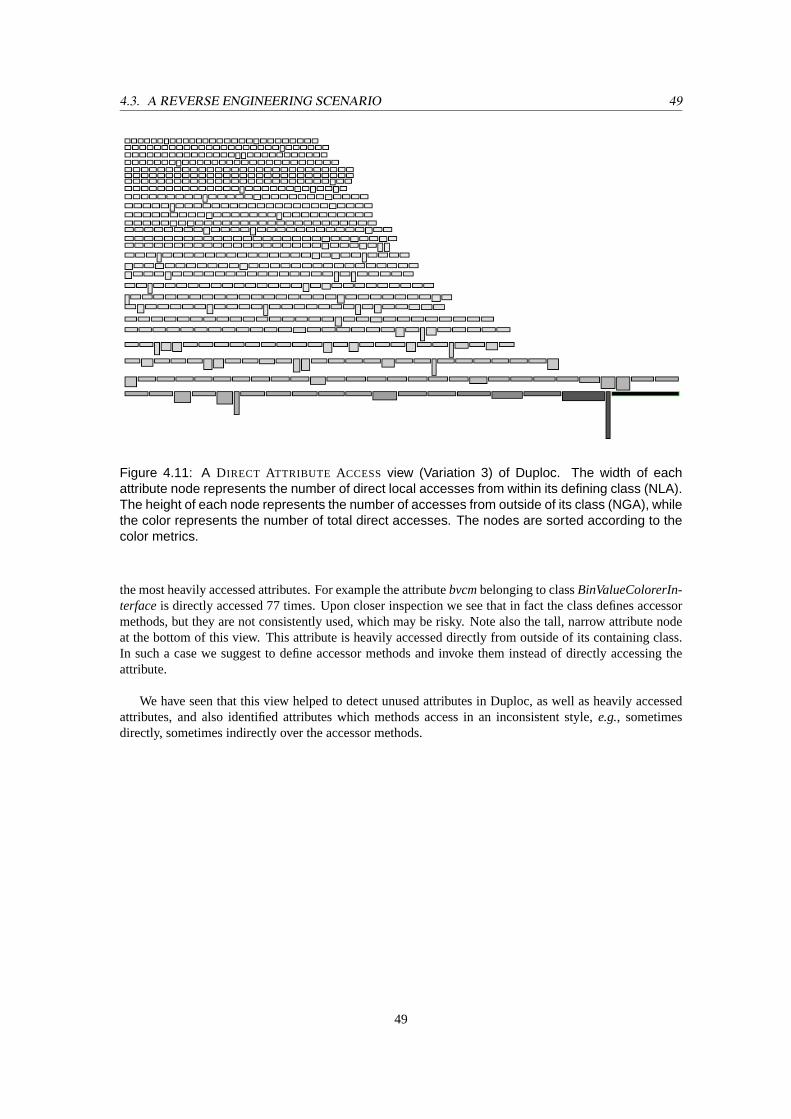
4.3. A REVERSE ENGINEERING SCENARIO 49
Figure 4.11: A DIRECT ATTRIBUTE ACCESS view (Variation 3) of Duploc. The width of eachattribute node represents the number of direct local accesses from within its defining class (NLA).The height of each node represents the number of accesses from outside of its class (NGA), whilethe color represents the number of total direct accesses. The nodes are sorted according to thecolor metrics.
the most heavily accessed attributes. For example the attributebvcmbelonging to classBinValueColorerIn-terfaceis directly accessed 77 times. Upon closer inspection we see that in fact the class defines accessormethods, but they are not consistently used, which may be risky. Note also the tall, narrow attribute nodeat the bottom of this view. This attribute is heavily accessed directly from outside of its containing class.In such a case we suggest to define accessor methods and invoke them instead of directly accessing theattribute.
We have seen that this view helped to detect unused attributes in Duploc, as well as heavily accessedattributes, and also identified attributes which methods access in an inconsistent style,e.g., sometimesdirectly, sometimes indirectly over the accessor methods.
49
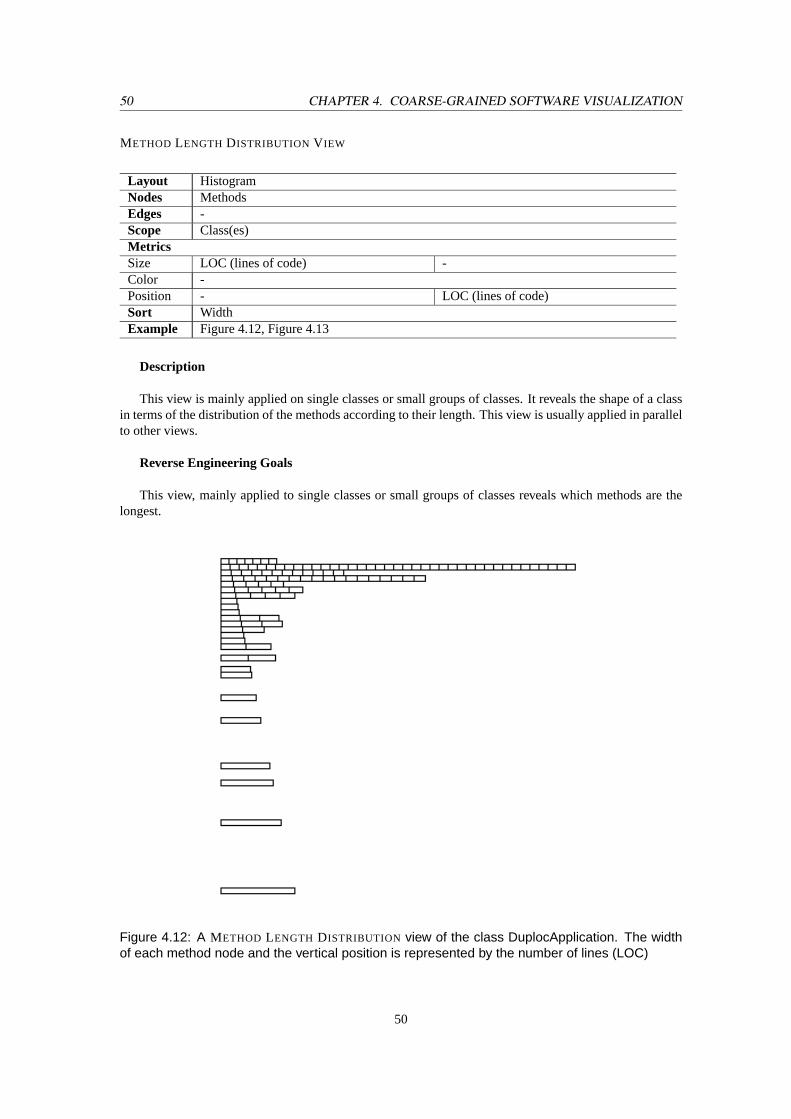
50 CHAPTER 4. COARSE-GRAINED SOFTWARE VISUALIZATION
METHOD LENGTH DISTRIBUTION V IEW
Layout HistogramNodes MethodsEdges -Scope Class(es)MetricsSize LOC (lines of code) -Color -Position - LOC (lines of code)Sort WidthExample Figure 4.12, Figure 4.13
Description
This view is mainly applied on single classes or small groups of classes. It reveals the shape of a classin terms of the distribution of the methods according to their length. This view is usually applied in parallelto other views.
Reverse Engineering Goals
This view, mainly applied to single classes or small groups of classes reveals which methods are thelongest.
Figure 4.12: A METHOD LENGTH DISTRIBUTION view of the class DuplocApplication. The widthof each method node and the vertical position is represented by the number of lines (LOC)
50
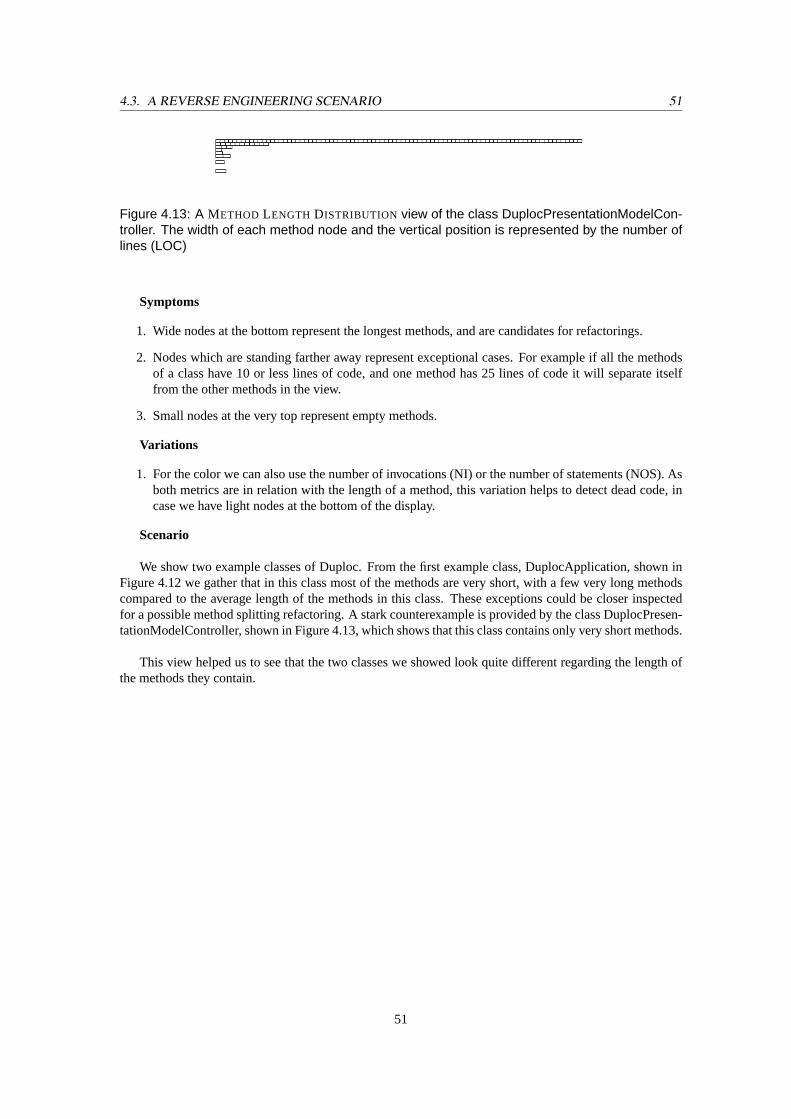
4.3. A REVERSE ENGINEERING SCENARIO 51
Figure 4.13: A METHOD LENGTH DISTRIBUTION view of the class DuplocPresentationModelCon-troller. The width of each method node and the vertical position is represented by the number oflines (LOC)
Symptoms
1. Wide nodes at the bottom represent the longest methods, and are candidates for refactorings.
2. Nodes which are standing farther away represent exceptional cases. For example if all the methodsof a class have 10 or less lines of code, and one method has 25 lines of code it will separate itselffrom the other methods in the view.
3. Small nodes at the very top represent empty methods.
Variations
1. For the color we can also use the number of invocations (NI) or the number of statements (NOS). Asboth metrics are in relation with the length of a method, this variation helps to detect dead code, incase we have light nodes at the bottom of the display.
Scenario
We show two example classes of Duploc. From the first example class, DuplocApplication, shown inFigure 4.12 we gather that in this class most of the methods are very short, with a few very long methodscompared to the average length of the methods in this class. These exceptions could be closer inspectedfor a possible method splitting refactoring. A stark counterexample is provided by the class DuplocPresen-tationModelController, shown in Figure 4.13, which shows that this class contains only very short methods.
This view helped us to see that the two classes we showed look quite different regarding the length ofthe methods they contain.
51
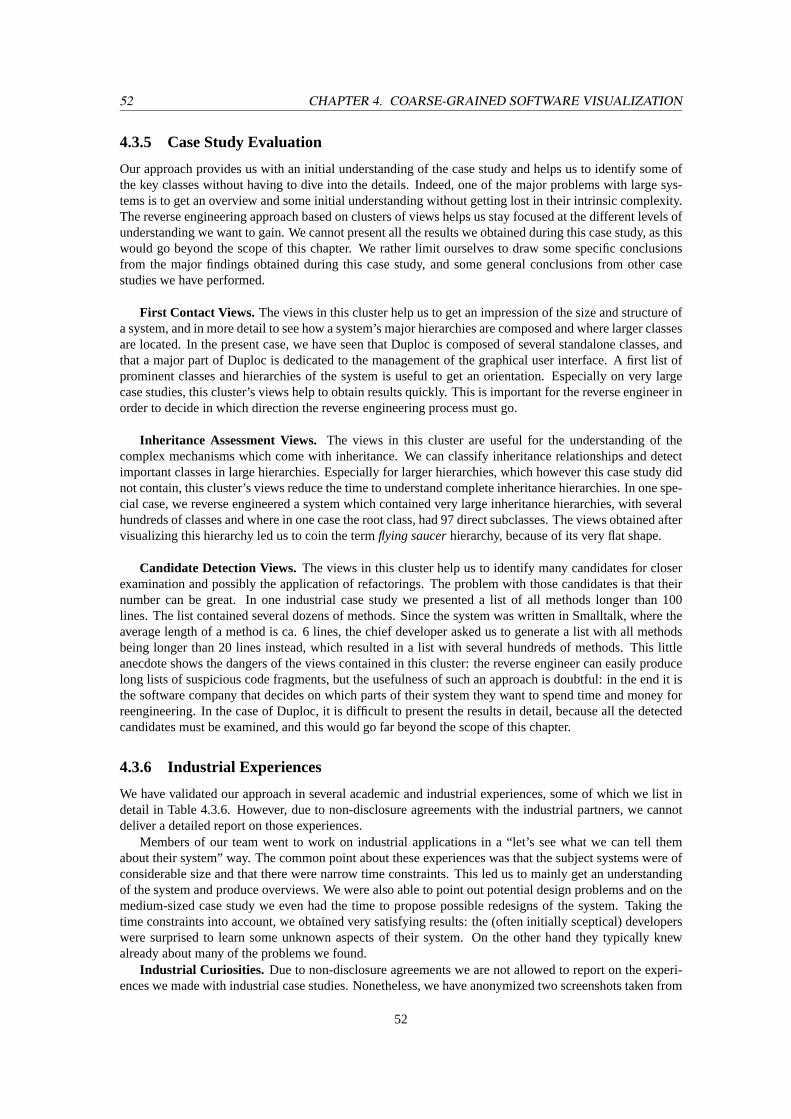
52 CHAPTER 4. COARSE-GRAINED SOFTWARE VISUALIZATION
4.3.5 Case Study Evaluation
Our approach provides us with an initial understanding of the case study and helps us to identify some ofthe key classes without having to dive into the details. Indeed, one of the major problems with large sys-tems is to get an overview and some initial understanding without getting lost in their intrinsic complexity.The reverse engineering approach based on clusters of views helps us stay focused at the different levels ofunderstanding we want to gain. We cannot present all the results we obtained during this case study, as thiswould go beyond the scope of this chapter. We rather limit ourselves to draw some specific conclusionsfrom the major findings obtained during this case study, and some general conclusions from other casestudies we have performed.
First Contact Views. The views in this cluster help us to get an impression of the size and structure ofa system, and in more detail to see how a system’s major hierarchies are composed and where larger classesare located. In the present case, we have seen that Duploc is composed of several standalone classes, andthat a major part of Duploc is dedicated to the management of the graphical user interface. A first list ofprominent classes and hierarchies of the system is useful to get an orientation. Especially on very largecase studies, this cluster’s views help to obtain results quickly. This is important for the reverse engineer inorder to decide in which direction the reverse engineering process must go.
Inheritance Assessment Views.The views in this cluster are useful for the understanding of thecomplex mechanisms which come with inheritance. We can classify inheritance relationships and detectimportant classes in large hierarchies. Especially for larger hierarchies, which however this case study didnot contain, this cluster’s views reduce the time to understand complete inheritance hierarchies. In one spe-cial case, we reverse engineered a system which contained very large inheritance hierarchies, with severalhundreds of classes and where in one case the root class, had 97 direct subclasses. The views obtained aftervisualizing this hierarchy led us to coin the termflying saucerhierarchy, because of its very flat shape.
Candidate Detection Views.The views in this cluster help us to identify many candidates for closerexamination and possibly the application of refactorings. The problem with those candidates is that theirnumber can be great. In one industrial case study we presented a list of all methods longer than 100lines. The list contained several dozens of methods. Since the system was written in Smalltalk, where theaverage length of a method is ca. 6 lines, the chief developer asked us to generate a list with all methodsbeing longer than 20 lines instead, which resulted in a list with several hundreds of methods. This littleanecdote shows the dangers of the views contained in this cluster: the reverse engineer can easily producelong lists of suspicious code fragments, but the usefulness of such an approach is doubtful: in the end it isthe software company that decides on which parts of their system they want to spend time and money forreengineering. In the case of Duploc, it is difficult to present the results in detail, because all the detectedcandidates must be examined, and this would go far beyond the scope of this chapter.
4.3.6 Industrial Experiences
We have validated our approach in several academic and industrial experiences, some of which we list indetail in Table 4.3.6. However, due to non-disclosure agreements with the industrial partners, we cannotdeliver a detailed report on those experiences.
Members of our team went to work on industrial applications in a “let’s see what we can tell themabout their system” way. The common point about these experiences was that the subject systems were ofconsiderable size and that there were narrow time constraints. This led us to mainly get an understandingof the system and produce overviews. We were also able to point out potential design problems and on themedium-sized case study we even had the time to propose possible redesigns of the system. Taking thetime constraints into account, we obtained very satisfying results: the (often initially sceptical) developerswere surprised to learn some unknown aspects of their system. On the other hand they typically knewalready about many of the problems we found.
Industrial Curiosities. Due to non-disclosure agreements we are not allowed to report on the experi-ences we made with industrial case studies. Nonetheless, we have anonymized two screenshots taken from
52
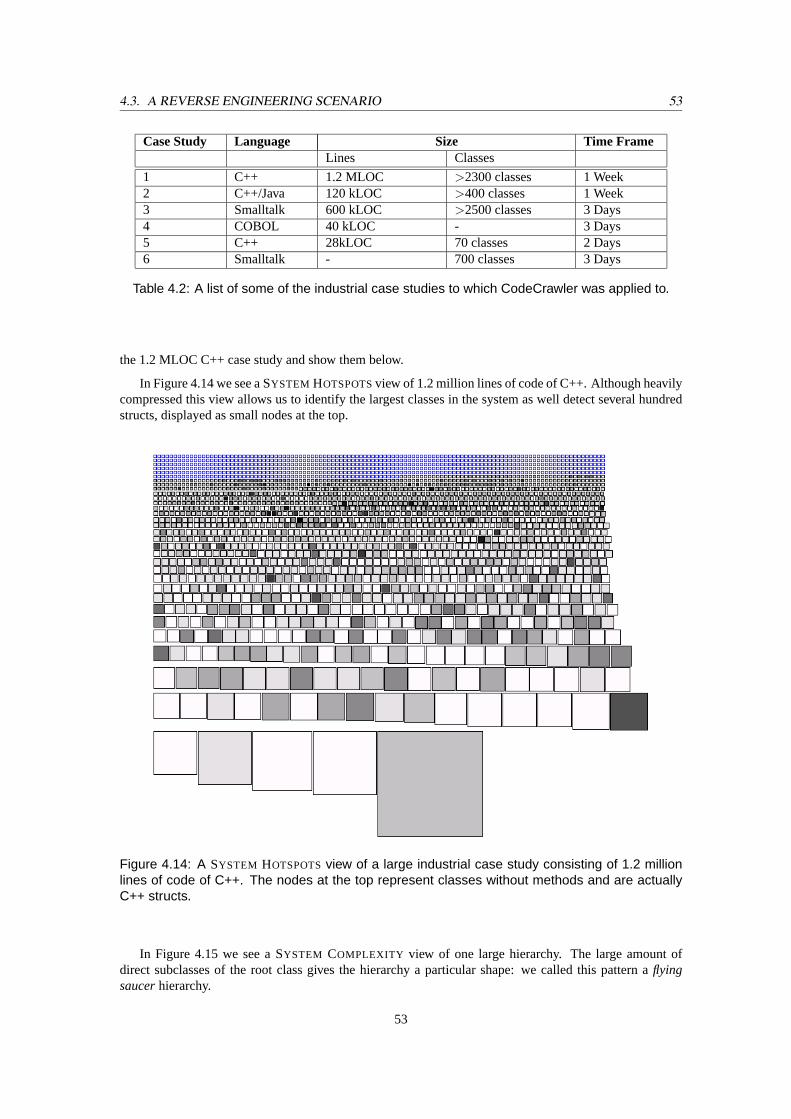
4.3. A REVERSE ENGINEERING SCENARIO 53
Case Study Language Size Time FrameLines Classes
1 C++ 1.2 MLOC >2300 classes 1 Week2 C++/Java 120 kLOC >400 classes 1 Week3 Smalltalk 600 kLOC >2500 classes 3 Days4 COBOL 40 kLOC - 3 Days5 C++ 28kLOC 70 classes 2 Days6 Smalltalk - 700 classes 3 Days
Table 4.2: A list of some of the industrial case studies to which CodeCrawler was applied to.
the 1.2 MLOC C++ case study and show them below.
In Figure 4.14 we see a SYSTEM HOTSPOTSview of 1.2 million lines of code of C++. Although heavilycompressed this view allows us to identify the largest classes in the system as well detect several hundredstructs, displayed as small nodes at the top.
Figure 4.14: A SYSTEM HOTSPOTSview of a large industrial case study consisting of 1.2 millionlines of code of C++. The nodes at the top represent classes without methods and are actuallyC++ structs.
In Figure 4.15 we see a SYSTEM COMPLEXITY view of one large hierarchy. The large amount ofdirect subclasses of the root class gives the hierarchy a particular shape: we called this pattern aflyingsaucerhierarchy.
53
54 CHAPTER 4. COARSE-GRAINED SOFTWARE VISUALIZATION
Figure 4.15: A SYSTEM COMPLEXITY view of a large hierarchy yields a form which we called flyingsaucer : the root class has 97 direct subclasses.
4.4 Related Work
Software Visualization
The graphical representations of software used in the field of software visualization, a sub-area of informa-tion visualization [WARE 00][Car 99], have long been accepted as comprehension aids to support reverseengineering. Indeed, software visualization itself has become one of the major approaches in reverse engi-neering. Priceet al. have presented an extensive taxonomy of software visualization, with several examplesand tools [PRIC 93].
Many tools make use of static information to visualize software, like Rigi [MU 86], Hy+ [CONS 93],SeeSoft [EICK 92], ShrimpViews [STOR 95], GSee [FAVR 01], and the FIELD environment [REIS 90], toname but a few prominent examples.
Substantial research has also been conducted on runtime information visualization, called program vi-sualization. Various tools and approaches make use of dynamic (trace-based) information such as ProgramExplorer [LANG 95], Jinsight and its ancestors [PAUW 93][PAUW 99] and Graphtrace [KLEY 88]. Variousapproaches have been discussed like in [KAZM 95] or [JERD 97] where interactions in program execu-tions are being visualized. In our current approach we do not exploit dynamic information. Richner hasconducted research on the combination of static and dynamic information [RICH 02][RICH 99], where thestatic information is provided by the Moose Reengineering Environment.
Several systems make use of the third dimension by rendering software in 3D. Brown and Najorkexplore three distinct uses of 3D [Sta 98], namely (1) expressing fundamental information about structuresthat are inherently two-dimensional, (2) uniting multiple views of an object, and (3) capturing a history ofa two-dimensional view. They exemplify these uses by showing screen dumps of views developed withthe Zeus algorithm animation system [BROW 91]. However, they also state that “the potential use of 3Dgraphics for program visualization is significant and mostly unexplored”. Some of the systems cited abovemake both use of 2D and 3D visualizations.
Until now we have refrained from using 3D for our visualizations, mainly because it would contradictthe lightweight constraint. However, we consider the exploration of the use of 3D as possible future work.
Metrics
Metrics have long been studied as a way to assess the quality and complexity of software [FENT 96], andrecently this has been applied to object-oriented software as well [LORE 94] [HEND 96]. Metrics profitfrom their scalability and, in the case of simple ones, from their reliable definition. However, simple mea-surements are hardly enough to sufficiently and reliably assess software quality [DEME 99a]. Some metrictools visualize information using diagrams for statistical analysis, like histograms and Kiviat diagrams.Datrix [MAYR 96], TAC++ [FIOR 98a] [FIOR 98b] and Crocodile [LEWE 98] are tools that exhibit suchvisualization features. However, in all these tools the visualizations are mere side effects of having to an-alyze large quantities of numbers. In our case, the visualization is an inherent part of the approach, hencewe do not visualize numbers, but constructs as they occur in source code.
54
4.5. CONCLUSION 55
Methodological Approach
To the best of our knowledge none of the approaches we reference in this thesis presents a reverse engineer-ing approach, which can help a reverse engineer to apply a certain tool or technique. Storeyet al. presentin [STOR 99] some basic ideas on how to build a mental model during software exploration, but do notprovide the much-needed, yet difficult to obtain, empirical evidence. We suppose this is because of theadhocnature of reverse engineering tools (including ours) and because software industry has not yet adoptedsuch tools as concrete aids for their development process.
4.5 Conclusion
Software reverse engineering is a complex and difficult task, mainly because of the sheer size and complex-ity of software legacy systems. Several approaches have been developed to support the reverse engineeringprocess, yet many of them fail because their scalability is limited or because they are too complex them-selves. Two promising approaches,software visualizationandsoftware metricsboth have their respectiveadvantages and drawbacks. Our solution combines both approaches and exploits their advantages, while itminimizes their drawbacks.
4.5.1 Summary
In this chapter we have presented a reverse engineering approach based on clusters ofpolymetric views,lightweight visualizations enriched with metrics. This approach enables us to quickly gain insights into theinner structure of large software legacy systems and helps us to detect problems.
Furthermore, we have illustrated our approach by applying different views and by thus reverse engi-neering a case study. We have been able to understand different aspects of the case study, among whichan overview of the application, a discussion on the used inheritance mechanisms, the detection of designpatterns, the detection of several places where in-depth examinations are needed, as well as propositionson where possible refactorings could be applied.
The views presented in this chapter have been applied on several large industrial legacy systems writtenin different languages like Smalltalk, Java, and C++. The systems in question ranged in size from 100kLOC to more than 1 MLOC. We are not allowed to report on the experiences obtained there due to non-disclosure agreements.
4.5.2 Benefits
The main benefits of our approach are the following:
• Scalability.Each polymetric view is able to transmit a great amount of information to the viewer in acondensed way. Furthermore, most of the presented views scale up to large systems,e.g., more than100 kLOC.
• Simplicity. The presented polymetric views are lightweight software visualizations, whose simplicitymakes them easily adaptable to new contexts and programming languages.
• Approach. The presented approach provides guidance to a reverse engineer in the most delicatephase of a reverse engineering process, namely the beginning. By discussing the views in detail, thepurpose and usability of each view is presented. We thus minimize the risk of getting lost during thereverse engineering.
• Customizability.The polymetric views are easily customizable, mainly by changing the metrics orthe layouts. These changes are necessary, because every legacy system has particularities to whichthe polymetric views must be adapted to. In that sense the polymetric views are helpful because theyemphasize the relative differences between the visualized entities. By that we mean that for exampleoverly large classes will stand out in the SYSTEM HOTSPOTSview, unregarded from the average sizeof the classes in the subject system.
55
56 CHAPTER 4. COARSE-GRAINED SOFTWARE VISUALIZATION
4.5.3 Limits
Our approach is limited in the following ways:
• Visual language.The presented views constitute a visual language which first must be learned by theviewer. In order to correctly interpret what he sees, the viewer must first learn what to look for in apolymetric view. Based on the amount of knowledge he gathers, the viewer can apply the approachmore efficiently.
• Ad-hoc approach.The approach presented here cannot be used like a step-by-step process, butheavily depends on the context that a reverse engineer encounters. For example while in one casestudies having methods of more than 100 lines may be exceptional, in another case it may be theaverage length. It does not mean that the latter system is worse in quality, it is just different.
4.5.4 Future Work
In the future we plan to investigate the following ideas:
• Language specific views.Since FAMIX is language-independent we have focused on developingviews in this context. We believe there are views which exploit language specific information, forexample modifier information in languages like C++ and Java or metaclasses in Smalltalk.
• New entities and relationships.The introduction of new entities and relationships, which may butdo not need to have an equivalent in software could help to generate new views based on these newartifacts. A way to interactively generate these artifacts can be supported by grouping mechanisms,similar to the ones implemented in Rigi [MU 86], which group entities and relationships accordingto certain rules (i.e., naming conventions, types, etc.).
• Usability and navigation.The extensive use of direct-manipulation idioms [COOP95], especiallythose relevant to the reverse engineering process , should further increase the malleability and flex-ibility of our tools. The introduction of navigation mechanisms, which reduce the latency betweenone view and the next one, can further increase the efficiency of the reverse engineering process.
• 3D. The use of the third dimension can help exploit and visualize more semantic information, al-though we believe that this research generates results which cannot be classified as “lightweight”anymore.
56
Chapter 5
Fine-grained Software Visualization:The Class Blueprint
5.1 Introduction
It has been measured that in the maintenance phase software professionals spend at least half of their timeanalyzing software to understand it [CORB 89] and that code reading is a viable verification and testingstrategy [BASI 87] [BASI 97] [HEND 02]. As we already mentioned, Sommerville [SOMM 00] and Davis[DAVI 95] estimate that the cost of software maintenance accounts for 50% to 75% of the overall cost ofa software system. These facts show that understanding source code is one of the hardest tasks in themaintenance of software systems.
Furthermore nowadayslegacy systemsare not only limited to procedural languages but are also writtenin object-oriented languages. Contrary to what one may think, the object-oriented programming paradigmhas but exacerbated this problem, since in object-oriented systems the domain model of the applicationis distributed across the whole system and the behavior is distributed across inheritance hierarchies withlate-binding [WILD 92] [CASA 97] [Duc 99]. Moreover, reading object-oriented code is more difficultthan reading procedural code [DEKE 02]. Indeed, in addition to the difficulties introduced by the technicalaspects of object-oriented languages such as inheritance and polymorphism [WILD 92], the reading orderof a class’ source code is not relevant as it was in most of the procedural languages where the order ofthe procedures was important and the use of forward declarations required. This lack of reading order isemphasized in languages such as Smalltalk,e.g.,a language based upon a powerful integrated developmentenvironment (IDE) in which the concept of files is only used for external code storage but not for codeediting. Moreover, even for file-based languages like Java, IDEs like Eclipse are literally eclipsing theimportance of source files and putting forwardcode browsingpractice as in Smalltalk.
In such a context understanding classes is of key importance as classes are the cornerstone of the object-oriented programming paradigm and the primary abstraction from which applications are built. Thereforethere is a definitive need to support the understanding of classes and their internal structure. In the past,work has been done to support the understanding of object-oriented applications [KLEY 88] [LANG 95][M END 95]. Some other work focused on analyzing the impact of graphical notation to support programunderstanding based on control-flow [HEND 02]. However such approaches were on one hand powerfulfor supporting the identification of design patterns but on the other hand too generic and not fine tuned forthe specific purpose of class understanding.
Summary. In this chapter we present a simple approach to ease the understanding of classes by visual-izing a semantically augmented call- and access-graph of the methods and attributes of classes1. We only
1This chapter is an extended version of the articleThe Class Blueprint: Visually Supporting the Understanding of Classes, submit-ted for publication to IEEE Transactions on Software Engineering, which is based on our articleA Categorization of Classes basedon the Visualization of their Internal Structure: the Class Blueprint, published in the OOPSLA 2001 Proceedings (Conference onObject-Oriented Programming, Systems, Languages, and Applications), pp. 300 - 311, ACM Press, 2001.
57
58 CHAPTER 5. FINE-GRAINED SOFTWARE VISUALIZATION: THE CLASS BLUEPRINT
take into account the internal static structure of a class and focus on the way methods call each other andaccess attributes and the way the classes use inheritance. We leave out the run-time behavior of a system.
We have coined the termclass blueprint, a visualization of a semantically augmented call-graph and itsspecific semantics-based layout. The objective of our visualization is to help a programmer to develop amental shape of the classes he browses and to offer a support for reconstructing the logical flow of methodcalls. In such a setup our approach reveals the “taste” of a class in terms of its call-graph and internal struc-ture. However our approach does not magically provide a detailed understanding of a class’ functionality.Besides the presentation of the technical aspects that the class blueprint implies, we establish a vocabularythat we developed based on the insights we obtained during several case studies. This vocabulary identifiesthe most common and specificvisual patterns, i.e., recurrent graphical situations we encountered duringthe validation of this work over several large case studies. We believe that this vocabulary can be the basisof a language (in a similar vein to the use of design patterns [GAMM 95]) that reverse engineers can usewhen communicating with each other. We would like to stress the fact that the results presented in thischapter (and the whole thesis) are language independent as we base our work on a language independentmeta-model for object-oriented source code representation [DEME 01]. However, most of our experienceshave been conducted on applications developed in Smalltalk, although we applied our approach on casestudies written in C++ and Java as well.
Contributions. The contributions of this chapter are the following:
• The definition of theclass blueprint, a polymetric view which helps to achieve fine-grained reverseengineering goals. It helps to understand the concrete implementation of classes and class hier-archies, and detect common patterns or coding styles. Using this view we can look for signs ofinconsistencies like the use of accessors. The class blueprint can be used to identify the possiblepresence of design patterns or occasions where design patterns could be introduced to ameliorate thesystem’s structure.
• The identification ofpatternsthat represent recurring situations and the discussion of their meaningin terms of implementation.
• The definition of a vocabulary based on these patterns.
Structure of the chapter. We start by discussing the challenges that the understanding of classesinvolves, and by making precise the context of this chapter and its constraints (Section 5.2). In Section 5.3we present the concept of the class blueprint and discuss two examples (Section 5.4). Based on the classblueprint, visual patterns are identified in Section 5.5. In Section 5.6 and Section 5.7 we then present severalpatterns and an analysis of the class blueprints (Section 5.8). We conclude (Section 5.11) the chapter witha discussion of the obtained results, the related work (Section 5.10), and an outlook on our future work.
5.2 The Challenge of Supporting Class Understanding
As our overall objective is to help reengineers to build a mental image of a class, we chose to visualize theessence of a class, therefore we restrict ourselves to methods, method invocations, attributes, and attributeaccesses. According to the program cognition model vocabulary proposed by Littmanet al. [L ITT 96] wesupport an approach of understanding that isopportunisticin the sense that it is not based on asystematicline-by-line understanding but as needed. Moreover, to locate our approach in the general context ofcognitive models [LITT 96] [VON 96], our approach is intended to support theimplementation plansat thelanguage level,i.e., working at code chunks, here classes and methods.
Mayrhauser and Vans mention that the cognition processes work at all levels of abstraction simultane-ously as programmers build a mental model of the code [VON 96]. Our approach is based on the visualidentification of hotspots at the class level or hierarchy level which then are verified with opportunist codereading. In this sense, our claim is not that graphical visualization is better than text reading even if webelieve that our approach eases the process [PETR 95]. Our approach creates a synergetic context betweenthe two where blueprints reveal the way classes are built, help raising hypotheses, or questions that are thenverified by reading some piece of code.
58
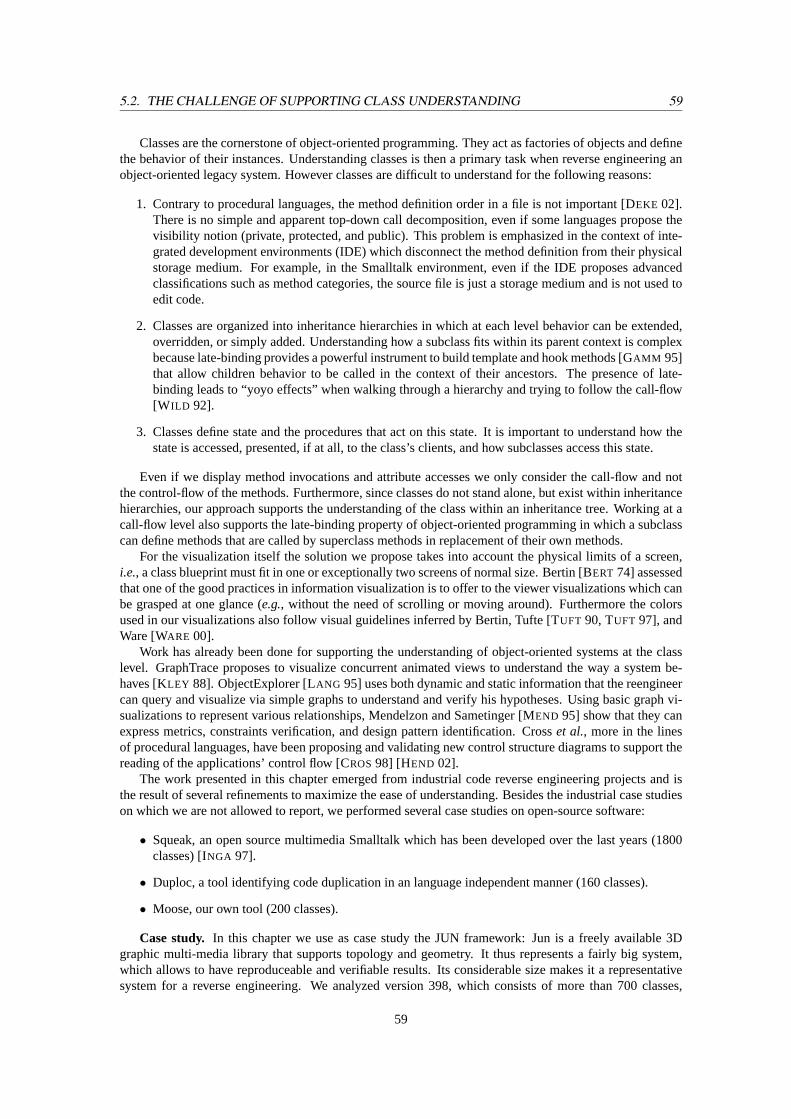
5.2. THE CHALLENGE OF SUPPORTING CLASS UNDERSTANDING 59
Classes are the cornerstone of object-oriented programming. They act as factories of objects and definethe behavior of their instances. Understanding classes is then a primary task when reverse engineering anobject-oriented legacy system. However classes are difficult to understand for the following reasons:
1. Contrary to procedural languages, the method definition order in a file is not important [DEKE 02].There is no simple and apparent top-down call decomposition, even if some languages propose thevisibility notion (private, protected, and public). This problem is emphasized in the context of inte-grated development environments (IDE) which disconnect the method definition from their physicalstorage medium. For example, in the Smalltalk environment, even if the IDE proposes advancedclassifications such as method categories, the source file is just a storage medium and is not used toedit code.
2. Classes are organized into inheritance hierarchies in which at each level behavior can be extended,overridden, or simply added. Understanding how a subclass fits within its parent context is complexbecause late-binding provides a powerful instrument to build template and hook methods [GAMM 95]that allow children behavior to be called in the context of their ancestors. The presence of late-binding leads to “yoyo effects” when walking through a hierarchy and trying to follow the call-flow[W ILD 92].
3. Classes define state and the procedures that act on this state. It is important to understand how thestate is accessed, presented, if at all, to the class’s clients, and how subclasses access this state.
Even if we display method invocations and attribute accesses we only consider the call-flow and notthe control-flow of the methods. Furthermore, since classes do not stand alone, but exist within inheritancehierarchies, our approach supports the understanding of the class within an inheritance tree. Working at acall-flow level also supports the late-binding property of object-oriented programming in which a subclasscan define methods that are called by superclass methods in replacement of their own methods.
For the visualization itself the solution we propose takes into account the physical limits of a screen,i.e., a class blueprint must fit in one or exceptionally two screens of normal size. Bertin [BERT 74] assessedthat one of the good practices in information visualization is to offer to the viewer visualizations which canbe grasped at one glance (e.g., without the need of scrolling or moving around). Furthermore the colorsused in our visualizations also follow visual guidelines inferred by Bertin, Tufte [TUFT 90, TUFT 97], andWare [WARE 00].
Work has already been done for supporting the understanding of object-oriented systems at the classlevel. GraphTrace proposes to visualize concurrent animated views to understand the way a system be-haves [KLEY 88]. ObjectExplorer [LANG 95] uses both dynamic and static information that the reengineercan query and visualize via simple graphs to understand and verify his hypotheses. Using basic graph vi-sualizations to represent various relationships, Mendelzon and Sametinger [MEND 95] show that they canexpress metrics, constraints verification, and design pattern identification. Crosset al., more in the linesof procedural languages, have been proposing and validating new control structure diagrams to support thereading of the applications’ control flow [CROS98] [HEND 02].
The work presented in this chapter emerged from industrial code reverse engineering projects and isthe result of several refinements to maximize the ease of understanding. Besides the industrial case studieson which we are not allowed to report, we performed several case studies on open-source software:
• Squeak, an open source multimedia Smalltalk which has been developed over the last years (1800classes) [INGA 97].
• Duploc, a tool identifying code duplication in an language independent manner (160 classes).
• Moose, our own tool (200 classes).
Case study. In this chapter we use as case study the JUN framework: Jun is a freely available 3Dgraphic multi-media library that supports topology and geometry. It thus represents a fairly big system,which allows to have reproduceable and verifiable results. Its considerable size makes it a representativesystem for a reverse engineering. We analyzed version 398, which consists of more than 700 classes,
59
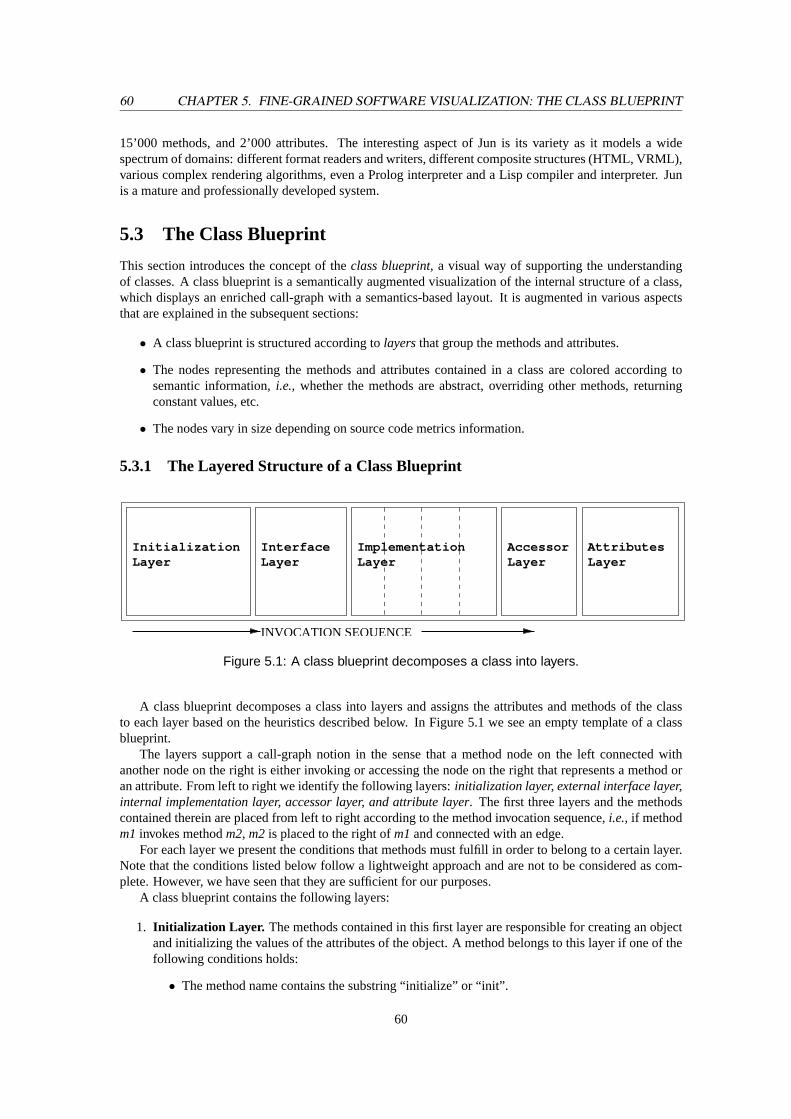
60 CHAPTER 5. FINE-GRAINED SOFTWARE VISUALIZATION: THE CLASS BLUEPRINT
15’000 methods, and 2’000 attributes. The interesting aspect of Jun is its variety as it models a widespectrum of domains: different format readers and writers, different composite structures (HTML, VRML),various complex rendering algorithms, even a Prolog interpreter and a Lisp compiler and interpreter. Junis a mature and professionally developed system.
5.3 The Class Blueprint
This section introduces the concept of theclass blueprint, a visual way of supporting the understandingof classes. A class blueprint is a semantically augmented visualization of the internal structure of a class,which displays an enriched call-graph with a semantics-based layout. It is augmented in various aspectsthat are explained in the subsequent sections:
• A class blueprint is structured according tolayersthat group the methods and attributes.
• The nodes representing the methods and attributes contained in a class are colored according tosemantic information,i.e., whether the methods are abstract, overriding other methods, returningconstant values, etc.
• The nodes vary in size depending on source code metrics information.
5.3.1 The Layered Structure of a Class Blueprint
InitializationLayer
InterfaceLayer
ImplementationLayer
AccessorLayer
AttributesLayer
INVOCATION SEQUENCE
Figure 5.1: A class blueprint decomposes a class into layers.
A class blueprint decomposes a class into layers and assigns the attributes and methods of the classto each layer based on the heuristics described below. In Figure 5.1 we see an empty template of a classblueprint.
The layers support a call-graph notion in the sense that a method node on the left connected withanother node on the right is either invoking or accessing the node on the right that represents a method oran attribute. From left to right we identify the following layers:initialization layer, external interface layer,internal implementation layer, accessor layer, and attribute layer. The first three layers and the methodscontained therein are placed from left to right according to the method invocation sequence,i.e., if methodm1 invokes methodm2, m2 is placed to the right ofm1and connected with an edge.
For each layer we present the conditions that methods must fulfill in order to belong to a certain layer.Note that the conditions listed below follow a lightweight approach and are not to be considered as com-plete. However, we have seen that they are sufficient for our purposes.
A class blueprint contains the following layers:
1. Initialization Layer. The methods contained in this first layer are responsible for creating an objectand initializing the values of the attributes of the object. A method belongs to this layer if one of thefollowing conditions holds:
• The method name contains the substring “initialize” or “init”.
60
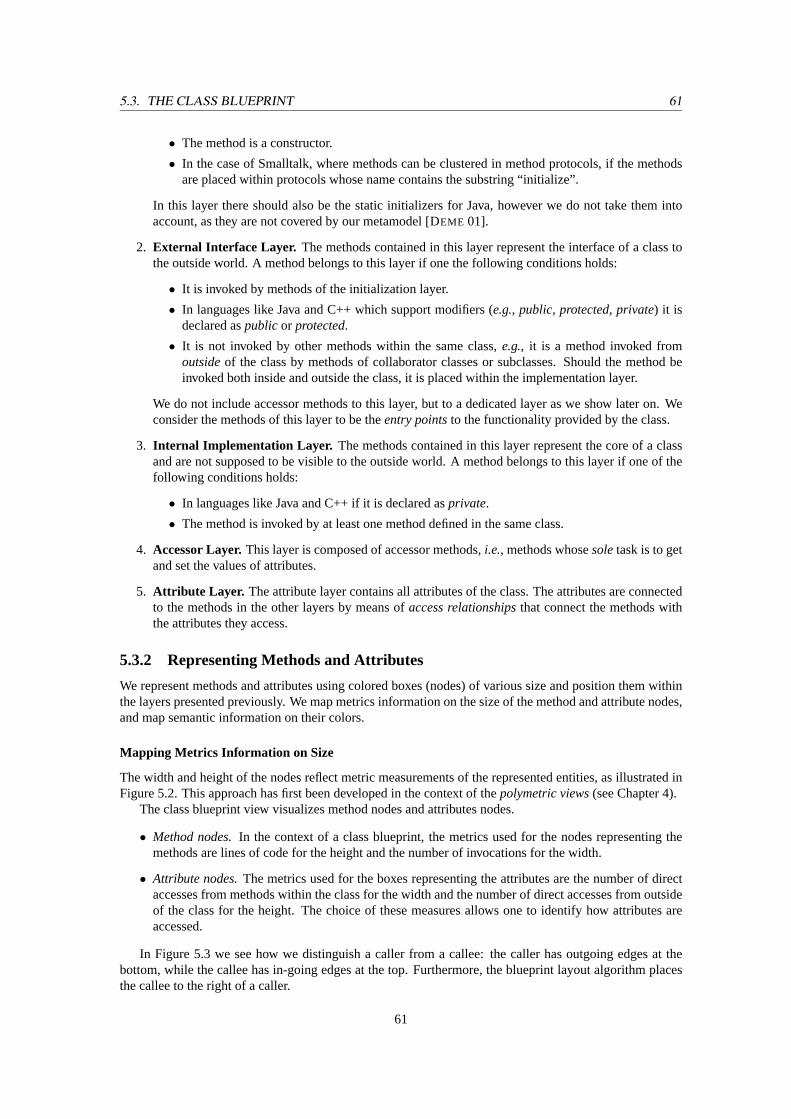
5.3. THE CLASS BLUEPRINT 61
• The method is a constructor.
• In the case of Smalltalk, where methods can be clustered in method protocols, if the methodsare placed within protocols whose name contains the substring “initialize”.
In this layer there should also be the static initializers for Java, however we do not take them intoaccount, as they are not covered by our metamodel [DEME 01].
2. External Interface Layer. The methods contained in this layer represent the interface of a class tothe outside world. A method belongs to this layer if one the following conditions holds:
• It is invoked by methods of the initialization layer.
• In languages like Java and C++ which support modifiers (e.g., public, protected, private) it isdeclared aspublicor protected.
• It is not invoked by other methods within the same class,e.g., it is a method invoked fromoutsideof the class by methods of collaborator classes or subclasses. Should the method beinvoked both inside and outside the class, it is placed within the implementation layer.
We do not include accessor methods to this layer, but to a dedicated layer as we show later on. Weconsider the methods of this layer to be theentry pointsto the functionality provided by the class.
3. Internal Implementation Layer. The methods contained in this layer represent the core of a classand are not supposed to be visible to the outside world. A method belongs to this layer if one of thefollowing conditions holds:
• In languages like Java and C++ if it is declared asprivate.
• The method is invoked by at least one method defined in the same class.
4. Accessor Layer.This layer is composed of accessor methods,i.e.,methods whosesoletask is to getand set the values of attributes.
5. Attribute Layer. The attribute layer contains all attributes of the class. The attributes are connectedto the methods in the other layers by means ofaccess relationshipsthat connect the methods withthe attributes they access.
5.3.2 Representing Methods and Attributes
We represent methods and attributes using colored boxes (nodes) of various size and position them withinthe layers presented previously. We map metrics information on the size of the method and attribute nodes,and map semantic information on their colors.
Mapping Metrics Information on Size
The width and height of the nodes reflect metric measurements of the represented entities, as illustrated inFigure 5.2. This approach has first been developed in the context of thepolymetric views(see Chapter 4).
The class blueprint view visualizes method nodes and attributes nodes.
• Method nodes.In the context of a class blueprint, the metrics used for the nodes representing themethods are lines of code for the height and the number of invocations for the width.
• Attribute nodes.The metrics used for the boxes representing the attributes are the number of directaccesses from methods within the class for the width and the number of direct accesses from outsideof the class for the height. The choice of these measures allows one to identify how attributes areaccessed.
In Figure 5.3 we see how we distinguish a caller from a callee: the caller has outgoing edges at thebottom, while the callee has in-going edges at the top. Furthermore, the blueprint layout algorithm placesthe callee to the right of a caller.
61
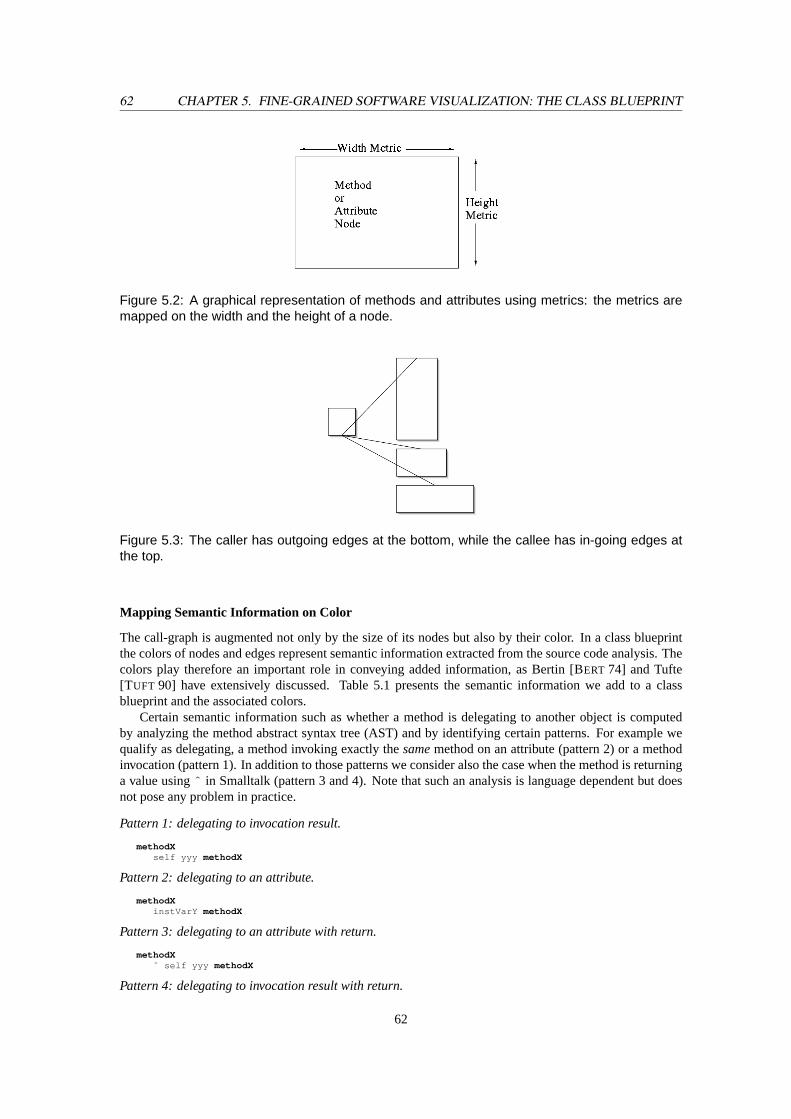
62 CHAPTER 5. FINE-GRAINED SOFTWARE VISUALIZATION: THE CLASS BLUEPRINT
Figure 5.2: A graphical representation of methods and attributes using metrics: the metrics aremapped on the width and the height of a node.
Figure 5.3: The caller has outgoing edges at the bottom, while the callee has in-going edges atthe top.
Mapping Semantic Information on Color
The call-graph is augmented not only by the size of its nodes but also by their color. In a class blueprintthe colors of nodes and edges represent semantic information extracted from the source code analysis. Thecolors play therefore an important role in conveying added information, as Bertin [BERT 74] and Tufte[TUFT 90] have extensively discussed. Table 5.1 presents the semantic information we add to a classblueprint and the associated colors.
Certain semantic information such as whether a method is delegating to another object is computedby analyzing the method abstract syntax tree (AST) and by identifying certain patterns. For example wequalify as delegating, a method invoking exactly thesamemethod on an attribute (pattern 2) or a methodinvocation (pattern 1). In addition to those patterns we consider also the case when the method is returninga value using in Smalltalk (pattern 3 and 4). Note that such an analysis is language dependent but doesnot pose any problem in practice.
Pattern 1: delegating to invocation result.
methodXself yyy methodX
Pattern 2: delegating to an attribute.
methodXinstVarY methodX
Pattern 3: delegating to an attribute with return.
methodXˆ self yyy methodX
Pattern 4: delegating to invocation result with return.
62
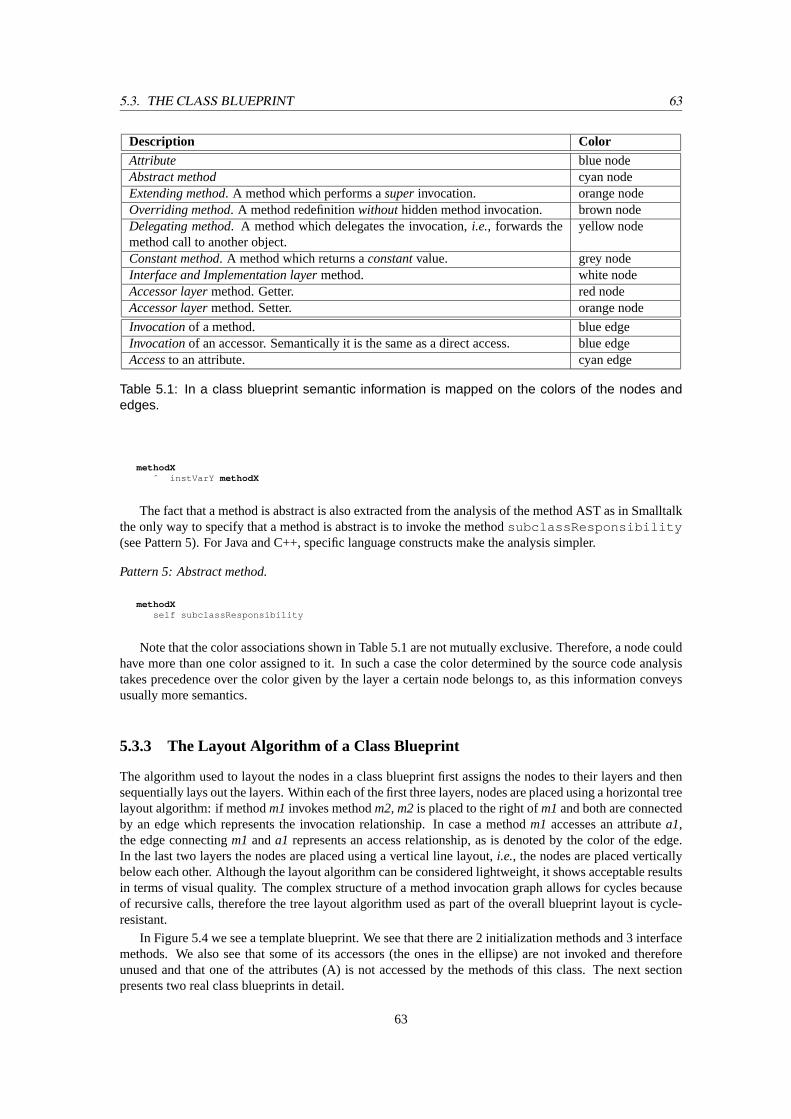
5.3. THE CLASS BLUEPRINT 63
Description ColorAttribute blue nodeAbstract method cyan nodeExtending method. A method which performs asuperinvocation. orange nodeOverriding method. A method redefinitionwithouthidden method invocation. brown nodeDelegating method. A method which delegates the invocation,i.e., forwards themethod call to another object.
yellow node
Constant method. A method which returns aconstantvalue. grey nodeInterface and Implementation layermethod. white nodeAccessor layermethod. Getter. red nodeAccessor layermethod. Setter. orange node
Invocationof a method. blue edgeInvocationof an accessor. Semantically it is the same as a direct access. blue edgeAccessto an attribute. cyan edge
Table 5.1: In a class blueprint semantic information is mapped on the colors of the nodes andedges.
methodXˆ instVarY methodX
The fact that a method is abstract is also extracted from the analysis of the method AST as in Smalltalkthe only way to specify that a method is abstract is to invoke the methodsubclassResponsibility(see Pattern 5). For Java and C++, specific language constructs make the analysis simpler.
Pattern 5: Abstract method.
methodXself subclassResponsibility
Note that the color associations shown in Table 5.1 are not mutually exclusive. Therefore, a node couldhave more than one color assigned to it. In such a case the color determined by the source code analysistakes precedence over the color given by the layer a certain node belongs to, as this information conveysusually more semantics.
5.3.3 The Layout Algorithm of a Class Blueprint
The algorithm used to layout the nodes in a class blueprint first assigns the nodes to their layers and thensequentially lays out the layers. Within each of the first three layers, nodes are placed using a horizontal treelayout algorithm: if methodm1invokes methodm2, m2is placed to the right ofm1and both are connectedby an edge which represents the invocation relationship. In case a methodm1 accesses an attributea1,the edge connectingm1 anda1 represents an access relationship, as is denoted by the color of the edge.In the last two layers the nodes are placed using a vertical line layout,i.e., the nodes are placed verticallybelow each other. Although the layout algorithm can be considered lightweight, it shows acceptable resultsin terms of visual quality. The complex structure of a method invocation graph allows for cycles becauseof recursive calls, therefore the tree layout algorithm used as part of the overall blueprint layout is cycle-resistant.
In Figure 5.4 we see a template blueprint. We see that there are 2 initialization methods and 3 interfacemethods. We also see that some of its accessors (the ones in the ellipse) are not invoked and thereforeunused and that one of the attributes (A) is not accessed by the methods of this class. The next sectionpresents two real class blueprints in detail.
63
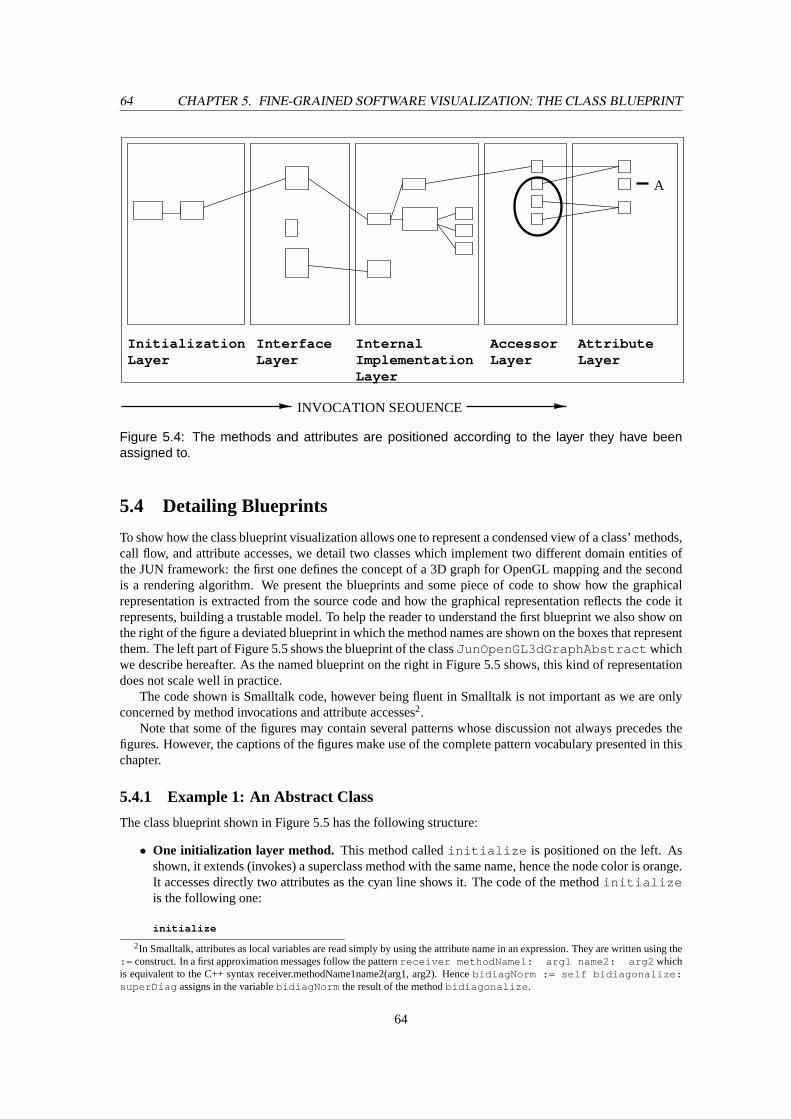
64 CHAPTER 5. FINE-GRAINED SOFTWARE VISUALIZATION: THE CLASS BLUEPRINT
Initialization AccessorInterface
A
Layer LayerInternalImplementation Layer
AttributeLayer
INVOCATION SEQUENCE
Layer
Figure 5.4: The methods and attributes are positioned according to the layer they have beenassigned to.
5.4 Detailing Blueprints
To show how the class blueprint visualization allows one to represent a condensed view of a class’ methods,call flow, and attribute accesses, we detail two classes which implement two different domain entities ofthe JUN framework: the first one defines the concept of a 3D graph for OpenGL mapping and the secondis a rendering algorithm. We present the blueprints and some piece of code to show how the graphicalrepresentation is extracted from the source code and how the graphical representation reflects the code itrepresents, building a trustable model. To help the reader to understand the first blueprint we also show onthe right of the figure a deviated blueprint in which the method names are shown on the boxes that representthem. The left part of Figure 5.5 shows the blueprint of the classJunOpenGL3dGraphAbstract whichwe describe hereafter. As the named blueprint on the right in Figure 5.5 shows, this kind of representationdoes not scale well in practice.
The code shown is Smalltalk code, however being fluent in Smalltalk is not important as we are onlyconcerned by method invocations and attribute accesses2.
Note that some of the figures may contain several patterns whose discussion not always precedes thefigures. However, the captions of the figures make use of the complete pattern vocabulary presented in thischapter.
5.4.1 Example 1: An Abstract Class
The class blueprint shown in Figure 5.5 has the following structure:
• One initialization layer method. This method calledinitialize is positioned on the left. Asshown, it extends (invokes) a superclass method with the same name, hence the node color is orange.It accesses directly two attributes as the cyan line shows it. The code of the methodinitializeis the following one:
initialize
2In Smalltalk, attributes as local variables are read simply by using the attribute name in an expression. They are written using the:= construct. In a first approximation messages follow the patternreceiver methodName1: arg1 name2: arg2 whichis equivalent to the C++ syntax receiver.methodName1name2(arg1, arg2). HencebidiagNorm := self bidiagonalize:superDiag assigns in the variablebidiagNorm the result of the methodbidiagonalize .
64
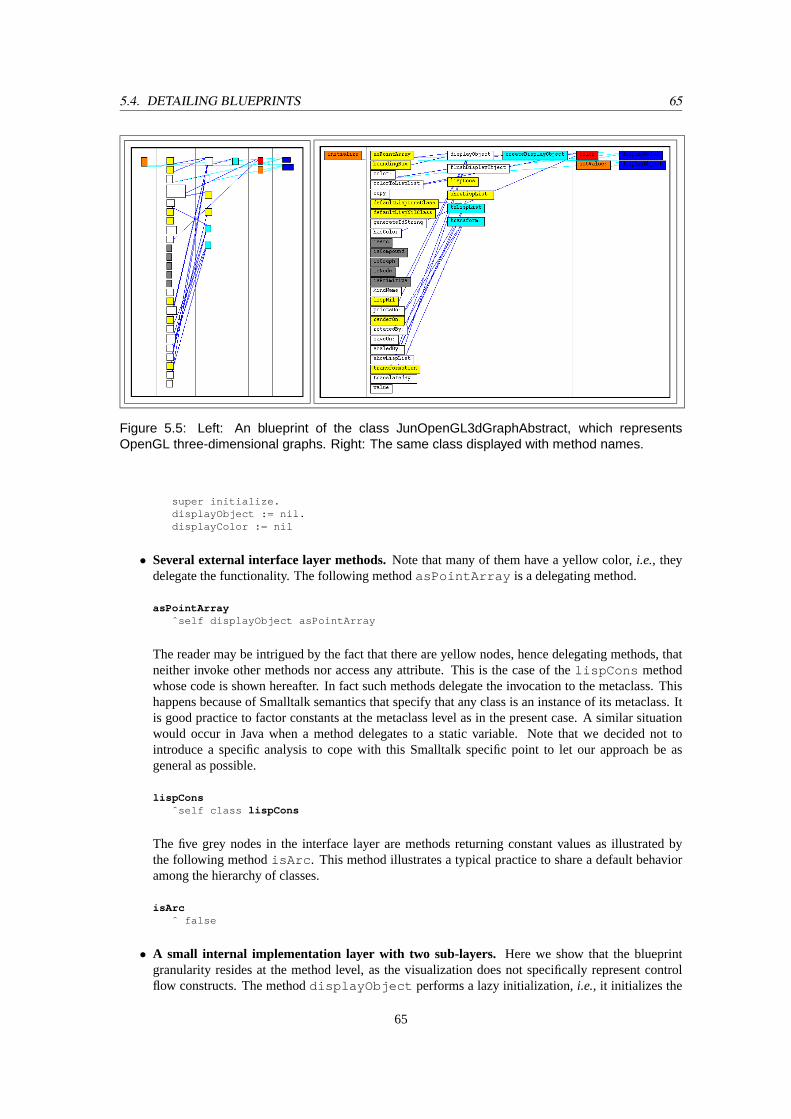
5.4. DETAILING BLUEPRINTS 65
Figure 5.5: Left: An blueprint of the class JunOpenGL3dGraphAbstract, which representsOpenGL three-dimensional graphs. Right: The same class displayed with method names.
super initialize.displayObject := nil.displayColor := nil
• Several external interface layer methods.Note that many of them have a yellow color,i.e., theydelegate the functionality. The following methodasPointArray is a delegating method.
asPointArrayˆself displayObject asPointArray
The reader may be intrigued by the fact that there are yellow nodes, hence delegating methods, thatneither invoke other methods nor access any attribute. This is the case of thelispCons methodwhose code is shown hereafter. In fact such methods delegate the invocation to the metaclass. Thishappens because of Smalltalk semantics that specify that any class is an instance of its metaclass. Itis good practice to factor constants at the metaclass level as in the present case. A similar situationwould occur in Java when a method delegates to a static variable. Note that we decided not tointroduce a specific analysis to cope with this Smalltalk specific point to let our approach be asgeneral as possible.
lispConsˆself class lispCons
The five grey nodes in the interface layer are methods returning constant values as illustrated bythe following methodisArc . This method illustrates a typical practice to share a default behavioramong the hierarchy of classes.
isArcˆ false
• A small internal implementation layer with two sub-layers. Here we show that the blueprintgranularity resides at the method level, as the visualization does not specifically represent controlflow constructs. The methoddisplayObject performs a lazy initialization,i.e., it initializes the
65
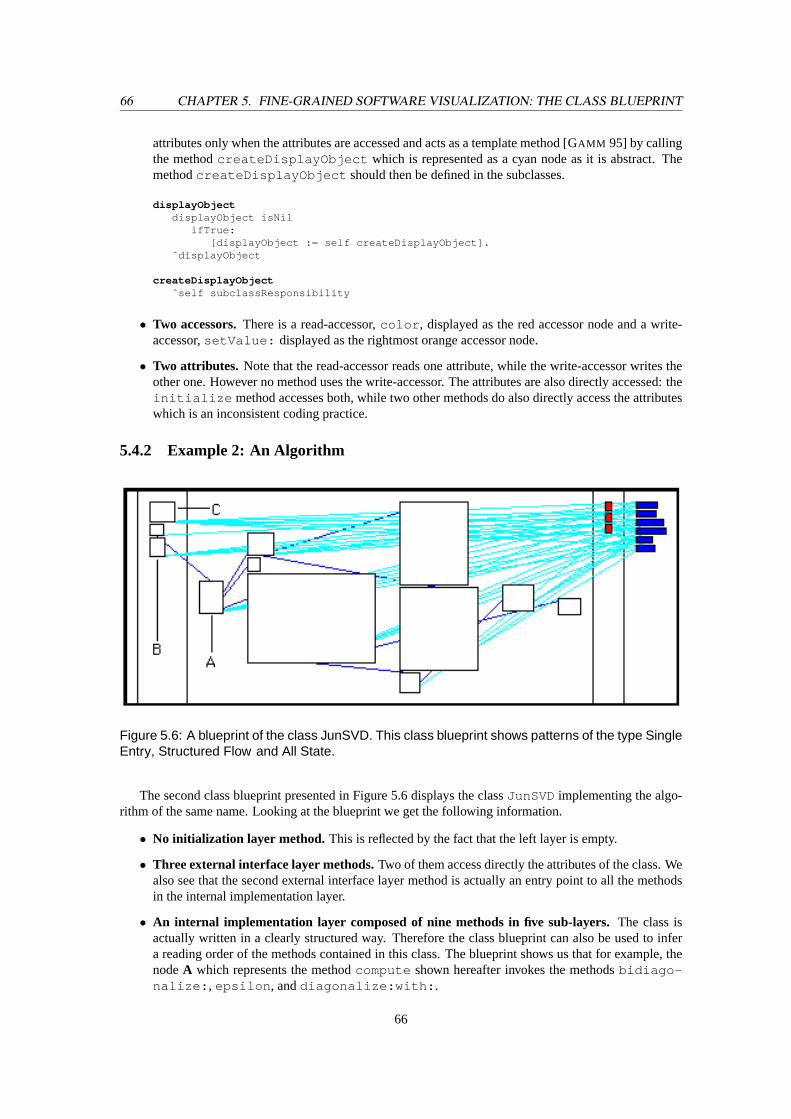
66 CHAPTER 5. FINE-GRAINED SOFTWARE VISUALIZATION: THE CLASS BLUEPRINT
attributes only when the attributes are accessed and acts as a template method [GAMM 95] by callingthe methodcreateDisplayObject which is represented as a cyan node as it is abstract. ThemethodcreateDisplayObject should then be defined in the subclasses.
displayObjectdisplayObject isNil
ifTrue:[displayObject := self createDisplayObject].
ˆdisplayObject
createDisplayObjectˆself subclassResponsibility
• Two accessors.There is a read-accessor,color , displayed as the red accessor node and a write-accessor,setValue: displayed as the rightmost orange accessor node.
• Two attributes. Note that the read-accessor reads one attribute, while the write-accessor writes theother one. However no method uses the write-accessor. The attributes are also directly accessed: theinitialize method accesses both, while two other methods do also directly access the attributeswhich is an inconsistent coding practice.
5.4.2 Example 2: An Algorithm
Figure 5.6: A blueprint of the class JunSVD. This class blueprint shows patterns of the type SingleEntry, Structured Flow and All State.
The second class blueprint presented in Figure 5.6 displays the classJunSVD implementing the algo-rithm of the same name. Looking at the blueprint we get the following information.
• No initialization layer method. This is reflected by the fact that the left layer is empty.
• Three external interface layer methods.Two of them access directly the attributes of the class. Wealso see that the second external interface layer method is actually an entry point to all the methodsin the internal implementation layer.
• An internal implementation layer composed of nine methods in five sub-layers.The class isactually written in a clearly structured way. Therefore the class blueprint can also be used to infera reading order of the methods contained in this class. The blueprint shows us that for example, thenodeA which represents the methodcompute shown hereafter invokes the methodsbidiago-nalize: , epsilon , anddiagonalize:with: .
66
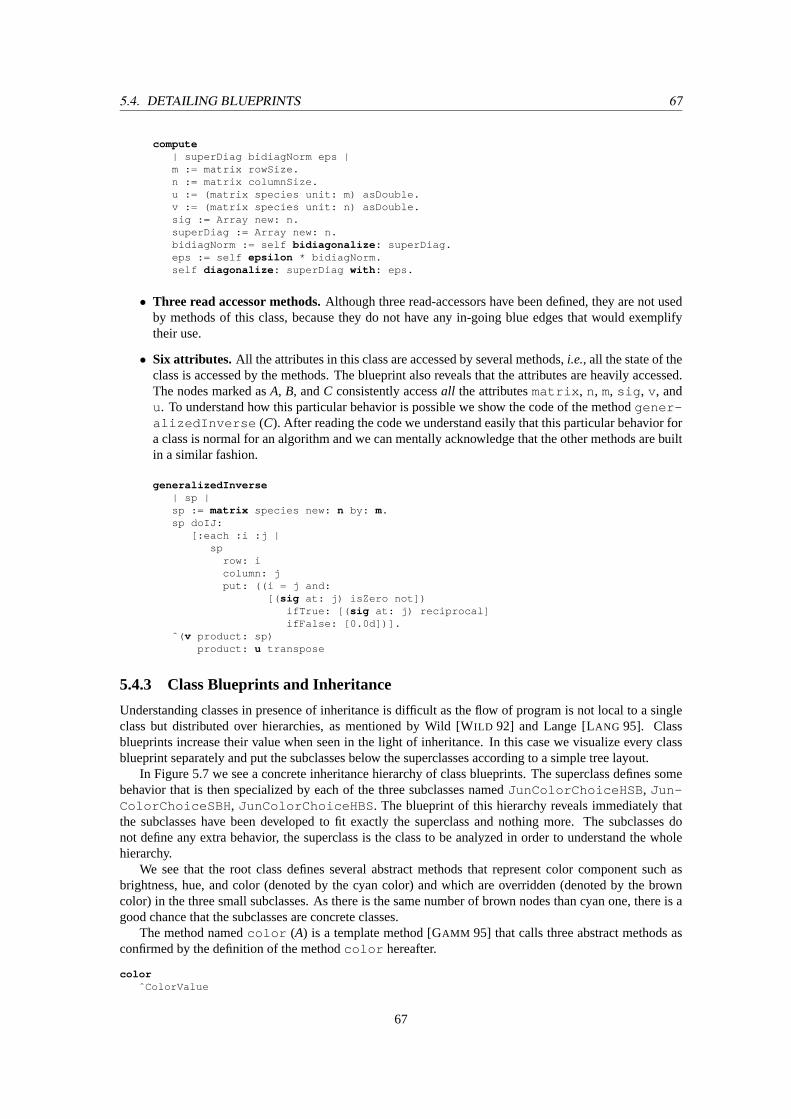
5.4. DETAILING BLUEPRINTS 67
compute| superDiag bidiagNorm eps |m := matrix rowSize.n := matrix columnSize.u := (matrix species unit: m) asDouble.v := (matrix species unit: n) asDouble.sig := Array new: n.superDiag := Array new: n.bidiagNorm := self bidiagonalize: superDiag.eps := self epsilon * bidiagNorm.self diagonalize: superDiag with: eps.
• Three read accessor methods.Although three read-accessors have been defined, they are not usedby methods of this class, because they do not have any in-going blue edges that would exemplifytheir use.
• Six attributes. All the attributes in this class are accessed by several methods,i.e.,all the state of theclass is accessed by the methods. The blueprint also reveals that the attributes are heavily accessed.The nodes marked asA, B,andC consistently accessall the attributesmatrix , n, m, sig , v , andu. To understand how this particular behavior is possible we show the code of the methodgener-alizedInverse (C). After reading the code we understand easily that this particular behavior fora class is normal for an algorithm and we can mentally acknowledge that the other methods are builtin a similar fashion.
generalizedInverse| sp |sp := matrix species new: n by: m.sp doIJ:
[:each :i :j |sp
row: icolumn: jput: ((i = j and:
[( sig at: j) isZero not])ifTrue: [( sig at: j) reciprocal]ifFalse: [0.0d])].
ˆ( v product: sp)product: u transpose
5.4.3 Class Blueprints and Inheritance
Understanding classes in presence of inheritance is difficult as the flow of program is not local to a singleclass but distributed over hierarchies, as mentioned by Wild [WILD 92] and Lange [LANG 95]. Classblueprints increase their value when seen in the light of inheritance. In this case we visualize every classblueprint separately and put the subclasses below the superclasses according to a simple tree layout.
In Figure 5.7 we see a concrete inheritance hierarchy of class blueprints. The superclass defines somebehavior that is then specialized by each of the three subclasses namedJunColorChoiceHSB , Jun-ColorChoiceSBH , JunColorChoiceHBS . The blueprint of this hierarchy reveals immediately thatthe subclasses have been developed to fit exactly the superclass and nothing more. The subclasses donot define any extra behavior, the superclass is the class to be analyzed in order to understand the wholehierarchy.
We see that the root class defines several abstract methods that represent color component such asbrightness, hue, and color (denoted by the cyan color) and which are overridden (denoted by the browncolor) in the three small subclasses. As there is the same number of brown nodes than cyan one, there is agood chance that the subclasses are concrete classes.
The method namedcolor (A) is a template method [GAMM 95] that calls three abstract methods asconfirmed by the definition of the methodcolor hereafter.
colorˆColorValue
67
68 CHAPTER 5. FINE-GRAINED SOFTWARE VISUALIZATION: THE CLASS BLUEPRINT
Figure 5.7: A class blueprint visualization of an inheritance hierarchy with the class JunColor-Choice as root class. The root class contains an Interface pattern, while each of the subclassesis a pure Overrider. Furthermore, each subclass is a pure Siamese Twin.
hue: self huesaturation: self saturationbrightness: self brightness
We see that the methodsxy: (B), andxy (C) play a central role in the design of the class as they areboth called by several of the methods of each subclass, as confirmed by the following method of the classJunColorChoiceSBH :
JunColorChoiceSBH>>brightness: value((value isKindOf: Number)
and: [0.0 <= value and: [value <= 1.0]])ifTrue: [self xy: self xy x @ 1 - value]
These examples show that the blueprints are useful to fulfill our fine-grained reverse engineering goals,namely:
1. Understand the concrete implementation of classes and class hierarchies, and detect common patternsor coding styles. Look for signs of inconsistencies like the use of accessors.
2. Identify the possible presence of design patterns or occasions where design patterns could be intro-duced to ameliorate the system’s structure.
3. Build a mental image of a class in terms of method invocations and state access.
4. Understand the class/subclass roles.
5. Identify key methods in a class.
68
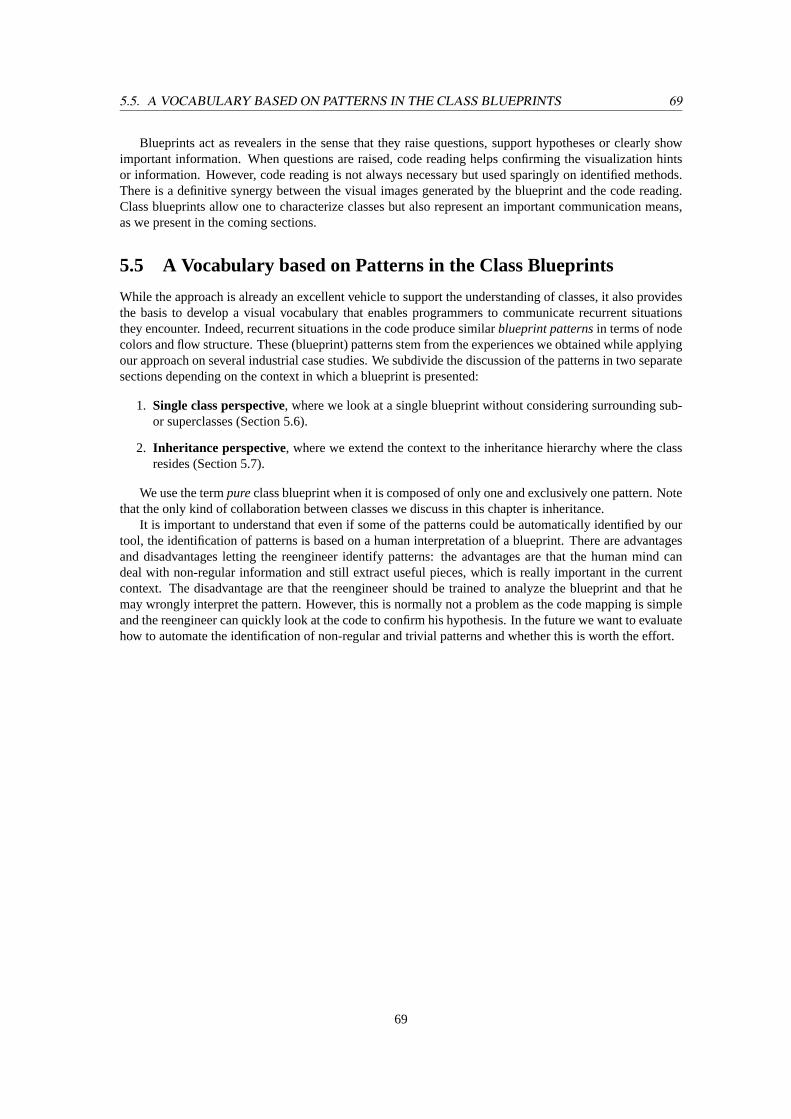
5.5. A VOCABULARY BASED ON PATTERNS IN THE CLASS BLUEPRINTS 69
Blueprints act as revealers in the sense that they raise questions, support hypotheses or clearly showimportant information. When questions are raised, code reading helps confirming the visualization hintsor information. However, code reading is not always necessary but used sparingly on identified methods.There is a definitive synergy between the visual images generated by the blueprint and the code reading.Class blueprints allow one to characterize classes but also represent an important communication means,as we present in the coming sections.
5.5 A Vocabulary based on Patterns in the Class Blueprints
While the approach is already an excellent vehicle to support the understanding of classes, it also providesthe basis to develop a visual vocabulary that enables programmers to communicate recurrent situationsthey encounter. Indeed, recurrent situations in the code produce similarblueprint patternsin terms of nodecolors and flow structure. These (blueprint) patterns stem from the experiences we obtained while applyingour approach on several industrial case studies. We subdivide the discussion of the patterns in two separatesections depending on the context in which a blueprint is presented:
1. Single class perspective, where we look at a single blueprint without considering surrounding sub-or superclasses (Section 5.6).
2. Inheritance perspective, where we extend the context to the inheritance hierarchy where the classresides (Section 5.7).
We use the termpureclass blueprint when it is composed of only one and exclusively one pattern. Notethat the only kind of collaboration between classes we discuss in this chapter is inheritance.
It is important to understand that even if some of the patterns could be automatically identified by ourtool, the identification of patterns is based on a human interpretation of a blueprint. There are advantagesand disadvantages letting the reengineer identify patterns: the advantages are that the human mind candeal with non-regular information and still extract useful pieces, which is really important in the currentcontext. The disadvantage are that the reengineer should be trained to analyze the blueprint and that hemay wrongly interpret the pattern. However, this is normally not a problem as the code mapping is simpleand the reengineer can quickly look at the code to confirm his hypothesis. In the future we want to evaluatehow to automate the identification of non-regular and trivial patterns and whether this is worth the effort.
69

70 CHAPTER 5. FINE-GRAINED SOFTWARE VISUALIZATION: THE CLASS BLUEPRINT
5.6 Single Class Blueprint Patterns
In this part we present the patterns that blueprints contain without considering surrounding sub- and super-classes. Note that one class blueprint may contain several patterns. The blueprint patterns in this sectionare grouped according to the following criteria:
• size(Section 5.6.1)
• distribution layer(Section 5.6.2)
• semantics(Section 5.6.3)
• call-flow (Section 5.6.4)
• andstate usage(Section 5.6.5)
Note that this grouping is not strict and is mainly used to ease the reading of the chapter.
70
5.6. SINGLE CLASS BLUEPRINT PATTERNS 71
5.6.1 Size-based Blueprint Patterns
Figure 5.8: A class blueprint visualization of an inheritance hierarchy with the class JunPrologEn-tity as root class.
Four simple patterns describe classes regarding their size:Single, Micro, Large Implementation, andGiant.
Single
This pattern is composed of one node. It describes classes that only consist of one method (see the rootclass of the hierarchy in Figure 5.8). This happens in the following cases:
1. The class in question represents dead code or has not been completely implemented yet.
2. It is the result of code sharing among hierarchies. It often represents methods defining single defaultvalues or testing methods in the form ofisSomething()as shown by the following method definition.See the discussion of theSingle Constant Definerpattern for more details. The single method of theroot class in Figure 5.8 has the following definition:
JunPrologEntity>>isJunPrologEntityˆtrue
When the method is not a method simply defining a constant but has a certain complexity, it isworth to look at it as it represents common behavior shared among several classes and often used todistinguish between several kinds of classes. In an inheritance hierarchy consisting of fifteen classes,not shown as blueprints in this chapter, implementing probability distribution, we found two singleclasses at the top of the hierarchy whose main purposes was to factor out two different ways ofcomputing a distribution as shown by the following definitions:
JunDiscreteProbability>>distribution: aCollection| t |t := 0.0.aCollection do: [:i | t := t + (self density: i)].ˆt
71
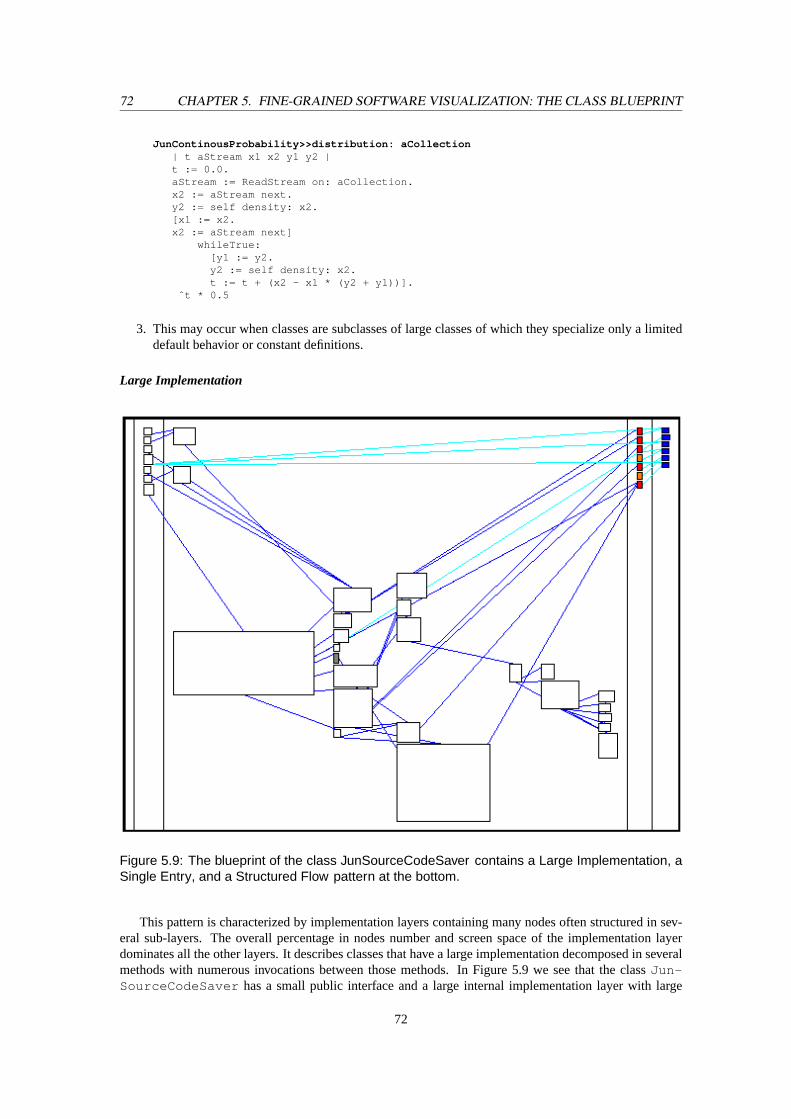
72 CHAPTER 5. FINE-GRAINED SOFTWARE VISUALIZATION: THE CLASS BLUEPRINT
JunContinousProbability>>distribution: aCollection| t aStream x1 x2 y1 y2 |t := 0.0.aStream := ReadStream on: aCollection.x2 := aStream next.y2 := self density: x2.[x1 := x2.x2 := aStream next]
whileTrue:[y1 := y2.y2 := self density: x2.t := t + (x2 - x1 * (y2 + y1))].
ˆt * 0.5
3. This may occur when classes are subclasses of large classes of which they specialize only a limiteddefault behavior or constant definitions.
Large Implementation
Figure 5.9: The blueprint of the class JunSourceCodeSaver contains a Large Implementation, aSingle Entry, and a Structured Flow pattern at the bottom.
This pattern is characterized by implementation layers containing many nodes often structured in sev-eral sub-layers. The overall percentage in nodes number and screen space of the implementation layerdominates all the other layers. It describes classes that have a large implementation decomposed in severalmethods with numerous invocations between those methods. In Figure 5.9 we see that the classJun-SourceCodeSaver has a small public interface and a large internal implementation layer with large
72

5.6. SINGLE CLASS BLUEPRINT PATTERNS 73
methods and 6 sub-layers. The role of this class is to save in a proprietary format the code of the applica-tion. As in Smalltalk classes are objects too, the code of this class is mainly extracting information fromclasses and transforming into strings that are finally stored on disk. This explains the impressive size ofcertain methods.
Micro
This pattern is composed of only a couple of nodes. It describes a small class that is composed of onlya couple of methods (see class annotated as emphF in Figure 5.8). This often occurs in subclasses thatspecialize behavior.
Giant
A really large number of nodes and invocations composes the entire blueprint. This pattern describes a hugeclass that is composed of hundreds of methods. Normally the blueprint layout algorithm is not efficientenough to support the understanding of such classes, although often patterns are recognizable. Such classescan have a complex initialization structure producing very long methods. Usually classes revealing aGiantpattern are classes having too much responsibilities and thus require a closer inspection.
73
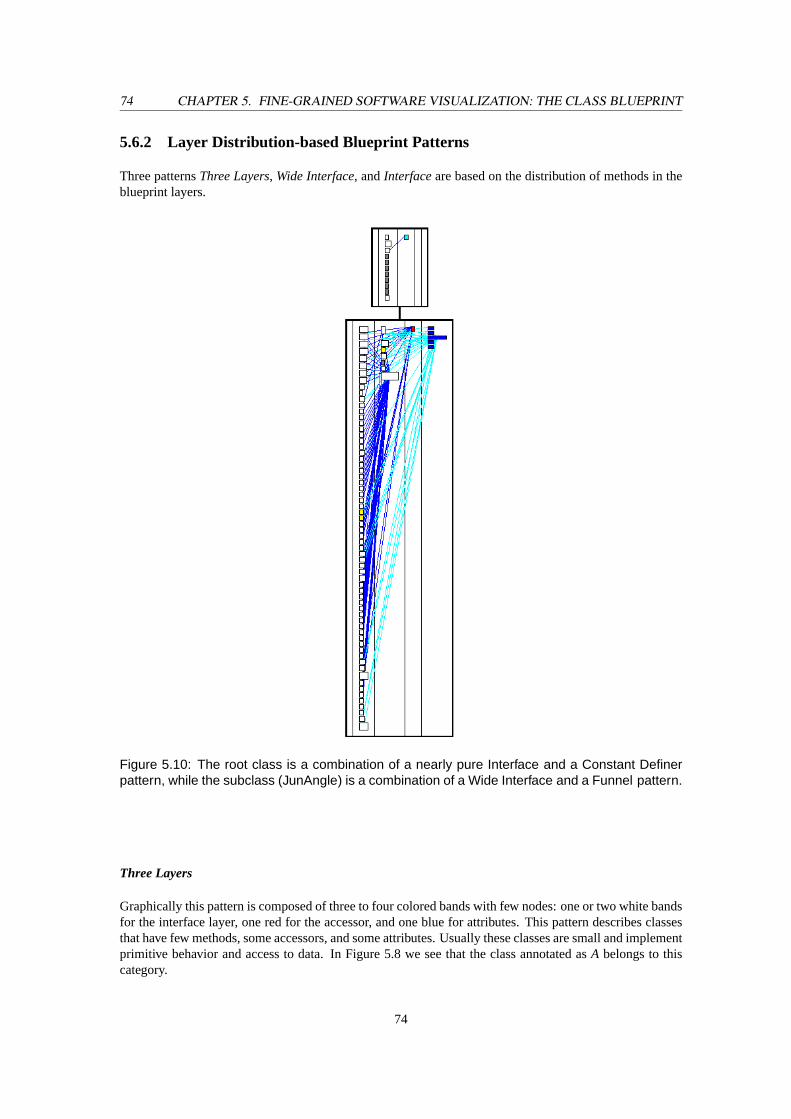
74 CHAPTER 5. FINE-GRAINED SOFTWARE VISUALIZATION: THE CLASS BLUEPRINT
5.6.2 Layer Distribution-based Blueprint Patterns
Three patternsThree Layers, Wide Interface, andInterfaceare based on the distribution of methods in theblueprint layers.
Figure 5.10: The root class is a combination of a nearly pure Interface and a Constant Definerpattern, while the subclass (JunAngle) is a combination of a Wide Interface and a Funnel pattern.
Three Layers
Graphically this pattern is composed of three to four colored bands with few nodes: one or two white bandsfor the interface layer, one red for the accessor, and one blue for attributes. This pattern describes classesthat have few methods, some accessors, and some attributes. Usually these classes are small and implementprimitive behavior and access to data. In Figure 5.8 we see that the class annotated asA belongs to thiscategory.
74
5.6. SINGLE CLASS BLUEPRINT PATTERNS 75
Interface
Graphically the pattern present one predominant interface layer. It occurs when a class acts as an interface,which is frequent for abstract superclasses. It also occurs when the class acts as a pool of constants. In theSmalltalk programming language there is no construct for defining constant values, therefore class methodsare often used to return constant values. Such classes can also contain aConstant Definerpattern as shownby the top class blueprint in Figure 5.10.
Wide Interface
Graphically this pattern is composed of a large interface layer proportionally to the rest of the class. AWide Interfaceblueprint is one that offers many entry points to its functionality proportionally to its im-plementation layer (see Figure 5.10 and to a certain extent Figure 5.5). Examples of such classes are GUIclasses with many buttons on the user interface which implement a method for every button the user canpress.
75
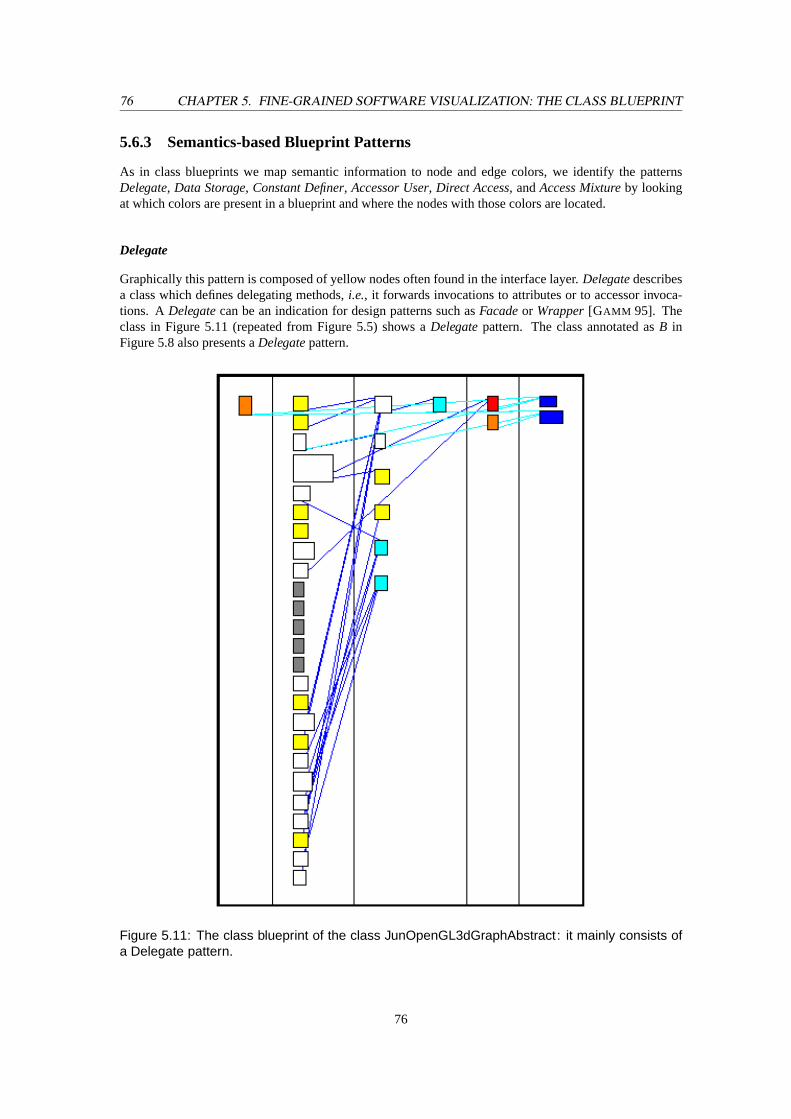
76 CHAPTER 5. FINE-GRAINED SOFTWARE VISUALIZATION: THE CLASS BLUEPRINT
5.6.3 Semantics-based Blueprint Patterns
As in class blueprints we map semantic information to node and edge colors, we identify the patternsDelegate, Data Storage, Constant Definer, Accessor User, Direct Access, andAccess Mixtureby lookingat which colors are present in a blueprint and where the nodes with those colors are located.
Delegate
Graphically this pattern is composed of yellow nodes often found in the interface layer.Delegatedescribesa class which defines delegating methods,i.e., it forwards invocations to attributes or to accessor invoca-tions. A Delegatecan be an indication for design patterns such asFacadeor Wrapper[GAMM 95]. Theclass in Figure 5.11 (repeated from Figure 5.5) shows aDelegatepattern. The class annotated asB inFigure 5.8 also presents aDelegatepattern.
Figure 5.11: The class blueprint of the class JunOpenGL3dGraphAbstract : it mainly consists ofa Delegate pattern.
76
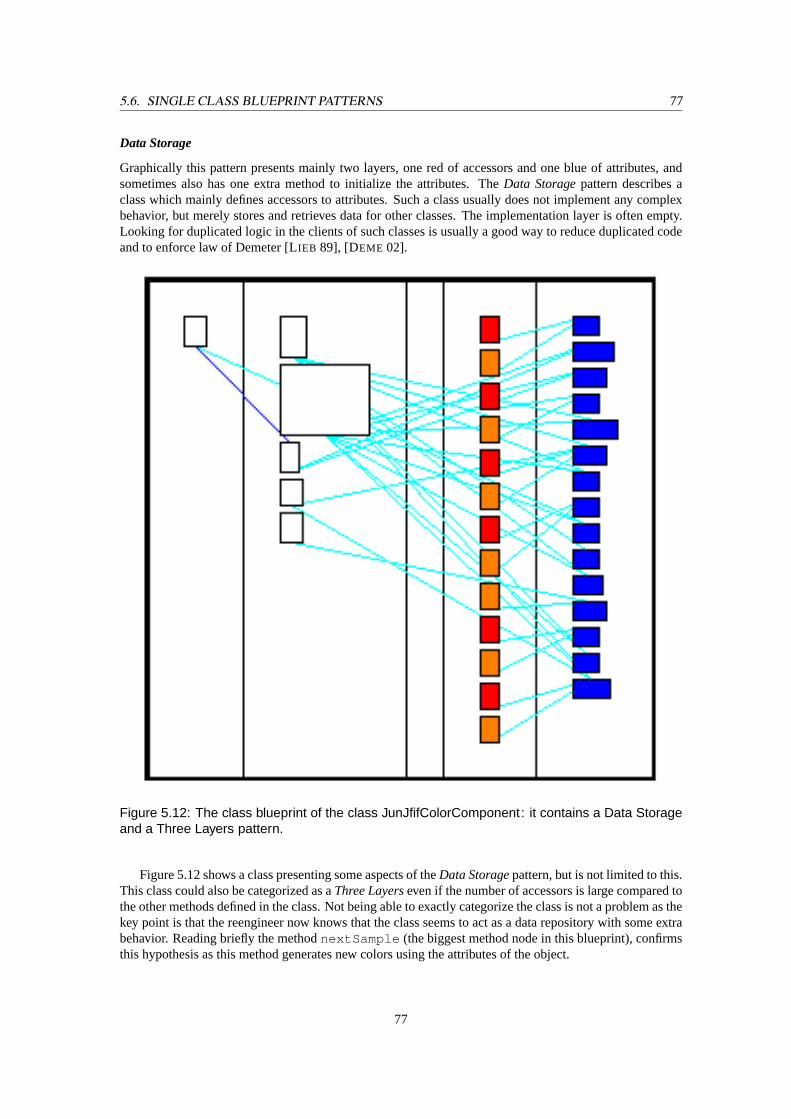
5.6. SINGLE CLASS BLUEPRINT PATTERNS 77
Data Storage
Graphically this pattern presents mainly two layers, one red of accessors and one blue of attributes, andsometimes also has one extra method to initialize the attributes. TheData Storagepattern describes aclass which mainly defines accessors to attributes. Such a class usually does not implement any complexbehavior, but merely stores and retrieves data for other classes. The implementation layer is often empty.Looking for duplicated logic in the clients of such classes is usually a good way to reduce duplicated codeand to enforce law of Demeter [LIEB 89], [DEME 02].
Figure 5.12: The class blueprint of the class JunJfifColorComponent : it contains a Data Storageand a Three Layers pattern.
Figure 5.12 shows a class presenting some aspects of theData Storagepattern, but is not limited to this.This class could also be categorized as aThree Layerseven if the number of accessors is large compared tothe other methods defined in the class. Not being able to exactly categorize the class is not a problem as thekey point is that the reengineer now knows that the class seems to act as a data repository with some extrabehavior. Reading briefly the methodnextSample (the biggest method node in this blueprint), confirmsthis hypothesis as this method generates new colors using the attributes of the object.
77
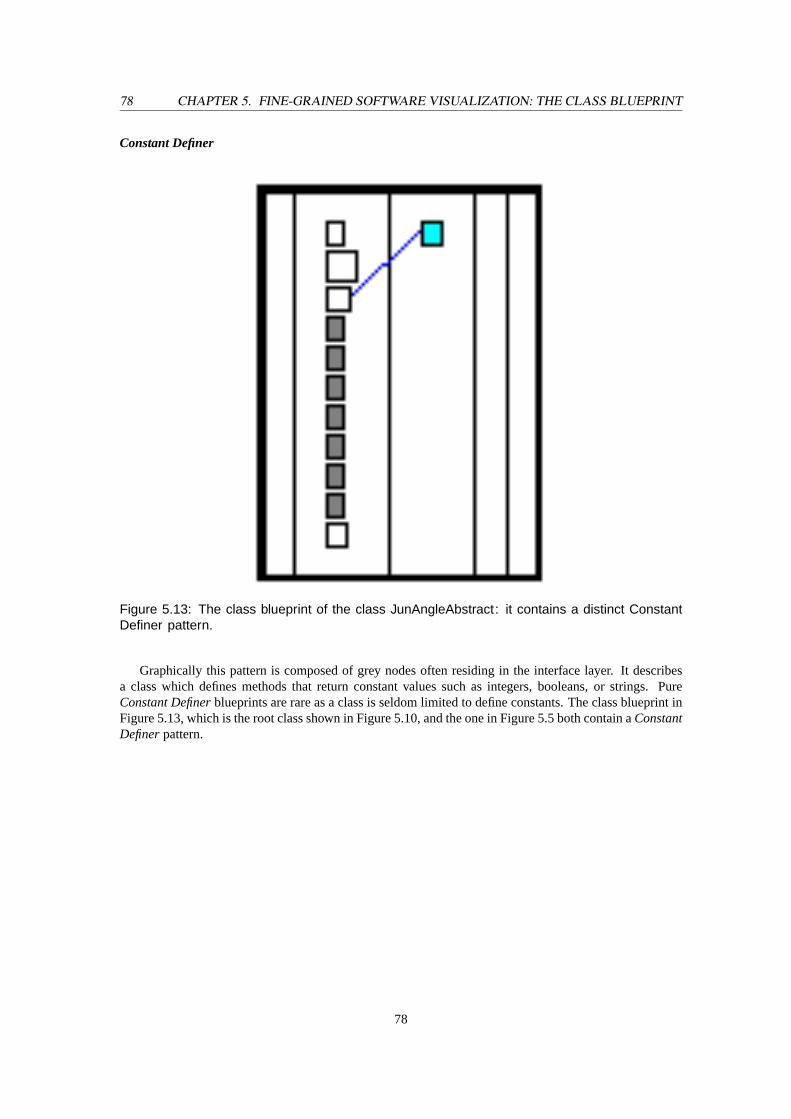
78 CHAPTER 5. FINE-GRAINED SOFTWARE VISUALIZATION: THE CLASS BLUEPRINT
Constant Definer
Figure 5.13: The class blueprint of the class JunAngleAbstract : it contains a distinct ConstantDefiner pattern.
Graphically this pattern is composed of grey nodes often residing in the interface layer. It describesa class which defines methods that return constant values such as integers, booleans, or strings. PureConstant Definerblueprints are rare as a class is seldom limited to define constants. The class blueprint inFigure 5.13, which is the root class shown in Figure 5.10, and the one in Figure 5.5 both contain aConstantDefinerpattern.
78
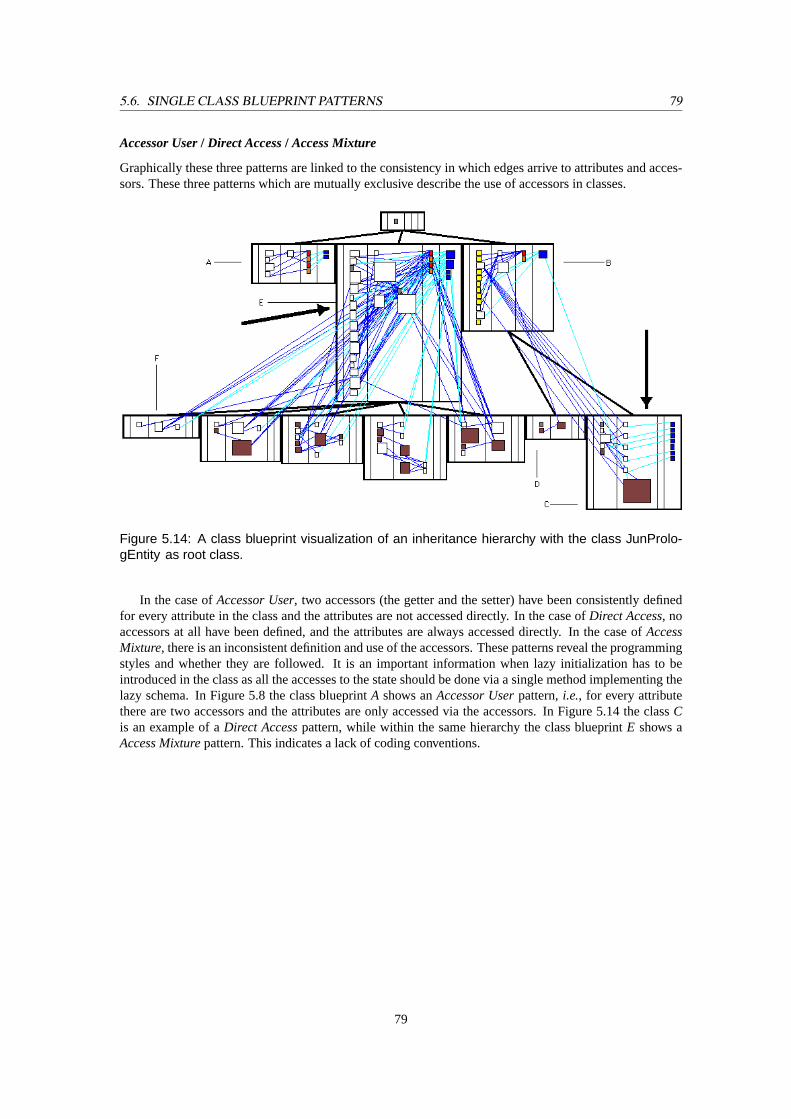
5.6. SINGLE CLASS BLUEPRINT PATTERNS 79
Accessor User/ Direct Access/ Access Mixture
Graphically these three patterns are linked to the consistency in which edges arrive to attributes and acces-sors. These three patterns which are mutually exclusive describe the use of accessors in classes.
Figure 5.14: A class blueprint visualization of an inheritance hierarchy with the class JunProlo-gEntity as root class.
In the case ofAccessor User, two accessors (the getter and the setter) have been consistently definedfor every attribute in the class and the attributes are not accessed directly. In the case ofDirect Access, noaccessors at all have been defined, and the attributes are always accessed directly. In the case ofAccessMixture, there is an inconsistent definition and use of the accessors. These patterns reveal the programmingstyles and whether they are followed. It is an important information when lazy initialization has to beintroduced in the class as all the accesses to the state should be done via a single method implementing thelazy schema. In Figure 5.8 the class blueprintA shows anAccessor Userpattern,i.e., for every attributethere are two accessors and the attributes are only accessed via the accessors. In Figure 5.14 the classCis an example of aDirect Accesspattern, while within the same hierarchy the class blueprintE shows aAccess Mixturepattern. This indicates a lack of coding conventions.
79
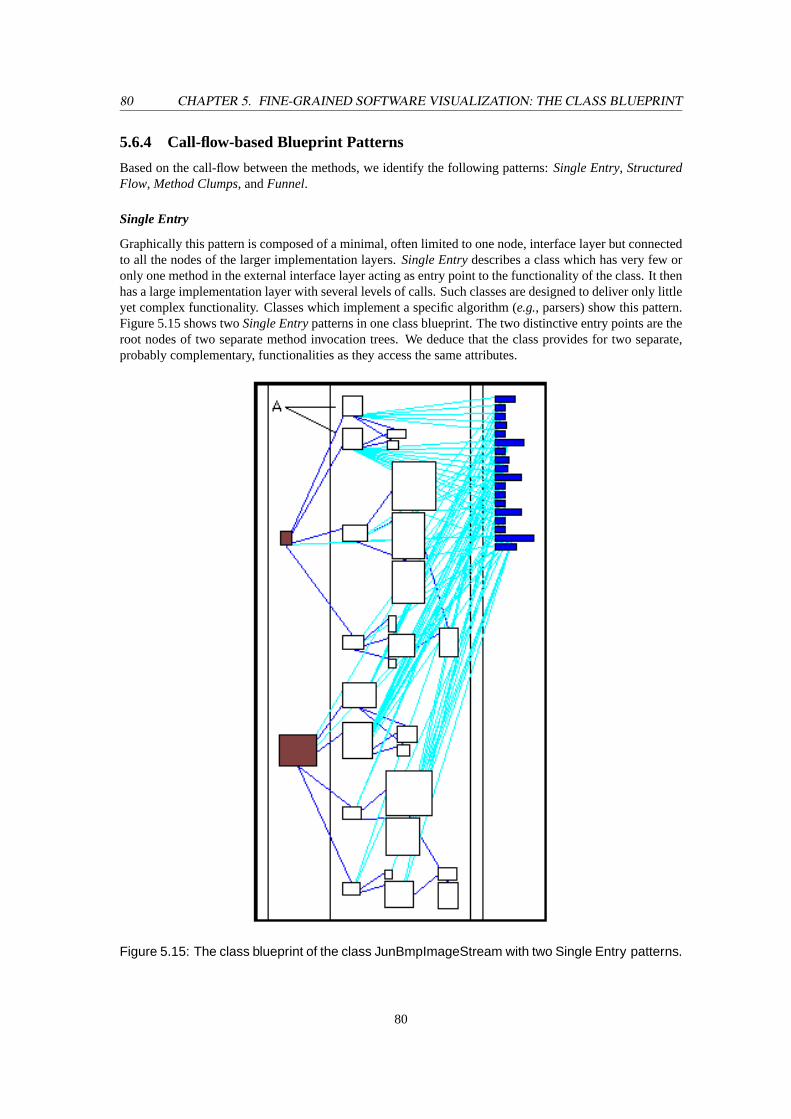
80 CHAPTER 5. FINE-GRAINED SOFTWARE VISUALIZATION: THE CLASS BLUEPRINT
5.6.4 Call-flow-based Blueprint Patterns
Based on the call-flow between the methods, we identify the following patterns:Single Entry, StructuredFlow, Method Clumps, andFunnel.
Single Entry
Graphically this pattern is composed of a minimal, often limited to one node, interface layer but connectedto all the nodes of the larger implementation layers.Single Entrydescribes a class which has very few oronly one method in the external interface layer acting as entry point to the functionality of the class. It thenhas a large implementation layer with several levels of calls. Such classes are designed to deliver only littleyet complex functionality. Classes which implement a specific algorithm (e.g., parsers) show this pattern.Figure 5.15 shows twoSingle Entrypatterns in one class blueprint. The two distinctive entry points are theroot nodes of two separate method invocation trees. We deduce that the class provides for two separate,probably complementary, functionalities as they access the same attributes.
Figure 5.15: The class blueprint of the class JunBmpImageStream with two Single Entry patterns.
80
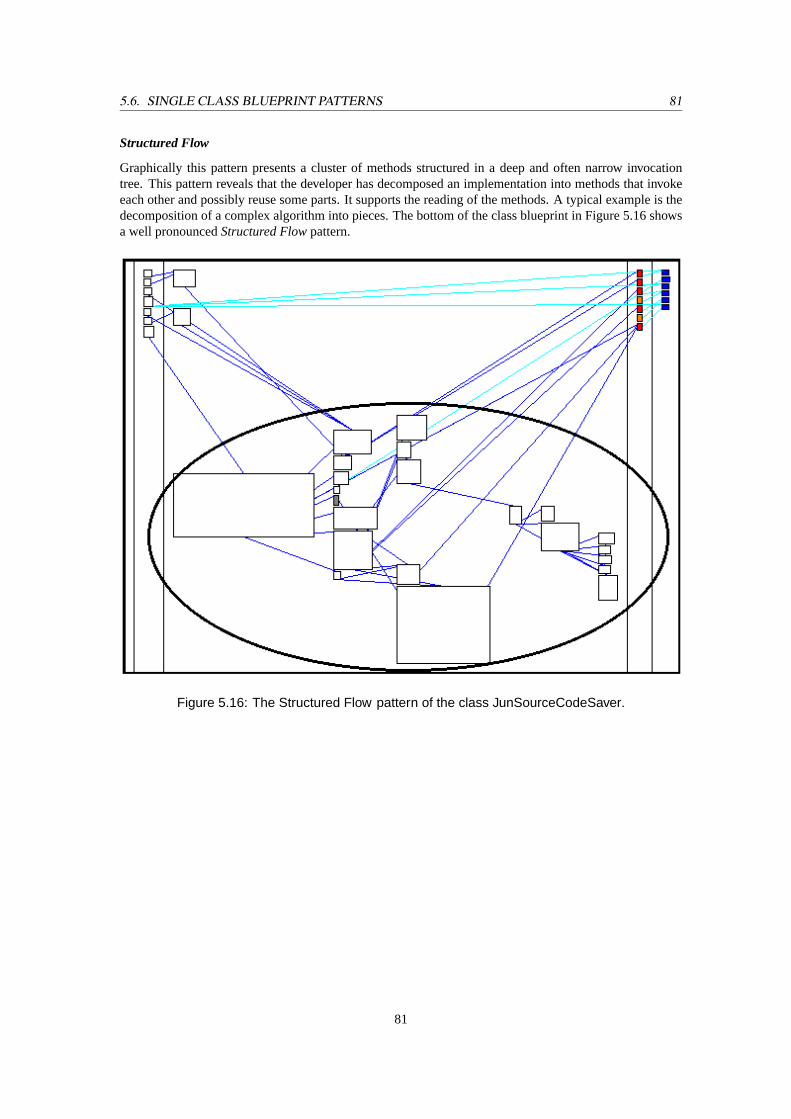
5.6. SINGLE CLASS BLUEPRINT PATTERNS 81
Structured Flow
Graphically this pattern presents a cluster of methods structured in a deep and often narrow invocationtree. This pattern reveals that the developer has decomposed an implementation into methods that invokeeach other and possibly reuse some parts. It supports the reading of the methods. A typical example is thedecomposition of a complex algorithm into pieces. The bottom of the class blueprint in Figure 5.16 showsa well pronouncedStructured Flowpattern.
Figure 5.16: The Structured Flow pattern of the class JunSourceCodeSaver.
81
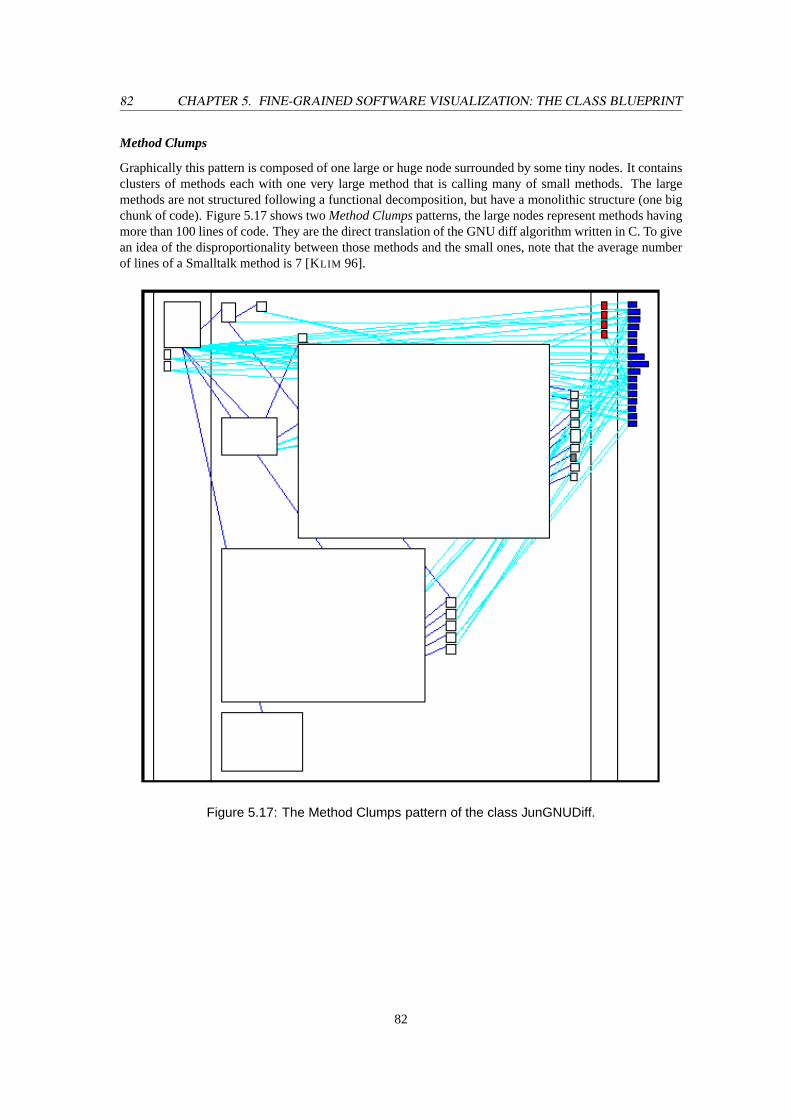
82 CHAPTER 5. FINE-GRAINED SOFTWARE VISUALIZATION: THE CLASS BLUEPRINT
Method Clumps
Graphically this pattern is composed of one large or huge node surrounded by some tiny nodes. It containsclusters of methods each with one very large method that is calling many of small methods. The largemethods are not structured following a functional decomposition, but have a monolithic structure (one bigchunk of code). Figure 5.17 shows twoMethod Clumpspatterns, the large nodes represent methods havingmore than 100 lines of code. They are the direct translation of the GNU diff algorithm written in C. To givean idea of the disproportionality between those methods and the small ones, note that the average numberof lines of a Smalltalk method is 7 [KLIM 96].
Figure 5.17: The Method Clumps pattern of the class JunGNUDiff.
82
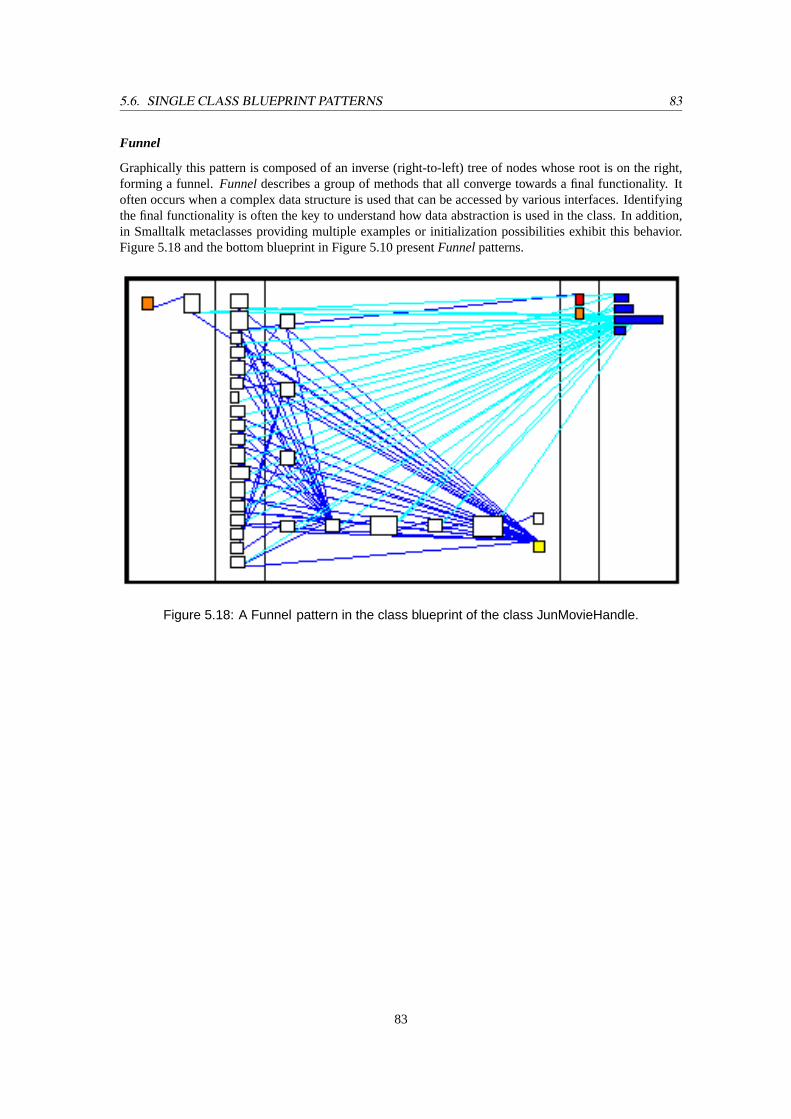
5.6. SINGLE CLASS BLUEPRINT PATTERNS 83
Funnel
Graphically this pattern is composed of an inverse (right-to-left) tree of nodes whose root is on the right,forming a funnel.Funneldescribes a group of methods that all converge towards a final functionality. Itoften occurs when a complex data structure is used that can be accessed by various interfaces. Identifyingthe final functionality is often the key to understand how data abstraction is used in the class. In addition,in Smalltalk metaclasses providing multiple examples or initialization possibilities exhibit this behavior.Figure 5.18 and the bottom blueprint in Figure 5.10 presentFunnelpatterns.
Figure 5.18: A Funnel pattern in the class blueprint of the class JunMovieHandle.
83
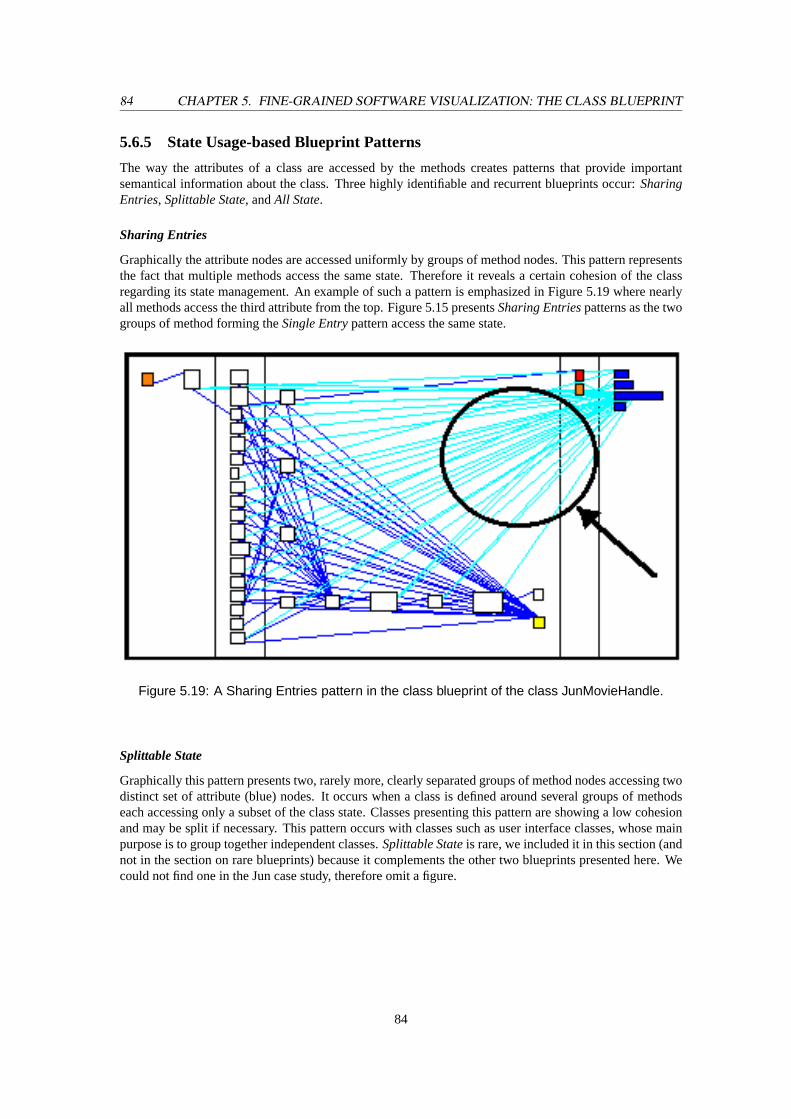
84 CHAPTER 5. FINE-GRAINED SOFTWARE VISUALIZATION: THE CLASS BLUEPRINT
5.6.5 State Usage-based Blueprint Patterns
The way the attributes of a class are accessed by the methods creates patterns that provide importantsemantical information about the class. Three highly identifiable and recurrent blueprints occur:SharingEntries, Splittable State, andAll State.
Sharing Entries
Graphically the attribute nodes are accessed uniformly by groups of method nodes. This pattern representsthe fact that multiple methods access the same state. Therefore it reveals a certain cohesion of the classregarding its state management. An example of such a pattern is emphasized in Figure 5.19 where nearlyall methods access the third attribute from the top. Figure 5.15 presentsSharing Entriespatterns as the twogroups of method forming theSingle Entrypattern access the same state.
Figure 5.19: A Sharing Entries pattern in the class blueprint of the class JunMovieHandle.
Splittable State
Graphically this pattern presents two, rarely more, clearly separated groups of method nodes accessing twodistinct set of attribute (blue) nodes. It occurs when a class is defined around several groups of methodseach accessing only a subset of the class state. Classes presenting this pattern are showing a low cohesionand may be split if necessary. This pattern occurs with classes such as user interface classes, whose mainpurpose is to group together independent classes.Splittable Stateis rare, we included it in this section (andnot in the section on rare blueprints) because it complements the other two blueprints presented here. Wecould not find one in the Jun case study, therefore omit a figure.
84
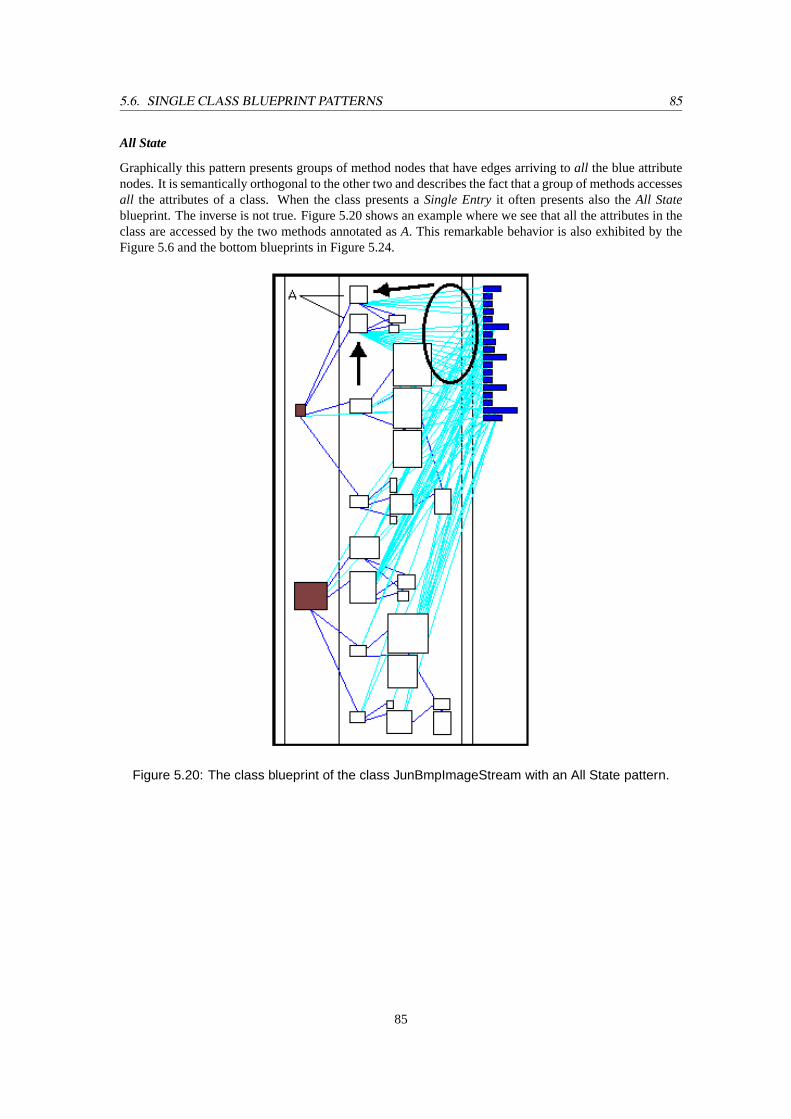
5.6. SINGLE CLASS BLUEPRINT PATTERNS 85
All State
Graphically this pattern presents groups of method nodes that have edges arriving toall the blue attributenodes. It is semantically orthogonal to the other two and describes the fact that a group of methods accessesall the attributes of a class. When the class presents aSingle Entryit often presents also theAll Stateblueprint. The inverse is not true. Figure 5.20 shows an example where we see that all the attributes in theclass are accessed by the two methods annotated asA. This remarkable behavior is also exhibited by theFigure 5.6 and the bottom blueprints in Figure 5.24.
Figure 5.20: The class blueprint of the class JunBmpImageStream with an All State pattern.
85
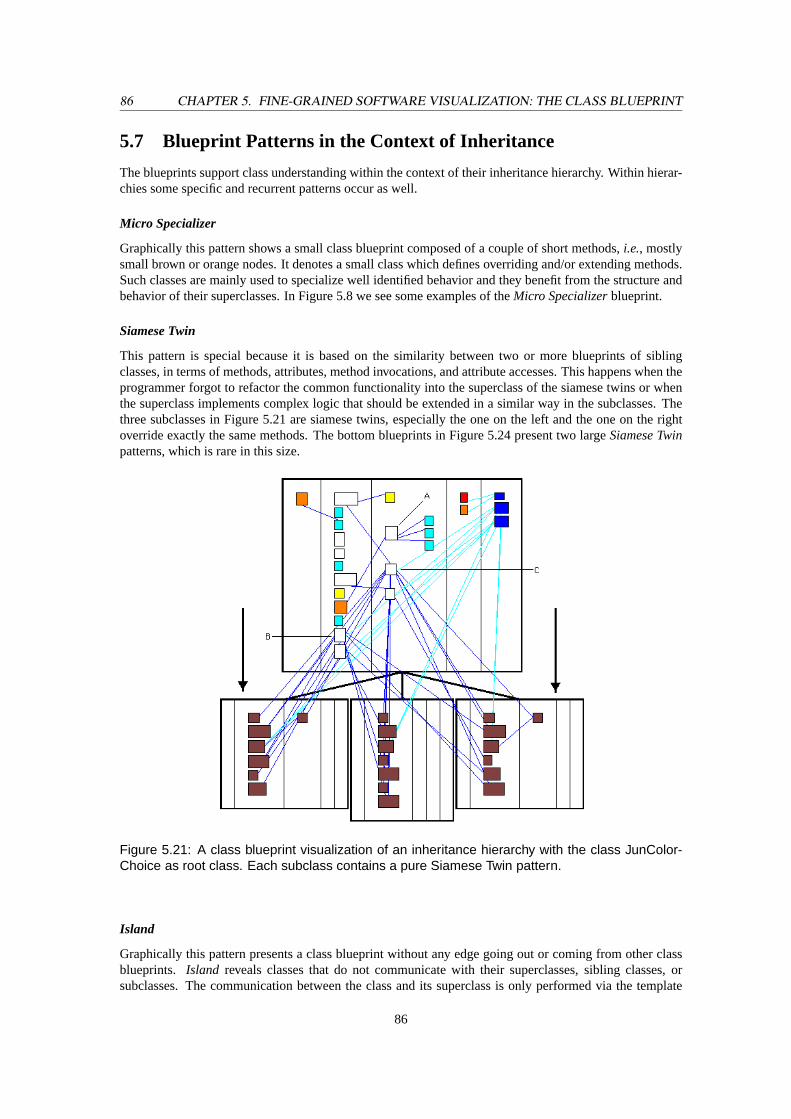
86 CHAPTER 5. FINE-GRAINED SOFTWARE VISUALIZATION: THE CLASS BLUEPRINT
5.7 Blueprint Patterns in the Context of Inheritance
The blueprints support class understanding within the context of their inheritance hierarchy. Within hierar-chies some specific and recurrent patterns occur as well.
Micro Specializer
Graphically this pattern shows a small class blueprint composed of a couple of short methods,i.e., mostlysmall brown or orange nodes. It denotes a small class which defines overriding and/or extending methods.Such classes are mainly used to specialize well identified behavior and they benefit from the structure andbehavior of their superclasses. In Figure 5.8 we see some examples of theMicro Specializerblueprint.
Siamese Twin
This pattern is special because it is based on the similarity between two or more blueprints of siblingclasses, in terms of methods, attributes, method invocations, and attribute accesses. This happens when theprogrammer forgot to refactor the common functionality into the superclass of the siamese twins or whenthe superclass implements complex logic that should be extended in a similar way in the subclasses. Thethree subclasses in Figure 5.21 are siamese twins, especially the one on the left and the one on the rightoverride exactly the same methods. The bottom blueprints in Figure 5.24 present two largeSiamese Twinpatterns, which is rare in this size.
Figure 5.21: A class blueprint visualization of an inheritance hierarchy with the class JunColor-Choice as root class. Each subclass contains a pure Siamese Twin pattern.
Island
Graphically this pattern presents a class blueprint without any edge going out or coming from other classblueprints. Island reveals classes that do not communicate with their superclasses, sibling classes, orsubclasses. The communication between the class and its superclass is only performed via the template
86
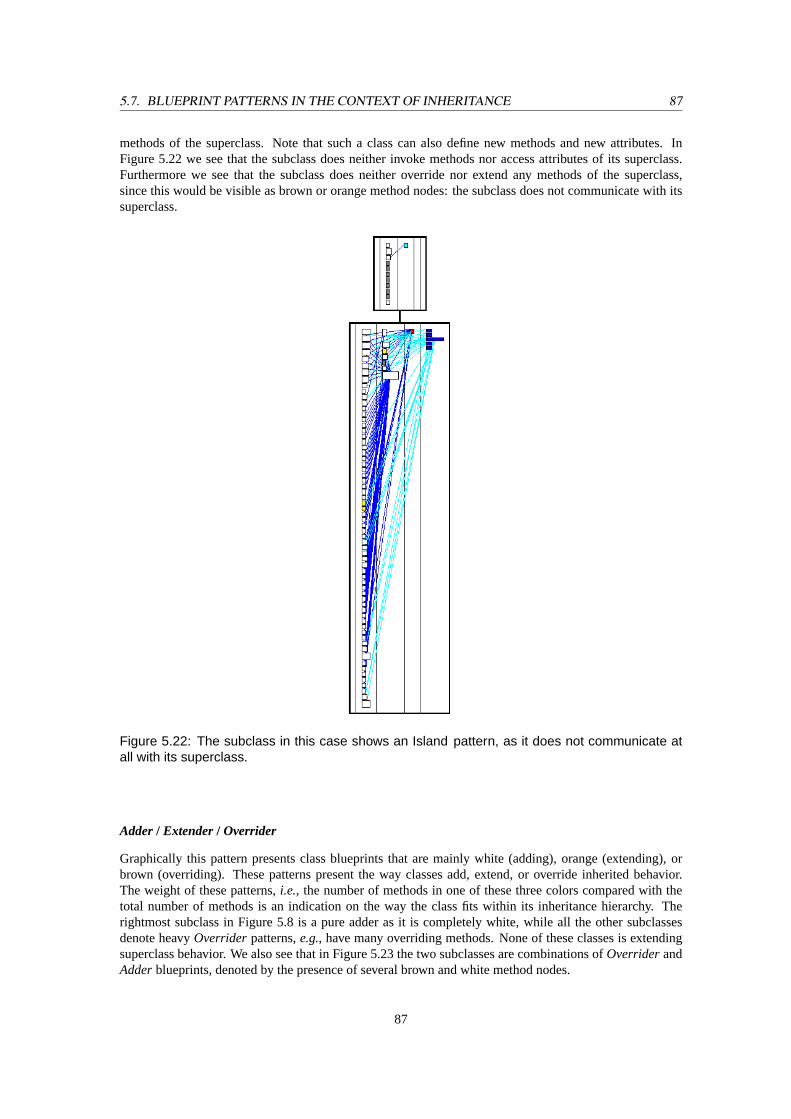
5.7. BLUEPRINT PATTERNS IN THE CONTEXT OF INHERITANCE 87
methods of the superclass. Note that such a class can also define new methods and new attributes. InFigure 5.22 we see that the subclass does neither invoke methods nor access attributes of its superclass.Furthermore we see that the subclass does neither override nor extend any methods of the superclass,since this would be visible as brown or orange method nodes: the subclass does not communicate with itssuperclass.
Figure 5.22: The subclass in this case shows an Island pattern, as it does not communicate atall with its superclass.
Adder/ Extender/ Overrider
Graphically this pattern presents class blueprints that are mainly white (adding), orange (extending), orbrown (overriding). These patterns present the way classes add, extend, or override inherited behavior.The weight of these patterns,i.e., the number of methods in one of these three colors compared with thetotal number of methods is an indication on the way the class fits within its inheritance hierarchy. Therightmost subclass in Figure 5.8 is a pure adder as it is completely white, while all the other subclassesdenote heavyOverriderpatterns,e.g., have many overriding methods. None of these classes is extendingsuperclass behavior. We also see that in Figure 5.23 the two subclasses are combinations ofOverriderandAdderblueprints, denoted by the presence of several brown and white method nodes.
87
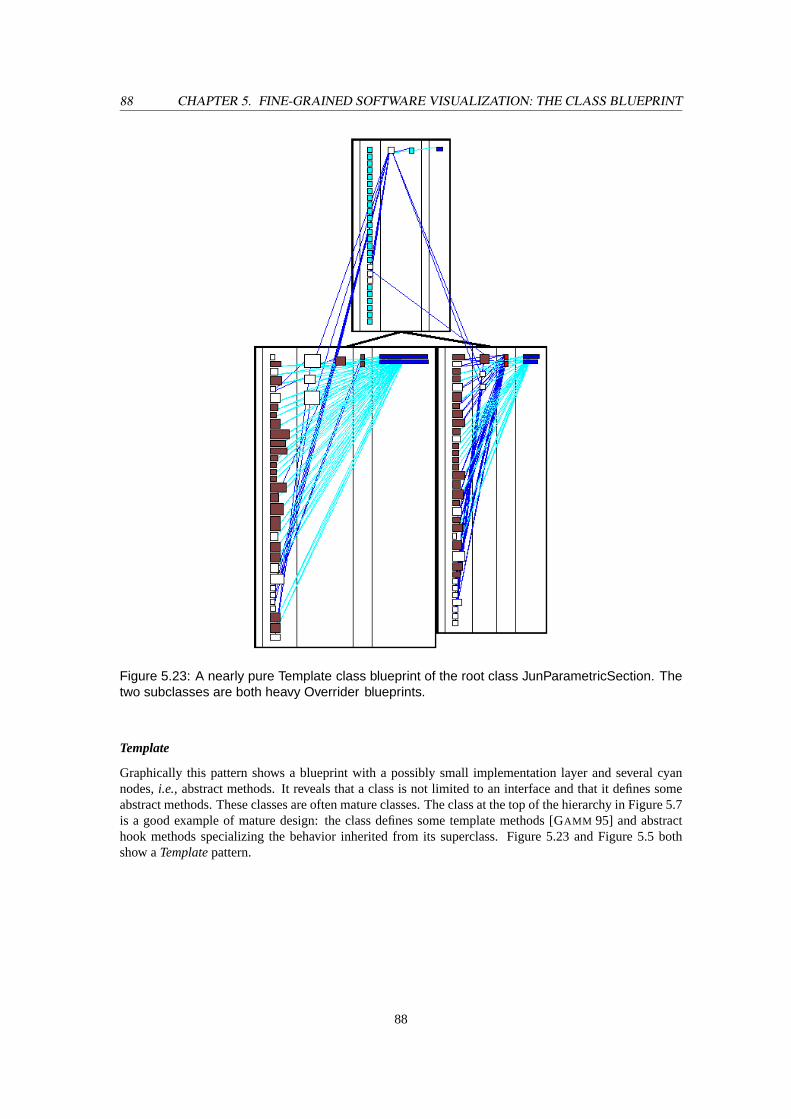
88 CHAPTER 5. FINE-GRAINED SOFTWARE VISUALIZATION: THE CLASS BLUEPRINT
Figure 5.23: A nearly pure Template class blueprint of the root class JunParametricSection. Thetwo subclasses are both heavy Overrider blueprints.
Template
Graphically this pattern shows a blueprint with a possibly small implementation layer and several cyannodes,i.e., abstract methods. It reveals that a class is not limited to an interface and that it defines someabstract methods. These classes are often mature classes. The class at the top of the hierarchy in Figure 5.7is a good example of mature design: the class defines some template methods [GAMM 95] and abstracthook methods specializing the behavior inherited from its superclass. Figure 5.23 and Figure 5.5 bothshow aTemplatepattern.
88
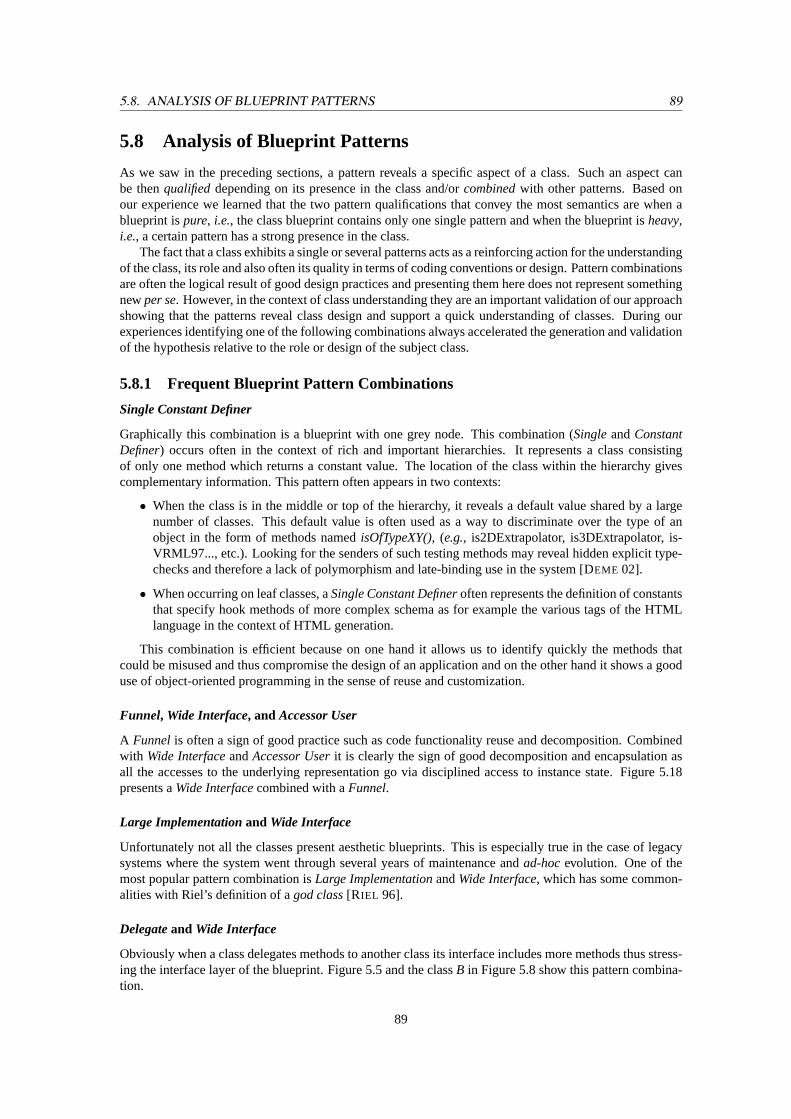
5.8. ANALYSIS OF BLUEPRINT PATTERNS 89
5.8 Analysis of Blueprint Patterns
As we saw in the preceding sections, a pattern reveals a specific aspect of a class. Such an aspect canbe thenqualifieddepending on its presence in the class and/orcombinedwith other patterns. Based onour experience we learned that the two pattern qualifications that convey the most semantics are when ablueprint ispure, i.e., the class blueprint contains only one single pattern and when the blueprint isheavy,i.e., a certain pattern has a strong presence in the class.
The fact that a class exhibits a single or several patterns acts as a reinforcing action for the understandingof the class, its role and also often its quality in terms of coding conventions or design. Pattern combinationsare often the logical result of good design practices and presenting them here does not represent somethingnewper se. However, in the context of class understanding they are an important validation of our approachshowing that the patterns reveal class design and support a quick understanding of classes. During ourexperiences identifying one of the following combinations always accelerated the generation and validationof the hypothesis relative to the role or design of the subject class.
5.8.1 Frequent Blueprint Pattern Combinations
Single Constant Definer
Graphically this combination is a blueprint with one grey node. This combination (SingleandConstantDefiner) occurs often in the context of rich and important hierarchies. It represents a class consistingof only one method which returns a constant value. The location of the class within the hierarchy givescomplementary information. This pattern often appears in two contexts:
• When the class is in the middle or top of the hierarchy, it reveals a default value shared by a largenumber of classes. This default value is often used as a way to discriminate over the type of anobject in the form of methods namedisOfTypeXY(), (e.g., is2DExtrapolator, is3DExtrapolator, is-VRML97..., etc.). Looking for the senders of such testing methods may reveal hidden explicit type-checks and therefore a lack of polymorphism and late-binding use in the system [DEME 02].
• When occurring on leaf classes, aSingle Constant Defineroften represents the definition of constantsthat specify hook methods of more complex schema as for example the various tags of the HTMLlanguage in the context of HTML generation.
This combination is efficient because on one hand it allows us to identify quickly the methods thatcould be misused and thus compromise the design of an application and on the other hand it shows a gooduse of object-oriented programming in the sense of reuse and customization.
Funnel, Wide Interface, and Accessor User
A Funnelis often a sign of good practice such as code functionality reuse and decomposition. Combinedwith Wide InterfaceandAccessor Userit is clearly the sign of good decomposition and encapsulation asall the accesses to the underlying representation go via disciplined access to instance state. Figure 5.18presents aWide Interfacecombined with aFunnel.
Large Implementationand Wide Interface
Unfortunately not all the classes present aesthetic blueprints. This is especially true in the case of legacysystems where the system went through several years of maintenance andad-hocevolution. One of themost popular pattern combination isLarge ImplementationandWide Interface, which has some common-alities with Riel’s definition of agod class[RIEL 96].
Delegateand Wide Interface
Obviously when a class delegates methods to another class its interface includes more methods thus stress-ing the interface layer of the blueprint. Figure 5.5 and the classB in Figure 5.8 show this pattern combina-tion.
89
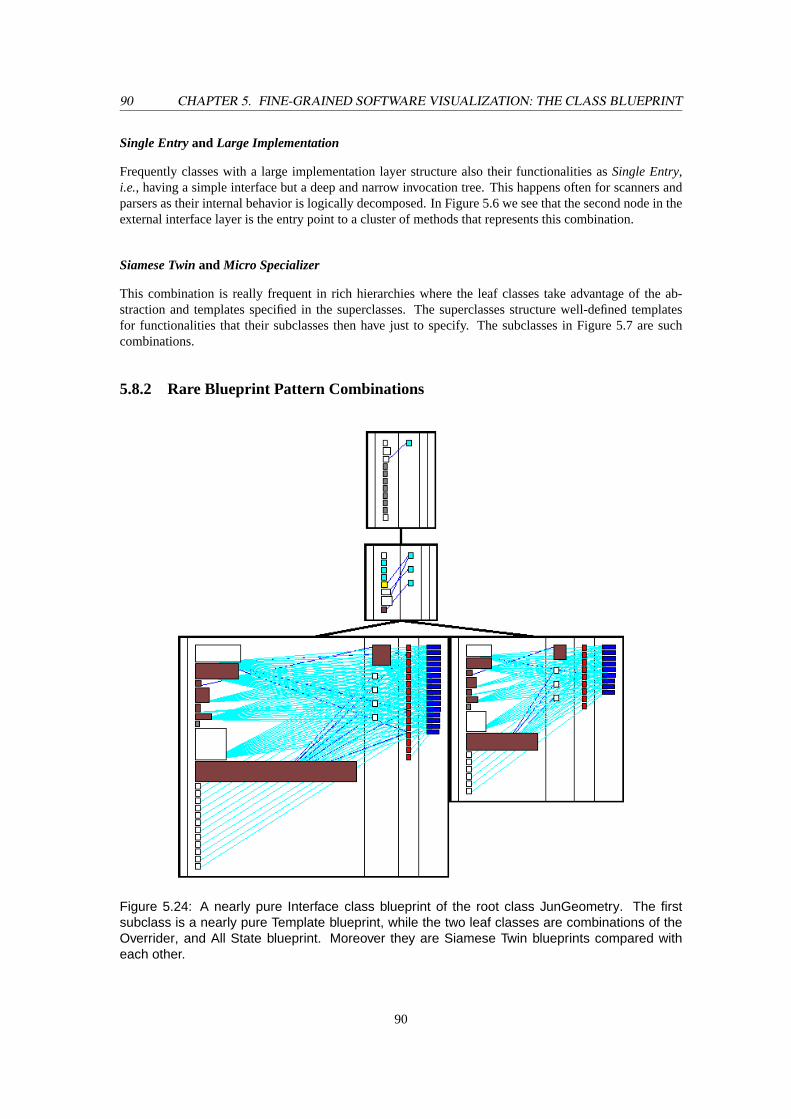
90 CHAPTER 5. FINE-GRAINED SOFTWARE VISUALIZATION: THE CLASS BLUEPRINT
Single Entryand Large Implementation
Frequently classes with a large implementation layer structure also their functionalities asSingle Entry,i.e., having a simple interface but a deep and narrow invocation tree. This happens often for scanners andparsers as their internal behavior is logically decomposed. In Figure 5.6 we see that the second node in theexternal interface layer is the entry point to a cluster of methods that represents this combination.
Siamese Twinand Micro Specializer
This combination is really frequent in rich hierarchies where the leaf classes take advantage of the ab-straction and templates specified in the superclasses. The superclasses structure well-defined templatesfor functionalities that their subclasses then have just to specify. The subclasses in Figure 5.7 are suchcombinations.
5.8.2 Rare Blueprint Pattern Combinations
Figure 5.24: A nearly pure Interface class blueprint of the root class JunGeometry. The firstsubclass is a nearly pure Template blueprint, while the two leaf classes are combinations of theOverrider, and All State blueprint. Moreover they are Siamese Twin blueprints compared witheach other.
90
5.9. TOOL SUPPORT: CODECRAWLER AND MOOSE 91
Pure Interface
Graphically this pattern presents a blueprint having only methods in the interface layer. The root class inFigure 5.24 is a nearly pureInterfaceblueprint (with only one method in the implementation layer). Thispattern may occur in the following cases:
• As a leaf class with overriding methods a pureInterfacecan be an incarnation of the NullObjectdesign pattern which only defines default behavior that is most of the time absorbing messages orreturning default values [WOOL 98].
• As a class near the top of an inheritance hierarchy, a pureInterfacereveals a class only implementingmethod signatures. In such a situation the pureInterfacenormally defines abstract methods. A pureInterfacewithout abstract methods is definitively a place to look further to see why none of themethods is abstract.
Pure Interfaceand Constant Definer
This combination represents a class whose methods are only returning constants. When a pureInterfaceisalso aConstant Definer, it reveals that the class mainly represents a common set of values. In Smalltalkmetaclasses exhibit this combination as there is no explicit constant definition via CONST-like constructs.The root class in Figure 5.24 is a good example of this combination.
Pure Overrider
As we mentioned earlier, anOverrider is often combined with aMicro or a Siamese Twinpattern. Pureoverriders are rare because this implies that the superclass achieves a good level of design and that thedomain allows one to structure subclasses by only defining a given set of methods. They reveal that theabstraction defined in the superclasses has been designed cautiously and can be reused by just redefining aprecise set of methods. They are a good sign regarding the quality of the hierarchy. By looking manuallyat the overridden methods and checking whether all the sibling classes override consistently these methodsallows one to focus on the class variation points and understand the key behavior of the classes. Each ofthe three subclasses shown in Figure 5.7 is a pureOverrider.
Extenderand Overrider
From our experience, patterns present less signs related to the extension of a functionality than its redefini-tion except for instance initialization phases. Our hypothesis is that extension is a more complex act than alocal redefinition. The combination of these two is then rare and often points to a mature design.
5.9 Tool Support: CodeCrawler and Moose
To obtain the class blueprint visualizations we use CodeCrawler as visualization tool and Moose as meta-model and provider of the metrics and semantic information (see Appendix A). Our tool CodeCrawlersupports the synergy between opportunist reading of the code and the visualization of classes in the fol-lowing ways:
• Interactivity. The blueprint visualizations do not merely represent source code, as in the case ofstatic visualizations (e.g., static pictures which cannot be manipulated), but they support directionmanipulation. When the proposed layout does not suit the reengineer wishes, he can select, move, ordelete connected, recursively connected, or not connected nodes.
• Code Proximity. At any moment the reengineer can access the code by clicking on any node andsee the corresponding definition at the level of a method, at the level of the class, and using codebrowsers presenting superclasses and subclasses. Moreover he has the possibility to see permanentlya floating window showing the code of the node over which the mouse pointer is passing.
91
92 CHAPTER 5. FINE-GRAINED SOFTWARE VISUALIZATION: THE CLASS BLUEPRINT
5.10 Related Work
Among the various approaches to support reverse engineering that have been proposed in the literature,graphical representations of software have long been accepted as comprehension aids [PRIC 93] [Sta 98].
Many tools make use of static information to visualize software, like Rigi [TILL 94], Hy+ [CONS 93][M END 95], SeeSoft [EICK 92], Dali [KAZM 99], ShrimpViews [STOR 95], TANGO [STAS 90], as wellas commercial tools like Imagix3 to name but a few of the more prominent examples. However, mostpublications and tools that address the problem of large-scale static software visualization treat classesas the smallest unit in their visualizations. There are some tools, for instance the FIELD programmingenvironment [REIS 90] or Hy+ [CONS 93] [MEND 95] which have visualized the internals of classes, butusually they limited themselves to showing method names, attributes, etc. and use simple graphs withoutadded semantical information.
Substantial research has also been conducted on runtime information visualization. Various tools andapproaches make use of dynamic (trace-based) information such as Program Explorer [LANG 95], Jinsightand its ancestors [PAUW 93] [PAUW 99], Graphtrace [KLEY 88] or [RICH 99]. Various approaches havebeen discussed like in [JERD 97] where interactions in program executions are being visualized, to namebut a few.
Nassi and Shneiderman proposed flowcharts to represent in a more dense manner the code of pro-cedures [NASS 73]. Warnier/Orr-diagrams allow us to describe the organization of data and procedures[H IGG 87]. Both approaches only deal with procedural code and control-flow. Crosset al. defined and val-idated the effectiveness of Control Structure Diagrams (CSD) [CROS98] [HEND 02], which is a graphicalrepresentation that depicts the control-structure and module-level organization of a program. Even if CSDhas been adapted from Ada to Java, it still does not take into account the fact that a class exists within anhierarchy and in presence of late-binding.
We provide a visualization of the internal structure of classes in terms of their implementations and inthe context of their inheritance relationships with other classes. In this sense our approach proposes a newdimension in the understanding of object-oriented systems.
5.11 Conclusion
As in object-oriented programming, classes are the primary abstractions based on which applications arebuilt, we focus on supporting the reengineer to understand the internal structure of classes and how classbehavior is developed in the context of the inheritance hierarchy in which it is defined. Our approach isbased on the synergy between the class blueprint visualization and opportunist code reading [LITT 96] asthe visualization helps building hypothesis, raising questions that a selective code reading verifies. As suchit supports an understanding at multiple levels of abstractions [VON 96].
5.11.1 Summary
In this chapter we have presented theclass blueprint, a polymetric view targeted at the understandingof classes and class hierarchies. The class blueprint visualizes the internal structure of classes,e.g., anaugmented call-graph enriched with metrics and semantic information. The class blueprint permits toidentify patterns that help to understand the structure of classes. We have identified and described severalof these patterns. Furthermore we have used the class blueprints on a case study and have discussed andverified our findings.
5.11.2 Benefits
The main benefits of our approach are the following:
3see http://www.imagix.com
92
5.11. CONCLUSION 93
• Reduction of complexity.Using a visualization namedclass blueprintwe can make assumptionsabout a class without having to read the whole source code. This “taste” of the class, which con-veys the purpose of a class, appears in two contexts: the class in isolation and the class within itsinheritance hierarchy.
• Identification of key methods.The class blueprint by condensing the class stresses, some of itsaspects. Based on the resulting signs shown by the blueprint, the reengineer builds hypotheses andgains insights on the structure and internal implementation of a class. The blueprint helps toselectthe relevantmethods whose reading validates or invalidates the hypotheses of the reengineer.
• A common vocabulary.The recurrent patterns created by the blueprints define a common vocabularyfor the class. This vocabulary supports the communication between reengineers during a reverseengineering process, in a similar manner to design patterns that constitute a vocabulary for designsolutions.
• Programming style detection.After the display of several blueprints, the observer starts to identifycommon patterns in different blueprints. These patterns reflect the programming style of the de-veloper,i.e., in some case studies we are able to recognize which developer wrote the blueprintedclasses.
5.11.3 Limits
Our approach is limited in the following ways:
• Layout Algorithm. The approach presented here relies heavily on an efficient layout algorithm interms of space and readability. Especially in the case of very large classes,i.e., having hundreds ofmethods, it may happen that the only real statement we can make is that the class is large (theGiantblueprint). However, patterns often occur in such classes providing important pieces of information.
• Functionality. The blueprint of a class can give the viewer a “taste” of the class at one glance.However, it does not show the actual functionality the class provides. The approach proposed hereis thus complementary to other approaches used to understand classes.
• Collaboration.We do not address collaboration aspects between classes for the time being.
• Static Analysis.The approach presented here does not make use of dynamic information. This meanswe are ignoring runtime information about which methods get actually invoked in a class. This isespecially relevant in the context of polymorphism and switches within the code. In this sense theclass blueprint can be seen as a visualization of every possible combination of method invocationsand attribute accesses.
5.11.4 Future work
In the future we plan to investigate the following ideas:
• Collaboration.Apply the class blueprint view on classes which are not within the same inheritancehierarchy, but which collaborate with each other. However this can be complex because of thepresence of late-binding and the possible high number of method invocations between classes.
• Cognitive Science.The visualization algorithm presented here and the methodology coming with itare bothad hoc, and build empirically on several years of experimentation. It shows little connectionwith research from the field of cognitive science. We would like to understand more deeply how ourapproach fits into more general approaches such as the one proposed by Ware [WARE 00], Bertin[BERT 74], and Tufte [TUFT 90] [TUFT 01].
93
94 CHAPTER 5. FINE-GRAINED SOFTWARE VISUALIZATION: THE CLASS BLUEPRINT
• Qualitative Empirical Analysis.We would like to have an empirical usability analysis and qual-itative validation of our approach by letting reverse engineers use our system and to collect theirexperiences. A second possibility we want to explore is to do a controlled experiment on the reverseengineering “efficiency” of two groups of users.
• Quantitative Empirical Analysis.We have already made a first quantitative validation of the classblueprints [LANZ 01a], where for two different case studies we have listed the number of differentblueprints we have found. Since in the meantime our vocabulary has changed, we want to make suchan experiment again with our refined categorization of blueprints. What we have already seen in thementioned case study is that the frequency of certain blueprints heavily depends on the case studyand the coding conventions that have been used.
• Languages.The proposed approach has been developed to be applicable to any class-based object-oriented language. We already visualized C++ and Java classes as blueprints. A first observationwas that the language or the mapping between the language to the blueprint layers still influencesthe blueprint. We plan to identify the variation points by applying the visualizations to a number ofother object-oriented languages.
• Pattern Recognition.The use of techniques from the field of image processing and pattern recog-nition could eventually be used to automatically recognize the blueprint patterns. We are currentlyinvestigating the possibility of a cooperation with a research group working in artificial intelligence.
94
Chapter 6
Evolutionary Software Visualization:The Evolution Matrix
6.1 Introduction
Coping with huge amounts of data is one of the major problems of software evolution research, as severalversions of the same software must be analyzed in parallel. A technique which can be used to reduce thiscomplexity issoftware visualization, as a good visual display allows the human brain to study multipleaspects of complex problems. Another useful approach when dealing with large amounts of data aresoft-ware metrics. Metrics can help to assess the complexity of software and to discover software artifacts withunusual measurements.
Summary. In this chapter we present a polymetric view calledevolution matrix[L ANZ 01b] 1 thatallows for an understanding of the evolution of classes within object-oriented software systems and theevolution of the systems themselves. Moreover the evolution matrix acts as a revealer of certain specificsituations that occur during system evolution such as pulsating classes that grow and shrink during the life-time of the system. We define a simple vocabulary to describe such specific behaviors. The intention is tobuild a vocabulary for software evolution. Note that even if the results we present are obtained on softwaresystems written in Smalltalk, the approach presented here does not depend on a particular programminglanguage, as our underlying metamodel is language-independent [DUCA 00, DEME 01]. With the evolutionmatrix view we want to achieve the following evolutionary reverse engineering goals:
1. Understand the evolution of object-oriented software systems in terms of size and growth rate.
2. Understand at which point in time classes have been introduced into a system and at which momentthey have been removed.
3. See if there are patterns in the evolution of classes. Such patterns help to understand the conditionof a class in a time perspective,e.g., how resistant to software evolution processes is a class, is itchanged with every release of a system, or are there classes which are virtually immune to softwareevolution?
Contributions. The contributions of this chapter are the following:
• The definition of theevolution matrix, a polymetric view which visualizes the evolution of the classesof a software system, and provides an understanding of the evolution of classes and of a wholesystem. The evolution matrix lets the viewer identifyevolutionary patternswhich help to understand(1) the evolution of the whole system, and (2) the evolution of single classes,
1This chapter is an extended version of the articleUnderstanding Software Evolution using a Combination of Software Visual-ization and Software Metrics, published in the LMO 2002 Proceedings (Languages et Modelesa Objets), pp. 135 - 149, HermesPublications, 2002.
95
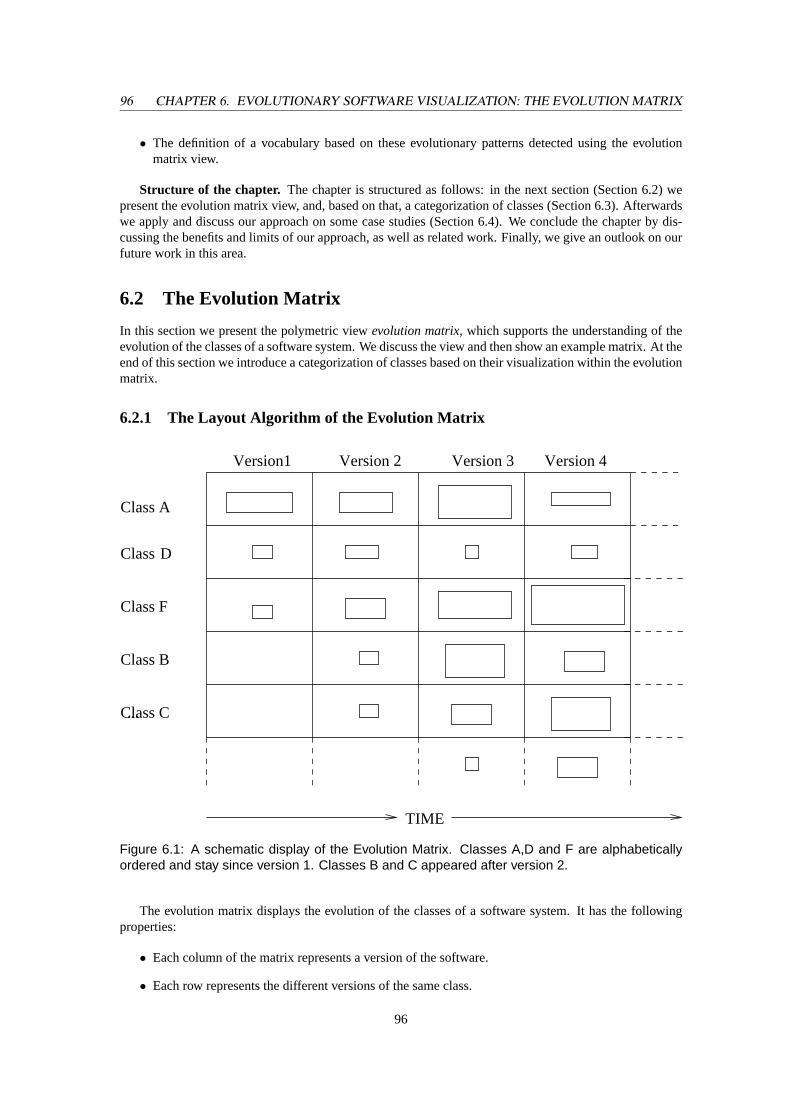
96 CHAPTER 6. EVOLUTIONARY SOFTWARE VISUALIZATION: THE EVOLUTION MATRIX
• The definition of a vocabulary based on these evolutionary patterns detected using the evolutionmatrix view.
Structure of the chapter. The chapter is structured as follows: in the next section (Section 6.2) wepresent the evolution matrix view, and, based on that, a categorization of classes (Section 6.3). Afterwardswe apply and discuss our approach on some case studies (Section 6.4). We conclude the chapter by dis-cussing the benefits and limits of our approach, as well as related work. Finally, we give an outlook on ourfuture work in this area.
6.2 The Evolution Matrix
In this section we present the polymetric viewevolution matrix, which supports the understanding of theevolution of the classes of a software system. We discuss the view and then show an example matrix. At theend of this section we introduce a categorization of classes based on their visualization within the evolutionmatrix.
6.2.1 The Layout Algorithm of the Evolution Matrix
Version1 Version 2 Version 3 Version 4
...
TIME
Class
Class A
Class B
D
Class F
Class C
Figure 6.1: A schematic display of the Evolution Matrix. Classes A,D and F are alphabeticallyordered and stay since version 1. Classes B and C appeared after version 2.
The evolution matrix displays the evolution of the classes of a software system. It has the followingproperties:
• Each column of the matrix represents a version of the software.
• Each row represents the different versions of the same class.
96
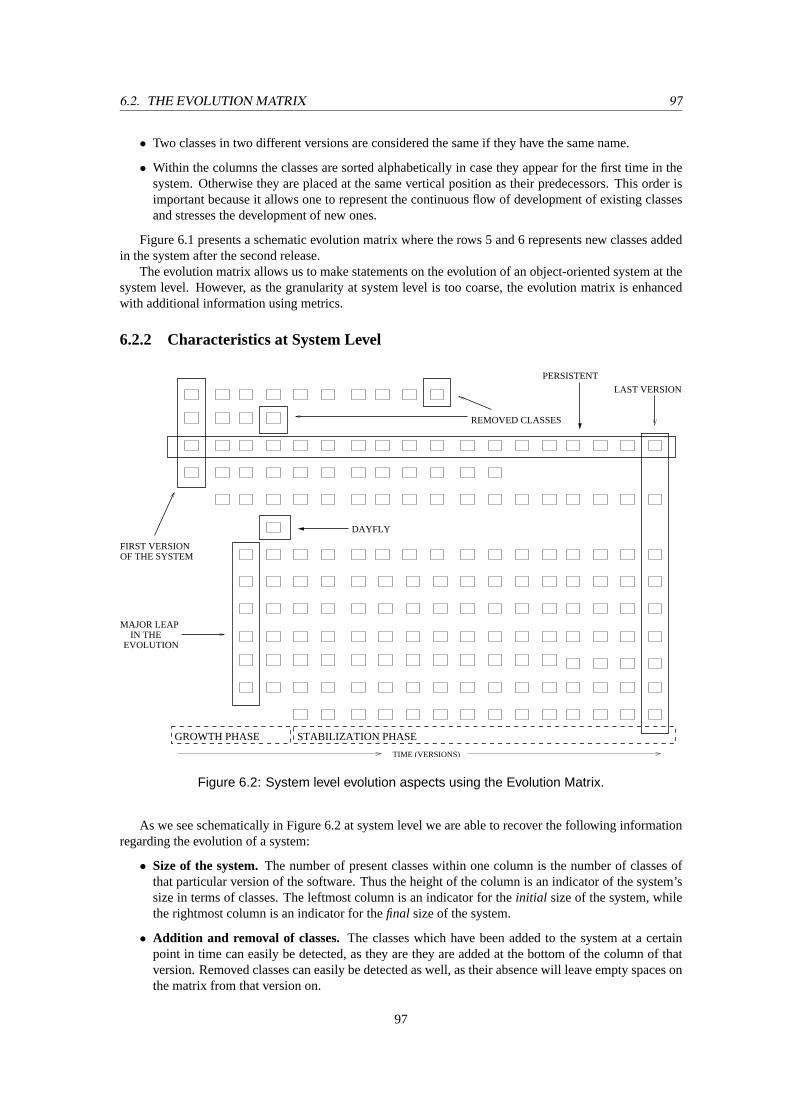
6.2. THE EVOLUTION MATRIX 97
• Two classes in two different versions are considered the same if they have the same name.
• Within the columns the classes are sorted alphabetically in case they appear for the first time in thesystem. Otherwise they are placed at the same vertical position as their predecessors. This order isimportant because it allows one to represent the continuous flow of development of existing classesand stresses the development of new ones.
Figure 6.1 presents a schematic evolution matrix where the rows 5 and 6 represents new classes addedin the system after the second release.
The evolution matrix allows us to make statements on the evolution of an object-oriented system at thesystem level. However, as the granularity at system level is too coarse, the evolution matrix is enhancedwith additional information using metrics.
6.2.2 Characteristics at System Level
FIRST VERSIONOF THE SYSTEM
REMOVED CLASSES
LAST VERSION
MAJOR LEAPIN THE
EVOLUTION
TIME (VERSIONS)
GROWTH PHASE STABILIZATION PHASE
DAYFLY
PERSISTENT
Figure 6.2: System level evolution aspects using the Evolution Matrix.
As we see schematically in Figure 6.2 at system level we are able to recover the following informationregarding the evolution of a system:
• Size of the system.The number of present classes within one column is the number of classes ofthat particular version of the software. Thus the height of the column is an indicator of the system’ssize in terms of classes. The leftmost column is an indicator for theinitial size of the system, whilethe rightmost column is an indicator for thefinal size of the system.
• Addition and removal of classes.The classes which have been added to the system at a certainpoint in time can easily be detected, as they are they are added at the bottom of the column of thatversion. Removed classes can easily be detected as well, as their absence will leave empty spaces onthe matrix from that version on.
97
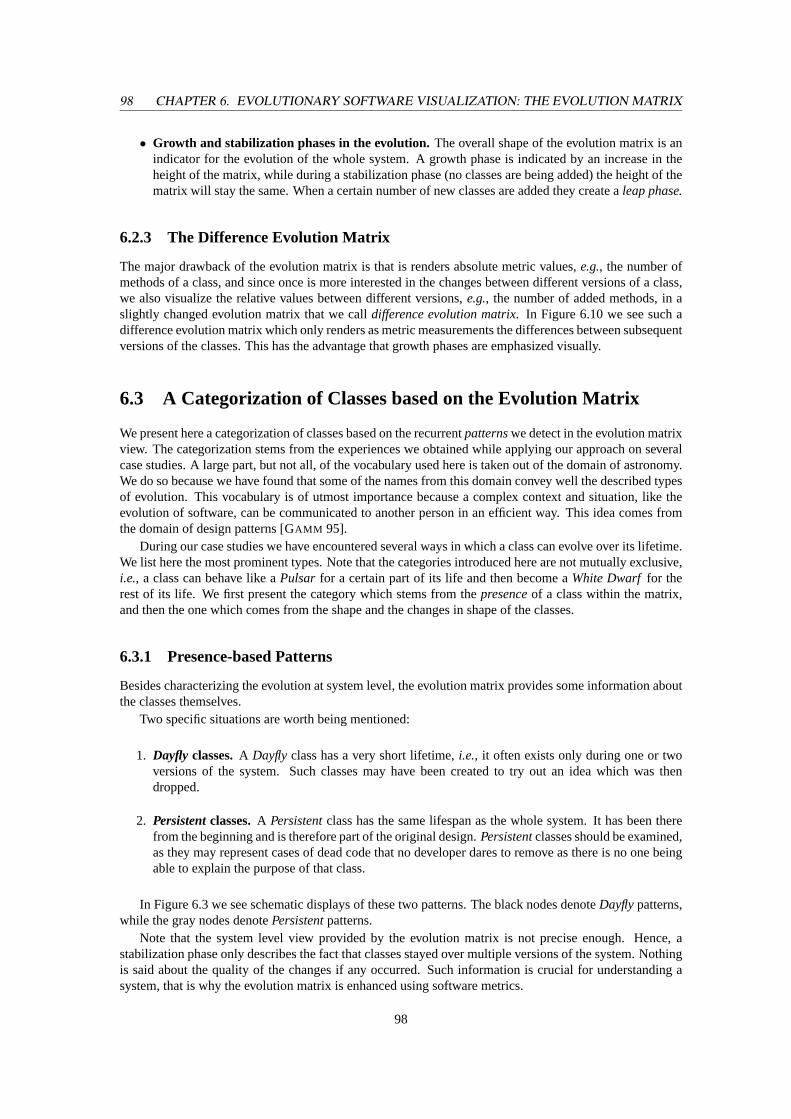
98 CHAPTER 6. EVOLUTIONARY SOFTWARE VISUALIZATION: THE EVOLUTION MATRIX
• Growth and stabilization phases in the evolution.The overall shape of the evolution matrix is anindicator for the evolution of the whole system. A growth phase is indicated by an increase in theheight of the matrix, while during a stabilization phase (no classes are being added) the height of thematrix will stay the same. When a certain number of new classes are added they create aleap phase.
6.2.3 The Difference Evolution Matrix
The major drawback of the evolution matrix is that is renders absolute metric values,e.g., the number ofmethods of a class, and since once is more interested in the changes between different versions of a class,we also visualize the relative values between different versions,e.g., the number of added methods, in aslightly changed evolution matrix that we calldifference evolution matrix. In Figure 6.10 we see such adifference evolution matrix which only renders as metric measurements the differences between subsequentversions of the classes. This has the advantage that growth phases are emphasized visually.
6.3 A Categorization of Classes based on the Evolution Matrix
We present here a categorization of classes based on the recurrentpatternswe detect in the evolution matrixview. The categorization stems from the experiences we obtained while applying our approach on severalcase studies. A large part, but not all, of the vocabulary used here is taken out of the domain of astronomy.We do so because we have found that some of the names from this domain convey well the described typesof evolution. This vocabulary is of utmost importance because a complex context and situation, like theevolution of software, can be communicated to another person in an efficient way. This idea comes fromthe domain of design patterns [GAMM 95].
During our case studies we have encountered several ways in which a class can evolve over its lifetime.We list here the most prominent types. Note that the categories introduced here are not mutually exclusive,i.e., a class can behave like aPulsar for a certain part of its life and then become aWhite Dwarf for therest of its life. We first present the category which stems from thepresenceof a class within the matrix,and then the one which comes from the shape and the changes in shape of the classes.
6.3.1 Presence-based Patterns
Besides characterizing the evolution at system level, the evolution matrix provides some information aboutthe classes themselves.
Two specific situations are worth being mentioned:
1. Dayfly classes.A Dayflyclass has a very short lifetime,i.e., it often exists only during one or twoversions of the system. Such classes may have been created to try out an idea which was thendropped.
2. Persistentclasses.A Persistentclass has the same lifespan as the whole system. It has been therefrom the beginning and is therefore part of the original design.Persistentclasses should be examined,as they may represent cases of dead code that no developer dares to remove as there is no one beingable to explain the purpose of that class.
In Figure 6.3 we see schematic displays of these two patterns. The black nodes denoteDayflypatterns,while the gray nodes denotePersistentpatterns.
Note that the system level view provided by the evolution matrix is not precise enough. Hence, astabilization phase only describes the fact that classes stayed over multiple versions of the system. Nothingis said about the quality of the changes if any occurred. Such information is crucial for understanding asystem, that is why the evolution matrix is enhanced using software metrics.
98
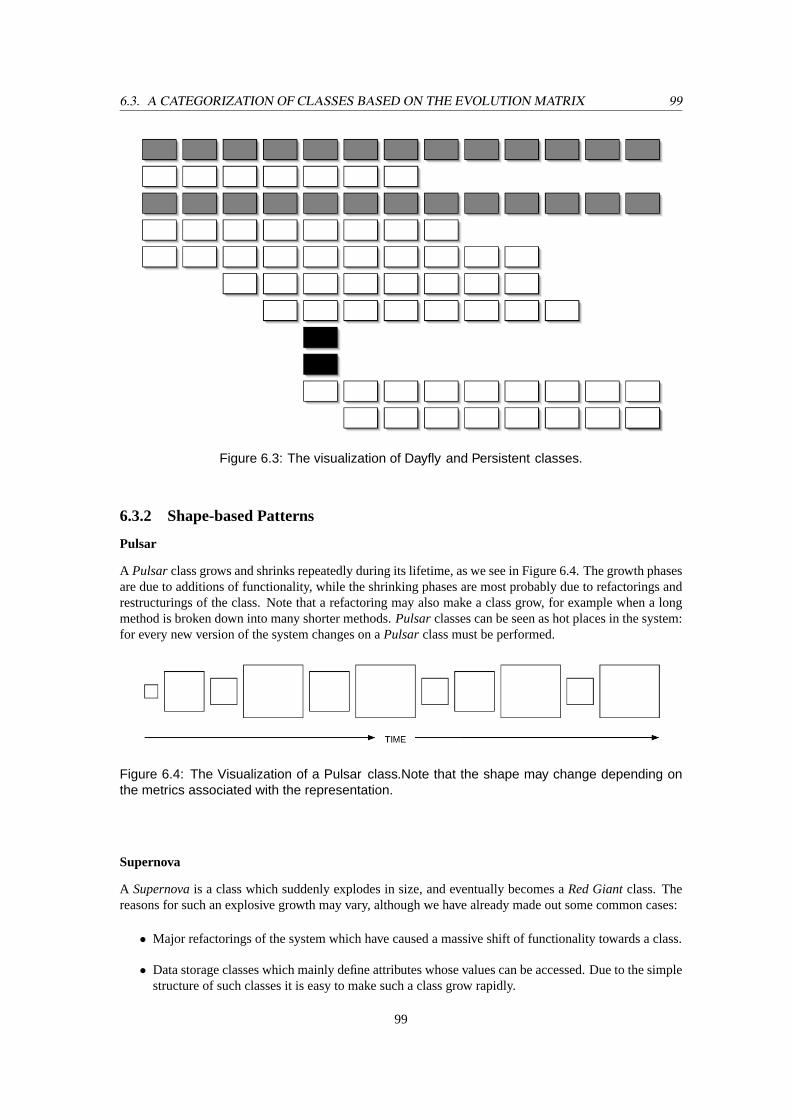
6.3. A CATEGORIZATION OF CLASSES BASED ON THE EVOLUTION MATRIX 99
Figure 6.3: The visualization of Dayfly and Persistent classes.
6.3.2 Shape-based Patterns
Pulsar
A Pulsarclass grows and shrinks repeatedly during its lifetime, as we see in Figure 6.4. The growth phasesare due to additions of functionality, while the shrinking phases are most probably due to refactorings andrestructurings of the class. Note that a refactoring may also make a class grow, for example when a longmethod is broken down into many shorter methods.Pulsarclasses can be seen as hot places in the system:for every new version of the system changes on aPulsarclass must be performed.
Figure 6.4: The Visualization of a Pulsar class.Note that the shape may change depending onthe metrics associated with the representation.
Supernova
A Supernovais a class which suddenly explodes in size, and eventually becomes aRed Giantclass. Thereasons for such an explosive growth may vary, although we have already made out some common cases:
• Major refactorings of the system which have caused a massive shift of functionality towards a class.
• Data storage classes which mainly define attributes whose values can be accessed. Due to the simplestructure of such classes it is easy to make such a class grow rapidly.
99
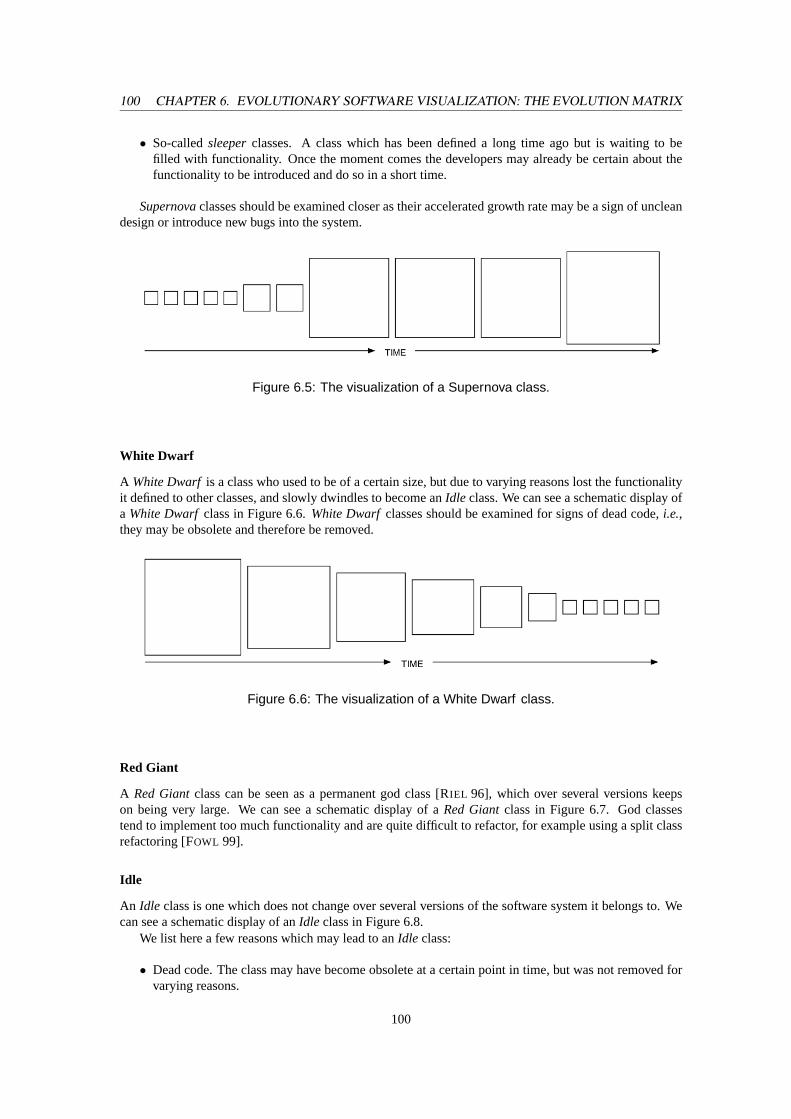
100 CHAPTER 6. EVOLUTIONARY SOFTWARE VISUALIZATION: THE EVOLUTION MATRIX
• So-calledsleeperclasses. A class which has been defined a long time ago but is waiting to befilled with functionality. Once the moment comes the developers may already be certain about thefunctionality to be introduced and do so in a short time.
Supernovaclasses should be examined closer as their accelerated growth rate may be a sign of uncleandesign or introduce new bugs into the system.
Figure 6.5: The visualization of a Supernova class.
White Dwarf
A White Dwarf is a class who used to be of a certain size, but due to varying reasons lost the functionalityit defined to other classes, and slowly dwindles to become anIdle class. We can see a schematic display ofa White Dwarf class in Figure 6.6.White Dwarf classes should be examined for signs of dead code,i.e.,they may be obsolete and therefore be removed.
Figure 6.6: The visualization of a White Dwarf class.
Red Giant
A Red Giantclass can be seen as a permanent god class [RIEL 96], which over several versions keepson being very large. We can see a schematic display of aRed Giantclass in Figure 6.7. God classestend to implement too much functionality and are quite difficult to refactor, for example using a split classrefactoring [FOWL 99].
Idle
An Idle class is one which does not change over several versions of the software system it belongs to. Wecan see a schematic display of anIdle class in Figure 6.8.
We list here a few reasons which may lead to anIdle class:
• Dead code. The class may have become obsolete at a certain point in time, but was not removed forvarying reasons.
100
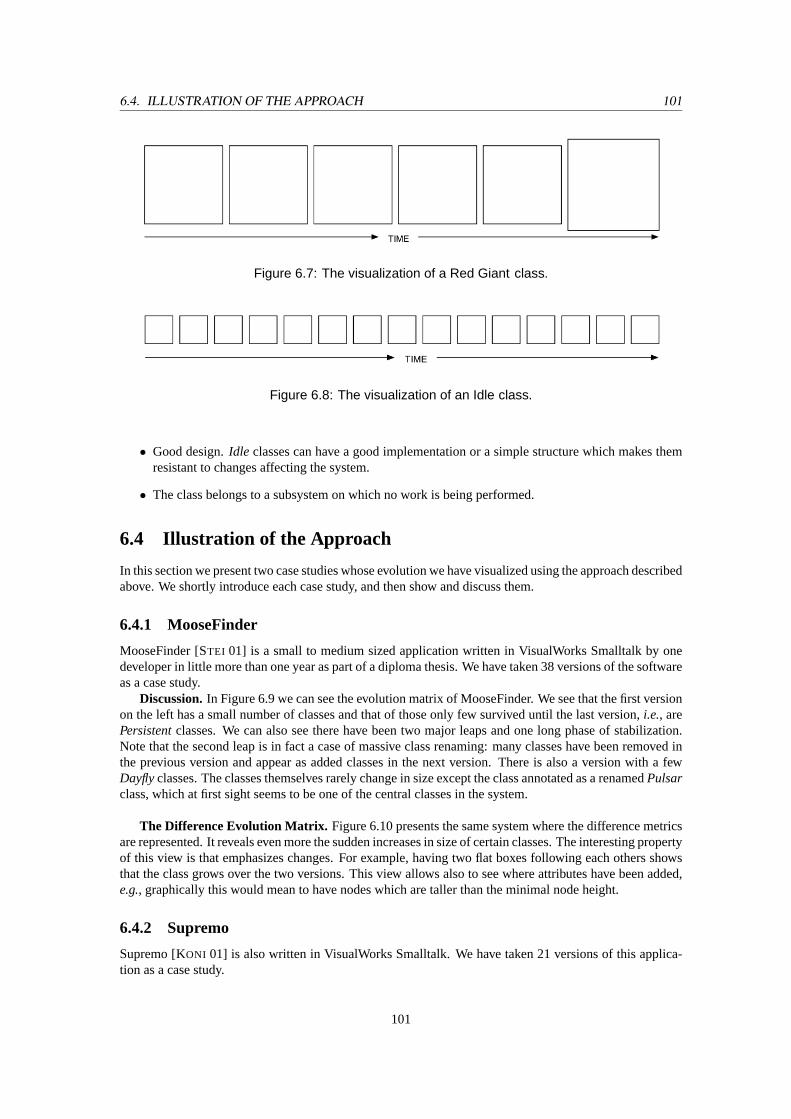
6.4. ILLUSTRATION OF THE APPROACH 101
Figure 6.7: The visualization of a Red Giant class.
Figure 6.8: The visualization of an Idle class.
• Good design.Idle classes can have a good implementation or a simple structure which makes themresistant to changes affecting the system.
• The class belongs to a subsystem on which no work is being performed.
6.4 Illustration of the Approach
In this section we present two case studies whose evolution we have visualized using the approach describedabove. We shortly introduce each case study, and then show and discuss them.
6.4.1 MooseFinder
MooseFinder [STEI 01] is a small to medium sized application written in VisualWorks Smalltalk by onedeveloper in little more than one year as part of a diploma thesis. We have taken 38 versions of the softwareas a case study.
Discussion.In Figure 6.9 we can see the evolution matrix of MooseFinder. We see that the first versionon the left has a small number of classes and that of those only few survived until the last version,i.e., arePersistentclasses. We can also see there have been two major leaps and one long phase of stabilization.Note that the second leap is in fact a case of massive class renaming: many classes have been removed inthe previous version and appear as added classes in the next version. There is also a version with a fewDayflyclasses. The classes themselves rarely change in size except the class annotated as a renamedPulsarclass, which at first sight seems to be one of the central classes in the system.
The Difference Evolution Matrix. Figure 6.10 presents the same system where the difference metricsare represented. It reveals even more the sudden increases in size of certain classes. The interesting propertyof this view is that emphasizes changes. For example, having two flat boxes following each others showsthat the class grows over the two versions. This view allows also to see where attributes have been added,e.g., graphically this would mean to have nodes which are taller than the minimal node height.
6.4.2 Supremo
Supremo [KONI 01] is also written in VisualWorks Smalltalk. We have taken 21 versions of this applica-tion as a case study.
101
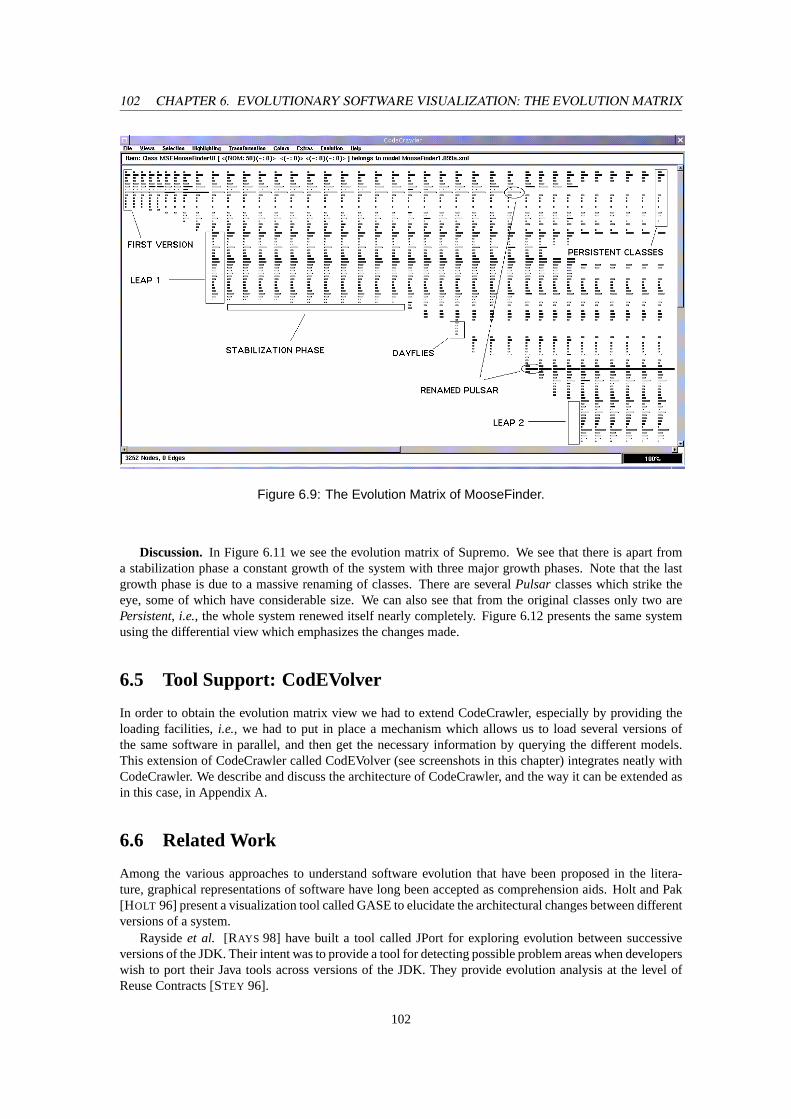
102 CHAPTER 6. EVOLUTIONARY SOFTWARE VISUALIZATION: THE EVOLUTION MATRIX
Figure 6.9: The Evolution Matrix of MooseFinder.
Discussion. In Figure 6.11 we see the evolution matrix of Supremo. We see that there is apart froma stabilization phase a constant growth of the system with three major growth phases. Note that the lastgrowth phase is due to a massive renaming of classes. There are severalPulsar classes which strike theeye, some of which have considerable size. We can also see that from the original classes only two arePersistent, i.e., the whole system renewed itself nearly completely. Figure 6.12 presents the same systemusing the differential view which emphasizes the changes made.
6.5 Tool Support: CodEVolver
In order to obtain the evolution matrix view we had to extend CodeCrawler, especially by providing theloading facilities,i.e., we had to put in place a mechanism which allows us to load several versions ofthe same software in parallel, and then get the necessary information by querying the different models.This extension of CodeCrawler called CodEVolver (see screenshots in this chapter) integrates neatly withCodeCrawler. We describe and discuss the architecture of CodeCrawler, and the way it can be extended asin this case, in Appendix A.
6.6 Related Work
Among the various approaches to understand software evolution that have been proposed in the litera-ture, graphical representations of software have long been accepted as comprehension aids. Holt and Pak[HOLT 96] present a visualization tool called GASE to elucidate the architectural changes between differentversions of a system.
Raysideet al. [RAYS 98] have built a tool called JPort for exploring evolution between successiveversions of the JDK. Their intent was to provide a tool for detecting possible problem areas when developerswish to port their Java tools across versions of the JDK. They provide evolution analysis at the level ofReuse Contracts [STEY 96].
102
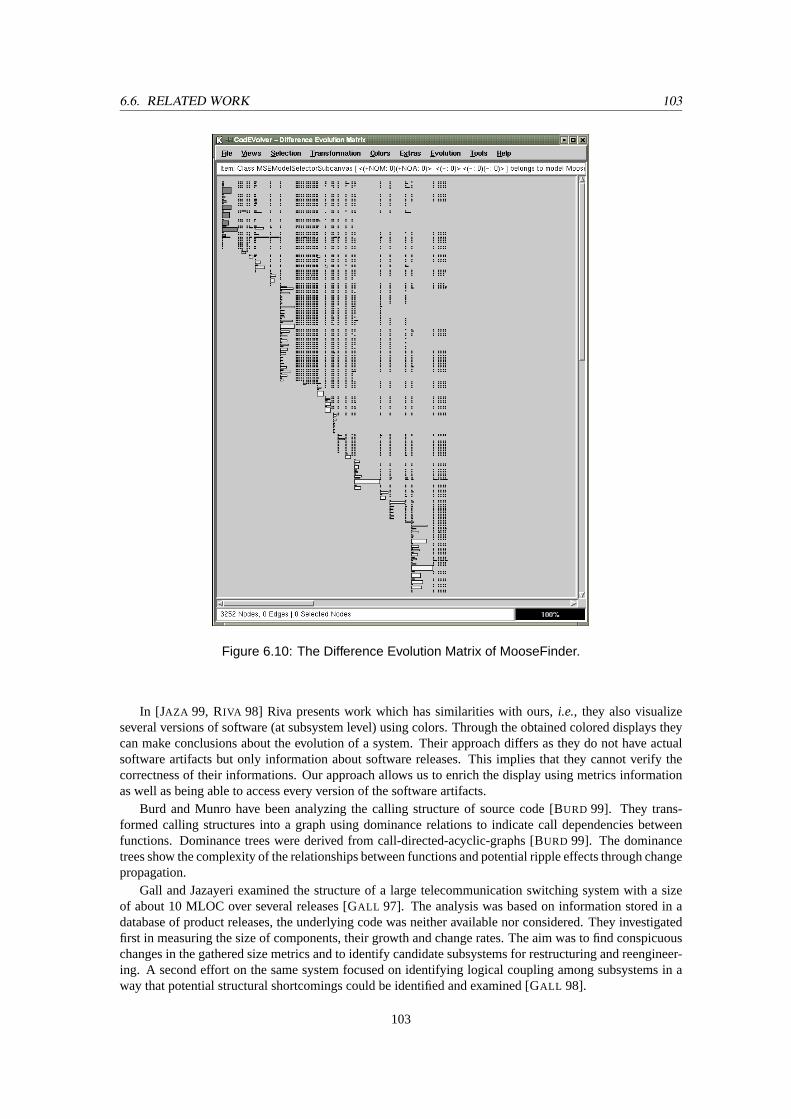
6.6. RELATED WORK 103
Figure 6.10: The Difference Evolution Matrix of MooseFinder.
In [JAZA 99, RIVA 98] Riva presents work which has similarities with ours,i.e., they also visualizeseveral versions of software (at subsystem level) using colors. Through the obtained colored displays theycan make conclusions about the evolution of a system. Their approach differs as they do not have actualsoftware artifacts but only information about software releases. This implies that they cannot verify thecorrectness of their informations. Our approach allows us to enrich the display using metrics informationas well as being able to access every version of the software artifacts.
Burd and Munro have been analyzing the calling structure of source code [BURD 99]. They trans-formed calling structures into a graph using dominance relations to indicate call dependencies betweenfunctions. Dominance trees were derived from call-directed-acyclic-graphs [BURD 99]. The dominancetrees show the complexity of the relationships between functions and potential ripple effects through changepropagation.
Gall and Jazayeri examined the structure of a large telecommunication switching system with a sizeof about 10 MLOC over several releases [GALL 97]. The analysis was based on information stored in adatabase of product releases, the underlying code was neither available nor considered. They investigatedfirst in measuring the size of components, their growth and change rates. The aim was to find conspicuouschanges in the gathered size metrics and to identify candidate subsystems for restructuring and reengineer-ing. A second effort on the same system focused on identifying logical coupling among subsystems in away that potential structural shortcomings could be identified and examined [GALL 98].
103
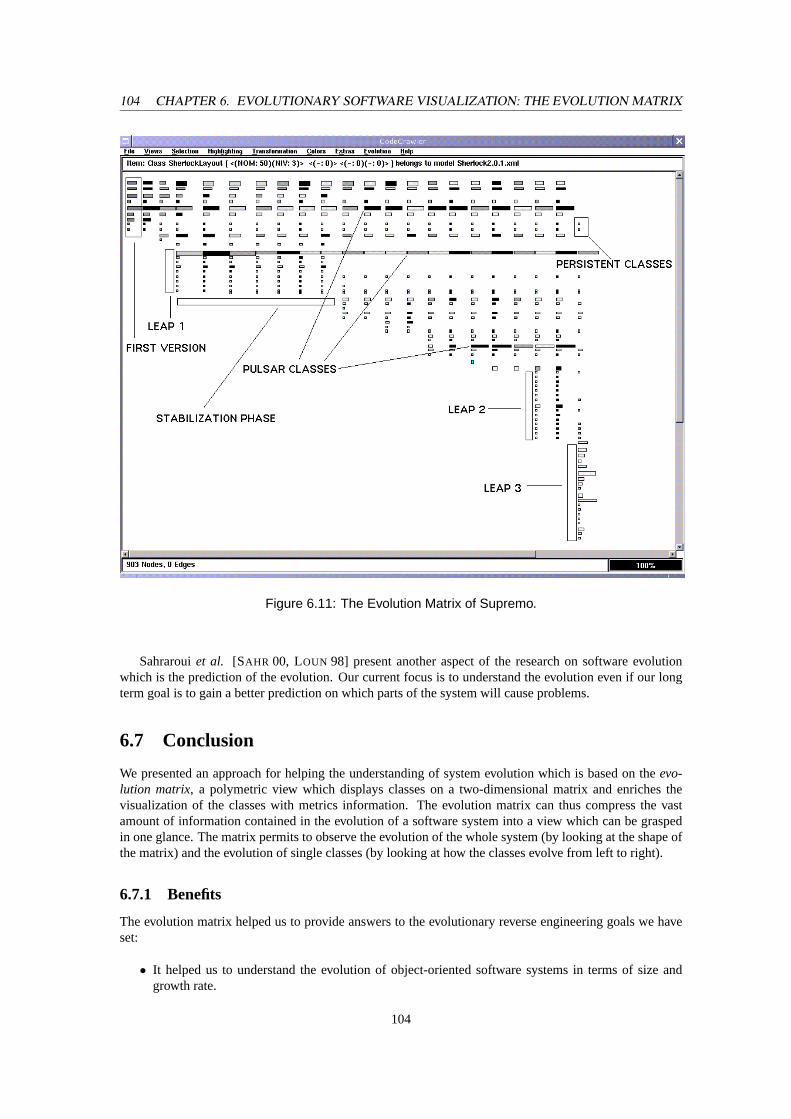
104 CHAPTER 6. EVOLUTIONARY SOFTWARE VISUALIZATION: THE EVOLUTION MATRIX
Figure 6.11: The Evolution Matrix of Supremo.
Sahrarouiet al. [SAHR 00, LOUN 98] present another aspect of the research on software evolutionwhich is the prediction of the evolution. Our current focus is to understand the evolution even if our longterm goal is to gain a better prediction on which parts of the system will cause problems.
6.7 Conclusion
We presented an approach for helping the understanding of system evolution which is based on theevo-lution matrix, a polymetric view which displays classes on a two-dimensional matrix and enriches thevisualization of the classes with metrics information. The evolution matrix can thus compress the vastamount of information contained in the evolution of a software system into a view which can be graspedin one glance. The matrix permits to observe the evolution of the whole system (by looking at the shape ofthe matrix) and the evolution of single classes (by looking at how the classes evolve from left to right).
6.7.1 Benefits
The evolution matrix helped us to provide answers to the evolutionary reverse engineering goals we haveset:
• It helped us to understand the evolution of object-oriented software systems in terms of size andgrowth rate.
104
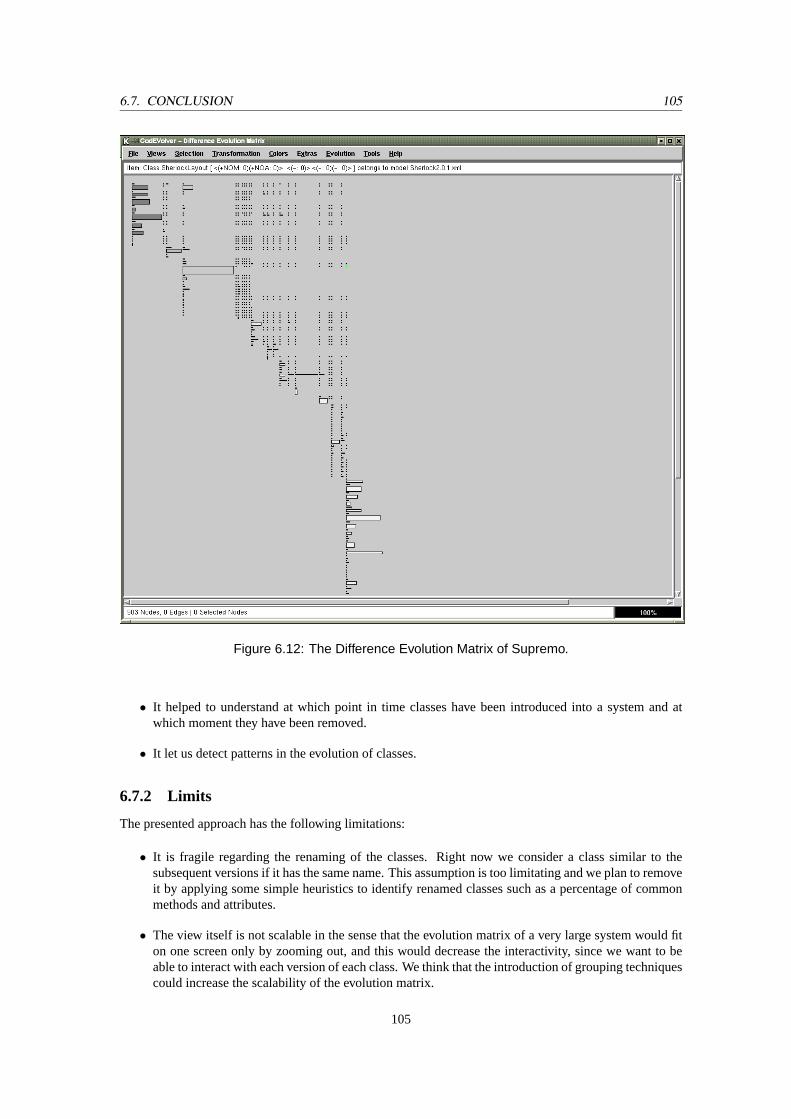
6.7. CONCLUSION 105
Figure 6.12: The Difference Evolution Matrix of Supremo.
• It helped to understand at which point in time classes have been introduced into a system and atwhich moment they have been removed.
• It let us detect patterns in the evolution of classes.
6.7.2 Limits
The presented approach has the following limitations:
• It is fragile regarding the renaming of the classes. Right now we consider a class similar to thesubsequent versions if it has the same name. This assumption is too limitating and we plan to removeit by applying some simple heuristics to identify renamed classes such as a percentage of commonmethods and attributes.
• The view itself is not scalable in the sense that the evolution matrix of a very large system would fiton one screen only by zooming out, and this would decrease the interactivity, since we want to beable to interact with each version of each class. We think that the introduction of grouping techniquescould increase the scalability of the evolution matrix.
105
106 CHAPTER 6. EVOLUTIONARY SOFTWARE VISUALIZATION: THE EVOLUTION MATRIX
6.7.3 Future Work
In the future we plan to investigate the following ideas:
• We would like to apply the evolution matrix at other levels of granularity. In particular, we want tobe able to reason in terms of subsystems, packages or applications because these concepts representconceptually linked classes in large applications. In such a context we would like to understandthe evolution of subsystems, inside them and between them when for example a class is changingsubsystem.
• Applying other metrics such the number of lines of codes in combination with the number of methodsor statements in the class should be investigated to see if we can qualify the actual changes,i.e., newmethods can be added as the results of code refactoring while in the same time the number of linescan decrease.
• The choice of the case studies is also another factor that we would like to analyze. Indeed, the ratesof changes may be quite different with longer periods between releases. In our experiences we haveaccess to all the versions made by the developers and could not really assess major versions.
• we plan to apply the same approach to several versions of large systems like Squeak, Java Swing,VisualWorks Smalltalk and the Microsoft Foundation Classes (MFC) where the time spent betweentwo versions can be months or years.
106
Chapter 7
Conclusions
In this chapter we summarize the contributions made in this dissertation, discuss the benefits of our ap-proach, and point to directions for future work.
7.1 Contributions
In this dissertation we presented a new, lightweight approach to enrich software visualizations with metricsand other semantic information. We call these enriched visualizationspolymetric views. The polymetricviews are customizable and can be easily adapted to different contexts. We used the polymetric viewsin three different reverse engineering contexts, namely (1) coarse-grained software visualization, (2) fine-grained software visualization, and (3) evolutionary software visualization.
• Coarse-grained software visualization. We presented and discussed several polymetric views aimedat the first phase of a reverse engineering process. During that stage, the reverse engineer needs tobuild a mental image of the software system he is analyzing. We presented a reverse engineeringapproach based on clusters of polymetric views. Such an approach is needed, because the reverseengineer not only needs to know what he is currently looking at, but he also needs to know whichare the next steps,i.e., which part or aspect of the system he wants to understand comes next. Usingthe coarse-grained views we were able to reach the coarse-grained reverse engineering goals we hadset up, namely:
– Assess the overall quality of the system
– Gain an overview of the system in terms of size, complexity, and structure.
– Locate and understand the most important classes and inheritance hierarchies,i.e., find theclasses and hierarchies that represent a core part of the system’s domain and understand theirdesign, structure in terms of implementation, and purpose in terms of functionality.
– Identify exceptional classes in terms of size and/or complexity compared to all classes in thesubject system. These may be candidates for a further inspection or for the application ofrefactorings.
– Identify exceptional methods in terms of size and/or complexity compared to the average ofthe methods in the subject system. These may be candidates for a further inspection regardingduplicated code or for the application of refactorings.
– Locate unused,e.g., dead code. This can be unused attributes, methods that are never invokedor that have commented method bodies, unreferenced classes, etc.
• Fine-grained software visualization.We presented and discussed the polymetric viewclass blueprint,a semantically augmented call- and access-graph of the methods and the attributes of classes. Theclass blueprint helps to understand and develop a mental image of the visualized classes. The classblueprint view provides the following benefits:
107
108 CHAPTER 7. CONCLUSIONS
– Reduction of complexity.It helps to make assumptions about a class without having to read thewhole source code. This “taste” of the class, which conveys the purpose of a class, appears intwo contexts: the class in isolation and the class within its inheritance hierarchy.
– Identification of key methods.By condensing the informations contained in a class, it stressessome of its aspects. Based on the resulting signs shown by the blueprint, the reengineer buildshypotheses and gains insights on the structure and internal implementation of a class. Theblueprint helps toselect the relevantmethods whose reading validates or invalidates the hy-potheses of the reengineer.
– A common vocabulary.The recurrent visual patterns created by the blueprints define a commonvocabulary for the class. This vocabulary supports the communication between reengineersduring a reverse engineering process, in a similar manner to design patterns that constitute avocabulary for design solutions.
– Programming style detection.After the display of several blueprints, the observer starts toidentify common visual patterns in different blueprints. These patterns reflect the programmingstyle of the developer,i.e., in some case studies we are able to recognize which developer wrotethe blueprinted classes.
• Evolutionary software visualization.We presented and discussed the polymetric viewevolution ma-trix. It allows for an understanding of the evolution of classes within object-oriented systems andthe evolution of the systems themselves. Moreover the evolution matrix acts as a revealer of cer-tain specific situations that occur during system evolution such as pulsating classes that grow andshrink during the lifetime of the system. We defined a simple vocabulary to describe such specificbehaviors. The evolution matrix view provides the following benefits:
– It provides system wide views that help to understand essential changes during the evolution ofan application.
– It provides a finer understanding of the class evolution.
– It builds a vocabulary to describe system and class evolution.
– It scales well. However, we expect to have some screen limitation problems with huge systems.Working at another level of abstraction will be required.
We claimed that the polymetric views can help to greatly reduce the complexity of a reverse engineeringprocess. Moreover, the added metrics and semantic information increase the amount of information thatis visually transmitted to the viewer. The polymetric views supportopportunistic code reading, i.e., thegoal of the polymetric views is not to replace code reading, but to point the viewer to locations of interest.To validate our claim we applied different polymetric views on several case studies, some of which arepresented in this thesis, with the goal of understanding the subject systems.
7.2 Future Work
The future work pertinent to each one of the three different aspects we have covered in this thesis (coarse-grained, fine-grained, and evolutionary understanding) is discussed in the respective chapters.
In this section we present several ideas that could not be realized or implemented, largely due to a lackof time and a lack of human resources. The future work described here does not necessarily have a directconnection to what we discussed in this thesis. Nonetheless we would like to present it here:
• Software visualization, whose roots lie mainly in information visualization, is limited by this legacy.Most of the time ideas from information visualization are applied on static systems, for examplewebsites, databases, and large documents. Software systems on the other hand are constantly beingevolved by their developers and maintainers and can be regarded as living systems. This differencecalls for a much higher degree of flexibility and above all interactivity which visualization tools mustoffer. The fact that most software developers still think in terms ofedit-compile-runcycles may be
108
7.2. FUTURE WORK 109
one of the major reasons for the lack of success of software visualization tools which use mainlygraphical approaches (as opposed to other visualizations,e.g., textual enhancements like the use ofcolor editing, different fonts, hypertext, etc.).
The future work would thus consist in developing highly interactive development environmentswhich would make the distinction between forward and reverse engineering / reengineering super-fluous.
• Visualization of software evolution is still a largely unexploited research field. This may be due tothe fact that software evolution research is still focused on managing the huge sets of data and noisewhich denote this research topic. We think that an approach based on alevel of detail(LOD), asused in 3D and Virtual Reality,e.g., games like so-called first-person shooters, which allows one toincrease the granularity of the observed information at will, may decrease the encountered problemsand thus increase the quality of the information one wants to see.
In this context we think that the use of animation,i.e., moving pictures of evolving software systems,could delegate the task of noise reduction to the human eye and brain. On the other hand we areaware that animation on its own is not enough, because in software evolution the main interest doesnot lie in observation, but in comparing different versions. In the case of animations, the axis of(development) time would be mapped on the axis of (animation) time, which makes comparisonsdifficult, if not impossible. However, by adding the right information one could even profit fromanimation techniques, if not only to obtain a high-level view of the evolution of a complete softwaresystem. Here again the right information is the key to interesting results.
• As presented in Chapter 2 software visualization does not necessarily mean a visual display butcan include other means as well. An interesting, yet under-exploited, research topic is softwareauralization, which visualizes software using sounds. It has mainly been used for rendering thedynamic behavior of software,e.g., each time a program passes through a certain loop a sound isgenerated, or the pitch of the generated sound varies according to the state a program is in.
Although it doesn’t make much sense to use this technique for the auralization of the static structureof software, it could be used for rendering evolving software. For example a sound could be gener-ated whose pitch changes according to the size of the system. Several other paths could be exploredin this topic, but once again this research is heavily dependent on having as much information,i.e.,version information of the examined system, as possible.
Examples of such pieces of information are the commit-time, the developer’s name tag, and of coursethe version number. Other important pieces of information are the developer’s comments, theirsize and the content. Knowing when, how, and what a developer says about the system he’s beingdeveloping could be interesting.
• Software evolution research depends on having consistent sets of information about evolving sys-tems, i.e., the granularity level of the available information heavily influences the quality of theresearch. Although interesting experiments have been conducted even with as little information asthe version numbers of subsystems [RIVA 98], high-quality research depends on having as much in-formation as possible. This is where versioning systems like CVS or RCS can provide a great dealof information, although the granularity level is still only of released versions and not at the levelof micro-changes, for example the addition and removal of methods. Versioning systems should notbe used as external tools as they are right now, but should be neatly integrated into developmentenvironments, in order to provide as much information about the evolution of software as possible.
An example of such the information is the tracing of browsers, which allows one to observe thebehaviorof programmers during the forward and reverse engineering phases of a software system’sevolution, as can already be done in the StarBrowser [WUYT ] by the SmallBrother plugin. Recov-ering such information would however involve a tight integration with the development environmentat hand. This again would involve an invisibility of such a plugin or extension,i.e., the plugin mustnot disturb or change the behavior of the developers during their programming.
109
110 CHAPTER 7. CONCLUSIONS
7.3 Closing Words
All too often research conducted in the field of software visualization, a descendant of information visu-alization, is ignoring the great insights obtained by people like Bertin and more recently Tufte, Ware, andStasko and others. This generated in the last few years dozens of software visualization tools that mainlyoffer the same functionalities and introduce little new insights. We believe that in order for software visu-alization to become a respected, serious, and established research field, software visualization researchersshould settle on a common benchmark which would allow one to accept and/or reject new/old ideas and todiscuss these ideas more critically.
The greatest problem that software visualization faces, is that it is a unique conjunction of variousaspects and techniques and requires from researchers a wide range of talents among which
• a deep sense of esthetics,
• a thorough knowledge in software engineering, software reengineering and software reverse engi-neering,
• a vast experience in programming languages and integrated development environments (IDEs),
• a solid talent in developing software to efficiently implement new ideas,
• a good basis in human-computer interaction (HCI).
Sadly, no teaching or research institution currently offers such a broad range of disciplines or even triesto aggregate them into an interdisciplinary course.
110

Chapter 8
Epilogue
Even though we believe that the contributions made in this thesis may be helpful, as long as there is notight integration of software visualization tools with current development environments, only a little partof their benefits will flow into mainstream software development and its industry.
However, it will stay a promising and interesting research field because of its complexity, reality, andbeauty.
In that sense: we are going to see...
Michele Lanza
Aprile 27, 2003
111
Appendix A
CodeCrawler - Implementation
A.1 Introduction
In this chapter we discuss the implementation of CodeCrawler1. CodeCrawler is the software visualizationtool we have implemented during the past years and which made possible all the visualizations presentedhere. In this chapter we discuss the implementation of CodeCrawler according to five aspects and thengeneralize the lessons learned into design guidelines and recommendations for the implementation of soft-ware visualization tools. We hope these lessons can ultimately be used profitably by researchers in thisfield in case they want to start a new implementation or enhance an existing implementation of a softwarevisualization tool.
CodeCrawler’s implementation changed and evolved in order to cope with the new requirements ourresearch generated. Its current design is thus able to solve most of the problems we encountered with staticsoftware visualizations. Moreover, several of the lessons learned with CodeCrawler can be generalized intomore common design guidelines and recommendations which apply to other kinds of software visualizationtools as well.
We identify five key issues pertinent to the implementation of a software visualization tool:
1. the overall architecture, i.e., the way the software visualization tool as a whole is structured. Aclear separation of its three main subsystems,e.g., the core, the visualization engine, and the meta-model, provides for the higher flexibility that is necessary to be resistant against software evolutionprocesses.
2. the internal architecture, i.e., the design of the core domain model. Although simple at first sight,the domain model must be designed for extensibility, since the added and new requirements in termsof the functionality needed by the users have an impact on it.
3. the visualization engine, i.e., the way information is visualized. Since software visualization toolshave special needs, an off-the-shelf visualization library does not offer the degree of freedom neededby the software visualization tool provider. On the other hand writing a complete visualization libraryfrom scratch is a cumbersome and lengthy process that should not burden the software visualizationtool provider. We describe a compromise solution that largely satisfied our needs.
4. the metamodel, i.e., the way data is collected and stored. This part, not directly related to softwarevisualization, but to more general and common reverse engineering issues, should also be separatedfrom a software visualization tool and be reused as an external and well-defined source of function-alities.
1This chapter is an extended version of the articleCodeCrawler - Lessons Learned in Building a Software Visualization Tool,published in the CSMR 2003 proceedings (7th European Conference on Software Maintenance and Reengineering), pp. 409 - 418,IEEE Press, 2003.
112
A.2. CODECRAWLER 113
5. the interactive facilities, i.e., the direct-manipulation possibilities that are offered to the user. Al-though hard to validate, it is this aspect that requires the most work from a software visualizationtool provider and that ultimately dictates the tool’s usability and success.
Software and Information Visualization
Priceet. al [Sta 98] define software visualization asthe use of crafts of typography, graphics design, ani-mation, and cinematography with modern human-computer interaction and computer graphics technologyto facilitate both the human understanding and effective use of computer software. Ware [WARE 00] statesthatvisualization provides an ability to comprehend huge amounts of data. However, software visualiza-tions are often too simplistic and lack visual cues for the viewer to correctly interpret them. In other casesthe obtained visualizations are still too complex to be of any real value to the viewer. The goal of anysoftware visualization tool is ultimately to visually render software, be it in a dynamic or static fashion.Software visualization is useful because visual displays allow the human brain to study multiple aspects ofcomplex problems in parallel. All software visualization tools face problems coming form the more generalfields ofinformation visualization[WARE 00] andsemiotics of graphics (the study of symbols and how theyconvey meaning), wonderfully discussed by Tufte [TUFT 90, TUFT 01, TUFT 97] and Bertin [BERT 74].
Ware [WARE 00] describes four basic stages in the process of data visualization, and interestinglyenough these four stages have a direct mapping on the architecture of software visualization tools:
1. The collection and storage of data itself.
2. The preprocessing designed to transform the data into something we can understand.
3. The display hardware and the graphics algorithms that produce an image on the screen.
4. The human perceptual and cognitive system,i.e., the perceiver.
We deduce from these four stages four components thatde factomust be present in one way or anotherin every software visualization tool:
1. The metamodel. The data to be visualized, in this case it is software source code, must be collectedand stored using a metamodel that provides facilities like parsing, storing, etc.
2. The internal architecture. Based on the data provided by the metamodel, a software visualizationtool must have some kind of internal representation of what it visualizes.
3. The visualization engine. An important part of every tool is devoted to the graphical output ofinformation.
4. Interactivity. The perceiver,e.g., the viewer, not only wants to look at software, most of the timeshe also wants to interact with the visualizations, since static visualizations seldom offer exhaustiveexplanations to the viewer.
Furthermore the union and interplay of these components can be regarded as theoverall architectureof a software visualization tool.
Structure of the chapter. In Section A.2 we present our tool CodeCrawler according to the five criteriaidentified above. We then generalize our findings into lessons learned (Section A.3) before concluding inSection A.4.
A.2 CodeCrawler
CodeCrawler is a language-independent software visualization tool written in Smalltalk. CodeCrawlersupports reverse engineering through the combination of metrics and software visualization [LANZ 99,DEME 99b, DUCA 01a, LANZ 01a]. In Figure A.1 we can see a screenshot of CodeCrawler. Its power and
113
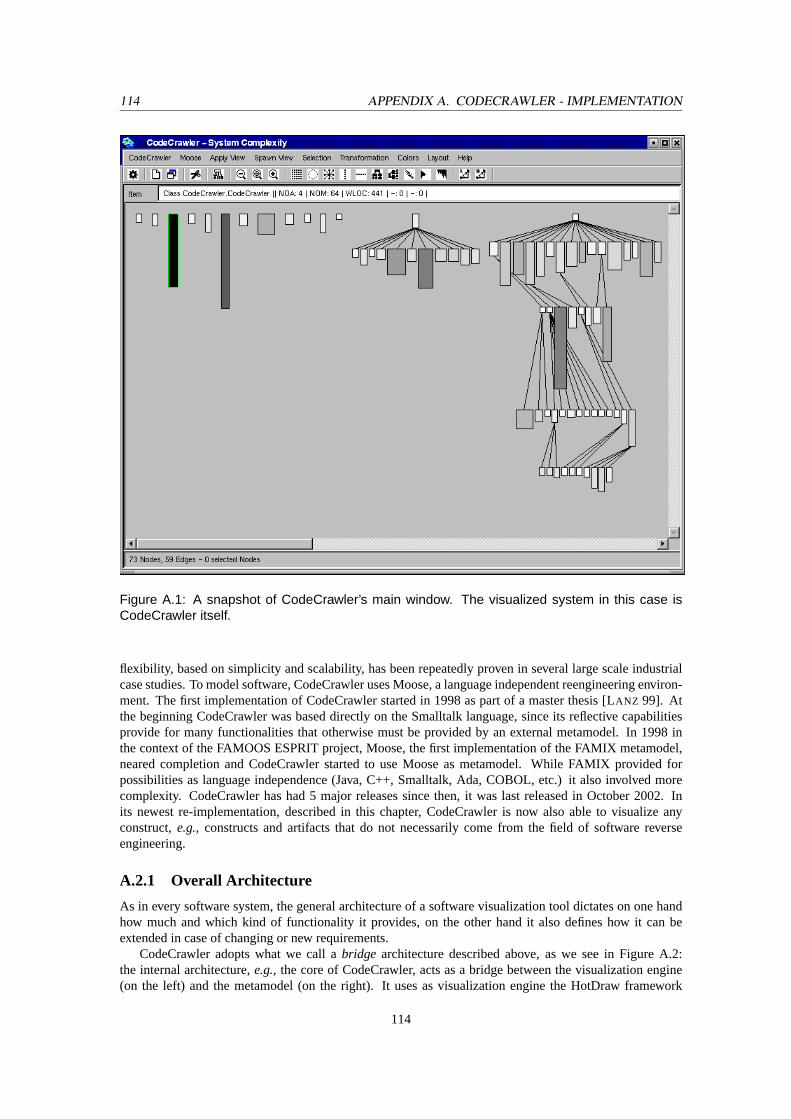
114 APPENDIX A. CODECRAWLER - IMPLEMENTATION
Figure A.1: A snapshot of CodeCrawler’s main window. The visualized system in this case isCodeCrawler itself.
flexibility, based on simplicity and scalability, has been repeatedly proven in several large scale industrialcase studies. To model software, CodeCrawler uses Moose, a language independent reengineering environ-ment. The first implementation of CodeCrawler started in 1998 as part of a master thesis [LANZ 99]. Atthe beginning CodeCrawler was based directly on the Smalltalk language, since its reflective capabilitiesprovide for many functionalities that otherwise must be provided by an external metamodel. In 1998 inthe context of the FAMOOS ESPRIT project, Moose, the first implementation of the FAMIX metamodel,neared completion and CodeCrawler started to use Moose as metamodel. While FAMIX provided forpossibilities as language independence (Java, C++, Smalltalk, Ada, COBOL, etc.) it also involved morecomplexity. CodeCrawler has had 5 major releases since then, it was last released in October 2002. Inits newest re-implementation, described in this chapter, CodeCrawler is now also able to visualize anyconstruct,e.g., constructs and artifacts that do not necessarily come from the field of software reverseengineering.
A.2.1 Overall Architecture
As in every software system, the general architecture of a software visualization tool dictates on one handhow much and which kind of functionality it provides, on the other hand it also defines how it can beextended in case of changing or new requirements.
CodeCrawler adopts what we call abridge architecture described above, as we see in Figure A.2:the internal architecture,e.g., the core of CodeCrawler, acts as a bridge between the visualization engine(on the left) and the metamodel (on the right). It uses as visualization engine the HotDraw framework
114
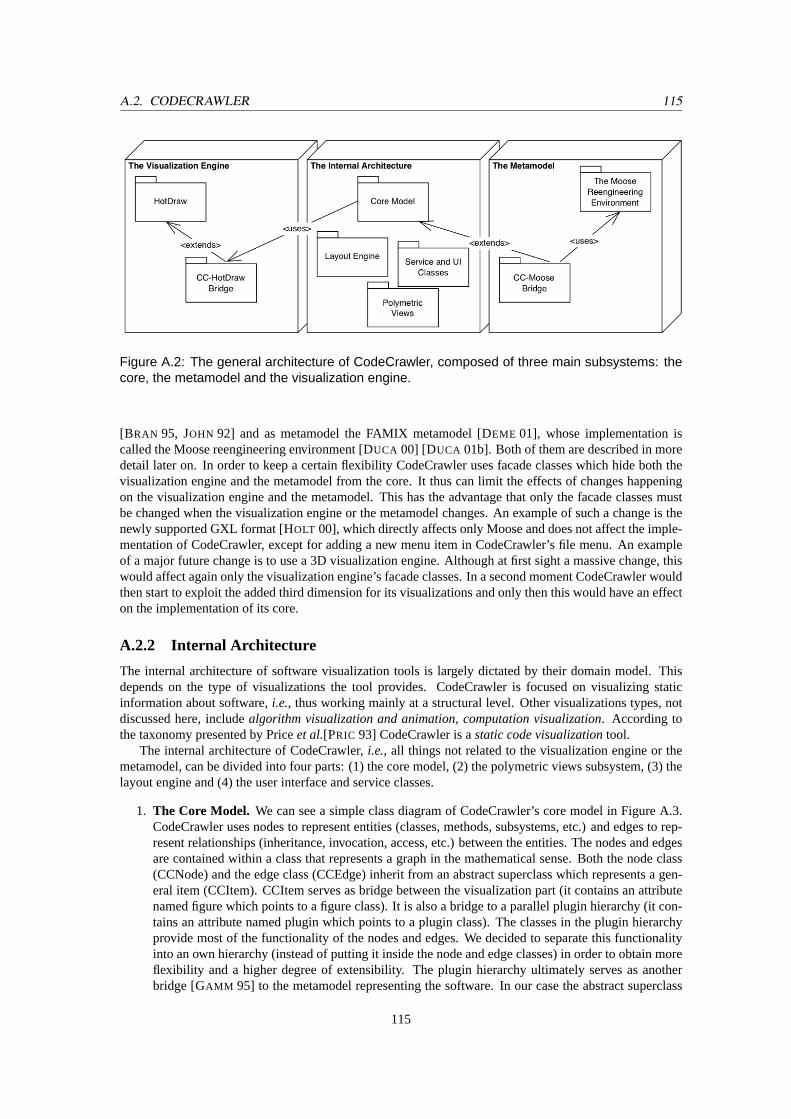
A.2. CODECRAWLER 115
Figure A.2: The general architecture of CodeCrawler, composed of three main subsystems: thecore, the metamodel and the visualization engine.
[BRAN 95, JOHN 92] and as metamodel the FAMIX metamodel [DEME 01], whose implementation iscalled the Moose reengineering environment [DUCA 00] [DUCA 01b]. Both of them are described in moredetail later on. In order to keep a certain flexibility CodeCrawler uses facade classes which hide both thevisualization engine and the metamodel from the core. It thus can limit the effects of changes happeningon the visualization engine and the metamodel. This has the advantage that only the facade classes mustbe changed when the visualization engine or the metamodel changes. An example of such a change is thenewly supported GXL format [HOLT 00], which directly affects only Moose and does not affect the imple-mentation of CodeCrawler, except for adding a new menu item in CodeCrawler’s file menu. An exampleof a major future change is to use a 3D visualization engine. Although at first sight a massive change, thiswould affect again only the visualization engine’s facade classes. In a second moment CodeCrawler wouldthen start to exploit the added third dimension for its visualizations and only then this would have an effecton the implementation of its core.
A.2.2 Internal Architecture
The internal architecture of software visualization tools is largely dictated by their domain model. Thisdepends on the type of visualizations the tool provides. CodeCrawler is focused on visualizing staticinformation about software,i.e., thus working mainly at a structural level. Other visualizations types, notdiscussed here, includealgorithm visualization and animation, computation visualization. According tothe taxonomy presented by Priceet al.[PRIC 93] CodeCrawler is astatic code visualizationtool.
The internal architecture of CodeCrawler,i.e., all things not related to the visualization engine or themetamodel, can be divided into four parts: (1) the core model, (2) the polymetric views subsystem, (3) thelayout engine and (4) the user interface and service classes.
1. The Core Model. We can see a simple class diagram of CodeCrawler’s core model in Figure A.3.CodeCrawler uses nodes to represent entities (classes, methods, subsystems, etc.) and edges to rep-resent relationships (inheritance, invocation, access, etc.) between the entities. The nodes and edgesare contained within a class that represents a graph in the mathematical sense. Both the node class(CCNode) and the edge class (CCEdge) inherit from an abstract superclass which represents a gen-eral item (CCItem). CCItem serves as bridge between the visualization part (it contains an attributenamed figure which points to a figure class). It is also a bridge to a parallel plugin hierarchy (it con-tains an attribute named plugin which points to a plugin class). The classes in the plugin hierarchyprovide most of the functionality of the nodes and edges. We decided to separate this functionalityinto an own hierarchy (instead of putting it inside the node and edge classes) in order to obtain moreflexibility and a higher degree of extensibility. The plugin hierarchy ultimately serves as anotherbridge [GAMM 95] to the metamodel representing the software. In our case the abstract superclass
115
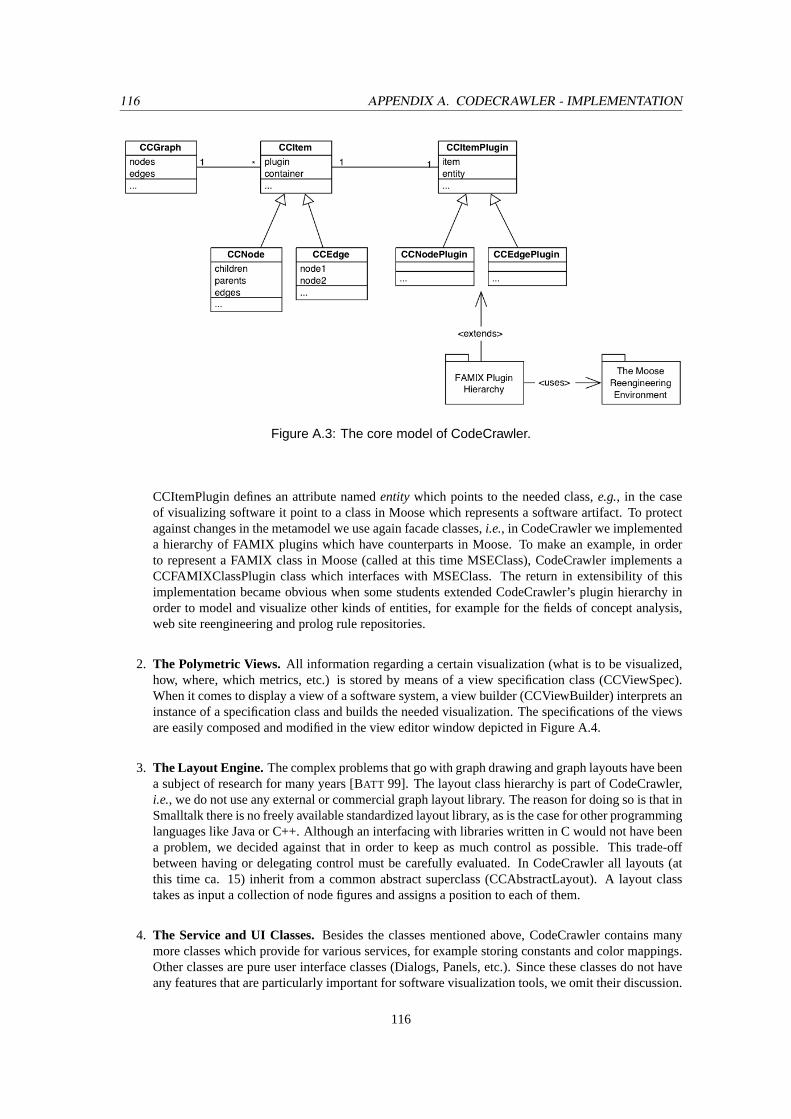
116 APPENDIX A. CODECRAWLER - IMPLEMENTATION
Figure A.3: The core model of CodeCrawler.
CCItemPlugin defines an attribute namedentity which points to the needed class,e.g., in the caseof visualizing software it point to a class in Moose which represents a software artifact. To protectagainst changes in the metamodel we use again facade classes,i.e., in CodeCrawler we implementeda hierarchy of FAMIX plugins which have counterparts in Moose. To make an example, in orderto represent a FAMIX class in Moose (called at this time MSEClass), CodeCrawler implements aCCFAMIXClassPlugin class which interfaces with MSEClass. The return in extensibility of thisimplementation became obvious when some students extended CodeCrawler’s plugin hierarchy inorder to model and visualize other kinds of entities, for example for the fields of concept analysis,web site reengineering and prolog rule repositories.
2. The Polymetric Views. All information regarding a certain visualization (what is to be visualized,how, where, which metrics, etc.) is stored by means of a view specification class (CCViewSpec).When it comes to display a view of a software system, a view builder (CCViewBuilder) interprets aninstance of a specification class and builds the needed visualization. The specifications of the viewsare easily composed and modified in the view editor window depicted in Figure A.4.
3. The Layout Engine. The complex problems that go with graph drawing and graph layouts have beena subject of research for many years [BATT 99]. The layout class hierarchy is part of CodeCrawler,i.e., we do not use any external or commercial graph layout library. The reason for doing so is that inSmalltalk there is no freely available standardized layout library, as is the case for other programminglanguages like Java or C++. Although an interfacing with libraries written in C would not have beena problem, we decided against that in order to keep as much control as possible. This trade-offbetween having or delegating control must be carefully evaluated. In CodeCrawler all layouts (atthis time ca. 15) inherit from a common abstract superclass (CCAbstractLayout). A layout classtakes as input a collection of node figures and assigns a position to each of them.
4. The Service and UI Classes.Besides the classes mentioned above, CodeCrawler contains manymore classes which provide for various services, for example storing constants and color mappings.Other classes are pure user interface classes (Dialogs, Panels, etc.). Since these classes do not haveany features that are particularly important for software visualization tools, we omit their discussion.
116
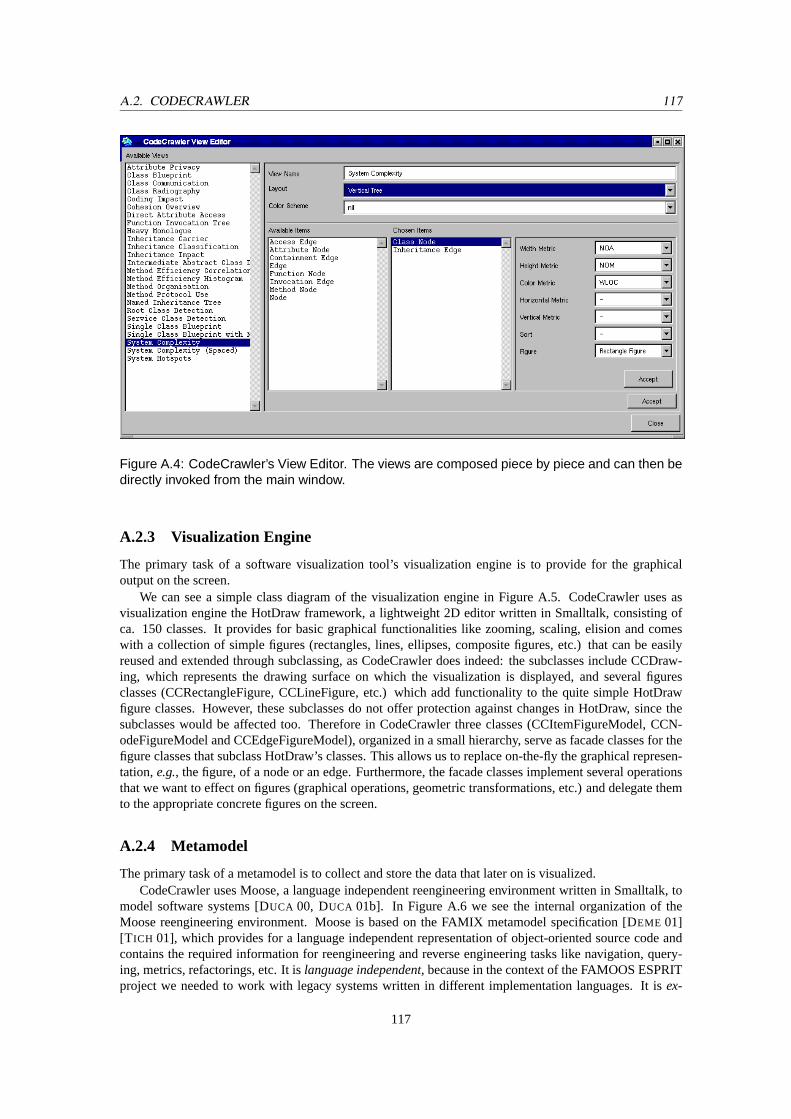
A.2. CODECRAWLER 117
Figure A.4: CodeCrawler’s View Editor. The views are composed piece by piece and can then bedirectly invoked from the main window.
A.2.3 Visualization Engine
The primary task of a software visualization tool’s visualization engine is to provide for the graphicaloutput on the screen.
We can see a simple class diagram of the visualization engine in Figure A.5. CodeCrawler uses asvisualization engine the HotDraw framework, a lightweight 2D editor written in Smalltalk, consisting ofca. 150 classes. It provides for basic graphical functionalities like zooming, scaling, elision and comeswith a collection of simple figures (rectangles, lines, ellipses, composite figures, etc.) that can be easilyreused and extended through subclassing, as CodeCrawler does indeed: the subclasses include CCDraw-ing, which represents the drawing surface on which the visualization is displayed, and several figuresclasses (CCRectangleFigure, CCLineFigure, etc.) which add functionality to the quite simple HotDrawfigure classes. However, these subclasses do not offer protection against changes in HotDraw, since thesubclasses would be affected too. Therefore in CodeCrawler three classes (CCItemFigureModel, CCN-odeFigureModel and CCEdgeFigureModel), organized in a small hierarchy, serve as facade classes for thefigure classes that subclass HotDraw’s classes. This allows us to replace on-the-fly the graphical represen-tation,e.g., the figure, of a node or an edge. Furthermore, the facade classes implement several operationsthat we want to effect on figures (graphical operations, geometric transformations, etc.) and delegate themto the appropriate concrete figures on the screen.
A.2.4 Metamodel
The primary task of a metamodel is to collect and store the data that later on is visualized.CodeCrawler uses Moose, a language independent reengineering environment written in Smalltalk, to
model software systems [DUCA 00, DUCA 01b]. In Figure A.6 we see the internal organization of theMoose reengineering environment. Moose is based on the FAMIX metamodel specification [DEME 01][T ICH 01], which provides for a language independent representation of object-oriented source code andcontains the required information for reengineering and reverse engineering tasks like navigation, query-ing, metrics, refactorings, etc. It islanguage independent, because in the context of the FAMOOS ESPRITproject we needed to work with legacy systems written in different implementation languages. It isex-
117
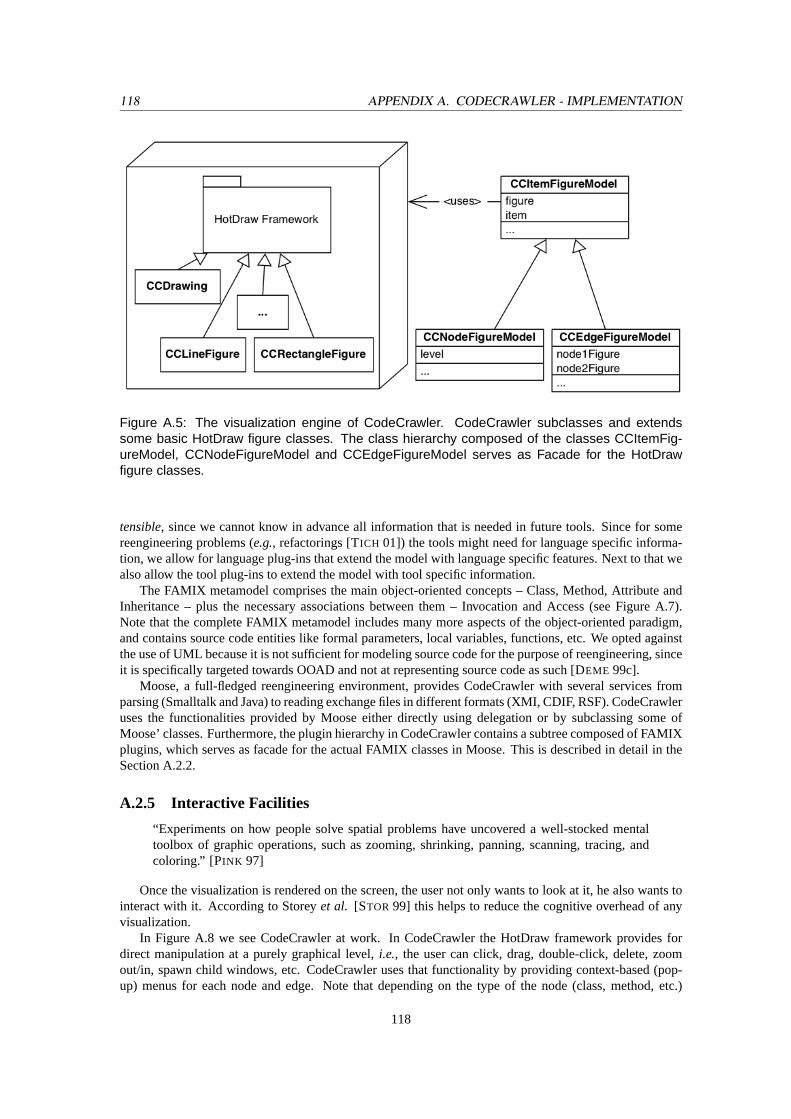
118 APPENDIX A. CODECRAWLER - IMPLEMENTATION
Figure A.5: The visualization engine of CodeCrawler. CodeCrawler subclasses and extendssome basic HotDraw figure classes. The class hierarchy composed of the classes CCItemFig-ureModel, CCNodeFigureModel and CCEdgeFigureModel serves as Facade for the HotDrawfigure classes.
tensible, since we cannot know in advance all information that is needed in future tools. Since for somereengineering problems (e.g., refactorings [TICH 01]) the tools might need for language specific informa-tion, we allow for language plug-ins that extend the model with language specific features. Next to that wealso allow the tool plug-ins to extend the model with tool specific information.
The FAMIX metamodel comprises the main object-oriented concepts – Class, Method, Attribute andInheritance – plus the necessary associations between them – Invocation and Access (see Figure A.7).Note that the complete FAMIX metamodel includes many more aspects of the object-oriented paradigm,and contains source code entities like formal parameters, local variables, functions, etc. We opted againstthe use of UML because it is not sufficient for modeling source code for the purpose of reengineering, sinceit is specifically targeted towards OOAD and not at representing source code as such [DEME 99c].
Moose, a full-fledged reengineering environment, provides CodeCrawler with several services fromparsing (Smalltalk and Java) to reading exchange files in different formats (XMI, CDIF, RSF). CodeCrawleruses the functionalities provided by Moose either directly using delegation or by subclassing some ofMoose’ classes. Furthermore, the plugin hierarchy in CodeCrawler contains a subtree composed of FAMIXplugins, which serves as facade for the actual FAMIX classes in Moose. This is described in detail in theSection A.2.2.
A.2.5 Interactive Facilities
“Experiments on how people solve spatial problems have uncovered a well-stocked mentaltoolbox of graphic operations, such as zooming, shrinking, panning, scanning, tracing, andcoloring.” [PINK 97]
Once the visualization is rendered on the screen, the user not only wants to look at it, he also wants tointeract with it. According to Storeyet al. [STOR 99] this helps to reduce the cognitive overhead of anyvisualization.
In Figure A.8 we see CodeCrawler at work. In CodeCrawler the HotDraw framework provides fordirect manipulation at a purely graphical level,i.e., the user can click, drag, double-click, delete, zoomout/in, spawn child windows, etc. CodeCrawler uses that functionality by providing context-based (pop-up) menus for each node and edge. Note that depending on the type of the node (class, method, etc.)
118
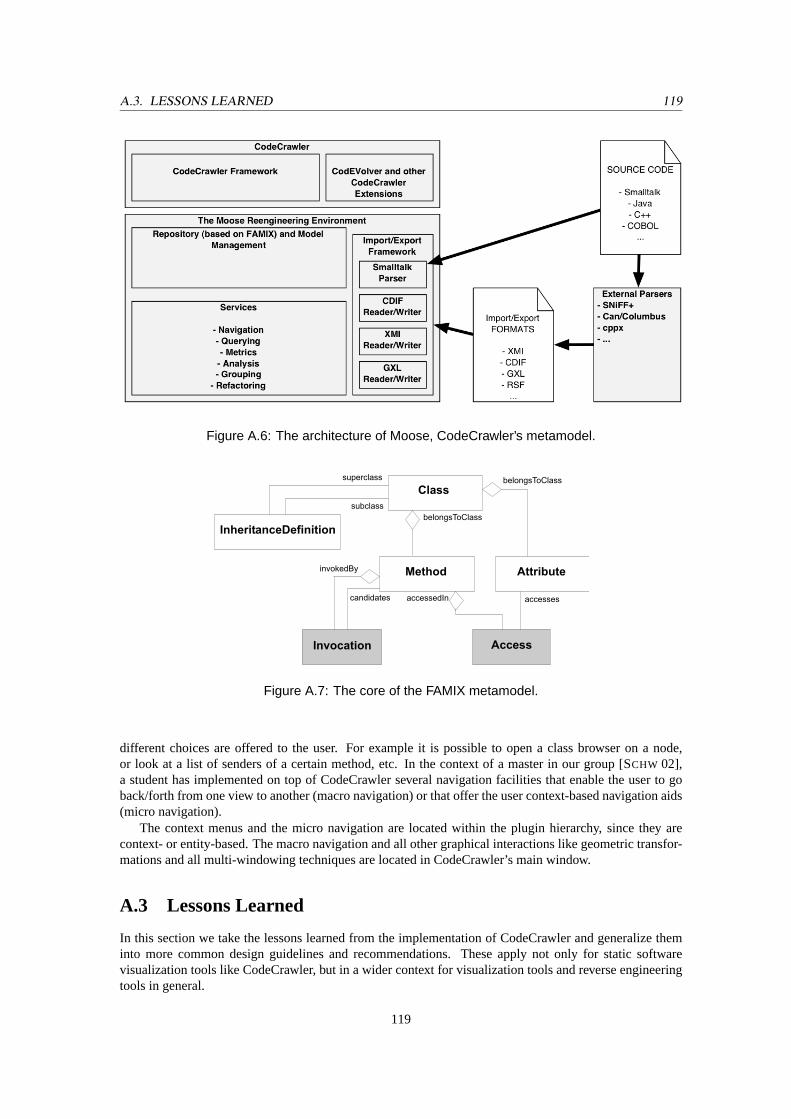
A.3. LESSONS LEARNED 119
Figure A.6: The architecture of Moose, CodeCrawler’s metamodel.
Figure A.7: The core of the FAMIX metamodel.
different choices are offered to the user. For example it is possible to open a class browser on a node,or look at a list of senders of a certain method, etc. In the context of a master in our group [SCHW 02],a student has implemented on top of CodeCrawler several navigation facilities that enable the user to goback/forth from one view to another (macro navigation) or that offer the user context-based navigation aids(micro navigation).
The context menus and the micro navigation are located within the plugin hierarchy, since they arecontext- or entity-based. The macro navigation and all other graphical interactions like geometric transfor-mations and all multi-windowing techniques are located in CodeCrawler’s main window.
A.3 Lessons Learned
In this section we take the lessons learned from the implementation of CodeCrawler and generalize theminto more common design guidelines and recommendations. These apply not only for static softwarevisualization tools like CodeCrawler, but in a wider context for visualization tools and reverse engineeringtools in general.
119
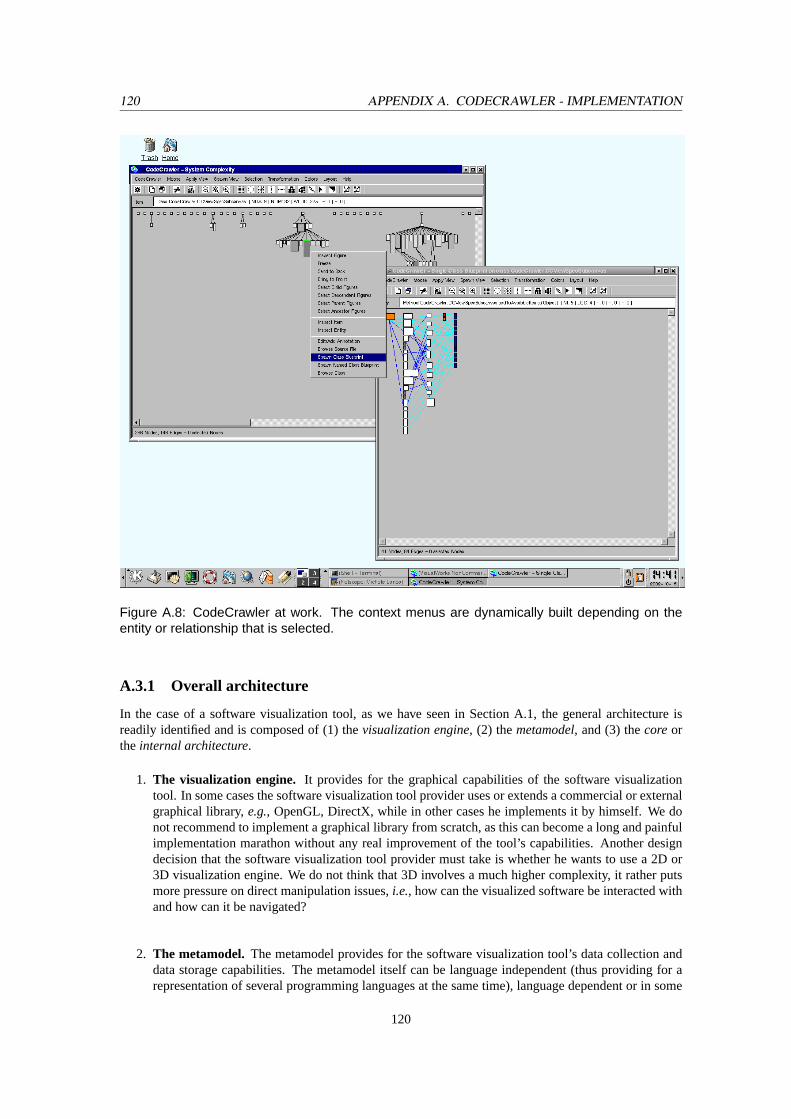
120 APPENDIX A. CODECRAWLER - IMPLEMENTATION
Figure A.8: CodeCrawler at work. The context menus are dynamically built depending on theentity or relationship that is selected.
A.3.1 Overall architecture
In the case of a software visualization tool, as we have seen in Section A.1, the general architecture isreadily identified and is composed of (1) thevisualization engine, (2) themetamodel, and (3) thecoreorthe internal architecture.
1. The visualization engine. It provides for the graphical capabilities of the software visualizationtool. In some cases the software visualization tool provider uses or extends a commercial or externalgraphical library,e.g., OpenGL, DirectX, while in other cases he implements it by himself. We donot recommend to implement a graphical library from scratch, as this can become a long and painfulimplementation marathon without any real improvement of the tool’s capabilities. Another designdecision that the software visualization tool provider must take is whether he wants to use a 2D or3D visualization engine. We do not think that 3D involves a much higher complexity, it rather putsmore pressure on direct manipulation issues,i.e., how can the visualized software be interacted withand how can it be navigated?
2. The metamodel.The metamodel provides for the software visualization tool’s data collection anddata storage capabilities. The metamodel itself can be language independent (thus providing for arepresentation of several programming languages at the same time), language dependent or in some
120
A.3. LESSONS LEARNED 121
cases even be the language itself without any additional meta-information.
3. The core. Ultimately the core is the part of the software visualization tool where the domain modeland the tool’s functionalities are modeled and implemented.
Both the visualization engine and the metamodel can be considered asexternaltools whose evolutioncannot be directly controlled by the software visualization tool provider, unless they provide one or both ofthem. However, this involves more work which distracts from the implementation of the software visual-ization tool’s core capabilities. It is therefore useful to provide a mechanism of protection against changeshappening in either the visualization engine (e.g., the visualization engine is not supported anymore, not up-to-date, does not work on a certain platform, etc.) or in the metamodel (e.g., the implementation changes).By providing the right protection mechanisms it is even thinkable to replace either the visualization engineor the metamodel without having a (big) impact on the software visualization tool core. In our case we doso by means of Facade classes, in a more general case the main point is to define precise interfaces to theboth the metamodel and the visualization engine. The quality and stability of these interfaces ultimatelydefines the overall stability of the tool.
A.3.2 The Internal Architecture
The core task of any visualization tool is to visualize (parts of) this internal graph representation. Thevisualization can be done by different means, but most tools visualize nodes as rectangles and edges asconnecting lines between the rectangles. The internal architecture thus provides for functionalities to allowa visualization. This mainly involves providing guidance to the user and assist him in the process ofvisualization,i.e., what should be visualized and how?
Many static code visualization tools have adopted as internal representation the basic entity-relationshipmetamodel, internally represented as a graph consisting ofnodes(the entities) andedges(the relationships).
• The nodes.The nodes represent concrete and inconcrete software artifacts. Concrete artifacts canbe localized in the source code and include classes, methods, functions, packages, etc., whereasinconcrete artifacts cannot be localized within the source code, but represent often abstractions inthe head of the developers. Examples for inconcrete artifacts are groups of classes, subsystems,functionalities, etc.
• The edges.The edges represent relationships between the software artifacts. Once again we canidentify concrete relationships like inheritance relationships and invocations between methods, andinconcrete relationships between inconcrete artifacts. An example of such a relationship is a depen-dency between two subsystems (”subsystem A depends on subsystem B”) which cannot be localizedwithin the source code.
This representation has the advantage of being domain independent, therefore making a mapping froma domain always possible. However, if domain-related information must be added, the E-R-metamodel istoo general. This is where a parallel domain-dependent plugin hierarchy comes into play: we have seenthat by using a parallel plugin hierarchy we can separate two concerns: one is the representation of a graphcomposed of nodes and edges in the mathematical sense, including all operations that go with it (traversingthe graph, getting children nodes, etc.), the other is the domain-relevant information,i.e., the node repre-sents a certain software artifact and this information must be modeled as well. One alternative would beto encode everything in the node and edge classes, thus having a deep hierarchy of items, composed ofclasses like ClassNode, MethodNode, InheritanceEdge, etc. A previous implementation of CodeCrawleradopted this model, but the limits in terms of flexibility soon became evident: the nodes and edges classesbecame too large, since all item-specific functionality was encoded in them. A separation into two hierar-chies practically froze the core model and made it become very stable, while the constant enhancementsand additions of functionality have mainly an impact only on the plugin hierarchy.
121
122 APPENDIX A. CODECRAWLER - IMPLEMENTATION
A.3.3 The Visualization Engine
The visualization engine of a software visualization tool has an influence on its most prominent aspect, thevisualization. Indeed, the user perceives it as the tool itself, since he does not see any other internal details.The design decisions to be taken in this case include the (1) type of engine (3D vs. 2D), (2) the degreeof possible interactivity, and (3) whether the engine comes from a third party as a possibly commercialproduct or whether the software visualization tool provider chooses to implement himself the visualizationengine as part of the tool.
1. Engine type (3D vs. 2D).This decision heavily influences the visualizations provided by the soft-ware visualization tool. The use of 3D involves more navigation (e.g., fly-through) and more com-puting performance. Moreover, the added third dimension must be exploited intelligently, for it istoo easy to generate nice looking 3D boxes.
2. Interactivity. Direct-manipulation interfaces which allow for several kinds ofdirect interactionsare known to be more user-friendly than others. They effectively reduce the latency between theperception of something of interest and the following investigation performed by the user. The usernaturally wants to click on the interface toreduce the distancebetween what he sees and what hethinks he sees. This translates to all kinds of interactions, like selecting, moving, removing, copying,inspecting, etc. visualized artifacts. We discuss this aspect in more detail later on.
3. Implementation. The decision whether to use or not a third party product (possibly a commercialone) has an impact on the implementation weight that the software visualization tool provider has.Naturally, third party and/or commercial products are more stable, faster and better documented,because the people that provide such products are more experienced and more engaged in graphicalissues. It is all too easy for a software visualization tool provider to shift his attention towards thevisualization part by providing nicer, faster and more colorful displays at the expense of semantics:Ultimately the goal of a software visualization tool is to provide meaningful information, and notonly nice displays, to the user. Therefore reusing graph visualization tools and libraries like Dotty,Grappa and GraphViz can break down the implementation time, but it can also introduce new prob-lems like lack of control, interactivity and customizability.
A visualization engine is merely a vehicle, and not the goal of a software visualization tool. In thatsense, although choosing the right engine is important, for the visualization tool the interface to the enginematters. The better-defined it is, the less time the tool provider spends on the engine. In our case we choseto use a lightweight engine which is easily extensible and which provides for all the necessary functionality.
One lesson learned is to choose the appropriate engine and to delegate the job of visualizing as much aspossible to the engine. Furthermore, the easier it is to visualize with an engine, the better. In case the toolprovider chooses to implement his own engine, we recommend to use a lightweight incremental approachand to strive to obtain visualizations as quickly as possible. Another lesson learned is that keeping as muchcontrol as possible over the visualization engine, in terms of implementation, helps to increase the usabilityof a software visualization tool. The first experiments we did with external engines soon reached a limit,because they were not customizable and flexible enough for our needs. Put in simple words, total (or asmuch as possible) control is necessary in this case.
A.3.4 The Metamodel
The metamodel used by a software visualization tool has an influence on its internal architecture. In somesoftware visualization tools there is no distinction between the metamodel and the internal architecture.This has the drawback that the tool has a monolithic architecture, and that the concern of the metamodelis not clearly separated from the other parts of the tool. The software visualization tool provider has aninterest in making this separation, since the metamodel comes with a considerable level of complexity thatshould not be added to a software visualization tool’s complexity. The reason for this complexity residesin concerns like the collection of information (parsing source code, reading and writing of files in variousexchange file formats and the storage and querying of this information (using databases, web browsers,etc.).
122
A.4. CONCLUSION 123
The general lesson is to separate metamodel concerns as much as possible from the implementation ofa software visualization tool. The software visualization tool must interface to a metamodel and reuse itsfunctionalities, but it should not be tied to it to prevent a mixing of concerns.
A.3.5 The Interactive Facilities
Modern computers allow for faster and more powerful displays, makingdirect-manipulationinterfacespossible, which allow the user to not only look at information on the screen, but to interact with it. Severalpublications and books in the human-computer-interface (HCI) field point out that it is essential to givethe user the possibility to ”play” with the displayed information. Since user interface design is not a topicof work we limit ourselves to point out its importance by citing some essential literature by Alan Cooper[COOP95, COOP99], Jef Raskin [RASK 00], and Jeff Johnson [JOHN 00].
The interactive facilities a software visualization tool provides heavily influence the quality of the toolin terms of reverse engineering. Storeyet al. provide a list of 14 cognitive design elements needed for areverse engineering process [STOR 99]. We deduce from that list that if a tool features direct manipulationit can facilitate navigation by providing directional and arbitrary navigation, while at the same time itreduces disorientation effects by reducing the effort for user-interface adjustment. Put in simple words wecan say that the user is more at ease with a tool that supports interactive visualizations.
At the implementation level the problem of interactivity is that it is a cross-cutting concern,i.e., interac-tivity must be provided by all parts of the system: the visualization engine provides graphical interactivity,while the internal architecture (and the metamodel) provide context-based interactivity. A simple exam-ple are pop-up menus, which offer choices at a graphical level (delete figure, spawn window, ...) but alsocontext-based choices (dive into a class node, inspect the senders of a method node, ...). In our case wehave seen that the overall bridge architecture is able to cope with this problem: the context menu on a figureis built in succession by the figure, its facade, its item and its plugin, and then presented to the user. Othersolutions to this problem is to separate interactive facilities into separate classes and offer them as plugins.
A.4 Conclusion
In this chapter we have presented the internal architecture of a software visualization tool and have identi-fied common problems and issues that are inherent to such systems at various levels. The levels we havediscussed include the overall architecture, the internal architecture, the visualization engine, the metamodeland the interactive facilities of software visualization tools.
• The overall architecture. An overall architecture which separates the three main parts (core, meta-model, visualization engine) of a software visualization tool allows for higher flexibility and greaterextensibility. At the same time the software visualization tool becomes less vulnerable against soft-ware evolution processes.
• The core / internal architecture. The design of the core of a software visualization tool is largelyguided by the goals the tool provider has in mind. Although the notion of a graph consisting of nodesand edges seems trivial, the functionality that matters is the one added to this core and the way thisfunctionality can be used by the tool’s users. In the case of CodeCrawler we have seen that there isa separation of the graph notion from a parallel, extensible, plugin hierarchy. This separation allowsfor a great extensibility through subclassing and addition of functionality.
• The visualization engine.The visualization engine’s main task is bring the visualizations of soft-ware to the screen. However, the degree of integration between a software visualization tool’s coreand its visualization engine influences the quality of the visualizations. Apart from providing protec-tion mechanisms against changes in the visualization engine, the engine is also largely responsible forthe level of interactivity a software visualization tool offers. Seen in this light we do not recommendcommercial (black-box) products, but favor white-box products whose classes can easily be reusedby delegation or subclassing. In the case of CodeCrawler we protect it against changes by using a
123
124 APPENDIX A. CODECRAWLER - IMPLEMENTATION
facade [GAMM 95] and use and extend a freeware, lightweight visualization framework called Hot-Draw. Note that some visualization engines provide a graph layout library as well. We recommendto use such libraries, because they can greatly reduce the complexity of a software visualization tool.
• The metamodel. The metamodel’s task is to collect and store the data that is visualized by thesoftware visualization tool. We recommend the separation of the metamodel from the software visu-alization tool in order to keep the focus on the core functionalities of the software visualization tool.The metamodel can be developed by someone else than the tool provider that has more experiencein that area. To make an example, the software visualization tool provider should not have to write aparser by himself, but reuse the existing parsers.
• The interactive facilities. Providing interactive facilities to the viewer is essential to the qualityof a software visualization tool. While at a purely technical level this should be provided by thevisualization engine, the interactions that are enriched with context information are often providedby the the domain model,i.e., the internal architecture of the software visualization tool.
124

Bibliography
[Car 99] S. K. Card, J. D. Mackinlay, and B. Shneiderman, editors. Readings in Information Visual-ization - Using Vision to Think. Morgan Kaufmann, 1999.(pp 11, 54)
[Duc 99] S. Ducasse and S. Demeyer, editors. The FAMOOS Object-Oriented Reengineering Hand-book. University of Bern, October 1999.(pp 13, 57)
[A LPE 98] S. R. Alpert, K. Brown, and B. Woolf. The Design Patterns Smalltalk Companion. AddisonWesley, 1998. (p 32)
[BASI 87] V. Basili and R. Selby.Comparing the Effectiveness of Software Testing Strategies. IEEETransactions on Software Engineering, vol. 12, no. 12, pages 1278–1296, December 1987.(p 57)
[BASI 97] V. Basili. Evolving and Packaging Reading Technologies. Journal Systems and Software,vol. 38, no. 1, pages 3–12, 1997.(p 57)
[BATT 99] G. D. Battista, P. Eades, R. Tamassia, and I. G. Tolls. Graph Drawing - Algorithms for thevisualization of graphs. Prentice-Hall, 1999.(pp 18, 116)
[BECK 97] K. Beck. Smalltalk Best Practice Patterns. Prentice-Hall, 1997.(p 46)
[BECK 00] K. Beck. Extreme Programming Explained: Embrace Change. Addison Wesley, 2000.(p 3)
[BERT 74] J. Bertin. Graphische Semiologie. Walter de Gruyter, 1974.(pp 11, 21, 59, 62, 93, 113)
[BRAN 95] J. Brant. HotDraw. Master’s thesis, University of Illinois at Urbana-Chanpaign, 1995.(p 115)
[BROW 91] M. H. Brown.ZEUS: A System for Algorithm Animation and Multi-view Editing. In Proceed-ings of the 1991 IEEE Workshop on Visual Languages, pages 4–9, October 1991.(p 54)
[BURD 99] E. Burd and M. Munro.An Initial Approach towards Measuring and Characterizing SoftwareEvolution. In Proceedings of the Working Conference on Reverse Engineering, WCRE’99,pages 168–174, 1999.(p 103)
[CASA 97] E. Casais and A. Taivalsaari.Object-Oriented Software Evolution and Re-engineering (Spe-cial Issue). Theory and Practice of Object Systems (TAPOS), vol. 3, no. 4, pages 233–301,1997. (p 57)
[CASA 98] E. Casais. Re-Engineering Object-Oriented Legacy Systems. Journal of Object-OrientedProgramming, vol. 10, no. 8, pages 45–52, January 1998.(pp 1, 7, 10)
[CHID 94] S. R. Chidamber and C. F. Kemerer.A Metrics Suite for Object Oriented Design. IEEETransactions on Software Engineering, vol. 20, no. 6, pages 476–493, June 1994.(pp 17,21)
[CHIK 90] E. J. Chikofsky and J. H. Cross, II.Reverse Engineering and Design Recovery: A Taxonomy.IEEE Software, pages 13–17, January 1990.(pp 1, 8, 10, 13)
125
126 BIBLIOGRAPHY
[COCK 01] A. Cockburn. Agile Software Development. Addison Wesley, 2001.(p 3)
[CONS 93] M. P. Consens and A. O. Mendelzon.Hy+: A Hygraph-based Query and VisualisationSystem. In Proceeding of the 1993 ACM SIGMOD International Conference on ManagementData, SIGMOD Record Volume 22, No. 2, pages 511–516, 1993.(pp 54, 92)
[COOP95] A. Cooper. About Face - The Essentials of User Interface Design. Hungry Minds, 1995.(pp 56, 123)
[COOP99] A. Cooper. The Inmates are running the Asylum. SAMS, 1999.(p 123)
[CORB 89] T. Corbi. Program Understanding: Challenge for the 1990s. IBM Systems Journal, vol. 28,no. 2, pages 294–306, 1989.(p 57)
[CROS98] J. H. Cross II, S. Maghsoodloo, and D. Hendrix.Control Structure Diagrams: Overview andEvaluation. Journal of Empirical Software Engineering, vol. 3, no. 2, pages 131–158, 1998.(pp 59, 92)
[DAVI 95] A. M. Davis. 201 Principles of Software Development. McGraw-Hill, 1995.(pp 1, 7, 57)
[DEKE 02] U. Dekel.Applications of Concept Lattices to Code Inspection and Review. Research report,Department of Computer Science, Technion, 2002.(pp 9, 57, 59)
[DEME 99a] S. Demeyer and S. Ducasse.Metrics, Do They Really Help?In J. Malenfant, editor, Pro-ceedings LMO’99 (Languages et Modelesa Objets), pages 69–82. HERMES Science Publi-cations, Paris, 1999. (p 54)
[DEME 99b] S. Demeyer, S. Ducasse, and M. Lanza.A Hybrid Reverse Engineering Platform Combin-ing Metrics and Program Visualization. In F. Balmas, M. Blaha, and S. Rugaber, editors,Proceedings WCRE’99 (6th Working Conference on Reverse Engineering). IEEE, October1999. (p 113)
[DEME 99c] S. Demeyer, S. Ducasse, and S. Tichelaar.Why Unified is not Universal. UML Shortcom-ings for Coping with Round-trip Engineering. In B. Rumpe, editor, Proceedings UML’99(The Second International Conference on The Unified Modeling Language), volume 1723 ofLNCS, Kaiserslautern, Germany, October 1999. Springer-Verlag.(p 118)
[DEME 01] S. Demeyer, S. Tichelaar, and S. Ducasse.FAMIX 2.1 – The FAMOOS Information ExchangeModel. Research report, University of Bern, 2001.(pp 13, 58, 61, 115, 117)
[DEME 02] S. Demeyer, S. Ducasse, and O. Nierstrasz. Object-Oriented Reengineering Patterns. MorganKaufmann, 2002. (pp 1, 8, 9, 13, 23, 77, 89)
[DUCA 99] S. Ducasse, M. Rieger, and S. Demeyer.A Language Independent Approach for DetectingDuplicated Code. In H. Yang and L. White, editors, Proceedings ICSM’99 (InternationalConference on Software Maintenance), pages 109–118. IEEE, September 1999.(p 25)
[DUCA 00] S. Ducasse, M. Lanza, and S. Tichelaar.Moose: an Extensible Language-Independent Envi-ronment for Reengineering Object-Oriented Systems. In Proceedings of the Second Interna-tional Symposium on Constructing Software Engineering Tools (CoSET 2000), June 2000.(pp 13, 95, 115, 117)
[DUCA 01a] S. Ducasse and M. Lanza.Towards a Methodology for the Understanding of Object-OrientedSystems. Technique et science informatiques, vol. 20, no. 4, pages 539–566, 2001.(pp 25,113)
[DUCA 01b] S. Ducasse, M. Lanza, and S. Tichelaar.The Moose Reengineering Environment. SmalltalkChronicles, August 2001. (pp 115, 117)
126
BIBLIOGRAPHY 127
[EICK 92] S. G. Eick, J. L. Steffen, and S. Eric E., Jr.SeeSoft—A Tool for Visualizing Line OrientedSoftware Statistics. IEEE Transactions on Software Engineering, vol. 18, no. 11, pages 957–968, November 1992. (pp 54, 92)
[FAVR 01] J.-M. Favre. GSEE: a Generic Software Exploration Environment. In Proceedings of the9th International Workshop on Program Comprehension, pages 233–244. IEEE, Mai 2001.(p 54)
[FENT 96] N. Fenton and S. L. Pfleeger. Software Metrics: A Rigorous and Practical Approach. In-ternational Thomson Computer Press, London, UK, Second edition, 1996.(pp 12, 16, 17,54)
[FIOR 98a] F. Fioravanti, P. Nesi, and S. Perli.Assessment of System Evolution Through Characteri-zation. In ICSE’98 Proceedings (International Conference on Software Engineering). IEEEComputer Society, 1998. (p 54)
[FIOR 98b] F. Fioravanti, P. Nesi, and S. Perli.A Tool for Process and Product Assessment of C++Applications. In CSMR’98 Proceedings (Euromicro Conference on Software Maintenanceand Reengineering). IEEE Computer Society, 1998.(p 54)
[FOWL 99] M. Fowler, K. Beck, J. Brant, W. Opdyke, and D. Roberts. Refactoring: Improving theDesign of Existing Code. Addison Wesley, 1999.(pp 46, 100)
[GALL 97] H. Gall, M. Jazayeri, R. R. Klosch, and G. Trausmuth.Software Evolution ObservationsBased on Product Release History. In Proceedings of the International Conference on Soft-ware Maintenance 1997 (ICSM’97), pages 160–166, 1997.(p 103)
[GALL 98] H. Gall, K. Hajek, and M. Jazayeri.Detection of Logical Coupling Based on Product ReleaseHistory. In Proceedings of the International Conference on Software Maintenance 1998(ICSM’98), pages 190–198, 1998.(p 103)
[GAMM 95] E. Gamma, R. Helm, R. Johnson, and J. Vlissides. Design Patterns. Addison Wesley, Read-ing, Mass., 1995. (pp 2, 29, 30, 32, 39, 58, 59, 66, 67, 76, 88, 98, 115, 124)
[HEND 96] B. Henderson-Sellers. Object-Oriented Metrics: Measures of Complexity. Prentice-Hall,1996. (pp 12, 16, 17, 54)
[HEND 02] D. Hendrix, J. H. Cross II, and S. Maghsoodloo.The Effectiveness of Control StructureDiagrams in Source Code Comprehension Activities. IEEE Transactions on Software Engi-neering, vol. 28, no. 5, pages 463 – 477, may 2002.(pp 9, 57, 59, 92)
[H IGG 87] D. A. Higgins and N. Zvegintzov. Data Structured Software Maintenance: The Warnier/OrrApproach. Dorset House, January 1987.(p 92)
[HOLT 96] R. C. Holt and J. Pak.GASE: Visualizing Software Evolution-in-the-Large. In Proceedingsof WCRE’96, pages 163–167, 1996.(p 102)
[HOLT 00] R. C. Holt, A. Winter, and A. Schurr. GXL: Towards a Standard Exchange Format. InProceedings WCRE’00, November 2000.(p 115)
[I NGA 97] D. Ingalls, T. Kaehler, J. Maloney, S. Wallace, and A. Kay.Back to the Future: The Story ofSqueak, A Practical Smalltalk Written in Itself. In Proceedings OOPSLA’97, pages 318–326,November 1997. (p 59)
[JAZA 99] M. Jazayeri, H. Gall, and C. Riva.Visualizing Software Release Histories: The Use of Colorand Third Dimension. In ICSM’99 Proceedings (International Conference on Software Main-tenance). IEEE Computer Society, 1999.(pp 10, 103)
[JERD 97] D. J. Jerding, J. T. Stansko, and T. Ball.Visualizing Interactions in Program Executions. InProceedings of ICSE’97, pages 360–370, 1997.(pp 9, 54, 92)
127
128 BIBLIOGRAPHY
[JOHN 92] R. E. Johnson.Documenting Frameworks using Patterns. In Proceedings OOPSLA ’92,pages 63–76, October 1992.(p 115)
[JOHN 00] J. Johnson. GUI Bloopers. Morgan Kaufmann, 2000.(p 123)
[K AZM 95] R. Kazman and M. Burth.Assessing Architectural Complexity. Research report, Universityof Waterloo, 1995. (p 54)
[K AZM 99] R. Kazman and S. J. Carriere.Playing detective: Reconstructing software architecture fromavailable evidence.Automated Software Engineering, April 1999.(p 92)
[K LEY 88] M. F. Kleyn and P. C. Gingrich.GraphTrace – Understanding Object-Oriented Systems UsingConcurrently Animated Views. In Proceedings OOPSLA ’88, pages 191–205, November1988. (pp 54, 57, 59, 92)
[K LIM 96] E. J. Klimas, S. Skublics, and D. A. Thomas. Smalltalk with Style. Prentice-Hall, 1996.(pp 47, 82)
[K ONI 01] G. G. Koni-N’sapu. A Scenario Based Approach for Refactoring Duplicated Code in ObjectOriented Systems. Diploma thesis, University of Bern, June 2001.(p 101)
[L ANG 95] D. B. Lange and Y. Nakamura.Interactive Visualization of Design Patterns can help inFramework Understanding. In Proceedings of OOPSLA’95, pages 342–357. ACM Press,1995. (pp 54, 57, 59, 67, 92)
[L ANZ 99] M. Lanza. Combining Metrics and Graphs for Object Oriented Reverse Engineering.Diploma thesis, University of Bern, October 1999.(pp 16, 18, 25, 113, 114)
[L ANZ 01a] M. Lanza and S. Ducasse.A Categorization of Classes based on the Visualization of theirInternal Structure: the Class Blueprint. In Proceedings of OOPSLA 2001, pages 300–311,2001. (pp 94, 113)
[L ANZ 01b] M. Lanza.The Evolution Matrix: Recovering Software Evolution using Software Visualiza-tion Techniques. In Proceedings of IWPSE 2001 (International Workshop on Principles ofSoftware Evolution), pages 37 – 42, 2001.(p 95)
[L ANZ 03] M. Lanza. CodeCrawler - Lessons Learned in Building a Software Visualization Tool. InProceedings of CSMR 2003, page to be published. IEEE Press, 2003.(p 3)
[L EHM 85] M. M. Lehman and L. Belady. Program Evolution - Processes of Software Change. LondonAcademic Press, 1985.(pp 3, 7)
[L EWE 98] C. Lewerentz and F. Simon.A Product Metrics Tool Integrated into a Software DevelopmentEnvironment. In Object-Oriented Technology Ecoop’98 Workshop Reader, volume 1543 ofLNCS, pages 256–257, 1998.(p 54)
[L IEB 89] K. J. Lieberherr and A. J. Riel.Contributions to Teaching Object Oriented Design and Pro-gramming. In Proceedings OOPSLA ’89, ACM SIGPLAN Notices, pages 11–22, October1989. (p 77)
[L ITT 96] D. Littman, J. Pinto, S. Letovsky, and E. Soloway.Mental Models and Software Maintenance.In Soloway and Iyengar, editors, Empirical Studies of Programmers, First Workshop, pages80–98, 1996. (pp 4, 58, 92)
[L ORE 94] M. Lorenz and J. Kidd. Object-Oriented Software Metrics: A Practical Guide. Prentice-Hall,1994. (pp 12, 16, 54)
[L OUN 98] H. Lounis, H. A. Sahraoui, and W. L. Melo.Vers un modele de prediction de la qualite dulogiciel pour les systemesa objets. L’Objet, Numero special Metrologie et Objets, vol. 4,no. 4, December 1998.
128
BIBLIOGRAPHY 129
[M.-A 01] C. B. M.-A. D. Storey and J. Michaud.SHriMP Views: An Interactive and CustomizableEnvironment for Software Exploration. In Proceedings of International Workshop on ProgramComprehension (IWPC ’2001), 2001.(p 12)
[M AYR 96] J. Mayrand, C. Leblanc, and E. M. Merlo.Experiment on the Automatic Detection of Func-tion Clones in a Software System Using Metrics. In International Conference on SoftwareSystem Using Metrics, pages 244–253, 1996.(p 54)
[M END 95] A. Mendelzon and J. Sametinger.Reverse Engineering by Visualizing and Querying. Soft-ware - Concepts and Tools, vol. 16, pages 170–182, 1995.(pp 57, 59, 92)
[M U 86] H. A. Muller. Rigi - A Model for Software System Construction, Integration, and Evaluationbased on Module Interface Specifications. PhD thesis, Rice University, 1986. (pp 3, 9, 54,56)
[NASS 73] I. Nassi and B. Shneiderman.Flowchart Techniques for Structured Programming. SIGPLANNotices, vol. 8, no. 8, August 1973.(p 92)
[PARN 94] D. L. Parnas. Software Aging. In Proceedings of International Conference on SoftwareEngineering, 1994. (pp 1, 7, 9)
[PAUW 93] W. D. Pauw, R. Helm, D. Kimelman, and J. Vlissides.Visualizing the Behavior of Object-Oriented Systems. In Proceedings OOPSLA ’93, pages 326–337, October 1993.(pp 54,92)
[PAUW 99] W. D. Pauw and G. Sevitsky.Visualizing Reference Patterns for Solving Memory Leaks inJava. In R. Guerraoui, editor, Proceedings ECOOP’99, volume 1628 ofLNCS, pages 116–134, Lisbon, Portugal, June 1999. Springer-Verlag.(pp 54, 92)
[PETR 95] M. Petre.Why looking isn’t always seeing: Readership skills and graphical programming.Communications of the ACM, vol. 38, no. 6, pages 33–44, June 1995.(p 58)
[PINK 97] S. Pinker. How the Mind Works. W. W. Norton, 1997.(p 118)
[PRIC 93] B. A. Price, R. M. Baecker, and I. S. Small.A Principled Taxonomy of Software Visualization.Journal of Visual Languages and Computing, vol. 4, no. 3, pages 211–266, 1993.(pp 54,92, 115)
[RAJL 00] V. Rajlich and K. Bennett.A Staged Model for the Software Life Cycle. IEEE Computer,vol. 33, no. 7, pages 66 – 71, 2000.(p 8)
[RASK 00] J. Raskin. The Humane Interface. Addison Wesley, 2000.(p 123)
[RAYS 98] D. Rayside, S. Kerr, and K. Kontogiannis.Change and Adaptive Maintenance Detection inJava Software Systems. In Proceedings of WCRE’98, pages 10–19. IEEE Computer Society,1998. (p 102)
[REIS 90] S. P. Reiss.Interacting with the FIELD environment. Software - Practice and Experience,vol. 20, pages 89–115, 1990.(pp 54, 92)
[RICH 99] T. Richner and S. Ducasse.Recovering High-Level Views of Object-Oriented Applicationsfrom Static and Dynamic Information. In H. Yang and L. White, editors, ProceedingsICSM’99 (International Conference on Software Maintenance), pages 13–22. IEEE, Septem-ber 1999. (pp 2, 9, 54, 92)
[RICH 02] T. Richner and S. Ducasse.Using Dynamic Information for the Iterative Recovery of Col-laborations and Roles. In Proceedings of ICSM’2002 (International Conference on SoftwareMaintenance), October 2002.(pp 9, 54)
[RIEL 96] A. J. Riel. Object-Oriented Design Heuristics. Addison Wesley, 1996.(pp 20, 31, 89, 100)
129
130 BIBLIOGRAPHY
[RIVA 98] C. Riva. Visualizing Software Release Histories: The Use of Color and Third Dimension.Master’s thesis, Politecnico di Milano, Milan, 1998.(pp 103, 109)
[ROBE 97] D. Roberts, J. Brant, and R. E. Johnson.A Refactoring Tool for Smalltalk. Theory andPractice of Object Systems (TAPOS), vol. 3, no. 4, pages 253–263, 1997.(p 20)
[RUGA 98] S. Rugaber and J. White.Restoring a Legacy: Lessons Learned. IEEE Software, vol. 15,no. 4, pages 28–33, July 1998.(pp 1, 7)
[SAHR 00] H. A. Sahraoui, M. Boukadoum, H. Lounis, and F. Etheve. Predicting Class Libraries In-terface Evolution: an investigation into machine learning approaches. In Proceedings of 7thAsia-Pacific Software Engineering Conference, 2000.(p 104)
[SCHW 02] D. Schweizer. Navigation in Object-Oriented Reverse Engineering. Diploma thesis, Univer-sity of Bern, June 2002. (p 119)
[SOMM 00] I. Sommerville. Software Engineering. Addison Wesley, Sixth edition, 2000.(pp 1, 7, 57)
[STAS 90] J. T. Stasko.TANGO: A Framework and System for Algorithm Animation. IEEE Computer,vol. 23, no. 9, pages 27–39, September 1990.(p 92)
[STEI 01] L. Steiger. Recovering the Evolution of Object Oriented Software Systems Using a FlexibleQuery Engine. Diploma thesis, University of Bern, June 2001.(p 101)
[STEY 96] P. Steyaert, C. Lucas, K. Mens, and T. D’Hondt.Reuse Contracts: Managing the Evolution ofReusable Assets. In Proceedings of OOPSLA ’96 Conference, pages 268–285. ACM Press,1996. (p 102)
[STOR 95] M.-A. D. Storey and H. A. Muller. Manipulating and documenting software structures usingSHriMP views. In Proceedings of the 1995 International Conference on Software Mainte-nance, 1995. (pp 3, 9, 54, 92)
[STOR 97] M.-A. D. Storey, K. Wong, and H. A. Muller. How Do Program Understanding Tools AffectHow Programmers Understand Programs?In I. Baxter, A. Quilici, and C. Verhoef, edi-tors, Proceedings Fourth Working Conference on Reverse Engineering, pages 12–21. IEEEComputer Society, 1997. (p 12)
[STOR 98] M.-A. D. Storey. A Cognitive Framework for Describing and Evaluating Software Explo-ration Tools. PhD thesis, Simon Fraser University, dec 1998.(p 12)
[STOR 99] M.-A. D. Storey, F. D. Fracchia, and H. A. Muller. Cognitive Design Elements to Support theConstruction of a Mental Model during Software Exploration. Journal of Software Systems,vol. 44, pages 171–185, 1999.(pp 1, 8, 22, 55, 118, 123)
[T ICH 01] S. Tichelaar.Modeling Object-Oriented Software for Reverse Engineering and Refactoring.PhD thesis, University of Berne, December 2001.(pp 13, 117, 118)
[T ILL 94] S. R. Tilley, K. Wong, M.-A. D. Storey, and H. A. Muller. Programmable Reverse Engin-nering. International Journal of Software Engineering and Knowledge Engineering, vol. 4,no. 4, pages 501–520, 1994.(p 92)
[TUFT 90] E. R. Tufte. Envisioning Information. Graphics Press, 1990.(pp 11, 59, 62, 93, 113)
[TUFT 97] E. R. Tufte. Visual Explanations. Graphics Press, 1997.(pp 11, 59, 113)
[TUFT 01] E. R. Tufte. The Visual Display of Quantitative Information. Graphics Press, 2nd edition,2001. (pp 16, 93, 113)
[VON 96] A. von Mayrhauser and A. Vans.Identification of Dynamic Comprehension Processes DuringLarge Scale Maintenance. IEEE Transactions on Software Engineering, vol. 22, no. 6, pages424–437, June 1996. (pp 4, 58, 92)
130

BIBLIOGRAPHY 131
[WARE 00] C. Ware. Information Visualization. Morgan Kaufmann, 2000.(pp 15, 54, 59, 93, 113)
[W ILD 92] N. Wilde and R. Huitt.Maintenance Support for Object-Oriented Programs. IEEE Trans-actions on Software Engineering, vol. SE-18, no. 12, pages 1038–1044, December 1992.(pp 1, 8, 10, 57, 59, 67)
[WOOL 98] B. Woolf.Null Object. In R. Martin, D. Riehle, and F. Buschmann, editors, Pattern Languagesof Program Design 3, pages 5–18. Addison Wesley, 1998.(p 91)
[WUYT ] R. Wuyts.StarBrowser. http://www.iam.unibe.ch/∼wuyts/StarBrowser/. (p 109)
[Sta 98] J. T. Stasko, J. Domingue, M. H. Brown, and B. A. Price, editors. Software Visualization -Programming as a Multimedia Experience. The MIT Press, 1998.(pp 11, 12, 21, 54, 92,113)
131
Curriculum Vitae
Personal Information
Name: Michele Lanza
Nationality: ItalianDate of Birth: April 3rd, 1973Place of Birth: Avellino, Italy
Education
1999 - 2003: Ph.D. in Computer Science in the Software Composition Group, University of Bern,SwitzerlandSubject of the Ph.D. thesis: “Object-Oriented Reverse Engineering - Coarse-grained,Fine-grained and Evolutionary Software Visualization”
1998 - 1999: Master in Computer Science in the Software Composition Group at the University ofBern, SwitzerlandSubject of the Master thesis: “Combining Metrics and Graphs for Object Oriented Re-verse Engineering”
1993 - 1997: Student in Computer Science at the University of Bern, SwitzerlandMinor in Mathematics at the University of Bern, SwitzerlandMinor in Micro-electronics at the University of Neuchatel, Switzerland
1989 - 1993: Linguistic Gymnasium in Aarau, Switzerland1979 - 1989: Primary Schools in Italy and Switzerland
132