Embed Size (px)
Citation preview

Disclaimer
Ich hatte eine großartige Präsentation geplant für heute ....
Aber, leider die meisten von Ihnen haben bereits gesehen.
Dies ist das zweite Mal, dass Herr Kriebel zwingt mich zu Schreiben Sie eine neue Präsentation ..... Was gibt's Freunde sind für ;-)
Agenda
• Characteristics of an Oracle workload on OpenVMS
• OpenVMS Optimization Techniques
• General Optimization Techniques
• Statspack / AWR reports
Who we are?
• Pledge to provide the highest level of technical consulting– No Results, no payment.
• Our staff contains former members of OpenVMS engineering
• Specialize in:– Performance Tuning (focusing on applications not only the
operating system)– Oracle & Oracle tuning (Oracle Partner)– Platform migration (Alpha to Integrity)– Custom engineering

Who we are?
• Serving mission critical customers all over the world, including the US, France, Germany, Switzerland, Israel, Belgium, Argentina, Italy & Sweden.
• Strong presence in Europe
• Germany is our #1 country in Europe
• Read some of our success stories: http://www.maklee.com/news.html
Oracle on OpenVMS
• Oracle is “just another” user mode application– (Almost) O/S agnostic– Data files compatible between platforms – Does not rely on OpenVMS specific mechanism (locking,
ASTs, etc.)
• Well tuned Oracle server would scale up nicely
Oracle on OpenVMS
• The following slides demonstrate the behavior of an Oracle server from an OpenVMS perspective.
• Alpha Server 32P GS1280 7/1300
• OpenVMS V8.3– 128GB RAM– 40GB SGA
• Server is running at 100% utilization– End of day processing
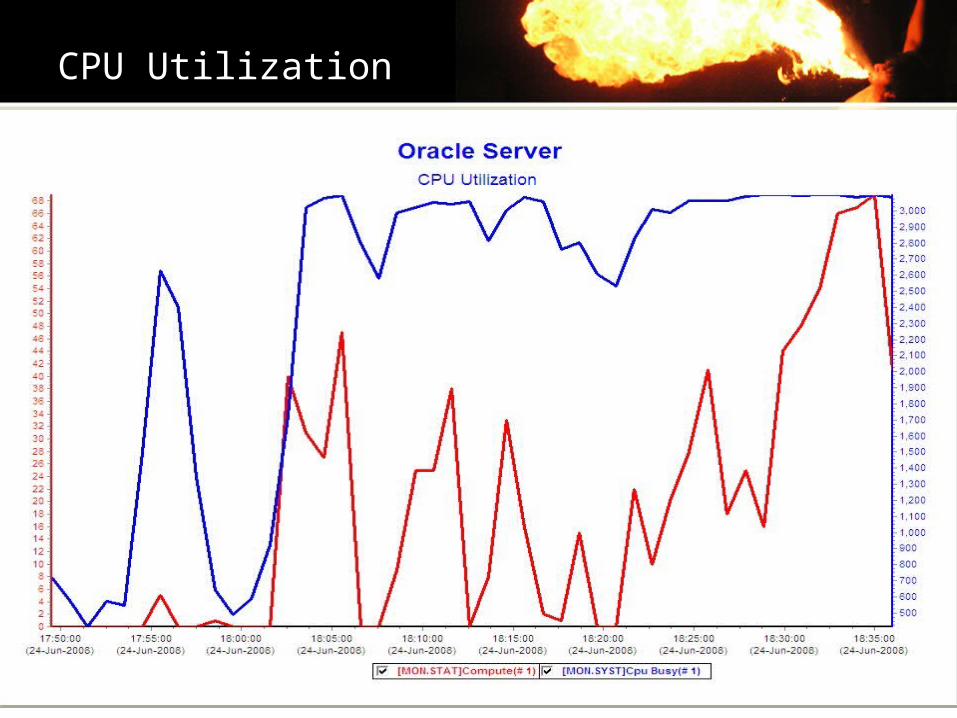
CPU Utilization
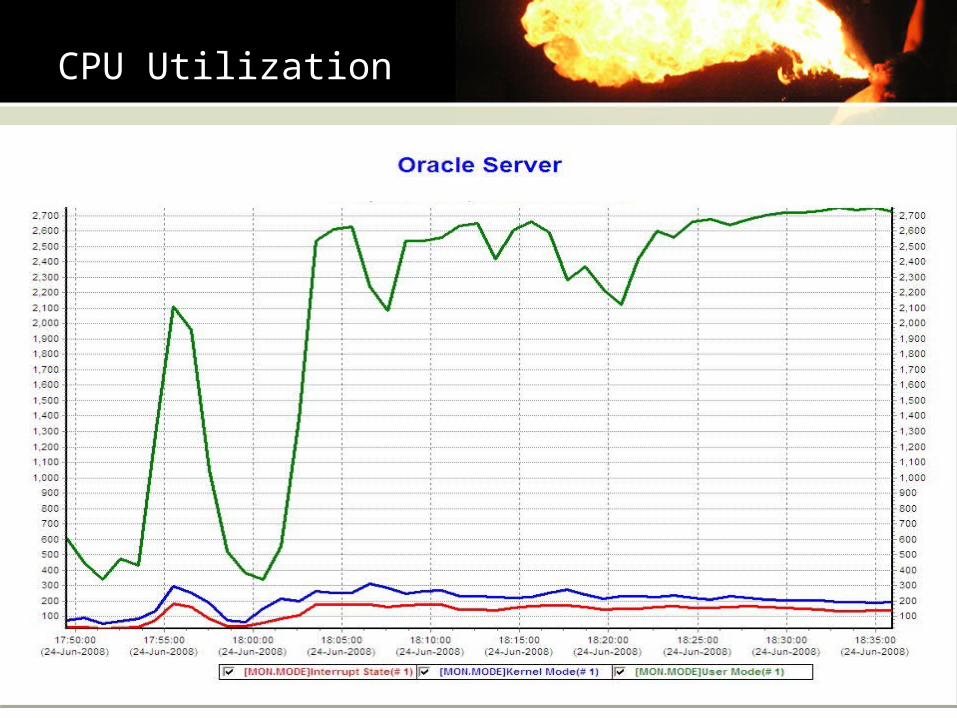
CPU Utilization
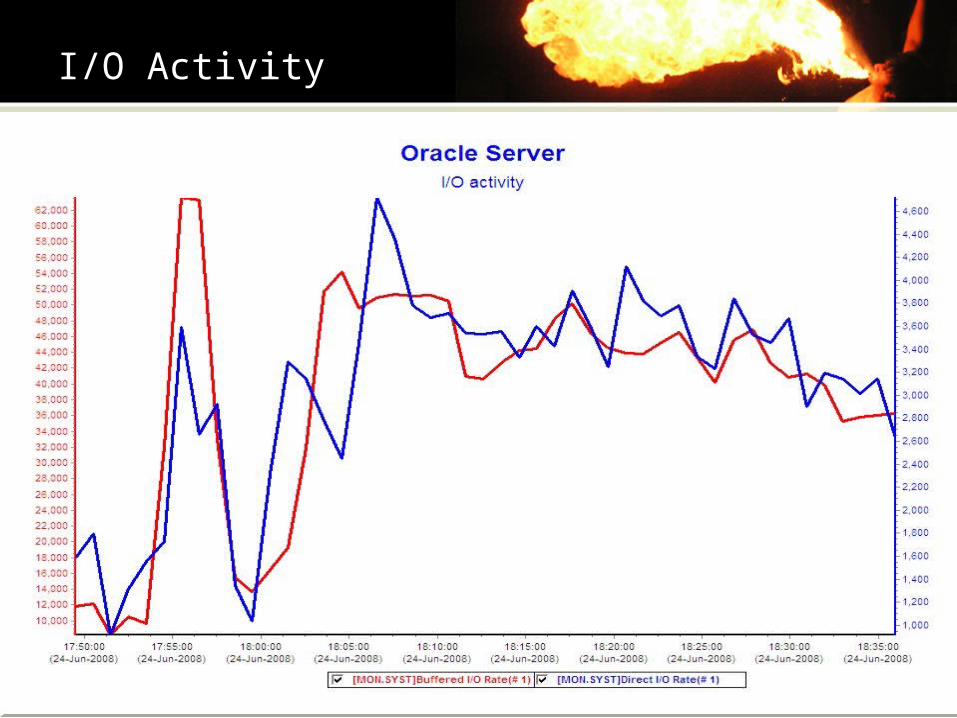
I/O Activity
I/O Activity
• A well tuned Oracle server does not perform many physical I/Os.
• Inspire to write-only physical I/Os – Quick quiz
• Which I/O operation is faster, read or write?
• Redo log files size & performance is critical
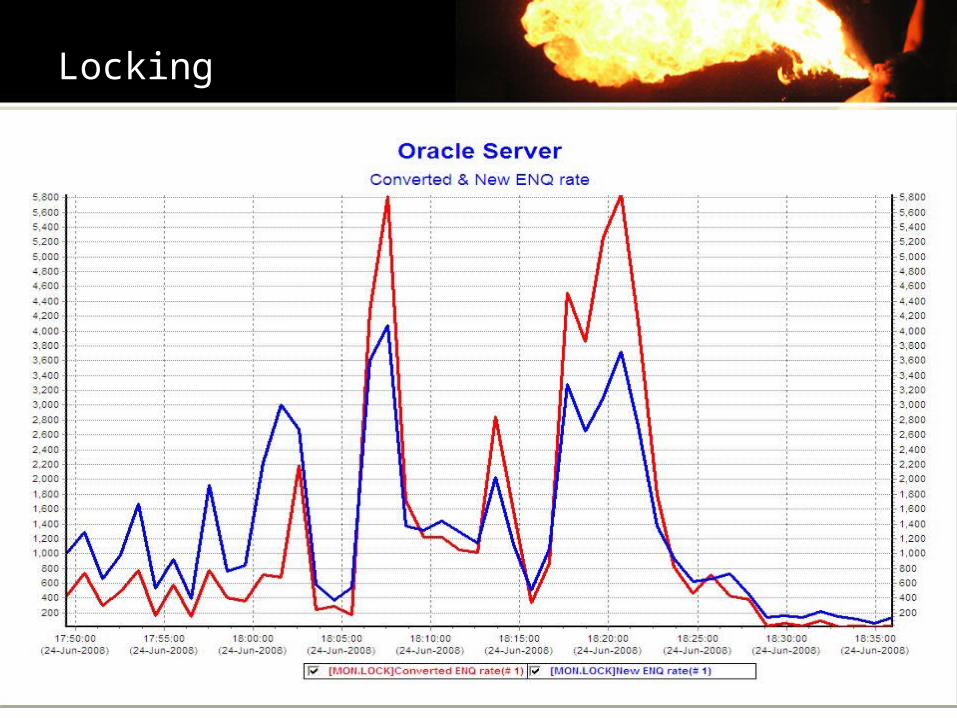
Locking
Locking
• Oracle implements it’s own locking mechanism.
• Locks are done in user mode.
• Dedicated lock manager is not required for an Oracle server.
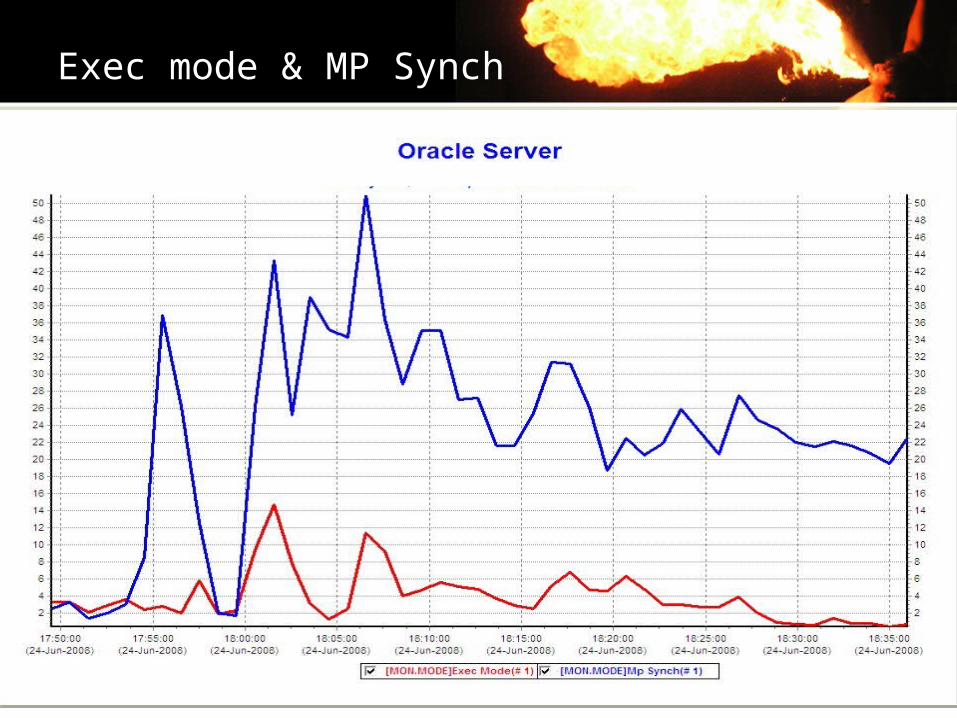
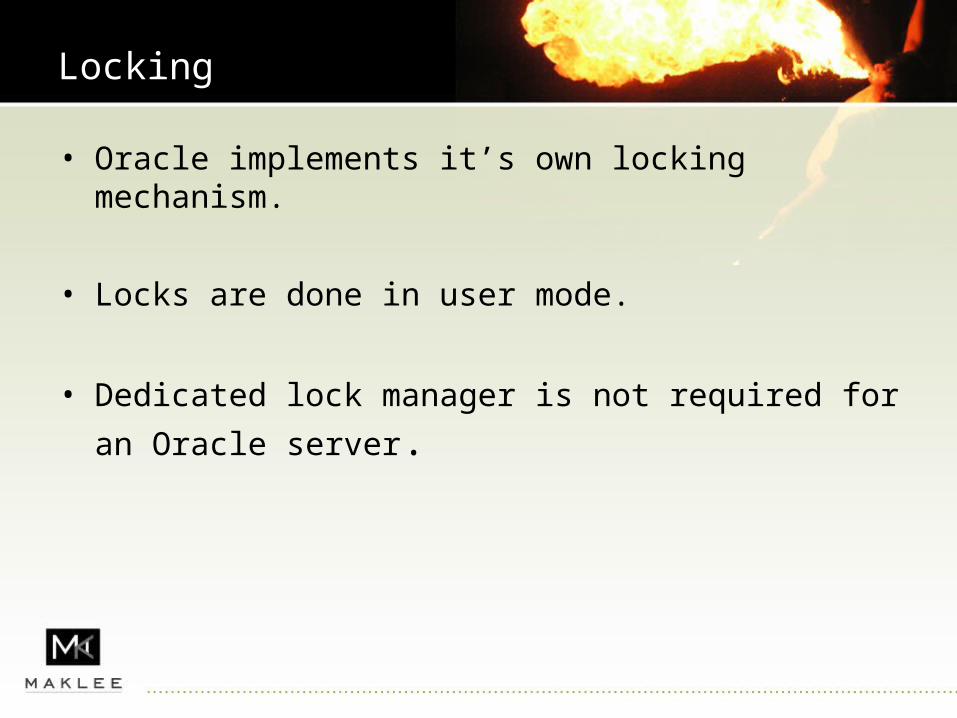
Exec mode & MP Synch
MP Synch
• MP Synch time is lost processor time– CPU A holding a spinlock while CPU B is forced to wait for
the same spinlock.
• MP Synch significantly impacts scaling – (in a bad way of course ;-)
• Oracle implements spinlocks in user mode as latches.– A process spins or sleeps when a latch is not available
• Typically a sign for:– Hot block in the database– One of the areas in the SGA is too small

OpenVMS Optimization Techniques
OpenVMS Optimization Techniques
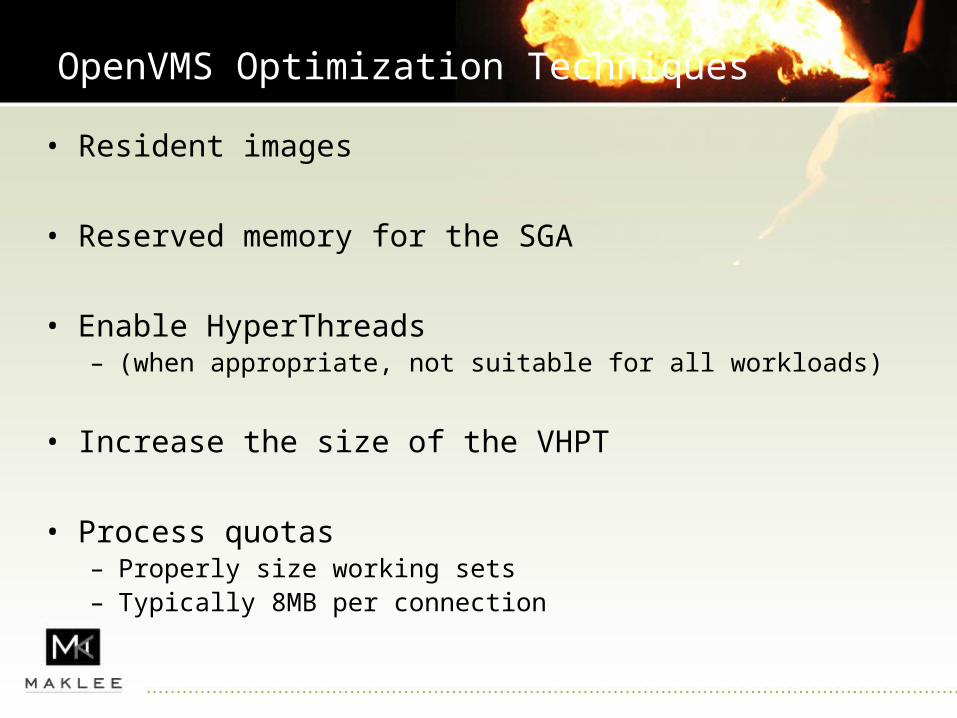
• Resident images
• Reserved memory for the SGA
• Enable HyperThreads – (when appropriate, not suitable for all workloads)
• Increase the size of the VHPT
• Process quotas– Properly size working sets– Typically 8MB per connection
VHPT Benchmark
• We have talked about this back in April but it is worth repeating…
• The following charts illustrate the impact of increasing the VHPT made on Oracle batch jobs
• rx6600 – 8 cores– OpenVMS V8.3-1H1– EVA8000– Oracle 10gR2– HyperThreads Enabled– 64 GB of physical memory
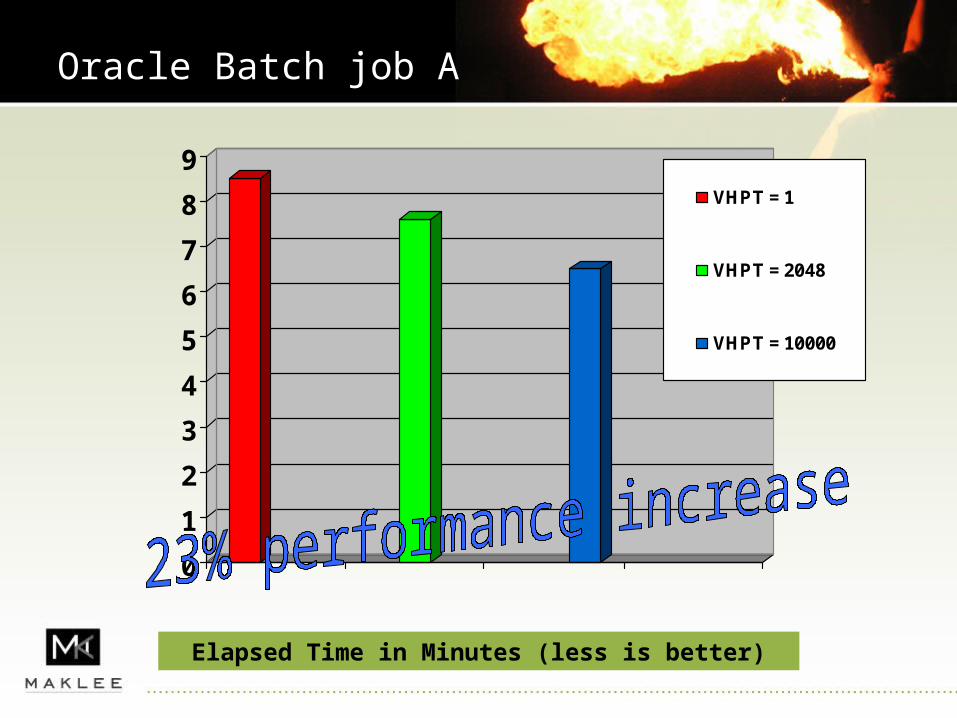
Oracle Batch job A
0
1
2
3
4
5
6
7
8
9VHPT = 1
VHPT = 2048
VHPT = 10000
Elapsed Time in Minutes (less is better)
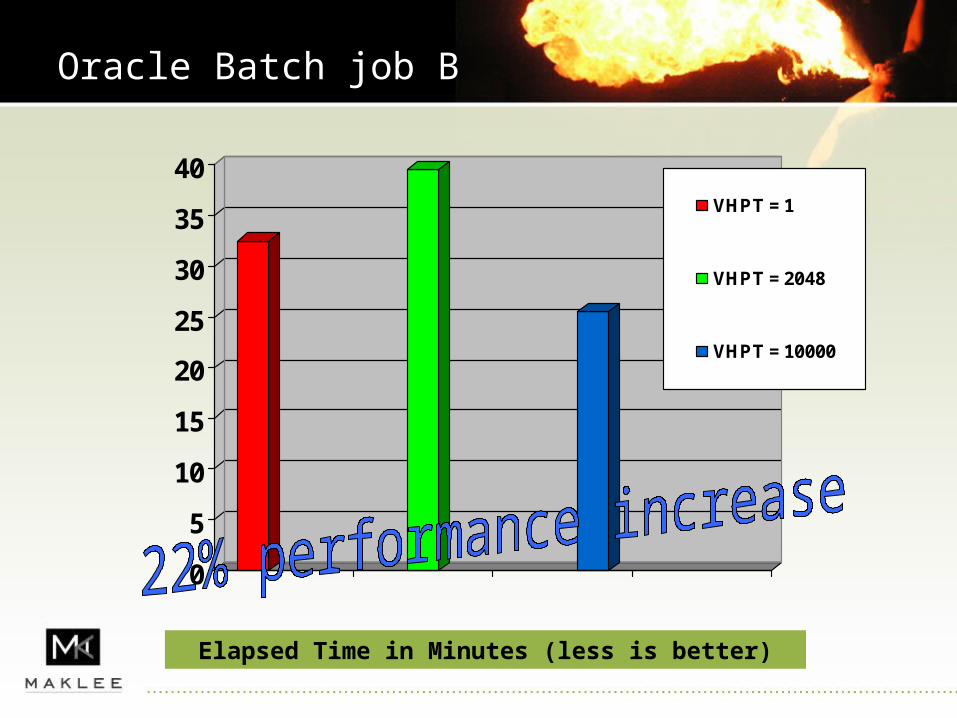
Oracle Batch job B
0
5
10
15
20
25
30
35
40VHPT = 1
VHPT = 2048
VHPT = 10000
Elapsed Time in Minutes (less is better)
Cluster interconnect Performance
• Oracle requires a dedicated cluster interconnect for RAC traffic.– Latency should be lower than 15ms
• Enabling Jumbo Frames is a must !
• OpenVMS achieved 0.5ms on– blades RAC (BL860)– V8.3-1H1– Gigabit Ethernet– Jumbo Frames enabled
Cluster interconnect Performance
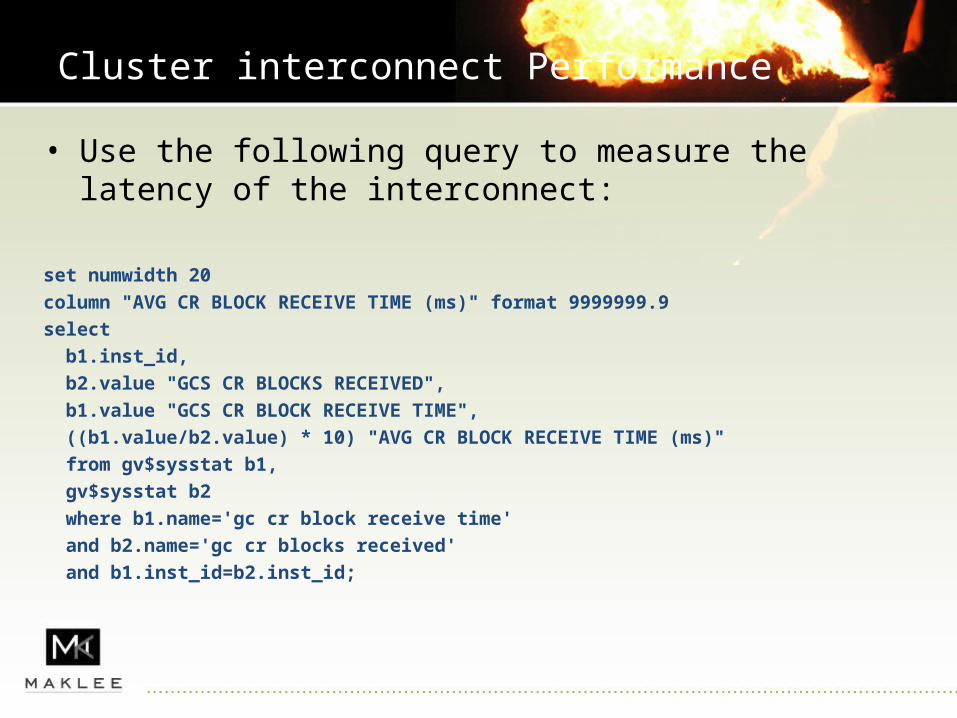
• Use the following query to measure the latency of the interconnect:
set numwidth 20
column "AVG CR BLOCK RECEIVE TIME (ms)" format 9999999.9
select
b1.inst_id,
b2.value "GCS CR BLOCKS RECEIVED",
b1.value "GCS CR BLOCK RECEIVE TIME",
((b1.value/b2.value) * 10) "AVG CR BLOCK RECEIVE TIME (ms)"
from gv$sysstat b1,
gv$sysstat b2
where b1.name='gc cr block receive time'
and b2.name='gc cr blocks received'
and b1.inst_id=b2.inst_id;
Cluster Interconnect performance
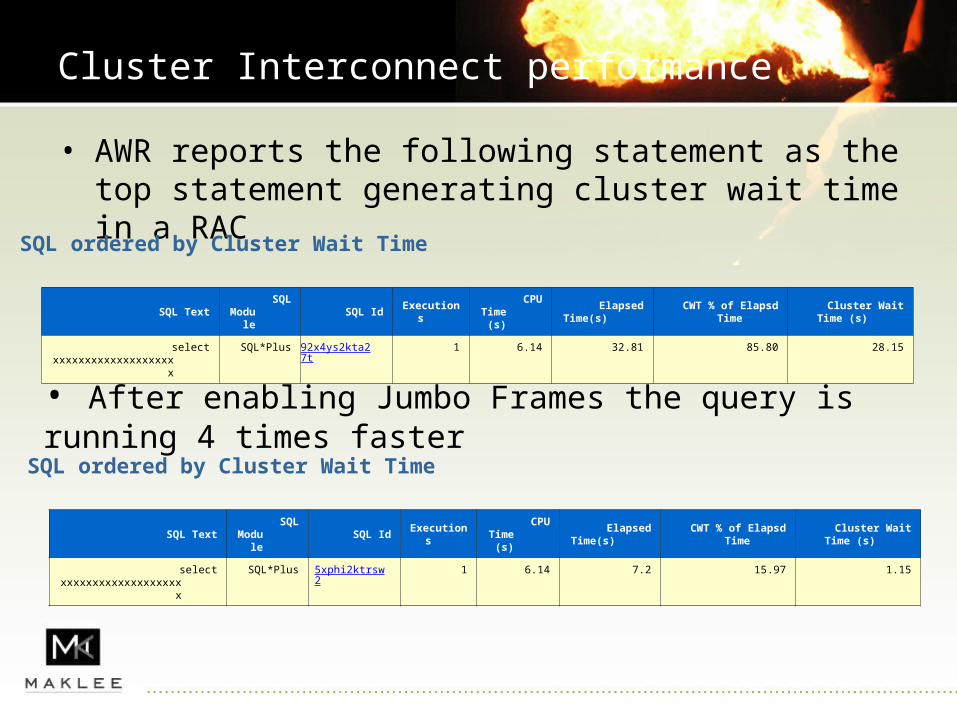
• AWR reports the following statement as the top statement generating cluster wait time in a RAC
SQL ordered by Cluster Wait Time
Cluster Wait Time (s)CWT % of Elapsd
TimeElapsed Time(s)CPU Time(s)ExecutionsSQL IdSQL ModuleSQL Text
28.1585.8032.816.14192x4ys2kta27tSQL*Plus select xxxxxxxxxxxxxxxxxxxx
SQL ordered by Cluster Wait Time
Cluster Wait Time (s)CWT % of Elapsd
TimeElapsed Time(s)CPU Time(s)ExecutionsSQL IdSQL ModuleSQL Text
1.1515.977.26.1415xphi2ktrsw2SQL*Plus select xxxxxxxxxxxxxxxxxxxx
• After enabling Jumbo Frames the query is running 4 times faster
Stay current
• OpenVMS V8.3-1H1 on Itanium
• OpenVMS V8.3 on Alpha
• Oracle 10.2.0.2 on both platforms
• Upgrade to 10.2.0.4 as soon as it will become available
10.2.0.4
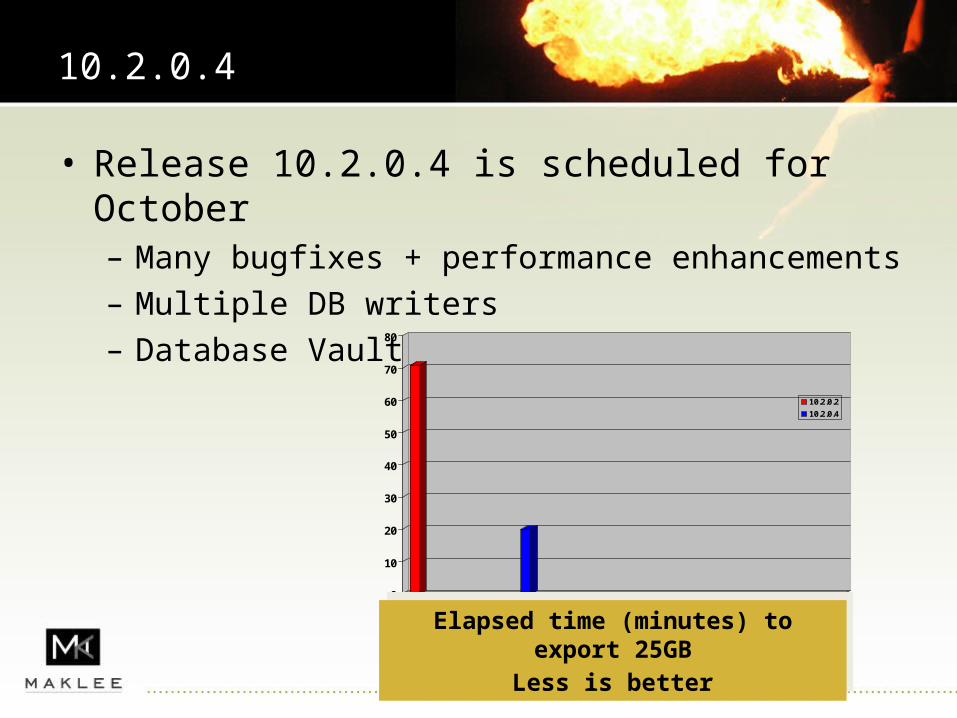
• Release 10.2.0.4 is scheduled for October– Many bugfixes + performance enhancements– Multiple DB writers– Database Vault
0
10
20
30
40
50
60
70
80
10.2.0.2
10.2.0.4
Elapsed time (minutes) to export 25GBLess is better
Elapsed time (minutes) to export 25GBLess is better
General Optimization Techniques
(not VMS specific)
System statistics
• Gathering schema statistics is a must. System statistics is equally important.
• Prior to 9i the CBO based it’s calculations on the number of I/O requests that would needed to satisfy a query.
• Starting with 9i, CPU cost has been added to the algorithm – Turned off by default unless system statistics available
• In Oracle 10g system statistics collects more information about I/O – New CPU speed– Seek time– Throughput
• Critical!! for certain optimization options in 10g
System statistics
• System statistics is common for all the nodes in the RAC– Do not collect system statistics if you are using a non
symmetrical hardware configuration.
• The information will be used by the CBO to produce better execution plans.
Missing Indexes
• It is a common knowledge that indexes are key to good database performance.
• With complex SQL statements, finding a missing index is not always trivial.
• Oracle DBMS_ADVISOR (introduced with Oracle 10.1) can assist in finding a missing index.– May be used with a representative workload or a single
statement.– Recommends indexes or materialized views.

Using DBMS_ADVISOR
• Create a directory for the results– SQLPLUS> CREATE OR REPLACE DIRECTORY advisor
AS '/ora_root/advisor_data’;– SQLPLUS> GRANT READ,WRITE ON DIRECTORY advisor TO PUBLIC;
• Execute the advisor against the target SQL statement
• SQLPLUS> EXECUTE dbms_advisor.quick_tune ( - DBMS_ADVISOR.SQLACCESS_ADVISOR, -task_name => 'TASK1', -attr1 => 'SELECT c2 FROM t1 WHERE c1 = :b1');
Using DBMS_ADVISOR
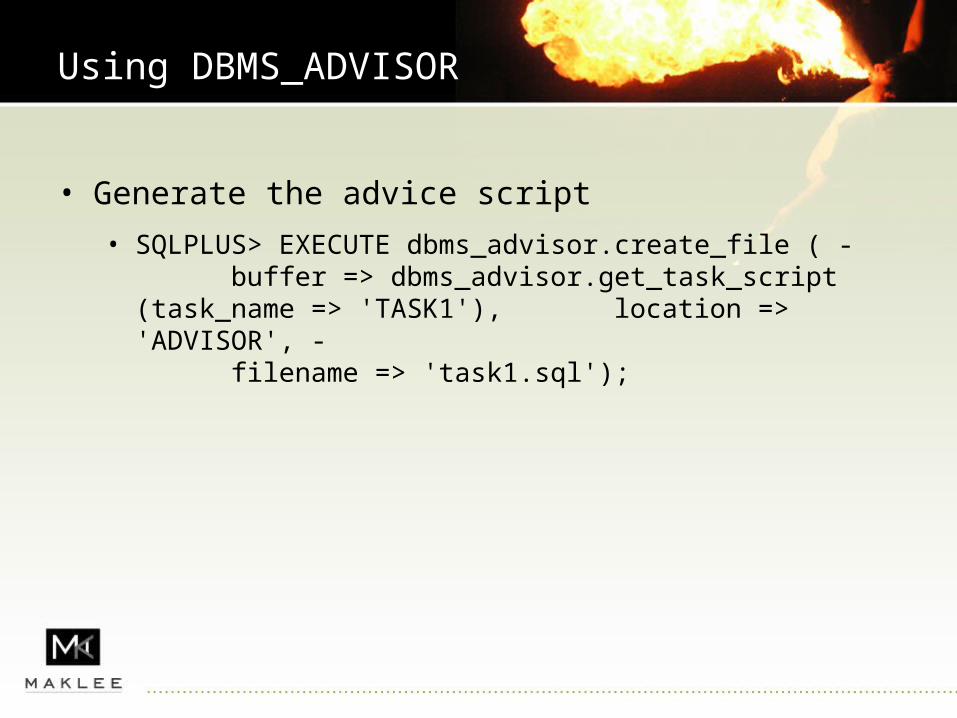
• Generate the advice script• SQLPLUS> EXECUTE dbms_advisor.create_file ( -
buffer => dbms_advisor.get_task_script (task_name => 'TASK1'), location => 'ADVISOR', -
filename => 'task1.sql');
Using DBMS_ADVISOR
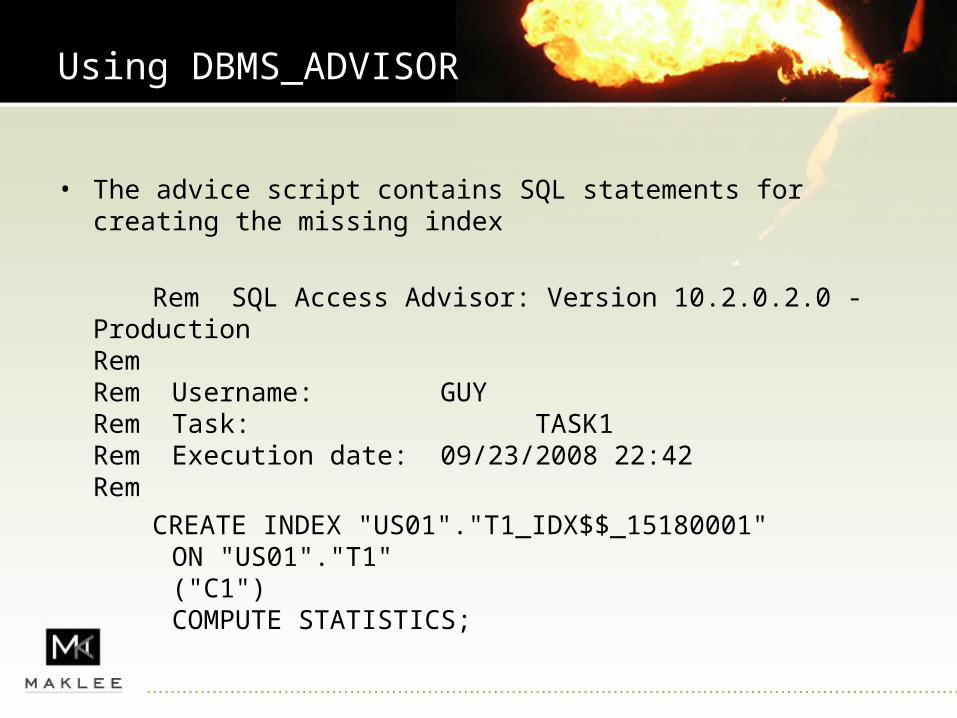
• The advice script contains SQL statements for creating the missing index
Rem SQL Access Advisor: Version 10.2.0.2.0 - ProductionRemRem Username: GUYRem Task: TASK1Rem Execution date: 09/23/2008 22:42Rem
CREATE INDEX "US01"."T1_IDX$$_15180001" ON "US01"."T1" ("C1") COMPUTE STATISTICS;
Unused Indexes
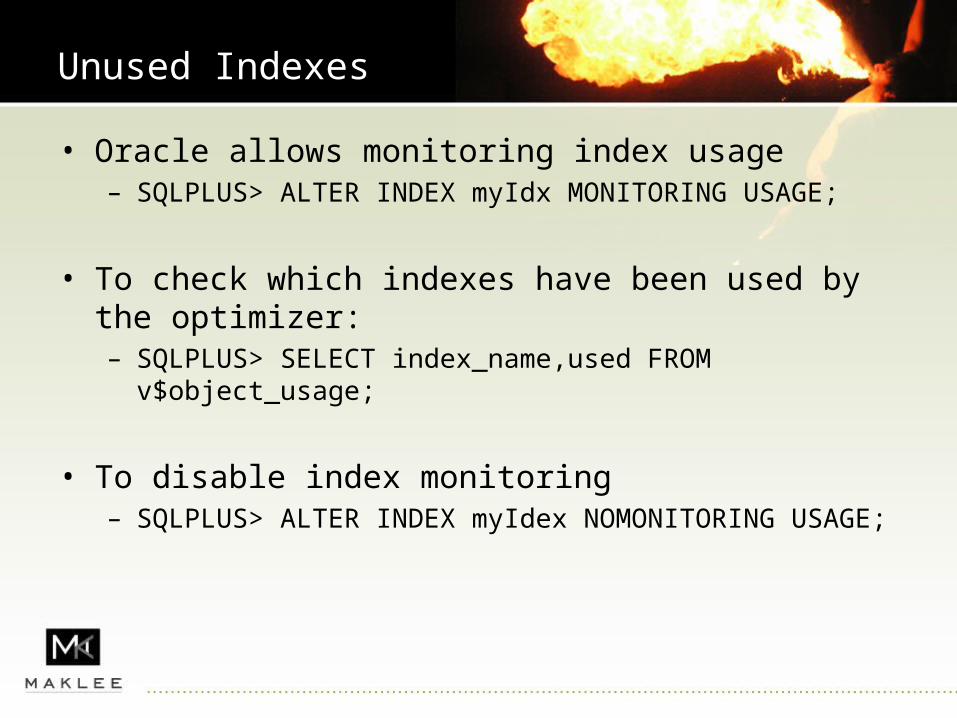
• Oracle allows monitoring index usage– SQLPLUS> ALTER INDEX myIdx MONITORING USAGE;
• To check which indexes have been used by the optimizer:– SQLPLUS> SELECT index_name,used FROM v$object_usage;
• To disable index monitoring– SQLPLUS> ALTER INDEX myIdex NOMONITORING USAGE;
Statspack / AWR reports
Statspack / AWR reports
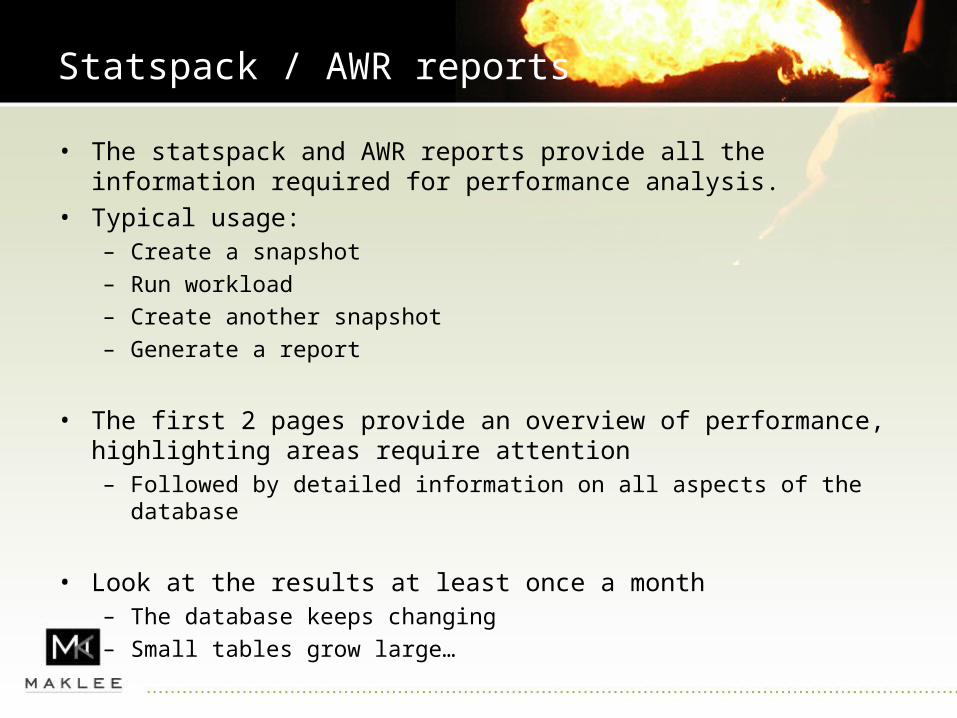
• The statspack and AWR reports provide all the information required for performance analysis.
• Typical usage:– Create a snapshot– Run workload– Create another snapshot– Generate a report
• The first 2 pages provide an overview of performance, highlighting areas require attention– Followed by detailed information on all aspects of the database
• Look at the results at least once a month– The database keeps changing– Small tables grow large…
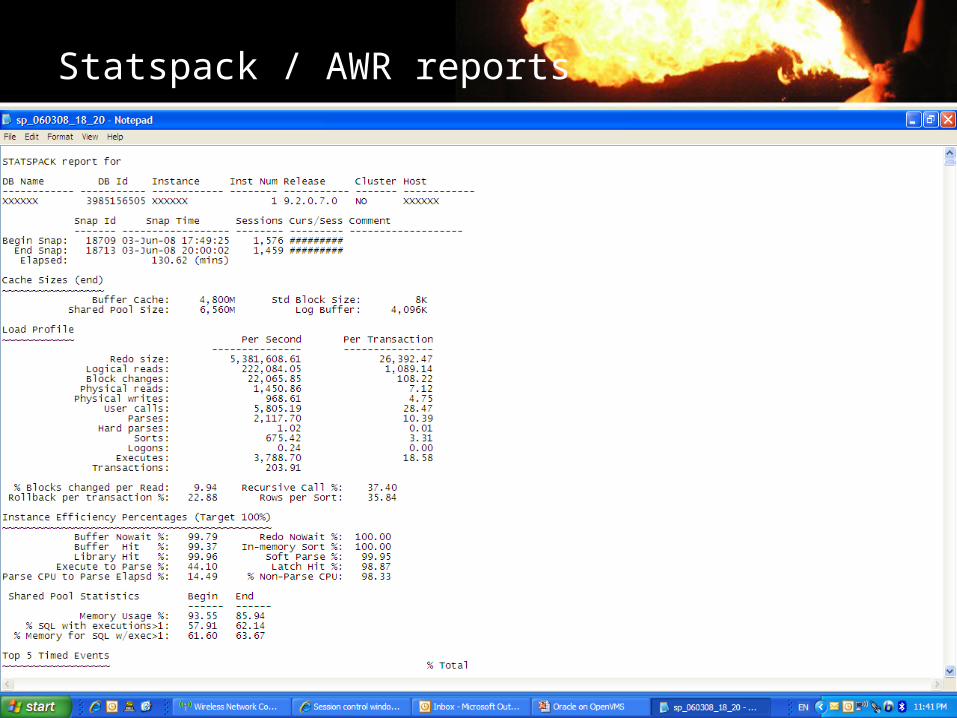
Statspack / AWR reports
Statspack / AWR reports
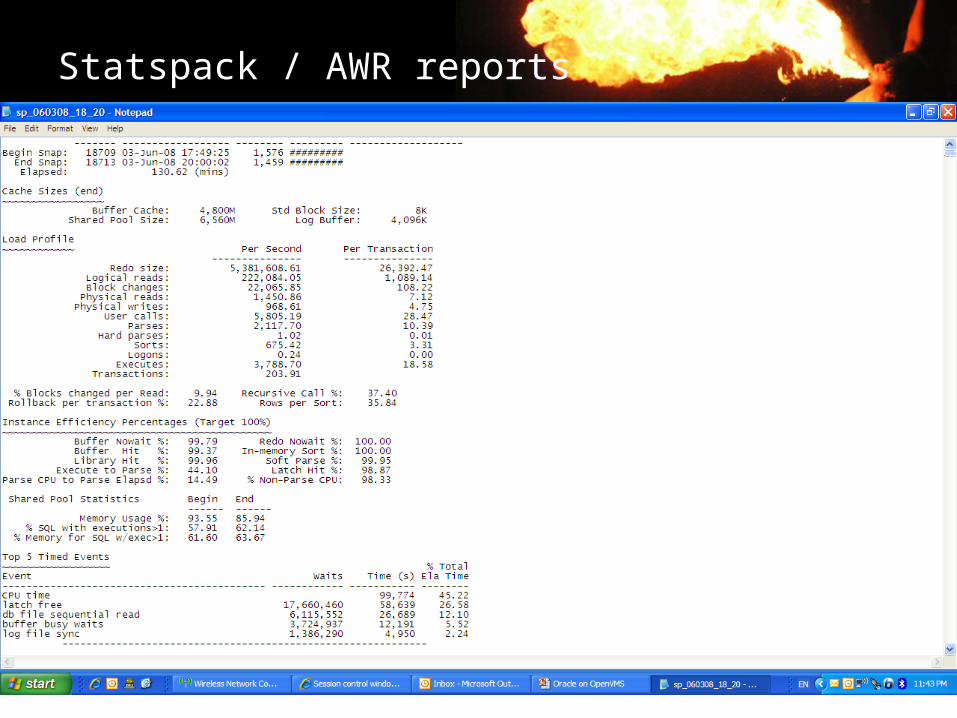
Statspack / AWR reports
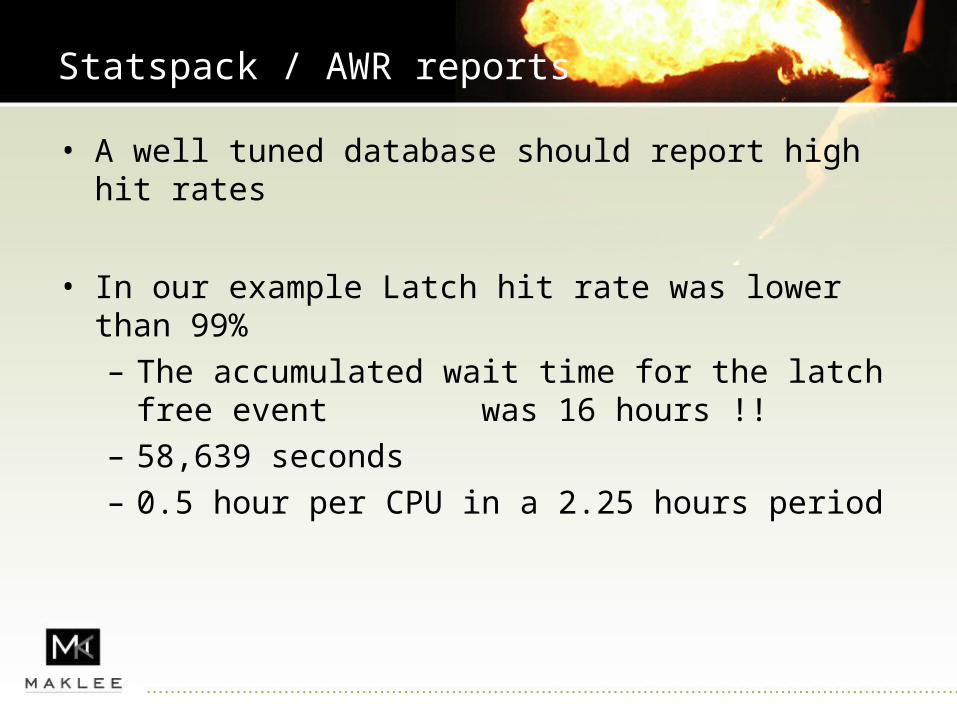
• A well tuned database should report high hit rates
• In our example Latch hit rate was lower than 99%– The accumulated wait time for the latch free event was
16 hours !! – 58,639 seconds– 0.5 hour per CPU in a 2.25 hours period
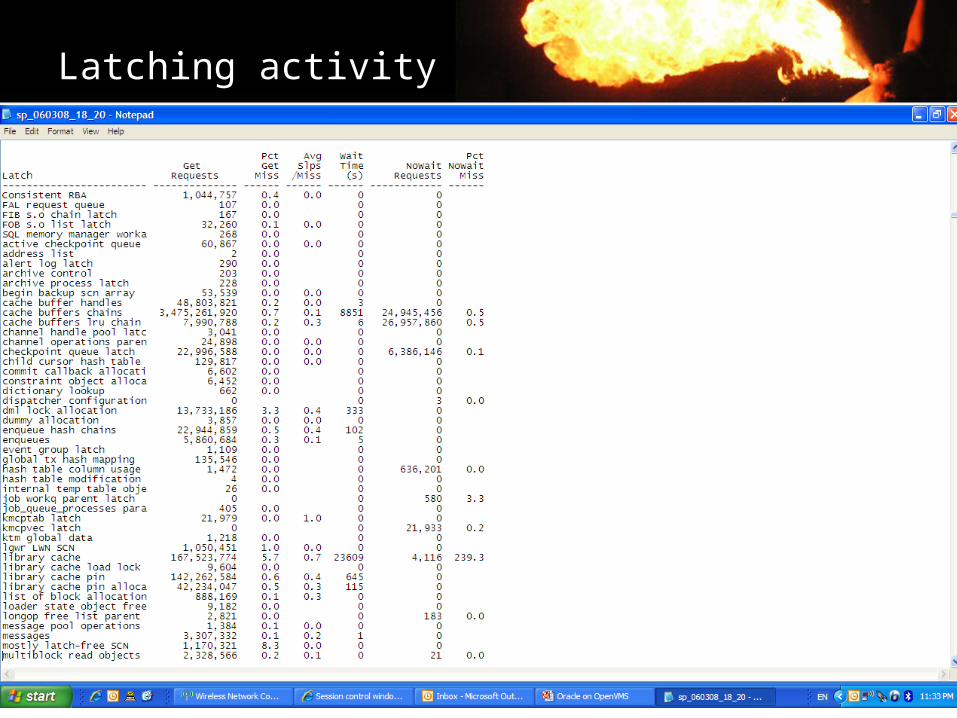
Latching activity
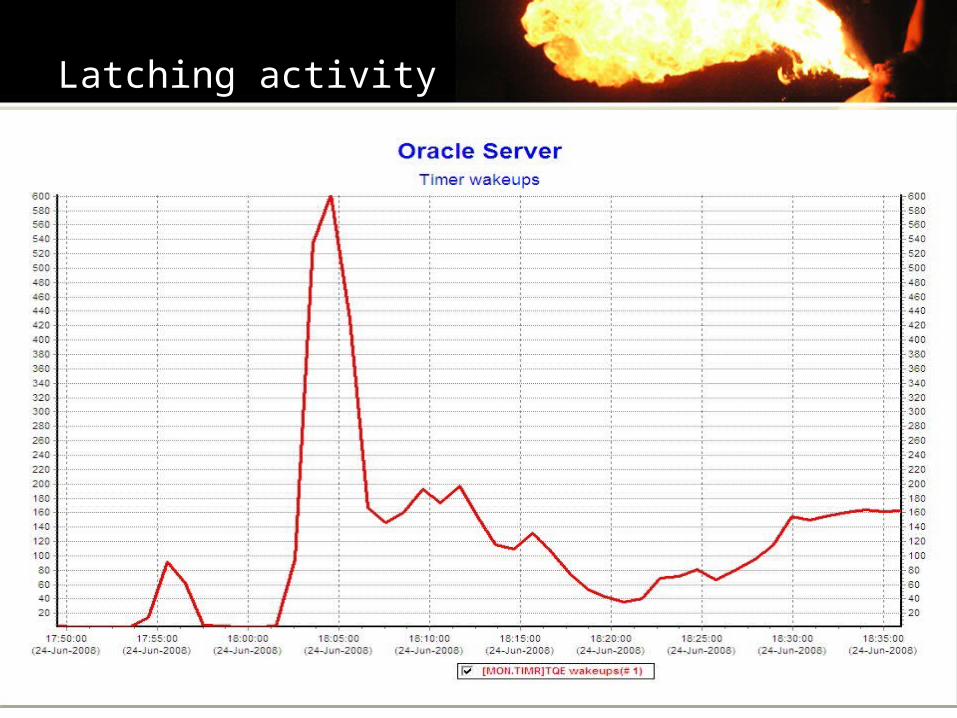
Latching activity
Statspack / AWR reports
• Once the latching problem has been resolved performance of the database improved significantly– Updates are 10 times ! faster– Overall performance improved 5 times
Long Connect Time
• Watch out for long connect time to the database
• Monitor CPU utilization of the BEQ listener– Utilization > 60% consider adding more BEQ listeners
• Possible solutions for long connection time:– Add BEQ listeners– Add listeners – Properly size the Flash recovery area
Automatic Memory Management
• Automatic Memory Management of the SGA is a new feature shipping with Oracle 10g
• Oracle attempts to manage available SGA memory to meet the application’s requirements
• Maklee recommends disabling automatic memory management– Oracle may fail to respond to a sudden change in the workload– No good deed goes unpunished….guarantee enough memory to all
areas of the SGA– To disable automatic memory management:
• SGA_MAXSIZE = X• SGA_TARGET = 0
RDB Vs. Oracle Terminology
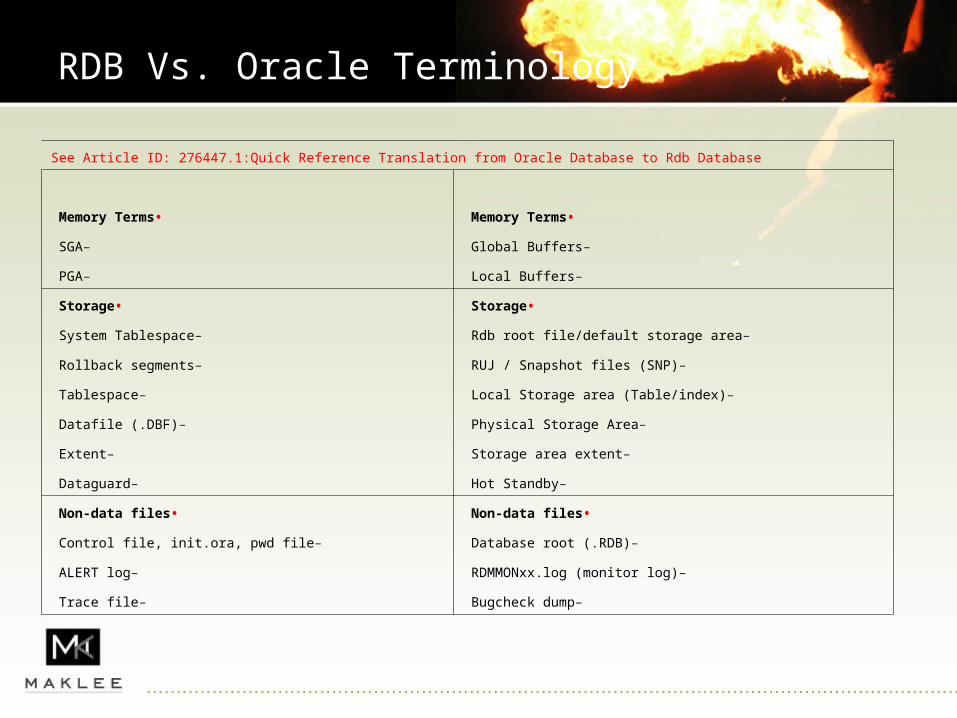
See Article ID: 276447.1:Quick Reference Translation from Oracle Database to Rdb Database
•Memory Terms •Memory Terms
– Global Buffers – SGA
– Local Buffers – PGA
•Storage •Storage
– Rdb root file/default storage area – System Tablespace
– RUJ / Snapshot files (SNP) – Rollback segments
– Local Storage area (Table/index) – Tablespace
– Physical Storage Area – Datafile (.DBF)
– Storage area extent – Extent
– Hot Standby – Dataguard
•Non-data files •Non-data files
– Database root (.RDB) – Control file, init.ora, pwd file
– RDMMONxx.log (monitor log) – ALERT log
– Bugcheck dump – Trace file
RDB Vs. Oracle Terminology
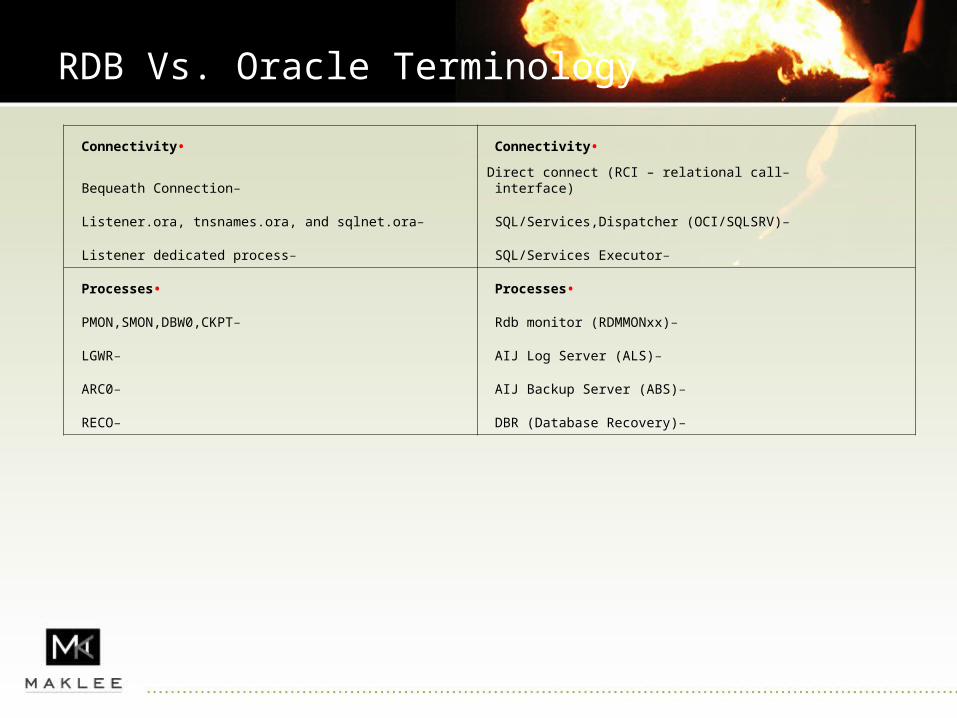
•Connectivity •Connectivity
– Direct connect (RCI – relational call interface) – Bequeath Connection
– SQL/Services,Dispatcher (OCI/SQLSRV) – Listener.ora, tnsnames.ora, and sqlnet.ora
– SQL/Services Executor – Listener dedicated process
•Processes •Processes
– Rdb monitor (RDMMONxx) – PMON,SMON,DBW0,CKPT
– AIJ Log Server (ALS) – LGWR
– AIJ Backup Server (ABS) – ARC0
– DBR (Database Recovery) – RECO
Adabas
• Maklee acknowledge that there are other database solutions available on OpenVMS.
• Starting November 2008 Maklee would offer wide range of services, for Software AG Adabas, focusing on performance tuning.
• Maklee continues to expand it’s offering in response to customer needs.
See us at www.maklee.com for:
• Oracle Tuning
• DBA services
• Oracle RAC installations
…..Bis bald
Questions?


![[Nigel Guy Wilson] an Anthology of Byzantine Prose(BookFi.org)](https://img.pdfslide.org/doc/110x75/577cc04a1a28aba7118f90a0/nigel-guy-wilson-an-anthology-of-byzantine-prosebookfiorg.jpg)