Embed Size (px)
Citation preview
ISSN 1814-2206
International Hop Growers` Convention I.H.G.C.
Proceedings of the Scientific Commission
Dobrna-Žalec, Slovenia 24 –27 June 2003
Edited for the Scientific Commission by
Dr. Elisabeth Seigner Bayerische Landesanstalt für Landwirtschaft, Institut für Pflanzenbau und Pflanzenzüchtung,
Arbeitsbereich Hopfen, Hüll

2
Impressum: Scientific Commission International Hop Growers` Commision (I.H.G.C.) Hop Research Center Hüll, Hüll 5 1/3, 85283 Wolnzach, Germany Internet: http://www.LfL.bayern.de Dr. Elisabeth Seigner June 2003 © Scientific Commission, I.H.G.C.
3
Contents
Page
Vorwort 6
Foreword 7
Papers presented
Session I: DISEASES AND PESTS OF HOPS Molecular markers for powdery mildew (Sphaerotheca humuli) resistance in hops 8 S. Seefelder and E. Seigner PCR detection of hop fungal pathogens 12 J. Patzak Hop wilt in Slovenia: Current situation and diagnostic research 17 S. Radišek, J. Jakše, A. Simončič and B. Javornik
"Root pathogen of hop causing foliar chlorosis and wilting of plant in 22 Vojvodina Province " J. Sabo, T. Djuric and S. Jasnic Plant growth regulator effects of fungicides applied to hop for control of 27 powdery mildew M.E. Nelson, K.C. Eastwell, C.M. Ocamb, W. Mahaffee, S.T. Kenny, G.G. Grove Control of Fusarium spp. on hop cones with grapefruit extract 32 E. Solarska Behavior and population development of the Damson-hop aphid on 36 two hop cultivars of different susceptibility F. Weihrauch and L. Moreth The use of suction trap for monitoring the migration of damson-hop aphid 41 (Phorodon humuli) (Hemiptera, Aphididae) Pérez, N, J. A. Magadán and V. Seco Biological control of Tetranychus urticae with the help of predatory mites on hops 46 J. Vostřel Session II: HOP CHEMISTRY AND QUALITY The formation of low-molecular polyphenols during the growth of hops 50 A. Forster, B. Beck, S. Massinger and R. Schmidt How Hop Powdery Mildew Infections Influence the Quality of Hops and Beer? 58 K. Krofta and V. Nesvadba Drop in the Content of Alpha Bitter Acids in the Course of Hop Storage 63 in Conditioned and Non-Conditioned Warehouses F. Kroupa, J. Urban, J. Ticha
4
Session III: NEW GENE-BASED METHODS IN HOP RESEARCH Transformation of Hop (Humulus lupulus L.) for an increased resistance 68 against pathogens C. Horlemann, A. Schwekendiek, R. Fleischer, M.Höhnle, and G. Weber Cloning and expression of valerophenone synthase promotor 73 Y. Okada, K. Saeki, A. Inaba, N. Suda, T. Kaneko, K. Ito Functional genomics of hop (H. lupulus L.) with main respect to genes 78 co-determining lupulin production J. Matoušek, P. Novak, J. Patzak, L. Vrba and K. Krofta Hop genetic research in Slovenia 83 B. Javornik, J. Jakše, A.Čerenak, N. Štajner, P. Kozjak, A. Ivančič, Z. Šatović, S. Škof, Z. Luthar
ISSR polymorphism in hop 87 T.V. Danilova and G.I. Karlov Session IV: HOP BREEDING Molecular evolution of hops, (Humulus lupulus L.) 92 A. Murakami, P. Darby, B. Javornik, M.S.S. Pais, E. Seigner, A. Lutz , P.Svoboda The potential for selective breeding to increase the Xanthohumol content of hops 97 P. Darby, R. Atkinson, L.A. Buggey and A.E. Meacham Practical knowledge and criteria influencing effectivity of breeding process in the CR 101 V. Nesvadba and K. Krofta Producting optimal first year yields in hops 106 G. Brits and G. C. Linsley-Noakes Posters Objective assessment of hop quality 111 R. Schmidt, A. Köberlein and A. Forster Use of HPLC in combination with different chemometric methods for 112 the determination of hop varieties J. Košir and M. Kač Nitrates in hop cones and beer 113 D. Majer & M. Virant Certification scheme for the production of hop planting material in Slovenia 114 N. Ferant, V. Knapic, M. Pecnik, S. Radisek, M. Rak-Cizej, K. Matjaz-Petek The estimation of hybid hops health status 115 M. Grudzińska Successful Artificial Infection of Hops with Verticillium albo-atrum in Tettnang 116 B. Wenzler Hop viroids, HLVd and HSVd, plasticity of quasiforms after natural and biolistic infections 117 J. Matoušek, L. Orctová, J. Patzak and P. Svoboda
5
Effects of hop latent viroid infection and climate variability on hops in Slovenia 118 Vlasta Knapic Variability of chitinase genes in world hop (Humulus lupulus L.) genetic resources 119 J. Patzak Genetic engineering of hop (Humulus lupulus L.) 120 H. Radic-Miehle and E. Seigner Population dynamics of Phorodon humuli (Schrank, 1801) (Hemiptera, Aphididae) 121 on hops in Leon (Spain) during 2002 A. Lorenzana, A. Hermoso de Mendoza, A. Pérez, A. Magadán , M. V. Seco The impact of floods in 2002 on Czech hop industry 122 K. Krofta, V. Nasvadba Using biotechnology for multiplication of hop 123 P. Svoboda
6
Vorwort
Die Tagung der Wissenschaftlichen Kommission (WK) im Internationalen Hopfenbaubüro (IHB) hat sich zur wichtigsten Plattform für den Erfahrungsaustausch der Wissenschaftler in der Hopfenforschung entwickelt.
Das IHB als Dachorganisation hat berechtigte Interessen, neben den wirtschaftlichen und technischen Entwicklungen auch die wissenschaftlichen Ergebnisse seinen Mitgliedern zur Kenntnis zu bringen. Es wurde deshalb vor zwei Jahren in Canterbury versucht, Hopfenwirt-schaftskongress und die Tagung der WK zeitgleich am gleichen Ort in Canterbury durchzu-führen. Leider hat sich herausgestellt, dass die Teilnehmer des Hopfenkongresses wenig Kontakt zu den Wissenschaftlern finden konnten und der vorgesehene Meinungsaustausch zwischen Praxis und Wissenschaft nicht stattgefunden hat. Der Vorsitzende der WK hat dem IHB deshalb vorgeschlagen, - die Tagung der WK wieder als eigenständige Veranstaltung durchzuführen,
- die Berichte über die Vorträge und Poster jedem Interessenten über das Internet
(www.landwirtschaft.bayern.de\lfl\ipz\hopfen\wk2003.pdf) zugänglich zu machen und
- eine Zusammenfassung der aktuellen Forschungsrichtungen in einem Vortrag während des Hopfenwirtschaftskongresses vorzustellen.
Es wäre sicher für alle Beteiligten eine Aufwertung, wenn dies auch im offiziellen Kongressprogramm als eigener Tagesordnungspunkt aufgenommen würde. Im Namen aller Teilnehmer möchte ich herzlich Dank sagen: - Dank den slowenischen Kolleginnen und Kollegen, insbesondere dem Chef des Institutes
Herrn M.Sc. Andrej Simoncic und Frau Majda Virant für die Einladung in das gastfreundliche Slowenien und die hervorragende Organisation.
- Dank den Hopfenpflanzern, die den Wissenschaftlern Einblick in die Praxis des
Hopfenbaus geben. - Dank an die Redner und die Aussteller von Postern, die ihr Wissen an die
Hopfenwirtschaft weitergeben. - Dank der unermüdlich arbeitenden Sekretärin Frau Dr. Elisabeth Seigner, die mit ihrer
Arbeit zwischen und während der Tagung die WK zu einer perfekten Organisation geführt hat.
Ich wünsche allen Tagungsteilnehmern einen erfolgreichen Erfahrungsaustausch und in angenehmer Umgebung in Zalec-Dobrna den notwendigen direkten Kontakt zu den Kolleginnen und Kollegen der internationalen Hopfenforschung. Bernhard Engelhard Vorsitzender der Wissenschaftlichen Kommission des IHB
7
FOREWORD
This meeting of the Scientific Commission (SC) of the International Hop Growers Convention (IHGC) has become an important forum for all scientists involved in hop research in order to exchange knowledge and experience. The IHGC as the umbrella organisation shows great interest in imparting information and knowledge from the economical and technical side as well as from the scientific side to all their members. Therefore, two years ago in Canterbury, England, it was tried to hold together the hop economic congress and the meeting of the SC at the same time and same place. Unfortunately, it turned out that the participants of the hop congress had difficulties in establishing contacts with our hop scientists and the planned exchange of views between practice and science failed. Thus, the chairman of the SC made several proposals to the IHGC: - from now on the meeting of the SC is again conducted independently
- reports on lectures and posters are made available on the internet
(www.landwirtschaft.bayern.de\lfl\ipz\hopfen\wk2003.pdf) to everyone who is interested in - a summary of all current research directions is presented in a lecture during the hop
congress Certainly it would be desirable for all persons involved if this lecture could be added as a separate item on the agenda of the official congress programme. On behalf of all participants I would like to say thank you very much : - Thanks to our Slovenian colleagues, especially to Mr. M.Sc. Andrej Simoncic, head of the
hop research institute, and to Mrs Majda Virant for their invitation to Slovenia which we know for its special hospitality and thank you for the excellent organization of this meeting.
- Thanks to the hop growers for providing insight into the practice of growing hops to our
hop scientists. - Thanks to the speakers and to those who have presented posters for passing on their
knowledge and experience to the hop industry. - Thanks to the secretary Dr. Elisabeth Seigner, who has contributed with her tireless work
before and during this meeting to a perfect organization. I wish all participants of the meeting fruitful discussions leading to this useful direct contact between colleagues operating in the international hop research – in midst this pleasant atmosphere of Zalec-Dobrna. Bernhard Engelhard Chairman of the Scientific Commission, IHGC
8
MOLECULAR MARKERS FOR POWDERY MILDEW (SPHAEROTHECA HUMULI) RESISTANCE IN HOPS
S. Seefelder and E. Seigner
Bayerische Landesanstalt für Landwirtschaft, Institut für Pflanzenbau und Pflanzenzüchtung, Hopfenforschungszentrum Hüll, Hüll 5 1/3, D-85283 Wolnzach, Deutschland
Tel.: +49-8161-714076; Fax: +49-8161-714514; E-mail: [email protected] Summary The AFLP (amplified fragment length polymorphism) bulked segregant analysis has been used to identify molecular markers for different powdery mildew resistance genes. Our interest was focused on developing DNA markers for resistance genes that are still effective in the German hop growing region - the R2 gene from the variety “Wye Target”, the Rbu gene from “Buket” and the resistance gene from a German wildhop. For this purpose segregating populations were produced from crossings between a resistant and a susceptible hop. In each progeny all individuals were tested for their powdery mildew (PM) resistance using a well established infection test system with PM isolates of characterised virulences as inoculum. Segregation analysis (resistant : susceptible) of each population confirmed the presence of a single dominant gene conferring resistance to powdery mildew. DNA pools of resistant and susceptible individuals of each mapping population were screened with a total of 380 AFLP primer combinations. Work to identify molecular markers closely linked to powdery mildew resistance genes is still in progress. So far 10 DNA markers could be found in the R2 resistant individuals and two markers could be identified that are associated with the Rbu gene from “Buket”. With one primer combination the marker for the R2 resistance and for the Rbu resistance could be detected simultaneously. The application of AFLP markers for powdery mildew resistance in practical hop breeding is discussed. Introduction In recent years infections of powdery mildew (Sphaerotheca humuli) have became a serious problem in commercial hop growing all across Europe and in the USA. In order to meet the demands of an environmentally beneficial and cost effective production of top quality hops the efficiency of controlling powdery mildew has to be increased. Thus breeding for resistance is of prime importance. At current the selection of disease resistant hop plants is based on the phenotype after artificial or natural infection with fungal spores in the greenhouse or in the fields. However, this phenotypic expression of susceptibility (powdery mildew spots) and resistance can significantly be affected by environmental factors, by different fungal spore load and the developmental stage of the plant itself, leading to wrong resistance data. Moreover, greenhouse tests and field evaluations of fungal resistance are time-consuming and laborious procedures. A more reliable and significantly faster way of testing for powdery mildew resistance can be achieved by proving the resistance directly on the genetic level, on the level of the DNA. Thus the target of our research is the identification of DNA markers closely linked to specific powdery mildew resistance genes. These molecular markers allow to distinguish resistant and susceptible individuals in only few days by the presence or absence of a specific resistance marker without prior fungal infection. Applying this gene diagnostic tool resistance to hop powdery mildew can be proved in a more specific and more reliable manner, thus supporting and accelerating the classical breeding procedure.
9
Preconditions to identify molecular markers for PM resistance
Profound knowledge on PM resistances that are still effective and a reliable resistance screening system are important preconditions to develop closely linked DNA resistance markers. An infection test system for powdery mildew using detached hop leaves has been established by our institute in cooperation with EpiLogic. This resistance screening system in petri dishes allows to test the infection behaviour of various PM races on hop leaves under standard optimized infection conditions in the laboratory. In this way sound data on the resistance of hops can be provided in only few days. Based on the latest investigations using 89 powdery mildew strains from England, France, the USA and the Hallertau growing region (Seigner et al., 2002) the effectiveness of race-specific resistances (R gene) based on major genes that are currently utilized in breeding could be evaluated. Only few known powdery mildew resistance genes still proved to confer resistance to PM infections: the R2 gene from “Wye Target“, the resistance of “Buket” and of three wild hops collected in the Thuringia region. All these resistances were incorporated into the Hüll germplasm. To increase selection efficiency molecular markers that are in close vicinity to the resistance genes and are therefore transmitted together with these genes should be developed. A very effective way to associate molecular markers with disease resistance is the bulked segregant analysis using AFLPs to detect polymorphic fragments linked to resistance. Identification of AFLP markers for powdery mildew resistance Specific crosses were made between a powdery mildew resistant individual and a susceptible plant to generate mapping populations segregating for powdery mildew resistance (Table 1) . Seedlings of those crosses were screened for resistance to powdery mildew in the laboratory of EpiLogic using the PM infection test system. In these tests detached hop leaves were inoculated with powdery mildew strains of characterized virulence in petri dishes. After 10 days incubation under standard conditions resistant and susceptible individuals could be distinguished. Moreover, by using Sphaerotheca strains with characterized virulence behaviour for inoculation resistance could be put down to the presence of a specific R gene. Resistance data were re-checked and could be confirmed after artificial PM inoculation in the greenhouse in Huell. Reliable resistance data are the prerequisite for the identification of closely linked markers in the genetic linkage analysis. Segregation of the R2, Rbu and the RW genes (table 1) confirmed or revealed the action of single dominant genes conferring resistance to powdery mildew. Following the bulked segregant strategy the DNA of 10 resistant and 10 susceptible individuals were separately pooled and analyzed using AFLPs. 380 primer combinations were tested on the bulks of resistant and susceptible plants until finally a few AFLP fragments (= DNA marker) could be identified that only occurred in the resistant pool and resistant parent. So far markers linked with PM susceptibility (“marker in repulsion”) could not be found. In order to verify these DNA fragments as resistance markers each individual from both pools (resistant – susceptible) along with both parents and the whole progeny were screened. 10 AFLP markers could be associated with the R2 gene deriving from “Wye Target” and two markers could be linked to the resistance gene of “Buket”. Segregation analysis within the various mapping populations indicated a recombination rate of less than 9-3%. This means that among 100 individuals the phenotypic resistance was associated with the resistance marker for the R2 and Rbu gene in 91-97%.
10
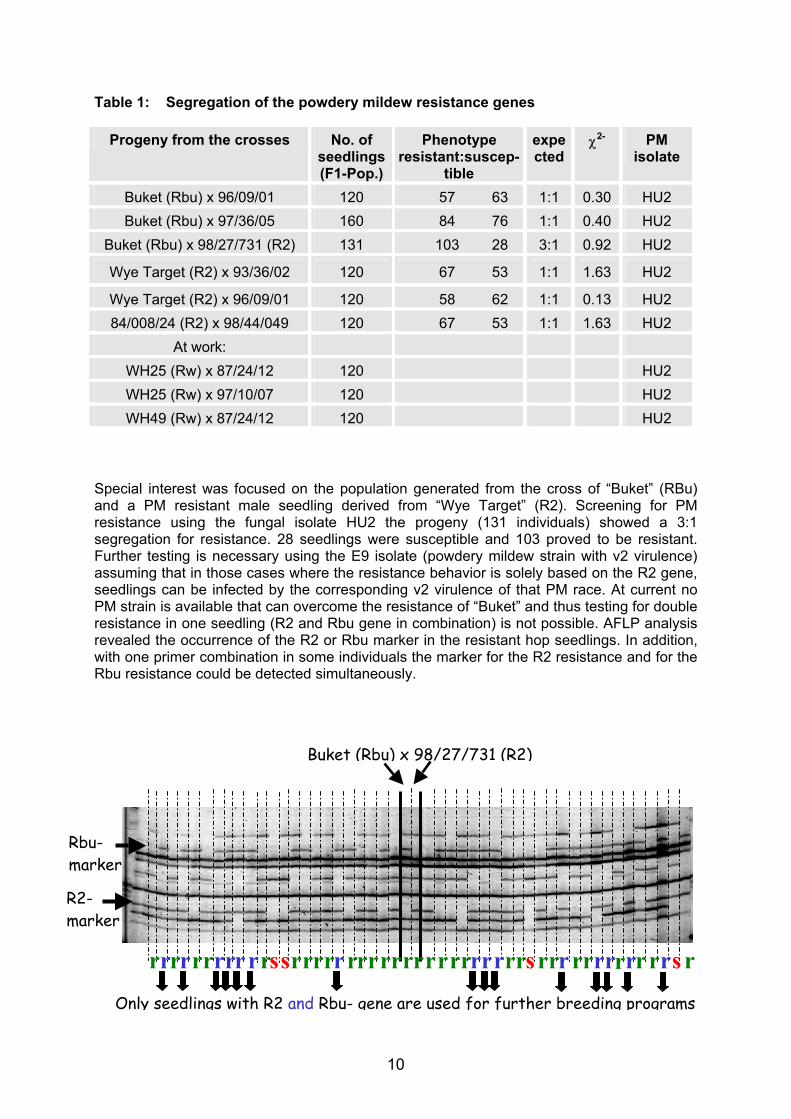
Table 1: Segregation of the powdery mildew resistance genes
Progeny from the crosses No. of seedlings(F1-Pop.)
Phenotype resistant:suscep-
tible
expected
χ2- PM isolate
Buket (Rbu) x 96/09/01 120 57 63 1:1 0.30 HU2 Buket (Rbu) x 97/36/05 160 84 76 1:1 0.40 HU2
Buket (Rbu) x 98/27/731 (R2) 131 103 28 3:1 0.92 HU2
Wye Target (R2) x 93/36/02 120 67 53 1:1 1.63 HU2
Wye Target (R2) x 96/09/01 120 58 62 1:1 0.13 HU2 84/008/24 (R2) x 98/44/049 120 67 53 1:1 1.63 HU2
At work: WH25 (Rw) x 87/24/12 120 HU2 WH25 (Rw) x 97/10/07 120 HU2 WH49 (Rw) x 87/24/12 120 HU2
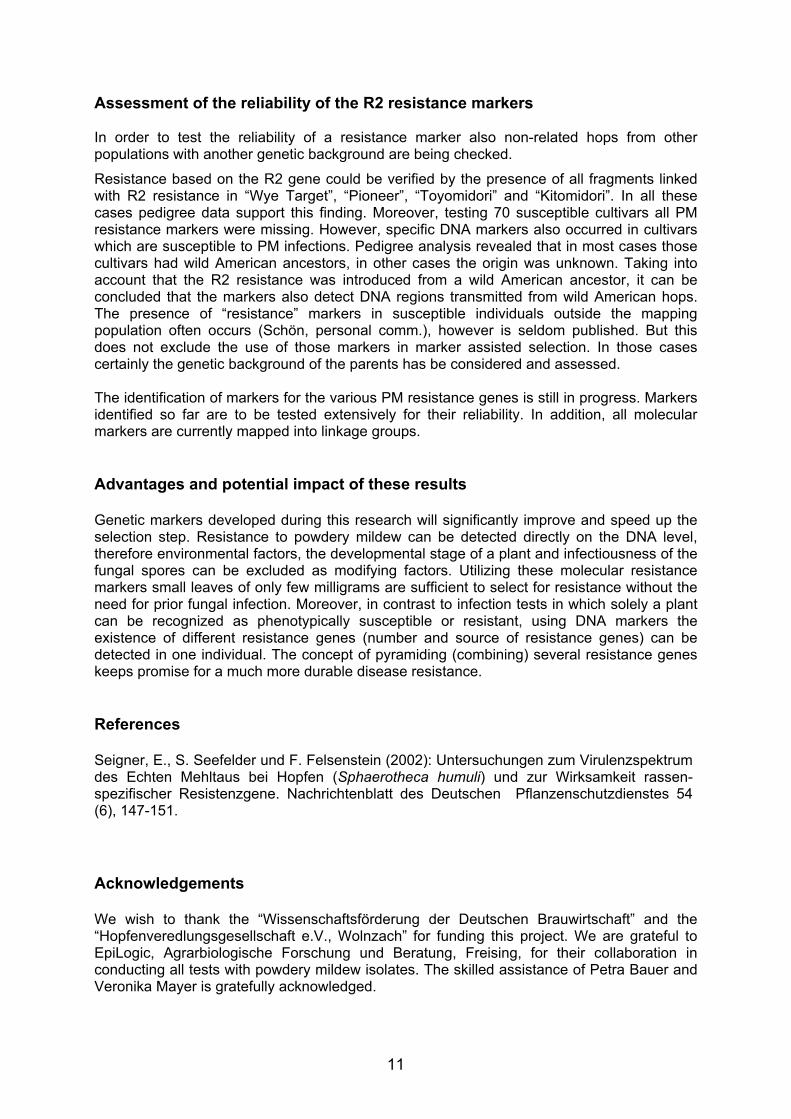
Special interest was focused on the population generated from the cross of “Buket” (RBu) and a PM resistant male seedling derived from “Wye Target” (R2). Screening for PM resistance using the fungal isolate HU2 the progeny (131 individuals) showed a 3:1 segregation for resistance. 28 seedlings were susceptible and 103 proved to be resistant. Further testing is necessary using the E9 isolate (powdery mildew strain with v2 virulence) assuming that in those cases where the resistance behavior is solely based on the R2 gene, seedlings can be infected by the corresponding v2 virulence of that PM race. At current no PM strain is available that can overcome the resistance of “Buket” and thus testing for double resistance in one seedling (R2 and Rbu gene in combination) is not possible. AFLP analysis revealed the occurrence of the R2 or Rbu marker in the resistant hop seedlings. In addition, with one primer combination in some individuals the marker for the R2 resistance and for the Rbu resistance could be detected simultaneously.
Rbu- marker
R2- marker
Buket (Rbu) x 98/27/731 (R2)
Only seedlings with R2 and Rbu- gene are used for further breeding programs
r ssrr r r r r r r r rrr r r r r rrrr rr r r rr r r rr r r r r r r rrr rrrr r s s
11
Assessment of the reliability of the R2 resistance markers In order to test the reliability of a resistance marker also non-related hops from other populations with another genetic background are being checked.
Resistance based on the R2 gene could be verified by the presence of all fragments linked with R2 resistance in “Wye Target”, “Pioneer”, “Toyomidori” and “Kitomidori”. In all these cases pedigree data support this finding. Moreover, testing 70 susceptible cultivars all PM resistance markers were missing. However, specific DNA markers also occurred in cultivars which are susceptible to PM infections. Pedigree analysis revealed that in most cases those cultivars had wild American ancestors, in other cases the origin was unknown. Taking into account that the R2 resistance was introduced from a wild American ancestor, it can be concluded that the markers also detect DNA regions transmitted from wild American hops. The presence of “resistance” markers in susceptible individuals outside the mapping population often occurs (Schön, personal comm.), however is seldom published. But this does not exclude the use of those markers in marker assisted selection. In those cases certainly the genetic background of the parents has be considered and assessed. The identification of markers for the various PM resistance genes is still in progress. Markers identified so far are to be tested extensively for their reliability. In addition, all molecular markers are currently mapped into linkage groups. Advantages and potential impact of these results Genetic markers developed during this research will significantly improve and speed up the selection step. Resistance to powdery mildew can be detected directly on the DNA level, therefore environmental factors, the developmental stage of a plant and infectiousness of the fungal spores can be excluded as modifying factors. Utilizing these molecular resistance markers small leaves of only few milligrams are sufficient to select for resistance without the need for prior fungal infection. Moreover, in contrast to infection tests in which solely a plant can be recognized as phenotypically susceptible or resistant, using DNA markers the existence of different resistance genes (number and source of resistance genes) can be detected in one individual. The concept of pyramiding (combining) several resistance genes keeps promise for a much more durable disease resistance. References Seigner, E., S. Seefelder und F. Felsenstein (2002): Untersuchungen zum Virulenzspektrum des Echten Mehltaus bei Hopfen (Sphaerotheca humuli) und zur Wirksamkeit rassen-spezifischer Resistenzgene. Nachrichtenblatt des Deutschen Pflanzenschutzdienstes 54 (6), 147-151.
Acknowledgements We wish to thank the “Wissenschaftsförderung der Deutschen Brauwirtschaft” and the “Hopfenveredlungsgesellschaft e.V., Wolnzach” for funding this project. We are grateful to EpiLogic, Agrarbiologische Forschung und Beratung, Freising, for their collaboration in conducting all tests with powdery mildew isolates. The skilled assistance of Petra Bauer and Veronika Mayer is gratefully acknowledged.
12
PCR DETECTION OF HOP FUNGAL PATHOGENS
Josef Patzak
Hop Research Institute Co. Ltd., Kadaňská 2525, 438 46 Žatec, Czech Republic, Tel: +420 415 732109, Fax: +420 415 732150, E-mail: [email protected]
Abstract
Hop downy mildew (Pseudoperonospora humuli) and hop powdery mildew (Sphaerotheca humuli) are the most important fungal plant diseases of hop (Humulus lupulus). The early detection and diagnosis of pathogens are often aggravated with symptomless before mass infection or commutation with another pathogens. Molecular analysis of internal transcribed spacer (ITS) regions of rDNA is a novel and very effective method of species determination. The specific PCR assays were developed to detect pathogens Pseudoperonospora humuli and Sphaerotheca humuli in naturally infected hop plants. Specific PCR primers combinations P1+P2 and S1+S2 amplified specific fragments from Pseudoperonospora humuli and Sphaerotheca humuli, respectively, and did not cross-react with hop DNA nor DNA from other fungi tested. PCR primers combinations R1+R2 and R3+R4 were possible to use in multiplex PCR detection of Pseudoperonospora humuli, Sphaerotheca humuli, Verticillium albo-atrum and Fusarium sambucinum. The phylogenetic relationships were inferred for 47 species of Oomycetes and 42 species of Erysiphales from nuclear rDNA (ITS1, 5.8S, ITS2). The molecular characterisation and phylogenetic analyses confirmed certainly species identification of both pathogens. These PCR assays proved to be accurate and sensitive for detection, diagnosis, classification, diseases monitoring and forecasting. Introduction
Hops (Humulus lupulus L.) are regularly subject to infection through filamentous fungi.
The infection sometimes results in severe loss of production as the plants wither. From fungal diseases, hop downy mildew (Pseudoperonospora humuli [Miabe & Takah.] Wilson) and actually hop powdery mildew (Sphaerotheca humuli [DC.] Burrill) belong to the most important hop fungal diseases in the CR with considerable economic effects. Pseudoperonospora humuli infects young shoots, leaves, flowers and cones, causing “basal spikes”, angular black leaf spots and brown discolouration of cones (Neve, 1991). Sphaerotheca humuli infects leaves and cones, causing humps, blisters, pale spots, distortion of cones and white mould (Seigner et al., 2001). The most important hop quarantine fungal disease, hop verticillum wilt (Verticillium albo-atrum Reinke & Berthold a V. dahliae Klebahn), has not been spread in the CR so far. Fusarium canker (Fusarium sambucinum Fuck.) actually has not considerable economic incidence in the CR.
Early detection and diagnosis of pathogens are crucial for implementation of efficient control strategies. Disease symptoms are rarely discernible on growing crops before mass infection and they are sometimes commutable with another. Therefore, rapid, specific and sensitive methods for the detection of all important pathogens are required. Classical identification method, based on morphological or physiological characters, is time-consuming, labour intensive and requires considerable knowledge of the genera involved (Grote et al., 2002). Molecular DNA techniques represent a novel and highly effective means of species determination, based mainly the comparison of internal transcribed spacers (ITS) regions of rDNA (Cooke et al., 2000). Molecular data have been used extensively to reconstruct phylogenetic relationships among fungi (Saenz and Taylor, 1999, Petersen and Rosendahl, 2001, Reithmüller et al., 2002).
In this paper, we report the development of specific PCR primers for effective detection of fungal pathogens in naturally infected hop plants. We infer phylogenetic relationships of these pathogens among downy and powdery mildews, respectively, using molecular sequence data of ribosomal ITS regions.
13
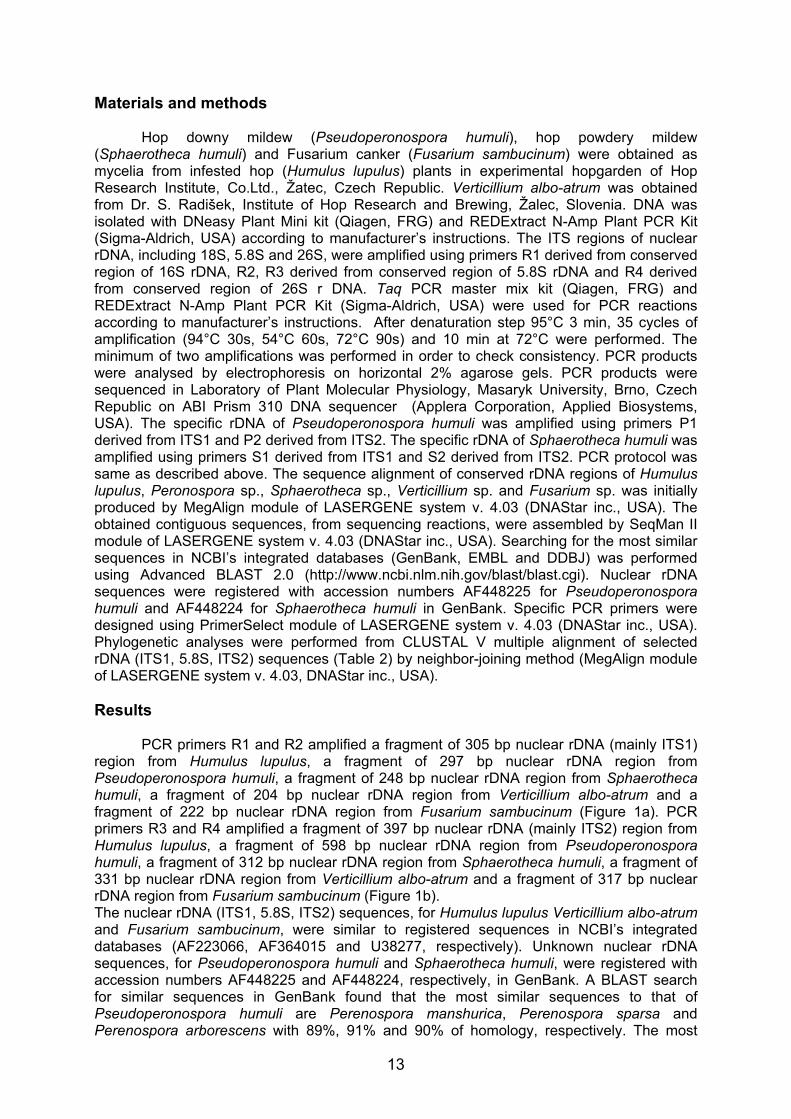
Materials and methods
Hop downy mildew (Pseudoperonospora humuli), hop powdery mildew (Sphaerotheca humuli) and Fusarium canker (Fusarium sambucinum) were obtained as mycelia from infested hop (Humulus lupulus) plants in experimental hopgarden of Hop Research Institute, Co.Ltd., Žatec, Czech Republic. Verticillium albo-atrum was obtained from Dr. S. Radišek, Institute of Hop Research and Brewing, Žalec, Slovenia. DNA was isolated with DNeasy Plant Mini kit (Qiagen, FRG) and REDExtract N-Amp Plant PCR Kit (Sigma-Aldrich, USA) according to manufacturer’s instructions. The ITS regions of nuclear rDNA, including 18S, 5.8S and 26S, were amplified using primers R1 derived from conserved region of 16S rDNA, R2, R3 derived from conserved region of 5.8S rDNA and R4 derived from conserved region of 26S r DNA. Taq PCR master mix kit (Qiagen, FRG) and REDExtract N-Amp Plant PCR Kit (Sigma-Aldrich, USA) were used for PCR reactions according to manufacturer’s instructions. After denaturation step 95°C 3 min, 35 cycles of amplification (94°C 30s, 54°C 60s, 72°C 90s) and 10 min at 72°C were performed. The minimum of two amplifications was performed in order to check consistency. PCR products were analysed by electrophoresis on horizontal 2% agarose gels. PCR products were sequenced in Laboratory of Plant Molecular Physiology, Masaryk University, Brno, Czech Republic on ABI Prism 310 DNA sequencer (Applera Corporation, Applied Biosystems, USA). The specific rDNA of Pseudoperonospora humuli was amplified using primers P1 derived from ITS1 and P2 derived from ITS2. The specific rDNA of Sphaerotheca humuli was amplified using primers S1 derived from ITS1 and S2 derived from ITS2. PCR protocol was same as described above. The sequence alignment of conserved rDNA regions of Humulus lupulus, Peronospora sp., Sphaerotheca sp., Verticillium sp. and Fusarium sp. was initially produced by MegAlign module of LASERGENE system v. 4.03 (DNAStar inc., USA). The obtained contiguous sequences, from sequencing reactions, were assembled by SeqMan II module of LASERGENE system v. 4.03 (DNAStar inc., USA). Searching for the most similar sequences in NCBI’s integrated databases (GenBank, EMBL and DDBJ) was performed using Advanced BLAST 2.0 (http://www.ncbi.nlm.nih.gov/blast/blast.cgi). Nuclear rDNA sequences were registered with accession numbers AF448225 for Pseudoperonospora humuli and AF448224 for Sphaerotheca humuli in GenBank. Specific PCR primers were designed using PrimerSelect module of LASERGENE system v. 4.03 (DNAStar inc., USA). Phylogenetic analyses were performed from CLUSTAL V multiple alignment of selected rDNA (ITS1, 5.8S, ITS2) sequences (Table 2) by neighbor-joining method (MegAlign module of LASERGENE system v. 4.03, DNAStar inc., USA).
Results
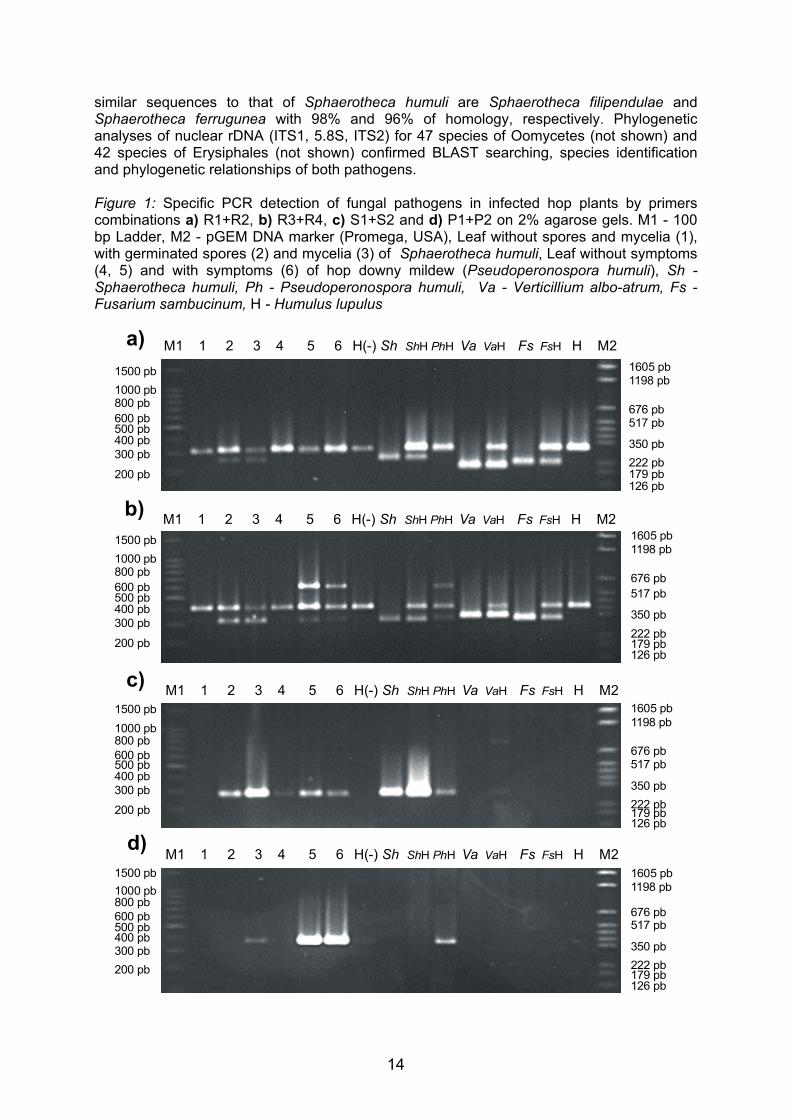
PCR primers R1 and R2 amplified a fragment of 305 bp nuclear rDNA (mainly ITS1)
region from Humulus lupulus, a fragment of 297 bp nuclear rDNA region from Pseudoperonospora humuli, a fragment of 248 bp nuclear rDNA region from Sphaerotheca humuli, a fragment of 204 bp nuclear rDNA region from Verticillium albo-atrum and a fragment of 222 bp nuclear rDNA region from Fusarium sambucinum (Figure 1a). PCR primers R3 and R4 amplified a fragment of 397 bp nuclear rDNA (mainly ITS2) region from Humulus lupulus, a fragment of 598 bp nuclear rDNA region from Pseudoperonospora humuli, a fragment of 312 bp nuclear rDNA region from Sphaerotheca humuli, a fragment of 331 bp nuclear rDNA region from Verticillium albo-atrum and a fragment of 317 bp nuclear rDNA region from Fusarium sambucinum (Figure 1b). The nuclear rDNA (ITS1, 5.8S, ITS2) sequences, for Humulus lupulus Verticillium albo-atrum and Fusarium sambucinum, were similar to registered sequences in NCBI’s integrated databases (AF223066, AF364015 and U38277, respectively). Unknown nuclear rDNA sequences, for Pseudoperonospora humuli and Sphaerotheca humuli, were registered with accession numbers AF448225 and AF448224, respectively, in GenBank. A BLAST search for similar sequences in GenBank found that the most similar sequences to that of Pseudoperonospora humuli are Perenospora manshurica, Perenospora sparsa and Perenospora arborescens with 89%, 91% and 90% of homology, respectively. The most
14
similar sequences to that of Sphaerotheca humuli are Sphaerotheca filipendulae and Sphaerotheca ferrugunea with 98% and 96% of homology, respectively. Phylogenetic analyses of nuclear rDNA (ITS1, 5.8S, ITS2) for 47 species of Oomycetes (not shown) and 42 species of Erysiphales (not shown) confirmed BLAST searching, species identification and phylogenetic relationships of both pathogens. Figure 1: Specific PCR detection of fungal pathogens in infected hop plants by primers combinations a) R1+R2, b) R3+R4, c) S1+S2 and d) P1+P2 on 2% agarose gels. M1 - 100 bp Ladder, M2 - pGEM DNA marker (Promega, USA), Leaf without spores and mycelia (1), with germinated spores (2) and mycelia (3) of Sphaerotheca humuli, Leaf without symptoms (4, 5) and with symptoms (6) of hop downy mildew (Pseudoperonospora humuli), Sh -Sphaerotheca humuli, Ph - Pseudoperonospora humuli, Va - Verticillium albo-atrum, Fs - Fusarium sambucinum, H - Humulus lupulus
1500 pb1000 pb
200 pb
800 pb
126 pb
500 pb600 pb
400 pb300 pb
222 pb179 pb
676 pb517 pb
350 pb
1198 pb1605 pb
1500 pb1000 pb
200 pb
800 pb
500 pb600 pb
400 pb300 pb
1500 pb1000 pb
200 pb
800 pb
500 pb600 pb
400 pb300 pb
1500 pb1000 pb
200 pb
800 pb
500 pb600 pb
400 pb300 pb
126 pb
222 pb179 pb
676 pb517 pb
350 pb
1198 pb1605 pb
126 pb222 pb179 pb
676 pb517 pb
350 pb
1198 pb1605 pb
126 pb
222 pb179 pb
676 pb517 pb
350 pb
1198 pb1605 pb
M1 1 2 3 4 5 6 H(-) H M2 H H H H Sh Va FsSh Ph Va Fs
M1 1 2 3 4 5 6 H(-) H M2 H H H H Sh Va FsSh Ph Va Fs
M1 1 2 3 4 5 6 H(-) H M2 H H H H Sh Va FsSh Ph Va Fs
M1 1 2 3 4 5 6 H(-) H M2 H H H H Sh Va FsSh Ph Va Fs
a)
b)
c)
d)
15
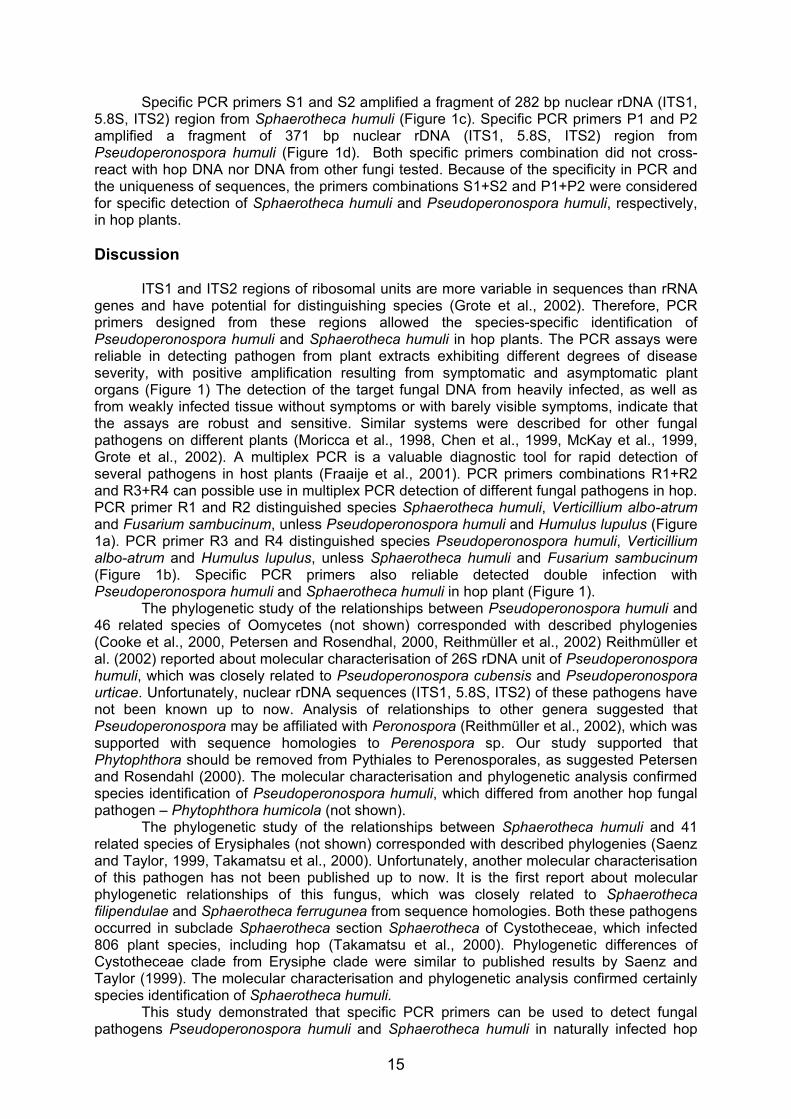
Specific PCR primers S1 and S2 amplified a fragment of 282 bp nuclear rDNA (ITS1, 5.8S, ITS2) region from Sphaerotheca humuli (Figure 1c). Specific PCR primers P1 and P2 amplified a fragment of 371 bp nuclear rDNA (ITS1, 5.8S, ITS2) region from Pseudoperonospora humuli (Figure 1d). Both specific primers combination did not cross-react with hop DNA nor DNA from other fungi tested. Because of the specificity in PCR and the uniqueness of sequences, the primers combinations S1+S2 and P1+P2 were considered for specific detection of Sphaerotheca humuli and Pseudoperonospora humuli, respectively, in hop plants.
Discussion
ITS1 and ITS2 regions of ribosomal units are more variable in sequences than rRNA genes and have potential for distinguishing species (Grote et al., 2002). Therefore, PCR primers designed from these regions allowed the species-specific identification of Pseudoperonospora humuli and Sphaerotheca humuli in hop plants. The PCR assays were reliable in detecting pathogen from plant extracts exhibiting different degrees of disease severity, with positive amplification resulting from symptomatic and asymptomatic plant organs (Figure 1) The detection of the target fungal DNA from heavily infected, as well as from weakly infected tissue without symptoms or with barely visible symptoms, indicate that the assays are robust and sensitive. Similar systems were described for other fungal pathogens on different plants (Moricca et al., 1998, Chen et al., 1999, McKay et al., 1999, Grote et al., 2002). A multiplex PCR is a valuable diagnostic tool for rapid detection of several pathogens in host plants (Fraaije et al., 2001). PCR primers combinations R1+R2 and R3+R4 can possible use in multiplex PCR detection of different fungal pathogens in hop. PCR primer R1 and R2 distinguished species Sphaerotheca humuli, Verticillium albo-atrum and Fusarium sambucinum, unless Pseudoperonospora humuli and Humulus lupulus (Figure 1a). PCR primer R3 and R4 distinguished species Pseudoperonospora humuli, Verticillium albo-atrum and Humulus lupulus, unless Sphaerotheca humuli and Fusarium sambucinum (Figure 1b). Specific PCR primers also reliable detected double infection with Pseudoperonospora humuli and Sphaerotheca humuli in hop plant (Figure 1).
The phylogenetic study of the relationships between Pseudoperonospora humuli and 46 related species of Oomycetes (not shown) corresponded with described phylogenies (Cooke et al., 2000, Petersen and Rosendhal, 2000, Reithmüller et al., 2002) Reithmüller et al. (2002) reported about molecular characterisation of 26S rDNA unit of Pseudoperonospora humuli, which was closely related to Pseudoperonospora cubensis and Pseudoperonospora urticae. Unfortunately, nuclear rDNA sequences (ITS1, 5.8S, ITS2) of these pathogens have not been known up to now. Analysis of relationships to other genera suggested that Pseudoperonospora may be affiliated with Peronospora (Reithmüller et al., 2002), which was supported with sequence homologies to Perenospora sp. Our study supported that Phytophthora should be removed from Pythiales to Perenosporales, as suggested Petersen and Rosendahl (2000). The molecular characterisation and phylogenetic analysis confirmed species identification of Pseudoperonospora humuli, which differed from another hop fungal pathogen – Phytophthora humicola (not shown).
The phylogenetic study of the relationships between Sphaerotheca humuli and 41 related species of Erysiphales (not shown) corresponded with described phylogenies (Saenz and Taylor, 1999, Takamatsu et al., 2000). Unfortunately, another molecular characterisation of this pathogen has not been published up to now. It is the first report about molecular phylogenetic relationships of this fungus, which was closely related to Sphaerotheca filipendulae and Sphaerotheca ferrugunea from sequence homologies. Both these pathogens occurred in subclade Sphaerotheca section Sphaerotheca of Cystotheceae, which infected 806 plant species, including hop (Takamatsu et al., 2000). Phylogenetic differences of Cystotheceae clade from Erysiphe clade were similar to published results by Saenz and Taylor (1999). The molecular characterisation and phylogenetic analysis confirmed certainly species identification of Sphaerotheca humuli.
This study demonstrated that specific PCR primers can be used to detect fungal pathogens Pseudoperonospora humuli and Sphaerotheca humuli in naturally infected hop
16
plants for efficient control and monitoring. Molecular characterisation and phylogenetic analysis of nuclear rDNA sequences can be used for exact classification of fungal pathogens and they are necessary for future investigations of downy and powdery mildews in hop.
Acknowlegments
The author wishs to give special thanks to Dr. František Veselý from Hop Research Institute Co.Ltd., Žatec, Czech Republic for his help with the identification of individual hop diseases and pathogens. The author wishs to give special thanks to Dr. Sebastjan Radišek, Institute of Hop Research and Brewing, Žalec for fungal DNA. References Chen W, Gray LE, Kurle JE and Grau CR (1999) Specific detection of Phialophora gregata
and Plectosporium tabacinum in infected soybean plants using polymerase chain reaction. Molecular Ecology 8: 871-877
Cooke DE, Drenth A, Duncan JM, Wagels G and Brasier CM (2000) A molecular phylogeny of Phytophthora and related oomycetes. Fungal Genetics and Biology 30: 17-32
Fraaije BA, Lovell DJ, Coelho JM, Baldwin S and Hollomon DW (2001) PCR-based assay to asses wheat varietal resistance to blotch (Septoria tritici and Stagonospora nodorum) and rust (Puccinia striiformis and Puccinia recondita) diseases. European Journal of Plant Pathology 107: 905-917
Grote D, Olmos A, Kofoet A, Tuset JJ, Bertolini E and Cambra M (2002) Specific and sensitive detection of Phytophthora nicotianae by simple and nested-PCR. European Journal of Plant Pathology 108: 197-207
McKay GJ, Brown AE, Bjourson AJ and Mercer PC (1999) Molecular characterisation of Alternaria linicola and its detection in linseed. European Journal of Plant Pathology 105: 157-166
Moricca S, Ragazzi A, Kasuga T. and Mitchelson KR (1998) Detection of Fusarium oxysporum f.sp. vasifectum in cotton tissue by polymerase chain reaction. Plant Pathology 47: 486-494
Neve RA (1991) Hops. Chapman a Hall, London Petersen AB and Rosendahl S (2000) Phylogeny of the Peronosporomycetes (Oomycota)
based on partial sequence of the large ribosomal subunit (LSU rDNA). Mycological Research 104: 1295-1303
Reithmüller A, Voglmayr H, Göker M, Weiß M and Oberwinkler F (2002) Phylogenetic relationships of the downy mildews (Perenosporales) and related groups based on nuclear large subuunit ribosomal DNA sequences. Mycologia 94: 834-849
Saenz GS and Taylor JW (1999) Phylogeny of the Erysiphales (powdery mildews) inferred from internal transcribed spacer ribosomal DNA sequences. Canadian Journal of Botany 77: 150-160
Seigner E, Seefelder S, Haugg B, Hesse H, Rösch H. and Felsenstein F (2001) Investigations on the virulence spectrum of hop powdery mildew (Sphaerotheca humuli). Proceedings of Scientific Commission of IHGC, Canterbury, Kent, England, August 5-7, 33-37
Takamatsu S, Hirata T and Sato Y (2000) A parasitic transition from trees to herbs occurred at least twice in tribe Cystotheceae (Erysiphaceae): evidence from nuclear ribosomal DNA. Mycological Research 104: 1304-1311
17
HOP WILT IN SLOVENIA: CURRENT SITUATION AND DIAGNOSTIC RESEARCH
S. Radišek1, J. Jakše2, A. Simončič3, B. Javornik4
1,3,4Institute of Hop Research and Brewing Žalec, Cesta Žalskega tabora 2, Žalec, Slovenia
2,4Centre for Biotechnology and Plant Breeding, Biotechnical Faculty, University of Ljubljana, Ljubljana, Slovenia
Abstract The lethal form of hop wilt is a serious threat to hop production in Slovenia. Since 1997, V. albo-atrum has caused considerable economic losses in the west part of the Savinja valley and to date has affected more than 160 ha of hop gardens in that area. To prevent further spread, a monitoring survey has been performed and strict phytosanitary measures have been maintained in infected areas. The occurrence of two forms of hop wilt (mild and lethal) caused by V. albo-atrum in Slovene hop growing areas, has required characterisation of field isolates. Pathogenicity tests and AFLP molecular analysis determined two groups of V. albo-atrum hop isolates, which indicates the appearance of a new, more virulent hop pathotype in the Savinja Valley. INTRODUCTION Hop wilt is one of the most important diseases of hop. It is caused by Verticillium albo-atrum Reinke & Berthold and Verticillium dahliae Klebahn, which are among tracheomycotic parasites of hop and other plants. In Europe, these two fungi cause considerable economic damage on hop and their hop pathotypes are therefore on the EPPO list of quarantine pathogens. Of the two aforementioned fungi, V. albo-atrum is the principal pathogen in most hop growing areas. The only effective means of control of hop wilt is planting resistant cultivars and carrying out phytosanitary measures. This disease appears in the mild or lethal (progressive) forms, depending on the pathogen pathotype, sensitivity of cultivars and ecological factors (Isaac and Keyworth, 1948; Sewell and Wilson, 1974; Talboys, 1972). The main difference between the forms is that the lethal one causes withering of hop, whereas with the mild form, plants continue to grow. Hop wilt in the mild form was first reported in England in 1924 (Harris, 1927). A few years later, in 1933, the lethal form was discovered, and by 1960 had affected around 2400 hectares of hop gardens (Jary, 1961). In Slovenia, the mild form of hop wilt was first identified as a cause of infections by both Verticillium species in 1974 (Dolinar, 1975). Until 1997, the disease appeared only sporadically in some hop gardens, but in that year, an outbreak of the lethal form of hop wilt was registered in the west part of the Savinja valley and V. albo-atrum was identified as the infectious agent. During the next five years, the lethal form of hop wilt spread rapidly in this part of the Savinja valley and all Slovene cultivars were infected. Since 1998, the Institute of Hop Research and Brewing Žalec, co-ordinated by the Ministry of Agriculture, Forestry and Food (MAFF), has carried out a monitoring survey of hop gardens. In addition, legislation was included the Order on protective measures for preventing the spread and for the suppression of hop wilt (Official Gazette RS, no. 45/01 and 117/02). This order defines all phytosanitary measures intended to prevent the spread of hop wilt, particularly to non-contaminated areas. Research is a very important part of hop wilt activities in Slovenia, particularly in diagnosis of the hop wilt pathogen. The occurrence of two hop wilt forms caused by V. albo-atrum in Slovene hop growing areas required the characterisation of field isolates. Characterisation of the pathogen population according to variation in virulence is important for disease management strategies, and hop isolates have been best characterised by pathogenicity tests on different hop cultivars (Clarkson and Heale, 1985; Sewell and Wilson, 1984). We
18
report here on the identification of two V. albo-atrum hop pathotypes by pathogenicity tests and AFLP molecular markers. MATERIALS AND METHODS Monitoring survey The monitoring survey provides detection and determination of infection in hop gardens.. It includes visual inspections of hop gardens, sampling, laboratory analysis and expert support. The monitoring survey includes all hop growing areas in Slovenia during the vegetation period, with a focus on the following hop gardens: • those in which hop wilt has been found, • those that are located near infected hop gardens, • those in which the same equipment is used by different hop growers, and • nurseries. Samples for laboratory analysis are taken from plants showing hop wilt symptoms, other plants in the exposed area and plants in randomly selected locations to detect possible latent hop wilt infections. Samples consist of approximately 20 cm long bines, which are cut from the plant at a height of 20 – 80 cm from the ground. The classical method of fungi isolation and PDA (potato dextrose agar) medium are used for determination of the pathogens. Fungal isolates Isolates of V. albo-atrum and V. dahliae were obtained from infected hop plants (mild or lethal) in different hop growing areas in Slovenia. All isolates were maintained as monosporic cultures on PDA at 4 ºC in the dark. The species identity of each isolate was checked by light microscopy. Pathogenicity tests Pathogenicity tests were performed in an isolated test plot under field environmental conditions. The hop cultivars Fuggle, Wye Target, Celeia and Cicero, with known resistance/susceptibility to infection by V. albo-atrum, were used as reference cultivars (Clarkson and Heale, 1985; Radišek et al., 2001a). The plant material was used as clonally propagated cuttings. The plants were grown in 4 litre plastic pots and plant growth was restricted to a single bine with regular pruning of the lateral shoots. The inoculum from tested isolates was prepared by growing monosporic cultures on PDA plates at room temperature for 10 days. The cultures were rinsed with sterile distilled water and the conidial density of the isolates was adjusted with a Thoma-chamber to approximately 2 x 10⁶ conidia per ml. Six-week old plants (ten of each cultivar) were inoculated by stem-puncture inoculation in the basal part of the bine. Control plants were similarly injected with sterile distilled water. Symptoms were assessed four weeks after inoculation and then at weekly intervals for a further two weeks, on a 0–5 scale according to the proportion of foliage affected by wilt symptoms. A score of 0 indicates no leaf symptoms, 1 = 1 to 20 % leaf area wilted, 2 = 21 to 40 % leaf area wilted, 3 = 41 to 60 % leaf area wilted, 4 = 61 to 80 % leaf area wilted and 5 = 81 to 100 % leaf area wilted. The level of disease severity for each plant was expressed by a severity index, which was calculated according to the Townsend-Heuberger formula (Püntener, 1981). The severity indexes were subjected to one-way analysis of variance.
DNA extraction and AFLP analysis For total DNA extraction, isolates were cultivated in general fungal medium (Weising et al., 1995) at room temperature by agitation on a rotary shaker. The mycelium was harvested by centrifugation at 2500 x g for 5 minutes and rinsed with sterile distillate water. Genomic DNA
19
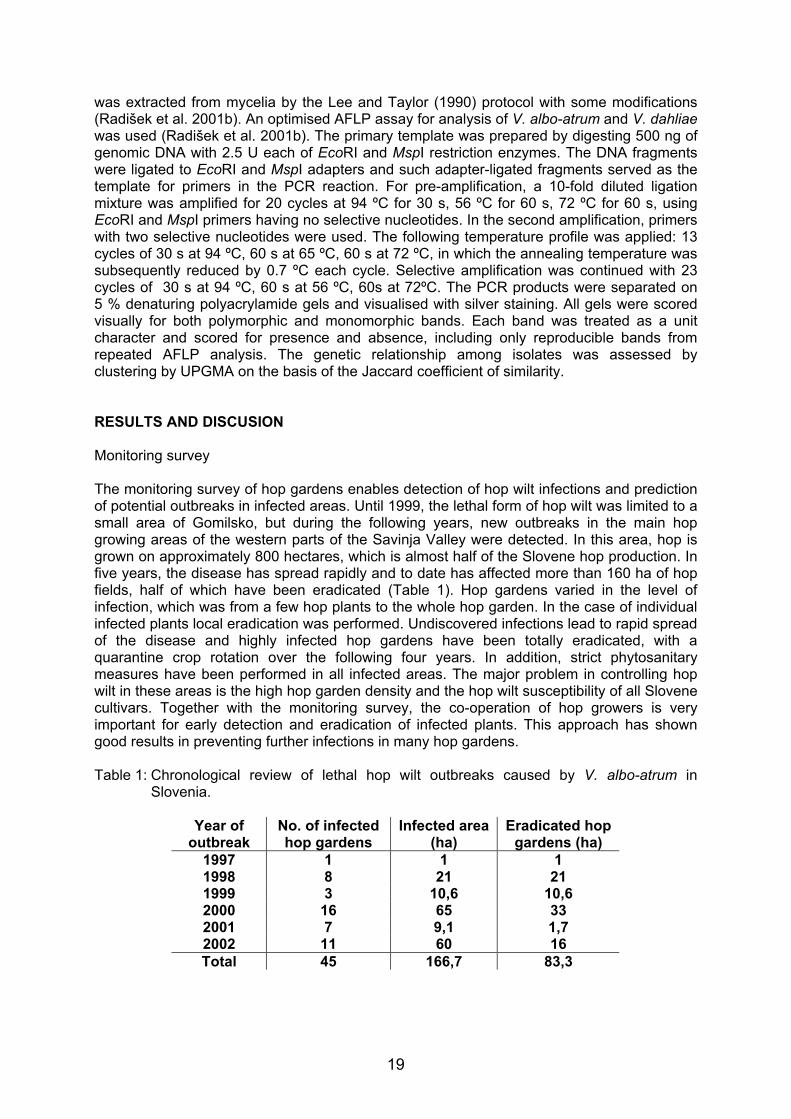
was extracted from mycelia by the Lee and Taylor (1990) protocol with some modifications (Radišek et al. 2001b). An optimised AFLP assay for analysis of V. albo-atrum and V. dahliae was used (Radišek et al. 2001b). The primary template was prepared by digesting 500 ng of genomic DNA with 2.5 U each of EcoRI and MspI restriction enzymes. The DNA fragments were ligated to EcoRI and MspI adapters and such adapter-ligated fragments served as the template for primers in the PCR reaction. For pre-amplification, a 10-fold diluted ligation mixture was amplified for 20 cycles at 94 ºC for 30 s, 56 ºC for 60 s, 72 ºC for 60 s, using EcoRI and MspI primers having no selective nucleotides. In the second amplification, primers with two selective nucleotides were used. The following temperature profile was applied: 13 cycles of 30 s at 94 ºC, 60 s at 65 ºC, 60 s at 72 ºC, in which the annealing temperature was subsequently reduced by 0.7 ºC each cycle. Selective amplification was continued with 23 cycles of 30 s at 94 ºC, 60 s at 56 ºC, 60s at 72ºC. The PCR products were separated on 5 % denaturing polyacrylamide gels and visualised with silver staining. All gels were scored visually for both polymorphic and monomorphic bands. Each band was treated as a unit character and scored for presence and absence, including only reproducible bands from repeated AFLP analysis. The genetic relationship among isolates was assessed by clustering by UPGMA on the basis of the Jaccard coefficient of similarity. RESULTS AND DISCUSION Monitoring survey The monitoring survey of hop gardens enables detection of hop wilt infections and prediction of potential outbreaks in infected areas. Until 1999, the lethal form of hop wilt was limited to a small area of Gomilsko, but during the following years, new outbreaks in the main hop growing areas of the western parts of the Savinja Valley were detected. In this area, hop is grown on approximately 800 hectares, which is almost half of the Slovene hop production. In five years, the disease has spread rapidly and to date has affected more than 160 ha of hop fields, half of which have been eradicated (Table 1). Hop gardens varied in the level of infection, which was from a few hop plants to the whole hop garden. In the case of individual infected plants local eradication was performed. Undiscovered infections lead to rapid spread of the disease and highly infected hop gardens have been totally eradicated, with a quarantine crop rotation over the following four years. In addition, strict phytosanitary measures have been performed in all infected areas. The major problem in controlling hop wilt in these areas is the high hop garden density and the hop wilt susceptibility of all Slovene cultivars. Together with the monitoring survey, the co-operation of hop growers is very important for early detection and eradication of infected plants. This approach has shown good results in preventing further infections in many hop gardens. Table 1: Chronological review of lethal hop wilt outbreaks caused by V. albo-atrum in
Slovenia.
Year of outbreak
No. of infected hop gardens
Infected area (ha)
Eradicated hop gardens (ha)
1997 1 1 1 1998 8 21 21 1999 3 10,6 10,6 2000 16 65 33 2001 7 9,1 1,7 2002 11 60 16 Total 45 166,7 83,3
20
Pathogenicity tests and AFLP analysis
Twenty-three V. albo-atrum isolates from different hop growing areas in Slovenia were taken for pathogenicity testing in 2001 and 2002. Test cultivars Fuggle, Wye Target, Celeia and Cicero expressed symptoms approximately four weeks after the stem inoculation as interveinal chlorosis, necrosis and defoliation of plants. All isolates of V. albo-atrum obtained from the lethal form of hop wilt induced the severe symptoms on the susceptible cultivars Fuggle and Celeia and mild symptoms on the other two inoculated cultivars. Isolates from the mild form of hop wilt induced mild symptoms on both susceptible cultivars and no symptoms on Wye Target and Cicero cultivars. Measurements of disease severity for each of the four hop cultivars revealed differences in the pathogenicity that confirmed two pathogenicity groups, designated PG1 and PG2. The first group (PG1) represents V. albo-atrum isolates obtained from different hop growing areas in Slovenia that were isolated from plants showing mild hop symptoms. All isolates from the lethal hop wilt (PG2 group) were from the western part of Savinja Valley, which indicates the appearance of a new pathotype of V.albo-atrum in this area. In order to supplement the pathogenicity test, molecular characterisation of isolates using AFLP analysis was employed. The AFLP technique was optimised for the analysis of V. albo-atrum and V. dahliae (Radišek et al., 2001b). Twenty isolates of V. albo-atrum, of which twelve were isolated from plants affected with the lethal form of hop wilt, six were from plants with the mild form, one from cucumber and one from petunia, were analysed. V. dahliae hop and green pepper were also included in the analysis. Seven isolates were initially screened with 39 primer combinations. Primer pairs generally produced 17 to 51 bands in a range of 50 to 800 base pairs. Based on initial screening, seven primer pairs were chosen to analyse differences among all isolates. The AFLP analysis well separated both Verticillium species into two clusters, with a genetic similarity value of 0.21. In the case of the V. dahliae cluster, hop and green pepper isolates were clearly differentiated. In the V. albo-atrum cluster, two well defined subgroups were determined, which correlated with the results of pathogenicity tests. The cucumber and petunia isolates were distinct from the hop isolates but they showed more similarities with mild types. Minor genetic variations were detected in both subgroups, but a clear grouping of V. albo-atrum hop isolates according to their level of virulence demonstrates genetic differences of hop V. albo-atrum pathotypes.
REFERENCES
Clarkson, J. M. and Heale, J. B. 1985. Pathogenicity and colonization studies on wild-type and auxotrophic isolates of Verticillium albo-atrum from hop. Plant Pathology 34:119-128.
Dolinar, M. 1975. Hop wilt (Verticillium albo-atrum in Verticillium dahliae). Report for 1975. Žalec, Institute of Hop Research and Brewing Žalec, Slovenia Harris, R. V. 1927. A wilt disease of hops. East Malling Research Station Annual Report for 1925, II Suplement: 92-93. Isaac, I., and Keyworth, W. G. 1948. Verticillium wilt of the hop (Humulus lupulus). A study of the pathogenicity of isolates from fluctuating and from progressive outbreaks. Annals of Applied Biology 35:243-249. Jary C. L., 1961. A summary of the present position. Association of Growers of the New Varieties of Hops. Annual Booklet: 11
21
Lee, S. B., and Taylor, J. W. 1990. Isolation of DNA from fungal mycelia and single spores. In: PCR Protocols. A Guide to Methods and Applications. Innis, M. A., Gelfand, D. H., Sninsky, D. H., and White, J. J., Eds T. J. (eds). San Diego, Academic Press. Püntener, W., ed. 1981. Manual for Field Trials in Plant Protection. 2th. ed, Documenta Ciba-Geigy Agricultural Division. Basle, Switzerland. Radišek, S., Jakše, J., and Javornik, B. 2001a. Optimisation of amplified fragment length polymorphism (AFLP) analysis of hop wilt (Verticillium albo-atrum and Verticillium dahliae). Research reports (Agriculture), Biotechnical Faculty, University of Ljubljana, 77-2:139-146. Radišek, S., Dolinar, M., Simončič, A., and Žolnir, M. 2001b. The state and activities performed to control hop wilt (Verticillium albo-atrum Reinke & Berthold and Verticillium dahliae Klebahn) in Slovenia in the year 2000. Hop bulletin, 8: 43-46. Sewell, G. W. F., and Wilson, J. F. 1974. Hop wilt, soil temperature and nitrogen. East Malling Research Station Annual Report for 1973:203-204. Sewell, G. W. F., and Wilson, J. F. 1984. The nature and distribution of Verticillium albo-atrum strains highly pathogenic to the hop. Plant Pathology 33:39-51. Talboys, P. W. 1972. Resistance to vascular wilt fungi. Proceedings of the Royal Society (London) 181:319-333. Weising, K., Nybom, H., Wolff, K., and Meyer, W. 1995. Fingerprinting in plants and fungi. London, CRC Press, Inc.
22
CHLOROSIS, WILTING AND DRYING OF HOPS
J. Sabo1, Tanja Đurić2 and S. Jasnić1
1Institute of Field and Vegetable Crops, Novi Sad, Yugoslavia 2AD "Bio-Ecological Center" Zrenjanin, Yugoslavia
Introduction. When hops are grown for several years in the same plot, favorable microclimatic conditions are created for the development and heavy infestations of a number of parasites, especially soil microorganisms, which are capable of inflicting heavy damage to hop production. Wishing to contribute to the etiological explanations of leaf chlorosis, basal stem, crown and root necroses and wilting and drying of hop plants, we have studied these diseases in hop gardens of the Vojvodina Province, the traditional hop-growing region in our country. Leaf chlorosis and wilting and drying of parts or whole hop plants were not uniformly distributed. They were more frequent in old gardens, in which the percentages of infected plants ranged between 5% and 80%, in dependence of location and year. In the long-term study conducted in the period 1994-2000, numerous isolates of infected tissues from hop stems, crowns and root produced several kinds of fungi. Fungi from the genus Fusarium were frequent, the species Rhizoctonia solani, Verticillium albo-atrum and Pythium mamillatum were rare. Since there are only scant data in domestic and international literature on the occurrence of chlorosis, wilting and drying in hops, we decided to study symptoms of these diseases, determine cultivation and morphological characteristics of the causal fungi, check their pathogenicity and identify them. The obtained results are presented in this paper.
Material and methods Isolation of fungi. Hop plants clearly showing disease symptoms were sampled in hop gardens from different locations in the Vojvodina Province. The infected plants were dug out and taken to the laboratory of the Plant Protection Department of the Institute of Field and Vegetable Crops in Novi Sad. Parasitic fungi were isolated on freshly prepared potato dextrose agar (PDA). For isolation of Pythium mamillatum, a special differential substrate (Cvjetković, 1982) was used. Small tissue fragments from the transitional zone between healthy and nectoric tissues of the stem, crown and root served for isolation. After disinfection and rinsing in sterilized water, they were placed on the substrate. Developing colonies were transferred onto a slanted substrate to obtain pure fungal cultures for further study. Cultivation and morphological characteristics of the fungi. To study the cultivation and morphological characteristics of th eisolated fungi, they were grown in a thermostat at 250C. Growth, appearance, color and shape of colonies were observed visually during 20 days of cultivation. Morphological characteristics of the fungi were observed for determination purposes. Fifty reproductive organs and mycelia were measured from each fungus. In the case of the genus Fusarium, characteristics were determined on PDA as well as on CLA. The fungi were grown 40 cm away from the source of light, which consisted of three white neon tubes and one black light. Pathogenicity test. The pathogenicity of the obtained fungal isolates was tested by inoculating cuttings and shoots of the hop varieties Bačka and Brewer's Gold.
Inoculation of hop cutting and shoots. Hop cuttings and shoots were inoculated by making longitudinal incisions, 1.5-2 cm long, inserting fragments of 7-day-old fungal colonies into them and covering the wounds with the incised bark. Six cuttings were inoculated in that way, which were then placed in pots filled with sterilized perlite and water as needed. Shoots were inoculated 42 days after placing the cuttings into the pots. The best-developed shoot from each cutting was selected for inoculation. Basal stems of six cutting were inoculated in that way. Six injured cuttings and six injured shoots which were not inoculated with fungi served as controls.
23
Changes occuring on the inoculated shoots were monitored periodically during a period of 100 days. After that period, the plants were taken out from the perlite, to assess changes developing in consequence to the reisolation of the parasites.
Results Fusarium species as agents of chlorosis, wilting and drying of hop plants. Inspections of hop gardens in several location in the Vojvodina Province (Bački Petrovac, Parage, Silbaš, Kulpin and Selenča) showed that leaf chlorosis and wilting of hop plants occurred on tha varieties Brewer's Gold, Aroma and Blisk, while the occurrence of the diseases was somewhat less intensive on the variety Bačka. The initial symptoms were evident on the underground and basal plant parts (roots, crown or underground lateral shoots), in the form of dark brown necroses of the bark and the woody parts. After that, the parasites expanded to infect the adjoining tissues, especially conductive vessels, thus interrupting or completely stopping the flow of water and nutrients. Consequently, the aboveground plant parts started to retard in growth, the leaves became chlorotic and shoots wilted and dried up. Fusarium species were most frequently isolated from the plants exhibiting the above symptoms. The study of cultivation and morphological characteristics of the isolated fungi from the genus Fusarium showed that they belonged to the species F. proliferatum, F. oxysporum, F. culmorum, F. acuminatum and F. solani. F. oxysporum and F. culmorum were most frequent, with the species F. solani dominating in some locations. All inoculated isolates exhibited varying degrees of pathogenicity to hop plants. The inoculated plants gradually perished and some of them wilted and dried up completely. The number of wilted and completely dry plants was one or two out of the six inoculated plants, the actual number depending on Fusarium species. The inoculated shoots had chlorotic leaves, the necrosis spreading from shoot tip towards its basal part. Ninety days after inoculation, all plants inoculated by the various Fusarium species were wilted and dry. The control plants were vital and free of pathological changes. The fungal species mentioned above were reisolated from the inoculated plants. Rhizoctonia solani - an agent of chlorosis, wilting and drying of hop plants.
In Bački Petrovac in the spring, necrotic zones which were clearly distinguished from the healthy tissue could be seen on the bark of the basal stems of the varieties Brewer's Gold and Bačka. The symptoms were considerably more pronounced in the variety Bačka. In both varieties the necrosis frequently spread to the subepidermal tissue which tended to rot and disintegrate. The bark inside the necrotic zones cracked and developed deep lesions. Slight chlorosis of leaves was evident on the infected plants. In the case of the variety Bačka, the necrosis reached conductive vessels spreading to the crown and the root system. These plants had chlorotic and wilted leaves. Wilting and drying of complete plants was frequent. Based on the appearance and color of mycelia, dimensions and branching pattern of hyphae, presence and dimensions of monilioid cells and the presence of sclerotia, the analyzed isolates were identified as R. solani. Changes on the inoculated cuttings and shoots attested to the pathogenicity of the R. solani isolates. Of the six cuttings that were inoculated, four perished due to necrosis and rotting and two were only partially necrosed. The completely necrosed cuttings did not put forth shoots. Of the six inoculated shoots, three were completely necrosed, as well as the parts of cutting from which these shoots developed. The other three shoots were partially necrosed. The leaves on the inoculated shoots were small and chlorotic. The control plants showed no symptoms of the disease. R. solani was reisolated from the infected plants. Verticillium albo-atrum - an agent of wilt in hops.
Wilting of individual hop plants of the variety Bačka was observed in several hop gardens in the location of Bački Petrovac. The plants from which the species V. ablo-atrum was isolated had thickened and necrosed stems. The leaves at first acquired a reddish hue and became necrotic later on. These leaves would fall off when touched. Cross sections of the thickened stems showed that the conductive vessels were necrosed, which frequently
24
resulted in the wilting of complete plants. The crowns and roots of the infected plants were necrosed to a varying degree. Based on the cultivation characteristics of fungal isolates, the appearance and dimensions of the hyphae and conidiophores, their branching and the number of phialids and the dimensions and appearance of conidia, this agent of hop wilt was identified as Verticillium albo-atrum. On inoculation, five out of the six inoculated cuttings became completely necrosed and they did not put forth shoots. One cutting was partially necrosed and it developed a single, short shoot. Disease symptoms could not be seen on the control cuttings. Each of them developed six shoots. The inoculated shoots suffered a slight leaf chlorosis and a necrosis of the edges of the lamina. Cross sections of the shoots showed a necrosis of the conducting vessels. The control was symptom-free. V. albo-atrum was reisolated from the inoculated plants. Pythium mamillatum - an agent of chlorosis, wilt and drying of hop plants.
Hop plants exhibiting symptoms of wilt and stem and root necrosis were sampled in a hop garden in th elocation of Selenča for isolation of causal agents. Isolations on a differential substrate containing malt, pentrexyl and benomyl produced the fungus Pythium mamillatum. The infected plants typically had chlorotic leaves and they exhibited the symptoms of wilt. Irregularly shaped necrotic areas could be seen on the basal parts of the stem of the wilted plants. In some instances the areas coalesced, forming a ring around the stem. The roots of the infected plants were necrosed for a large measure. Longitudinal sections of stems and roots showed light brown necrosis spreading to the conductive vessels. The infected tissues partially rotted and disintegrated. Some infected plants dried up completely. Such plants had completely dried leaves and necrotic stem and roots. Based on the cultivation and morphological characteristics of the isolates taken from infected plants, the fungus was determined as P. mamillatum. The fungus formed a non-septated mycelium with typical swellings, oogonia, antheridia and permanent spores - oospores. The walls of the oogonia were covered with numerous projections of variable lengths. Inoculation of hop cuttings and shoots confirmed the pathogenicity of this fungus. Of the six inoculated cuttings, five were completely necrosed and one was partially necrosed. The completely necrosed cuttings did not produce shoots. Their roots were poorly developed and partially rotten. Of the six inoculated shoots, two were completely necrosed, just as the portions of the cuttings from which they emerged. The remaining four shoots were partially necrosed. Their leaves were smaller than those of the control and they were also chlorotic. The non-inoculated plants were free of disease symptoms. P. mamillatum was reisolated from the inoculated plants.
Discussion The five-year study of the parasitic mycoflora of hops showed that several fungal
species caused the symptoms of leaf chlorosis, necrosis of different plant parts and the wilting and drying of hop plants. Several fungal species were isolated from hop plants exhibiting the above symptoms. The most frequently isolated species belonged to the genus Fusarium: F. oxysporum, F. solani, F. culmorum, F. proliferatum and F. acuminatum. Among these, F. oxysporum and F. acuminatum were most frequent. Hop wilting was observed for the first time in the Vojvodina Province in 1963 (Aćimović, 1963). This author estimated the percentages of wilted plants at 1% in new hop gardens and from 5 to 20% in old ones. Iz uvelih biljaka izolovane su Fungi from the genus Fusarium were isolated from wilted plants but the author did not determine the species nor did he examine their pathogenicity. According to literature data, the agents of wilting in most hop-growing countries are regularly fungi from the genus Fusarium, F. sambucinum being the most frequent species (Dolinar, 1973 in Slovenia; Keyworth et al., 1940; Royle, 1978 in England; Pichlmaier et al., 1992 in Germany; Solarska, 1977; Pitrowski et al., 1981 in Poland; Christie, 1957 in New Zealand, etc.). This species, known as the agent of hop canker, root rot and wilt, was not found on the isolated examined in this study. However, the species F. oxysporum, which is
25
also known as a parasite of hops in Europe (Harling et al., 1984; Križ, 1958; Dolinar, 1974; Solarska, 1977; etc.), was frequently isolated from the infected plants. According to the available data, the species F. solani, F. proliferatum and F. acuminatum have not been described as parasites of hops. Our tests confirmed their pathogenicity on the hop. The fungus Rhizoctonia solani is a polyphagous parasite, which parasitizes over 200 plant species from 66 families (Viennot-Bourgin, 1949). In our country, it was described as a parasite of hops for the first time in 1998 (Jasnić et al., 1998). There are scant literature data on the occurrence of R. solani on hops. It was observed for the first time by Jones (1952) in British Columbia, on the variety Brewer's Gold. R. solani as a parasite of hops was also mentioned in the former Czechoslovakia (Horsky, 1987). Our study confirmed the presence of R. solani on hops in the Vojvodina Province. This species occurs sporadically and for the present it should be considered as a minor parasite. Fungi from the genus Verticillium, agents of wilt, have been found in many countries where they pose serious economic problems in hop production (Leibelt, 1972 in Germany; Keyworth et al., 1942 in England; Piotrowski et al., 1981 in Poland; Horner, 1965 in the USA; Christie, 1957 in New Zealand; and many other authors from different parts of the world). V. albo-atrum was registered for the first time in our country in 1997, in the location of Bački Petrovac (Jasnić et al., in press). In the former Yugoslavia, V. albo-atrum was registered in Slovenia, as a wilt disease dominating on heavy soils, and V. dahliae, dominating on sandy soils (Dolinar, 1974). The wilt registered in Slovenia in 1974, was a mild form of the disease which did not have a serious impact on hop yield. However, the strain registered in Slovenia in 1997 was found to be lethal for hops, causing large-scale wilting and extensive damage (Dolinar et al., 1999; Simončić et al., 1999). Taking into account the experiences of the hop growers from Slovenia from other countries in Europe and other continents, the occurrence of the fungus V. albo-atrum in our hop gardens should be taken seriously. The species Pythium mamillatum was isolated from wilted hop plants for the first time in 1999 (Jasnić et al., 1999). This species has not been described before as a parasite of hops. According to a literature source from India, the species Pythium intermedium was isolated on hops (Damle, 1952). This seems to be the only literature source on this genus parasitizing the hop. The species P. mamillatum is known as the agent of seedling damping-off and root rot in various plant species such as sugarbeet, wheat, cotton, sugar cane, alfalfa, cucumbers, pineapple, forest trees (Domsch et al., 1968), etc. Although P. mamillatum was isolated from only a few plants from a single location in the Vojvodina Province, its pathogenicity exhibited under inoculation shows that this parasite of hops should be treated with due care.
Conclusion The long-term study of the occurrence of leaf chlorosis and wilting of hop plants conducted in several locations in the Vojvodina Province showed that these diseases may be caused by fungi from the genus Fusarium and the species Rhizoctonia solani, Verticillium albo-atrum and Pythium mamillatum. The fungal species Fusarium oxysporum and Fusarium culmorum were most frequently isolated from the infected plants. Since their pathogenicity has been confirmed, it was concluded that these fungi played the major role in the ethiologies of leaf chlorosis and wilting of hop plants in the Vojvodina Province. Our observations, made during the long-term study, indicate that the symptoms of leaf chlorosis, necrosis of different plant parts and the wilting of hop plants result from the action of a complex of fungi (Fusarium spp., R. solani, V. albo-atrum, P. mamillatum, etc.) which reside in the soil. To confirm this hypothesis, it is necessary to continue the study of the effects of these fungal species, individually and in combinations, on the manifestation of leaf chlorosis and the wilting of hop plants.
26
Literature Aćimović, M. (1963): Problematika suzbijanja bolesti hmelja i dosadašnji rad na njenom
rešavanju. Zbornik radova Instituta za polj. istraživanja. Jubilarna sveska povodom 25- godišnjice rada ustanove (1938-1963), Novi sad Christie, T. (1957): A black rot of the hop plant, N.Z.I.Sci.Teck., Sect.A., 38, 6:647-648. Cvjetković, B. (1982): Neke vrste roda Phytophthora s posebnim osvrtom na metode
izolacije. Poljoprivredna znanstvena smotra 59: 283-302, Zagreb. Damle, V.P. (1952): Enzymic study of certain parasitic fungi. Indian bot. Soc., 31: 13-55. Dolinar, M. (1973): Verticilij, Fusarij in Fitoftora v hmeljaščik Savinjske doline. Hmeljak 3,
Velenje. Dolinar, M. (1974): Pojav uvelosti hmelja v Sloveniji. Priloga hmeljarja, 8:26. Dolinar, M., Simončić, A. (1999): Hmeljeva uvelost (Verticillium albo-atrum Reinke et
Berthold in Verticillium dahliae Klebahn) v Sloveniji. Hmeljar 68(99), 3-4:32-34,Žalec. Domsch, K.H. Gams, W. Anderson, T.H. (1980): Compendium of soil fungi. Academic Press:
830-833. Horner, C.E. (1965): Verticillium wilt of hops in Oregon. Plant Dis reptr: 49: 538-540. Horsky, V. (1987): Uplatneni fungicidi pri vyrobe chmelovy korenáču. Chmelarstvi 60
(10):151-152, Ustav Razvoje Biotechnologi, Prague. Jasnić, S., Đurić,T., Sabo,J. (1998): Rhizoctonia solani, parazit hmelja u Jugoslaviji.Zaštita
bilja 225: 245-255 Jasnić,S., Đurić, T., Sabo, J. (1999): Pythium mamilatum Meurs, kao parazit hmelja. Zaštita
bilja 229: 217-228. Jasnić,S., Đurić, T., Sabo, J. (2000): Verticiliozno uvenuće hmelja u Vojvodini. Zaštita bilja (in
print). Jones, W. (1952): Infection of basal shoots of hop plants by Rhizoctonia solani. Sci. Agric.32,
2: 114-115. Keyworth, W.G., Davies, D.L.G. (1940): Hop diseases. A report of the preliminary
investigations carried out in 1938 and 1939. on Certain hop diseases-reprinted form I. Kent. Br.N.F.U. eec. 1936. Keyworth, W.G. (1942): Verticillium wilt of hop (Humulus lupulus) Ann appl. Biol. 29: 346-
357. Leibelt, W. (1972): Die Welke des Hoppens und ihre Bekämpfung. Hopf. Rdsch, 23 H. 2,3. Pichlmaier, J., Zinkelnagel, V. (1992): Phytophthora citricola (Sawada) as causal agent of
black root and crown rot of hop. Zeitschrift für Pflanzenkrankheiten und Pflanzenschutz, 99: 5:
505-518. Piotrowski, J., Milczak, M. (1981): Biochemiczne wskrazniki stopnia odpor nosci chmicle na
Verticillium albo-atrum i Fusarium sambucinam. Acta Agrobotanica, Towarzystwo Botaniczne 3: 277-284. Warszawa.
Royle, D.J. (1978): Annual Report for 1977, Department of hop Research Wye College, Aschford, Kent. U.K: 39-46.
Simončić, A., Dolinar, M. (1999): Ukrepi v zvezi s hmejevo uvelostjo v Sloveniji v letih 1998 in 1999., Hmeljar 68 (99), 3-4: 39-40.
Solarska, E. (1977): Wiedniecic infekcyjne chmiclu i proby jego zwalczania. Ochr. Rost, 21 (5): 18-19.
Viennot-Bourgin (1949): Les champignons parasites, Tome II: 1191-1192, Paris.
27
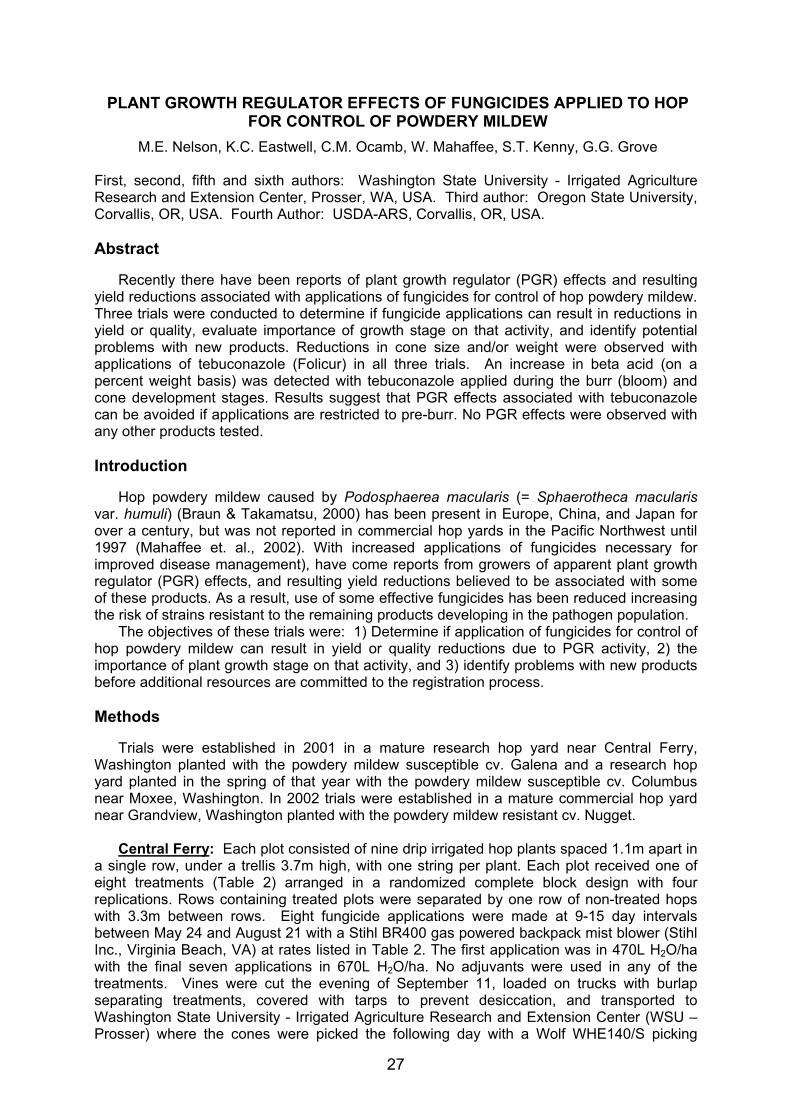
PLANT GROWTH REGULATOR EFFECTS OF FUNGICIDES APPLIED TO HOP FOR CONTROL OF POWDERY MILDEW
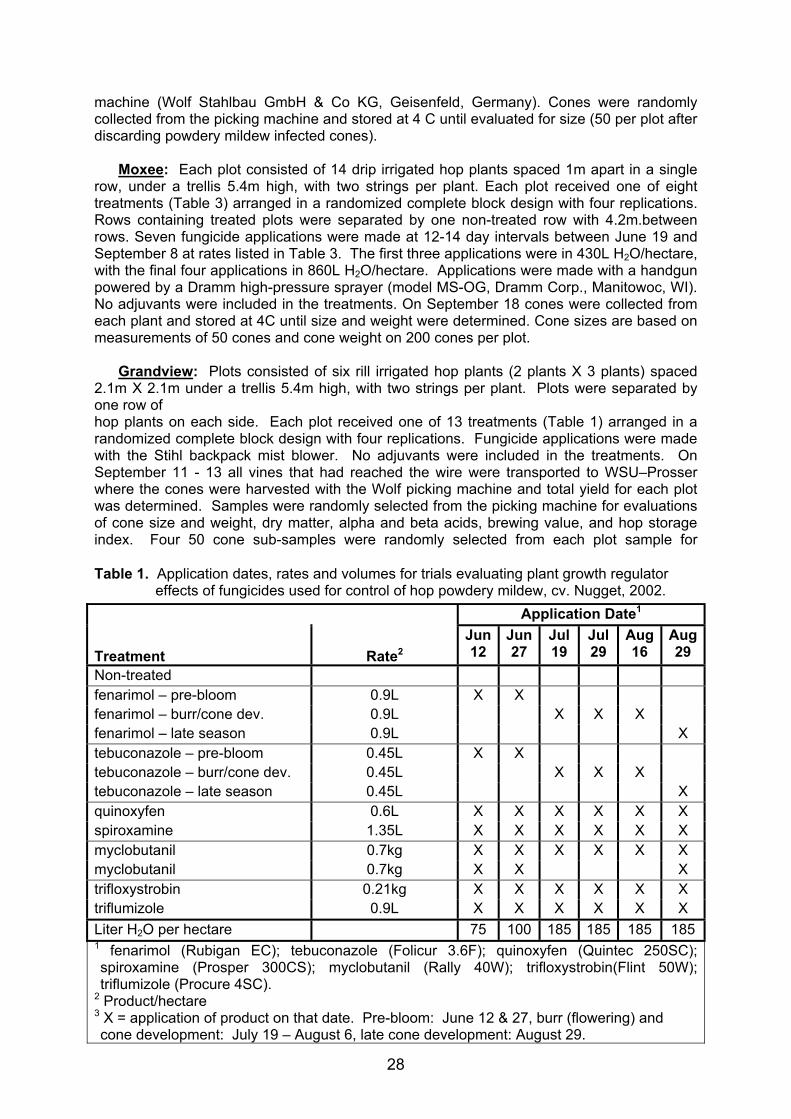
M.E. Nelson, K.C. Eastwell, C.M. Ocamb, W. Mahaffee, S.T. Kenny, G.G. Grove First, second, fifth and sixth authors: Washington State University - Irrigated Agriculture Research and Extension Center, Prosser, WA, USA. Third author: Oregon State University, Corvallis, OR, USA. Fourth Author: USDA-ARS, Corvallis, OR, USA. Abstract Recently there have been reports of plant growth regulator (PGR) effects and resulting yield reductions associated with applications of fungicides for control of hop powdery mildew. Three trials were conducted to determine if fungicide applications can result in reductions in yield or quality, evaluate importance of growth stage on that activity, and identify potential problems with new products. Reductions in cone size and/or weight were observed with applications of tebuconazole (Folicur) in all three trials. An increase in beta acid (on a percent weight basis) was detected with tebuconazole applied during the burr (bloom) and cone development stages. Results suggest that PGR effects associated with tebuconazole can be avoided if applications are restricted to pre-burr. No PGR effects were observed with any other products tested. Introduction Hop powdery mildew caused by Podosphaerea macularis (= Sphaerotheca macularis var. humuli) (Braun & Takamatsu, 2000) has been present in Europe, China, and Japan for over a century, but was not reported in commercial hop yards in the Pacific Northwest until 1997 (Mahaffee et. al., 2002). With increased applications of fungicides necessary for improved disease management), have come reports from growers of apparent plant growth regulator (PGR) effects, and resulting yield reductions believed to be associated with some of these products. As a result, use of some effective fungicides has been reduced increasing the risk of strains resistant to the remaining products developing in the pathogen population. The objectives of these trials were: 1) Determine if application of fungicides for control of hop powdery mildew can result in yield or quality reductions due to PGR activity, 2) the importance of plant growth stage on that activity, and 3) identify problems with new products before additional resources are committed to the registration process. Methods Trials were established in 2001 in a mature research hop yard near Central Ferry, Washington planted with the powdery mildew susceptible cv. Galena and a research hop yard planted in the spring of that year with the powdery mildew susceptible cv. Columbus near Moxee, Washington. In 2002 trials were established in a mature commercial hop yard near Grandview, Washington planted with the powdery mildew resistant cv. Nugget. Central Ferry: Each plot consisted of nine drip irrigated hop plants spaced 1.1m apart in a single row, under a trellis 3.7m high, with one string per plant. Each plot received one of eight treatments (Table 2) arranged in a randomized complete block design with four replications. Rows containing treated plots were separated by one row of non-treated hops with 3.3m between rows. Eight fungicide applications were made at 9-15 day intervals between May 24 and August 21 with a Stihl BR400 gas powered backpack mist blower (Stihl Inc., Virginia Beach, VA) at rates listed in Table 2. The first application was in 470L H2O/ha with the final seven applications in 670L H2O/ha. No adjuvants were used in any of the treatments. Vines were cut the evening of September 11, loaded on trucks with burlap separating treatments, covered with tarps to prevent desiccation, and transported to Washington State University - Irrigated Agriculture Research and Extension Center (WSU – Prosser) where the cones were picked the following day with a Wolf WHE140/S picking
28
machine (Wolf Stahlbau GmbH & Co KG, Geisenfeld, Germany). Cones were randomly collected from the picking machine and stored at 4 C until evaluated for size (50 per plot after discarding powdery mildew infected cones). Moxee: Each plot consisted of 14 drip irrigated hop plants spaced 1m apart in a single row, under a trellis 5.4m high, with two strings per plant. Each plot received one of eight treatments (Table 3) arranged in a randomized complete block design with four replications. Rows containing treated plots were separated by one non-treated row with 4.2m.between rows. Seven fungicide applications were made at 12-14 day intervals between June 19 and September 8 at rates listed in Table 3. The first three applications were in 430L H2O/hectare, with the final four applications in 860L H2O/hectare. Applications were made with a handgun powered by a Dramm high-pressure sprayer (model MS-OG, Dramm Corp., Manitowoc, WI). No adjuvants were included in the treatments. On September 18 cones were collected from each plant and stored at 4C until size and weight were determined. Cone sizes are based on measurements of 50 cones and cone weight on 200 cones per plot. Grandview: Plots consisted of six rill irrigated hop plants (2 plants X 3 plants) spaced 2.1m X 2.1m under a trellis 5.4m high, with two strings per plant. Plots were separated by one row of hop plants on each side. Each plot received one of 13 treatments (Table 1) arranged in a randomized complete block design with four replications. Fungicide applications were made with the Stihl backpack mist blower. No adjuvants were included in the treatments. On September 11 - 13 all vines that had reached the wire were transported to WSU–Prosser where the cones were harvested with the Wolf picking machine and total yield for each plot was determined. Samples were randomly selected from the picking machine for evaluations of cone size and weight, dry matter, alpha and beta acids, brewing value, and hop storage index. Four 50 cone sub-samples were randomly selected from each plot sample for
Table 1. Application dates, rates and volumes for trials evaluating plant growth regulator effects of fungicides used for control of hop powdery mildew, cv. Nugget, 2002.
Application Date1
Treatment Rate2 Jun 12
Jun 27
Jul 19
Jul 29
Aug 16
Aug 29
Non-treated fenarimol – pre-bloom 0.9L X X fenarimol – burr/cone dev. 0.9L X X X fenarimol – late season 0.9L X tebuconazole – pre-bloom 0.45L X X tebuconazole – burr/cone dev. 0.45L X X X tebuconazole – late season 0.45L X quinoxyfen 0.6L X X X X X X spiroxamine 1.35L X X X X X X myclobutanil 0.7kg X X X X X X myclobutanil 0.7kg X X X trifloxystrobin 0.21kg X X X X X X triflumizole 0.9L X X X X X X Liter H2O per hectare 75 100 185 185 185 185 1 fenarimol (Rubigan EC); tebuconazole (Folicur 3.6F); quinoxyfen (Quintec 250SC); spiroxamine (Prosper 300CS); myclobutanil (Rally 40W); trifloxystrobin(Flint 50W); triflumizole (Procure 4SC).
2 Product/hectare 3 X = application of product on that date. Pre-bloom: June 12 & 27, burr (flowering) and cone development: July 19 – August 6, late cone development: August 29.
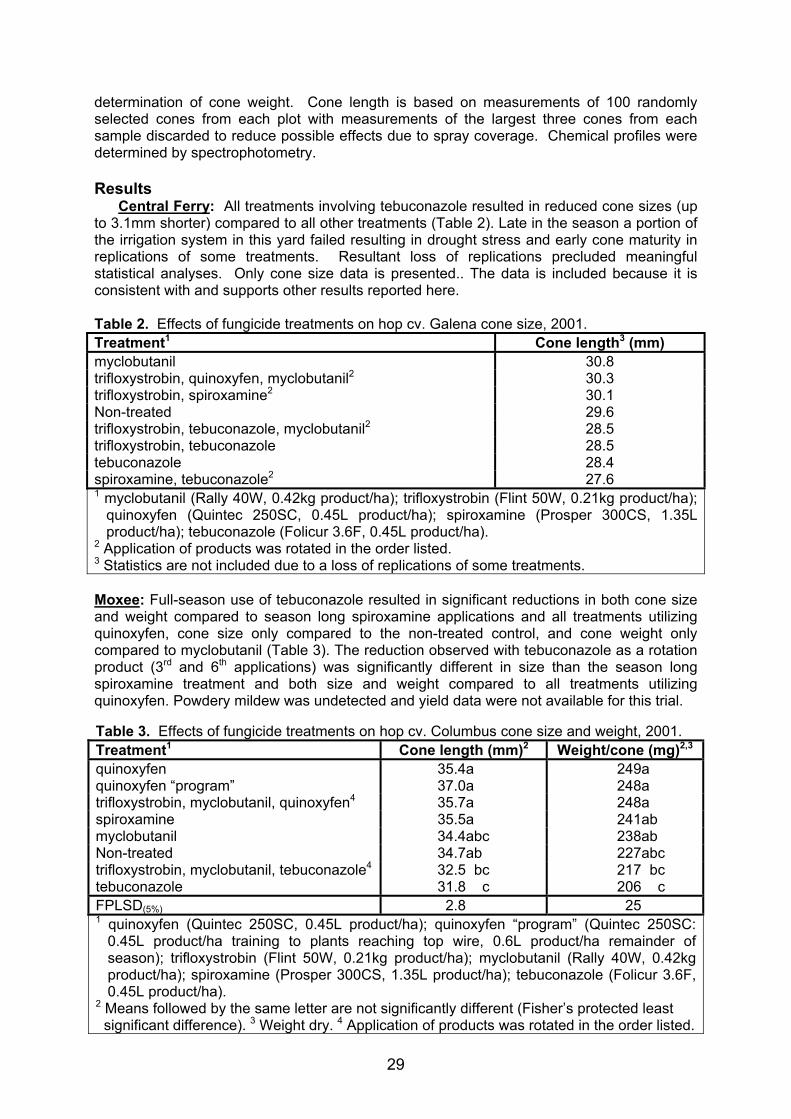
29
determination of cone weight. Cone length is based on measurements of 100 randomly selected cones from each plot with measurements of the largest three cones from each sample discarded to reduce possible effects due to spray coverage. Chemical profiles were determined by spectrophotometry. Results Central Ferry: All treatments involving tebuconazole resulted in reduced cone sizes (up to 3.1mm shorter) compared to all other treatments (Table 2). Late in the season a portion of the irrigation system in this yard failed resulting in drought stress and early cone maturity in replications of some treatments. Resultant loss of replications precluded meaningful statistical analyses. Only cone size data is presented.. The data is included because it is consistent with and supports other results reported here. Table 2. Effects of fungicide treatments on hop cv. Galena cone size, 2001. Treatment1 Cone length3 (mm) myclobutanil 30.8 trifloxystrobin, quinoxyfen, myclobutanil2 30.3 trifloxystrobin, spiroxamine2 30.1 Non-treated 29.6 trifloxystrobin, tebuconazole, myclobutanil2 28.5 trifloxystrobin, tebuconazole 28.5 tebuconazole 28.4 spiroxamine, tebuconazole2 27.6 1 myclobutanil (Rally 40W, 0.42kg product/ha); trifloxystrobin (Flint 50W, 0.21kg product/ha);
quinoxyfen (Quintec 250SC, 0.45L product/ha); spiroxamine (Prosper 300CS, 1.35L product/ha); tebuconazole (Folicur 3.6F, 0.45L product/ha).
2 Application of products was rotated in the order listed. 3 Statistics are not included due to a loss of replications of some treatments. Moxee: Full-season use of tebuconazole resulted in significant reductions in both cone size and weight compared to season long spiroxamine applications and all treatments utilizing quinoxyfen, cone size only compared to the non-treated control, and cone weight only compared to myclobutanil (Table 3). The reduction observed with tebuconazole as a rotation product (3rd and 6th applications) was significantly different in size than the season long spiroxamine treatment and both size and weight compared to all treatments utilizing quinoxyfen. Powdery mildew was undetected and yield data were not available for this trial. Table 3. Effects of fungicide treatments on hop cv. Columbus cone size and weight, 2001. Treatment1 Cone length (mm)2 Weight/cone (mg)2,3 quinoxyfen 35.4a 249a quinoxyfen “program” 37.0a 248a trifloxystrobin, myclobutanil, quinoxyfen4 35.7a 248a spiroxamine 35.5a 241ab myclobutanil 34.4abc 238ab Non-treated 34.7ab 227abc trifloxystrobin, myclobutanil, tebuconazole4 32.5 bc 217 bc tebuconazole 31.8 c 206 c FPLSD(5%) 2.8 25 1 quinoxyfen (Quintec 250SC, 0.45L product/ha); quinoxyfen “program” (Quintec 250SC:
0.45L product/ha training to plants reaching top wire, 0.6L product/ha remainder of season); trifloxystrobin (Flint 50W, 0.21kg product/ha); myclobutanil (Rally 40W, 0.42kg product/ha); spiroxamine (Prosper 300CS, 1.35L product/ha); tebuconazole (Folicur 3.6F, 0.45L product/ha).
2 Means followed by the same letter are not significantly different (Fisher’s protected least significant difference). 3 Weight dry. 4 Application of products was rotated in the order listed.
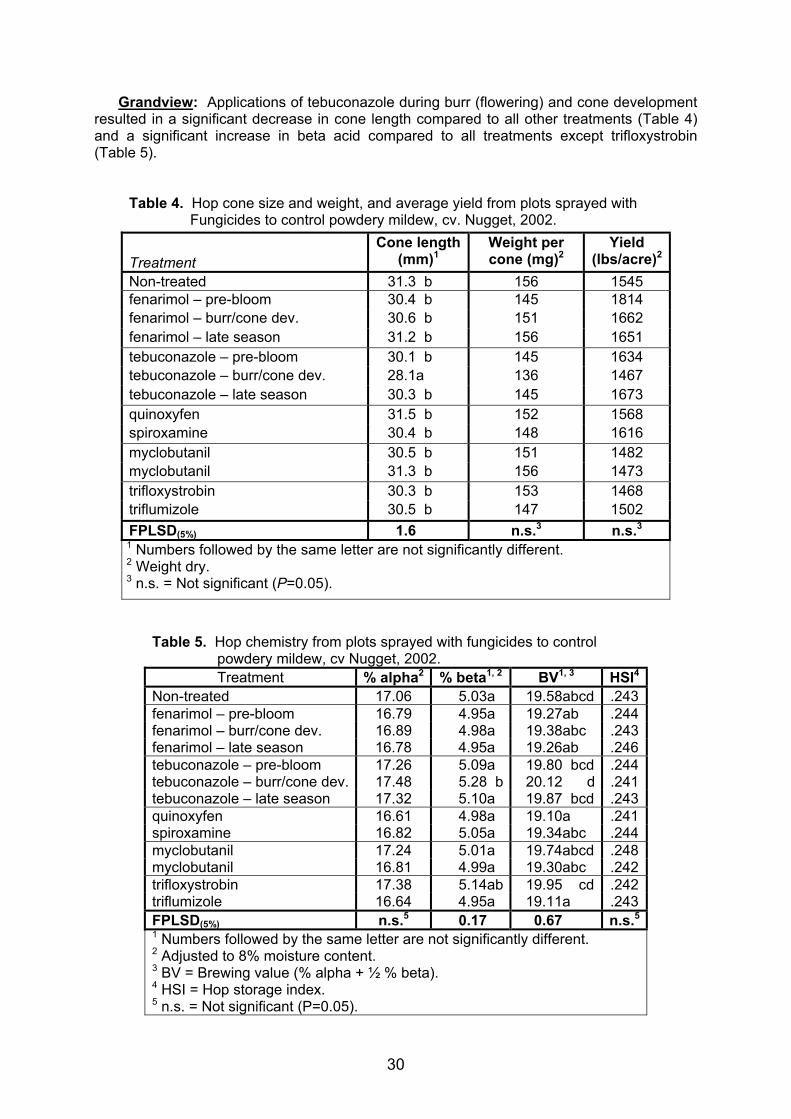
30
Grandview: Applications of tebuconazole during burr (flowering) and cone development resulted in a significant decrease in cone length compared to all other treatments (Table 4) and a significant increase in beta acid compared to all treatments except trifloxystrobin (Table 5).
Table 4. Hop cone size and weight, and average yield from plots sprayed with Fungicides to control powdery mildew, cv. Nugget, 2002.
Treatment Cone length
(mm)1 Weight per cone (mg)2
Yield (lbs/acre)2
Non-treated 31.3 b 156 1545 fenarimol – pre-bloom 30.4 b 145 1814 fenarimol – burr/cone dev. 30.6 b 151 1662 fenarimol – late season 31.2 b 156 1651 tebuconazole – pre-bloom 30.1 b 145 1634 tebuconazole – burr/cone dev. 28.1a 136 1467 tebuconazole – late season 30.3 b 145 1673 quinoxyfen 31.5 b 152 1568 spiroxamine 30.4 b 148 1616 myclobutanil 30.5 b 151 1482 myclobutanil 31.3 b 156 1473 trifloxystrobin 30.3 b 153 1468 triflumizole 30.5 b 147 1502 FPLSD(5%) 1.6 n.s.3 n.s.3 1 Numbers followed by the same letter are not significantly different. 2 Weight dry. 3 n.s. = Not significant (P=0.05).
Table 5. Hop chemistry from plots sprayed with fungicides to control powdery mildew, cv Nugget, 2002.
Treatment % alpha2 % beta1, 2 BV1, 3 HSI4 Non-treated 17.06 5.03a 19.58abcd .243 fenarimol – pre-bloom 16.79 4.95a 19.27ab .244 fenarimol – burr/cone dev. 16.89 4.98a 19.38abc .243 fenarimol – late season 16.78 4.95a 19.26ab .246 tebuconazole – pre-bloom 17.26 5.09a 19.80 bcd .244 tebuconazole – burr/cone dev. 17.48 5.28 b 20.12 d .241 tebuconazole – late season 17.32 5.10a 19.87 bcd .243 quinoxyfen 16.61 4.98a 19.10a .241 spiroxamine 16.82 5.05a 19.34abc .244 myclobutanil 17.24 5.01a 19.74abcd .248 myclobutanil 16.81 4.99a 19.30abc .242 trifloxystrobin 17.38 5.14ab 19.95 cd .242 triflumizole 16.64 4.95a 19.11a .243 FPLSD(5%) n.s.5 0.17 0.67 n.s.5 1 Numbers followed by the same letter are not significantly different. 2 Adjusted to 8% moisture content. 3 BV = Brewing value (% alpha + ½ % beta). 4 HSI = Hop storage index. 5 n.s. = Not significant (P=0.05).
31
Although the same treatment resulted in decreases in weight per cone and plot yield, the decreases are not proportional to the reduction in cone size and the differences are not statistically significant. An increase in percent alpha acid for the same treatment was significant at P=0.078 and so is not shown as significant at P=0.05 in Table 5. Differences in brewing value (calculated as % alpha + ½ % beta) are also shown in Table 5. No significant differences were observed in the hop storage index. Cone sizes and weights are based on three replications with all other results based on four replications.
Discussion Results indicate that application of tebuconazole during burr and cone development can result in reductions in cone size and weight. Increases in alpha and beta acids along with the corresponding increase in brewing value are probably due to decreases in mass per cone without proportional decreases in alpha or beta acid production per cone. This results in the observed increases in these products on a percent weight basis rather than an actual increase in production. No PGR problems were observed with any other products. PGR effects may be temperature related and may vary by year, location, cultivar, etc. Several Washington hop growers reported below average cone sizes in 2002. This may be due to nighttime temperatures lower than normal in late August and early September (part of the cone development stage). More ‘normal’ temperatures may have resulted in greater PGR activity in the 2002 Nugget trials.
References
Braun U, Takamatsu S (2000). Phylogeny of Erysiphe, Microsphaera, Uncinula (Erysipheae) and Cystotheca, Podosphaera, Sphaerotheca (Cystotheceae) inferred from rDNA ITS sequences - some taxonomic consequences. Schlechtendalia 4: 1-33. Mahafee WF, Thomas CS, Turechek WW, Ocamb CM, Gubler WD (2002). Development of an infection risk forecaster for hop powdery mildew. Phytopathology 92,S100. Acknowledgements The assistance and donation of part of a hop yard by Segal Hop Ranch, Grandview, Washington is gratefully acknowledged. This research was supported in part by grants from the Hop Research Council, Washington Hop Commission, Busch Agricultural Resources, Inc., Miller Brewing, Bayer, Crompton (Uniroyal), Dow AgroSciences, and Gowan companies.
32
CONTROL OF FUSARIUM SPP. ON HOP CONES WITH GRAPEFRUIT EXTRACT
E. Solarska Institute of Soil Science and Plant Cultivation, Department of Breeding and Production of Special Crops, 24-100 Puławy, Poland
Abstract
Influence of grapefruit extract on mycelial growth of Fusarium species and efficacy of grapefruit extract in the control of Fusarium cone tip blight of hop were studied. Addition of grapefruit extract to PDA at 10-20 µg/ cm3 inhibited mycelial growth of Fusarium spp. but only for 2-4 weeks depending on Fusarium species and used product. Treatment of hop with grapefruit extract by spraying in concentration 0.1-0.2% suppressed development of disease, especially in the case of the one product. Introduction Fusarium spp. are important pathogens of hop. The cancer of hop, caused by Fusarium sambucinum (Fr.) Sacc. and Fusarium culmorum W.G. Smith/Sacc.i is a destructive disease of the plant (Royle, 1974; Solarska, 1978, 1981). Recently Solarska (2001) have found that Fusarium sambucinum can also cause hop bine rot above soil-level. The cone tip blight is new disease of hop in some countries ( Bienapfl, et al., 2001; Solarska, 2003, in press). In Poland, the disease became very severe on hops of many hop-gardens in the last two years. The main fungi associated with cone tip blight are species of Fusarium i.e. F.sambucinum and F. avenaceum. Management practices to reduce disease severity should include applications of well-timed foliar fungicides for effective control but danger of too much chemical residues in cones could occur after fungicides treatments in the last stage of hop development. Some plant extracts have been reported to possess pathogen control properties (Angioni et al 1998; Orlikowski and Saniewska, 1995). Compounds exstracted from grapefruit seeds and pulp inhibited in vitro growth of broad spectrum of plant pathogens and its applications as foliar spray reduced damage of many diseases (Angioni et al., 1998; Orlikowski et al. 2001). The present study compares impact of two products based on grapefruit extract on growth, spore and mycelium morphology of Fusarium sambucinum and Fusarium avenaceum and their ability to reduce the disease severity on hops. Material and methods The studies were carried out in 2002 on hop-garden with Marynka cultivar in Hop Experimental Station at Kępa, which belongs to The Institute of Soil Science and Plant Cultivation in Puławy. The crop was treated with grapefruit extract by spraying five times during vegetation period. The research material was hop cones. Two commercial products based on grapefruit extract were used in the studies. The first Biosept 33 SL containing 33% grapefruit extract was supplied by Cintamani Poland and the second Grevit 200 SL containing 20% grapefruit extract was supplied by Avis Naturall Poland. Biosept 33 SL was applied in concentration of 0.1 % and Grevit 200 SL in concentration of 0.2%. Plant health was determined and infection by Fusarium spp. was assessed during harvesting.
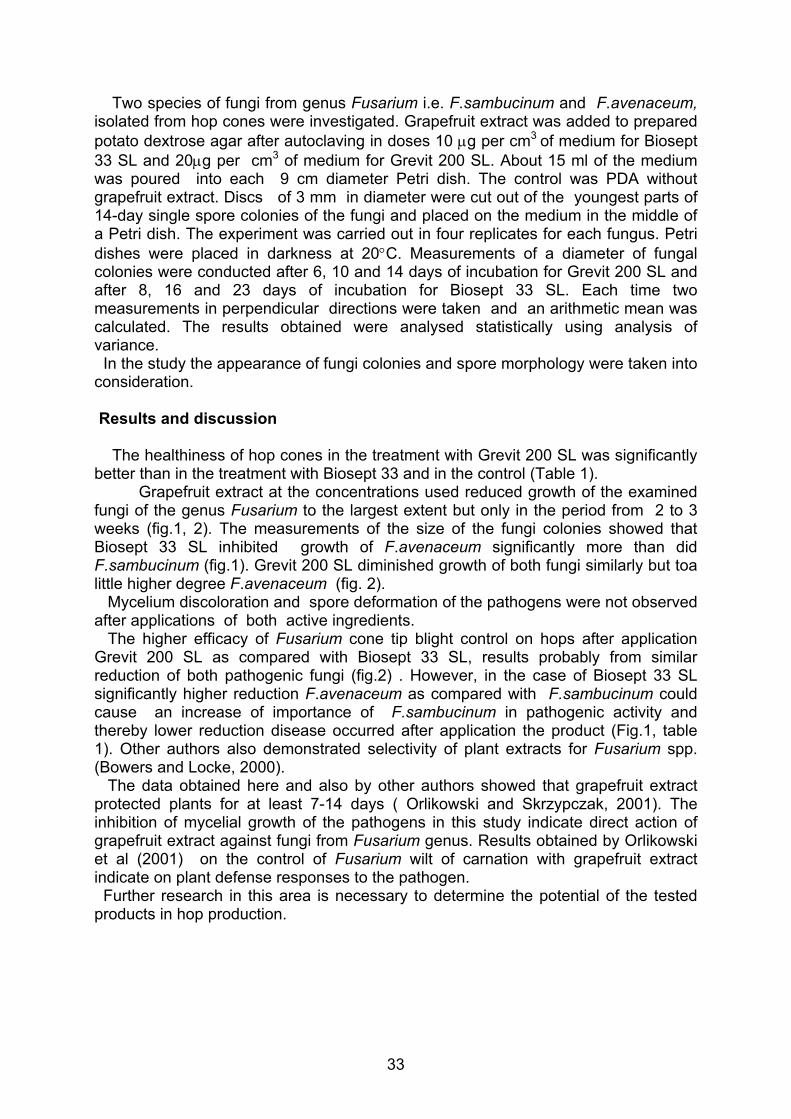
33
Two species of fungi from genus Fusarium i.e. F.sambucinum and F.avenaceum, isolated from hop cones were investigated. Grapefruit extract was added to prepared potato dextrose agar after autoclaving in doses 10 µg per cm3 of medium for Biosept 33 SL and 20µg per cm3 of medium for Grevit 200 SL. About 15 ml of the medium was poured into each 9 cm diameter Petri dish. The control was PDA without grapefruit extract. Discs of 3 mm in diameter were cut out of the youngest parts of 14-day single spore colonies of the fungi and placed on the medium in the middle of a Petri dish. The experiment was carried out in four replicates for each fungus. Petri dishes were placed in darkness at 20°C. Measurements of a diameter of fungal colonies were conducted after 6, 10 and 14 days of incubation for Grevit 200 SL and after 8, 16 and 23 days of incubation for Biosept 33 SL. Each time two measurements in perpendicular directions were taken and an arithmetic mean was calculated. The results obtained were analysed statistically using analysis of variance. In the study the appearance of fungi colonies and spore morphology were taken into consideration. Results and discussion The healthiness of hop cones in the treatment with Grevit 200 SL was significantly better than in the treatment with Biosept 33 and in the control (Table 1). Grapefruit extract at the concentrations used reduced growth of the examined fungi of the genus Fusarium to the largest extent but only in the period from 2 to 3 weeks (fig.1, 2). The measurements of the size of the fungi colonies showed that Biosept 33 SL inhibited growth of F.avenaceum significantly more than did F.sambucinum (fig.1). Grevit 200 SL diminished growth of both fungi similarly but toa little higher degree F.avenaceum (fig. 2). Mycelium discoloration and spore deformation of the pathogens were not observed after applications of both active ingredients. The higher efficacy of Fusarium cone tip blight control on hops after application Grevit 200 SL as compared with Biosept 33 SL, results probably from similar reduction of both pathogenic fungi (fig.2) . However, in the case of Biosept 33 SL significantly higher reduction F.avenaceum as compared with F.sambucinum could cause an increase of importance of F.sambucinum in pathogenic activity and thereby lower reduction disease occurred after application the product (Fig.1, table 1). Other authors also demonstrated selectivity of plant extracts for Fusarium spp. (Bowers and Locke, 2000). The data obtained here and also by other authors showed that grapefruit extract protected plants for at least 7-14 days ( Orlikowski and Skrzypczak, 2001). The inhibition of mycelial growth of the pathogens in this study indicate direct action of grapefruit extract against fungi from Fusarium genus. Results obtained by Orlikowski et al (2001) on the control of Fusarium wilt of carnation with grapefruit extract indicate on plant defense responses to the pathogen. Further research in this area is necessary to determine the potential of the tested products in hop production.
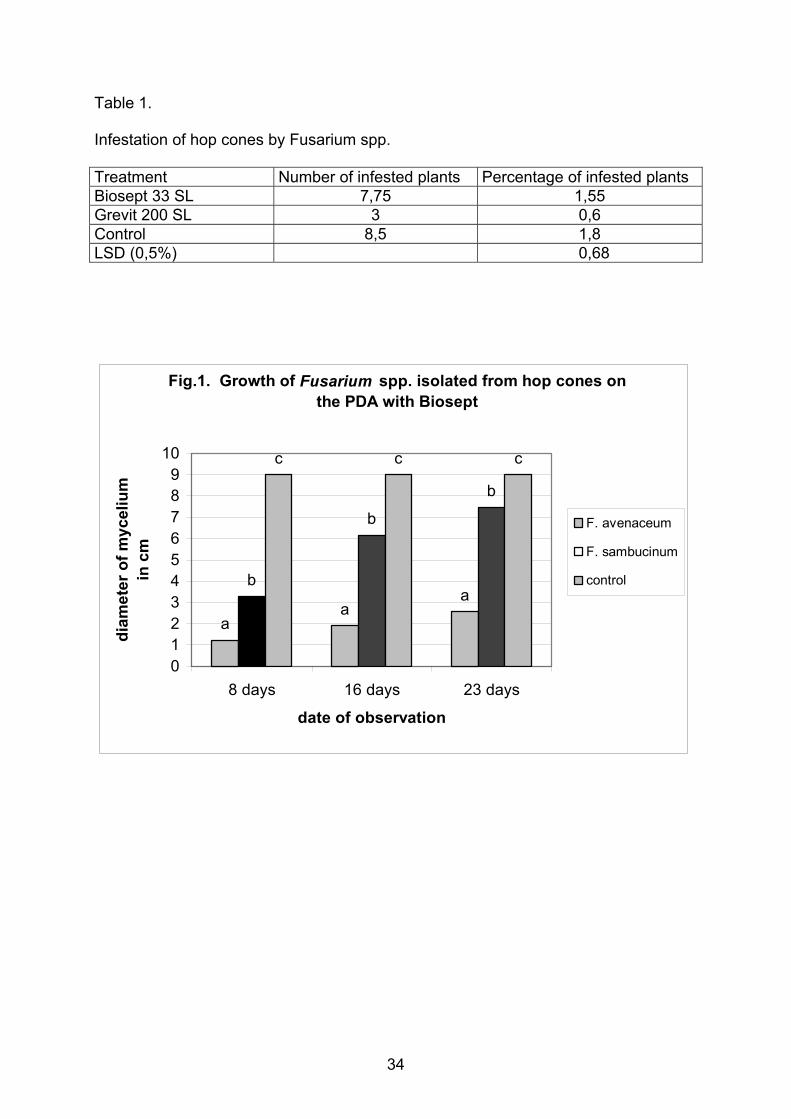
34
Table 1. Infestation of hop cones by Fusarium spp. Treatment Number of infested plants Percentage of infested plants Biosept 33 SL 7,75 1,55 Grevit 200 SL 3 0,6 Control 8,5 1,8 LSD (0,5%) 0,68
Fig.1. Growth of Fusarium spp. isolated from hop cones on the PDA with Biosept
aa
ab
b
b
c c c
0123456789
10
8 days 16 days 23 days
date of observation
diam
eter
of m
ycel
ium
in
cm
F. avenaceum
F. sambucinum
control
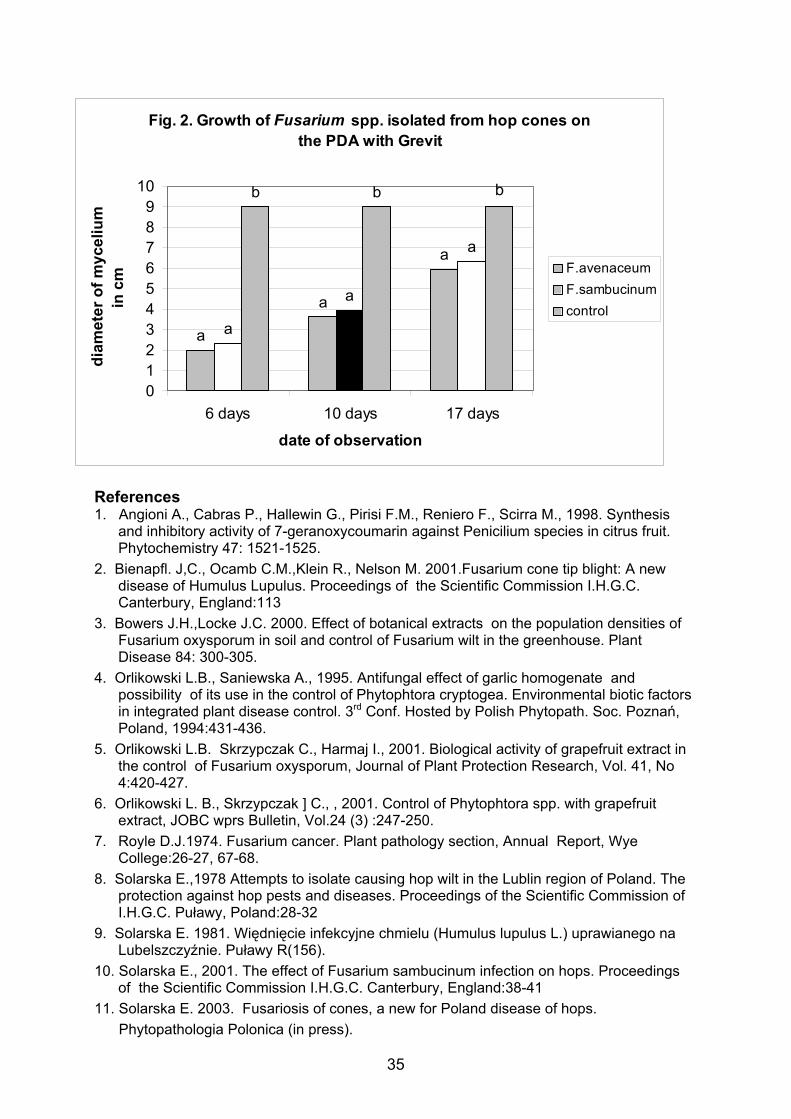
35
References 1. Angioni A., Cabras P., Hallewin G., Pirisi F.M., Reniero F., Scirra M., 1998. Synthesis
and inhibitory activity of 7-geranoxycoumarin against Penicilium species in citrus fruit. Phytochemistry 47: 1521-1525.
2. Bienapfl. J,C., Ocamb C.M.,Klein R., Nelson M. 2001.Fusarium cone tip blight: A new disease of Humulus Lupulus. Proceedings of the Scientific Commission I.H.G.C. Canterbury, England:113
3. Bowers J.H.,Locke J.C. 2000. Effect of botanical extracts on the population densities of Fusarium oxysporum in soil and control of Fusarium wilt in the greenhouse. Plant Disease 84: 300-305.
4. Orlikowski L.B., Saniewska A., 1995. Antifungal effect of garlic homogenate and possibility of its use in the control of Phytophtora cryptogea. Environmental biotic factors in integrated plant disease control. 3rd Conf. Hosted by Polish Phytopath. Soc. Poznań, Poland, 1994:431-436.
5. Orlikowski L.B. Skrzypczak C., Harmaj I., 2001. Biological activity of grapefruit extract in the control of Fusarium oxysporum, Journal of Plant Protection Research, Vol. 41, No 4:420-427.
6. Orlikowski L. B., Skrzypczak ] C., , 2001. Control of Phytophtora spp. with grapefruit extract, JOBC wprs Bulletin, Vol.24 (3) :247-250.
7. Royle D.J.1974. Fusarium cancer. Plant pathology section, Annual Report, Wye College:26-27, 67-68.
8. Solarska E.,1978 Attempts to isolate causing hop wilt in the Lublin region of Poland. The protection against hop pests and diseases. Proceedings of the Scientific Commission of I.H.G.C. Puławy, Poland:28-32
9. Solarska E. 1981. Więdnięcie infekcyjne chmielu (Humulus lupulus L.) uprawianego na Lubelszczyźnie. Puławy R(156).
10. Solarska E., 2001. The effect of Fusarium sambucinum infection on hops. Proceedings of the Scientific Commission I.H.G.C. Canterbury, England:38-41
11. Solarska E. 2003. Fusariosis of cones, a new for Poland disease of hops. Phytopathologia Polonica (in press).
Fig. 2. Growth of Fusarium spp. isolated from hop cones on the PDA with Grevit
a
a
a
a
a
a
bb
0123456789
10
6 days 10 days 17 days
date of observation
diam
eter
of m
ycel
ium
in c
m F.avenaceumF.sambucinumcontrol
b
36
BEHAVIOUR AND POPULATION DEVELOPMENT OF THE DAMSON-HOP APHID ON TWO HOP CULTIVARS OF DIFFERENT SUSCEPTIBILITY
F. Weihrauch* & L. Moreth**
*Bayerische Landesanstalt für Landwirtschaft, Institut für Pflanzenbau und Pflanzenzüchtung,
Hopfenforschungszentrum, Hüll 5 1/3, D-85283 Wolnzach, Germany **Bayerische Landesanstalt für Landwirtschaft, Abteilung Förderwesen und Fachrecht,
Sachgebiet Strukturförderung, Menzinger Str.54, D-80638 München, Germany
Abstract Spring migration and initial population development of Phorodon humuli on the two cultivars "Hallertauer Magnum" (HM) and "Spalter Select" (SE) were monitored in the years 1996, 1998 and 1999 in an experimentally designed hop garden in Bavaria, Germany. Migration rates on SE were significantly lower, reaching in 1998 18.8% and in 1999 30.2% of corresponding ala-te aphid numbers on HM. Development rates of unwinged aphid morphs in the field also diffe-red significantly, reaching on SE in 1998 6.5% and in 1999 14.4% of corresponding aphid numbers on HM at the end of the monitoring period. Additional greenhouse experiments with released alate P. humuli on showed a highly different behaviour on the two cvs, with much more time spent with probing and phloem sap uptake on HM in contrary to a more restless behaviour on SE. The development rate of unwinged aphids on SE in the greenhouse rea-ched only 12.9% of aphid numbers on HM within 28 days. Introduction To break the cycle of pesticide resistance in Phorodon humuli, an integrated approach to the management of this pest in hops is badly needed. One cornerstone of such an integrated stra-tegy is the breeding of hop cultivars (cvs) resistant to or, at least, only slightly susceptible to P. humuli infestation. In UK hop research since the 1980s a breeding programme of aphid--resistant genotypes is in rapid progress, prospecting varieties with enhanced levels of aphid resistance (Darby & Campbell, 1996). In German hop breeding meanwhile aphid resistance is also being seen as a challenge for future hop research. According to the experience of far-mers in the Hallertau growing region, of the cvs currently grown in Germany the bitter cv Hal-lertauer Magnum (HM) seems to be the most susceptible cv to P. humuli, whereas the aroma cv Spalter Select (SE) obviously offers practically no problems regarding aphid infestation in commercial hop growing. The goal of the present study was to investigate and verify these ob-servations, and, by the monitoring of relevant insect-plant interactions, to find clues how the mechanisms of these different susceptibilities are working in fact. Such informations could be regarded as one more bit of knowledge for the future breeding of less susceptible hop genoty-pes and, thus, to a more successful integrated pest management approach in hop growing. Materials and methods Field study site and experimental design. Field investigations were carried out in 1996, 1998 and 1999 in a private hop garden in Oberulrain near Neustadt a.d. Donau, Kelheim district, Bavaria, Germany (11°49'E, 48°48'N). The trapeziform high-trellis hop garden had a size of 2.20 ha and was situated at approximately 385 m a.s.l. The garden contained an experimen-tally designed part (0.45 ha) with 48 plots of 12 different cvs, arranged randomly in the rows without wire-trellis support poles. The pole rows and the rest of the garden was planted with cv Northern Brewer. Each plot consisted of 12 subsequent, double-trained hop plants in one row. For the monitoring of aphid migration, eight scaffoldings were put up on 22 May 1996, 15 May 1998 and 12 May 1999 in the centres of the four replications of cvs HM and SE, respecti-vely. Each of these scaffoldings carried two platforms with a height of 2.5 m and 5 m above ground, and served as permanent lookouts for observing and monitoring aphid migration and population development without affecting neither animals nor plants during the entire monito-ring periods which lasted until 14 June 1996, 9 June 1998 and 11 June 1999. From the plat-
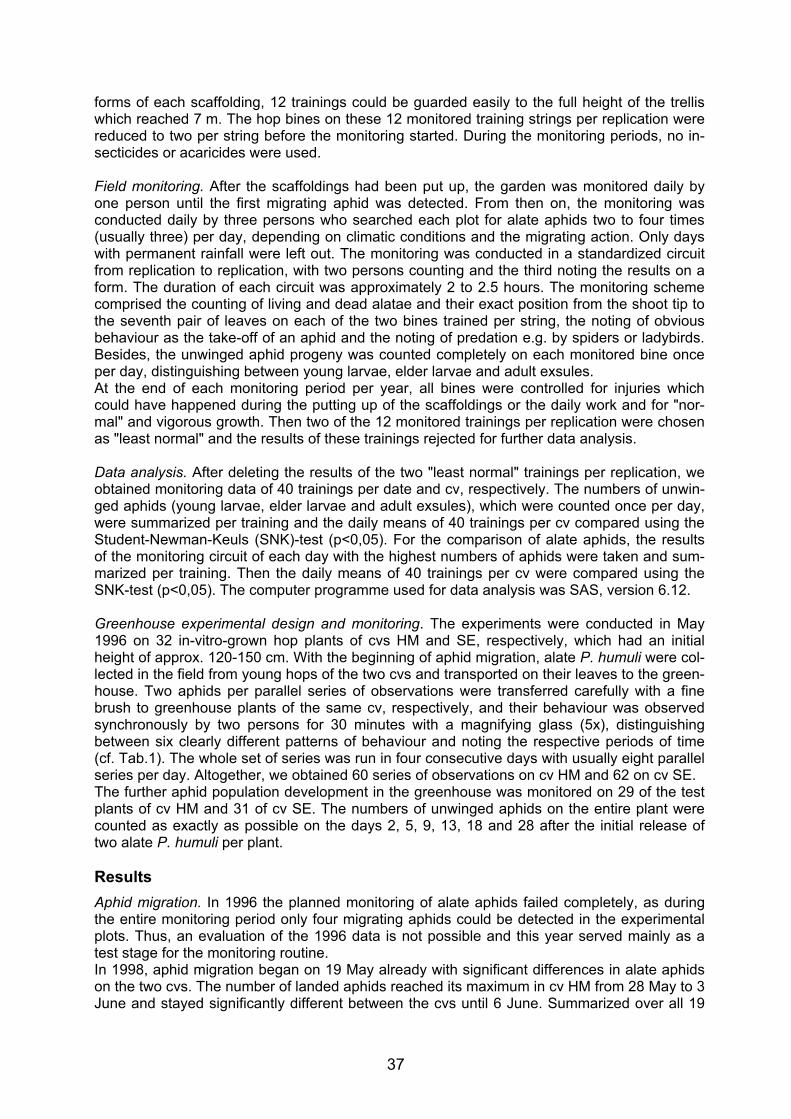
37
forms of each scaffolding, 12 trainings could be guarded easily to the full height of the trellis which reached 7 m. The hop bines on these 12 monitored training strings per replication were reduced to two per string before the monitoring started. During the monitoring periods, no in-secticides or acaricides were used. Field monitoring. After the scaffoldings had been put up, the garden was monitored daily by one person until the first migrating aphid was detected. From then on, the monitoring was conducted daily by three persons who searched each plot for alate aphids two to four times (usually three) per day, depending on climatic conditions and the migrating action. Only days with permanent rainfall were left out. The monitoring was conducted in a standardized circuit from replication to replication, with two persons counting and the third noting the results on a form. The duration of each circuit was approximately 2 to 2.5 hours. The monitoring scheme comprised the counting of living and dead alatae and their exact position from the shoot tip to the seventh pair of leaves on each of the two bines trained per string, the noting of obvious behaviour as the take-off of an aphid and the noting of predation e.g. by spiders or ladybirds. Besides, the unwinged aphid progeny was counted completely on each monitored bine once per day, distinguishing between young larvae, elder larvae and adult exsules. At the end of each monitoring period per year, all bines were controlled for injuries which could have happened during the putting up of the scaffoldings or the daily work and for "nor-mal" and vigorous growth. Then two of the 12 monitored trainings per replication were chosen as "least normal" and the results of these trainings rejected for further data analysis. Data analysis. After deleting the results of the two "least normal" trainings per replication, we obtained monitoring data of 40 trainings per date and cv, respectively. The numbers of unwin-ged aphids (young larvae, elder larvae and adult exsules), which were counted once per day, were summarized per training and the daily means of 40 trainings per cv compared using the Student-Newman-Keuls (SNK)-test (p<0,05). For the comparison of alate aphids, the results of the monitoring circuit of each day with the highest numbers of aphids were taken and sum-marized per training. Then the daily means of 40 trainings per cv were compared using the SNK-test (p<0,05). The computer programme used for data analysis was SAS, version 6.12. Greenhouse experimental design and monitoring. The experiments were conducted in May 1996 on 32 in-vitro-grown hop plants of cvs HM and SE, respectively, which had an initial height of approx. 120-150 cm. With the beginning of aphid migration, alate P. humuli were col-lected in the field from young hops of the two cvs and transported on their leaves to the green-house. Two aphids per parallel series of observations were transferred carefully with a fine brush to greenhouse plants of the same cv, respectively, and their behaviour was observed synchronously by two persons for 30 minutes with a magnifying glass (5x), distinguishing between six clearly different patterns of behaviour and noting the respective periods of time (cf. Tab.1). The whole set of series was run in four consecutive days with usually eight parallel series per day. Altogether, we obtained 60 series of observations on cv HM and 62 on cv SE. The further aphid population development in the greenhouse was monitored on 29 of the test plants of cv HM and 31 of cv SE. The numbers of unwinged aphids on the entire plant were counted as exactly as possible on the days 2, 5, 9, 13, 18 and 28 after the initial release of two alate P. humuli per plant. Results Aphid migration. In 1996 the planned monitoring of alate aphids failed completely, as during the entire monitoring period only four migrating aphids could be detected in the experimental plots. Thus, an evaluation of the 1996 data is not possible and this year served mainly as a test stage for the monitoring routine. In 1998, aphid migration began on 19 May already with significant differences in alate aphids on the two cvs. The number of landed aphids reached its maximum in cv HM from 28 May to 3 June and stayed significantly different between the cvs until 6 June. Summarized over all 19
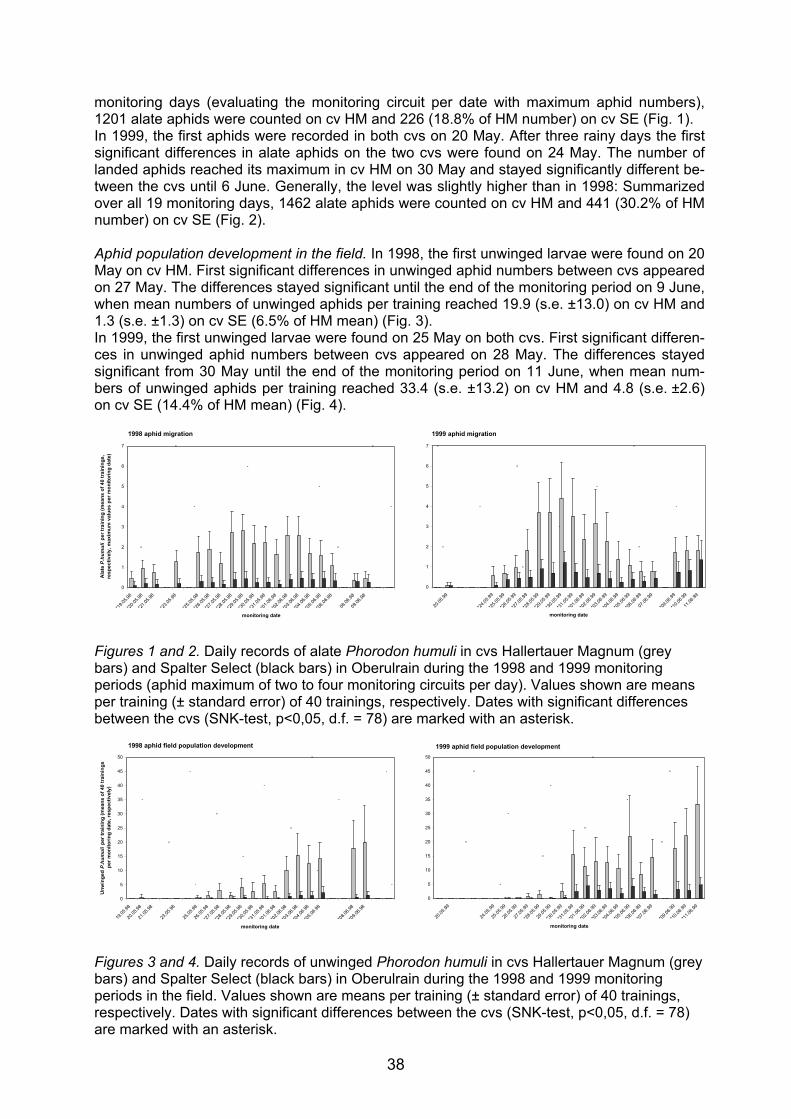
38
monitoring days (evaluating the monitoring circuit per date with maximum aphid numbers), 1201 alate aphids were counted on cv HM and 226 (18.8% of HM number) on cv SE (Fig. 1). In 1999, the first aphids were recorded in both cvs on 20 May. After three rainy days the first significant differences in alate aphids on the two cvs were found on 24 May. The number of landed aphids reached its maximum in cv HM on 30 May and stayed significantly different be-tween the cvs until 6 June. Generally, the level was slightly higher than in 1998: Summarized over all 19 monitoring days, 1462 alate aphids were counted on cv HM and 441 (30.2% of HM number) on cv SE (Fig. 2). Aphid population development in the field. In 1998, the first unwinged larvae were found on 20 May on cv HM. First significant differences in unwinged aphid numbers between cvs appeared on 27 May. The differences stayed significant until the end of the monitoring period on 9 June, when mean numbers of unwinged aphids per training reached 19.9 (s.e. ±13.0) on cv HM and 1.3 (s.e. ±1.3) on cv SE (6.5% of HM mean) (Fig. 3). In 1999, the first unwinged larvae were found on 25 May on both cvs. First significant differen-ces in unwinged aphid numbers between cvs appeared on 28 May. The differences stayed significant from 30 May until the end of the monitoring period on 11 June, when mean num-bers of unwinged aphids per training reached 33.4 (s.e. ±13.2) on cv HM and 4.8 (s.e. ±2.6) on cv SE (14.4% of HM mean) (Fig. 4).
Figures 1 and 2. Daily records of alate Phorodon humuli in cvs Hallertauer Magnum (grey bars) and Spalter Select (black bars) in Oberulrain during the 1998 and 1999 monitoring periods (aphid maximum of two to four monitoring circuits per day). Values shown are means per training (± standard error) of 40 trainings, respectively. Dates with significant differences between the cvs (SNK-test, p<0,05, d.f. = 78) are marked with an asterisk.
Figures 3 and 4. Daily records of unwinged Phorodon humuli in cvs Hallertauer Magnum (grey bars) and Spalter Select (black bars) in Oberulrain during the 1998 and 1999 monitoring periods in the field. Values shown are means per training (± standard error) of 40 trainings, respectively. Dates with significant differences between the cvs (SNK-test, p<0,05, d.f. = 78) are marked with an asterisk.
1998 aphid migration
0
1
2
3
4
5
6
7
*19.05
.98
*20.05
.98
*21.05
.98
*23.05
.98
*25.05
.98
*26.05
.98
*27.05
.98
*28.05
.98
*29.05
.98
*30.05
.98
*31.05
.98
*01.06
.98
*02.06
.98
*03.06
.98
*04.06
.98
*05.06
.98
*06.06
.98
08.06
.98
09.06
.98
monitoring date
Ala
te P
.hum
uli
per t
rain
ing
(mea
ns o
f 40
trai
ning
s,
resp
ectiv
ely,
max
imum
val
ues
per m
onito
ring
date
)
1999 aphid migration
0
1
2
3
4
5
6
7
20.05
.99
*24.0
5.99
*25.0
5.99
*26.0
5.99
*27.0
5.99
*28.0
5.99
*29.0
5.99
*30.0
5.99
*31.0
5.99
*01.0
6.99
*02.0
6.99
*03.0
6.99
*04.0
6.99
*05.0
6.99
*06.0
6.99
07.06
.99
*09.0
6.99
*10.0
6.99
11.06
.99
monitoring date
1998 aphid field population development
0
5
10
15
20
25
30
35
40
45
50
19.05
.98
20.05
.98
21.05
.98
23.05
.98
25.05
.98
26.05
.98
*27.0
5.98
*28.0
5.98
*29.0
5.98
*30.0
5.98
*31.0
5.98
*01.0
6.98
*02.0
6.98
*03.0
6.98
*04.0
6.98
*05.0
6.98
*08.0
6.98
*09.0
6.98
monitoring date
Unw
inge
d P.
hum
uli
per t
rain
ing
(mea
ns o
f 40
trai
ning
s p
er m
onito
ring
date
, res
pect
ivel
y)
1999 aphid field population development
0
5
10
15
20
25
30
35
40
45
50
20.05
.99
24.05
.99
25.05
.99
26.05
.99
27.05
.99
*28.05
.99
29.05
.99
*30.05
.99
*31.05
.99
*01.06
.99
*02.06
.99
*03.06
.99
*04.06
.99
*05.06
.99
*06.06
.99
*07.06
.99
*09.06
.99
*10.06
.99
*11.06
.99
monitoring date
39
Aphid behaviour and population development in greenhouse trials. On cv SE the behavioural patterns of alate P. humuli were clearly more "restless" than on cv HM, where the aphids spent much more time with probing and phloem sap ingestion (Tab. 1). The development ra-tes of their unwinged progeny were also clearly different: On cv SE the mean aphid numbers reached only 12.9% of those on cv HM within 28 days (Tab. 2). Table 1. Mean time [min] of various behaviour patterns per alate Phorodon humuli within the first 30 minutes after release on leaves of cv HM (n=60) and cv SE (n=62).
Table 2. Aphid population development (means and standard error of unwinged aphids per plant) within 28 days on greenhouse plants of cv HM (n=29) and cv SE (n=31). Day 1 = release of two alate Phorodon humuli per plant, respectively.
Discussion As in any other insect-plant interaction complex, in the Humulus lupulus/Phorodon humuli system pest resistance or susceptibility generally must be regarded as the essential part of the interaction. The identification of suitable feeding plants by an aphid roughly can be divided in four possible ways: visual, olfactory, mechanical and gustatory stimuli, with any combination of these being possible.Thus, Dorschner & Baird (1989) list a wide range of possible plant de-fense barriers against being colonized by aphids: volatile substances, leaf pubescence, the chemical composition or amount of epicuticular waxes, leaf tissues resistant to stylet penetra-tion by mechanical means or by resisiting depolymerization by aphid salivary enzymes, the presence of chemical antifeedants or the lack of feeding stimulants, mechanisms which alter the aphid's path to the phloem and make that cell type difficult to locate, and the composition of the phloem sap itself making it nutritionally inadequate for the aphid. Our results indicate that there are at least two mechanisms involved which provide significant differences in aphid susceptibility betweeen cvs HM and SE: First, the monitoring of migrating aphids gives evidence that SE is colonized to a much lesser extent (approx. 20-30 %) by alate P. humuli than HM. One reason may be the difference in leaf colour between cvs, with SE be-ing the cv with dark greener foliage. Campbell (1991) noted in cv Brewer's Gold 1.5 times mo-re migrant P. humuli on yellow-foliaged plants than on their green counterparts, thus eviden-cing a visual selection during landing. Another reason may be seen in the release of semio-chemicals by "pioneer colonizers" of P. humuli on a hop plant which leads to an aggregation of migratory morphs on this plant (Campbell et al., 1993). However, we think that the most im-portant role for the significantly higher number of aphid migrants on HM must be seen in diffe-rences of the volatile substances released by the cvs themselves, acting either as an attrac-tant or as an repellent. Lösel et al. (1996) found that a number of identified components of the hop headspace odours, simple compounds as well as relatively simple mixtures, can exert a behaviour-modifying effect on P. humuli in the field, with significant repellent effects in methyl salicylate, butyl isothiocyanate and 4-pentenyl isothiocyanate. Our bevavioural observations from the greenhouse also point into the direction of a certain repellent effect in SE, on which the aphids acted much more restlessly than on HM and spent much less time with probing and phloem sap ingestion. The latter behavioural differences between aphids on resistant and
Monitoring dayCultivar HM SE HM SE HM SE HM SE HM SE HM SEMean 2,1 2,8 10,6 6,7 15,6 7,8 49,7 (no 167,5 17,7 2598,3 334,2Standard error 3,39 2,96 9,32 5,11 9,23 5,44 41,94 data) 151,11 21,39 2206,4 332,34
2 5 9 13 18 28
Behaviour pattern HM SE Probing 1.07 0.18Phloem sap ingestion 2.62 0.35Horizontal motion on the leaf 3.55 5.55Change of leaf side 0.80 1.48Change of leaf storey 0.17 0.34Vertical motion on the bine 0.00 1.18
40
susceptible hops were also observed by Paul et al. (1996). Other influencing factors such as the preference of migrants for plants along the edges of hop gardens (Eppler, 1989) or local patterns of wind shelter (Campbell, 1977) can be excluded by our experimental design. Second, the significantly different aphid population development rates on both cvs indicate that in SE there is not only a reduced phloem sap uptake, but that it also is nutritionally inad-equate for P. humuli, probably due to a different amino acid composition, and causes a de-crease in aphid fertility. Generally, our results give further evidence that for a commercially grown cv SE must be regarded as at least highly tolerant towards P. humuli infestation. This is in good accordance with the results of Kralj et al. (1998) who found that resistance to P. humuli is related to a combination of three biochemical markers in the hop essential oil, viz alpha-pinene, beta-pinene and an unidentified "peak 92". In a list of damage scores from 1 to 10 (with 1 representing the lowest damage) for more than 100 accessions, Kralj et al. (1998) give SE a score of 3, thus regarding it as one of eight commercially grown cvs with the least susceptibility. Acknowledgements This study was funded by Deutsche Bundesstiftung Umwelt, Osnabrück, Germany. We also thank Georg Nutz, Oberulrain, for the kind provision of his field for trials, Olga Ehrenstrasser for her help in monitoring the greenhouse trials and virtually the complete staff of the Hüll Hop Research Institute for their help in the field investigations even on weekends and holidays.
References Campbell, C.A.M., 1977. Distribution of damson-hop aphid (Phorodon humuli) migrants on
hops in relation to hop variety and wind shelter. Annals of Applied Biology 87: 315-325. Campbell, C.A.M., 1991. Response of Phorodon humuli to yellow and to green hop foliar
colours. Entomologia Experimentalis et Applicata 60: 95-99. Campbell, C.A.M., J. Pettersson, J.A. Pickett, L.J. Wadhams & C.M. Woodcock, 1993. Spring
migration of damson-hop aphid, Phorodon humuli (Homoptera, Aphididae), and summer host plant-derived semiochemicals released on feeding. Journal of Chemical Ecology 19: 1569-1576.
Darby, P. & C.A.M. Campbell, 1996. Aphid-resistant hops – the key to integrated pest management in hops. Brighton Crop Protection Conference – Pests & Diseases – 1996: 893-898.
Dorschner, K.W. & C.R. Baird, 1989. Electronically Monitored Feeding Behavior of Phorodon humuli (Homoptera: Aphididae) on Resistant and Susceptible Hop Genotypes. Journal of Insect Behavior 2: 437-446.
Eppler, A., 1989. Settling behaviour of Phorodon humuli in relation to virus spread. Proceedings of the International Workshop on Hop Virus Diseases Rauischholzhausen 1998: 113-120.
Kralj, D., M. Kač, M. Dolinar, M. Žolnir & S. Kralj, 1998. Marker-assisted hop (Humulus lupulus L.) breeding. Monatsschrift für Brauwissenschaft 1998(7/8): 111-119.
Lösel, P.M., M. Lindemann, J. Scherkenbeck, J. Maier, B. Engelhard, C.A.M. Campbell, J. Hardie, J.A. Pickett, L.J. Wadhams, A. Elbert & G. Thielking, 1996. The Potential of Semiochemicals for Control of Phorodon humuli (Homoptera: Aphididae). Pesticide Science 48: 293-303.
Paul, T.A., P. Darby, C.P. Green, C.J. Hodgson & J.T. Rossiter, 1996. Electrical penetration graphs of the damson-hop aphid, Phorodon humuli on resistant and susceptible hops (Humulus lupulus). Entomologia Experimentalis et Applicata 80: 335-342.
41
THE USE OF SUCTION TRAP FOR MONITORING THE MIGRATION OF DAMSON-HOP APHID (Phorodon humuli) (Hemiptera, Aphididae)
Pérez, N 1, J. A. Magadán2 and V. Seco3 1: Departamento de Biología Animal, Universidad de León, 24071-León (Spain).
2: Sociedad Anónima Española de Fomento del Lúpulo S.A. Villanueva de Carrizo (León) (Spain). 3 Departamento de Ingeniería Agraria, Universidad de León, 24071-León (Spain)
Abstract The field catches of Phorodon humuli (Schrank) during two years (2000-2001) by means of yellow traps and suction trap have been compared in province of Leon (Northwest of Spain). The results of the samplings are discussed. Introduction The hop aphid is a holocyclic dioecious species that over winters as resistance egg on different species of cultivated and ornamental plum tress (Prunus spp.). The eggs hatch at the end of February or beginning of March (WRIGHT et al., 1994) and feeds off the yolk and Prunus leaves until they emigrate to hop plants, Humulus lupulus L. This occurs from mid may to mid July and occasionally to mid August (AVELING, 1981). Only apterous viviparous females develop on hops during summer (CAMPBELL, 1985), which means that, with the possible exception of dispersion flights by migrating females in spring-summer, there are no aphid infestations on colonised hops. The hop plant is the only secondary host for hop aphid (TAYLOR et al., 1979, KNOWLTON, 1983, EPPLER, 1986). Gynoparous (winged females) appear in autumn and return to the Prunus trees where they produce apterous oviparous females. Oviparous females mate with winged males that have developed in the hop plant and colonised the plum trees. They lay eggs and therefore complete the life cycle. The hop aphid, Phorodon humuli (Schrank), causes considerable damage to Humulus lupulus plants in Spain and in other hop-producing areas in the world, and also to plum trees (Prunus domestica L.) (GRATWICK, 1992), though no studies have been carried out in our country. Traps for monitoring aerial aphid populations in León have been used constantly since the 80’s (Luis CALABUIG et al., 1983; MAZÉ GONZÁLEZ et al., 1985). Quantitative and qualitative analyses have been carried out on the efficacy of Moericke traps at different ground levels as well as comparative analyses between Moericke and suction traps (HULLÉ et al., 1992). These traps have also been used in studies on the emigration and re-emigration of P. humuli in León province (FERNÁNDEZ et al., 2002). This study concerns the setting up of a network of traps in all the hop-producing areas to determine how many Moericke traps would be necessary for a warning network. Catches using these traps were compared with catches made by the only existing suction trap (Examine Project) in the province, situated at distances of 20 and 50 Km from the main hop-producing areas. The results should enable us to determine the onset of colonisation and the end of emigration and also monitor the appearance of males and gynopares during autumn. These results were compared with data obtained years ago in the same study area. Material and Methods Traps were placed in the main hop-growing areas in the province of León, the riverside of the rivers Órbigo, Tuerto and Porma (fig.1), to monitor the flights of hop-aphids from primary to secondary host (Humulus lupulus). Yellow Moericke traps (60x60x10 cm) were placed near
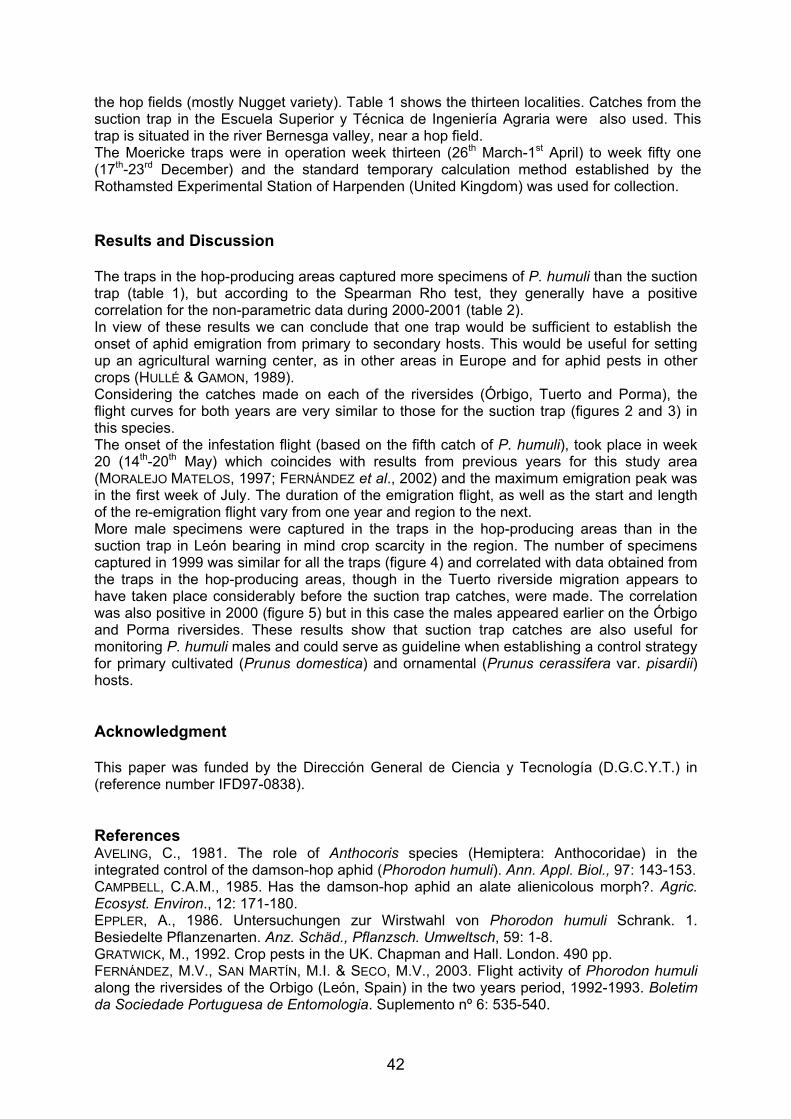
42
the hop fields (mostly Nugget variety). Table 1 shows the thirteen localities. Catches from the suction trap in the Escuela Superior y Técnica de Ingeniería Agraria were also used. This trap is situated in the river Bernesga valley, near a hop field. The Moericke traps were in operation week thirteen (26th March-1st April) to week fifty one (17th-23rd December) and the standard temporary calculation method established by the Rothamsted Experimental Station of Harpenden (United Kingdom) was used for collection. Results and Discussion The traps in the hop-producing areas captured more specimens of P. humuli than the suction trap (table 1), but according to the Spearman Rho test, they generally have a positive correlation for the non-parametric data during 2000-2001 (table 2). In view of these results we can conclude that one trap would be sufficient to establish the onset of aphid emigration from primary to secondary hosts. This would be useful for setting up an agricultural warning center, as in other areas in Europe and for aphid pests in other crops (HULLÉ & GAMON, 1989). Considering the catches made on each of the riversides (Órbigo, Tuerto and Porma), the flight curves for both years are very similar to those for the suction trap (figures 2 and 3) in this species. The onset of the infestation flight (based on the fifth catch of P. humuli), took place in week 20 (14th-20th May) which coincides with results from previous years for this study area (MORALEJO MATELOS, 1997; FERNÁNDEZ et al., 2002) and the maximum emigration peak was in the first week of July. The duration of the emigration flight, as well as the start and length of the re-emigration flight vary from one year and region to the next. More male specimens were captured in the traps in the hop-producing areas than in the suction trap in León bearing in mind crop scarcity in the region. The number of specimens captured in 1999 was similar for all the traps (figure 4) and correlated with data obtained from the traps in the hop-producing areas, though in the Tuerto riverside migration appears to have taken place considerably before the suction trap catches, were made. The correlation was also positive in 2000 (figure 5) but in this case the males appeared earlier on the Órbigo and Porma riversides. These results show that suction trap catches are also useful for monitoring P. humuli males and could serve as guideline when establishing a control strategy for primary cultivated (Prunus domestica) and ornamental (Prunus cerassifera var. pisardii) hosts. Acknowledgment This paper was funded by the Dirección General de Ciencia y Tecnología (D.G.C.Y.T.) in (reference number IFD97-0838). References AVELING, C., 1981. The role of Anthocoris species (Hemiptera: Anthocoridae) in the integrated control of the damson-hop aphid (Phorodon humuli). Ann. Appl. Biol., 97: 143-153. CAMPBELL, C.A.M., 1985. Has the damson-hop aphid an alate alienicolous morph?. Agric. Ecosyst. Environ., 12: 171-180. EPPLER, A., 1986. Untersuchungen zur Wirstwahl von Phorodon humuli Schrank. 1. Besiedelte Pflanzenarten. Anz. Schäd., Pflanzsch. Umweltsch, 59: 1-8. GRATWICK, M., 1992. Crop pests in the UK. Chapman and Hall. London. 490 pp. FERNÁNDEZ, M.V., SAN MARTÍN, M.I. & SECO, M.V., 2003. Flight activity of Phorodon humuli along the riversides of the Orbigo (León, Spain) in the two years period, 1992-1993. Boletim da Sociedade Portuguesa de Entomologia. Suplemento nº 6: 535-540.
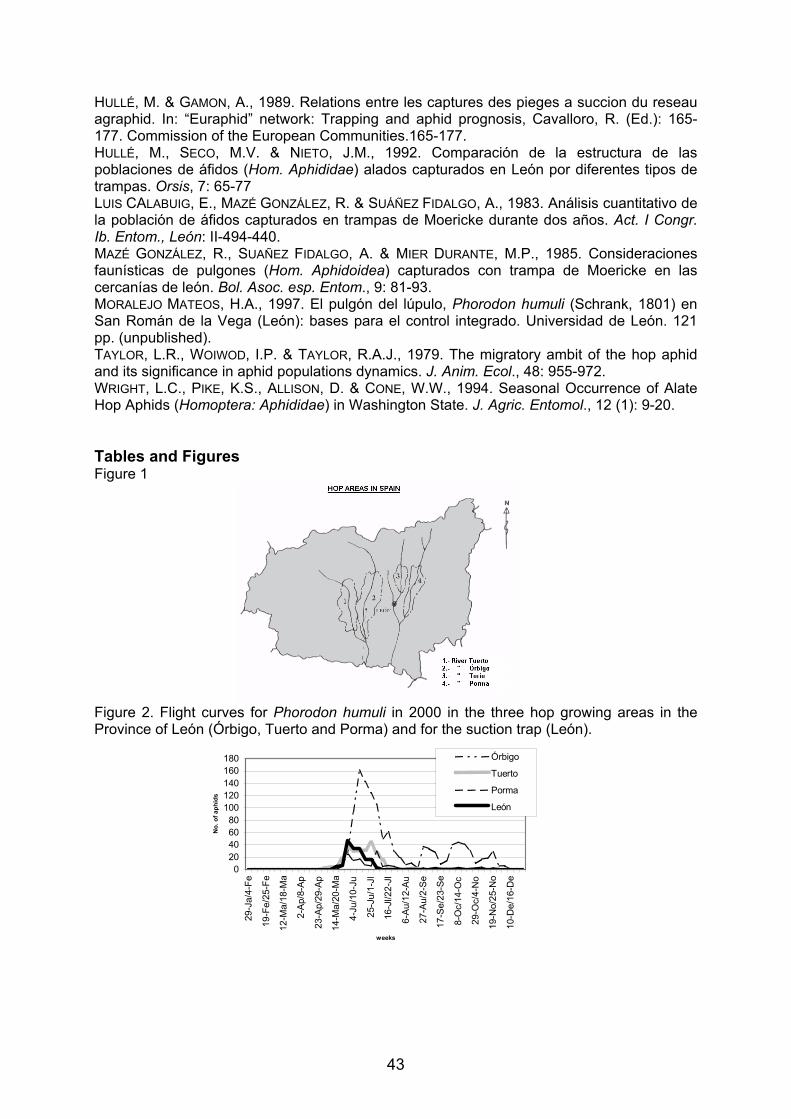
43
HULLÉ, M. & GAMON, A., 1989. Relations entre les captures des pieges a succion du reseau agraphid. In: “Euraphid” network: Trapping and aphid prognosis, Cavalloro, R. (Ed.): 165-177. Commission of the European Communities.165-177. HULLÉ, M., SECO, M.V. & NIETO, J.M., 1992. Comparación de la estructura de las poblaciones de áfidos (Hom. Aphididae) alados capturados en León por diferentes tipos de trampas. Orsis, 7: 65-77 LUIS CALABUIG, E., MAZÉ GONZÁLEZ, R. & SUÁÑEZ FIDALGO, A., 1983. Análisis cuantitativo de la población de áfidos capturados en trampas de Moericke durante dos años. Act. I Congr. Ib. Entom., León: II-494-440. MAZÉ GONZÁLEZ, R., SUAÑEZ FIDALGO, A. & MIER DURANTE, M.P., 1985. Consideraciones faunísticas de pulgones (Hom. Aphidoidea) capturados con trampa de Moericke en las cercanías de león. Bol. Asoc. esp. Entom., 9: 81-93. MORALEJO MATEOS, H.A., 1997. El pulgón del lúpulo, Phorodon humuli (Schrank, 1801) en San Román de la Vega (León): bases para el control integrado. Universidad de León. 121 pp. (unpublished). TAYLOR, L.R., WOIWOD, I.P. & TAYLOR, R.A.J., 1979. The migratory ambit of the hop aphid and its significance in aphid populations dynamics. J. Anim. Ecol., 48: 955-972. WRIGHT, L.C., PIKE, K.S., ALLISON, D. & CONE, W.W., 1994. Seasonal Occurrence of Alate Hop Aphids (Homoptera: Aphididae) in Washington State. J. Agric. Entomol., 12 (1): 9-20. Tables and Figures Figure 1
Figure 2. Flight curves for Phorodon humuli in 2000 in the three hop growing areas in the Province of León (Órbigo, Tuerto and Porma) and for the suction trap (León).
020406080
100120140160180
29-J
a/4-
Fe
19-F
e/25
-Fe
12-M
a/18
-Ma
2-Ap
/8-A
p
23-A
p/29
-Ap
14-M
a/20
-Ma
4-Ju
/10-
Ju
25-J
u/1-
Jl
16-J
l/22-
Jl
6-Au
/12-
Au
27-A
u/2-
Se
17-S
e/23
-Se
8-O
c/14
-Oc
29-O
c/4-
No
19-N
o/25
-No
10-D
e/16
-De
weeks
No.
of a
phid
s
Órbigo
Tuerto
Porma
León
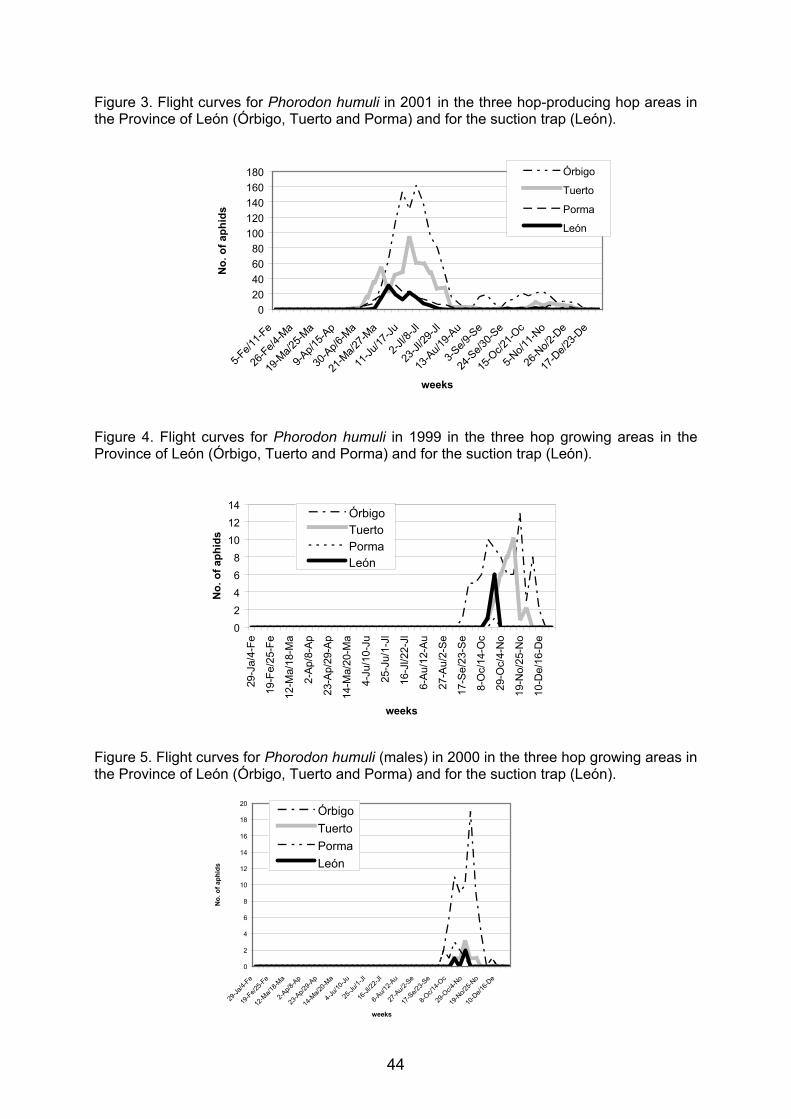
44
Figure 3. Flight curves for Phorodon humuli in 2001 in the three hop-producing hop areas in the Province of León (Órbigo, Tuerto and Porma) and for the suction trap (León).
020406080
100120140160180
5-Fe/1
1-Fe
26-F
e/4-M
a
19-M
a/25-M
a
9-Ap/1
5-Ap
30-A
p/6-M
a
21-M
a/27-M
a
11-Ju
/17-Ju
2-Jl/8
-Jl
23-Jl
/29-Jl
13-A
u/19-A
u
3-Se/9
-Se
24-S
e/30-S
e
15-O
c/21-O
c
5-No/1
1-No
26-N
o/2-D
e
17-D
e/23-D
e
weeks
No.
of a
phid
s
Órbigo
Tuerto
Porma
León
Figure 4. Flight curves for Phorodon humuli in 1999 in the three hop growing areas in the Province of León (Órbigo, Tuerto and Porma) and for the suction trap (León).
02468
101214
29-J
a/4-
Fe
19-F
e/25
-Fe
12-M
a/18
-Ma
2-A
p/8-
Ap
23-A
p/29
-Ap
14-M
a/20
-Ma
4-Ju
/10-
Ju
25-J
u/1-
Jl
16-J
l/22-
Jl
6-A
u/12
-Au
27-A
u/2-
Se
17-S
e/23
-Se
8-O
c/14
-Oc
29-O
c/4-
No
19-N
o/25
-No
10-D
e/16
-De
weeks
No.
of a
phid
s
ÓrbigoTuertoPormaLeón
Figure 5. Flight curves for Phorodon humuli (males) in 2000 in the three hop growing areas in the Province of León (Órbigo, Tuerto and Porma) and for the suction trap (León).
0
2
4
6
8
10
12
14
16
18
20
29-Ja
/4-Fe
19-F
e/25-F
e
12-M
a/18-M
a
2-Ap/8
-Ap
23-A
p/29-A
p
14-M
a/20-M
a
4-Ju/1
0-Ju
25-Ju
/1-Jl
16-Jl
/22-Jl
6-Au/1
2-Au
27-A
u/2-S
e
17-S
e/23-S
e
8-Oc/1
4-Oc
29-O
c/4-N
o
19-N
o/25-N
o
10-D
e/16-D
e
weeks
No.
of a
phid
s
ÓrbigoTuertoPormaLeón
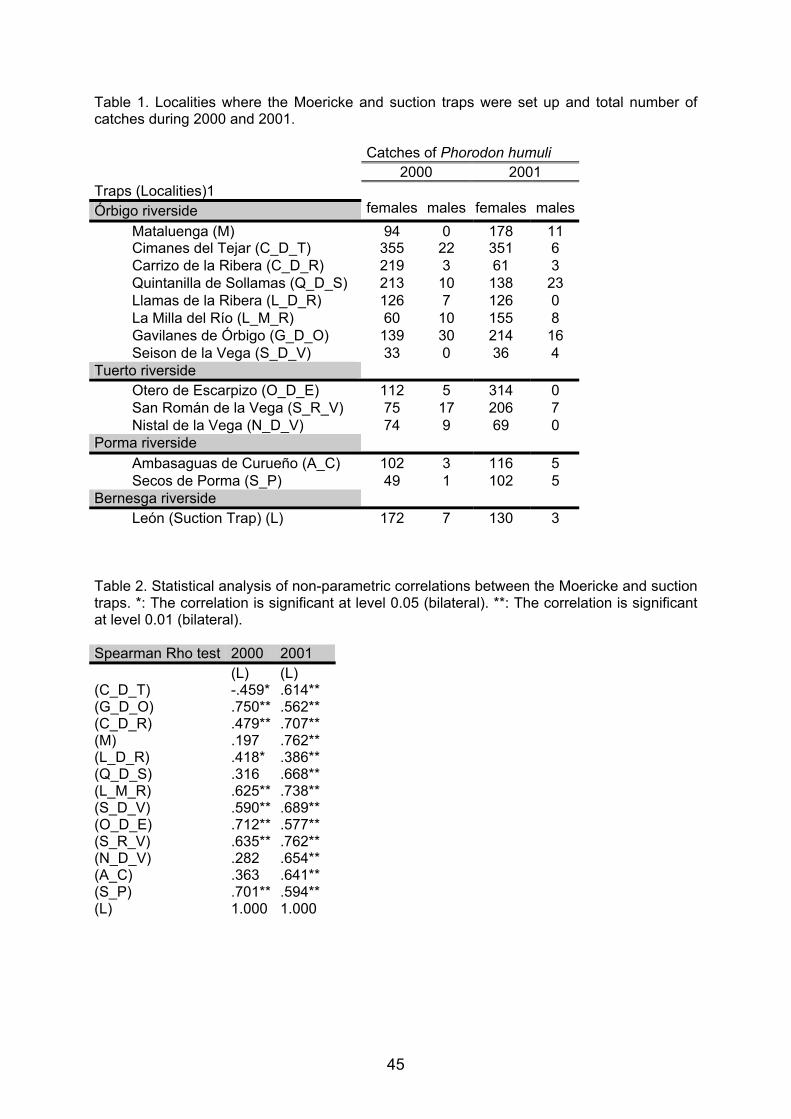
45
Table 1. Localities where the Moericke and suction traps were set up and total number of catches during 2000 and 2001. Catches of Phorodon humuli 2000 2001 Traps (Localities)1 Órbigo riverside
females
males
females
males
Mataluenga (M) 94 0 178 11 Cimanes del Tejar (C_D_T) 355 22 351 6 Carrizo de la Ribera (C_D_R) 219 3 61 3 Quintanilla de Sollamas (Q_D_S) 213 10 138 23 Llamas de la Ribera (L_D_R) 126 7 126 0 La Milla del Río (L_M_R) 60 10 155 8 Gavilanes de Órbigo (G_D_O) 139 30 214 16 Seison de la Vega (S_D_V) 33 0 36 4
Tuerto riverside Otero de Escarpizo (O_D_E) 112 5 314 0 San Román de la Vega (S_R_V) 75 17 206 7 Nistal de la Vega (N_D_V) 74 9 69 0
Porma riverside Ambasaguas de Curueño (A_C) 102 3 116 5 Secos de Porma (S_P) 49 1 102 5
Bernesga riverside León (Suction Trap) (L) 172 7 130 3
Table 2. Statistical analysis of non-parametric correlations between the Moericke and suction traps. *: The correlation is significant at level 0.05 (bilateral). **: The correlation is significant at level 0.01 (bilateral). Spearman Rho test 2000 2001 (L) (L) (C_D_T) -.459* .614** (G_D_O) .750** .562** (C_D_R) .479** .707** (M) .197 .762** (L_D_R) .418* .386** (Q_D_S) .316 .668** (L_M_R) .625** .738** (S_D_V) .590** .689** (O_D_E) .712** .577** (S_R_V) .635** .762** (N_D_V) .282 .654** (A_C) .363 .641** (S_P) .701** .594** (L) 1.000 1.000
46
BIOLOGICAL CONTROL OF TETRANYCHUS URTICAE KOCH WITH THE HELP OF PREDATORY MITES ON HOPS
J. Vostrel
Hop Research Institute, Co., Ltd., 2525 Kadaňská, 438 46 Žatec, Czech Republic. Abstract Predatory mites Typhlodromus pyri Scheuten and Amblyseius californicus Mc Gregor have been able to control resistant populations of two-spotted spider mite (Tetranychus urticae Koch) within the period 2000-2002 in an experimental hop garden in Kaaden, Czech Republic. Damson-hop aphid (Phorodon humuli Schrank) was successfully treated with a selective insecticide, pymetrozine. Rare surviving aphids were controlled by aphidophagous insects, which were not damaged by pymetrozine. This combination of biological and chemical control seems to be a promising practise in T. urticae and P. humuli management strategy. Introduction Damson hop aphid (Phorodon humuli Schrank) and two-spotted spider mite (Tetranychus urticae Koch) are the two most dangerous pests of hop plants not only in Europe but in the USA as well. Aphids can cause damage to a crop in several ways. Nymphs and adults withdraw nutrients from the plant and disturb the growth hormone balance; plant sap lacks protein and is rich in sugar. The aphids excrete the excess sugar as honeydew and sooty moulds (Cladosporium spp.) can grow on it, photosynthesis also decreases and toxic substances can be brought into a plant and pathogens, especially viruses, can be transmitted. Larvae and nymphs as well as adults of T. urticae cause chlorophyll are destroyed. Photosynthesis and therefore plant growth decreases, substances are brought into a plant, which are probably poisonous (Malais, Ravensberg, 1992). Contemporary hop protection against resistant strains of Phorodon humuli Schrank and Tetranychus urticae Koch is based exclusively on their control by insecticides and acaricides. Management strategy in hop protection against P. humuli consists for the last decade predominantly on application of highly effective aphicide, imidacloprid. Nevertheless, we can find surviving aphids after treatment with this compound in some hop gardens lately. Regular change of imidacloprid and pymetrozine is therefore recommended to be able to cope with this problem. Hexythiazox, fenpyroximate, abamectin and propargite are recommended for hop protection against T. urticae (Vostrel, 2000). In spite of the fact that these acaricides are still highly efficient, other ways of hop protection against T. urticae are necessary to search for as the resistance of T. urticae may appear in the future. Biological methods with the help of predatory mites seem to be one possible way. Strong and Croft (1995) obtained some promising results if some species of Phytoseiid mites were released in Oregon. The most effective control was reached with the help of Neoseiulus fallacis and Typhlodromus occidentalis or by a mixture of the both species. Similar results were obtained with these two species when they were released in Washington State. Mite numbers did not exceed a mean number of six mobile stages per leaf during the season and there was no economic damage on cones (James et al., 2001). Not only American researchers but European as well have already had some promising results with biological control of T. urticae with the help of predatory mites. In Kent hop gardens in England Campbell and Lilley (1999) obtained some good results with Phytoseiulus persimilis. In Germany Benker (1997) and in France Weisenberger (1999) engaged in biological control possibilities as well. First reports concerning biological control of two-spotted spider mite with the help of predatory mites, Typhlodromus pyri Scheuten and Amblyseius californicus McGregor in CR were presented by Vostrel (2001) at the previous meeting of the Scientific Commission in Canterbury, England. As they seemed to be promising ones, the research work continued in 2001 and 2002. A selective insecticide (pymetrozine) controlled damson hop aphid on the experimental plot. Similar approach was studied in England on dwarf hops with the use of a single soil application of imidacloprid. Predators regulated here the numbers of aphids when the effects of the aphicide diminished (Campbell, 2001).
47
Material and methods A small experimental hop garden in Kaaden was used for the purpose of testing biological control of T. urticae with the help of predatory mites Typhlodromus pyri Scheuten and Amblyseius californicus Mc Gregor (Acari: Tetranychidae, Phytoseiidae). The same hop garden served for preliminary tests with these Phytoseiid mites in 2000 season as presented in the last meeting of the Scientific Commission held in Canterbury in 2001. The individuals of the both species were obtained for this purpose from Biola Chelcice as well as in 2000 tests. A. californicus was released on May 8, 2001 in the rate of 20 adults per plant. Both species (A. californicus and T. pyri) were released on April 29, 2002 in the same rate as in the previous year. A. californicus was delivered for this purpose in a transporting container with approximately 2000 predatory mites and released by tapping from this container with sawdust on hop shoots emerging from soil in both experimental years. T. pyri was released in spring 2002 with the help of felt belts containing five adults each. That means four belts were put to each biologically treated hop plant among emerging shoots. Samples of 50 leaves were taken from May 25 till August 28 in 2001 and from May 24 till September 09 in 2002, resp.
One hundred hop plants were included into each variant in both years. Totally fifteen times were samples taken in 2001 and eleven times the following year. Only a very low density of T. urticae was observed in the time when predatory mites were released. The samples were brought into a laboratory where the densities of two-spotted spider mites and predatory mites were checked. To be able to cope with abundant damson hop aphids present each year in the experimental hop garden a selective aphicide, pymetrozine (Chess 25 WP) was applied at the beginning of June. Its efficiency was high enough to prevent economic damage. Surviving aphids were controlled by aphidophagous predators among them coccinellids were the most numerous. Results In 2001 the highest population density of T. urticae was observed at the beginning of the season, in the last decade of May and at the beginning of June. The maximum of T. urticae eggs reached the value of 28,4 per leaf (June 07, 2001) and the maximum of mobile stages (13,8 per leaf) was found out on May 25, 2001. Later, since the third decade of June, number of both eggs and mobile stages decreased to low values (under 2,5 eggs/leaf and 1,5 mobile stages per leaf, resp.). Increase of population density of two-spotted spider mite was observed during harvest time in the last decade of August but it did not exceed fifteen eggs and five mobile stages per leaf. This trend was followed by the occurrence of A. californicus, where the highest number of mobile stages per leaf was observed in the time when the abundance of T. urticae was the highest as well. The most numerous were the predatory mites at the beginning of the season when they reached the number between five and fourteen mobile stages per fifty leaves. Later their number dropped with decreasing population density of T. urticae. Among native acarophagous predators Aeolothrips spp. was the most numerous natural enemy of two-spotted spider mite. Nymphal stages of Stethorus spp. and Orius spp. were rarely observed too, predominantly in the second half of the season. Similar development in population dynamics of T. urticae and its predatory mites was observed in 2002 season. The number of two-spotted spider mites was slightly lower in both experimental plots in comparison with the previous year at the beginning of the season when the highest number was reached on May 24, 2002 (3,6 mobile stages per leaf) in the plot treated with Typhlodromus pyri and 4,7 mobile stages per leaf in the plot treated with Amblyseius californicus. Later number of two-spotted spider mites decreased to fewer than 3.0 individuals per leaf (till the harvest time). The increase in population density of T. urticae was recorded in September, that means in time when hops are commonly over their harvest. Population density of predatory mites followed the occurrence of their prey.
48
Conclusion In a small experimental hop garden in Kaaden, Czech Republic predatory mites Amblyseius californicus (in a two-years experiment) and Typhlodromus pyri (in a one year experiment) succeeded to control resistant strains of two-spotted spider mite, which occurred in a low population density during all the season. In this way they confirmed preliminary tests from 2000 as presented at the meeting of the Scientific Commission in Canterbury two years ago. Integrated pest management is possible to do with the help of a selective aphicide pymetrozine, which has not only high aphicidal efficacy but also enables surviving of predators after its application, which are able to control surviving aphids. This strategy seems to be a promising one in the case of a complete failure of acaricides due to resistance phenomenon. References Benker, U., 1997: Population dynamics of pests (damson-hop aphid Phorodon humuli Schrank and two-spotted spider mite Tetranychus urticae Koch) and beneficial organisms in hops. Proceedings of the Scientific Commission of the International Hop Growers’ Convention. Zatec, Czech Republic, 29 July – 01 August, 1997: 21-27.
Campbell, C.A.M., Lilley, R., 1999: The effect of timing and rates of release of Phytoseiulus persimilis against two-spotted spider mite Tetranychus urticae on dwarf hops. Biocontrol Science and Technology 9, 453-465.
Campbell, C.A.M., 2001: Integrated management of damson-hop aphid on dwarf hops. Proceedings of the Scientific Commission of the International Hop Grower’s Convention. Canterbury, Kent, England, 5-7 August, 2001: 61-65.
James, D.G., Price, T.S., Wright, L.C., Perez, J, 2001: Biological control of mites and aphids on Washington hops: an assemblage approach. Proceedings of the Scientific Commission of the International Hop Growers’ Convention. Canterbury, Kent, England, 5-7 August, 2001: 71-75.
Malais, M., Ravensberg, W.J., 1992: Knowing and Recognizing. Koppert, B.V., Berkel and Rodenrijs, the Netherlands, 98 p.
Strong, W.B. and Croft, B.A., 1995: Inoculative release of Phytoseiid mites (Acarina: Phytoseiidae) into the rapidly expanding canopy of hop for control of Tetranychus urticae (Acarina: Tetranychidae). Environ. Entomol., 24: 446-453.
Vostrel, J., 2000: The research of P. humuli and T. urticae resistance and its using in hop protection strategy. The Final Report for Czech Ministry of Agriculture, National Agency for Agricultural Research, 43 p.
Vostrel, J., 2001: The control of Tetranychus urticae by predatory mites Phytoseiulus persimilis Athias Henriot, Typhlodromus pyri Scheuten and Amblyseius californicus Mc Gregor (Acari: Tetranychidae, Photoseiidae) on hops. Proceeedings of the Scientific Commission of the International Hop Growers Convention. Canterbury, Kent, England, 5-7 August, 2001: 66-70.
Weisenberger, A., 1999: Biological control of the damson-hop aphid, Phorodon humuli (Schrank) with the ladybird Harmonia axyridis (Pallas) in Alsace: comparison between the natural and flightless strain. Proceedings of the Scientific Commission of the International Hop Growers’ Convention. Pulawy, Poland, 27-30 July, 1999: 99-103.
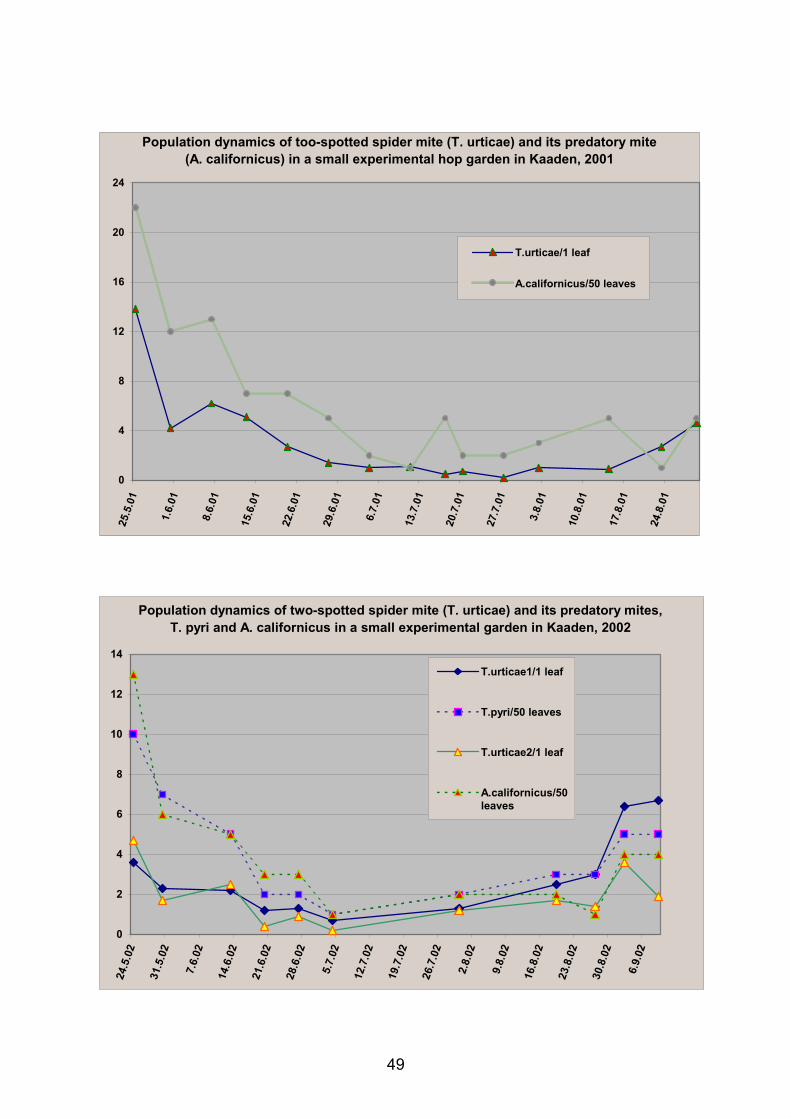
49
0
4
8
12
16
20
24
25.5
.01
1.6.
01
8.6.
01
15.6
.01
22.6
.01
29.6
.01
6.7.
01
13.7
.01
20.7
.01
27.7
.01
3.8.
01
10.8
.01
17.8
.01
24.8
.01
T.urticae/1 leaf
A.californicus/50 leaves
Population dynamics of too-spotted spider mite (T. urticae) and its predatory mite (A. californicus) in a small experimental hop garden in Kaaden, 2001
0
2
4
6
8
10
12
14
24.5
.02
31.5
.02
7.6.
02
14.6
.02
21.6
.02
28.6
.02
5.7.
02
12.7
.02
19.7
.02
26.7
.02
2.8.
02
9.8.
02
16.8
.02
23.8
.02
30.8
.02
6.9.
02
T.urticae1/1 leaf
T.pyri/50 leaves
T.urticae2/1 leaf
A.californicus/50leaves
Population dynamics of two-spotted spider mite (T. urticae) and its predatory mites, T. pyri and A. californicus in a small experimental garden in Kaaden, 2002
50
THE FORMATION OF LOW-MOLECULAR POLYPHENOLS DURING THE GROWTH OF HOPS
Adrian Forster, Barbara Beck, Sabine Massinger und Roland Schmidt NATECO2 GmbH & Co. KG, Auenstrasse 18-20, 85283 Wolnzach
INTRODUCTION A short time ago we reported on the composition of low-molecular polyphenols in various hop varieties and in two hop-growing regions (1). In the summary the following central findings resulted: ”Two teams have systematically investigated the composition of low-molecular polyphenols in hops. More than 100 individual components can be separated by means of HPLC. Most of them can be characterized by means of DAD spectra and HPLC-MS coupling. Based on two crops 11 important European hop varieties are described in their compositions of low-molecular polyphenols. This results to some extent in considerable differences. When comparing the Hallertau and USA hop-growing regions with the varieties investigated Perle and Nugget, some differences can be traced in three crops. Thus for the first time it was successfully proved that the growing regions can have an effect on the chemical composition of hops.” In the present contribution the question was how low-molecular polyphenols are formed during the growth. At the same time samples of vine leaves and hop cones were drawn during the vegetation period and analysed for the low-molecular polyphenols by means of HPLC-DAD analysis. MATERIAL AND METHODS The research was spread over the two vegetation periods 2001 and 2002. The aroma varieties selected were Hallertau Hallertauer Tradition (HHT) and Hallertau Spalter Select (HSE) as well as the bitter varieties Hallertau Hallertauer Magnum (HHM) and Hallertau Hallertauer Taurus (HTU). In 2001 the samples were taken following a concept according to Table 1, by which the 5 development stages were used from the annual growing recommendations from Hüll (2). Table 1: Taking samples of hop vine leaves and cones in various stages of vegetation
Stage Description Sample taken Vine leaves Cones
35 50 % of trellis height beginning of June X 65 full bloom mid-July X 75 semi- to fully formed cones beginning of August X X 81 beginning of cone ripening mid-August X X 89 cone ripening end of August/
beginning of Sept. X X
In 2002 the samples were limited to being taken from vine leaves and cones in 2 stages. Vine leaves and cones were frozen directly after the samples were taken. In order to eliminate effects of different drying processes, freeze-drying or lyophylisation was employed. This process took about 20 hours in a laboratory unit, model Alpha 1 – 4 from the firm Christ. The vine leaves or cones dried in this way were tested by means of a HPLC-DAD analysis for their low-molecular polyphenols. The methods as well as the results of characterising the substances by means of ion tap mass spectrometer have already been shown (1). Most of
51
the 80 evaluated individual components can be grouped into the following 7 substance classes: ♦ hydroxy benzoic acids ♦ hydroxy cinnamic acids ♦ flavanols (catechin, epicatechin) ♦ proanthocyanidins (anthohcyanidins, delphinidins) ♦ quercetin flavonoids ♦ kaemperol flavonoids ♦ other flavonoids If one adds the 7 classes and supplement them with some not clearly characterized substances they produce the total of the low-molecular polyphenols. It was possible to determine the non-polar components quercetin, 8 prenyl naringenin and xanthohumol with a HPLC-DAD method which normally separates and quantifies hop bitter compounds (3). In addition the samples were analysed for their total content of polyphenols with a non-specific colour method similar to that described by Jerumanis (4). RESULTS Within the scope of this presentation only the results from the 2001 crop will be quoted so that tables and figures do not escalate out of bounds. The results of the samples from the 2002 crop produced a comparable picture so that the findings from the 2001 crop can essentially be confirmed. Substance classes as an average of 4 varieties Table 2 comprises the development of all low-molecular polyphenols in the stages of growth as an average over the 4 varieties respectively. The 7 substance classes as well as the total of the low-molecular polyphenols are listed. The first 5 rows of figures include the vine leaves, the following 3 the cones. In Table 3 the relations of the contents in the cones to the leaves are listed. The Tables 4 - 7 contain the corresponding data for each hop variety as in Table 2. Table 2: Low-molecular polyphenols and substance classes in 5 leaf and 3 cone
samples, vegetation period 2001. Values in mg/100 g waterfree sample, average from all 4 varieties
Vine leaves Cones
Stage 35 65 75 81 89 75 81 89 Hydroxy cinnamic acids 1.297 1.180 971 901 798 254 232 181 Hydroxy benzoic acids - - - - - - 1 5 Flavanols 136 119 91 84 78 430 340 260 Proanthocyanidins 198 151 117 108 97 625 539 430 Quercetin flavonoids 624 496 453 416 395 282 273 220 Kaemperol flavonoids 1.959 1.672 1.615 1.496 1.328 207 205 177 Other flavonoids 43 36 36 29 25 28 30 27 Total low-molecular polyphenols
4.618 3.934 3.536 3.277 2.756 1.984 1.866 1.534
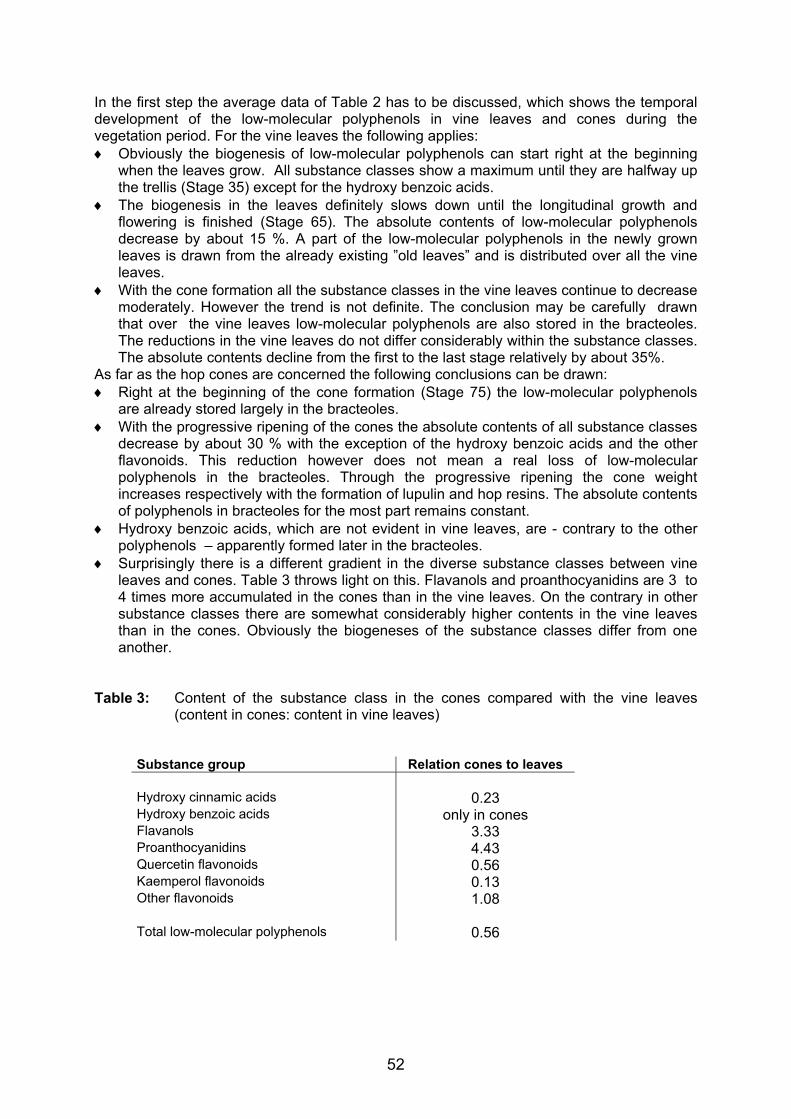
52
In the first step the average data of Table 2 has to be discussed, which shows the temporal development of the low-molecular polyphenols in vine leaves and cones during the vegetation period. For the vine leaves the following applies: ♦ Obviously the biogenesis of low-molecular polyphenols can start right at the beginning
when the leaves grow. All substance classes show a maximum until they are halfway up the trellis (Stage 35) except for the hydroxy benzoic acids.
♦ The biogenesis in the leaves definitely slows down until the longitudinal growth and flowering is finished (Stage 65). The absolute contents of low-molecular polyphenols decrease by about 15 %. A part of the low-molecular polyphenols in the newly grown leaves is drawn from the already existing ”old leaves” and is distributed over all the vine leaves.
♦ With the cone formation all the substance classes in the vine leaves continue to decrease moderately. However the trend is not definite. The conclusion may be carefully drawn that over the vine leaves low-molecular polyphenols are also stored in the bracteoles. The reductions in the vine leaves do not differ considerably within the substance classes. The absolute contents decline from the first to the last stage relatively by about 35%.
As far as the hop cones are concerned the following conclusions can be drawn: ♦ Right at the beginning of the cone formation (Stage 75) the low-molecular polyphenols
are already stored largely in the bracteoles. ♦ With the progressive ripening of the cones the absolute contents of all substance classes
decrease by about 30 % with the exception of the hydroxy benzoic acids and the other flavonoids. This reduction however does not mean a real loss of low-molecular polyphenols in the bracteoles. Through the progressive ripening the cone weight increases respectively with the formation of lupulin and hop resins. The absolute contents of polyphenols in bracteoles for the most part remains constant.
♦ Hydroxy benzoic acids, which are not evident in vine leaves, are - contrary to the other polyphenols – apparently formed later in the bracteoles.
♦ Surprisingly there is a different gradient in the diverse substance classes between vine leaves and cones. Table 3 throws light on this. Flavanols and proanthocyanidins are 3 to 4 times more accumulated in the cones than in the vine leaves. On the contrary in other substance classes there are somewhat considerably higher contents in the vine leaves than in the cones. Obviously the biogeneses of the substance classes differ from one another.
Table 3: Content of the substance class in the cones compared with the vine leaves
(content in cones: content in vine leaves)
Substance group Relation cones to leaves Hydroxy cinnamic acids 0.23 Hydroxy benzoic acids only in cones Flavanols 3.33 Proanthocyanidins 4.43 Quercetin flavonoids 0.56 Kaemperol flavonoids 0.13 Other flavonoids 1.08 Total low-molecular polyphenols 0.56
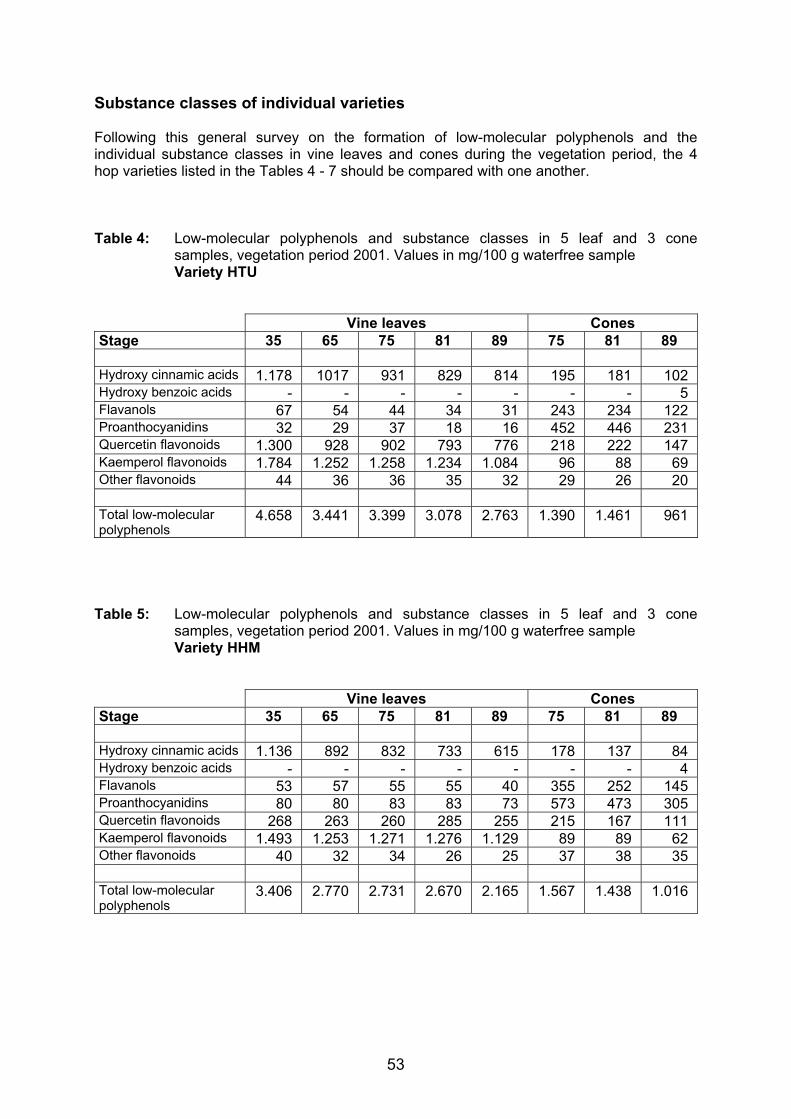
53
Substance classes of individual varieties Following this general survey on the formation of low-molecular polyphenols and the individual substance classes in vine leaves and cones during the vegetation period, the 4 hop varieties listed in the Tables 4 - 7 should be compared with one another. Table 4: Low-molecular polyphenols and substance classes in 5 leaf and 3 cone
samples, vegetation period 2001. Values in mg/100 g waterfree sample Variety HTU
Vine leaves Cones
Stage 35 65 75 81 89 75 81 89 Hydroxy cinnamic acids 1.178 1017 931 829 814 195 181 102 Hydroxy benzoic acids - - - - - - - 5 Flavanols 67 54 44 34 31 243 234 122 Proanthocyanidins 32 29 37 18 16 452 446 231 Quercetin flavonoids 1.300 928 902 793 776 218 222 147 Kaemperol flavonoids 1.784 1.252 1.258 1.234 1.084 96 88 69 Other flavonoids 44 36 36 35 32 29 26 20 Total low-molecular polyphenols
4.658 3.441 3.399 3.078 2.763 1.390 1.461 961
Table 5: Low-molecular polyphenols and substance classes in 5 leaf and 3 cone
samples, vegetation period 2001. Values in mg/100 g waterfree sample Variety HHM
Vine leaves Cones
Stage 35 65 75 81 89 75 81 89 Hydroxy cinnamic acids 1.136 892 832 733 615 178 137 84 Hydroxy benzoic acids - - - - - - - 4 Flavanols 53 57 55 55 40 355 252 145 Proanthocyanidins 80 80 83 83 73 573 473 305 Quercetin flavonoids 268 263 260 285 255 215 167 111 Kaemperol flavonoids 1.493 1.253 1.271 1.276 1.129 89 89 62 Other flavonoids 40 32 34 26 25 37 38 35 Total low-molecular polyphenols
3.406 2.770 2.731 2.670 2.165 1.567 1.438 1.016
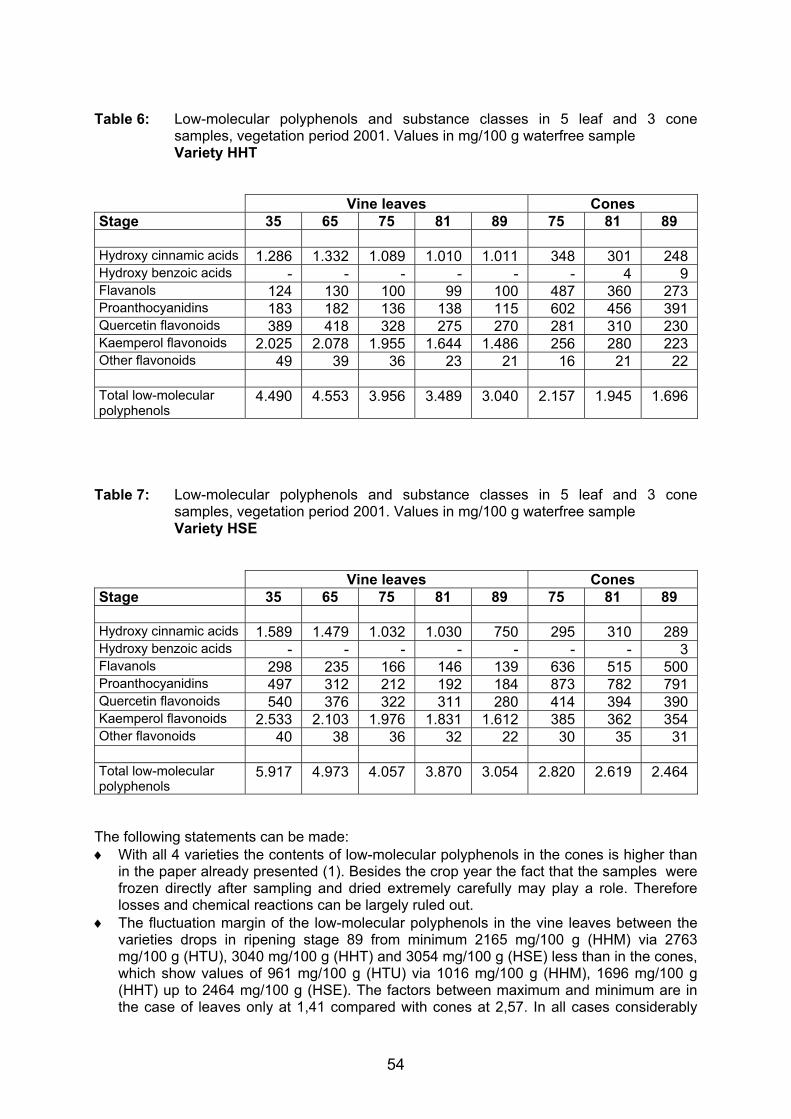
54
Table 6: Low-molecular polyphenols and substance classes in 5 leaf and 3 cone
samples, vegetation period 2001. Values in mg/100 g waterfree sample Variety HHT
Vine leaves Cones
Stage 35 65 75 81 89 75 81 89 Hydroxy cinnamic acids 1.286 1.332 1.089 1.010 1.011 348 301 248 Hydroxy benzoic acids - - - - - - 4 9 Flavanols 124 130 100 99 100 487 360 273 Proanthocyanidins 183 182 136 138 115 602 456 391 Quercetin flavonoids 389 418 328 275 270 281 310 230 Kaemperol flavonoids 2.025 2.078 1.955 1.644 1.486 256 280 223 Other flavonoids 49 39 36 23 21 16 21 22 Total low-molecular polyphenols
4.490 4.553 3.956 3.489 3.040 2.157 1.945 1.696
Table 7: Low-molecular polyphenols and substance classes in 5 leaf and 3 cone
samples, vegetation period 2001. Values in mg/100 g waterfree sample Variety HSE
Vine leaves Cones
Stage 35 65 75 81 89 75 81 89 Hydroxy cinnamic acids 1.589 1.479 1.032 1.030 750 295 310 289 Hydroxy benzoic acids - - - - - - - 3 Flavanols 298 235 166 146 139 636 515 500 Proanthocyanidins 497 312 212 192 184 873 782 791 Quercetin flavonoids 540 376 322 311 280 414 394 390 Kaemperol flavonoids 2.533 2.103 1.976 1.831 1.612 385 362 354 Other flavonoids 40 38 36 32 22 30 35 31 Total low-molecular polyphenols
5.917 4.973 4.057 3.870 3.054 2.820 2.619 2.464
The following statements can be made: ♦ With all 4 varieties the contents of low-molecular polyphenols in the cones is higher than
in the paper already presented (1). Besides the crop year the fact that the samples were frozen directly after sampling and dried extremely carefully may play a role. Therefore losses and chemical reactions can be largely ruled out.
♦ The fluctuation margin of the low-molecular polyphenols in the vine leaves between the varieties drops in ripening stage 89 from minimum 2165 mg/100 g (HHM) via 2763 mg/100 g (HTU), 3040 mg/100 g (HHT) and 3054 mg/100 g (HSE) less than in the cones, which show values of 961 mg/100 g (HTU) via 1016 mg/100 g (HHM), 1696 mg/100 g (HHT) up to 2464 mg/100 g (HSE). The factors between maximum and minimum are in the case of leaves only at 1,41 compared with cones at 2,57. In all cases considerably
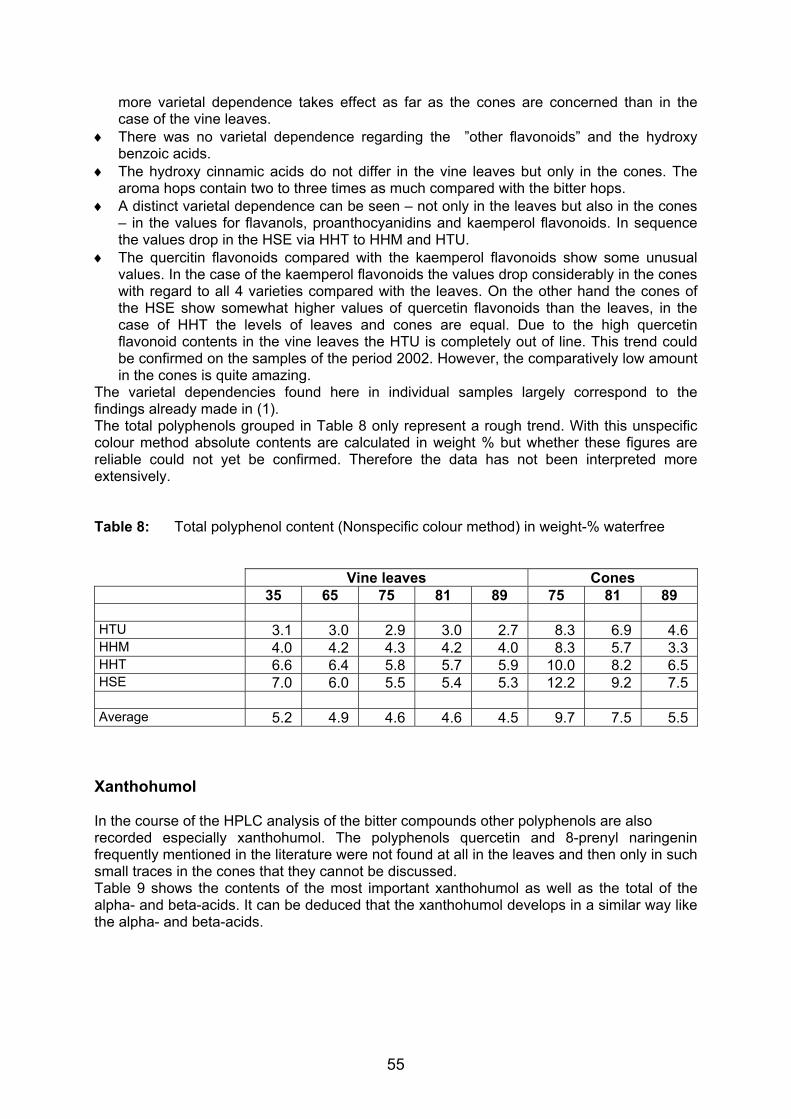
55
more varietal dependence takes effect as far as the cones are concerned than in the case of the vine leaves.
♦ There was no varietal dependence regarding the ”other flavonoids” and the hydroxy benzoic acids.
♦ The hydroxy cinnamic acids do not differ in the vine leaves but only in the cones. The aroma hops contain two to three times as much compared with the bitter hops.
♦ A distinct varietal dependence can be seen – not only in the leaves but also in the cones – in the values for flavanols, proanthocyanidins and kaemperol flavonoids. In sequence the values drop in the HSE via HHT to HHM and HTU.
♦ The quercitin flavonoids compared with the kaemperol flavonoids show some unusual values. In the case of the kaemperol flavonoids the values drop considerably in the cones with regard to all 4 varieties compared with the leaves. On the other hand the cones of the HSE show somewhat higher values of quercetin flavonoids than the leaves, in the case of HHT the levels of leaves and cones are equal. Due to the high quercetin flavonoid contents in the vine leaves the HTU is completely out of line. This trend could be confirmed on the samples of the period 2002. However, the comparatively low amount in the cones is quite amazing.
The varietal dependencies found here in individual samples largely correspond to the findings already made in (1). The total polyphenols grouped in Table 8 only represent a rough trend. With this unspecific colour method absolute contents are calculated in weight % but whether these figures are reliable could not yet be confirmed. Therefore the data has not been interpreted more extensively. Table 8: Total polyphenol content (Nonspecific colour method) in weight-% waterfree
Vine leaves Cones 35 65 75 81 89 75 81 89 HTU 3.1 3.0 2.9 3.0 2.7 8.3 6.9 4.6 HHM 4.0 4.2 4.3 4.2 4.0 8.3 5.7 3.3 HHT 6.6 6.4 5.8 5.7 5.9 10.0 8.2 6.5 HSE 7.0 6.0 5.5 5.4 5.3 12.2 9.2 7.5 Average 5.2 4.9 4.6 4.6 4.5 9.7 7.5 5.5
Xanthohumol In the course of the HPLC analysis of the bitter compounds other polyphenols are also recorded especially xanthohumol. The polyphenols quercetin and 8-prenyl naringenin frequently mentioned in the literature were not found at all in the leaves and then only in such small traces in the cones that they cannot be discussed. Table 9 shows the contents of the most important xanthohumol as well as the total of the alpha- and beta-acids. It can be deduced that the xanthohumol develops in a similar way like the alpha- and beta-acids.
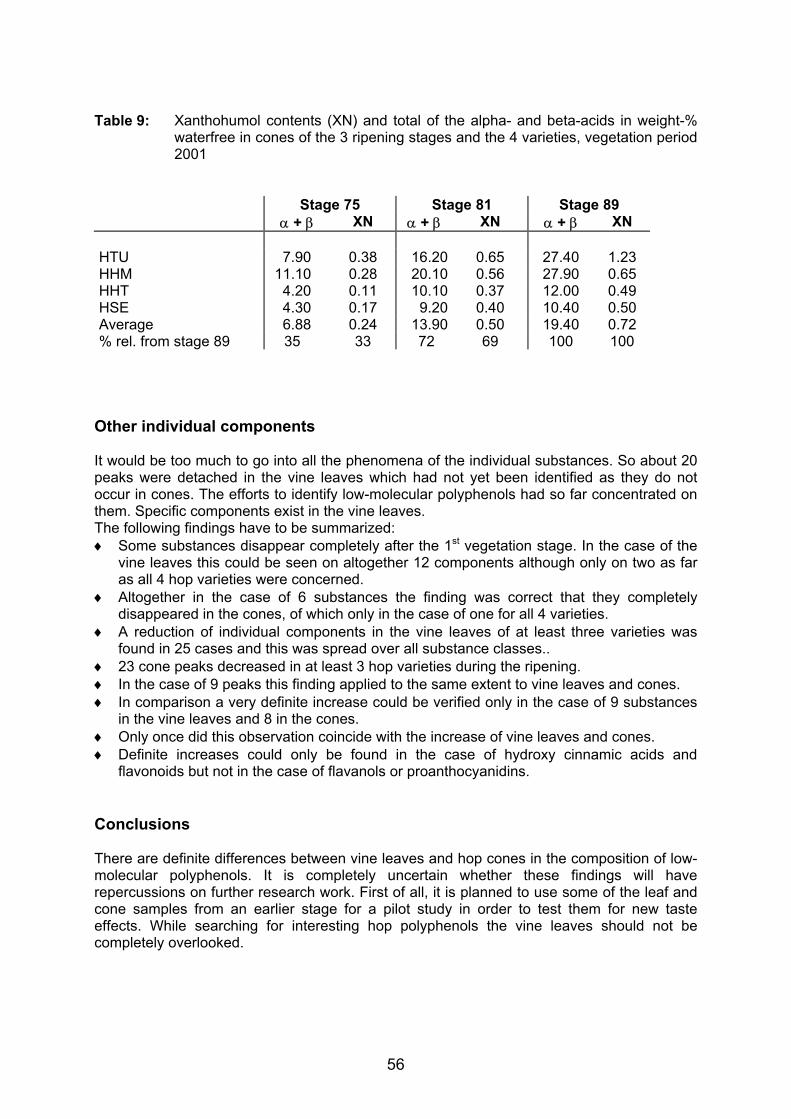
56
Table 9: Xanthohumol contents (XN) and total of the alpha- and beta-acids in weight-%
waterfree in cones of the 3 ripening stages and the 4 varieties, vegetation period 2001
Stage 75 Stage 81 Stage 89
α + β XN α + β XN α + β XN HTU 7.90 0.38 16.20 0.65 27.40 1.23 HHM 11.10 0.28 20.10 0.56 27.90 0.65 HHT 4.20 0.11 10.10 0.37 12.00 0.49 HSE 4.30 0.17 9.20 0.40 10.40 0.50 Average 6.88 0.24 13.90 0.50 19.40 0.72 % rel. from stage 89 35 33 72 69 100 100
Other individual components It would be too much to go into all the phenomena of the individual substances. So about 20 peaks were detached in the vine leaves which had not yet been identified as they do not occur in cones. The efforts to identify low-molecular polyphenols had so far concentrated on them. Specific components exist in the vine leaves. The following findings have to be summarized: ♦ Some substances disappear completely after the 1st vegetation stage. In the case of the
vine leaves this could be seen on altogether 12 components although only on two as far as all 4 hop varieties were concerned.
♦ Altogether in the case of 6 substances the finding was correct that they completely disappeared in the cones, of which only in the case of one for all 4 varieties.
♦ A reduction of individual components in the vine leaves of at least three varieties was found in 25 cases and this was spread over all substance classes..
♦ 23 cone peaks decreased in at least 3 hop varieties during the ripening. ♦ In the case of 9 peaks this finding applied to the same extent to vine leaves and cones. ♦ In comparison a very definite increase could be verified only in the case of 9 substances
in the vine leaves and 8 in the cones. ♦ Only once did this observation coincide with the increase of vine leaves and cones. ♦ Definite increases could only be found in the case of hydroxy cinnamic acids and
flavonoids but not in the case of flavanols or proanthocyanidins. Conclusions There are definite differences between vine leaves and hop cones in the composition of low-molecular polyphenols. It is completely uncertain whether these findings will have repercussions on further research work. First of all, it is planned to use some of the leaf and cone samples from an earlier stage for a pilot study in order to test them for new taste effects. While searching for interesting hop polyphenols the vine leaves should not be completely overlooked.
57
SUMMARY The biogenesis of low-molecular polyphenols in hops begins very early with the growth of the vine leaves. The composition of the polyphenols in the cones differs considerably from those in the vine leaves. Thus polyphenols were discovered in vine leaves which do not occur at all in the bracteoles. However this also applies the other way round. Xanthohumol and hydroxybenzoic acids for example can be found only in the cones. Vine leaves contain generally higher amounts of low-molecular polyphenols than cones. This particularly applies to the substance classes of the kaemperol flavonoids followed by the hydroxy cinnamic acids and the quercitin flavonoids. Cones on the other hand are considerably richer in flavanols and proanthocyanidins than vine leaves. Individual low-molecular polyphenols, which can easily be detected at the beginning, disappear completely during the vegetation period, an observation which applies more to the vine leaves than the cones. In the case of about 25 substances a definite decrease could be ascertained to the same extent in at least 3 varieties. This applies in the case of 9 peaks for leaves and cones. The 4 hop varieties studied differ in the composition of the polyphenols to a considerably greater extent in the cones than in the leaves. As already ascertained on several occasions the aroma hops HHT and especially HSE are richer in low-molecular polyphenols than the bitter varieties HTU and HHM. Apart from that one phenomenon is worth mentioning: The leaves of the HTU contain by far the highest amounts of quercetin flavonoids compared with the other varieties, on the other hand the cones contain the least. Literature (1) Forster, A., Beck, B., Schmidt, R., Jansen, C., Mellenthin, A.:
Monatsschrift für Brauwissenschaft, Jahrgang 55, 5/6, 98 - 108, (Juni 2002)
(2) Annual Recommandations of the Bayerische Landesanstalt für Landwirtschaft, Anbau-Düngung-Pflanzenschutz-Sorten, Hopfen 2003
(3) Forster, A., Beck, B., Köberlein, A., Schmidt, R.: EBC Proceedings of the 26th Congress Maastricht 223 - 230, (1997)
(4) Jerumanis, J.: Brauwissenschaft 25, 319 - 322, (1972)
58
HOW HOP POWDERY MILDEW INFLUENCES THE QUALITY OF HOPS AND BEER?
Karel Krofta, Vladimír Nesvadba, Hop Research Institute, Co. Ltd., Zatec, Czech Republic
ABSTRACT Hop powdery mildew (Sphaerotheca humuli) is a serious fungal disease of hop. It has endangered quality and quantity of hop crop every year. The influence of hop powdery mildew was studied in the period 1999-2002 on several varieties cultivated in Saaz growing region.The results of bitter acids analyses showed that cones damaged by powdery mildew had lower contents of α-bitter acids by 12-25 % rel. Contents of β-bitter acids was reduced too. Cohumulone and colupulone ratio remained practically unchanged. Contents of hop oils in infected cones was significantly reduced. SPME analyses results revealed some substantial differences in the hop oils composition of infected and healthy cones. Practically no methylesters of fatty acids with linear, branched and unsaturated chain were found in cones heavily infected by powdery mildew. The influence of hop powdery mildew on beer quality was verified by brewing tests performed at 0,5 hl brew scale. The results of brewing tests did not prove negative influence of hop powdery mildew on beer quality at moderate levels of infection. INTRODUCTION
Hop powdery mildew (Sphaerotheca humuli) is a serious fungal disease of hop. In 1997 it appeared in the Czech Republic after a long time and since it has endangered quality and quantity of hop crop every year. That year hop powder mildew broke out in wide scale practically in the whole Europe and in the USA where it had not been known up to that time /Mahaffee et al., 2001/. The influence of hop powdery mildew on hops and beer quality was studied in the period 1999-2002 on several varieties (Saaz, Magum, Premiant) cultivated in Saaz growing region. Healthy cones and cones damaged by powdery mildew picked at the stage of maturity were analysed on the contents and composition of hop bitter acids and hop oils. The influence on beer quality was investigated by brewing tests performed in a pilot scale. Level of infection estimated as percent of infected cones was mostly 30-50 %. MATERIALS AND METHODS Hops used for experiments were picked manually or taken from the bulk of a picking machine. Several healthy and infected cones were immediately taken away for analysis of hop oils by solid-phase microextraction method. The remainder was dried at the tempera-ture of 55 °C. The first part of dried hops was used for brewing tests, the second one was manually sorted according to the extent of infection for analyses of bitter acids and hop oils by steam distillation method.
Hop bitter acids were analysed by HPLC method according to EBC 7.7 /ANALYTICA EBC, 1997/. Hops were extracted in two-phase system diethylether-methanol. Alpha and beta acids were separated directly from diethylether phase on HPLC column Nucleosil RP C18 (Macherey Nagel, Germany), 5 µm, 250 x 4,0 mm. Temperature of the column was 40 °C. Mobile phase consisted of the mixture of methanol-water-phosphoric acid (850:190:5 vol.), flow 0,8 ml/min. Analyses were performed on liquid chromatograph SHIMADZU LC 10 with diode array detector at the wavelenght of 314 nm.
Hop oils were isolated from hops by steam-distillation method with 100 g of dried hop cones /WRIGHT, CONNERY, 1951/ and by solid-phase microextraction method (SPME) /KROFTA, ČEPIČKA, 2000/. For SPME separation fresh, undried hop cone was used in the amount of 0,3 g immediately after picking. Only a part affected by powdery mildew was used for analysis of infected cones. The samples were placed into 4 ml vial, tightly closed and extracted by polydimethylsiloxane fiber 100 µm (PDMS) in headspace at the temperature of 50 °C for 60 minutes. The fiber was desorbed at the GC injector for 3 minutes at 250 °C. Hop oils components were determined by gas chromatography (GC Varian 3400, mass detector Finnigan ITD 800). Analytical capillary column DB5, 30 m, 0,25 mm, 0,25 µm was temperaturely programmed at the range of 60-250 °C (steam distillation) and 40-250 °C (SPME). Carrier gas was helium, flowrate 1,0 ml/min. Distilled oil (0,1 µl)
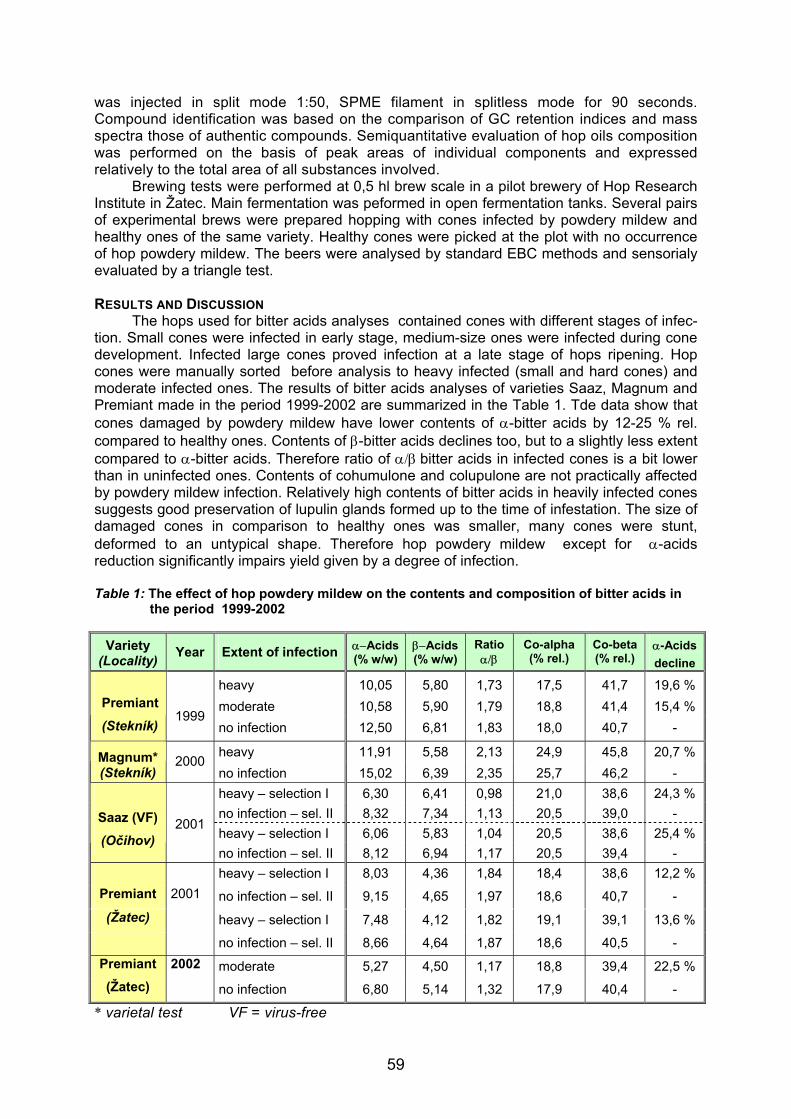
59
was injected in split mode 1:50, SPME filament in splitless mode for 90 seconds. Compound identification was based on the comparison of GC retention indices and mass spectra those of authentic compounds. Semiquantitative evaluation of hop oils composition was performed on the basis of peak areas of individual components and expressed relatively to the total area of all substances involved.
Brewing tests were performed at 0,5 hl brew scale in a pilot brewery of Hop Research Institute in Žatec. Main fermentation was peformed in open fermentation tanks. Several pairs of experimental brews were prepared hopping with cones infected by powdery mildew and healthy ones of the same variety. Healthy cones were picked at the plot with no occurrence of hop powdery mildew. The beers were analysed by standard EBC methods and sensorialy evaluated by a triangle test. RESULTS AND DISCUSSION
The hops used for bitter acids analyses contained cones with different stages of infec-tion. Small cones were infected in early stage, medium-size ones were infected during cone development. Infected large cones proved infection at a late stage of hops ripening. Hop cones were manually sorted before analysis to heavy infected (small and hard cones) and moderate infected ones. The results of bitter acids analyses of varieties Saaz, Magnum and Premiant made in the period 1999-2002 are summarized in the Table 1. Tde data show that cones damaged by powdery mildew have lower contents of α-bitter acids by 12-25 % rel. compared to healthy ones. Contents of β-bitter acids declines too, but to a slightly less extent compared to α-bitter acids. Therefore ratio of α/β bitter acids in infected cones is a bit lower than in uninfected ones. Contents of cohumulone and colupulone are not practically affected by powdery mildew infection. Relatively high contents of bitter acids in heavily infected cones suggests good preservation of lupulin glands formed up to the time of infestation. The size of damaged cones in comparison to healthy ones was smaller, many cones were stunt, deformed to an untypical shape. Therefore hop powdery mildew except for α-acids reduction significantly impairs yield given by a degree of infection. Table 1: The effect of hop powdery mildew on the contents and composition of bitter acids in the period 1999-2002
Variety (Locality) Year Extent of infection α−Acids
(% w/w) β−Acids (% w/w)
Ratioα/β
Co-alpha (% rel.)
Co-beta (% rel.)
α-Acids decline
heavy 10,05 5,80 1,73 17,5 41,7 19,6 % moderate 10,58 5,90 1,79 18,8 41,4 15,4 %
Premiant (Stekník)
1999 no infection 12,50 6,81 1,83 18,0 40,7 -
heavy 11,91 5,58 2,13 24,9 45,8 20,7 % Magnum* (Stekník)
2000 no infection 15,02 6,39 2,35 25,7 46,2 - heavy – selection I 6,30 6,41 0,98 21,0 38,6 24,3 % no infection – sel. II 8,32 7,34 1,13 20,5 39,0 - heavy – selection I 6,06 5,83 1,04 20,5 38,6 25,4 %
Saaz (VF) (Očihov)
2001
no infection – sel. II 8,12 6,94 1,17 20,5 39,4 - heavy – selection I 8,03 4,36 1,84 18,4 38,6 12,2 %
Premiant 2001 no infection – sel. II 9,15 4,65 1,97 18,6 40,7 - (Žatec) heavy – selection I 7,48 4,12 1,82 19,1 39,1 13,6 %
no infection – sel. II 8,66 4,64 1,87 18,6 40,5 - Premiant 2002 moderate 5,27 4,50 1,17 18,8 39,4 22,5 % (Žatec) no infection 6,80 5,14 1,32 17,9 40,4 -
* varietal test VF = virus-free
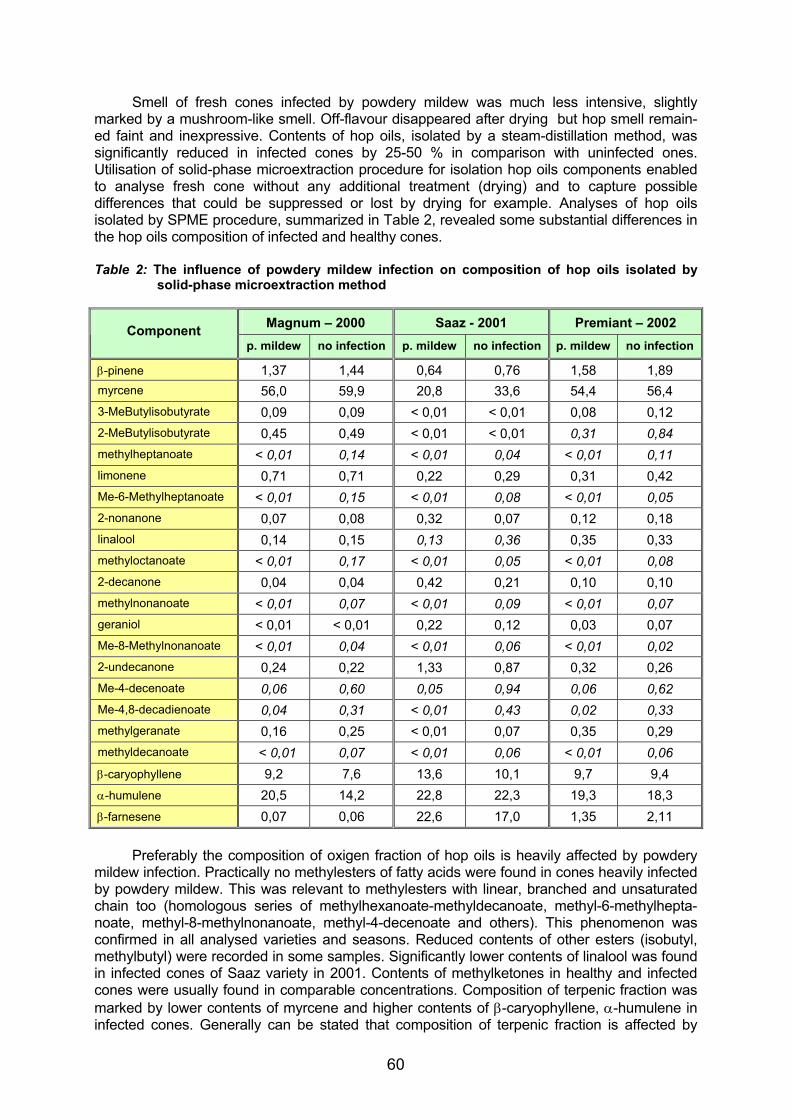
60
Smell of fresh cones infected by powdery mildew was much less intensive, slightly marked by a mushroom-like smell. Off-flavour disappeared after drying but hop smell remain-ed faint and inexpressive. Contents of hop oils, isolated by a steam-distillation method, was significantly reduced in infected cones by 25-50 % in comparison with uninfected ones. Utilisation of solid-phase microextraction procedure for isolation hop oils components enabled to analyse fresh cone without any additional treatment (drying) and to capture possible differences that could be suppressed or lost by drying for example. Analyses of hop oils isolated by SPME procedure, summarized in Table 2, revealed some substantial differences in the hop oils composition of infected and healthy cones. Table 2: The influence of powdery mildew infection on composition of hop oils isolated by solid-phase microextraction method
Magnum – 2000 Saaz - 2001 Premiant – 2002 Component p. mildew no infection p. mildew no infection p. mildew no infection
β-pinene 1,37 1,44 0,64 0,76 1,58 1,89 myrcene 56,0 59,9 20,8 33,6 54,4 56,4 3-MeButylisobutyrate 0,09 0,09 < 0,01 < 0,01 0,08 0,12 2-MeButylisobutyrate 0,45 0,49 < 0,01 < 0,01 0,31 0,84 methylheptanoate < 0,01 0,14 < 0,01 0,04 < 0,01 0,11 limonene 0,71 0,71 0,22 0,29 0,31 0,42 Me-6-Methylheptanoate < 0,01 0,15 < 0,01 0,08 < 0,01 0,05 2-nonanone 0,07 0,08 0,32 0,07 0,12 0,18 linalool 0,14 0,15 0,13 0,36 0,35 0,33 methyloctanoate < 0,01 0,17 < 0,01 0,05 < 0,01 0,08 2-decanone 0,04 0,04 0,42 0,21 0,10 0,10 methylnonanoate < 0,01 0,07 < 0,01 0,09 < 0,01 0,07 geraniol < 0,01 < 0,01 0,22 0,12 0,03 0,07 Me-8-Methylnonanoate < 0,01 0,04 < 0,01 0,06 < 0,01 0,02 2-undecanone 0,24 0,22 1,33 0,87 0,32 0,26 Me-4-decenoate 0,06 0,60 0,05 0,94 0,06 0,62 Me-4,8-decadienoate 0,04 0,31 < 0,01 0,43 0,02 0,33 methylgeranate 0,16 0,25 < 0,01 0,07 0,35 0,29 methyldecanoate < 0,01 0,07 < 0,01 0,06 < 0,01 0,06 β-caryophyllene 9,2 7,6 13,6 10,1 9,7 9,4 α-humulene 20,5 14,2 22,8 22,3 19,3 18,3 β-farnesene 0,07 0,06 22,6 17,0 1,35 2,11
Preferably the composition of oxigen fraction of hop oils is heavily affected by powdery
mildew infection. Practically no methylesters of fatty acids were found in cones heavily infected by powdery mildew. This was relevant to methylesters with linear, branched and unsaturated chain too (homologous series of methylhexanoate-methyldecanoate, methyl-6-methylhepta-noate, methyl-8-methylnonanoate, methyl-4-decenoate and others). This phenomenon was confirmed in all analysed varieties and seasons. Reduced contents of other esters (isobutyl, methylbutyl) were recorded in some samples. Significantly lower contents of linalool was found in infected cones of Saaz variety in 2001. Contents of methylketones in healthy and infected cones were usually found in comparable concentrations. Composition of terpenic fraction was marked by lower contents of myrcene and higher contents of β-caryophyllene, α-humulene in infected cones. Generally can be stated that composition of terpenic fraction is affected by
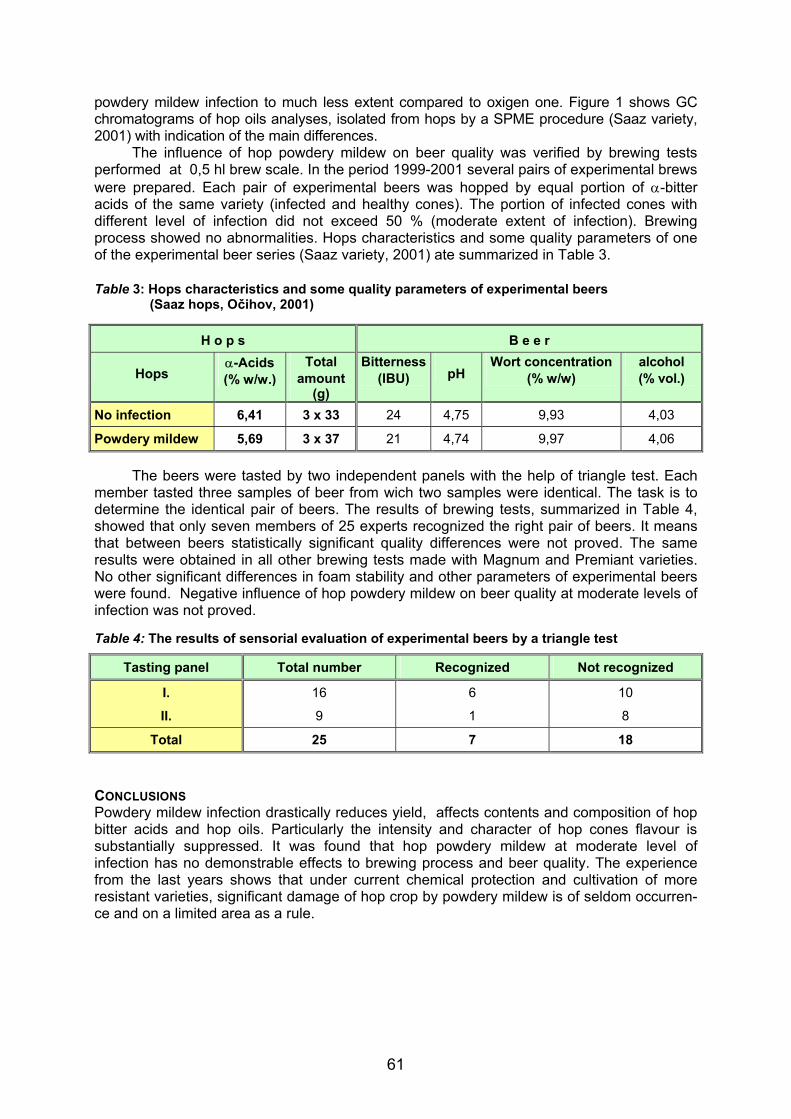
61
powdery mildew infection to much less extent compared to oxigen one. Figure 1 shows GC chromatograms of hop oils analyses, isolated from hops by a SPME procedure (Saaz variety, 2001) with indication of the main differences.
The influence of hop powdery mildew on beer quality was verified by brewing tests performed at 0,5 hl brew scale. In the period 1999-2001 several pairs of experimental brews were prepared. Each pair of experimental beers was hopped by equal portion of α-bitter acids of the same variety (infected and healthy cones). The portion of infected cones with different level of infection did not exceed 50 % (moderate extent of infection). Brewing process showed no abnormalities. Hops characteristics and some quality parameters of one of the experimental beer series (Saaz variety, 2001) ate summarized in Table 3.
Table 3: Hops characteristics and some quality parameters of experimental beers (Saaz hops, Očihov, 2001)
H o p s B e e r
Hops α-Acids (% w/w.)
Total amount
(g)
Bitterness(IBU) pH
Wort concentration (% w/w)
alcohol (% vol.)
No infection 6,41 3 x 33 24 4,75 9,93 4,03
Powdery mildew 5,69 3 x 37 21 4,74 9,97 4,06
The beers were tasted by two independent panels with the help of triangle test. Each member tasted three samples of beer from wich two samples were identical. The task is to determine the identical pair of beers. The results of brewing tests, summarized in Table 4, showed that only seven members of 25 experts recognized the right pair of beers. It means that between beers statistically significant quality differences were not proved. The same results were obtained in all other brewing tests made with Magnum and Premiant varieties. No other significant differences in foam stability and other parameters of experimental beers were found. Negative influence of hop powdery mildew on beer quality at moderate levels of infection was not proved. Table 4: The results of sensorial evaluation of experimental beers by a triangle test
Tasting panel Total number Recognized Not recognized
I. 16 6 10
II. 9 1 8
Total 25 7 18 CONCLUSIONS Powdery mildew infection drastically reduces yield, affects contents and composition of hop bitter acids and hop oils. Particularly the intensity and character of hop cones flavour is substantially suppressed. It was found that hop powdery mildew at moderate level of infection has no demonstrable effects to brewing process and beer quality. The experience from the last years shows that under current chemical protection and cultivation of more resistant varieties, significant damage of hop crop by powdery mildew is of seldom occurren-ce and on a limited area as a rule.
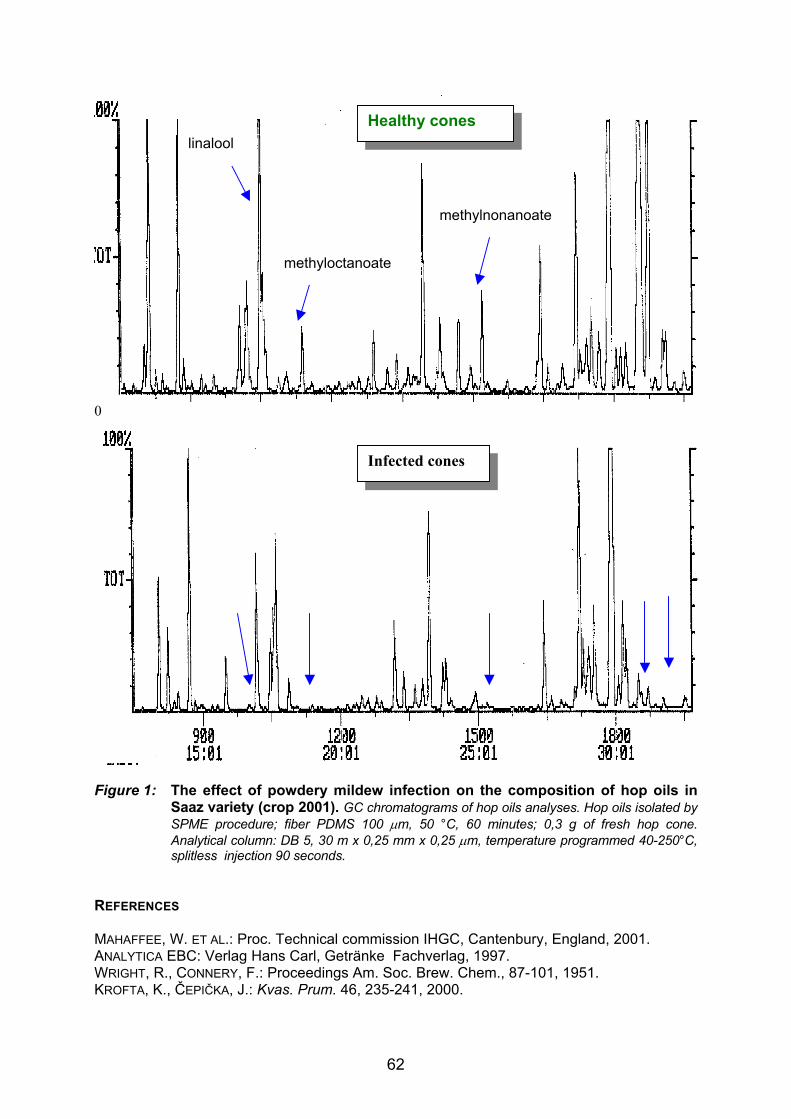
0
Figure 1: The effect of powdery mild
Saaz variety (crop 2001). GCSPME procedure; fiber PDMS Analytical column: DB 5, 30 m x splitless injection 90 seconds.
REFERENCES MAHAFFEE, W. ET AL.: Proc. Technical comANALYTICA EBC: Verlag Hans Carl, GeträWRIGHT, R., CONNERY, F.: Proceedings AKROFTA, K., ČEPIČKA, J.: Kvas. Prum. 46,
methyloctanoate
Healthy cones linalool
methylnonanoate
Infected cones
62
ew infection on the composition of hop oils in chromatograms of hop oils analyses. Hop oils isolated by 100 µm, 50 °C, 60 minutes; 0,3 g of fresh hop cone. 0,25 mm x 0,25 µm, temperature programmed 40-250°C,
mission IHGC, Cantenbury, England, 2001. nke Fachverlag, 1997. m. Soc. Brew. Chem., 87-101, 1951. 235-241, 2000.
63
DROP IN THE CONTENT OF ALPHA BITTER ACIDS IN THE COURSE OF HOP STORAGE IN CONDITIONED AND NON-CONDITIONED WAREHOUSES
Frantisek Kroupa*, Jaroslav Urban**, Jana Ticha**
V. F. HUMULUS Ltd., U odboru 787, 438 01 Zatec, Czech Republic *
Chmelarstvi, d.p., Mostecka 2580, 438 19 Zatec, Czech Republic ** Introduction In addition to processing hops for various hop products, increasing attention is paid to their storage. The objective of storage is to maintain the original quality of fresh hops, as breweries require quality hops throughout the year. At present, the SAAZ aroma variety is grown on an area of 5 982 ha, i.e., 95% of the area where hops are cultivated in the Czech Republic. 94 % of hop production is processed to pellets (pellets of types 90 and 45). Thus, we decided to ascertain the impact of storage conditions on the quality of the SAAZ aroma variety – cone hops and pellet hops of type 45. Material and Methods Variety – saaz semi-early red bine hop (saaz ) Analytical methods: EBC 7.7 Determination of alpha and beta bitter acids ASBC Hops – 6A Determination of alpha and beta bitter acids Hops – 12 Determination of HSI EBC 7.2 Determination of moisture Storage Experiment Scheme: Harvested and dried hops were pressed and transported to warehouses within 24 hours. Farmers´ bales were immediately distributed to individual warehouses. The aim of the trials was to ascertain the impact of the storage time of pressed hops and pellets 45 (pellets were packed in laminated foil flushed with inert gas) on the hop quality in conditioned and non-conditioned warehouses. The content of alpha bitter acids, HSI, and percent transformation of alpha and beta bitter acids were monitored. Simultaneously, average temperatures were measured in individual types of warehouses. Four Trials Identified for Observation: Trial T1 – pressed hops were placed in non-conditioned warehouse; samples for the above-mentioned analyses were taken at regular intervals. In October, the hops were processed (pellets 45) and the hop pellets were put back into the same non-conditioned stores. Samples continued to be taken. Trial K1 – pressed hops were placed in conditioned warehouse; samples for the above-mentioned analyses were taken at regular intervals. In October, the hops were processed (pellets 45) and the hop pellets were put back into the same conditioned stores. Samples continued to be taken. Trial T2 – pressed hops were placed in non-conditioned warehouse; samples for the above-mentioned analyses were taken at regular intervals. In February, the hops were processed (pellets 45) and the hop pellets were put back into the same non-conditioned stores. Samples continued to be taken. Trial K2 – pressed hops were placed in conditioned stores; samples for the above-mentioned analyses were taken at regular intervals. In February, the hops were processed (pellets 45) and the hop pellets were put back into the same conditioned stores. Samples continued to be taken.
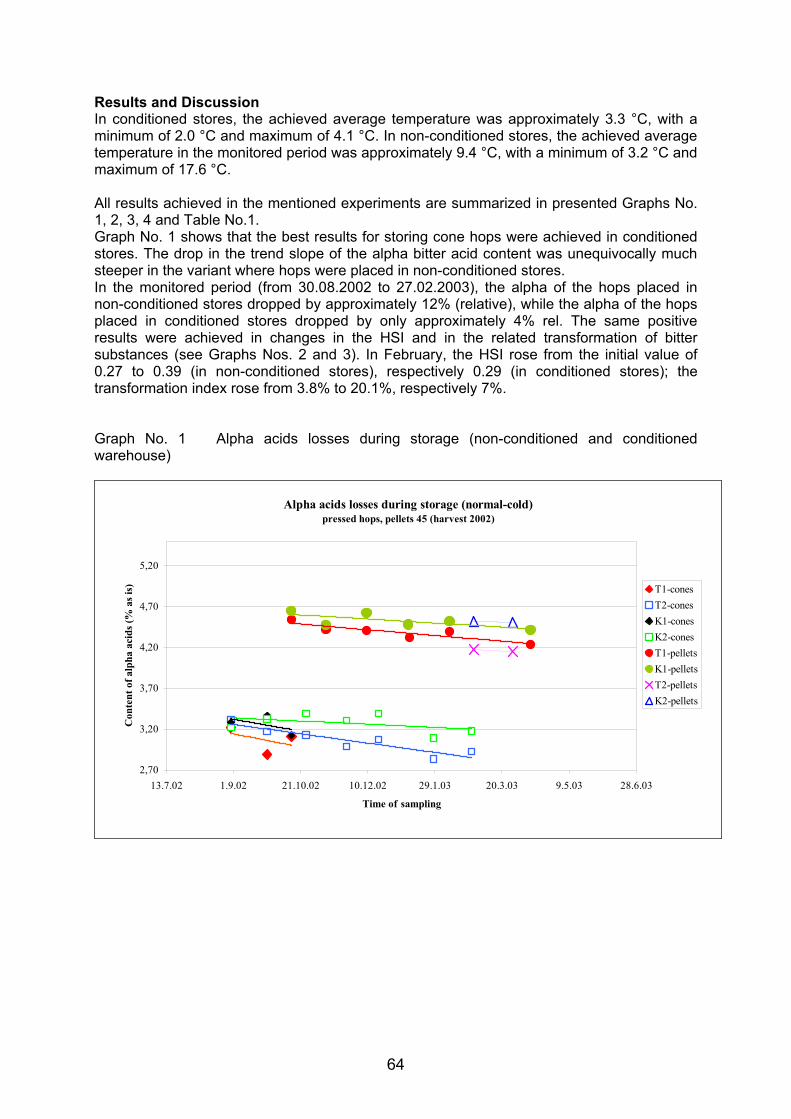
64
Results and Discussion In conditioned stores, the achieved average temperature was approximately 3.3 °C, with a minimum of 2.0 °C and maximum of 4.1 °C. In non-conditioned stores, the achieved average temperature in the monitored period was approximately 9.4 °C, with a minimum of 3.2 °C and maximum of 17.6 °C. All results achieved in the mentioned experiments are summarized in presented Graphs No. 1, 2, 3, 4 and Table No.1. Graph No. 1 shows that the best results for storing cone hops were achieved in conditioned stores. The drop in the trend slope of the alpha bitter acid content was unequivocally much steeper in the variant where hops were placed in non-conditioned stores. In the monitored period (from 30.08.2002 to 27.02.2003), the alpha of the hops placed in non-conditioned stores dropped by approximately 12% (relative), while the alpha of the hops placed in conditioned stores dropped by only approximately 4% rel. The same positive results were achieved in changes in the HSI and in the related transformation of bitter substances (see Graphs Nos. 2 and 3). In February, the HSI rose from the initial value of 0.27 to 0.39 (in non-conditioned stores), respectively 0.29 (in conditioned stores); the transformation index rose from 3.8% to 20.1%, respectively 7%. Graph No. 1 Alpha acids losses during storage (non-conditioned and conditioned warehouse)
Alpha acids losses during storage (normal-cold)pressed hops, pellets 45 (harvest 2002)
2,70
3,20
3,70
4,20
4,70
5,20
13.7.02 1.9.02 21.10.02 10.12.02 29.1.03 20.3.03 9.5.03 28.6.03
Time of sampling
Con
tent
of a
lpha
aci
ds (%
as i
s) T1-conesT2-conesK1-conesK2-conesT1-pelletsK1-pelletsT2-pelletsK2-pellets
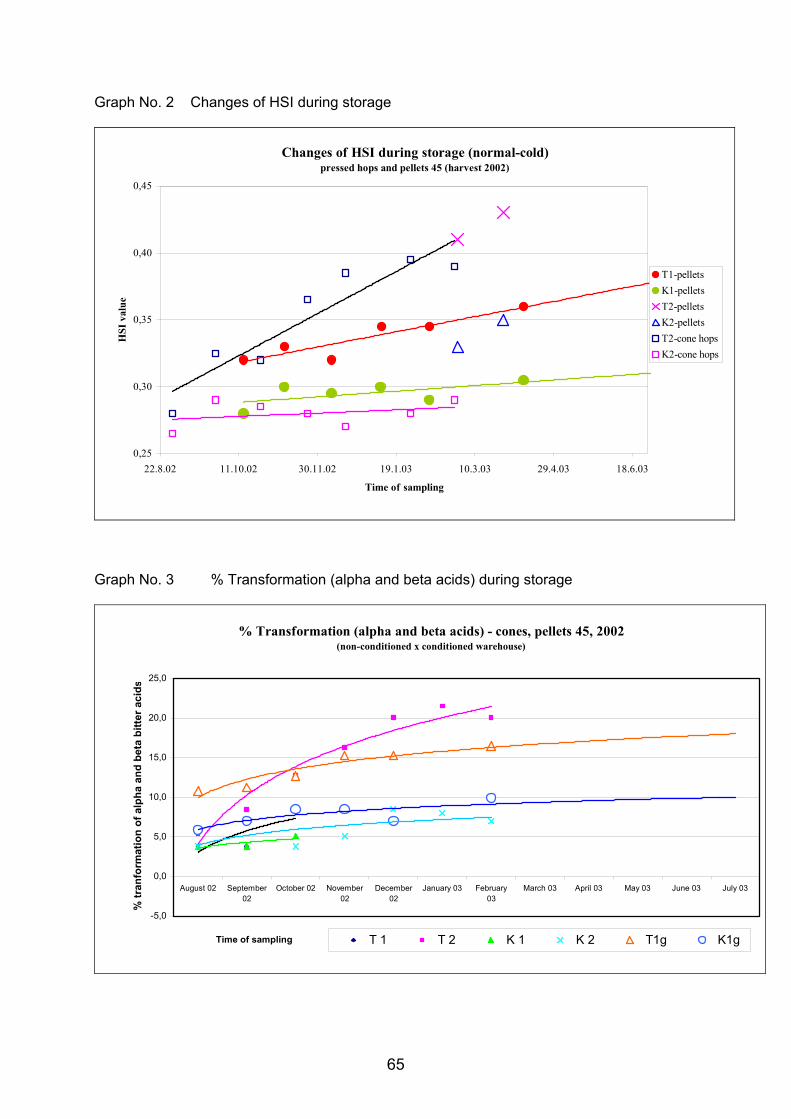
65
Graph No. 2 Changes of HSI during storage
Changes of HSI during storage (normal-cold)pressed hops and pellets 45 (harvest 2002)
0,25
0,30
0,35
0,40
0,45
22.8.02 11.10.02 30.11.02 19.1.03 10.3.03 29.4.03 18.6.03
Time of sampling
HSI
val
ue
T1-pelletsK1-pelletsT2-pelletsK2-pelletsT2-cone hopsK2-cone hops
Graph No. 3 % Transformation (alpha and beta acids) during storage
% Transformation (alpha and beta acids) - cones, pellets 45, 2002(non-conditioned x conditioned warehouse)
-5,0
0,0
5,0
10,0
15,0
20,0
25,0
August 02 September02
October 02 November02
December02
January 03 February03
March 03 April 03 May 03 June 03 July 03
Time of sampling
% tr
anfo
rmat
ion
of a
lpha
and
bet
a bi
tter a
cids
T 1 T 2 K 1 K 2 T1g K1g
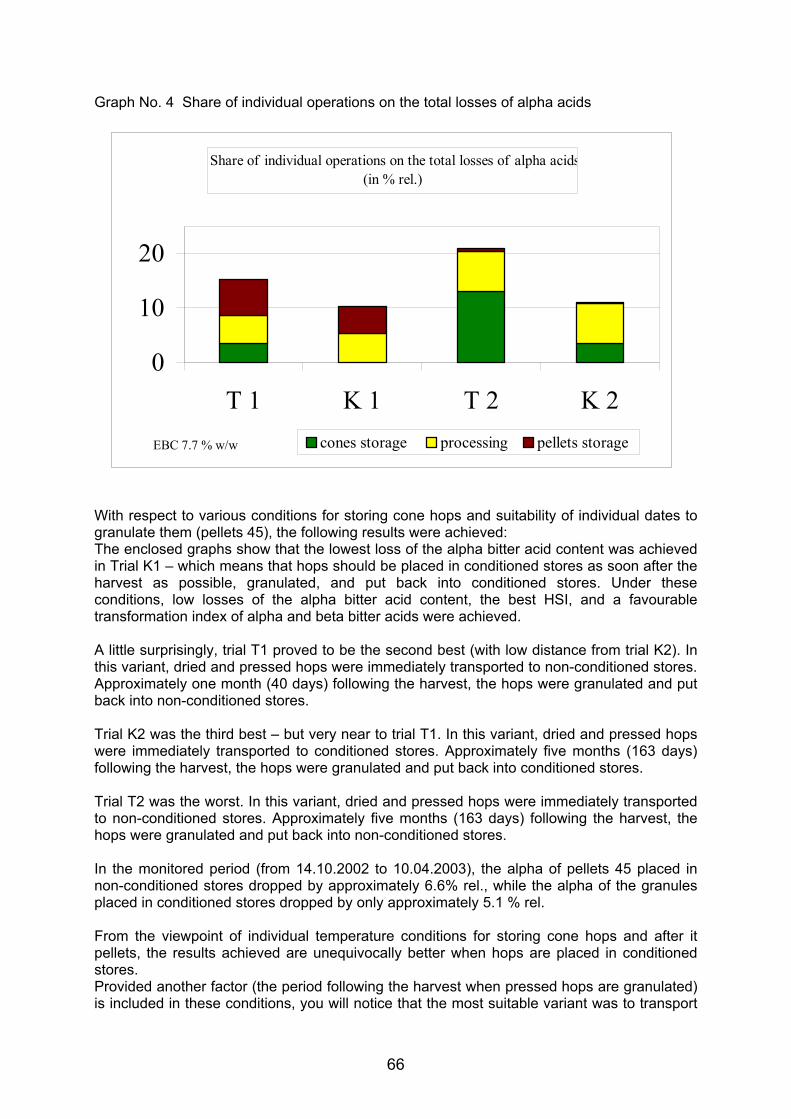
66
Graph No. 4 Share of individual operations on the total losses of alpha acids
Share of individual operations on the total losses of alpha acids(in % rel.)
0
10
20
T 1 K 1 T 2 K 2cones storage processing pellets storage EBC 7.7 % w/w
With respect to various conditions for storing cone hops and suitability of individual dates to granulate them (pellets 45), the following results were achieved: The enclosed graphs show that the lowest loss of the alpha bitter acid content was achieved in Trial K1 – which means that hops should be placed in conditioned stores as soon after the harvest as possible, granulated, and put back into conditioned stores. Under these conditions, low losses of the alpha bitter acid content, the best HSI, and a favourable transformation index of alpha and beta bitter acids were achieved. A little surprisingly, trial T1 proved to be the second best (with low distance from trial K2). In this variant, dried and pressed hops were immediately transported to non-conditioned stores. Approximately one month (40 days) following the harvest, the hops were granulated and put back into non-conditioned stores. Trial K2 was the third best – but very near to trial T1. In this variant, dried and pressed hops were immediately transported to conditioned stores. Approximately five months (163 days) following the harvest, the hops were granulated and put back into conditioned stores. Trial T2 was the worst. In this variant, dried and pressed hops were immediately transported to non-conditioned stores. Approximately five months (163 days) following the harvest, the hops were granulated and put back into non-conditioned stores. In the monitored period (from 14.10.2002 to 10.04.2003), the alpha of pellets 45 placed in non-conditioned stores dropped by approximately 6.6% rel., while the alpha of the granules placed in conditioned stores dropped by only approximately 5.1 % rel. From the viewpoint of individual temperature conditions for storing cone hops and after it pellets, the results achieved are unequivocally better when hops are placed in conditioned stores. Provided another factor (the period following the harvest when pressed hops are granulated) is included in these conditions, you will notice that the most suitable variant was to transport
67
dried harvested hops immediately to conditioned stores and granulate them as soon as possible (trial K1). Table No. 1 shows qualitative pellet characteristics obtained from individual trials (time of sampling 10.4.2003):
Pellets 45 Analytical value K1 T1 K2 T2 Total losses of alpha acids ( % rel.) 10,3 15,2 11,0 20,9 Hop storage index 0,31 0,36 0,35 0,43 % Transformation (alpha and beta) 9,9 16,5 15,3 24,4
Adding together all the individual losses (storing cone hops, losses caused by hop granulation and storage of pellets) of alpha bitter acids in the variants mentioned above proves that the total losses of alpha bitter acids correspond to the standings of individual tested variants. The total losses of alpha bitter acids in individual trials were as follows: trial K1 approximately 10.3% rel., trial K2 approximately 11.0%, trial T1 approximately 15.2%, and trial T2 approximately 20.9 %. Conclusion Four testing trials of storing cone and pellet hops have been tried. The impact of storage temperatures, storage periods, and dates of cone hop processing (pellets 45) were monitored. The experiments have so far revealed that the best variant for the SAAZ variety is trial K1 (i.e., transporting hops from the farmer to conditioned stores as soon as possible, processing to a hop pellets in the shortest possible time, and subsequently placing pellets in conditioned stores). In the course of this variant, the content of alpha bitter acids dropped by approximately 10.3%. Trials K2 and T1 showed nearly the same results. The total losses of alpha bitter acids were nearly the same; nevertheless, the other qualitative characteristics were better in trial K2. Experiments are still in process, and specified analytic values will be monitored by September 2003.
68
TRANSFORMATION OF HOP (HUMULUS LUPULUS L.) FOR AN INCREASED RESISTANCE AGAINST PATHOGENS
Christoph Horlemann, Axel Schwekendiek, Robert Fleischer, Martin Höhnle, and Gerd
Weber
Department of Plant Breeding and Biotechnology, University of Hohenheim, D-70599 Stuttgart, Germany,
Tel.: +49-711-4592341, Fax: +49-711-4592343, [email protected]
Abstract
An efficient procedure for regeneration of hop (Humulus lupulus L.) was established. For the first time Agrobacterium-mediated genetic transformation of hop (cv “Tettnanger”) was achieved.
Shoot internodes from in vitro cultures were identified to be the most suitable type of explant for regeneration. Using this type of explant, a shoot-inducing medium was developed that supported direct organogenesis of approximately 50% of the explants. Plantlets were successfully rooted and transferred to the greenhouse. Overall, in less than six months in vitro propagated hop cultures were regenerated to plants in the greenhouse. Agrobacterium-mediated genetic transformation was performed with the reporter-gene GUS (β-glucuro-nidase). The presence and function of transgenes in plants growing in the greenhouse was verified by PCR (polymerase chain reaction) and enzyme assay for GUS-activity, respec-tively. We have obtained 21 transgenic plants from 1,440 explants initially transformed yiel-ding an overall transformation efficiency of 1.5 %.
Using this transformation system, hop has been transformed with genes known to convey increased resistance against pathogens.
Introduction
Hop is sensitive to different types of pathogens adversely affecting its yield and product quality. However, resistance breeding of hop is hindered for instance in the variety “Tettnanger” by the lack of male plants. Genetic transformation of this variety will enable the introduction of new traits like resistance against pathogenic fungi without changing other traits.
An important prerequisite for such an approach is an efficient system for regenerating transgenic plants. Various reports have been published on regeneration of hop. However, only few reports were published on genetic transformation of hop. These experiments were either not successful (Becker 2000) or irreproducible (Orniaková and Matoušek 1996; Orniaková et al. 1999). Therefore, no reliable method for genetic transformation of hop existed.
The aim of this work was the establishment of an efficient regeneration and transformation method for the hop variety “Tettnanger”.
Results
Regeneration
A flow diagram of hop regeneration is shown in figure 1. Initially, shoot internodes from in vitro propagated material were cultured on shoot induction medium for 6-8 weeks. Approxi-mately 50% of the explants developed clusters of organogenic tissue. Then clusters of organogenic tissue or single shoots were harvested and transferred to elongation medium. Typically, multiple shoots grew from a single cluster of this type of tissue. In consecutive growth cycles on elongation medium further shoots could be harvested. Upon reaching a
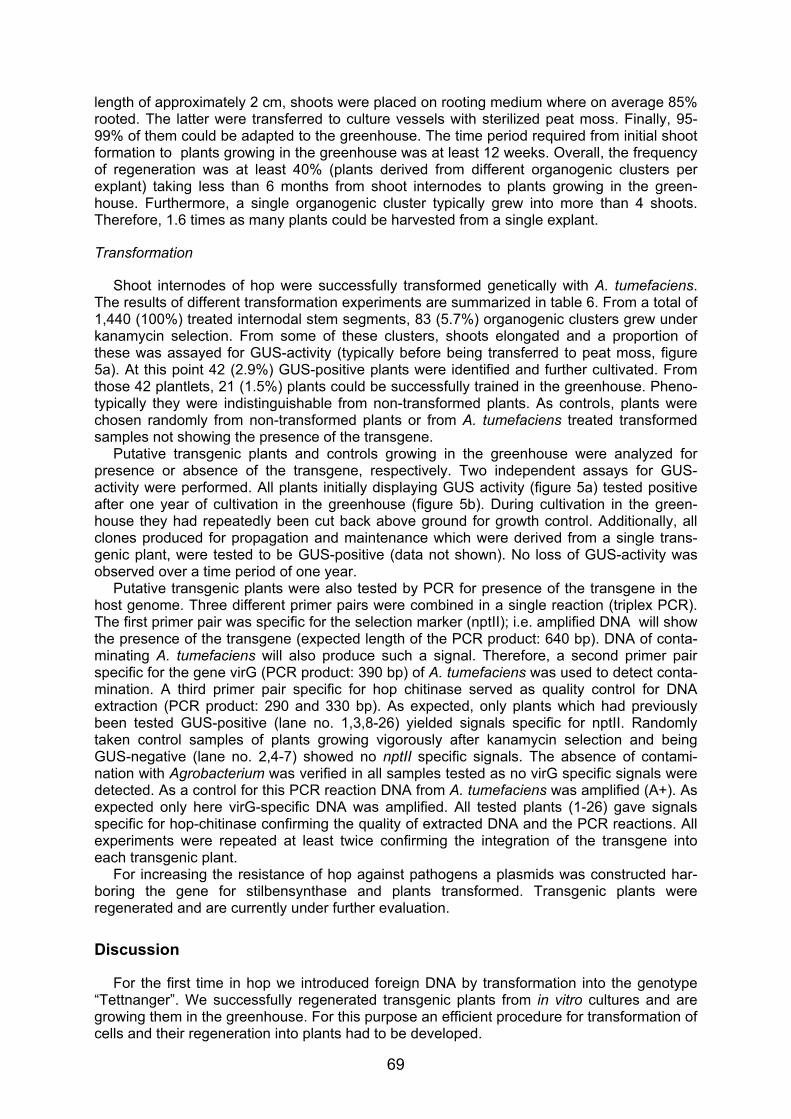
69
length of approximately 2 cm, shoots were placed on rooting medium where on average 85% rooted. The latter were transferred to culture vessels with sterilized peat moss. Finally, 95-99% of them could be adapted to the greenhouse. The time period required from initial shoot formation to plants growing in the greenhouse was at least 12 weeks. Overall, the frequency of regeneration was at least 40% (plants derived from different organogenic clusters per explant) taking less than 6 months from shoot internodes to plants growing in the green-house. Furthermore, a single organogenic cluster typically grew into more than 4 shoots. Therefore, 1.6 times as many plants could be harvested from a single explant.
Transformation
Shoot internodes of hop were successfully transformed genetically with A. tumefaciens. The results of different transformation experiments are summarized in table 6. From a total of 1,440 (100%) treated internodal stem segments, 83 (5.7%) organogenic clusters grew under kanamycin selection. From some of these clusters, shoots elongated and a proportion of these was assayed for GUS-activity (typically before being transferred to peat moss, figure 5a). At this point 42 (2.9%) GUS-positive plants were identified and further cultivated. From those 42 plantlets, 21 (1.5%) plants could be successfully trained in the greenhouse. Pheno-typically they were indistinguishable from non-transformed plants. As controls, plants were chosen randomly from non-transformed plants or from A. tumefaciens treated transformed samples not showing the presence of the transgene.
Putative transgenic plants and controls growing in the greenhouse were analyzed for presence or absence of the transgene, respectively. Two independent assays for GUS-activity were performed. All plants initially displaying GUS activity (figure 5a) tested positive after one year of cultivation in the greenhouse (figure 5b). During cultivation in the green-house they had repeatedly been cut back above ground for growth control. Additionally, all clones produced for propagation and maintenance which were derived from a single trans-genic plant, were tested to be GUS-positive (data not shown). No loss of GUS-activity was observed over a time period of one year.
Putative transgenic plants were also tested by PCR for presence of the transgene in the host genome. Three different primer pairs were combined in a single reaction (triplex PCR). The first primer pair was specific for the selection marker (nptII); i.e. amplified DNA will show the presence of the transgene (expected length of the PCR product: 640 bp). DNA of conta-minating A. tumefaciens will also produce such a signal. Therefore, a second primer pair specific for the gene virG (PCR product: 390 bp) of A. tumefaciens was used to detect conta-mination. A third primer pair specific for hop chitinase served as quality control for DNA extraction (PCR product: 290 and 330 bp). As expected, only plants which had previously been tested GUS-positive (lane no. 1,3,8-26) yielded signals specific for nptII. Randomly taken control samples of plants growing vigorously after kanamycin selection and being GUS-negative (lane no. 2,4-7) showed no nptII specific signals. The absence of contami-nation with Agrobacterium was verified in all samples tested as no virG specific signals were detected. As a control for this PCR reaction DNA from A. tumefaciens was amplified (A+). As expected only here virG-specific DNA was amplified. All tested plants (1-26) gave signals specific for hop-chitinase confirming the quality of extracted DNA and the PCR reactions. All experiments were repeated at least twice confirming the integration of the transgene into each transgenic plant.
For increasing the resistance of hop against pathogens a plasmids was constructed har-boring the gene for stilbensynthase and plants transformed. Transgenic plants were regenerated and are currently under further evaluation.
Discussion
For the first time in hop we introduced foreign DNA by transformation into the genotype “Tettnanger”. We successfully regenerated transgenic plants from in vitro cultures and are growing them in the greenhouse. For this purpose an efficient procedure for transformation of cells and their regeneration into plants had to be developed.
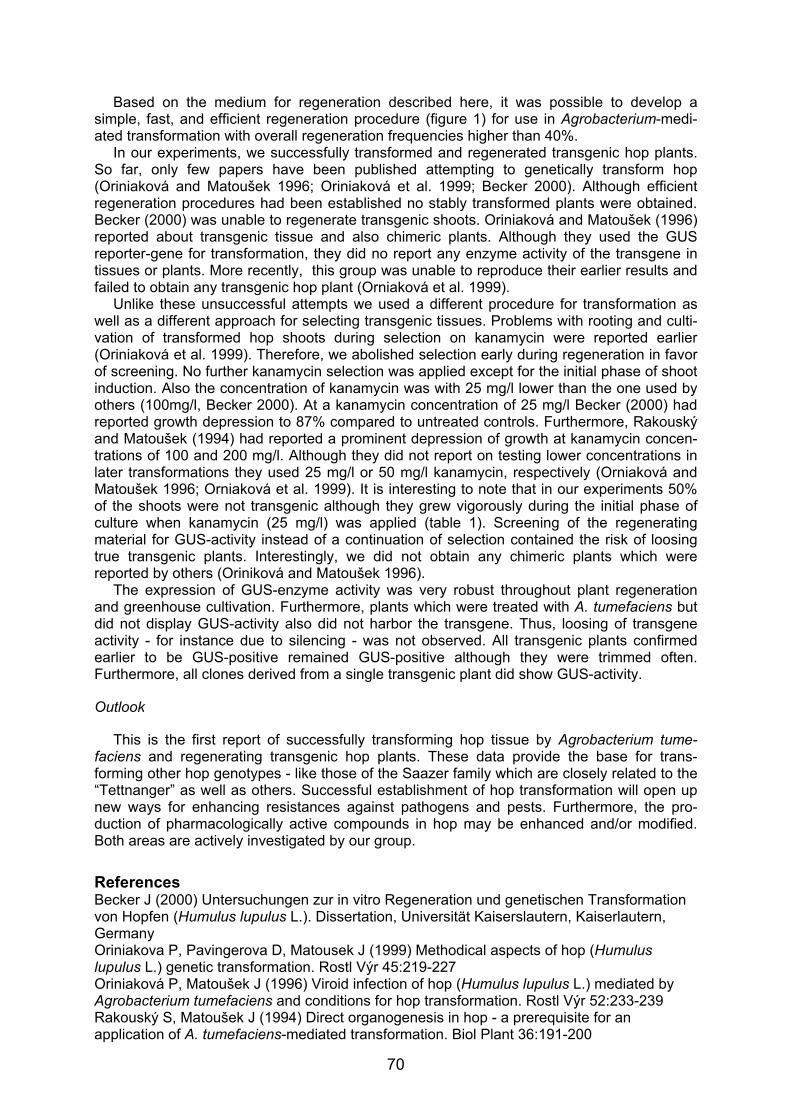
70
Based on the medium for regeneration described here, it was possible to develop a simple, fast, and efficient regeneration procedure (figure 1) for use in Agrobacterium-medi-ated transformation with overall regeneration frequencies higher than 40%.
In our experiments, we successfully transformed and regenerated transgenic hop plants. So far, only few papers have been published attempting to genetically transform hop (Oriniaková and Matoušek 1996; Oriniaková et al. 1999; Becker 2000). Although efficient regeneration procedures had been established no stably transformed plants were obtained. Becker (2000) was unable to regenerate transgenic shoots. Oriniaková and Matoušek (1996) reported about transgenic tissue and also chimeric plants. Although they used the GUS reporter-gene for transformation, they did no report any enzyme activity of the transgene in tissues or plants. More recently, this group was unable to reproduce their earlier results and failed to obtain any transgenic hop plant (Orniaková et al. 1999).
Unlike these unsuccessful attempts we used a different procedure for transformation as well as a different approach for selecting transgenic tissues. Problems with rooting and culti-vation of transformed hop shoots during selection on kanamycin were reported earlier (Oriniaková et al. 1999). Therefore, we abolished selection early during regeneration in favor of screening. No further kanamycin selection was applied except for the initial phase of shoot induction. Also the concentration of kanamycin was with 25 mg/l lower than the one used by others (100mg/l, Becker 2000). At a kanamycin concentration of 25 mg/l Becker (2000) had reported growth depression to 87% compared to untreated controls. Furthermore, Rakouský and Matoušek (1994) had reported a prominent depression of growth at kanamycin concen-trations of 100 and 200 mg/l. Although they did not report on testing lower concentrations in later transformations they used 25 mg/l or 50 mg/l kanamycin, respectively (Orniaková and Matoušek 1996; Orniaková et al. 1999). It is interesting to note that in our experiments 50% of the shoots were not transgenic although they grew vigorously during the initial phase of culture when kanamycin (25 mg/l) was applied (table 1). Screening of the regenerating material for GUS-activity instead of a continuation of selection contained the risk of loosing true transgenic plants. Interestingly, we did not obtain any chimeric plants which were reported by others (Oriniková and Matoušek 1996).
The expression of GUS-enzyme activity was very robust throughout plant regeneration and greenhouse cultivation. Furthermore, plants which were treated with A. tumefaciens but did not display GUS-activity also did not harbor the transgene. Thus, loosing of transgene activity - for instance due to silencing - was not observed. All transgenic plants confirmed earlier to be GUS-positive remained GUS-positive although they were trimmed often. Furthermore, all clones derived from a single transgenic plant did show GUS-activity.
Outlook
This is the first report of successfully transforming hop tissue by Agrobacterium tume-faciens and regenerating transgenic hop plants. These data provide the base for trans-forming other hop genotypes - like those of the Saazer family which are closely related to the “Tettnanger” as well as others. Successful establishment of hop transformation will open up new ways for enhancing resistances against pathogens and pests. Furthermore, the pro-duction of pharmacologically active compounds in hop may be enhanced and/or modified. Both areas are actively investigated by our group.
References Becker J (2000) Untersuchungen zur in vitro Regeneration und genetischen Transformation von Hopfen (Humulus lupulus L.). Dissertation, Universität Kaiserslautern, Kaiserlautern, Germany Oriniakova P, Pavingerova D, Matousek J (1999) Methodical aspects of hop (Humulus lupulus L.) genetic transformation. Rostl Výr 45:219-227 Oriniaková P, Matoušek J (1996) Viroid infection of hop (Humulus lupulus L.) mediated by Agrobacterium tumefaciens and conditions for hop transformation. Rostl Výr 52:233-239 Rakouský S, Matoušek J (1994) Direct organogenesis in hop - a prerequisite for an application of A. tumefaciens-mediated transformation. Biol Plant 36:191-200
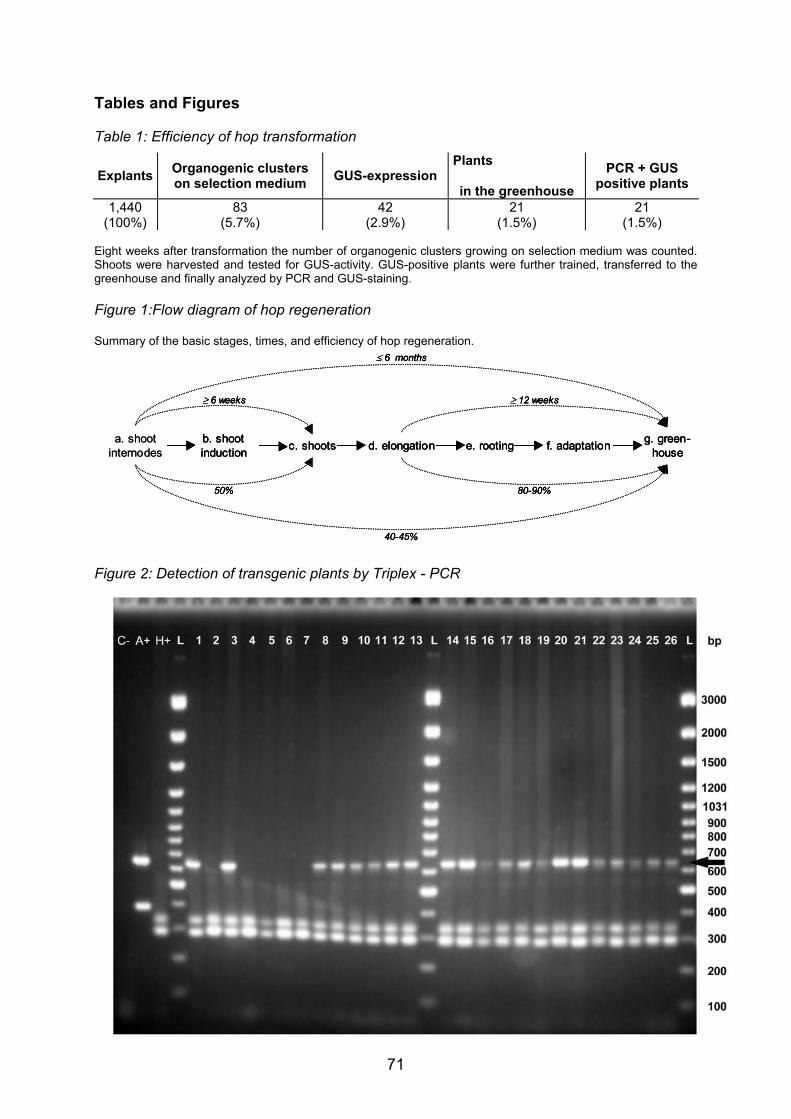
71
Tables and Figures
Table 1: Efficiency of hop transformation
Explants Organogenic clusters on selection medium GUS-expression
Plants
in the greenhouse PCR + GUS
positive plants
1,440 (100%)
83 (5.7%)
42 (2.9%)
21 (1.5%)
21 (1.5%)
Eight weeks after transformation the number of organogenic clusters growing on selection medium was counted. Shoots were harvested and tested for GUS-activity. GUS-positive plants were further trained, transferred to the greenhouse and finally analyzed by PCR and GUS-staining.
Figure 1:Flow diagram of hop regeneration
Summary of the basic stages, times, and efficiency of hop regeneration.
a. shootinternodes
b. shootinduction d. elongation e. rooting f. adaptationc. shoots g. green-
house
≤ 6 months
≥ 6 weeks ≥ 12 weeks
50%
40-45%
80-90%
a. shootinternodes
b. shootinduction d. elongation e. rooting f. adaptationc. shoots g. green-
house
≤ 6 months
≥ 6 weeks ≥ 12 weeks
50%
40-45%
80-90%
b. shootinduction d. elongation e. rooting f. adaptationc. shoots g. green-
house
≤ 6 months
≥ 6 weeks ≥ 12 weeks
50%
40-45%
80-90%
Figure 2: Detection of transgenic plants by Triplex - PCR
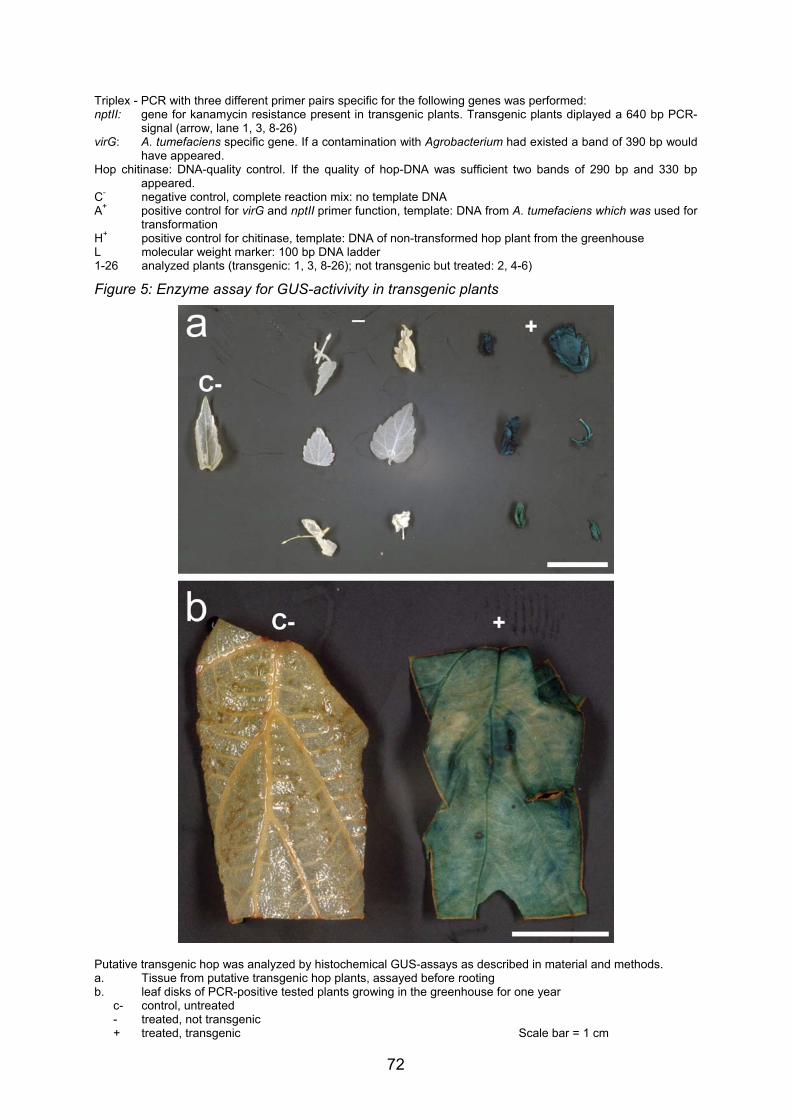
72
Triplex - PCR with three different primer pairs specific for the following genes was performed: nptII: gene for kanamycin resistance present in transgenic plants. Transgenic plants diplayed a 640 bp PCR-
signal (arrow, lane 1, 3, 8-26) virG: A. tumefaciens specific gene. If a contamination with Agrobacterium had existed a band of 390 bp would
have appeared. Hop chitinase: DNA-quality control. If the quality of hop-DNA was sufficient two bands of 290 bp and 330 bp
appeared. C- negative control, complete reaction mix: no template DNA A+ positive control for virG and nptII primer function, template: DNA from A. tumefaciens which was used for
transformation H+ positive control for chitinase, template: DNA of non-transformed hop plant from the greenhouse L molecular weight marker: 100 bp DNA ladder 1-26 analyzed plants (transgenic: 1, 3, 8-26); not transgenic but treated: 2, 4-6)
Figure 5: Enzyme assay for GUS-activivity in transgenic plants
Putative transgenic hop was analyzed by histochemical GUS-assays as described in material and methods. a. Tissue from putative transgenic hop plants, assayed before rooting b. leaf disks of PCR-positive tested plants growing in the greenhouse for one year
c- control, untreated - treated, not transgenic + treated, transgenic Scale bar = 1 cm
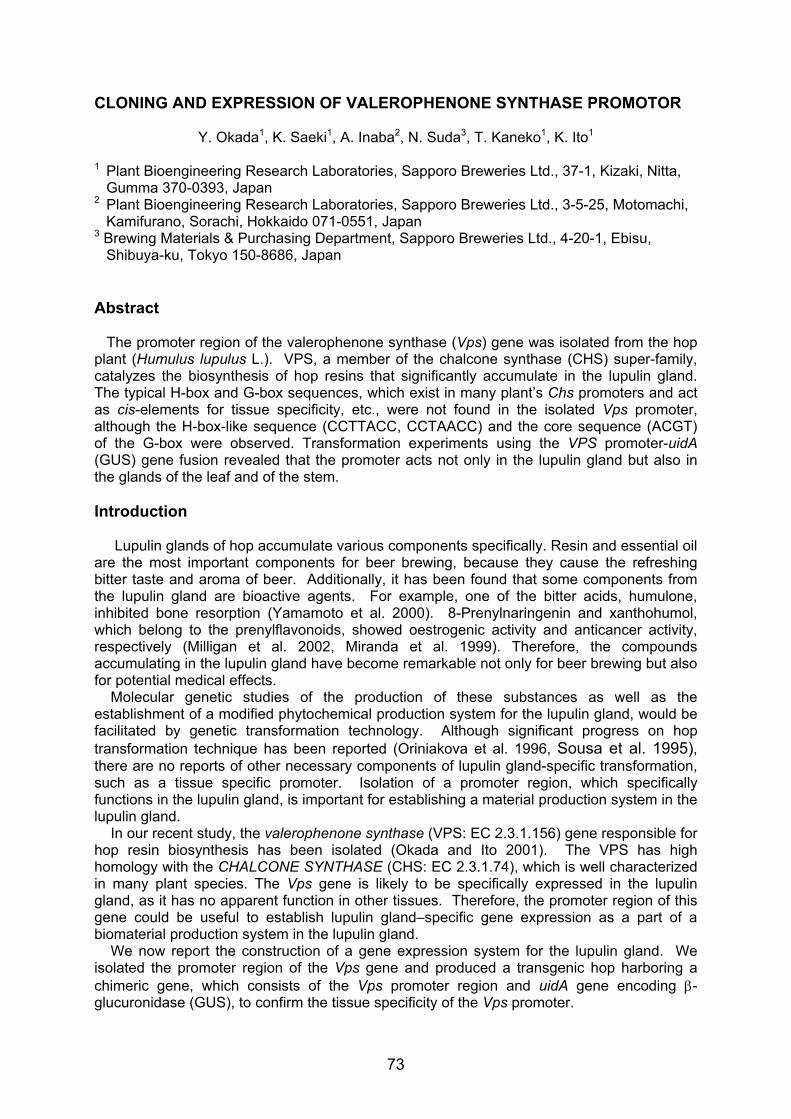
73
CLONING AND EXPRESSION OF VALEROPHENONE SYNTHASE PROMOTOR
Y. Okada1, K. Saeki1, A. Inaba2, N. Suda3, T. Kaneko1, K. Ito1 1 Plant Bioengineering Research Laboratories, Sapporo Breweries Ltd., 37-1, Kizaki, Nitta,
Gumma 370-0393, Japan 2 Plant Bioengineering Research Laboratories, Sapporo Breweries Ltd., 3-5-25, Motomachi,
Kamifurano, Sorachi, Hokkaido 071-0551, Japan 3 Brewing Materials & Purchasing Department, Sapporo Breweries Ltd., 4-20-1, Ebisu,
Shibuya-ku, Tokyo 150-8686, Japan Abstract The promoter region of the valerophenone synthase (Vps) gene was isolated from the hop plant (Humulus lupulus L.). VPS, a member of the chalcone synthase (CHS) super-family, catalyzes the biosynthesis of hop resins that significantly accumulate in the lupulin gland. The typical H-box and G-box sequences, which exist in many plant’s Chs promoters and act as cis-elements for tissue specificity, etc., were not found in the isolated Vps promoter, although the H-box-like sequence (CCTTACC, CCTAACC) and the core sequence (ACGT) of the G-box were observed. Transformation experiments using the VPS promoter-uidA (GUS) gene fusion revealed that the promoter acts not only in the lupulin gland but also in the glands of the leaf and of the stem. Introduction Lupulin glands of hop accumulate various components specifically. Resin and essential oil are the most important components for beer brewing, because they cause the refreshing bitter taste and aroma of beer. Additionally, it has been found that some components from the lupulin gland are bioactive agents. For example, one of the bitter acids, humulone, inhibited bone resorption (Yamamoto et al. 2000). 8-Prenylnaringenin and xanthohumol, which belong to the prenylflavonoids, showed oestrogenic activity and anticancer activity, respectively (Milligan et al. 2002, Miranda et al. 1999). Therefore, the compounds accumulating in the lupulin gland have become remarkable not only for beer brewing but also for potential medical effects. Molecular genetic studies of the production of these substances as well as the establishment of a modified phytochemical production system for the lupulin gland, would be facilitated by genetic transformation technology. Although significant progress on hop transformation technique has been reported (Oriniakova et al. 1996, Sousa et al. 1995), there are no reports of other necessary components of lupulin gland-specific transformation, such as a tissue specific promoter. Isolation of a promoter region, which specifically functions in the lupulin gland, is important for establishing a material production system in the lupulin gland. In our recent study, the valerophenone synthase (VPS: EC 2.3.1.156) gene responsible for hop resin biosynthesis has been isolated (Okada and Ito 2001). The VPS has high homology with the CHALCONE SYNTHASE (CHS: EC 2.3.1.74), which is well characterized in many plant species. The Vps gene is likely to be specifically expressed in the lupulin gland, as it has no apparent function in other tissues. Therefore, the promoter region of this gene could be useful to establish lupulin gland–specific gene expression as a part of a biomaterial production system in the lupulin gland. We now report the construction of a gene expression system for the lupulin gland. We isolated the promoter region of the Vps gene and produced a transgenic hop harboring a chimeric gene, which consists of the Vps promoter region and uidA gene encoding β-glucuronidase (GUS), to confirm the tissue specificity of the Vps promoter.
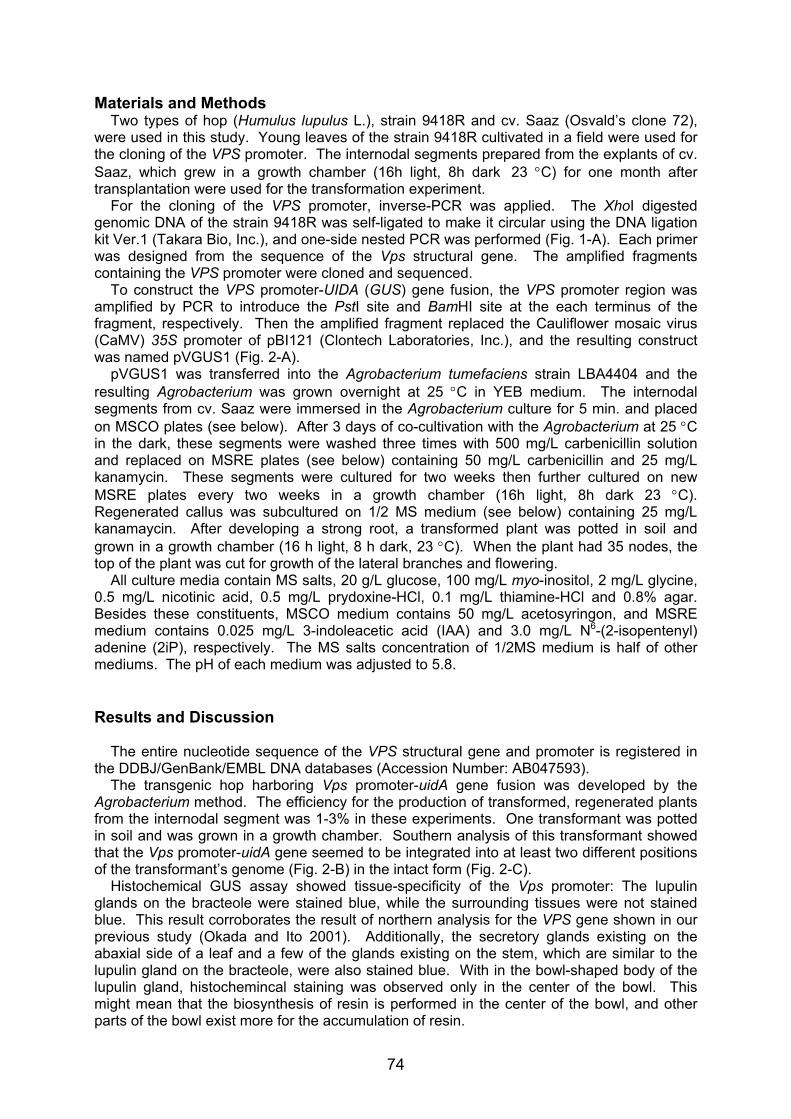
74
Materials and Methods Two types of hop (Humulus lupulus L.), strain 9418R and cv. Saaz (Osvald’s clone 72), were used in this study. Young leaves of the strain 9418R cultivated in a field were used for the cloning of the VPS promoter. The internodal segments prepared from the explants of cv. Saaz, which grew in a growth chamber (16h light, 8h dark�23 °C) for one month after transplantation were used for the transformation experiment. For the cloning of the VPS promoter, inverse-PCR was applied. The XhoI digested genomic DNA of the strain 9418R was self-ligated to make it circular using the DNA ligation kit Ver.1 (Takara Bio, Inc.), and one-side nested PCR was performed (Fig. 1-A). Each primer was designed from the sequence of the Vps structural gene. The amplified fragments containing the VPS promoter were cloned and sequenced. To construct the VPS promoter-UIDA (GUS) gene fusion, the VPS promoter region was amplified by PCR to introduce the PstI site and BamHI site at the each terminus of the fragment, respectively. Then the amplified fragment replaced the Cauliflower mosaic virus (CaMV) 35S promoter of pBI121 (Clontech Laboratories, Inc.), and the resulting construct was named pVGUS1 (Fig. 2-A). pVGUS1 was transferred into the Agrobacterium tumefaciens strain LBA4404 and the resulting Agrobacterium was grown overnight at 25 °C in YEB medium. The internodal segments from cv. Saaz were immersed in the Agrobacterium culture for 5 min. and placed on MSCO plates (see below). After 3 days of co-cultivation with the Agrobacterium at 25 °C in the dark, these segments were washed three times with 500 mg/L carbenicillin solution and replaced on MSRE plates (see below) containing 50 mg/L carbenicillin and 25 mg/L kanamycin. These segments were cultured for two weeks then further cultured on new MSRE plates every two weeks in a growth chamber (16h light, 8h dark�23 °C). Regenerated callus was subcultured on 1/2 MS medium (see below) containing 25 mg/L kanamaycin. After developing a strong root, a transformed plant was potted in soil and grown in a growth chamber (16 h light, 8 h dark, 23 °C). When the plant had 35 nodes, the top of the plant was cut for growth of the lateral branches and flowering. All culture media contain MS salts, 20 g/L glucose, 100 mg/L myo-inositol, 2 mg/L glycine, 0.5 mg/L nicotinic acid, 0.5 mg/L prydoxine-HCl, 0.1 mg/L thiamine-HCl and 0.8% agar. Besides these constituents, MSCO medium contains 50 mg/L acetosyringon, and MSRE medium contains 0.025 mg/L 3-indoleacetic acid (IAA) and 3.0 mg/L N6-(2-isopentenyl) adenine (2iP), respectively. The MS salts concentration of 1/2MS medium is half of other mediums. The pH of each medium was adjusted to 5.8. Results and Discussion The entire nucleotide sequence of the VPS structural gene and promoter is registered in the DDBJ/GenBank/EMBL DNA databases (Accession Number: AB047593). The transgenic hop harboring Vps promoter-uidA gene fusion was developed by the Agrobacterium method. The efficiency for the production of transformed, regenerated plants from the internodal segment was 1-3% in these experiments. One transformant was potted in soil and was grown in a growth chamber. Southern analysis of this transformant showed that the Vps promoter-uidA gene seemed to be integrated into at least two different positions of the transformant’s genome (Fig. 2-B) in the intact form (Fig. 2-C). Histochemical GUS assay showed tissue-specificity of the Vps promoter: The lupulin glands on the bracteole were stained blue, while the surrounding tissues were not stained blue. This result corroborates the result of northern analysis for the VPS gene shown in our previous study (Okada and Ito 2001). Additionally, the secretory glands existing on the abaxial side of a leaf and a few of the glands existing on the stem, which are similar to the lupulin gland on the bracteole, were also stained blue. With in the bowl-shaped body of the lupulin gland, histochemincal staining was observed only in the center of the bowl. This might mean that the biosynthesis of resin is performed in the center of the bowl, and other parts of the bowl exist more for the accumulation of resin.
75
VPS from the hop is a member of the CHS super-family (Schröder 1999) which has a high homology in general with chalcone synthases. CHALCONE SYNTHASE acts as the key enzyme in the biosynthetic pathway of the flavonoids, which contribute to flower pigmentation, to protection against UV-light and to resistance against pathogens (phytoalexins) (Hahlbrock 1981). Most of the Chs promoters from various plant species have cis-elements called H-box and G-box (Koch et al. 2001). The functions of these elements or related elements for the Chs promoters were studied with respect to tissue-specific and developmental regulation (Hotter et al. 1995, Ingrid et al. 1992, Kaiser and Batschauer 1995). However, the typical H-box (CCTACC) and G-box (CACGTG) were not observed in the sequence of the hop Vps promoter (Fig. 1-B), although the H-box-like sequences (CCTTACC, CCTAACC) and core sequence of the G-box (ACGT) were found in the sequence. Therefore, the hop Vps promoter might have other elements for tissue-specific regulation. In the present study, we successfully accumulated GUS in the lupulin gland using the VPS promoter-uidA gene fusion. This means that the Vps promoter could be useful for driving gene expression in the lupulin gland. Recently, the compounds accumulating in the lupulin gland have generated much excitement not only for beer brewing but also for potential medical uses (cf. humulone, 8-prenylnaringenin, xanthohumol etc.) (Milligan et al. 2002, Miranda et al. 1999, Yamamoto et al. 2000). Our gene expression system established in lupulin glands using the Vps promoter could be applied to improve the contents or components of such bioactive substances in the lupulin gland, and will contribute to the development of new uses for hops besides beer brewing.
Figure 1. Cloning strategy and nucleotide sequence of Vps gene. (A) Cloning strategy for Vps promoter and structure gene. The number in parentheses corresponds to the sequence position described in (B). (B) A part of the nucleotide sequence of VPS promoter. H-box-like sequences are boxed. “ACGT” sequence is indicated by double line. Presumed TATA signal is underlined. Inverted repeat and direct repeat are indicated by arrows.
CCACCAAGAC TAATAACACA AACAATAGAG AACGAACACA CCAATAGCAA TACAAAACAC CTTACGTCAA CTGACCCAAC 2180
AGAGAGCTAC CATGTCAAAA GACAATACTA GTTTGAGACT TCACCACTGT CAAAATTCTA GTTCTCAACA CTAGCAAAAA 2260AAAAAGTGTT AAACACCATC AATCACATAA CGACATACTT CTTGGCCATA TTTTTTTTCC CATGTAATCA TGTAAAAGGT 2340GGGGAAAATA AATCAATACA CATAAAGAAC AATGAAAAAA TAAATAAACA AGTCAAATTA TTATAATTTA ACATTAATAA 2420AAAGTTGAGA ATCACAAACA TTGGTACGTA GGTATTAGGG TTGGTGTTTA CACATATTAT CCATAGGCCA TGCACACCTT 2500ACCTAACCCA TGCACCACTT TGTACATATT ATATATATAA CTCCAATTTG GCTTTGCATT TCAACACTTG TAATCATTAC 2580ACTATATTTG TGTATATAGT GTAAGTTTTC ACAGTACTAC TAGCTATATA TATATCAGGT AATGGCGTCC GTAACTGTAG 2660
2101
TATA signalH-box-like sequence
A
B
1 kb
Xho IXho I
TAAATG
Cloned fragmentXho I
Primer
VPS promoter
Primer
gDNA
Primer
(2642)(2101)(1)
VPS
Inverse PCR
Self-ligation
76
References Hotter GS, Kooter J, Dubery IA, Lamb CJ, Dixon RA, Harrison MJ (1995) Cis-elements and potential trans-acting factors for the developmental regulation of the Phaseolus vulgaris CHS15 promoter. Plant Mol Biol 28: 967-981 Ingrid M, Meer VD, Brouwer M, Spelt CE, Mol JNM and Stuitje AR (1992) The TACPyAT repeats in the chalcone synthase promoter of Petunia hybrida act as a dominant negative cis-acting module in the control of organ-specific expression. Plant J 2: 525-535 Kaiser T, Batschauer A (1995) Cis-acting elements of the Chs1 gene from white mustard controlling promoter activity and spatial patterns of expression. Plant Mol Biol 28: 231-243 Koch MA, Weisshaar B, Kroymann J, Haubold B, Mitchell-Olds T (2001) Comparative genomics and regulatory evolution: Conservation and Function of the Chs and Apetala3 promoters. Mol Biol Evol 18: 1882-1891 Milligan S, Kalita J, Pocock V, Heyerick A, De Cooman L, Rong H, De Keukeleire D (2002) Oestrogenic activity of the hop phyto-oestrogen, 8-prenylnaringenin. Reproduction 123, 235-242 Miranda CL, Stevens JF, Helmrich A, Henderson MC, Rodriguez RJ, Yang Y-H, Deinzer ML, Barnes DW, Buhler DR (1999) Antiproliferative and cytotoxic effects of prenylated flavonoids from hops (Humulus lupulus) in human cancer cell lines. Food Chem Toxicol 37: 271-285
Figure 2. Southern analysis for transgenic hop harboring Vps promoter-uidAgene fusion. (A) Restriction map of the pVGUS1. (B) Single digestion by each enzyme, (C) double digestion by EcoRI and various other enzymes.
BamHI EcoRIXhoI BglII
pVGUS1
VPS promoter GUS(pBI121)
NOS ter
XhoI/EcoRI BglII/EcoRI BamHI/EcoRI
pVG
US1
Saaz
Tran
sgen
icpV
GU
S1Sa
azTr
ansg
enic
pVG
US1
Saaz
Tran
sgen
ic
2.02.3
6.69.4
27.5
(kbp)
2.02.3
6.69.4
27.5
(kbp)
pVG
US1
Saaz
Tran
sgen
icpV
GU
S1Sa
azTr
ansg
enic
pVG
US1
Saaz
XhoI BglII BamHI
Tran
sgen
icpV
GU
S1Sa
azTr
ansg
enic
EcoRI
probe
(A)
(B) (C)
77
Okada Y, Ito K. (2001) Cloning and analysis of valerophenone synthase gene expressed specifically in lupulin gland of hop (Humulus lupulus L.). Biosci Biotechnol Biochem 65: 150-155 Oriniakova P, Matousek J (1996) Viroid infection of hop (Humulus lupulus L.) mediated by Agrobacterium tumefaciens and conditions for hop transformation. Rostlinna Vyroba 42:233-239 Sousa J, Batista D, Pais MS (1995) Regeneration protocol in Humulus lupulus L. and study of the conditions for transformation mediated by Agrobacterium tumefaciens, EBC Congress 1995:135-142 Schröder J (1999) The chalcone/stilbene synthase-type family of condensing enzymes. In: Sankawa U (eds) Comprehensive Natural Products Chemistry Vol. 1. Elsevier, Amsterdam pp 749-771 Yamamoto K, Wang J, Yamamoto S, Tobe H (2000) Suppression of cyclooxygenase-2 gene transcription by humulone of beer hop extract studied with reference to glucocorticoid. FEBS letters 465: 103-106
78
FUNCTIONAL GENOMICS OF HOP (H. lupulus L.) WITH MAIN RESPECT TO GENES CO-DETERMINING LUPULIN PRODUCTION.
J. Matoušek*, P. Novak*,J. Patzak**, L. Vrba* and K. Krofta**
*IPMB AS CR, Branišovská 31, České Budějovice, CZ 370 05, Czech Republic
*Hop Institute GmbH, Kadaňská 2525, Žatec, CZ , Czech Republic Abstract
Structural and functional aspects of genomic organization of genes and regulatory elements, which are predicted to be involved in biosynthesis of bitter acids and prenylated flavonoids are studied. It was found that hop chs homologues such as CHS_H1, VPS, CHS 2 and CHS 4 form specific oligofamilies and clusters and, as follows from our previous work, their tissue-specific expression is strongly regulated. Fishing for regulatory factors such as R2R3 MYB-related sequences is performed with inverse PCR and library screening methods using conserved motifs derived from PAP1 and PAP2 genes of A. thaliana. Enzymatic studies on recombinant proteins expressed in E. coli was introduced to solve the question of functional properties of hop CHS homologues. These analyses confirmed the idea that only CHS_H1 has significant true chalcone synthase activity with naringenin chalcone and therefore, this enzyme can be considered as key enzyme in prenylflavonoid biosynthesis, while both, CHS_H1 and VPS can participate in synthesis of bitter acids. High expression of chalcone synthase-like genes was found in maturating hop cones of cultivars with high bitter acid content by Northern and Western blotting using probes specific for vps, chs_H1, chs 4 and polyspecific serum risen against recombinant protein CHS4, respectively. It was found that cultivars with high bitter acids content (Agnus, Magnum, Target) kept expression of CHS homologues longer during the cone development in contrast to time limited expression of CHS homologues in cultivar with low bitter acids. INTRODUCTION
Hop is one of the most important crops in the Czech Republic with big economical benefit. Czech hop production is valued on world market and it ranks, with 6 thousand hectares, on fourth place in the world below USA, Germany and China. Recent technologies of beer production stimulate hop growers to introduce comprehensive hops, providing high yield of bitter acids (up to 15-20 % of α acids) on the one hand, but on the other hand, also fine aromatic components like volatile oils are desired to achieve good taste of beer. These requirements push breeders to prepare new hybrid materials with improved lupulin composition and other plant characteristic including resistance to various pathogens. Moreover, the recent discovery of potential anti-cancer compounds, such as prenylated flavonoids in hop, led to increasing interest of food industry, medicine and pharmacy to hop products. The terms like "medicinal hops" and "medicinal beer" have been introduced (for the overviews see e.g. Matoušek, 2001; Matoušek et al., 2002). Because the content (influenced by both, synthesis and stability), of these valuable components in lupulin is determined genetically, molecular genetic analysis of genes co-determining lupulin composition should contribute significantly to accelerate the improvement of hop. These forthcoming biotechnologies are based on modern as well as classical breeding and selection programmes.
Certain progress in our understanding of metabolic pathways involved in synthesis of bitter acids and prenylflavonoids in lupulin has been achieved during last three years by finding that chalcone synthase homologues are the principal constituents of these metabolic pathways (Paniego et al., 1999). The corresponding genes of several hop CHS homologues, such as valerophenone synthase (VPS) and true chalcone synthase (CHS_H1) were isolated and characterized (Okada and Ito, 2001, Matoušek et al., 2002). Additionally, three another chalcone synthase homological genes with so far non identified enzymatic function in hop were identified: chs 4 (Novák et al., 2003) , chs 2 (GenBank accession number AB061020) and chs 3 (AB061022). It follows from our previous work (Matoušek et al., 2001, Matoušek et al., 2002, Novák et al., 2003) that 1. there are oligofamilies of chs homologues in hop and
79
2. that there must be some additional regulatory genes which have principal influence on levels of secondary metabolites in lupulin. This conclusion can be, for instance, judged from the fact that there is not simple additive effect of chs_H1 genes on content of xanthohumol in hybrid hops having common origin (Matoušek et al., 2002). In order to achieve further progress in the understanding how the structural genes are regulated, the principles of functional genomics of hop have to be developed. MATERIALS AND METHODS
Plant material, RNA isolation and cDNA preparation :Hop plants were maintained in breeding hop garden in the Hop Research Institute, Žatec. Cultivars Agnus, Sládek, Osvalds’72, Galena, Taurus, Target, Magnum, Fuggle and Nugget were used in our analyses.RNA was isolated from the mature hop inflorescences collected from cultivars using RNeasy plant mini kit (Qiagen) with some modification. In RT PCR reactions, the primer pairs specific for chs_H1, chs2, chs 4 and vps were used as described by Novák et al. (2003). For amplification of Myb genes we used primers derived from AtMYB75/PAP1 (GenBank AC AF062908) and AtMYB90/PAP2 (GenBank AC AF062915).
Expression and purification of recombinant proteins, enzyme assays: In all cases the protein coding region of the cDNAs was inserted via NdeI and BamHI sites introduced into expression vector pET15-b (Novagen) downstream to sequence coding histidine tag. Proteins were expressed in E. coli [BL21(DE3)] according to pET system manual (Novagen). Expressed proteins were purified using affinity chromatography on Ni-Agarose column according manufacturer’s protocol (Qiagen) and purity was visually checked in SDS gels stained with Coomassie blue.The reactions were performed according Zuurbier et al (1998). TLC plates were scanned and radioactivity signals quantified using STORM device and ImageQuaNT software (Molecular Dynamics, USA). For kinetic studies, analyses were performed with varying concentrations of isovaleryl-CoA (0.25-50µM), isobutyryl-CoA (0.25-50µM) or p-coumaroyl-CoA (0.25-400µM) in the presence of 30 µM malonyl-CoA. Enzyme kinetic constants were calculated by non-linear regression according Hernandez and Ruiz (1998).
Northern and Western blot analyses: Total RNA samples of 35 µg each were separated on formaldehyde-denaturating agarose gel and blotted onto a nylon membrane. Prehybridization and hybridization were carried out using formamide-based (pre) hybridization buffer at 42oC. The final washing was performed in 0.25×SSC plus 0.1 SDS at 50 oC for 20 min. The probes for the detection of chs 4, chs_H1 and vps were prepared from PCR fragments using specific primers (chs4NdeI, chs4BamH1, chsH1NdeI, chsH1BamH1, vpsNdeI, vpsBamH1) (see Novák et al. 2003) and radioactivelly labelled using RediprimeTM II random prime labeling system (Amersham Pharmacia Biotech). The autoradiograms were scanned using STORM device and ImageQuaNT software (Molecular Dynamics). Proteins for immunoblotting were extracted from hop flowers, young cones and mature cones. Proteins were extracted in 0.5 M potassium phosphate pH 8, 1.5% polyethylenglycol (MW 6000), 400 mM Sucrose, 1 mM CaCl2, 200 mM Ascorbic acid, 50 mM EDTA, 0.2mM phenylmethanesulfonyl fluorid and 100 mg.l-1 Nonidet P-40, desalted and analysed on SDS PAGE. Immunoblotting was performed according Harlow and Lane (1988). Mouse antibodies for the detection of CHS homologues was gained by immunization with purified CHS 4 expressed from E. coli. The specific reaction of the antibody with CHS 4 and cross-reactions with VPS, CHS 2 and CHS_H1 were found out (not shown). Anti-mouse IgG alkaline phosphatase conjugate was used for detection system.
Quantification of lupulin compouds: Hop resins and xanthohumols were estimated according EBC 7.7 procedure (1997) on HPLC column nucleosil RP C18 (Machererey Nagel, Germany, 5mm, 250×4.6mm) using chromatograph Shimadzu LC-10A. The quantification was performed using external standard ICE 2. For chemical analyses the same plants were used as in the case of RNA and protein isolations.
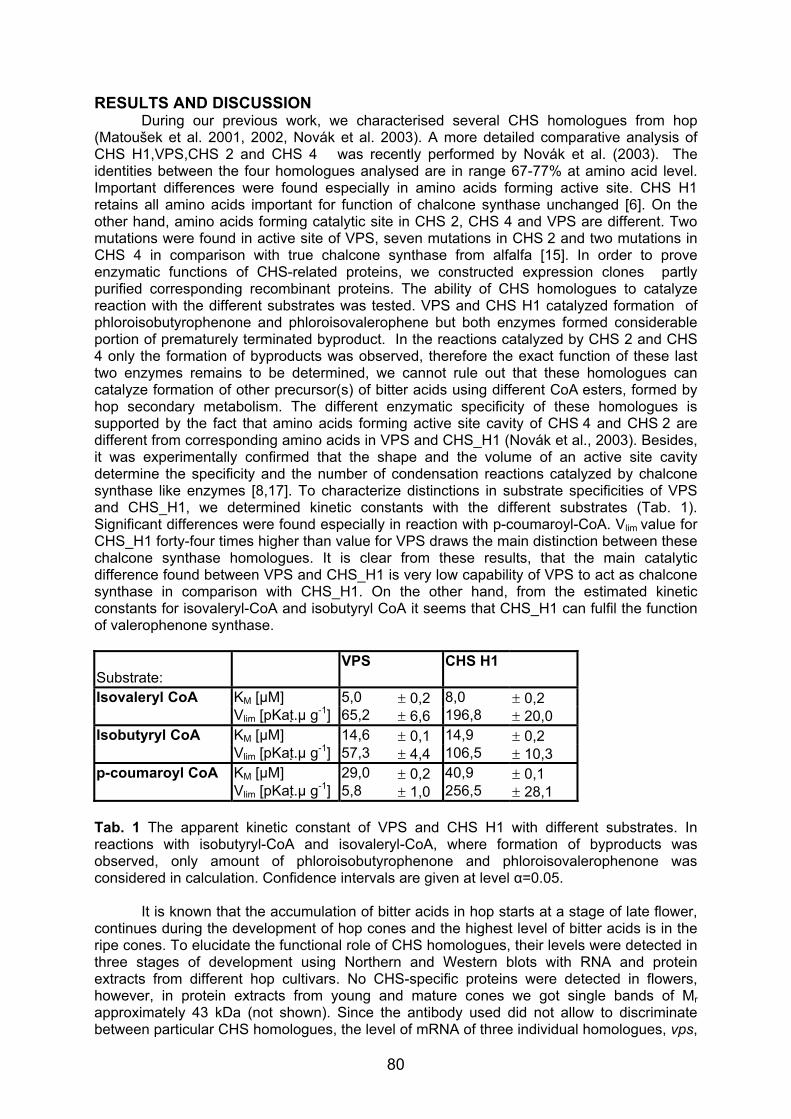
80
RESULTS AND DISCUSSION During our previous work, we characterised several CHS homologues from hop
(Matoušek et al. 2001, 2002, Novák et al. 2003). A more detailed comparative analysis of CHS H1,VPS,CHS 2 and CHS 4 was recently performed by Novák et al. (2003). The identities between the four homologues analysed are in range 67-77% at amino acid level. Important differences were found especially in amino acids forming active site. CHS H1 retains all amino acids important for function of chalcone synthase unchanged [6]. On the other hand, amino acids forming catalytic site in CHS 2, CHS 4 and VPS are different. Two mutations were found in active site of VPS, seven mutations in CHS 2 and two mutations in CHS 4 in comparison with true chalcone synthase from alfalfa [15]. In order to prove enzymatic functions of CHS-related proteins, we constructed expression clones partly purified corresponding recombinant proteins. The ability of CHS homologues to catalyze reaction with the different substrates was tested. VPS and CHS H1 catalyzed formation of phloroisobutyrophenone and phloroisovalerophene but both enzymes formed considerable portion of prematurely terminated byproduct. In the reactions catalyzed by CHS 2 and CHS 4 only the formation of byproducts was observed, therefore the exact function of these last two enzymes remains to be determined, we cannot rule out that these homologues can catalyze formation of other precursor(s) of bitter acids using different CoA esters, formed by hop secondary metabolism. The different enzymatic specificity of these homologues is supported by the fact that amino acids forming active site cavity of CHS 4 and CHS 2 are different from corresponding amino acids in VPS and CHS_H1 (Novák et al., 2003). Besides, it was experimentally confirmed that the shape and the volume of an active site cavity determine the specificity and the number of condensation reactions catalyzed by chalcone synthase like enzymes [8,17]. To characterize distinctions in substrate specificities of VPS and CHS_H1, we determined kinetic constants with the different substrates (Tab. 1). Significant differences were found especially in reaction with p-coumaroyl-CoA. Vlim value for CHS_H1 forty-four times higher than value for VPS draws the main distinction between these chalcone synthase homologues. It is clear from these results, that the main catalytic difference found between VPS and CHS_H1 is very low capability of VPS to act as chalcone synthase in comparison with CHS_H1. On the other hand, from the estimated kinetic constants for isovaleryl-CoA and isobutyryl CoA it seems that CHS_H1 can fulfil the function of valerophenone synthase. VPS CHS H1 Substrate: Isovaleryl CoA KM [µM] 5,0 ± 0,2 8,0 ± 0,2 Vlim [pKat. µ g-1] 65,2 ± 6,6 196,8 ± 20,0 Isobutyryl CoA KM [µM] 14,6 ± 0,1 14,9 ± 0,2 Vlim [pKat. µ g-1] 57,3 ± 4,4 106,5 ± 10,3 p-coumaroyl CoA KM [µM] 29,0 ± 0,2 40,9 ± 0,1 Vlim [pKat. µ g-1] 5,8 ± 1,0 256,5 ± 28,1 Tab. 1 The apparent kinetic constant of VPS and CHS H1 with different substrates. In reactions with isobutyryl-CoA and isovaleryl-CoA, where formation of byproducts was observed, only amount of phloroisobutyrophenone and phloroisovalerophenone was considered in calculation. Confidence intervals are given at level α=0.05.
It is known that the accumulation of bitter acids in hop starts at a stage of late flower,
continues during the development of hop cones and the highest level of bitter acids is in the ripe cones. To elucidate the functional role of CHS homologues, their levels were detected in three stages of development using Northern and Western blots with RNA and protein extracts from different hop cultivars. No CHS-specific proteins were detected in flowers, however, in protein extracts from young and mature cones we got single bands of Mr approximately 43 kDa (not shown). Since the antibody used did not allow to discriminate between particular CHS homologues, the level of mRNA of three individual homologues, vps,
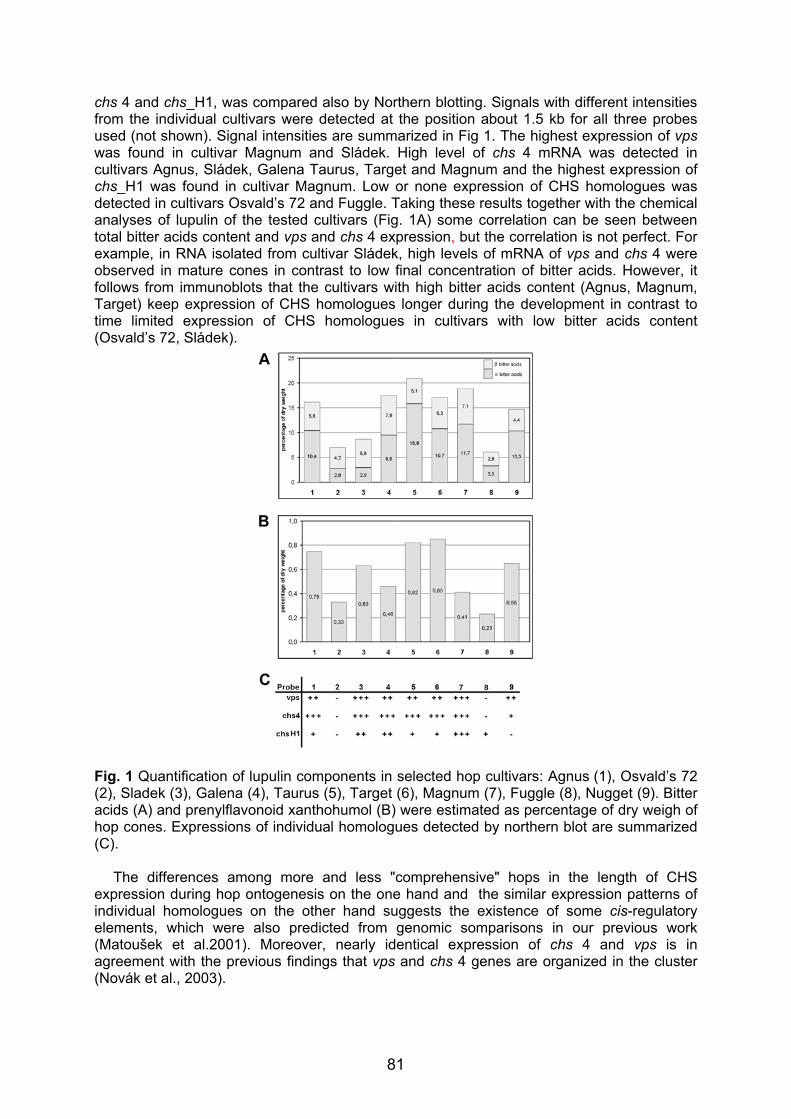
81
chs 4 and chs_H1, was compared also by Northern blotting. Signals with different intensities from the individual cultivars were detected at the position about 1.5 kb for all three probes used (not shown). Signal intensities are summarized in Fig 1. The highest expression of vps was found in cultivar Magnum and Sládek. High level of chs 4 mRNA was detected in cultivars Agnus, Sládek, Galena Taurus, Target and Magnum and the highest expression of chs_H1 was found in cultivar Magnum. Low or none expression of CHS homologues was detected in cultivars Osvald’s 72 and Fuggle. Taking these results together with the chemical analyses of lupulin of the tested cultivars (Fig. 1A) some correlation can be seen between total bitter acids content and vps and chs 4 expression, but the correlation is not perfect. For example, in RNA isolated from cultivar Sládek, high levels of mRNA of vps and chs 4 were observed in mature cones in contrast to low final concentration of bitter acids. However, it follows from immunoblots that the cultivars with high bitter acids content (Agnus, Magnum, Target) keep expression of CHS homologues longer during the development in contrast to time limited expression of CHS homologues in cultivars with low bitter acids content (Osvald’s 72, Sládek).
Fig. 1 Quantification of lupulin components in selected hop cultivars: Agnus (1), Osvald’s 72 (2), Sladek (3), Galena (4), Taurus (5), Target (6), Magnum (7), Fuggle (8), Nugget (9). Bitter acids (A) and prenylflavonoid xanthohumol (B) were estimated as percentage of dry weigh of hop cones. Expressions of individual homologues detected by northern blot are summarized (C).
The differences among more and less "comprehensive" hops in the length of CHS
expression during hop ontogenesis on the one hand and the similar expression patterns of individual homologues on the other hand suggests the existence of some cis-regulatory elements, which were also predicted from genomic somparisons in our previous work (Matoušek et al.2001). Moreover, nearly identical expression of chs 4 and vps is in agreement with the previous findings that vps and chs 4 genes are organized in the cluster (Novák et al., 2003).
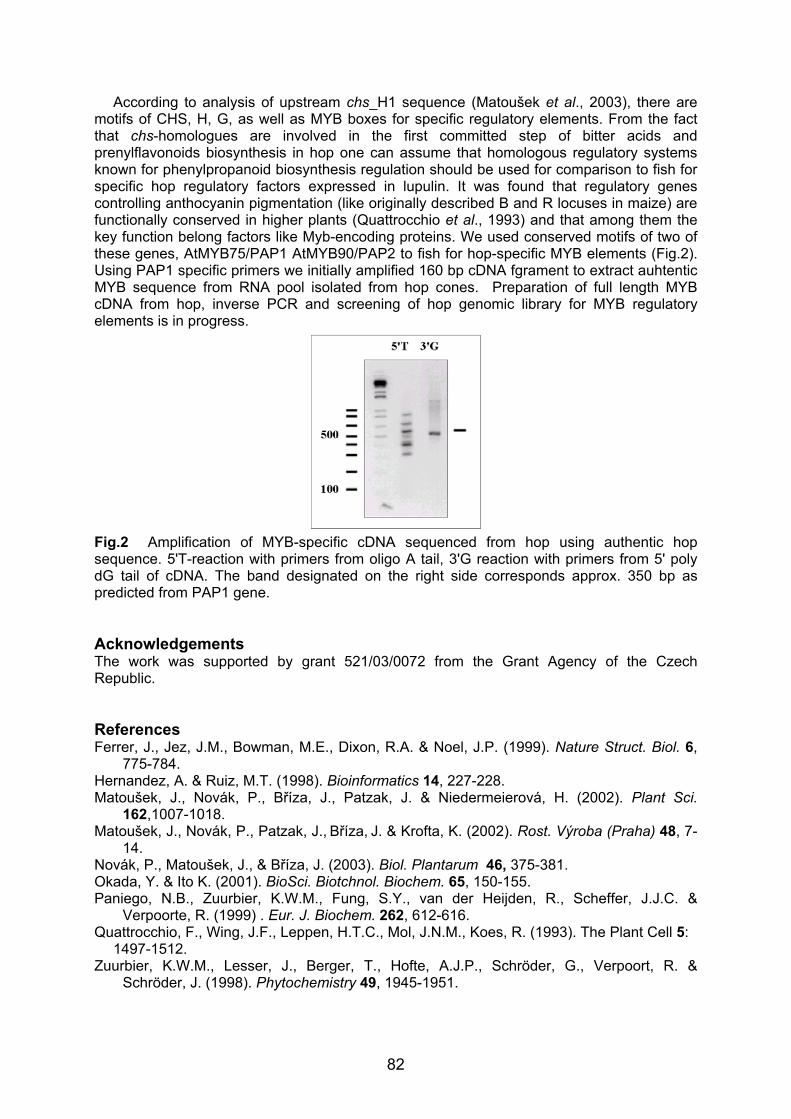
82
According to analysis of upstream chs_H1 sequence (Matoušek et al., 2003), there are motifs of CHS, H, G, as well as MYB boxes for specific regulatory elements. From the fact that chs-homologues are involved in the first committed step of bitter acids and prenylflavonoids biosynthesis in hop one can assume that homologous regulatory systems known for phenylpropanoid biosynthesis regulation should be used for comparison to fish for specific hop regulatory factors expressed in lupulin. It was found that regulatory genes controlling anthocyanin pigmentation (like originally described B and R locuses in maize) are functionally conserved in higher plants (Quattrocchio et al., 1993) and that among them the key function belong factors like Myb-encoding proteins. We used conserved motifs of two of these genes, AtMYB75/PAP1 AtMYB90/PAP2 to fish for hop-specific MYB elements (Fig.2). Using PAP1 specific primers we initially amplified 160 bp cDNA fgrament to extract auhtentic MYB sequence from RNA pool isolated from hop cones. Preparation of full length MYB cDNA from hop, inverse PCR and screening of hop genomic library for MYB regulatory elements is in progress.
Fig.2 Amplification of MYB-specific cDNA sequenced from hop using authentic hop sequence. 5'T-reaction with primers from oligo A tail, 3'G reaction with primers from 5' poly dG tail of cDNA. The band designated on the right side corresponds approx. 350 bp as predicted from PAP1 gene.
Acknowledgements The work was supported by grant 521/03/0072 from the Grant Agency of the Czech Republic.
References Ferrer, J., Jez, J.M., Bowman, M.E., Dixon, R.A. & Noel, J.P. (1999). Nature Struct. Biol. 6,
775-784. Hernandez, A. & Ruiz, M.T. (1998). Bioinformatics 14, 227-228. Matoušek, J., Novák, P., Bříza, J., Patzak, J. & Niedermeierová, H. (2002). Plant Sci.
162,1007-1018. Matoušek, J., Novák, P., Patzak, J., Bříza, J. & Krofta, K. (2002). Rost. Výroba (Praha) 48, 7-
14. Novák, P., Matoušek, J., & Bříza, J. (2003). Biol. Plantarum 46, 375-381. Okada, Y. & Ito K. (2001). BioSci. Biotchnol. Biochem. 65, 150-155. Paniego, N.B., Zuurbier, K.W.M., Fung, S.Y., van der Heijden, R., Scheffer, J.J.C. &
Verpoorte, R. (1999) . Eur. J. Biochem. 262, 612-616. Quattrocchio, F., Wing, J.F., Leppen, H.T.C., Mol, J.N.M., Koes, R. (1993). The Plant Cell 5:
1497-1512. Zuurbier, K.W.M., Lesser, J., Berger, T., Hofte, A.J.P., Schröder, G., Verpoort, R. &
Schröder, J. (1998). Phytochemistry 49, 1945-1951.
83
HOP GENETIC RESEARCH IN SLOVENIA
B. Javornik1,2., J. Jakše1, A.Čerenak2, N. Štajner1, P. Kozjak1, A. Ivančič3, Z. Šatović4,
S. Škof1, Z. Luthar1
1Centre for Biotechnology and Plant Breeding, Biotechnical Faculty, University of Ljubljana, Jamnikarjeva 101, Ljubljana 1000, Slovenia
2Institute of Hop Research and Brewing Žalec, Cesta Žalskega tabora 2, Žalec 3300, Slovenia
3Faculty of Agriculture, University of Maribor, Vrbanska 30, 2000 Maribor, Slovenia 4Faculty of Agriculture, University of Zagreb, Svetošimunska 6, 10000 Zagreb, Croatia
1 Introduction Hop growing in Slovenia has a tradition of more than 100 years, and hop breeding also has a long tradition. The first cultivars released by the Institute of Hop Research and Brewing (IHRB) in 1971 were Ahil, Apolon, Atlas and Aurora. They were followed in 1980 by three (Bobek, Blisk and Buket) and in 1990 by four new hop cultivars (Cicero, Celea, Cekin and Cerera). These Slovene hop cultivars were the result of breeding work carried out by Dr. Dragica Kralj. Additionally, cv. Savinjski golding, an ecotype of English Fuggle, was also registered and put on the variety list. Today, Aurora occupies 60% of Slovene hop fields, followed by Savinjski golding (15%), Bobek (10%), Celeia (5%) and others. The recently introduced cv. Magnum is grown on less than 5% of hop fields. This varietal structure emphasises the importance of “regional” hop breeding and the adaptation of hop varieties to the specific growing conditions. Since the last release of hop cultivars in 1990, breeding work at IHRB has been faced with various obstacles and has only been recently intensified. Genetic studies have been set up alongside this hop breeding work, mainly at the Biotechnical Faculty (CPBB BF) to provide additional and hopefully useful information for hop breeding. The genetic work carried out in the last two years will be briefly discussed. 2 Evaluation of hop genetic resources
The IHRB maintains an extensive collection of worldwide hop cultivars and their own breeding lines and a fairly rich collection of wild hops. These genetic resources have been evaluated by morphological or biochemical descriptions and additionally by molecular markers, thus providing more accurate and detailed information than classical phenotypic data. In general, the main aim of management of genetic resources is to ensure that as much as possible of the exist ing genetic diversity of the species is preserved. The effectiveness of this depends to a large extent on the genetic information available on the germplasm under study and molecular markers provide genetic information of direct value in the acquisition of data on diversity, maintenance of germplasm collections and characterization of genetic diversity. On a more fundamental level, molecular marker information may lead to the further identification of useful genes contained in collection. Hop cultivars maintained at the IHRB collection have been evaluated by RAPD (Šuštar-Vozlič and Javornik, 1999), AFLP and four microsatellite (SSR) markers (Jakše et al., 2001). In these two works, the main characterization of the hop germplasm under study was observed – e.g. a clear geographic division of cultivars into American and European genotypes and a distinct grouping within European germplasm reflecting past hop breeding practices adopted in different regions. Our work on hop genetic resources was extended to studies of wild hops and male and female breeding lines by four SSR markers (Javornik et al., unpublished). Molecular variability of SSR was assessed on 51 cultivated females, 14 male breeding lines,
84
25 wild females, 20 wild males (Euroasia) and 14 wild males (USA). SSR were evaluated on a sample of 124 accessions, giving an average of 15.7 alleles per loci, with the relatively low PIC value of 0.25. Genetic distances were calculated by five different measures of which the Dice distance coefficient (DD) or the proportion of shared alleles distance (Dps) and the stepwise distance (Dsw) were the best estimates. A UPGMA tree based on these distances gave the expected distribution of accessions into clusters. USA wild males formed a very distinct separate cluster, while the genetic distances among other accessions were smaller. A cluster was formed containing 25 Euroasian wild male and female accessions, while the other wild and cultivated male or female accessions did not show a tendency for more specific grouping. Analysis of molecular variance (AMOVA) was made on all non-USA accessions in order to gain an insight into the genetic structure of Euroasian hop diversity (female vs. male; cultivated vs wild; within cultivated and wild vs. among female and male etc). AMOVA conclusions were:
- most of the molecular variance was found within groups; - wild hops differ from cultivated but the percentage of variation among groups was
limited and there were no significant differences in the amount of molecular variation between cultivated and wild hops;
- molecular analysis failed to distinguish between female and male hops. The Australian SSR were further analysed by sequencing 41 out of 63 alleles detected at four loci in the sample of 124 accessions. No obvious variation was found either in the flanking region or in the microsatellite repeat structure in sequences except at locus 5-2. At this locus we think that we observed direct mutation events and the independent development of a duplicated locus within species. Within locus 5-2, we found two distinct types of microsatellite repeat in geographically partitioned native hops, which provides substantial support for earlier data of hop geographic separation (Javornik et al., unpublished) 3 Development of molecular markers in hops
Different PCR-based molecular markers have enabled the fine-scale genetic characterisation of the germplasm collection and they supply a large amount of data that can be used for germplasm management, genetic studies, and breeding purposes etc. In hop, RAPD and AFLP markers have mainly been used in different studies and applications, mostly because of their simplicity, relatively high information value and the lack of hop genomic information. We have used both the mentioned marker systems but in order to gain addit ional hop genomic information, the development of hop microsatell ite markers was undertaken. The establishment of a microsatellite analysis system for a new species is a considerable financial and technical challenge. However, microsatellites have been proven to be markers of choice in many crops because of their abundance and uniform distribution in genomes, hypervariability, co-dominant nature (particularly important in highly heterozygous crops), transportability among species and accessibility for other research laboratories. Only four microsatellite loci have been identified in hop to date, but their good properties and applicability have already been shown in genetic diversity and fingerprinting studies, and in attempts to create a hop genetic linkage map. More microsatellite loci are required to increase knowledge of the hop genome, and particularly to develop a reliable genetic map. We first developed an efficient protocol for isolation of di-, tri- and tetranucleotide microsatellite motifs through enrichment selection and thus significantly improve the isolation of microsatellite sequences from hop genome (Jakše and Javornik, 2001). The average enrichment ratio in developed libraries was 32 %, with the lowest ratio in the ACTC library (4 %) and the highest ratio in the GT library (42 %). Altogether, 235 different clones were sequenced from 6 out of 8 developed libraries. Of these, 227 clones contained microsatellite repeats. Compound and compound-interrupted types of microsatellite repeats were the most common. After duplication checking, it was found that 147 unique sequences had been obtained. The average redundancy was 37 %, the highest being in the ACTC library (67 %) and the lowest in the CAG library (24 %). According to the length of the flanking regions, 112
85
unique clones were suitable for primer development. To date, 28 new microsatellite markers have been developed and genotyped on 68 accessions (Jakše et al., 2002). Polymorphic microsatellites produced an average of 10 alleles/locus and average polymorphism information content (PIC) of 0.6. Calculated PIC values classified 18 loci as informative markers (PIC>0.5) and 13 as suitable for mapping ((PIC>0.7). We are continuing work on the development of more new microsatellite markers. We have also improved our AFLP analysis, moving from silver stained detection and manual band scoring to fluorescence AFLP (fAFLP) with automated band detection and band evaluation by computer software (Štajner et al., in press). 4 Identification of hop genotypes The developed microsatellites were applied as molecular markers for identifying hop varieties. Sixty-three hop accessions were included in the analysis, of which 58 were varieties and 5 tetraploids. Fourteen primers were used for the SSR analysis. Altogether, 73 different alleles were amplified, of which 14 were specific for nine cultivars. Overall, 116 different genotypes were observed, of which 50 were unique and observed only once. For cultivar identification, a minimum of 5 primer pairs were selected, which allowed the discrimination of 44 cultivars. The main purpose of this research is to provide a scheme of cultivar identification based on polymorphic microsatellite data that will be useful for hop breeders, merchants and brewers (Čerenak et al., submitted). 5 Genome mapping Genetic maps based on comparison of recombination frequencies between pairs of markers make it possible to follow the inheritance of any chromosomal region in a controlled cross. Today, genetic maps have been constructed for many crops in order to map monogenic traits and dissect polygenic traits. Mapping of monogenic traits is usually simple, as long as there is a reliable assay for it. Mapping for quantitative traits (QTL) is complicated by the fact that many genes are usually involved, whose expression is influenced by environmental factors. Nevertheless, marker assisted selection (MAS) has been found to be a very useful breeding strategy in the creation of new varieties in many crops. In hop, one study generated a male and female genetic linkage map using AFLP markers (Seefelder et al., 2000) on a mapping family of Wye Traget x 85/54/1 (German breeding line). We have also started making a map of the family of 120 progenies from a previous cross (Magnum x 2/1 – wild Slovene male) characteristic for the variability of alpha acid content. We are using fAFLP as molecular markers, applying two different restriction enzymes (Eco RI and Pst I) in combination with the standard one (Mse I) to avoid clustering of the Eco RI/Mse I markers around centromers. We have analysed 18 primer pair combinations so far, generating around 400 polymorphic markers, but they are not yet evaluated. We hope to increase the number of primer combinations to 30 and additionally to include as many microsatellite markers as possible. We thus hope that a saturated hop map can be constructed and used primarily for the delineation of OTL governing alpha acid content. In addition to this map, we are analysing another mapping family for aphid resistance (Čerenak and Javornik, 2002) and building families for Verticillium resistance. 6 Genetic transformation Genetic transformations are an attractive alternative to conventional breeding methods since they enable relatively rapid introduction of desirable characteristics into established hop cultivars without altering their quality profiles. However, for efficient application of transformation techniques, various conditions must be fulfilled, one of which is a high rate in vitro regeneration. There are only a few reports on hop in vitro regeneration, most through callus formation either of some wild varieties (Batista et al., 1995, 2000) or commercial cultivars (Gurriarán et al., 1999). So far, no successful transformation protocol has been published, except for transient GUS expression in transformed hop callus tissue (Oriniakova et al., 1999). Hop transformation work has been carried out in our lab for the last two years and we can currently report on establishing an efficient Agrobacterium-mediated transformation of the Slovenian commercial hop cultivar Aurora. Expression of an uidA (β-
86
glucuronidase) reporter gene was histochemically assayed and integration of the reporter and plant selection (nptII) genes into hop genome confirmed by PCR analysis. References Batista, D., Ascensão, L., Sousa, M.J., Pais M.S. 2000. Plant Science 151: 47-57. Batista, D., Sousa, M.J., Pais M.S. 1995. In Vitro Cell. Dev. Biol.-Plant. 32: 37-41. Čerenak A., Javornik B.2002. Res.Report Zb.Biotechn.Fak.UL 79 (2): 361-369. Čerenak A., Jakše J., Javornik B. DNA fingerprinting of hop varieties using simple sequence repeat markers. (submitted to JASBC) Gurriarán, M.J., Revilla M.A., Tamés R.S. 1999. Plant Cell Reports 18: 1007-1011. Jakše J., Kindlhofer K., Javornik B. 2001.. Genome 44:773-783. Jakše J., Javornik B. 2001. Plant Mol. Biol. Report., 19: 217-226. Jakše J., Bandelj D., Javornik B. 2002. Mol Ecol Notes 2: 544-546. Javornik B., Jakše J., Šatović Z. Genetic variability of wild hops (unpublished) Javornik B., Jakše J., Kurumata M., Trontelj P. Rise and fall of microsatellites (unpublished) Oriniakova, P., Pavingerova, D., Matoušek, J. 1999. Rostlinna Vyroba 45: 219-227. Seefelder S., Ehrmaier H., Schweizer G., Seigner E. 2000.. Plant Breeding 119:249-255. Šuštar-Vozlič and Javornik B. 1999. Plant Breeding 118:175-181. Štajner N., Bandelj D., Javornik B. Protocol used for AFLP by automatic laser fluorescence analysis (ALFA). Res.Report Zb.Biotechn.Fak.UL ( in press)
87
ISSR POLYMORPHISM IN HOP
T.V. Danilova & G.I. Karlov K.A.Timiryazev Moscow Agricultural Academy, Timiryazevskaya st., 44, 127550 Moscow, Russia
Abstract Inter simple sequence repeat (ISSR) polymorphism was used to evaluate the genetic variability of 26 diverse hop genotypes. Twenty three primers generated 183 DNA fragments, of which 106 (57.9%) were polymorphic. The level of genetic variability detected with ISSR-PCR analysis was higher in comparison with RAPD and AFLP previously reported by some authors. Cultivar specific DNA fragments were found for four genotypes. Cluster analysis grouped the cultivars corresponding to their origin. Two ISSR primers revealed fragments specific for male plants. The applicability of ISSR-PCR analysis for hop germplasm evaluation is discussed. Introduction In recent years it has become well recognized that DNA molecular markers (based on PCR - polymerase chain reaction) are powerful tool for genetic analysis and breeding programs because of their reliability and simplicity. The RAPD (randomly amplified polymorphic DNA), AFLP (amplified fragment length polymorphism), STS (sequence tagged sites) and microsatellite markers were used to describe genetic diversity and phylogenetic relationships in hop (Humulus lupulus L.), and to identify sex in hop plants (Polley et al, 1997). Depending on the set of hop genotypes and primers, the level of genetic diversity varied from low, when cultivars could not be distinguished (Pillay & Kenny, 1996, Brady et al, 1996, Hartl & Seefelder, 1998) to high enough for germplasm evaluation and successful phylogenetic analysis (Patzak et al, 1999, Sustar-Vozlic & Javornic, 1999, Mukami 2000, Siefelder et al, 2000, Jakse et al, 2001). Since 1994 (Zeitkewich et al, 1994) inter simple sequence repeat (ISSR) markers are successfully applied for genetic analysis of plants (Nagaoka & Oginara, 1997, Kojima et al, 1998, Prevost & Wilkinson, 1999, Joshi et al, 2000, Arcade et al, 2000). High polymorphism of ISSR markers is based on abundance and hypervariability of microsatellites (simple sequence repeats - SSR) – short tandem repeats of two - five base pairs motifs in plant genomes. ISSR primers contain sequences complimentary to SSR motif and 1-3 base “anchor” on 3’ or 5’ end which provides an amplification of regions between adjacent SSRs. ISSR-PCR overcomes many of the technical limitations of RAPD and AFLP because of its high reproducibility and simplicity; it does not need prior information about DNA sequence. J. Patzak (2001) compared suitability of ISSR molecular markers and RAPD, STS, AFLP for genetic analysis of 10 hop varieties. The polymorphism of ISSR PCR products was lowest, but enough to distinguish most genotypes. ISSR had the lowest correlation with chemical characteristics of hop cultivars. The objective of this study was to access the applicability of ISSR PCR markers in analysis of phylogenetic relationships, cultivars identification and sex detection in hop. Materials and methods Plant material. The hop plants from Research Institute of Hop (Chuvash Republic, Russia) used in this study are listed in table 1. ISSR-PCR and electrophoresis. DNA was isolated from dried leaves by the SDS method (60°C, 45 min extraction in SDS buffer: 100mM TRIS-HCl, pH8, 50mM Na2EDTA, 500 mM NaCl, 1,25% SDS, 2% PVP, Na2S2O5 40-50 mg/10 ml buffer added before use), purified in one volume of chloroform/isoamyl-alcohol (24/1) and precipitated in the presence of
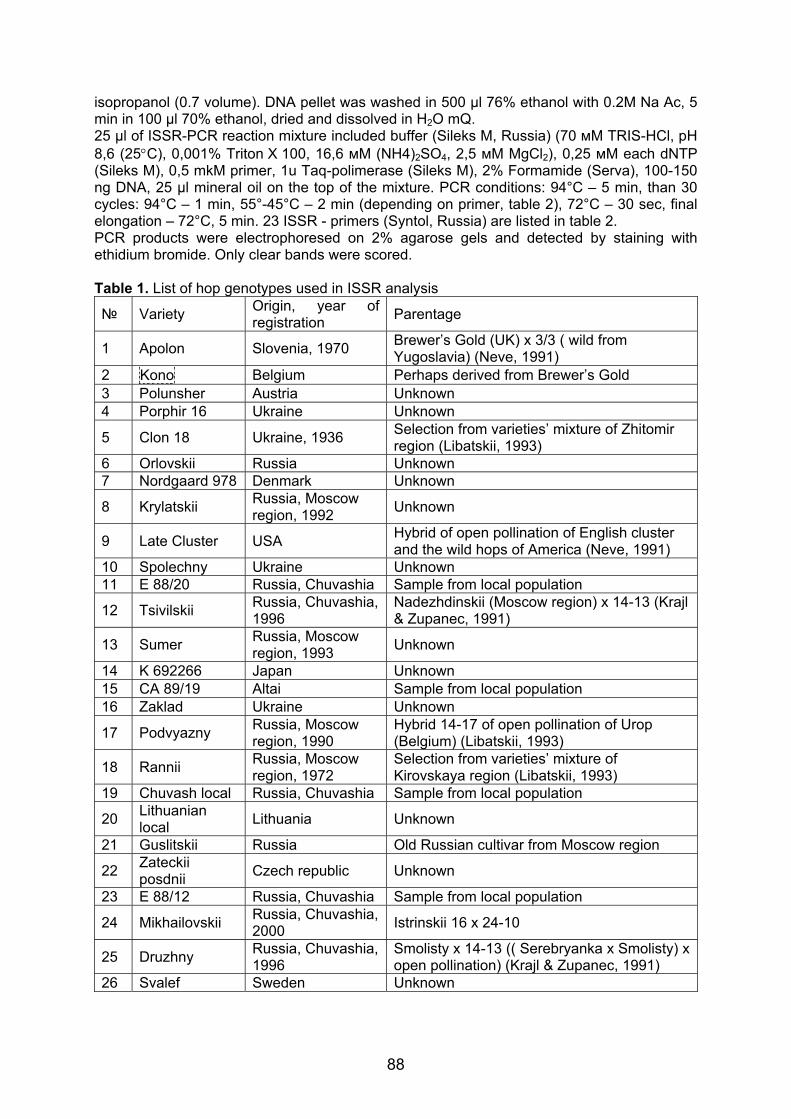
88
isopropanol (0.7 volume). DNA pellet was washed in 500 µl 76% ethanol with 0.2М Na Ac, 5 min in 100 µl 70% ethanol, dried and dissolved in H2O mQ. 25 µl of ISSR-PCR reaction mixture included buffer (Sileks M, Russia) (70 мM TRIS-HCl, pH 8,6 (25°C), 0,001% Triton Х 100, 16,6 мM (NH4)2SO4, 2,5 мM MgCl2), 0,25 мM each dNTP (Sileks M), 0,5 mkM primer, 1u Taq-polimerase (Sileks M), 2% Formamide (Serva), 100-150 ng DNA, 25 µl mineral oil on the top of the mixture. PCR conditions: 94°С – 5 min, than 30 cycles: 94°С – 1 min, 55°-45°С – 2 min (depending on primer, table 2), 72°С – 30 sec, final elongation – 72°С, 5 min. 23 ISSR - primers (Syntol, Russia) are listed in table 2. PCR products were electrophoresed on 2% agarose gels and detected by staining with ethidium bromide. Only clear bands were scored. Table 1. List of hop genotypes used in ISSR analysis
№ Variety Origin, year of registration Parentage
1 Apolon Slovenia, 1970 Brewer’s Gold (UK) х 3/3 ( wild from Yugoslavia) (Neve, 1991)
2 Kono Belgium Perhaps derived from Brewer’s Gold 3 Polunsher Austria Unknown 4 Porphir 16 Ukraine Unknown
5 Clon 18 Ukraine, 1936 Selection from varieties’ mixture of Zhitomir region (Libatskii, 1993)
6 Orlovskii Russia Unknown 7 Nordgaard 978 Denmark Unknown
8 Krylatskii Russia, Moscow region, 1992 Unknown
9 Late Cluster USA Hybrid of open pollination of English cluster and the wild hops of America (Neve, 1991)
10 Spolechny Ukraine Unknown 11 E 88/20 Russia, Chuvashia Sample from local population
12 Tsivilskii Russia, Chuvashia, 1996
Nadezhdinskii (Moscow region) х 14-13 (Krajl & Zupanec, 1991)
13 Sumer Russia, Moscow region, 1993 Unknown
14 K 692266 Japan Unknown 15 CA 89/19 Altai Sample from local population 16 Zaklad Ukraine Unknown
17 Podvyazny Russia, Moscow region, 1990
Hybrid 14-17 of open pollination of Urop (Belgium) (Libatskii, 1993)
18 Rannii Russia, Moscow region, 1972
Selection from varieties’ mixture of Kirovskaya region (Libatskii, 1993)
19 Chuvash local Russia, Chuvashia Sample from local population
20 Lithuanian local Lithuania Unknown
21 Guslitskii Russia Old Russian cultivar from Moscow region
22 Zateckii posdnii Czech republic Unknown
23 E 88/12 Russia, Chuvashia Sample from local population
24 Mikhailovskii Russia, Chuvashia, 2000 Istrinskii 16 х 24-10
25 Druzhny Russia, Chuvashia, 1996
Smolisty х 14-13 (( Serebryanka х Smolisty) х open pollination) (Krajl & Zupanec, 1991)
26 Svalef Sweden Unknown
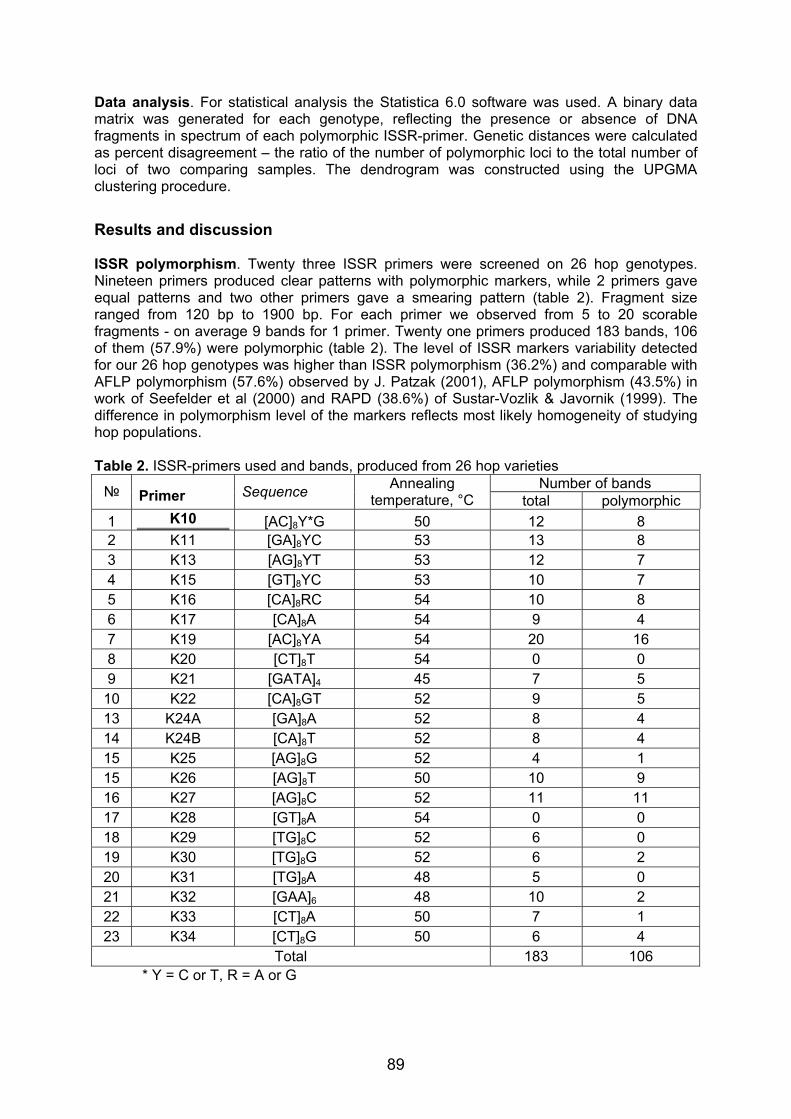
89
Data analysis. For statistical analysis the Statistica 6.0 software was used. A binary data matrix was generated for each genotype, reflecting the presence or absence of DNA fragments in spectrum of each polymorphic ISSR-primer. Genetic distances were calculated as percent disagreement – the ratio of the number of polymorphic loci to the total number of loci of two comparing samples. The dendrogram was constructed using the UPGMA clustering procedure. Results and discussion ISSR polymorphism. Twenty three ISSR primers were screened on 26 hop genotypes. Nineteen primers produced clear patterns with polymorphic markers, while 2 primers gave equal patterns and two other primers gave a smearing pattern (table 2). Fragment size ranged from 120 bp to 1900 bp. For each primer we observed from 5 to 20 scorable fragments - on average 9 bands for 1 primer. Twenty one primers produced 183 bands, 106 of them (57.9%) were polymorphic (table 2). The level of ISSR markers variability detected for our 26 hop genotypes was higher than ISSR polymorphism (36.2%) and comparable with AFLP polymorphism (57.6%) observed by J. Patzak (2001), AFLP polymorphism (43.5%) in work of Seefelder et al (2000) and RAPD (38.6%) of Sustar-Vozlik & Javornik (1999). The difference in polymorphism level of the markers reflects most likely homogeneity of studying hop populations. Table 2. ISSR-primers used and bands, produced from 26 hop varieties
Number of bands № Primer Sequence Annealing temperature, °С total polymorphic
1 K10 [AC]8Y*G 50 12 8 2 K11 [GA]8YC 53 13 8 3 K13 [AG]8YT 53 12 7 4 K15 [GT]8YC 53 10 7 5 K16 [CA]8RC 54 10 8 6 K17 [CA]8A 54 9 4 7 K19 [AC]8YA 54 20 16 8 K20 [CT]8T 54 0 0 9 K21 [GATA]4 45 7 5
10 K22 [CA]8GT 52 9 5 13 K24A [GA]8A 52 8 4 14 K24B [CA]8T 52 8 4 15 K25 [AG]8G 52 4 1 15 K26 [AG]8T 50 10 9 16 K27 [AG]8C 52 11 11 17 K28 [GT]8A 54 0 0 18 K29 [TG]8C 52 6 0 19 K30 [TG]8G 52 6 2 20 K31 [TG]8A 48 5 0 21 K32 [GAA]6 48 10 2 22 K33 [CT]8A 50 7 1 23 K34 [CT]8G 50 6 4
Total 183 106 * Y = С or Т, R = A or G
90
Specific DNA fragments were found for the most geographically distant genotypes K 692266 (Japan) – primers K15, K17 and CA 89/19 (Altai) – primer K16 and for cultivars Michailovskii – K22 and Apolon – K24A. Two ISSR primers produced bands, specific for 40 male plants from collection of Research Institute of Hop (Chuvash Republic, Russia) and were absent in female plants listed in table 1. Genetic distances and phylogenetic analysis. The distances (percent of disagreement according Statistica 6.0 software) were calculated between pairs of hop genotypes. The maximum distances - from 0.45 to 0.53 were obtained between cultivars Apolon (Slovenia), Spolechny (Ukraine) on the one hand and Russian genotypes (Rannii, Chuvash local, Guslitskii, Podvyazny E 88/20, Mikhailovskii) on the other hand, also between K 692266 (Japan) and the same Russian genotypes. On basis of the distances an UPGMA dendrogram was constructed (fig. 1). Most hop varieties distributed between two clusters. The overwhelming majority of Russian cultivars, Zaklad from Ukraine, Lithuanian local and Zateckii posdnii formed one cluster. Another cluster was more heterogeneous, it included most European and Ukrainian cultivars, three Russian varieties as subcluster and two eastern samples K 692266 (Japan) and CA 89/19 (Altai) as separate units. To a certain extent the dendrogram reflected the breeding process of hop in Russia and former USSR. Till the middle of the XIX century old local cultivars and mixtures were grown in Russia and Ukraine. To the end of the XIX century Bohemian, Bavarian and English varieties were introduced and partly replaced old local cultivars or mixed with them. The first hybrid cultivars were registered in the USSR in 1970s (Libatskii, 1993). That can explain for example the closeness of Ukrainian cultivars Clon 18 and Porphir 16 to other European cultivars. We didn’t observed any correlation between ISSR clustering and chemical or agronomic characteristics of varieties which is in accordance with the results of J.Patzak (2001): he obtained the lowest correlation coefficient between ISSR classification and chemical data in comparison with STS, AFLP and RAPD. Our results demonstrated suitability of ISSR-PCR analysis for accessing of genetic relationships between hop varieties and can be effectively used in hop breeding programs for designing crosses according to the origin of varieties and for sex identification in crosses. References 1. Arcade A. et al. (2000). Application of AFLP, RAPD and ISSR markers to genetic mapping of European and Japanese larch. Theor. Appl. Genet.. V. 100, 299–307. 2. Brady J.L., Scott N.S., Thomas M.R. (1996) DNA typing of hops (Humulus lupulus L.) through application of RAPD and microsatellite marker sequences converted to sequence tagged sites (STS). Euphytica. V. 91, 277–284. 3. Hartl L., Seefelder S. (1998) Diversity of selected hop cultivars detected by fluorescent AFLPs. Theor. Appl. Genet. V. 96, 112–116. 4. Jakse J., Kindlhofer K., Javornik B. (2001) Assessment of genetic variation and differentiation of hop genotypes by microsatellite and AFLP markers. Genome 44(5), 773–82. 5. Joshi S.P. et al. (2000) Genetic diversity and phylogenetic relationship as revealed by inter simple sequence repeat (ISSR) polymorphism in the genus Orysa. Theor. Appl. Genet. V. 100, 1311–1320. 6. Kojima T. et al. (1998) Genetic linkage map of ISSR and RAPD markers in Eincorn wheat in relation to that of RFLP markers. Theor. Appl. Genet. V. 96, 37–45. 7. Krajl D., Zupanec J. (1991) Variability of essential oils of hops. Humulus lupulus L. J. Inst. Brew. V. 97, 197–206. 8. Libatskii E.P. Hop-growing. Moscow: Kolos, 1993. 287p. 9. Mukami A. (2000) Hop variety classification using the genetic distance based on RAPD. J. of The Institute of Brewing. V. 106, N 3, 157–161. 10. Nagaoka T., Oginara Y. (1997) Applicability of inter-simple sequence repeat polymorphisms in wheat for use as DNA markers in comparison to RFLP and RAPD markers. Theor. Appl. Genet.. V. 97, 597–602.
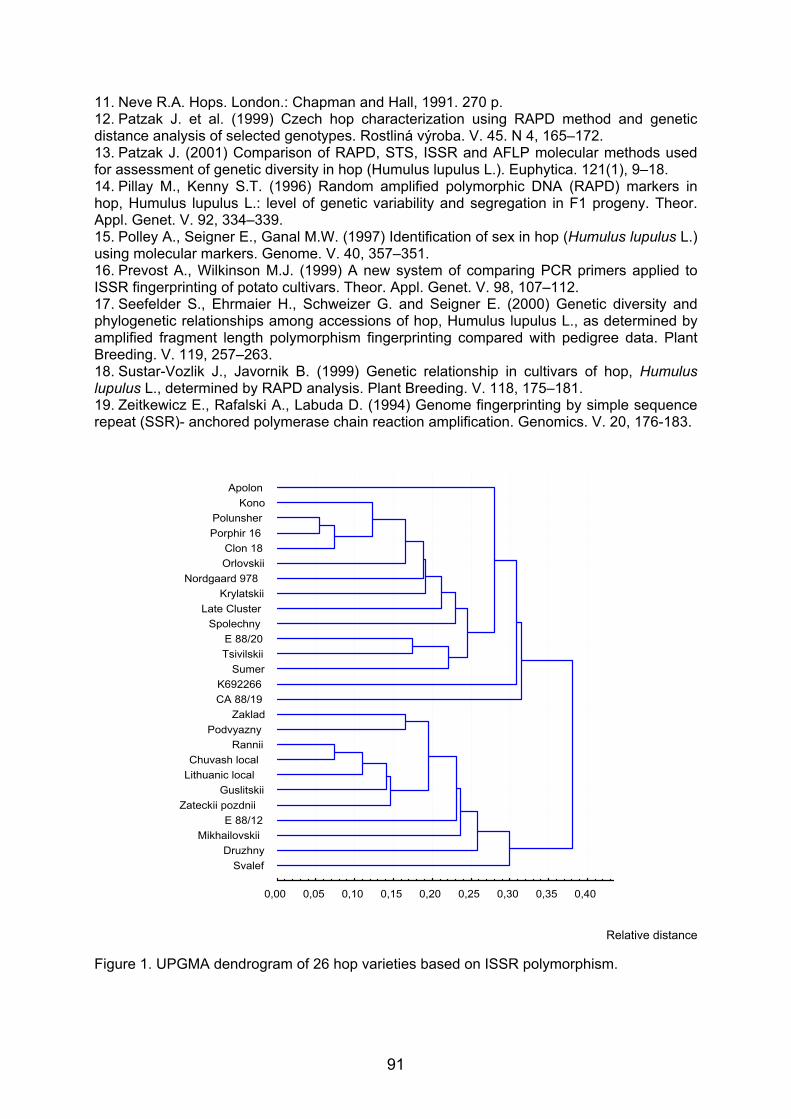
91
11. Neve R.A. Hops. London.: Chapman and Hall, 1991. 270 p. 12. Patzak J. et al. (1999) Czech hop characterization using RAPD method and genetic distance analysis of selected genotypes. Rostliná výroba. V. 45. N 4, 165–172. 13. Patzak J. (2001) Comparison of RAPD, STS, ISSR and AFLP molecular methods used for assessment of genetic diversity in hop (Humulus lupulus L.). Euphytica. 121(1), 9–18. 14. Pillay M., Kenny S.T. (1996) Random amplified polymorphic DNA (RAPD) markers in hop, Humulus lupulus L.: level of genetic variability and segregation in F1 progeny. Theor. Appl. Genet. V. 92, 334–339. 15. Polley A., Seigner E., Ganal M.W. (1997) Identification of sex in hop (Humulus lupulus L.) using molecular markers. Genome. V. 40, 357–351. 16. Prevost A., Wilkinson M.J. (1999) A new system of comparing PCR primers applied to ISSR fingerprinting of potato cultivars. Theor. Appl. Genet. V. 98, 107–112. 17. Seefelder S., Ehrmaier H., Schweizer G. and Seigner E. (2000) Genetic diversity and phylogenetic relationships among accessions of hop, Humulus lupulus L., as determined by amplified fragment length polymorphism fingerprinting compared with pedigree data. Plant Breeding. V. 119, 257–263. 18. Sustar-Vozlik J., Javornik B. (1999) Genetic relationship in cultivars of hop, Humulus lupulus L., determined by RAPD analysis. Plant Breeding. V. 118, 175–181. 19. Zeitkewicz E., Rafalski A., Labuda D. (1994) Genome fingerprinting by simple sequence repeat (SSR)- anchored polymerase chain reaction amplification. Genomics. V. 20, 176-183.
Relative distance Figure 1. UPGMA dendrogram of 26 hop varieties based on ISSR polymorphism.
0,00 0,05 0,10 0,15 0,20 0,25 0,30 0,35 0,40
SvalefDruzhny
MikhailovskiiE 88/12
Zateckii pozdniiGuslitskii
Lithuanic localChuvash local
RanniiPodvyazny
ZakladCA 88/19K692266
SumerTsivilskiiE 88/20
SpolechnyLate Cluster
KrylatskiiNordgaard 978
OrlovskiiClon 18
Porphir 16Polunsher
KonoApolon
92
MOLECULAR EVOLUTION OF HOPS, Humulus lupulus Atsushi Murakami1), Peter Darby2), Branka Javornik3), Maria S. S. Pais4), Elisabeth Seigner5),
Anton Lutz5) and Petr Svoboda6)
1) Kirin Brewery Co., Ltd., Research Laboratory for Brewing,1-17-1 Namamugi Tsurumi-ku, Yokohama 230-8628, Japan 2) Horticulture Research International, Dept. of Hop Research, Wye, Ashford, Kent TN25 5AH, England 3) Center for Plant Biotechnology and Breeding, Biotechnical Faculty, University of Ljubljana, Jamnikarjeva 101, SI-1000 Ljubljana, Slovenia 4) Laboratory of Plant Biotechnology - ICAT, Edificio ICAT, Campo Grande 1749-016, Lisbon, Portugal 5) Bayer. Landesanstalt für Landwirtschaft, Institut für Pflanzenbau und Pflanzenzuechtung, Arbeitsbereich Hopfen, Huell 5 1/3, D-85283 Wolnzach, Germany 6)Hop Research Institute Co., Ltd., Kadanska 2525, 43846 Zatec, Czech Republic Abstract The origin, migration and genetic relationship among wild hops, Humulus lupulus, grown in the Northern Hemisphere are still unknown. A phylogenetic study among wild hops would be expected to give insights into their evolution and provide important knowledge of their genetic variation of direct relevance to current hop breeding. We have analyzed wild hops collected from around the world to assess the genetic diversity and the geographical distribution of haplotypes. The haplotypes were characterized by the differences of DNA sequence and presence and absence of indels (insertion/deletion) of chloroplast DNA non-coding regions. They are primarily divided into two types, one is the European and the other is the Asian-North American type. Their geographic distribution indicates that the divergence of these types has occurred in China, supporting the origin of hops, previously postulated by Neve (1991). Hop populations in Europe and others in China, Japan and North America diverged approximately 1.12 million years ago, and the differentiation within the latter occurred 0.4-0.7 million years ago. The North American population, which has been considered to originate from Asian hops, possesses a high degree of genetic diversity. The European population showed a wide range of distribution across Eurasia with a slight genetic variation, found only in Caucasus region. Wild hops grown in each region are genetically diverged, and still remain as large genetic resources that have not been significantly utilized to date. Thus, the expansion of genetic variation provided by wild hops could be useful for breeding. Introduction Hop is a dioecious perennial plant, and only female cones are used for beer production. The genus Humulus consists of three species: H. lupulus, H. japonicus and H. yunnanensis (Small 1978, Neve 1991). Wild hops are distributed throughout the Northern Hemisphere, and they are classified in five taxonomic varieties; lupulus for European, cordifolius for Japanese and neomexicanus, pubescens and lupuloides for three North American hops, respectively (Small 1978). While some important characteristics such as disease resistance and the high content of bitter compounds are known to come from wild hops (Neve 1991), they have not, in general, been fully integrated into breeding programs due to their lower quality of flavor. Little is known about the phylogenetic relationship among wild hops and their genetic variability. We have analyzed wild hops from around the world to determine the genetic differences among populations to give insights into details of hop evolution and diversification. We have used twelve non-coding regions of chloroplast DNA (cpDNA) comprising a sequence of approximately 8 kb.
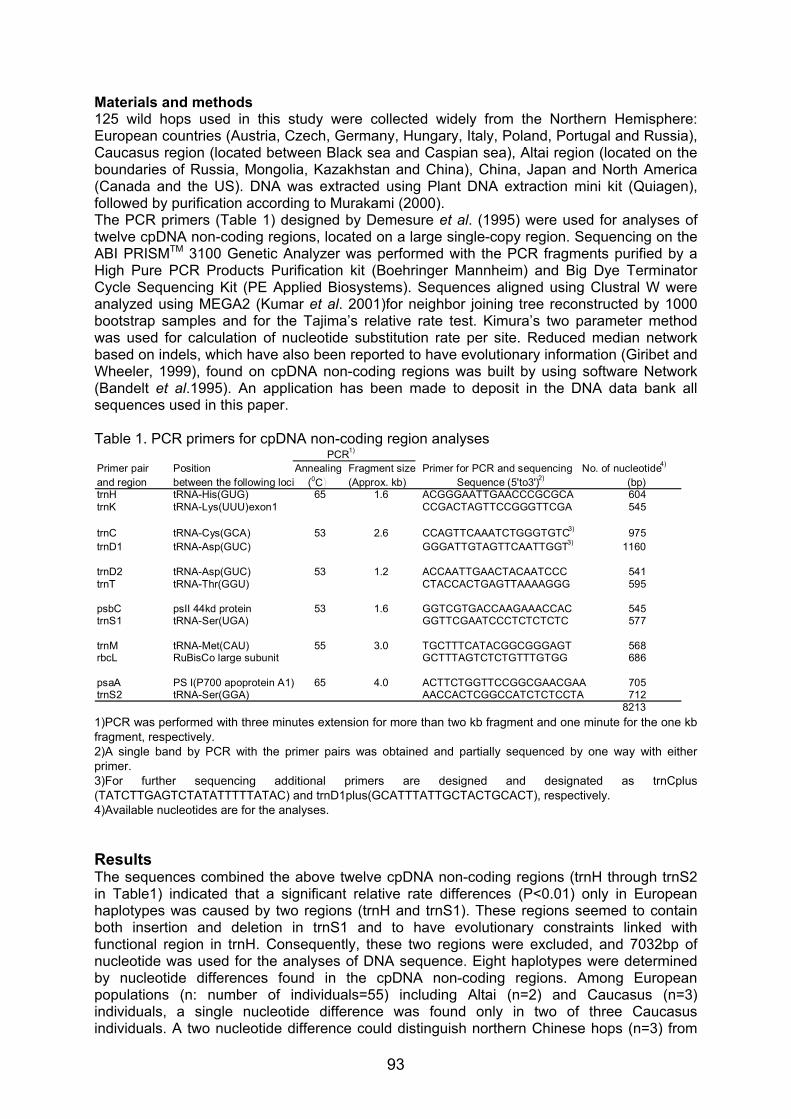
93
Materials and methods 125 wild hops used in this study were collected widely from the Northern Hemisphere: European countries (Austria, Czech, Germany, Hungary, Italy, Poland, Portugal and Russia), Caucasus region (located between Black sea and Caspian sea), Altai region (located on the boundaries of Russia, Mongolia, Kazakhstan and China), China, Japan and North America (Canada and the US). DNA was extracted using Plant DNA extraction mini kit (Quiagen), followed by purification according to Murakami (2000). The PCR primers (Table 1) designed by Demesure et al. (1995) were used for analyses of twelve cpDNA non-coding regions, located on a large single-copy region. Sequencing on the ABI PRISMTM 3100 Genetic Analyzer was performed with the PCR fragments purified by a High Pure PCR Products Purification kit (Boehringer Mannheim) and Big Dye Terminator Cycle Sequencing Kit (PE Applied Biosystems). Sequences aligned using Clustral W were analyzed using MEGA2 (Kumar et al. 2001)for neighbor joining tree reconstructed by 1000 bootstrap samples and for the Tajima’s relative rate test. Kimura’s two parameter method was used for calculation of nucleotide substitution rate per site. Reduced median network based on indels, which have also been reported to have evolutionary information (Giribet and Wheeler, 1999), found on cpDNA non-coding regions was built by using software Network (Bandelt et al.1995). An application has been made to deposit in the DNA data bank all sequences used in this paper. Table 1. PCR primers for cpDNA non-coding region analyses
1)PCR was performed with three minutes extension for more than two kb fragment and one minute for the one kb fragment, respectively. 2)A single band by PCR with the primer pairs was obtained and partially sequenced by one way with either primer. 3)For further sequencing additional primers are designed and designated as trnCplus (TATCTTGAGTCTATATTTTTATAC) and trnD1plus(GCATTTATTGCTACTGCACT), respectively. 4)Available nucleotides are for the analyses. Results The sequences combined the above twelve cpDNA non-coding regions (trnH through trnS2 in Table1) indicated that a significant relative rate differences (P<0.01) only in European haplotypes was caused by two regions (trnH and trnS1). These regions seemed to contain both insertion and deletion in trnS1 and to have evolutionary constraints linked with functional region in trnH. Consequently, these two regions were excluded, and 7032bp of nucleotide was used for the analyses of DNA sequence. Eight haplotypes were determined by nucleotide differences found in the cpDNA non-coding regions. Among European populations (n: number of individuals=55) including Altai (n=2) and Caucasus (n=3) individuals, a single nucleotide difference was found only in two of three Caucasus individuals. A two nucleotide difference could distinguish northern Chinese hops (n=3) from
PCR1)
Primer pair Position Annealing Fragment size Primer for PCR and sequencing No. of nucleotide4)
and region between the following loci ( 0C (Approx. kb) Sequence (5'to3')2) (bp) trnH tRNA-His(GUG) 65 1.6 ACGGGAATTGAACCCGCGCA 604 trnK tRNA-Lys(UUU)exon1 CCGACTAGTTCCGGGTTCGA 545
trnC tRNA-Cys(GCA) 53 2.6 CCAGTTCAAATCTGGGTGTC 3) 975 trnD1 tRNA-Asp(GUC) GGGATTGTAGTTCAATTGGT 3) 1160
trnD2 tRNA-Asp(GUC) 53 1.2 ACCAATTGAACTACAATCCC 541 trnT tRNA-Thr(GGU) CTACCACTGAGTTAAAAGGG 595 psbC psII 44kd protein 53 1.6 GGTCGTGACCAAGAAACCAC 545 trnS1 tRNA-Ser(UGA) GGTTCGAATCCCTCTCTCTC 577
trnM tRNA-Met(CAU) 55 3.0 TGCTTTCATACGGCGGGAGT 568 rbcL RuBisCo large subunit GCTTTAGTCTCTGTTTGTGG 686
psaA PS I(P700 apoprotein A1) 65 4.0 ACTTCTGGTTCCGGCGAACGAA 705 trnS2 tRNA-Ser(GGA) AACCACTCGGCCATCTCTCCTA 712
8213
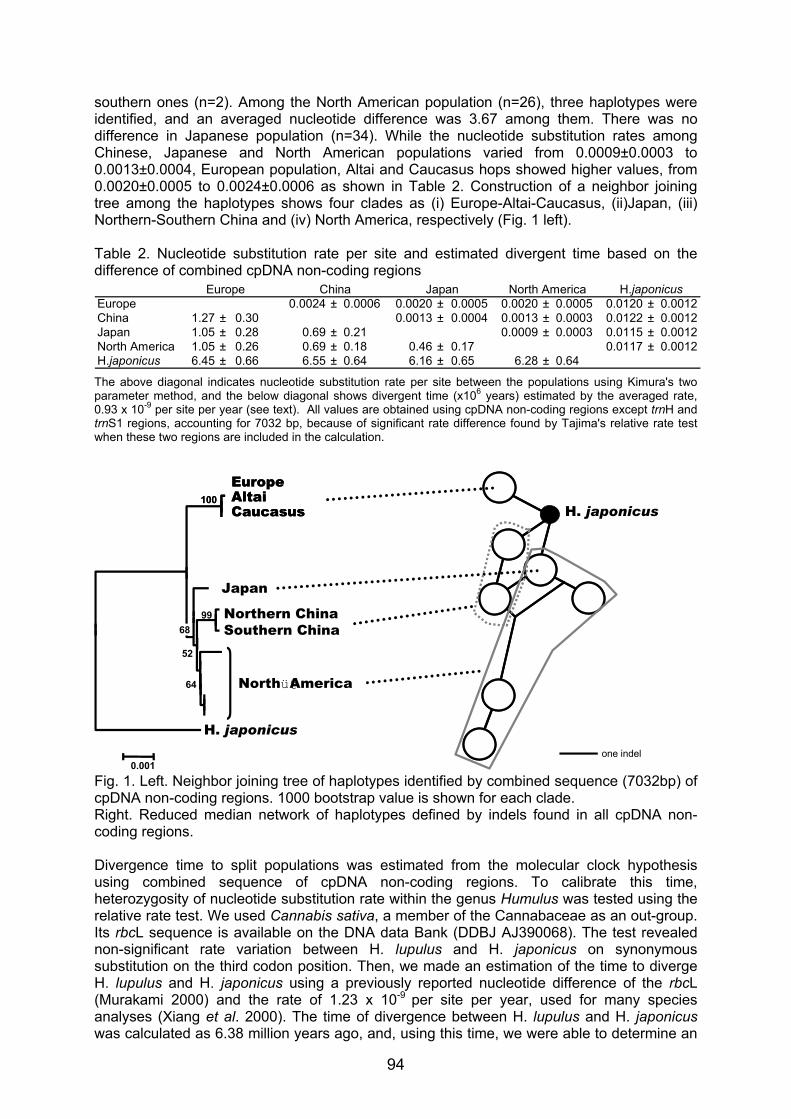
94
southern ones (n=2). Among the North American population (n=26), three haplotypes were identified, and an averaged nucleotide difference was 3.67 among them. There was no difference in Japanese population (n=34). While the nucleotide substitution rates among Chinese, Japanese and North American populations varied from 0.0009±0.0003 to 0.0013±0.0004, European population, Altai and Caucasus hops showed higher values, from 0.0020±0.0005 to 0.0024±0.0006 as shown in Table 2. Construction of a neighbor joining tree among the haplotypes shows four clades as (i) Europe-Altai-Caucasus, (ii)Japan, (iii) Northern-Southern China and (iv) North America, respectively (Fig. 1 left). Table 2. Nucleotide substitution rate per site and estimated divergent time based on the difference of combined cpDNA non-coding regions The above diagonal indicates nucleotide substitution rate per site between the populations using Kimura's two parameter method, and the below diagonal shows divergent time (x106 years) estimated by the averaged rate, 0.93 x 10⁻⁹ per site per year (see text). All values are obtained using cpDNA non-coding regions except trnH and trnS1 regions, accounting for 7032 bp, because of significant rate difference found by Tajima's relative rate test when these two regions are included in the calculation.
Fig. 1. Left. Neighbor joining tree of haplotypes identified by combined sequence (7032bp) of cpDNA non-coding regions. 1000 bootstrap value is shown for each clade. Right. Reduced median network of haplotypes defined by indels found in all cpDNA non-coding regions. Divergence time to split populations was estimated from the molecular clock hypothesis using combined sequence of cpDNA non-coding regions. To calibrate this time, heterozygosity of nucleotide substitution rate within the genus Humulus was tested using the relative rate test. We used Cannabis sativa, a member of the Cannabaceae as an out-group. Its rbcL sequence is available on the DNA data Bank (DDBJ AJ390068). The test revealed non-significant rate variation between H. lupulus and H. japonicus on synonymous substitution on the third codon position. Then, we made an estimation of the time to diverge H. lupulus and H. japonicus using a previously reported nucleotide difference of the rbcL (Murakami 2000) and the rate of 1.23 x 10⁻⁹ per site per year, used for many species analyses (Xiang et al. 2000). The time of divergence between H. lupulus and H. japonicus was calculated as 6.38 million years ago, and, using this time, we were able to determine an
68
52
0.001
100EuropeAltaiCaucasus
100EuropeAltaiCaucasus
Japan
H. japonicus
99
64 Northü@America
Northern China Southern China
H. japonicus
one indel
cpE
cpSC
cpNC
cpJcpNA1
cpNA2
cpNA3
cpNA4
Europe China Japan North America H.japonicusEurope 0.0024 ± 0.0006 0.0020 ± 0.0005 0.0020 ± 0.0005 0.0120 ± 0.0012China 1.27 ± 0.30 0.0013 ± 0.0004 0.0013 ± 0.0003 0.0122 ± 0.0012Japan 1.05 ± 0.28 0.69 ± 0.21 0.0009 ± 0.0003 0.0115 ± 0.0012North America 1.05 ± 0.26 0.69 ± 0.18 0.46 ± 0.17 0.0117 ± 0.0012H.japonicus 6.45 ± 0.66 6.55 ± 0.64 6.16 ± 0.65 6.28 ± 0.64
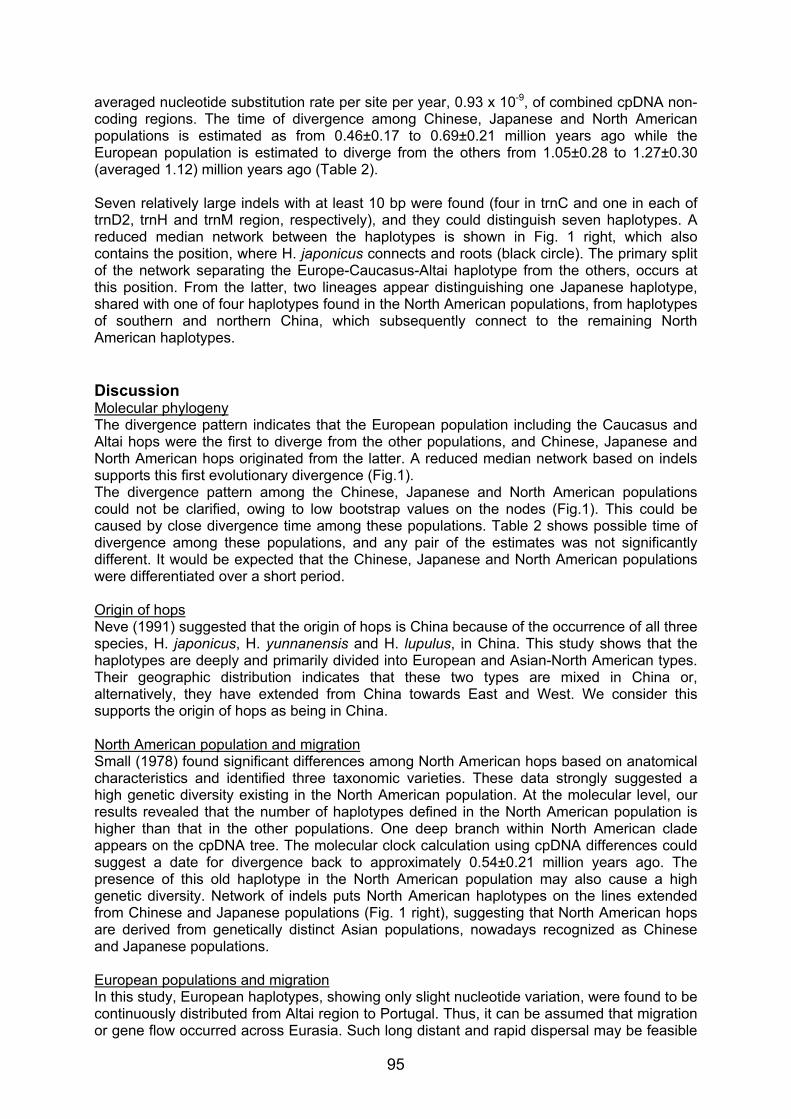
95
averaged nucleotide substitution rate per site per year, 0.93 x 10⁻⁹, of combined cpDNA non-coding regions. The time of divergence among Chinese, Japanese and North American populations is estimated as from 0.46±0.17 to 0.69±0.21 million years ago while the European population is estimated to diverge from the others from 1.05±0.28 to 1.27±0.30 (averaged 1.12) million years ago (Table 2). Seven relatively large indels with at least 10 bp were found (four in trnC and one in each of trnD2, trnH and trnM region, respectively), and they could distinguish seven haplotypes. A reduced median network between the haplotypes is shown in Fig. 1 right, which also contains the position, where H. japonicus connects and roots (black circle). The primary split of the network separating the Europe-Caucasus-Altai haplotype from the others, occurs at this position. From the latter, two lineages appear distinguishing one Japanese haplotype, shared with one of four haplotypes found in the North American populations, from haplotypes of southern and northern China, which subsequently connect to the remaining North American haplotypes. Discussion Molecular phylogeny The divergence pattern indicates that the European population including the Caucasus and Altai hops were the first to diverge from the other populations, and Chinese, Japanese and North American hops originated from the latter. A reduced median network based on indels supports this first evolutionary divergence (Fig.1). The divergence pattern among the Chinese, Japanese and North American populations could not be clarified, owing to low bootstrap values on the nodes (Fig.1). This could be caused by close divergence time among these populations. Table 2 shows possible time of divergence among these populations, and any pair of the estimates was not significantly different. It would be expected that the Chinese, Japanese and North American populations were differentiated over a short period. Origin of hops Neve (1991) suggested that the origin of hops is China because of the occurrence of all three species, H. japonicus, H. yunnanensis and H. lupulus, in China. This study shows that the haplotypes are deeply and primarily divided into European and Asian-North American types. Their geographic distribution indicates that these two types are mixed in China or, alternatively, they have extended from China towards East and West. We consider this supports the origin of hops as being in China. North American population and migration Small (1978) found significant differences among North American hops based on anatomical characteristics and identified three taxonomic varieties. These data strongly suggested a high genetic diversity existing in the North American population. At the molecular level, our results revealed that the number of haplotypes defined in the North American population is higher than that in the other populations. One deep branch within North American clade appears on the cpDNA tree. The molecular clock calculation using cpDNA differences could suggest a date for divergence back to approximately 0.54±0.21 million years ago. The presence of this old haplotype in the North American population may also cause a high genetic diversity. Network of indels puts North American haplotypes on the lines extended from Chinese and Japanese populations (Fig. 1 right), suggesting that North American hops are derived from genetically distinct Asian populations, nowadays recognized as Chinese and Japanese populations. European populations and migration In this study, European haplotypes, showing only slight nucleotide variation, were found to be continuously distributed from Altai region to Portugal. Thus, it can be assumed that migration or gene flow occurred across Eurasia. Such long distant and rapid dispersal may be feasible
96
with a high migration rate of hundreds of meters per year, which is comparable to those observed in European trees (Ferris et al. 1999). Alternatively, animals may assist hop migration (Ono, 1961). Breeding and genetic resources In this study, North American hops were confirmed to be distinct from others and a high degree of genetic variation still remains within them. Furthermore, both Japanese and Chinese hops are genetically differentiated both between each other and from the others. The results offer the possibility of using wild germplasm to open new genetic resources and expand genetic variation for breeding. Acknowledgement We thank persons who were engaged in collecting wild hops for their endeavor and enthusiasm. This paper could not be achieved without their dedications. We thank Dr. Kenny (Washington State University, USA) for providing the samples. Besides cpDNA, nuclear DNA (microsatellite DNA and rDNA spacer region) analyses have already been finished. Detailed results will be published elsewhere in near future. Literature cited Bandelt, H.-J., Forster, P., Sykes B. C., Richards M. B. Mitochondrial portraits of human
populations. Genetics 141,743-753, 1995. The software is downloaded from www. fluxus - engineering. com.
Demesure, B., Sodzi, N., and Petit, R. J. A set of universal primers for amplification of polymorphic non-coding regions of mitochondrial and chloroplast DNA in plants. Mol. Ecol. 4, 129-131. 1995.
Ferris, C., King, R. A. and Hewitt, G. M. Isolation within species and the history of glacial refugia. In "Molecular systematics and plant evolution", Hollingsworth, P. M., R. M. Bateman and R. J. Gornall (eds.), Taylor Francis, London, 20-34, 1999
Giribet, G. and Wheeler, W. C. On gaps. Mol. Phylogenet. Evol. 13, 1, 132-143, 1999 Kumar, S., Tamura, K., Jakobsen, I. B. and Nei, M. MEGA2: Molecular Evolutionary Genetics
Analysis software, Arizona State University, Tempe, Arizona, USA. 2001. The software is downloaded from www.megasoftware.net.
Murakami, A. Comparison of sequence of rbcL and non-coding regions of Chloroplast DNA and ITS2 region of rDNA in genus Humulus. Breed. Sci. 50, 155-160, 2000
Neve, R. A. Hops. Chapman and Hall, London, 1991 Ono, T. The wild hop native to Japan. Sasaki Printing & Publishing, Sendai, 1961 Small, E. A numerical and nomenclatural analysis of morpho-geographic taxa of Humulus.
Syst. Bot., 3, 37-76, 1978 Xiang Q-Y , Solitis D. E., Soltis P. S., Manchester S. R., and Crawford D. J. Timing the eastern Asian-eastern North American floristic disjunction: Molecular clock corroborates Paleontological estimates. Mol. Phylogenet. Evol. 15, 462-472, 2000
97
THE POTENTIAL FOR SELECTIVE BREEDING TO INCREASE THE
XANTHOHUMOL CONTENT OF HOPS.
Peter Darby1, Richard Atkinson2, Lesley A. Buggey2 and Ann E. Meacham2
1Horticulture Research International, Department of Hop Research, Imperial College, Wye,
Ashford, Kent, UK, TN25 5AH. 2Brewing Research International, Lyttel Hall, Nutfield, Redhill, Surrey, UK, RH1 4HY.
Abstract Xanthohumol, a compound unique to hops, shows considerable promise for its effects on a range of cancers. The potential, within the variety collection and breeding lines at HRI-Wye, to increase Xanthohumol content by conventional, selective breeding is investigated. Xanthohumol content is confirmed as a stable, varietal characteristic. Although strongly correlated with resin content, there was sufficient variability amongst breeding lines for an exploratory crossing programme. Such crosses have indicated that the trait is heritable and marked improvements in content can be achieved without also increasing alpha-acid content. Keywords : hop, breeding, xanthohumol, alpha-acid, varieties. Introduction There is currently much interest in the properties of the hop-derived prenylated flavanoid Xanthohumol for its effects in vitro on a range of mammalian cancers, both for prevention and treatment (Gerhauser et al, 2003). The compound is unique to hops and, therefore, hops would represent the primary economic raw material for the exploitation of the compound. The studies presented here aim to investigate the potential to increase the Xanthohumol content, as a single trait, by conventional, selective hop breeding. Such breeding requires the characteristic to have a high genotypic (varietal) component from both female and male parents, for there to be sufficient variability to allow useful selection, and for the trait to be heritable and identifiable in later generations. Methods All hop growing trials were carried out at HRI-Wye and samples were prepared and analysed by HPLC (Analytica-EBC methods 7.7 and 7.8 modified). Data were obtained from trials of eleven UK hop varieties over the period 1998-2002, including the most important in commercial production in the UK with the exception of cv. ‘Goldings‘ which, due to its sensitivity to hop mosaic virus, is not grown in plots at Wye. The hop variety collection at HRI-Wye, comprising UK, USA and European varieties, was surveyed in 1997 and the following season the population of female breeding lines in use within the hop improvement programme was assessed. Male breeding lines were assessed for the number of resin glands on the anthers, and flowers were harvested and dried from the line showing most numerous glands. Exploratory crosses were made in 1999 and the resulting progeny were raised and established in field plots for assessment and analysis in 2001.
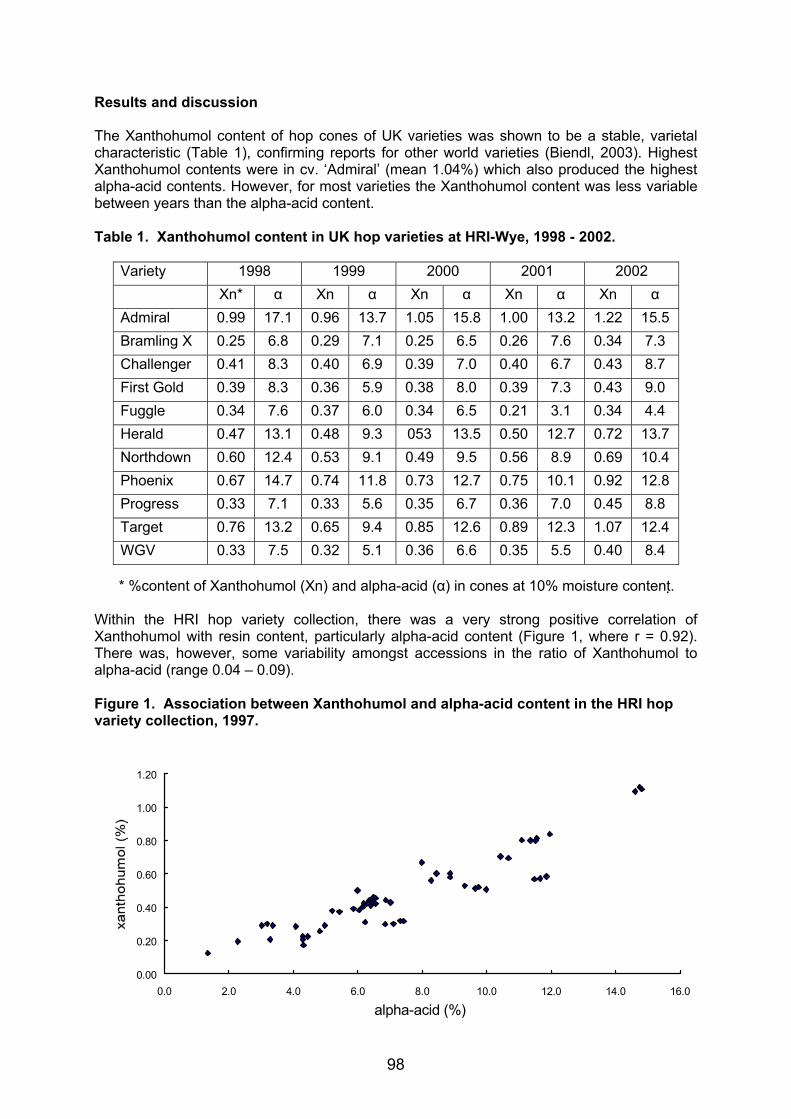
98
Results and discussion The Xanthohumol content of hop cones of UK varieties was shown to be a stable, varietal characteristic (Table 1), confirming reports for other world varieties (Biendl, 2003). Highest Xanthohumol contents were in cv. ‘Admiral’ (mean 1.04%) which also produced the highest alpha-acid contents. However, for most varieties the Xanthohumol content was less variable between years than the alpha-acid content. Table 1. Xanthohumol content in UK hop varieties at HRI-Wye, 1998 - 2002.
Variety 1998 1999 2000 2001 2002 Xn* α Xn α Xn α Xn α Xn α
Admiral 0.99 17.1 0.96 13.7 1.05 15.8 1.00 13.2 1.22 15.5 Bramling X 0.25 6.8 0.29 7.1 0.25 6.5 0.26 7.6 0.34 7.3 Challenger 0.41 8.3 0.40 6.9 0.39 7.0 0.40 6.7 0.43 8.7 First Gold 0.39 8.3 0.36 5.9 0.38 8.0 0.39 7.3 0.43 9.0 Fuggle 0.34 7.6 0.37 6.0 0.34 6.5 0.21 3.1 0.34 4.4 Herald 0.47 13.1 0.48 9.3 053 13.5 0.50 12.7 0.72 13.7 Northdown 0.60 12.4 0.53 9.1 0.49 9.5 0.56 8.9 0.69 10.4 Phoenix 0.67 14.7 0.74 11.8 0.73 12.7 0.75 10.1 0.92 12.8 Progress 0.33 7.1 0.33 5.6 0.35 6.7 0.36 7.0 0.45 8.8 Target 0.76 13.2 0.65 9.4 0.85 12.6 0.89 12.3 1.07 12.4 WGV 0.33 7.5 0.32 5.1 0.36 6.6 0.35 5.5 0.40 8.4
* %content of Xanthohumol (Xn) and alpha-acid (α) in cones at 10% moisture content. Within the HRI hop variety collection, there was a very strong positive correlation of Xanthohumol with resin content, particularly alpha-acid content (Figure 1, where r = 0.92). There was, however, some variability amongst accessions in the ratio of Xanthohumol to alpha-acid (range 0.04 – 0.09). Figure 1. Association between Xanthohumol and alpha-acid content in the HRI hop variety collection, 1997.
0.00
0.20
0.40
0.60
0.80
1.00
1.20
0.0 2.0 4.0 6.0 8.0 10.0 12.0 14.0 16.0
alpha-acid (%)
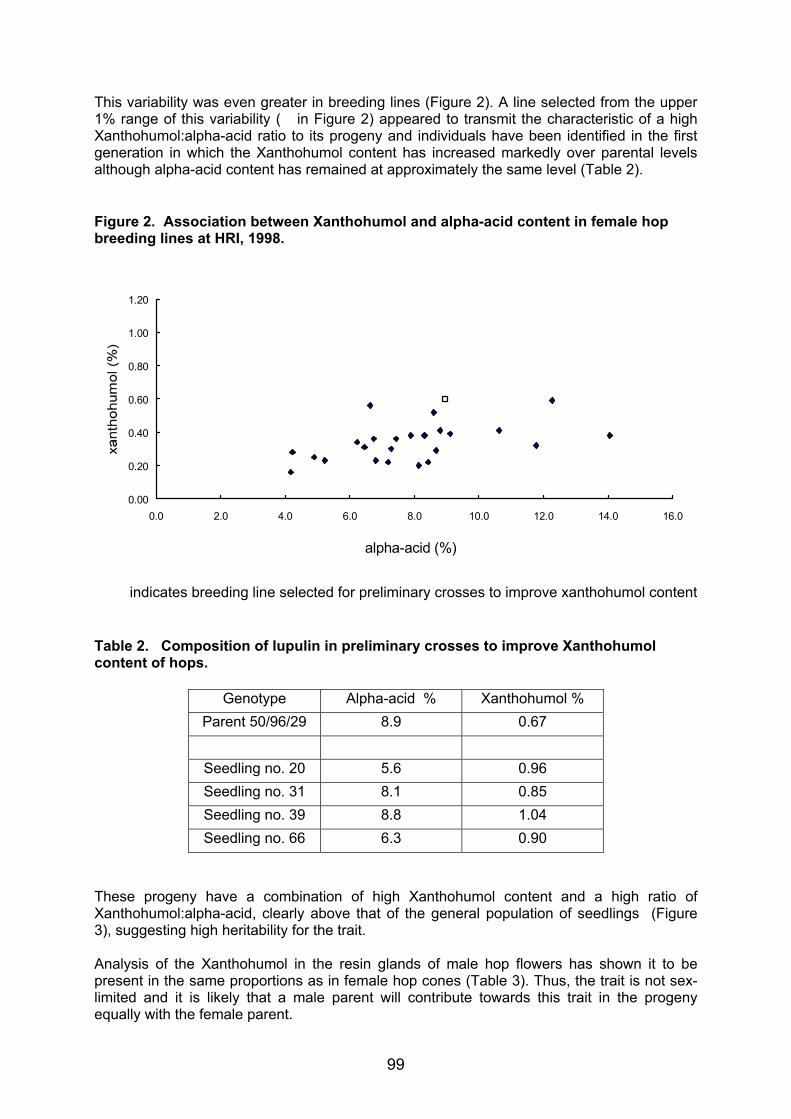
99
This variability was even greater in breeding lines (Figure 2). A line selected from the upper 1% range of this variability (� in Figure 2) appeared to transmit the characteristic of a high Xanthohumol:alpha-acid ratio to its progeny and individuals have been identified in the first generation in which the Xanthohumol content has increased markedly over parental levels although alpha-acid content has remained at approximately the same level (Table 2). Figure 2. Association between Xanthohumol and alpha-acid content in female hop breeding lines at HRI, 1998.
� indicates breeding line selected for preliminary crosses to improve xanthohumol content Table 2. Composition of lupulin in preliminary crosses to improve Xanthohumol content of hops.
Genotype Alpha-acid % Xanthohumol %
Parent 50/96/29 8.9 0.67
Seedling no. 20 5.6 0.96 Seedling no. 31 8.1 0.85 Seedling no. 39 8.8 1.04 Seedling no. 66 6.3 0.90
These progeny have a combination of high Xanthohumol content and a high ratio of Xanthohumol:alpha-acid, clearly above that of the general population of seedlings (Figure 3), suggesting high heritability for the trait. Analysis of the Xanthohumol in the resin glands of male hop flowers has shown it to be present in the same proportions as in female hop cones (Table 3). Thus, the trait is not sex-limited and it is likely that a male parent will contribute towards this trait in the progeny equally with the female parent.
0.00
0.20
0.40
0.60
0.80
1.00
1.20
0.0 2.0 4.0 6.0 8.0 10.0 12.0 14.0 16.0
alpha-acid (%)
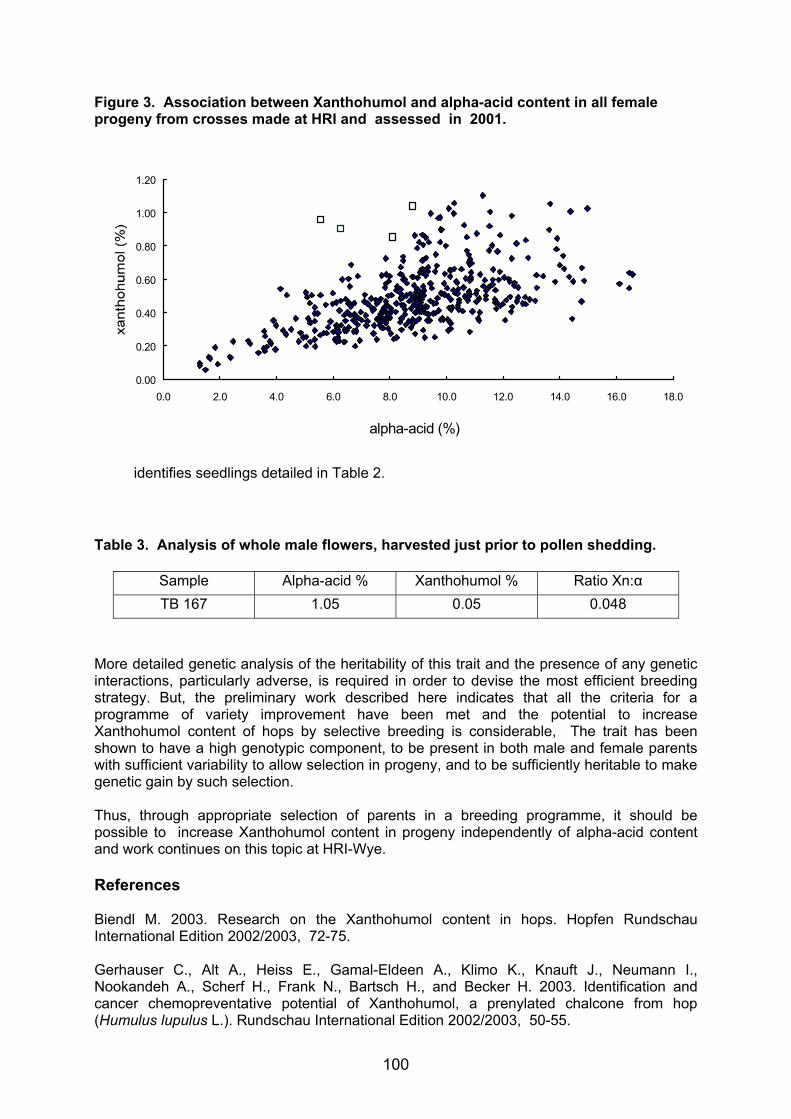
100
Figure 3. Association between Xanthohumol and alpha-acid content in all female progeny from crosses made at HRI and assessed in 2001.
� identifies seedlings detailed in Table 2. Table 3. Analysis of whole male flowers, harvested just prior to pollen shedding.
Sample Alpha-acid % Xanthohumol % Ratio Xn:α TB 167 1.05 0.05 0.048
More detailed genetic analysis of the heritability of this trait and the presence of any genetic interactions, particularly adverse, is required in order to devise the most efficient breeding strategy. But, the preliminary work described here indicates that all the criteria for a programme of variety improvement have been met and the potential to increase Xanthohumol content of hops by selective breeding is considerable, The trait has been shown to have a high genotypic component, to be present in both male and female parents with sufficient variability to allow selection in progeny, and to be sufficiently heritable to make genetic gain by such selection. Thus, through appropriate selection of parents in a breeding programme, it should be possible to increase Xanthohumol content in progeny independently of alpha-acid content and work continues on this topic at HRI-Wye. References Biendl M. 2003. Research on the Xanthohumol content in hops. Hopfen Rundschau International Edition 2002/2003, 72-75. Gerhauser C., Alt A., Heiss E., Gamal-Eldeen A., Klimo K., Knauft J., Neumann I., Nookandeh A., Scherf H., Frank N., Bartsch H., and Becker H. 2003. Identification and cancer chemopreventative potential of Xanthohumol, a prenylated chalcone from hop (Humulus lupulus L.). Rundschau International Edition 2002/2003, 50-55.
0.00
0.20
0.40
0.60
0.80
1.00
1.20
0.0 2.0 4.0 6.0 8.0 10.0 12.0 14.0 16.0 18.0
alpha-acid (%)
101
PRACTICAL KNOWLEDGE AND CRITERIA INFLUENCING EFFECTIVITY OF BREEDING PROCESS IN THE CR
V. Nesvadba Vladimír & K. Krofta
Hop Research Institute Co., LTD. Žatec, Czech Republic Abstract: Practical knowledge strongly influences breeding objectives. A very important feature of every variety is the stability of alpha bitter contents during hops growing process. High variability have varieties Sládek and Bor. On the contrary low variability was obtained in Premiant and Agnus. It is very important for a hop variety to show a good level of alpha bitter contents stability also within individual localities. Dynamics of ageing process is another very important feature. Different values of hop storage index (HSI) were assessed as well. The influence of individual compounds of hop resins on quality and taste of beer was studied too. It was found that higher contents of cohumulone increases utilization of brewing compounds and in this way intensity of beer bitterness are increased as well. Contents of prenyl flavonoids is another important feature. Prevalent share of xanthohumulone is typical. The richest on this compound are Taurus, Admiral and Agnus varieties (ca 1%). Vitality is another very important feature not only for hop producers but for hop growers as well. Productivity within multiplication process was assessed together with missing plants found out during spring stock-taking. Introduction
Hop breeding process is a very demanding work, which insures from the following three aspects. Hop (Humulus lupulus L.) is a dioecious plant and only female plants bear hop cones. Therefore male plants enter a crossing process as nearly unknown pollinator. High degree of heterogony complicates transmission of important features on posterity. The main economic features are polygenically based, which complicates not only the own breeding work but evaluation of obtained breeding materials as well (Nesvadba, 2001). Hop, as all perennial crops, is cultivated on the same plot for a long time. From this reason every hop breeder must take into his account the both demands, present ones and those ones, which will be necessary for the whole time of variety cultivation. Among them the practical demands, which will be the base of a new high quality variety for not only hop growers but hop trade, hop procession and brewing industry as well, are the most important. Knowledge concerning these necessary demands is very important for hop breeders because it creates the main breeding criteria, which can be in Czech Republic divided into the following five points:
1. Economic hop parameters. Direct demands on a new hop variety: hop yield, bitter acids contents, cultivation (pruning, grubbing, hilling up, picking, harvest time), resistance against pathogens belong there (Nesvadba, Krofta, 2002).
2. Influence of plots on hop growing. Influence of soil conditions, elevation above sea level and other outdoor conditions on productivity of new varieties. Choice of the most suitable varieties for individual localities (Nesvadba, Krofta, 2000).
3. Stability of productivity. Above all influence of climatic conditions on qualitative and quantitative parameters of new hop varieties. Suitability for storage and index of aging with the respect to the main methods of hops storage and processing of hops, decrease of alpha acids after harvest in dependence to a variety (Krofta et al., 1999).
4. Demands of brewing industry. Structure of hopping in individual breweries, utilization of individual types of hop products (pellets, extracts). Influence of individual hop resins, essential oils, polyphenols on beer quality (Nesvadba, 2003).
5. Prognosis in hop cultivation and utilization. Modernization of growing agro-technologies, development of brewing technologies, brewing demands - beer of the future, pharmacy.
In the paper are shown some practical pieces of knowledge, which strongly influence breeding demands on a new hop varieties in Czech Republic. It is necessary to say that only some pieces of knowledge are shown here. Certainly, there are a lot of breeding criteria within breeding work, which can differ in individual countries cultivating hops.
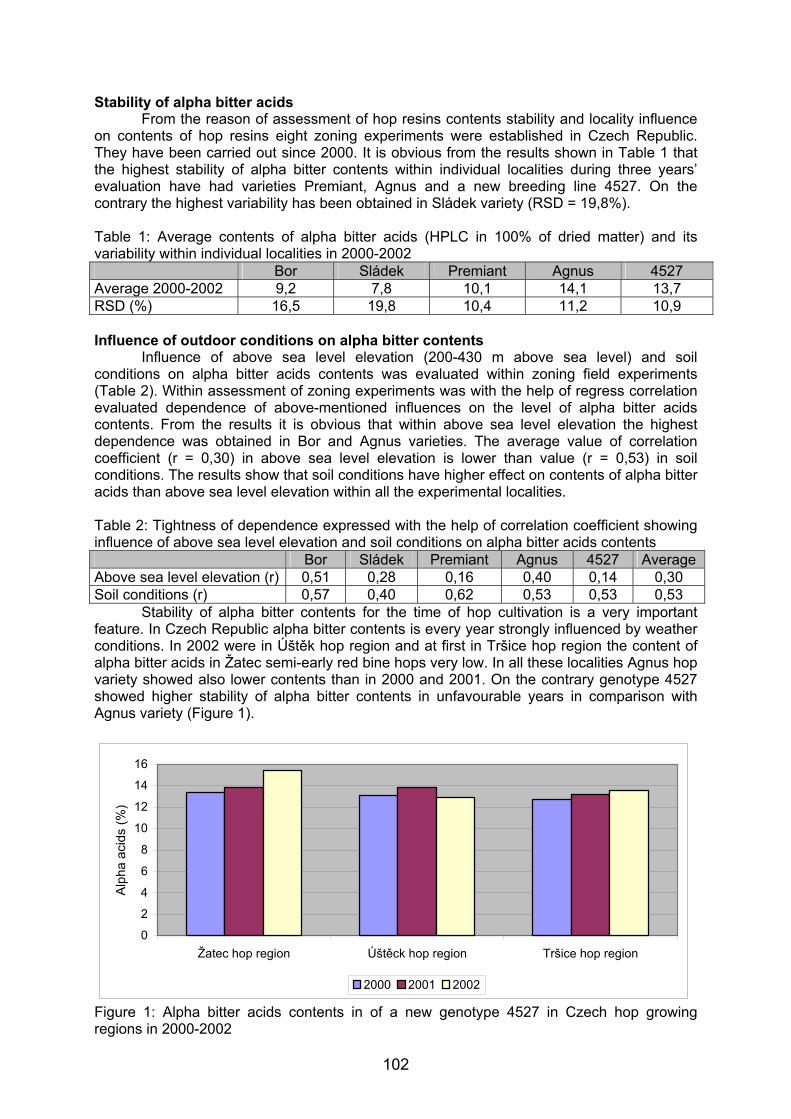
102
Stability of alpha bitter acids From the reason of assessment of hop resins contents stability and locality influence on contents of hop resins eight zoning experiments were established in Czech Republic. They have been carried out since 2000. It is obvious from the results shown in Table 1 that the highest stability of alpha bitter contents within individual localities during three years’ evaluation have had varieties Premiant, Agnus and a new breeding line 4527. On the contrary the highest variability has been obtained in Sládek variety (RSD = 19,8%). Table 1: Average contents of alpha bitter acids (HPLC in 100% of dried matter) and its variability within individual localities in 2000-2002 Bor Sládek Premiant Agnus 4527 Average 2000-2002 9,2 7,8 10,1 14,1 13,7 RSD (%) 16,5 19,8 10,4 11,2 10,9 Influence of outdoor conditions on alpha bitter contents Influence of above sea level elevation (200-430 m above sea level) and soil conditions on alpha bitter acids contents was evaluated within zoning field experiments (Table 2). Within assessment of zoning experiments was with the help of regress correlation evaluated dependence of above-mentioned influences on the level of alpha bitter acids contents. From the results it is obvious that within above sea level elevation the highest dependence was obtained in Bor and Agnus varieties. The average value of correlation coefficient (r = 0,30) in above sea level elevation is lower than value (r = 0,53) in soil conditions. The results show that soil conditions have higher effect on contents of alpha bitter acids than above sea level elevation within all the experimental localities. Table 2: Tightness of dependence expressed with the help of correlation coefficient showing influence of above sea level elevation and soil conditions on alpha bitter acids contents Bor Sládek Premiant Agnus 4527 Average Above sea level elevation (r) 0,51 0,28 0,16 0,40 0,14 0,30 Soil conditions (r) 0,57 0,40 0,62 0,53 0,53 0,53 Stability of alpha bitter contents for the time of hop cultivation is a very important feature. In Czech Republic alpha bitter contents is every year strongly influenced by weather conditions. In 2002 were in Úštěk hop region and at first in Tršice hop region the content of alpha bitter acids in Žatec semi-early red bine hops very low. In all these localities Agnus hop variety showed also lower contents than in 2000 and 2001. On the contrary genotype 4527 showed higher stability of alpha bitter contents in unfavourable years in comparison with Agnus variety (Figure 1).
0
2
4
6
8
10
12
14
16
Žatec hop region Úštěck hop region Tršice hop region
Alp
ha a
cids
(%)
2000 2001 2002
Figure 1: Alpha bitter acids contents in of a new genotype 4527 in Czech hop growing regions in 2000-2002
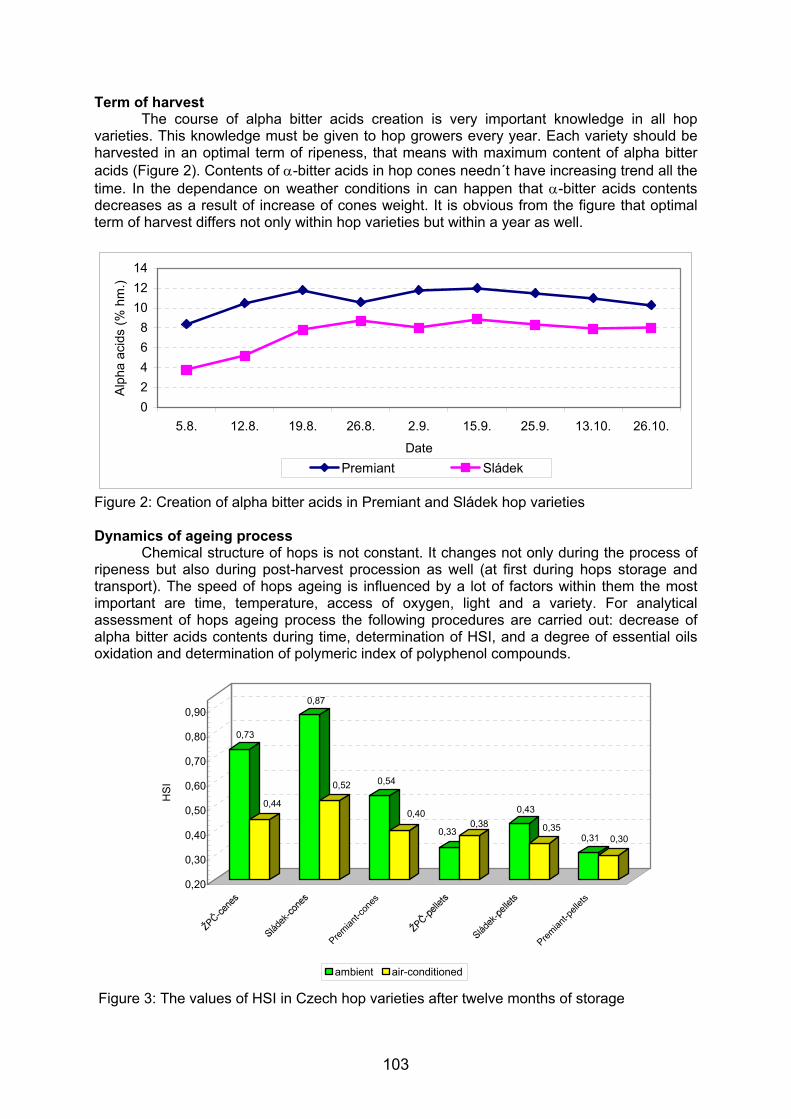
103
Term of harvest The course of alpha bitter acids creation is very important knowledge in all hop varieties. This knowledge must be given to hop growers every year. Each variety should be harvested in an optimal term of ripeness, that means with maximum content of alpha bitter acids (Figure 2). Contents of α-bitter acids in hop cones needn´t have increasing trend all the time. In the dependance on weather conditions in can happen that α-bitter acids contents decreases as a result of increase of cones weight. It is obvious from the figure that optimal term of harvest differs not only within hop varieties but within a year as well.
02468
101214
5.8. 12.8. 19.8. 26.8. 2.9. 15.9. 25.9. 13.10. 26.10.
Date
Alp
ha a
cids
(% h
m.)
Premiant Sládek
Figure 2: Creation of alpha bitter acids in Premiant and Sládek hop varieties Dynamics of ageing process Chemical structure of hops is not constant. It changes not only during the process of ripeness but also during post-harvest procession as well (at first during hops storage and transport). The speed of hops ageing is influenced by a lot of factors within them the most important are time, temperature, access of oxygen, light and a variety. For analytical assessment of hops ageing process the following procedures are carried out: decrease of alpha bitter acids contents during time, determination of HSI, and a degree of essential oils oxidation and determination of polymeric index of polyphenol compounds.
0,73
0,44
0,87
0,52 0,54
0,40
0,330,38
0,43
0,350,31 0,30
0,20
0,30
0,40
0,50
0,60
0,70
0,80
0,90
HS
I
Premian
t-con
es
Premian
t-pell
ets
ambient air-conditioned
Figure 3: The values of HSI in Czech hop varieties after twelve months of storage
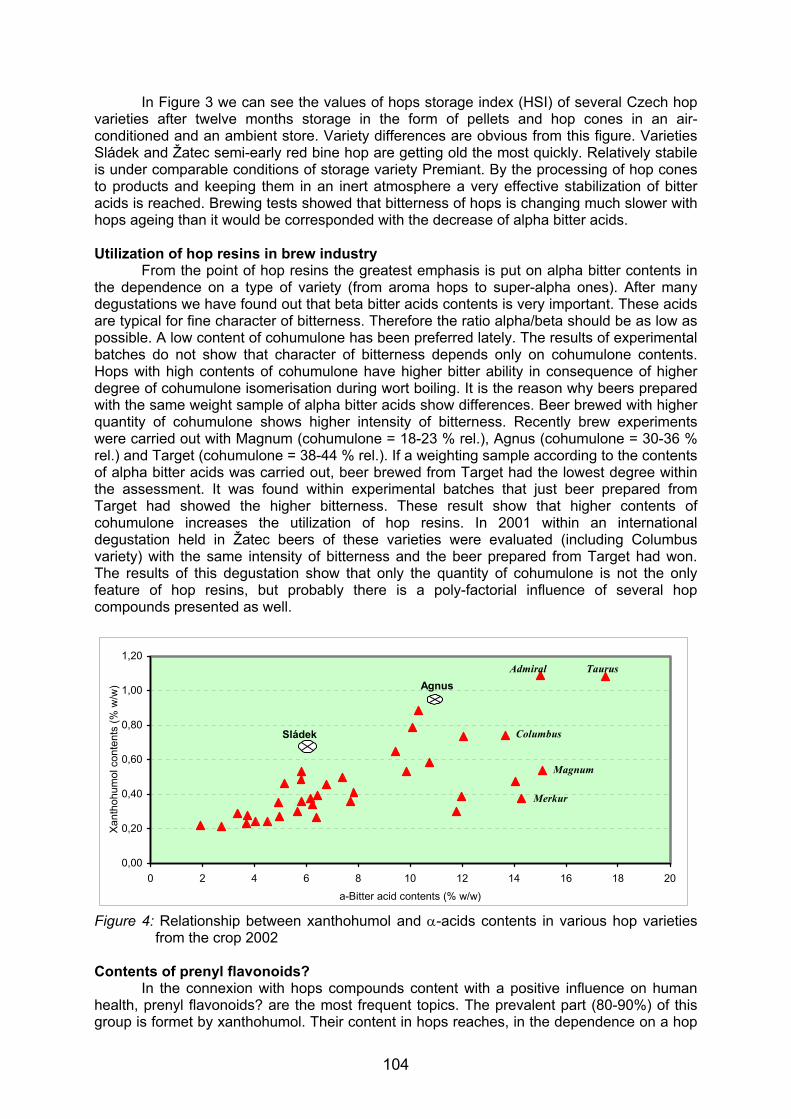
104
In Figure 3 we can see the values of hops storage index (HSI) of several Czech hop varieties after twelve months storage in the form of pellets and hop cones in an air-conditioned and an ambient store. Variety differences are obvious from this figure. Varieties Sládek and Žatec semi-early red bine hop are getting old the most quickly. Relatively stabile is under comparable conditions of storage variety Premiant. By the processing of hop cones to products and keeping them in an inert atmosphere a very effective stabilization of bitter acids is reached. Brewing tests showed that bitterness of hops is changing much slower with hops ageing than it would be corresponded with the decrease of alpha bitter acids. Utilization of hop resins in brew industry From the point of hop resins the greatest emphasis is put on alpha bitter contents in the dependence on a type of variety (from aroma hops to super-alpha ones). After many degustations we have found out that beta bitter acids contents is very important. These acids are typical for fine character of bitterness. Therefore the ratio alpha/beta should be as low as possible. A low content of cohumulone has been preferred lately. The results of experimental batches do not show that character of bitterness depends only on cohumulone contents. Hops with high contents of cohumulone have higher bitter ability in consequence of higher degree of cohumulone isomerisation during wort boiling. It is the reason why beers prepared with the same weight sample of alpha bitter acids show differences. Beer brewed with higher quantity of cohumulone shows higher intensity of bitterness. Recently brew experiments were carried out with Magnum (cohumulone = 18-23 % rel.), Agnus (cohumulone = 30-36 % rel.) and Target (cohumulone = 38-44 % rel.). If a weighting sample according to the contents of alpha bitter acids was carried out, beer brewed from Target had the lowest degree within the assessment. It was found within experimental batches that just beer prepared from Target had showed the higher bitterness. These result show that higher contents of cohumulone increases the utilization of hop resins. In 2001 within an international degustation held in Žatec beers of these varieties were evaluated (including Columbus variety) with the same intensity of bitterness and the beer prepared from Target had won. The results of this degustation show that only the quantity of cohumulone is not the only feature of hop resins, but probably there is a poly-factorial influence of several hop compounds presented as well.
0,00
0,20
0,40
0,60
0,80
1,00
1,20
0 2 4 6 8 10 12 14 16 18 20
a-Bitter acid contents (% w/w)
Xant
hohu
mol
con
tent
s (%
w/w
)
Taurus
Merkur
Magnum
Columbus
Admiral
Sládek
Agnus
Figure 4: Relationship between xanthohumol and α-acids contents in various hop varieties from the crop 2002 Contents of prenyl flavonoids? In the connexion with hops compounds content with a positive influence on human health, prenyl flavonoids? are the most frequent topics. The prevalent part (80-90%) of this group is formet by xanthohumol. Their content in hops reaches, in the dependence on a hop
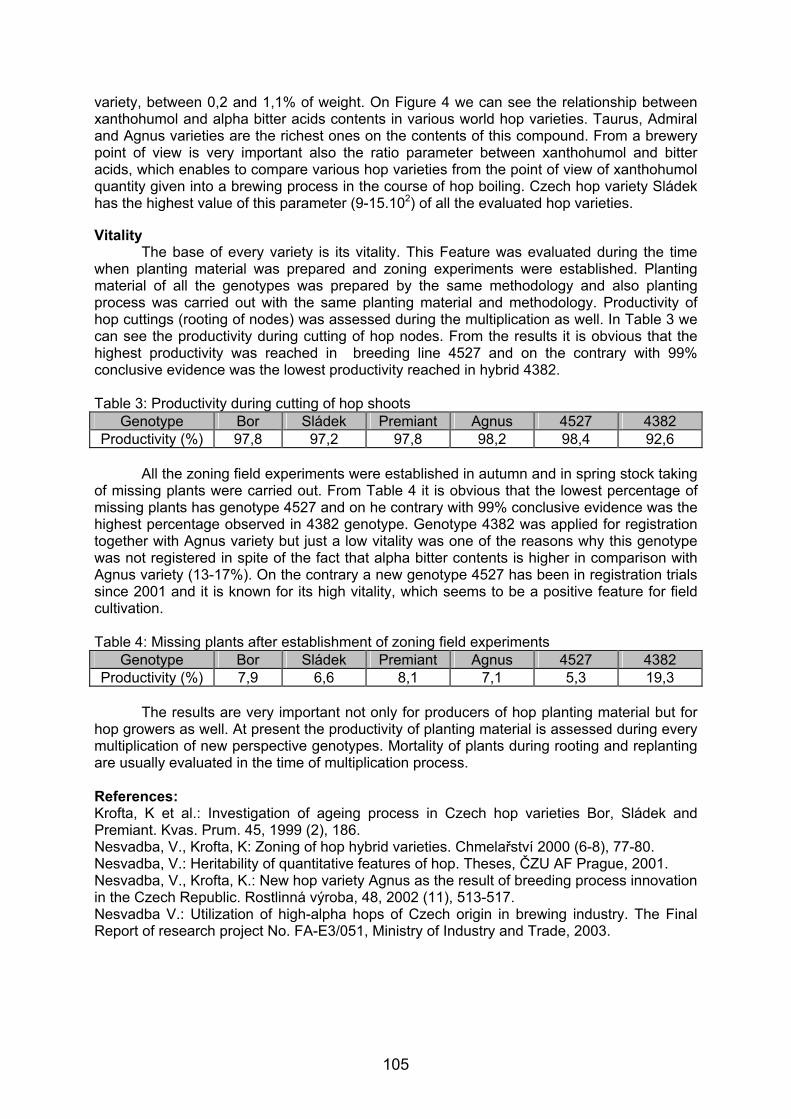
105
variety, between 0,2 and 1,1% of weight. On Figure 4 we can see the relationship between xanthohumol and alpha bitter acids contents in various world hop varieties. Taurus, Admiral and Agnus varieties are the richest ones on the contents of this compound. From a brewery point of view is very important also the ratio parameter between xanthohumol and bitter acids, which enables to compare various hop varieties from the point of view of xanthohumol quantity given into a brewing process in the course of hop boiling. Czech hop variety Sládek has the highest value of this parameter (9-15.102) of all the evaluated hop varieties. Vitality The base of every variety is its vitality. This Feature was evaluated during the time when planting material was prepared and zoning experiments were established. Planting material of all the genotypes was prepared by the same methodology and also planting process was carried out with the same planting material and methodology. Productivity of hop cuttings (rooting of nodes) was assessed during the multiplication as well. In Table 3 we can see the productivity during cutting of hop nodes. From the results it is obvious that the highest productivity was reached in breeding line 4527 and on the contrary with 99% conclusive evidence was the lowest productivity reached in hybrid 4382. Table 3: Productivity during cutting of hop shoots
Genotype Bor Sládek Premiant Agnus 4527 4382 Productivity (%) 97,8 97,2 97,8 98,2 98,4 92,6
All the zoning field experiments were established in autumn and in spring stock taking of missing plants were carried out. From Table 4 it is obvious that the lowest percentage of missing plants has genotype 4527 and on he contrary with 99% conclusive evidence was the highest percentage observed in 4382 genotype. Genotype 4382 was applied for registration together with Agnus variety but just a low vitality was one of the reasons why this genotype was not registered in spite of the fact that alpha bitter contents is higher in comparison with Agnus variety (13-17%). On the contrary a new genotype 4527 has been in registration trials since 2001 and it is known for its high vitality, which seems to be a positive feature for field cultivation. Table 4: Missing plants after establishment of zoning field experiments
Genotype Bor Sládek Premiant Agnus 4527 4382 Productivity (%) 7,9 6,6 8,1 7,1 5,3 19,3
The results are very important not only for producers of hop planting material but for hop growers as well. At present the productivity of planting material is assessed during every multiplication of new perspective genotypes. Mortality of plants during rooting and replanting are usually evaluated in the time of multiplication process. References: Krofta, K et al.: Investigation of ageing process in Czech hop varieties Bor, Sládek and Premiant. Kvas. Prum. 45, 1999 (2), 186. Nesvadba, V., Krofta, K: Zoning of hop hybrid varieties. Chmelařství 2000 (6-8), 77-80. Nesvadba, V.: Heritability of quantitative features of hop. Theses, ČZU AF Prague, 2001. Nesvadba, V., Krofta, K.: New hop variety Agnus as the result of breeding process innovation in the Czech Republic. Rostlinná výroba, 48, 2002 (11), 513-517. Nesvadba V.: Utilization of high-alpha hops of Czech origin in brewing industry. The Final Report of research project No. FA-E3/051, Ministry of Industry and Trade, 2003.
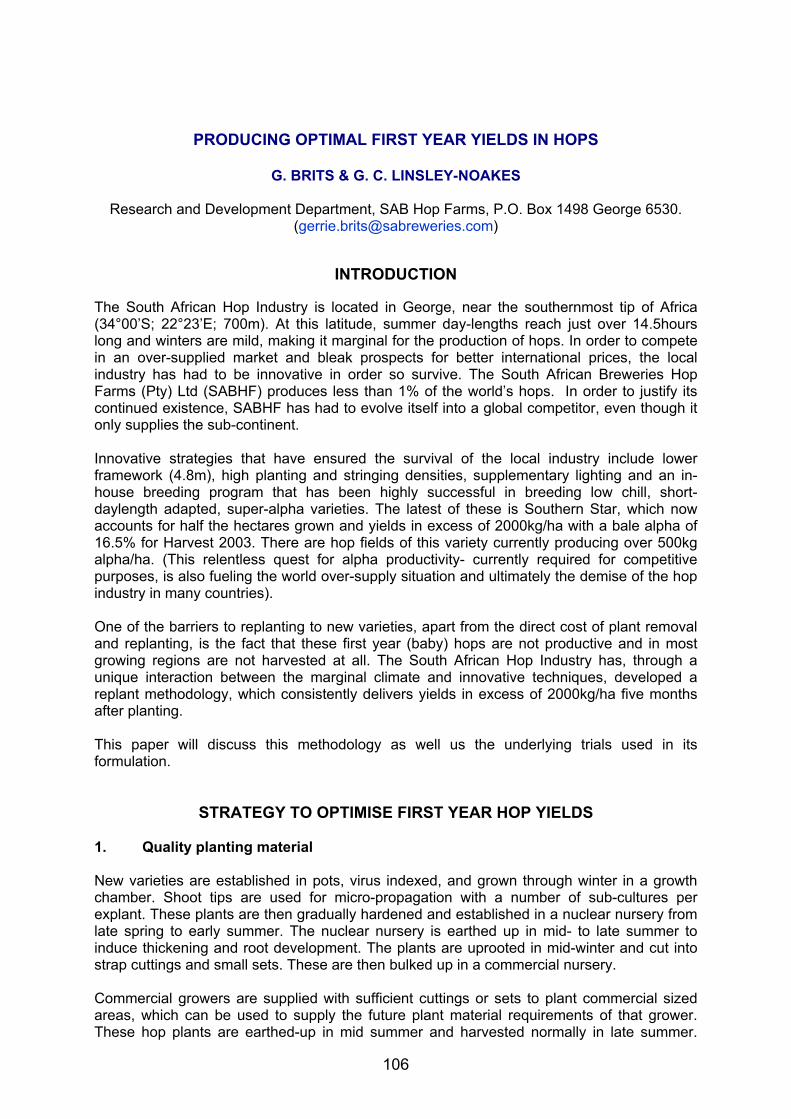
106
PRODUCING OPTIMAL FIRST YEAR YIELDS IN HOPS
G. BRITS & G. C. LINSLEY-NOAKES
Research and Development Department, SAB Hop Farms, P.O. Box 1498 George 6530. ([email protected])
INTRODUCTION The South African Hop Industry is located in George, near the southernmost tip of Africa (34°00’S; 22°23’E; 700m). At this latitude, summer day-lengths reach just over 14.5hours long and winters are mild, making it marginal for the production of hops. In order to compete in an over-supplied market and bleak prospects for better international prices, the local industry has had to be innovative in order so survive. The South African Breweries Hop Farms (Pty) Ltd (SABHF) produces less than 1% of the world’s hops. In order to justify its continued existence, SABHF has had to evolve itself into a global competitor, even though it only supplies the sub-continent. Innovative strategies that have ensured the survival of the local industry include lower framework (4.8m), high planting and stringing densities, supplementary lighting and an in-house breeding program that has been highly successful in breeding low chill, short-daylength adapted, super-alpha varieties. The latest of these is Southern Star, which now accounts for half the hectares grown and yields in excess of 2000kg/ha with a bale alpha of 16.5% for Harvest 2003. There are hop fields of this variety currently producing over 500kg alpha/ha. (This relentless quest for alpha productivity- currently required for competitive purposes, is also fueling the world over-supply situation and ultimately the demise of the hop industry in many countries). One of the barriers to replanting to new varieties, apart from the direct cost of plant removal and replanting, is the fact that these first year (baby) hops are not productive and in most growing regions are not harvested at all. The South African Hop Industry has, through a unique interaction between the marginal climate and innovative techniques, developed a replant methodology, which consistently delivers yields in excess of 2000kg/ha five months after planting. This paper will discuss this methodology as well us the underlying trials used in its formulation.
STRATEGY TO OPTIMISE FIRST YEAR HOP YIELDS
1. Quality planting material New varieties are established in pots, virus indexed, and grown through winter in a growth chamber. Shoot tips are used for micro-propagation with a number of sub-cultures per explant. These plants are then gradually hardened and established in a nuclear nursery from late spring to early summer. The nuclear nursery is earthed up in mid- to late summer to induce thickening and root development. The plants are uprooted in mid-winter and cut into strap cuttings and small sets. These are then bulked up in a commercial nursery. Commercial growers are supplied with sufficient cuttings or sets to plant commercial sized areas, which can be used to supply the future plant material requirements of that grower. These hop plants are earthed-up in mid summer and harvested normally in late summer.
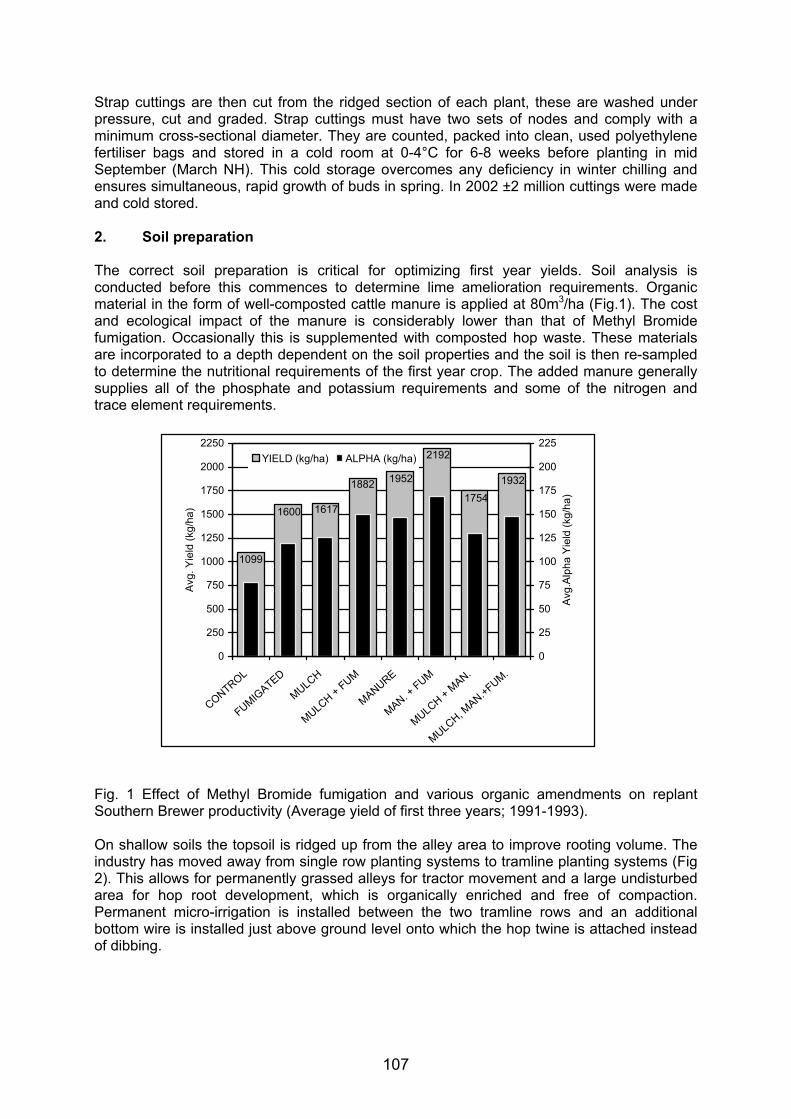
107
Strap cuttings are then cut from the ridged section of each plant, these are washed under pressure, cut and graded. Strap cuttings must have two sets of nodes and comply with a minimum cross-sectional diameter. They are counted, packed into clean, used polyethylene fertiliser bags and stored in a cold room at 0-4°C for 6-8 weeks before planting in mid September (March NH). This cold storage overcomes any deficiency in winter chilling and ensures simultaneous, rapid growth of buds in spring. In 2002 ±2 million cuttings were made and cold stored. 2. Soil preparation The correct soil preparation is critical for optimizing first year yields. Soil analysis is conducted before this commences to determine lime amelioration requirements. Organic material in the form of well-composted cattle manure is applied at 80m3/ha (Fig.1). The cost and ecological impact of the manure is considerably lower than that of Methyl Bromide fumigation. Occasionally this is supplemented with composted hop waste. These materials are incorporated to a depth dependent on the soil properties and the soil is then re-sampled to determine the nutritional requirements of the first year crop. The added manure generally supplies all of the phosphate and potassium requirements and some of the nitrogen and trace element requirements.
Fig. 1 Effect of Methyl Bromide fumigation and various organic amendments on replant Southern Brewer productivity (Average yield of first three years; 1991-1993). On shallow soils the topsoil is ridged up from the alley area to improve rooting volume. The industry has moved away from single row planting systems to tramline planting systems (Fig 2). This allows for permanently grassed alleys for tractor movement and a large undisturbed area for hop root development, which is organically enriched and free of compaction. Permanent micro-irrigation is installed between the two tramline rows and an additional bottom wire is installed just above ground level onto which the hop twine is attached instead of dibbing.
1099
1600 1617
1882 1952
2192
19321754
0
250
500
750
1000
1250
1500
1750
2000
2250
CONTROL
FUMIGATED
MULCH
MULCH + FUM
MANURE
MAN. + FUM
MULCH + M
AN.
MULCH, M
AN.+FUM.
Avg
. Yie
ld (k
g/ha
)
0
25
50
75
100
125
150
175
200
225
Avg
.Alp
ha Y
ield
(kg/
ha)
YIELD (kg/ha) ALPHA (kg/ha)
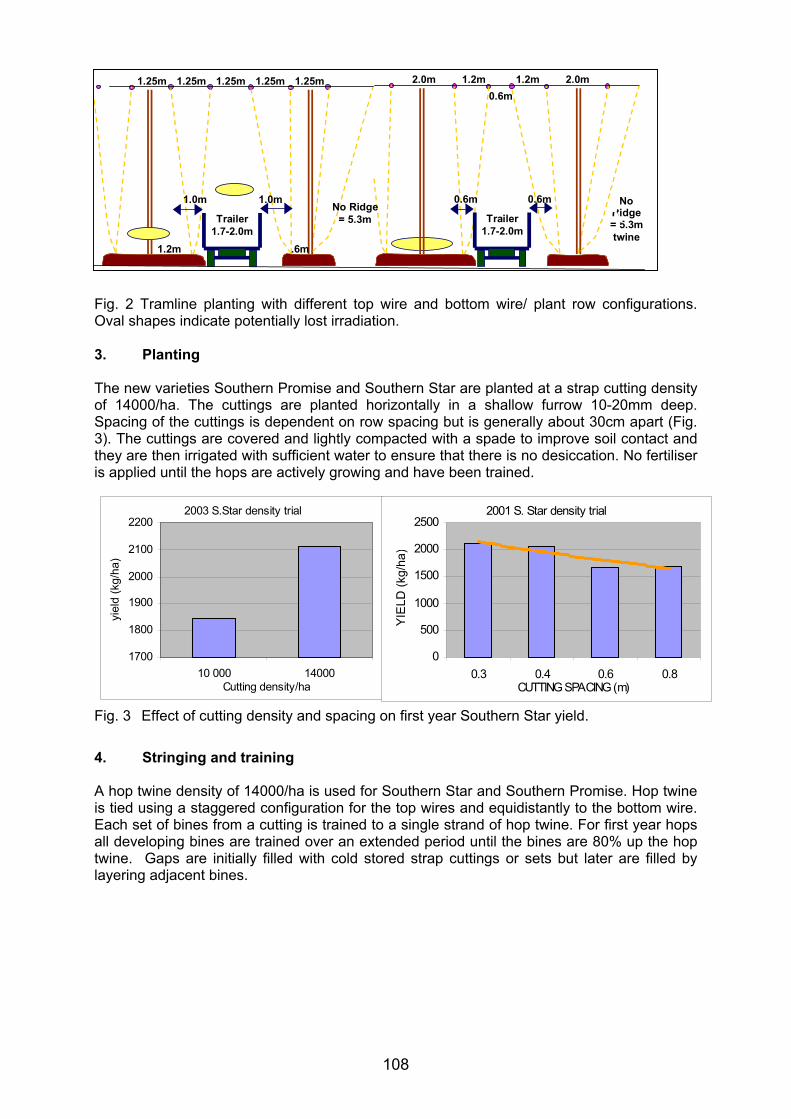
108
Fig. 2 Tramline planting with different top wire and bottom wire/ plant row configurations. Oval shapes indicate potentially lost irradiation. 3. Planting The new varieties Southern Promise and Southern Star are planted at a strap cutting density of 14000/ha. The cuttings are planted horizontally in a shallow furrow 10-20mm deep. Spacing of the cuttings is dependent on row spacing but is generally about 30cm apart (Fig. 3). The cuttings are covered and lightly compacted with a spade to improve soil contact and they are then irrigated with sufficient water to ensure that there is no desiccation. No fertiliser is applied until the hops are actively growing and have been trained.
Fig. 3 Effect of cutting density and spacing on first year Southern Star yield.
4. Stringing and training A hop twine density of 14000/ha is used for Southern Star and Southern Promise. Hop twine is tied using a staggered configuration for the top wires and equidistantly to the bottom wire. Each set of bines from a cutting is trained to a single strand of hop twine. For first year hops all developing bines are trained over an extended period until the bines are 80% up the hop twine. Gaps are initially filled with cold stored strap cuttings or sets but later are filled by layering adjacent bines.
2003 S.Star density trial
1700
1800
1900
2000
2100
2200
10 000 14000Cutting density/ha
yiel
d (k
g/ha
)
2001 S. Star density trial
0
500
1000
1500
2000
2500
0.3 0.4 0.6 0.8CUTTING SPACING (m)
YIE
LD (k
g/ha
)
2.0m 2.0m 1.2m 1.2m0.6m
Trailer1.7-2.0m
0.6m 0.6m No Ridge = 5.3m twine
1.25m 1.25m 1.25m 1.25m 1.25m
Trailer 1.7-2.0m
1.0m 1.0m No Ridge
= 5.3m
1.2m .6m
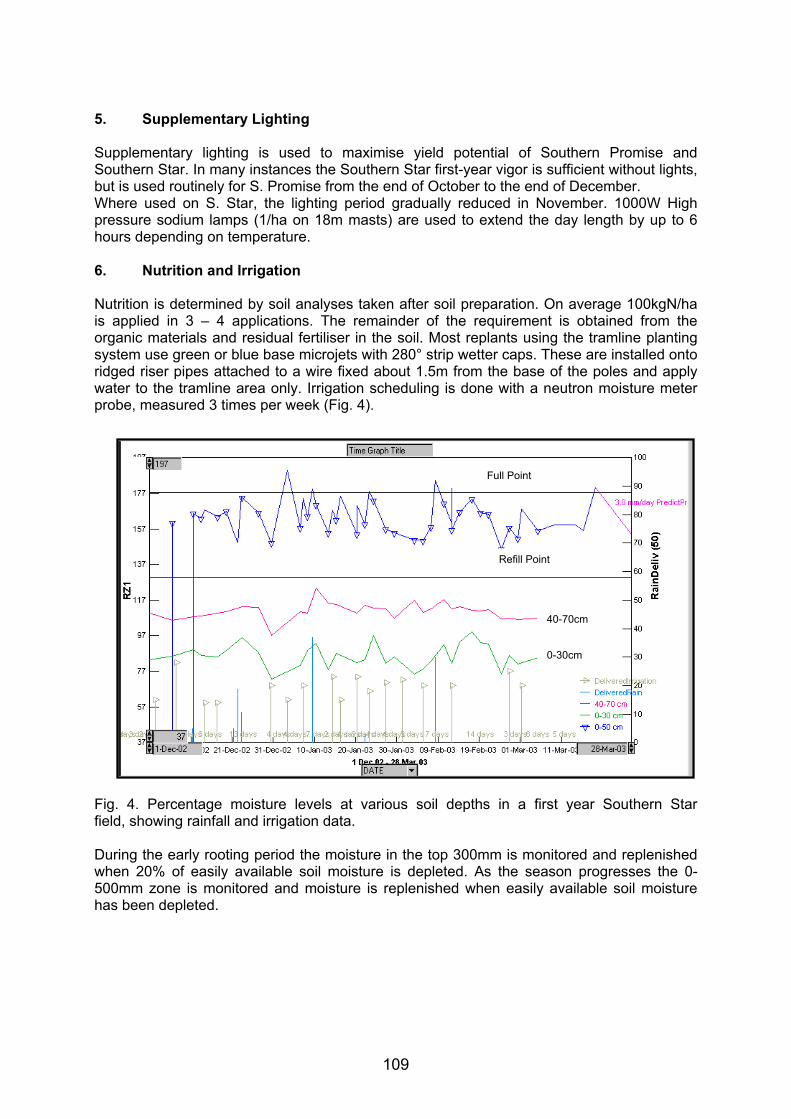
109
5. Supplementary Lighting
Supplementary lighting is used to maximise yield potential of Southern Promise and Southern Star. In many instances the Southern Star first-year vigor is sufficient without lights, but is used routinely for S. Promise from the end of October to the end of December. Where used on S. Star, the lighting period gradually reduced in November. 1000W High pressure sodium lamps (1/ha on 18m masts) are used to extend the day length by up to 6 hours depending on temperature. 6. Nutrition and Irrigation Nutrition is determined by soil analyses taken after soil preparation. On average 100kgN/ha is applied in 3 – 4 applications. The remainder of the requirement is obtained from the organic materials and residual fertiliser in the soil. Most replants using the tramline planting system use green or blue base microjets with 280° strip wetter caps. These are installed onto ridged riser pipes attached to a wire fixed about 1.5m from the base of the poles and apply water to the tramline area only. Irrigation scheduling is done with a neutron moisture meter probe, measured 3 times per week (Fig. 4).
Fig. 4. Percentage moisture levels at various soil depths in a first year Southern Star field, showing rainfall and irrigation data. During the early rooting period the moisture in the top 300mm is monitored and replenished when 20% of easily available soil moisture is depleted. As the season progresses the 0-500mm zone is monitored and moisture is replenished when easily available soil moisture has been depleted.
Full Point
Refill Point
40-70cm
0-30cm
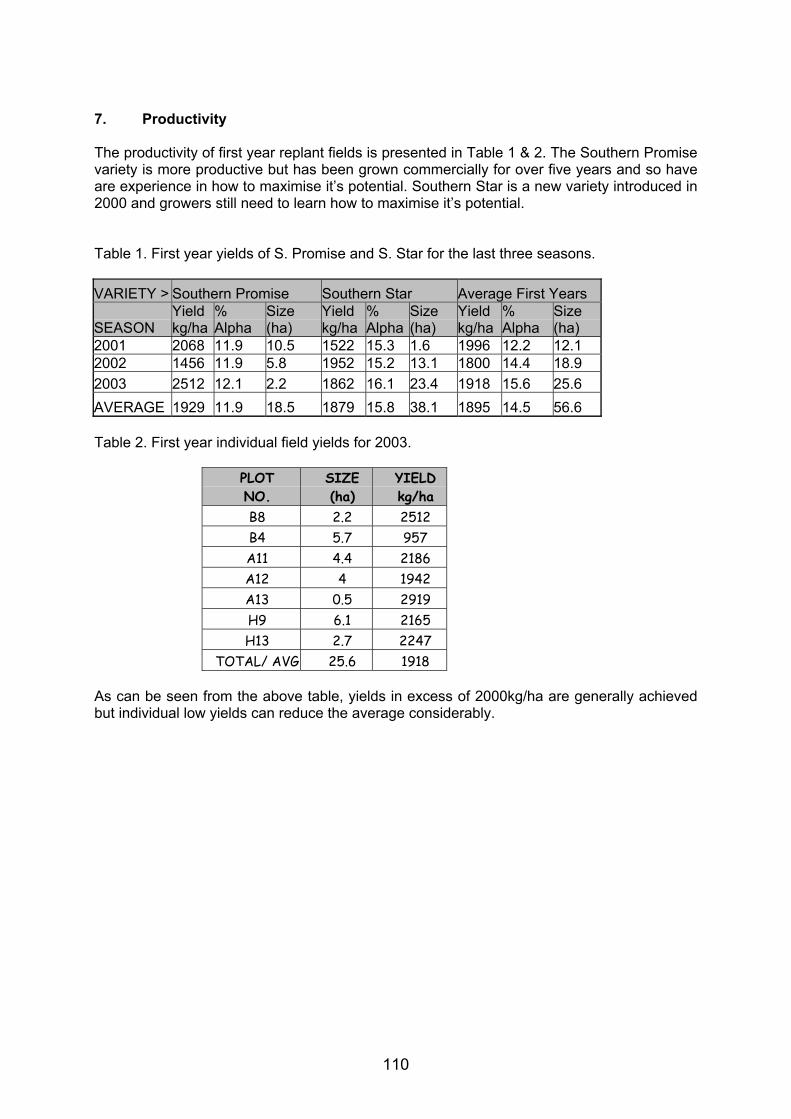
110
7. Productivity The productivity of first year replant fields is presented in Table 1 & 2. The Southern Promise variety is more productive but has been grown commercially for over five years and so have are experience in how to maximise it’s potential. Southern Star is a new variety introduced in 2000 and growers still need to learn how to maximise it’s potential. Table 1. First year yields of S. Promise and S. Star for the last three seasons. VARIETY > Southern Promise Southern Star Average First Years
SEASON Yield kg/ha
% Alpha
Size (ha)
Yield kg/ha
% Alpha
Size (ha)
Yield kg/ha
% Alpha
Size (ha)
2001 2068 11.9 10.5 1522 15.3 1.6 1996 12.2 12.1 2002 1456 11.9 5.8 1952 15.2 13.1 1800 14.4 18.9 2003 2512 12.1 2.2 1862 16.1 23.4 1918 15.6 25.6 AVERAGE 1929 11.9 18.5 1879 15.8 38.1 1895 14.5 56.6 Table 2. First year individual field yields for 2003.
PLOT NO.
SIZE (ha)
YIELD kg/ha
B8 2.2 2512 B4 5.7 957 A11 4.4 2186 A12 4 1942 A13 0.5 2919 H9 6.1 2165 H13 2.7 2247
TOTAL/ AVG 25.6 1918
As can be seen from the above table, yields in excess of 2000kg/ha are generally achieved but individual low yields can reduce the average considerably.
111
OBJECTIVE ASSESSMENT OF HOP QUALITY
Roland Schmidt, Angelika Köberlein and Adrian Forster NATECO2 GmbH & Co. KG, Auenstrasse 18-20, 85283 Wolnzach, Germany
Abstract During weighing-in and certification samples are taken from all German hop lots for the "Independent Quality Assessment". The examination of the samples includes chemical and physical methods. Besides moisture content and proportion of bracteoles the hop lots are examined for attacks of pests and diseases. This entails a visual inspection of the samples. At the same time the inspector differentiates between shades of green and brown. The subjective appraisal can be influenced by many different factors. Although the light under which the samples are assessed can to some extent be standardized, it is not possible to calibrate the inspectors. From this it can be deduced that an objectified assessment of the stages of infestation is desirable. The present work is aimed at improving the reproducibility of determining the degree of infestation with a photographic measuring unit. For this the Scanalyzer from Lemnatec was used. With the measuring unit, first of all a digital photo is made of a hop sample, approximately the size of a DIN A4 sheet, under standardized conditions. This photo is stored as a real picture. From the more than 16 million colours relevant shades from the real picture are grouped into colour grades. The software assigns undefined colours to the existing colour grades. By this means e.g. the shades of green of the healthy cone material, the shades of brown of the infested parts of the cones and the shades of yellow of the lupulin can be grouped into colour grades. With the definition of the colour grades the measuring unit is calibrated. The software reduces the information of the real picture and in the next step evaluates the photo according to the colour grades occurring. The evaluation of the colour grade picture is made by calculating the proportional areas of the individual colour grades. From this it is possible to calculate the degree of infested surface in the hop sample. Corresponding to the proportional area of infested cone material the hop sample is assigned to an infestation stage. Real picture and colour grade picture, as well as the evaluation of the colour grades by surface area can easily be stored in archives, the data set takes up approx. 1 MB memory space per sample. The measuring results for the area infested can be reproduced very well. In an experiment numerous hop samples, which had already been appraised, were tested with the Scanalyzer. The values of infestation measured in the form of brown areas can be reproduced considerably better than the corresponding subjective appraisals by hand. The experiments allow the conclusion that more plausible results are achieved. In particular runaways in a subjective appraisal which are ascertained time and time again are avoided. The Scanalyzer provides the evaluation for a sample within 1-2 minutes, i.e. in about the same time needed for a conventional appraisal. It is planned to test the measuring unit on the 2003 crop in the Hallertau.
112
USE OF HPLC IN COMBINATION WITH DIFFERENT CHEMOMETRIC METHODS FOR THE DETERMINATION OF HOP VARIETIES
I. J. Košir 1, M. Kač 1,2
1Institute for Hop Research and Brewing Žalec, C. Žalskega tabora 2, SI-3310 Žalec, Slovenia
2Department of Food Science and Technology, Biotechnical Faculty, University of Ljubljana, Jamnikarjeva 101, SI-1111 Ljubljana, Slovenia
Different chemometric methods were applied to distinguish groups of hop varieties most commonly present in Slovenia and to classify individual hop samples. 33 hop samples from different hop growing regions in Slovenia, represented six varieties (Bobek, Celeia, Aurora, Sav. Golding, Taurus, and Magnum) were included in the study. The amounts of alfa- and beta-acids, ratios between co-humulone and total amount of alfa-acids and co-lupulone and beta-acids, ratios between total amounts of alfa-and beta-acids and the lead conductance values of hops determined according to the instructions in Metods 7.7 and 7.4 in Analytica EBC (1) were used as the input parameters to different chemometric methods. Principal Component Analysis (PCA) and Hierarchical clustering (HC) were used as the examples of unsupervised methods to find out the importance of particular input parameter to the grouping of samples. PCA and HC both gave comparable results for the separation of hop samples according to the varieties. In the case of PCA the best grouping was obtained by the use of variance instead of covariance, while in the case of HC the best results were obtained by the use of Euclidean distances and Ward's linkage. Both PCA and HC methods give the final results of 100 % correct grouping. As the representative of supervised chemometric methods Linear Discriminant Analysis (LDA) and Regulised Discriminant Analysis (RDA) were used. The models obtained from the application of both methods gave 100 % correct classification and also the prediction ability of the built models, determined with the test set method was very good.
1) Analytica - EBC, European Brewery Convention, Verlag Hans Carl Getränke-Fachverlag, Nürnberg, Germany, 1998.
113
NITRATES IN HOP CONES AND BEER
D. Majer & M. Virant Institute of hop research and brewing Žalec, Žalskega tabora 2, 3310 Žalec, Slovenia
During the last decade a lot of Slovene hop-growers attention was focused on ecologically balanced production of hop and on introduction of the system of hazard analysis and critical control points (HACCP). One of the most important components in defining critical control points for beer is also the control of plant nutrition. It reflects trough the influence of different nutrition levels in the quality of beer as the final product. The contents of nitrates in hop cones can vary a lot. Different quantities of added nitrogen fertilizers can result in higher or lower content of nitrates in the beer. In our research the influence of different quantities of nitrogen (0, 50, 100, 150, 200, 250, 300, 350, 400, 450, 500 in 600 kg /ha) on the quantity of nitrates in cones and in beer was investigated. For the experiment the cones of Slovenian hop cultivars Savinjski golding and Aurora were used. The nitrogen was added in three equal portions in the last decade of may, in the middle of June and in the first decade of July respectively. In the state of technological maturity the water content with gravimetric method, the content of alpha acids with conductometric method (Analytica-EBC, 1987) and the content of nitrates with HPLC method (Donhauser et al, 1989) were defined. For beer making the wort from industrial production with 12 % of extract was used. In the wort the analysis of nitrates content with liquid chromatography (HPLC) with UV-VIS detector by 205 nm was made (Kač et al, 1996). Hopping lasted 90 minutes. The quantity of hop which was added to wort was calculated on addition 100 mg of alpha acids per one litre and distributed into three equal portions added successively. In the hopping wort the analysis of nitrates content was made by the same method as in the wort. A real input of nitrates in hopping wort was calculated by standard formula (Hops and Hops Product, 1997). The fermentation of hopping wort lasted seven days under the procedure of classical bottom fermentation. After that the beer aginged in the still for 14 days. In the beer the analysis of nitrate content was made and real and theoretical input of nitrates with hop cones were calculated by standard formula (Hops and Hops Product, 1997). We found out that the content of nitrates in cones from nonfertilized trials was lower than in cones from fertilized trials. The average content of nitrates in the cones from nonfertilized trials of Savinjski golding was only 76 mg /100 g of dry cones but the average in the cones from fertilized trials was 1300 mg/100 g of dry cones. The cones of nonfertilized Aurora had in average 491 mg/100 g of dry cones and the cones from fertilized Aurora had about 1460 mg/100 g of dry cones. The content of nitrates in cones was mainly increased with higher portion of nitrogen. The differences are statistically significant. The influence of nitrogen fertilization on nitrate content in beer is more difficult to evaluate because the content of nitrates in beer is the total sum of nitrates contributed by wort (water, malt) and hop. The real input of nitrates in beer was lower by hopping with cones from nonfertilized trials in comparation to fertilized trials (by Savinjski golding in average for 50 % and by Aurora for 38 %). In most trials higher portion of nitrogen increased nitrates content in beer. Different portions of nitrogen and different contents of nitrates in cones had more significant influence on the content of nitrates in beer by cultivar Aurora. By Savinjski golding the differences between trials were less significant. Considerable differences were found in comparison between real and theoretical input of nitrates into beer.
114
CERTIFICATION SCHEME FOR THE PRODUCTION OF HOP PLANTING MATERIAL IN SLOVENIA
N. Ferant1, V. Knapic2, M. Pecnik2, S. Radisek1, M. Rak-Cizej1, K. Matjaz-Petek1
1Slovenian Institute of Hop Research and Brewing; 2Ministry of Agriculture, Forestry and Food, Ljubljana, Slovenia ([email protected])
Satisfactory results in the cultivation of hop (Humulus lupulus L.) depend to a large extent on the quality and plant health of the material used for their propagation and of the hop plants intended for hop production. The determination of plant health and quality standards for hop reproductive material was set by EPPO standard PM 4/16. EU Member States applied different schemes for pathogen-tested material of hop, but on EU level there is no directive, regulating growing and marketing of hop propagating material and hop plants intended for hop production. This is an unusual situation, if having in mind firstly that hop propagation is vegetative and secondly that an EU directive exists on certification of hop yield. New certification scheme for hop propagating material and hop plants for planting has been prescribed in Slovenia in 2003. The main reason is occurrence and spread of progressive (lethal) form of hop wilt, caused by a new pathotype of Verticillium albo-atrum. Implementing regulation was prepared on the basis of the Agricultural Seeds and Propagating Material Act and the Plant Health Act which implemented Council Directive 2000/29/EC on protective measures against the introduction into the Community of organisms harmful to plants or plant products and against their spread within the Community. Determination of plant health and quality standards for hops required detailed technical and scientific consideration. In the certification scheme for the production of certified pathogen-tested material of hop, the successive steps described by EPPO scheme (EPPO, 1999) have been mostly taken. The subject of official certification are hop plants, intended for further propagation or for sale, which are vegetatively propagated and obtained from selected candidate material after several propagation stages under conditions ensuring that stated health standards are met. The virus and/or viroid elimination is included, if necessary. The filiation of the material is considered throughout the scheme with a view to maintaining the identity of the variety and to preventing harmful organisms:
- First category of propagating material is pre-basic material which has been produced from candidate material according to generally accepted methods (in vitro).
- Second category is basic material which has been produced either directly or in second stage in a vegetative way from pre-basic material (in vitro or in vivo) and which is intended for the production of third category: certified material (EPPO, 1998).
Hop propagating material and certified plants for planting are officially examined and declared virus-tested, meaning to be found free of specific viruses and virus-like pathogens reducing the usefulness of the propagating material and plants for planting, or again virus-free, meaning to be found free of all known viruses and virus-like pathogens, listed in the annex. The established hop certification scheme in Slovenia will ensure that purchasers throughout the Community receive propagating material and plants for planting which are healthy and of good quality. To avoid creation of barriers to trade and thus hinder the free movement of hop plants for planting within the Community there is a need to harmonize conditions at Community level. Literature: Agricultural Seeds and Propagating Material Act, Official gazette of RS 58/02 Plant Healt Act, Official gazette of Republic of Slovenia 45/01 EPPO (1998) Nursery requirements – Recomended requirements for establishments participating in certification of fruit or ornamental crops - PM 4/7(1) EPPO (1999) Certification schemes: Pathogen-tested material of hop. PM 4/16(1)
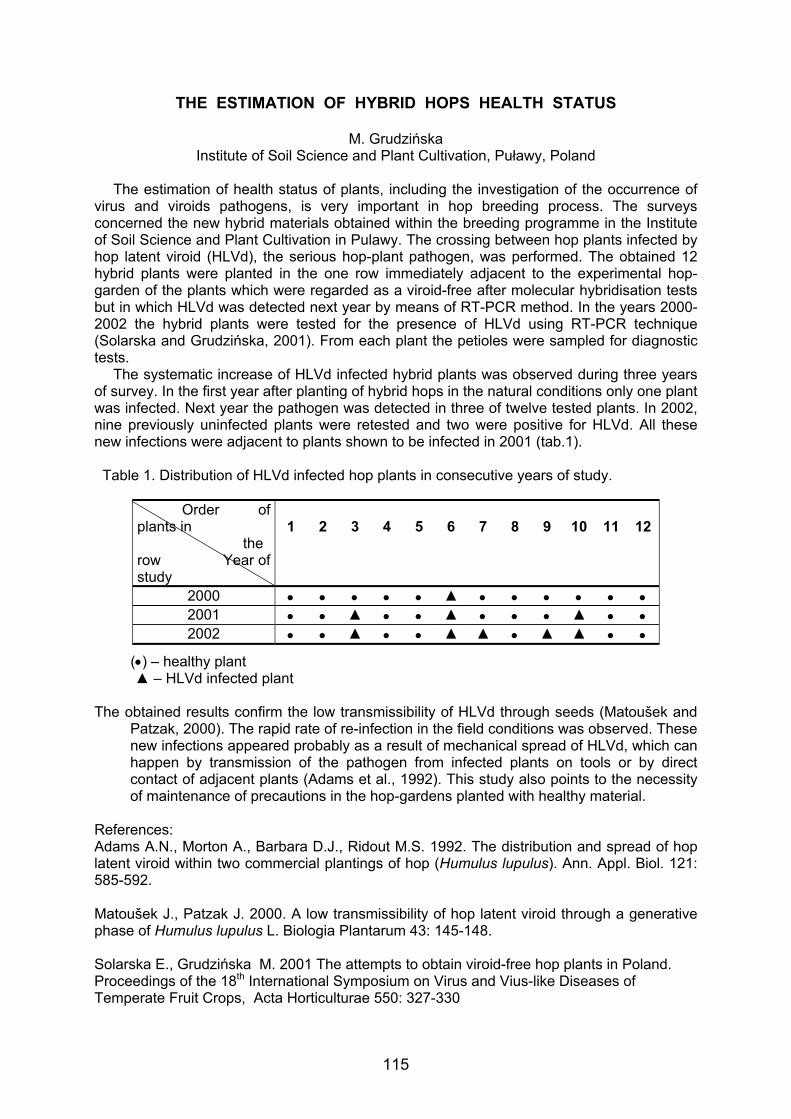
115
THE ESTIMATION OF HYBRID HOPS HEALTH STATUS
M. Grudzińska Institute of Soil Science and Plant Cultivation, Puławy, Poland
The estimation of health status of plants, including the investigation of the occurrence of
virus and viroids pathogens, is very important in hop breeding process. The surveys concerned the new hybrid materials obtained within the breeding programme in the Institute of Soil Science and Plant Cultivation in Pulawy. The crossing between hop plants infected by hop latent viroid (HLVd), the serious hop-plant pathogen, was performed. The obtained 12 hybrid plants were planted in the one row immediately adjacent to the experimental hop-garden of the plants which were regarded as a viroid-free after molecular hybridisation tests but in which HLVd was detected next year by means of RT-PCR method. In the years 2000-2002 the hybrid plants were tested for the presence of HLVd using RT-PCR technique (Solarska and Grudzińska, 2001). From each plant the petioles were sampled for diagnostic tests.
The systematic increase of HLVd infected hybrid plants was observed during three years of survey. In the first year after planting of hybrid hops in the natural conditions only one plant was infected. Next year the pathogen was detected in three of twelve tested plants. In 2002, nine previously uninfected plants were retested and two were positive for HLVd. All these new infections were adjacent to plants shown to be infected in 2001 (tab.1). Table 1. Distribution of HLVd infected hop plants in consecutive years of study.
(•) – healthy plant ▲ – HLVd infected plant The obtained results confirm the low transmissibility of HLVd through seeds (Matoušek and
Patzak, 2000). The rapid rate of re-infection in the field conditions was observed. These new infections appeared probably as a result of mechanical spread of HLVd, which can happen by transmission of the pathogen from infected plants on tools or by direct contact of adjacent plants (Adams et al., 1992). This study also points to the necessity of maintenance of precautions in the hop-gardens planted with healthy material.
References: Adams A.N., Morton A., Barbara D.J., Ridout M.S. 1992. The distribution and spread of hop latent viroid within two commercial plantings of hop (Humulus lupulus). Ann. Appl. Biol. 121: 585-592. Matoušek J., Patzak J. 2000. A low transmissibility of hop latent viroid through a generative phase of Humulus lupulus L. Biologia Plantarum 43: 145-148. Solarska E., Grudzińska M. 2001 The attempts to obtain viroid-free hop plants in Poland. Proceedings of the 18th International Symposium on Virus and Vius-like Diseases of Temperate Fruit Crops, Acta Horticulturae 550: 327-330
Order of plants in the row Year of study
1
2
3
4
5
6
7
8
9
10
11
12
2000 • • • • • ▲ • • • • • • 2001 • • ▲ • • ▲ • • • ▲ • • 2002 • • ▲ • • ▲ ▲ • ▲ ▲ • •
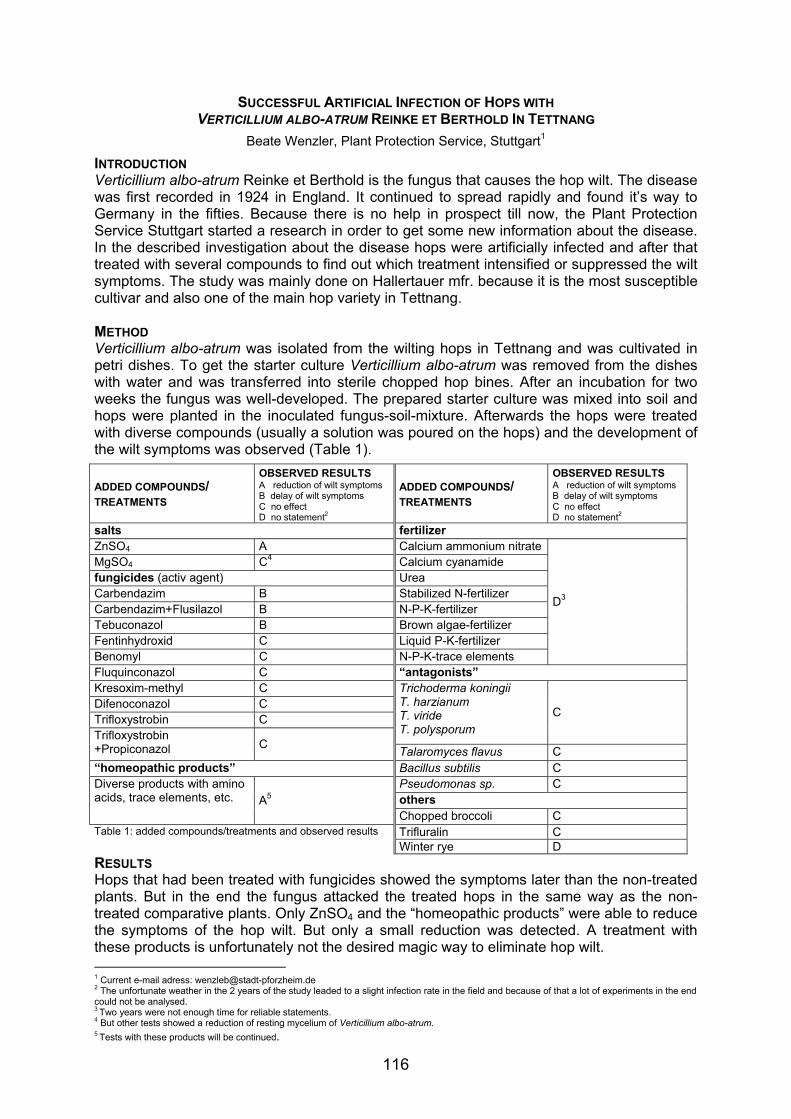
116
SUCCESSFUL ARTIFICIAL INFECTION OF HOPS WITH VERTICILLIUM ALBO-ATRUM REINKE ET BERTHOLD IN TETTNANG
Beate Wenzler, Plant Protection Service, Stuttgart1
INTRODUCTION Verticillium albo-atrum Reinke et Berthold is the fungus that causes the hop wilt. The disease was first recorded in 1924 in England. It continued to spread rapidly and found it’s way to Germany in the fifties. Because there is no help in prospect till now, the Plant Protection Service Stuttgart started a research in order to get some new information about the disease. In the described investigation about the disease hops were artificially infected and after that treated with several compounds to find out which treatment intensified or suppressed the wilt symptoms. The study was mainly done on Hallertauer mfr. because it is the most susceptible cultivar and also one of the main hop variety in Tettnang. METHOD Verticillium albo-atrum was isolated from the wilting hops in Tettnang and was cultivated in petri dishes. To get the starter culture Verticillium albo-atrum was removed from the dishes with water and was transferred into sterile chopped hop bines. After an incubation for two weeks the fungus was well-developed. The prepared starter culture was mixed into soil and hops were planted in the inoculated fungus-soil-mixture. Afterwards the hops were treated with diverse compounds (usually a solution was poured on the hops) and the development of the wilt symptoms was observed (Table 1).
ADDED COMPOUNDS/ TREATMENTS
OBSERVED RESULTS A reduction of wilt symptoms B delay of wilt symptoms C no effect D no statement2
ADDED COMPOUNDS/ TREATMENTS
OBSERVED RESULTS A reduction of wilt symptoms B delay of wilt symptoms C no effect D no statement2
salts fertilizer ZnSO4 A Calcium ammonium nitrateMgSO4 C4 Calcium cyanamide fungicides (activ agent) Urea Carbendazim B Stabilized N-fertilizer Carbendazim+Flusilazol B N-P-K-fertilizer Tebuconazol B Brown algae-fertilizer Fentinhydroxid C Liquid P-K-fertilizer Benomyl C N-P-K-trace elements
D3
Fluquinconazol C “antagonists” Kresoxim-methyl C Difenoconazol C Trifloxystrobin C
Trichoderma koningii T. harzianum T. viride T. polysporum
C
Trifloxystrobin +Propiconazol C Talaromyces flavus C “homeopathic products” Bacillus subtilis C
Pseudomonas sp. C others
Diverse products with amino acids, trace elements, etc. A5
Chopped broccoli C Trifluralin C Table 1: added compounds/treatments and observed results Winter rye D
RESULTS Hops that had been treated with fungicides showed the symptoms later than the non-treated plants. But in the end the fungus attacked the treated hops in the same way as the non-treated comparative plants. Only ZnSO4 and the “homeopathic products” were able to reduce the symptoms of the hop wilt. But only a small reduction was detected. A treatment with these products is unfortunately not the desired magic way to eliminate hop wilt. 1 Current e-mail adress: [email protected] 2 The unfortunate weather in the 2 years of the study leaded to a slight infection rate in the field and because of that a lot of experiments in the end could not be analysed. 3 Two years were not enough time for reliable statements. 4 But other tests showed a reduction of resting mycelium of Verticillium albo-atrum. 5 Tests with these products will be continued.
117
HOP VIROIDS, HLVd AND HSVd, PLASTICITY OF QUASIFORMS AFTER NATURAL AND BIOLISTIC INFECTIONS
J. Matoušek*, L. Orctová*, J. Patzak** and P. Svoboda**,
*IPMB AS CR, Branišovská 31, České Budějovice, CZ-370 05, Czech Republic
*Hop Institute GmbH, Kadaňská 2525, Žatec, CZ-438 46, Czech Republic Molecular analysis of two hop viroids, HSVd and HLVd is performed with respect to their variability and ability to infect various wild plant species potentially important for viroid spreading and microevolution. While HLVd was referred to have the host range limited to hop, HSVd forms very invasive group with many molecular variants or quasispecies and ability to infect various plant species. Recent analyses (Matoušek J. e.a.:Virology 287:349, 2001) show, however, that HLVd forms quasispecies, too, providing its replication under temperature stress. Moreover, that certain thermomutants of HLVd can undergo microevolution in Solanaceous species forming "low level" populations (Matoušek J.:Biol. Plant., 46: 607, 2003). Hence, in principle, under certain conditions both these viroids could have some potential to propagate in various wild plant species, perhaps forming "low level" populations representing latent danger for various hop genotypes and other crops. To investigate this possibility, biolistic methods for viroid transfer as infectious cDNAs and RNAs were developed. It was found that a minute amount of viroid RNA is sufficient for viroid infection by this approach, which is about 1000x more efficient than classical inoculation. HSVd variants that were collected from grapevines surrounding hopgardens (Matoušek e. a.:Plant Soil Environ. 49:168, 2003) were easily transmissible to hop, in which it promotes severe symptoms and developmental distortions. Using TGGE and cDNA heteroduplex analysis, we found that at least 70 % of grapevine samples from locations close to hopgardens in Northern Bohemia [Žatec and Úštěk growing areas], but also in Slovenia [Žalec growing area] were infected with HSVd forming populations containing quasispecies. Particular variant of HSVd corresponding to AC E01844 was experimentally transmissible from these samples to Czech hop Osvald's 72 also by classical mechanical inoculation. This means that hop viroids represent potential danger in natural conditions and have to be systematically monitored. Analysis of HLVd and HSVd propagation in approx. 15 wild species collected in hopgarden agrobiotype is in progress.
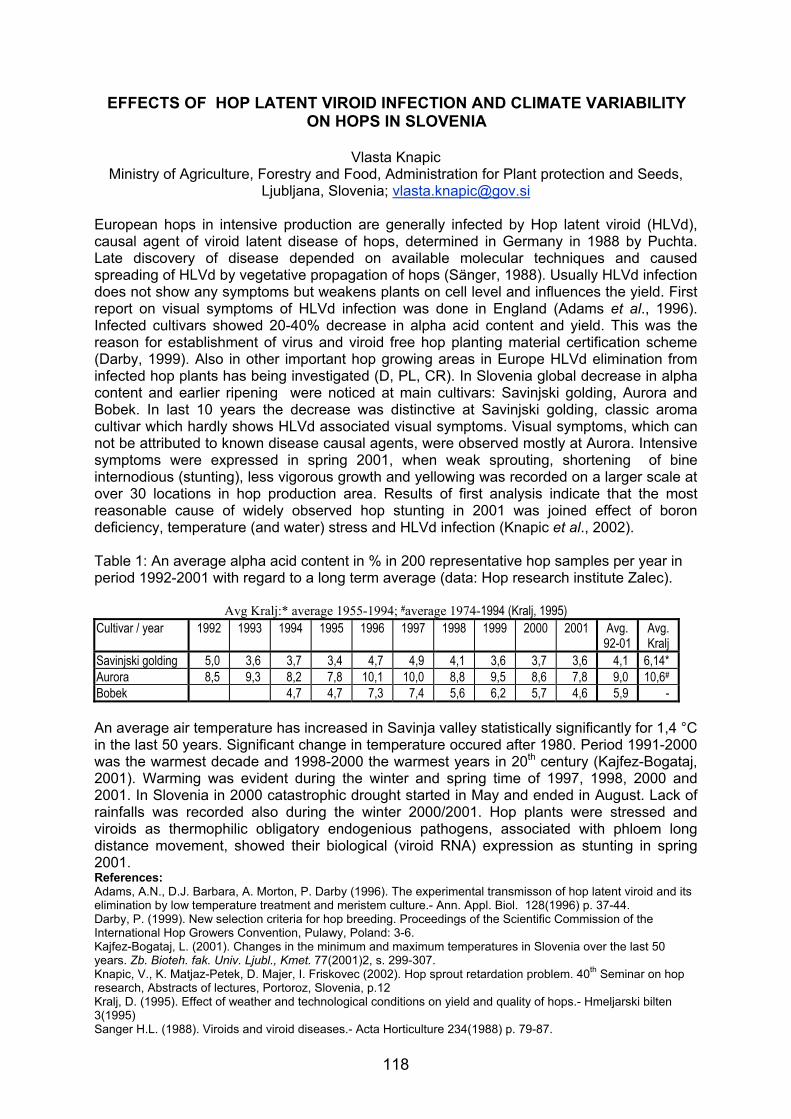
118
EFFECTS OF HOP LATENT VIROID INFECTION AND CLIMATE VARIABILITY ON HOPS IN SLOVENIA
Vlasta Knapic
Ministry of Agriculture, Forestry and Food, Administration for Plant protection and Seeds, Ljubljana, Slovenia; [email protected]
European hops in intensive production are generally infected by Hop latent viroid (HLVd), causal agent of viroid latent disease of hops, determined in Germany in 1988 by Puchta. Late discovery of disease depended on available molecular techniques and caused spreading of HLVd by vegetative propagation of hops (Sänger, 1988). Usually HLVd infection does not show any symptoms but weakens plants on cell level and influences the yield. First report on visual symptoms of HLVd infection was done in England (Adams et al., 1996). Infected cultivars showed 20-40% decrease in alpha acid content and yield. This was the reason for establishment of virus and viroid free hop planting material certification scheme (Darby, 1999). Also in other important hop growing areas in Europe HLVd elimination from infected hop plants has being investigated (D, PL, CR). In Slovenia global decrease in alpha content and earlier ripening were noticed at main cultivars: Savinjski golding, Aurora and Bobek. In last 10 years the decrease was distinctive at Savinjski golding, classic aroma cultivar which hardly shows HLVd associated visual symptoms. Visual symptoms, which can not be attributed to known disease causal agents, were observed mostly at Aurora. Intensive symptoms were expressed in spring 2001, when weak sprouting, shortening of bine internodious (stunting), less vigorous growth and yellowing was recorded on a larger scale at over 30 locations in hop production area. Results of first analysis indicate that the most reasonable cause of widely observed hop stunting in 2001 was joined effect of boron deficiency, temperature (and water) stress and HLVd infection (Knapic et al., 2002). Table 1: An average alpha acid content in % in 200 representative hop samples per year in period 1992-2001 with regard to a long term average (data: Hop research institute Zalec).
Avg Kralj:* average 1955-1994; #average 1974-1994 (Kralj, 1995) Cultivar / year 1992 1993 1994 1995 1996 1997 1998 1999 2000 2001 Avg.
92-01 Avg. Kralj
Savinjski golding 5,0 3,6 3,7 3,4 4,7 4,9 4,1 3,6 3,7 3,6 4,1 6,14* Aurora 8,5 9,3 8,2 7,8 10,1 10,0 8,8 9,5 8,6 7,8 9,0 10,6# Bobek 4,7 4,7 7,3 7,4 5,6 6,2 5,7 4,6 5,9 - An average air temperature has increased in Savinja valley statistically significantly for 1,4 °C in the last 50 years. Significant change in temperature occured after 1980. Period 1991-2000 was the warmest decade and 1998-2000 the warmest years in 20th century (Kajfez-Bogataj, 2001). Warming was evident during the winter and spring time of 1997, 1998, 2000 and 2001. In Slovenia in 2000 catastrophic drought started in May and ended in August. Lack of rainfalls was recorded also during the winter 2000/2001. Hop plants were stressed and viroids as thermophilic obligatory endogenious pathogens, associated with phloem long distance movement, showed their biological (viroid RNA) expression as stunting in spring 2001. References: Adams, A.N., D.J. Barbara, A. Morton, P. Darby (1996). The experimental transmisson of hop latent viroid and its elimination by low temperature treatment and meristem culture.- Ann. Appl. Biol. 128(1996) p. 37-44. Darby, P. (1999). New selection criteria for hop breeding. Proceedings of the Scientific Commission of the International Hop Growers Convention, Pulawy, Poland: 3-6. Kajfez-Bogataj, L. (2001). Changes in the minimum and maximum temperatures in Slovenia over the last 50 years. Zb. Bioteh. fak. Univ. Ljubl., Kmet. 77(2001)2, s. 299-307. Knapic, V., K. Matjaz-Petek, D. Majer, I. Friskovec (2002). Hop sprout retardation problem. 40th Seminar on hop research, Abstracts of lectures, Portoroz, Slovenia, p.12 Kralj, D. (1995). Effect of weather and technological conditions on yield and quality of hops.- Hmeljarski bilten 3(1995) Sanger H.L. (1988). Viroids and viroid diseases.- Acta Horticulture 234(1988) p. 79-87.
119
VARIABILITY OF CHITINASE GENES IN WORLD HOP (HUMULUS LUPULUS L.) GENETIC RESOURCES
Josef Patzak
Hop Research Institute Co. Ltd., Kadaňská 2525, 438 46 Žatec, Czech Republic,
Tel: +420 415 732109, Fax: +420 415 732150, E-mail: [email protected]
Abstract
Chitinase [EC 3.2.1.14] is an enzyme, which catalyzes the hydrolysis of β-1,4 linkages of the N-acetyl-D-glucosamine polymer chitin, a component of fungal cell walls and exoskeleton of insects, which is not know to occur naturally in plants. It has been suggested that enzyme may play a role in defence against plant pathogens (Yeboah et al., 1998). Chitinases have been grouped into different classes on the basis of their primary structure. The class I, II and IV chitinases have homologous catalytic domains and correspond to glycosyl hydrolase family 19, while class III and V chitinases belong to glycosyl hydrolase family 18 (Suarez et al., 2001). One chitinase gene (AF147497) of class I was also sequenced and characterized in hop (Humulus lupulus L.) genome of cv. Zenith, which belongs to powdery mildew resistance hops (Henning and Moore, 1999).
In our work, we have studied presence, variability and expression of this chitinase gene in world hop genetic resources. We found the presence of this chitinase gene in 68 world hop cultivars, which were analyzed. Three individual alleles, which differed in sequences of intron 2, were characterized. Allele B was similar to known chitinase gene (AF147497) of cv. Zenith, which contains only this allele in genome, similar as cvs. Premiant (CR), Pride of Ringwood (Australia) and Lubelski (Poland). Shorter allele A were alone contained in genome of 12 cultivars (Target (UK), Aurora (Slovenia), Merkur (FRG), Agnus (CR) for example). Longer allele C were alone contained in genome of cvs. Galena, Columbus (USA) and Southern Brewer (South Africa). All three allele combinations were found in world hop genetic resources. Combination A+B was the most numerous in 35 cultivars (mainly European genotypes). Combination A+C was represented in 11 cultivars (mainly American genotypes). Combination B+C was represented only in Brewers Gold (UK), Blisk and Atlas (Slovenia). Group dividing did not correlate with resistance to fungal diseases, only slightly with breeding origin. RFLP analysis detected that there are from two to four copies of this chitinase gene in hop genome. Physical localization of individual gene copies did not correspond with individual alleles in cultivars.
It is known that chitinase activity is induced and associated with stress and wound responses in plants. Different expression and complex regulation suggest also physiological role for chitinase during plant growth and development (Lawton et al., 1992). In our preliminary experiments, we found no expression of this gene in healthy in vitro plants and different expression in individual hop genotypes during season in field conditions.
The author wishes to give special thanks to the National Agency for Agricultural Research of the Ministry of Agriculture of the Czech Republic for supporting this research in project No. QC1336.
Henning J.A., Moore D.L. (1999) Hop chitinase gene. http//www.ncbi.nlm.nih.gov/genbank. Lawton K., Ward E., Payne G., Moyer M., Ryals J. (1992) Acidic and basic class III chitinase
mRNA accumulation in responce to TMV infection of tobacco. Plant Molecular Biology 19: 735-743.
Suarez V., Staehelin C., Arango R., Holtorf H., Hofsteenge J., Meins F. jr. (2001) Substrate specificity and antifungal activity of recombinant tobacco class I chitinases. Plant Molecular Biology 45: 609-618.
Yeboah N.A., Arahira M., Nong V.H., Zhang D., Kadokura K., Watanabe A., Fukazawa C. (1998) A class III acidic endochitinase is specifically expressed in the developing seeds of soybean (Glycine max [L. ] Merr.). Plant Molecular Biology 36: 407-415.
120
GENETIC ENGINEERING OF HOP (HUMULUS LUPULUS L.)
H. Radic-Miehle and E. Seigner Bayerische Landesanstalt für Landwirtschaft, Institut für Pflanzenbau und Pflanzenzüchtung,
IPZ 5c, Am Gereuth 8, D-85354 Freising, Deutschland Tel. +49 (0)8161 71-4069; Fax: +49 (0)8161 71-5227;
E-mail: [email protected] There are considerable advantages in gene transfer compared to classical breeding procedures: single genes may be transferred fast and specifically into an existing cultivar for the improvement of resistance performance without changing quality traits. Furthermore, genes from beyond typical genetic resources, i.e. wild hops, may be transferred without cross-breeding limitations. Routinely used gene transfer methods are being presented: indirect and direct gene transfer by Agrobacterium tumefaciens and gene gun, respectively. Both methods have been applied in hops (Oriniakova & Matousek, 1996; Becker, 2000; Batista et al., 2001; Horlemann & Weber, 2001), but have to be followed by a successful regeneration of transgenic hop plantlets from internode calli. Here we present the first transfer experiments and results, where selection markers (e.g. resistance to an antibiotic) as well as reporter genes (e.g. uidA gene for GUS enzyme assay) have successfully been transferred into cv. ‘Saazer’ and cv. ’Hallertauer Mittelfrüh’. Both cultivars have regenerated plants. Plants of cv. ‘Saazer’ are being cultivated in greenhouse since February 2003 while plants of the cv. ’Hallertauer Mittelfrüh’ are in the process of in vitro culture. Figures are presented how transgenic tissues are detected in hops by GUS enzyme assay and by polymerase chain reaction (PCR). Stable GUS expression was detected in ‘Saazer’ even after some generations of cloning as well as in the greenhouse. No chimeras were observed as described before (Oriniakova & Matousek, 1996). The final objective of gene transfer in hops is the improvement of resistance to fungal pathogens. After adaptation of transformation protocols, genes coding for pathogen resistance will be transferred into both cultivars in the near future. Acknowledgements The funding of this research project by the Bavarian State Ministry for Agronomy and Forestry is gratefully acknowledged. Special thanks are to Ms B. Haugg and Ms P. Hartberger for their excellent technical assistance. References:
• Batista D,Sousa MJ & Pais MS (2001) Improving hop (Humulus lupulus L.) for resistance against fungi. IHGC Proceedings, Aug 5-7 2001, Canterbury, Kent, England. p. 16
• Becker J (2000) Untersuchungen zur in vitro Regeneration und genetischen Transformation von Hopfen (Humulus lupulus L.). Dissertation, Universität Kaiserslautern, Kaiserlautern, Germany
• Horlemann C & Weber G (2001) Towards the regeneration and transformation of hop. IHGC Proceedings, Aug 5-7 2001, Canterbury, Kent, England. pp. 12-15
• Oriniakova P & Matousek J (1996) Viroid infection of hop (Humulus lupulus L.) mediated by Agrobacterium tumefaciens and conditions for hop transformation. Rostl Výr 52:233-239
121
POPULATION DYNAMICS OF Phorodon humuli (Schrank, 1801) (Hemiptera, Aphididae) ON HOPS IN LEÓN (SPAIN) DURING 2002
A. Lorenzana1, A. Hermoso de Mendoza2, A. Pérez3, A. Magadán4 , M. V. Seco3
1: Laboratorio de Diagnóstico-Fundación Chicarro-Canseco-Banciella E.S.T.I.A.-Universidad de León -24071- León
2: Instituto Valenciano de Investigaciones Agrarias -46113- Moncada (Valencia) 3: E.S.T.I. Agraria- Universidad de León -24071- León
4: Sociedad Anónima Española de Fomento del Lúpulo -24270- Villanueva de Carrizo (León) The aim of this work is to study the population dynamics of Phorodon humuli on hop plants treated at different times. Six groups of plants treated with imidacloprid were established, making three randomly distributed repetitions in blocks in three subplots (1, edge of the yard; 2, intermediate; 3, inside). Sampling consisted of counting the number of aphids inside a wooden frame (20x30 cm) placed on the plant surface at 2m, 3.25m and 6m (leaves, and also cones during August). Number of aphids per m² of plant surface was measured weekly. Natural enemies were identified in the yard and/or in the laboratory. Population dynamics was as follows: a) Untreated group: slight decrease in population at the end of June-beginning of July; peak numbers of aphids in mid-July; break down of the population until the end of August, and new increase in population at the end of this month. Cones: small aphid population throughout sampling. b) Treated groups: if treatment was in June, there was no peak in this month, and peaks in July and August were smaller. If treatment was in July or in August, there was no peak in August. More aphids were found on the edge of the yard than inside. During June and July the aphid population was always greater at 2m and 3.25m than at 6m. The mean aphid population at 2m and 3.25m was similar. The population in cones was similar at all heights. Coccinelids were the most numerous aphid predators found on hop leaves; we also found chrysopids on leaves and anthocorids inside the cones. The reported population dynamics is similar to those described for the USA (Campbell & Cone, 1994), but not to the dynamics for the Czech Republic (Hrdý, 1980) or Great Britain (Campbell, 1978). Given the great importance of natural enemies in the aphid control described in other countries, a more detailed study of these enemies in León would be very useful. The most efficient aphid treatments for the year 2002 are probably: a first treatment in June, when the natural enemies haven’t yet arrived at the hop, and a second one in the second half of July-beginning of August to prevent the final population increase. The distribution of plants within the yard influences the distribution of P. humuli, with more aphids occurring on the edges than inside. The population of P. humuli is concentrated on main stem leaves in the middle part of the plants. The necessity for aphid control depends on the relationship between aphid infestation levels, yield reduction and control costs. As a result of growing interest in integrated control it would be very useful to determine the Economic Injury Level (EIL) and the Economic Threshold (ET) of P. humuli. This study constitutes the basis of their calculation. References - Campbell, C. A. M., 1978: Regulation of the damson-hop aphid (Phorodon humuli (Schrank.)) on hops (Humulus lupulus L.) by predators. Journal of Horticulture Science, 53 (3): 235-242. - Campbell, C. A. M. & Cone, W. W., 1994: Influence of predators on population development of Phorodon humuli (Homoptera: Aphididae) on hops. Env. Entomology, 23 (6): 1391-1396. - Hrdý, I., 1980: Integrierter Pflanzenschutz im Hopfenbau. In Proceedings, International Symposium of IOBC/WPRS on Integrated Control in Agriculture and Forestry. Wien, 8.-12-79 (IOBC/WPRS, ed.), 267-280.
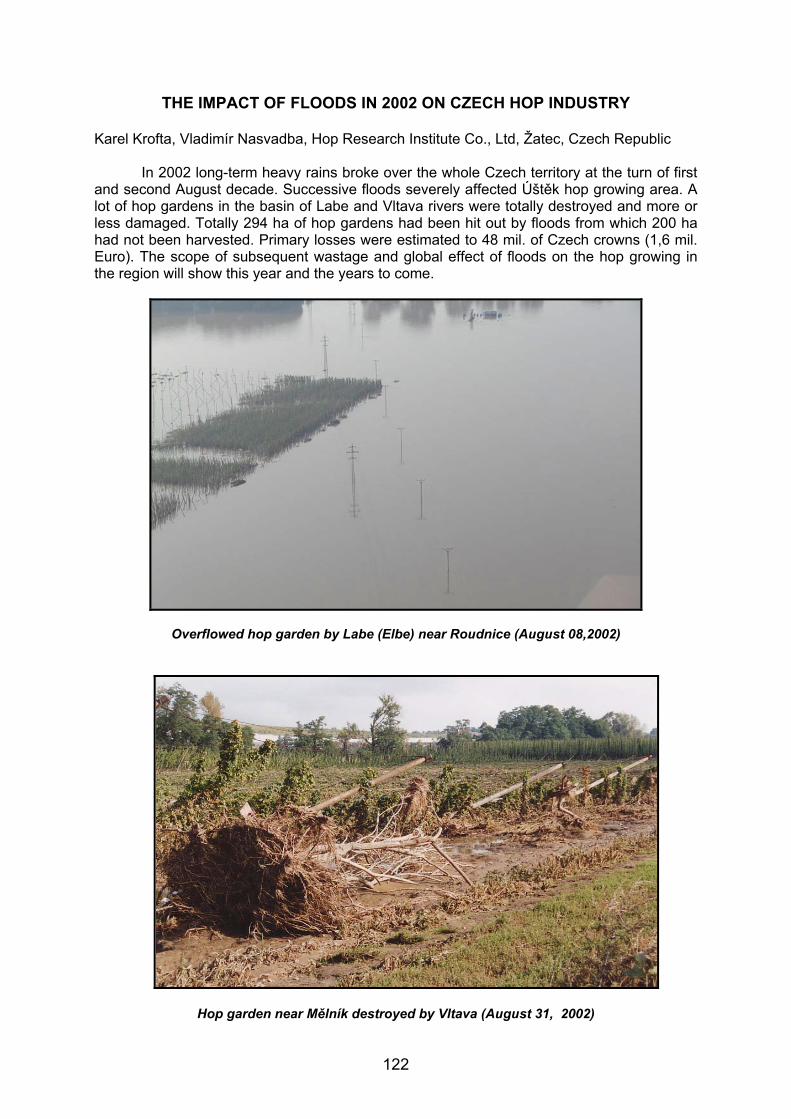
122
THE IMPACT OF FLOODS IN 2002 ON CZECH HOP INDUSTRY
Karel Krofta, Vladimír Nasvadba, Hop Research Institute Co., Ltd, Žatec, Czech Republic In 2002 long-term heavy rains broke over the whole Czech territory at the turn of first and second August decade. Successive floods severely affected Úštěk hop growing area. A lot of hop gardens in the basin of Labe and Vltava rivers were totally destroyed and more or less damaged. Totally 294 ha of hop gardens had been hit out by floods from which 200 ha had not been harvested. Primary losses were estimated to 48 mil. of Czech crowns (1,6 mil. Euro). The scope of subsequent wastage and global effect of floods on the hop growing in the region will show this year and the years to come.
Overflowed hop garden by Labe (Elbe) near Roudnice (August 08,2002)
Hop garden near Mělník destroyed by Vltava (August 31, 2002)
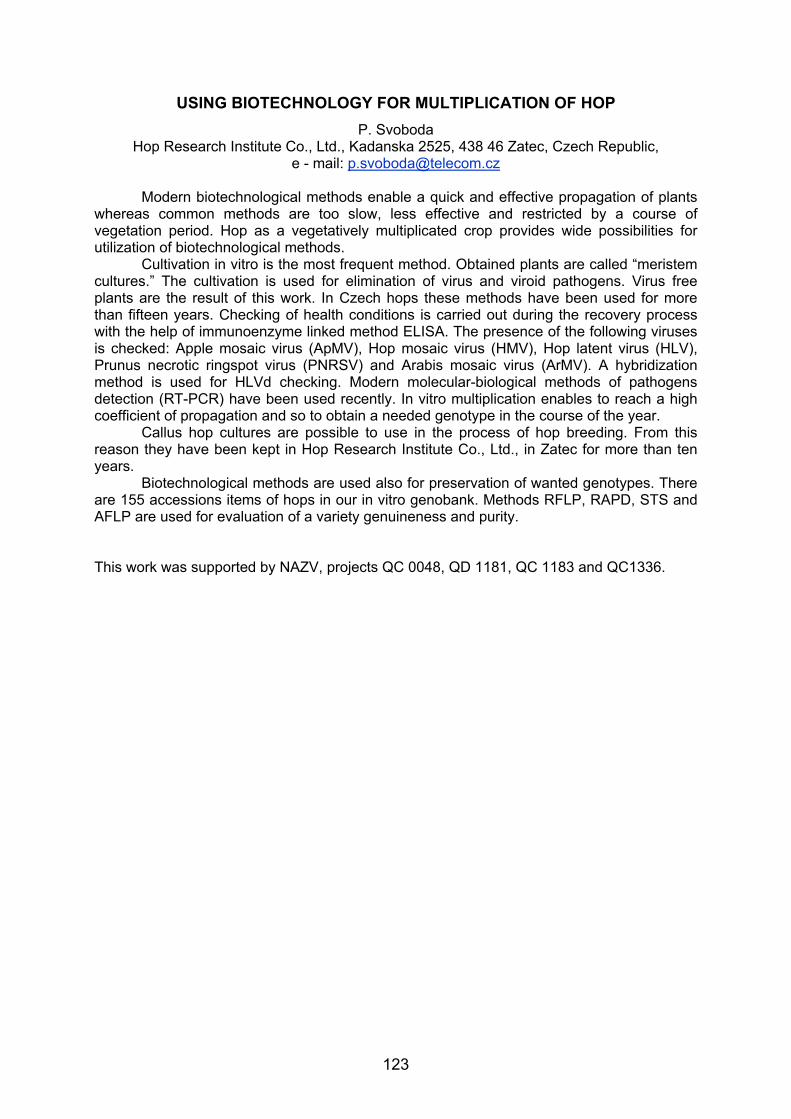
123
USING BIOTECHNOLOGY FOR MULTIPLICATION OF HOP P. Svoboda
Hop Research Institute Co., Ltd., Kadanska 2525, 438 46 Zatec, Czech Republic, e - mail: [email protected]
Modern biotechnological methods enable a quick and effective propagation of plants whereas common methods are too slow, less effective and restricted by a course of vegetation period. Hop as a vegetatively multiplicated crop provides wide possibilities for utilization of biotechnological methods. Cultivation in vitro is the most frequent method. Obtained plants are called “meristem cultures.” The cultivation is used for elimination of virus and viroid pathogens. Virus free plants are the result of this work. In Czech hops these methods have been used for more than fifteen years. Checking of health conditions is carried out during the recovery process with the help of immunoenzyme linked method ELISA. The presence of the following viruses is checked: Apple mosaic virus (ApMV), Hop mosaic virus (HMV), Hop latent virus (HLV), Prunus necrotic ringspot virus (PNRSV) and Arabis mosaic virus (ArMV). A hybridization method is used for HLVd checking. Modern molecular-biological methods of pathogens detection (RT-PCR) have been used recently. In vitro multiplication enables to reach a high coefficient of propagation and so to obtain a needed genotype in the course of the year. Callus hop cultures are possible to use in the process of hop breeding. From this reason they have been kept in Hop Research Institute Co., Ltd., in Zatec for more than ten years. Biotechnological methods are used also for preservation of wanted genotypes. There are 155 accessions items of hops in our in vitro genobank. Methods RFLP, RAPD, STS and AFLP are used for evaluation of a variety genuineness and purity. This work was supported by NAZV, projects QC 0048, QD 1181, QC 1183 and QC1336.