Embed Size (px)
Citation preview
Universität Hohenheim
Institut für Volkswirtschaftslehre
Lehrstuhl für Volkswirtschaftslehre, insbesondere Umweltökonomie
sowie Ordnungs-, Struktur- und Verbraucherpolitik
Personality-based approach to environmental
valuation
Dissertation
zur Erlangung des akademischen Grades eines
„Doktors der Wirtschaftswissenschaften“ (Dr. oec.)
vorgelegt der Fakultät Wirtschafts- und Sozialwissenschaften
der Universität Hohenheim
von
Nopasom Sinphurmsukskul
Stuttgart, Juni 2015
This thesis was accepted as a doctoral dissertation in fulfillment of the requirements for the
degree “Doktor der Wirtschaftswissenschaften” (Dr. oec.) by the Faculty of Business,
Economics and Social Sciences at the University of Hohenheim, Germany on:
08.06.2015
Dates of oral examinations (Rigorosum): 03-04.11.2015
EXAMINATION COMMITTEE
Supervisor and first reviewer: Prof. Dr. Michael Ahlheim
Second reviewer: Prof. Dr. Alfonso Sousa-Poza
Additional examiner: Prof. Dr. Andreas Pyka
Acknowledgement
Writing this dissertation was like embarking on a really long journey. Along this journey, there
were many ups and also many downs. I was fortunate enough to have a group of people who
were willing to march with me through the entire journey.
First and foremost, I would like to express my deepest gratitude to my supervisor, Prof. Dr.
Michael Ahlheim who guided me through the whole odyssey, providing me with endless
inspiration, kindness, academic and mental support. I am extremely honored to be a student of
this great economist who is also a great person. I would also like to express my gratitude to
Prof. Dr. Franz Heidhues who initiated the path to doctoral degree for me. It broke my heart
that I could not complete this dissertation before his death in September 2014. My sincere
gratitude is extended to Prof. Dr. Alfonso Sousa-Poza for his crucial comments on the
empirical part of this study. I would also like to thank Prof. Dr. Oliver Frör who, from the very
start of this project, has been my very good friend as well as my mentor. His invaluable support
got me through many difficult turns during the journey.
I would also like to thank Dr. Tobias Börger for his crucial comments and suggestions on how
to improve this dissertation. It was him who gave me the final and crucial push. I would also
like to thank Dr. Antonia Heinke for her readiness to listen and help and also for her comments
on how to improve the earlier versions of this dissertation. Special thanks to my friend Peter
Tannenberger who was always available when I wanted to discuss some ideas or concepts that
I did not understand. I would also like to extend my appreciation to Brigitte Güney who always
gave me important encouragement and mental support when I needed the most. Special thanks
also go to Martin Lempe, Britta Möller, Andreas Zahn, Sonna Pelz, Ute Siepmann, Jan
Neidhardt, Sebastian Sinn, Johannes Hürten, Jasmin Ritter, Sebastian Will, and Katharina
Schmid at the Chair of Economics, esp. Environmental Economics, Regulatory and Consumer
Policy at the University of Hohenheim for always making me feel welcome in Germany and
for all the pleasant conversations and meals we had together.
I would like to express my great appreciation to the Colonel Kasem Nanthakit Foundation for
the financial support during my stay in Germany. I am particularly grateful for the advice and
mental support given by Dr. Sirinan Sriratana. My grateful thanks are also extended to my
aunt, Dr. Wilawan Kanjanapan, who provided me with important guidance on how to edit and
polish my dissertation and on how to prepare for the oral examination. I would also like to
thank my uncle, Prof. Dr. Anan Kanjanapan, for his academic guidance.

I would also like to thank my friend Dr. Sukit Kanjina for his extraordinary sense of empathy
and his willingness to help whenever I need. Special thanks also go to Supitchya Chaipongpun
and Dr. Thunyawadee Sucharidtham for being such good friends of mine over all these years.
I would also like to offer my special thanks to Dr. Sarisa Suriyarak, who was always there for
me, providing me with mental support, pleasant conversations, and laughter.
Last but not least, I would like to express my deepest gratitude to my parents, Dr. Opas and
Dr. Sunantha Sinphurmsukskul and to my sister Dr. Supanee Sinphurmsukskul for their
understanding and endless support. Without them, I would not be able to complete this
dissertation.
II
Table of Contents
I. List of Figures .......................................................................................................................... IV
II. List of Tables ............................................................................................................................ V
III. List of Boxes .......................................................................................................................... VI
IV. Abbreviations ...................................................................................................................... VII
Chapter 1 Introduction .................................................................................................................1
1.1 Study motivation ..................................................................................................................1
1.2 Structure of the study..........................................................................................................6
Chapter 2 Environmental valuation ...........................................................................................9
2.1. Theoretical foundations ...................................................................................................10
2.1.1 Environmental valuation: Rationale ................................................................................................10 2.1.2 Total economic value of the environment ........................................................................................11 2.1.3 Environmental valuation in neoclassical economics .......................................................................13
2.2 Environmental valuation: Practice .................................................................................23
2.2.1 Indirect methods ................................................................................................................................23 2.2.2 Direct methods ...................................................................................................................................28
2.3 The Contingent Valuation Method .................................................................................33
2.3.1 Survey administration and questionnaire design............................................................................33 2.3.2 Analysis of CVM data .......................................................................................................................39
2.4 Discussion of the quality of the CVM .............................................................................48
2.4.1 Validity of CVM surveys: Evidence form three aspects of validity...............................................49 2.4.2 Main sources of errors and biases of CVM results .........................................................................54 2.4.3 Sources of error of CVM results: The psychological perspective..................................................57
2.5 Summary .............................................................................................................................60
Chapter 3 Personality .................................................................................................................63
3.1 Fundamentals of personality psychology .......................................................................64
3.1.1 Understanding the concept of personality .......................................................................................64 3.1.2 Measuring traits.................................................................................................................................70 3.1.3 Traits in practice: Objective reality and influences on behavior ..................................................74 3.1.4 Trait taxonomy: In search of the fundamental traits of human beings ........................................77
3.2 The Big Five personality model (BFM) ..........................................................................79
3.2.1 A short history: Why five? ................................................................................................................80 3.2.2 Costa and McCrae’s framework ......................................................................................................84 3.2.3 The Big Five measurement tools ....................................................................................................101
3.3 Summary .......................................................................................................................... 104
III
Chapter 4 Personality and contingent valuation.................................................................. 107
4.1 Review and outline of the chapter ................................................................................ 107
4.2 The importance of personality for contingent valuation .......................................... 108
4.3 Effects of five personality domains on WTP answers ............................................... 111
4.4 Summary .......................................................................................................................... 127
Chapter 5 Empirical analysis .................................................................................................. 129
5.1 General survey settings .................................................................................................. 129
5.1.1 Background to the research project ...............................................................................................130 5.1.2 The survey design ............................................................................................................................133 5.1.3 Practical realizations of the survey ................................................................................................141
5.2 Results............................................................................................................................... 143
5.2.1 Basic results ......................................................................................................................................143 5.2.2 Practical application of the NEO-FFI survey inventory ..............................................................145 5.2.3 Effects of the five personality domains on WTP statements: Empirical evidence .....................158 5.2.4 Discussion of the empirical results .................................................................................................168
Chapter 6 Summary and conclusions .................................................................................... 175
References................................................................................................................................... 183
Appendix..................................................................................................................................... 197

IV
I. List of Figures
Figure 2-1: Total economic value of the natural environment ................................................... 12
Figure 2-2: Example of the payment card elicitation format ..................................................... 38 Figure 2-3: Sources of error in a CVM survey............................................................................ 57 Figure 3-1: The Johari Window ................................................................................................... 72
Figure 5-1: Study area and Mae Sa watershed .......................................................................... 131 Figure 5-2: The NEO-FFI ........................................................................................................... 139 Figure 5-3: Level of education of the respondents ................................................................... 145
Figure 5-4: Scree plot of eigenvalues ....................................................................................... 147
V
II. List of Tables
Table 3-1: Different descriptions of the five personality dimensions ....................................... 83
Table 4-1: Expected influence of personality on stated WTP .................................................. 126 Table 5-1: Bid design of the DC question format (in Baht) ..................................................... 137 Table 5-2: Age, household size, incomes and monthly expenses on bottled water of the
respondents and their households............................................................................................... 144 Table 5-3: Alpha coefficients of the NEO-FFI ......................................................................... 146 Table 5-4: Item factor analysis of the NEO-FFI ....................................................................... 148
Table 5-5: Poorly performing NEO-FFI items .......................................................................... 152 Table 5-6: Items discarded from the analysis ............................................................................ 153 Table 5-7: Alpha coefficients of the modified NEO-FFI ......................................................... 153
Table 5-8: Item factor analysis for the NEO-FFI (20 items excluded) .................................... 154 Table 5-9: Mean, standard deviation, the minimum and maximum value of factor scores ... 155 Table 5-10: Description of the variables used in correlation analysis ..................................... 156
Table 5-11: Correlations of the Big Five with socio-economic and attitudinal variables ...... 157 Table 5-12: Description of the variables used in regression analyses ..................................... 160 Table 5-13: Personality as explanatory variables for WTP in the DC dataset ........................ 163
Table 5-14: Personality as explanatory variables of WTP for the PC dataset ........................ 165 Table 5-15: The five personality domains as explanatory variables of interview response
behavior ....................................................................................................................................... 168

VI
III. List of Boxes
Box 3-1: Facets of neuroticism .................................................................................................... 88
Box 3-2: Facets of extraversion ................................................................................................... 92 Box 3-3: Facets of openness to experience ................................................................................. 94 Box 3-4: Facets of agreeableness ................................................................................................. 96
Box 3-5: Facets of conscientiousness ......................................................................................... 99 Box 5-1: Scenario description to customers during the survey............................................... 135 Box 5-2: PC question format ...................................................................................................... 138

VII
IV. Abbreviations
16 PF 16 Personality factors
ABCM Attribute-based choice modelling
ABM Averting behavior method
BFI-10 10-item Big Five inventory
BFI Big Five inventory
BFM Big Five personality model
CBA Cost-benefit analysis
CJ Citizen jury
CV Compensating variation
CVM Contingent valuation method
DC Dichotomous choice (elicitation format)
DFG Deutsche Forschungsgemeinschaft (German Science Foundation)
EFA Exploratory factor analysis
EV Equivalent variation
HDM Hedonic price method
MMPI Minnesota Multiphasic Personality Inventory
MRW Mae Rim Water Works
MS Market stall
NEO-FFI NEO five factor inventory
NEO-PI-R NEO personality inventory-revised
NOAA National Oceanic and Atmospheric Association
OE Open-ended (elicitation format)
OLS Ordinary least squares
PC Payment card (elicitation format)
PCA Principle component analysis
PVM Participatory valuation method
RUM Random utility model
TDM Trait descriptive adjective
TCM Travel cost method
WTA Willingness to accept
WTP Willingness to pay
1
Chapter 1 Introduction
1.1 Study motivation
The natural environment generates a wide range of benefits for society. It provides raw materials
and energy to the economy, allowing for the production of consumption goods all of which serve
our wants and needs. At the same time, the natural environment provides goods and services
directly to individual citizens. The clean air we breathe, the beauty of a waterfall we enjoy, and
the various ecosystem functions that support our existence are all benefits we obtain directly
from the environment. All of the above direct and indirect benefits of the natural environment
can be referred to as environmental goods. They are labelled as “goods” because, like ordinary
market goods such as food, clothing, and cars, environmental commodities generate well-being
or welfare for individuals and societies. Yet, unlike ordinary market goods, environmental
commodities are very special kinds of commodities whose properties prevent them from being
traded, and thereby valued, in markets.
Environmental goods often have the character of public goods. This means that when
environmental goods are created, e.g. in the form of improved air quality, nobody can be
excluded from consuming these goods, and that their consumption by additional individuals
does not diminish the benefits to others. Since exclusion is not possible, property rights to
environmental goods cannot be defined and as a result markets where such goods are bought
and sold do not exist. Environmental goods, therefore, can be categorized as nonmarket goods.
The absence of market for an environmental good, however, complicates the quantification of
its economic value, i.e. the changes in utility that its consumption leads to. For the case of an
ordinary market good, its economic value is indicated by its market value, i.e. its price. The
underlying assumption is that economic agents will purchase the commodity only if the utility
they gain from its consumption is at least as high as its price. In this sense, the price that
individuals are willing to pay to purchase the commodity is the monetary value of the minimum
utility that they can derive from that commodity. Since markets for environmental goods do not
exist, neither do their market prices. As a consequence, the changes in utility that the
consumption of environmental goods induce have to be assessed by other means.
The absence of market price as an indication of the benefits of environmental goods has
contributed to the development of environmental valuation techniques. These methods aim at
the monetary quantification of the economic value of environmental goods. Such methods
2
become relevant, for example, when political decision makers need estimates of the monetary
value of environmental goods in order to contrast them to the overall costs of the project
resulting in the improvement or conservation of such goods. The valuation techniques available
can be separated into direct and indirect methods. Indirect valuation methods rely on an
assumption that there be a market good that is consumed with the environmental good under
consideration. Consequently, the value that environmental good can be assessed indirectly
through the actual consumption behavior of the related market good. The reliance on actual
market behavior, however, means that indirect valuation methods take into account only the use
value of environmental goods, i.e. value people derive from the direct use of the goods. The
non-use value, i.e. value that people place on environmental goods because they exist, cannot
be captured by indirect valuation techniques. Direct valuation methods, which rely on surveys
and require respondents to directly state their individual valuation for environmental goods, are
able to assess both use and non-use values of environmental goods. Direct methods, therefore,
are able to assess the economic value of a wider range of environmental commodities. Of the
various direct valuation methods available, the contingent valuation method (CVM) has been
the most hopeful to put behind all complications arising from the assessment of environmental
goods. This method constitutes the focus of this study.
The CVM relies on extensive surveys, which can be conducted face-to-face, by mail, by
telephone, or on the internet, with a representative sample of a population likely to be affected
by a public project that induces a change in an environmental good. As mentioned earlier, in the
private goods purchase situation, the price households pay to purchase a good is a reliable
estimate of the benefits that that good generates for the people consuming it. The CVM makes
use of this assumption and constructs a hypothetical market for an environmental good in order
to assess the benefits that its consumption leads to. An important feature of the CVM, therefore,
is the project scenario, i.e. a detailed description of the public project that leads to a change in
the level of provision of an environmental good. After respondents are confronted with the
project scenario, a hypothetical market setting is presented to them. In the hypothetical market
setting, respondents are asked to state the maximum amount of money they would be willing to
pay (WTP) in order to obtain benefits from the provision of environmental good in question.
The WTPs stated by respondents represent the monetary value of the utility changes they expect
from the proposed environmental change scenario. After the stated WTP of all sampled
households are elicited, the mean WTPs of the representative households are calculated and
extrapolated to arrive at the social value of the project.
3
The CVM, however, has a number of methodological shortcomings. The shortcomings of
the CVM stem from its simulated market, which is not able to emulate all aspects of the private
goods purchase situation. In the private goods purchase situation, individuals are able to search
for information on the commodities they desire. As they are the ones who decide the time of
purchase, they can take their time gathering as much information about the items in question as
they want in order to make informed purchase decisions. Hands-on experience that consumers
can have with the commodities under consideration can help them form preferences for such
goods and thus ease their decision makings considerably. Once the purchase decision is made,
consumers have to pay the defined prices in order to obtain the commodities. Since the prices
that consumers pay to purchase the goods are reliable estimates of the utility they expect from
the goods, individual preferences of consumers are truthfully revealed in the transaction process.
Many features of the private goods purchase situation cannot be mimicked in a CVM
interview. For a start, CVM respondents do not play as active role in a CVM interview as they
do in an actual market. Instead, respondents are approached by interviewers at a random hour
and are asked to consider about an improvement of some environmental goods they may have
never heard of before. Since the project in question does not yet exist, respondents do not have
the opportunity to inspect how the planned environmental improvements would feel like. They
have to rely on the materials given in the survey most of which consist of verbal descriptions
and photos which may or may not suit their needs. Consequently, it is very difficult for CVM
respondents to form an exact idea about the environmental project in question. On top of that,
respondents in a face-to-face or telephone CVM interview are given only a relatively short
period of time to consider the project scenario and to identify their true individual valuation.
Given these difficulties, CVM respondents must put tremendous efforts in imagining about the
project. Unless they give careful thoughts on their valuation decisions, respondents might not
be able to derive the correct estimate of their individual valuation of the proposed project and
report a “wrong” WTP as a result.
Apart from the shortcoming related to the formation of individual preferences, another
shortcoming of the CVM is related to the truthful revelation of these preferences. As discussed
above, the truthful revelation of individual preferences is not a problem in a private goods
market. Rational consumers always reveal their true preferences for the commodity they desire
through the price they actually have to pay to obtain that commodity. However, there is no real
market transaction in the CVM. After respondents report the maximum amount of money that
they would be willing to pay in order to support the implementation of an environmental project,
they do not have to pay that stated amount. This means respondents’ stated WTP are nothing
4
but a statement of intention. When respondents only have to state what they would be willing to
pay without really having to pay it, the truthfulness of their answers can be easily compromised.
The hypothetical nature of the CVM, therefore, allows respondents to deliberately misreport
their WTP statements, which would lead to erroneous WTP estimates on the part of the
researcher.
Given the procedural shortcomings of the CVM discussed above, it is therefore very
important –for the CVM to produce theoretically meaningful WTP statements– to ensure that
all survey participants consider the survey questions thoroughly and report them truthfully.
However, these basic requirements are not necessarily fulfilled in practical CVM surveys. Over
the past decades, many irregularities of the WTP statements have been detected. They include,
e.g., the hypothetical bias (i.e. the divergence between the hypothetical and actual contributions
for environmental goods) and the social desirability effect (i.e. the tendency of respondents to
state a higher WTP answer when interviewers present). To date, explanations for the systematic
biases and irregularities of the WTP responses have been proposed. Reasons have been
attributed mainly to the components of the CVM survey instrument, which trigger the disturbing
effects on the WTP answers. Little attention has been paid, however, to the personal
characteristics of survey respondents, which may as well play an important role. This is the point
where this study aims to contribute.
Research in the fields of psychology suggests that within human beings there be
dispositional attributes, which determine persons’ tendency to feel, think, and behave in
particular ways. Over years, various different dispositional concepts have been developed and
validated by psychologists who have employed such concepts to gain a better understanding of
the workings of people’s mind and use this understanding to explain human behavior. So when
it comes to the context of the environmental valuation survey, it is very likely that within survey
participants there also exists dispositional attributes. And by identifying the inner attributes of
CVM respondents, we may be able to establish direct links between such attributes and various
different patterns of WTP responses, and obtain a better understanding on the mental
mechanisms underlying WTP response behavior. Evidence supporting the use of this approach
is emerging in the literature of environmental valuation (Menges et al. 2005; Lusk et al. 2007;
Frör 2008; Börger 2013). Differing dispositional attributes have been detected to systematically
influence the ways respondents process complex information, form their expectations about the
proposed environmental project, and the tendency to misstate their WTP answers. These insights
are very important because they can guide the future design of environmental valuation surveys
to better suit the psychology of WTP response behavior.
5
This study offers a close look at the use of dispositional attributes to better understand
WTP response behavior. Although this research approach is relatively new in the context of the
CVM, explaining human behavior by reference to dispositional attributes has long been a
common practice in psychology (Ajzen 2005). As mentioned previously, a myriad of latent and
hypothetical characteristics have been conceptualized in differing sub-fields of psychology.
These include, e.g., cognitive styles in cognitive psychology (Sternberg and Grigorenko 1997;
Pacini and Epstein 1999), attitudes in social psychology (Ajzen 2005), and consumer decision
styles in consumer psychology (Howard 1994). The list is endless. But the construct that appears
as most suitable to spearhead the investigation into the dispositional attributes of individuals is
personality traits. This is because personality traits do not deal with mere fractions of people’s
dispositions. Whereas other dispositional concepts refer exclusively to, say, emotion or
cognitive disposition of individuals, personality traits deal with dispositions of the whole
persons (Pervin and Cervone 2010, p.7). This means that traits encompass a wide variety of
mental phenomena. And many of such phenomena might play important roles in WTP decisions.
The case for using traits in the CVM seems strong for three reasons. First, traits may
influence the level of cognitive efforts CVM respondents put into making their WTP decisions.
It is well established that traits determine the depth of individual decision making (Matthews et
al. 2009, p.357ff.). Some people may be inclined to put a great level of cognitive efforts into
making decisions while others are inclined to make quick or snap decisions. If this is the case in
the CVM survey, some respondents may be willing to go to great intellectual efforts to answer
the WTP questions even if they have to think hard about the question while others may tend to
make quick WTP decisions. Second, traits may directly determine the preferential judgments of
CVM respondents. In a CVM survey, respondents’ judgments on the desirability of the proposed
project depend on many factors, e.g. their previous experience with the environmental goods in
question, their attitude towards the goods, and their attitude towards the responsible
organization. It is very likely that judgments on the desirability of the project will depend on
respondents’ enduring characteristics, e.g. their personality traits. Some respondents, for
example, may tend to make decisions based on their enduring altruistic motivations. So these
respondents are likely to assign a higher value to the environmental project than those without
this characteristic. Using traits to explain WTP decision, therefore, implies that we will be able
to take a direct account of some important motivations underlying WTP answers. Last but not
least, traits motivate social behavior many of which could be important in the context of CVM
surveys. For instance, traits determine individual difference in the ways people express their
personal feelings to strangers (Doherty and Schlenker 1991; Chang et al. 2001). In a CVM
6
survey, especially the face to face and telephone surveys, respondents are asked to report their
WTP directly to interviewers. The way respondents report their feelings to interviewers will be
different from person to person. Some people may have enduring characteristics that make them
susceptible to the presence of interviewers and thus may tend to misreport their WTP. Others
may not be influenced by the presence of interviewers and are able to truthfully report their
feelings. This implies that traits may underpin reasons for the misstating of WTP answers.
Therefore, the overall objective of this study is to analyze the usefulness of the trait
concept in the context of environmental valuation using the contingent valuation method. Of
special interest is the explanations trait concepts can provide on the mechanisms underlying
respondents’ inability to form the correct expectations about the proposed environmental
project and their incentives to misstate their WTP answers. In addition, this study will attempt
to propose recommendations on how the design and administration of the CVM survey should
be tailored based on the psychological characteristics of its respondents.
1.2 Structure of the study
There are six chapters in this study. After this introduction, chapter 2 introduces the economic
valuation of environmental changes. Its main aim is to familiarize the reader with the theory of
environmental valuation and the empirical techniques used to measure the value of
environmental changes. This chapter provides an important basis of this study because it
highlights the gap between theory and practices of environmental valuation which this study
intends to use personality theory to explain. Therefore, the first and the second parts of this
chapter focus on the theory and methods of environmental valuation. In the third part, the CVM
which is the method of interest to this study is put under microscope. Details regarding its survey
design and the analysis of its survey data are described and then discussed. Chapter 2 culminates
in the fourth part which deals with the quality of welfare estimates obtained from the CVM. This
part first highlights the points where the CVM can go wrong, producing WTP estimates that
deviate from the theoretically correct ones. Next, this part reviews attempts to assess the validity
of WTP measures. Findings on different types of response biases including proposals on how to
mitigate them are presented. Eventually, this section presents to the reader a number of studies
which aim at the explicit investigation into the inner characteristics of CVM respondents in an
attempt to give psychological explanations to their WTP responses. Finding suggests that the
mental attributes of respondents give a better understanding on the mental mechanisms behind
7
their WTP statements. Chapter 2 concludes that psychological attributes of CVM respondents
should be further investigated.
The aim of chapter 3 is to search for both model and method developed in personality
psychology that can be used to inspect the inner attributes of CVM respondents. The first part
of this chapter offers the fundamentals of personality psychology. These include the meaning of
personality concept, its practical measurement tools, and empirical evidence regarding its reality
and influences on behavior. This first part is important because it provides justifications why
the concept of personality should at all be used to investigate mental characteristics of the CVM
participants. The second part offers details on the Big Five personality model (BFM), which
forms the conceptual basis for the empirical investigation of this study. The BFM posits that in
every individual, there exist five core personality dimensions representing the five most
important aspects of his or her identity. These aspects refer to emotional, social behavioral,
experiential, attitudinal, and motivational aspects (Goldberg 1990; John and Srivastava 1999).
Because they represent the five psychological “pillars” of persons, the five personality
dimensions are expected to underpin people’s decisions and behavior in many different
situations. This includes when they are making valuation decisions in a CVM survey. The
second part of chapter 3 goes into great detail how the BFM is developed. The focus is put on
one specific model of the BFM which has been widely accepted by psychologists. Within this
particular framework, each of the five personality dimensions or “domains” is described with
six subsidiary traits or “facets.” As the section unveils, it becomes clear that these 30 facets give
both width and depth to the meanings and the workings of the five personality domains. Most
importantly, however, these facets are dispositions in their own right and thus they form a squad
of meaningful traits many of which may provide fine-tuned insights into the psychological
processes underlying WTP response behavior. At the end of this part, specialized tools devised
to measure the five personality dimensions and their corresponding facets are introduced. Their
validity, especially in the cross-cultural and cross-countries contexts, is discussed.
The aim of chapter 4 is to establish theoretical links between the five domains and the
WTP response patterns. For this purpose, facets constituting each of the five personality
domains are subjected to WTP response behavior, and theoretical anticipations on how these
facets affect the stated WTP are made accordingly. These specific effects of facets on the stated
WTP, which can be perceived as the different channels through which their domains can affect
WTP statements, are then used to formulate theoretical predictions on the domain level. To date,
this is the first economic study that takes a full advantage of this theoretical facet structure
underlying the five personality dimensions. Outcome is a rich analysis. Based on facets, it is
8
conjectured that various, and different sets of, personal attributes are at work when respondents
are 1) forming their expectation on the proposed project scenario and 2) stating their WTP
answers to interviewers. Both positive and negative influences of dispositional characteristics
on the different processes of WTP decision makings are anticipated.
The objective of chapter 5 is to test the theoretical predictions made in chapter 4 with
respect to the effects of the five personality domains and facets on people’s WTP decisions. The
first section addresses details on the empirical surveys, i.e. backgrounds of the research project,
the CVM survey design, and the practical realization of the surveys. In total, two practical CVM
studies were completed in Chiang Mai, northern Thailand. Both CVM studies assessed people’s
WTP for the improvements of their household tap water quality. The surveys were carried out
in the framework of international research collaboration program SFB 564 and funded by the
German Science Foundation (DFG). In the surveys, respondents were presented with the main
CVM questionnaire and another questionnaire specially designed to measure the five personality
domains and facets. Results of the surveys are presented in the second part. Chapter 6
summarizes and concludes the study.
9
Chapter 2 Environmental valuation
This chapter is organized into five sections. The first part gives a review on the theories that
form the backbones of environmental valuation. It offers the rationale for environmental
valuation explaining why the well-being generated by the environment is unknown and why it
should be measured. It becomes apparent that environmental goods have two crucial properties
in this respect, namely non-excludability and (some of them) non-rivalry in consumption.
Because of these properties, environmental assets have no market prices from which their true
values can be inferred. Next, this section elucidates all possible channels through which the
environment can create well-being to individual members of society. The concept of total
economic value and two major classes of environmental values, i.e. the use and non-use values
are introduced. The section then proceeds to the theoretical instruments designed to assess
people’s welfare changes resulting from the changes of the states of the environment. The so-
called Hicksian Compensating Variation, which is a theoretical welfare measure that underpins
major valuation techniques, is presented. The second part of this chapter reviews practical
environmental valuation approaches. Various valuation methods including their advantages and
disadvantages are exhibited. The section shows that only a class of methods, the so-called direct
valuation techniques, are able to assess both use- and non-use values of the environment and are
consequently appropriate to be used in valuation practices. The most widely employed direct
valuation technique, the contingent valuation method, which will also be the focus of this study,
is described in detail in the third section. As a survey-based method, the core elements of the
contingent valuation method are its survey and questionnaire design. Thus, details on its survey
procedure as well as questionnaire design are given. The fourth section scrutinizes the validity
of valuation methods with a specific focus on the contingent valuation method. Studies using
various validity criteria are reviewed. Studies employing a psychological approach to investigate
the methodological shortcomings of the valuation methods are presented at the end of the fourth
section. It becomes apparent that such an approach can give considerable insights into many
types of response behavior in contingent valuation surveys. The last section is the chapter
summary.
10
2.1. Theoretical foundations
2.1.1 Environmental valuation: Rationale
One of the most frequently asked questions about environmental valuation is: why do we need
to do it? To answer this question it must first be reminded that environmental valuation is in fact
a common procedure in private and public decision making. When consumption decisions are
made, or when a new airport is built, a forest protection area is established, a damaged watershed
is rehabilitated consequences on environmental goods are either implicitly or explicitly taken
into account in relation to the outcomes of the decisions. Very often, however, such valuation
processes are not documented and lack explicit accountability. This is not entirely the fault of
those who are in charge of these decisions. Environmental commodities have characteristics that
make it difficult to gauge their values. More specifically, they are often characterized by two
properties. Their first property is non-excludability in consumption, which means that it is
impossible or very expensive to exclude an individual from attaining benefits from
environmental amenities. For example, one cannot prohibit individuals from breathing clean air
or enjoying the beautiful scenery of agricultural lands in a rural area. It is thus impossible to
exclude anyone from the consumption of such a good. Another property which is also given for
many environmental goods is their non-rivalry in consumption. This means that environmental
goods can be utilized by more than one person without decreasing the benefits to be received by
other users. Because of their public good nature, property rights for environmental goods cannot
be clearly defined. So, there is no market where prices for environmental commodities are traded
in light of their supply and demand. This absence of a market price, as explained in the
introductory chapter, makes it impossible for us to realize the value of the environment through
readily available market data. So, the value of environmental goods has to be quantified by other
means, i.e. by the use of environmental valuation techniques.
Environmental valuation methods can be used for several purposes (Hanley et al. 2001a).
Their first important field of application is the provision of quantitative input for cost-benefit
analysis (CBA) (Hanley 2001; Hanley and Barbier 2009). CBA is a very important decision tool
when it comes to decisions on the allocation of public funds in environmental sector. As a
decision guideline, public decision-makers conduct a CBA, where the benefits of a project under
consideration are compared to its costs. A proposed environmental project should be undertaken
only if the project costs are outweighed by the benefits the project creates for society. While the
calculation of project costs is rather straightforward – as all costs (e.g. material, labor, land, and
capital costs) usually have market prices determined in the competitive marketplace – the
11
assessment of the project benefits is often much more problematic. This is because the public
good nature of environmental goods. No market prices exist for benefits resulting from
environmental project. Here, environmental valuation must be applied to appraise the benefits
of the project in monetary terms, which then can be directly compared to the project costs.
Information obtained from environmental valuation will enable policy-makers to efficiently
allocate limited public funds.
The second use of environmental valuation is for the assessment of environmental
damage. This use of environmental valuation is particularly important in the USA where under
the Comprehensive Environmental Response, Compensation, and Liability Act (CERCLA),
states and the federal government are able to hold parties accountable for their releases of
hazardous substances that may endanger environmental goods. Because of the public good
nature of the environment, no market prices exist for quantifying the monetary value of
environmental damage. So, environmental valuation techniques have to be employed in order
to assess the value of such damage.
The third use of environmental valuation data is for the adjustment of national accounting
figures such as gross domestic product (GDP) to take into account the state of the natural
environment. In its classic form, GDP is an indicator of economic performance, providing an
account of all the goods and services that an economy produces in a year. This conventional
from of GDP, however, assesses only the gross output of an economy. Neither the deterioration
of environmental quality nor the depletion of natural resources that are associated with the
output of respective economy is taken into account. In order to provide a complete description
of the state and the development of an economy, the traditional GDP has to be adjusted by
incorporating the changes in the natural capital. Again, as such environmental changes are
unpriced by the market, environmental valuation have to be employed. After the importance of
environmental valuation is introduced in this section, the next section presents the many
different channels through which the environment can generate value to individuals and
societies. For this purpose, the conceptual framework of the total economic value of the
environment will be presented.
2.1.2 Total economic value of the environment
In the sphere of economic theory, the notion of value is anthropocentric. Environmental
commodities are considered as carrying values only if they are beneficial to humans, i.e. only if
they generate utility to individuals (Tietenberg and Lewis 2009). This notion of value excludes
other types of value that are not related to humans such as intrinsic or ecological value, concepts
12
which acknowledge that the natural environment has its own value regardless of whether or not
any human derives utility from it (Naess 1986). This anthropocentric view of value forms the
basis for the framework of the total economic value of the environment to be discussed below.
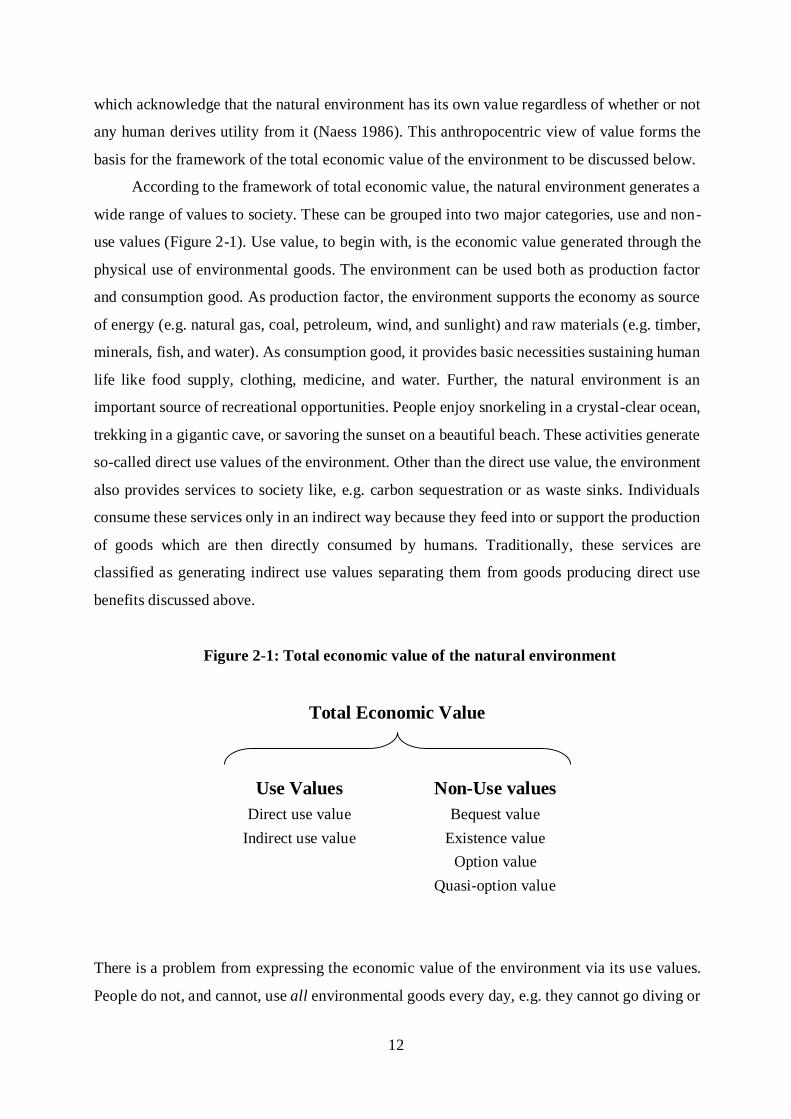
According to the framework of total economic value, the natural environment generates a
wide range of values to society. These can be grouped into two major categories, use and non-
use values (Figure 2-1). Use value, to begin with, is the economic value generated through the
physical use of environmental goods. The environment can be used both as production factor
and consumption good. As production factor, the environment supports the economy as source
of energy (e.g. natural gas, coal, petroleum, wind, and sunlight) and raw materials (e.g. timber,
minerals, fish, and water). As consumption good, it provides basic necessities sustaining human
life like food supply, clothing, medicine, and water. Further, the natural environment is an
important source of recreational opportunities. People enjoy snorkeling in a crystal-clear ocean,
trekking in a gigantic cave, or savoring the sunset on a beautiful beach. These activities generate
so-called direct use values of the environment. Other than the direct use value, the environment
also provides services to society like, e.g. carbon sequestration or as waste sinks. Individuals
consume these services only in an indirect way because they feed into or support the production
of goods which are then directly consumed by humans. Traditionally, these services are
classified as generating indirect use values separating them from goods producing direct use
benefits discussed above.
Figure 2-1: Total economic value of the natural environment
Total Economic Value
Use Values Non-Use values
Direct use value Bequest value
Indirect use value Existence value
Option value
Quasi-option value
There is a problem from expressing the economic value of the environment via its use values.
People do not, and cannot, use all environmental goods every day, e.g. they cannot go diving or
13
hiking every day. Many people may have even never done it at all and only read about it in the
magazines. That does not mean that coral reefs or beautiful valleys have no value for those
people, but the value is generated by the fact that such environmental assets are available for
use rather than being used on a constant basis. To make this point clearer think about a hospital.
Many people rarely visit hospitals or none at all. Yet the hospital provide a valuable stand-by
service for society. Its value cannot be fully expressed by the number of its users or income
collected (Weisbrod 1964) but additionally by the option that people have to use it. This leads
to the first type of non-use value to be introduced in this section, i.e. option value (Weisbrod
1964). It is the environmental value associated with the possible use of the natural environment
in the future. A natural resource carries an option value when there is a positive possibility that
it will have value for human society in the future. In this case, one would be willing to do
something to preserve the option that the resource might prove valuable in the future.
The second type of non-use value is quasi-option value (Arrow and Fisher 1974). The
quasi-option value accrues from the same motivation as option value. However, unlike the
option value, the ability to utilize environmental goods is still uncertain. Environmental goods
also produce welfare to individuals even though they may not expect to use them at all. This
refers to bequest value of the environment. People may preserve the natural environment
because they want to keep options open for the future generations to benefit from it. The last
non-use value is existence value (Krutilla 1967): individual utility is obtained merely by
acknowledging that particular environmental goods exist. It has been argued that existence value
covers some areas of the ecologists’ intrinsic value (Attfield 1998). This is because existence
value implies that people value natural resources for their own sake. After introducing the total
economic value of environment goods, the discussion can now turn its focus on the theoretical
framework underpinning environmental valuation.
2.1.3 Environmental valuation in neoclassical economics
Based on a review by Ahlheim (1998), this section introduces the theoretical welfare measures
that form the theoretical basis for major environmental valuation techniques. To facilitate the
illustration, let us assume a society with h = 1,2,…, H households. Each household consumes N
different market goods denoted by the vector xh = [xh1,xh2,…,xhN]. Other than the consumption
of the vector of market goods, households are provided with an environmental state z. In
addition, Ih denotes household h’s disposable income.
14
Now consider a public project which aims at improving some aspect of environmental
quality. This project could be for instance a wetland rehabilitation program or a reforestation
project. Of main interest is the net impact of the environmental project upon the well-being of
society. Therefore, the welfare measures that are used to determine changes in the well-being of
society are introduced. This will be done from the ground up so that the fundamentals of the
measure are clear to the reader. As a starting point, let 𝑤(∙) be a function known as the social
welfare function that consists of the utility of all households living in the same society. In a
democratic society, it should hold that:
𝑊 = 𝑤(𝑈1 , 𝑈2, … , 𝑈𝐻 ) , 𝜕𝑤
𝜕𝑈ℎ≥ 0, (2-1)
where 𝑈ℎrepresents the utility of household ℎ (ℎ = 1,2, … 𝐻). By 𝜕𝑤
𝜕𝑈ℎ≥ 0 it is meant that no
single household in this society is to be discriminated against. It ensures that for all social
decisions the welfare of any household must not be decreased. Now consider the environmental
project. Two particular states of the project are of interest. Let i = 0 represent the initial state,
i.e. the situation before the implementation of the project, and let i = 1 denote the new situation,
i.e. the state after the project has already been implemented. The environmental program is
intended to improve the state of the environment 𝑧𝑖 from an initial situation 𝑧0 to a final situation
𝑧1 which are both an argument of any household’s utility function. This would result in a change
of social welfare and can be expressed as:
∆𝑊01 = 𝑤01(∆𝑈1, ∆𝑈2, … , ∆𝑈𝐻 ). (2-2)
In equation (2-2), ∆𝑊01 expresses the social welfare change between situations 0 and 1 while
∆𝑈ℎ represents the utility change of individual household ℎ between those two situations. From
equation (2-2) the measure of the change of social welfare resulting from an environmental
project can be decomposed into two main steps. The first step, also known as the assessment
problem, is to identify the welfare change of each single household ∆𝑈ℎ for all households being
affected by that environmental change. The second step, the aggregation problem, is to
aggregate these utility changes of all households to obtain the social welfare change. It will first
be explained how welfare changes of individual households can be measured followed by a
discussion of the aggregation of the welfare of individual households.
15
In order to identify the welfare change of an individual household, a welfare measure is
needed that is able to indicate whether that household is better off, worse off, or as well off as
before the environmental project was implemented. For this, a welfare measure IND01 has to
fulfill what is known as the indicator criterion which reads:
𝐼𝑁𝐷01>=<
0 ⇔ 𝑈h1
>=<
Uh0 (ℎ = 1, 2, … , 𝐻). (2-3)
Now, it is still possible that welfare measures that fulfill the indicator criterion may not be
empirically observable. In welfare theory, such an indicator may refer to the mathematical
functions that represent the unobservable preference orderings of consumers (and thus fulfill the
indicator criterion) but cannot be computed empirically. Due to this reason, the welfare indicator
that is needed must be computable on the basis of empirically observable data. This criterion,
i.e. the computability criterion, can in fact be regarded as a prerequisite for the practical
implementation of any welfare measure. The construction of welfare measures typically begins
with a mathematical function that can describe the preference ordering of an individual
household. This is because by definition the measurement of welfare aims at the preferences of
an individual. Of all mathematical functions to describe a preference ordering, the most well-
known is the direct utility function:
𝑈ℎ = 𝑢ℎ(𝑥ℎ , 𝑧𝑖) (ℎ = 1, 2, … , 𝐻). (2-4)
The direct utility function of a household is a function of xh, the consumption bundle chosen by
household ℎ, and 𝑧𝑖, the states of the environment. Note that 𝑧𝑖 are predefined on a societal level
and cannot be chosen by the household. Thus, it is not household-specific and subscripted with
ℎ. Both an increase of consumption of market goods and an improvement of the state of the
environment 𝑧𝑖 increase household utility, i.e. 𝜕𝑢ℎ
𝜕𝑥ℎ> 0 and
𝜕𝑢ℎ
𝜕𝑧𝑖> 0. This means that all
arguments can be considered as goods. Now let us consider the impact of the environmental
project. The difference between household utility before and after the implementation of the
project can be described as:
𝛥𝑈ℎ01 = 𝑈ℎ
1 − 𝑈ℎ0 = 𝑢ℎ(𝑥ℎ
1 , 𝑧1) − 𝑢ℎ(𝑥ℎ0, 𝑧0) (2-5)
16
Typically, an environmental project does not induce only the effect on the states of the
environment 𝑧𝑖 (the environmental effect) but it also triggers the market good effect. The market
good effect refers to the project’s consequences on household income and market prices. The
environmental project typically has direct effects on household income. It generally decreases
household income because the implementation of the project usually requires government to
raise additional taxes. Such an effect is captured by 𝐼ℎ𝑖 . Let 𝐼ℎ
0 (ℎ = 1,2, … 𝐻) denote the income
of household h in the initial situation, while 𝐼ℎ1 refers to household income in the final situation.
The project also influences market prices p = [p1,p2,…,pN] for the N market goods consumed by
a respective household h because some market commodities are consumed more after the
environment is improved (e.g. fishing and camping equipment after a formerly eutrophicated
lake has been cleaned) while some are consumed less (e.g. video game consoles in this case).
These changes in consumption are presumed to affect market prices. These effects are described
by 𝑝𝑖 . Let 𝑝0 refer to the vector of market prices in the initial situation, while 𝑝1 refers to the
vector of market prices in the final situation. Observe that all households encounter the same
prices in the market so the subscript ℎ does not appear with 𝑝.
Since income and market prices are also affected by an environmental improvement
project, it is more straightforward to use the indirect utility function 𝑣ℎwhich can be obtained
by maximizing the utility of household h with respect to its budget constraint 𝐼ℎ = 𝑝. 𝑥ℎ.
Substituting the direct utility function by the indirect one yields:
𝛥𝑈ℎ01 = 𝑣ℎ(𝑝1 , 𝐼ℎ
1, 𝑧1) − 𝑣ℎ(𝑝0, 𝐼ℎ0, 𝑧0), (2-6)
where 𝑣ℎ(p1, 𝐼ℎ1, 𝑧1) denotes the maximum utility household ℎ can obtain from consuming the
optimal consumption bundle 𝑥ℎ1, given market prices 𝑝1 , income 𝐼ℎ
1, and environmental state 𝑧1.
Similarly, 𝑣ℎ(𝑝0, 𝐼ℎ0, 𝑧0) refers to the maximum utility household h can obtain from consuming
the optimal consumption bundle 𝑥ℎ0, given market prices 𝑝0 and income 𝐼ℎ
0 in the environmental
state 𝑧0. When it comes to the assessment of utility difference as expressed in (2-5) and (2-6),
both expressions are not useful as neither direct utility function nor indirect utility function is
observable. In order to derive a welfare measure that satisfies both the indicator and
computability conditions, another form of expressing a preference ordering has to be employed,
i.e. the expenditure function 𝑒ℎ. The expenditure function 𝑒ℎ(𝑝, 𝑧, 𝑈ℎ) refers to the minimum
amount of money a household must spend at given prices p and environmental state 𝑧 in order
to attain the utility level 𝑈ℎ. An important property of the expenditure function is that it is strictly
17
increasing in 𝑈. That is, at a given level of market prices 𝑝 and environmental state 𝑧, an increase
in household utility must be accompanied by an increase in monetary expenditure. This is why
this function is also called money-metric utility function. Given this strict relationship between
household expenditures and household utility level, a household’s utility can be measured in
terms of the monetary expenditures.
Once equipped with the expenditure function, it is now possible to measure household
welfare changes accruing from environmental projects. For this purpose, two prominent welfare
measures developed by John Hicks (Hicks 1942), the equivalent variation (EV) and the
compensating variation (CV), will be highlighted. The basic idea of these two measures is
simple. The magnitude of a utility change of a household resulting from an environmental
project can be indicated by the difference between the two levels of expenditure which are
necessary for a household to obtain two levels of utility in the initial situation 𝑈0 and final
situation 𝑈1. It is necessary to assess the levels of expenditure of the household to attain 𝑈0 and
𝑈1. However, as market prices 𝑝𝑖 and environmental states 𝑧𝑖 also vary between the two
situations (before and after project implementation), one needs to fix both 𝑝𝑖 and 𝑧𝑖 at an
arbitrary level. The two Hicksian welfare measures CV and EV are different only in terms of
the states of the environment 𝑧𝑖and market prices 𝑝𝑖 chosen as reference points for the
expenditure function. Equivalent variation is defined with an initial state of the environment 𝑧0
and an initial state of market prices p0 as reference points, and can be expressed as:
𝐸𝑉ℎ01 = 𝑒ℎ(𝑝0 , 𝑧0, 𝑈ℎ
1) − 𝑒ℎ(𝑝0 , 𝑧0, 𝑈ℎ0)
= 𝑒ℎ(𝑝0 , 𝑧0, 𝑈ℎ1) − 𝐼ℎ
0. (2-7)
The basic idea behind EV can be seen clearly from equation (2-7). EV is just the difference
between: 1) the expenditure level that would be necessary for a household to obtain i ts final
utility level (after implementation of the project) before prices and the state of the environment
change (i.e. 𝑒ℎ(𝑝0 , 𝑧0, 𝑈ℎ1)); and 2) the level of expenditure that would be necessary for that
household to obtain the initial utility level (before implementation of the project), given the
initial level of prices and state of the environment (i.e. 𝑒ℎ(𝑝0 , 𝑧0, 𝑈ℎ0)). Since it is assumed that
there is no private saving, the expenditure level in the initial state is equal to the initial level of
income 𝐼ℎ0. When the environmental project increases household utility, i.e. 𝑈1 > 𝑈0, EV can
be interpreted as the minimum amount of money that should be given to a household to forgo
the benefit (utility increase) it will receive if the project is implemented. This amount of money
18
is known as “willingness to accept” (WTA). On the other hand, if a project causes negative
effects on household utility (𝑈1 < 𝑈0), EV will be equal to the maximum amount of money
that a household is willing to give up to prevent this project. This EV is referred to as
“willingness to pay” (WTP). In simpler terms, this is the amount of money that can be extracted
from the household so that it feels equivalently worse off as if the project had been implemented.
While the concept of EV is based on the initial state of market prices 𝑝0 and environment
𝑧0, CV employs the final state of market prices 𝑝1 and environment 𝑧1 as reference points, and
can be expressed as:
𝐶𝑉ℎ01 = 𝑒ℎ(𝑝1 , 𝑧1, 𝑈ℎ
1) − 𝑒ℎ(𝑝1 , 𝑧1, 𝑈ℎ0)
= 𝐼ℎ1 − 𝑒ℎ(𝑝1 , 𝑧1, 𝑈ℎ
0). (2-8)
From equation (2-8) it can be seen that CV measures the utility change by the difference between
the new household income 𝐼ℎ1 and the hypothetical income that would be necessary to keep the
household at its initial utility level after prices and environmental quality have changed
(Ahlheim 2002). When a public project increases a household’s utility (i.e. 𝑈1 > 𝑈0), CV is
equal to the amount of money that can be subtracted from the household and leave it as well off
as before the implementation of the project. When a public project has negative effects on a
household’s utility (i.e. 𝑈1 < 𝑈0), CV can be interpreted as the minimum amount of money that
a household will accept as compensation for its loss of utility and still feel as good as it felt
before the project was implemented. On the one hand, CV – as the minimum amount of money
to compensate for utility loss of a household – is interpreted as WTA. On the other hand, CV –
as the maximum amount of money that can be taken away from a household and still leave it as
well off as before the project – is referred to as WTP.
In practice, CV is preferred to EV. This is because the interpretation of CV as WTP for a
utility improving environmental change and as WTA compensation for a utility decreasing
environmental change is more intuitive than the respective interpretations of the EV. In addition,
it might be easier to convey the basic idea of CV to the respondents of environmental valuation
surveys. That is, it might be more meaningful to ask respondents how much they are willing to
pay for an increase of utility (CV) instead of the prevention of a utility decrease (EV). It is also
more intuitive to ask respondents to accept compensation for their utility loss (CV of a utility
loss) than to ask about their willingness to forgo the benefit they would receive (EV of a utility
increase). The following consideration, therefore, will be limited to the compensating variation.
19
The term 𝐶𝑉ℎ01as specified in (2-8) cannot be empirically assessed. This is because one
cannot observe the term 𝑒ℎ(𝑝1 , 𝑧1, 𝑈ℎ0), which represents the hypothetical expenditure necessary
for the household to keep its initial level of utility when prices and the environmental state have
already changed. In order to assess it empirically, the 𝐶𝑉ℎ01 has to be reformulated by adding
additional terms (that sum up to zero), as follows:
𝐶𝑉ℎ01 = 𝑒ℎ (𝑝1 , 𝑧1 , 𝑈ℎ
1) − 𝑒ℎ(𝑝0 , 𝑧0, 𝑈ℎ0) +
𝑒ℎ(𝑝0 , 𝑧0, 𝑈ℎ
0) − 𝑒ℎ(𝑝1 , 𝑧0, 𝑈ℎ0) +
𝑒ℎ(𝑝1 , 𝑧0, 𝑈ℎ0) − 𝑒ℎ(𝑝1 , 𝑧1, 𝑈ℎ
0). (2-9)
From (2-9), different components of the Hicksian compensating variation 𝐶𝑉ℎ01 become clear.
The difference in the first row of (2-9) represents the compensating variation that is induced by
the change in household income and can be denoted with 𝐶𝑉𝐼ℎ01. The difference in the second
row of (2-9) equals the compensating variation resulting from the changes of market prices, so
an alternative expression is 𝐶𝑉𝑃ℎ01. The difference in the last row of (2-9) is the change in the
household’s utility resulting from the change of environmental quality and can be denoted with
𝐶𝑉𝑍ℎ01. As a result, the total compensating variation 𝐶𝑉ℎ
01 can be represented by the sum of
three partial compensating variations according to
𝐶𝑉ℎ01 = 𝐶𝑉𝐼ℎ
01 + 𝐶𝑉𝑃ℎ01 + 𝐶𝑉𝑍ℎ
01. (2-10)
The separation of the total compensating variation 𝐶𝑉ℎ01 into the three partial compensating
variations is very useful as there exist computation techniques for the empirical assessment of
each of the three partial compensating variations. The expression 𝐶𝑉𝐼ℎ01, for a start, can be
calculated by finding the differences between the initial level of household income (before
implementation of the project) and the final level of household income (after implementation of
the project) for all households in society. This can be expressed as:
𝐶𝑉𝐼ℎ01 = 𝑒ℎ(𝑝1 , 𝑧1, 𝑈ℎ
1) − 𝑒ℎ(𝑝0 , 𝑧0, 𝑈ℎ0) = 𝐼ℎ
1 − 𝐼ℎ0 = 𝐼ℎ
01. (2-11)
The expression 𝐶𝑉𝑃ℎ01 can be written in an alternative form. According to the Fundamental
Theorem of the Differential and Integral Calculus:
20
𝐶𝑉𝑃ℎ01 = 𝑒ℎ(𝑝0 , 𝑧0, 𝑈ℎ
0) − 𝑒ℎ(𝑝1 , 𝑧0, 𝑈ℎ0) = − ∫ ∇𝑝𝑒ℎ(𝑝, 𝑧0, 𝑈ℎ
0)𝑝1
𝑝0 𝑑𝑝. (2-12)
According to Shephard’s Lemma, equation (2-12) then reads:
𝐶𝑉𝑃ℎ01 = − ∫
ℎ(p, 𝑧0, 𝑈ℎ
0)𝑑𝑝𝑝1
𝑝0 , (2-13)
or the integral over the vector of Hicksian demand functions between the initial and final levels
of market prices. Though the Hicksian demand functions are not observable, they can be
computed via information obtained from the Marshallian demand function (Vartia 1983). The
expression 𝐶𝑉𝑃ℎ01 can therefore be empirically assessed.
The only remaining challenge is the empirical assessment of 𝐶𝑉𝑍ℎ01. This expression can
also be written in an alternative form. According to the Fundamental Theorem of the Differential
and Integral Calculus:
𝐶𝑉𝑍ℎ01 = 𝑒ℎ(𝑝1 , 𝑧0, 𝑈ℎ
0) − 𝑒ℎ(𝑝1 , 𝑧1, 𝑈ℎ0) = − ∫ ∇𝑧𝑒ℎ(𝑝1 , 𝑧, 𝑈ℎ
0)𝑧1
𝑧0 𝑑𝑧. (2-14)
According to Shephard’s Lemma, equation (2-14) then reads:
𝐶𝑉𝑍ℎ01 = ∫ 𝜋ℎ
𝑧1
𝑧0 (𝑝1 , 𝑧, 𝑈ℎ0)𝑑𝑧 = 𝑊𝑇𝑃𝑍ℎ
01, (2-15)
where 𝜋 is the vector of shadow prices of environmental quality. These shadow prices are equal
to the marginal expenditure for a unit of consumption of environmental quality 𝜕𝑒ℎ
𝜕𝑧. But since
the shadow prices of environmental quality cannot be observed an alternative method is needed
to reveal the actual benefit of the change in environmental quality. In practice, household utility
generated by an environmental project expressed as 𝐶𝑉𝑍ℎ01 can be elicited by different
environmental valuation methods, all of which aim to elicit the WTP of the households for the
change in environmental quality (𝑊𝑇𝑃𝑍ℎ01). Such a valuation forms part of the total welfare
change of household h from a public environmental project which consists of the utility changes
resulting from a change in income, a change in prices and a change in environmental quality
and can now be expressed by equation (2-16):
21
𝐶𝑉ℎ01 = 𝐼ℎ
01 + ∫ ℎ
(𝑝, 𝑧0, 𝑈ℎ0)𝑑𝑝 + 𝑊𝑇𝑃𝑍ℎ
01𝑝0
𝑝1 . (2-16)
It is now possible to identify whether the environmental project in question makes the individual
household better off, worse off, or as well off as it was at the initial situation (i.e. whether the
outcome of equation (2-16) is greater than, smaller than, or equal to 0).
After assessing the individual welfare changes for all households affected by an
environmental project (the identification problem), the problem of aggregating these individual
welfare changes into an indicator of the change in social welfare have to be addressed (the
aggregation problem). The solution to this aggregation problem is straightforward if all
households in society are better off or worse off as a result of the project in question. It is clear
that the project should be undertaken or called off, respectively. In these unambiguous cases,
the social decision can be derived directly from the information of individual welfare changes.
Unfortunately, projects which can generate unambiguous welfare changes are very rare. Most
environmental investment projects create both winners and losers. One group of people is
usually made better off at the cost of others. For these ambiguous cases, measures for changes
in social welfare resulting from environmental projects must be identified.
From Arrow’s Impossibility Theorem (Arrow 1963) it is known that under reasonable
conditions there exists no possible way to objectively and uniquely aggregate individual
preferences. The aggregation of individual preferences will lead, one way or another, to the
distributional judgment of welfare (i.e. how welfare should be weighted among different groups
of people), which is strictly prohibited in ordinal utility theory. However, this strict requirement
is usually relaxed for practical purposes. Practical CBA conventionally employs Hicks-Kaldor
criterion, also known as potential Pareto criterion (Hicks 1939; Kaldor 1939). The Hicks-Kaldor
criterion holds that if the losers (i.e. people who are made worse off) from a certain project can
be compensated by the winners (i.e. people who are made better off through the project), and
the winners would still be better off, the project could be considered to increase social welfare.
According to the Hicks-Kaldor criterion, an indicator of social welfare change can be computed
by adding up the individual compensating variation across all households affected by the project
as:
22
∑ 𝐶𝑉ℎ01
𝐻
ℎ=1
= ∑ 𝐼ℎ01
𝐻
ℎ=1
+ ∑ ∫ ℎ
(𝑝, 𝑧0, 𝑈ℎ0)𝑑𝑝
𝑝0
𝑝1
𝐻
ℎ=1
+ ∑ 𝑊𝑇𝑃𝑍ℎ01
𝐻
ℎ=1
(2-17)
∑ 𝐶𝑉ℎ01
𝐻
ℎ=1
>
= 0 <
⇒ ∆𝑊01 >
= 0 <
(2-18)
where ∆𝑊01 denotes the change of social welfare between situations 0 and 1. A strictly
negative balance of the aggregate CV is an indicator of a decrease in social welfare resulting
from the environmental project. A strictly positive balance of the aggregate CV indicates an
increase in social welfare resulting from the project. The positive balance of the overall CV also
implies that winners from the project are able to compensate losers for their welfare loss and at
least one winner would still be better off than before the project is implemented. However, such
compensations are never made in reality. This means that the Kaldor-Hicks criterion implies
interpersonal welfare comparisons, a step that is strictly prohibited in the realm of ordinal utility
theory. It is important to keep in mind that this aggregation exercise implies the use of arbitrary
political value judgments.
To calculate the Hicksian compensating variation for the whole society, it is necessary to
identify, for all households, income changes, and welfare changes from price changes and
environmental changes (see 2-17). These tasks are time and cost intensive and they make the
valuation of small environmental projects often not feasible. Therefore, a simplified version of
the appraisal method has to be found. This simplified approach relies on a comparison between
the aggregated individual benefits from the planned environmental project and the overall costs
of the project.
𝐵𝐶01 = ∑ 𝑊𝑇𝑃𝑍ℎ01
𝐻
ℎ=1
− 𝑝1𝑞 (2-19)
where 𝑝1𝑞 is simply the cost of the environmental project in question, 𝑝1 is the price vector of
all factor inputs 𝑞 that are involved in the implementation of the environmental project. The
total cost of the project, p1q, is compared to the benefit of the project, ∑ 𝑊𝑇𝑃𝑍ℎ01𝐻
ℎ=1 . The term,
∑ 𝑊𝑇𝑃𝑍ℎ01𝐻
ℎ=1 refers to the aggregate WTP of all households in society for the implementation
of the environmental project in question. Notice that in this simplified approach of the practical
CBA, the measurement of benefits focuses exclusively on the welfare change induced by the
23
change in environmental quality. The usual rule is that when a project’s benefit as measured by
∑ 𝑊𝑇𝑃𝑍ℎ01𝐻
ℎ=1 exceeds its cost, the project in question should be carried out; otherwise the
project should be abandoned, since it does not produce net welfare to society. In the next section,
a variety of environmental valuation techniques that have been developed to assess individual
WTP for environmental changes in the real world will be introduced and then discussed in detail.
2.2 Environmental valuation: Practice
In general, environmental valuation techniques have been categorized into two main categories:
indirect and direct methods. Indirect valuation techniques utilize information on the actual
consumption of market goods to draw conclusions about a household’s preference for non-
market environmental goods. This category consists of the averting behavior method (ABM),
the travel cost method (TCM), and the hedonic pricing method (HDM). As these indirect
methods reveal people’s preferences for non-market environmental goods through their
consumption of market goods, they are also called revealed preference methods. The direct
valuation methods include the contingent valuation method (CVM), attribute-based choice
modeling (ABCM), and the participatory valuation method (PVM). An essential component of
these techniques is that they directly ask respondents about their preferences for environmental
public goods. They utilize hypothetical market settings in which households have an opportunity
to state their preference for environmental goods. This is why these methods are also called
stated preference methods. In this section the indirect and direct methods will be introduced in
turn. Since this study will focus on the CVM as a model for the direct valuation approach, CVM
will be discussed in more detail.
2.2.1 Indirect methods
The indirect valuation or the revealed preference methods aim at the assessment of the use value
of environmental commodities using information revealed in the market, i.e. the households’
consumption of related market goods. An important assumption underpinning indirect methods
is the weak complementarity. Introduced by Mäler (1974), the concept of weak complementarity
has been widely used in the valuation of non-market goods based on observable market behavior
(Palmquist 2004). In short, the concept requires that there be a market good1 that is consumed
with the environmental good considered. For the weak complementarity to hold, it is assumed
1As it is often impossible to single out an obvious private good that is a weak complement to the environmental
good, Bockstael and Kling (1988) investigate the weak complementarity between the environmental good with
sets of market goods.
24
that the market good is non-essential or that there is a choke price at or above which the
consumption of the good falls to zero. Above the choke price, the changes in environmental
quality play no role in consumers’ well-being, i.e. the marginal utility of the environmental good
under consideration is zero. If the necessary kit for scuba diving becomes so expensive that
nobody dives, the marginal benefit of an increase in the quality of the coral reef is also zero.
One implication of the weak complementarity is that the benefits from the environmental
amenities can be approximately measured from the demand equation from its complementary
market good. Another important, though implicit, assumption underlying indirect methods is
that the representative households are assumed to have utility functions that are weakly
separable (Hanley and Spash 1993). This means that the demand curve for environmental quality
under consideration can be estimated while ignoring prices of all other goods. Going back to the
scuba diving example, the demand for scuba diving can be estimated independently of demand
for alternative goods, e.g. hiking (alternative leisure activity), or for rice (alternative non-leisure
consumption). In the following, the most frequently used revealed preference methods are
introduced.
Averting Behavior Method (ABM)
The idea underlying the ABM is the household production function theory of consumer behavior
(Abdalla et al. 1992). The name may seem odd at first sight. However this theory only states
that a household acquires consumption goods using various inputs. These input variables include
capital, labor, as well as other consumption goods and environmental qualities. To illustrate,
households may combine three inputs, say, the ground water in their properties, their manpower,
and the water treatment equipment to produce a new commodity, for example drinking water.
Some of these inputs (e.g. ground water) may be subject to degradation (e.g. via pollution caused
by a manufacturer in the vicinity area). This triggers households to adjust their consumption
levels of other input goods (e.g. upgrading their water treatment facilities). Following this
reasoning, a change in environmental quality can then be appraised via changes in expenditures
for the consumption goods needed to compensate for the change in environmental quality.
Consider the effects of noise produced by an airport or highways as another example. Affected
households have to increase their expenses for necessary counter-measures to cope with the
noise problem, i.e. they might have to install sound-proof windows and air conditioners. In this
sense, averting expenditures can be taken as an approximate of WTP for changes of
environmental quality. The social benefits of a public policy or project aiming at the reduction
25
of noise can be estimated from the households’ averting expenditures that could be avoided
when the original source of pollution or noise is reduced.
Of course, for the averting expenditure to reflect the exact welfare effect on households
from the environmental changes, it must be a perfect substitute of environmental quality. But
this is rarely the case. Very often, households are not able to avert all the detrimental effects
from environmental degradations. Environmental changes might intrude individual utility
without any averting measures possible. Households are not able, for instance, to use the sound-
proof windows they purchase to eliminate the noise they experience in their backyards. In this
case, the averting expenditure will give an underestimation of the use value households would
receive from the reduction of noise. On the other side, it is also possible that the counter -
measures can be jointly consumed for other purposes. Sound-proof windows may not only
reduce the noise from the nearby airport but also save electricity bills by preventing heat losses.
Here, the expenditure for double-glazed windows gives an overestimate of the benefits from a
potential noise reduction program. Despite these shortcomings, the ABM is still favored by
some researchers due to its simplicity. Valuation studies applying the ABM usually revolve
around limited topics, such as air pollution, and pest control (Abrahams et al. 2000; Wu and
Huang 2001).
Travel Cost Method (TCM)
One of the first methods developed to estimate the demand for environmental amenities is the
TCM. The method was initiated in the context of the planning and management of outdoor
recreation (Wood and Trice 1958; Clawson and Knetsch 1966). The TCM assumes that traveling
to experience a recreational site is costly, and that the travel costs incurred by individuals can
be taken as an indicator of the benefits they will gain from enjoying the site. The types of travel
costs in the TCM usually include costs for transportation like gasoline and train or bus tickets.
It also takes into account other out-of-pocket expenses that are necessary to enjoy environmental
amenities, e.g. entry fees, on-site expenditures and equipment like fishing boats, lifejackets, or
swimming suits. As the travel costs increase with distance, it is usually observed that the
visitation rate diminishes at greater distances from the site. In principle, treating the differential
costs as prices means that the demand curve for recreational visits can be derived. The resulting
area under the demand curve gives an estimate of the total consumer surplus accruing to visitors
to the recreational site (Hanley and Spash 1993). The TCM has been applied to assess social
26
welfare generated by a wide range of recreational sites, e.g. coral reefs, islands, forests, and
national parks (Shrestha et al. 2002; Bhat 2003; Chen et al. 2004; Ahmed et al. 2007).
However, the TCM suffers from a number of theoretical and practical shortcomings. With
regard to its theoretical basis, Ahlheim and Frör (2003) point out that since the demand functions
estimated by the TCM are of the Marshallian type (i.e. the demand derived from observation in
the competitive market), their integration generates all the problems known from the discussion
of the Marshallian consumer surplus (e.g. path-dependency of the integral). This does not lead
to CV because Hicksian demand functions would then be needed. Another shortcoming of the
TCM regards the calculation of travel cost. Equipment purchased for the purpose of enjoying
environmental goods is durable and can be utilized for other purposes, as well. This problem is
similar to that mentioned in the ABM. Hiking boots can of course be used for more than one
trip. The allocation of its cost to one single trip is disputable (Randall 1994). The same applies
to multi-purpose trips. Travelers usually visit several places in one single trip. They may also
use the opportunity of the trip to visit their relatives or old friends in the area. In this case,
specifying costs for one particular site incurred by a household is problematic. Neglecting these
problems altogether will lead to an overestimation of the travel cost necessary to enjoy a certain
recreational site and thus the individual welfare that households obtain from this site. The second
difficulty relates to the valuation of time. Apart from out-of-pocket expenses, the TCM usually
includes the value of time in the calculation of the travel cost. It is unclear, however, which part
of the time should be counted as travelling costs. The opportunity cost of time is also far from
obvious. A fraction of personal wage is often used as a value of time (Fix and Loomis 1998;
Liston-Heyes and Heyes 1999). But this can be problematic as an individual usually spends his
or her holiday for travelling.
Hedonic Pricing Method (HPM)
The last revealed preference method to be discussed is the Hedonic Pricing Method (HPM).
What distinguishes the HPM from other indirect valuation techniques is its basic premise: that
a commodity possesses various characteristics, and it is these characteristics that give rise to
individual utility. It can then be derived that people place value on a commodity according to
its attributes, and that price of a commodity should reflect its attributes (Lancaster 1966).
According to this assumption, the price p of a commodity is the function of its various
characteristics 𝑥1, 𝑥2, … , 𝑥𝑛 and can be expressed as:
27
𝑝 = 𝑓(𝑥1, 𝑥2, … , 𝑥𝑛). (2-20)
Consider the real-estate market as an example. The price of an apartment is determined by its
general attributes, such as total area, number of bedrooms, quality of construction materials,
basic infrastructure, etc. To apply the HPM to environmental valuation, it is further assumed
that at least one of the n characteristics of the commodity is related to an environmental quality.
The price of the apartment, for instance, also reflects characteristics related to environmental
qualities, such as air quality in the area or a possible lake view. By means of the HPM, the value
of these environmental quality aspects can be estimated.
In general, there are two steps of the HPM technique (Hanley and Spash 1993). The first
step involves an estimation of the relationship between the environmental characteristic 𝑥𝑖 and
the price of the related market good, i.e. the function 𝑓(. ) in (2-20). The partial derivative of the
price with respect to the environmental characteristic 𝜕𝑝
𝜕𝑥𝑖 is equal to the marginal cost of buying
one additional unit of that characteristic and, if the real-estate market functions perfectly, the
marginal benefit of a one unit increase in that characteristic. The second step of the HPM is to
estimate a demand curve for the environmental quality in question using the information gained
from step one. The calculation procedure, however, depends critically on the assumptions about
the supply side of the real-estate market.
A number of drawbacks of the HPM must be mentioned. First, the HPM assumes that the
market under consideration is in equilibrium, i.e. all buyers have perfect information and they
can move to the utility-maximizing position. This is rarely the case in reality. Estate agents have
considerable incentives to exaggerate the positive aspects of an apartment, often including
associated environmental quality aspects. They also have incentives to play down the negative
aspects. The choice that buyers make based on this information may not be consistent with what
they would have chosen if they had had the complete set of information. The consequence is
that HPM estimates may not represent the value an individual actually places on a particular
environmental good. A similar problem also arises if there is a limited variety of apartments in
the real-estate market. As a consequence of this limited supply the observed prices may not
equal market prices that would have evolved in equilibrium. Second, the HPM elicits social
benefits generated from the environment at its present level of quality. However, some buyers
may know in advance about possible future changes of environmental quality and complete a
market transaction based on their expectations of future changes. The implicit prices of
environmental quality derived from the present prices of real estate would be overestimated as
28
a result (Hanley and Spash 1993). Third, it is usually the case that the number of combinations
of characteristics of a good is limited. For example, only a limited number of different varieties
of apartment is available in the real-estate market. Individuals cannot freely configure their
preferred characteristics of the apartment. Consequently, the consumers may not be able to
completely express their preference.
All of the indirect valuation techniques reviewed in this section offer two common
advantages. First, they deal with the actual consumption and production behavior in a
competitive market. It is well-known that actual market behavior is the most reliable source of
information on individual preferences. Second, in these valuation techniques, participants are
tasked with simple questions (if individuals have to be directly asked at all). They are not
overloaded with cognitive tasks but merely asked about their daily activities (e.g. their counter-
measures against air pollution). In spite of these advantages, the application of the revealed
preference methods is rather limited. As indirect valuation methods rely on actual market
behavior, such methods cannot be used to value projects that will lead to the future change of
environmental quality. Another, perhaps more important, disadvantage of these methods is that
the market-related data obtained in the framework of these techniques can only capture the use
values of the natural environment. These techniques cannot capture non-use values (e.g.
existence value, quasi-option value, or bequest value) since non-use values have no behavioral
trail for economists to follow (Krutilla 1967). The discussion of shortcomings of the valuation
techniques reviewed in this section paves the way to the next section, in which the direct
valuation methods are reviewed.
2.2.2 Direct methods
The direct valuation methods rely on statements made by households regarding the welfare they
expect from the implementation of a particular environmental project. The core element of all
of these methods is the survey in which non-market environmental goods are described in detail.
Thereafter, a framework is introduced to respondents in which they are asked to express their
appreciation for the environmental goods provided by that project in terms of their WTP or
WTA. Since all aspects of the goods can be presented including their use- and non-use aspects,
respondents are expected to realize the total economic value these environmental goods. Thus,
household responses are assumed to capture the whole range of environmental values, both use
and non-use values. It is also possible to use direct valuation methods to appraise the social
benefits expected from an environmental project that is not yet implemented and thus assess
29
future expected benefits. In this section, three methods classified in this methodological category
are presented.
Contingent Valuation Method (CVM)
The CVM is by far the most prominent direct valuation technique. It relies on extensive surveys
with a representative sample of the population likely to be affected by some environmental
project. In a CVM interview, which can be conducted face-to-face, by mail, or by telephone, a
detailed description of the project in question (project scenario) is presented to the respondent.
Thereafter, the respondents encounters a hypothetical market setting in which they are given the
opportunity to express their maximum WTP to support the environmental project proposed, or
to go without it. The empirical WTP responses obtained from the respondents are taken to be a
monetary expression of the utility level they expect from the planed environmental project. To
calculate the social values of the project, the mean WTP is estimated from the sample of
surveyed households and then multiplied by the total number of households living in the area
affected by those environmental improvements. Although it is capable of assessing the total
economic value of environmental goods, the CVM has attracted criticism regarding the
reliability and validity of the WTP it produces (Desvousges et al. 1993; Diamond and Hausman
1993). As the CVM constitutes the main focus of this study, its procedures are discussed in more
detail in section 2.3. The quality of the welfare estimates from the CVM is discussed in section
2.4. Before that, this section briefly introduces the participatory valuation method (PVM) and
attribute-based choice modeling (ABCM).
Participatory Valuation Method (PVM)
It has been mentioned earlier in Chapter 1 that one methodological weakness of the CVM is that
it requires a high cognitive effort from the respondent when being asked to state a WTP for an
environmental good. Respondents have to form an exact idea regarding the benefits of the
environmental amenity they may have never heard of before (in terms of its use- and non-use
benefits). There is no place for them to try out how the benefits from the project feel like. In
addition to that, CVM respondents have to complete all these tasks within a limited amount of
time. In response to these limitations, participatory valuation methods (PVM) have been
devised. To date, there are two main methods in this category: citizen juries (CJ) (Sagoff 1998;
Kenyon and Nevin 2001) and the market stall approach (MS) (Macmillan et al. 2002; Álvarez-
Farizo et al. 2007). Both the CJ and the MS approach make use of the idea of a micro-society in
30
which a number of participants are randomly selected to symbolically represent the entire
society in a workshop setting; they then decide about issues regarding public goods. PVM
meetings, as specified in the CJ and the MS approach, involve from 6 to 16 respondents who
come together, form small groups, and discuss and deliberate about an environmental project
over a number of days. During these meetings, participants are provided with extensive
information about the proposed program, and are allowed to question experts and stakeholders
and discuss evidence with other participants, thereby gradually increasing their understanding
of the issue. In the CJ participants are grouped together and treated in a jury-like manner. The
CJ does not necessarily aim to produce quantitative WTP estimates. Rather it expects qualitative
information received from the preference construction process of participants, which can be
closely monitored during the meeting, and also a consensus outcome which reflects the public
interest. On the contrary, the primary intention of the MS approach is to produce WTP estimates
using a participatory approach. The MS consists of groups of 6-10 respondents. The meetings
are held two to three times, approximately one week apart from each other. Between meetings,
respondents are given an opportunity to discuss the issues with their families, and jot down the
results in a notebook provided. They can then talk about their feelings in the group meeting held
the following week. The MS approach is expected to circumvent the CVM’s problem of
conveying the complexity of environmental goods the limited time of the survey interview,
while also producing WTP estimates (Lienhoop and MacMillan 2007).
As with other valuation methods, the CJ and the MS have drawbacks. First, both are
conducted with small groups of respondents. Hence, the sample size of a study applying either
technique cannot be statistically representative of the whole population affected by an
environmental project. The second shortcoming of these methods is that participants in the
valuation workshops may be pressured by the group norm and therefore cannot express their
true feelings. It is therefore the task of the moderator to ensure that no individual is allowed to
overly take the floor to persuade other participants. However, the actions of the moderator
should also be closely monitored, as this person plays an important role in leading the group
discussion and eliciting conclusions from the group. The sensitivity of valuation outcomes to
the role of the moderator might impair the validity of the results. The third drawback is that, as
the CJ and the MS provide participants with more time regarding the discussed topic, this may
allow participants to act strategically with regard to their WTP response rather than report
truthfully. It can therefore be concluded that neither the CJ nor the MS are good substitutes for
the conventional CVM. Nonetheless, they may be a perfect complement for CVM studies in
31
providing practitioners with qualitative data assisting the interpretation of quantitative results of
a CVM survey.
Attribute-Based Choice Modeling (ABCM)
The basic premise of the ABCM is similar to that of the HPM: any particular consumption good
is assumed to generate utility through its attributes. A waterfall for example, can be decomposed
into its utility generating characteristics like water quality, water quantity, its scenery, wildlife
habitat, and road access. The ABCM is devised in order to estimate the welfare effects that each
of these environmental attributes produces for individuals. This marks the basic difference
between the CVM and the ABCM. The ABCM is interested in assessing the values of different
attributes of an environmental good whereas the CVM focuses on eliciting the value of an intact
environmental asset described in one single scenario. In an ABCM survey, alternative versions
of the same environmental good (each differing in one or several of its basic attributes) are
presented to respondents. For instance, the respondents may have to consider different versions
of the same waterfall one of which may have excellent water quality and fair road access while
another has fair water quality but excellent access. An important characteristic of the ABCM is
that one of the attributes of the good must be the price necessary for the provision of that good.
Because price is included as one of the attributes of the goods, WTP for each attribute can then
be calculated (Hanley et al. 2001b, p.436).
The ABCM refers to different valuation methods that employ the basic valuation approach
described above. These techniques only differ in the way respondents are asked to express their
choices over the variations of the good in question. These techniques include discrete choice
experiments, contingent ranking, contingent rating and paired comparisons (Hanley et al. 2001b;
List et al. 2006). Discrete choice experiments present to respondents variations of the same good
each differing in the level of one or several characteristics. From the available alternatives,
respondents are asked to select the most preferred one. This method is similar to the CVM in
the sense that it asks respondents to choose between the proposed alternatives. In the CVM,
respondents either pay for the project and enjoy environmental improvements or refuse to pay
and remain at the status quo. For discrete choice experiments to produce theoretically consistent
welfare estimates, a baseline alternative corresponding to the status quo must be presented in
the choice set (Bateman et al. 2002, p.251). In a contingent raking survey, participants are
required to rank a set of alternative versions of the good. Similarly, the welfare estimates
produced from the contingent ranking are theoretically accurate only if a baseline situation
32
representing the status quo is presented to respondents. If such a no-change alternative is not
offered, they might be forced to choose one alternative which they may not prefer at all
(Bateman et al. 2002, p.252). The contingent rating method does not require respondents to
make explicit comparisons between the alternatives. Instead it demands participants to rate each
of the variations of the good on a semantic or a numerical scale. As no explicit trade-offs are
made between the choices, the contingent rating method does not give welfare estimates that are
consistent with utility theory. In a paired-comparison survey, respondents have to select the
preferred alternatives of a set of two. They are also asked to indicate the strength of their
preference on a semantic or numerical scale. The latter feature makes estimates from this method
not consistent with economic theory, i.e. with ordinal utility theory. So, results of a paired
comparison surveys cannot be applied in CBA.
Proponents of ABCM point out that the method is more informative than CVM studies,
as respondents get multiple chances to express their preferences for valuing the good (Rizzi and
Ortúzar 2003; Hall et al. 2004; Xu et al. 2006; Wang et al. 2007). They also argue that the
ABCM minimizes the risk with respect to biases created by respondents since it does not directly
ask survey participants for explicit WTP statements. WTP is estimated indirectly from
respondents’ choices stated in the survey. On a closer look, however, it can be seen that ABCM
still suffer from two major shortcomings. First, it is clear that respondents in ABCM surveys are
required to make tremendous cognitive efforts. It has been mentioned before that the cognitive
burden for CVM respondents is high due to the hypothetical nature of the interview. This goes
one step further in ABCM. Participants do not only face the difficulty of forming the exact idea
about a project that might possibly still not yet exist, but they also have to consider more than
two variations of the same project and also have to make the trade-offs between different
attributes. Second, it is extremely difficult for researchers to design the choice set that constitutes
of both credible and feasible levels of attributes of the good. Too far-fetched choice sets may
induce survey participants to give unrealistic responses. A crucial point is to assign reasonable
price levels that are coherent with the levels of attributes of the good (Bateman et al. 2002,
p.261). Yet despite all these difficulties, ABCM offer promising valuation methods that
incorporate advanced econometric techniques with the theory of rational and probabilistic
choice. However, this set of methods also suffers from the complexity of its survey design
which, at this point in time, seems inevitable.
33
2.3 The Contingent Valuation Method
The CVM is the most intuitive and simplest method to assess the welfare change that individuals
expect from some environmental project. The method is intuitive because it asks respondents
directly about their own expected welfare changes resulting from this project. It is simple
because there is only one scenario and one trade-off decision involved. Due to its promising
features, the CVM is chosen as environmental valuation method in this study. This section
consists of two parts. The first part deals with details of the CVM interview and questionnaire
design, the second part with the analysis of CVM data.
2.3.1 Survey administration and questionnaire design
CVM studies usually begin with the specification of the relevant populations. The aim here is
to minimize potential biases arising from the choice of the population. There are two approaches
to define the population of interest in a CVM survey (Carson and Hanemann 2005). The first
approach is a political one. The survey may aim at the assessment of welfare of a specific group
of people such as people who live in a certain political jurisdiction. So, defining the population
according the political approach is rather straightforward.
The second approach to define the relevant population is an economic one. This approach
incorporates all people who receive benefits and/or incur costs of the project considered. As a
general guideline, three categories of population must be considered: the cost bearers, the user
population, and the non-user population (Bateman et al. 2002). The identification of the cost
bearers and the user population is relatively easy. The cost bearers are those who have to pay
for the project if it is implemented. The user population contains people who obtain utility from
the project by directly or indirectly using the resources it provides. The users of a project
intending to clean up small canals in a city, for instance, would constitute citizens who dwell
near the canals, those who commute via boats to their work places, people who jog along those
canals, etc. The non-user population refers to those who hold non-use values for the project’s
outcomes. They are more difficult to determine as there is not necessarily a spatial link between
an environmental project’s outcome and those that hold non-use values for it. Strictly speaking,
if the environmental good is extremely unique, the non-user population can be the national or
even global population. However, while an environmental good may generate economic values
for an individual living far away, such individuals may be few and far between. For practical
purposes, some author has recommended the use of so-called distance-decay approach to
estimate the distance beyond which economic value of an environmental good is approaching
34
some arbitrary small value (e.g. Hanley et al. 2003). This is under the assumption that as
distance from an environmental good increases, the average values per household will decrease.
Yet, the influence of distance decay on the values of an environmental good is not
straightforward and depends on many factors such as the resource types (Hanley et al. 2003;
Rolfe and Windle 2012) and the choice of welfare measure (Bateman et al. 2006).
After the identification of the relevant population, a representative sample of this
population has to be selected. Ideally, all the citizens affected by the proposed project should be
included in the survey. Nonetheless, due to the time and budget constraints, CVM researchers
cannot interview the whole population. An alternative is to conduct interviews only with a group
of sample households that can represent the whole population of interest. The representativeness
of these households is very important. It ensures that the estimated mean WTP can be
meaningfully extrapolated to obtain the social value of the project for the whole population
affected. This means that non-probability sampling methods – such as convenience sampling,
by which respondents are selected only because they are in the right place at the right time – are
not appropriate for CVM surveys. Instead, various probability sampling methods (e.g. simple
random sampling, or cluster sampling) can be applied (Churchill and Lacobucci 2002). In every
CVM study, the representativeness of the household sample should not be taken for granted and
should always be evaluated.
Closely linked to the choice of the target population and the sampling method is the choice
of the survey mode. CVM surveys can be conducted as in-person surveys e.g. employing face-
to-face or telephone interviews, or in a self-administered way as mail or internet surveys.
Choosing the appropriate survey mode is crucial because it determines the list of households
from which the sample will be drawn. The key is to have the sample frame that is consistent
with the target population. For instance, a mail survey is not suitable if the population of interest
is dwellers in a mountainous area where access to postal services may be limited. Conducting a
face-to-face survey is more appropriate in this case. In addition, the choice of survey mode is
important because it can affect the WTP stated by survey respondents (Loomis and King 1994;
Ethier et al. 2000; Davis 2004). Of all modes, the face-to-face interview is claimed to be
superior. Data gathered from this mode of interview are regarded as the benchmark of CVM
results (Arrow et al. 1993). The decisive feature of the face-to-face survey is that it provides
possibilities for interviewer-respondent interactions. Interviewers can direct the sequence of
questions, manage complex WTP elicitation questions, and employ different media (e.g. print,
audio, or video) in the interview. If needed, respondents can also ask for clarification of any
unclear points of the scenario. The drawback of this mode is that the presence of the interviewer
35
may influence respondents’ answers (interviewer biases) and that respondents are only given a
limited of time to complete the questionnaire (Bateman and Mawby 2004; Davis 2004;
Svedsäter 2007). Eventually, the need for a large number of interviewers and their need to
physically visit respondents in their homes make face-to-face surveys one of the most costly
survey modes.
Questionnaire design
A properly-designed questionnaire is a prerequisite for any CVM survey. A number of studies
attempt to lay down general guidelines for the CVM survey instrument, such as Bateman et al.
(2002) or Mitchell and Carson (1989). The most notable attempt has been made by the blue-
ribbon panel commissioned by the National Oceanographic and Atmospheric Administration
(NOAA) in 1993 (Arrow et al. 1993). Many of the standards set by the panel are considered as
the “best practices” of the CVM until today. This section reviews the procedure of CVM studies
in detail. Important literature that should also be consulted include Carson and Hanemann
(2005).
A typical CVM questionnaire consists of five main parts. CVM interviews typically start
with a brief introduction of the survey: who is responsible for the survey, the survey objectives,
time of the interview, and what researchers intend to do with the survey results. If they agree to
participate in the survey, respondents are then presented with warm-up questions which are
intended to build up their confidence before they are asked questions that require more cognitive
effort. Thereafter, respondents are asked about problems with respect to the current
environmental state, their mitigation strategies at present, and their worries about the future of
the environmental good. It is expected that respondents’ memories with respect to the
environmental good in question is refreshed as they are guided through these questions, and are
asked to recall their experiences with the good.
The second part of the questionnaire contains a detailed description of the environmental
changes resulting from a planned environmental project. The description of the scenario is one
of the most crucial components of a CVM study because respondents are often unlikely to have
had direct experience with the proposed improvements. Consequently, utility changes expected
by respondents often depend solely on the information provided and the scenarios described.
The scenario presentation begins with a description of the current state of the environmental
good to be valued, its status quo. This includes its geographical extent, its utilization, and
problems associated with the use of the environmental good. Information regarding the
36
availability of substitutes which may affect respondents’ values should also be given.
Subsequently, respondents are presented with the planned improvements of the state of the
respective environmental good. They are provided with details of how these improvements can
be achieved, including measures to be carried out, the responsible organizations, and the
timeframe of the proposed program. The scenario must also describe the final state of the
environment after the project has been undertaken: what it will look like, and what will be the
expected benefits from the improvements. All these details are important for the respondents to
be able to imagine how much this project will increase their utility. The biggest challenge with
respect to the scenario presentation is to provide the optimal amount of information so as to
enable all individuals to make informed decisions on the one hand, and to avoid overloading
respondents with information on the other.
The third part of CVM questionnaire is the presentation of the hypothetical market setting.
This is the part where respondents are informed that in order for the proposed project to be
realized a contribution of the prospective beneficiaries, i.e. the households, would be required.
The hypothetical market is defined by the implementation and the payment rule. The
implementation rule identifies the conditions under which the project will be carried out. A
common implementation rule is a statement like: “the proposed environmental project will be
carried out only if the money collected can cover the costs for the implementation of the project.”
The payment rule specifies how the contributions to the project that households are going to
state in this study will be actually collected when the project is implemented. A common
payment rule is a statement like: “if the proposed project is implemented your household will
be asked to exactly the amount you stated in this study.” Another important aspect of the
payment rule, is the payment vehicle. The payment vehicle is the means by which respondents
can contribute to the project (e.g. tax increases, direct fees, or voluntary donations). In general,
coercive payments (fees and taxes) are preferred over other voluntary payment means, such as
donations. This is because donations are prone to the problem of “free riding”, which arises
when people want to enjoy the consumption of a public good but do not contribute to the costs
for its provision (Champ and Bishop 2001; Wiser 2007). Moreover, the payment should be
coercive because asking people to contribute voluntarily might reduce the credibility that the
fundraising objective will be achieved, and thus people may be less likely to reveal their true
WTP (Champ et al. 1997). In order to incentivize respondents to truthfully state the maximum
amount of money they are willing to contribute to the realization of the proposed project, the
specification of hypothetical market setting has to be done with extreme care.
37
The fourth part of the questionnaire is the WTP elicitation question. A cluster of different
elicitation question formats have been devised and tested over the years. The simplest method
is to directly ask respondents to state the exact amount of their WTP for the project: “What is
the maximum amount of money that you would be willing to pay for the project to be
implemented?” Other formats involve, for example, confronting respondents with predefined
“bids” for the proposed project which they can choose to accept (if their maximum amount of
WTP is equal to or higher than that proposed bid) or decline (if their maximum amount of WTP
is smaller than the proposed bid). An alternative method asks respondents to select from a list
of payment amounts that amount they are willing to pay to secure the realization of the proposed
project. It should be noted the different WTP question formats have been found to potentially
bias WTP answers given by respondents. Thus, this topic will be picked up and discussed in
more detail in the next section.
In the fifth part of the CVM questionnaire, respondents are usually presented with
attitudinal and socioeconomic questions. These questions aim to collect data regarding the
households’ social and economic conditions. Information obtained from this last section of the
questionnaire is used to estimate the determinants of WTP answers. The identification of WTP
determinants is useful because it enables policy makers to learn about the groups of people who
receive positive or negative consequences of the proposed environmental program. WTP
determinants can also be employed as internal validity tests to check whether stated WTP is
determined by certain respondent-specific variables as predicted by theory.
Elicitation question formats
As mentioned in the preceding paragraph, there are various elicitation methods. Here, three
major ones will be highlighted: the open-ended (OE), payment card (PC) and dichotomous
choice (DC) formats. For other formats, the reader should consult Bateman et al. (2002). The
basic idea of the OE elicitation format, which was widely used in the 1970s and 1980s, is to
directly ask survey respondent to specify the exact amount they are willing to pay for the
proposed project. The biggest advantage of this question format is that mean WTP of the sample
can be directly calculated as the average stated WTP by all respondents. However, the OE format
suffers from a number of problems, such as large non-response rates and high numbers of
outliers (Bateman et al. 1995). These problems stem from the fact that respondents are not
familiar with the task of valuing the environmental good in question, so they are uncertain about
the utility level that can be expected from the proposed project, let alone stating the exact amount
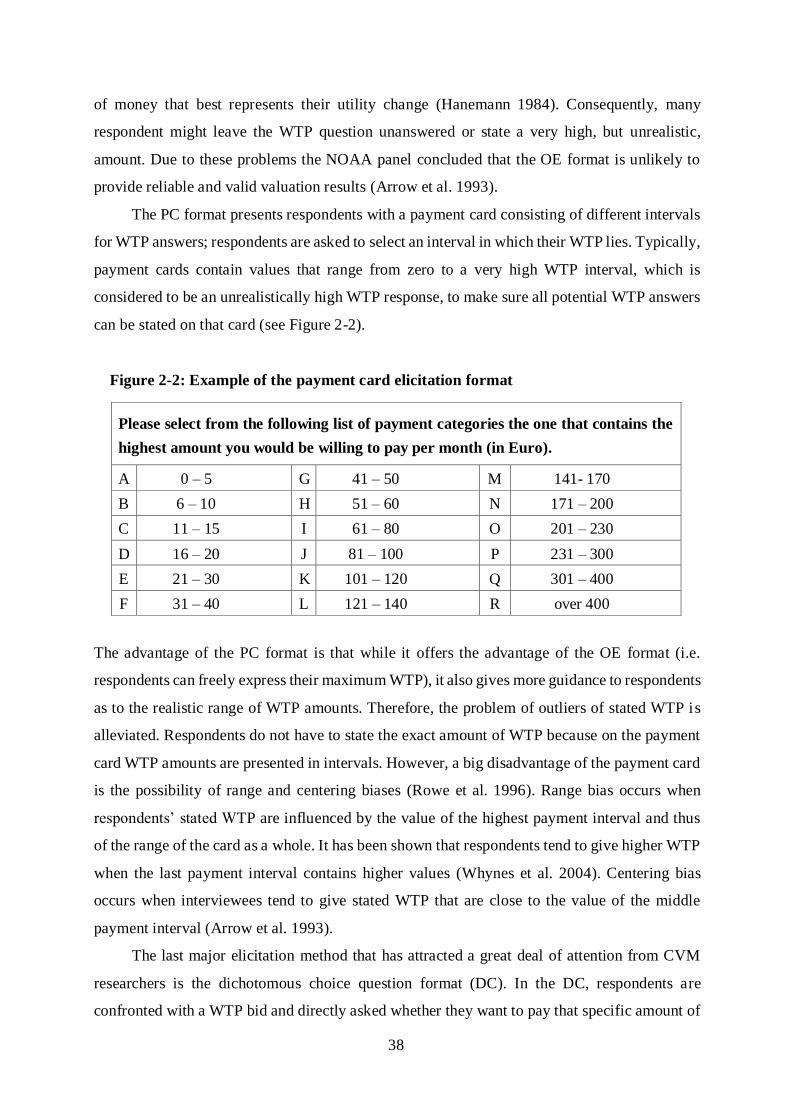
38
of money that best represents their utility change (Hanemann 1984). Consequently, many
respondent might leave the WTP question unanswered or state a very high, but unrealistic,
amount. Due to these problems the NOAA panel concluded that the OE format is unlikely to
provide reliable and valid valuation results (Arrow et al. 1993).
The PC format presents respondents with a payment card consisting of different intervals
for WTP answers; respondents are asked to select an interval in which their WTP lies. Typically,
payment cards contain values that range from zero to a very high WTP interval, which is
considered to be an unrealistically high WTP response, to make sure all potential WTP answers
can be stated on that card (see Figure 2-2).
Figure 2-2: Example of the payment card elicitation format
Please select from the following list of payment categories the one that contains the
highest amount you would be willing to pay per month (in Euro).
A 0 – 5 G 41 – 50 M 141- 170
B 6 – 10 H 51 – 60 N 171 – 200
C 11 – 15 I 61 – 80 O 201 – 230
D 16 – 20 J 81 – 100 P 231 – 300
E 21 – 30 K 101 – 120 Q 301 – 400
F 31 – 40 L 121 – 140 R over 400
The advantage of the PC format is that while it offers the advantage of the OE format (i.e.
respondents can freely express their maximum WTP), it also gives more guidance to respondents
as to the realistic range of WTP amounts. Therefore, the problem of outliers of stated WTP is
alleviated. Respondents do not have to state the exact amount of WTP because on the payment
card WTP amounts are presented in intervals. However, a big disadvantage of the payment card
is the possibility of range and centering biases (Rowe et al. 1996). Range bias occurs when
respondents’ stated WTP are influenced by the value of the highest payment interval and thus
of the range of the card as a whole. It has been shown that respondents tend to give higher WTP
when the last payment interval contains higher values (Whynes et al. 2004). Centering bias
occurs when interviewees tend to give stated WTP that are close to the value of the middle
payment interval (Arrow et al. 1993).
The last major elicitation method that has attracted a great deal of attention from CVM
researchers is the dichotomous choice question format (DC). In the DC, respondents are
confronted with a WTP bid and directly asked whether they want to pay that specific amount of
39
money to support the proposed project or not. Initially, there was only a single-bounded DC
question format, where only one WTP bid was proposed (Bishop and Heberlein 1979). Double-
bounded DC was proposed thereafter (Hanemann 1985). The double-bounded DC asks
respondents two consecutive questions. In case respondents agree to pay the first bid, the double-
bounded DC presents respondents with a higher bid and asks whether they still would pay this
higher amount. In case respondents reject paying for the first bid, they are confronted with a
lower WTP bid. It is clear that the double-bounded DC can extract more information from one
respondent than single-bounded DC. One of the advantages of the DC format is that its question
format is analogous to the market situation where people are confronted with a take-it-or-leave-
it type of decision. Therefore it might be easier for respondents to answer. Moreover, by
reducing choice set to a simple yes-no answer, the DC is able to induce a truthful revelation of
individual preferences. This means, respondents will always perceive it as their best choice to
agree to pay the bid if their appreciation for the project is as high as the bid amount.
Despite its advantages, a number of problems regarding the use of the DC format have
been discussed. WTP estimated from DC questions are prone to suffer from starting point bias
that is respondents are influenced by the amount of the initial WTP bid (Ryan et al. 2004). The
starting point bias may be caused by the fact that respondents are uncertain about the act
monetary amount that reflects their expected utility change. Consequently, they may think that
the initial bid represents a hint to the value of the good in question. Another explanation of the
starting point bias could be attributed to the so called “yea”-saying behavior (Ryan et al. 2004).
Yea-saying behavior happens when respondents feel tempted to accept the proposed bid by
saying yes irrespective of the amount of the proposed bid and the amount of their “true” WTP.
Apart from the widely observed starting point bias, the DC format requires a much larger sample
size than other elicitation formats in order to produce reliable benefit estimates. To sum
everything up, different elicitation formats have their own advantages and disadvantages which
should be considered when selecting the elicitation format for a CVM survey. In the next section,
the statistical methods used to analyze WTP data obtained from these different elicitation
questions will be introduced.
2.3.2 Analysis of CVM data
After collecting WTP responses from the sampled households in a CVM study, there are a
number of steps to statistically compute mean WTP of the sample. These technical steps are
needed because of three main reasons (Bateman et al. 2002). Firstly, the elicitation question
formats used in the CVM do not always produce precise figures for each household’s WTP. It
40
was mentioned that only the OE format produces precise WTP statements. Other formats such
as DC and PC produce only WTP statements as interval data. Secondly, only the sampled, not
all, households are interviewed for their stated WTP, which makes it necessary to determine the
level of confidence with which the sample means can be extrapolated to the whole population
in the sample frame. For these reasons, certain statistical methods are needed to estimate the
mean WTP which can then be multiplied by the total number of households in the population
to arrive at the social value of the proposed environmental project. Thirdly, a statistical
estimation must also be employed to find the determinants of WTP. Information on the
determinants helps researchers to identify the characteristics of households that obtain more or
less benefits from the environmental project. The information on which variables have an
impact on people’s WTP statements can also be used for the validation of WTP statements.
For the OE format which produces continuous WTP data, the calculation of mean WTP
is rather straightforward. No parametric models are required because when the OE format is
used, respondents are asked to state the exact amount of money that they would be willing to
pay for the program considered. The obtained WTP statements can simply be averaged to
produce the mean WTP of the survey sample. However, the result is the mean WTP of the
sample households but not of the population. The two are not necessarily identical because
sampling procedures naturally incur errors. To infer the population mean using the rather
unreliable sample mean, a confidence interval must be calculated. The confidence interval
indicates that range of values that the estimate of interest will assume with a specified level of
certainty. As general practices, researchers employ certainty levels of 90%, 95%, or 99%. For
example, the 95% confidence interval implies that from 100 times the sampling is repeated,
there are 95 times that the true parameter of the population falls in that interval. The following
formula is used: 95% confidence interval of 𝜇 = �̅� ± 1.96 (𝑆.𝐷.
√𝑁), where 𝜇 represents the mean
of the population, �̅� denotes the sample’s mean, S.D. is the standard deviation of the mean, and
√𝑁 is the square root of the sample size (Berry and Lindgren 1996).
Estimating the determinants of WTP for OE data is equally straightforward. Simple
regression techniques, usually Ordinary Least Squares regression (OLS), can be used. The
stated WTP is taken as the dependent variable and the socio-economic and attitudinal
characteristics are taken as the independent variables. But as OE datasets usually consist of a
high proportion of zero responses and no nonnegative WTP statements, the use of simple of
OLS will produce biased parameters. As a consequence, it is more correct to use parametric
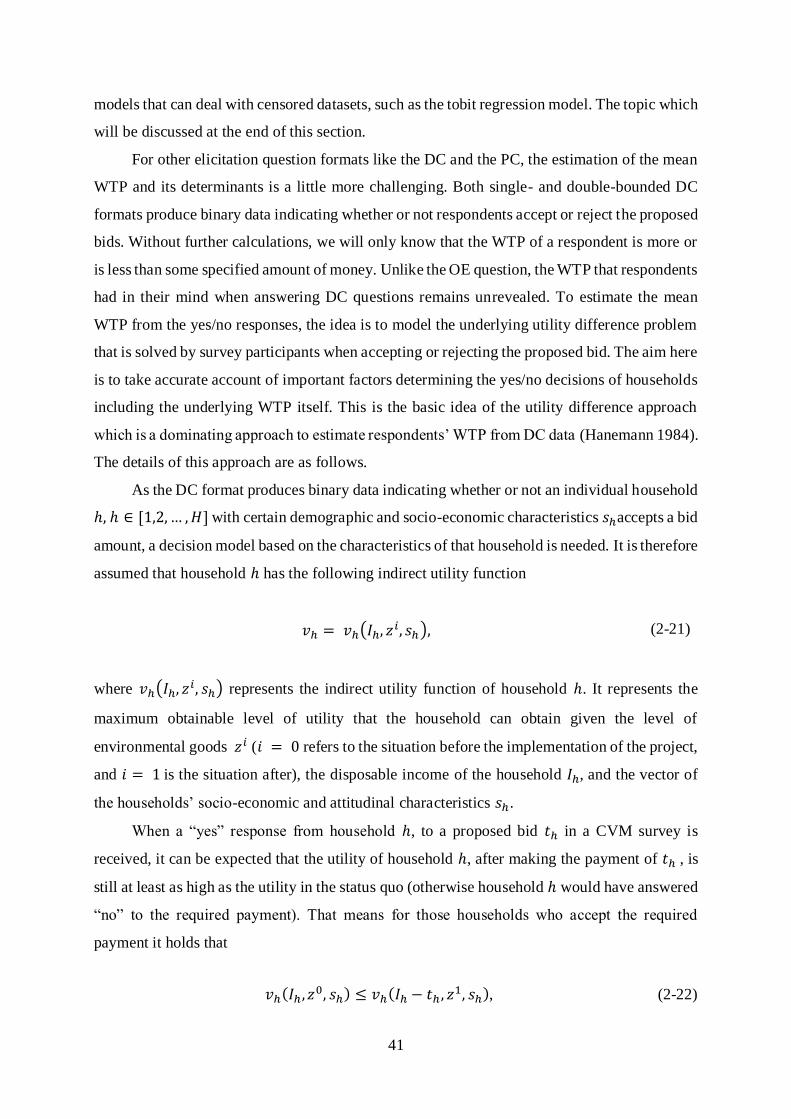
41
models that can deal with censored datasets, such as the tobit regression model. The topic which
will be discussed at the end of this section.
For other elicitation question formats like the DC and the PC, the estimation of the mean
WTP and its determinants is a little more challenging. Both single- and double-bounded DC
formats produce binary data indicating whether or not respondents accept or reject the proposed
bids. Without further calculations, we will only know that the WTP of a respondent is more or
is less than some specified amount of money. Unlike the OE question, the WTP that respondents
had in their mind when answering DC questions remains unrevealed. To estimate the mean
WTP from the yes/no responses, the idea is to model the underlying utility difference problem
that is solved by survey participants when accepting or rejecting the proposed bid. The aim here
is to take accurate account of important factors determining the yes/no decisions of households
including the underlying WTP itself. This is the basic idea of the utility difference approach
which is a dominating approach to estimate respondents’ WTP from DC data (Hanemann 1984).
The details of this approach are as follows.
As the DC format produces binary data indicating whether or not an individual household
ℎ, ℎ ∈ [1,2, … , 𝐻] with certain demographic and socio-economic characteristics 𝑠ℎaccepts a bid
amount, a decision model based on the characteristics of that household is needed. It is therefore
assumed that household ℎ has the following indirect utility function
𝑣ℎ = 𝑣ℎ(𝐼ℎ, 𝑧𝑖, 𝑠ℎ), (2-21)
where 𝑣ℎ(𝐼ℎ, 𝑧𝑖, 𝑠ℎ) represents the indirect utility function of household ℎ. It represents the
maximum obtainable level of utility that the household can obtain given the level of
environmental goods 𝑧𝑖 (𝑖 = 0 refers to the situation before the implementation of the project,
and 𝑖 = 1 is the situation after), the disposable income of the household 𝐼ℎ, and the vector of
the households’ socio-economic and attitudinal characteristics 𝑠ℎ.
When a “yes” response from household ℎ, to a proposed bid 𝑡ℎ in a CVM survey is
received, it can be expected that the utility of household ℎ, after making the payment of 𝑡ℎ , is
still at least as high as the utility in the status quo (otherwise household ℎ would have answered
“no” to the required payment). That means for those households who accept the required
payment it holds that
𝑣ℎ(𝐼ℎ , 𝑧0, 𝑠ℎ) ≤ 𝑣ℎ(𝐼ℎ − 𝑡ℎ , 𝑧1, 𝑠ℎ), (2-22)
42
The weak inequality in (2-22) can be inferred from any “yes” response to a DC question in a
CVM survey as long as the sampled households aim to maximize their utility, which this
approach assumes. Nonetheless, if the household answers “yes” for other reasons, e.g. to please
interviewers, the inequality (2-22) will not be applicable anymore. The design of a CVM study
must ensure that the “yes” response can be explained by (2-22). Further, the inequality (2-22)
implies that for the “yes” response to be meaningful, household ℎ must have a clear idea about
the change of its welfare between situations 0 and 1. If not, the WTP response, as well as its
statistical estimate, will not represent the actual utility changes that the household expects from
the project. In the next steps, the parametric version of the weak inequality in (2-22) shall be
introduced.
The weak inequality in (2-22) is of course only an illustration of what might happen in
respondents’ heads when giving a “yes” answer to the DC question format. The true rationales
for this answer are unobservable by nature. This means that the true form of 𝑣ℎ(𝐼ℎ , 𝑧𝑖 , 𝑠ℎ) is
unknown to the analyst. So the aim of this approach is the approximation of the real form of
𝑣ℎ(𝐼ℎ, 𝑧𝑖, 𝑠ℎ). This leads to the core idea underpinning the framework of the Random Utility
Model (RUM) as developed by McFadden (1974). According to the RUM, the true indirect
utility function of household ℎ consists of two parts: the deterministic term �̅�ℎ(𝐼ℎ, 𝑧𝑖, 𝑠ℎ).
representing the approximation of the real indirect utility function made by the analyst and the
stochastic term 𝜀ℎ𝑖 which refers to the part of the true indirect utility function that is
unobservable for the analyst and thus can only be taken into account implicitly. Household ℎ’s
level of utility can thus be expressed as:
𝑣ℎ(𝐼ℎ , 𝑧𝑖, 𝑠ℎ). = �̅�ℎ(𝐼ℎ, 𝑧𝑖, 𝑠ℎ). +𝜀ℎ𝑖 . (2-23)
The framework of the RUM shown in (2-23) will be used as a building block for the statistical
estimation of mean WTP and its determinants. Equation (2-22) will be transformed according
to the RUM framework. Further, the analyst can only investigate the WTP responses in terms
of probability. The probability of a respondent to accept the proposed bid 𝑡ℎ reads:
𝑃𝑟 {𝑦𝑒𝑠ℎ} = 𝑃𝑟 {�̅�ℎ(𝐼ℎ , 𝑧0, 𝑠ℎ) + 𝜀ℎ0 ≤ �̅�ℎ (𝐼ℎ − 𝑡ℎ, 𝑧1, 𝑠ℎ) + 𝜀ℎ
1}
= 𝑃𝑟 {𝜀ℎ0 − 𝜀ℎ
1 ≤ �̅�ℎ(𝐼ℎ − 𝑡ℎ , 𝑧1, 𝑠ℎ) − �̅�ℎ(𝐼ℎ, 𝑧0, 𝑠ℎ)}. (2-24)
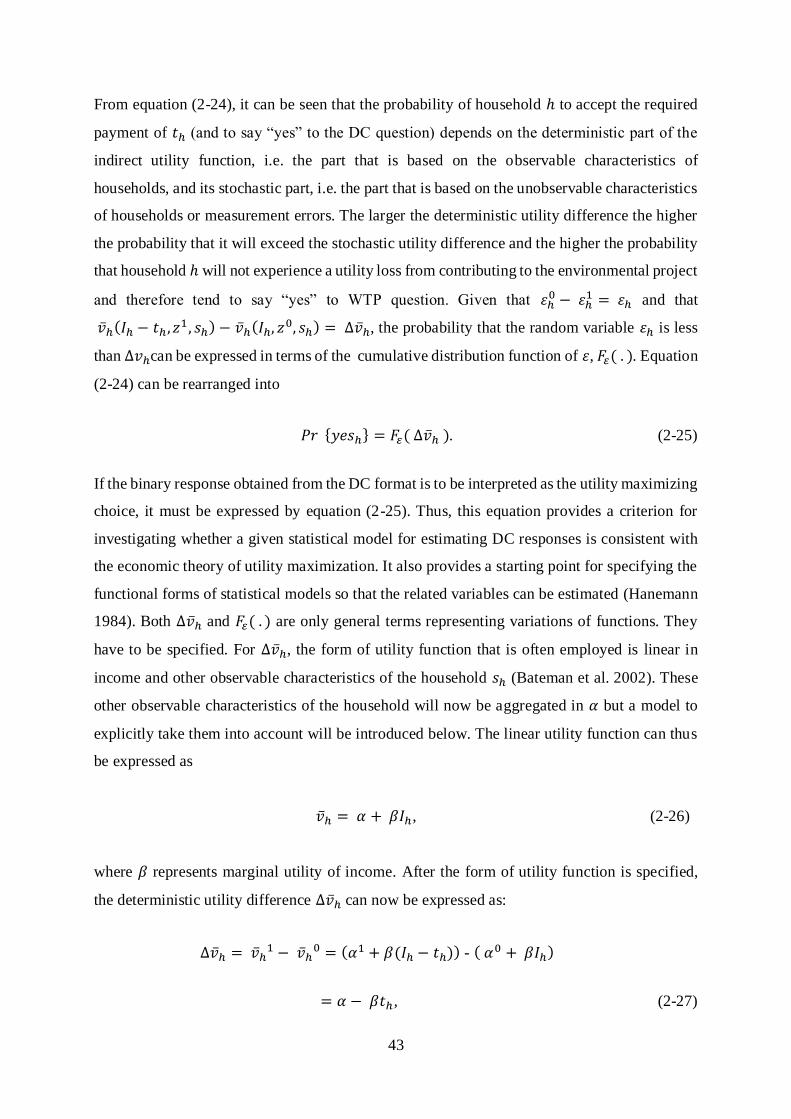
43
From equation (2-24), it can be seen that the probability of household ℎ to accept the required
payment of 𝑡ℎ (and to say “yes” to the DC question) depends on the deterministic part of the
indirect utility function, i.e. the part that is based on the observable characteristics of
households, and its stochastic part, i.e. the part that is based on the unobservable characteristics
of households or measurement errors. The larger the deterministic utility difference the higher
the probability that it will exceed the stochastic utility difference and the higher the probability
that household ℎ will not experience a utility loss from contributing to the environmental project
and therefore tend to say “yes” to WTP question. Given that 𝜀ℎ0 − 𝜀ℎ
1 = 𝜀ℎ and that
�̅�ℎ(𝐼ℎ − 𝑡ℎ , 𝑧1 , 𝑠ℎ) − �̅�ℎ(𝐼ℎ, 𝑧0, 𝑠ℎ) = ∆�̅�ℎ, the probability that the random variable 𝜀ℎ is less
than ∆𝑣ℎcan be expressed in terms of the cumulative distribution function of 𝜀, 𝐹𝜀( . ). Equation
(2-24) can be rearranged into
𝑃𝑟 {𝑦𝑒𝑠ℎ} = 𝐹𝜀( ∆�̅�ℎ ). (2-25)
If the binary response obtained from the DC format is to be interpreted as the utility maximizing
choice, it must be expressed by equation (2-25). Thus, this equation provides a criterion for
investigating whether a given statistical model for estimating DC responses is consistent with
the economic theory of utility maximization. It also provides a starting point for specifying the
functional forms of statistical models so that the related variables can be estimated (Hanemann
1984). Both ∆�̅�ℎ and 𝐹𝜀( . ) are only general terms representing variations of functions. They
have to be specified. For ∆�̅�ℎ, the form of utility function that is often employed is linear in
income and other observable characteristics of the household 𝑠ℎ (Bateman et al. 2002). These
other observable characteristics of the household will now be aggregated in 𝛼 but a model to
explicitly take them into account will be introduced below. The linear utility function can thus
be expressed as
�̅�ℎ = 𝛼 + 𝛽𝐼ℎ, (2-26)
where 𝛽 represents marginal utility of income. After the form of utility function is specified,
the deterministic utility difference ∆�̅�ℎ can now be expressed as:
∆�̅�ℎ = �̅�ℎ1 − �̅�ℎ
0 = (𝛼1 + 𝛽(𝐼ℎ − 𝑡ℎ)) - ( 𝛼0 + 𝛽𝐼ℎ)
= 𝛼 − 𝛽𝑡ℎ, (2-27)
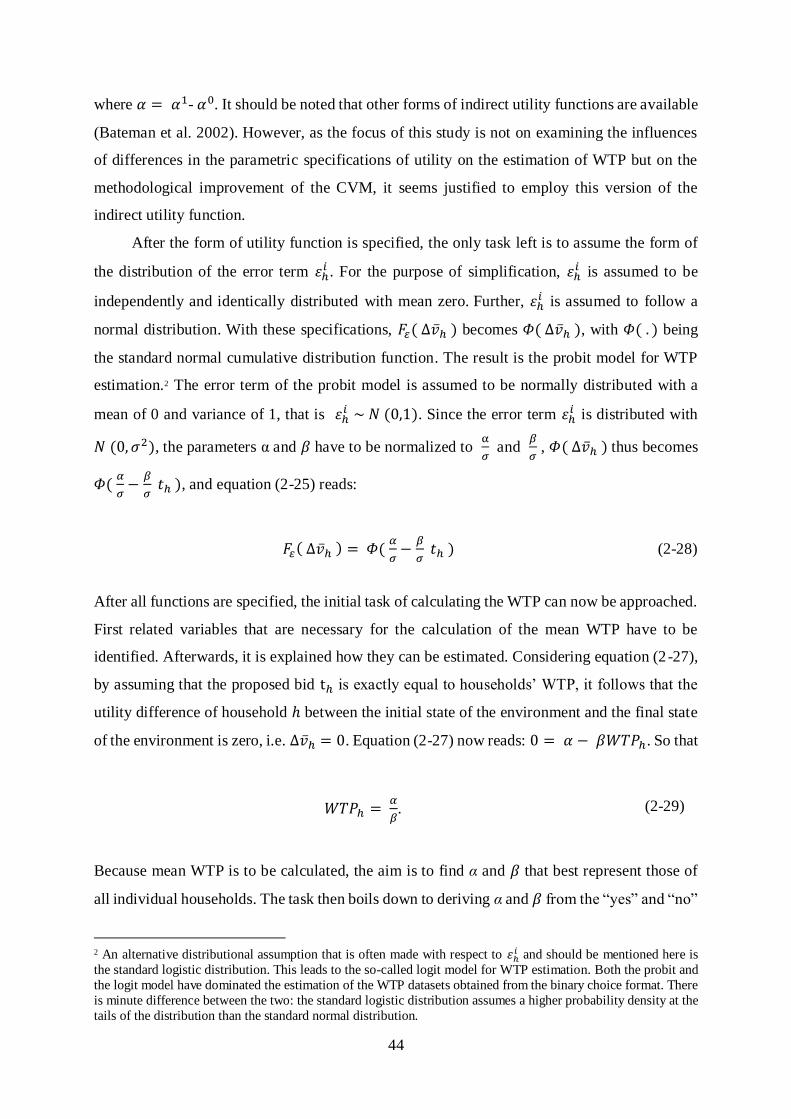
44
where 𝛼 = 𝛼1- 𝛼0. It should be noted that other forms of indirect utility functions are available
(Bateman et al. 2002). However, as the focus of this study is not on examining the influences
of differences in the parametric specifications of utility on the estimation of WTP but on the
methodological improvement of the CVM, it seems justified to employ this version of the
indirect utility function.
After the form of utility function is specified, the only task left is to assume the form of
the distribution of the error term 𝜀ℎ𝑖 . For the purpose of simplification, 𝜀ℎ
𝑖 is assumed to be
independently and identically distributed with mean zero. Further, 𝜀ℎ𝑖 is assumed to follow a
normal distribution. With these specifications, 𝐹𝜀( ∆�̅�ℎ ) becomes 𝛷( ∆�̅�ℎ ), with 𝛷( . ) being
the standard normal cumulative distribution function. The result is the probit model for WTP
estimation.2 The error term of the probit model is assumed to be normally distributed with a
mean of 0 and variance of 1, that is 𝜀ℎ𝑖 ~ 𝑁 (0,1). Since the error term 𝜀ℎ
𝑖 is distributed with
𝑁 (0, 𝜎2), the parameters α and 𝛽 have to be normalized to α
𝜎 and
𝛽
𝜎 , 𝛷( ∆�̅�ℎ ) thus becomes
𝛷( 𝛼
𝜎−
𝛽
𝜎 𝑡ℎ ), and equation (2-25) reads:
𝐹𝜀( ∆�̅�ℎ ) = 𝛷( 𝛼
𝜎−
𝛽
𝜎 𝑡ℎ ) (2-28)
After all functions are specified, the initial task of calculating the WTP can now be approached.
First related variables that are necessary for the calculation of the mean WTP have to be
identified. Afterwards, it is explained how they can be estimated. Considering equation (2-27),
by assuming that the proposed bid tℎ is exactly equal to households’ WTP, it follows that the
utility difference of household ℎ between the initial state of the environment and the final state
of the environment is zero, i.e. ∆�̅�ℎ = 0. Equation (2-27) now reads: 0 = 𝛼 − 𝛽𝑊𝑇𝑃ℎ. So that
𝑊𝑇𝑃ℎ = 𝛼
𝛽. (2-29)
Because mean WTP is to be calculated, the aim is to find α and 𝛽 that best represent those of
all individual households. The task then boils down to deriving α and 𝛽 from the “yes” and “no”
2 An alternative distributional assumption that is often made with respect to 𝜀ℎ
𝑖 and should be mentioned here is
the standard logistic distribution. This leads to the so-called logit model for WTP estimation. Both the probit and
the logit model have dominated the estimation of the WTP datasets obtained from the binary choice format. There
is minute difference between the two: the standard logistic distribution assumes a higher probability density at the
tails of the distribution than the standard normal distribution.
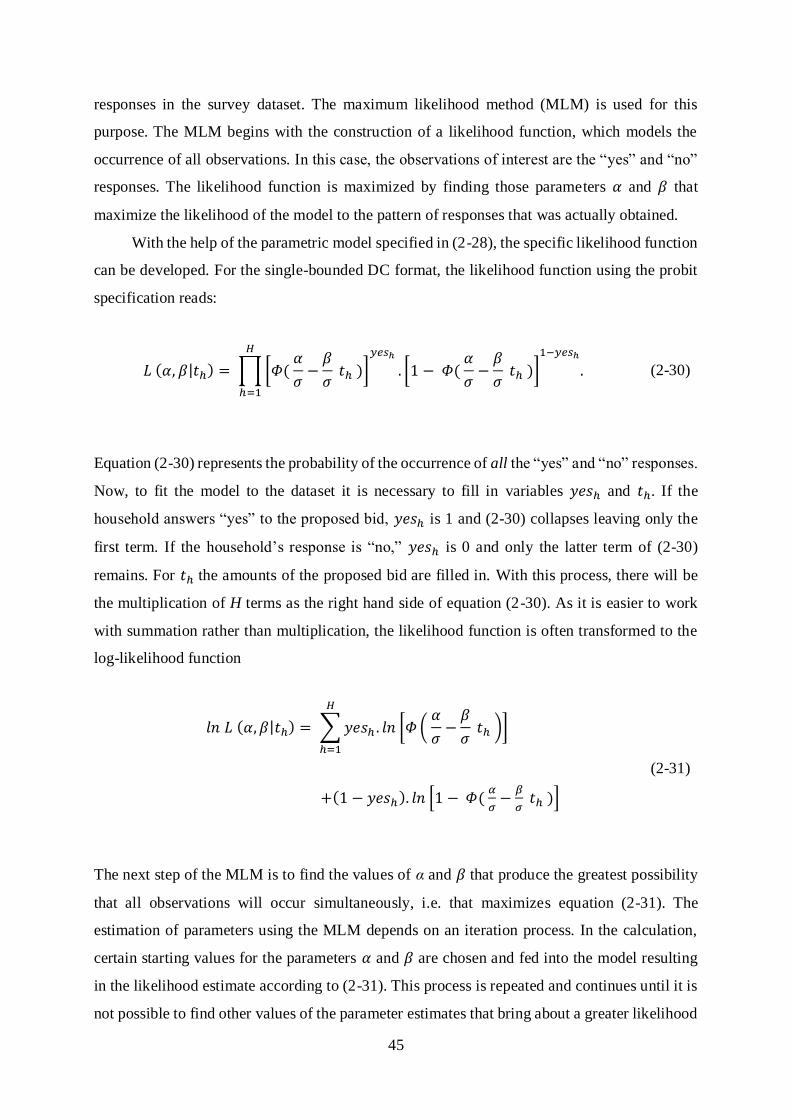
45
responses in the survey dataset. The maximum likelihood method (MLM) is used for this
purpose. The MLM begins with the construction of a likelihood function, which models the
occurrence of all observations. In this case, the observations of interest are the “yes” and “no”
responses. The likelihood function is maximized by finding those parameters 𝛼 and 𝛽 that
maximize the likelihood of the model to the pattern of responses that was actually obtained.
With the help of the parametric model specified in (2-28), the specific likelihood function
can be developed. For the single-bounded DC format, the likelihood function using the probit
specification reads:
𝐿 (𝛼, 𝛽|𝑡ℎ) = ∏ [𝛷( 𝛼
𝜎−
𝛽
𝜎 𝑡ℎ )]
𝑦𝑒𝑠ℎ
.
𝐻
ℎ=1
[1 − 𝛷( 𝛼
𝜎−
𝛽
𝜎 𝑡ℎ )]
1−𝑦𝑒𝑠ℎ
. (2-30)
Equation (2-30) represents the probability of the occurrence of all the “yes” and “no” responses.
Now, to fit the model to the dataset it is necessary to fill in variables 𝑦𝑒𝑠ℎ and 𝑡ℎ. If the
household answers “yes” to the proposed bid, 𝑦𝑒𝑠ℎ is 1 and (2-30) collapses leaving only the
first term. If the household’s response is “no,” 𝑦𝑒𝑠ℎ is 0 and only the latter term of (2-30)
remains. For 𝑡ℎ the amounts of the proposed bid are filled in. With this process, there will be
the multiplication of H terms as the right hand side of equation (2-30). As it is easier to work
with summation rather than multiplication, the likelihood function is often transformed to the
log-likelihood function
𝑙𝑛 𝐿 (𝛼, 𝛽|𝑡ℎ) = ∑ 𝑦𝑒𝑠ℎ . 𝑙𝑛 [𝛷 ( 𝛼
𝜎−
𝛽
𝜎 𝑡ℎ )]
𝐻
ℎ=1
+(1 − 𝑦𝑒𝑠ℎ). 𝑙𝑛 [1 − 𝛷( 𝛼
𝜎−
𝛽
𝜎 𝑡ℎ )]
(2-31)
The next step of the MLM is to find the values of α and 𝛽 that produce the greatest possibility
that all observations will occur simultaneously, i.e. that maximizes equation (2-31). The
estimation of parameters using the MLM depends on an iteration process. In the calculation,
certain starting values for the parameters 𝛼 and 𝛽 are chosen and fed into the model resulting
in the likelihood estimate according to (2-31). This process is repeated and continues until it is
not possible to find other values of the parameter estimates that bring about a greater likelihood
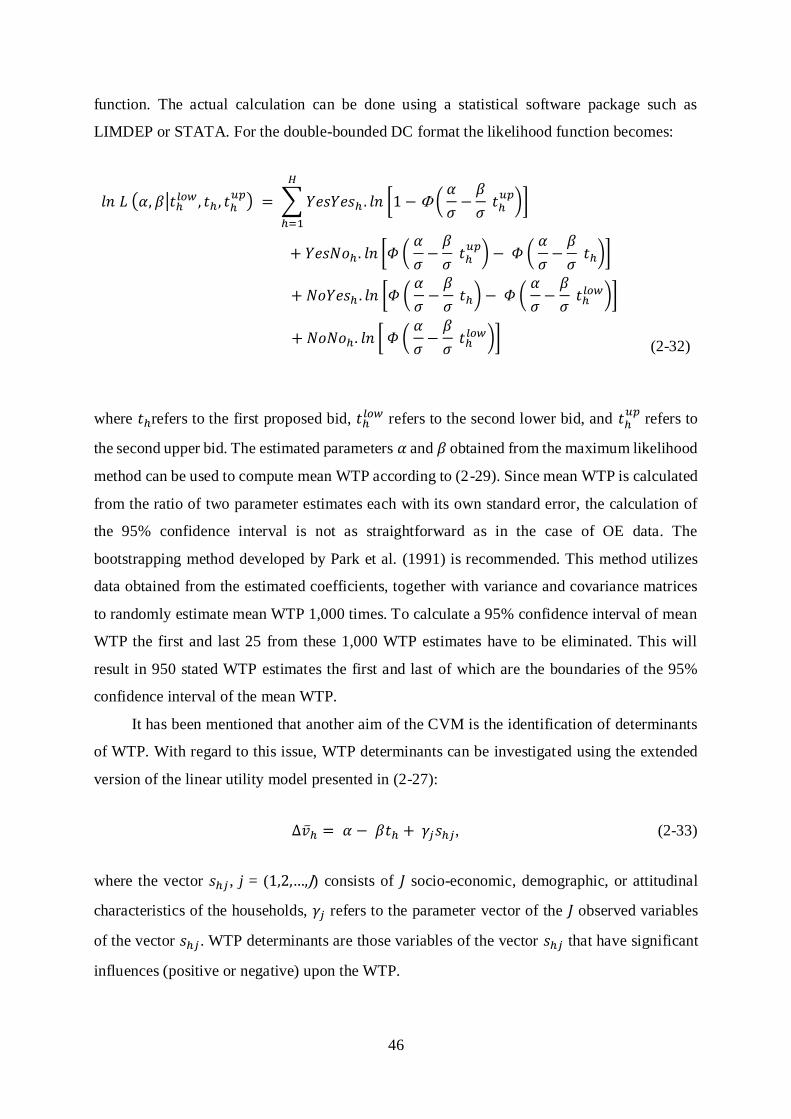
46
function. The actual calculation can be done using a statistical software package such as
LIMDEP or STATA. For the double-bounded DC format the likelihood function becomes:
𝑙𝑛 𝐿 (𝛼, 𝛽|𝑡ℎ𝑙𝑜𝑤 , 𝑡ℎ , 𝑡ℎ
𝑢𝑝) = ∑ 𝑌𝑒𝑠𝑌𝑒𝑠ℎ . 𝑙𝑛 [1 − ( 𝛼
𝜎−
𝛽
𝜎 𝑡ℎ
𝑢𝑝)]
𝐻
ℎ=1
+ 𝑌𝑒𝑠𝑁𝑜ℎ . 𝑙𝑛 [𝛷 ( 𝛼
𝜎−
𝛽
𝜎 𝑡ℎ
𝑢𝑝) − 𝛷 (
𝛼
𝜎−
𝛽
𝜎 𝑡ℎ)]
+ 𝑁𝑜𝑌𝑒𝑠ℎ . 𝑙𝑛 [𝛷 ( 𝛼
𝜎−
𝛽
𝜎 𝑡ℎ) − 𝛷 (
𝛼
𝜎−
𝛽
𝜎 𝑡ℎ
𝑙𝑜𝑤)]
+ 𝑁𝑜𝑁𝑜ℎ . 𝑙𝑛 [ 𝛷 ( 𝛼
𝜎−
𝛽
𝜎 𝑡ℎ
𝑙𝑜𝑤)] (2-32)
where 𝑡ℎrefers to the first proposed bid, 𝑡ℎ𝑙𝑜𝑤 refers to the second lower bid, and 𝑡ℎ
𝑢𝑝 refers to
the second upper bid. The estimated parameters 𝛼 and 𝛽 obtained from the maximum likelihood
method can be used to compute mean WTP according to (2-29). Since mean WTP is calculated
from the ratio of two parameter estimates each with its own standard error, the calculation of
the 95% confidence interval is not as straightforward as in the case of OE data. The
bootstrapping method developed by Park et al. (1991) is recommended. This method utilizes
data obtained from the estimated coefficients, together with variance and covariance matrices
to randomly estimate mean WTP 1,000 times. To calculate a 95% confidence interval of mean
WTP the first and last 25 from these 1,000 WTP estimates have to be eliminated. This will
result in 950 stated WTP estimates the first and last of which are the boundaries of the 95%
confidence interval of the mean WTP.
It has been mentioned that another aim of the CVM is the identification of determinants
of WTP. With regard to this issue, WTP determinants can be investigated using the extended
version of the linear utility model presented in (2-27):
∆�̅�ℎ = 𝛼 − 𝛽𝑡ℎ + 𝛾𝑗𝑠ℎ𝑗, (2-33)
where the vector 𝑠ℎ𝑗 , j = (1,2,…,J) consists of 𝐽 socio-economic, demographic, or attitudinal
characteristics of the households, 𝛾𝑗 refers to the parameter vector of the 𝐽 observed variables
of the vector 𝑠ℎ𝑗 . WTP determinants are those variables of the vector 𝑠ℎ𝑗 that have significant
influences (positive or negative) upon the WTP.
47
For the DC dataset of this study, parameters 𝛼, 𝛽, and 𝛾𝑗 will be estimated based on the
probit model. For the PC dataset, two estimation methods for the calculation of mean WTP are
possible. First, the mean WTP can be assessed using interval data. In this case, any bid interval
in the payment card can be described as (𝑡ℎ𝑙𝑜𝑤 , 𝑡ℎ
𝑢𝑝). When a payment card is selected by
respondents it can be interpreted using the logic of the DC approach in that they accept 𝑡ℎ𝑙𝑜𝑤
and reject 𝑡ℎ𝑢𝑝
. The log-likelihood function for the PC dataset therefore reads:
𝑙𝑛 𝐿 (𝛼, 𝛽|𝑡ℎ𝑙𝑜𝑤 , 𝑡ℎ
𝑢𝑝) = ∑ 𝑙𝑛 [𝛷 ( 𝛼
𝜎−
𝛽
𝜎 𝑡ℎ
𝑢𝑝) − 𝛷 (
𝛼
𝜎−
𝛽
𝜎 𝑡ℎ
𝑙𝑜𝑤)]
𝐻
ℎ=1
(2-34)
Alternatively, the analyst could also calculate the midpoints of each response interval and
directly calculate mean WTP based on these midpoints. In this case, there is no need for any
parametric estimation technique. The computation of mean WTP based on midpoints frees
researchers from the uncertainty regarding the correct distribution for dataset. It also releases
researchers from the need to make a number of distributional assumptions that would be
required if the interval data were used. When using interval midpoints to represent WTP
responses the calculation of the 95% confidence interval is simple as it is the same formula as
for OE data. This study employs both DC and PC question formats in the empirical CVM
survey. For the DC dataset, there is no alternative technique for estimating the mean WTP.
Therefore, mean WTP will be estimated based on the log-likelihood model introduced in (2-
32). For the PC dataset, the computation of mean WTP based on midpoints will be used to
simplify the WTP analysis and the tobit model will be employed, because PC data is censored
at zero.
Whenever the dependent variable in a model is not distributed freely but cut off at some
point a regression model for censored data is needed. The PC dataset is clearly censored as no
negative WTP responses are recorded. With a censored dataset, the Ordinary Least Square
estimation is not suitable because it will yield biased and inconsistent parameter estimates
(Tobin 1958). The alternative tobit model assumes that there is a latent variable (𝑊𝑇𝑃ℎ∗). This
latent variable cannot be observed, and it is determined by the socio-economic, demographic,
and attitudinal characteristics of the households represented by the vector 𝑠ℎ. The magnitude of
their effect on the latent variable 𝑊𝑇𝑃ℎ∗ is captured by the parameter vector 𝛾. On top of that,
the normally distributed error term (𝜀ℎ ~ 𝑁 (0, 𝜎2)) captures the error effect in the linear
relation. This alternative tobit model reads:
48
𝑊𝑇𝑃ℎ∗ = 𝛾𝑠ℎ + 𝜀ℎ (2-35)
The latent variable can be observed in terms of the observable variable (𝑊𝑇𝑃̅̅ ̅̅ ̅̅ℎ̅) only if 𝑊𝑇𝑃ℎ
∗ is
greater than zero. Otherwise the latent variable is set equal to zero. The observable variable
𝑊𝑇𝑃̅̅ ̅̅ ̅̅ℎ̅ is therefore defined as:
𝑊𝑇𝑃̅̅ ̅̅ ̅̅ℎ̅ = {
𝑊𝑇𝑃ℎ∗ if 𝑊𝑇𝑃ℎ
∗ > 0
0 if 𝑊𝑇𝑃ℎ∗ ≤ 0
(2-36)
Equation (2-36) indicates that for households who state their WTP for the proposed program,
these WTP statements are assumed to have a linear relationship with their socio-economic or
attitudinal characteristics and other random influences. Coefficients of the variables in the tobit
model will also be calculated with the maximum likelihood method.
The likelihood function of the PC elicitation format using the tobit specification consists
of two parts. The first part captures the probability of observing a stated WTP of zero
𝑃𝑟(𝑊𝑇𝑃̅̅ ̅̅ ̅̅ℎ̅ = 0) = 𝑃𝑟(𝑊𝑇𝑃ℎ
∗ ≤ 0) = 𝑃𝑟(𝜀ℎ ≤ −𝛾𝑠ℎ) = 𝑃𝑟 (𝜀ℎ
𝜎≤
−𝛾𝑠ℎ
𝜎) = (
−𝛾𝑠ℎ
𝜎) .
Because of the symmetry of the distribution (−𝛾𝑠ℎ
𝜎) = 1 − (
−𝛾𝑠ℎ
𝜎) . The second part of the
likelihood function stems from the uncensored observations and can be expressed as
1
𝜎 (
𝑊𝑇𝑃̅̅ ̅̅ ̅̅ ̅ℎ−𝛾𝑠ℎ
𝜎). The likelihood of the PC format using the tobit specification reads:
𝐿 (𝛾|𝑠ℎ) = ∏ [1 − (−𝛾𝑠ℎ
𝜎)]
𝑊𝑇𝑃̅̅ ̅̅ ̅̅ ̅ℎ=0
.
𝐻
ℎ=1
[1
𝜎 (
𝑊𝑇𝑃̅̅ ̅̅ ̅̅ℎ̅ − 𝛾𝑠ℎ
𝜎)]
𝑊𝑇𝑃̅̅ ̅̅ ̅̅ ̅ℎ>0
. (2-37)
This likelihood model can be converted into a log likelihood function, which can then be
maximized in order to determine the parameters 𝛾 that are most likely to have generated the
observed data.
2.4 Discussion of the quality of the CVM
After major techniques of environmental valuation have been introduced, one important topic
that is critical for justifying the use of these methods is the assessment of their quality. How
good are these valuation methods? How much faith can one put in environmental values
49
assessed and estimated by these techniques? The main objective of this section is therefore to
discuss the quality of environmental valuation techniques, with a special focus on the contingent
valuation method. It should be mentioned at the outset that the quality of valuation techniques
such as the CVM is traditionally addressed based on the concepts of validity and reliability.
Validity refers to the degree to which the method measures the concept it is intended to measure.
Reliability refers to the consistency of environmental values produced by means of different
environmental valuation methods or at different points in time. Valuation techniques are
considered to be reliable when they yield results that are stable over time. However, this section
will discuss only issues related to validity. The replicability of CVM results is not considered.
The rest of this section is organized into three parts. The first part reviews empirical
evidence on the validity of CVM results. It will be shown that these validity studies lead to the
detection of typical errors and systematic biases of WTP statements. The second part, section
2.4.2, identifies the main sources of errors and biases of CVM results. The third part reviews
studies that directly investigate the mental processes that lead to the stated WTP to prepare for
the discussion of the influence of personality traits on environmental values, the main focus of
this study.
2.4.1 Validity of CVM surveys: Evidence form three aspects of validity
For many measurement tools, the verification of their measurements cannot be any simpler. One
can, for example, count bottles in a crate to check a reverse vending machine’s precision, or one
can use the true north (e.g. Northern Star) as a reference point for the magnetic north identified
by a compass. But this is not the case for the CVM. There is no figure on the correct WTP
answers that can be used to verify the response given by each survey participant. Nor is it
possible to look inside people’s heads and monitor what they are thinking when giving WTP
answers. Instead, researchers accumulate findings on the various conventional validity criteria
in search for conclusive evidence supporting the validity of a measurement. Some contrast CVM
estimates with indicators of what theoretically should be measured (criterion validity). Some
compare CVM results to welfare measures obtained from different valuation techniques
(convergent validity). Others assess whether CVM results relate in particular ways to predictors
identified by economic theory (theoretical validity).
50
Criterion validity
The basic principle of criterion validity is to test the comparison between the value measurement
and what is known to be correct. In the context of CVM, criterion validity implies the
comparison between the practical WTP estimates with a criterion assumed to represent the true
WTP. This is problematic because the true WTP is unobservable by its nature. To circumvent
this problem, other criteria of the true WTP are used. These include: actual voluntary
contributions to public goods (Champ et al. 1997; Veisten and Navrud 2006) and binding
referendum responses (Cummings and Taylor 1999; Vossler and Kerkvliet 2003; Johnston
2006). By employing these alternative criteria, these studies detect significant differences
between practical WTP estimates and criteria of the true WTP with the former significantly
exceeding the latter (Neill et al. 1994; Cummings and Taylor 1999; List 2001; Veisten and
Navrud 2006).3 As a consequence, these studies have brought to attention the problem of
hypothetical bias –the tendency for CVM respondents to inflate their WTP answers when there
are no commitments to their answers.
The detection of hypothetical bias invites critical evaluations of the features of the CVM
survey that may pose real threats to the validity of the method if they are left untreated. In
addition, it leads to the development of ex ante and ex post treatments. Such an ex ante approach
includes increasing the level of commitment from the part of the respondent by using so-called
“cheap talk.” (Cummings and Taylor 1999). Basically, such a cheap talk script describes the
problem of hypothetical bias and the request to survey participants to avoid repeating it.
However, results from the use of this method are rather mixed (Cummings and Taylor 1999;
Aadland and Caplan 2006). One of the ex post methods involves the use of certainty scales to
eliminate answers from respondents that are not entirely certain of their WTP answers (Champ
et al. 1997). Findings from experimental studies show that WTP answers given by “certain”
respondents are very close to the actual payment (Blumenschein et al. 2008; Morrison and
Brown 2009). Another type of studies show that such emphasizing the level of realism of the
exercise, the degree of hypothetical biases can be reduced. For example, Veisten and Navrud
(2006) sent mails to 2,498 recipients asking them for their WTP into a fund to finance the
protection of forest areas in Norway. Recipients also received an invoice for actual payment.
One group of the participants received the invoice simultaneously with the questionnaire while
another group obtained the invoice one week after returning the questionnaire. Results showed
3 It is worth noting that not all criterion validity studies obtain the same result. Many studies found that there is
no statistical difference between hypothetical and actual payments (e.g. Johnston 2006, Vossler and Kerkvliet
2003).
51
that respondents who received invoice simultaneously with the questionnaire halved their WTP
answers compared to those who faced only the questionnaire first.
Convergent validity
Convergent validity refers to the test of whether the measurement is converge (diverge) to other
tests believed to measure the same construct. In the context of the CVM, convergent validity
tests compare welfare measures obtained from the CVM and measures obtained from other
environmental valuation methods. An obvious shortcoming of the convergent validity
assessment is that it is not possible to identify which measure has a superior quality (in terms of
a closer approximation of the true value of the environmental project in question). This is also
the reason why insights obtained from this validity criterion are limited.
Up to a point in time, estimates from indirect valuation methods (e.g. the TCM and the
HPM) had been employed to judge the validity of CVM estimates. This is because economists
historically had more trust in information revealed in the market. The assumption was that that
both the TCM and the HPM produce a lower bound of the welfare measurement. In an influential
review conducted almost 20 years ago, Carson et al. (1996) reviewed a total of 83 studies which
altogether provide 616 comparisons of the CVM estimates and revealed preference estimates.
The authors showed that estimates from the CVM are a little (though significantly) smaller than
those of the indirect valuation techniques. At first glance, this result points to the invalidity of
CVM results. The CVM which measures the non-use as well as use values of the environment
should give larger (not smaller) estimates than the revealed preference methods that assess only
the use value of environmental goods. A closer look reveals that such a result is difficult to
interpret due to a number of reasons. First, the CVM, TCM and HPM address “overlapping but
not identical” value sets (Bateman et al. 2002, p.314). While the TCM and HPM take an ex-post
perspective and exclude the non-use value component, the CVM takes an ex-ante view, which
cannot be derived from direct experience with the environmental change under consideration,
and measures both use- and non-use values. This means welfare measures obtained from the
CVM, TCM and HPM may not have any expected ordering because they are based on different
types of valuations. Second, estimates of indirect valuation methods are suffering from
methodological shortcomings of their own (see section 2.2.1). Thus, their validity cannot be
taken for granted, either. Putting everything together, it means that first the theoretical
correlation patterns between estimates obtained from the CVM and the TCM and HPM must be
found before comparisons of practical valuation outputs can be meaningfully interpreted.
52
A similar problem is found regarding the comparisons between estimates obtained from
the CVM and direct valuation methods like the ABCM and the PVM.4 None of these methods
can claim superiority in terms of producing estimates that are closer to the true welfare changes
households expect from the environmental project. Thus, results from the comparisons can mean
almost everything (or in other words, almost nothing). For example, the convergence between
WTP measures obtained from the three methods does not necessarily mean that both of them
are valid. They may be equally invalid and results biased in the same direction. At the same
time, divergence between welfare estimates does not necessarily imply that the estimates are
invalid. The above mentioned findings imply that convergent validity tests cannot provide
conclusive evidence on the validity of the CVM results.
Theoretical validity
This part reviews studies which try to verify WTP estimates based on expectations derived from
economic theory. The common objective of these studies is to analyze whether WTP estimates
exhibit properties which conform to those of the Hicksian Compensating Variation. Arguably,
among different types of validity tests reviewed in this section, the theoretical validity test
provides most insights into the quality of CVM results. Theoretical validity test does not
compare welfare estimates to external criteria the quality of which is unknown, but it directly
compares the empirical properties of CVM estimates with the theoretical properties of the
Hicksian Compensating Variation. Results indicate how well the properties of valuation results
correspond to those of the theoretical construct one intends to measure. Most of the biases
detected in CVM surveys result from violations of theoretical validity. Some of such bias will
be introduced below.
A range of studies setting out to test theory-driven expectations found that practical WTP
estimates are insensitive to certain theoretically relevant factors or that WTP measures are overly
sensitive to other theoretically irrelevant variables. As a result, a number of irregularities and
biases of CVM results have been brought to light. Biases of the former category are detected
when estimates from the CVM do not sufficiently correspond to expectations derived from
conventional economic theory. They refer to problems such as part-whole bias or embedding.
Biases of the latter category are detected whenever stated values are influenced by any
4 Studies comparing estimates of the CVM with those of the ABCM and PVM show slightly lower welfare estimates
of the former (Lienhoop and Macmillan 2007, Mogas et al. 2006, Jin et al. 2006).
53
procedural or situational factors which should not have any effects on the stated WTP. These
include, for instance, protest responses and biases associated with elicitation question formats
(e.g. starting point and range biases).
Let us consider first the detection of the so-called embedding and part-whole bias. This
bias describes the finding that WTP estimates obtained from the CVM are not sufficiently
responsive to differing quantities and qualities of the environmental good being valued. It has
been repeatedly found that WTP estimates for multiple improvement levels of environmental
goods where one level of the improvement is a subset of the others do not differ significantly
(Svedsäter 2000; Jorgensen et al. 2001; Whitehead et al. 2009).5 In what is considered a
landmark publication, Desvousges et. al. (1992) aim at the estimation of the WTP to protect
2,000, 20,000, and 200,000 migratory waterfowls from drowning in thousands of waste-oil
holding ponds in Texas, Oklahoma, and New Mexico. Results show that WTP to protect the
differing quantity of birds do not statistically differ. The detection of the embedding and part-
whole bias spearheaded a huge wave of criticism of the CVM in the 1990s (Desvousges et al.
1993; Diamond and Hausman 1993; Diamond and Hausman 1994). They have also led to the
development of a standardized scope test in CVM practice (Desvousges et al. 2012). In a scope
test, a reduced or raised level of the environmental good is valued in a split survey design. The
study is considered as passing the scope test when WTP for the two levels of provision are
statistically different.
Now observations where practical WTP estimates are overly sensitive to the theoretically
irrelevant factors are considered. This category includes biases associated with elicitation
question formats such as starting point and range biases both of which have already been
discussed in section 2.3.1. Here, what is known in the CVM literature as protest bid is discussed.
In CVM studies, it is common that there be a group of respondents who refuse to contribute to
the provision of the environmental good by stating zero WTP. These zero bids have two possible
meanings depending on the underlying reasons of these respective respondents. In case
respondents stated a zero WTP because they are in fact indifferent to or expect no utility gain
from the provision of the environmental good, their zero WTP is considered as consistent with
the economic theory of value and must be included into the benefit-cost analysis. Nonetheless,
when the zero WTP are the respondents’ expressions of protest beliefs,6 these “protesting” zero
5 For counter examples, see Nielsen and Kjaer (2011), Bateman and Mawby (2004), Chilton and Hutchinson
(2003), Norinder et al.( 2001)
6 Protest belief refers to protest attitudes associated with the process of valuation or the constructed market scenario
(Meyerhoff and Liebe 2006).
54
WTP do not reflect the true economic preferences of respondents towards the proposed program
and must be treated with extreme care.
The task for CVM studies is to eliminate potential biases that will be introduced by the
protest zero. Unfortunately, there is neither a solid agreement about the procedure to distinguish
genuine zero WTP from protest responses nor a procedure to treat protest responses in the
survey dataset. To date, the method to identify protest zeros is to use of debriefing questions,
i.e. attitudinal questions eliciting the underlying motivations of respondents for their WTP
responses. Zero bidders who hold protest beliefs are identified as the protest zeros (Strazzera et
al. 2003; Ferreira and Gallagher 2010). According to this criterion, the percentage of protest
bids in a CVM survey can be as high as 80-90% (Ferreira and Gallagher 2010, p. 647). Recently,
Meyerhoff and Liebe (2006) have argued that respondents who gave positive WTP may as well
hold protest beliefs. A participant may have protest beliefs about the project scenario (e.g. he
or she may think that the project cannot be realized as promised) but might still express a
positive WTP. This raises a question of whether or not and to what extent the WTP stated by
this person accurately reflects his or her preference toward the environmental good in question.
As a result, researchers should not treat only protest beliefs of zero bidders but they should also
pay attention to the protest beliefs of respondents stating positive WTP. After the typical biases
encountered in CVM surveys have been introduced in this section, the next section will present
the sources of such errors and biases.
2.4.2 Main sources of errors and biases of CVM results
This section attempts to highlight the points where a CVM survey can go wrong, producing
WTP estimates that deviate from the theoretically correct ones. It should first be mentioned that
this section confines itself to a fundamental aspect of the CVM, i.e. its role as an empirical
measure of individual welfare. This means, biases related to methodological issues such as
selection of a survey sample, estimation of the mean WTP, and aggregation of the WTP
estimates are excluded from the consideration. Of course, these methodological issues
contribute one way or another to the calculation of the social value of an environmental project.
But they are not directly relevant to the validity of individual WTP responses given by
households. Ahlheim et al. (2010) detected that in the course of a typical CVM interview there
are three main sources of errors and biases of CVM results. These “Sources of Error” (SoE)
occur in the course of the formation of individual WTP, the revelation of individual WTP, and
the aggregation of individual WTP. As the third SoE is related to the aggregation of the WTP
55
estimates, only the first two SoE will be presented below (for the SoE associated with the
aggregation process see Ahlheim et al. 2010).
The first source of error (SoE1) arises from the fact that it is extremely difficult for
respondents in a CVM interview to derive a reliable estimate of their individual valuation of the
project proposed. Typically, it is not the task of citizens to assign value to environmental goods.
The decisions whether or not and to what extent an environmental good should be preserved or
provided are usually made on a high political level. In the CVM, respondents are asked to make
these decisions, which can be very difficult for them. Furthermore, forming an exact idea of the
benefits to be expected from some environmental project that does not yet exist can be very
difficult since such a project cannot be inspected and the knowledge about the project in
question is usually limited to the information given in the questionnaire. In addition,
respondents in a CVM interview are typically approached by an interviewer who requests them
to make valuation decisions right away without any possibility to delay the decision. So,
respondents are given only a limited time to process the information about the project proposed
and to form expectations about its benefits for them. Within this short period of time,
respondents have to read or listen to the description of the project, to imagine about the benefits
of the program that typically has not yet been realized, and to formulate their overall
expectations about the program. All these tasks require considerable mental effort which some
respondents may not be willing to invest at the time of the interview.
The second source of error (SoE2) stems from the fact that respondents in a CVM
interview may refuse to state what they have in mind as the true value of the project in question.
A reason for such behavior might be the hypothetical nature of the CVM. WTP statements given
by respondents in a CVM survey are only a statement of intention and have no immediate
consequences. Respondents may give a WTP amount that differs from the true amount they
would actually be prepared to give because of strategic reasons. They may misreport their WTP
to influence the provision of the good and/or the final level of payment they have to make for
the good (Bateman et al. 2002). These two types of responding are also known as overpledging
and free riding (Mitchell and Carson 1989).7 Other respondents may choose not to report their
true WTP because of emotional reasons. They may feel upset with some statements in the
questionnaire or with some behavior of the interviewer. As a consequence, they understate their
7 Overpledging refers to the situation where respondents state a WTP that is higher than their true WTP assuming
that their answers will influence the decision about the provision of the good in question but at the same time they
will not form any basis for the pricing policy. Free riding occurs if individuals understate their WTP answers while
expecting that others would pay enough to ensure the provision of the good (Venkatachalam 2004).
56
WTP. Misreporting of WTP may also occur by chance and misunderstanding. For instance,
respondents may be influenced by WTP elicitation question formats and give WTP statements
that are not in accord with what they actually have in mind. For example, they may perceive the
WTP bid in the DC question as an appropriate level of contribution and thus give a (distorted)
WTP statement accordingly.
Figure 2-3 illustrates the course of a typical CVM interview and the two sources of errors
of CVM results that have been discussed in this section (SoE 1 & SoE 2) are marked. After a
description of an environmental project has been presented to the respondents, they have to
process the given information in order to form an idea of the benefits from the project presented
and of the individual welfare changes these benefits might lead to. More specifically,
respondents have to think about the attributes of the project in question and its intended
environmental changes. Respondents also have to imagine how the environmental changes
would affect their well-being. As mentioned before, these mental tasks are not easy, and
respondents may not be able to accomplish them completely. This can lead to wrong
expectations regarding the project and as a consequence wrong estimates of the individual
welfare changes. This is what referred to as the problem of value formation (SoE 1) and the
resulting bias is for instance the part-whole bias (see 2.4.1). In the next step of a CVM interview,
respondents are asked for their WTP. This is where respondents consider how to report their
true WTP to the interviewer. Again, respondents may not state their answer in the way assumed
by the CVM researcher. This is what referred to as the problem of value elicitation (SoE 2).
Resulting biases are, for example, hypothetical bias, strategic bias, protest responses (see 2.4.1),
and biases associated with elicitation question formats (see 2.3.1). After the problems of value
formation and value elicitation have been discussed, the next section will review studies that
aim at giving psychological explanation to these problems. The attempt to give psychological
explanation of WTP response behavior represents the central research aspect of this study. Thus,
it will be discussed in more detail in the following.
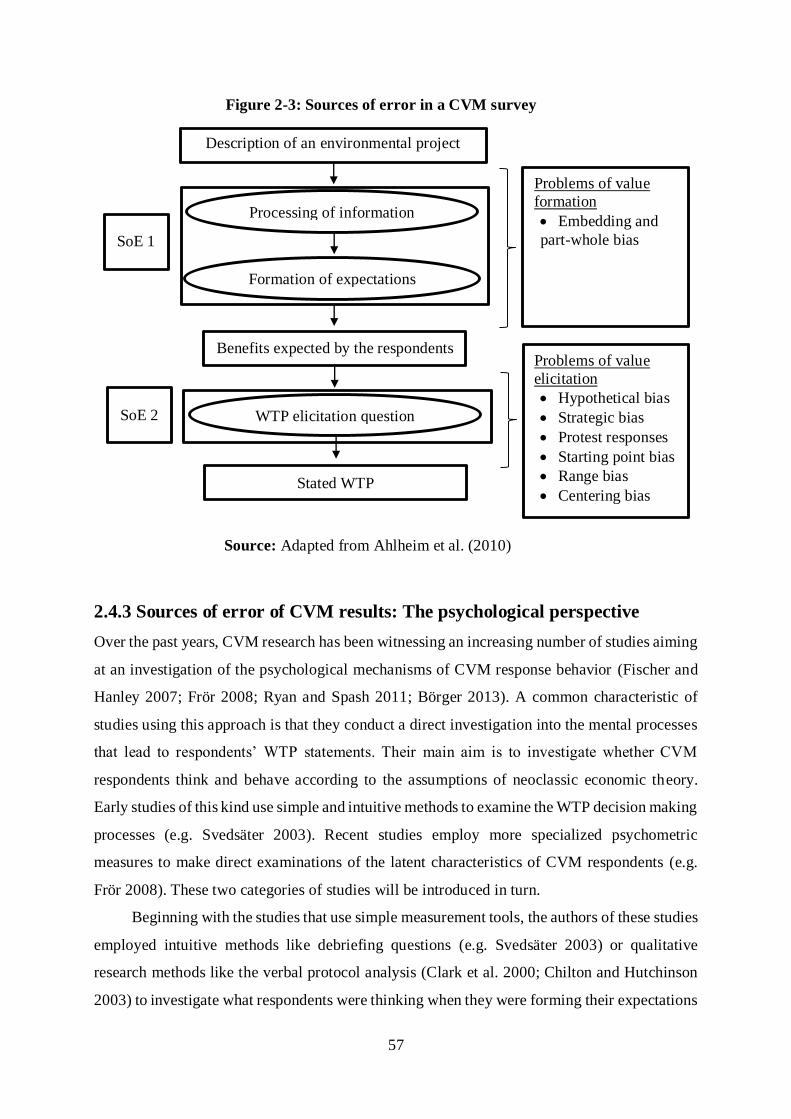
57
Figure 2-3: Sources of error in a CVM survey
Source: Adapted from Ahlheim et al. (2010)
2.4.3 Sources of error of CVM results: The psychological perspective
Over the past years, CVM research has been witnessing an increasing number of studies aiming
at an investigation of the psychological mechanisms of CVM response behavior (Fischer and
Hanley 2007; Frör 2008; Ryan and Spash 2011; Börger 2013). A common characteristic of
studies using this approach is that they conduct a direct investigation into the mental processes
that lead to respondents’ WTP statements. Their main aim is to investigate whether CVM
respondents think and behave according to the assumptions of neoclassic economic theory.
Early studies of this kind use simple and intuitive methods to examine the WTP decision making
processes (e.g. Svedsäter 2003). Recent studies employ more specialized psychometric
measures to make direct examinations of the latent characteristics of CVM respondents (e.g.
Frör 2008). These two categories of studies will be introduced in turn.
Beginning with the studies that use simple measurement tools, the authors of these studies
employed intuitive methods like debriefing questions (e.g. Svedsäter 2003) or qualitative
research methods like the verbal protocol analysis (Clark et al. 2000; Chilton and Hutchinson
2003) to investigate what respondents were thinking when they were forming their expectations
Processing of information
Formation of expectations
Benefits expected by the respondents
Description of an environmental project
WTP elicitation question
Stated WTP
Problems of value
formation
Embedding and
part-whole bias
Problems of value
elicitation
Hypothetical bias
Strategic bias
Protest responses
Starting point bias
Range bias
Centering bias
SoE 1
SoE 2
58
about the proposed project and reporting their WTP answers. For instance, respondents are
asked to “think aloud” by describing their thoughts when making WTP decisions. By these
methods, researchers can examine reasons behind stated WTP of respondents. Results show
that interviewees have consistent difficulties in understanding the valuation questions, but they
nevertheless tend to answer the questions regardless of the meaning they attach to the tasks. It
is also found that a huge portion of participants in contingent valuation surveys give stated WTP
that are referenced by theoretically irrelevant motivations like charitable motivations and
political issues. Similar outcomes are reported in a series of classic studies by Kahneman (1992;
1993; 1999). These studies show that WTP statements only represent the value of a feeling to
have done something good, or of some “moral satisfaction,” and not the economic value of the
environmental good as assumed by economic theory. Kahneman demonstrates that WTP may
only express the level of satisfaction an individual obtains from the “act of giving”. Thus, stated
WTP does not represent the utility an individual expects from the consumption of the
environmental good in question but from the act of giving or at least stating the intention to give
in the CVM interview. This phenomenon, that the act of giving generates a positive utility
change of its own, is also known as the concept of “warm glow of giving” (Andreoni 1989;
Andreoni 1990).
Special attention must be drawn to a number of studies that assess dispositional attributes
of CVM participants using specialized measures designed and validated in psychology (Frör
2008; Börger 2013). These studies have a common assumption that all individuals possess
certain inner attributes. By identifying these inner attributes of CVM respondents, one may be
able to establish a direct link between these psychological attributes and various different
patterns of CVM response behavior as predicted by theory. This will provide a better
understanding of the respondents when answering WTP questions. It must be noted that studies
employing this approach differ from other direct validity studies in that they utilize constructs
that have been developed and validated in the field of psychology. Also important is the fact
that they employ well-tested psychometric inventories to assess these constructs.
It was found that some respondents have psychological attributes that may contribute to
the value formation problems occurred in CVM surveys. Frör (2008) utilizes a model developed
in cognitive psychology to investigate the type of information processing CVM respondents use
when answering WTP questions. According to the dual-process model of reasoning, there are
two main reasoning processes that are operating in the human mind: analytical-rational and
intuitive-experiential thinking styles. Intuitive-experiential persons tend to minimize their
cognitive efforts in making decisions. They prefer to make their decisions by reference to
59
hunches, intuition, and feelings. Analytical-rational individuals, on the contrary, prefer to
exercise full cognitive ability in decision making situations. It is very likely that intuitive-
experiential respondents will not thoroughly consider all attributes of the proposed
environmental project and assign value to the project based on only some of its attributes.
Following the same line of argument, analytical-rational respondents who are more cautious in
their valuation will be able to find the value of the project that is closer to their true value. Using
a question inventory developed to assess the two information processing styles, Frör
demonstrates that intuitive-experiential participants state significantly smaller WTP than
analytical-rational respondents. This result supports his hypothesis that people with intuitive-
experiential reasoning style may be susceptible to the value formation problems and thus their
WTP statements should be interpreted with caution.
Apart from the psychological explanations of the value formation problems, those of the
value elicitation problems were also found. Börger (2013) studies a form of response bias known
as socially desirable responding (i.e. the tendency of respondents to give answers that make
them look good) in the context of the CVM. The author argues that the socially desirably
responding is motivated by the general desire of the respondent to gain social status, a person’s
disposition also known as the need for social approval. By employing a well-validated question
inventory designed to measure the need for social approval of individuals in a CVM study
conducted in Southwest China, the author is able to detect the different levels of individual
propensities to strive for social approval and relate such tendencies to people’s WTP statements
according to theoretical predictions.
This section gave an overview on issues regarding the quality of welfare estimates
obtained from the CVM. It highlighted two critical points where CVM might produce responses
that deviate from the true WTP. The section also presented a number of irregularities and
systematic distortions of WTP responses detected in the CVM literature. These include, e.g. the
hypothetical bias, embedding, and protest bids. Eventually, this section introduced the attempts
of CVM researchers to make investigations into the psychological processes underpinning WTP
response behavior. They successfully demonstrate that, when coming up with their WTP
response, CVM respondents may be thinking of purchasing moral satisfaction or of a
contribution to a charity, and not of the expected utility from the proposed environmental
program. Interviewees may not be able to understand the questions as initially intended by the
researchers. More recently, a few studies have detected psychological attributes of respondents
that are responsible for their inability to form correct expectation about the proposed project and
for their intention to report desirable WTP statements instead of the truthful ones.
60
2.5 Summary
The aim of this chapter was to give an overview of the theory and practices of environmental
valuation with a special focus on the contingent valuation method. The chapter starts with
rationales for the economic valuation of environmental goods. It explains that the true value of
the environment carries a very important piece of information, i.e. the level of welfare that the
environment can create for human beings. But since this true value of the environment cannot
be found by the mechanisms of the market, it has to be assessed by alternative environmental
valuation approaches. Next, the chapter introduces the framework of total economic value of
the environment and makes clear the many channels through which environmental goods can
generate well-being to individuals and societies. Subsequently, the chapter presents a theoretical
instrument that can be used to determine changes in well-being of individuals resulting from the
public provision or conservation of environmental goods, i.e. the Hicksian Compensating
Variation. The Hicksian Compensating Variation can be used without reservation in the
comparative static welfare analysis including the measurement of individual welfare changes
resulting from environmental projects. As the maximum amount of money that people are
willing to pay in order to receive the benefits from some environmental project (WTP) can be
interpreted as representing the Hicksian Compensating Variation, this theoretical welfare
measure can be used in practical environmental valuation.
These practical valuation methods are introduced in the second part of this chapter. Two
families of methods are presented, namely the indirect and direct valuation methods. The
differences between the indirect valuation methods like the travel cost method and the hedonic
pricing method on the one hand and the direct valuation methods like the CVM and the ABCM
on the other are discussed. One decisive difference is that the direct valuation technique allows
for the assessment of both use- and nonuse values. This property is one of the main reasons why
the CVM plays a very important role in the context of environmental valuation. Therefore, the
third part of this chapter delves into details of CVM interview and questionnaire design. In the
section it becomes clear that there are many parts in the CVM protocol that can go wrong. Being
a survey-based method, the CVM relies heavily on the questionnaire and on the direct statement
of respondents regarding their welfare changes.
The quality of CVM surveys is discussed in the fourth section. Studies that examine the
criterion, convergent, and theoretical validity of CVM surveys are reviewed. Findings from
these studies suggest that the practical CVM surveys may sometimes produce welfare estimates
that are not theoretically consistent with the true level of individual welfare changes. This is
61
because the two main sources of errors that tend to turn up in the course of practical CVM
studies. Firstly, it is quite difficult for respondents to realize their true individual valuation in
CVM surveys, and secondly, even if respondents are able to realize their true individual
valuation, they might not be willing to report it to the interviewers. At the end of the fourth
section, studies that investigate the psychological foundations of the two sources of error of
practical CVM surveys are reviewed. Authors of these studies aim at a better understanding of
the psychological processes within a respondent leading to biased statements of WTP. Findings
show that psychological concepts can improve the understanding on many biases occurring in
practical CVM studies. Therefore it seems justified to make a further investigation into this area.
In the next chapter, personality psychology, which is one of the leading disciplines that
investigates psychological characteristics of human beings, will be introduced.

62
63
Chapter 3 Personality The purpose of this chapter is to introduce those concepts and tools developed within the field
of personality psychology which can be used to analyze the task of stating a WTP for an
environmental good in a CVM survey. The next section discusses the fundamentals behind
personality psychology and makes clear why it is worth examining this sub-field of psychology,
and where the focus of such an examination should be placed. Section 3.2.1 outlines the central
concept in this field, i.e. personality, and will show that the concept of personality is holistically
referred to as an entity which determines an individual’s behavior. A number of theories have
been proposed regarding its components, but at present the trait approach to personality is the
most prominent. Within this approach, personality is defined and measured in terms of traits,
meaning the fundamental human dispositions – those influencing people’s typical behavior,
thoughts and feelings. Section 3.2.1 ends with a discussion on the relevance of trait to the CVM.
Trait measurement tools are then introduced in Section 3.2.2, after which Section 3.2.3
discusses the reality behind traits and the influence traits have on people’s’ behavior. Section
3.2.3 concludes that it is worth investigating personality psychology in general and trait theory
in particular for three key reasons. First, traits are the psychological concept which is central to
human behavior, second, traits can be conveniently measured using a self-reporting
questionnaire, and third, it has been shown that traits can be used to explain people's behavior
in many real world situations. Section 3.2.4 introduces the taxonomy of personality traits, the
concept that results from psychologists’ attempt to identify the fundamental traits of human
beings.
Section 3.3 introduces the Big Five factor model (BFM) as a specific trait model which
formed the conceptual basis of the empirical research carried out in this study. A short history
of the BFM is given in Section 3.3.1. Section 3.3.2 introduces a specific BFM model, one
developed by the two prominent psychologists Paul Costa and Robert McCrae, whose research
on the BFM introduced the model to a wider audience. Descriptions of the five traits used in
their model and the corresponding sub-traits are also given. It will become apparent from the
discussions in this chapter that these concepts form a group of powerful dispositions, those able
to explain the variety of psychological phenomena that exist within individuals and; thus, should
be able to provide an insight into CVM response behavior. Section 3.3.3 presents the
measurement tool used in the assessment of the BFM, with issues regarding validity in general
64
and cross-cultural validity in particular also discussed. A summary of the chapter is given in
Section 3.4.
3.1 Fundamentals of personality psychology
3.1.1 Understanding the concept of personality
There has always been an interest in the latent characteristics of individuals8, but the scientific
investigation of such latent attributes has only been pioneered when the modern era of
psychology began - in the 1930s or approximately 30 years after Sigmund Freud published his
ground breaking book, The Interpretation of Dreams, and revolutionized the way people look
at psychology. During that time, American studies of “individual differences” were integrated
with the German studies into “Charakter”, thereby producing a new psychological discipline:
personality psychology (McAdams 2001). In the first issue of the Journal of Personality (then
Character and Personality), McDougall (1932), an early pioneer of psychology, attempted to
provide a clear-cut definition of personality from the very start. He argued that personality
carries the same meaning as the German terms “Charakter” and “Persönlichkeit,” it being “the
sum total of those [internal] features, properties, or qualities of an individual organism…”
(McDougall 1932, p.4). Although McDougall did not specify what those “features, properties,
or qualities...” are, his definition of personality provides a good starting point when wishing to
understand the concept, for it suggests that personality is a holistic concept.9 Personality does
not refer to fractions of people’s mental attributes, as with concepts in other fields of
psychology, such as emotional or cognitive attributes, but instead is meant to provide a greater
level of understanding of a person’s whole and intact characteristics.
In what is considered the first major textbook on personality psychology: Personality: A
Psychological Interpretation, Gordon W. Allport (1937) also searched for a specific definition
of personality, one that best represented contemporary psychological usage. Credited as the
founding father of personality psychology, Allport viewed personality as a person’s true inner
identity, i.e. “what an individual is regardless of the manner in which other people perceive his
8 Interest in people’s latent attributes can be traced back to the works of Aristotle and his student Theophrastus,
both of whom felt that the behavior of individuals is determined by a certain inner “character” (Matthews et al.
2009, p.3). 9 Holism is one of the distinguishing features of personality psychology, its view being that the workings of
people’s minds must be understood as a whole, and that they cannot be fully understood from the sum of their
parts (McAdams 1997). This feature distinguishes personality psychology from other sub-disciplines of
psychology which tend to be elementaristic (McAdams 1997, p. 4).
65
qualities or evaluate them” (Allport 1937, p.40). Like McDougall, Allport also perceived
personality as being holistic, referring to it as “the total manifold psycho-physical individuality”
(Allport 1937, p.24). To identify the specifics behind this, Allport reviewed in total 49 meanings
of personality derived from the domains of psychology, philosophy, sociology, as well as
theology (p. 29-46). His definition of personality, which is still quoted to this day, is that it is
“the dynamic organization within the individual of those psycho-physical systems that
determine his unique adjustments to his environment” (Allport 1937, p.48). Although this
definition is more technical and more difficult to understand than McDougall’s, it reveals three
grand visions Allport had on the nature of personality at that time, those which would steer
personality research for many decades to come.
First and foremost, this definition reveals that Allport saw personality as an entity that
lies within individuals. This implies that the components of personality are not readily
observable and thus they need to be conceptualized and verified. Second, Allport saw
personality as a set of psychophysical systems. By “psychophysical systems” Allport meant that
personality is neither exclusively mental nor exclusively neural. Personality “entails the
operation of both body and mind, inextricably fused into a personal unity” (Allport 1937, p.48).
Allport posited that “psychophysical systems” refers to all dispositional factors, all of which,
he argued, can be described by traits. This attempt by Allport to explain the components of
personality using trait notions was quickly followed by the proposal of alternatives by other
contemporary psychologists. This subject of trait theory and its alternatives will be picked up
again shortly. Third, personality has causal effects on behavior (Allport 1937, p. 48), contending
that “personality is something and does something.” According to him, personality is what lies
behind “unique adjustments to [a person’s] environment.” By this, Allport meant that a
personality is a person’s survival kit. However in 1961, he changed this description to
“characteristic behavior and thought” (McAdams 1997, p.4), and so broadened the influence of
personality, extending it to cover its effects on people’s consistencies in behavior and thought.
In sum, the personality construct was conceptualized as a result of a belief among
personality theorists that the psychological individuality of human being should be holistically
investigated. An important outcome is that the personality construct is a very broad monolithic
concept. The most important work from the early days is from Gordon Allport who attempted
to provide a clear-cut, yet still broad, definition of personality. In the following, attempts to
better understand personality made by other theorists shall be reviewed. Two main research
questions which were of interest to personality theorists after the publication of Allport’s work
were (i) what precisely are the systems which form the core of personality? and (ii) how can
66
they be measured? The first of these questions was asked during the period 1930 to 1950, and
the second between 1950 and 1970 (McAdams 1997). This section addresses only question (i),
while question (ii) will be the focus of section 3.1.2.
Which components constitute personality?
So, what systems form the core of personality? As mentioned above, this question characterized
personality psychology during the period 1930 to 1950, a time when psychologists focused on
the construction of the conceptual systems needed to understand personality (McAdams 1997,
p. 7). Over time, theories have been developed by psychologists from various schools of
thought, such as psychoanalytic theory, bio-psychological theory, behaviorist theory, cognitive
theory and trait theory. These personality theories are also known as the “grand theories,”
because of the differing influences they receive from the classic schools of psychology (Runyan
1997). These grand theories are based on different epistemological assumptions regarding
personality. At present, trait theory dominates the other theories and, therefore, will be
introduced in greater detail. Other personality theories will only be briefly touched upon
below.10
Psychoanalytic personality theory focuses on the role of the unconscious - a part of
people’s mind in which the mental activities take place without their awareness (McAdams
2001). The founder of this tradition, Sigmund Freud, believed that a great deal of an adult’s
personality is defined by the content of his or her unconscious, and this is why Freud believed
that people are not able to understand why they are the way they are, and that the only way to
learn about people’s personalities is to make use of the specialized techniques developed by
psychoanalysts, such as dream analysis. In sharp contrast to the psychoanalytic theories,
behaviorist theory proposes that the determinants of personality lie outside a person. The basic
proposition behind behaviorism is that personality can be best understood by investigating
situational factors (McAdams 2001). Despite being a psychological discipline, behaviorism
refuses to deal with any psychological entities which cannot be directly observed, like thoughts
and feelings. To understand people’s individuality, behaviorism investigates the situational
determinants only, and so bypasses all psychological phenomena. Other approaches focus on
the inner qualities of individuals as the core of personality. For example, cognitive theory
contends that subjective thought lies at the center of individuals’ personalities (Pervin and
Cervone 2010), so what characterizes people are their own thoughts, such as how they perceive
10 For more detail on these theories, the reader should consult Pervin and Cervone (2010) and McAdams (2001)
67
themselves and how they perceive the world around them. To learn about people’s personalities,
we have to investigate their personal perceptions. The bio-psychological approach, meanwhile,
focuses on the role of genes, hormones and neurotransmitters. According to this approach,
personality is inherited and can be changed only if the genes, hormones and neurotransmitters
are altered (Pervin and Cervone 2010).
The above overview of personality approaches reveals an obvious disagreement among
them as to what forms the core of personality. Some argue that it is the unconscious which lies
in the center of the workings of personality, while others contend that it is situational factors,
subjective thoughts or biological characteristics. This is not surprising, after all, personality is
a construct devised in order to take an accurate account of the whole, coherent and intact mental
characteristics of a person - a tall order in itself, and the complexities of the constructs would
seem to be a natural outcome of this. As a result, it is often mentioned that the different aspects
of personality are so diverse that they can never be united within any single theory (e.g.
Ryckman 2008), and that what personality theories describe is only a fraction of the truth behind
the workings of a personality (e.g. Carducci 2009).
Trait: The building block of personality
It was mentioned before that there is another approach to the study of personality – the trait
approach. Allport developed trait theory because he foresaw problems regarding the complexity
of the concept of personality; that the phenomena encompassed by human personality are too
complex and diverse to be workable, especially within empirical studies. As a result, he
suggested that the concept of personality should be “broken down” into smaller units, those
suitable for the purposes of description and measurement, i.e. traits (Allport 1937, p.236). So,
a trait can be best understood as the basic structural unit or building block of personality. At
present, personality is usually defined and measured in terms of traits (Hofstee 1994)11, and
therefore the trait approach to personality will be discussed in more detail than will other
approaches.
11 Trait theory started to dominate the personality study landscape when personality theorists diverted their
attention from building conceptual systems to engaging in the empirical investigation of personality, i.e. during
the period 1950 to 1970 (cf. McAdams 1997, p.13). What personality scientists needed during that time was a way
to operationalize personality concepts so that the field could be moved forward by empirical investigation. The
primary focus of the field became the identification and measurement of the constructs that tap the key components
of personality. Such practices were expected to increase our level of understanding regarding the different parts of
personality, which later could be put back together to create better theories of the whole (McAdams 1997, p.15).
68
Trait theory is simple, and it roots lie in everyday common sense. Every day, we employ
the trait approach when we characterize ourselves, our colleagues or relatives - using various
trait descriptors. We are familiar with trait descriptors like “outgoing,” “imaginative,”
“worrying,” “trusting,” and “organized,” for we use these terms every day. These trait terms are
believed to be meaningful because they can explain and predict people’s behavior in many
situations. At the very least, the fact that people exhibit enduring behavior over time and across
situations seems to confirm the existence of traits; however, no one has ever directly observed
traits – they may only be words used for the classification of habits or they may have an
objective reality. Traits are probably meaningful, but we do not know their true nature. Allport
built trait theory based upon this common usage of and belief in traits.
Allport agreed that traits provide us with an easy, natural and meaningful way to account
for people’s individuality (Allport 1937); however, he added that traits are more than just words
used to organize categories of behavior. Traits are an objective reality and are the foundation of
people’s enduring behavior; they have the ability to energize, direct, and select behavior.
Furthermore, Allport believed that traits have a biological basis and are also based on the
neuropsychic structure of a given person (Allport 1961). Allport’s notion that traits have a
biological basis has been maintained and further explored by many contemporary trait scientists
(Gray 1982; Eysenck and Eysenck 1985; Zuckerman 1991; DeYoung et al. 2005), and the
dominant scholars in this field are Hans J. Eysenck and Jeffrey Gray, who developed biological
explanations for traits that have become very well established in trait psychology. These models
are known as Eysenck’s theory of arousal and Gray’s Reinforcement Sensitivity Theory (for an
excellent review of both theories see Matthews and Gilliland 1999).
Yet, the majority of contemporary trait theorists resist making generalizations about the
nature of traits (e.g. McCrae and Costa 2006; Hogan 2007). They believe that traits are an
objective reality and do not deny their psycho-physiological foundations. However, they believe
that additional factors may have roles in determining traits. It is generally conceived that traits
have a diverse nature (McAdams 2001), and may be collectively determined by the
unconscious, by genetics, the surrounding environment and individual cognition. It may also be
the case that different traits have different origins; that while some traits may be determined by
the unconscious or by individual subjectivity, other traits may be inherited (McCrae and Costa
2006). Consequently, contemporary trait theorists left the nature of traits open, focusing instead
on three major aspects of personality traits (for a more comprehensive review see Matthews et
al. 2009 and McAdams 2001).
69
Firstly, traits are generally seen as dispositions within individuals that are somewhat
stable across time and across different situations. Traits are like the “unchangeable spots of the
leopard” (Matthews et al. 2009, p.3). This means that if a person has a strong trait of, say,
friendliness, it must be possible to find evidence that that person is consistently friendly in a
variety of situations. The stability of a trait is an important assumption on which trait theory is
based. If a trait does change depending on the situation at hand, it is not a meaningful concept.
Secondly, traits are typically considered as a continuum ranging from one extreme to the other
extreme. This implies that traits are comparable among individuals, analogous to human weight
or height. All personality traits are possessed by all individuals, however to different degrees.
Lastly, most theorists maintain that traits exert a significant influence on behavior. This means
that traits causally influence, and therefore are able to explain, individual tendencies (c.f.
McAdam 2001, p.255)12. Consequently, contemporary trait theorists generally refer to traits as
dimensions of individual differences that contribute to an individual’s enduring patterns of
feeling, thinking, and behaving (e.g. McCrae and Costa 2006, p. 25; Pervin and Cervone 2010,
p.228; Wilt et al. 2011, p.987).
Related to the main topic of this dissertation, based on the review conducted in this
section, in the real world respondents in a CVM survey must be expected to possess a collection
of dispositional traits which are somewhat stable over time and across situations. These
dispositional traits are the “unchangeable spots of the leopard” and define respondents’ “true
characters.” It is also to be expected that all CVM respondents possess the same set of
dispositional traits only to a different degree. Furthermore, it can be expected that traits hold an
important role in respondents’ functioning and are instrumental in causing behavior to occur
overtime and in different situations including in the CVM survey. All these suggest that if we
are able to identify traits within CVM respondents, we can gain a better understanding on their
response behavior, such as when they are answering WTP questions. Clearly, for the concept
of traits to be useful for the CVM, suitable assessment techniques must be available. In the next
section, methods used for the assessment of traits during the course of a CVM survey will be
discussed. On the one hand, the method of inquiry used must be valid and reliable, while on the
other, it must be comprehensive enough to assess the personalities of CVM respondents in a
very short period of time.
12 Alternatively, some theorists maintain that traits are only convenient categories which can be used to describe
consistent behavior. Traits do not cause behavior. According to this view, the trait of friendliness does not cause
a person to be friendly. It only describes the person’s tendency to behave in a friendly manner overtime and
across different situations (McAdams, 2001, p.254).
70
3.1.2 Measuring traits
Regardless of how psychologists theorize the nature of personality and traits we should never
forget that traits are a psychological construct, meaning personality and traits are postulated
attributes and cannot be directly observed in the same way as objects in the physical world.
Constructs do not possess physical properties and cannot be measured in terms of objective
magnitude, as can tables or cups - their properties are strictly theoretical. It goes without saying
that the theoretical conceptualization of a construct determines the tools used to measure it.
Different grand personality theories advocate the use of different types of investigation methods
to understand personality; for example, psychoanalytic theorists state that personality is
characterized by the content of people’s unconscious, and as a result, they recommend the use
of specific psychoanalytic practices such as dream analysis to explore it (Freud 1913). As the
focus of this study is on trait theory, particular attention will be paid to the investigation methods
it uses, while for details of the methods used within the “non-trait” approach, readers should
consult Pervin and Cervone (2010).
Trait psychologists use personality inventories such as questionnaires to measure single
or multiple traits at the same time. During the years 1950 to 1970, when personality
psychologists started to focus their attention on the empirical investigation of personality (see
previous section), trait concepts were rigorously translated into specific procedures, those
capable of being measured and described in empirical terms. Special attention was paid to the
development and refinement of self-administered personality inventories, as apparatuses to be
used for the assessment of personality traits in a normal population13 (McAdams 1997). Self-
reporting inventories make use of the direct questioning to elicit people’s trait attributes, and
respondents in such surveys play the role of the observer of their own personal characteristics -
reporting them to researchers by answering questions contained within the specific inventory.
Of course, respondents are not asked “do you have the ‘deliberation’ trait?,” but are asked to
rate the extent to which their behavior, thoughts or feelings correspond to a series of statements.
These statements reflect nothing but differing aspects of the trait construct in question.
Statements representing the trait deliberation include; for example, “I think things through
before coming to a decision”, and “I plan ahead carefully when I go on a trip” (Costa and
McCrae 1992b, p.74). The usual answer format with these personality inventories is in the form
13 During that time, the Minnessota Multiphasic Personality Inventory (MMPI) (Hathaway and McKinley 1940)
was the most popular self-reporting inventory used. Nonetheless, its use is specific to people with emotional
disorders. Its forerunner, known as the first modern personality test, was Woodworth’s Personal Data Sheet, which
was developed by Robert Woodworth in 1919 (McAdams 1997, p.7). This test was developed to assist the United
States Army identify recruits who may be prone to combat stress.
71
of a Likert scale (Likert 1932), as these allow respondents to express the extent (e.g. frequency,
intensity or strength) to which statements reflect their behavior. Within a 5-point Likert scale,
the potential answers are “very frequently,” “frequently,” “occasionally,” “rarely,” and “never.”
The scores for each scale range from 5 (very frequently) to 1 (never). People who score highly
on these statements also receive high trait scores. The interpretation made from such a scoring
method is clear: high scorers on a trait behave, think and feel in particular ways more often and
more intensely than low scorers.
The fact that traits can be assessed using a personality inventory is very useful when using
the CVM, for in order to learn about respondents’ latent attributes, minimal instruments are
required, and those questions designed to assess the attributes of interest can be conveniently
integrated into a CVM questionnaire. This implies that the personalities of respondents can be
appraised in all survey modes, such as face-to-face interviews, mail surveys and internet
surveys. The use of personality inventories also implies that CVM researchers will be able to
assess the personality traits of a considerable number of respondents within a short period of
time, and as most personality inventories are multiple-choice tests, the interpretation of their
scores will also be straightforward and can be carried out by CVM researchers who have no
educational background in psychology. Other assessment techniques, in which answers may be
given in terms of verbal statements, may not have this advantage, such as dream interpretation.
As the use of direct questioning to assess personality traits is useful when using the CVM, and
so could be employed during this study, its strengths and limitations should be presented in
more detail.
The strength of self-reporting questionnaires lies in their intuitiveness, for most question
items are statements related to everyday activities. In order to provide valid answers, i.e.
statements that truly reflect the underlying traits in question, respondents only have to think
about the frequency and intensity of certain behavior or feelings they exhibit or experience over
time and in different situations, and this is a simple task. Furthermore, it is clear that no other
person has access to the traits of a particular person, so asking a person about his or her own
personality characteristics can be considered the most direct method possible.
The limitations of self-reporting questionnaires lie in their two key assumptions, first, that
people know enough about themselves to give meaningful statements regarding their traits, and
two, that they will give honest answers to researchers (Murray et al. 2008). These assumptions
represent the Achilles’ heel of self-reporting questionnaires, and so will be considered in turn
here. Beginning with the first assumption, it is argued that a person may not know everything
about him or herself (Kagen 1988; Kagen 2005; Kagen 2007), an issue best illustrated using the
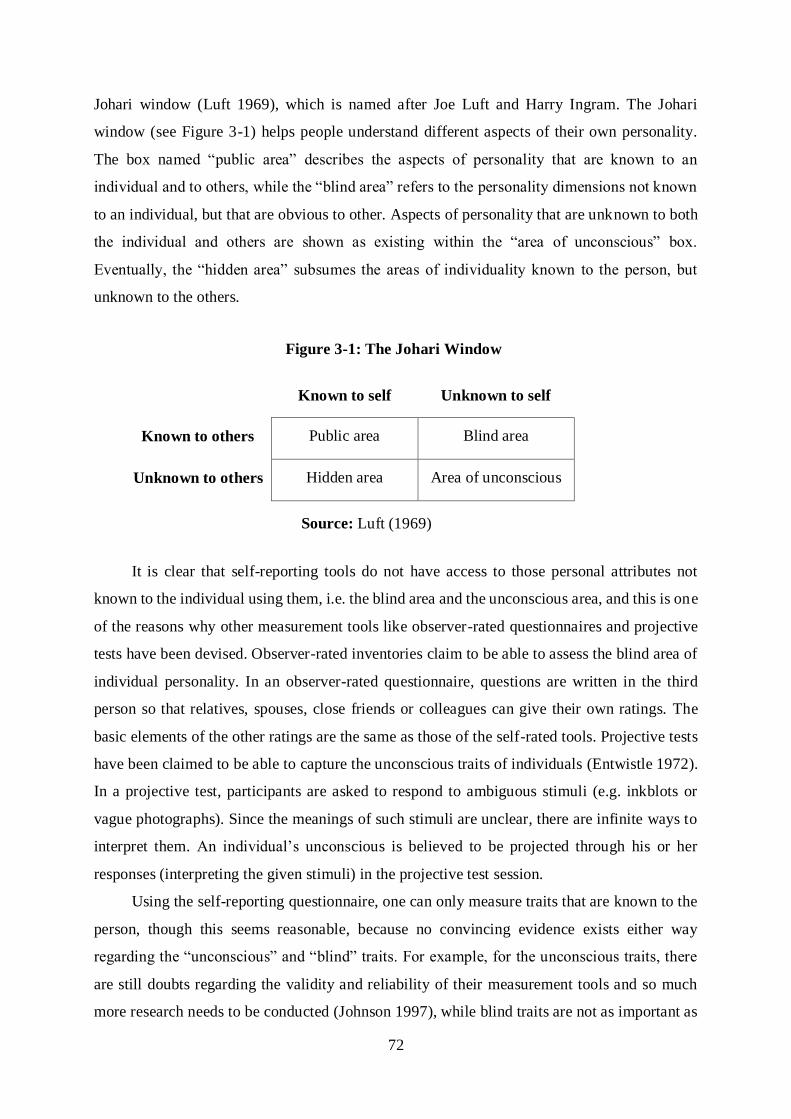
72
Johari window (Luft 1969), which is named after Joe Luft and Harry Ingram. The Johari
window (see Figure 3-1) helps people understand different aspects of their own personality.
The box named “public area” describes the aspects of personality that are known to an
individual and to others, while the “blind area” refers to the personality dimensions not known
to an individual, but that are obvious to other. Aspects of personality that are unknown to both
the individual and others are shown as existing within the “area of unconscious” box.
Eventually, the “hidden area” subsumes the areas of individuality known to the person, but
unknown to the others.
Figure 3-1: The Johari Window
Source: Luft (1969)
It is clear that self-reporting tools do not have access to those personal attributes not
known to the individual using them, i.e. the blind area and the unconscious area, and this is one
of the reasons why other measurement tools like observer-rated questionnaires and projective
tests have been devised. Observer-rated inventories claim to be able to assess the blind area of
individual personality. In an observer-rated questionnaire, questions are written in the third
person so that relatives, spouses, close friends or colleagues can give their own ratings. The
basic elements of the other ratings are the same as those of the self-rated tools. Projective tests
have been claimed to be able to capture the unconscious traits of individuals (Entwistle 1972).
In a projective test, participants are asked to respond to ambiguous stimuli (e.g. inkblots or
vague photographs). Since the meanings of such stimuli are unclear, there are infinite ways to
interpret them. An individual’s unconscious is believed to be projected through his or her
responses (interpreting the given stimuli) in the projective test session.
Using the self-reporting questionnaire, one can only measure traits that are known to the
person, though this seems reasonable, because no convincing evidence exists either way
regarding the “unconscious” and “blind” traits. For example, for the unconscious traits, there
are still doubts regarding the validity and reliability of their measurement tools and so much
more research needs to be conducted (Johnson 1997), while blind traits are not as important as
Known to self Unknown to self
Known to others Public area Blind area
Unknown to others Hidden area Area of unconscious
73
they first appear. Studies that correlate the observer- and self-rated personality scores often
report a satisfactory level of correlation, i.e. between 0.40 and 0.60 (McCrae et al. 2004;
Connolly et al. 2007). In other words, the information obtained using the self-rated and
observer-rated tools tend to be the same.
The second assumption used by self-reporting inventories is that respondents will report
truthfully to researchers, and this represents another weak point in this measurement tool. The
reason for this is that individuals may be reluctant to report their own traits. When answering
personality questions, survey respondents have two options; they can choose to disclose their
true characteristics to the interviewer, or they can withhold the truth about themselves, meaning
they may not be willing to report all their traits as they actually perceive them - they may present
themselves as they believe others would like to perceive them. This problem is known as
‘socially desirable’ responding, meaning the “tendency to give answers that make respondents
look good” (Paulhus 1991, p.17). Although the problem at hand is quite clear - that socially
desirable responding can affect the outcomes of self-administered personality assessments - the
solution is not, in fact this issue has been examined for decades and no satisfactory solutions
found. This is because it is in fact very difficult to detect if and to what extent individuals
respond to personality questionnaires in a socially desirable manner.
Typically, the detection of socially desirable responses relies on the use of self-reporting
questionnaires, such as the Marlowe-Crowne Social Desirability Scale and the Balanced
Inventory of Desirable Responding (Paulhus 2002). The basic principles behind these self-
reporting tools are similar; they contain a list of desirable but uncommon characteristics, and
also undesirable but common characteristics. Claiming to have desirable attributes or denying
the presence of undesirable ones are both signs of untruthful responses. High scorers have a
greater tendency to give socially desirable responses than low scorers. Personality measures are
considered to be biased by socially desirable responses if the scores from the two measures
correlate. In a landmark publication, McCrae and Costa (1983) argued that the use of correlation
as evidence of the invalidity of personality measures is unjustified, as the social desirability
scales do not only measure the tendency to give overly (and therefore untrue) positive self-
descriptions but also the truly positive self-descriptions of individuals. Individuals who in fact
have all the desirable characteristics listed in the social desirability scales would also obtain a
high social desirability score. And consequently the correlation of the social desirability scales
with personality measures will indicate shared substantive variance, and not shared artifact.
In summary, the use of self-reporting questionnaires is an appropriate way to elicit
personality traits, for two main reasons. First, it is the most intuitive and direct method to use
74
for measuring latent attributes like traits, and second, self-reporting offers a number of empirical
advantages for researchers. Despite some limitations to the method, self-reporting
questionnaires still offer the most effective way to measure individual traits, and particularly in
the context of this study. Now that both trait concepts and their measurement have been
introduced, the next question to consider is: How useful are trait concepts in the real world?
3.1.3 Traits in practice: Objective reality and influences on behavior
The central question for this section to address is: Are traits of use in practice and to what
extent? This is an important question because, after all, traits are hypothetical constructs, so
neither their existence nor their impacts on behavior should be taken for granted. One further
question arises from this: How can a postulated attribute such as a trait and its influence be
verified in the real world? Guidelines for the validation of theoretical constructs like traits were
developed during the 1950s14, with important contributions being: Technical Recommendations
for Psychological Tests and Diagnostic Techniques – as collated by the American
Psychological Association (1954), Cronbach and Meehl (1955), and Loevinger (1957), which
together detailed the fundamental principles behind construct validation. According to
Cronbach and Meehl (1955), a construct exists only as an “open concept,” which is defined
implicitly using a “network of laws.” This network of laws may refer to the relationships
between the construct under consideration and other constructs, or the links between the
construct in question and observable variables. When the construct under consideration is fairly
new, it may be defined only by a few associations. Over time, the “network of laws” defining a
given construct will be enriched by means of dynamic processes through which the network is
further defined and elaborated as new empirical findings accumulate over time. It should be
noted that the validation of a psychological construct resembles general scientific procedures
used for developing and testing theories. The point to be made here is that traits are also an open
concept, so we can only validate the workings and existence of traits by subjecting them to the
relevant network of laws, that is, their relationship to other constructs and/or observable
variables.
What does the evidence say regarding the reality of traits and their influence on people’s
behavior? These very same questions were at the center of the “person-situation” debate that
14 Before that, psychologists were occupying themselves with criterion-oriented validity tests (Cronbach and Meehl
1955, p. 281ff.). The procedure used in these tests is simple. Test administrators conduct the measurement, obtain
independent criteria, and compute the level of correlation between the test results and the selected criteria. An
intelligence test; for example, is valid when its scores are correlated with criteria such as GPA records.
75
characterized the development of both personality psychology and social psychology over two
decades - the 1970s and 1980s. The person-situation debate was ignited by Walter Mischel’s
Personality and Assessment, published in 1968, the main message of which was that human
behavior is too inconsistent to make traits a meaningful construct (Mischel 1968; Mischel
1973). Mischel argued that individual behavior is determined by different situations, and;
therefore, tends to vary across them. He stressed that behavior is highly situation specific, so
personality traits cannot be applied to predict human behavior. The critique produced by
Mischel became influential because of his convincing empirical evidence demonstrating that
people tend to act in a manner inconsistent with their traits. He showed that people’s trait scores
and their actual behavior do not usually correlate; and when they do, the correlation is generally
weak - a correlation figure of 0.30 has been used as the upper boundary of the relationship
between personality traits and behavior for some time. Mischel further argued that the
inconsistent nature of human beings implies that there is no such thing as a trait disposition as
suggested by trait psychologists.
Such harsh critiques offered by Mischel prompted trait psychologists to engage in two
lines of research the first of which attempts to demonstrate that traits do exist as an “objective,”
psychological attribute (Block 1977; McCrae and Costa 1987; Costa and McCrae 1988). The
second line of research tries to show that trait-behavior correlation is, in fact, stronger than the
presumed level of 0.30 (Epstein 1979; Epstein 1983; Epstein and O'Brien 1985). These two
lines of research will be briefly reviewed in turn.
Following the first line of inquiry, proponents of trait psychology tested the existence of
traits using either cross-observer or longitudinal studies. The rationale behind using cross-
observer studies was that if traits are an objective reality, they must be “perceivable”, not only
to the person in question, but also to others, such as parents, spouses, relatives, close friends
and colleagues. The cross-observer validity of personality traits can be assessed when
respondents are each rated by at least two observers - one of whom may be the subject. The
rationale behind longitudinal research is that if there are such things as traits, they should be
manifested in terms of the relative stability of individuals’ trait scores. This is because traits are
relatively enduring characteristics among individuals. Traits must endure across situations and
over time, otherwise one would not be able to distinguish traits from mental states. The typical
method used in longitudinal studies is to administer the same personality inventory to the same
person twice, with the duration between the two tests ranging from a number of weeks to a few
years.
76
Evidence suggests that satisfactory levels of convergence exist between self- and
observer-rated personality tests (McCrae 1982; McCrae and Costa 1987); for example, McCrae
and Costa (1987) administered the self- and observer-rated versions of two different trait
instruments. In their study, the subjects were asked to nominate friends, neighbors and co-
workers who were not their relatives, and the results showed substantial levels of agreement
among different observers regarding the traits of the same subject. Agreement was also found
between self-raters and peer-raters. The magnitude of the correlations ranged from 0.40 to 0.60,
and the results held for both personality inventories. These results led authors to point to the
existence of traits as objective psychological attributes, those that both groups of respondents
could perceive somewhat accurately. The results were confirmed recently (Connolly et al.
2007).
Evidence from longitudinal studies has also showed that traits are somewhat stable
overtime. Some longitudinal studies have suggested that traits exhibit their robustness over
rather long periods of time, such as six years (Costa and McCrae 1988) or in some studies, 45
years (Soldz and Vaillant 1999). What makes things complicated for this form of inquiry is the
perception of trait psychologists that individual traits are only relatively stable (Costa and
McCrae 1997) - trait theorists do not expect individuals’ trait scores to remain stable throughout
their lives. In fact, personality scientists believe that there are normative trait patterns that shift
within individuals. For this reason, results from longitudinal studies cannot be meaningfully
interpreted unless the normative shift among traits is revealed. Researchers have put significant
effort into investigating the normative shifts among traits, and early evidence presented by
McCrae and Costa (1994) suggested that after the age 30, individual traits become more stable.
This proposal was widely accepted among trait psychologists until recently, when new evidence
emerged showing that traits do change even in people over 30 years of age, and that patterns of
personality development are unique for each person (Roberts and Mroczek 2008). Basically,
this means that much more research is needed, and that the nature of trait development is far
from settled. Until this research is carried out, evidence from longitudinal studies may provide
only weak support for the objective reality of trait.
As to the second line of inquiry that attempt to investigate the predictive power of traits,
evidence on trait-behavior correlations suggests that traits can predict behavior better than the
0.30 barrier mentioned previously. The average degree of correlation between a single trait and
a behavior has been updated to around 0.40 (Nisbett 1980), which is already very close to the
theoretically obtainable level of correlation between a specific trait and a specific behavior of
0.50 (Ahadi and Diener 1989; Strube 1991). Interestingly enough, the effect of a given
77
“situation” on behavior is not stronger than that of a “person.” In a special issue of the Journal
of Research in Personality (2009 – issue 43), published to commemorate 40 years of the person-
situation debate, Funder (2009, p.120) noted that 0.40 represents about the same impact level
as documented over a century of social-psychological research (Richard et al. 2003). Worse,
some authors pointed out that while the “person” side of the debate can be defined with
considerable specificity and validity, the issue of how to specify and measure “situations” is far
from settled (Hogan 2009). Thus, the prediction of single behavioral acts cannot be expected to
depend upon explanations drawn from a single situational variable.
In sum, traits seem to be a useful psychological concept in the real world. Driven by the
critique on trait theory which were put forward during the 1970s, personality psychologists have
since convincingly demonstrated that the concept of traits exists as objective psychological
attributes and that traits do have a significant impact upon people’s behavior. Taken section
3.1.1, 3.1.2 and 3.1.3 together, it appears that the concept of personality in general and traits in
particular, provides an appropriate conceptual basis for the investigation of the psychological
characteristics of CVM respondents. First, traits hold an important role in the functioning of
individuals, i.e. they give rise to behavior. Second, traits can be conveniently measured during
a CVM survey through the use of personality inventories, and third, empirical evidence supports
the assertion that traits exist as objective attributions and can be used to predict people’s
behavior. For these reasons, the use of trait theory in this study would appear to have been
justified.
3.1.4 Trait taxonomy: In search of the fundamental traits of human beings
In the remainder of this section, the focus will shift to the selection of those traits to be used to
explain WTP response behavior. The key question related to this was: Which traits should be
selected for analysis in the context of a CVM survey? Trait selection is a crucial step in such a
study, and lessons had been learned from consumer studies conducted during the 1970s and
1980s (Kassarjian 1971; Kassarjian and Sheffet 1981; Kassarjian and Sheffet 1991), a time
when traits were used rigorously to predict the purchasing-decisions of consumers. Contrary to
expectations, traits showed a poor predictive ability with regard to the consumption choices of
economic agents (Kassarjian 1971), one of the many reasons for this being the lack of
theoretical justification for the investigations. In most cases, “no a priori thought is directed to
how or why personality should or should not be related to that aspects of consumer behavior
being studied” (Jacoby 1971, p. 244). In addition, it was often the case that the personality scales
used were not appropriate, with trait concepts developed to explain such issues as psychological
78
condition such as schizophrenia being used to predict the purchasing behavior related to
washing machines or a pair of shoes.
To avoid repeating these mistakes, this study employed those traits which represent the
most crucial aspects of an individual personality, as this ensured that the selected dispositions
would be critical in helping to understand the psychological “pillars” that underlie the way in
which people function across contexts and over time. But what are the most important aspects
of an individual personality? It was discussed earlier that the early personality theorists were
not able to answer this question, and their attempts to gain a more comprehensive level of
understanding of personality led to the conclusion that the phenomena embedded in this concept
is too diverse and complex to be united in any single theory. As a result, personality theorists
went elementaristic, focusing their interest on conceptualizing and measuring parts of
personality, such as traits (see 3.1.1). And as will be shown below, this shift in focus was
followed by the development of a multitude of traits, and this ultimately led to a resurgence of
interest in the carrying out of research aimed at developing a comprehensive theory of
personality.
The resurgence of interest to develop a comprehensive theory of personality was triggered
by the need to bring order to a discipline which had been flooded with trait descriptors (see John
et al. 1988). Due to the boom in interest around trait research, the number of trait descriptors
developed “escalated without an end in sight” (John and Srivastava 2001, p.102). The number
of traits identified ended up being as high as between 2,800 and 4,500, depending on the
definition of a trait used (Allport and Odbert 1936; Norman 1967). For this reason, trait
scientists attempted to identify a set of fundamental personality descriptions in terms of trait
taxonomy. The basic idea behind trait taxonomy is that the universe of personality dimensions
is influenced and therefore can be represented by a limited number of essential personality traits
(John and Srivastava 2001). Obviously, a taxonomical approach to traits is a theoretical
breakthrough that should be exploited in this study, for it not only facilitates the selection of
those traits to be used, but will also ensure that all the key mental attributes held by individuals
are taken into account.
Apart from the three key assumptions of trait theory reviewed in section 3.1.1, trait
taxonomy relies on one additional key assumption. The assumption is that all trait terms can be
organized into some kind of hierarchical structure, implying that there are different levels of
traits - from more general to more specific ones. Traits at the lower level of the hierarchy are
assumed to contain meanings that are both common and specific. Based on their common
meaning, the lower level traits can be combined to form a larger but more general trait.
79
However, this also means that some specific meanings around the smaller traits remain
unexplained by the larger or global ones. By measuring specific traits, additional information
over and above that which could be obtained from the global traits is guaranteed.
Over the years, various trait taxonomies have been proposed (Cattell 1947; Eysenck 1947;
Costa and McCrae 1992a), but nowadays it seems to be commonly accepted in personality
psychology that there are five core psychological aspects of human beings, and that they are
represented by five global personality traits, or the “Big Five” (Goldberg 1993). Despite some
controversy (Eysenck 1992; McAdams 1992; Block 1995), the Big Five Personality Model (or
BFM; also known as the ‘five-factor theory’ or ‘five-factor model’) has gained traction among
personality psychologists as a general taxonomy of personality traits (De Raad 2000). Since
1995, the BFM has outpaced alternative trait taxonomies and dominated publications on
personality studies (John et al. 2008). It is the intention of this study to employ the BFM, for it
is expected that by identifying the five psychological pillars of CVM respondents, it will be
possible to give sound psychological explanations for many of the participants’ WTP responses,
those left unexplained by micro-economic theory.
Even though the use of the BFM to explain an economic valuation of environmental
changes has yet to be tested, two reasons exist which would lead one to believe that the BFM
will provide a valuable theoretical foundation for this study. First, the BFM contains key
personality dimensions that are important when wishing to understand individuals. As will be
shown later in this chapter, these core personality dimensions cover various psychological areas,
including the emotional, interpersonal, experiential, attitudinal and motivational aspects of
people, all of which may play a decisive role in their WTP decisions. Second, the BFM is well
validated, for even though there are varying taxonomical models, only the BFM has been
accepted as a common language among personality psychologists. Over the last few decades,
its validity and reliability have been intensively evaluated. Throughout the remainder of this
chapter, the conceptualizations and measurement of the BFM will be introduced and discussed.
3.2 The Big Five personality model (BFM) This section is designed to introduce the conceptualizations and definitions of the five global
traits and is structured as follows. Section 3.2.1 offers a short history of the BFM, introducing
how personality psychologists came to a consensus that the basic structure behind personality
differences could be analyzed using only five global traits. As this section unveils, it is apparent
that two lines of inquiry have played a major role in helping to uncover the thousands of trait
80
descriptions that exist and which can be broadly categorized into the five dimensions. These
lines of inquiry are associated with the so-called lexical and questionnaire tradition. While
Section 3.2.1 focuses on the former, Section 3.2.2 takes a closer look at the questionnaire
tradition. The five-factor model developed by Paul T. Costa, Jr. and Robert R. McCrae will also
be introduced, for their work associated with the questionnaire tradition forms a line of research
that has had a tremendous influence on the development of the theory-based BFM. At present,
Costa and McCrae’s framework is the most used within the field of personality studies, and;
therefore, will be adopted in this study. Also in Section 3.2.2, each of the five global traits will
be placed under the microscope, before Section 3.2.3 discusses measurement of the Big Five
and also the applicability of the BFM in non-English speaking countries.
3.2.1 A short history: Why five?
To properly understand the development of the BFM, the concept of lexical hypothesis must be
introduced. The lexical hypothesis was pioneered by Gordon Allport, in an attempt to identify
all trait descriptions that exist in the personality sphere. Allport postulated that all important
descriptions regarding human behavior can be explored in everyday language. The basic
assumption behind this hypothesis is that those individual differences that are most salient and
socially relevant in people’s lives will eventually become encoded into their language; the more
important such an individual difference, the more likely is it to become expressed as a single
word (John et al. 1988). The study by Allport and Odbert (1936) marked one of the first
scientific studies on trait taxonomy to be carried out using lexical hypothesis. 15They pioneered
the lexical hypothesis by selecting trait terms from the second edition of the unabridged
Webster’s New International Dictionary. All nouns and adjectives that could be used to
“distinguish the behavior of one human being from that of another” were investigated (Allport
and Odbert 1936, p.24). They compiled a list of approximately 17,953 words and put these into
different categories, these being: personality traits, temporary states, evaluative judgments and
doubtful terms. Allport managed to obtain 4,504 words that could also be classified as trait
terms.
Allport’s identification of the “trait sphere” served as the basis for an important
breakthrough in taxonomical research made by Raymond B. Cattell (1943). Cattell believed
that there are different levels of trait description, from the most specific traits to the most
15 The first lexical study was completed by Baumgarten (1933), who assembled terms from various German
dictionaries and publications using her own judgment, but did not classify the terms further (John et al. 1988,
p.176).
81
general. This idea drove him to engage in a quest to condense the list of trait terms making use
of the factor analytical method, which is a statistical method that had recently been developed.
This method can be used to detect the underlying but unobservable structure of a dataset. Using
factor analysis, the inter-correlations among general traits can be detected, and their “sources”
identified. There were two main steps in Cattell’s attempt to extract the source traits. First,
Cattell (1943) used the semantic reduction process, in which he omitted terms with prefixes for
which the stem terms were also available. As a part of this, he excluded many rare, archaic and
colloquial terms (De Raad 2000). The remaining terms were categorized on the basis of both
synonymity and anonymity, producing bipolar trait descriptions. This first step resulted in 160
categories of trait descriptions, and then by adding terminology that had been developed by
psychologists, Cattell arrived at 171 personality variables, those he claimed comprised the
complete personality sphere. Second, Cattell used correlation analysis to find the “sources” of
these 171 traits, and the result was the 35 derived personality variables. Cattell argued that these
35 traits represented source traits, later applying oblique factor analysis and obtaining 12
personality factors which later became a part of his 16 personality factors, also known as the
16-PF.
Cattell’s 16-PF triggered the discovery of the BFM. Empirical studies that tried to
replicate Cattell’s study failed to uncover the 16 personality factors (Fiske 1949; Tupes and
Christal 1961; Norman 1963; Digman and Takemoto-Chock 1981), but instead found that the
structure of people’s personality could be best described using only five personality variables
and not 16 as suggested by Cattell. The BFM was “discovered” when Donald Fiske (1949)
executed factor analysis based on peer- and staff-ratings from 128 subjects. He found that
people’s personality is best described using only five dimensions. Fiske did not follow-up on
his initial findings and his discovery is often described as an “accident” (Goldberg 1993, p.27).
Years later, Tupes and Christal (1961) attempted to clarify these factors, carrying out factor
analysis studies based on peer ratings from 790 subjects. They also re-analyzed Cattell’s
datasets as well as those of Fiske. Their results replicated Fiske’s, i.e. the persisting structure of
the Big Five was found across all different sample groups. Tupes and Christal described the
five factors as: emotional stability (calm and not easily upset), surgency (talkative, assertive
and energetic), culture (intellectual/cultured and independent-minded), agreeableness (good-
natured, cooperative and trustful), and dependability (conscientious, responsibility and orderly).
Their five factors resemble the first five in Cattell’s 16 PF and show striking similarities to
Fiske’s 5 (John et al. 1988). Other scholars who investigated Cattell’s framework and obtained
82
the five personality dimensions are, among others, Norman (1963), and Digman and Takemoto-
Chock (1981).
One limitation of these pioneering studies is that they are all rooted in Cattell’s personality
model; therefore, what the evidence from these studies really shows is that Cattell’s 35
personalities can be summarized within five broad personality traits. In addition, researchers
were convinced that Allport and Odbert’s analyses were hindered by technical limitations
(Goldberg 1993), and this led to the idea that a “second round” of dictionary studies and of
factor analyses should be conducted in order to confirm the BFM. This task was carried out
mainly by two prominent personality researchers - Warren Norman and Lewis Goldberg.
During the 1980s and 1990s Goldberg worked extensively on English words, then newly
identified by Norman (1967)16, as the full universe of trait descriptions. From Norman’s
complete set of 2,797 trait terms Goldberg (1981) constructed his trait inventory, excluding
terms whose meanings could not be well understood and words that were variants of the already
included terms (John et al. 1988). This led to the development of an inventory of 1,710 traits,
and this inventory was used as a basic tool to scrutinize Norman’s trait sphere. Goldberg
executed a series of studies unearthing trait dimensions that he believed best represent the basic
structure of Norman’s trait terms. The studies were summarized in Goldberg (1990). The factor
structures of personality data in these studies clearly replicate the BFM, and Goldberg
eventually concluded that the five personality traits best account for the basic structure of
individual personality. As a result, he dubbed these five global traits, the “Big Five.”
To sum up, the BFM was originally “discovered” as a result of the many waves of
investigation into English language trait terms. With help from the factor analytical method, the
theoretical significance of trait terms in the English dictionary, and the idea of there being a
hierarchical structure of personality, was empirically exhibited. The BFM has since been
validated to the extent that it forms an important milestone in personality research, bringing a
consensus to the field of personality psychology that humans’ latent and stable psychological
16 Norman (1967) scanned the unabridged 1961 Webster’s Third New International Dictionary (the version used
by Allport and Odbert in 1936 which was issued in 1925). He found 9,046 terms in addition to Allport and Odbert
(1936), most of which were either suffixal or prefixal variations of terms already included. He therefore added
only 171 terms, resulting in a master set of 18,125 terms (cf. John et al. 1988, p.185). From these, Norman derived
2,797 terms that can be used to describe consistent and stable modes of individual adjustment to the environment.
His 2,797 trait terms are much fewer in number than Allport and Odbert’s 4,504, because he excluded dispositions related to physical and mental health (e.g. insane) and physical dispositions (e.g. athletic) (cf. John et al. 1988,
p.187). Norman’s listing provided the foundation for most contemporary taxonomies, because the exclusion and
inclusion of terms was based on much more explicit criteria.
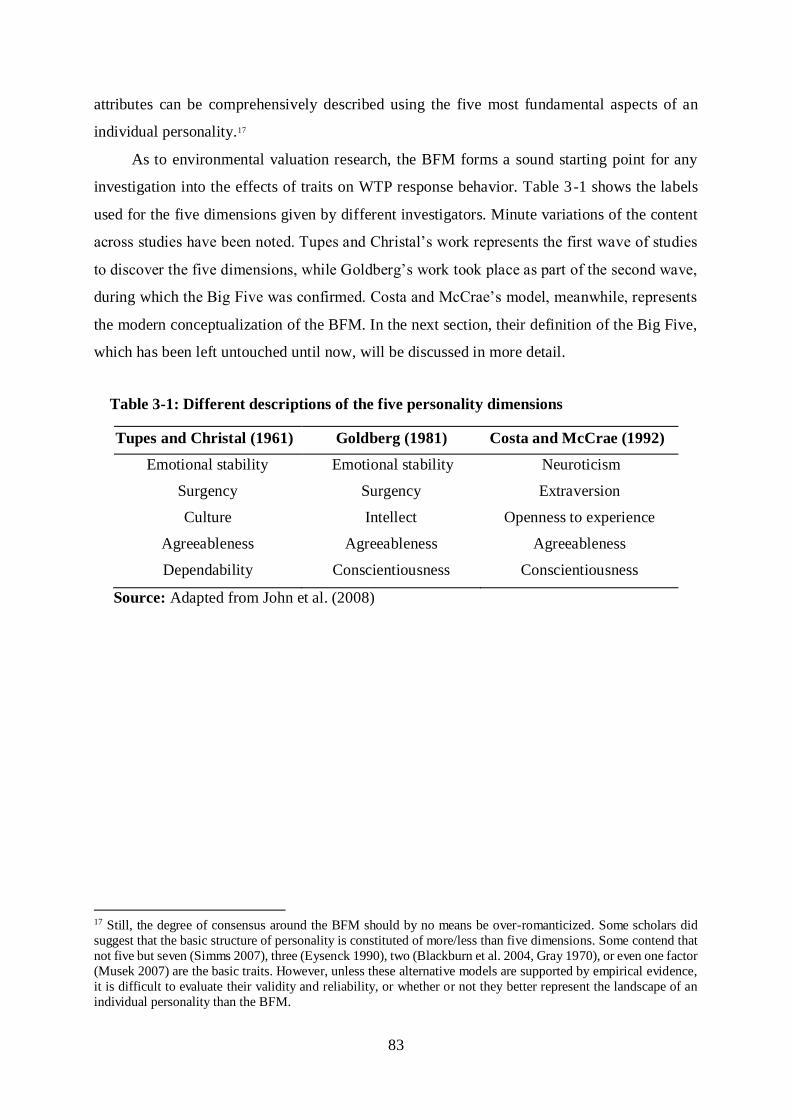
83
attributes can be comprehensively described using the five most fundamental aspects of an
individual personality.17
As to environmental valuation research, the BFM forms a sound starting point for any
investigation into the effects of traits on WTP response behavior. Table 3-1 shows the labels
used for the five dimensions given by different investigators. Minute variations of the content
across studies have been noted. Tupes and Christal’s work represents the first wave of studies
to discover the five dimensions, while Goldberg’s work took place as part of the second wave,
during which the Big Five was confirmed. Costa and McCrae’s model, meanwhile, represents
the modern conceptualization of the BFM. In the next section, their definition of the Big Five,
which has been left untouched until now, will be discussed in more detail.
Table 3-1: Different descriptions of the five personality dimensions
Tupes and Christal (1961) Goldberg (1981) Costa and McCrae (1992)
Emotional stability Emotional stability Neuroticism
Surgency Surgency Extraversion
Culture Intellect Openness to experience
Agreeableness Agreeableness Agreeableness
Dependability Conscientiousness Conscientiousness
Source: Adapted from John et al. (2008)
17 Still, the degree of consensus around the BFM should by no means be over-romanticized. Some scholars did
suggest that the basic structure of personality is constituted of more/less than five dimensions. Some contend that
not five but seven (Simms 2007), three (Eysenck 1990), two (Blackburn et al. 2004, Gray 1970), or even one factor
(Musek 2007) are the basic traits. However, unless these alternative models are supported by empirical evidence,
it is difficult to evaluate their validity and reliability, or whether or not they better represent the landscape of an
individual personality than the BFM.
84
3.2.2 Costa and McCrae’s framework
Because the BFM was developed from trait terms contained within an English dictionary, some
psychologists said that the Big Five should be interpreted as descriptive rather than explanatory
concepts (John et al. 2008), meaning that predictions regarding individuals’ behavior could be
made based on the five global traits. However, these domains are not necessarily the causes of
people’s behavior due to their lexical origin. For example, a statement such as “Bob works hard
because Bob is conscientious” is a circular statement.18
A different conceptualization of the Big Five was put forward by Paul T. Costa Jr. and
Robert R. McCrae, who proposed that the Big Five are basic dispositions that “contribute
causally to the development of habits, attitudes, skills, and other characteristic adaptations”
(McCrae and Costa 1995, p.231). The underlying mechanisms of such influences are left open,
meaning “the mechanisms through which traits operate may or may not be specified in
psychological theory” (McCrae and Costa 1995, p.248). According to this perspective, “Bob
works hard because Bob is conscientious” can be considered a genuine explanation; however,
the true mechanisms - referring mostly to biological ones (John et al. 2008) - underlying the
causal influences of “conscientiousness” on “working hard” remain to be discovered.
The reason for these varying conceptualizations lies in the fact that Costa and McCrae’s
BFM was developed using a different approach from the lexical one (McCrae 1994). The BFM
based on a lexical hypothesis begins from the bottom-up: firstly identifying all traits in the
personality sphere using information from natural language in the dictionary, and then
identifying the broadest possible dimensions that could describe those traits. Costa and McCrae
began at the top and worked down, meaning first the broadest possible dimensions of traits were
identified and only then their constituents (Costa and McCrae 1992b). Rather than investigating
traits in a dictionary, Costa and McCrae chose to work with questionnaires whose scales were
designed to measure constructs derived from personality theories. The guiding principle of
Costa and McCrae’s work is to search for resemblances in what various questionnaire scales
measure. By identifying as many as possible of the broad personality traits that are common
across theories and questionnaires, and at the same time searching for the broad traits that are
left unaccounted for, by the late 1980s Costa and McCrae were convinced that they had
exhausted the full range of personality characteristics (McCrae and John 1992).
18 An alternative view given by Johnson (1997, p.77) was that such a statement can be considered a valid
explanation, even if the Big Five are only a description of typical behavior and have no causal influence on them.
The actual message from such a statement is that Bob’s behavior is not unusual for him and; thus’ his action
requires no further explanations. It is similar to saying “that’s typical” or “that’s in his nature.”
85
Most importantly, McCrae and Costa were among the first to show that the Big Five
constructed from lexical studies (the dictionary-based Big Five) converge with those derived
from personality theory, i.e. the questionnaire tradition (McCrae and Costa 1985; McCrae and
Costa 1987). They named the latter the Five-Factor personality model to distinguish it from the
Big Five model.19 In one of their classic papers, McCrae and Costa (1987) asked individuals to
rate Goldberg’s trait scales (an inventory designed to assess the dictionary-based traits of
individuals) and the NEO inventory, which is a questionnaire developed by McCrae and Costa
to assess theoretically based global traits.20 The detail of this inventory will be given in section
3.2.3. After factor-analyzing the data, five factors were “revealed” across the datasets, so
McCrae and Costa (1987) went on with the investigation, administering self-reporting and
observer-rated versions of Goldberg’s trait scales and the NEO inventory. Observers in the
study were friends, neighbors and co-workers of the respondents, and the results showed that
different observers agreed on the traits for the same respondent. Further, correspondences
between self-rated and other-rated surveys were also reported. The results obtained led McCrae
and Costa to conclude that the Big Five are objective, psychological attributes. The
correspondences between the lexical BFM and the theoretically-developed BFM on the one
hand, and between the self-reporting and other-ratings on the other, have very important
consequences for the conceptualizations of the Big Five, showing that the five global traits are
more than everyday English trait terms and that they have an objective reality as other,
traditional trait concepts. This finding led to “a dramatic change in the acceptance of the five
factors in the field” (John et al. 2008, p.139).
Basically, the Costa and McCrae five personality factor model and the lexical Big Five
concept are similar. The number of dimensions in both models is the same, and the content of
the dimensions are similar (Goldberg 1993). The main difference is that Costa and McCrae
(1992b) conceptualize the Big Five in terms of domains and facets (see Figure 3-2), with
domains referring to the five global personality traits, and facets referring to specific traits
located at a lower level of the trait hierarchy. Each of the five domains is represented by six
facets, not because each is naturally divided into six parts, but because literature suggests that
at least six components are necessary to capture the workings of each domain (Costa et al.
1991). This approach has an important strength over the lexical tradition, because facets are
19 For convenience purposes, the five-factor model will also be referred to as the BFM for the remainder of this
paper.
20 NEO is an acronym for neuroticism, extraversion, and openness to experience the first three global traits that
were identified by McCrae and Costa.
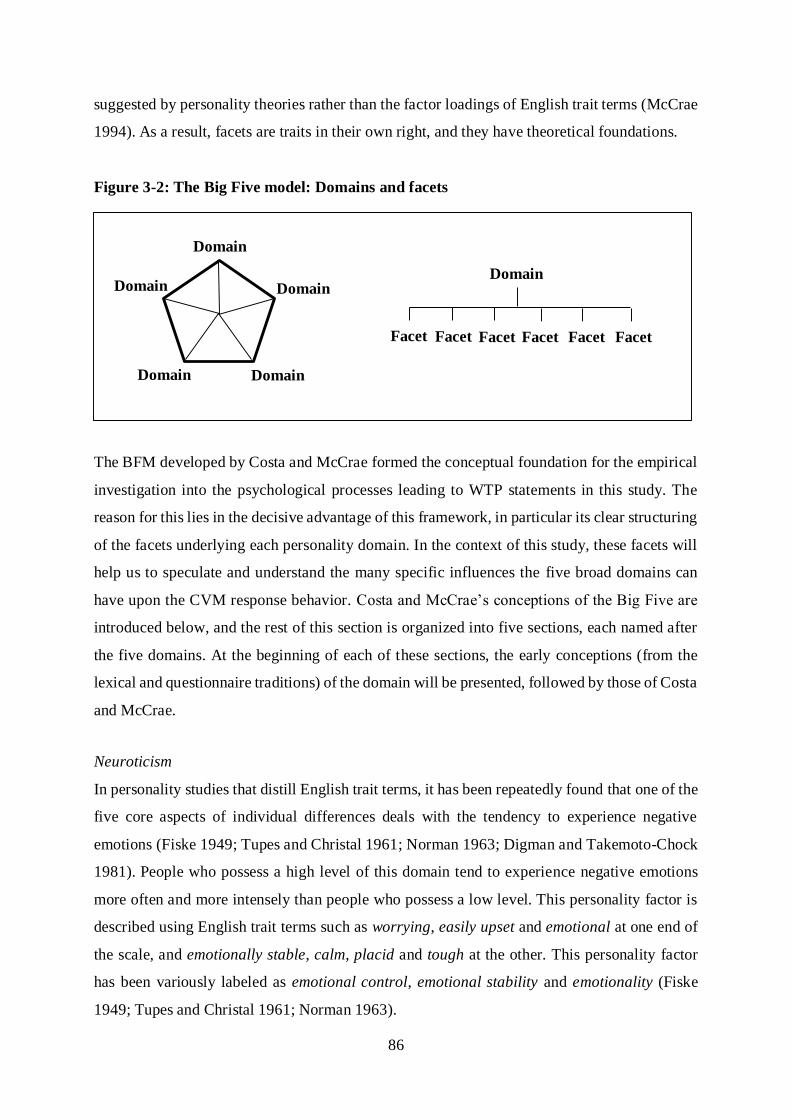
86
suggested by personality theories rather than the factor loadings of English trait terms (McCrae
1994). As a result, facets are traits in their own right, and they have theoretical foundations.
Figure 3-2: The Big Five model: Domains and facets
The BFM developed by Costa and McCrae formed the conceptual foundation for the empirical
investigation into the psychological processes leading to WTP statements in this study. The
reason for this lies in the decisive advantage of this framework, in particular its clear structuring
of the facets underlying each personality domain. In the context of this study, these facets will
help us to speculate and understand the many specific influences the five broad domains can
have upon the CVM response behavior. Costa and McCrae’s conceptions of the Big Five are
introduced below, and the rest of this section is organized into five sections, each named after
the five domains. At the beginning of each of these sections, the early conceptions (from the
lexical and questionnaire traditions) of the domain will be presented, followed by those of Costa
and McCrae.
Neuroticism
In personality studies that distill English trait terms, it has been repeatedly found that one of the
five core aspects of individual differences deals with the tendency to experience negative
emotions (Fiske 1949; Tupes and Christal 1961; Norman 1963; Digman and Takemoto-Chock
1981). People who possess a high level of this domain tend to experience negative emotions
more often and more intensely than people who possess a low level. This personality factor is
described using English trait terms such as worrying, easily upset and emotional at one end of
the scale, and emotionally stable, calm, placid and tough at the other. This personality factor
has been variously labeled as emotional control, emotional stability and emotionality (Fiske
1949; Tupes and Christal 1961; Norman 1963).
Domain
Domain
Domain
Domain
Domain
Domain
Facet Facet Facet Facet Facet Facet
87
In traditional personality studies, traits describing the tendency to experience negative
emotions have also been at the forefront thanks to the intensive research carried out by Hans J.
Eysenck (1947). Eysenck’s view of neuroticism resembles that of the lexical tradition, for he
perceived neuroticism as a trait that determines the propensity of individuals to experience
negative emotions. Individuals with a high level of neuroticism are receptive to stressful
situations, while low scorers are calm and relaxed. Conventional wisdom on neuroticism was
very much influenced by Eysenck’s hypothesis; that neuroticism is associated with the brain’s
“limbic system,21” which at that time was believed to be an “emotional hub” in the human brain.
Though considered obsolete by trait theorists today, Eysenck’s hypothesis of the biological
foundation of neuroticism paved the way for other brain-based theories of neuroticism to be
developed. Eysenck’s research on neuroticism played a very important role in convincing
personality theorists, including Costa and McCrae, that neuroticism is one of the basic human
personality dimensions (Eysenck 1947; Eysenck 1967; Eysenck 1990).
Costa and McCrae (1992b, p.14) view neuroticism as a personality domain that influences
“the general tendency to experience negative effects such as fear, sadness, embarrassment,
anger, guilt, and disgust.” People with a high level of neuroticism have a high propensity to
experience these six negative emotions. The neuroticism domain also gives rise to phenomena
such as a susceptibility to impulses and a low ability to cope with individual stress (Costa and
McCrae 1992b). Despite the similarities neuroticism may share with certain other mental
disorders, Costa and McCrae stressed that neuroticism does not imply mental distress.
Individuals can have a high level of neuroticism without having any mental disorders of any
kind, while people with a low level of neuroticism are not necessarily cheerful or jolly the whole
time – though they experience negative moods less often than high scorers. They tend to be
emotionally stable, calm and even-tempered; relaxed and able to cope with stressful situations.
It was mentioned before that Costa and McCrae conceptualized each of the five personality
domains to encompass six specific traits or facets. In this study, facets will be used, not only to
provide a better understanding of the working of these domains, but also to explain WTP
response behavior. For now, descriptions for the facets of neuroticism are described in Box 3-
1.
21 Note that the limbic system refers to a set of brain structures consisting of parts of the amygdale, septum,
hippocampus and prefrontal cortex. The term may wrongly remind the reader of a different medical term - the
lymph, which refers to a type of fluid in the body.
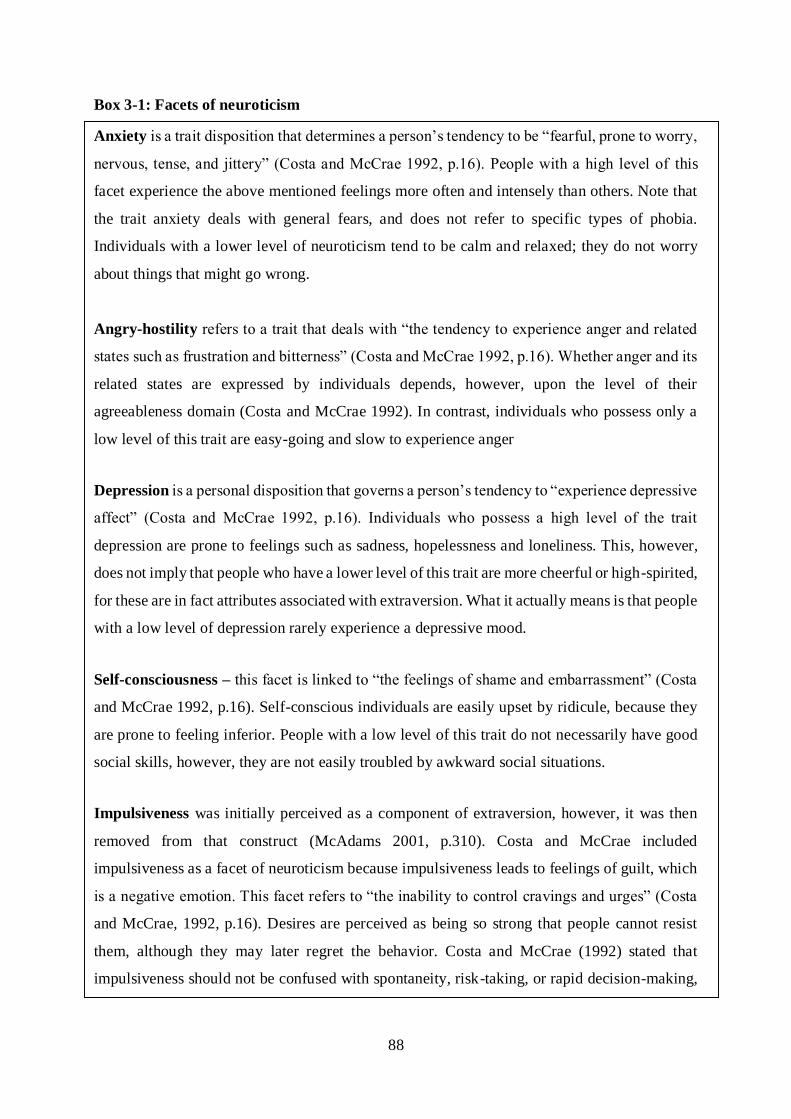
88
Box 3-1: Facets of neuroticism
Anxiety is a trait disposition that determines a person’s tendency to be “fearful, prone to worry,
nervous, tense, and jittery” (Costa and McCrae 1992, p.16). People with a high level of this
facet experience the above mentioned feelings more often and intensely than others. Note that
the trait anxiety deals with general fears, and does not refer to specific types of phobia.
Individuals with a lower level of neuroticism tend to be calm and relaxed; they do not worry
about things that might go wrong.
Angry-hostility refers to a trait that deals with “the tendency to experience anger and related
states such as frustration and bitterness” (Costa and McCrae 1992, p.16). Whether anger and its
related states are expressed by individuals depends, however, upon the level of their
agreeableness domain (Costa and McCrae 1992). In contrast, individuals who possess only a
low level of this trait are easy-going and slow to experience anger
Depression is a personal disposition that governs a person’s tendency to “experience depressive
affect” (Costa and McCrae 1992, p.16). Individuals who possess a high level of the trait
depression are prone to feelings such as sadness, hopelessness and loneliness. This, however,
does not imply that people who have a lower level of this trait are more cheerful or high-spirited,
for these are in fact attributes associated with extraversion. What it actually means is that people
with a low level of depression rarely experience a depressive mood.
Self-consciousness – this facet is linked to “the feelings of shame and embarrassment” (Costa
and McCrae 1992, p.16). Self-conscious individuals are easily upset by ridicule, because they
are prone to feeling inferior. People with a low level of this trait do not necessarily have good
social skills, however, they are not easily troubled by awkward social situations.
Impulsiveness was initially perceived as a component of extraversion, however, it was then
removed from that construct (McAdams 2001, p.310). Costa and McCrae included
impulsiveness as a facet of neuroticism because impulsiveness leads to feelings of guilt, which
is a negative emotion. This facet refers to “the inability to control cravings and urges” (Costa
and McCrae, 1992, p.16). Desires are perceived as being so strong that people cannot resist
them, although they may later regret the behavior. Costa and McCrae (1992) stated that
impulsiveness should not be confused with spontaneity, risk-taking, or rapid decision-making,
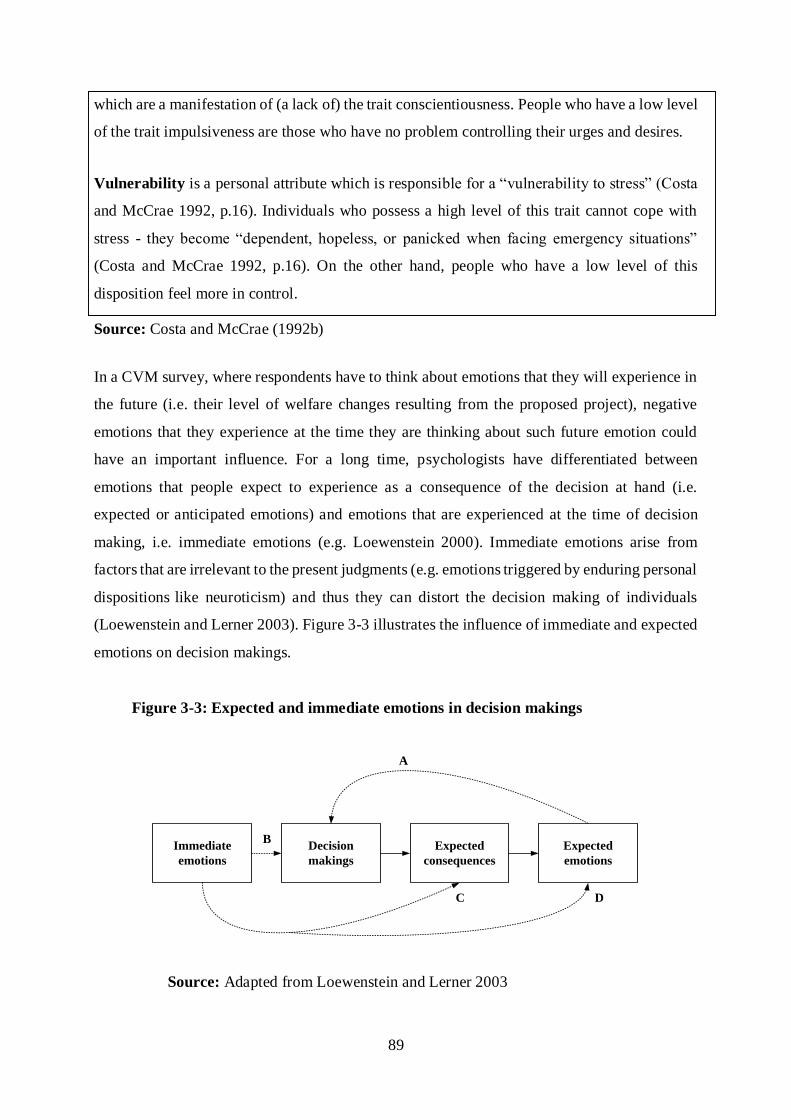
89
which are a manifestation of (a lack of) the trait conscientiousness. People who have a low level
of the trait impulsiveness are those who have no problem controlling their urges and desires.
Vulnerability is a personal attribute which is responsible for a “vulnerability to stress” (Costa
and McCrae 1992, p.16). Individuals who possess a high level of this trait cannot cope with
stress - they become “dependent, hopeless, or panicked when facing emergency situations”
(Costa and McCrae 1992, p.16). On the other hand, people who have a low level of this
disposition feel more in control.
Source: Costa and McCrae (1992b)
In a CVM survey, where respondents have to think about emotions that they will experience in
the future (i.e. their level of welfare changes resulting from the proposed project), negative
emotions that they experience at the time they are thinking about such future emotion could
have an important influence. For a long time, psychologists have differentiated between
emotions that people expect to experience as a consequence of the decision at hand (i.e.
expected or anticipated emotions) and emotions that are experienced at the time of decision
making, i.e. immediate emotions (e.g. Loewenstein 2000). Immediate emotions arise from
factors that are irrelevant to the present judgments (e.g. emotions triggered by enduring personal
dispositions like neuroticism) and thus they can distort the decision making of individuals
(Loewenstein and Lerner 2003). Figure 3-3 illustrates the influence of immediate and expected
emotions on decision makings.
Figure 3-3: Expected and immediate emotions in decision makings
Source: Adapted from Loewenstein and Lerner 2003
Immediate
emotions
Expected
emotions
Expected
consequences
Decision
makings
A
B
C D
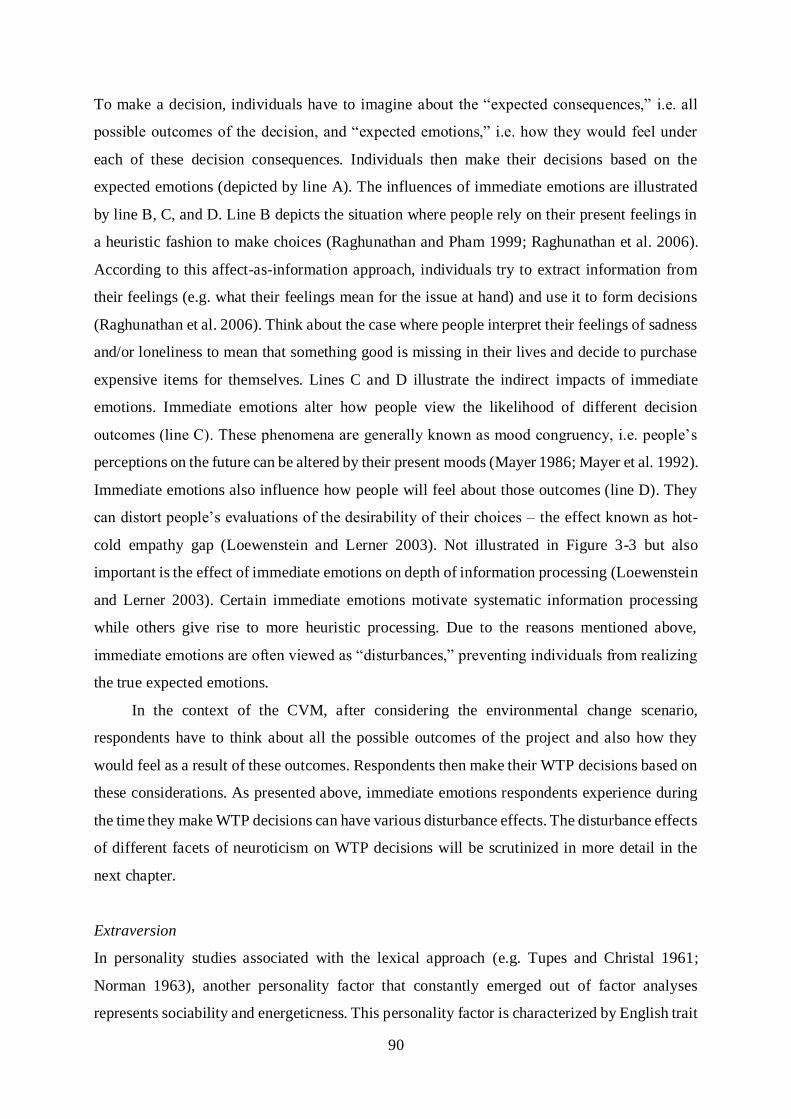
90
To make a decision, individuals have to imagine about the “expected consequences,” i.e. all
possible outcomes of the decision, and “expected emotions,” i.e. how they would feel under
each of these decision consequences. Individuals then make their decisions based on the
expected emotions (depicted by line A). The influences of immediate emotions are illustrated
by line B, C, and D. Line B depicts the situation where people rely on their present feelings in
a heuristic fashion to make choices (Raghunathan and Pham 1999; Raghunathan et al. 2006).
According to this affect-as-information approach, individuals try to extract information from
their feelings (e.g. what their feelings mean for the issue at hand) and use it to form decisions
(Raghunathan et al. 2006). Think about the case where people interpret their feelings of sadness
and/or loneliness to mean that something good is missing in their lives and decide to purchase
expensive items for themselves. Lines C and D illustrate the indirect impacts of immediate
emotions. Immediate emotions alter how people view the likelihood of different decision
outcomes (line C). These phenomena are generally known as mood congruency, i.e. people’s
perceptions on the future can be altered by their present moods (Mayer 1986; Mayer et al. 1992).
Immediate emotions also influence how people will feel about those outcomes (line D). They
can distort people’s evaluations of the desirability of their choices – the effect known as hot-
cold empathy gap (Loewenstein and Lerner 2003). Not illustrated in Figure 3-3 but also
important is the effect of immediate emotions on depth of information processing (Loewenstein
and Lerner 2003). Certain immediate emotions motivate systematic information processing
while others give rise to more heuristic processing. Due to the reasons mentioned above,
immediate emotions are often viewed as “disturbances,” preventing individuals from realizing
the true expected emotions.
In the context of the CVM, after considering the environmental change scenario,
respondents have to think about all the possible outcomes of the project and also how they
would feel as a result of these outcomes. Respondents then make their WTP decisions based on
these considerations. As presented above, immediate emotions respondents experience during
the time they make WTP decisions can have various disturbance effects. The disturbance effects
of different facets of neuroticism on WTP decisions will be scrutinized in more detail in the
next chapter.
Extraversion
In personality studies associated with the lexical approach (e.g. Tupes and Christal 1961;
Norman 1963), another personality factor that constantly emerged out of factor analyses
represents sociability and energeticness. This personality factor is characterized by English trait
91
terms like talkative, energetic, sociable, cheerful, expressive and assertive at the one end, and
silent, self-contained, solemn, secretive, submissive and cautious at the other. This factor is
sometimes referred to as surgency (e.g. Tupes and Christal 1961).
In traditional personality studies, theorists have long dealt with extraversion-introversion,
whose meaning resembles that of surgency (Wilt and Revelle 2009). Extraversion-introversion
was conceptualized by a protégé of Sigmund Freud - Carl Jung (1913/1971), and according to
him, extraverts are people who direct their mental energy towards objects or people in the
outside world, while introverts direct their energy toward the inner self. Nevertheless, Jung
never performed any scientific work to test his hypotheses, and in the end it was Hans Eysenck
who performed factor analysis, and found extraversion-introversion to be an important domain
in terms of helping to understand individual differences (Eysenck 1947). He described
extraverts as sociable and enthusiastic, and introverts as quiet and reserved, and established the
arousal hypothesis of extraversion, which provides an in-depth understanding of the domain
(Eysenck 1967). He proposed that neurological activity in the brain is an important factor in
determining the individual level of extraversion-introversion. Based on the assumption of Homo
Staesis, i.e. human beings are driven to maintain an optimum level of stimulation intakes,
Eysenck suggested that extraverts are people who have a higher optimal level of stimulation
intake than introverts, and because of this, extraverts constantly need more stimulation than
introverts. Introverts, on the other hand, tend to be over-aroused because of their low optimal
level of stimulation intake, so are more reserved. They attempt to reduce, rather than increase,
the level of stimulation experienced from without.
Costa and McCrae’s extraversion reflects Eysenck’s work, and that of lexical studies.
According to Costa and McCrae (1992b), the core meanings of extraversion deal with
individuals’ levels of sociability, energeticness and positive emotions. First, extraverts, or
people who score high on the extraversion domain, prefer interpersonal interactions - are
sociable people who favor social events. Second, extraverts are energetic, active and prefer
excitements - they can also be described as upbeat, energetic and optimistic. Third, extraversion
concerns people’s tendency to experience positive emotions, so high scorers on the extraversion
scale are inclined to feel good, are high spirited and optimistic. Low extraversion scorers, or
introverts, are reserved yet not unfriendly people, but prefer to be alone. Introverts are not
necessarily unhappy or pessimistic. Costa and McCrae (1992) conceptualized extraversion as
subsuming six smaller traits, namely warmth, gregariousness, assertiveness, activity,
excitement-seeking and positive emotions. The descriptions of these facets are shown in Box 3-
2.

92
Box 3-2: Facets of extraversion
Warmth is a personality facet that deals with interpersonal intimacy. People who possess a
high level of this trait are “affectionate and friendly” (Costa and McCrae 1992, p.17). They
genuinely like people and have the ability to form close relationships with them. Individuals
who possess a low level of warmth are not necessarily hostile - they are simply more reserved
in their manner.
Gregariousness refers to “the preference for other people’s company” (Costa and McCrae
1992, p.17). A person with a high level of this facet prefers to be surrounded by people, and the
more the better. An individual who possesses a low level of this personality trait does not seek
and may often avoid social stimulation. He or she tends to be a loner.
Assertiveness represents an aspect of extraversion that is associated with a person’s tendency
to be “dominant, forceful, and socially ascendant” (Costa and McCrae 1992, p.17). People who
possess a high level of assertiveness often become group leaders. In contrast, individuals with
a low level of assertiveness prefer to be in the background when it comes to social interactions.
Activity deals with a person’s preference for action. More specifically, people with a high level
of this trait are energetic and have a need to keep busy - often leading to a fast-paced life. People
who possess a low level of this trait are relaxed; however, they are not necessarily lazy.
Excitement-seeking is a personality facet which means that individuals “crave excitement and
stimulation” (Costa and McCrae 1992, p.17). Individuals with a high level of this personality
trait love thrills, prefer things like bright colors and noisy environments. Individuals who
possess a low level of this facet have little or no need for outside stimulation.
Positive emotions deals with people’s “tendency to experience positive emotions such as joy,
happiness, love, and excitement” (Costa and McCrae 1992, p.17). Positive individuals are
optimistic, high-spirited, as well as joyful. In contrast, those who possess a low level of the
positive emotion facet are not necessarily unhappy - they are simply less exuberant.
Source: Costa and McCrae (1992)
In contrast to what is commonly understood by laymen, extraversion does not deal only with
sociability – the domain has multiple, core meanings. Other than sociability, extraversion also
determines people’s need for stimulation in terms of activities and excitement. On top of that,
93
extraversion is associated with a propensity to experience a wide range of positive emotions.
Further investigations have been made into what the common features underpinning all these
sub-components of extraversion are, and conclusions have varied. Some have concluded that it
is the tendency to experience positive emotions (e.g. Watson and Clark 1997), while others state
that it is a sensitivity to rewards (Lucas et al. 2000). However, the latest finding on this issue
has suggested that at the core of extraversion is a tendency to engage and enjoy social attention
(Ashton et al. 2002). Consequently, it is reasonable to suspect that, in the context of CVM
surveys, the tendency to enjoy social attention of CVM respondents could play important roles
in determining how respondents will state their WTP answers to interviewers. The theoretical
link between extraversion and stated WTP will be analyzed in more detail in the next chapter.
Openness to experience
Since its inception, this personality factor has been characterized by disagreement; both in terms
of its basic structure and also its naming convention (McCrae 1994). In lexical personality
studies, Openness to experience has been labeled, either as intellect, because of the dominance
of cognitive ability within the factor (Fiske 1949), or as culture, due to the dominance of a
personal tendency to enjoy the arts and sciences (Norman 1963). It was Digman and Takemoto-
Chock (1981, p. 155) who first argued that this personality factor should be characterized by
both aspects - “one having to do with intelligence and the other with matters of culture.”
Goldberg (1990) agreed on this duality, and found that one of the Big Five is described by terms
representing intellectual ability (wisdom, knowledge, intelligence, depth, insight and curiosity)
and aesthetic preference (sophistication, creativity and art).
McCrae (1994) agreed that mere aspects of intellect do not cover the whole meaning of
this personality factor, so he suggested personality psychologists use the term “openness to
experience.” McCrae’s argument consisted of two main points. First, the main feature of this
factor is in fact intellectual “interest” rather than intellectual “ability.” Though the domain is
shown to be correlated to individuals’ cognitive ability, it is not its key element (McCrae 1994,
p.254), so using the term “intellect” may be misleading. Second, McCrae (1994, p.254) argued
that intellect “fails to suggest the diverse psychological correlates that the factor is known to
have.” He further argued that this personality factor is a wide concept which implies
individuals’ intellectual curiosity as well as broad interests, having a liberal view, adventurous
tendencies and a need for variety. Only some aspects of intellect are considered to lie inside the
central meaning of openness to experience.
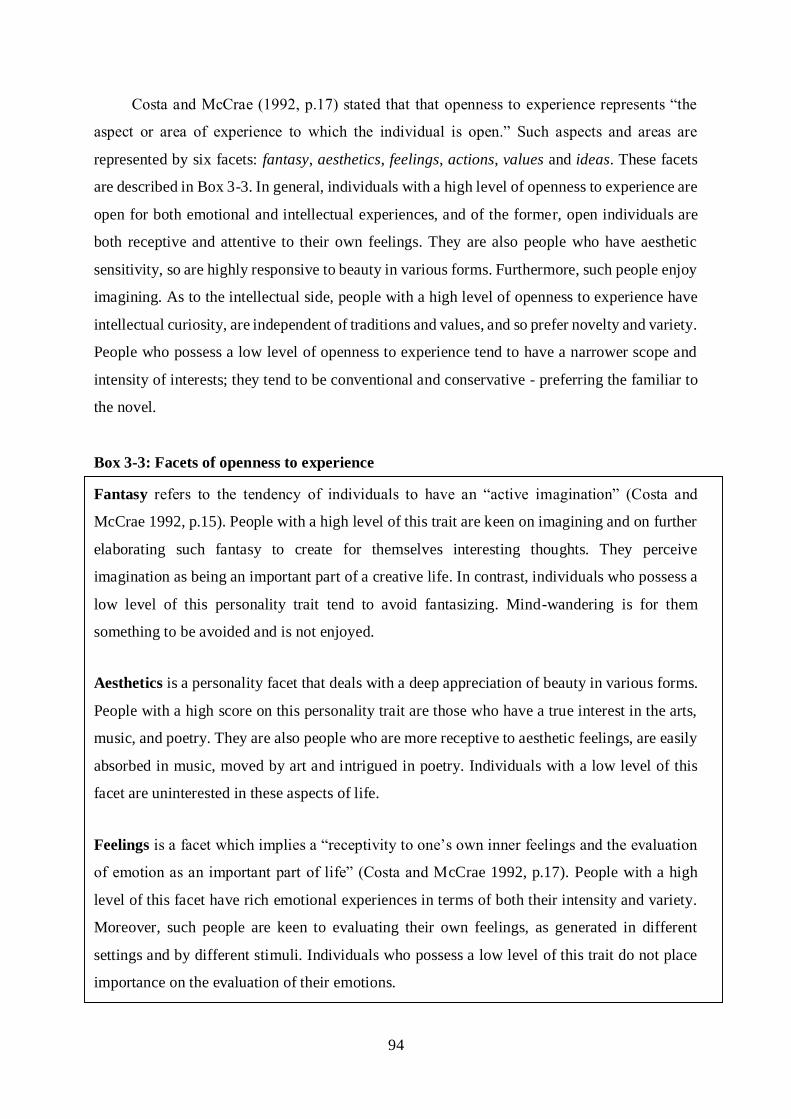
94
Costa and McCrae (1992, p.17) stated that that openness to experience represents “the
aspect or area of experience to which the individual is open.” Such aspects and areas are
represented by six facets: fantasy, aesthetics, feelings, actions, values and ideas. These facets
are described in Box 3-3. In general, individuals with a high level of openness to experience are
open for both emotional and intellectual experiences, and of the former, open individuals are
both receptive and attentive to their own feelings. They are also people who have aesthetic
sensitivity, so are highly responsive to beauty in various forms. Furthermore, such people enjoy
imagining. As to the intellectual side, people with a high level of openness to experience have
intellectual curiosity, are independent of traditions and values, and so prefer novelty and variety.
People who possess a low level of openness to experience tend to have a narrower scope and
intensity of interests; they tend to be conventional and conservative - preferring the familiar to
the novel.
Box 3-3: Facets of openness to experience
Fantasy refers to the tendency of individuals to have an “active imagination” (Costa and
McCrae 1992, p.15). People with a high level of this trait are keen on imagining and on further
elaborating such fantasy to create for themselves interesting thoughts. They perceive
imagination as being an important part of a creative life. In contrast, individuals who possess a
low level of this personality trait tend to avoid fantasizing. Mind-wandering is for them
something to be avoided and is not enjoyed.
Aesthetics is a personality facet that deals with a deep appreciation of beauty in various forms.
People with a high score on this personality trait are those who have a true interest in the arts,
music, and poetry. They are also people who are more receptive to aesthetic feelings, are easily
absorbed in music, moved by art and intrigued in poetry. Individuals with a low level of this
facet are uninterested in these aspects of life.
Feelings is a facet which implies a “receptivity to one’s own inner feelings and the evaluation
of emotion as an important part of life” (Costa and McCrae 1992, p.17). People with a high
level of this facet have rich emotional experiences in terms of both their intensity and variety.
Moreover, such people are keen to evaluating their own feelings, as generated in different
settings and by different stimuli. Individuals who possess a low level of this trait do not place
importance on the evaluation of their emotions.
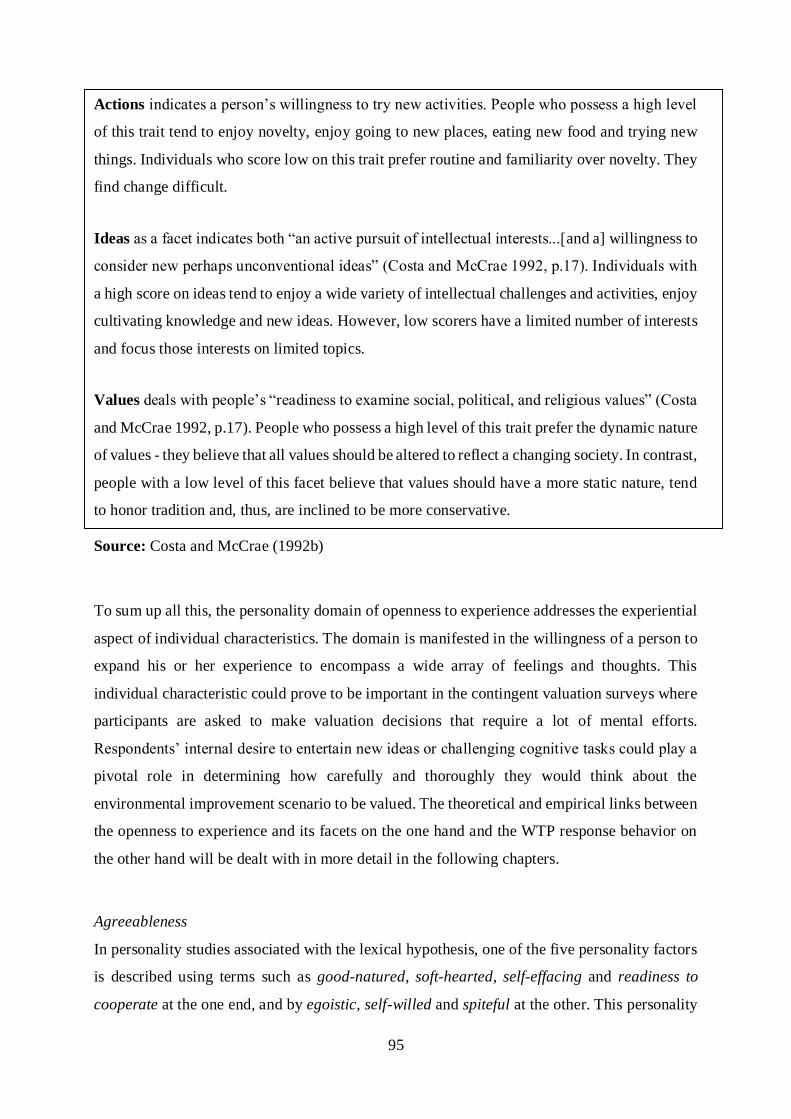
95
Actions indicates a person’s willingness to try new activities. People who possess a high level
of this trait tend to enjoy novelty, enjoy going to new places, eating new food and trying new
things. Individuals who score low on this trait prefer routine and familiarity over novelty. They
find change difficult.
Ideas as a facet indicates both “an active pursuit of intellectual interests...[and a] willingness to
consider new perhaps unconventional ideas” (Costa and McCrae 1992, p.17). Individuals with
a high score on ideas tend to enjoy a wide variety of intellectual challenges and activities, enjoy
cultivating knowledge and new ideas. However, low scorers have a limited number of interests
and focus those interests on limited topics.
Values deals with people’s “readiness to examine social, political, and religious values” (Costa
and McCrae 1992, p.17). People who possess a high level of this trait prefer the dynamic nature
of values - they believe that all values should be altered to reflect a changing society. In contrast,
people with a low level of this facet believe that values should have a more static nature, tend
to honor tradition and, thus, are inclined to be more conservative.
Source: Costa and McCrae (1992b)
To sum up all this, the personality domain of openness to experience addresses the experiential
aspect of individual characteristics. The domain is manifested in the willingness of a person to
expand his or her experience to encompass a wide array of feelings and thoughts. This
individual characteristic could prove to be important in the contingent valuation surveys where
participants are asked to make valuation decisions that require a lot of mental efforts.
Respondents’ internal desire to entertain new ideas or challenging cognitive tasks could play a
pivotal role in determining how carefully and thoroughly they would think about the
environmental improvement scenario to be valued. The theoretical and empirical links between
the openness to experience and its facets on the one hand and the WTP response behavior on
the other hand will be dealt with in more detail in the following chapters.
Agreeableness
In personality studies associated with the lexical hypothesis, one of the five personality factors
is described using terms such as good-natured, soft-hearted, self-effacing and readiness to
cooperate at the one end, and by egoistic, self-willed and spiteful at the other. This personality
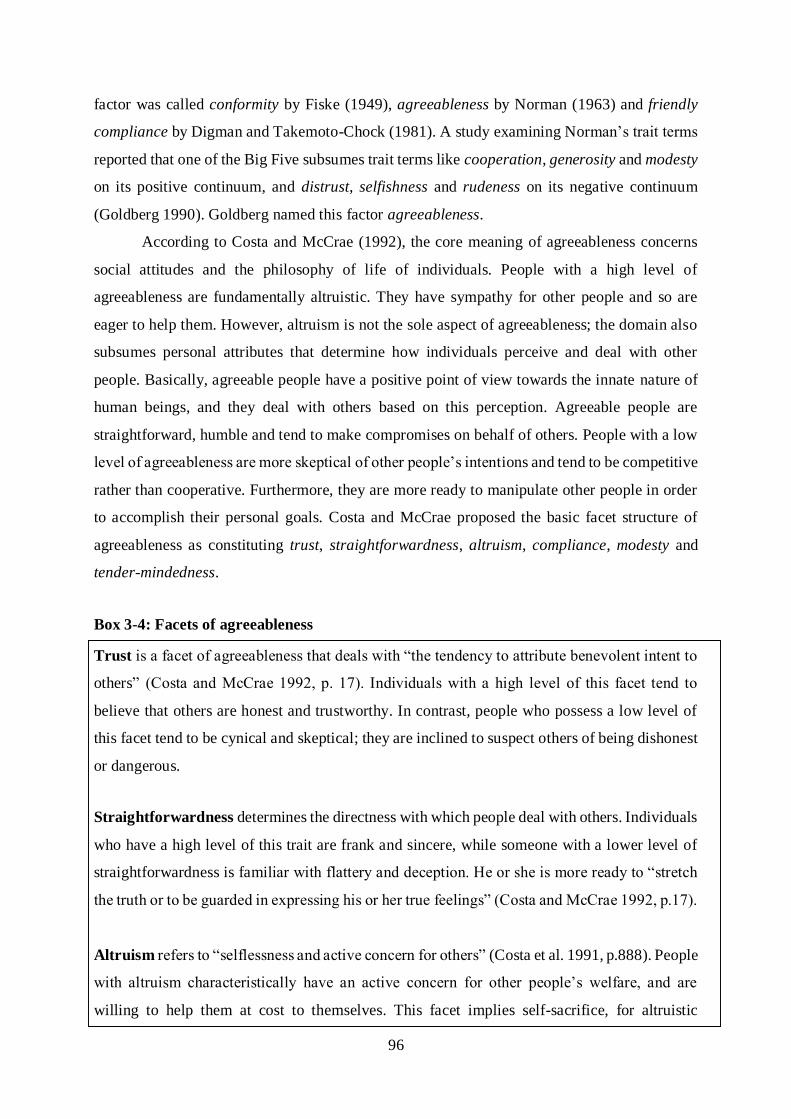
96
factor was called conformity by Fiske (1949), agreeableness by Norman (1963) and friendly
compliance by Digman and Takemoto-Chock (1981). A study examining Norman’s trait terms
reported that one of the Big Five subsumes trait terms like cooperation, generosity and modesty
on its positive continuum, and distrust, selfishness and rudeness on its negative continuum
(Goldberg 1990). Goldberg named this factor agreeableness.
According to Costa and McCrae (1992), the core meaning of agreeableness concerns
social attitudes and the philosophy of life of individuals. People with a high level of
agreeableness are fundamentally altruistic. They have sympathy for other people and so are
eager to help them. However, altruism is not the sole aspect of agreeableness; the domain also
subsumes personal attributes that determine how individuals perceive and deal with other
people. Basically, agreeable people have a positive point of view towards the innate nature of
human beings, and they deal with others based on this perception. Agreeable people are
straightforward, humble and tend to make compromises on behalf of others. People with a low
level of agreeableness are more skeptical of other people’s intentions and tend to be competitive
rather than cooperative. Furthermore, they are more ready to manipulate other people in order
to accomplish their personal goals. Costa and McCrae proposed the basic facet structure of
agreeableness as constituting trust, straightforwardness, altruism, compliance, modesty and
tender-mindedness.
Box 3-4: Facets of agreeableness
Trust is a facet of agreeableness that deals with “the tendency to attribute benevolent intent to
others” (Costa and McCrae 1992, p. 17). Individuals with a high level of this facet tend to
believe that others are honest and trustworthy. In contrast, people who possess a low level of
this facet tend to be cynical and skeptical; they are inclined to suspect others of being dishonest
or dangerous.
Straightforwardness determines the directness with which people deal with others. Individuals
who have a high level of this trait are frank and sincere, while someone with a lower level of
straightforwardness is familiar with flattery and deception. He or she is more ready to “stretch
the truth or to be guarded in expressing his or her true feelings” (Costa and McCrae 1992, p.17).
Altruism refers to “selflessness and active concern for others” (Costa et al. 1991, p.888). People
with altruism characteristically have an active concern for other people’s welfare, and are
willing to help them at cost to themselves. This facet implies self-sacrifice, for altruistic
97
individuals are generous and willing to help others. Low altruism scorers are self-centered, and
so are more reluctant to help others or become involved in other people’s problems.
Compliance is an aspect of personality that deals with interpersonal conflict. People with a
high level of compliance tend to forgive and forget - they tend to inhibit aggression and defer
to others. They also prefer cooperation rather than competition. Low scorers have no problem
with expressing their anger.
Modesty is a facet that reflects on aspects of an individual’s self. Individuals with a high level
of this trait are humble and modest; they are not preoccupied with themselves. However, they
are not necessarily lacking in self-confidence. People that have a low level of modesty have an
inflated view of themselves.
Tender-mindedness represents people’s “attitudes of sympathy and concern for others” (Costa
and McCrae 1992b, p. 18). Individuals with a high level of this trait have a “tendency to be
guided by feelings, especially those of sympathy, in making judgments and forming attitudes”
(Costa et al. 1991, p.889). People who have a low level of this trait tend to make decisions based
on cold logic.
Source: Costa and McCrae (1992b)
To sum up, agreeableness addresses the interpersonal aspect of individual characteristics. It
incorporates the qualities of empathy, friendliness, cooperation, and care. People with a high
level of agreeableness are good-natured and soft-hearted. In easy words, agreeable people are
nice people. When it comes to the contingent valuation surveys where individuals are asked to
pay for some environmental improvement program which would generate benefit not only to
the contributors but also to the society as a whole as well as to future generations, the qualities
incorporated in the domain of agreeableness could play important roles in determining people’s
contribution decisions to the environmental improvement program in question. The conceptual
links between the facets of agreeableness and stated WTP will be scrutinized in more detail in
chapter 4.
98
Conscientiousness
In lexical studies, one of the five personality factors is labeled as will to achieve, responsibility
and dependability (Fiske 1949; Tupes and Christal 1961; Digman and Takemoto-Chock 1981).
The positive end of this factor is described using terms like determined, responsible, insistently
orderly and persevering, while the negative end can be described by words such as relaxed,
indolent, frivolous and fickle. In Goldberg’s landmark study (1990), this personality factor was
represented using terms that describe painstaking qualities, like order, self-discipline,
reliability, responsible and cautious. The negative end of this personality factor is represented
by terms such as negligence, careless, lazy, inconsistency and aimless. Goldberg named this
factor conscientiousness. In traditional personality theory, traits reflecting aspects of
conscientiousness have long been investigated, though independently of each other (Costa et al.
1991). Costa et al. (1991) provided examples of such traits, such as Webb’s will factor (Webb
1915). This trait describes “the tendency not to abandon tasks in the face of obstacles” and a
person’s trustworthiness (Rothbart 2011, p.22). Self-control and orderly were other examples
provided. These are also important components in Lorr’s interpersonal traits (Lorr and Youniss
1973). Clearly, these traits echo the painstaking quality possessed by individuals. The negative
continuum of conscientiousness was also investigated, producing terms such as impulsivity.
Note that this impulsivity construct deals with quick decision times and a lack of persistence
(Buss and Plomin 1975).
Costa et al. (Costa et al. 1991, p.889) described conscientiousness as containing both the
“proactive and inhibitive aspects” of individuals. The proactive aspect of conscientiousness is
manifested in terms of an individual’s need for success and the degree to which someone pushes
himself toward his goals. The inhibitive aspect is best described as an ability to control
impulses. Unlike people with a low level of neuroticism, conscientious individuals learn to
control their desires through planning and organizing. Low neuroticism people are able to resist
their temptations because of their innate human quality – a low level of neuroticism. They do
not learn to do so. In Costa and McCrae’s model, conscientiousness is described in terms of six
facets, namely: achievement striving, competence, self-discipline, order, dutifulness and
deliberation.
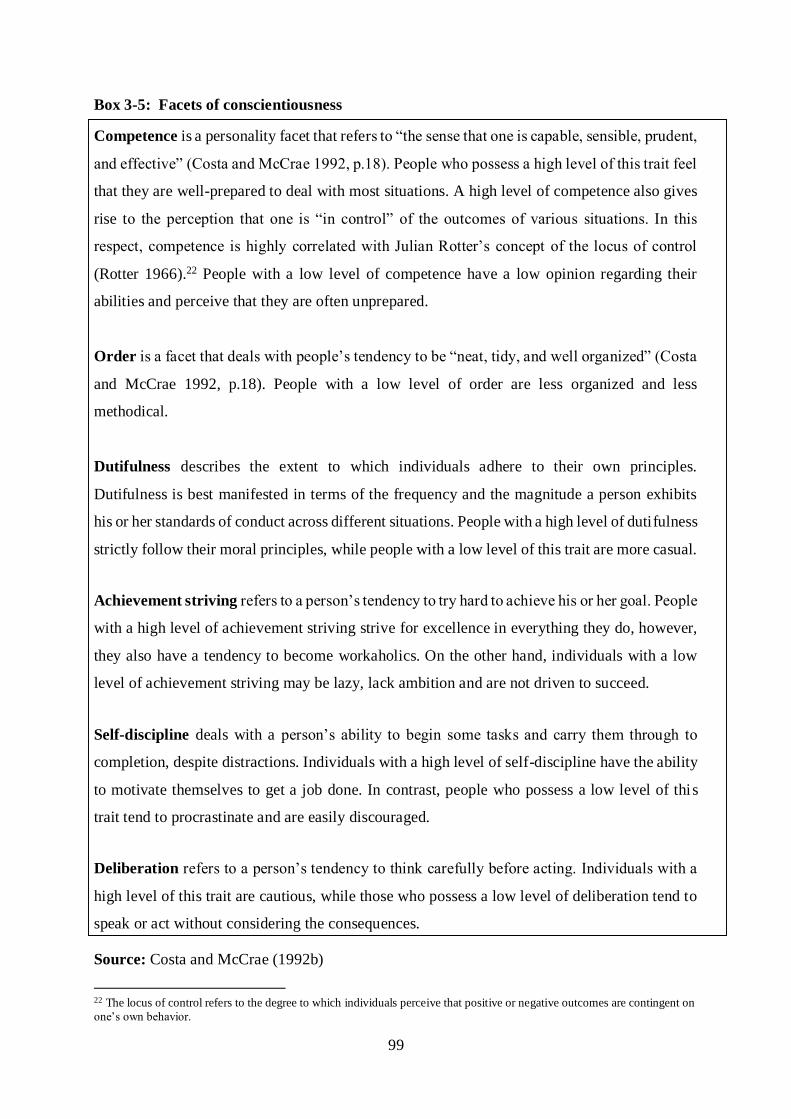
99
Box 3-5: Facets of conscientiousness
Competence is a personality facet that refers to “the sense that one is capable, sensible, prudent,
and effective” (Costa and McCrae 1992, p.18). People who possess a high level of this trait feel
that they are well-prepared to deal with most situations. A high level of competence also gives
rise to the perception that one is “in control” of the outcomes of various situations. In this
respect, competence is highly correlated with Julian Rotter’s concept of the locus of control
(Rotter 1966).22 People with a low level of competence have a low opinion regarding their
abilities and perceive that they are often unprepared.
Order is a facet that deals with people’s tendency to be “neat, tidy, and well organized” (Costa
and McCrae 1992, p.18). People with a low level of order are less organized and less
methodical.
Dutifulness describes the extent to which individuals adhere to their own principles.
Dutifulness is best manifested in terms of the frequency and the magnitude a person exhibits
his or her standards of conduct across different situations. People with a high level of dutifulness
strictly follow their moral principles, while people with a low level of this trait are more casual.
Achievement striving refers to a person’s tendency to try hard to achieve his or her goal. People
with a high level of achievement striving strive for excellence in everything they do, however,
they also have a tendency to become workaholics. On the other hand, individuals with a low
level of achievement striving may be lazy, lack ambition and are not driven to succeed.
Self-discipline deals with a person’s ability to begin some tasks and carry them through to
completion, despite distractions. Individuals with a high level of self-discipline have the ability
to motivate themselves to get a job done. In contrast, people who possess a low level of this
trait tend to procrastinate and are easily discouraged.
Deliberation refers to a person’s tendency to think carefully before acting. Individuals with a
high level of this trait are cautious, while those who possess a low level of deliberation tend to
speak or act without considering the consequences.
Source: Costa and McCrae (1992b)
22 The locus of control refers to the degree to which individuals perceive that positive or negative outcomes are contingent on
one’s own behavior.
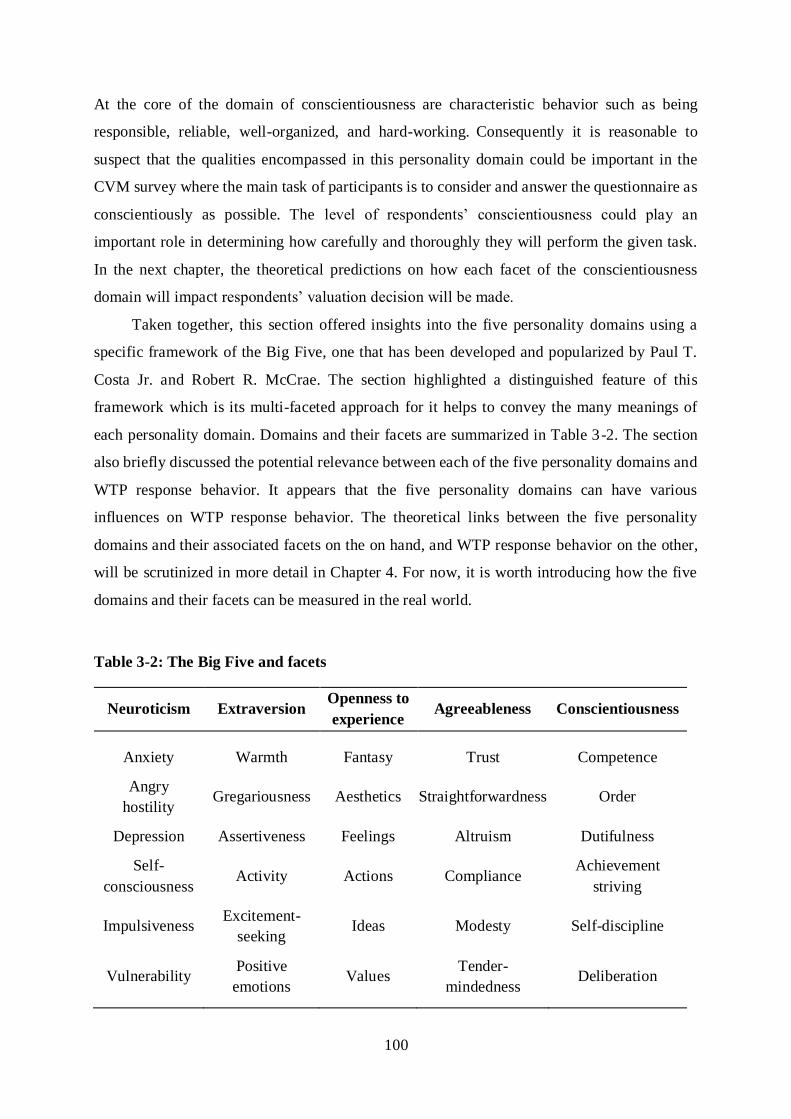
100
At the core of the domain of conscientiousness are characteristic behavior such as being
responsible, reliable, well-organized, and hard-working. Consequently it is reasonable to
suspect that the qualities encompassed in this personality domain could be important in the
CVM survey where the main task of participants is to consider and answer the questionnaire as
conscientiously as possible. The level of respondents’ conscientiousness could play an
important role in determining how carefully and thoroughly they will perform the given task.
In the next chapter, the theoretical predictions on how each facet of the conscientiousness
domain will impact respondents’ valuation decision will be made.
Taken together, this section offered insights into the five personality domains using a
specific framework of the Big Five, one that has been developed and popularized by Paul T.
Costa Jr. and Robert R. McCrae. The section highlighted a distinguished feature of this
framework which is its multi-faceted approach for it helps to convey the many meanings of
each personality domain. Domains and their facets are summarized in Table 3-2. The section
also briefly discussed the potential relevance between each of the five personality domains and
WTP response behavior. It appears that the five personality domains can have various
influences on WTP response behavior. The theoretical links between the five personality
domains and their associated facets on the on hand, and WTP response behavior on the other,
will be scrutinized in more detail in Chapter 4. For now, it is worth introducing how the five
domains and their facets can be measured in the real world.
Table 3-2: The Big Five and facets
Neuroticism Extraversion Openness to
experience Agreeableness Conscientiousness
Anxiety Warmth Fantasy Trust Competence
Angry
hostility Gregariousness Aesthetics Straightforwardness Order
Depression Assertiveness Feelings Altruism Dutifulness
Self-
consciousness Activity Actions Compliance
Achievement
striving
Impulsiveness Excitement-
seeking Ideas Modesty Self-discipline
Vulnerability Positive
emotions Values
Tender-
mindedness Deliberation
101
3.2.3 The Big Five measurement tools
Over the years, a number of personality inventories have been developed to measure the
components of the Big Five factor model, such as the International Personality Item Pool (IPIP)
(Gow et al. 2005), the Big Five Inventory (BFI) (John and Srivastava 2001) and the Revised
NEO personality inventory (NEO-PI-R) (Costa and McCrae 1992b; for more Big Five
inventories see John and Srivastava 2001)). Of all the personality measures, the NEO-PI-R, and
its shortened version the NEO-FFI, are the most widely used and validated (Rolland et al. 1998;
Aluja et al. 2005; Gow et al. 2005).
The NEO-PI-R was first published in 1985 by Costa and McCrae with the aim of building
a truly multi-purpose personality inventory or, in their own words, “a single instrument useful
for understanding and predicting a wide variety of criteria such as vocational interests, health
and illness behavior, psychological well-being, and characteristic coping styles” (Costa and
McCrae 1992b, p.39). The self-administered version of this questionnaire consists of 240 items,
each of which is a statement such as “I always feel blue,” “I easily get angry,” or “I usually feel
a burst of energy inside me.” Answers to these 240 statements must be given according to the
five-point Likert scale (i.e. very much disagree, disagree, neutral, agree and very much agree).
Some statements were negatively posed in order to detect respondents’ consistency. From the
240 items, every eight items elicit a facet. The score of six facets constituting a domain can then
be summed to produce the domain score. So, the NEO-PI-R provides information on both facet
and domain levels.
With its 240 question items, the NEO-PI-R is rather lengthy for many empirical studies.
It takes on average 45 minutes to one hour to complete the whole questionnaire (Costa and
McCrae 1992b). In response to this problem, Costa and McCrae introduced a shorter version of
the questionnaire, the Five-Factor Inventory (NEO-FFI) with 60 items, in 1992 (Costa and
McCrae 1992b). The 60 items contained in the NEO-FFI were taken from the original 240
items. Out of the 48 items eliciting each domain in the NEO-PI-R, twelve items that have the
highest factor loadings on the corresponding domain, and, thereby, contribute most to its overall
meaning, were chosen for the new tool. One obvious benefit of this condensing of the measure
is that the NEO-FFI can be used in a study where the time available for testing is limited.
However, the cost for reducing the items to only one-fourth is that information on specific facets
within each domain is no longer available. Therefore, the inventory is only recommended when
global information on personality is considered sufficient (Costa and McCrae 1992b). Despite
being condensed, the NEO-FFI has been found to have a high correlation with the NEO-PI-R.
Costa and McCrae (1992b) found very satisfactory correlation coefficients when comparing the
102
NEO-FFI and NEO-PI-R (these being 0.92, 0.90, 0.91, 0.77 and 0.87 for scales measuring
neuroticism, extraversion, openness to experience, agreeableness and conscientiousness
respectively). It was also found that each group of 12 items selected to assess each personality
factor had a satisfactory level of internal consistency, as measured by Cronbach’s Alpha
reliability index.23 The Cronbach’s Alpha of each personality factor was reported to be between
0.60 and 0.80 (Rolland et al. 1998; Panayiotou et al. 2004; Aluja et al. 2005).
An important question is: are both the NEO-PI-R and NEO-FFI applicable in non-
English-speaking countries? The two tools are devised to assess the BFM, the framework of
which was developed based on words found in English dictionaries and using Western
personality theories. As a consequence, if the five personality domains were not present in the
non-English speaking countries, datasets obtained from the NEO-PI-R and NEO-FFI would
actually be meaningless.
An approach to this question is to directly test the Big Five measurement tools that have
been developed in the English speaking world on people in the country of interest. This
approach focuses on the cross-cultural validity of the BFM measurement tools (Cheung et al.
2011). In studies using this approach, the NEO-PI-R and the NEO-FFI is translated into various
languages, then factor analysis is performed to analyze the latent personality structure of the
datasets and to examine whether it coincides with the BFM. In general, findings from these
studies suggest that factors similar to the Big Five emerge across western and non-English
speaking countries, including Switzerland, Spain, Greece, Germany, Austria, Switzerland,
Estonia, Finland and France. In addition, Zheng, et al. (2008), as well as McCrae et al. (2004),
and Trull and Geary (1997), provided convincing empirical evidence that the NEO
questionnaires can be employed in non-western societies, including China, Russia and the
Czech Republic. The same holds true for countries speaking eastern languages such as Indian,
Filipino and Vietnamese (McCrae et al. 1998; Leininger 2002; Lodhi et al. 2002). In 2005,
McCrae and Terraciano (2005) attempted to validate the NEO-PI-R once and for all. They
gathered data from 50 cultures representing six continents, including African and Arabic
countries which had not been exhaustively investigated. The NEO-PI-R was employed in non-
English speaking countries such as Thailand, Japan and Hong Kong. After the data from each
23 Cronbach’s alpha is a scale indicating the degree to which a set of items measures a single latent construct
(Shevlin et al. 2000). It is assumed that if a set of questions is eliciting the same underlying construct, they must
have a high level of inter-correlation. Cronbach's alpha will generally increase as the inter-correlations among test
items increase. The reliability scale ranges from 0 to 1, with 1 meaning that all questions elicit the same underlying
psychological construct. The score 0 means that there is no correlation among different questions and that each
question in the group assesses totally different psychological constructs.
103
country were pooled and standardized, the whole dataset was factor analyzed. The results
“unmistakably” suggest a five-factor solution is applicable (McCrae and Terracciano 2005, p.
552).
Another approach to test the validity of the BFM in non-English speaking countries aims
at exploring the indigenous personality characteristics of the people in such countries. In studies
adopting this approach, indigenous personality terms are carefully collected from the native
language. The investigators then use factor analysis to find whether or not the Big Five
personality structure emerges from the trait terms people use in their daily lives in a particular
country. A very good summary of cross-cultural studies conducted early on is given in Saucier
et al. (2000), in which the authors review a total of 19 cross-cultural studies conducted in:
Germanic (German, Dutch), Slavic (Polish, Czech, Russian), Romance (Italian, Spanish), and
non-Indo-European languages (Hebrew, Hungarian, Turkish, Korean, Filipino). In all 19
studies, trait terms were gathered from the dictionaries of each local language and factor-
analyzed in an attempt to find the Big Five personality dimensions. Saucier et al. (2000)
reported that personality factors resembling those of the Big Five emerged from the Germanic
languages. Slavic studies can also be considered as supportive of the BFM. However, the
replication of the Big Five factors was somewhat less consistent in studies using the Romance
languages (Italian and Spanish). Saucier et al. (2000) demonstrated that sub-components of
emotional stability (neuroticism) were spread across several factors, and that the intellect factor
(openness to experience) was not clearly recovered. For this reason, Saucier et al. called for
more studies to be carried out with the romance languages. Studies using the non-Indo-
European languages exhibited some minor deviations from the Big Five structure; nevertheless,
Saucier et al. considered them to satisfactorily support the BFM. All in all, the authors
concluded that the pattern of results tended to support the idea that approximately five basic
trait clusters can be detected across different languages.
In summary, it has been shown here that the BFM has satisfactorily demonstrated its
validity in both English and non-English speaking countries, supporting the basic premise that
the BFM is a comprehensive and universal personality framework, one that represents the basic
psychological aspects of individuals, regardless of their cultural, socio-economic and political
backgrounds. As a result, it can be safely assumed that the NEO-PI-R and NEO-FFI can be
employed in non-English speaking countries, producing personality data that are theoretically
meaningful.
104
3.3 Summary
The goal of this chapter was to introduce the models and methods used in personality
psychology to provide a better level of understanding and assessment of the mental attributes
of CVM respondents. The review conducted with respect to the definition of the personality
construct suggests that personality is a concept devised to take account of the sum total of a
person’s mental characteristics. However, due to the fundamentally broad nature of personality,
attempts to pin down its elements during the 1930s to 1950s met with limited success. The
theories of personality developed during that period shed light on parts of personality, but not
the whole. It became clear that the phenomena embedded in the concept of personality are both
complex and diverse, and that it would be impossible to unite all of these aspects in a single
theoretical framework. Thus, during the 1950s to 1970s, personality theorists turned
elementaristic, focusing their attention on conceptualizing and measuring basic units of
personality, and this led to the dominance of trait theory. The main advantage of trait theory is
that it operationalizes the concept of personality using trait dispositions, all of which can be
conveniently measured using self-reporting mechanisms. Also, the premise was that knowledge
about parts of the personality would enable theorists to form a theory about the whole. The
chapter further showed that traits have a profound relevance when it comes to CVM decision-
making, as they can be measured during a CVM survey using self-reporting inventories.
Evidence also suggests that traits have an objective reality and can predict people’s behavior in
the real world. The use of traits in this study would therefore seem justified.
Section 3.2 looked closely at the BFM, the long-awaited, comprehensive theory of
personality. After the explosion of trait research, which resulted in a bonanza of trait terms, trait
theorists had enough resources and reasons to develop a comprehensive theory about
personality. The BFM emerged out of two lines of inquiry; one associated with the distillation
of trait terms in the English dictionary and another with the exploration of traits developed in
traditional personality theories. Special attention was given to the BFM framework put forward
by Costa and McCrae, who extensively investigated the reliability and validity of the BFM
during the 1980s and early 1990s, and, therefore, increased the popularity of their framework.
This section went into detail regarding Costa and McCrae’s conceptions of the five personality
domains and the 30 corresponding facets. It became apparent that the BFM provides a large
number of powerful dispositions which can be used to explain many of the behavioral
tendencies of individuals. So, it is very likely that by identifying respondents’ personalities in
terms of domains and facets we will be able to detect systematic patterns in their WTP answers.

105
The last part of Section 3.2 introduced the NEO-PI-R and NEO-FFI, both of which were
developed by Costa and McCrae, but have since been verified by psychologists worldwide. The
section came to the conclusion that both the model and the measurement tools used for the BFM
could be employed in this study without reservation.

106
107
Chapter 4 Personality and contingent
valuation
4.1 Review and outline of the chapter
This study set out to provide a comprehensive analysis of the role of personality characteristics
for systematic distortions of WTP answers in contingent valuation surveys. As was laid out in
detail in chapter 2, the systematic distortions contained in WTP answers may occur at two points
during the course of a CVM interview. First, distortions may occur during the value formation
process, i.e. when respondents have to form an idea of their individual valuation of some
proposed environmental project. Some respondents in a CVM survey may not be able to form
an exact idea of the future benefits they may expect from the environmental project proposed
and as a consequence they may have wrong expectations regarding the project and ultimately
biased estimates of their individual welfare changes. So, respondents who encounter problems
during the value formation process may unknowingly misreport their WTP answers. Second,
distortions of WTP answers may occur during the WTP elicitation. After forming an idea of
their individual welfare changes resulting from the project, respondents are asked to report this
individual evaluation in terms of WTP statements. Some respondents may deliberately
misreport their WTP statements which also results in erroneous welfare estimates on the part of
the researcher.
In order to search for the psychological factors that may lead respondents to misreport
their WTP answers, the concept of personality trait was explored in chapter 3. Findings revealed
that during their lifetime individuals are constantly influenced by their personality traits, which
are dimensions of individual differences that causally determine an individual’s enduring
pattern of behavior. So, personality traits may be an important psychological factor that
determines the answering behavior of respondents in CVM surveys and the relation between
the two should be further analyzed. There are, however, a bonanza of trait descriptions that have
been identified over the years. Due to this reason, the Big Five personality model was
introduced. The basic idea of this personality model is that the whole sphere of trait
characteristics of human beings can be represented by five personality domains which are
labelled neuroticism, extraversion, openness to experience, agreeableness, and
conscientiousness. As the five personality domains are very broad dimensions of personality,
their meanings and components are described using facets, which are specific traits locating at
108
a lower level of trait hierarchy. Each of the five personality domains can be represented by six
facets (see 3.2.2).
After the introduction of contingent valuation in chapter 2 and of the Big Five personality
domains in chapter 3, this chapter will now develop the theoretical foundation of an empirical
investigation of the influence of personality on WTP answers in contingent valuation surveys.
It is in this chapter that the Big Five personality model is integrated into the CVM framework.
The rest of this chapter is structured as follows. After this introductory section, section 4.2 offers
a discussion on the importance of considering personality in environmental valuation. Three
main reasons that call for an investigation of the influence of the personality in contingent
valuation surveys are presented. First, it is suspected that the shortcomings of the CVM related
to the formation of individual preference and the misreporting of WTP answers may have their
root in the personality of respondents. Second, personality may be able to provide indications
of individual preferences for the proposed project. Third, direct links between personality and
answering behavior that are yet to be detected in this study can be used to verify WTP estimates
in the future CVM surveys. Section 4.2 ends with the review of the empirical literature on the
Big Five personality domains in CVM. It will become apparent that so far only little use has
been made of insights on individual personality gained from the Big Five model to analyze the
task of stating a WTP for an environmental public good in a contingent valuation surveys. In
section 4.3, the theoretical relationship between a respondent’s personality and the WTP
response is analyzed in detail. For each personality domain, the analysis will be performed in
two steps. First, theoretical considerations shall be made on the facet level. Second, the resulting
theoretical links shall be aggregated to form the theoretical prediction on the domain level.
Based on the theoretical predictions made, hypotheses of the influence of the five personality
domains on stated WTP will be formulated. The conclusion of this chapter is given in section
4.4.
4.2 The importance of personality for contingent valuation
Analyzing the influence of personality in contingent valuation surveys is important for three
reasons. First, systematic distortions contained in WTP answers may have their root in the
personality of respondents. Distortions that occur during the value formation process, for a start,
could result from the lack of effort from survey participants. It is conceivable that, because of
their personality, some respondents may not have intrinsic incentive to exert effort into
considering the project scenario. Consequently, they may have wrong expectations regarding
109
the project and consequently biased estimates of their individual welfare changes. Distortions
that occur during the value elicitation process could also be the consequence of personal
characteristics. It can be suspected that, because of their personal characteristics, some
respondents may find it as their best choice to misreport their WTP answers. The relationship
between personality and misreporting has long been recognized in survey research (e.g. Naemi
et al. 2009; Van Vaerenbergh and Thomas 2012). Many types of misreporting have been found
to be consistent over time and across different settings, suggesting that they are not situation-
specific and tend to have their own cognitive and motivational roots (Weijters et al. 2010). Since
personality may be the source of biases contained in WTP answers, systematic relationships
between the personality of respondents and their stated WTP can be expected. This topic will
be picked up again in the next section.
Second, personality traits of CVM respondents should be assessed because their traits may
provide some indication of their preferences for the project proposed and thereby their WTP for
that project. Both preference and personality are concepts which have been developed to explain
heterogeneity in human behavior and so the relationships between the two have been long
suspected (Albanese 1987; Almlund et al. 2011; Becker et al. 2012). Even though the specific
form and the level of association between personality and preference still remain to be
investigated, one can safely expect the personality scores of a person to give some indication of
his or her preference regarding some specific subject. People who score high on openness to
experience, for instance, can be expected to prefer novelty over familiarity. By identifying the
personality characteristics of the respondents in CVM surveys, we may be able to deduce what
their preferences (and thereby their WTP) for the project proposed would be like. Due to this
reason, systematic associations between the personality of respondents and the amount of their
stated WTP are anticipated. The specific forms of such associations will be discussed in the next
section.
Third, from the direct links between WTP statements and personality traits that are yet to
be detected in this study some generalizations can be made that may turn out to be useful as a
guideline for the verification of WTP estimates of the future CVM surveys. From the discussion
above, it can be seen that personality traits could be systematically related to stated WTP
through two main avenues. First, some traits could be the source of response biases triggering
the over- or understating of WTP, and second, other traits may be a good indication of people’s
preferences for the project proposed. Identifying respondents who score high on traits in the
first category enables us to assess the bias that may contain in their WTP. At the same time,
traits in the second category can also be used to identify untrustworthy responses. As the scores
110
of these traits should relate in particular ways with stated WTP, those WTP responses that do
not conform to this expectation can be identified and excluded from the sample.
Empirical research on personality in environmental valuation
Despite the many ways in which personality could influence answering behavior in CVM
surveys, no empirical research has been found that examines the effect of personality in such
survey studies. One study, however, has used personality to explain answering behavior in
ABCM like choice experiment. Soliño and Farizo (2014) applied a 10-item version of the Big
Five Inventory (BFI-10) to identify the five personality domains of 2,224 dwellers from Castilla
y León, Spain who participated in a discrete choice experiment conducted to quantify the social
value of a program aiming at forest management. Results showed that on the one hand people
who possess a high level of openness to experience and extraversion are more likely to choose
the option for implementing the environmental program. On the other hand people who possess
a high level of neuroticism and agreeableness are less likely to prefer the implementation of the
program. The authors concluded that the Big Five personality domains clearly have an effect
on the choices survey participants make and that personality are related to individual
preferences for this particular environmental program.
Other authors chose to apply personality concepts to investigate the typical irregularities
and biases that are encountered in stated-preference methods such as the hypothetical bias
(Grebitus et al. 2013). Grebitus et al. (2013) used the Midlife Development Inventory (MIDI)
scale to elicit the Big Six personality dimensions of 196 people from Bonn and Cologne,
Germany who participated in real and hypothetical choice experiment and auctions. The Big
Six personality model includes agency as the sixth personality domain. This domain is
associated with people’s tendency to be forceful and dominant, the aspect that is captured by a
facet of extraversion (assertiveness) in the BFM. Results showed that the effects of personality
domains on people’s valuations differed between the real and hypothetical environments. The
authors concluded that people of the same personality types tend to behave differently in
hypothetical and real settings, suggesting that personality traits explain at least a portion of
hypothetical bias.
In sum, a few studies could be found that analyze the influence of personality on the
choices respondents make in choice experiment and on the often found biases in stated-
preference methods such as the hypothetical bias. No previous study, however, has employed
personality concept to detect systematic biases contained in WTP answers in CVM interviews.
The aim of this study, therefore, is to provide a comprehensive analysis of the role of personality
111
for systematic biases contained in WTP answers in contingent valuation surveys. For this
purpose, two research questions will be addressed in this study and they will be presented in the
next section.
4.3 Effects of five personality domains on WTP answers
The main aim of this study gives rise to two specific research questions for investigating the
importance of the five personality domains in environmental valuation surveys the first of which
is:
1) Do respondents in CVM interviews possess personality structure that is consistent with
the Big Five?
This first research question is crucial as it forms a necessary condition for the BFM to be useful
in the CVM. It is clear that if CVM respondents do not possess the five personality domains,
there is no reason to further evaluate the usefulness of the BFM in the context of the CVM.
However, it is reasonable to expect that respondents in the CVM do possess a personality
structure that is consistent with the Big Five. This is because of the universality of the Big Five
model and the empirical evidence which has been shown in section 3.2.3 –the model has been
replicated across individuals from various sociocultural contexts. Due to this reason the
following hypothesis can be formulated.
In order to test whether CVM participants have the personality structure that is consistent with
the BFM, a Big Five inventory will be employed in the practical CVM survey. The obtained
data will be factor analyzed to detect the latent structure of the data. If the five factor structure
does not emerge out of the dataset, it means that the personality structure of CVM respondents
does not resemble that of the BFM. On the contrary, if results from the factor analysis reveal
the structure of the five personality dimensions, it can be safely concluded that CVM
respondents possess a personality structure that resembles that of the BFM. This leads to the
second research question:
Hypothesis 1: Respondents possess a personality structure that is consistent with
the Big Five
112
2) If the BFM personality structure can be detected for CVM respondents, what are the
relationships between the Big Five personality characteristics and their WTP
statements?
The purpose of this second research question is to scrutinize the effects of the Big Five
personality domains on WTP statements. While the first research question represents the
necessary condition to justify the usefulness of the BFM in the context of contingent valuation
interviews, this second research question can be considered as the sufficient condition. That is,
if there is no systematic relationship between the personality of a CVM respondent and any of
his or her WTP answers, the Big Five personality model is not needed for the CVM as no
insights can be gained. In order to answer this second research question, hypotheses on how the
five personality domains might affect the stated WTP of survey participants must first be
formulated. This will be done in the next sections for each of the five domains in turn.
4.3.1 Neuroticism
The neuroticism domain is made up of six facets, i.e. anxiety, angry hostility, depression, self-
consciousness, impulsiveness, and vulnerability. Therefore, this section is further
subcategorized into six small parts labeled after the six facets of neuroticism. In each part, the
relationship of the individual facet and WTP response behavior is scrutinized. After considering
all the six facets, the hypothesis on how neuroticism affects the stated WTP will be formulated.
Anxiety
It was mentioned before that anxiety is a facet of neuroticism which gives rise to feelings
associated with fear. Anxious individuals are fearful, nervous, and tense. They are inclined to
have free-floating anxiety and to dwell on things that might go wrong. Anxiety is measured by
question items such as: “I am easily frightened”, “I often feel tense and jittery”, “I often worry
about things that might go wrong” and “Frightening thoughts sometimes come into my head”.
Because of their free-floating anxiety, anxious individuals are inclined to perceive greater risk
in all situations and are also more likely to make risk-averse choices than calm individuals
(Lerner and Keltner 2000). Following this, CVM respondents who obtain a high score on
anxiety should also be expected to perceive a greater level of risk in their lives than respondents
with a low level of anxiety. Such risk can be perceived with respect to, for instance, possible
future financial difficulties or other unexpected events in the future. Due to this reason, fearful
113
respondents must be expected to make a risk-averse choice when stating their WTP and thus
understate their contribution to the proposed environmental project.
Angry Hostility
Angry hostility represents an individual’s tendency to experience the feeling of anger and
related states such as frustration and bitterness. This facet is assessed by question items such as:
“I often get angry at the way people treat me”, “Even minor annoyances can be frustrating to
me” and “I often get disgusted with people I have to deal with”. In contingent valuation surveys,
it can be expected that respondents with a high score on angry hostility can easily get angry at
the way they are treated during the interview or at the formulations or statements in the
questionnaire. Consequently, it is conceivable that they are likely to give WTP responses which
reflect differing sorts of annoyance rather than their true individual valuation of the proposed
project. Negative effect of angry hostility on WTP statements can therefore be anticipated.
Depression
Depression is expected to lead to understating WTP. This facet of neuroticism deals with
feelings of sadness, hopelessness, and loneliness. It is assessed by statements such as:
“Sometimes I feel completely worthless”, “I have sometimes experienced a deep sense of guilt
or sinfulness” and “Sometimes things look pretty bleak and hopeless to me”. CVM respondents
with a high score of depression are likely to have low mood and an absence of interest in many
aspects of life. This is likely to include the lack of interest in the environmental project to be
valued. The absence of interest in the proposed environmental project and the tendency to feel
despair believing that nothing will turn out well for them neither in the near nor far future are
likely to motivate depressed respondents to report a low WTP amount regardless of their
individual valuation of the project. On top of that, the tendency to expect the worst in all things
could also lead depressed individuals to have protest belief, i.e. protest attitudes associated with
the constructed market scenario. The relation between neuroticism and protest belief will also
be tested in Chapter 5.
Self-Consciousness
It is to be anticipated that self-conscious participants in the CVM survey will understate their
WTP answer. Self-consciousness deals with the propensity of an individual to experience the
feeling of inferiority. Question items designed to measure this facet are for example, “I often
feel inferior to others”. CVM respondents with a high score of self-consciousness can be
114
expected to classify the situation of their households as being worse than others. They are those
who receive continuous pressure from the feelings of inferiority and low self-esteem. This could
lead high scorers to report low WTP statements for the proposed environmental program
independent of their valuation of it.
Impulsiveness
Impulsiveness is the facet of neuroticism that deals with a person’s inability to control his or
her cravings and urges. It is assessed by question items like “I have trouble resisting my
cravings”, “When I am having my favorite foods, I tend to eat too much” and “I sometimes eat
myself sick”. These question items indicate that high scorers on impulsiveness have difficulties
in resisting their inner urges and have a high tendency to behave or react to certain stimulants
in a way that they will later regret. As the tendency to be the victim of eating disorder of CVM
respondents is clearly not relevant to their valuation of environmental goods, it can be safely
expected that impulsiveness does not influence individual WTP answers.
Vulnerability
Vulnerability is another facet of neuroticism that is not relevant to the context of this study.
Vulnerability determines an individual’s inability to cope with stress. Individuals who score
high on vulnerability feel panicked when facing with emergency situations. Question items
designed to assess this facet are, for example: “I often feel helpless and want someone else to
solve my problems” and “When I’m under a great deal of stress, sometimes I feel like I’m going
to pieces”. Obviously, the tendency of respondents to be susceptible to stress is neither relevant
to how they will value the individual benefits accruing from an environmental project nor how
they will report the perceived value of such a project. As a result, no plausible connection
between stated WTP and vulnerability can be established.
Now that the effects of all individual facets of neuroticism on WTP statements have been
considered, these effects must be considered together so that the theoretical prediction on the
domain level can be made. Putting everything together, it appears that neuroticism is not a
desirable personality characteristic if what we want from CVM respondents are their reliable
answers regarding their WTP for an environmental change scenario. Four facets (anxiety, angry
hostility, depression, and self-consciousness) are expected to produce disturbing influence on
CVM respondents when they are reporting their WTP. All of them can be anticipated to
motivate respondents to understate their WTP for the proposed project. Through depression,
the relation between neuroticism and protest belief is also expected. The other two facets
115
(impulsiveness and vulnerability) appear to be irrelevant to the context of contingent valuation
surveys. Due to this reason, the following hypothesis can be formulated.
4.3.2 Extraversion
This personality domain consists of six facets namely warmth, gregariousness, activity,
excitement-seeking, assertiveness, and positive emotions. The expected relationships between
these facets and WTP answers will be discussed in turn beginning with warmth.
Warmth
Warmth is suspected to trigger overstating of WTP. This facet of extraversion deals with a
person’s ability to form and maintain close relationships with others. It is measured by items
like: “I find it easy to smile and be outgoing with strangers”, “I take personal interest in the
people I work with”, “I really enjoy talking to people” and “I have strong emotional attachments
to my friends”. According to these items, individuals exhibiting this facet are friendly people.
When it comes to the context of contingent valuation surveys, the friendliness of respondents
may prove to be a threat to the validity of their WTP answers. This is because the WTP of
respondents who are affectionate and friendly are likely to be more susceptible to the presence
of interviewers than that of reserved respondents. Respondents exhibiting this facet may give
WTP answers that reflect their friendliness rather than their valuation of the proposed
environmental program. They are likely to overstate their WTP as a result.
Gregariousness
Gregariousness is also suspected of leading respondents to overstate their WTP. This facet of
extraversion gives rise to the preference for other people’s company. It is assessed by question
items like “I like to have a lot of people around me”, “I really feel the need for other people if I
am by myself for long” and “I’d rather vacation at a popular beach than an isolated cabin in
the woods”. What these items clearly imply is the fact that high scorers on gregariousness items
assign a high value to social interactions. This characteristic of gregariousness may put a serious
threat to in-person contingent valuation surveys. In an in-person CVM survey (like face-to-face
and telephone surveys) the interaction between interviewers and respondents is prominent.
Hypothesis 2: Respondents with a high level of neuroticism are more likely to state
a significantly lower WTP than respondents with a low level of neuroticism
116
Gregarious respondents are likely to put special attention to the interpersonal aspect of the
survey. They may feel the urge to maintain good atmosphere between them and interviewers
by reporting WTP answers that they deem desirable but have no relevance to the welfare
changes they expect from the proposed environmental project. Following this line of reasoning,
extraversion mediated through gregariousness can give rise to the overstating of WTP answers.
Activity
No relationship is expected between activity and WTP response behavior. As mentioned in
chapter 3, activity deals with the level of mental energy that individuals possess. Individuals
with a high level of this facet feel more energetic and need to live a busy life. Activity is assessed
by question items like “I often feel as if I’m bursting with energy”, “I am a very active person”
and “When I do things I do them vigorously”. It is quite obvious that the tendency to have a fast-
paced lifestyle is not relevant to the valuation of environmental goods. Thus, this facet will not
be considered further.
Excitement-seeking
The relevance between excitement-seeking and WTP answers is not expected. This facet of
extraversion is responsible for the need for excitement and stimulation within individuals. It is
measured by statements like “I love the excitement of roller coasters”, “I have sometimes done
things just for kicks or thrills” and “I’m attracted to bright colors and flashy styles”. Since there
is no reason why the love for “kicks” or “thrills” of individuals should affect their WTP response
behavior, excitement-seeking is not expected to influence the WTP answers.
Assertiveness
Assertiveness is not expected to have influence on stated WTP. This facet refers to the tendency
of individuals to be forceful, dominant, and outspoken. It is measured by items like “I am
dominant, forceful, and assertive” “I have often been a leader of groups I have belonged to”
and “In conversations, I tend to do most of the talking”. Given such characterization of assertive
individuals, it comes as no surprise that assertiveness has been a prime suspect of triggering a
response bias known as extreme response style (Harzing 2006). The extreme response style is
the “tendency to endorse the most extreme response categories regardless of content”
(Baumgartner and Steenkamp 2001, p.145). But since the extreme response style comes into
play only when the Likert scale is used (see 3.2.2 for the explanation of the Likert scale),
assertiveness does not expect to influence the stating of WTP. The relation between extraversion
117
and the tendency to endorse the extreme options of Likert scale, however, will be tested in
Chapter 5.
Positive emotions
It is anticipated that positive emotions lead to the overstating of WTP. This facet of extraversion
refers to the “tendency to experience positive emotions such as joy, happiness” (Costa and
McCrae 1992, p.17). It is measured by question items such as “I have sometimes experienced
intense joy or ecstasy”, “I am not a cheerful optimist (reversed score)” and “I am a cheerful,
high-spirited person”. In the literature of decision science dealing with the effects of positive
feelings on decision makings, evidence suggests that positive emotions signifies individuals
that “all is well,” and discourages individuals to engage in a careful evaluation of the situation
(Loewenstein and Lerner 2003, p.629). Thus, in the context of the CVM, it can be reasonably
expected that survey participants with a high level of positive emotions likely overstate their
WTP.
In conclusion, extraversion is an undesirable personality characteristic within CVM
respondent as it likely distorts their WTP statements. Three facets of extraversion likely lead to
the misreporting of WTP (warmth, gregariousness, and positive emotions). Because these three
facets lead to the overstating of WTP, it can be expected that extraversion also produces an
overall positive effect on stated WTP. Extraversion, mediated through assertiveness, is also
expected to be related to extreme response style. The other two facets of extraversion (activity
and excitement-seeking) are expected to be irrelevant to the context of CVM. Thus, the
following hypothesis can be formulated.
4.3.3 Openness to experience
The six facets of openness to experience are fantasy, aesthetics, feelings, actions, ideas, and
values. The theoretical links between these six facets and the WTP response behavior will be
examined below.
Hypothesis 3: Respondents with a high level of extraversion are more likely to state a
significantly higher WTP than respondents with a low level of extraversion
118
Fantasy
This personal attribute is suspected to have no influence on WTP answers. Fantasy is
responsible for individual differences among people in their willingness to use and enjoy their
imagination. This facet of openness to experience is assessed by question items like “I have an
active fantasy life”, “I enjoy concentrating on a fantasy or daydream and exploring all its
possibilities, letting it grow and develop” or “As a child I rarely enjoyed games of make believe
(reversed score)”. High scorers on these scales enjoy using imagination. Low scorers on these
scales are interpreted to be “prosaic” (Costa and McCrae 1992b, p.17). When it comes to
contingent valuation surveys, respondents who score high on fantasy are likely to be more
motivated to craft the mental image of the proposed project than low scorers. However, this
does not necessarily mean that they will expect a larger welfare change from the program (and
should thereby give higher WTP answer) than low scorers. Due to this reason, no relationship
between fantasy and WTP answers is expected.
Aesthetics
It is suspected that aesthetics has no influence on WTP answers. This facet of openness to
experience describes people’s preference for art and music. It is measured by question items
such as “I am sometimes completely absorbed in music I am listening to” and “Poetry has little
or no effect on me (reversed score)”. Aesthetics also covers the individual appreciation for the
beauty of the natural environment: “I am intrigued by the patterns I find in art and nature.”
Because of this, this facet may prove to be important for the CVM if the proposed program
involves, e.g. the improvement of the beauty of a particular landscape. However, if the scenario
only includes the improvement of tap water supply and the change of land use in upstream areas
like in the survey conducted for the empirical part of this study, aesthetics is not expected to
play any role in determining WTP answers.
Feelings
No relationship is expected between feelings and WTP answers. Feelings gives rise to the
willingness to examine one’s own emotions. This facet is measured by question items like “I
seldom pay much attention to my feelings of the moment (reversed score)” and “I seldom notice
the moods or feelings that different environments produce (reversed score)”. Low scorers on
feelings are blunted. They rarely pay attention to how they feel. It is safe to expect that CVM
respondents who score high on feelings are intrinsically motivated to scrutinize their level of
welfare changes resulting from the proposed environmental project. High scorers are familiar
119
with pinpointing their own emotions in different situations and thus are expected to better
recognize the level of their welfare changes than low scorers. However, high scorers on feelings
do not necessarily obtain a higher level of welfare change from the program than low scorers.
Because of this, the relationships between feelings and WTP answers are not expected.
Actions
Actions is expected to lead to comparably high WTP answers. This facet of openness to
experience represents the extent to which a person prefers novel activities. The facet is assessed
through eight question items, e.g. “I think it’s interesting to learn and develop new hobbies”, “I
often try new and foreign foods” and “Sometimes I make changes around the house just to try
something different”. High scorers on this facet have a higher tendency to adopt new products,
goods, or services than low scorers. They are likely to be opinion leaders as they are more likely
to obtain information from media rather than through word of mouth. Due to these reasons,
actions may come into play and have a very important role in the context of contingent valuation
survey. Because the provision of environmental goods introduces changes and novelty, high
scorers on actions are likely to obtain a higher level of welfare changes resulting from the
project than low scorers. As a result, it is reasonable to expect that high scorers on actions are
willing to pay more for the proposed environmental project than low scorers.
Ideas
Ideas is not expected to influence WTP answers. This facet represents the level of intellectual
curiosity. It is elicited by statements about the extent to which individuals take pleasure from
mental exercises. These statements are for example: “I often enjoy playing with theories or
abstract ideas”, “I enjoy solving problems or puzzles” and “I have a wide range of intellectual
interests”. People who receive high scores from ideas scales are those who actively pursue
intellectual interests. Low scorers, on the contrary, have a limited area of interests. It can be
expected that people who have high scores on ideas, i.e. high intellectual interests, will be more
motivated to put mental effort in considering about the project scenario. But since respondents
who think more about the program do not necessarily want to pay more for it, no clear
relationship between ideas and WTP answers can be expected.
Values
Values is not expected to influence WTP answers. This facet of openness to experience
determines a person’s readiness to re-examine ideals. High scorers on this facet are ready to
120
question social, political, and religious values. The items of this facet are for example: “I believe
that laws and social policies should change to reflect the needs of a changing world”, “I believe
that the different ideas of right and wrong that people in other societies have may be valid for
them” and “I believe that loyalty to one’s ideals and principles is more important than open-
mindedness (reversed score)”. High scorers on such scales are interpreted as people who do not
believe in conventional ideals. Low scorers on values can be easily described as conservative
and traditionalist. It is rather obvious that people’s readiness to examine ideals has nothing to
do with how they will value the environmental improvements and how well they will do it.
Therefore, the facet values will not be considered further.
It can be easily observed that openness to experience is a desirable attribute within
individuals when it comes to contingent valuation surveys. Many of its facets provide intrinsic
incentive for CVM respondents to put more effort into considering the proposed environmental
change scenario (fantasy, feelings and ideas). However, these facets are not expected to be
related to the amount of stated WTP as the level of effort individuals put into considering the
proposed project cannot be related to the level of their individual welfare changes. Yet, these
facets could be positively associated with the amount of time people use for answering the
questionnaire. It has been found that the more time people use to answer survey questions the
more effort they are likely to put into considering and answering such questions (Bassili and
Fletcher 1991; Fletcher and Chalmers 1991). Due to this reason, openness to experience
mediated through fantasy, feelings, and ideas can be expected to be positively associated with
the response time CVM respondents use for answering the questions. The relation between
openness to experience and response time will be tested in the next chapter.
The only facet of openness to experience that is related to WTP answers is actions. The
tendency to be receptive to new ideas and to adopt them may lead high scorers on actions to be
willing to pay more for the proposed program than low scorers. Due to these reasons, the domain
of openness to experience is expected to be positively associated with stated WTP, i.e. the
higher the score of openness to experience, the higher stated WTP.
Hypothesis 4: Respondents with a high level of openness to experience are more likely to
state a significantly higher WTP than respondents with a low level of openness to
experience
121
4.3.4 Agreeableness
Trust
People who have a high level of this facet are predisposed to believe that others are well-
intentioned. It is measured by items like “I believe that most people are basically well-
intentioned, “I think most of the people I deal with are honest and trustworthy” and “I have a
good deal of faith in human nature”. Trust can be a very important personal attribute when it
comes to in-person contingent valuation surveys. This is because this facet may directly affect
the effort respondents’ put into answering questions. Respondents who trust interviewers tend
to answer questions thoroughly and completely (Roulston 2003; Groves et al. 2004). Due to this
reason, it can be reasonably expected that CVM respondents with a high level of trust may put
more effort into considering the project scenario than low scorers of this facet. But since
respondents who think more carefully about the program do not necessarily pay more for it than
respondents who think less, neither a positive nor a negative effect of trust on stated WTP is
expected. However, trust may be positively associated with response time.
Straightforwardness
Straightforwardness is measured by items such as: “I’m not crafty or sly”, “If necessary, I am
willing to manipulate people to get what I want (reversed score)”, “I couldn’t deceive anyone
even if I wanted to”, “At times I bully or flatter people into doing what I want them to (reversed
score)” and “Being perfectly honest is a bad way to do business (reversed score)”. When it
comes to the context of this study, respondents with a high level of this facet can be expected
to be frank and sincere. Yet, no systematic influence of straightforwardness on stated WTP can
be expected. Some ingenuous respondents may dislike the project and thus state low WTP
answers while others may give higher WTP answers because they prefer the project.
Altruism
Altruism is anticipated to influence stated WTP positively. This facet is an aspect of
agreeableness determining “selflessness and concern for others” (Costa et al. 1991, p.888). It is
assessed by question items such as “I go out of my way to help others if I can”, “I think of myself
as a charitable person”, “I am not known for my generosity (reverse score)” and “Some people
think I’m selfish and egotistical (reversed score)”. Altruists have active concern for other’s
welfare and they are willing to assist others in need of help. When it comes to the valuation of
environmental goods, the effects of altruism on WTP statements can assumed to be positive.
122
Respondents who score high on altruism are those who have active concern for others and so
they are likely to obtain a higher level of welfare changes resulting from the project. In contrary,
respondents who score low on altruism focus only their personal benefits and so they are likely
to obtain a lower level of welfare changes than the high scorers. Thus, it is assumed that altruism
will affect WTP answers positively.
Compliance
Compliance determines individual reactions to interpersonal conflict. It is assessed by questions
like “I hesitate to express my anger even when it’s justified,” “When I’ve been insulted, I just
try to forgive and forget”, “If I don’t like people I let them know it” (reversed score), “I can be
sarcastic and cutting when I need to be” (reversed score). According to these question items,
compliance gives rise to the ability to inhibit anger expression in conflict situations. In the
CVM, compliant respondents are unlikely to express their anger or resentments when they
encounter “conflicts” in CVM studies, e.g. when they dislike the interviewer or feel offended
by certain statements in the CVM questionnaire. Compliant respondents are unlikely to
understate their WTP because of emotional reasons. Thus, compliance can be assumed to
produce the non-negative effect on people’s WTP statements.
Modesty
Modesty is not expected to systematically influence stated WTP. This facet of agreeableness
represents the individual tendency to be “humble and self-effacing” (Costa and McCrae 1992,
p.18). High scorers on the modesty facet are not preoccupied with themselves. On the contrary,
low scorers on modesty have “inflated views of themselves” (Costa et al. 1991, p.889). They
strongly believe in their superiority and are prone to narcissism. As neither people’s tendency
to be humble nor their tendency to be narcissistic is likely to influence their individual valuation
of the environmental change scenario, no effect of modesty on stated WTP is expected.
Tender-mindedness
Tender-mindedness refers to the tendency of individuals to be guided by the feeling of sympathy
in making decisions. This facet is assessed by question items such as: “I would rather be known
as merciful than just”, “Human need should always take priority over economic consideration”
and “I believe all human beings are worthy of respect”. When it comes to the valuation of
environmental goods, it is reasonable to expect that tender-mindedness will have positive
123
effects on individuals’ WTP answers. This is because high scorers on tender-mindedness will
likely base their WTP decisions on the feelings of sympathy. So, they are hypothesized to be
willing to contribute more for the provision of environmental public goods than low scorers
who are likely to make contribution decisions, which are characterized as just.
To sum up, agreeableness contains many desirable personal attributes when it comes to
contingent valuation surveys. Through compliance, agreeableness can be expected to motivate
respondents to forgive and forget, making their stated WTP resistant to the various negative
effects that might be induced by the formulations of the questions. Through trust, agreeableness
may motivate respondents to put more effort into considering and answering the questions. So,
agreeable people can be expected to use more time to answer survey questions. This prediction
will be tested in the next chapter. Through characteristics like altruism and tender-mindedness,
agreeableness may affect how survey participants perceive the benefits from the environmental
project, basing their valuation decisions on other people’s welfare as well as the feelings of
sympathy. Therefore, positive association between agreeableness and stated WTP can be
anticipated.
4.3.5 Conscientiousness
Competence
No relationship is expected between competence and WTP answers. Competence refers to the
tendency of individuals to feel capable, sensible, and effective. It is assessed by question items
like “I keep myself informed and usually make intelligent decisions”, “I pride myself on my
sound judgment” and “I am efficient and effective at my work”. Since the tendency to feel
capable of a person does not have anything to do with his or her valuation of environmental
change scenario, competence is considered as irrelevant to the stated WTP.
Order
Order is not expected to have any influence on stated WTP. This facet of conscientiousness
deals with the tendency of a person to be neat, tidy, and well-organized. It is measured by items
like: “I keep my belongings neat and clean”, “I like to keep everything in its place so I know
Hypothesis 5: Respondents with a high level of agreeableness are more likely to state a
significantly higher WTP than respondents with a low level of agreeableness
124
just where it is” and “I tend to be somewhat fastidious or exacting”. The tendency of people to
be orderly is obviously irrelevant to their valuation of environmental improvement projects. So,
order is not expected affect stated WTP.
Dutifulness
Dutifulness is not expected to influence stated WTP. This facet refers to the tendency of people
to adhere to their ethical codes. It is measured by items like: “I pay my debts promptly and in
full”, “I adhere strictly to my ethical principles” and “I’d really have to be sick before I’d miss
a day of work”. In easy words, dutiful individuals are dependable. Whether or not the person is
dependable should not be relevant to his or her valuation of environmental projects. Thus,
dutifulness is not expected to be relevant to WTP answers.
Self-discipline
It is anticipated that self-discipline does not affect stated WTP. This facet deals with a person’s
ability to begin tasks and complete them regardless of distractions and boredom. It is assessed
by questions such as: “I’m pretty good about pacing myself so as to get things done on time”,
“I am a productive person who always gets the job done” and “Once I start a project, I almost
always finish it.” The tendency of individuals to be disciplined should not be related to how
they value an environmental project. Therefore, the relationship between self-discipline and
stated WTP is not expected.
Achievement striving
The relationship between achievement striving and stated WTP is not expected. Achievement
striving refers to the tendency of individuals to have high aspiration levels and to work hard to
achieve their goals. It is assessed by items like: “I have a clear set of goals and work toward
them in an orderly fashion”, “I work hard to accomplish my goals” and “I strive to achieve all
I can”. The tendency of individuals to be ambitious and work hard should not be related to their
valuation of an environmental project. So, no relationship between this facet and stated WTP is
expected.
Deliberation
A positive relationship between deliberation and response time is expected. Deliberation deals
with people’s propensity to be cautious and thoughtful. This facet of conscientiousness is
125
measured by question items like “I think things through before coming to a decision”, “I always
consider the consequences before I take action”, “I rarely make hasty decisions” and “I think
twice before I answer a question”. These items imply that individuals who score high on
deliberation are more ready to make effortful decisions (Costa and McCrae 1992, p.18).
Individuals scoring low on deliberation are more spontaneous and tend to make hasty decisions.
It can be expected that deliberate respondents will make extensive and careful WTP decisions.
Deliberate respondents are expected to scrutinize all given information that is relevant for the
valuation of the proposed scenario. So it is very likely that they will use more time to answer
the survey questions than low scorers on deliberation who, by contrast, are less likely to have
every detail of the project spelled out before making contribution decisions. Due to this reason,
a positive association between deliberation and response time is expected. This link be tested
in chapter 5. Deliberation, however, is not expected to determine WTP statements. This is
because respondents who put more effort into thinking about the program do not necessarily
want to pay more for it.
In sum, five out of six facets of conscientiousness, i.e. competence, order, dutifulness,
achievement striving, and self-discipline, are expected exhibit no relevance to the CVM. A
positive relation is expected between deliberation and response time. No facets of
conscientiousness is expected to be related to stated WTP. Due to this reason, the following
hypothesis can be formulated.
Table 4-1 summarizes the expected influence of the Big Five personality traits on stated WTP.
Neuroticism and extraversion are expected to be the source of biases contained in WTP answers.
Whereas neuroticism is expected to motivate respondents to understate their WTP, extraversion
can be expected to trigger the overstating of the WTP. Openness to experience and
agreeableness, on the other hand, are expected to provide indication of people’s WTP for a
public project. Positive association between openness to experience and stated WTP is expected
because open individuals prefer new activities and therefore they may be willing to pay more
for the planned environmental project. Positive relation between agreeableness and stated WTP
is also expected. This is because agreeable people are altruistic and tender-minded. So they are
expected to be willing to pay more for the public project.
Hypothesis 6: Conscientiousness does not have an effect on WTP statements
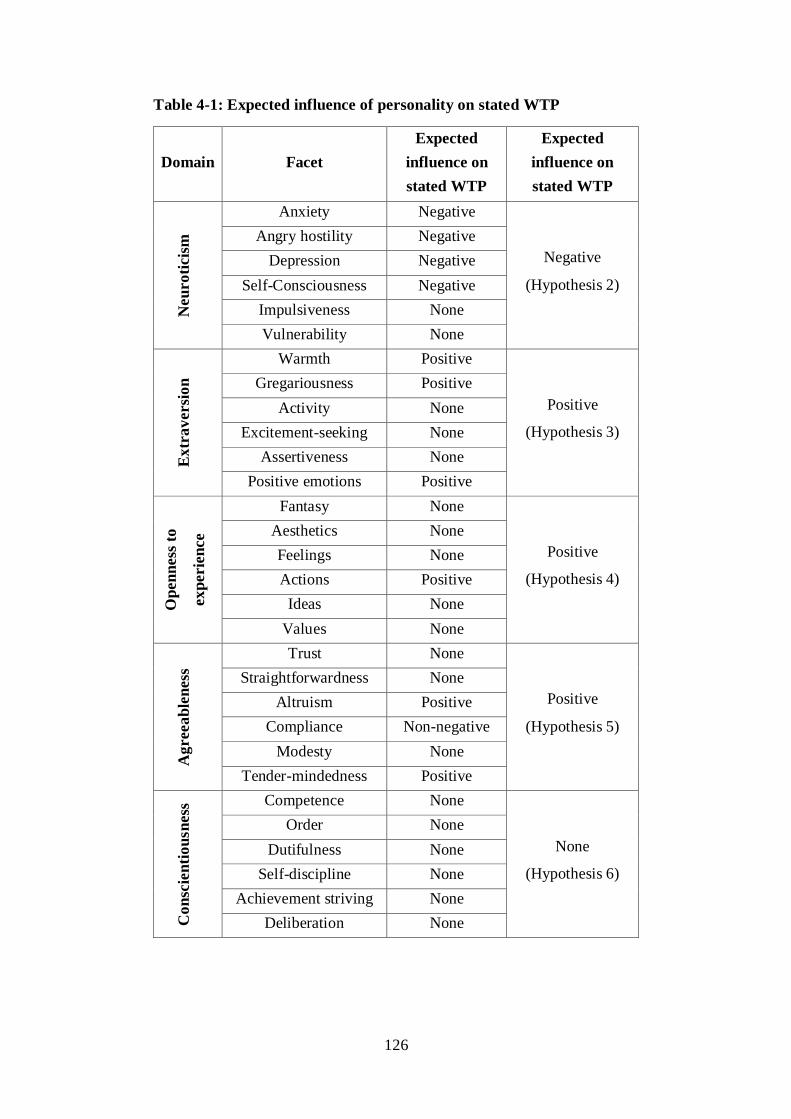
126
Table 4-1: Expected influence of personality on stated WTP
Domain Facet
Expected
influence on
stated WTP
Expected
influence on
stated WTP N
eu
ro
ticis
m
Anxiety Negative
Negative
(Hypothesis 2)
Angry hostility Negative
Depression Negative
Self-Consciousness Negative
Impulsiveness None
Vulnerability None
Ex
tra
versi
on
Warmth Positive
Positive
(Hypothesis 3)
Gregariousness Positive
Activity None
Excitement-seeking None
Assertiveness None
Positive emotions Positive
Op
en
ness
to
ex
perie
nce
Fantasy None
Positive
(Hypothesis 4)
Aesthetics None
Feelings None
Actions Positive
Ideas None
Values None
Ag
reea
ble
ness
Trust None
Positive
(Hypothesis 5)
Straightforwardness None
Altruism Positive
Compliance Non-negative
Modesty None
Tender-mindedness Positive
Co
nsc
ien
tio
usn
ess
Competence None
None
(Hypothesis 6)
Order None
Dutifulness None
Self-discipline None
Achievement striving None
Deliberation None
127
4.4 Summary
In this chapter, a theoretical foundation of an empirical investigation of the influence of
personality on WTP answers is developed. The chapter begins with the discussion on the
importance to consider personality in environmental valuation. It turns out that there are three
main reasons that call for a systematic analysis of personality in the context of CVM. First,
systematic distortions contained in WTP answers may have root in the personality of
respondents. Second, personality may be able to provide some indication of people’s WTP for
the project to be valued. Third, direct links between stated WTP and personality to be detected
may be useful for the verification of WTP estimates of the future CVM studies. After the
importance of personality in CVM is discussed, the empirical literature of the BFM in CVM is
reviewed. It becomes apparent that no previous study has ever employed the BFM to detect
systematic biases that may be contained in WTP answers. Due to this reason, theoretical links
between the Big Five personality domains and WTP statements are scrutinized in detail.
Because of the multi-faceted structure of the five personality domains, in the first step the
analysis is made on the facet level. Resulting theoretical links are then considered aggregately
in the second step to form the theoretical predictions on the domain level. It becomes apparent
that two domains can be expected to be the source of biases in WTP answers. These are
neuroticism and extraversion. Openness to experience and agreeableness are expected to be
positively related to people’s WTP for an environmental project. Relation between
conscientiousness and stated WTP is not expected. These theoretical predictions will be tested
in the next chapter.

128
129
Chapter 5 Empirical analysis
In the preceding chapter, a theoretical framework for the analysis of the effects of the Big Five
personality domains on WTP statements in CVM surveys was developed. After finding that the
five personality domains are a potential source of biases contained in WTP answers, the
theoretical links between the five personality domains and WTP statements were scrutinized in
detail. On the basis of the obtained theoretical insights, six research hypotheses were formulated
in the last chapter, so the main aim of this chapter is to present the results of the empirical work
to test these six hypotheses.
As a result, this chapter is organized into four sections. The next section, section 5.1,
presents the background to a practical CVM survey aimed at assessing the social value of a tap
water improvement program that was conducted in Chiang Mai, northern Thailand. This section
introduces the Uplands Program, a collaborative research project run by universities and
research institutes from Germany, Vietnam and Thailand, and which provided the framework
for the empirical CVM survey. Thereafter, the study area and its environmental problems, those
which have led to the need for a tap water improvement program, will be described. Details of
the CVM questionnaire and Big Five inventory (the NEO-FFI) are also provided in this section.
Following section 5.1, section 5.2 presents the results of the survey, beginning with a report on
the general socio-economic characteristics of the CVM respondents. It then describes indicators
of the reliability and validity of the personality data obtained from the NEO-FFI. This is
followed by a detailed analysis of the impact of the five personality domains on WTP
statements. A discussion of the results follows in section 5.3.
5.1 General survey settings
This section contains three sub-sections. Section 5.1.1 starts with the background to the
empirical CVM survey conducted in Chiang Mai Province, northern Thailand, after which
section 5.1.2 provides information on the research design. The practical realization of the survey
is then covered in section 5.1.3.
130
5.1.1 Background to the research project
The Uplands Program
The CVM survey was carried out to test the effects of the Big Five on WTP statements, and
was part of the collaborative research project “Research for Sustainable Land Use and Rural
Development in Mountainous Regions of Southeast Asia” (Sonderforschungsbereich 564, or
SFB564) and commonly known as the Uplands Program. The Uplands Program was a
collaborative research project run by nine universities and research institutes in Germany,
Vietnam and Thailand. The program began in July 2000 and completed its work in June 2012.
Its activities were financed by the German government via the German Research Foundation,
or Deutsche Forschungsgemeinschaft (DFG). The focus of the program was to contribute to a
scientific advancement of the sustainable use of land and rural development in the mountainous
regions of Southeast Asia. The two main study areas covered by the program were in northern
Thailand (mainly in Chiang Mai Province), and in northern Vietnam (Son La Province). Since
the CVM survey conducted for this study was based in Thailand, only the Thai part of The
Uplands Program will be described here.24
In the mountainous regions of northern Thailand, where market-based agriculture
predominates, the resulting intensive land use activities put tremendous pressure on both land
productivity levels and the natural environment in general (Kaosa-ard 2001). This trend can be
observed in most watersheds across northern Thailand, where upland populations have been
steered toward market-oriented agricultural practices. The outcomes of this have been a
deterioration in both short- and long-term agricultural productivity levels in the highland areas
and also a deterioration of the quality of the natural environment there (Heidhues and Pape
2007). These activities are having negative impacts on the well-being of both highlanders –
those living in the area, and lowlanders living in downstream areas. The aims of the Thai part
of the Uplands Program were to advance scientific knowledge and help increase the
productivity of highland agriculture, while at the same time minimizing its adverse impacts on
the natural environment and also on human communities. To achieve these goals, the program
brought together scientific expertise from different knowledge domains, such as horticulture,
entomology, plant pathology, agricultural engineering, sociology and economics. Based on
these knowledge domains, 16 research topics from the natural sciences (e.g. fertigation
strategies, agrochemical and pest management, post-harvest technology) and social sciences
24 For more details of the Vietnamese part of the program see http://www.uni-hohenheim.de/sfb564/.
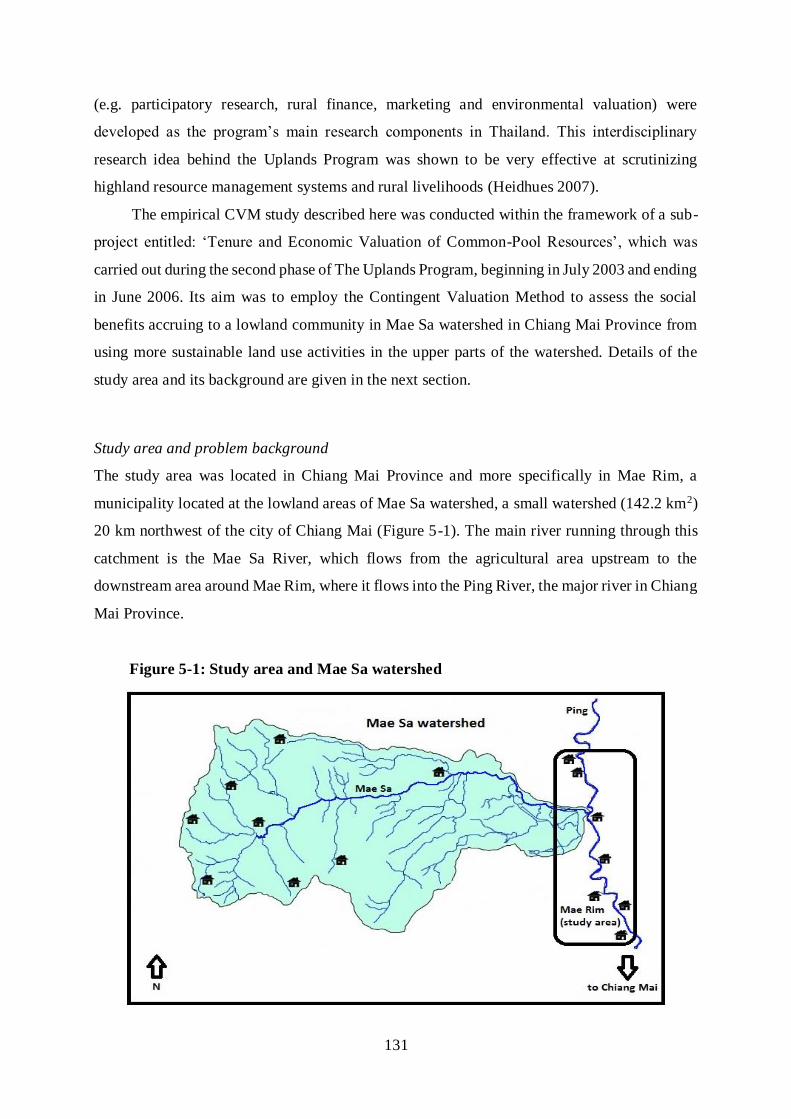
131
(e.g. participatory research, rural finance, marketing and environmental valuation) were
developed as the program’s main research components in Thailand. This interdisciplinary
research idea behind the Uplands Program was shown to be very effective at scrutinizing
highland resource management systems and rural livelihoods (Heidhues 2007).
The empirical CVM study described here was conducted within the framework of a sub-
project entitled: ‘Tenure and Economic Valuation of Common-Pool Resources’, which was
carried out during the second phase of The Uplands Program, beginning in July 2003 and ending
in June 2006. Its aim was to employ the Contingent Valuation Method to assess the social
benefits accruing to a lowland community in Mae Sa watershed in Chiang Mai Province from
using more sustainable land use activities in the upper parts of the watershed. Details of the
study area and its background are given in the next section.
Study area and problem background
The study area was located in Chiang Mai Province and more specifically in Mae Rim, a
municipality located at the lowland areas of Mae Sa watershed, a small watershed (142.2 km2)
20 km northwest of the city of Chiang Mai (Figure 5-1). The main river running through this
catchment is the Mae Sa River, which flows from the agricultural area upstream to the
downstream area around Mae Rim, where it flows into the Ping River, the major river in Chiang
Mai Province.
Figure 5-1: Study area and Mae Sa watershed
132
Considered a suburban area, Mae Rim has good basic infrastructure, such as roads, electricity
supply, telephone and internet connections, and health care services. All households in Mae
Rim have access to clean water, as nearly all villages are connected to the water distribution
system managed by the Mae Rim Waterworks (MRW) –the publicly owned water service
provider in the area. The MRW uses water from both the Mae Sa and Ping rivers as i ts main
water sources, treats this water to make it of a suitable quality, then stores it in elevated tanks
before distributing it to local households using gravity flow. Those villages that do not have
access to the MRW distribution system have established their own village water systems –
usually simple systems relying on the groundwater supply. However, the households surveyed
in this study are connected to the MRW system and so use water originally taken from the Mae
Sa River. For many years, these households received an inferior service from the MRW and
they often experienced water supply interruptions which sometimes lasted for a few hours or
even an entire day. In some areas, the tap water flows under an extremely low pressure, forcing
households to buy water pumps and storage tanks. It is also the case that tap water turns red in
color sometimes. Some water users even claim they sometimes suffer diarrhea from consuming
the MRW’s water.
There are two main reasons for the tap water problems mentioned above. The first reason
is the outdated water distribution system used by the MRW, as there are often leaks and holes
in the pipes which can lead to supply interruptions in certain areas, and can also lead to
contamination of the water supply. The second reason is associated with the adverse effects of
farming practices in the upper part of the watershed. In the upstream area of the Mae Sa valley,
there are 22 Hmong and local Lanna (northern Thai) villages. The major sources of income for
the inhabitants of these villages are based on agricultural activities. Local Lanna villagers earn
their incomes from the production of vegetables (e.g. cabbage, paprika and chayote) and flowers
(e.g. chrysanthemums). Hmong villagers earn their incomes from growing lychee fruit. Over
the years, these farming activities have had a number of adverse effects upon the Mae Sa River,
including 1) periodic water shortages in the river due to the large amount of water extracted for
farming activities, 2) high sediment load in the river due to soil erosion, and 3) high pesticide
residue levels. These issues have led to problems with the tap water quality experienced in the
downstream area. For example, the periodic water shortages in the river lead to interruptions in
the tap water supply among the downstream villages. Also, the high sediment load in the river
leads to the tap water in Mae Rim turning red, while the chemicals in the river, many of which
cannot be removed using MRW’s standard water treatment methods, lead to illnesses among
tap water users. In the next section, a proposed tap water improvement program, which formed
133
the thematic core of the practical CVM survey carried out for this study, will be described in
detail.
The tap water improvement program
After many interviews conducted with local experts, two sets of measures were identified as
being necessary to make the tap water of a consistently drinkable quality. These experts
included scientists from the Faculty of Environmental Engineering at Chiang Mai University,
the Director and technical officers of the MRW, and scientists from the Uplands Program. The
first set of measures proposed was an improvement to the MRW distribution system; outdated
pipes needed to be replaced and properly maintained, so as to reduce the number of supply
interruptions and also the potential contamination of tap water by biological pollutants. The
second set of measures included the introduction of sustainable land use practices in the
upstream communities, such as use of a more locally-adapted pest control system and a soil
conservation program. The plan was that this second set of measures would lead to a reduction
in the chemical residue and sedimentation levels in the Mae Sa River. An important point
regarding this second set of measures is that it would lead to an improvement in both private
goods (in terms of the better tap water quality) and public goods. Sustainable agricultural
practices were expected to result in the following public goods: (i) reduced chemical residue
levels in the local ecosystems, bringing benefits to people living in the vicinity of the river now
and in the future, (ii) reduced pesticide contamination of fruit and vegetables grown in the area,
which would benefit consumers in general, 3) better soil quality in the uplands area, bringing
benefits to the highland farmers, and 4) reduced rainfall runoff, preventing flash floods in Mae
Rim and so benefiting the Mae Rim population as a whole.
5.1.2 The survey design
Two questionnaires were employed as part of the CVM survey - the CVM questionnaire and a
personality inventory. The details of these two questionnaires are introduced below.
CVM questionnaire
The CVM questionnaire was developed based on feedback gained from several expert
interviews, as well as two rounds of pre-tests held with MRW household members. The
procedure proposed by Arrow et al. (1993) was strictly followed to minimize potential bias
induced by the questions. The questionnaire was first developed in English and at a later stage
134
translated into Thai, with the use of language carefully adjusted to fit the suburban context
around Chiang Mai, where a high proportion of people have a relatively low level of education
(see section 5.2.1). Following the standard CVM questionnaire format described in chapter 2,
the questionnaire used in the survey consisted of four main parts: warm-up questions, scenario
description, WTP elicitation questions, and socio-economic and attitudinal questions (a full
version of the questionnaire is shown in Appendix 1).
The first part of the CVM questionnaire contained warm-up questions, the aims of which
were to: (i) create a good interview atmosphere and build the confidence of the respondents, so
that they would feel more comfortable when answering the questions, (ii) activate respondents’
memories with respect to their household water supply and their water consumption activities,
and (iii) obtain specific information regarding domestic water sources and water use. The warm-
up questions inquired about the sources of water, the uses the water was put to and any problems
encountered with the domestic and drinking water supplies. Survey participants were also asked
to describe their monthly water consumption expenses.
The second section of the questionnaire contained the most important element: a
description of the project scenario. In this section, verbal descriptions as well as photographs
were used to provide details about the proposed tap water improvement program to the survey
respondents. The scenario description presented in the survey can be seen in Box 5-1.The
project description began with an introduction of the tap water improvement program, the
organizations involved in it, and the major aim of the program - which was to provide an
uninterrupted drinking water supply to MRW water users. Here, the names of any public
authorities involved were eliminated to create a project scenario credible to the MRW water
users and to minimize the chances of respondents giving protest answers.25 Under the project
scenario, the tap water improvement program was called the “Drinkable Tap Water – Clean
Stream” program. This title was developed somewhat as a gimmick to make it stand-out from
other programs that the respondents may have heard of.26 It was also expected that the title
25 During the pre-test of this scenario, the public authorities in Thailand seemed to have a low level of credibility
among Mae Rim residents. Most if not all public investment projects were believed to be executed at inflated costs
to give opportunities for corruption to take place among high-ranking civil servants and/or politicians. In the pre-
test, respondents revealed their preference that the proposed program should be exclusively managed by the MRW,
which is a state-owned enterprise. State-owned corporations in Thailand are operated as commercial enterprises,
but still have public policy objectives. Most of them have a very good reputation among the Thai population.
26 It was detected during the pre-test that respondents sometimes confused this tap water improvement program
with other programs implemented by different organizations.
135
would remind respondents that the proposed project not only dealt with private goods, i.e.
improved tap water quality, but also public goods, i.e. improvements of environmental quality
of the upper part of the valley. At this point, these two objectives, to improve the MRW’s water
distribution system and environmental quality in the upper part of the watershed, were described
in more detail. In addition, photographs illustrating the two sets of measures and map of the
watershed were given to the respondents (see Appendix 1). Ultimately, the benefits to be
generated by the program were clearly stated.
Box 5-1: Scenario description to customers during the survey
Chiang Mai University, the University of Hohenheim and the Mae Rim Water Works
(MRW) company are currently surveying water users’ level of interest in the program
“Drinkable Tap Water-Clean Stream”. The idea is that all MRW customers should enjoy
an uninterrupted supply of tap water which is also drinkable.
“Drinkable Tap Water-Clean Stream” consists of two main programs which are: (i) an
improvement to the MRW distribution system and (ii) an improvement in upstream water
quality - as the source of the MRW’s water.
INT.: Show photograph card
Improvements to the MRW distribution system are necessary due to pollution ingress -
with biological pollutants entering the supply in the area due to broken pipes. Biological
pollutants can cause diarrhea and other diseases. The broken pipes are also responsible
for frequent interruptions in the water service in some parts of Mae Rim.
An improvement of upstream water quality is necessary to ensure that the MRW receives
good water, both for treatment and distribution purposes. There are two main problems
regarding the upstream water quality, the first being the red color of the water, something
which occurs regularly in the wet season, and the second, contamination with pesticides
which can lead to severe health problems such as cancer. The red color of the water is
caused by soil erosion in the upper reaches of the Mae Sa valley, while pesticides in the
water are a consequence of high usage levels there. As you can see from this map, your
tap water is sourced entirely from the rivers of the Mae Sa valley.
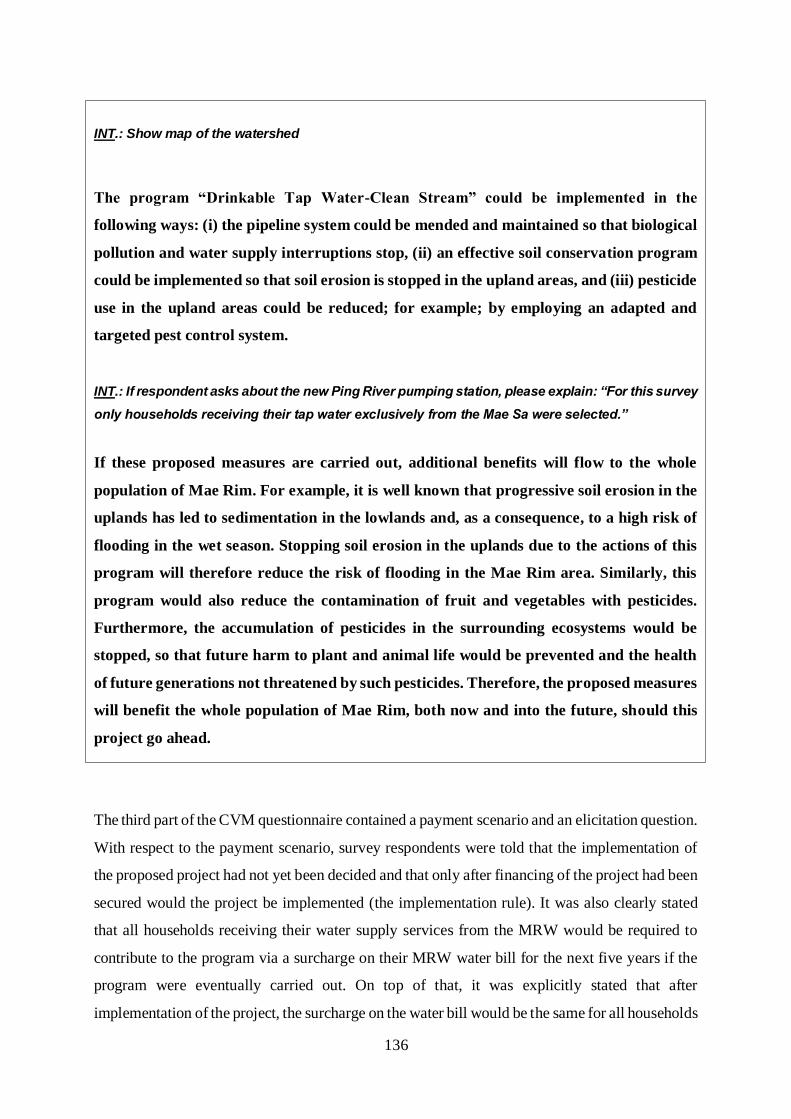
136
INT.: Show map of the watershed
The program “Drinkable Tap Water-Clean Stream” could be implemented in the
following ways: (i) the pipeline system could be mended and maintained so that biological
pollution and water supply interruptions stop, (ii) an effective soil conservation program
could be implemented so that soil erosion is stopped in the upland areas, and (iii) pesticide
use in the upland areas could be reduced; for example; by employing an adapted and
targeted pest control system.
INT.: If respondent asks about the new Ping River pumping station, please explain: “For this survey
only households receiving their tap water exclusively from the Mae Sa were selected.”
If these proposed measures are carried out, additional benefits will flow to the whole
population of Mae Rim. For example, it is well known that progressive soil erosion in the
uplands has led to sedimentation in the lowlands and, as a consequence, to a high risk of
flooding in the wet season. Stopping soil erosion in the uplands due to the actions of this
program will therefore reduce the risk of flooding in the Mae Rim area. Similarly, this
program would also reduce the contamination of fruit and vegetables with pesticides.
Furthermore, the accumulation of pesticides in the surrounding ecosystems would be
stopped, so that future harm to plant and animal life would be prevented and the health
of future generations not threatened by such pesticides. Therefore, the proposed measures
will benefit the whole population of Mae Rim, both now and into the future, should this
project go ahead.
The third part of the CVM questionnaire contained a payment scenario and an elicitation question.
With respect to the payment scenario, survey respondents were told that the implementation of
the proposed project had not yet been decided and that only after financing of the project had been
secured would the project be implemented (the implementation rule). It was also clearly stated
that all households receiving their water supply services from the MRW would be required to
contribute to the program via a surcharge on their MRW water bill for the next five years if the
program were eventually carried out. On top of that, it was explicitly stated that after
implementation of the project, the surcharge on the water bill would be the same for all households
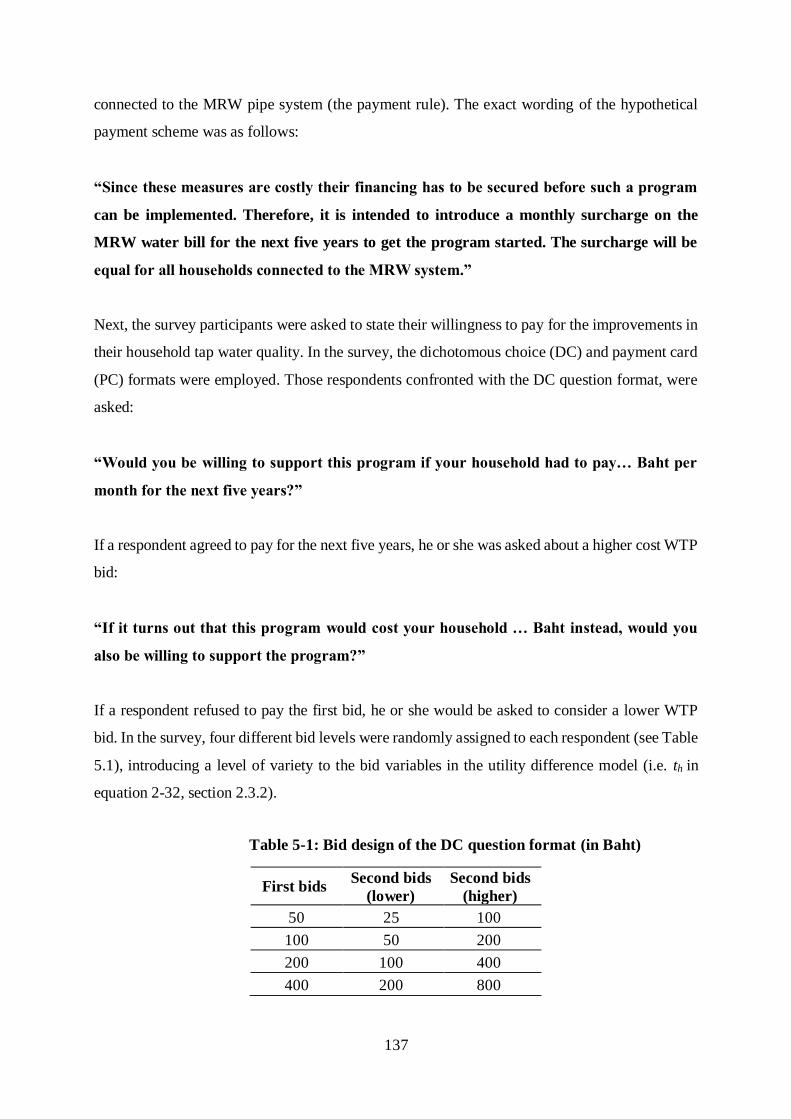
137
connected to the MRW pipe system (the payment rule). The exact wording of the hypothetical
payment scheme was as follows:
“Since these measures are costly their financing has to be secured before such a program
can be implemented. Therefore, it is intended to introduce a monthly surcharge on the
MRW water bill for the next five years to get the program started. The surcharge will be
equal for all households connected to the MRW system.”
Next, the survey participants were asked to state their willingness to pay for the improvements in
their household tap water quality. In the survey, the dichotomous choice (DC) and payment card
(PC) formats were employed. Those respondents confronted with the DC question format, were
asked:
“Would you be willing to support this program if your household had to pay… Baht per
month for the next five years?”
If a respondent agreed to pay for the next five years, he or she was asked about a higher cost WTP
bid:
“If it turns out that this program would cost your household … Baht instead, would you
also be willing to support the program?”
If a respondent refused to pay the first bid, he or she would be asked to consider a lower WTP
bid. In the survey, four different bid levels were randomly assigned to each respondent (see Table
5.1), introducing a level of variety to the bid variables in the utility difference model (i.e. th in
equation 2-32, section 2.3.2).
Table 5-1: Bid design of the DC question format (in Baht)
First bids Second bids
(lower)
Second bids
(higher)
50 25 100
100 50 200
200 100 400
400 200 800
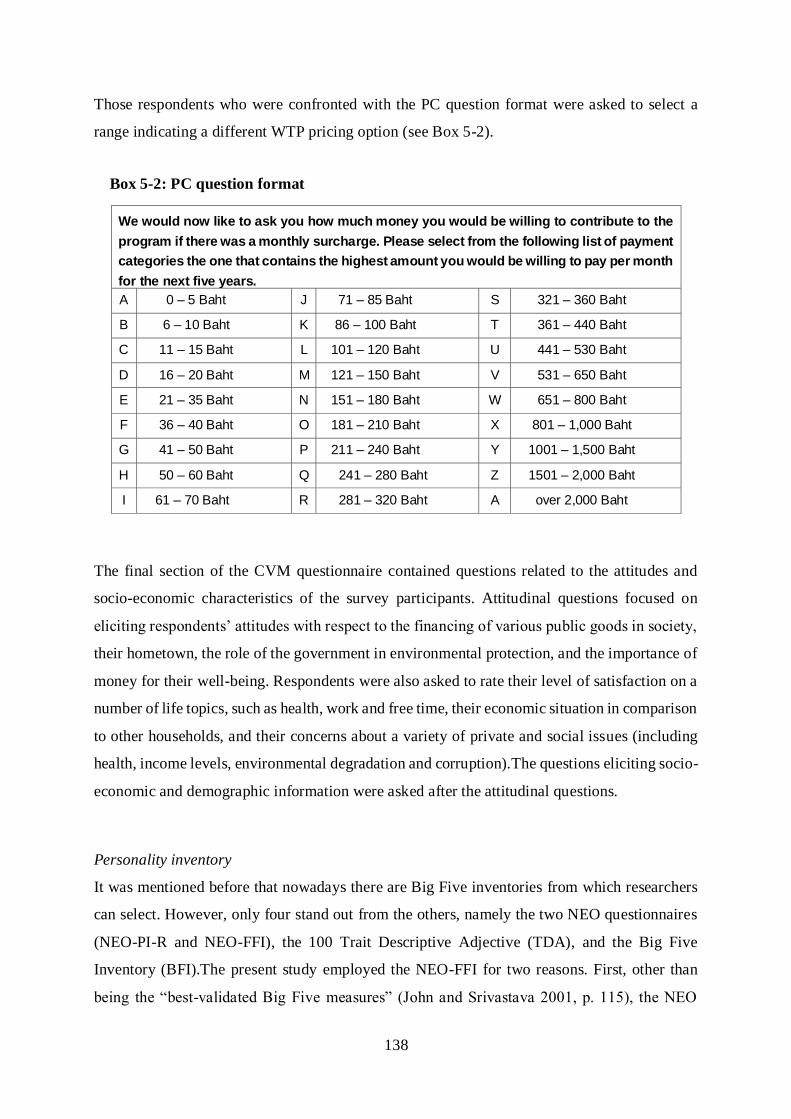
138
Those respondents who were confronted with the PC question format were asked to select a
range indicating a different WTP pricing option (see Box 5-2).
Box 5-2: PC question format
We would now like to ask you how much money you would be willing to contribute to the
program if there was a monthly surcharge. Please select from the following list of payment
categories the one that contains the highest amount you would be willing to pay per month
for the next five years.
A 0 – 5 Baht J 71 – 85 Baht S 321 – 360 Baht
B 6 – 10 Baht K 86 – 100 Baht T 361 – 440 Baht
C 11 – 15 Baht L 101 – 120 Baht U 441 – 530 Baht
D 16 – 20 Baht M 121 – 150 Baht V 531 – 650 Baht
E 21 – 35 Baht N 151 – 180 Baht W 651 – 800 Baht
F 36 – 40 Baht O 181 – 210 Baht X 801 – 1,000 Baht
G 41 – 50 Baht P 211 – 240 Baht Y 1001 – 1,500 Baht
H 50 – 60 Baht Q 241 – 280 Baht Z 1501 – 2,000 Baht
I 61 – 70 Baht R 281 – 320 Baht A
A
over 2,000 Baht
The final section of the CVM questionnaire contained questions related to the attitudes and
socio-economic characteristics of the survey participants. Attitudinal questions focused on
eliciting respondents’ attitudes with respect to the financing of various public goods in society,
their hometown, the role of the government in environmental protection, and the importance of
money for their well-being. Respondents were also asked to rate their level of satisfaction on a
number of life topics, such as health, work and free time, their economic situation in comparison
to other households, and their concerns about a variety of private and social issues (including
health, income levels, environmental degradation and corruption).The questions eliciting socio-
economic and demographic information were asked after the attitudinal questions.
Personality inventory
It was mentioned before that nowadays there are Big Five inventories from which researchers
can select. However, only four stand out from the others, namely the two NEO questionnaires
(NEO-PI-R and NEO-FFI), the 100 Trait Descriptive Adjective (TDA), and the Big Five
Inventory (BFI).The present study employed the NEO-FFI for two reasons. First, other than
being the “best-validated Big Five measures” (John and Srivastava 2001, p. 115), the NEO
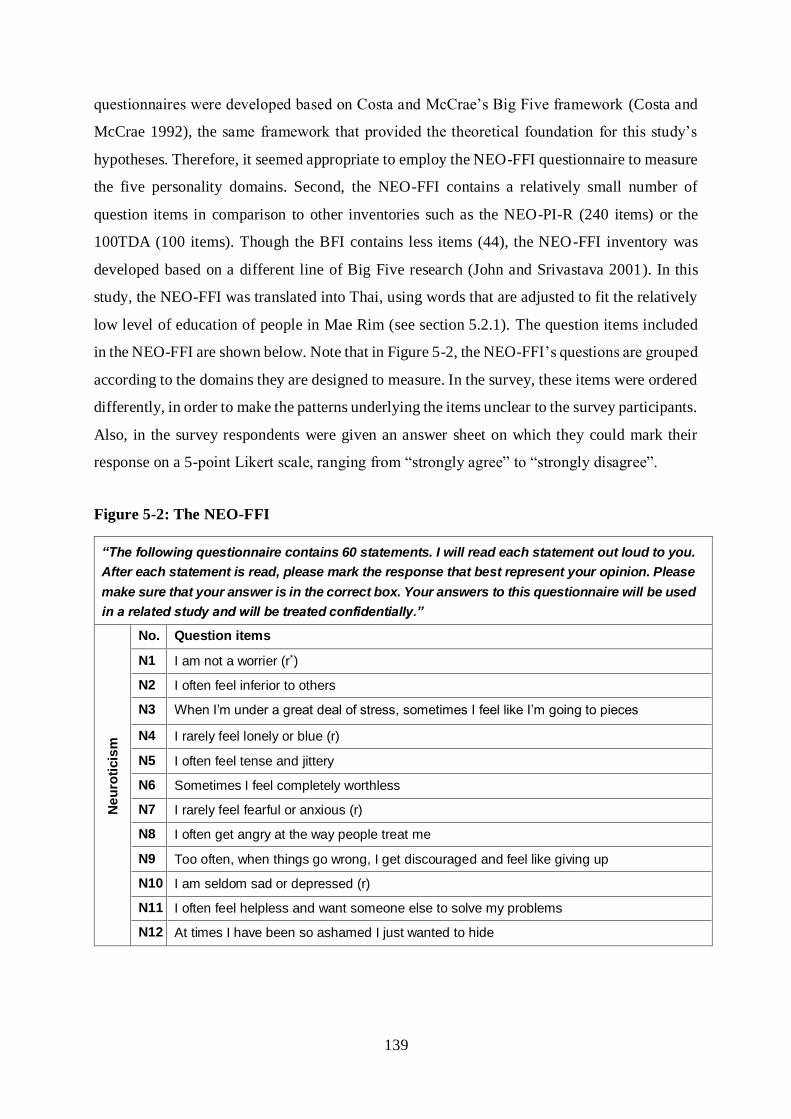
139
questionnaires were developed based on Costa and McCrae’s Big Five framework (Costa and
McCrae 1992), the same framework that provided the theoretical foundation for this study’s
hypotheses. Therefore, it seemed appropriate to employ the NEO-FFI questionnaire to measure
the five personality domains. Second, the NEO-FFI contains a relatively small number of
question items in comparison to other inventories such as the NEO-PI-R (240 items) or the
100TDA (100 items). Though the BFI contains less items (44), the NEO-FFI inventory was
developed based on a different line of Big Five research (John and Srivastava 2001). In this
study, the NEO-FFI was translated into Thai, using words that are adjusted to fit the relatively
low level of education of people in Mae Rim (see section 5.2.1). The question items included
in the NEO-FFI are shown below. Note that in Figure 5-2, the NEO-FFI’s questions are grouped
according to the domains they are designed to measure. In the survey, these items were ordered
differently, in order to make the patterns underlying the items unclear to the survey participants.
Also, in the survey respondents were given an answer sheet on which they could mark their
response on a 5-point Likert scale, ranging from “strongly agree” to “strongly disagree”.
Figure 5-2: The NEO-FFI
“The following questionnaire contains 60 statements. I will read each statement out loud to you.
After each statement is read, please mark the response that best represent your opinion. Please
make sure that your answer is in the correct box. Your answers to this questionnaire will be used
in a related study and will be treated confidentially.”
Ne
uro
ticis
m
No. Question items
N1 I am not a worrier (r*)
N2 I often feel inferior to others
N3 When I’m under a great deal of stress, sometimes I feel like I’m going to pieces
N4 I rarely feel lonely or blue (r)
N5 I often feel tense and jittery
N6 Sometimes I feel completely worthless
N7 I rarely feel fearful or anxious (r)
N8 I often get angry at the way people treat me
N9 Too often, when things go wrong, I get discouraged and feel like giving up
N10 I am seldom sad or depressed (r)
N11 I often feel helpless and want someone else to solve my problems
N12 At times I have been so ashamed I just wanted to hide
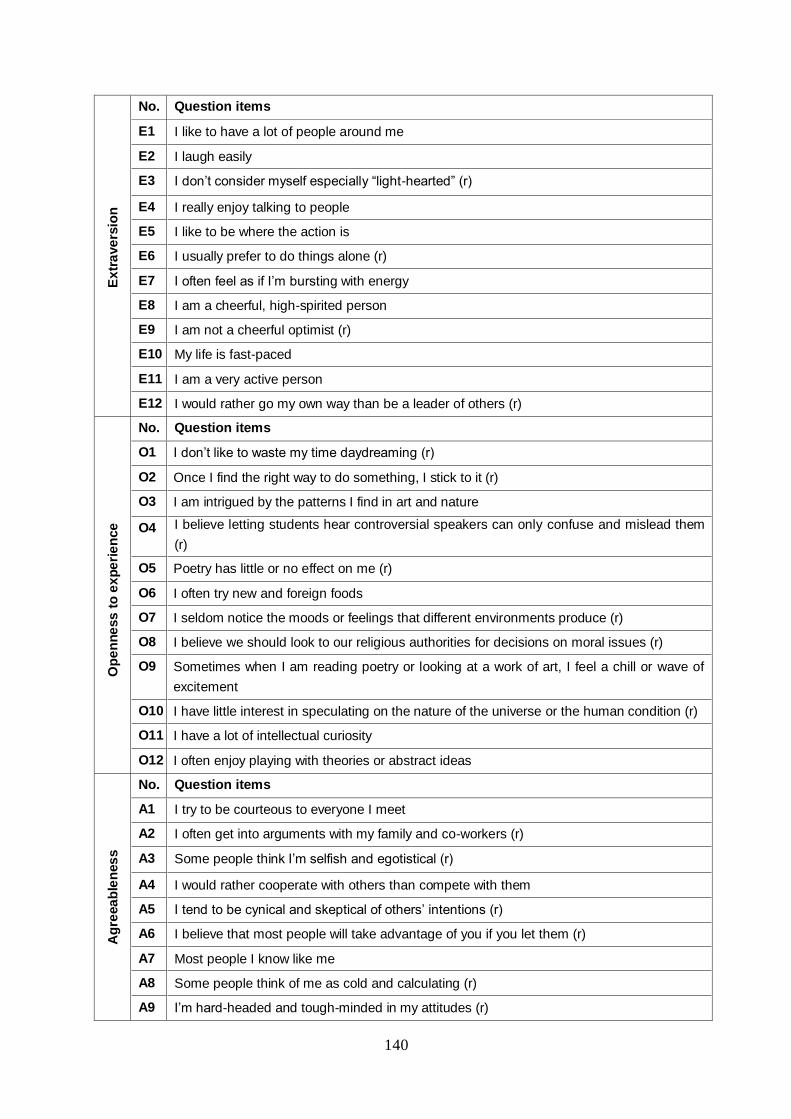
140
Ex
tra
ve
rsio
n
No. Question items
E1 I like to have a lot of people around me
E2 I laugh easily
E3 I don’t consider myself especially “light-hearted” (r)
E4 I really enjoy talking to people
E5 I like to be where the action is
E6 I usually prefer to do things alone (r)
E7 I often feel as if I’m bursting with energy
E8 I am a cheerful, high-spirited person
E9 I am not a cheerful optimist (r)
E10 My life is fast-paced
E11 I am a very active person
E12 I would rather go my own way than be a leader of others (r)
Op
en
ne
ss
to
ex
pe
rie
nce
No. Question items
O1 I don’t like to waste my time daydreaming (r)
O2 Once I find the right way to do something, I stick to it (r)
O3 I am intrigued by the patterns I find in art and nature
O4 I believe letting students hear controversial speakers can only confuse and mislead them
(r)
O5 Poetry has little or no effect on me (r)
O6 I often try new and foreign foods
O7 I seldom notice the moods or feelings that different environments produce (r)
O8 I believe we should look to our religious authorities for decisions on moral issues (r)
O9 Sometimes when I am reading poetry or looking at a work of art, I feel a chill or wave of
excitement
O10 I have little interest in speculating on the nature of the universe or the human condition (r)
O11 I have a lot of intellectual curiosity
O12 I often enjoy playing with theories or abstract ideas
Ag
reea
ble
nes
s
No. Question items
A1 I try to be courteous to everyone I meet
A2 I often get into arguments with my family and co-workers (r)
A3 Some people think I’m selfish and egotistical (r)
A4 I would rather cooperate with others than compete with them
A5 I tend to be cynical and skeptical of others’ intentions (r)
A6 I believe that most people will take advantage of you if you let them (r)
A7 Most people I know like me
A8 Some people think of me as cold and calculating (r)
A9 I’m hard-headed and tough-minded in my attitudes (r)
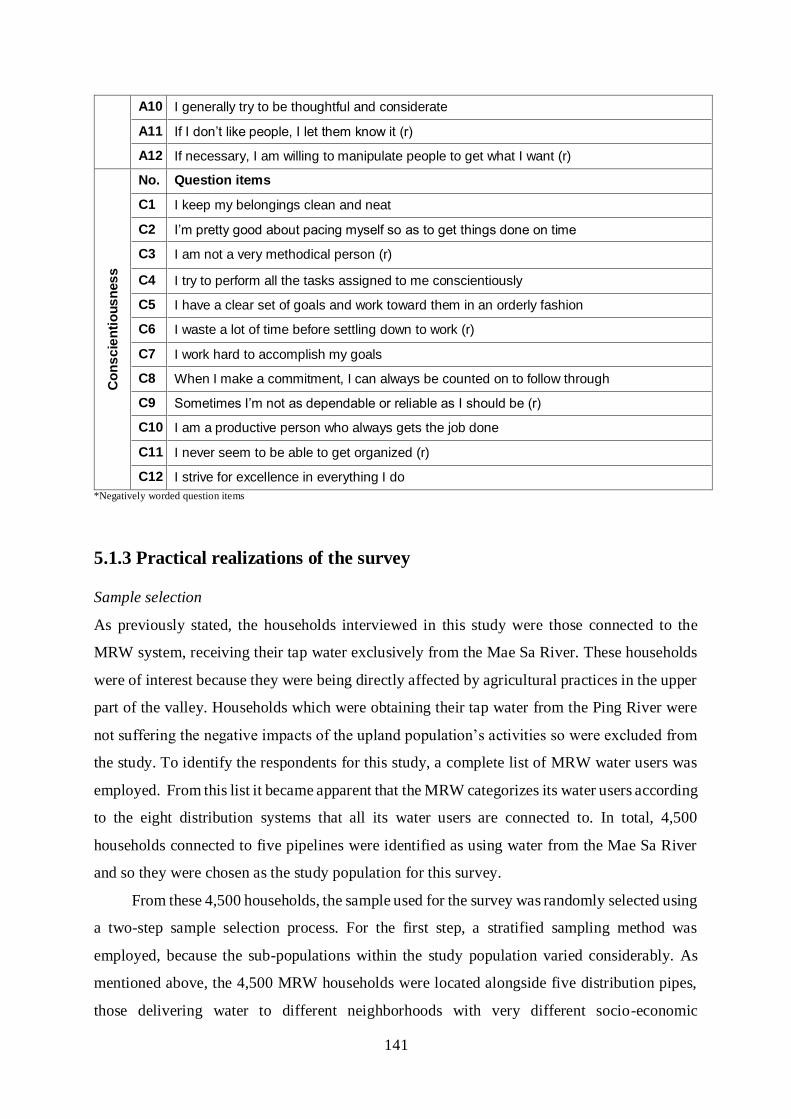
141
A10 I generally try to be thoughtful and considerate
A11 If I don’t like people, I let them know it (r)
A12 If necessary, I am willing to manipulate people to get what I want (r)
Co
ns
cie
nti
ou
sn
es
s
No. Question items
C1 I keep my belongings clean and neat
C2 I’m pretty good about pacing myself so as to get things done on time
C3 I am not a very methodical person (r)
C4 I try to perform all the tasks assigned to me conscientiously
C5 I have a clear set of goals and work toward them in an orderly fashion
C6 I waste a lot of time before settling down to work (r)
C7 I work hard to accomplish my goals
C8 When I make a commitment, I can always be counted on to follow through
C9 Sometimes I’m not as dependable or reliable as I should be (r)
C10 I am a productive person who always gets the job done
C11 I never seem to be able to get organized (r)
C12 I strive for excellence in everything I do
*Negatively worded question items
5.1.3 Practical realizations of the survey
Sample selection
As previously stated, the households interviewed in this study were those connected to the
MRW system, receiving their tap water exclusively from the Mae Sa River. These households
were of interest because they were being directly affected by agricultural practices in the upper
part of the valley. Households which were obtaining their tap water from the Ping River were
not suffering the negative impacts of the upland population’s activities so were excluded from
the study. To identify the respondents for this study, a complete list of MRW water users was
employed. From this list it became apparent that the MRW categorizes its water users according
to the eight distribution systems that all its water users are connected to. In total, 4,500
households connected to five pipelines were identified as using water from the Mae Sa River
and so they were chosen as the study population for this survey.
From these 4,500 households, the sample used for the survey was randomly selected using
a two-step sample selection process. For the first step, a stratified sampling method was
employed, because the sub-populations within the study population varied considerably. As
mentioned above, the 4,500 MRW households were located alongside five distribution pipes,
those delivering water to different neighborhoods with very different socio-economic
142
characteristics. For instance, one of the five distribution pipelines provides tap water to the
residential area around military barracks, while another pipeline serves an area used as
accommodation for the 1995 Southeast Asia Games, and now occupied mainly by government
officials and their families. This meant that the five distribution pipelines represented very well
the five strata from which a survey sample should be chosen. Using the stratified sampling
strategy for this survey, households in each stratum were independently sampled based on their
frequency relative to the total population in order to ensure that each stratum was well
represented by the sample. To select households from each stratum, the second step of the
sampling procedure, a systematic sampling method was employed. Using the systematic
sampling method ensured that all households in each stratum had the same probability of being
selected. During this step, MRW water users connected to each of the five distribution lines
were arranged according to their meter number, then these households were selected at regular
intervals throughout this ordered list. In the end, out of 4,500 households that were utilizing
water from the Mae Sa River, 570 households, or 12.6% of the target population, were randomly
selected for the empirical survey. A split sample design was then used, in which 345 interviews
were conducted using the DC elicitation format and 225 interviews were conducted employing
the PC elicitation format.
Interviews
The survey interviews were carried out between December 2004 and September 2005. In total,
87 interviewers were recruited, all of whom were master’s degree students from Chiang Mai
University. After being recruited, the interviewers were familiarized with the questionnaires
and the interview procedures, the details of which will be described in the following section. At
the beginning of each interview, interviewers were instructed to give a brief introduction to the
interviewees regarding the institution responsible for the survey, the overall objectives of the
survey, and the time that would be needed for the interview. Interviewers were asked to
interview only household heads, or the person who was in control of the household budget.
During the scenario presentation, interviewers were instructed to visualize the scenario by
producing: 1) a map of the areas currently receiving MRW services, and 2) a mini-brochure
describing the program “Drinkable Tap Water – Clean Stream”, which included photos of
broken pipes, soil erosion, red-colored river water, and details regarding pesticide application
practices (see Appendix 1 for an example of the brochure). When asking respondents the WTP
questions, interviewers were instructed not to lead the respondents based on their or others’
143
attitudes towards MRW, and to be neutral in their body language. At the end, when respondents
were asked sensitive questions regarding their level of education or their household income
levels, interviewers were asked to produce the answer sheet containing different income
intervals, so that respondents could give their answers in private. Interviewers were also asked
to record the time it took respondents to complete the CVM questionnaire.
After the main questionnaire had been completed, interviewers were instructed to ask
respondents whether or not they were willing to participate in an extra, yet related study. If the
answer was yes, interviewers were asked to give a brief introduction on the purpose of these
extra questions. Thereafter, interviewers were asked to read the NEO-FFI questions out loud to
the respondents, who could mark their answers down on an answer sheet. This procedure was
useful, since many of the question items used in the NEO-FFI were rather personal, such as “I
always feel that I am inferior to other people”. In general, it took respondents approximately
10 to 15 minutes to complete the NEO-FFI.
5.2 Results
The empirical results of the survey were split into three main categories and presented in turn.
Section 5.2.1 describes the basic results of the CVM surveys, i.e. the socio-economic and
demographic information provided by the household sample, section 5.2.2 assesses the
measurement quality of the NEO-FFI and offers a detailed analysis of the relationship between
the Big Five and the WTP statements. Section 5.2.4 contains a discussion of the results.
5.2.1 Basic results
The socio-economic characteristics of the households covered in this section are gender, age,
household size, education and income of the survey respondents, as these are often found to be
the most important WTP determinants and so can be used to check the plausibility of the WTP
statements obtained during the empirical CVM survey (for a more detailed description of the
household sample see Ahlheim et al. (2010)). In general, the gender of the respondents was
equally distributed. Out of the 570 total interviews, approximately half (54%) were conducted
with male respondents, and all of the respondents interviewed identified themselves either as
the household head or as a person who made the key decisions on household spending.
Respondents were mostly middle-aged, i.e. in their 40s (40.53). The actual age range of the
respondents was rather wide being between 18 and 80 years. Two respondents under 18 were
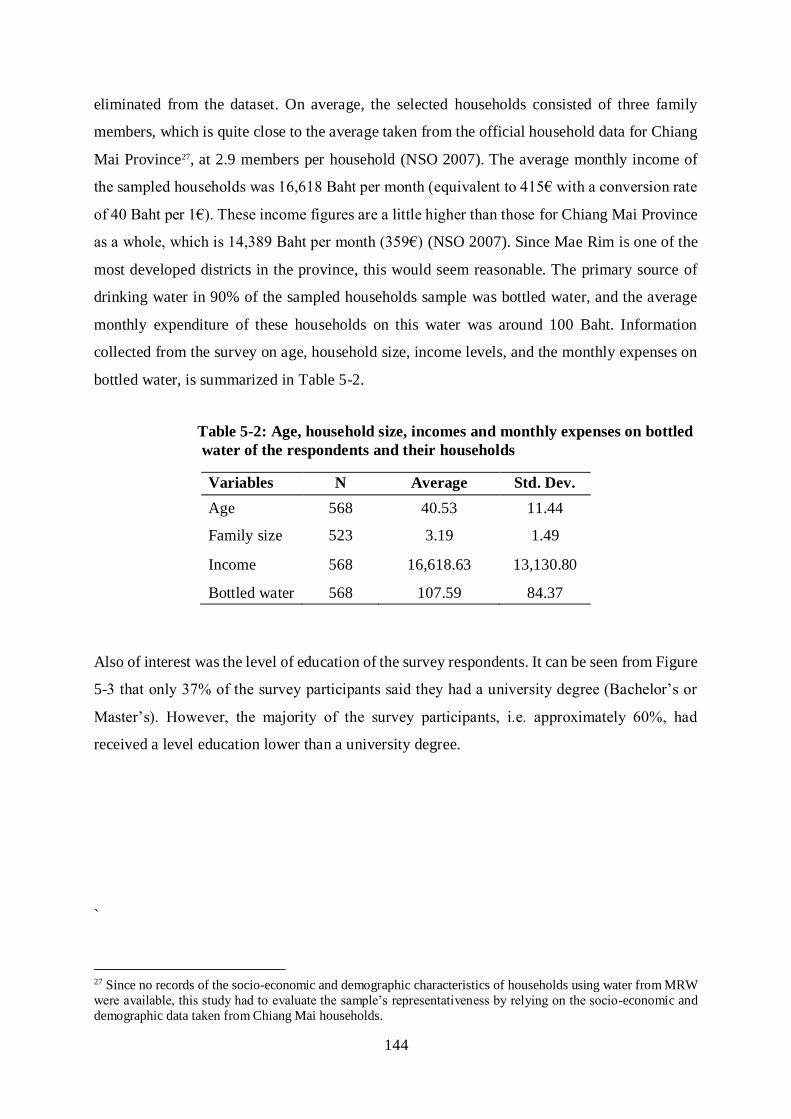
144
eliminated from the dataset. On average, the selected households consisted of three family
members, which is quite close to the average taken from the official household data for Chiang
Mai Province27, at 2.9 members per household (NSO 2007). The average monthly income of
the sampled households was 16,618 Baht per month (equivalent to 415€ with a conversion rate
of 40 Baht per 1€). These income figures are a little higher than those for Chiang Mai Province
as a whole, which is 14,389 Baht per month (359€) (NSO 2007). Since Mae Rim is one of the
most developed districts in the province, this would seem reasonable. The primary source of
drinking water in 90% of the sampled households sample was bottled water, and the average
monthly expenditure of these households on this water was around 100 Baht. Information
collected from the survey on age, household size, income levels, and the monthly expenses on
bottled water, is summarized in Table 5-2.
Table 5-2: Age, household size, incomes and monthly expenses on bottled
water of the respondents and their households
Variables
N Average Std. Dev.
Age 568 40.53 11.44
Family size 523 3.19 1.49
Income 568 16,618.63 13,130.80
Bottled water 568 107.59 84.37
Also of interest was the level of education of the survey respondents. It can be seen from Figure
5-3 that only 37% of the survey participants said they had a university degree (Bachelor’s or
Master’s). However, the majority of the survey participants, i.e. approximately 60%, had
received a level education lower than a university degree.
`
27 Since no records of the socio-economic and demographic characteristics of households using water from MRW
were available, this study had to evaluate the sample’s representativeness by relying on the socio-economic and
demographic data taken from Chiang Mai households.
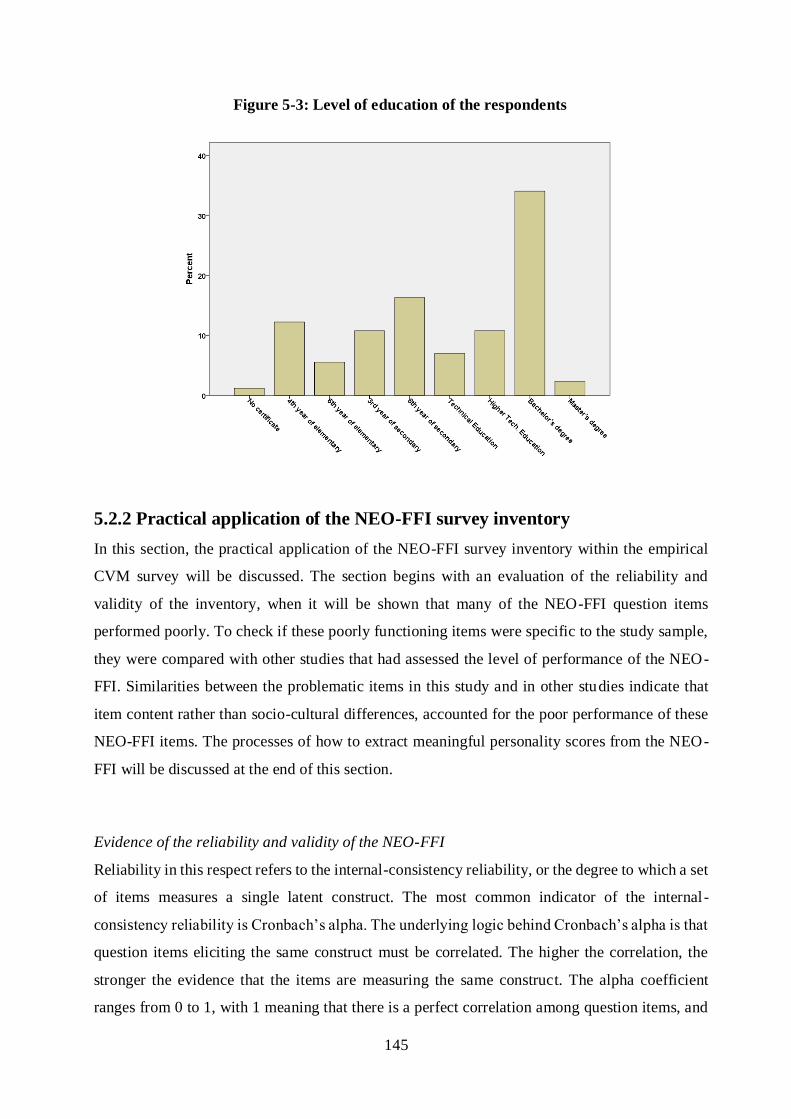
145
Figure 5-3: Level of education of the respondents
5.2.2 Practical application of the NEO-FFI survey inventory
In this section, the practical application of the NEO-FFI survey inventory within the empirical
CVM survey will be discussed. The section begins with an evaluation of the reliability and
validity of the inventory, when it will be shown that many of the NEO-FFI question items
performed poorly. To check if these poorly functioning items were specific to the study sample,
they were compared with other studies that had assessed the level of performance of the NEO-
FFI. Similarities between the problematic items in this study and in other studies indicate that
item content rather than socio-cultural differences, accounted for the poor performance of these
NEO-FFI items. The processes of how to extract meaningful personality scores from the NEO-
FFI will be discussed at the end of this section.
Evidence of the reliability and validity of the NEO-FFI
Reliability in this respect refers to the internal-consistency reliability, or the degree to which a set
of items measures a single latent construct. The most common indicator of the internal-
consistency reliability is Cronbach’s alpha. The underlying logic behind Cronbach’s alpha is that
question items eliciting the same construct must be correlated. The higher the correlation, the
stronger the evidence that the items are measuring the same construct. The alpha coefficient
ranges from 0 to 1, with 1 meaning that there is a perfect correlation among question items, and
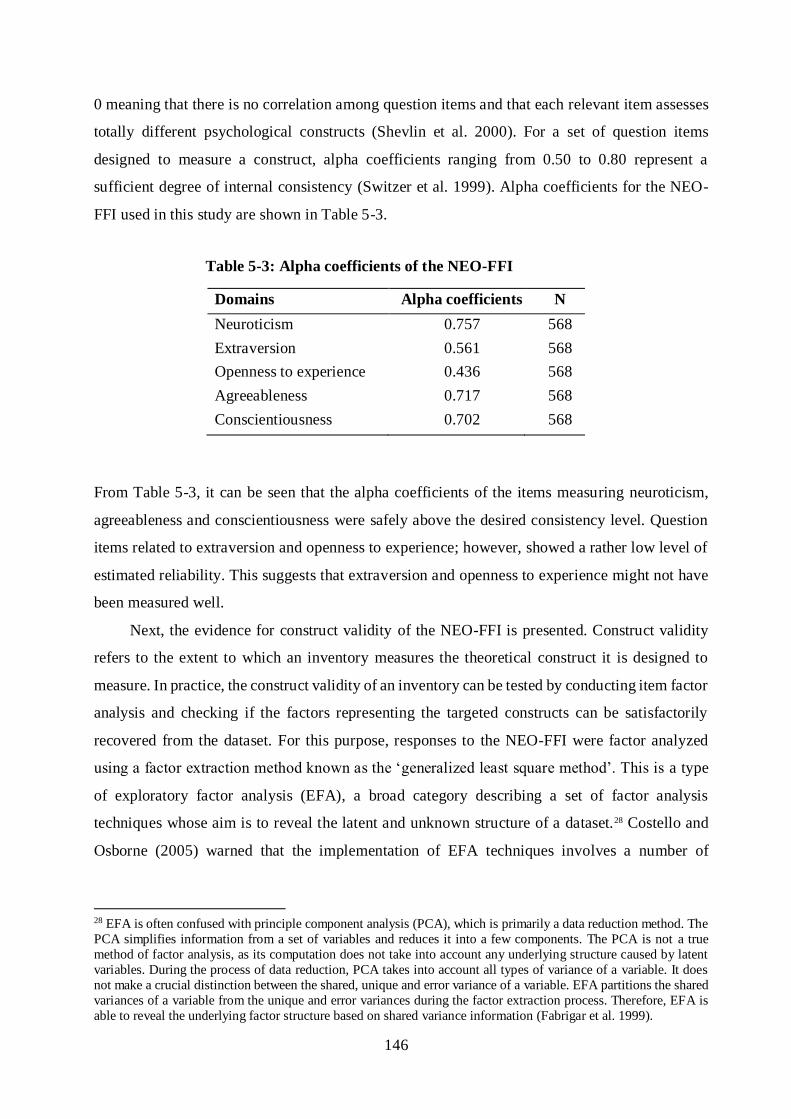
146
0 meaning that there is no correlation among question items and that each relevant item assesses
totally different psychological constructs (Shevlin et al. 2000). For a set of question items
designed to measure a construct, alpha coefficients ranging from 0.50 to 0.80 represent a
sufficient degree of internal consistency (Switzer et al. 1999). Alpha coefficients for the NEO-
FFI used in this study are shown in Table 5-3.
Table 5-3: Alpha coefficients of the NEO-FFI
Domains Alpha coefficients N
Neuroticism 0.757 568
Extraversion 0.561 568
Openness to experience 0.436 568
Agreeableness 0.717 568
Conscientiousness 0.702 568
From Table 5-3, it can be seen that the alpha coefficients of the items measuring neuroticism,
agreeableness and conscientiousness were safely above the desired consistency level. Question
items related to extraversion and openness to experience; however, showed a rather low level of
estimated reliability. This suggests that extraversion and openness to experience might not have
been measured well.
Next, the evidence for construct validity of the NEO-FFI is presented. Construct validity
refers to the extent to which an inventory measures the theoretical construct it is designed to
measure. In practice, the construct validity of an inventory can be tested by conducting item factor
analysis and checking if the factors representing the targeted constructs can be satisfactorily
recovered from the dataset. For this purpose, responses to the NEO-FFI were factor analyzed
using a factor extraction method known as the ‘generalized least square method’. This is a type
of exploratory factor analysis (EFA), a broad category describing a set of factor analysis
techniques whose aim is to reveal the latent and unknown structure of a dataset.28 Costello and
Osborne (2005) warned that the implementation of EFA techniques involves a number of
28 EFA is often confused with principle component analysis (PCA), which is primarily a data reduction method. The
PCA simplifies information from a set of variables and reduces it into a few components. The PCA is not a true
method of factor analysis, as its computation does not take into account any underlying structure caused by latent
variables. During the process of data reduction, PCA takes into account all types of variance of a variable. It does
not make a crucial distinction between the shared, unique and error variance of a variable. EFA partitions the shared
variances of a variable from the unique and error variances during the factor extraction process. Therefore, EFA is
able to reveal the underlying factor structure based on shared variance information (Fabrigar et al. 1999).
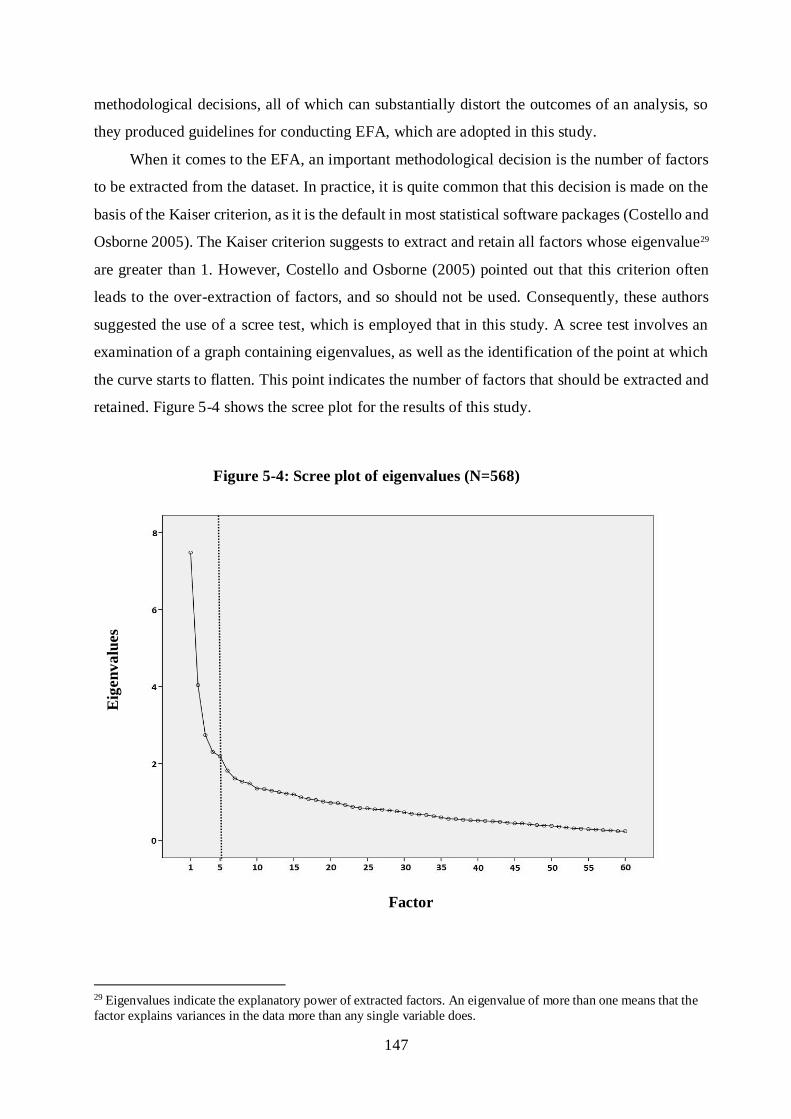
147
methodological decisions, all of which can substantially distort the outcomes of an analysis, so
they produced guidelines for conducting EFA, which are adopted in this study.
When it comes to the EFA, an important methodological decision is the number of factors
to be extracted from the dataset. In practice, it is quite common that this decision is made on the
basis of the Kaiser criterion, as it is the default in most statistical software packages (Costello and
Osborne 2005). The Kaiser criterion suggests to extract and retain all factors whose eigenvalue29
are greater than 1. However, Costello and Osborne (2005) pointed out that this criterion often
leads to the over-extraction of factors, and so should not be used. Consequently, these authors
suggested the use of a scree test, which is employed that in this study. A scree test involves an
examination of a graph containing eigenvalues, as well as the identification of the point at which
the curve starts to flatten. This point indicates the number of factors that should be extracted and
retained. Figure 5-4 shows the scree plot for the results of this study.
Figure 5-4: Scree plot of eigenvalues (N=568)
29 Eigenvalues indicate the explanatory power of extracted factors. An eigenvalue of more than one means that the
factor explains variances in the data more than any single variable does.
Factor
Eig
en
va
lues
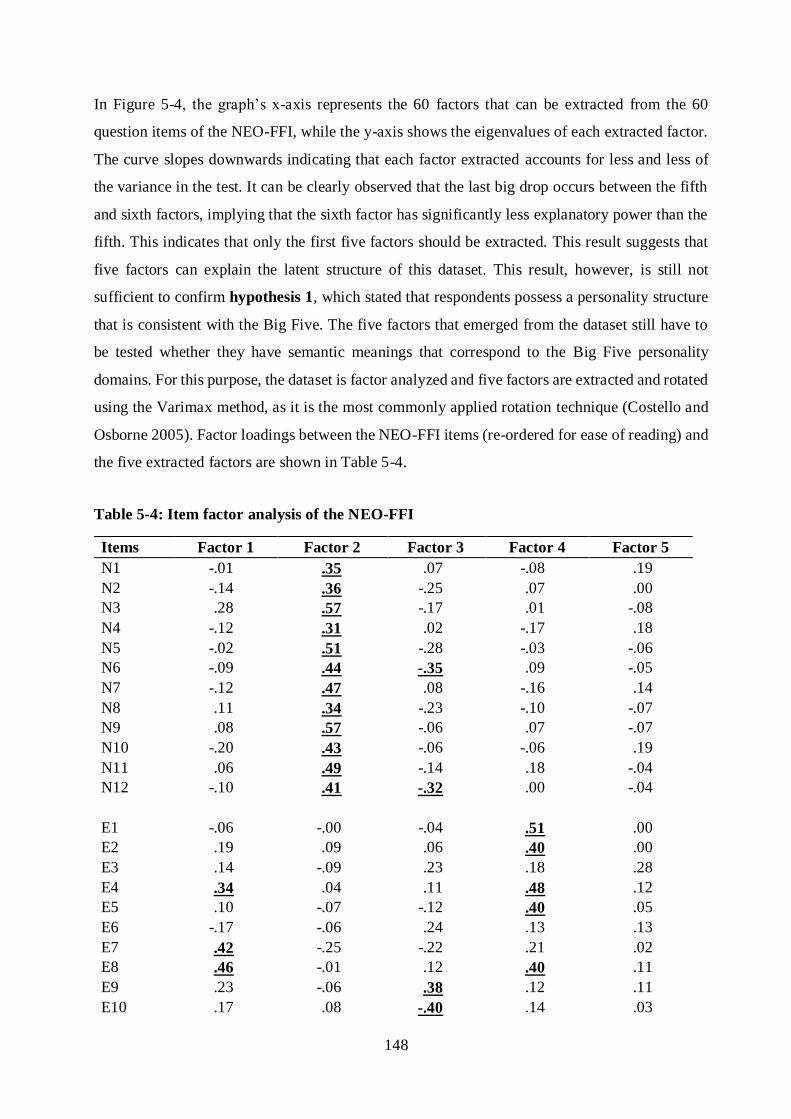
148
In Figure 5-4, the graph’s x-axis represents the 60 factors that can be extracted from the 60
question items of the NEO-FFI, while the y-axis shows the eigenvalues of each extracted factor.
The curve slopes downwards indicating that each factor extracted accounts for less and less of
the variance in the test. It can be clearly observed that the last big drop occurs between the fifth
and sixth factors, implying that the sixth factor has significantly less explanatory power than the
fifth. This indicates that only the first five factors should be extracted. This result suggests that
five factors can explain the latent structure of this dataset. This result, however, is still not
sufficient to confirm hypothesis 1, which stated that respondents possess a personality structure
that is consistent with the Big Five. The five factors that emerged from the dataset still have to
be tested whether they have semantic meanings that correspond to the Big Five personality
domains. For this purpose, the dataset is factor analyzed and five factors are extracted and rotated
using the Varimax method, as it is the most commonly applied rotation technique (Costello and
Osborne 2005). Factor loadings between the NEO-FFI items (re-ordered for ease of reading) and
the five extracted factors are shown in Table 5-4.
Table 5-4: Item factor analysis of the NEO-FFI
Items Factor 1 Factor 2 Factor 3 Factor 4 Factor 5
N1 -.01 .35 .07 -.08 .19
N2 -.14 .36 -.25 .07 .00
N3 .28 .57 -.17 .01 -.08
N4 -.12 .31 .02 -.17 .18
N5 -.02 .51 -.28 -.03 -.06
N6 -.09 .44 -.35 .09 -.05
N7 -.12 .47 .08 -.16 .14
N8 .11 .34 -.23 -.10 -.07
N9 .08 .57 -.06 .07 -.07
N10 -.20 .43 -.06 -.06 .19
N11 .06 .49 -.14 .18 -.04
N12 -.10 .41 -.32 .00 -.04
E1 -.06 -.00 -.04 .51 .00
E2 .19 .09 .06 .40 .00
E3 .14 -.09 .23 .18 .28
E4 .34 .04 .11 .48 .12
E5 .10 -.07 -.12 .40 .05
E6 -.17 -.06 .24 .13 .13
E7 .42 -.25 -.22 .21 .02
E8 .46 -.01 .12 .40 .11
E9 .23 -.06 .38 .12 .11
E10 .17 .08 -.40 .14 .03
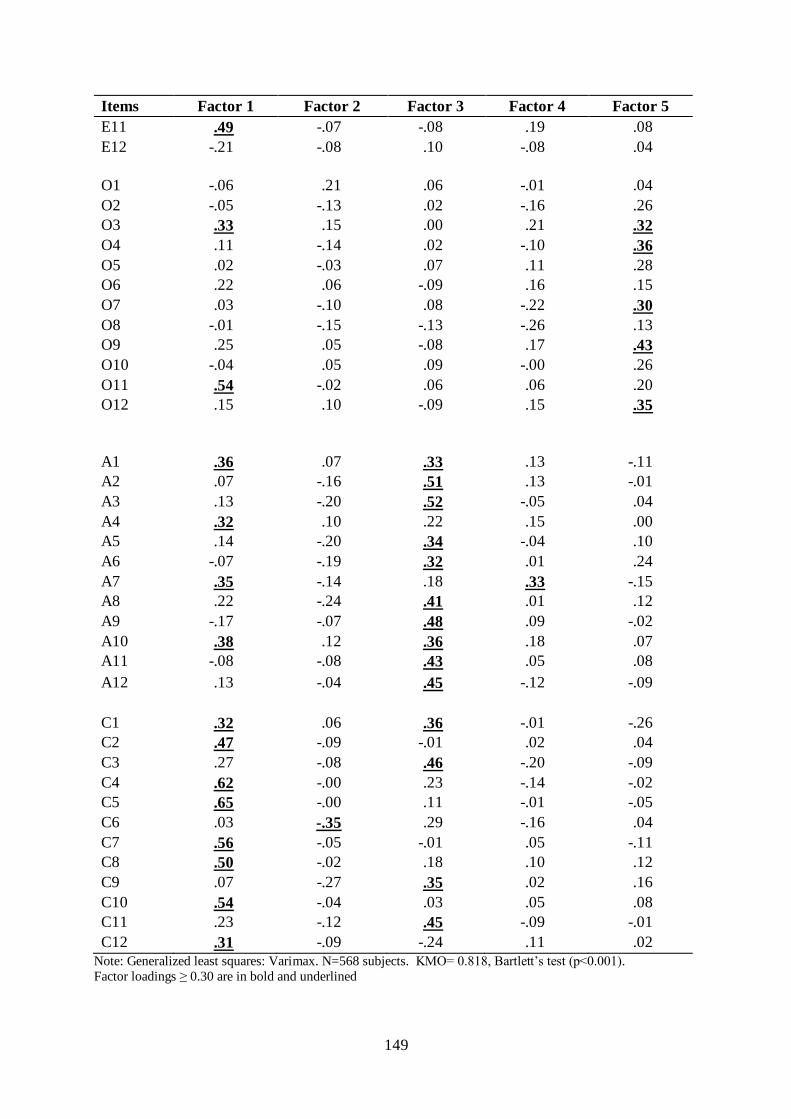
149
Items Factor 1 Factor 2 Factor 3 Factor 4 Factor 5
E11 .49 -.07 -.08 .19 .08
E12 -.21 -.08 .10 -.08 .04
O1 -.06 .21 .06 -.01 .04
O2 -.05 -.13 .02 -.16 .26
O3 .33 .15 .00 .21 .32
O4 .11 -.14 .02 -.10 .36
O5 .02 -.03 .07 .11 .28
O6 .22 .06 -.09 .16 .15
O7 .03 -.10 .08 -.22 .30
O8 -.01 -.15 -.13 -.26 .13
O9 .25 .05 -.08 .17 .43
O10 -.04 .05 .09 -.00 .26
O11 .54 -.02 .06 .06 .20
O12 .15 .10 -.09 .15 .35
A1 .36 .07 .33 .13 -.11
A2 .07 -.16 .51 .13 -.01
A3 .13 -.20 .52 -.05 .04
A4 .32 .10 .22 .15 .00
A5 .14 -.20 .34 -.04 .10
A6 -.07 -.19 .32 .01 .24
A7 .35 -.14 .18 .33 -.15
A8 .22 -.24 .41 .01 .12
A9 -.17 -.07 .48 .09 -.02
A10 .38 .12 .36 .18 .07
A11 -.08 -.08 .43 .05 .08
A12 .13 -.04 .45 -.12 -.09
C1 .32 .06 .36 -.01 -.26
C2 .47 -.09 -.01 .02 .04
C3 .27 -.08 .46 -.20 -.09
C4 .62 -.00 .23 -.14 -.02
C5 .65 -.00 .11 -.01 -.05
C6 .03 -.35 .29 -.16 .04
C7 .56 -.05 -.01 .05 -.11
C8 .50 -.02 .18 .10 .12
C9 .07 -.27 .35 .02 .16
C10 .54 -.04 .03 .05 .08
C11 .23 -.12 .45 -.09 -.01
C12 .31 -.09 -.24 .11 .02
Note: Generalized least squares: Varimax. N=568 subjects. KMO= 0.818, Bartlett’s test (p<0.001).
Factor loadings ≥ 0.30 are in bold and underlined
150
Now, it must be checked if the semantic meanings of the extracted factors in Table 5-4
corresponded to the Big Five. The semantic meanings of the factors were derived from the content
of the question items loaded on to them, and that factor loadings were accepted as meaningful if
equal to or greater than 0.30. From this it follows that the meaning of factor 1 reflects that of four
domains: extraversion, openness to experience, agreeableness and conscientiousness. This is due
to the fact that the items designed to measure these four domains loaded predominantly on this
factor. Nonetheless, the key to the identification of these factors is the content of the items with
the highest loadings (Kline 2008). The three items that had the highest loadings on factor 1 were
C4, C5 and C7: “I try to perform all the tasks assigned to me conscientiously”, “I have a clear
set of goals and work toward them in an orderly fashion”, and “I work hard to accomplish my
goals”. On top of that, most of the items that loaded on factor 1 were designed to measure
conscientiousness (8 out of 18), so although not in a perfectly clear way, factor 1 should be labeled
as conscientiousness.
Factor 2 clearly represented neuroticism, as all question items designed to measure
neuroticism loaded on this factor. Although N6 and N12 also had high loadings on factor 3, they
were only their secondary loadings. The primary loadings for these two items were on factor 2.
One can notice that factor 2 also contained a negatively worded item designed to measure
conscientiousness (C6), that is: “I waste a lot of time before settling down to work”. This item
loaded negatively on factor 2, implying that this factor had characteristics in opposition to what
it was meant to measure. This means that factor 2 was associated with procrastination. This makes
sense as factor 2 represents neuroticism.
The content of factor 3 was determined using question items designed to measure
neuroticism, extraversion, agreeableness and conscientiousness. However, the three items that
loaded highest on this factor were negatively worded items designed to measure agreeableness
(A2, A3 and A9), these being: “I often get into arguments with my family and co-workers”, “Some
people think I’m selfish and egotistical” and “I’m hard-headed and tough-minded in my
attitudes.” Furthermore, ten out of the eighteen items that loaded on this factor were
agreeableness-related items. For these reasons, factor 3 should be interpreted as agreeableness,
though it should be kept in mind that the content of this factor does not perfectly reflect that of
the agreeableness domain.
Factor 4 represents extraversion. In the study, this factor contained five out of the twelve
extraversion items, these five question items being: “I like to have a lot of people around me”, “I
laugh easily”, “I really enjoy talking to people”, “I like to be where the action is”, and “I am a
cheerful, high-spirited person”. Factor 4 contains one item from another domain, i.e. A7: “Most
151
people I know like me”. However, this makes sense, as this item implies an aspect of extraversion,
that is, the ability to form close relationships with others. It should be mentioned that factor 4
only moderately reflected the meaning of extraversion, because most of the extraversion items
did not measure the latent trait they were supposed to measure. They either loaded on the wrong
factors (E7, E9, E10 and E11) or did not load significantly on any of the five extracted factors
(E3, E6 and E12).
Factor 5 should be labeled openness to experience, as all of the 5 question items loading
on this factor were designed to measure openness to experience, these being O3, O4, O7, O9 and
O12: “I am intrigued by the patterns I find in art and nature”, “I believe letting students hear
controversial speakers can only confuse and mislead them”, “I seldom notice the moods or
feelings that different environments produce”, “Sometimes when I am reading poetry or looking
at a work of art, I feel a chill or wave of excitement”, and “I often enjoy playing with theories or
abstract ideas”. Factor 5 did not contain items measuring other personality domains. It should be
mentioned that seven openness items did not load on this factor.
To sum up, the latent factor structure underlying responses to the NEO-FFI consisted of
five factors whose meanings satisfactorily correspond to the Big Five. Based on this finding, it
does not seem justified to reject hypothesis 1, which stated that respondents possess a personality
structure that is consistent with the Big Five. Consequently, the usefulness of the BFM in the
context of CVM can be further evaluated. In section 5.2.3, it will be analyzed whether there is a
systematic relation between the big five personality domains and WTP statements.
Before going to the next section, problematic items of the NEO-FFI should be investigated
in more detail. Results from the item factor analysis showed that many question items related to
extraversion, openness to experience, agreeableness and conscientiousness did not measure what
they were designed to. This is in spite of the fact that all NEO-FFI question items were interpreted
into Thai, using the language that fits the suburban context of Mae Rim, where the majority of
people have a relatively low level of education. In total, 20 NEO-FFI items either loaded on the
wrong factor or did not load on any of the five factors. The majority of these 20 items also
functioned poorly in other studies. This implies that the content of these items, rather than the
samples or the socio-cultural settings of the studies, accounts for the poor performance. Table 5-
5 displays the poorly functioning items in the Mae Rim sample and the poorly functioning items
in eight published studies of the NEO-FFI inventory, as reviewed by Hull et al. (2010).30 The
30 These eight published studies reported on the factor structure of the NEO-FFI from surveys in eight different
countries: Canada, the Czech Republic, Jamaica, Japan, Poland, Slovakia, the United Kingdom and the United
States.
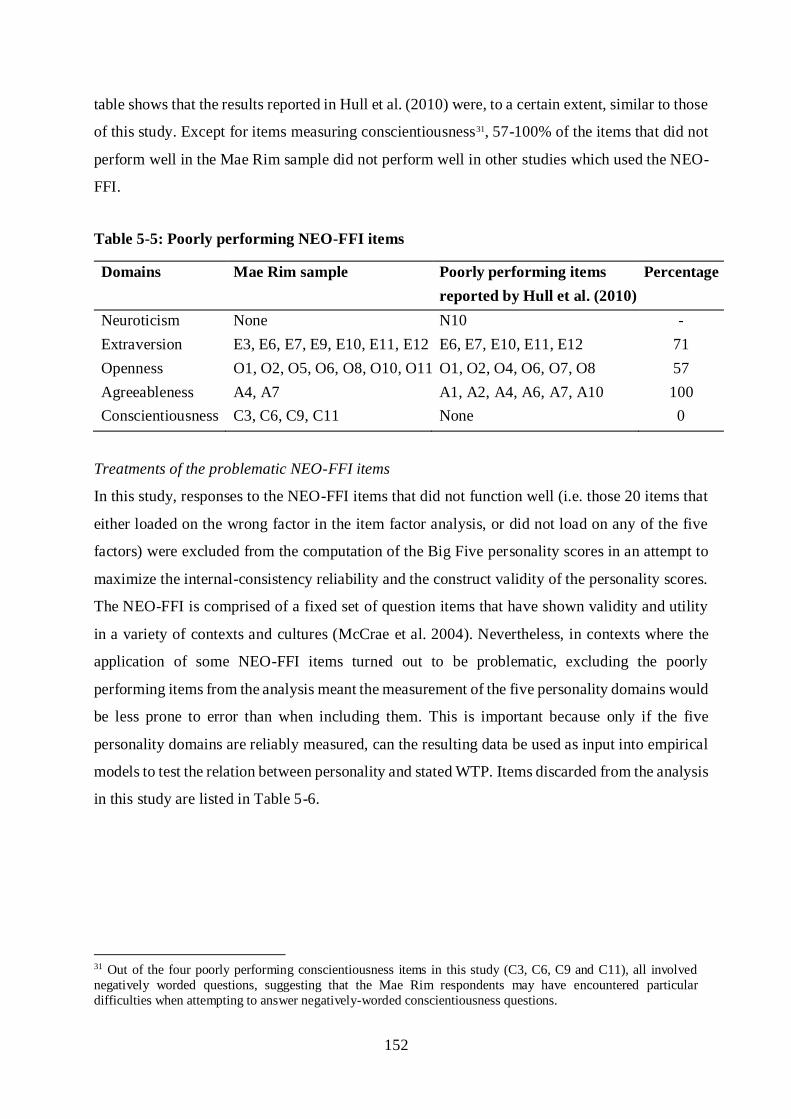
152
table shows that the results reported in Hull et al. (2010) were, to a certain extent, similar to those
of this study. Except for items measuring conscientiousness31, 57-100% of the items that did not
perform well in the Mae Rim sample did not perform well in other studies which used the NEO-
FFI.
Table 5-5: Poorly performing NEO-FFI items
Domains Mae Rim sample Poorly performing items
reported by Hull et al. (2010)
Percentage
Neuroticism None N10 -
Extraversion E3, E6, E7, E9, E10, E11, E12 E6, E7, E10, E11, E12 71
Openness O1, O2, O5, O6, O8, O10, O11 O1, O2, O4, O6, O7, O8 57
Agreeableness A4, A7 A1, A2, A4, A6, A7, A10 100
Conscientiousness C3, C6, C9, C11 None 0
Treatments of the problematic NEO-FFI items
In this study, responses to the NEO-FFI items that did not function well (i.e. those 20 items that
either loaded on the wrong factor in the item factor analysis, or did not load on any of the five
factors) were excluded from the computation of the Big Five personality scores in an attempt to
maximize the internal-consistency reliability and the construct validity of the personality scores.
The NEO-FFI is comprised of a fixed set of question items that have shown validity and utility
in a variety of contexts and cultures (McCrae et al. 2004). Nevertheless, in contexts where the
application of some NEO-FFI items turned out to be problematic, excluding the poorly
performing items from the analysis meant the measurement of the five personality domains would
be less prone to error than when including them. This is important because only if the five
personality domains are reliably measured, can the resulting data be used as input into empirical
models to test the relation between personality and stated WTP. Items discarded from the analysis
in this study are listed in Table 5-6.
31 Out of the four poorly performing conscientiousness items in this study (C3, C6, C9 and C11), all involved
negatively worded questions, suggesting that the Mae Rim respondents may have encountered particular
difficulties when attempting to answer negatively-worded conscientiousness questions.
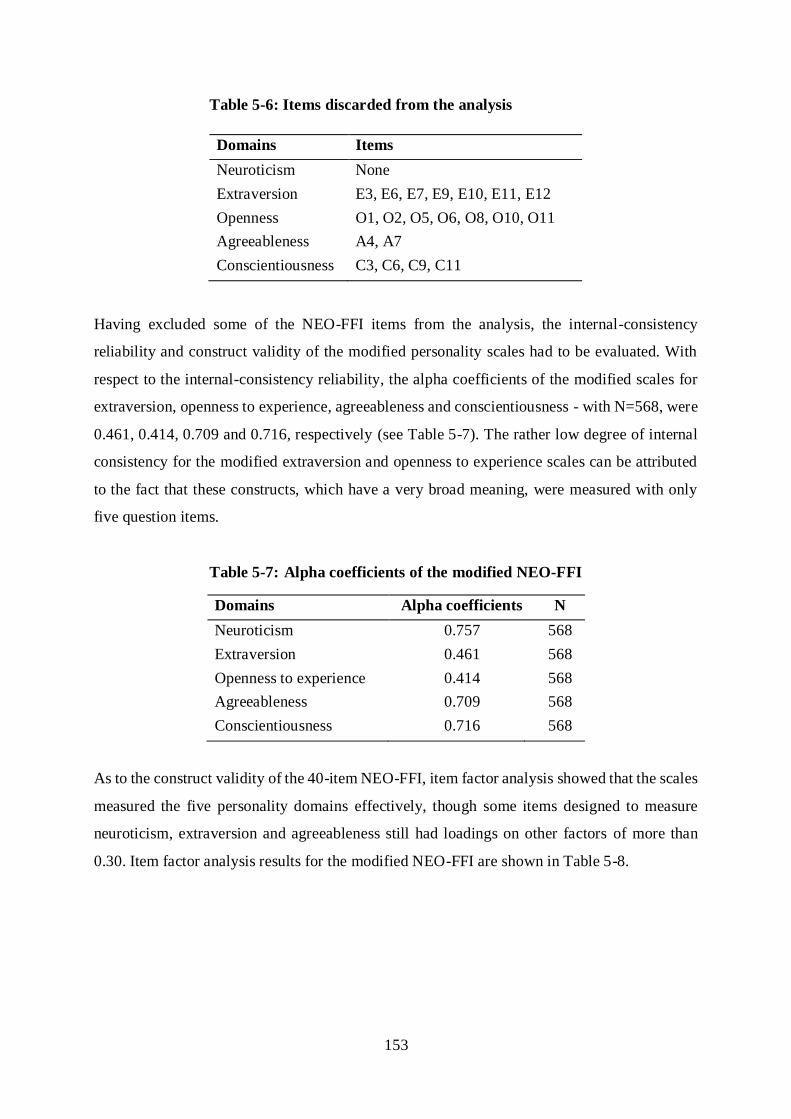
153
Table 5-6: Items discarded from the analysis
Having excluded some of the NEO-FFI items from the analysis, the internal-consistency
reliability and construct validity of the modified personality scales had to be evaluated. With
respect to the internal-consistency reliability, the alpha coefficients of the modified scales for
extraversion, openness to experience, agreeableness and conscientiousness - with N=568, were
0.461, 0.414, 0.709 and 0.716, respectively (see Table 5-7). The rather low degree of internal
consistency for the modified extraversion and openness to experience scales can be attributed
to the fact that these constructs, which have a very broad meaning, were measured with only
five question items.
Table 5-7: Alpha coefficients of the modified NEO-FFI
Domains Alpha coefficients N
Neuroticism 0.757 568
Extraversion 0.461 568
Openness to experience 0.414 568
Agreeableness 0.709 568
Conscientiousness 0.716 568
As to the construct validity of the 40-item NEO-FFI, item factor analysis showed that the scales
measured the five personality domains effectively, though some items designed to measure
neuroticism, extraversion and agreeableness still had loadings on other factors of more than
0.30. Item factor analysis results for the modified NEO-FFI are shown in Table 5-8.
Domains Items
Neuroticism None
Extraversion E3, E6, E7, E9, E10, E11, E12
Openness O1, O2, O5, O6, O8, O10, O11
Agreeableness A4, A7
Conscientiousness C3, C6, C9, C11
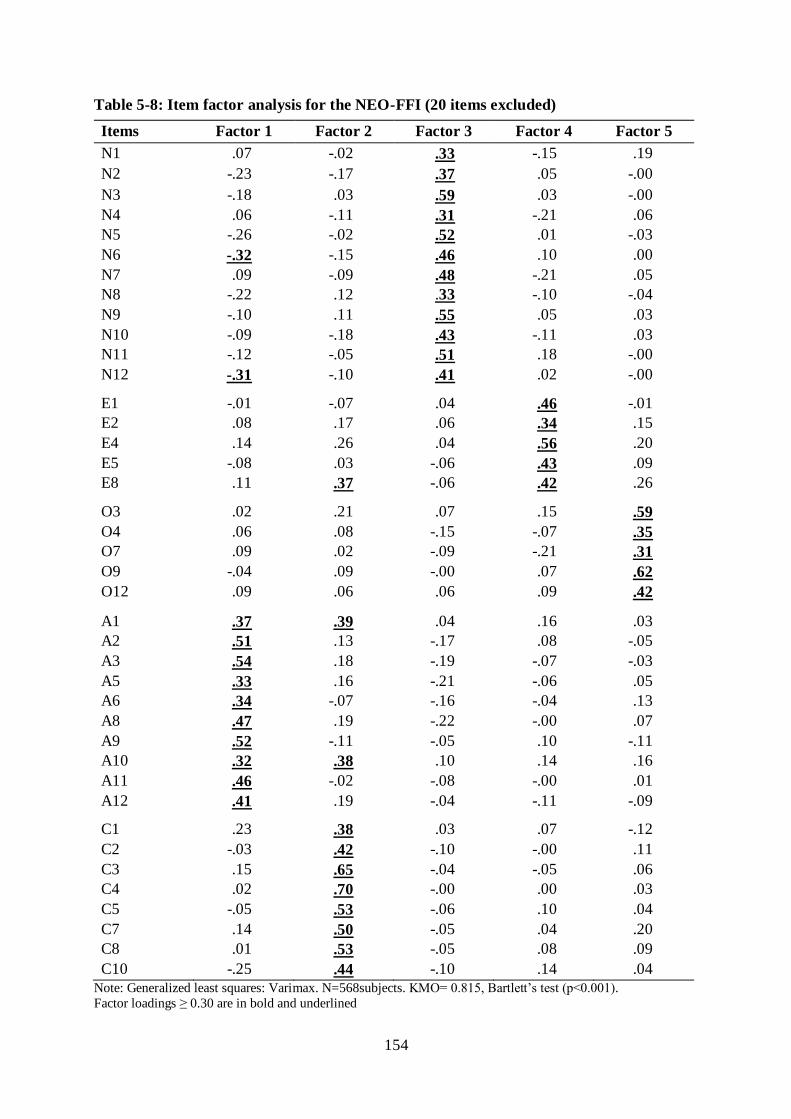
154
Table 5-8: Item factor analysis for the NEO-FFI (20 items excluded)
Items Factor 1 Factor 2 Factor 3 Factor 4 Factor 5
N1 .07 -.02 .33 -.15 .19
N2 -.23 -.17 .37 .05 -.00
N3 -.18 .03 .59 .03 -.00
N4 .06 -.11 .31 -.21 .06
N5 -.26 -.02 .52 .01 -.03
N6 -.32 -.15 .46 .10 .00
N7 .09 -.09 .48 -.21 .05
N8 -.22 .12 .33 -.10 -.04
N9 -.10 .11 .55 .05 .03
N10 -.09 -.18 .43 -.11 .03
N11 -.12 -.05 .51 .18 -.00
N12 -.31 -.10 .41 .02 -.00
E1 -.01 -.07 .04 .46 -.01
E2 .08 .17 .06 .34 .15
E4 .14 .26 .04 .56 .20
E5 -.08 .03 -.06 .43 .09
E8 .11 .37 -.06 .42 .26
O3 .02 .21 .07 .15 .59
O4 .06 .08 -.15 -.07 .35
O7 .09 .02 -.09 -.21 .31
O9 -.04 .09 -.00 .07 .62
O12 .09 .06 .06 .09 .42
A1 .37 .39 .04 .16 .03
A2 .51 .13 -.17 .08 -.05
A3 .54 .18 -.19 -.07 -.03
A5 .33 .16 -.21 -.06 .05
A6 .34 -.07 -.16 -.04 .13
A8 .47 .19 -.22 -.00 .07
A9 .52 -.11 -.05 .10 -.11
A10 .32 .38 .10 .14 .16
A11 .46 -.02 -.08 -.00 .01
A12 .41 .19 -.04 -.11 -.09
C1 .23 .38 .03 .07 -.12
C2 -.03 .42 -.10 -.00 .11
C3 .15 .65 -.04 -.05 .06
C4 .02 .70 -.00 .00 .03
C5 -.05 .53 -.06 .10 .04
C7 .14 .50 -.05 .04 .20
C8 .01 .53 -.05 .08 .09
C10 -.25 .44 -.10 .14 .04
Note: Generalized least squares: Varimax. N=568subjects. KMO= 0.815, Bartlett’s test (p<0.001).
Factor loadings ≥ 0.30 are in bold and underlined
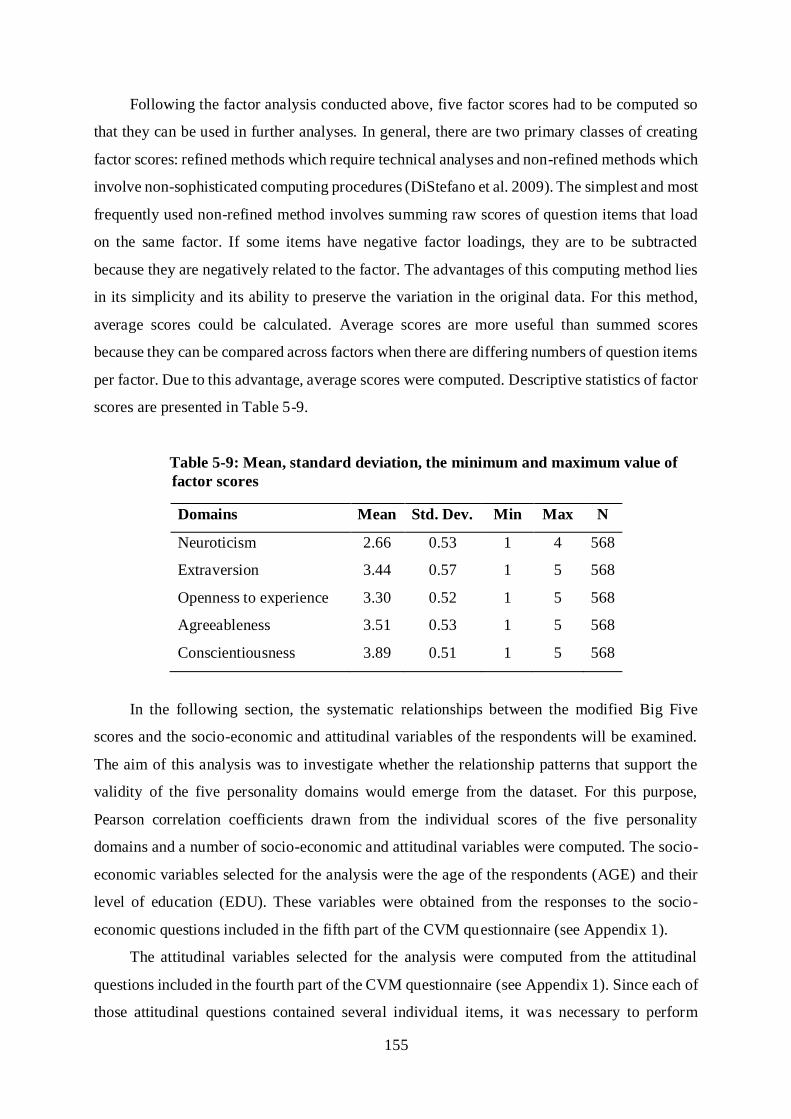
155
Following the factor analysis conducted above, five factor scores had to be computed so
that they can be used in further analyses. In general, there are two primary classes of creating
factor scores: refined methods which require technical analyses and non-refined methods which
involve non-sophisticated computing procedures (DiStefano et al. 2009). The simplest and most
frequently used non-refined method involves summing raw scores of question items that load
on the same factor. If some items have negative factor loadings, they are to be subtracted
because they are negatively related to the factor. The advantages of this computing method lies
in its simplicity and its ability to preserve the variation in the original data. For this method,
average scores could be calculated. Average scores are more useful than summed scores
because they can be compared across factors when there are differing numbers of question items
per factor. Due to this advantage, average scores were computed. Descriptive statistics of factor
scores are presented in Table 5-9.
Table 5-9: Mean, standard deviation, the minimum and maximum value of
factor scores
Domains Mean Std. Dev. Min Max N
Neuroticism 2.66 0.53 1 4 568
Extraversion 3.44 0.57 1 5 568
Openness to experience 3.30 0.52 1 5 568
Agreeableness 3.51 0.53 1 5 568
Conscientiousness 3.89 0.51 1 5 568
In the following section, the systematic relationships between the modified Big Five
scores and the socio-economic and attitudinal variables of the respondents will be examined.
The aim of this analysis was to investigate whether the relationship patterns that support the
validity of the five personality domains would emerge from the dataset. For this purpose,
Pearson correlation coefficients drawn from the individual scores of the five personality
domains and a number of socio-economic and attitudinal variables were computed. The socio-
economic variables selected for the analysis were the age of the respondents (AGE) and their
level of education (EDU). These variables were obtained from the responses to the socio-
economic questions included in the fifth part of the CVM questionnaire (see Appendix 1).
The attitudinal variables selected for the analysis were computed from the attitudinal
questions included in the fourth part of the CVM questionnaire (see Appendix 1). Since each of
those attitudinal questions contained several individual items, it was necessary to perform
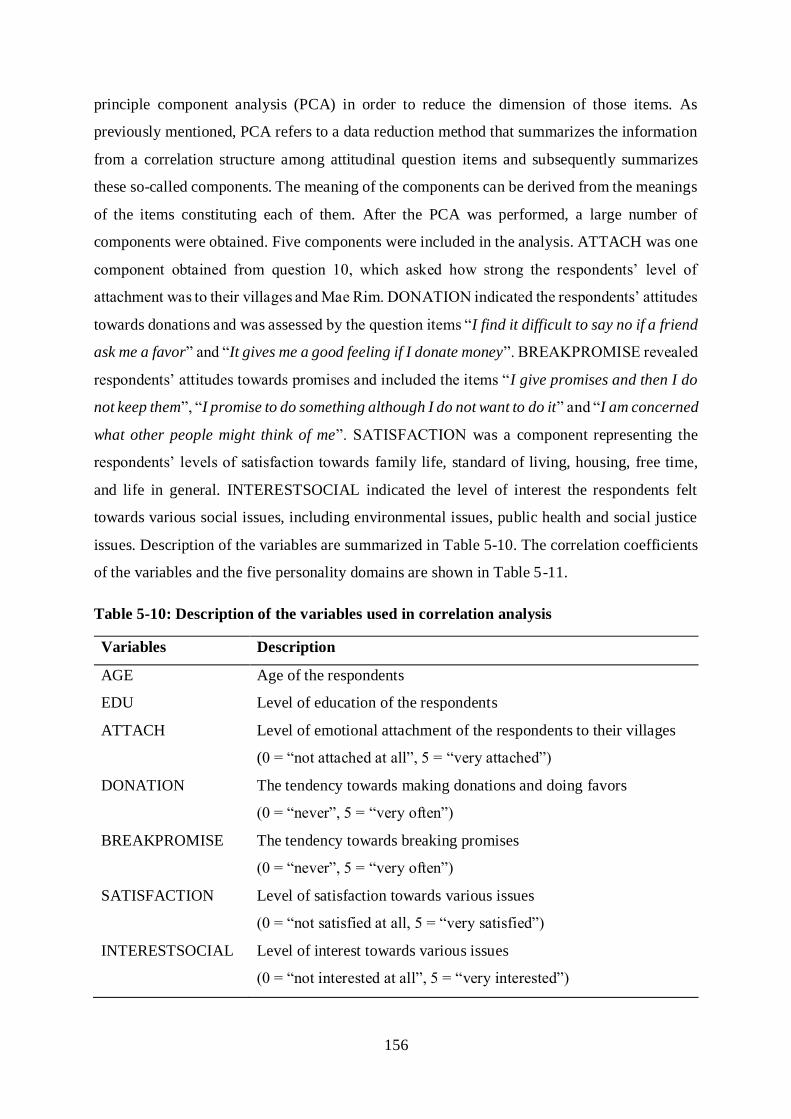
156
principle component analysis (PCA) in order to reduce the dimension of those items. As
previously mentioned, PCA refers to a data reduction method that summarizes the information
from a correlation structure among attitudinal question items and subsequently summarizes
these so-called components. The meaning of the components can be derived from the meanings
of the items constituting each of them. After the PCA was performed, a large number of
components were obtained. Five components were included in the analysis. ATTACH was one
component obtained from question 10, which asked how strong the respondents’ level of
attachment was to their villages and Mae Rim. DONATION indicated the respondents’ attitudes
towards donations and was assessed by the question items “I find it difficult to say no if a friend
ask me a favor” and “It gives me a good feeling if I donate money”. BREAKPROMISE revealed
respondents’ attitudes towards promises and included the items “I give promises and then I do
not keep them”, “I promise to do something although I do not want to do it” and “I am concerned
what other people might think of me”. SATISFACTION was a component representing the
respondents’ levels of satisfaction towards family life, standard of living, housing, free time,
and life in general. INTERESTSOCIAL indicated the level of interest the respondents felt
towards various social issues, including environmental issues, public health and social justice
issues. Description of the variables are summarized in Table 5-10. The correlation coefficients
of the variables and the five personality domains are shown in Table 5-11.
Table 5-10: Description of the variables used in correlation analysis
Variables Description
AGE Age of the respondents
EDU Level of education of the respondents
ATTACH Level of emotional attachment of the respondents to their villages
(0 = “not attached at all”, 5 = “very attached”)
DONATION The tendency towards making donations and doing favors
(0 = “never”, 5 = “very often”)
BREAKPROMISE The tendency towards breaking promises
(0 = “never”, 5 = “very often”)
SATISFACTION Level of satisfaction towards various issues
(0 = “not satisfied at all, 5 = “very satisfied”)
INTERESTSOCIAL Level of interest towards various issues
(0 = “not interested at all”, 5 = “very interested”)
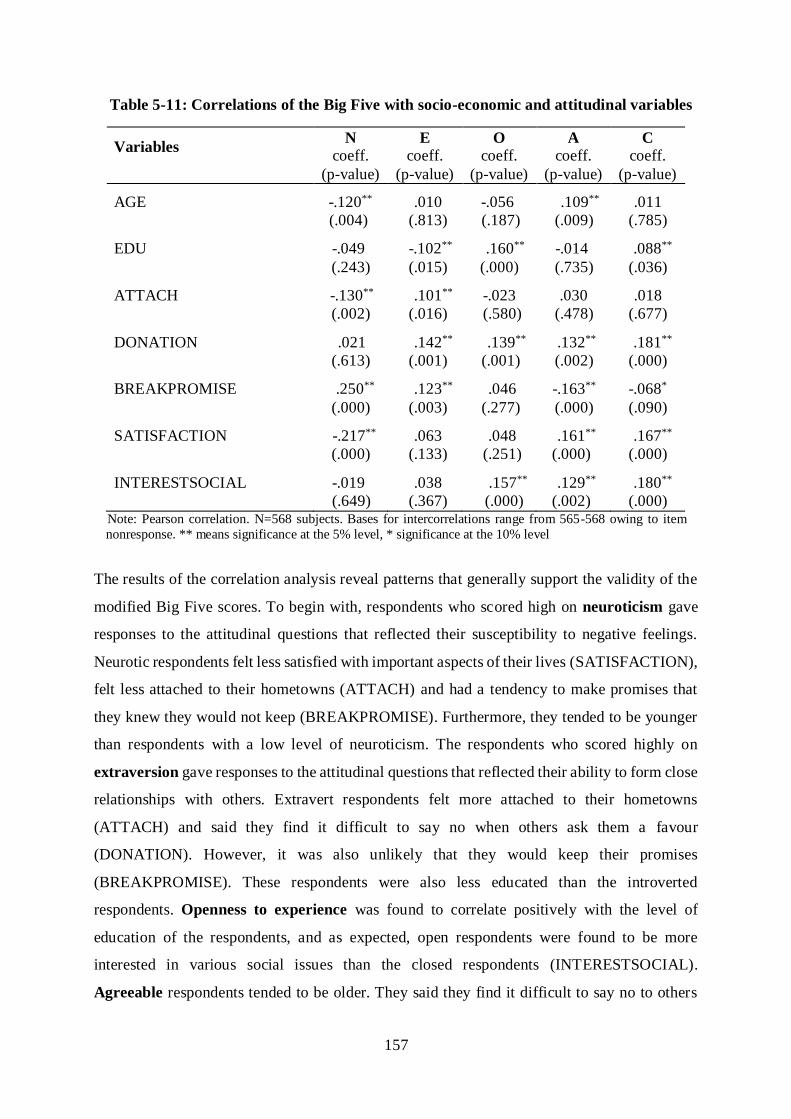
157
Table 5-11: Correlations of the Big Five with socio-economic and attitudinal variables
Variables N
coeff.
(p-value)
E
coeff.
(p-value)
O
coeff.
(p-value)
A
coeff.
(p-value)
C
coeff.
(p-value)
AGE -.120**
(.004)
.010
(.813)
-.056
(.187)
.109**
(.009)
.011
(.785)
EDU -.049
(.243)
-.102**
(.015)
.160**
(.000)
-.014
(.735)
.088**
(.036)
ATTACH -.130**
(.002)
.101**
(.016)
-.023
(.580)
.030
(.478)
.018
(.677)
DONATION .021
(.613)
.142**
(.001)
.139**
(.001)
.132**
(.002)
.181**
(.000)
BREAKPROMISE .250**
(.000)
.123**
(.003)
.046
(.277)
-.163**
(.000)
-.068*
(.090)
SATISFACTION -.217**
(.000)
.063
(.133)
.048
(.251)
.161**
(.000)
.167**
(.000)
INTERESTSOCIAL -.019
(.649)
.038
(.367)
.157**
(.000)
.129**
(.002)
.180**
(.000) Note: Pearson correlation. N=568 subjects. Bases for intercorrelations range from 565-568 owing to item
nonresponse. ** means significance at the 5% level, * significance at the 10% level
The results of the correlation analysis reveal patterns that generally support the validity of the
modified Big Five scores. To begin with, respondents who scored high on neuroticism gave
responses to the attitudinal questions that reflected their susceptibility to negative feelings.
Neurotic respondents felt less satisfied with important aspects of their lives (SATISFACTION),
felt less attached to their hometowns (ATTACH) and had a tendency to make promises that
they knew they would not keep (BREAKPROMISE). Furthermore, they tended to be younger
than respondents with a low level of neuroticism. The respondents who scored highly on
extraversion gave responses to the attitudinal questions that reflected their ability to form close
relationships with others. Extravert respondents felt more attached to their hometowns
(ATTACH) and said they find it difficult to say no when others ask them a favour
(DONATION). However, it was also unlikely that they would keep their promises
(BREAKPROMISE). These respondents were also less educated than the introverted
respondents. Openness to experience was found to correlate positively with the level of
education of the respondents, and as expected, open respondents were found to be more
interested in various social issues than the closed respondents (INTERESTSOCIAL).
Agreeable respondents tended to be older. They said they find it difficult to say no to others
158
(DONATION). But, unlike the extraverts, agreeable respondents were less likely to break their
promises once they made them (BREAKPROMISE). This self-reported form of reliability was
also found among conscientious respondents, who tended to be highly educated.
In summary, evidence regarding the internal-consistency reliability and validity of the
modified NEO-FFI scores suggested that these scores measured what they claim to measure,
that is, the five personality domains, and therefore they can be employed in the analysis of the
relationships between the Big Five domains and the WTP statements to be conducted in the
next section.
5.2.3 Effects of the five personality domains on WTP statements: Empirical
evidence
The main objective of this study was to investigate the effects of the Big Five personality domains
on WTP statements in contingent valuation surveys. The theoretical foundation for this
investigation was developed in Chapter 4, which described how insights obtained from the Big
Five model were integrated into the CVM framework and the theoretical predictions regarding
the effects of each of the five personality domains on WTP statements. The empirical
measurement of the domains using the NEO-FFI, as presented in the last section, resulted in
domain scores which could then be used to test the theoretical predictions made previously. The
results of this empirical test constitute the main content of this section.
The investigation described in this section made use of the probit and tobit regression
models for the WTP decisions introduced in section 2.3.2. Based on these models, those variables
that were systematically associated with the stated WTPs, i.e. the WTP determinants, could be
identified. In order to test if the Big Five personality domains are a determinant of WTP
statements, the Big Five scales were included as the core independent variables of the probit and
tobit regression models. In addition, several socio-economic and attitudinal variables were also
included in the models, for two reasons, first, so that their effects on WTP statements could be
controlled, and two, so that it would be possible to check for the plausibility of the WTP
statements. Plausible WTP data formed an important basis for an analysis of the relationship
between personality and WTP statements, but as previously discussed, one of the main difficulties
arising from the hypothetical nature of the CVM is the lack of any criterion able to be used to
verify its results. By making predictions on how certain respondent characteristics would affect
the stated WTP, the CVM results could be validated to a certain extent. In the following section,
159
the socio-economic and attitudinal variables that were included in the probit and tobit models
will be introduced, and their expected influence on the stated WTPs will be discussed.
To begin with, general socio-economic variables such as the sex and age of the respondents
(SEX and AGE) were expected to vary systematically with stated WTP, whereas the number of
people in the household (HHSIZE) was expected to positively influence stated WTP. This was
due to the fact that a household with more members would be likely to receive more benefits
from an environmental project than a household with fewer members. Furthermore, respondents
with a higher level of education and income (EDU and INCOME) were expected to be willing to
contribute more to the tap water improvement program. The same was expected of respondents
who spent more on bottled water each month (BOTTBILL), as they were likely to benefit more
from the drinkable tap water. Note that the above-mentioned socio-economic variables were
obtained directly from responses to the questions contained in the fourth part of the CVM
questionnaire (see Appendix 1).
Unlike the socio-economic variables presented above, the attitudinal variables could not be
obtained from the attitudinal questions, because each attitudinal question contained many small
question items. As a result, it was necessary to conduct principle component analysis to reduce
the question items’ dimensions to a smaller number of factors. In total, three extracted factors
were included in the probit and tobit regression models. The first factor - WORRY, represented
the extent to which respondents were worried about the ailments and diseases they could contract
from the consumption of contaminated tap water (such as diarrhea, kidney stones and cancer).
The more respondents worried about their tap water quality, the more they could be expected to
want to pay for the water improvement program. So, a positive coefficient of WORRY was
anticipated. The second and third factors (BENEFIT and PROTEST) were extracted from
question 8 concerning the reasons for the WTP decisions (Appendix 1), where BENEFIT referred
to the various private and public benefits resulting from the program, and PROTEST represented
items that assessed the respondents’ views on protesting (including: “I have severe doubts that
these improvements can be realized as described”, “I think government is responsible for such a
program and should pay for it”, and “My water costs are already high enough; we should receive
the good quality service without additional costs”). Respondents who expected more benefits
from the program could be expected to contribute more; with the opposite expected of those who
scored highly on the protest belief. Therefore, the coefficients of BENEFIT and PROTEST were
expected to be positive and negative, respectively. Description of the variables used in this
analysis are summarized in Table 5-12.
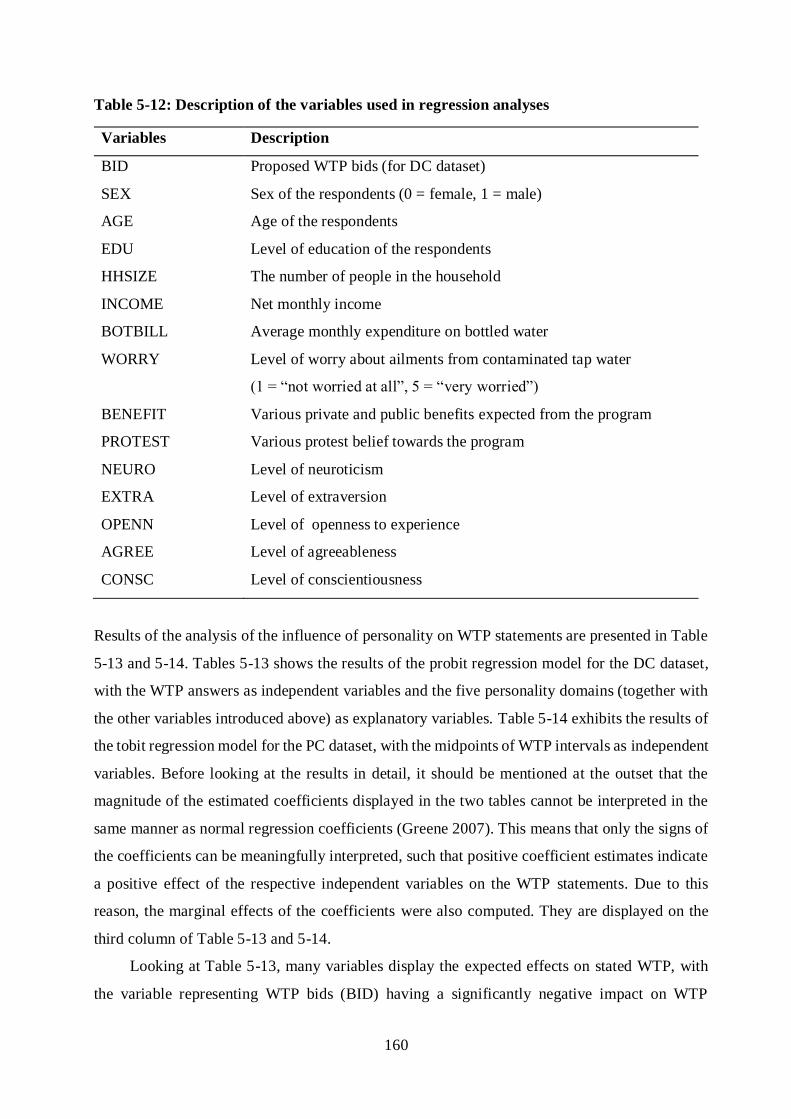
160
Table 5-12: Description of the variables used in regression analyses
Variables Description
BID Proposed WTP bids (for DC dataset)
SEX Sex of the respondents (0 = female, 1 = male)
AGE Age of the respondents
EDU Level of education of the respondents
HHSIZE The number of people in the household
INCOME Net monthly income
BOTBILL Average monthly expenditure on bottled water
WORRY Level of worry about ailments from contaminated tap water
(1 = “not worried at all”, 5 = “very worried”)
BENEFIT Various private and public benefits expected from the program
PROTEST Various protest belief towards the program
NEURO Level of neuroticism
EXTRA Level of extraversion
OPENN Level of openness to experience
AGREE Level of agreeableness
CONSC Level of conscientiousness
Results of the analysis of the influence of personality on WTP statements are presented in Table
5-13 and 5-14. Tables 5-13 shows the results of the probit regression model for the DC dataset,
with the WTP answers as independent variables and the five personality domains (together with
the other variables introduced above) as explanatory variables. Table 5-14 exhibits the results of
the tobit regression model for the PC dataset, with the midpoints of WTP intervals as independent
variables. Before looking at the results in detail, it should be mentioned at the outset that the
magnitude of the estimated coefficients displayed in the two tables cannot be interpreted in the
same manner as normal regression coefficients (Greene 2007). This means that only the signs of
the coefficients can be meaningfully interpreted, such that positive coefficient estimates indicate
a positive effect of the respective independent variables on the WTP statements. Due to this
reason, the marginal effects of the coefficients were also computed. They are displayed on the
third column of Table 5-13 and 5-14.
Looking at Table 5-13, many variables display the expected effects on stated WTP, with
the variable representing WTP bids (BID) having a significantly negative impact on WTP
161
answers. This result is plausible since the higher the proposed bids, the less likely it was that
respondents would want to pay for them. Furthermore, age of the respondent (AGE) had a
negative effect on the stated WTP. This result is in line with expectations and means that the
older the respondents, the less likely they were to be willing to pay for the proposed program.
This could be attributed to the fact that elderly people usually expect fewer benefits from an
environmental project whose impacts are not immediate and that may only be generated in the
far future. Next, the coefficients of both INCOME and BOTTBILL are significantly positive, as
expected. Households with a higher level of income systematically had a higher WTP, and
households with higher monthly bottled water expenses expected more benefits from the tap
water improvement program, and as a result, were willing to pay more to support the program.
As to the attitudinal variables, both WORRY and BENEFIT exhibited a positive association with
the stated WTP, in other words, respondents who were more worried about the quality of their
tap water and expected more benefits to be created by the program, were more likely to be willing
to pay for it. PROTEST had a significantly negative effect on the stated WTP, suggesting that
households who did not agree with the scenario tended to pay less. All in all, these effects confirm
the prior expectations and confirm the plausibility of the elicited WTP.
When it comes to the effects of the five personality domains on the stated WTP, it is
apparent that some of the five personality domains were statistically significant variables in
explaining the systematic variations of WTP answers. More specifically, openness to experience
(OPENN) had a strongly significant and positive effect on WTP answers, as did
conscientiousness (CONSC) but to a lesser degree, at only a 5% level. Therefore, the first,
important finding is that respondents’ openness to experience and conscientiousness could
explain the stated WTP levels above and beyond the controlled socio-economic and attitudinal
variables. In other words, after controlling for the effects of the variables sex, age, education,
number of household members, income levels, worries over water quality, reasons for the
contribution, and reasons for disagreement with the project scenario, respondents’ WTP
statements were determined to a significant degree by their personality domains openness to
experience and conscientiousness. This result supports hypothesis 4 - that respondents a high
level of openness to experience are more likely to state a significantly higher WTP than
respondents with a low level of openness to experience. The result, however, contradicts
hypothesis 6 - that conscientiousness does not have an effect on WTP statements. In particular,
the evidence here suggests that respondents a high level of conscientiousness are more likely to
state a significantly higher WTP than respondents with a low level of conscientiousness.
162
The second important finding here is that not all five personality domains exhibited a direct
association with stated WTP. More specifically, the expected relationships between neuroticism
(NEURO), extraversion (EXTRA) and agreeableness (AGREE) on the one hand and the WTP
answers on the other could not be confirmed by using this probit model for the DC dataset. The
lack of statistical significance for the three personality domains holds true even in a reduced
regression model excluding all other socio-economic and attitudinal variables. This indicates that
no relationships could be detected between stated WTP and the neuroticism, extraversion and
agreeableness scores, even if such a relationship was only spurious, as induced by confounding
variables. As a result, on the basis of this finding it is not possible to confirm hypotheses 2, 3 or
5. These two tentative findings were further tested in the PC version of the CVM survey.
Looking at the marginal effects of the explanatory variables in the DC model, a 1000-baht
increase in the WTP bids (BID) decreases the probability that the respondents will accept the bids
by 144 percentage points. At the same time, a 1000-baht increase in the net monthly income
(INCOME) increases the probability that the respondents will accept the proposed bids by 3
percentage points. A one-unit increase in openness to experience (OPENN) and
conscientiousness scores (CONSC) will increase the probability that the respondents will accept
the proposed bids by nine and fourteen percentage points respectively.
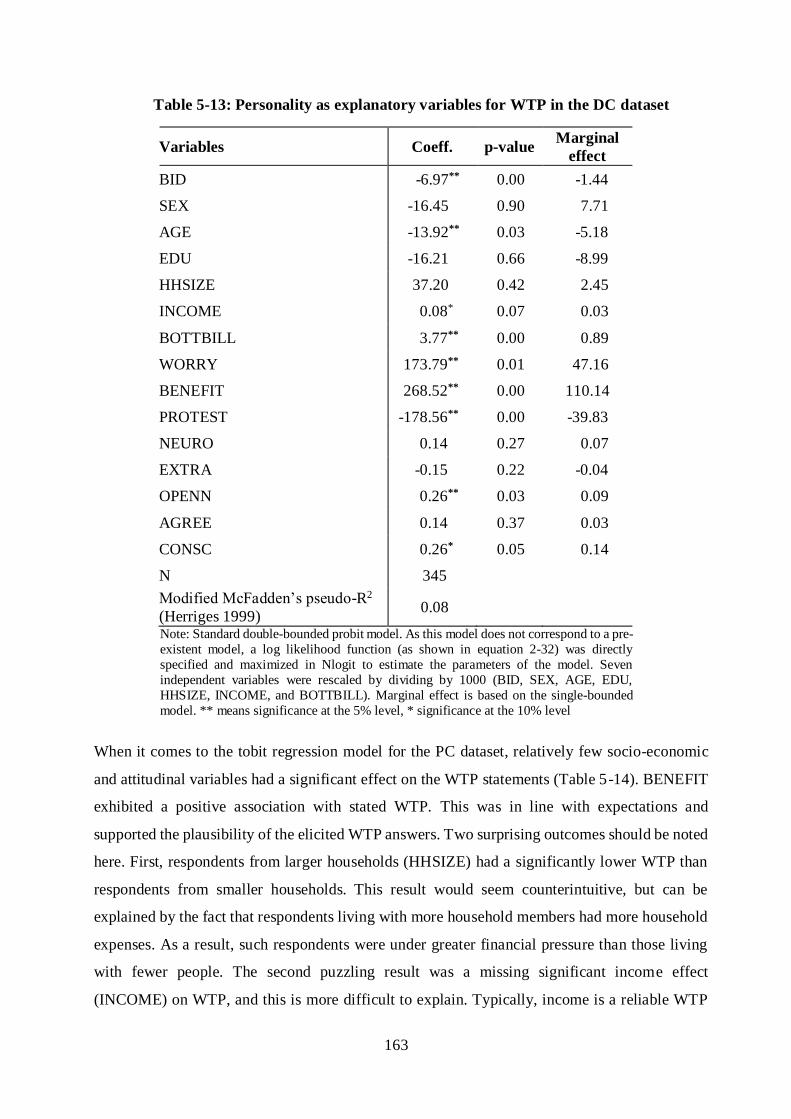
163
Table 5-13: Personality as explanatory variables for WTP in the DC dataset
Variables Coeff. p-value Marginal
effect
BID -6.97** 0.00 -1.44
SEX -16.45 0.90 7.71
AGE -13.92** 0.03 -5.18
EDU -16.21 0.66 -8.99
HHSIZE 37.20 0.42 2.45
INCOME 0.08* 0.07 0.03
BOTTBILL 3.77** 0.00 0.89
WORRY 173.79** 0.01 47.16
BENEFIT 268.52** 0.00 110.14
PROTEST -178.56** 0.00 -39.83
NEURO 0.14 0.27 0.07
EXTRA -0.15 0.22 -0.04
OPENN 0.26** 0.03 0.09
AGREE 0.14 0.37 0.03
CONSC 0.26* 0.05 0.14
N 345
Modified McFadden’s pseudo-R2
(Herriges 1999) 0.08
Note: Standard double-bounded probit model. As this model does not correspond to a pre-
existent model, a log likelihood function (as shown in equation 2-32) was directly
specified and maximized in Nlogit to estimate the parameters of the model. Seven
independent variables were rescaled by dividing by 1000 (BID, SEX, AGE, EDU,
HHSIZE, INCOME, and BOTTBILL). Marginal effect is based on the single-bounded
model. ** means significance at the 5% level, * significance at the 10% level
When it comes to the tobit regression model for the PC dataset, relatively few socio-economic
and attitudinal variables had a significant effect on the WTP statements (Table 5-14). BENEFIT
exhibited a positive association with stated WTP. This was in line with expectations and
supported the plausibility of the elicited WTP answers. Two surprising outcomes should be noted
here. First, respondents from larger households (HHSIZE) had a significantly lower WTP than
respondents from smaller households. This result would seem counterintuitive, but can be
explained by the fact that respondents living with more household members had more household
expenses. As a result, such respondents were under greater financial pressure than those living
with fewer people. The second puzzling result was a missing significant income effect
(INCOME) on WTP, and this is more difficult to explain. Typically, income is a reliable WTP
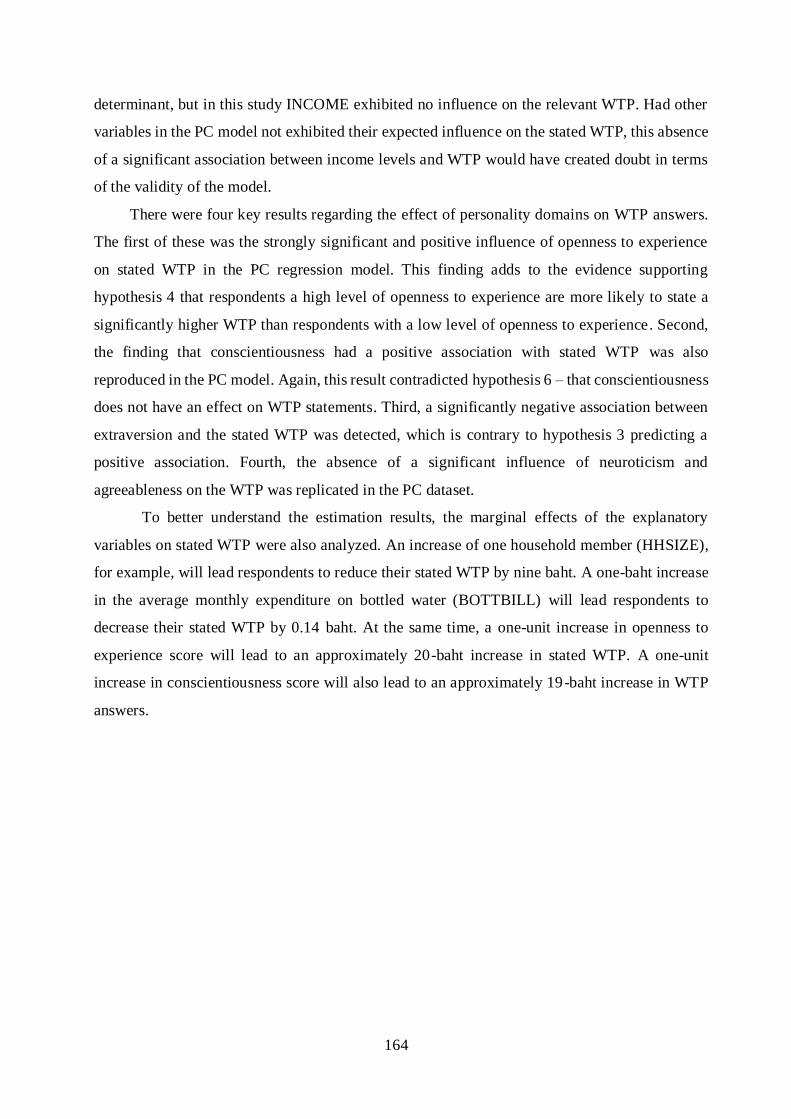
164
determinant, but in this study INCOME exhibited no influence on the relevant WTP. Had other
variables in the PC model not exhibited their expected influence on the stated WTP, this absence
of a significant association between income levels and WTP would have created doubt in terms
of the validity of the model.
There were four key results regarding the effect of personality domains on WTP answers.
The first of these was the strongly significant and positive influence of openness to experience
on stated WTP in the PC regression model. This finding adds to the evidence supporting
hypothesis 4 that respondents a high level of openness to experience are more likely to state a
significantly higher WTP than respondents with a low level of openness to experience. Second,
the finding that conscientiousness had a positive association with stated WTP was also
reproduced in the PC model. Again, this result contradicted hypothesis 6 – that conscientiousness
does not have an effect on WTP statements. Third, a significantly negative association between
extraversion and the stated WTP was detected, which is contrary to hypothesis 3 predicting a
positive association. Fourth, the absence of a significant influence of neuroticism and
agreeableness on the WTP was replicated in the PC dataset.
To better understand the estimation results, the marginal effects of the explanatory
variables on stated WTP were also analyzed. An increase of one household member (HHSIZE),
for example, will lead respondents to reduce their stated WTP by nine baht. A one-baht increase
in the average monthly expenditure on bottled water (BOTTBILL) will lead respondents to
decrease their stated WTP by 0.14 baht. At the same time, a one-unit increase in openness to
experience score will lead to an approximately 20-baht increase in stated WTP. A one-unit
increase in conscientiousness score will also lead to an approximately 19-baht increase in WTP
answers.
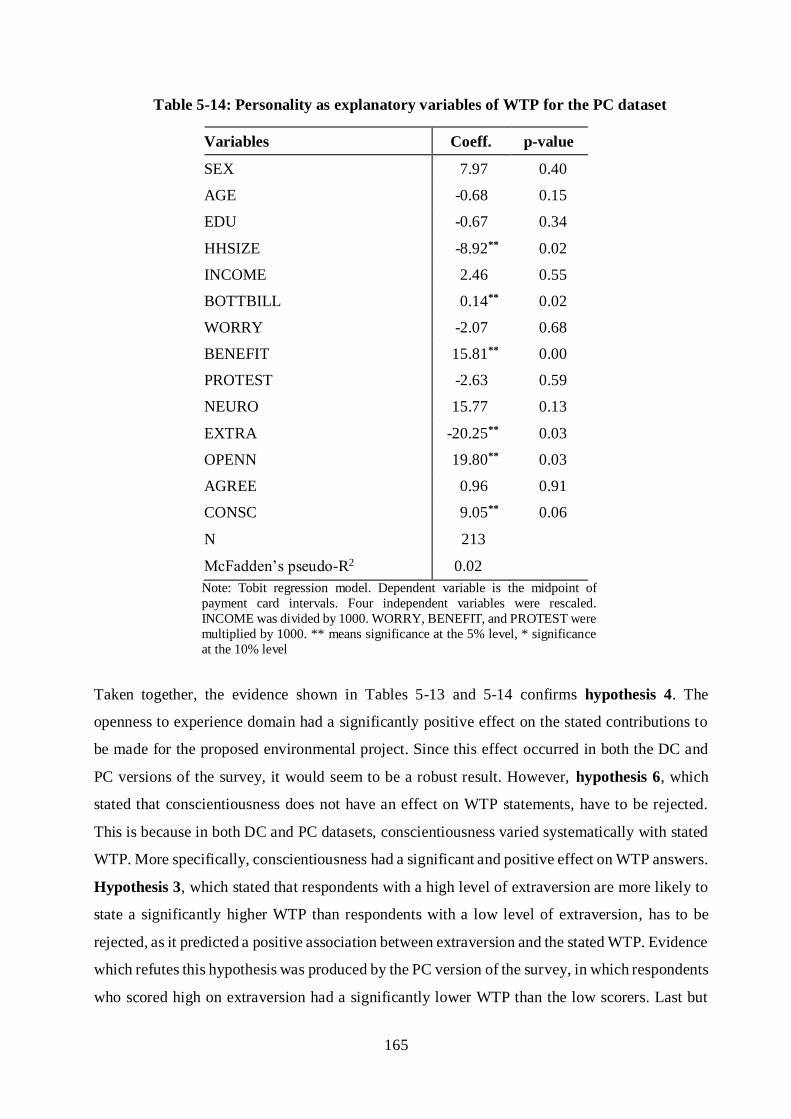
165
Table 5-14: Personality as explanatory variables of WTP for the PC dataset
Variables Coeff. p-value
SEX 7.97 0.40
AGE -0.68 0.15
EDU -0.67 0.34
HHSIZE -8.92** 0.02
INCOME 2.46 0.55
BOTTBILL 0.14** 0.02
WORRY -2.07 0.68
BENEFIT 15.81** 0.00
PROTEST -2.63 0.59
NEURO 15.77 0.13
EXTRA -20.25** 0.03
OPENN 19.80** 0.03
AGREE 0.96 0.91
CONSC 9.05** 0.06
N 213
McFadden’s pseudo-R2 0.02
Note: Tobit regression model. Dependent variable is the midpoint of
payment card intervals. Four independent variables were rescaled.
INCOME was divided by 1000. WORRY, BENEFIT, and PROTEST were
multiplied by 1000. ** means significance at the 5% level, * significance
at the 10% level
Taken together, the evidence shown in Tables 5-13 and 5-14 confirms hypothesis 4. The
openness to experience domain had a significantly positive effect on the stated contributions to
be made for the proposed environmental project. Since this effect occurred in both the DC and
PC versions of the survey, it would seem to be a robust result. However, hypothesis 6, which
stated that conscientiousness does not have an effect on WTP statements, have to be rejected.
This is because in both DC and PC datasets, conscientiousness varied systematically with stated
WTP. More specifically, conscientiousness had a significant and positive effect on WTP answers.
Hypothesis 3, which stated that respondents with a high level of extraversion are more likely to
state a significantly higher WTP than respondents with a low level of extraversion, has to be
rejected, as it predicted a positive association between extraversion and the stated WTP. Evidence
which refutes this hypothesis was produced by the PC version of the survey, in which respondents
who scored high on extraversion had a significantly lower WTP than the low scorers. Last but
166
not least, hypotheses 2 and 5 could not be confirmed on the basis of the regression results of this
study. In both the DC and PC versions of the survey, neither neuroticism nor agreeableness had
a significant effect on the WTP statements. Before looking into these results in more detail, the
effects of the five personality domains on other CVM response behavior should be tested, those
predicted based on the insights obtained from the Big Five model (section 4.3).
In total, five theoretical predictions were made in section 4.3 with respect to the relation
between the five personality domains and different CVM response behavior. To start with,
neuroticism was expected to be an important determinant of protest belief. Next, a positive
association between extraversion and extreme response style was anticipated, because of the
exaggerated communication styles of the extraverts. Last but not least, openness to experience,
agreeableness and conscientiousness were expected to provide an intrinsic incentive among
respondents to answer the CVM questionnaire as carefully as possible. As a result, these three
personality domains were expected to positively affect the amount of time respondents used to
answer the questionnaires.
To test the theoretical predictions mentioned above, three OLS regressions using differing
response behavior as dependent variables were performed. The three dependent variables of
interest were protest belief, extreme response style, and time used for interview. These were
measured as follows. For protest belief, a “protest scale” (Meyerhoff and Liebe 2006) was
calculated by summing up the ratings interviewees gave on a five-point Likert scale to three
protest statements in the CVM questionnaire, these being: “I have severe doubts that these
improvements can be realized as described”, “I think the government is responsible for such a
program and should pay for it”, and “My water costs are already high enough we should receive
the good quality service without additional costs”. A higher protest score represented a stronger
protest against the proposed scenario. Extreme response style was measured by counting the
number of positive and negative extreme responses (Meisenberg and Williams 2008), such as
“strongly agree” and “strongly disagree”, that each respondent gave to all 78 question items
which contained the five-point Likert scale in the CVM questionnaire. The more often he or she
used the endpoints of the Likert scale, the higher the “extreme response score” each respondent
obtained. Finally, to record the timings of each interview, the interviewers were asked to record
the overall time each respondent needed to complete it.
The independent variables of the three regression models consisted of the Big Five scores
and a set of socio-economic variables. The regression results are shown in Table 5-15, and these
suggest that several of the socio-economic variables were important in determining the protest
beliefs and extreme response styles of the respondents, as well as the amount of time it took them
167
to complete each interview. Looking first at the determinants of the respondents’ protest beliefs,
the sex (SEX) and income (INCOME) coefficients were negative, meaning that those who were
male and had a higher income were less likely to hold protest belief. At the same time, the
education (EDU) and number of household member (HHSIZE) coefficients were both
significantly positive, indicating that respondents with a higher level of education and from larger
households were more likely to hold protest attitudes. EDU also had a significant and positive
effect on the respondents’ extreme response styles, while it had a significant and negative effect
on the amount of time respondents took to complete their interviews. Average monthly
expenditure on bottled water (BOTTBILL) coefficients was also significantly negative, meaning
that respondents who pay more for their bottled water per month used less time to complete their
interviews.
Turning now to evidence regarding the effects of the five personality domains, neuroticism
(NEURO) had a significant and positive effect on protest beliefs and, unexpectedly, so did
conscientiousness (CONSC). Extraversion did not seem to have any significant effect on extreme
responses, instead, positive and negative effects were displayed by conscientiousness and
neuroticism respectively. Ultimately, conscientiousness (CONSC) had the expected positive
influence on the amount of time each respondent took to complete the interview, while
extraversion (EXTRA) had a negative impact. These results will be discussed in more detail in
the next section.
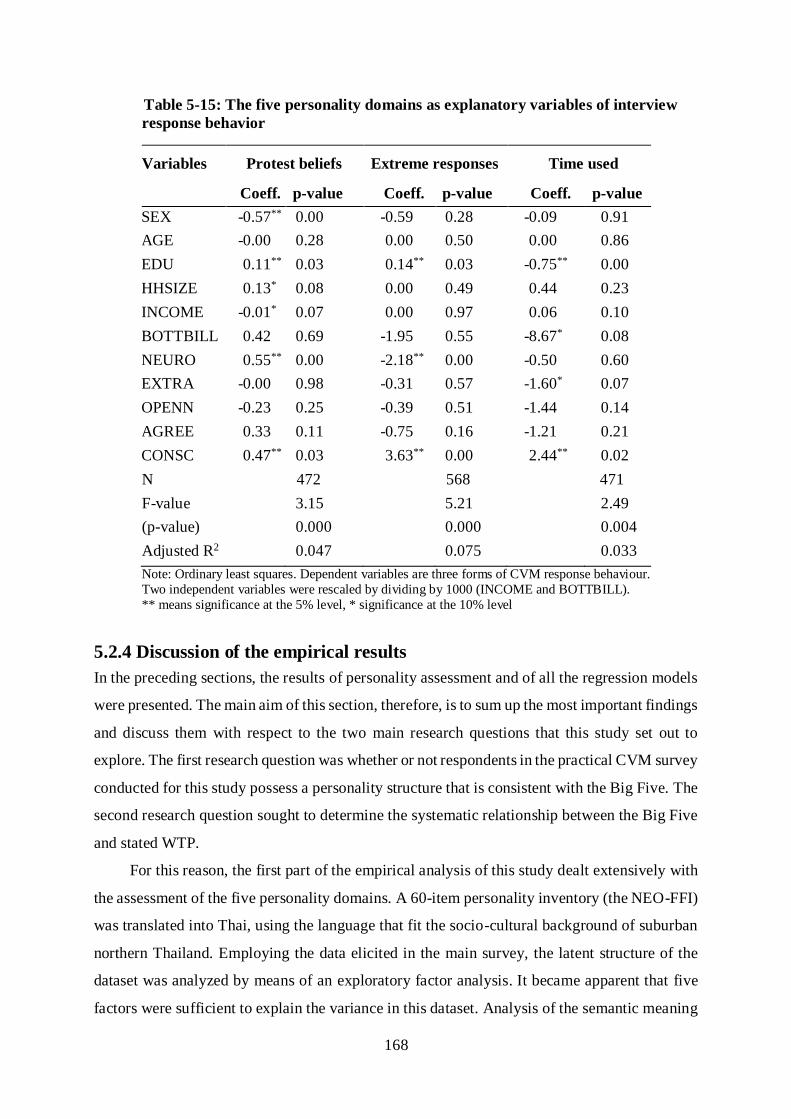
168
Table 5-15: The five personality domains as explanatory variables of interview
response behavior
Variables Protest beliefs Extreme responses Time used
Coeff. p-value Coeff. p-value Coeff. p-value
SEX -0.57** 0.00 -0.59 0.28 -0.09 0.91
AGE -0.00 0.28 0.00 0.50 0.00 0.86
EDU 0.11** 0.03 0.14** 0.03 -0.75** 0.00
HHSIZE 0.13* 0.08 0.00 0.49 0.44 0.23
INCOME -0.01* 0.07 0.00 0.97 0.06 0.10
BOTTBILL 0.42 0.69 -1.95 0.55 -8.67* 0.08
NEURO 0.55** 0.00 -2.18** 0.00 -0.50 0.60
EXTRA -0.00 0.98 -0.31 0.57 -1.60* 0.07
OPENN -0.23 0.25 -0.39 0.51 -1.44 0.14
AGREE 0.33 0.11 -0.75 0.16 -1.21 0.21
CONSC 0.47** 0.03 3.63** 0.00 2.44** 0.02
N 472 568 471
F-value 3.15 5.21 2.49
(p-value) 0.000 0.000 0.004
Adjusted R2 0.047 0.075 0.033
Note: Ordinary least squares. Dependent variables are three forms of CVM response behaviour.
Two independent variables were rescaled by dividing by 1000 (INCOME and BOTTBILL).
** means significance at the 5% level, * significance at the 10% level
5.2.4 Discussion of the empirical results
In the preceding sections, the results of personality assessment and of all the regression models
were presented. The main aim of this section, therefore, is to sum up the most important findings
and discuss them with respect to the two main research questions that this study set out to
explore. The first research question was whether or not respondents in the practical CVM survey
conducted for this study possess a personality structure that is consistent with the Big Five. The
second research question sought to determine the systematic relationship between the Big Five
and stated WTP.
For this reason, the first part of the empirical analysis of this study dealt extensively with
the assessment of the five personality domains. A 60-item personality inventory (the NEO-FFI)
was translated into Thai, using the language that fit the socio-cultural background of suburban
northern Thailand. Employing the data elicited in the main survey, the latent structure of the
dataset was analyzed by means of an exploratory factor analysis. It became apparent that five
factors were sufficient to explain the variance in this dataset. Analysis of the semantic meaning
169
of the five extracted factors revealed that their meanings corresponded satisfactorily to the Big
Five. As a result, hypothesis 1 which stated that CVM respondents possess a personality
structure that is consistent with the Big Five is supported and a further analysis of the systematic
relationship between the five personality domains and WTP answers in CVM is warranted.
Despite the fact that the NEO-FFI could satisfactorily distinguish between the five
personality factors which should theoretically be included in it, the results from exploratory
analysis revealed that many of its question items did not measure what they were designed to.
This finding of the present study is consistent with that of Hull et al. (2010) who also found that
many items of the NEO-FFI performed poorly across various socio-cultural settings. This
suggested that the items and not the samples or the cultural contexts are the source of the
problem. Since the inclusion of the poorly performing items in the subsequent analysis could
make the measurement of the five personality domains prone to error, responses to 20 poorly
performing items of the original inventory were excluded from further analysis. The remaining
empirical analysis of this first part focused on the reliability and validity of the 40-item version
of the inventory. The alpha coefficients of the modified scales indicated the 40-item scale to be
sufficiently reliable. On top of that, evidence of the modified scale’s construct validity was
documented by means of exploratory factor analysis and correlation analysis. It became clear
that the 40 question items functioned well in the current sample and that they were able to
actually distinguish between the five personality domains.
When it comes to the main part of the analysis, i.e. the testing of the relation between
personality and WTP answers, personality scores computed from these 40 items were used in
regression models to test the influence of personality on WTP statements in a CVM interview.
Many interesting results were obtained from which an improved understanding of different
patterns of WTP answering behavior stemming from individual differences in personality
characteristics of respondents can be gained. Neuroticism, to begin with, exhibited no effect
on WTP answers in both DC and PC regression models. Consequently, hypothesis 2 could
neither be confirmed nor rejected based on the present data. This finding was unexpected and
rather difficult to explain. Theoretical considerations made on the facets of neuroticism clearly
suggested that this personality domain can be expected to lead to the understating of WTP. This
result also differed from that reported by Soliño and Farizo (2014) who found that respondents
who possess a high level of neuroticism were less likely to choose the implementation of an
environmental program in a choice experiment survey. A possible explanation for the absence
of neuroticism effect on WTP answers may be that the neuroticism domain is too broad a
170
concept to predict the statement of WTP. It is conceivable that some facets of neuroticism may
produce unforeseen and contradictory effects on WTP statements.
It is possible, for example, that the facet of self-consciousness might cause respondents to
overstate their WTP instead of understating it as predicted in section 4.3.1. Individuals with a
high score on self-consciousness are those who are easily disturbed by awkward social
situations. Because of this, self-conscious individuals might avoid embarrassing themselves by
behaving according to what others deem as desirable. In the CVM context, the statement of zero
or low WTP for a public environmental good is likely to trigger social disapproval (Börger
2013). As a consequence, self-conscious respondents might be more likely to overstate their
WTP for the proposed environmental program independent of their valuation of it. This
hypothesis is in agreement with Börger’s (2013) findings which showed that CVM respondents
who are afraid of social disapproval in fact tend to overstate their WTP. If self-consciousness
did indeed cause the overstating of WTP, this effect could act against the effects of other facets
of neuroticism and explain the lack of the neuroticism effect on WTP answers in this study.
Yet, this is pure speculation and further research on the direct effect of neuroticism facets on
stated WTP in CVM survey is required.
Even though the neuroticism domain might be too broad to predict WTP answers, it
appeared to be at an appropriate level of abstractness when it comes to the prediction of other
CVM response behavior. More specifically, neuroticism exhibited a positive effect on protest
belief. This result collaborated the theoretical prediction made in section 4.3.1 and it indicated
that anxious respondents were more likely to have a strong protest attitude towards the tap water
improvement program than calm respondents. This finding, while preliminary, suggested that
neurotics were likely to state WTP that constitutes some mix of preference evaluation and
protest beliefs, which is of course not desirable from the perspective of the CVM practitioner.
Furthermore, neuroticism also showed a negative relation with extreme responses. This meant
that high scorers on neuroticism selected the middle response options of the Likert scales
regardless of the content of the question. This result implied that neurotics might not exert
enough effort into answering questions in CVM surveys. Taken together, it must be stated that
even though the effect of neuroticism on stated WTP could neither be completely confirmed
nor refuted, there were indications that neuroticism was a source of potential biases contained
in WTP answers. Further evidence on the existence and the exact form of neuroticism’s
influence on WTP is therefore necessary.
When it comes to the effect of extraversion on stated WTP, hypothesis 3 had to be
rejected. A negative association between extraversion and WTP answers was found in the PC
171
regression model. Extraversion had no impact on stated WTP when the DC question format was
used. One potential cause of this difference in results is the relatively small sample size of the
DC dataset (N=345). The DC elicitation question format requires a rather large sample size in
order to produce reliable results (Arrow et al. 1993). This might contribute to the difference in
results. The negative effect on WTP statements that extraversion displayed in the PC model was
surprising. It contradicted both the hypothesized impact and the result reported by Soliño and
Farizo (2014) who found that extraverts were more likely to prefer the implementation of an
environmental program in a choice experiment survey. The reason for this discrepancy in results
is quite unclear. A possible explanation might be the unforeseen negative effect of some facets
of extraversion on WTP statements. Consider the possibility that the facet of positive emotions
led respondents to understate their WTP instead of overstating it as predicted in section 4.3.2.
Respondents with a high score on positive emotions tended to be cheerful and optimistic.
Optimism, however, might cause extraverts to interpret both present and future situations in the
best possible light and thus perceive the proposed tap water improvement program as
unnecessary and understate their WTP as a result. This hypothesis is in line with the ideas of
Loewenstein and Lerner (2003), who suggested that positive emotions discourage individuals
to engage in a careful evaluation of the situation and trigger an overly optimistic judgment. If
positive emotions did cause the understatement of WTP, this effect could dominate the effect
of other facets and explain the negative effect of extraversion on stated WTP in PC regression
model. Yet again, this is merely a possible explanation and it should be investigated in future
studies.
Contrary to expectations, this study did not find a significant relationship between
extraversion and extreme response style. This result differed from that reported by Harzing
(2006) who hypothesized and found that extraversion was a strong determinant of extreme
response styles in many surveyed countries. The reason for this discrepancy in results could
stem from the different personality inventory. While Harzing (2006) employed the Eysenck
Personality Questionnaire (EPQ), this study used the NEO-FFI. On top of that, the present study
excluded seven extraversion items from the analysis due to their poor psychometric quality.
These are potential causes of the different in results. Extraversion, however, showed a negative
relation with the amount of time needed for the interview. This meant that high scorers on
extraversion used significantly less time to answer survey questions. This implied that
extraverts may not exert enough effort into answering questions in CVM surveys. Overall, while
the positive relationship between extraversion and stated WTP had to be rejected based on the
172
present data, it would be premature to dismiss the idea of extraversion as a source of biases of
WTP statements.
With respect to the relation between openness to experience and stated WTP, hypothesis
4 was confirmed. Because of their preference for and readiness to adopt novel activities, open-
minded individuals were expected to obtain a bigger welfare change resulting from the
environmental change scenario and consequently report a significantly higher WTP than close-
minded respondents. The results obtained from regression analyses clearly demonstrated the
positive association between openness to experience and stated WTP in both DC and PC
regression models. This was strong evidence suggesting that respondents with a high score on
openness to experience were indeed more likely to expect a higher level of welfare changes
from the proposed tap water improvement program and thereby reported a higher WTP answer
than respondents with a low score on openness to experience. This finding is in agreement with
Soliño and Farizo’s (2014) finding which showed that openness to experience positively affects
consumers’ preferences for an environmental program. On the basis of the evidence found in
this study, it is reasonable to suggest that openness to experience is an important personality
characteristic and it should be assessed in CVM surveys.
In contrast to the theoretical prediction made in section 4.3.3, openness to experience
turned out not to play any role for the amount of time respondents needed to answer survey
questions. As a result, the idea that openness to experience provided intrinsic incentive for CVM
respondents to exert more effort into answering the survey questions could neither be rejected
nor confirmed.
When it comes to the effect of agreeableness on stated WTP, hypothesis 5 could neither
be confirmed nor refuted. This hypothesis stated that CVM respondents with a high level of
agreeableness are more likely to state a significantly higher WTP than respondents with a low
level of agreeableness. The current study found that agreeableness exhibited no influence on
WTP statements in both DC and PC regression models. This result might be because agreeable
respondents were likely to have a protest attitude towards the tap water improvement program.
This relationship could be observed in the regression model displayed in Table 5-14. It should
be noted, however, that while the coefficient for agreeableness was positive, the observed effect
was slightly above the 10% significance level (p-value = 0.11). This protest attitude could act
against the positive effect of agreeableness and explain the absence of an agreeableness effect
on WTP answers. However, further work is required to establish this.
Hypothesis 6 which stated that conscientiousness does not affect WTP statements had to
be rejected on grounds of the present data. In both DC and PC models, conscientiousness
173
displayed a positive influence on the amount of WTP responses. This positive association
suggested that conscientious respondents had a higher preference for the proposed tap water
improvement scenario than respondents who score low on conscientiousness. This might be
because of the tendency to be cautious and deliberate of conscientious respondents that could
enable them to obtain a complete perception of the proposed tap water improvement program
and the benefits to be expected from it. Respondents with a low level of conscientiousness, in
contrast, might be less careful when they form the idea of the future benefits to be expected
from the project proposed and as a result obtain only a partial perception of the program and its
benefits. This conjecture was supported by the finding of Frör (2008) who reported that CVM
respondents who were effortful in their information processing and decision making stated a
higher WTP than respondents who relied on fast and effortless decision making style.
Apart from its impact on stated WTP, conscientiousness was also found to determine the
amount of time respondents used in the interview, the result which confirmed the prediction
made in chapter 4 and suggested that conscientious individuals exerted more effort into
considering and answering survey questions. Further, positive associations between
conscientiousness on the one hand and extreme response style and protest beliefs on the other
were detected. These impacts of conscientiousness were unexpected but they could also be
explained by the high level of effort that conscientious respondents put into the interview. The
attempt to carefully consider and evaluate the project scenario could lead conscientious
respondents to be more critical on certain aspects of the project than respondents with a low
level of conscientiousness. At the same time, respondents who were more cautious might feel
more confident in their decision making leading them to select the extreme response options of
the Likert scales. Taken together, these findings underscore the importance of conscientiousness
for explaining response behavior in CVM.
In conclusion, it must be stated that personality characteristics are an important factor that
determine response behavior in contingent valuation surveys. The amount of stated WTP is
determined by three personality domains which are extraversion, openness to experience, and
conscientiousness. While WTP statements are positively affected by openness to experience
and conscientiousness, they are negatively biased by extraversion. Agreeableness appears not
to be associated with WTP answers in this study. Neuroticism, despite being unrelated to stated
WTP on the domain level, negatively influences many forms of response behavior and is
expected to be an important WTP determinant on the facet level.

174
175
Chapter 6 Summary and conclusions
The purpose of the current study was to scrutinize the role of personality for systematic
distortions of WTP answers in contingent valuation surveys. Although the existence of
systematically distorted responses in CVM surveys has long been acknowledged, reasons for
their occurrence have been attributed mainly to the components of the CVM survey instrument,
which trigger the disturbing effects on the WTP answers. Little attention has been paid,
however, to the psychological characteristics of survey respondents, which may as well play an
important role. In particular, insights from modern personality psychological research which
has already been applied in the recent decades in the fields of economic psychology and
behavioral economics have not been given much consideration in the context of environmental
valuation. Therefore, this study analyzed the impact of personality characteristics on WTP
statements from both theoretical and empirical points of view. As such, it provides an important
opportunity to advance the understanding of the psychological process leading to systematic
biases in WTP answers.
After the introductory chapter offered rationales for a systematic analysis of personality
in CVM, the theoretical foundations and procedural details of the method were presented in
chapter 2. The main feature of the contingent valuation method is a survey in which the
respondents are directly asked to form an idea of the value that an environmental project might
generate for them and to report this individual valuation in terms of their WTP for the realization
of that project. On the basis of neoclassical welfare theory, these WTP statements can be
interpreted as a measure for the individual utility change resulting from the project in question.
In practice, however, the theoretical significance of WTP statements is often threatened by a
variety of systematic distortions. These include many types of response bias associated with the
format of the WTP elicitation question (e.g. starting point bias and range bias), hypothetical
bias, the stating of protest responses, embedding and part-whole bias. The process analysis of a
typical CVM interview revealed that such biases and errors occur in the course of WTP
formation process (during which respondents may not be able to identify their true individual
valuation of the program) and WTP elicitation process (during which respondents may
deliberately misreport their WTP). This chapter ended with an introduction of a line of CVM
research dealing with the WTP formation and elicitation problems from a psychological
perspective, the approach that fundamentally inspired the present study’s basic research design.
Rather than assuming that respondents are able to derive a correct estimate of their individual
176
valuation and truthfully report it in practical CVM surveys, this line of CVM research contests
these assumptions and is able to detect systematic relations between biases contained in WTP
answers and respondents’ psychological characteristics. This finding underscores the
importance of psychological characteristics for detecting biases contained in WTP answers.
Chapter 3, therefore, dealt with one of the most important psychological characteristics
of the human being: personality. After finding that personality construct was originally aimed
to account for the whole, intact psychological characteristics of individuals, the concept and
approach to its measurement were discussed from trait perspective. Trait perspective focuses
on the operationalization of the concept of personality using trait dispositions, all of which can
be conveniently measured using self-report inventories. Following this, the question whether
and to what extent trait has an impact on people’s behavior in real world situations was
addressed. In this respect, well-documented findings provide a rich picture of empirically
observed effects of traits on people’s behavior. As traits are the psychological characteristics
which are central to human behavior and which can be conveniently measured by adding some
questions to a standard CVM questionnaire, it was concluded that the use of the trait concept to
analyze potential biases occurring in practical CVM studies seemed justified.
In search of a specific theory of trait, which can form the conceptual basis of the empirical
research of this study, the Big Five personality model (BFM) was introduced in the second half
of Chapter 3. The basic idea of the BFM is that all traits that exist in the personality sphere can
be represented by five broad dimensions of personality, namely neuroticism, extraversion,
openness to experience, agreeableness, and conscientiousness. Each of these personality
dimensions or domains can be further represented by six facets, which are specific and unique
aspects of the domain. After elaborating on the definitions of all domains and facets, it became
clear that the BFM offers a large number of powerful traits, which can be used to detect potential
biases contained in WTP answers. Chapter 3 ended with the introduction of the NEO-FFI, a 60-
item personality inventory that was specifically designed to assess the five personality domains
when the time available for survey –and additional questions in particular– is limited. Evidence
on the cross-cultural validity of the NEO-FFI indicates that the inventory functions well in non-
English speaking countries and therefore can be employed in the practical CVM study
conducted in northern Thailand for the empirical part of this study.
In Chapter 4, the role of five personality domains was analyzed in the context of
contingent valuation surveys. In order to provide a suitable starting point for further analysis,
three reasons to consider personality in CVM were discussed in the first part of this chapter.
First, personality was suspected to be the source of potential biases contained in contingent
177
valuation survey responses, especially stated WTP for an environmental project. Second,
personality was also expected to be related to people’s preferences for the environmental
project. Because of these two reasons, a systematic relation between personality and WTP
statements in CVM interviews was anticipated. This led to the third reason to consider
personality in contingent valuation surveys. The direct links between personality and stated
WTP that might be detected in this study can be useful for the development of a mechanism to
identify untrustworthy WTP statements in future CVM studies. The first part of chapter 4 ended
with the review of empirical research on personality in contingent valuation. As shown, so far
only little use has been made of insights on personality gained in the BFM to verify CVM survey
results.
The discussion of the importance to consider personality in CVM gave rise to two main
research questions that were addressed in the remainder of the study. The first research question
concerned the applicability and validity of the BFM to explain the respondents’ personality in
a practical CVM survey that was conducted in Thailand. To answer this question, responses to
the NEO-FFI were analyzed. In this respect, it was hypothesized that the five factor structure
would emerge from the dataset indicating that CVM respondents possess the five personality
domains. In order for the BFM to be useful for CVM, however, there must be a systematic
relation between the Big Five and contingent valuation survey responses, especially stated
WTP. Hence, the second research question focused on the association between the five
personality dimensions on the one hand and stated WTP and CVM response behavior on the
other. To answer this second research question, the theoretical links between personality and
WTP answers were analyzed in detail. The amount of stated WTP was anticipated to be
negatively and positively determined by neuroticism and extraversion respectively. A positive
relation between openness to experience and agreeableness on the one hand and the amount of
WTP on the other was expected. However, conscientiousness was not expected to influence
WTP statements. Apart from these, the theoretical consideration predicted the relationship
between the five personality domains and other forms of response behavior, namely the amount
of time respondents used to complete the survey, extreme response style, and protest belief.
The derived theoretical predictions of the influence of the Big Five on stated WTP and
contingent valuation survey responses were verified in a practical CVM survey conducted to
estimate the social value of a tap water improvement program in northern Thailand. The study
was conducted within the framework of the Collaborative Research Center (SFB) 564
“Research for Sustainable Land Use and Rural Development in Mountainous Regions of
Southeast Asia.” The results of that study were presented in Chapter 5. Using factor analytical
178
method, it was found that the personality of respondents in the survey can indeed be
characterized by the five personality dimensions. It was further shown, however, that 20
question items of the NEO-FFI functioned poorly. They were consequently excluded from
further analysis.
As expected, a number of systematic relationships between the personality characteristics
of CVM respondents and their responses to the WTP question were found both in the DC and
the PC dataset. Openness to experience and conscientiousness exhibited a significantly positive
effect on WTP statements for both question formats, whereas extraversion was significantly
negatively related to WTP only in the PC format. Surprisingly, neuroticism and agreeableness
did not have any effect on WTP responses. When it comes to the influence of the five domains
on other forms of contingent valuation survey responses, neuroticism showed a negative impact
on extreme responses and a positive effect on protest belief. Extraversion showed a negative
impact on response time. Conscientiousness displayed positive influence on extreme responses,
response time, and protest belief. No impact of openness to experience and agreeableness on
contingent valuation survey responses were found.
Taken together, these results suggest that the personality characteristics of the respondents
as measured by 40-item NEO-FFI have explanatory power for WTP as well as for other
contingent valuation survey responses in addition to the usual socio-economic and attitudinal
characteristics of the survey respondents. So, the personality characteristics of respondents play
an important role in the CVM study conducted for this study. Each of the five domains,
however, plays a rather different role. Neuroticism appears to be an important determinant of
protest belief and middle response style. Extraversion contributes to the understating of
respondents’ WTP and the low effort respondents put into answering survey questions.
Openness to experience and conscientiousness are systematically related to individual
preferences for the proposed tap water improvement program. At the same time,
conscientiousness leads respondents to be thorough in the survey and is a source of protest
belief and extreme responses.
These findings confirm that the integration of the personality concept into the theoretical
framework of the CVM offers new insights into the psychological processes leading to
systematic variations in WTP answers and other forms of contingent valuation survey
responses. Such new insights give rise to a number of recommendations for further CVM
surveys to be discussed in the following. The first recommendation is that future contingent
valuation surveys should make a greater effort to assess individual differences in the domains
of openness to experience and conscientiousness of the respondents in order to verify their WTP
179
statements. This recommendation stems from the finding that openness to experience and
conscientiousness displayed a significantly positive effect on stated WTP in both the DC and
PC versions of the survey. An explanation of the observed significant relationships is that
respondents with a high level of these personality traits have a higher preference and, therewith,
higher WTP for the project scenario than low scorers. Consequently, those WTP responses that
do not conform to this expectation should be identified and discarded.
The second recommendation follows from the result that extraversion exhibited a
significantly negative effect on stated WTP in the PC dataset. An explanation of this result is
that extraversion is associated with the understating of respondents’ WTP. Due to this reason,
future contingent valuation surveys using PC elicitation method should take this fact into
account and assess the extraversion domain of the respondents so that the deliberate
understatements of their WTP can be detected. Based on the data of this study, the negative
impact of extraversion was not found in the survey using the DC elicitation question format.
The small sample size may account for this absence of effect. This hypothesis still needs to be
tested in future studies.
Third, the findings that neuroticism positively affects protest belief and negatively
impacts extreme response style gave rise to the conclusion that neuroticism was an important
source of bias in many forms of survey responses. It is therefore recommended that the
neuroticism domain should be assessed in future applications of the CVM in order to take its
biasing effects into account.
The fourth recommendation stems from the evidence of the NEO-FFI’s validity. It was
found in this study that the NEO-FFI did not perform very well in the suburban context of Mae
Rim, northern Thailand. One possible reason is that respondents become tired of the survey task
after completing the main CVM questionnaire. A 60-item inventory such as the NEO-FFI might
be too large for the respondent. Based on the present data, the use of the NEO-FFI in CVM
interviews cannot be recommended. However, since the sample size of this study is rather small
(N=570), further evidence for the performance of the NEO-FFI in a larger sample is therefore
necessary. Other personality inventories such as the BFI-10 that relies only on 10 short phrases
to assess the Big Five (Rammstedt and John 2007) should also be tested for their applicability
in the CVM survey.
Although the present study has successfully detected various response patterns that are
driven by the underlying personality of CVM respondents, it also has certain limitations that
call for further investigation. First of all, it remains unclear whether the broad personality
dimension or domain is the most appropriate level of specificity for describing the personality
180
of CVM respondents in order to predict their WTP responses. Facets, due to their specific and
narrow meanings, may be able to offer a more fine-grained understanding of the psychological
processes leading to the statement of WTP than broad domains. Yet, since the respondents’
tasks of forming and stating a WTP for an environmental good are both complex and
interrelated, global personality traits might have higher predictive power than specific traits. In
modern personality psychological research, this issue is known as the bandwidth-fidelity
dilemma in personality assessment (Ones and Viswesvaran 1996) and has been subject to
considerable debate. While conventional wisdom has it that specific and narrow measures of
traits produce more detailed insights into people’s behavior and so should always be preferred
over broad and general measures of traits, many authors have found counterevidence and
demonstrated that broad personality measures are better in predicting and explaining behavior
in certain areas of interest, such as job performance (Ones and Viswesvaran 1996). An
alternative point of view is that the appropriate level of abstractness of personality traits depends
on the topic under investigation (Hogan and Roberts 1996). Based on the data of this study, it
is conceivable that the suitable level of specification depends on both the topic being
investigated and the personality domains under consideration. It was found in this study that, to
explain stated WTP, it is more appropriate to use the domain of openness to experience. Yet for
other forms of contingent valuation responses, the predictive power of openness to experience
seemed to disappear. For neuroticism, the opposite is the case. Since the data in this study were
not suited to give a conclusive answer to this issue, future research on this topic should
investigate this tentative hypothesis.
Another important limitation of this study that needs to be discussed stems from the fact
that the exact form of interaction among facets of a particular domain is unknown. The BFM as
conceptualized by Costa and McCrae leaves open the mechanism through which facets function
together as an intact, coherent entity (domain) to impact people’s behavior (Costa and McCrae
1992b, p. 16). To keep the analysis simple, it was assumed in this study that all facets function
with the same intensity. It is, however, conceivable that different facets function with different
intensities, and these intensities might in turn be contingent on the given situational context.
Facets of neuroticism, for instance, might function differently in different contexts. While self-
consciousness might function with higher intensity than anxiety and thus dominate its effect in
the context of in-person CVM interviews, the opposite might be true when it comes to
answering contingent valuation questions in a mail interview. Since the exact form of these
interlinks among facets can have a decisive effect on the predicted links between the Big Five
and stated WTP, this issue should be investigated further.
181
One source of weakness in this study which could have affected its outcome was the fact
that the NEO-FFI is only the condensed version of the original inventory designed to measure
the Big Five: the NEO-PI-R. The NEO-PI-R consists of 240 items, every eight of which assess
one facet. To compute domain scores, the scores of facets constituting a domain are summed.
From this it is clear that the obtained domain scores as assessed by the NEO-PI-R contain
complete information on their facets. This is not the case for the NEO-FFI. The 60 question
items contained in the NEO-FFI were selected from the original 240 by means of factor analysis.
These 60 items had the highest factor loadings on the corresponding domains and thus
contribute most to their meaning. The problem is that domain scores as measured by the NEO-
FFI would contain only partial information on their facets. Therefore, some level of error could
have resulted from the use of these scales to test predictions that were formulated based on all
facets. Further study is needed to establish this.
In conclusion, this study develops a new approach to investigate systematic variations in
WTP answers in a contingent valuation survey. This approach, which is based on a conceptual
framework of modern personality psychology, allows for a broader perspective on response
behavior in contingent valuation interviews. In addition to their true individual valuation of an
environmental project, respondents are viewed as being influenced by their underlying
personality characteristics for selecting their WTP responses in contingent valuation surveys.
By means of a personality model, these personality characteristics can be identified and their
influence on WTP response behavior can be predicted. The fact that systematic relationships
between the personality characteristics of respondents and their stated WTP can be detected in
this particular CVM study underscores the explanatory power of this new perspective. The
results of this study, therefore, stress the necessity to adopt a broader perspective on response
behavior in CVM interviews. When it comes to direct valuation methods like contingent
valuation and discrete choice experiments, the characteristics of the survey design and of the
survey participants as well as their interactions are an important source of systematically
distorted responses and as a consequence these factors should be explicitly taken into account
in the empirical analysis. With this broader perspective on CVM, new insights into the processes
leading to potential biases in WTP answers can be gained and recommendations for the
improvement of the validity of WTP estimates can be derived. This study should be seen as a
first step towards such a perspective.

182
183
References
Aadland, D. and A. J. Caplan (2006). Cheap talk reconsidered: New evidence from CVM.
Journal of Economic Behavior & Organization 60: 562-578.
Abdalla, C. W., B. A. Roach and D. J. Epp (1992). Valuing environmental quality changes
using averting expenditures: an application to groundwater. Land Economics 68(2):
163-169.
Abrahams, N. A., B. J. Hubbell and J. L. Jordan (2000). Joint production and averting
expenditure measures of willingness to pay: do water expenditure really measure
avoidance cost? American Journal of Agricultural Economics 82(2): 427-437.
Ahadi, S. and E. Diener (1989). Multiple determinants and effect size. Journal of personality
and social psychology 56(3): 398-406.
Ahlheim, M. (1998). Measures of economic welfare. Handbook of utility theory. S. Barbera, P.
J. Hammond and C. Seidl. Norwell, MA, Kluwer Academic Publishers: 484-568.
Ahlheim, M. (2002). Project appraisal and the reclamation of disturbed landscapes.
Hohenheimer Diskussionsbeiträge 202/2002.
Ahlheim, M., B. Ekasingh, O. Frör, J. Kitchaicharoen, A. Neef, C. Sangkapitux and N.
Sinphurmsukskul (2010). Better than their reputation: enhancing the validity of
contingent valuation mail survey results through citizen expert groups. Journal of
Environmental Planning and Management 53(2): 163-182.
Ahlheim, M. and O. Frör (2003). Valuing the non-market production of agriculture.
Agrarwirtschaft 52(8): 356-369.
Ahmed, M., G. M. Umali, C. K. Chong, M. F. Rull and M. C. Garcia (2007). Valuing
recreational and conservation benefits of coral reefs:the case of Bolinao, Philippines.
Ocean & Coastal Management 50(1-2): 103-118.
Ajzen, I. (2005). Attitudes, personality, and behavior. Berkshire, Open University Press.
Albanese, P. J. (1987). The nature of preferences: An exploration of the relationship between
economics and psychology. Journal of Economic Psychology 8(1): 3-18.
Allport, G. W. (1937). Personality: A Psychological Interpretation New York, Holt.
Allport, G. W. (1961). Pattern and growth in personality. New York, Holt, Rinehart & Winston.
Allport, G. W. and H. S. Odbert (1936). Trait-names: A psycholexical study. New York,
Princeton.
Almlund, M., A. L. Duckworth, J. Heckman and T. Kautz (2011). Personality psychology and
economics. Handbook of the economics of education. E. A. Hanushek, S. Machin and
L. Woessmann. Amsterdam, North-Holland. 4: 1-182.
Aluja, A., O. García, J. Rossier and L. García (2005). Comparison of the NEO-FFI, the NEO-
FFI-R and an alternative short version of the NEO-PI-R (NEO-60) in Swiss and Spanish
samples. Personality and Individual Differences 38: 591–604.
Álvarez-Farizo, B., N. Hanley, R. Barberán and A. Lázaro (2007). Choice modeling at the
“market stall”: Individual versus collective interest in environmental valuation.
Ecological Economics 60: 743-751.
American Psychological Association (1954). Technical recommendations for psychological
tests and diagnostic techniques. Psychological Bulletin 51(2): 1-38.
Andreoni, J. (1989). Giving with Impure Altruism: Applications to Charity and Ricardian
Equivalence. Journal of Political Economy 97(6): 1447-1458.
Andreoni, J. (1990). Impure altruism and donations to public goods: a theory of warm-glow
giving. Economic Journal 100(401): 464-477.
Arrow, K. and A. C. Fisher (1974). Environmental preservation, uncertainty, and irreversibility.
The quarterly journal of economics 88: 312-319.
184
Arrow, K., R. Solow, P. R. Portney, E. E. Leamer, R. Radner and H. Schuman (1993). Report
of the NOAA panel on contingent valuation: natural resource damage assessment under
the oil pollution act of 1990. Federal Register 58: 4601-4614.
Arrow, K. J. (1963). Social choice and individual values. New York, John Wiley and Sons.
Ashton, M. C., K. Lee and P. S. V. (2002). What is the central feature of extraversion? Social
attention versus reward sensitivity. Journal of Personality and Social Psychology 83(1):
245-252.
Attfield, R. (1998). Existence value and intrinsic value. Ecological Economics 24: 163-168.
Bassili, J. N. and J. Fletcher (1991). Response-time measurement in survey research: A method
for CATI and a new look at non-attitudes Public opinion quarterly 60: 390-399.
Bateman, I. J., R. T. Carson, B. Day, M. Hanemann, N. Hanley, T. Hett, M. Jones-Lee, G.
Loomes, S. Mourato, E. Ozdemiroglu, D. W. Pearce, R. Sugden and J. Swanson (2002).
Economic valuation with stated preference techniques. Cheltenham, Edward Elgar.
Bateman, I. J., B. Day, S. Georgiou and I. Lake (2006). The aggregation of environmetnal
benefit values: Welfare measures, distance decay and total WTP. Ecological Economics
60: 450-460.
Bateman, I. J., I. H. Langford, R. K. Turner, K. G. Willis and G. D. Garrod (1995). Elicitation
and truncation effects in contingent valuation studies. Ecological Economics 12: 161-
179.
Bateman, I. J. and J. Mawby (2004). First impressions count: interviewer appearance and
information effects in stated preference studies. Ecological Economics 49: 47-55.
Baumgartner, H. and J.-B. E. M. Steenkamp (2001). Response styles in marketing research: A
cross-national investigation. Journal of Marketing Research 38(2): 143-156.
Becker, A., T. Deckers, T. J. Dohmen, A. Falk and F. Kosse (2012). The relationship between
economic preferences and psychological personality measures. Discussion Paper No.
6470, Institute for the Study of Labor (IZA), Germany.
Berry, D. A. and B. W. Lindgren (1996). Statistics: theory and methods. Belmont, Wadsworth
Publishing Company.
Bhat, M. G. (2003). Application of non-market valuation to the Florida Keys marine reserve
management. Journal of Environmental Management 67(4): 315-325.
Bishop, R. C. and T. A. Heberlein (1979). Measuring values of extra-market goods: are indirect
measures biased? American Journal of Agricultural Economics 61: 936-940.
Block, J. (1977). Advancing the psychology of personality: Paradigmatic shift or improving the
quality of research? . Personality at the cross-roads: Current issues in interactional
psychology D. Magnusson and N. S. Endler. Hillsdale, NJ, Erlbaum: 37-64.
Block, J. (1995). A contrarian view of the Five-Factor approach to personality description.
Psychological Bulletin 117(2): 187-215.
Blumenschein, K., G. Blomquist, M. Johannesson, N. Horn and P. Freeman (2008). Eliciting
willingness to pay without bias: Evidence from a field experiment. Economic Journal
118(1): 114-137.
Bockstael, N. E. and C. L. Kling (1988). Valuing environmental quality: Weak
complementarity with sets of goods. American Journal of Agricultural Economics
70(3): 654-662.
Börger, T. (2013). Keeping up appearances: Motivations for socially desirable responding in
contingent valuation interviews Ecological Economics 87: 155-165.
Buss, A. H. and R. Plomin (1975). A temperament theory of personality development. New
York, Wiley.
Carducci, B. J. (2009). The psychology of personality: Viewpoints, research, and applications.
West Sussex, John Wiley & Sons.
185
Carson, R. T., N. E. Flores, K. M. Martin and J. L. Wright (1996). Contingent valaution and
revealed preference methodologies: comparing the estimates for quasi-public goods.
Land Economics 72(1): 80-99.
Carson, R. T. and W. M. Hanemann (2005). Contingent valuation. Handbook of environmental
economics. K.-G. Mäler and J. R. Vincent. Amsterdam, Elsevier. 2: 821-936.
Cattell, R. B. (1943). The description of personality II: basic traits resolved into clusters.
Journal of Abnormal and Social psychology 38: 476-507.
Cattell, R. B. (1947). Confirmation and clarification of the plimary personality factors.
Psychometrika 12: 197-220.
Champ, P. A. and R. C. Bishop (2001). Donation payment mechanisms and contingent
valuation: an empirical study of hypothetical bias. Environmental and Resource
Economics 19: 383-402.
Champ, P. A., R. C. Bishop, T. C. Brown and D. W. McCollum (1997). Using donation
mechanisms to value nonuse benefits from public goods. Journal of Environmental
Economics and Management 33: 151-162.
Chang, L., K. T. Hau and A. M. Guo (2001). The effect of self-consciousness on the expression
of gender views. Journal of Applied Social Psychology 31(2): 340-351.
Chen, W., H. Hong, Y. Liu, L. Zhang, X. Hou and M. Raymond (2004). Recreation demand
and economic value: an application of travel cost method for Xiamen Island. China
Economic Review 15(4): 398-406.
Cheung, F. M., F. J. R. van de Vijver and F. T. L. Leong (2011). Toward a new approach to the
study of personality in culture American Psychologist 66(7): 593-603.
Chilton, S. M. and W. G. Hutchinson (2003). A qualitative examination of how respondents in
a contingent valuation study rationalise their WTP responses to an increase in the
quantity of the environmental good. Journal of Economic Psychology 24: 65-75.
Churchill, G. A. and J. D. Lacobucci (2002). Marketing Research: Methodological foundation.
Ohio, Thomson Learning.
Clark, J., J. Burgess and C. M. Harrison (2000). I struggled with this money business:
respondents' perspectives on contingent valuation. Ecological Economics 33(1): 45-62.
Clawson, M. and J. L. Knetsch (1966). Economics of outdoor recreation Baltimore, Johns
Hopkins University Press.
Connolly, J. J., E. J. Kavanagh and C. Viswesvaran (2007). The convergent validity between
self and observer ratings of personality: a meta-analytic review. International Journal
of Selection and Assessment 15(1): 110-117.
Costa, P. T. and R. R. McCrae (1988). Personality in adulthood: a six-year longitudinal study
of self-reports and spouse ratings on the NEO personality inventory. Journal of
personality and social psychology 54(5): 853-863.
Costa, P. T. and R. R. McCrae (1992a). Four ways five factors are basic. Personality and
Individual Differences 13(6): 653-665.
Costa, P. T. and R. R. McCrae (1992b). Revised NEO Personality Inventory (NEO-PI-R) and
NEO Five-Factor Inventory (NEOFFI) professional manual. Odessa, FL, Psychological
Assessment Resources, Inc.
Costa, P. T. and R. R. McCrae (1997). Longitudinal stability of adult personality. Handbook of
personality psychology. R. Hogan, J. Johnson and S. Briggs. London, Academic Press:
269-290.
Costa, P. T., R. R. McCrae and D. A. Dye (1991). Facet scales for Agreeableness and
Conscientiousness: A revision of the NEO Personality Inventory. Personality and
Individual Differences 12: 887-898.
Costello, A. B. and J. W. Osborne (2005). Best practices in exploratory factor analysis: Four
recommendations for getting the most from your analysis. Practical assessment,
186
research and evaluation 10(7): Available online:
http://pareonline.net/getvn.asp?v=10&n=17.
Cronbach, L. J. and P. E. Meehl (1955). Construct validity in psychological tests. Psychological
Bulletin 52(4): 281-302.
Cummings, R. G. and L. O. Taylor (1999). Unbiased value estimates for environmental goods:
a cheap talk design for the contingent valuation method The American Economic Review
89(3): 649-665.
Davis, J. (2004). Assessing community preferences for development projects: are willingness
to pay studies robust to mode effects? World Development 32(4): 655-672.
De Raad, B. (2000). The big five personality factors: the psycholexical approach to personality.
Seattle, Hogrefe and Huber Publishers.
Desvousges, W., K. Mathews and K. Train (2012). Adequate responsiveness to scope in
contingent valuation. Ecological Economics 84: 121-128.
Desvousges, W. H., A. R. Gable, R. W. Dunford and S. P. Houdson (1993). Contingent
valuation: The wrong tool to measure passive-use losses. Choices 2: 9-11.
Desvousges, W. H., F. R. Johnson, R. W. Dunford, S. P. Hudson, K. N. Wilson and K. J. Boyle
(1992). Measring nonuse damages using contingent valuation: An experimental
evaluation of accuracy. Research Triangle Institute Monograph.
DeYoung, C. G., J. B. Peterson and D. M. Higgins (2005). Sources of openness/intellect:
cognitive and neuropsychological correlates of the fifth factor of personality. Journal of
Personality 73(4): 825-858.
Diamond, P. A. and J. A. Hausman (1993). On contingent valuation measurement of nonuse
values. Contingent valuation: a critical assessment. J. A. Hausman. Amsterdam, North-
Holland.
Diamond, P. A. and J. A. Hausman (1994). Contingent valuation: is some number better than
no number? Journal of Economic Perspectives 8(4): 45-64.
Digman, J. M. and N. K. Takemoto-Chock (1981). Factors in the natural language of
personality: re-analysis, comparison, and interpretation of six major studies.
Multivariate Behavioral Research 16: 149-170.
DiStefano, C., M. Zhu and D. Mindrilǎ (2009). Understanding and using factor scores:
Considerations for the applied researcher. Practical assessment, research and
evaluation 14(20): Available online: http://pareonline.net/getvn.asp?v=14&n=20.
Doherty, K. and B. R. Schlenker (1991). Self-consciousness and strategic self-presentation.
Journal of Personality 59(1): 1-18.
Entwistle, D. R. (1972). To dispel fantasies about fantasy-based measures of achievement
motivation. Psychological Bulletin 77: 377-391.
Epstein, S. (1979). The stability of behavior: On predicting most of the people much of the time.
Journal of personality and social psychology 37: 1097-1126.
Epstein, S. (1983). Aggregation and beyond: Some basic issues on the prediction of behavior.
Journal of Personality 51(3): 360 - 392.
Epstein, S. and E. J. O'Brien (1985). The person-situation debate in historical and current
perspective. Psychological Bulletin 98(3): 513-537.
Ethier, R. G., G. L. Poe, W. D. Schulze and J. Clark (2000). A comparison of hypothetical
phone and mail contingent valuation responses for green-pricing electricity programs.
Land Economics 76(1): 54-67.
Eysenck, H. J. (1947). Dimensions of personality. London, Routledge & Kegan Paul.
Eysenck, H. J. (1967). The biological basis of personality. Springfield, Thomas.
Eysenck, H. J. (1990). Genetic and environmental contributions to individual differences: the
three major dimensions of personality Journal of Personality 58(1): 245-261.
187
Eysenck, H. J. (1992). Four ways five factors are not basic. Personality and Individual
Differences 13(6): 667-673.
Eysenck, H. J. and M. W. Eysenck (1985). Personality and individual differences: A natural
science approach. New York, Plenum.
Fabrigar, L. R., D. T. Wegener, R. C. MacCallum and E. J. Strahan (1999). Evaluating the use
of exploratory factor analysis in psychological research. Psychological methods 4(3):
272-299.
Ferreira, S. and L. Gallagher (2010). Protest responses and community attitudes toward
accepting compensation to host waste disposal infrastructure. Land Use Policy 27: 638-
652.
Fischer, A. and N. Hanley (2007). Analysing decision behaviour in stated preference surveys:
A consumer psychological approach. Ecological Economics 61: 303-314.
Fiske, D. W. (1949). Consistency of the factorial structures of personality ratings from different
sources. Journal of Abnormal and Social psychology 44: 329-344.
Fix, P. and J. Loomis (1998). Comparing the economic value of mountain biking estimated
using revealed and stated preference. Journal of Environmental Planning and
Management 41(2): 227-236.
Fletcher, J. F. and M. C. Chalmers (1991). Attitudes of Canadians toward affirmative action:
Opposition, value pluralism and nonattitudes. Political behavior 12: 67-96.
Freud, S. (1913). The Interpretation of dreams. New York, Bartleby.com, 2010
Frör, O. (2008). Bounded rationality in contingent valuation: empirical evidence using
cognitive psychology. Ecological Economics 68: 570-581.
Funder, D. C. (2009). Persons, behaviors and situations: An agenda for personality psychology
in the postwar era. Journal of Research in Personality 43: 120-126.
Goldberg, L. R. (1981). Language and individual differences: the search for universals in
personality lexicons. Review of personality and social psychology. L. Wheeler. Beverly
Hills, Sage. 2: 141-165.
Goldberg, L. R. (1990). An alternative description of personality: the Big-Five factor structure.
Journal of personality and social psychology 59: 1216-1229.
Goldberg, L. R. (1993). The structure of phenotypic personality traits. American Psychologist
48(1): 26-34.
Gow, A. J., M. C. Whiteman, A. Pattie and I. J. Deary (2005). Goldberg's IPIP Big-Five factor
markers: Internal consistency and concurrent validation in Scotland. Personality and
Individual Differences 39: 317–329.
Gray, J. A. (1982). The neuropsychology of anxiety: An enquiry into the functions of the septo-
hippocampal system. New York, Oxford University Press.
Grebitus, C., J. L. Lusk and R. M. N. Jr. (2013). Explaining differences in real and hypothetical
experimental auctions and choice experiments with personality. Journal of Economic
Psychology 36: 11-26.
Greene, W. H. (2007). Limdep version 9.0 reference guide, Plainview.
Groves, R. M., J. Floyd J. Fowler, M. P. Couper, J. M. Lepkowski, E. Singer and R. Tourangeau
(2004). Survey methodology. New Jersey, Wiley & Sons.
Hall, J., R. Viney, M. Haas and J. Louviere (2004). Using stated preference discrete choice
modeling to evaluate health care programs. Journal of Business Research 57: 1026-
1032.
Hanemann, W. M. (1984). Welfare evaluations in contingent valuation experiments with
discrete responses. American Journal of Agricultural Economics 66(3): 332-341.
Hanemann, W. M. (1985). Some issues in continuous- and discrete-response contingent
valuation studies. Northeastern journal of agricultural and resource economics 14(1):
5-13.
188
Hanley, N. (2001). Cost-benefit analysis and environmental policymaking Environment and
Planning C: Government and Policy 19: 103-118.
Hanley, N. and E. B. Barbier (2009). Pricing Nature - Cost-benefit analysis and environmental
policy. Cheltenham, Edward Elgar.
Hanley, N., F. Schläpfer and J. Spurgeon (2003). Aggregating the benefits of environmental
improvements: distance-decay functions for use and non-use values. Journal of
Environmental Economics and Management 68: 297-304.
Hanley, N., J. F. Shogren and B. White (2001a). Introduction to environmental economics. New
York, Oxford University Press.
Hanley, N., J. F. Shogren and B. White (2001b). Valuing the environment and natural resources.
Oxford, Oxford University Press.
Hanley, N. and C. L. Spash (1993). Cost-benefit analysis and the environment. Cheltenham,
Edward Elgar.
Harzing, A.-W. (2006). Resposne styles in cross-national survey research: A 26-country study.
Cross cultural management 6(2): 243-266.
Heidhues, F. (2007). Conclusions and outlook to the edited volume. Sustainable land use in
mountainous regions of Southeast Asia. F. Heidhues, L. Herrmann, A. Neef, S.
Neidhart, J. Pape and V. Zárate. Heidelberg, Springer-Verlag: 399-409.
Heidhues, F. and J. Pape (2007). Sustainable land use and sustainable rural livelihoods in
mountainous regions of Southeast Asia -Meeting the challenges of ecological, socio-
economic and cultural diversity. Sustainable land use in mountainous regions of
Southeast Asia. F. Heidhues, L. Herrmann, A. Neef, S. Neidhart, J. Pape and V. Zárate.
Heidelberg, Springer-Verlag: 1-14.
Herriges, J. A. (1999). Measuring goodness of fit for the double-bounded logit model:
Comment. American journal of agricultural economics 81(1): 231-234.
Hicks, J. (1942). Consumer's surplus and index numbers. Review of Economic Studies 9: 126-
137.
Hicks, J. R. (1939). The foundations of welfare economics. Economic Journal 49: 696-712.
Hofstee, W. K. B. (1994). Who should own the definition of personality? European Journal of
Personality 8: 149-162.
Hogan, J. and B. W. Roberts (1996). Issues and non-issues in the fidelity-bandwidth trade-off.
Journal of organizational behavior 17: 627-637.
Hogan, R. (2007). Personality and the fate of organizations. New Jersey, Lawrence Erlbaum
Associates
Hogan, R. (2009). Much ado about nothing: The person-situation debate. Journal of Research
in Personality 43: 249.
Howard, J. (1994). Buyer behaviour in marketing strategy. Englewood Cliffs, Prentice Hall.
Hull, D. M., A. A. Beaujean, F. C. Worrell and A. E. Verdisco (2010). An item-level
examination of the factorial validity of NEO Five-Factor Inventory scores. Educational
and psychological measurement 70(6): 1021-1041.
Jacoby, J. (1971). Personality and innovation proneness. Journal of Marketing Research 8: 244-
247.
John, O. P., A. Angleitner and F. Ostendorf (1988). The lexical approach to personality: A
historical review of trait taxonomic research. European Journal of Personality 2: 171-
203.
John, O. P., L. P. Naumann and C. J. Soto (2008). Paradigm shift to the integrative Big Five
trait taxonomy: History, measurement, and conceptual issues. Handbook of personality:
Theory and research. O. P. John, R. W. Robins and L. A. Pervin. New York, The
Guilford Press: 114-158.
189
John, O. P. and S. Srivastava (1999). The Big-Five Trait Taxonomy: History, Measurement,
and Theoretical Perspectives. Handbook of personality: Theory and research. L. Pervin
and O. P. John. New York, Guilford: 727.
John, O. P. and S. Srivastava (2001). The Big-Five trait taxonomy: History, measurement, and
theoretical perspectives. Handbook of personality: Theory and research. L. Pervin and
O. P. John. New York, Guilford: 102-138.
Johnson, J. A. (1997). Units of analysis for the description and explanation of personality
Handbook of personality psychology. R. Hogan, J. Johnson and S. Briggs. London,
Academic Press: 73-91.
Johnston, R. J. (2006). Is hypothetical bias universal? Validating contingent valuation responses
using a binding public referendum. Journal of Environmental Economics and
Management 52(1): 469-481.
Jorgensen, B. S., M. A. Wilson and T. A. Heberlein (2001). Fairness in the contingent valuation
of environmental public goods: attitude toward paying for environmental improvements
at two levels of scope. Ecological Economics 36: 133-148.
Jung, C. G. (1913/1971). Psychological types: Collected works NJ, Princeton University Press.
Kagen, J. (1988). The meanings of personality predicates. American Psychologist 43: 614-620.
Kagen, J. (2005). A time for specificity. Journal of Personality Assessment 85(2): 125-127.
Kagen, J. (2007). A trio of concerns. Perspectives on Psychological Science 2: 361-376.
Kahneman, D. and J. L. Knetsch (1992). Valuing public goods: the purchase of moral
satisfaction. Journal of Environmental Economics and Management 22: 57-70.
Kahneman, D., I. Ritov, K. E. Jacowitz and P. Grant (1993). Stated willingness to pay for public
goods: a psychological perspective. Psychological science 4: 310-315.
Kahneman, D., I. Ritov and D. Schkade (1999). Economic preferences or attitude expressions?:
an analysis of dollar responses to public issues. Journal of risk and uncertainty 19: 203-
235.
Kaldor, N. (1939). Welfare propositions of economics and interpersonal comparisons of utility
Economic Journal 49: 549-552.
Kaosa-ard, M. (2001). Ecosystem management in northern Thailand. Institutions, livelihoods
and the environment: Change and response in mainland southeast asia. A. Straub.
Copenhagen, NIAS Publishing: 129-165.
Kassarjian, H. H. (1971). Personality and Consumer Behavior: A Review. Journal of Marketing
Research 8: 409-418.
Kassarjian, H. H. and M. J. Sheffet (1981). Personality and consumer behavior: An update.
Perspectives in consumer behavior. H. H. Kassarjian and T. Robertson. Glenview, IL
Scott, Foresman and Co.: 160-180.
Kassarjian, H. H. and M. J. Sheffet (1991). Personality and consumer behavior: An update.
Perspectives in consumer behavior. H. H. Kassarjian and T. Robertson. Englewood
Cliffs, NJ, Prentice-Hall: 281-303.
Kenyon, W. and C. Nevin (2001). The use of economic and participatory approaches to assess
forest development: a case study in the Ettrick Valley. Forest Policy and Economics 3:
69-80.
Kline, P. (2008). An easy guide to factor analysis. East Sussex, Routledge.
Krutilla, J. V. (1967). Conservation reconsidered. The American Economic Review 57(4): 777-
786.
Lancaster, K. J. (1966). A new approach to consumer theory. Journal of Political Economy
74(2): 132-157.
Leininger, A. (2002). Vietnamese American personality and acculturation: an exploration
between personality traits and cultural goals. The five-factor model of personality across
cultures. R. R. McCrae and J. Allik. New York, Kluwer Academic Publisher: 197-227.
190
Lienhoop, N. and D. MacMillan (2007). Valuing wilderness in Iceland: estimation of wta and
wtp using the market stall appraoch to contingent valuation. Land Use Policy 24: 289-
295.
Likert, R. (1932). A technique for the measurement of attitudes. Archives of Psychology
22(140): 55.
List, J. (2001). Do explicit warnings eliminate the hypothetical bias in elicitation procedure?
evidence from filed auctions for sportcards. The American Economic Review 91(5):
1499-1507.
List, J. A., P. Sinha and M. H. Taylor (2006). Using Choice Experiments to Value Non-Market
Goods and Services: Evidence from Field Experiments. Advances in Economic Analysis
& Policy 6(2): 1-37.
Liston-Heyes, C. and A. Heyes (1999). Recreational benefits from the Dartmoor national park.
Journal of Environmental Management 55(2): 69-80.
Lodhi, P. H., S. Deo and V. M. Belhekar (2002). The five-factor model of personality in Indian
context: measurement and correlates. The five-factor model of personality across
cultures. R. R. McCrae and J. Allik. New York, Kluwer Academic Publisher: 227-248.
Loevinger, J. (1957). Objective tests as instruments of psychological theory. Psychological
Reports 3: 635-694.
Loewenstein, G. (2000). Emotions in economic theory and economic behavior. The American
Economic Review 90(2): 426-432.
Loewenstein, G. and J. S. Lerner (2003). The role of affect in decision making. Handbook of
affective science. R. J. Davidson, K. R. Sherer and H. H. Goldsmith. Oxford, Oxford
University Press.
Loomis, J. and M. King (1994). Comparison of mail and telephone-mail contingent valuation
surveys. Journal of Environmental economics Management 41: 309-324.
Lorr, M. and R. P. Youniss (1973). An inventory of interpersonal style. Journal of Personality
Assessment 37(2): 165-173.
Lucas, R. E., E. Diener, A. Grob, E. M. Suh and L. Shao (2000). Cross-cultural evidence for
the fundamental features of extraversion. Journal of personality and social psychology
79(3): 452-468.
Luft, J. (1969). Of human interaction. Palo Alto, Califonia, National Press Books.
Lusk, J. L., T. Nilsson and K. Foster (2007). Public preference and private choices: Effect of
altruism and free riding on demand for environmentally certified pork. Environmental
and Resource Economics 36: 499-521.
Macmillan, D. C., L. Philip, N. Hanley and B. Álvarez- Farizo (2002). Valuing the non-market
benefits of wild goose conservation: a comparison of interview and group-based
approaches. Ecological Economics 43: 49-59.
Mäler, K.-G. (1974). Environmental economics: A theoretical inquiry. Baltimore, Resources
for the Future.
Matthews, G., I. J. Deary and M. C. Whiteman (2009). Personality traits. New York, Cambridge
University Press.
Matthews, G. and K. Gilliland (1999). The personality theories of H. J. Eysenck and J. A. Gray:
a comparative review. Personality and Individual Differences 26: 583-626.
Mayer, J. D. (1986). How mood influences cognition. Advances in cognitive science. N. E.
Sharkey. West Sussex, Ellis Horwood Limited.
Mayer, J. D., Y. N. Gaschke, D. L. Braverman and T. W. Evans (1992). Mood-congruent
judgment is a general effect. Journal of personality and social psychology 63(1): 119-
132.
McAdams, D. P. (1992). The Five -Factor model in personality: A critical appraisal. Journal of
Personality 60(2): 329-361.
191
McAdams, D. P. (1997). A conceptual history of personality psychology. Handbook of
personality psychology. R. Hogan, J. Johnson and S. Briggs. London, Academic Press:
4-40.
McAdams, D. P. (2001). The person: an integrated introduction to personality psychology.
Florida, Harcourt College publishers.
McCrae, R. R. (1982). Consensual validation of personality traits: evidence from self-reports
and ratings. Journal of personality and social psychology 43: 293-303.
McCrae, R. R. (1994). Openness to Experience: expanding the boundaries of factor V.
European Journal of Personality 8(4): 251 - 272.
McCrae, R. R. and P. T. Costa (1983). Social desirability scales: More substance than style.
Journal of Consulting and Clinical Psychology 51(6): 882-888.
McCrae, R. R. and P. T. Costa (1985). Updating Norman's "adequate taxonomy": Intelligence
and personality dimensions in natural language and in questionnaires. Journal of
personality and social psychology 49: 710-721.
McCrae, R. R. and P. T. Costa (1987). Validation of the Five-Factor Model of personality across
instruments and observers. Journal of Personality and Social Psychology 52(1): 81-90.
McCrae, R. R. and P. T. Costa (1994). The stability of personality: Observation and evaluations.
Current Directions in Psychological Science 3: 173-175.
McCrae, R. R. and P. T. Costa (1995). Trait explanations in personality psychology. European
Journal of Personality 9: 231-252.
McCrae, R. R. and P. T. Costa (2006). Personality in adulthood. New York, The Guilford Press.
McCrae, R. R., P. T. Costa, G. H. Pilar, J. P. Rolland and W. D. Parker (1998). Cross-cultural
assessment of the five-factor model: the revised NEO personality Inventory. Journal of
Cross-Cultural Psychology 29: 171-188.
McCrae, R. R. and O. P. John (1992). An introduction to the five-factor model and its
applications. Journal of Personality 60: 175-215.
McCrae, R. R., J. Paul T. Costa, T. A. Martin, V. E. Oryol, A. A. Rukavishnikov, I. G. Senin,
M. Hrebickova and T. Urbanek (2004). Consensual validation of personality traits
across cultures. Journal of Research in Personality 38: 179-201.
McCrae, R. R. and A. Terracciano (2005). Universal features of personality traits from the
observer's perspective: data from 50 cultures. Journal of personality and social
psychology 88(3): 547-561.
McDougall, W. (1932). Of the words character and personality. Journal of Personality 1(1): 3-
16.
McFadden, D. (1974). Conditional logit analysis of qualitative choice behavior. Frontiers in
Econometrics. New York, Academic Press: 105-142.
Meisenberg, G. and A. Williams (2008). Are acquiescent and extreme response styles related
to low intelligence and education? Personality and Individual Differences 44: 1539-
1550.
Menges, R., C. Schroeder and S. Traub (2005). Altruism, warm glow, and the willingness-to-
donate for green electricity: An artefactual field experiment. Environmental and
Resource Economics 31: 431-458.
Meyerhoff, J. and U. Liebe (2006). Protest beliefs in contingent valuation: Explaining their
motivation Ecological Economics 57(4): 583-594.
Mischel, W. (1968). Personality and assessment. New York, Wiley
Mischel, W. (1973). Toward a cognitive social learning reconceptualization of personality
Psychological review 80: 252-283.
Mitchell, R. C. and R. T. Carson (1989). Using surveys to value public goods: the contingent
valuation method. Washington D. C., Resource for the Future
192
Morrison, M. and T. C. Brown (2009). Testing the effectiveness of certainty scales, cheap talk,
and dissonance-minimization in reducing hypothetical bias in contingent valuation
studies. Environmental and Resource Economics 44: 307-326.
Murray, G., F. Judd, H. Jackson, C. Fraser, A. Komiti, P. Pattison, A. Wearing and G. Robins
(2008). Big boys don’t cry: an investigation of stoicism and its mental health outcomes.
Personality and Individual Differences 44: 1369–1381.
Naemi, B. D., D. J. Beal and S. C. Payne (2009). Personality predictors of extreme response
style. Journal of Personality 77(1): 261-286.
Naess, A. (1986). Intrinsic value: Will the defenders of nature please rise? Conservation
biology: The science of scarcity and diversity. M. E. Soulé. Sunderland, MA, Sinauer
Associates: 504-515.
Neill, H. R., R. G. Cummings, P. P. Ganderton, G. W. Harrison and T. McGuckin (1994).
Hypothetical surveys and real economic commitments. Land Economics 70(2): 145-
154.
Nisbett, R. E. (1980). The trait construct in lay and professional psychology. Retrospections on
social psychology. L. Festinger. New York, Oxford University Press: 109-130.
Norman, W. T. (1963). Toward an adequate taxonomy of personality attributes: replicated
factor structure in peer nomination personality ratings. Journal of Abnormal and Social
psychology 66: 574-583.
Norman, W. T. (1967). 2,800 personality trait descriptors: normative operating characteristics
for a university population, Department of Psychology, University of Michigan.
NSO (2007). The 2007 household socio-economic survey. Bangkok, National Statistical Office.
Ones, D. S. and C. Viswesvaran (1996). Bandwidth-Fidelity dilemma in personality
measurment for personal selection. Journal of organizational behavior 17(6): 609-626.
Pacini, R. and S. Epstein (1999). The relation of rational and experiential information
processing styles to personality, basic beliefs, and the ratio-bias phenomenon.
Personality processes and individual differences 76(6): 972-987.
Palmquist, R. B. (2004). Weak complementarity, path independence, and the intuition of the
WIllig condition. Journal of Environmental Economics and Management 49: 103-115.
Panayiotou, G., C. M. Kokkinos and G. Spanoudis (2004). Searching for the ‘‘Big Five’’ in a
Greek context: The NEO-FFI under the microscope. Personality and Individual
Differences 36: 1841-1854.
Park, T., J. B. Loomis and M. Creel (1991). Confidence intervals for evaluating benefits
estimates from dichotomous choice contingent valuation studies. Land Economics
67(1): 64-73.
Paulhus, D. L. (1991). Measurement and control of response bias. Measures of personality and
social psychological attitudes. J. P. Robinson, P. R. Shaver and L. S. Wrightsman. San
Diego, Academic Press: 17-59.
Paulhus, D. L. (2002). Socially desirable responding: The evolution of a construct. The role of
constructs in psychological and educational measurement. H. I. Braun, D. N. Jackson
and D. E. Wiley. NJ, Erlbaum: 49-69.
Pervin, L. A. and D. Cervone (2010). Personality: Theory and research. Ney Jersey, John Wiley
and Sons.
Price, C. (2000). Valuation of unpriced products: contingent valuation, cost-benefit analysis
and participatory democracy. Land Use Policy 17: 187-196.
Raghunathan, R. and M. T. Pham (1999). All negative moods are not equal: Motivational
influences of anxiety and sadness on decision making. Organizational Behaviour and
Human Decision Processes 79(1): 56-77.
Raghunathan, R., M. T. Pham and K. P. Corfman (2006). Informatioinal properties of anxiety
and sadness, and displaced coping. journal of Consumer Research 32: 596-601.
193
Rammstedt, B. and O. P. John (2007). Measuring personality in one minute or less: A 10-item
short version of the big five inventory in English and German. Journal of Research in
Personality 41(203-212).
Randall, A. (1994). A difficulty with the travel cost method. Land Economics 70(1): 88-96.
Richard, F. D., C. F. J. Bond and J. J. Stokes-Zoota (2003). One hundred years of social
psychology quantitiatively described. Review of General Psychology 7: 331-363.
Rizzi, L. I. and J. d. D. Ortúzar (2003). Stated preference in the valuation of interurban road
safety. Accident Analysis and Prevention 35: 9-22.
Roberts, B. W. and D. Mroczek (2008). Personality trait change in adulthood. Current
Directions in Psychological Science 17(1): 35.
Rolfe, J. and J. Windle (2012). Distance decay functions for iconic assets: Assessing national
values to protect the health of the Great Barrier Reef in Australia. Environmental and
Resource Economics 53: 347-365.
Rolland, J., W. Parker and H. Stumpf (1998). A Psychometric Examination of the French
Translations of NEO-PI-R and NEO-FFI. Journal of Personality Assessment 71(2): 269-
291.
Rothbart, M. K. (2011). Becoming who we are: Temperament and personality. New York, The
Guilford Press.
Rotter, J. B. (1966). Generalized expectancies for internal versus external control of
reinforcement. Psychological Monographs 33(1): 300-303.
Roulston, K. (2003). Learning to interview in the social sciences Qualitative inquiry 9(4): 643-
668.
Rowe, R. D., W. D. Schulze and W. S. Breffle (1996). A test for payment card biases. Journal
of Environmental Economics and Management 31: 178-185.
Runyan, W. M. (1997). Studying lives. Handbook of personality psychology. R. Hogan, J.
Johnson and S. Briggs. London, Academic Press: 41-69.
Ryan, A. M. and C. L. Spash (2011). Is WTP attitudinal measure? Empirical analysis of the
psychological explanation for contingent values. Journal of Economic Psychology 32:
674-687.
Ryan, M., D. A. Scott and C. Donaldson (2004). Valuing health care using willingness to pay:
a comparison of the payment card and dichotomous choice methods. Journal of Health
Economics 23: 237-258.
Ryckman, R. (2008). Theories of personality Belmont, Thomson Wadsworth.
Sagoff, M. (1998). Aggregation and deliberation in valuing environmental public goods: A look
beyond contingent pricing. Ecological Economics 24: 213-230.
Shevlin, M., J. Miles, M. Davies and S. Walker (2000). Coefficient alpha:A useful indicator of
reliability? . Personality and Individual Differences 28(2): 229-237
Shrestha, R. K., A. F. Seidl and A. S. Moraes (2002). Value of recreational fishing in the
Brazilian Pantanal: a travel cost analysis using count data models. Ecological
Economics 42(1-2): 289-299.
Soldz, S. and G. Vaillant (1999). The Big Five personality traits and the life course: A 45-year
longitudinal study
Journal of Research in Personality 33: 208-232.
Soliño, M. and B. A. Farizo (2014). Personal traits underlying environmental preferences: A
discrete choice experiment. PLoS ONE 9(2): 1-7.
Sternberg, R. J. and E. L. Grigorenko (1997). Are cognitive styles still in style? American
Psychologist 52(7): 700-712.
Strazzera, E., M. Genius, R. Scarpa and G. Hutchinson (2003). The effect of protest votes on
the estimates of WTP for use values of recreational sites. Environmental and Resource
Economics 25: 461-476.
194
Strube, M. J. (1991). Multiple determinants and effect size: A more general method of
discourse. Journal of personality and social psychology 61(6): 1024-1027.
Svedsäter, H. (2000). Contingent valuation of global environmental resources: test of perfect
and regular embedding. Journal of Economic Psychology 21: 605-623.
Svedsäter, H. (2003). Economic valuation of the environment: how citizens make sense of
contingent valuation questions. Land Economics 79(1): 122-135.
Svedsäter, H. (2007). Ambivalent statements in contingent valuation studies: inclusive response
formats and giving respondents time to think. The Australian Journal of Agricultural
and Resource Economics 51: 91-107.
Switzer, G. E., S. R. Wisniewski, S. H. Belle, M. A. Dew and R. Schultz (1999). Selecting,
developing, and evaluating research instruments. Social Psychiatry and Psychiatric
Epidemiology 34: 399-409.
Tietenberg, T. and L. Lewis (2009). Environmental and natural resource economics Boston,
Pearson Education.
Tobin, J. (1958). Estimation of relationships for limited dependent variables. Econometrica
26(1): 24-36.
Trull, T. J. and D. C. Geary (1997). Comparison of the big-five factor structure across samples
of Chinese and American adults. Journal of Personality Assessment 69(2): 324-341.
Tupes, E. C. and R. E. Christal (1961). Recurrent personality factors based on trait ratings.
Washington, DC: U.S. , Government Printing Office.
Van Vaerenbergh, Y. and T. D. Thomas (2012). Response styles in survey research: A literature
review of antecedents, consequences, and remedies. International journal of public
opinion research 25(2): 195-217.
Vartia, Y. O. (1983). Efficient methods of measuring welfare changes and compensated income
in terms of ordinary demand functions. Econometrica 51: 79-98.
Veisten, K. and S. Navrud (2006). Contingent valuation and actual payment for voluntarily
provided passive-use values: assessing the effect of an induced truth-telling mechanism
and elicitation formats. Applied Economics 38: 735-756.
Venkatachalam, L. (2004). The contingent valuation method: a review. Environmental impact
assessment review 24: 89-124
Vossler, C. A. and J. Kerkvliet (2003). A criterion validity test of the contingent valuation
method: comparing hypothetical and actual voting behavior for a public referendum.
Journal of Environmental Economics and Management 45(3): 631-649.
Wang, X., J. Bennett, C. Xie, Z. Zhang and D. Liang (2007). Estimating non-market
environmental benefits of the conversion of cropland to forest and grassland program:
A choice modeling approach. Ecological Economics 63(1): 114-125.
Watson, D. and L. A. Clark (1997). Extraversion and its positive emotional core. Handbook of
personality psychology. R. Hogan, J. Johnson and S. Briggs. San Diego, Academic
Press: 767-793.
Webb, E. (1915). Character and intelligence: An attempt at an exact study of character. The
British Journal of Psychology Monograph Series, 1(3).
Weijters, B., M. Geuens and N. Schilewaert (2010). The individual consistency of acquiescence
and extreme response style in self-report questionnaires. Applied psychological
measurement 34(2): 105-121.
Weisbrod, B. A. (1964). Collective-consumption services of individual-consumption goods.
Quarterly Journal of Economics 78: 471-477.
Whitehead, J., P. Groothuis, R. Southwick and P. Foster-Turley (2009). Measuring the
economic benefits of Saginaw Bay coastal marsh with revealed and stated preference
methods. Journal of Great Lakes Research 35(3): 430-437.
195
Whynes, D. K., J. L. Wolstenholme and E. Frew (2004). Evidence of range bias in contingent
valuation payment scales. Health Economics 13: 183-190.
Wilt, J., K. Oehlberg and W. Revelle (2011). Anxiety in personality. Personality and Individual
Differences 50: 987-993.
Wilt, J. and W. Revelle (2009). Extraversion. Handbook of individual differences in social
behavior. M. R. Leary and R. H. Hoyle. New York, The Guilford Press.
Wiser, R. H. (2007). Using contingent valuation to explore willingness to pay for renewable
energy: a comparison of collective and voluntary payment vehicles. Ecological
Economics 62(3-4): 419-432.
Wood, S. and A. Trice (1958). Measurement of recreation benefits. Land Economics 34: 195-
207.
Wu, P.-I. and C. Huang (2001). Actual averting expenditure versus stated willingness to pay.
Applied Economics 33(2): 277-283.
Xu, Z., G. Cheng, J. Bennett, Z. Zhang, A. Long and H. Kunio (2006). Choice modeling and its
application to managing the Ejina Region, China. Journal of Arid Environments.
Zheng, L., L. R. Goldberg, Y. Zheng, Y. Zhao, Y. Tang and L. Liu (2008). Reliability and
concurrent validation of the IPIP Big-Five factor markers in China: consistencies in
factor structure between internet-obtained heterosexual and homosexual samples.
Personality and Individual Differences 45(7): 649-654.
Zuckerman, M. (1991). Psychobiology of personality Cambridge, Cambridge University Press.

196

197
Appendix
CVM Questionnaire
Economic benefits of an improvement of the Mae Rim tap water supply
Sawasdee krab/kah
“Chiang Mai University and the University of Hohenheim in Germany are doing research together with the Mae Rim Water Works to examine the possibilities for an improvement of the water supply in Mae Rim. This survey serves to explore the possibilities and the wishes of the population regarding such an improvement. Your household has been randomly selected out of all the customers of the Water Works. We kindly ask you to answer the following questions so that your opinion can contribute to build a better tap water supply system in this region. Your answers will be treated confidentially. This interview will last approximately 45 minutes.”
Next question
1-1 For which purposes do you use the water from the Mae Rim Water Works?
INT.: Please check one number per line. Yes No
A Bathing 01 02
B Dish washing 01 02
C Laundering 01 02
D House-cleaning 01 02
E Gardening 01 02
F Cooking 01 02
G Drinking 01 02 if “no“ : L
H Do you treat the water before drinking? 01 02 if “no“ : L
How do you treat it?
I By filtering 01 02
J By boiling 01 02
K By adding chemicals 01 02
L Others:

198
1-2 For how many years have you been connected to the water system of the Mae Rim Water Works?
years
1-3 Do you experience problems with the MRW system like e. g. low pressure, interruption of water supply for several hours per day or for entire days?
INT.: Please present the scale never
rarely
sometimes
often
very often
A Low pressure 1 2 3 4 5
B Interruption of water supply for several hours per day
1 2 3 4 5
C Interruption of water supply for entire days
1 2 3 4 5
1-4 What is your average monthly water bill for the water delivered by the Mae Rim Water Works?
Baht
1-5 Do you also have a village water system in your village?
Yes ............. 01 No ............. 02
1-10
1-6 Are you connected to this village water system? Yes ............. 01 No ............. 02
1-10
1-7 For which purposes do you use the water from the village water system?
INT.: Please check one number per line. Yes No
A Bathing 01 02
B Dish washing 01 02
C Laundering 01 02
D House-cleaning 01 02
E Gardening 01 02
F Cooking 01 02
G Drinking 01 02 if “no“ : L
H Do you treat the water before drinking? 01 02 if “no“ : L
How do you treat it?
I By filtering 01 02
J By boiling 01 02
K By adding chemicals 01 02
L Others:

199
1-8 What is your average monthly water bill for the village
water system?
Baht
1-9 For how many years have you been connected to the
village water system?
years
1-10 Do you have installed a water supply system of your own which you use, for example a ground water well or pump etc.
Yes .............. 01 No .............. 02
1-13
1-11 For which purposes do you use the water from your own water system?
INT.: Please check one number per line. Yes No
A Bathing 01 02
B Dish washing 01 02
C Laundering 01 02
D House-cleaning 01 02
E Gardening 01 02
F Cooking 01 02
G Drinking 01 02 if “no“ : L
H Do you treat the water before drinking? 01 02 if “no“ : L
How do you treat it?
I By filtering 01 02
J By boiling 01 02
K By adding chemicals 01 02
L Others:
1-12 How many years ago have you established your own water system?
years ago -99
1-13 Do you have installed a water storage tank system? Yes .............. 01 No .............. 02

200
2 Now let’s talk about your drinking water.
2-1 Which is the primary source of drinking water in your house or apartment?
INT: Please check only one of the possibilities.
MRW water ................. 01 Village water system .. 02 Own system ............... 03 Bottled water delivered to your house/apt. ........... 04 Bottled water bought in the store .......................... 05
Other .......................... 06
3-1
3-1
3-1
3-1
3-1
2-2 What are the reasons for choosing your primary source of drinking water?
INT.: Please check one number per line. Yes No
A All other sources are hazardous to my health. 01 02 3-3
B It has the best quality. 01 02 3-3
C It tastes better than the others. 01 02 3-3
D It is the cheapest source. 01 02 3-3
E It is more convenient than the other sources. 01 02 3-3
F I have always used this source. 01 02 3-3
3-1 How would you characterize the quality of the drinking water from your primary source?
Please specify with the help of the scale.
very poor ...................... 01 poor ........................... 02
just o.k. ...................... 03 good .......................... 04 excellent ..................... 05
Do not know ................ 06
3-2 What are the reasons for choosing your primary source of drinking water?
INT.: Please check one number per line. Yes No
A All other sources are hazardous to my health. 01 02
B It has the best quality. 01 02
C It tastes better than the others. 01 02
D It is the cheapest source. 01 02
E It is more convenient than the other sources. 01 02
F I have always used this source. 01 02

201
3-3 How much money do you spend on average per month on bottled drinking water?
Baht
4 Now we would like to talk about the MRW water service
4-1 How would you characterize the overall quality of the water of the MRW water system?
Please specify with the help of the scale.
very poor ..................... 01 poor .......................... 02
just o.k. ..................... 03 good ......................... 04 excellent .................... 05
Do not know ............... 06
4-2 Do you have installed a filter for purifying the MRW water?
Yes .............. 01 No .............. 02
4-3 We would like to know your opinion regarding some specific characteristics of MRW water. Please, tell us how worried you are about these characteristics
using the following scale.
INT.: Please present the scale not worried at all
little worried
sometimes worried
quite worried
very worried
A Taste 1 2 3 4 5
B Color 1 2 3 4 5
C Odor 1 2 3 4 5
D Other: 1 2 3 4 5
4-4 When you think about drinking the MRW water how worried are you about getting the following diseases?
INT.: Please present the scale not worried at all
little worried
sometimes worried
quite worried
very worried
A Diarrhea 1 2 3 4 5
B Kidney stones 1 2 3 4 5
C Cancer 1 2 3 4 5
D Other: 1 2 3 4 5
4-5 Have you or has somebody in your family ever become ill from the MRW water?
Yes ....... 01 No ....... 02
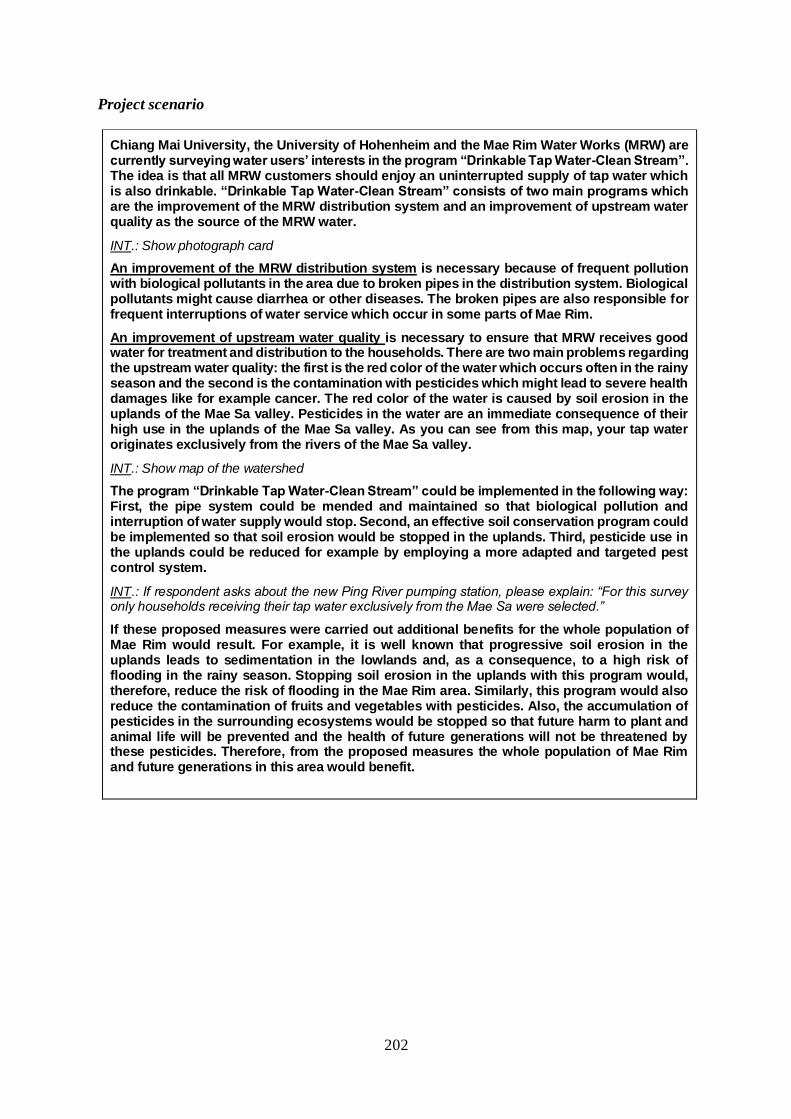
202
Project scenario
Chiang Mai University, the University of Hohenheim and the Mae Rim Water Works (MRW) are currently surveying water users’ interests in the program “Drinkable Tap Water-Clean Stream”. The idea is that all MRW customers should enjoy an uninterrupted supply of tap water which is also drinkable. “Drinkable Tap Water-Clean Stream” consists of two main programs which are the improvement of the MRW distribution system and an improvement of upstream water quality as the source of the MRW water.
INT.: Show photograph card
An improvement of the MRW distribution system is necessary because of frequent pollution with biological pollutants in the area due to broken pipes in the distribution system. Biological pollutants might cause diarrhea or other diseases. The broken pipes are also responsible for frequent interruptions of water service which occur in some parts of Mae Rim.
An improvement of upstream water quality is necessary to ensure that MRW receives good water for treatment and distribution to the households. There are two main problems regarding the upstream water quality: the first is the red color of the water which occurs often in the rainy season and the second is the contamination with pesticides which might lead to severe health damages like for example cancer. The red color of the water is caused by soil erosion in the uplands of the Mae Sa valley. Pesticides in the water are an immediate consequence of their high use in the uplands of the Mae Sa valley. As you can see from this map, your tap water originates exclusively from the rivers of the Mae Sa valley.
INT.: Show map of the watershed
The program “Drinkable Tap Water-Clean Stream” could be implemented in the following way: First, the pipe system could be mended and maintained so that biological pollution and interruption of water supply would stop. Second, an effective soil conservation program could be implemented so that soil erosion would be stopped in the uplands. Third, pesticide use in the uplands could be reduced for example by employing a more adapted and targeted pest control system.
INT.: If respondent asks about the new Ping River pumping station, please explain: “For this survey only households receiving their tap water exclusively from the Mae Sa were selected.”
If these proposed measures were carried out additional benefits for the whole population of Mae Rim would result. For example, it is well known that progressive soil erosion in the uplands leads to sedimentation in the lowlands and, as a consequence, to a high risk of flooding in the rainy season. Stopping soil erosion in the uplands with this program would, therefore, reduce the risk of flooding in the Mae Rim area. Similarly, this program would also reduce the contamination of fruits and vegetables with pesticides. Also, the accumulation of pesticides in the surrounding ecosystems would be stopped so that future harm to plant and animal life will be prevented and the health of future generations will not be threatened by these pesticides. Therefore, from the proposed measures the whole population of Mae Rim and future generations in this area would benefit.
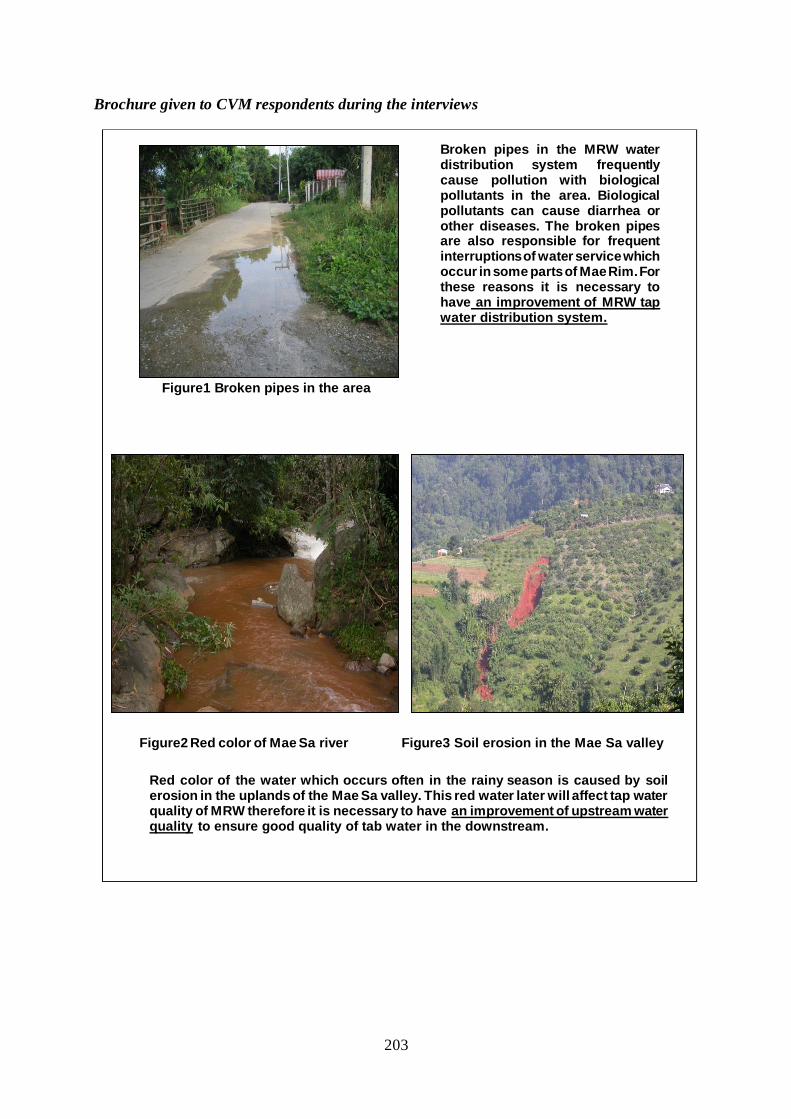
203
Brochure given to CVM respondents during the interviews
Broken pipes in the MRW water distribution system frequently cause pollution with biological pollutants in the area. Biological pollutants can cause diarrhea or other diseases. The broken pipes are also responsible for frequent interruptions of water service which occur in some parts of Mae Rim. For these reasons it is necessary to have an improvement of MRW tap water distribution system.
Figure1 Broken pipes in the area
Figure2 Red color of Mae Sa river Figure3 Soil erosion in the Mae Sa valley
Red color of the water which occurs often in the rainy season is caused by soil erosion in the uplands of the Mae Sa valley. This red water later will affect tap water quality of MRW therefore it is necessary to have an improvement of upstream water quality to ensure good quality of tab water in the downstream.
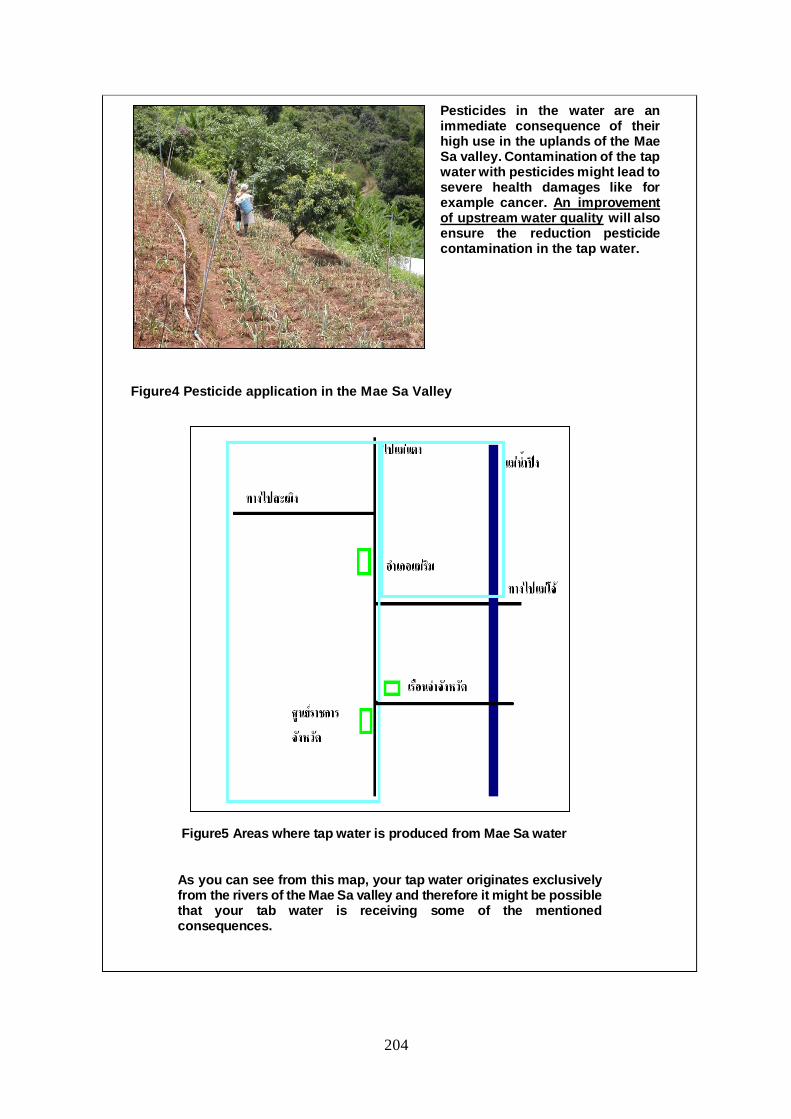
204
Pesticides in the water are an immediate consequence of their high use in the uplands of the Mae Sa valley. Contamination of the tap water with pesticides might lead to severe health damages like for example cancer. An improvement of upstream water quality will also ensure the reduction pesticide contamination in the tap water.
Figure4 Pesticide application in the Mae Sa Valley
Figure5 Areas where tap water is produced from Mae Sa water
As you can see from this map, your tap water originates exclusively from the rivers of the Mae Sa valley and therefore it might be possible that your tab water is receiving some of the mentioned consequences.

205
5 Now we would like to know how important the elements of the described program are for yourself.
INT.: Please present the scale not important at all
not so important
fairly important
important
very important
A no interruptions of water service
1 2 3 4 5
B no biological pollutants in the tap water
1 2 3 4 5
C no pesticides in the tap water
1 2 3 4 5
D clear color of the water 1 2 3 4 5
E reduced flooding in the Mae Rim area
1 2 3 4 5
F less soil degradation in the uplands
1 2 3 4 5
G
no accumulation of pesticided in the ecosystems
1 2 3 4 5
H less pesticides in fruits and vegetables
1 2 3 4 5
I reduced health threats for future generations
1 2 3 4 5

206
WTP elicitation question formats
Double-bounded DC, for the initial bid designs see table 5-1
6a Since these measures are costly their financing has to be secured before such a program can be implemented. Therefore, it is intended to introduce a monthly surcharge on the MRW water bill for the next five years to get the program started. The surcharge will be equal for all households connected to the MRW system. Would you be willing to support this program if your household had to pay 50 Baht per month for the next five years?
Yes .............. 01
No ............... 02
6b 6c
6b If it turns out that this program would cost your household 100 Baht instead, would you also be willing to support the program?
Yes .............. 01
No ............... 02
7
7
6c If instead the monthly surcharge were only 25 Baht, would you then be willing to support this program?
Yes .............. 01
No ............... 02

207
7 Did you personally find it difficult to make a decision about your contribution to the improvements?
INT.: Please present the scale.
very easy .......................... 01 quite easy ........................ 02
neutral ............................. 03 difficult ............................. 04 very difficult ...................... 05
8 How true are the following considerations with respect to your decision on the amount to contribute to the improvements of tap water supply?
INT.: Please present the scale not true at all
mostly not true
partly true
mostly true
fully true
A
I will be able to save money since I don’t have to buy bottled water or to use the water filter
any more.
1 2 3 4 5
B It is more convenient to get all my water from the tap.
1 2 3 4 5
C
My household will not run the risk of becoming ill from the tap water
any more.
1 2 3 4 5
D
I never felt at ease with the red color of the tap water and want to
contribute to stop it.
1 2 3 4 5
F
It gives me a good feeling to know that future generations will
live in a healthier environment.
1 2 3 4 5
H
I would like to pay for this improvement but I cannot afford it.
1 2 3 4 5
I
I have severe doubts that these improvements can be realized
as described.
1 2 3 4 5
J
I think government is responsible for such a program
and should pay for it.
1 2 3 4 5
K
My water costs are already high enough. We should receive the good quality service without
additional costs.
1 2 3 4 5

208
9 Do you think that the following facilities and institutions should be financed by taxes? Please be aware of the fact that all government spendings require the imposition of taxes to raise the necessary funds.
INT.: Please check one number per line Yes No
A Libraries 01 02
B Discotheques 01 02
C State Railway of Thailand 01 02
D Swimming-pools, gyms, sports fields 01 02
E Schools 01 02
F Provincial Electricity Authority 01 02
G Theater 01 02
H Provincial Water Authority 01 02
I Mass Transit Authority 01 02
J Thailand Post 01 02
L Telephone of Thailand 01 02
10 To what extent do you feel emotionally attached to…
INT.: Please present the scale not attached
at all
little attached
fairly attached
attachd
very attached
A … your village? 1 2 3 4 5
B … Mae Rim? 1 2 3 4 5
C … Chiang Mai Province? 1 2 3 4 5
D … Northern Thailand? 1 2 3 4 5
E … Thailand as a whole? 1 2 3 4 5
11 How often do you…
INT.: Please present the scale never rarely sometimes often very often
A
… lend money to somebody who is not a member of
your family?
1 2 3 4 5
B … donate for a good social
cause? 1 2 3 4 5
C
… donate to an environmental
organization?
1 2 3 4 5

209
12 To what extent do the following statements apply to you?
INT.: Please present the scale never rarely sometimes often very often
A I find it difficult to say “no” if a friend asks me a favor.
1 2 3 4 5
B
It gives me a good feeling if I donate money for people I do not know personally, for example for old people, disabled people or orphans
1 2 3 4 5
C
The increase of my “boon” associated with the donation is very important to me.
1 2 3 4 5
D
I help other people because they will help me when I am in need.
1 2 3 4 5
E
I donate money because “giving” is an established habit in our society.
1 2 3 4 5
F
I promise to do something although I do not want to do it.
1 2 3 4 5
G I give promises and then I do not keep them.
1 2 3 4 5
H I am concerned what other people might think of me.
1 2 3 4 5
13 To what extent do you agree with the following statements?
INT.: Please present the scale and check one number per line.
do not agree at all
do not agree
quite agree
agree
fully
agree
A
Taking care of environmental protection is an important task of government.
1 2 3 4 5
B
Law enforcement concerning environmental management is usually not effective.
1 2 3 4 5
C
Usually, government’s action concerning environmental protection is ‘too late’.
1 2 3 4 5
D
Government should collect more taxes to increase the budget for environmental management.
1 2 3 4 5
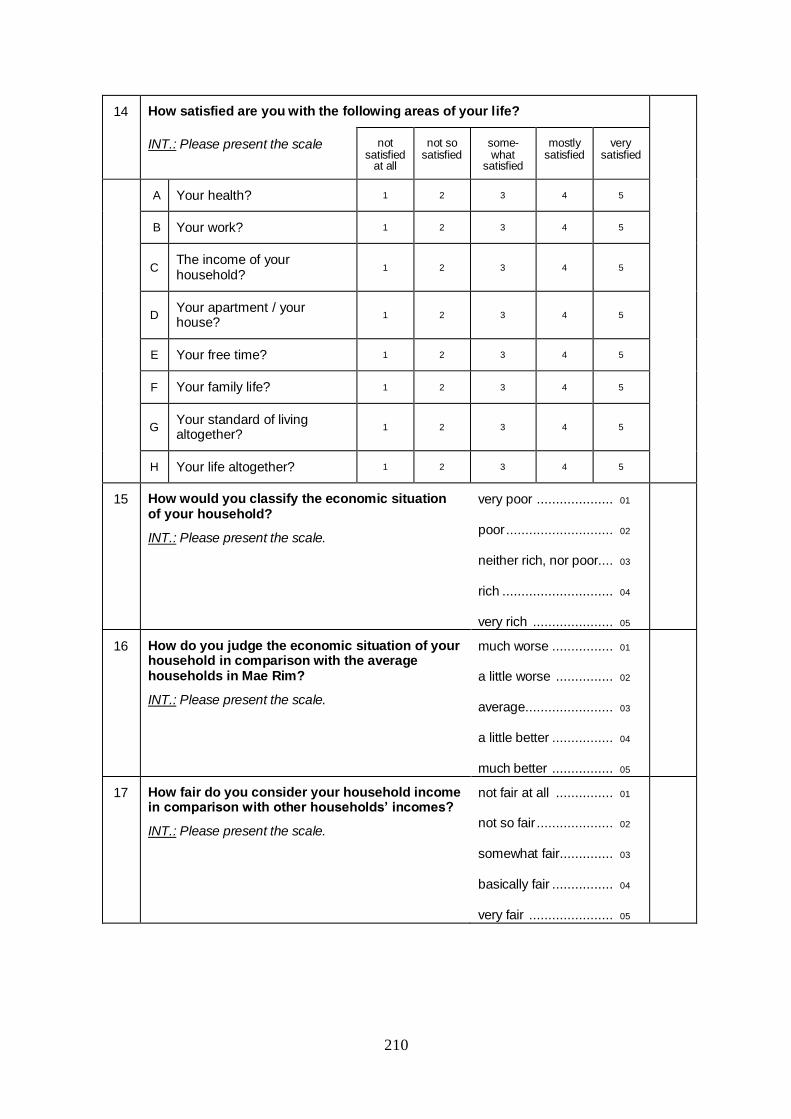
210
14 How satisfied are you with the following areas of your life?
INT.: Please present the scale not satisfied
at all
not so satisfied
some-what
satisfied
mostly satisfied
very satisfied
A Your health? 1 2 3 4 5
B Your work? 1 2 3 4 5
C The income of your household?
1 2 3 4 5
D Your apartment / your house?
1 2 3 4 5
E Your free time? 1 2 3 4 5
F Your family life? 1 2 3 4 5
G Your standard of living altogether?
1 2 3 4 5
H Your life altogether? 1 2 3 4 5
15 How would you classify the economic situation of your household?
INT.: Please present the scale.
very poor .................... 01 poor ............................ 02 neither rich, nor poor.... 03 rich ............................. 04 very rich ..................... 05
16 How do you judge the economic situation of your household in comparison with the average households in Mae Rim?
INT.: Please present the scale.
much worse ................ 01 a little worse ............... 02 average....................... 03 a little better ................ 04 much better ................ 05
17 How fair do you consider your household income in comparison with other households’ incomes?
INT.: Please present the scale.
not fair at all ............... 01 not so fair .................... 02 somewhat fair .............. 03 basically fair ................ 04 very fair ...................... 05
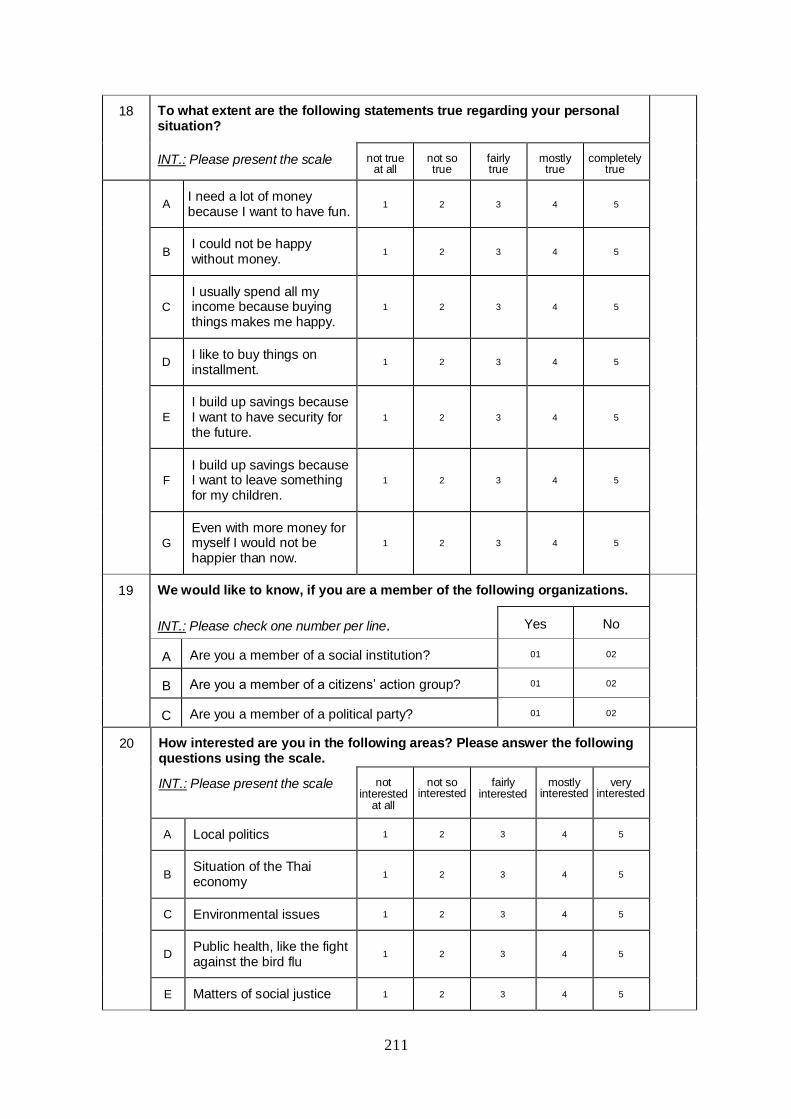
211
18 To what extent are the following statements true regarding your personal situation?
INT.: Please present the scale not true at all
not so true
fairly true
mostly true
completely true
A I need a lot of money because I want to have fun.
1 2 3 4 5
B
I could not be happy without money.
1 2 3 4 5
C
I usually spend all my income because buying things makes me happy.
1 2 3 4 5
D I like to buy things on installment.
1 2 3 4 5
E
I build up savings because I want to have security for the future.
1 2 3 4 5
F
I build up savings because I want to leave something for my children.
1 2 3 4 5
G
Even with more money for myself I would not be happier than now.
1 2 3 4 5
19 We would like to know, if you are a member of the following organizations.
INT.: Please check one number per line. Yes No
A Are you a member of a social institution? 01 02
B Are you a member of a citizens’ action group? 01 02
C Are you a member of a political party? 01 02
20 How interested are you in the following areas? Please answer the following questions using the scale.
INT.: Please present the scale not interested
at all
not so interested
fairly interested
mostly interested
very interested
A Local politics 1 2 3 4 5
B Situation of the Thai economy
1 2 3 4 5
C Environmental issues 1 2 3 4 5
D Public health, like the fight against the bird flu
1 2 3 4 5
E Matters of social justice 1 2 3 4 5
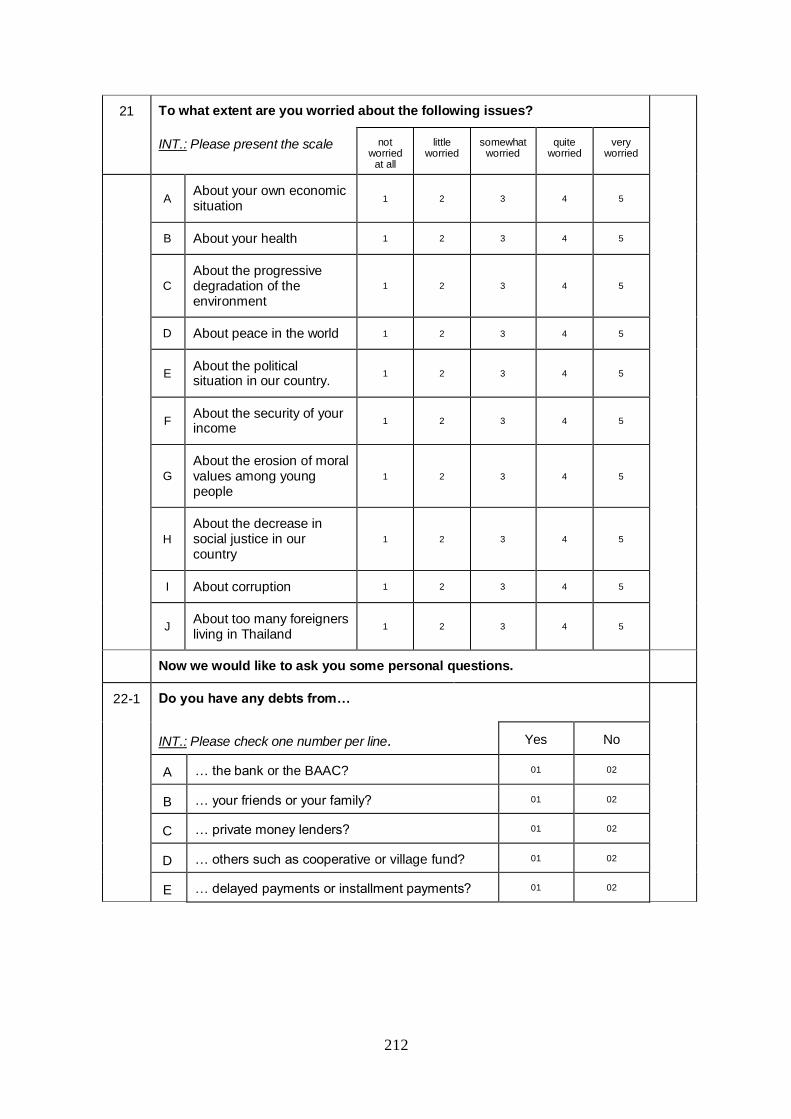
212
21 To what extent are you worried about the following issues?
INT.: Please present the scale not worried
at all
little worried
somewhat worried
quite worried
very worried
A About your own economic situation
1 2 3 4 5
B About your health 1 2 3 4 5
C
About the progressive degradation of the environment
1 2 3 4 5
D About peace in the world 1 2 3 4 5
E About the political situation in our country.
1 2 3 4 5
F About the security of your income
1 2 3 4 5
G
About the erosion of moral values among young people
1 2 3 4 5
H
About the decrease in social justice in our country
1 2 3 4 5
I About corruption 1 2 3 4 5
J About too many foreigners living in Thailand
1 2 3 4 5
Now we would like to ask you some personal questions.
22-1 Do you have any debts from…
INT.: Please check one number per line. Yes No
A … the bank or the BAAC? 01 02
B … your friends or your family? 01 02
C … private money lenders? 01 02
D … others such as cooperative or village fund? 01 02
E … delayed payments or installment payments? 01 02
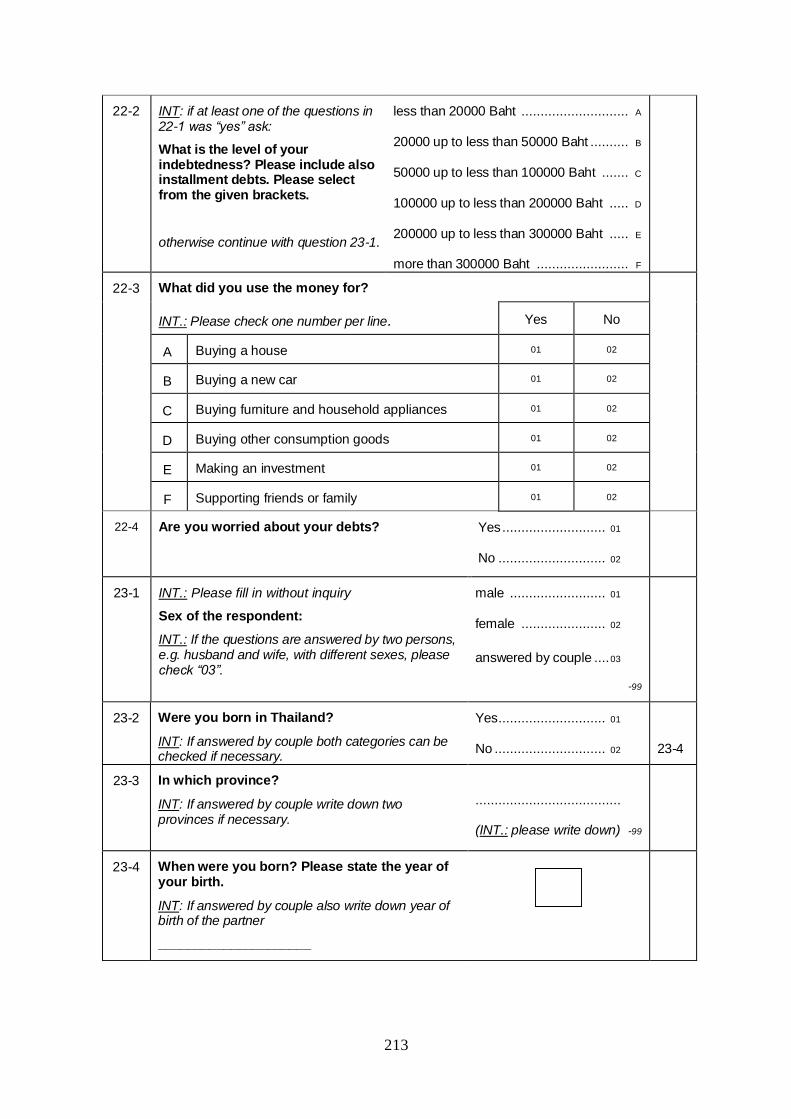
213
22-2 INT: if at least one of the questions in 22-1 was “yes” ask:
What is the level of your indebtedness? Please include also installment debts. Please select from the given brackets.
otherwise continue with question 23-1.
less than 20000 Baht ............................ A 20000 up to less than 50000 Baht .......... B 50000 up to less than 100000 Baht ....... C 100000 up to less than 200000 Baht ..... D 200000 up to less than 300000 Baht ..... E more than 300000 Baht ........................ F
22-3 What did you use the money for?
INT.: Please check one number per line. Yes No
A Buying a house 01 02
B Buying a new car 01 02
C Buying furniture and household appliances 01 02
D Buying other consumption goods 01 02
E Making an investment 01 02
F Supporting friends or family 01 02
22-4 Are you worried about your debts? Yes ........................... 01 No ............................ 02
23-1 INT.: Please fill in without inquiry
Sex of the respondent:
INT.: If the questions are answered by two persons, e.g. husband and wife, with different sexes, please check “03”.
male ......................... 01 female ...................... 02
answered by couple .... 03
-99
23-2 Were you born in Thailand?
INT: If answered by couple both categories can be checked if necessary.
Yes ............................ 01 No ............................. 02
23-4
23-3 In which province?
INT: If answered by couple write down two provinces if necessary.
......................................
(INT.: please write down) -99
23-4 When were you born? Please state the year of your birth.
INT: If answered by couple also write down year of birth of the partner
_____________________

214
23-5 What marital status do you have? What applies to you from this list?
INT.: Please present the list.
I am married and live together with my spouse .............................. 01 I am married and live separated from my spouse .............................. 02
I am not married ..................... 03 I am divorced .......................... 04 I am widowed .......................... 05
23-6 Do you have children or even grandchildren? Yes ........................... 01 No ............................ 02
23-7 How many persons are constantly living in your household, including yourself? Please consider all the children in the household. Person(s)
23-8 INT.: ask only households with at least 2 persons.
How many persons living in your household contribute to your household income?
Person(s)
23-9 Which is your highest level of education? Please give your answers according to the list.
INT.: Please present the list.
INT: If answered by couple you may check two different categories if necessary.
I left the school without certificate ................... 01 4th year of elementary school ......................... 02 6th year of elementary school ......................... 03 3rd year of secondary school .......................... 04 6th year of secondary school ........................... 05 Technical Education Certificate ....................... 06 Higher Technical Education Certificate ............ 07 The bachelor degree ....................................... 08 The master degree ........................................ 09 I have obtained a PhD ................................... 10 I have a different certificate: ........................... 11
(INT.: Please write down)

215
23-10 What kind of job do you do at present?
INT.: Please present list.
INT: If answered by couple you may check two different categories if necessary.
Worker / employee ........................................ 01 Official .......................................................... 02 Owner or renter of a farm................................ 03
Self-employed ................................................. 04 Trainee, student, pupil .................................... 05 Housewife, househusband ............................. 06 Retiree, early retirement ................................ 07 Unemployed................................................... 08
23-12 23-12 23-12 23-12 23-12 23-12 23-12
23-11 Are you employed full-time or part-time?
INT: If answered by couple you may check both categories if necessary.
Full-time ................ 01 Part-time .............. 02
23-12 What is the average net monthly income of your household altogether?
Please state the sum of wages, incomes from self-employment and pensions minus tax payments and social security insurance. Please also add the income from public subsidies, rents, housing subsidies, child benefits, and other sources of income.
If you are responsible for the support of a part of your family not living in your household, please deduct this amount. Your statement will be treated confidentially.
INT.: Please present the list.
less than 6000 Baht .............................. A 6000 up to less than 10000 Baht ............ B 10000 up to less than 20000 Baht ......... C 20000 up to less than 30000 Baht ......... D 30000 up to less than 50000 Baht ......... E more than 50000 Baht .......................... F
Thank you very much for answering these questions! I assure that I carried out this interview according to the given instructions.
Signature of the interviewer
Date
Karlshofstr. 4, 70599 Stuttgart 0176-29945684 [email protected]
Nopasom Sinphurmsukskul Professional experience/ Awards
2010-2014 Colonel Kasem Nanthakit Foundation Bangkok, Thailand
Scholarship holder
2006-2009 The Uplands Program Chiang Mai, Thailand
Research associates
Research associates in a research project tit led “Economic valuation of environmental improvements in Northern Thailand
and Vietnam.”
2003-2006 The Uplands Program Chiang Mai, Thailand
Research associates
Research associates in a research project tit led “Tenure and economic valuation of common-pool resources in mountainous
regions of Thailand and Vietnam.”
2000-2001 Stuttgarter Hofbräu Stiftung Stuttgart, Germany
Scholarship holder
1998-2000 Sanwa Bank Foundation Tokyo, Japan
Scholarship holder
Education/ Degrees
2015 University of Hohenheim Stuttgart, Germany
Ph.D. candidate
Dissertation tit led “Personality-based approach to
environmental valuation.”
2000-2002 University of Hohenheim Stuttgart, Germany
M.Sc. Food Security, Natural Resources Management in the
Tropics and Subtropics
Master thesis tit led “Impact analysis of microcredit project in northeast Thailand: A case study of Thai-German Development
Foundation.”
1996-2000 Chiang Mai University Chiang Mai, Thailand
Bachelor degree in Economics
Graduated with First Class Honors
1990-1996 Vajiravudh College Bangkok, Thailand
Secondary school certificate

Eidesstattliche Versicherung gemäß § 8 Absatz 2 Buchstabe b) der Promotionsordnung der Universität Hohenheim zum Dr. oec. und Dr. rer. soc. 1. Bei der eingereichten Dissertation zum Thema
……………………………………………………………………………………………… …………………………………………………………………………………………....... ……………………………………………………………………………………………… handelt es sich um meine eigenständig erbrachte Leistung.
2. Ich habe nur die angegebenen Quellen und Hilfsmittel benutzt und mich keiner unzulässigen Hilfe Dritter bedient. Insbesondere habe ich wörtlich oder sinngemäß aus anderen Werken übernommene Inhalte als solche kenntlich gemacht.
3. Ich habe nicht die Hilfe einer kommerziellen Promotionsvermittlung oder -beratung in
Anspruch genommen. 4. Die Bedeutung der eidesstattlichen Versicherung und der strafrechtlichen Folgen einer
unrichtigen oder unvollständigen eidesstattlichen Versicherung sind mir bekannt. Die Richtigkeit der vorstehenden Erklärung bestätige ich. Ich versichere an Eides Statt, dass ich nach bestem Wissen die reine Wahrheit erklärt und nichts verschwiegen habe.
____________________________ _____________________________________ Ort, Datum Unterschrift

Eidesstattliche Versicherung gemäß § 8 Absatz 2 Buchstabe b) der Promotionsordnung der Universität Hohenheim zum Dr.oec. und Dr. rer. soc. Belehrung Die Universität Hohenheim verlangt eine Eidesstattliche Versicherung über die Eigenständigkeit der erbrachten wissenschaftlichen Leistungen, um sich glaubhaft zu versichern, dass der Promovierende die wissenschaftlichen Leistungen eigenständig erbracht hat. Weil der Gesetzgeber der Eidesstattlichen Versicherung eine besondere Bedeutung beimisst und sie erhebliche Folgen haben kann, hat der Gesetzgeber die Abgabe einer falschen eidesstattlichen Versicherung unter Strafe gestellt. Bei vorsätzlicher (also wissentlicher) Abgabe einer falschen Erklärung droht eine Freiheitsstrafe bis zu drei Jahren oder eine Geldstrafe. Eine fahrlässige Abgabe (also Abgabe, obwohl Sie hätten erkennen müssen, dass die Erklärung nicht den Tatsachen entspricht) kann eine Freiheitsstrafe bis zu einem Jahr oder eine Geldstrafe nach sich ziehen. Die entsprechenden Strafvorschriften sind in § 156 StGB (falsche Versicherung an Eides Statt) und in § 161 StGB (Fahrlässiger Falscheid, fahrlässige falsche Versicherung an Eides Statt) wiedergegeben. § 156 StGB: Falsche Versicherung an Eides Statt Wer vor einer zur Abnahme einer Versicherung an Eides Statt zuständigen Behörde eine solche Versicherung falsch abgibt oder unter Berufung auf eine solche Versicherung falsch aussagt, wird mit Freiheitsstrafe bis zu drei Jahren oder mit Geldstrafe bestraft. § 161 StGB: Fahrlässiger Falscheid, fahrlässige falsche Versicherung an Eides Statt: Absatz 1: Wenn eine der in den §§ 154 und 156 bezeichneten Handlungen aus Fahrlässigkeit begangen worden ist, so tritt Freiheitsstrafe bis zu einem Jahr oder Geldstrafe ein. Absatz 2: Straflosigkeit tritt ein, wenn der Täter die falsche Angabe rechtzeitig berichtigt. Die Vorschriften des § 158 Absätze 2 und 3 gelten entsprechend. Ich habe die Belehrung zur Eidesstattlichen Versicherung zur Kenntnis genommen. ______________________________ __________________________________ Ort, Datum Unterschrift