Embed Size (px)
Citation preview
VOLUME 82, NUMBER 26 P H Y S I C A L R E V I E W L E T T E R S 28 JUNE 1999
l,
Phase Diagram of Star Polymer Solutions
M. Watzlawek,1,* C. N. Likos,1,2 and H. Löwen1,2
1Institut für Theoretische Physik II, Heinrich-Heine-Universität, Universitätsstraße 1, D-40225 Düsseldorf, Germany2IFF Theorie II, Forschungszentrum Jülich GmbH, D-52425 Jülich, Germany
(Received 13 January 1999)
The phase diagram of star polymer solutions in a good solvent is obtained over a wide range ofdensities and arm numbers by Monte Carlo simulations. The effective interaction between the starsis modeled by an ultrasoft pair potential which is logarithmic in the core-core distance. Among thestable phases are a fluid as well as body-centered cubic, face-centered cubic, body-centered orthogonaand diamond crystals. In a limited range of arm numbers, reentrant melting and reentrant freezingtransitions occur for increasing density. [S0031-9007(99)09465-X]
PACS numbers: 64.70.–p, 61.25.Hq, 82.70.Dd
sf-ntr-
anrs
ral
leonsntre
s--
if-
--cc,s-alnd
elyw
eor
dia-er
-
ira
A major challenge in statistical physics is to understanand predict the macroscopic phase behavior from a mcroscopic many-body theory for a given interaction btween the particles [1]. For a simple classical fluid [2], thinteraction is specified in terms of a radially symmetric papotentialV �r� wherer is the particle separation. Signifi-cant progress has been made during the last decadepredicting the thermodynamically stable phases for simpintermolecular pair potentials, such as for Lennard-Jonsystems, plasmas or hard spheres, using computer silations [1], and density functional theory [3]. Importanrealizations of classical many-body systems are suspsions of colloidal particles dispersed in a fluid medium.striking advantage of such colloidal samples over moleclar ones is that their effective pair interaction is eminenttunable through experimental control of particle and sovent properties [4]. This brings about more extreme painteractions, leading to novel phase transformations. Finstance, if the colloidal particles are sterically stabilizeagainst coagulation, the “softness” of the interparticle rpulsion is governed by the length of the polymer chaingrafted onto the colloidal surface, their surface graftindensity, and solvent quality. Computer simulations antheory have revealed that a fluid freezes into a bodcentered-cubic (bcc) crystal for soft long-ranged repusions and into a face-centered-cubic (fcc) one for stroshort-ranged repulsions [5]. This was confirmed in expements on sterically stabilized colloidal particles [6]. Asimilar behavior occurs for charge-stabilized suspensiowhere the softness ofV �r� is now controlled by the con-centration of added salt [7]. Less common effects weobserved for potentials involving an attractive part asifrom a repulsive core. In reducing the range of the attration, a vanishing liquid phase has been observed [8] andisostructural solid-solid transition was predicted [9]. Morcomplicated pair potentials can even lead to stable qsicrystalline phases and a quadruple point in the phaseagram [10].
The aim of this Letter is to study the phase diagram ofultrasoft repulsive pair potentialV �r� which is logrithmicin r inside a core of diameters and vanishes exponen-
0031-9007�99�82(26)�5289(4)$15.00
di-
e-isir
s inleesmu-ten-Au-lyl-irorde-sgdy-l-
ngri-
ns
redec-aneua-di-
an
tially in r outside the core. The motivation to do this itwofold: first, such a potential is a good model for the efective interaction between star polymers in a good solve[11,12], which can be regarded as sterically stabilized paticles where the size of the particles is much smaller ththe length of the grafted polymer chains [13]. These staare characterized by their arm number (or functionality)f,i.e., the number of polymer chains tethered to the centparticle, and their corona diameters which measures thespatial extension of the monomer density around a singstar center. Second, more fundamentally, phase transitifor such soft potentials are expected to be rather differefrom that for stronger repulsions. From a study of the pulogarithmic potential in two spatial dimensions [14], it isknown that one needs a critical prefactor to freeze the sytem, which is quite different from, e.g., inverse-power potentials. Furthermore, the potential crossover atr � s isexpected to influence drastically the freezing transition,the number densityr of the stars is near the overlap concentration,r� � 1�s3.
We obtain the full phase diagram of star polymer solutions by Monte Carlo simulation and theory. As a result, among the stable phases are a fluid as well as bfcc, body-centered orthogonal (bco), and diamond crytals. We emphasize that the stability of a bco crystwith anisotropic rectangular elementary cell and a diamostructure was never obtained before for aradially symmet-ric pair potential. In fact, there is a widespread belief in thliterature that anisotropic or three-body forces are soleresponsible for a stable diamond lattice [15]. We shothat both the crossover atr � s and the ultrasoftness ofthe core are crucial for the stability of the bco and thdiamond phase. Moreover, we get reentrant melting f34 & f & 60, and reentrant freezing for44 & f & 60 asr is increasing. Some features of the presented phasegram have already been observed in a system of copolymmicelles exhibiting a very similar interaction to star polymers [6,16].
With kBT denoting the thermal energy, our effective papotential between two star centers is a combination oflogarithm inside the core of sizes and a Yukawa potential
© 1999 The American Physical Society 5289
VOLUME 82, NUMBER 26 P H Y S I C A L R E V I E W L E T T E R S 28 JUNE 1999
outside the core [12],
V �r� �
518
kBTf3�2
8>><>>:
2 ln� rs � 1
1
11p
f�2�r # s�,
s
11p
f�2
exp�2p
f �r2s��2s�r �r . s� ,
(1)such that both the potential and its first derivative (or,equivalently, the force) are continuous at r � s [12].The decay length of the exponential is given by thelargest blob diameter within the Daoud-Cotton theoryfor single star polymers [17]. Experimental support forthis potential comes from neutron scattering data on thestructural ordering of 18-arm stars in the fluid phase [12]and shear moduli measurements in the crystalline phaseof micelles [18]. Furthermore, microscopic simulations oftwo star polymers have shown that this potential providesan excellent description of the effective star interaction fora broad range of arm numbers [19]. We note that V �r�becomes the hard sphere potential for f ! `.
Because of the purely entropic origin of the interstarrepulsion, the strength of the pair potential (1) scaleslinearly with kBT , causing the temperature to be an irrele-vant thermodynamic quantity. Therefore, for the calcu-lation of the phase diagram, only the packing fraction ofthe stars, h � p�6rs3, and the arm number f matter,the latter playing the role of an “effective inverse tempera-ture.” We use computer simulations to access the phasediagram. The free energies of the fluid phase and sev-eral possible solid phases are calculated by thermodynamicintegration via Monte Carlo simulations [20]. The free en-ergy of the fluid phase, Ffl, is obtained either by the well-known “pressure or density route” [2,20], or, alternatively,by the so-called “f route.” The pressure route relates thefree energy for nonvanishing h to that at zero packing frac-tion, keeping f fixed. In the f route, f is used as an arti-ficial thermodynamic variable, now keeping h fixed. Thefree energy of star polymers with a certain arm number fis then obtained by the following integration:
Ffl �Z f
0df 0
ø≠U≠f 0
¿f 0
. (2)
Here, U �P
i,j V �jri 2 rjj� is the total potential energyfunction which depends on f since V �r� depends on fparametrically. �· · ·�f 0 denotes the canonical ensembleaverage for a system with fixed arm number f 0. Therefore,in order to carry out the f-route integration, a series ofsimulations at fixed h but for increasing f 0 is performedto calculate the integrand of Eq. (2).
We use the Frenkel-Ladd method for continuous poten-tials to obtain the free energy of the solid phases [20,21].For these Monte Carlo calculations, suitable candidatecrystal structures have to be chosen. Our method to getinformation about the possible stable structures for fixed
5290
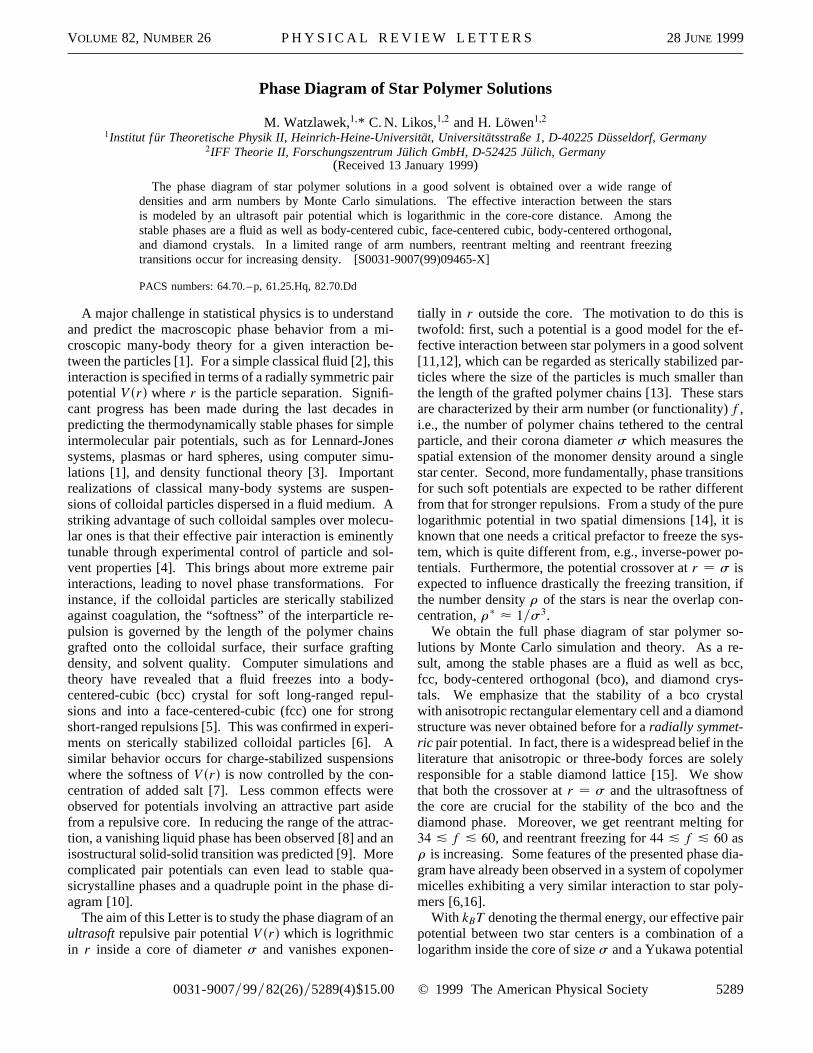
f and h consists of two steps: first, we calculate latticesums for a wide class of crystals, including the “usual”structures with cubic elementary cells (fcc, bcc, hcp, andsimple cubic) and several “unusual” structures. These un-usual structures are the hexagonal lattice, the diamondlattice, representations of quasicrystalline structures (see,e.g., Ref. [10]), and generalizations of the usual struc-tures, which were obtained by stretching the elementarycell lengths (denoted as a, b, and c) of these structuresby arbitrary factors, then using the two independent ra-tios b�a and c�a as minimization parameters of the lat-tice sum. Second, we calculate the global bond orderparameters [22] of the equilibrated structures, which werespontaneously formed in a first set of simulations, alwaysstarting from a purely random configuration. Crystal struc-tures whose bond order parameters are in agreement withthese measured parameters, and which have reasonablysmall values of the lattice sum, are then chosen as candi-date structures for the free energy calculations. This pro-cedure was performed for a wide range of arm numbers18 # f # 512 and packing fractions 0 # h # 1.5. Fi-nally, the obtained free energy data at fixed f were usedto explore the phase boundaries via the common dou-ble tangent construction. The resulting phase diagram isdisplayed in Fig. 1. In the explored range of f and h,four different stable crystal structures are found besides afluid phase. For f , fc 34, the fluid phase is stablefor all densities, which is in agreement with results ob-tained from an effective hard sphere mapping procedure[23] and from scaling theory [11]. We remark that Wittenet al. [11] only estimated fc within 1 order of magnitudeto be around f 100. For f $ fc, at least one stable
FIG. 1. The phase diagram of star polymer solutions fordifferent arm numbers f versus packing fraction h. Thesquares and the circles indicate the phase boundaries asobtained from computer simulations and theory, respectively;lines are only guides to the eye. The statistical error of thesimulations is of the order of the symbol size. The trianglesindicate the freezing and melting point of hard spheres.
VOLUME 82, NUMBER 26 P H Y S I C A L R E V I E W L E T T E R S 28 JUNE 1999
crystal phase is found. We focus first on the crystal phasesat 0.2 & h & 0.7: for fc , f & 54, a bcc phase is found,whereas for f * 70, only the fcc structure turns out to bestable. At intermediate f (54 & f & 70), bcc-fcc phasetransitions occur. For 0.2 & h & 0.7, the mean interpar-ticle distance r � r21�3 is larger than s, leaving only theexponential part of V �r� to be relevant for the phase be-havior. Therefore, the observance of a fcc phase for largef, corresponding to a short-range, strongly screened poten-tial, and a bcc phase for small f, corresponding to a long-range, less screened potential, is analogous to the phasebehavior found for charged colloids [5,7]. In Fig. 1, thefreezing and melting points for hard spheres, correspond-ing to f ! `, are shown as well, denoted by black trian-gles. We emphasize that even star polymers with very higharm numbers freeze at considerably smaller h than hardspheres. In fact, our simulations show that a “hard sphere-like” structure is found only for extremely high arm num-bers f * 10 000. Thus the change in the phase boundarycannot be shown on the scale of the figure.
Let us now consider the phase behavior for h 0.7,where r is in the order of s and the logarithmic part ofV �r� becomes relevant. From our calculations, a reentrantmelting transition, i.e., a transition from a solid to aliquid phase with increasing h, is found for 34 , f &
60. We note that this reentrant melting was alreadypredicted qualitatively by Witten et al. [11]. For f * 60,a solid-solid phase transformation into a bco phase takesplace. This unusual phase is stable up to h 1.0. For44 & f & 60, the remolten liquid refreezes into this bcostructure at h 0.80. At h 1.0, a further solid-solidphase transition from the bco into a diamond structure isfound, the latter being stable for arm numbers f * 44and packing fractions up to h 1.4 1.5. Notice thatthe extension of the two phase regions (“density jumps” )of all encountered phase transitions is extremely smalldue to the soft character of V �r� [24]. Moreover, theempirical Hansen-Verlet freezing rule [25] is valid for allpoints at the phase boundaries where we calculated thestatic structure factor S�q�. This also includes the reentrantmelting transition for h 0.7, where the S�q� for the fluidbegins to show unusual behavior [23].
We develop now a physical intuition for the unusual oc-currence of the bco and diamond phase. For this purpose,we report first on the detailed structure of the bco phase.At fixed h, the bco crystal is described by the two lengthratios of its elementary cell, b�a and c�a, respectively. Inorder to calculate the free energy of the bco crystal by theFrenkel-Ladd method, these ratios had to be determinedfrom a first set of simulations. In these NpT simulations[20], the system was free to adopt its optimal values forb�a and c�a, starting either from a purely random con-figuration or an initial bco configuration. Within the errorbars, the so determined elementary cell length ratios werein agreement with the values obtained from the minimiza-tion of the lattice sums. We therefore took the lattice sum
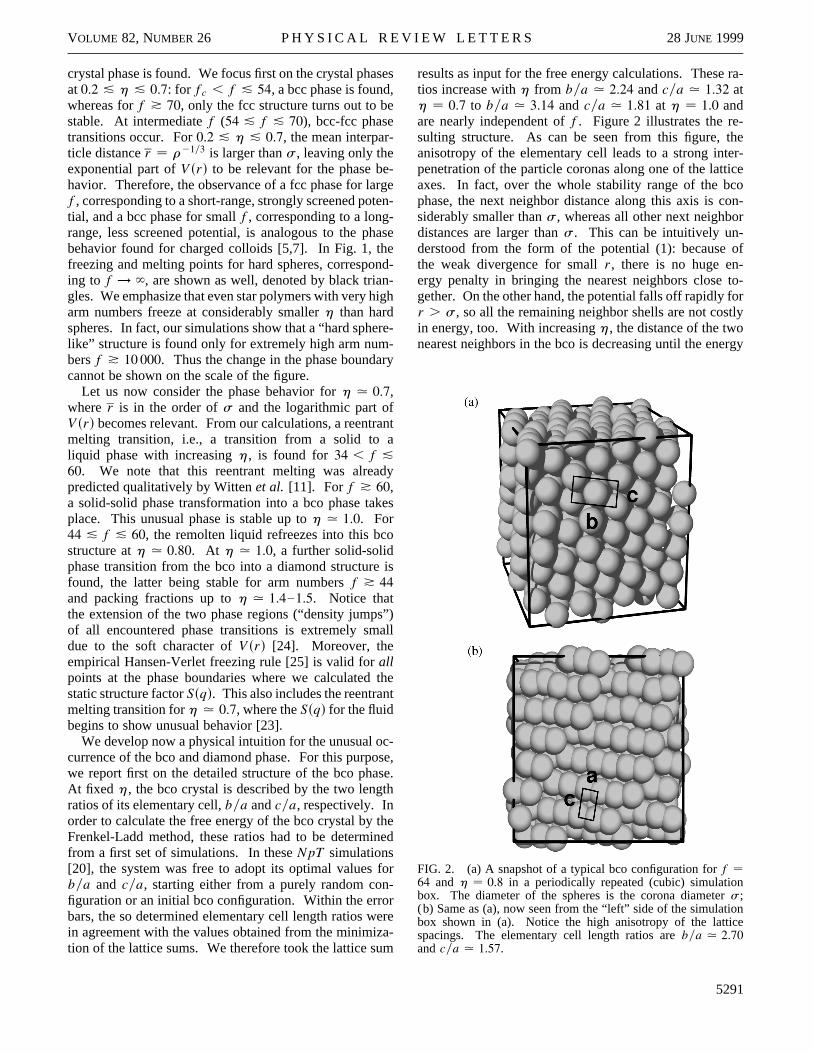
results as input for the free energy calculations. These ra-tios increase with h from b�a 2.24 and c�a 1.32 ath � 0.7 to b�a 3.14 and c�a 1.81 at h � 1.0 andare nearly independent of f. Figure 2 illustrates the re-sulting structure. As can be seen from this figure, theanisotropy of the elementary cell leads to a strong inter-penetration of the particle coronas along one of the latticeaxes. In fact, over the whole stability range of the bcophase, the next neighbor distance along this axis is con-siderably smaller than s, whereas all other next neighbordistances are larger than s. This can be intuitively un-derstood from the form of the potential (1): because ofthe weak divergence for small r , there is no huge en-ergy penalty in bringing the nearest neighbors close to-gether. On the other hand, the potential falls off rapidly forr . s, so all the remaining neighbor shells are not costlyin energy, too. With increasing h, the distance of the twonearest neighbors in the bco is decreasing until the energy
FIG. 2. (a) A snapshot of a typical bco configuration for f �64 and h � 0.8 in a periodically repeated (cubic) simulationbox. The diameter of the spheres is the corona diameter s;(b) Same as (a), now seen from the “ left” side of the simulationbox shown in (a). Notice the high anisotropy of the latticespacings. The elementary cell length ratios are b�a 2.70and c�a 1.57.
5291
VOLUME 82, NUMBER 26 P H Y S I C A L R E V I E W L E T T E R S 28 JUNE 1999
penalty becomes significant. Hence, the bco will then loseagainst another structure with more than two nearest neigh-bors inside the corona. A suitable structure is the diamondphase which possesses four tetrahedrally ordered nearestneighbors. Indeed, our simulations show that all the otherneighbors are kept outside the corona in the stability rangeof the diamond. Therefore, both the ultrasoft logarithmicpart and the crossover at r � s are crucial for the stabilityof the bco and the diamond phase. This provides a sim-ple reason why such phases have not been found earlierfor strongly repulsive interactions. We further note thatthe presented scenario also nicely expresses itself in theangle-average radial distribution functions g�r� of the bcoand diamond solid, which show a similar anomaly as foundin the g�r� of the fluid phase [23].
As for a further theoretical investigation, we solvedthe accurate Rogers-Young closure [26] to obtain the freeenergy of the fluid for f � 18, 32, 40, 48, and 64. Forthe aforementioned solid structures, we used the Einstein-crystal perturbation theory [27] to calculate the associatedfree energies. As this theory provides only an upper boundto the free energy, the domain of stability of the fluid isenhanced in comparison to the simulation results. Thetheory predicts 40 , fc , 48 and eliminates the domainof stability of the bcc crystal. Otherwise, as also shownin Fig. 1, the same phase behavior as determined fromsimulations emerges.
We finally note that all our predictions for r # 2r�, i.e.,h & 1.0, should be verifiable in scattering experiments,since for these densities pair interactions are dominant.In fact, in recent experimental work on spherical diblockcopolymer micelles, Gast and co-workers have alreadyconfirmed a part of our results [6,16]. The freezingtransition in fcc and bcc crystals depending on the numberof arms f is found [6] as well as reentrant melting withincreasing h [16]. For the “most starlike” system, also areentrant freezing is observed as predicted in Fig. 1. Forh * 1.0 however, when three stars exhibit overlaps withintheir coronae, many body interactions become important,which we have neglected in our calculations using the pairpotential (1). Nevertheless, from a theoretical point ofview, this potential turned out to be interesting also forh * 1.0, resulting for the first time in a stable diamondstructure for a purely radially symmetric pair interaction.
In conclusion, we have determined the phase diagramof star polymers over a broad range of arm numbers f andpacking fractions h by computer simulations and theory.The phase diagram includes a fluid phase as well as fourstable crystal phases. These crystal phases are a fcc crystaland a bcc crystal, as well as an unusual anisotropic bcostructure and a diamond crystal.
It is a pleasure to thank Professor Daan Frenkelfor helpful remarks. We further thank the DeutscheForschungsgemeinschaft for support within SFB 237.
5292
*Corresponding author.Email address: [email protected]
[1] Observation, Prediction and Simulation of Phase Transi-tions in Complex Fluids, edited by M. Baus, L. F. Rull,and J. P. Ryckaert (Kluwer, Dordrecht, The Netherlands,1995).
[2] See, e.g., J. P. Hansen and I. R. McDonald, Theory ofSimple Liquids (Academic, New York, 1986), 2nd ed.
[3] H. Löwen, Phys. Rep. 237, 249 (1994).[4] P. N. Pusey, in Liquids, Freezing and the Glass Transition,
edited by J. P. Hansen, D. Levesque, and J. Zinn-Justin(North-Holland, Amsterdam, 1991).
[5] M. O. Robbins, K. Kremer, and G. S. Grest, J. Chem. Phys.88, 3286 (1988); W. G. Hoover, S. G. Gray, and K. W.Johnson, J. Chem. Phys. 55, 1128 (1971); J. F. Lutskoand M. Baus, J. Phys. Condens. Matter 3, 6547 (1991).
[6] G. A. McConnell et al., Phys. Rev. Lett. 71, 2102 (1993).[7] E. B. Sirota et al., Phys. Rev. Lett. 62, 1524 (1989).[8] S. M. Ilett et al., Phys. Rev. E 51, 1344 (1995).[9] P. Bolhuis and D. Frenkel, Phys. Rev. Lett. 72, 2211
(1994).[10] A. R. Denton and H. Löwen, Phys. Rev. Lett. 81, 469
(1998); Prog. Colloid Polym. Sci. 104, 160 (1997).[11] T. A. Witten, P. A. Pincus, and M. E. Cates, Europhys.
Lett. 2, 137 (1986); T. A. Witten and P. A. Pincus,Macromolecules 19, 2509 (1986).
[12] C. N. Likos et al., Phys. Rev. Lett. 80, 4450 (1998).[13] G. S. Grest et al., Adv. Chem. Phys. XCIV, 67 (1996).[14] J. P. Hansen and D. Levesque, J. Phys. C 14, l603 (1981);
J. M. Caillol et al., J. Stat. Phys. 28, 325 (1982).[15] F. H. Stillinger and T. A. Weber, Phys. Rev. B 31, 5262
(1985); R. Biswas and D. R. Hamann, Phys. Rev. Lett. 55,2001 (1985); J. Tersoff, Phys. Rev. Lett. 56, 632 (1985);S. R. Phillpot et al., Phys. Rev. B 40, 2831 (1989).
[16] G. A. McConnell and A. P. Gast, Macromolecules 30, 435(1997).
[17] M. Daoud and J. P. Cotton, J. Phys. (Paris) 43, 531 (1982).[18] J. Buitenhuis and S. Förster, J. Chem. Phys. 107, 262
(1997).[19] A. Jusufi, M. Watzlawek, and H. Löwen, Macromolecules
(to be published).[20] D. Frenkel and B. Smit, Understanding Molecular Simu-
lation (Academic, San Diego, 1996).[21] D. Frenkel, Phys. Rev. Lett. 56, 858 (1986).[22] P. J. Steinhardt, D. R. Nelson, and M. Ronchetti, Phys.
Rev. B 28, 784 (1983); P. R. ten Wolde, M. J. Ruiz-Montero, and D. Frenkel, Phys. Rev. Lett. 75, 2714(1995).
[23] M. Watzlawek, H. Löwen, and C. N. Likos, J. Phys.Condens. Matter 10, 8189 (1998).
[24] A consideration of the so-called “volume terms” wouldlead to even smaller density jumps; see, e.g., H. Graf andH. Löwen, Phys. Rev. E 57, 5744 (1998).
[25] J. P. Hansen and L. Verlet, Phys. Rev. 184, 151 (1969).[26] F. J. Rogers and D. A. Young, Phys. Rev. A 30, 999
(1984).[27] C. F. Tejero et al., Phys. Rev. Lett. 73, 752 (1994); Phys.
Rev. E 51, 558 (1995).


![magick-28061nWaEmHwq7xzj · Steeldartpíteffle Die beliebte Star-Editian für Einsteiger Black Star Silver Star Gold Star Blue Star Il ]Xings Die Kings Darl Einsteiger-Serie mil Barrels](https://img.pdfslide.org/doc/110x75/5d549ccb88c993ce318b90d1/magick-28061nwaemhwq7xzj-steeldartpiteffle-die-beliebte-star-editian-fuer-einsteiger.jpg)