Embed Size (px)
Citation preview
SUPPLEMENTARY INFORMATION
Polymeric IgA1 controls erythroblast proliferation and accelerates
erythropoiesis recovery in anemia
Séverine Coulon1,Φ,*
, Michaël Dussiot1,2,3,*
, Damien Grapton1,2,3
, Thiago Trovati Maciel2,3
,
Pamella Huey Mei Wang2,3
, Celine Callens1, Meetu Kaushik Tiwari
2,3, Saurabh Agarwal
2,3,
Aurelie Fricot1, Julie Vandekerckhove
1, Houda Tamouza
2,3, Yael Zermati
1, Jean-Antoine
Ribeil1,¥
, Kamel Djedaini4, Zeliha Oruc
5, Virginie Pascal
5,
Geneviève Courtois1, Bertrand
Arnulf6,7
, Marie-Alexandra Alyanakian8,9
, Patrick Mayeux10,11,12
, Tomas Leanderson13
, Marc
Benhamou2,3
, Michel Cogné5, Renato C. Monteiro
2,3, Olivier Hermine
1,14 and Ivan C. Moura
2,3
1CNRS UMR 8147, Université Paris Descartes, Faculté de Médecine, Hôpital Necker, Paris, France
2INSERM U699, Paris, France
3Faculté de Médecine and Université Denis Diderot Paris VII, Paris, France
4Clinique Geoffroy Saint-Hilaire, Paris, France
5Université de Limoges; CNRS UMR 6101, France
6Service d’Immuno-Hématologie, Faculté de Médecine and Université Denis Diderot Paris VII, Assistance
Publique-Hôpitaux de Paris, Hôpital Saint Louis, Paris, France 7Laboratoire EA3963, Faculté de Médecine and Université Denis Diderot Paris VII, Assistance Publique-Hôpitaux
de Paris, Hôpital Saint Louis, Paris, France. 8INSERM U1013, Université Paris Descartes, Faculté de Médecine, Hôpital Necker, Paris, France
9Laboratoire d'Immunologie Biologique, Assistance Publique-Hôpitaux de Paris, Hôpital Necker, Paris, France
10Institut Cochin, Département d'Hématologie, Paris, France
11INSERM U567, Paris, France
12 CNRS UMR 8104, Université Paris Descartes, Faculté de Médecine, Paris, France
13 Immunology Group, Lund University, Lund, Sweden
14 Service d’Hématologie clinique, Assistance Publique-Hôpitaux de Paris, Hôpital Necker, Paris, France
Φ Present Adress : Service de Pharmacie , Assistance Publique-Hôpitaux de Paris, Hôpital Cochin, Paris, France
¥ Present Adress: Departement de Biothérapie, Hôpital Necker, Paris, France
* These authors contributed equally to this work
Address correspondence to: Ivan Cruz Moura, Ph.D., INSERM U699, Immunopathologie rénale, récepteurs et
inflammation, Faculté de Médecine Xavier Bichat. 16, Rue Henri Huchard. F-75870 Paris Cedex 18 Paris, France.
Phone : 33-1-5727-730 1 ; FAX : 33-1-5727-7661 ; e-mail : [email protected], to Renato Monteiro, M.D.,
Ph.D., INSERM U699, Immunopathologie rénale, récepteurs et inflammation, Faculté de Médecine Xavier
Bichat. 16, Rue Henri Huchard. F-75870 Paris Cedex 18 Paris, France. Phone : 33-1-5727-730 1 ; FAX : 33-1-
5727-7661 ; e-mail : [email protected] or to: Olivier Hermine, M.D., Ph.D., Centre National de la
Recherche Scientifique-Unité Mixte de Recherche 8147, Université Paris V. René Descartes, Hôpital Necker, 161
rue de Sèvres, 75015 Paris, France. Phone: 33-1-4449-0675; Fax: 33-1-4449-0676; e-mail:
Nature Medicine doi:10.1038/nm.2462
ba
U937 cells
ells
C
Immunoglobulin binding
pIgA1
mIgA1
IgG
CD36+ Cells
Immunoglobulin binding
ells
C
pIgA1
mIgA1
IgG
c
UT7-Epo cells K562 cells
Erythroid cells
llse
C
Immunoglobulin binding
llse
C
Immunoglobulin bindingImmunoglobulin binding
ells
C
TF1-Epo cells
pIgA1
mIgA1
IgG
feUT7
IgG IgA IgA
IP
IB TfR1
sTfR1 sCD89
U937
sTfR1 sCD89
UT7
IB CD89
IP
0
50
100
150 CD89
% r
ela
tive t
o G
AP
DH
0
50
100
150 ASGPR
% r
ela
tive t
o G
AP
DH
CD36+ cells HT29
0
50
100
150 pIgR
% r
ela
tive t
o G
AP
DH
CD36+ cells Tom1
CD36+ 63DC265K + cells U937 CD36+ cells HepG2cells
0
200
400
600 TfR1
% r
ela
tive t
o G
AP
DH
0
50
100
150 Fc α / µ R
% r
ela
tive t
o G
AP
DH
d
UT7 U937
ells
Cells
C
ells
Clls
eC
g
IP
IB TfR1
pIgA
1-be
ads
CD36+ cells
IgG-b
eads
IgG-b
eads
IgG-b
eads
pIgA
1-be
ads
pIgA
1-be
ads
IgG-b
eads
pIgA
1-be
ads
Ant
i-IgA
TfR1
CD89
Nature Medicine doi:10.1038/nm.2462
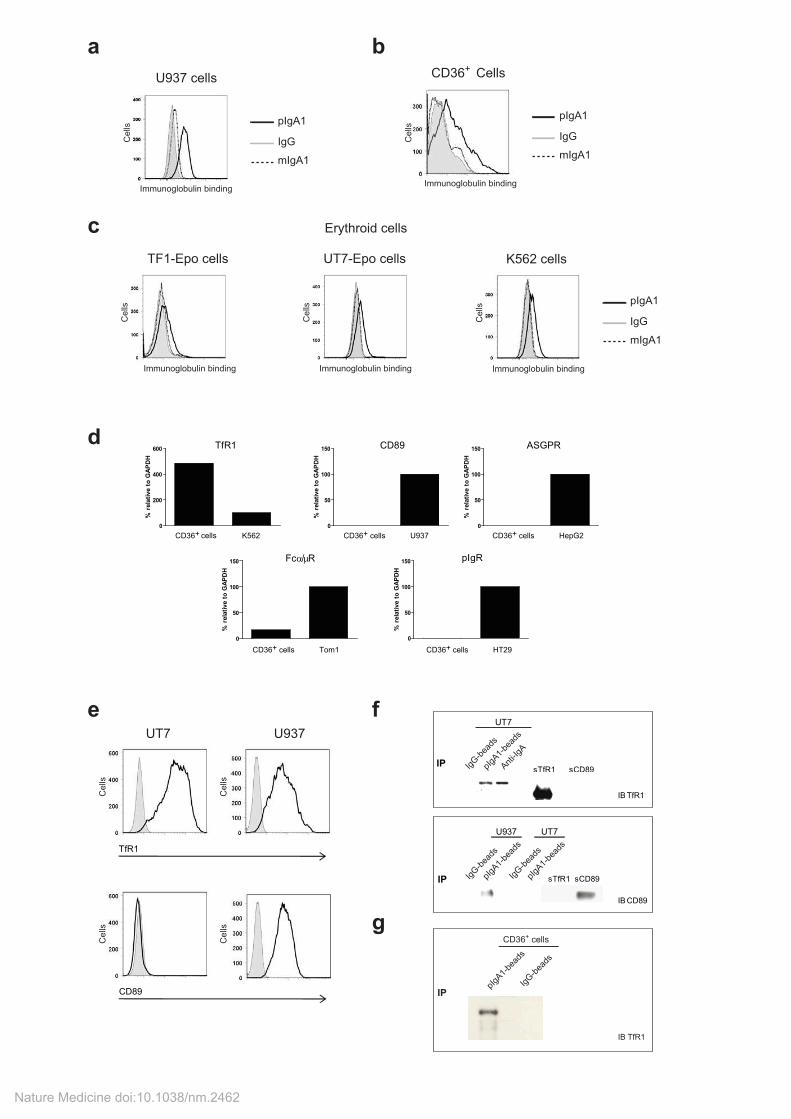
Supplementary Figure 1: pIgA1 binds human erythroid cells through TfR1.
Binding of pIgA1 (black line), mIgA1 (dotted line) or IgG (shaded gray, used to control for non-specific binding) to: (a) myeloid cell line U937, (b) CD36
+ primary cells, (c) growth factors dependent (TF1-
Epo, UT7-Epo) or independent (K562) erythroid cell lines. For Ig binding cells were incubated with 0.25 mg ml
-1 for 1 h on ice before washing and incubation for 20 min at 4°C with a biotinylated goat
anti-human IgA followed staining with allophycocyanin (APC)-streptavidin (SouthernBiotech). (d and e) Expression of IgA receptors in human erythroid cells. (d) Total RNA was extracted from CD36
+
erythroid cells that had been cultured for 4 days, and the expression of the transcripts for the five
known IgA receptors (TfR1, CD89, Fc /µR, pIgR and ASGPR) was evaluated by quantitative RT-PCR relative to GAPDH. Positive controls from relevant cell lines are included. (e) Representative immunofluorescence analysis of the expression of TfR1 (upper panels) or CD89 (lower panels) on the erythroid cell line UT7 or the myelomonocytic cell line U937 (black line) compared with the isotype control (shaded gray). One representative experiment of three is shown. Binding of pIgA1 to IgA-R (f-g). Binding of pIgA1 to TfR1 or CD89 (f). Binding was demonstrated by co-immunoprecipitation with pIgA1-conjugated Sepharose 4B beads or with pIgA1 and F(ab’)2 anti-IgA-conjugated Sepharose 4B. IgG-conjugated Sepharose 4B beads were used as a negative control. The presence of TfR1 (upper panel; erythroid cell line UT7 cultured with Epo) or CD89 (lower panel; erythroid cell line UT7 cultured with Epo and myelomonocytic cell line U937) in immunoprecipitates was demonstrated by immunoblotting. The recombinant soluble forms of TfR1 and of CD89 used as positive controls for immunoblotting are shown. The data are representative of three independent experiments. (g) Binding of pIgA1 to TfR1 from primary CD36
+ cells lysates. Binding was demonstrated by immunoprecipitation
with pIgA1- (or IgG as a control) conjugated Sepharose 4B beads. The presence of TfR1 was visualized by immunoblotting.
Nature Medicine doi:10.1038/nm.2462
bCD36+ Cells
c
pIgA1
pIgA1 + sTfR1
IgG
pIgA1
pIgA1 + A24
IgG
Immunoglobulin binding Immunoglobulin binding
Cells
Cells
Immunoglobulin binding
ells
C
a
pIgA1
pIgA1 + siRNA-TfR1
IgG
UT7-Epo cells
TfR1
ActinImmunoglobulin binding
% o
f M
ax
UT7-Epo cellsUT7-Epo cells
siR
NA
-TfR
1si
RN
A-S
cram
ble
pIgA1IgG
FS
C
FS
C
Caspase activationCaspase activationPBS
mIg
A1
pIgA
1
GST-J
Cha
inGST
0.00
0.05
0.10
0.15
0.20*
*
**
Cum
ula
tive
cells
(x1
06) *
IgG mIgA1 pIgA10
10
20
30
40 **
**
BF
U-E
deri
ved c
olo
nie
s
(num
ber
per
500 c
ells
pla
ted)
d e
0 2 4 6 8 100
50
100
150
200
250Exp 1
Exp 2
Exp 3
Exp 4
Exp 5
Time (d)
TfR
1 e
xpre
ssio
n
on e
ryth
roid
cells
(M
FI)
f
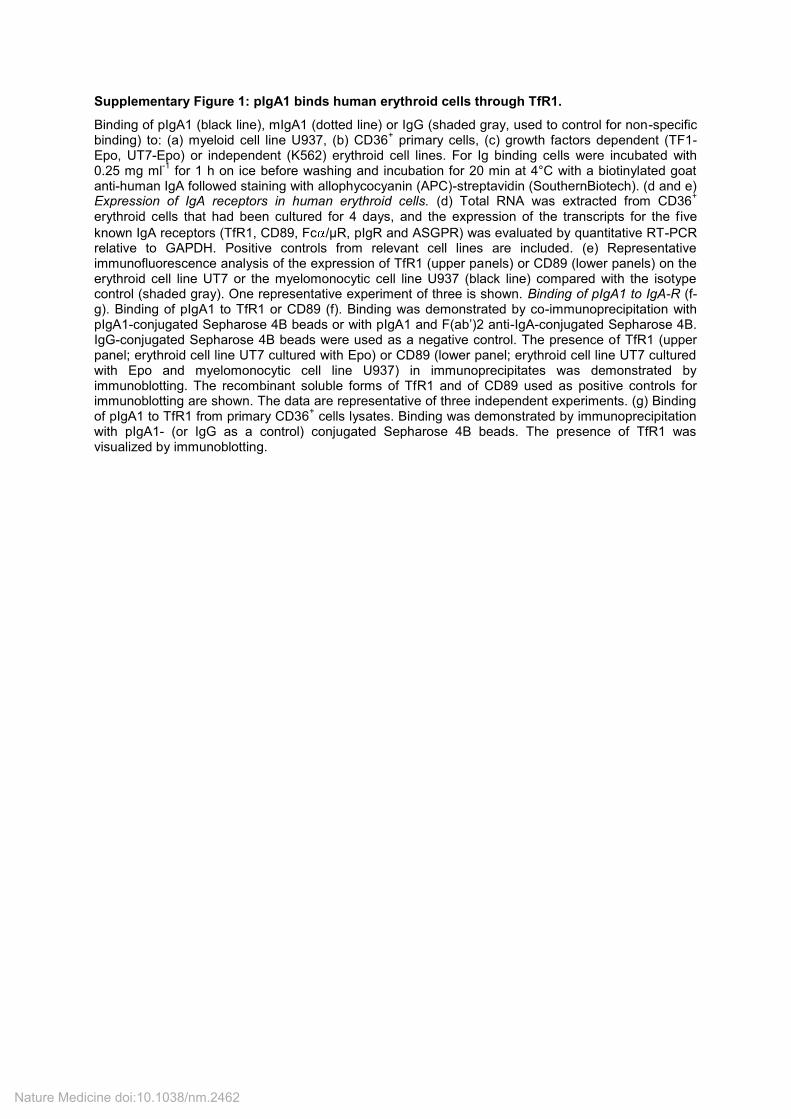
Supplementary Figure 2: pIgA1 binds to TfR1 and induces erythroid cells growth.
(a) pIgA1 binding to CD36+ primary cells and UT7 cells (black line) was inhibited by preincubation of pIgA1 for 30 min
with soluble (s)TfR1 (dotted line). (b) pIgA1 binding to cells (black line) was inhibited by preincubation of the cells for 30 minutes with anti-TfR1 mAb A24 (which induces TfR1 internalization) (dotted line). (c) pIgA1 binding to cells transfected with a TfR1 siRNA. Right: immunoblotting confirming TfR1 down-regulation by siRNA. Actin was used to control equal protein loading. Left: Histograms showing that pIgA1 binding to cells (black line) was inhibited in siRNA transfected cells (dotted line). In all histograms IgG binding is shown (shaded gray). Data are representative of three independent experiments. IgA1 polymers induce early erythroblasts growth. (d) UT7 cells deprived of Epo for 18 hours and cultured in the presence of 0.2mg ml
-1 of pIgA1 or IgG as a control. Cells were fixed, permeabilized and activated
caspase-3 was revealed by immunofluorescence and flow cytometry as described in Supplemental Material and Methods. (e) Left: 5.10
4 CD36
+ erythroid cells (generated from CD34
+ cord blood cells as described in Material and
Methods) were cultured with IL-3 (10 ng ml-1
), SCF (100 ng ml-1
) and Epo (0.1 U ml-1
), in the presence of 0.2 mg ml-1
of: pIgA1, mIgA1, purified recombinant GST-J-chain or purified GST, or PBS as indicated. The number of viable cells (at day four) is shown. Counts are from three independent cultures derived from one cord blood sample. The experiment was repeated with three independent cord blood samples. One representative experiment is shown. The data are presented as the mean ± SEM *p < 0.05; **p < 0.01. Right: Semisolid cultures for the detection of BFU-E in the presence of pIgA1, mIgA1 or IgG as a control. CD34
+ progenitors from human cord blood were cultured for 16
days in methylcellulose medium supplemented with IL-3, IL-6, GM-CSF and suboptimal concentrations of Epo (0.1 U ml
-1) in the presence of 0.2 mg ml
-1 pIgA1 (black bar), mIgA1 (gray bar) or IgG (empty bar). The data are presented as
the mean ± SEM (n=3) ** p <0.01. One representative experiment of three is shown. (f) Analysis of TfR1 expression throughout erythroblast differentiation. Flow cytometry analysis of the time-course of TfR1 expression in CD36
+
cultures. Five independent experiments are shown. Nature Medicine doi:10.1038/nm.2462
b c d
Hea
lthy vo
lunt
eer
IgA d
eficient
IgA d
eficient
+ p
IgA1
IgA d
eficient
+Ig
G
0
25
5050
75
100
* *
Annexin
V+/P
I+ c
ells
(%
)
0.0
0.1
0.2
0.3
0.4
0.5
*
*
Cum
ula
tive c
ells
(x1
06)
Hea
lthy vo
lunt
eer
IgA d
eficient
IgA d
eficient
+ p
IgA1
IgA d
eficient
+Ig
G
a
Serum Bone Marrow0
20
60
100pIgA1
mIgA1
x 3
AU
C o
f to
tal Ig
A1 (
%)
0 10 20 30 40 500
2
4
10
30
50Bone marrow
Serum
850 k
Da
350 k
Da
150 k
Da
Fraction number
IgA
(µ
g m
l-1)
Healthy volunteers IgA deficient patients0
5
10
15
20
25 **
Epo s
eru
m level (m
U m
l-1)
AKT
ERK
p-ERK
p-AKT
0 3 10 30 3 10 30
pIgA1 SCF
Time (min)
HSC70
fe g
p-ERK
p-JAK2
p-AKT
ERK
AKT
p-mTOR
p-STAT5a
Epo
IgA1
0pIgA1
1
p-AKT
AKT
Epo (U ml-1)
2 3 4 0 .03 .2 1
h i
p-ERK/ERK
p-AKT/AKT
0 50 100 150 200
0
.16
.8
4
+ PBS
+ pIgA1
+ PBS
+ pIgA1
**
**
ERK
p-ERK
AKT
p-AKT
0 .16 .8 4 0 .16 .8 4
+ pIgA1
SCF (ng ml-1)
SC
F (
ng
ml-1
)
Intensity
(% relative to 4 ng ml-1 SCF)
ERK
p-ERK
AKT
p-AKT
0 .03 .2 1 0 .03 .2 1
+ pIgA1
Epo (U ml-1)
Nature Medicine doi:10.1038/nm.2462
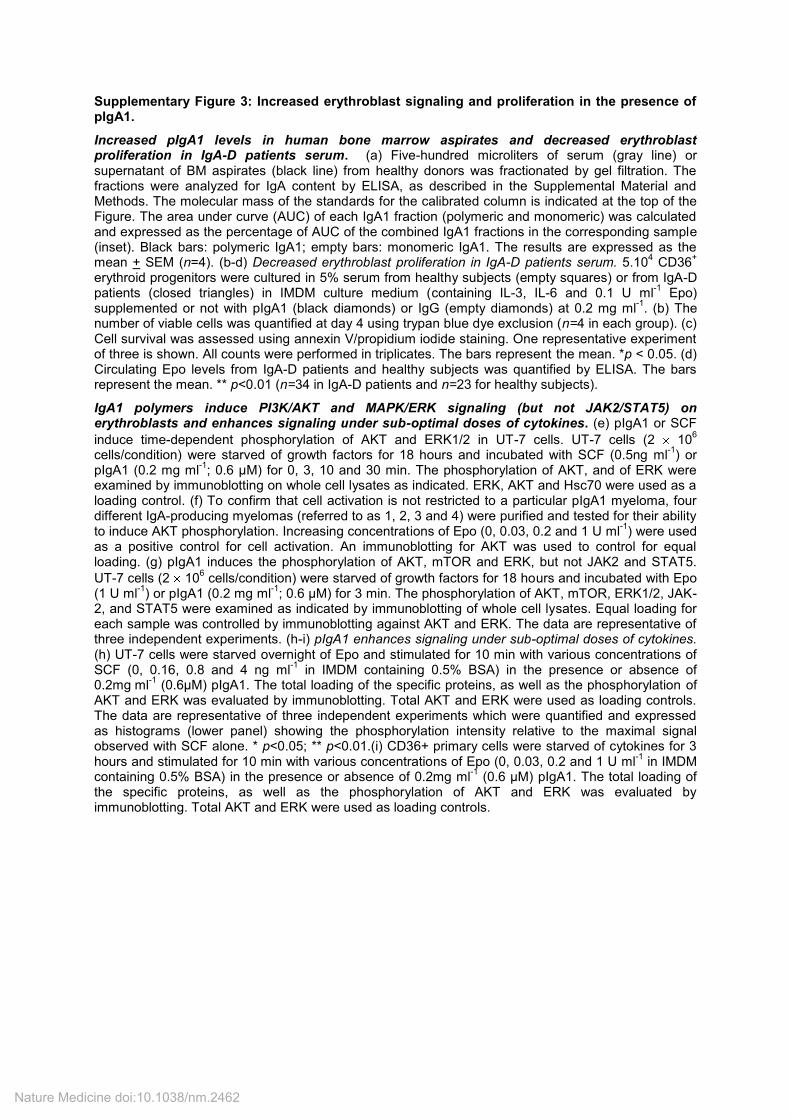
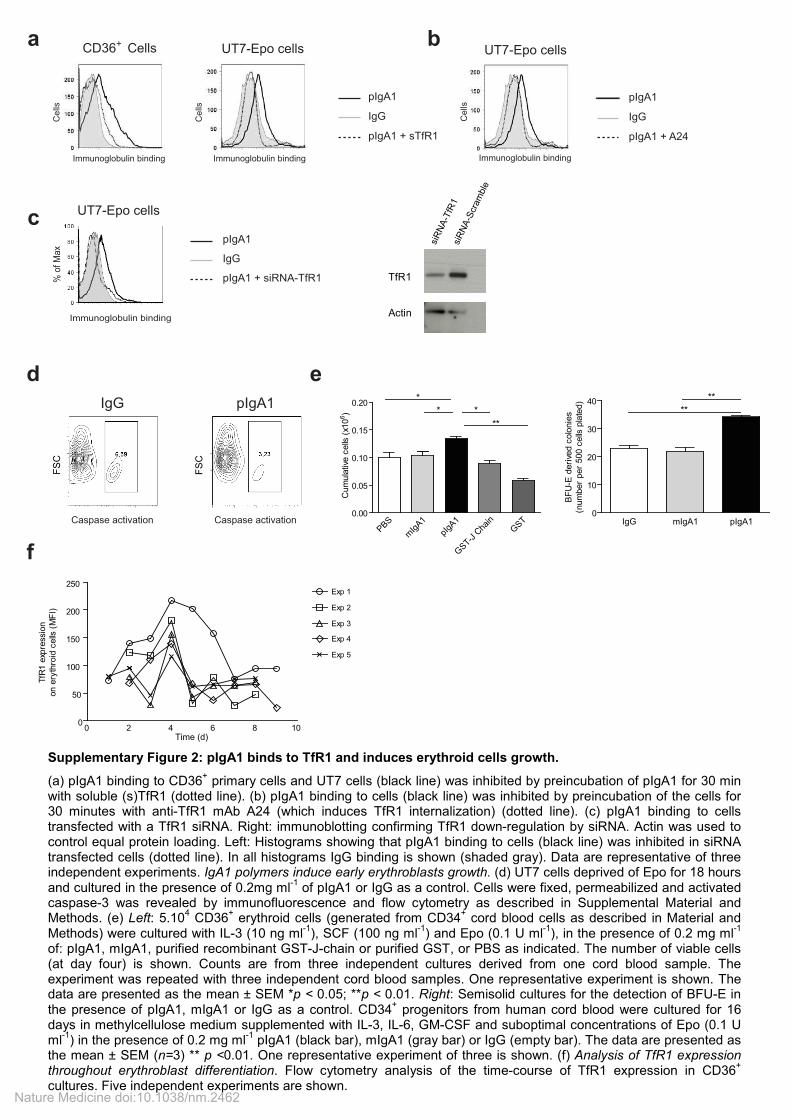
Supplementary Figure 3: Increased erythroblast signaling and proliferation in the presence of pIgA1.
Increased pIgA1 levels in human bone marrow aspirates and decreased erythroblast proliferation in IgA-D patients serum. (a) Five-hundred microliters of serum (gray line) or supernatant of BM aspirates (black line) from healthy donors was fractionated by gel filtration. The fractions were analyzed for IgA content by ELISA, as described in the Supplemental Material and Methods. The molecular mass of the standards for the calibrated column is indicated at the top of the Figure. The area under curve (AUC) of each IgA1 fraction (polymeric and monomeric) was calculated and expressed as the percentage of AUC of the combined IgA1 fractions in the corresponding sample (inset). Black bars: polymeric IgA1; empty bars: monomeric IgA1. The results are expressed as the mean + SEM (n=4). (b-d) Decreased erythroblast proliferation in IgA-D patients serum. 5.10
4 CD36
+
erythroid progenitors were cultured in 5% serum from healthy subjects (empty squares) or from IgA-D patients (closed triangles) in IMDM culture medium (containing IL-3, IL-6 and 0.1 U ml
-1 Epo)
supplemented or not with pIgA1 (black diamonds) or IgG (empty diamonds) at 0.2 mg ml-1
. (b) The number of viable cells was quantified at day 4 using trypan blue dye exclusion (n=4 in each group). (c) Cell survival was assessed using annexin V/propidium iodide staining. One representative experiment of three is shown. All counts were performed in triplicates. The bars represent the mean. *p < 0.05. (d) Circulating Epo levels from IgA-D patients and healthy subjects was quantified by ELISA. The bars represent the mean. ** p<0.01 (n=34 in IgA-D patients and n=23 for healthy subjects).
IgA1 polymers induce PI3K/AKT and MAPK/ERK signaling (but not JAK2/STAT5) on erythroblasts and enhances signaling under sub-optimal doses of cytokines. (e) pIgA1 or SCF
induce time-dependent phosphorylation of AKT and ERK1/2 in UT-7 cells. UT-7 cells (2 106
cells/condition) were starved of growth factors for 18 hours and incubated with SCF (0.5ng ml-1
) or pIgA1 (0.2 mg ml
-1; 0.6 µM) for 0, 3, 10 and 30 min. The phosphorylation of AKT, and of ERK were
examined by immunoblotting on whole cell lysates as indicated. ERK, AKT and Hsc70 were used as a loading control. (f) To confirm that cell activation is not restricted to a particular pIgA1 myeloma, four different IgA-producing myelomas (referred to as 1, 2, 3 and 4) were purified and tested for their ability to induce AKT phosphorylation. Increasing concentrations of Epo (0, 0.03, 0.2 and 1 U ml
-1) were used
as a positive control for cell activation. An immunoblotting for AKT was used to control for equal loading. (g) pIgA1 induces the phosphorylation of AKT, mTOR and ERK, but not JAK2 and STAT5.
UT-7 cells (2 106 cells/condition) were starved of growth factors for 18 hours and incubated with Epo
(1 U ml-1
) or pIgA1 (0.2 mg ml-1
; 0.6 µM) for 3 min. The phosphorylation of AKT, mTOR, ERK1/2, JAK-2, and STAT5 were examined as indicated by immunoblotting of whole cell lysates. Equal loading for each sample was controlled by immunoblotting against AKT and ERK. The data are representative of three independent experiments. (h-i) pIgA1 enhances signaling under sub-optimal doses of cytokines. (h) UT-7 cells were starved overnight of Epo and stimulated for 10 min with various concentrations of SCF (0, 0.16, 0.8 and 4 ng ml
-1 in IMDM containing 0.5% BSA) in the presence or absence of
0.2mg ml-1
(0.6µM) pIgA1. The total loading of the specific proteins, as well as the phosphorylation of AKT and ERK was evaluated by immunoblotting. Total AKT and ERK were used as loading controls. The data are representative of three independent experiments which were quantified and expressed as histograms (lower panel) showing the phosphorylation intensity relative to the maximal signal observed with SCF alone. * p<0.05; ** p<0.01.(i) CD36+ primary cells were starved of cytokines for 3 hours and stimulated for 10 min with various concentrations of Epo (0, 0.03, 0.2 and 1 U ml
-1 in IMDM
containing 0.5% BSA) in the presence or absence of 0.2mg ml-1
(0.6 µM) pIgA1. The total loading of the specific proteins, as well as the phosphorylation of AKT and ERK was evaluated by immunoblotting. Total AKT and ERK were used as loading controls.
Nature Medicine doi:10.1038/nm.2462
d
α1KI α1KI/Igj -/-0
0.5
1.0
1.5 **
IgA
1 (
mg
ml-1
)
c
0 10
40
80
120
5 10 15 20 25 30 35 40 45 50 55 60 65 70 75 80
α1KI
α1KI/Igj -/-
Time (hours)
(CIg
A/C
max)
x100
pIgA1
IgG
a
TfR
1
TER-119
R2
R1
llse
C
Gated on R1
(TfR1-/TER-119+ cells)
Immunoglobulin binding
ells
C
Gated on R2
(TfR1+/TER-119+ cells)
Immunoglobulin binding
b
100
03020100
20
40
60
80α1KI serum
α1KI/Igj -/- serum
Human serum
Fraction number
IgA
1 (
pe
rce
nt o
f m
ax)
e
LT α1KI0
50
100
150
200
250
Epo s
eru
m leve
l (p
g m
l-1)
LT α1KI0
100
200
300
Ferr
itin
(ng l
-1)
f
LT α1KI0
0.5
1.0
1.5
Tra
nsfe
rrin
(g l
-1)
g
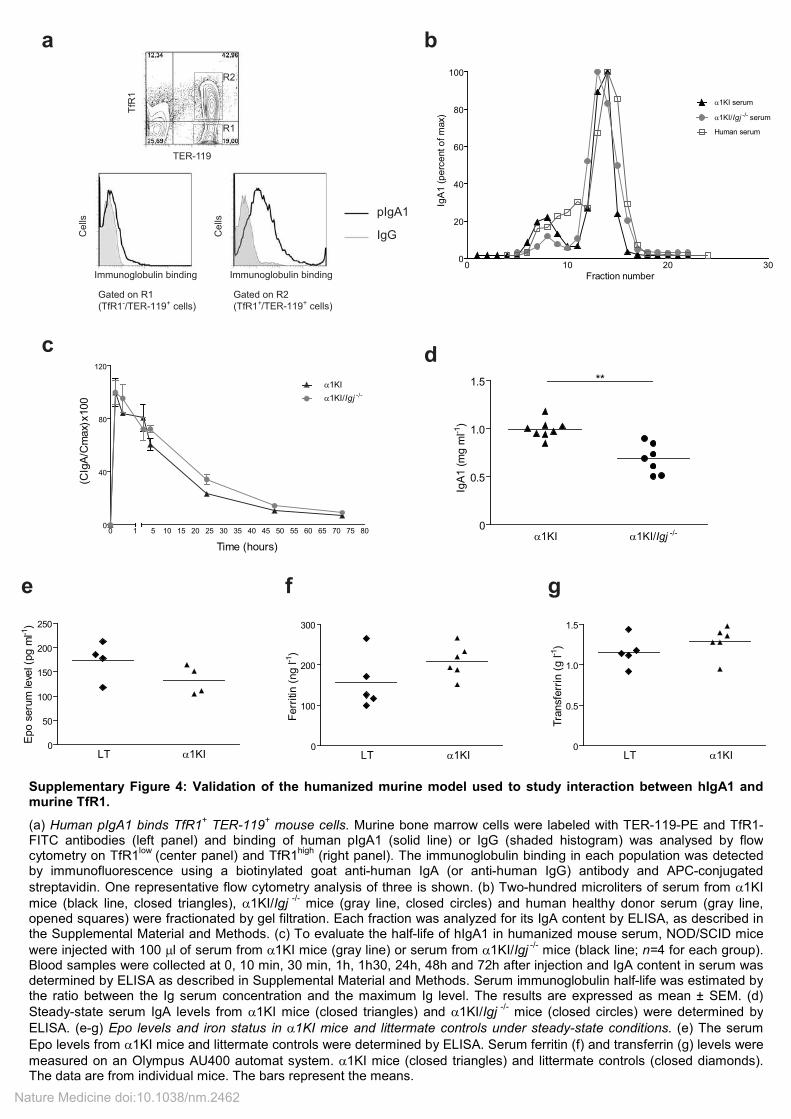
Supplementary Figure 4: Validation of the humanized murine model used to study interaction between hIgA1 and murine TfR1.
(a) Human pIgA1 binds TfR1+ TER-119
+ mouse cells. Murine bone marrow cells were labeled with TER-119-PE and TfR1-
FITC antibodies (left panel) and binding of human pIgA1 (solid line) or IgG (shaded histogram) was analysed by flow cytometry on TfR1
low (center panel) and TfR1
high (right panel). The immunoglobulin binding in each population was detected
by immunofluorescence using a biotinylated goat anti-human IgA (or anti-human IgG) antibody and APC-conjugated
streptavidin. One representative flow cytometry analysis of three is shown. (b) Two-hundred microliters of serum from α1KI
mice (black line, closed triangles), α1KI/Igj -/-
mice (gray line, closed circles) and human healthy donor serum (gray line, opened squares) were fractionated by gel filtration. Each fraction was analyzed for its IgA content by ELISA, as described in the Supplemental Material and Methods. (c) To evaluate the half-life of hIgA1 in humanized mouse serum, NOD/SCID mice
were injected with 100 µl of serum from α1KI mice (gray line) or serum from α1KI/Igj -/-
mice (black line; n=4 for each group). Blood samples were collected at 0, 10 min, 30 min, 1h, 1h30, 24h, 48h and 72h after injection and IgA content in serum was determined by ELISA as described in Supplemental Material and Methods. Serum immunoglobulin half-life was estimated by the ratio between the Ig serum concentration and the maximum Ig level. The results are expressed as mean ± SEM. (d)
Steady-state serum IgA levels from α1KI mice (closed triangles) and α1KI/Igj -/-
mice (closed circles) were determined by
ELISA. (e-g) Epo levels and iron status in α1KI mice and littermate controls under steady-state conditions. (e) The serum
Epo levels from α1KI mice and littermate controls were determined by ELISA. Serum ferritin (f) and transferrin (g) levels were
measured on an Olympus AU400 automat system. α1KI mice (closed triangles) and littermate controls (closed diamonds). The data are from individual mice. The bars represent the means.
Nature Medicine doi:10.1038/nm.2462
a
LT α1KI0
88
9
10
11
12
**
RB
C (
x10
6 p
er
mm
3)
b
LT α1KI0
20
4040
50
60
70
**
He
ma
tocrit
(%)
c
LT α1KI0
0.2
0.4
0.6
Re
tic
ulo
cy
tes
(x1
06 p
er
mm
3)
IgG pIgA10
5
10
15 *
BF
U-E
(num
ber
per
10
4 b
one m
arr
ow
cells
)
e
IgG pIgA10
2
4
6
8
10
12 **
TE
R-1
19
+ /
CD
71
+ c
ells
(x10
6 c
ells
pe
r fe
mu
r)
fd
Pro-E Ery-A Ery-B Ery-C0.001
0.01
0.1
1
10
100
LT
α1KI
Ery
thro
bla
sts
(x1
06 c
ells
per
fem
ur)
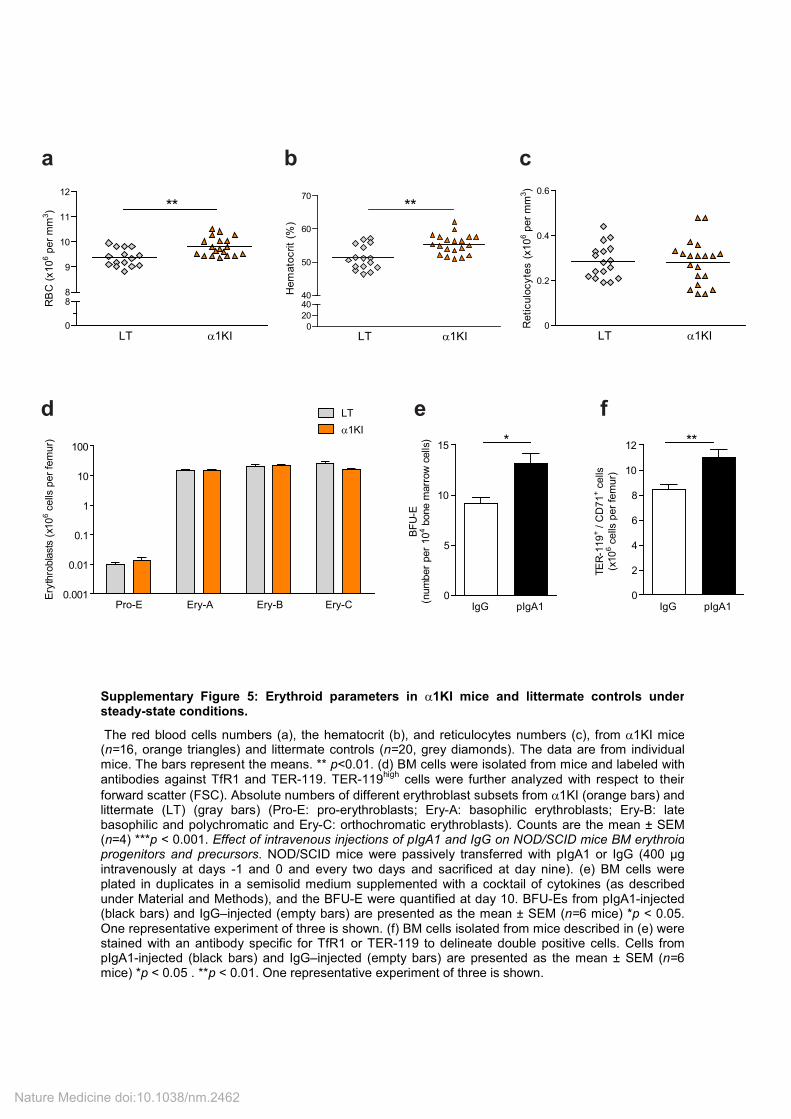
Supplementary Figure 5: Erythroid parameters in α1KI mice and littermate controls under steady-state conditions.
The red blood cells numbers (a), the hematocrit (b), and reticulocytes numbers (c), from α1KI mice (n=16, orange triangles) and littermate controls (n=20, grey diamonds). The data are from individual mice. The bars represent the means. ** p<0.01. (d) BM cells were isolated from mice and labeled with antibodies against TfR1 and TER-119. TER-119
high cells were further analyzed with respect to their
forward scatter (FSC). Absolute numbers of different erythroblast subsets from α1KI (orange bars) and littermate (LT) (gray bars) (Pro-E: pro-erythroblasts; Ery-A: basophilic erythroblasts; Ery-B: late basophilic and polychromatic and Ery-C: orthochromatic erythroblasts). Counts are the mean ± SEM (n=4) ***p < 0.001. Effect of intravenous injections of pIgA1 and IgG on NOD/SCID mice BM erythroid progenitors and precursors. NOD/SCID mice were passively transferred with pIgA1 or IgG (400 µg intravenously at days -1 and 0 and every two days and sacrificed at day nine). (e) BM cells were plated in duplicates in a semisolid medium supplemented with a cocktail of cytokines (as described under Material and Methods), and the BFU-E were quantified at day 10. BFU-Es from pIgA1-injected (black bars) and IgG–injected (empty bars) are presented as the mean ± SEM (n=6 mice) *p < 0.05. One representative experiment of three is shown. (f) BM cells isolated from mice described in (e) were stained with an antibody specific for TfR1 or TER-119 to delineate double positive cells. Cells from pIgA1-injected (black bars) and IgG–injected (empty bars) are presented as the mean ± SEM (n=6 mice) *p < 0.05 . **p < 0.01. One representative experiment of three is shown.
Nature Medicine doi:10.1038/nm.2462
dP
HZ
α1
KI
LT
LT
α1
KI
0.0
0.1
0.2
0.3
0.4
0.5
*
Spleen weight (g)
eL
itte
rma
teα1K
I
TfR1
911-
RE
T9
11-R
ET
TfR1
%5-/
+9
6%
7-/+
82
PH
Z
LT
α1
KI
0
50
100
150
200
*
TER-119+ / CD71
+ cells
(x106 per spleen)
ab
c
02
57
91
20
20
40
60
LT
Igj
-/-
Tim
e (
d)
Hematocrit (%)
02
57
91
2012345
Tim
e (
d)
Reticulocytes (x106 per mm
3)
LT
Igj
-/-
02
57
91
204456789
10
Tim
e (
d)
RBC (x106 per mm
3)
LT
Igj
-/-
Su
pp
lem
en
tary
Fig
ure
6:
Hu
man
pIg
A1
, b
ut
no
t m
ou
se p
IgA
, en
han
ce e
ryth
rop
oie
tic r
eco
very
in
mic
e s
ub
jecte
d t
o a
ne
mia
. M
ouse I
gA
po
lym
ers
do n
ot
accele
rate
ery
thro
po
iesis
recovery
. (a
-c)
Mic
e w
ere
subje
cte
d t
o P
HZ
-in
duced h
em
oly
tic a
nem
ia (
50m
g/k
g/m
ice inje
ctions o
n d
ay 0
and 1
) an
d e
ryth
ropoie
tic r
espo
nse w
as
eva
luate
d a
t da
ys 0
, 2,
5 ,
7 ,
9 a
nd 1
2 i
n l
itte
rmate
contr
ols
(n=
4;
em
pty
bars
) a
nd J
cha
in k
nockout
(Igj-/-
) m
ice (
n=
4;
bla
ck b
ars
). H
em
ato
crit
(a),
reticulo
cyte
s (
b)
and r
ed b
loo
d c
ells
(c)
num
ber
were
eva
luate
d.
The
data
are
pre
sente
d
as
the
mean
±
SE
M.
Hum
an
IgA
poly
mers
accele
rate
ery
thro
po
iesis
recovery
. α
1K
I m
ice w
ere
subje
cte
d t
o P
HZ
-in
duced
hem
oly
tic a
nem
ia (
50m
g/k
g/m
ice
inje
ctio
ns o
n d
ay 0
and 1
). (
d)
Upper
pan
el: s
ple
en w
eig
ht, c
orr
espon
din
g t
o e
ryth
ropo
ietic r
esponse
to a
cute
anem
ia i
n m
ice,
was e
valu
ate
d a
t da
y 9
in
α1
KI
mic
e (
n=
3)
and l
itte
rmate
contr
ols
(n=
5).
Lo
wer
pane
l: a
repre
sen
tative p
hoto
of
sple
en
fro
m α
1K
I (left
) and
fro
m l
itte
rmate
contr
ol
(rig
ht)
is
sho
wn.
*p <
0.0
5.
(e)
The p
erc
enta
ge o
f T
ER
-119
+/C
D71
+ c
ells
in t
he s
ple
en
was e
valu
ate
d b
y f
low
cyto
metr
y a
naly
sis
. T
he d
ata
are
fro
m i
ndiv
idu
al
mic
e (
bars
repre
sent
the m
ean).
Litte
rmate
contr
ols
(bla
ck d
iam
onds)
and α
1K
I m
ice (
bla
ck t
riangle
s).
*p <
0.0
5.
Repre
se
nta
tive f
low
cyto
metr
y a
na
lysis
of
the c
ells
are
sho
wn
.
Nature Medicine doi:10.1038/nm.2462
i
h
a
Anti-RBCd
PHZ
0 3 6 90
1
2
3
4IgG
pIgA1
Time (d)
Reticulo
cyte
s (
x10
6 p
er
mm
3)
***
PHZ
0 3 6 9
44
6
8
10IgG
pIgA1
Time (d)
RB
C (
x10
6 p
er
mm
3) ****
0 2 4 70
1
2
3IgG
pIgA1
Time (d)
Reticulo
cyte
s (
x10
6 p
er
mm
3)
***
PHZ
0 3 6 90
2020
30
40
50 IgG
pIgA1
Time (d)
Hem
ato
cri
t (%
)
**
0 0.5 1.0 1.5
0
25
50
75
100
24 48 72
pIgA1
IgG
Time (h)
Cig (
µg m
l-1)
0
01x
Cm
ax (
µg m
l-1)
0 2 4 70
2
4
6
8
10IgG
pIgA1
Time (d)
RB
C (
x10
6 p
er
mm
3) *
Anti-RBC
0 2 4 70
20
40
60IgG
pIgA1
Time (d)
Hem
ato
cri
t (%
)
*
Anti-RBC
PHZ
IgG0
5
10
15**
BF
U-E
(num
ber
per
10
5 s
ple
en c
ells
pla
ted)
pIgA1
PHZ
0
100
200
300
400
500
600 *
TE
R-1
19
+ / C
D71
+ c
ells
(x10
6 c
ells
per
sple
en)
IgG pIgA1
b c
e f g
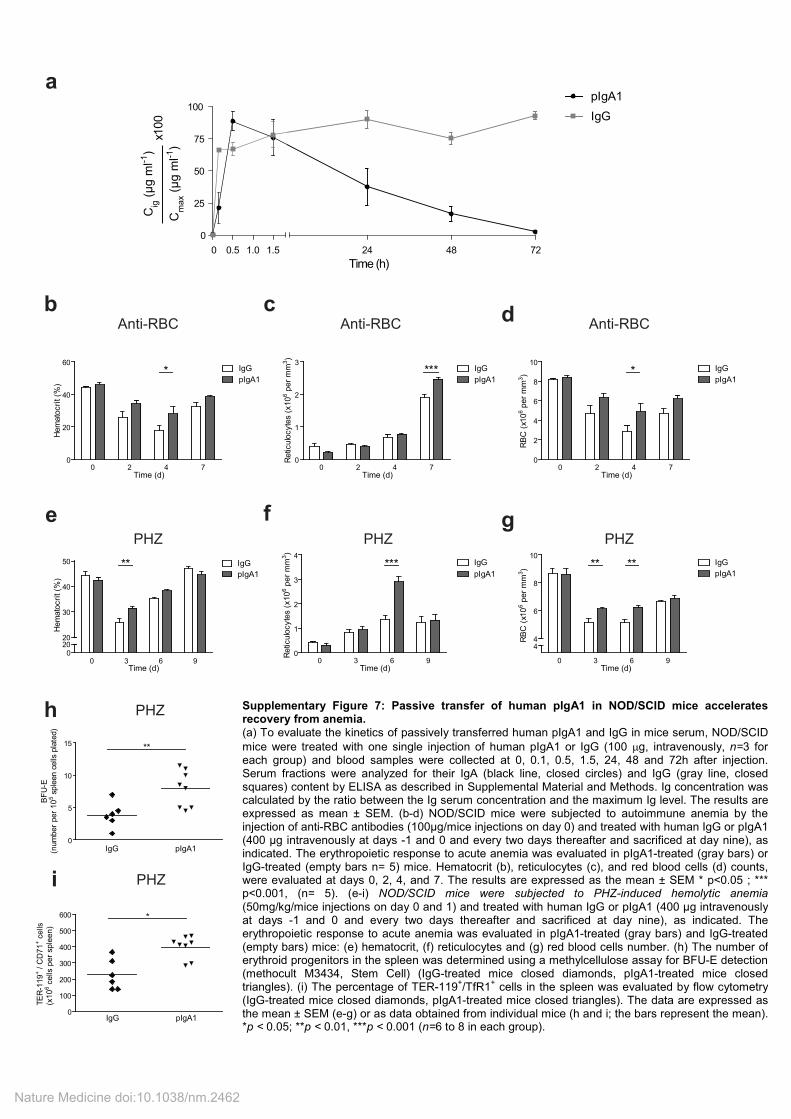
Supplementary Figure 7: Passive transfer of human pIgA1 in NOD/SCID mice accelerates recovery from anemia. (a) To evaluate the kinetics of passively transferred human pIgA1 and IgG in mice serum, NOD/SCID
mice were treated with one single injection of human pIgA1 or IgG (100 µg, intravenously, n=3 for each group) and blood samples were collected at 0, 0.1, 0.5, 1.5, 24, 48 and 72h after injection. Serum fractions were analyzed for their IgA (black line, closed circles) and IgG (gray line, closed squares) content by ELISA as described in Supplemental Material and Methods. Ig concentration was calculated by the ratio between the Ig serum concentration and the maximum Ig level. The results are expressed as mean ± SEM. (b-d) NOD/SCID mice were subjected to autoimmune anemia by the injection of anti-RBC antibodies (100µg/mice injections on day 0) and treated with human IgG or pIgA1 (400 µg intravenously at days -1 and 0 and every two days thereafter and sacrificed at day nine), as indicated. The erythropoietic response to acute anemia was evaluated in pIgA1-treated (gray bars) or IgG-treated (empty bars n= 5) mice. Hematocrit (b), reticulocytes (c), and red blood cells (d) counts, were evaluated at days 0, 2, 4, and 7. The results are expressed as the mean ± SEM * p<0.05 ; *** p<0.001, (n= 5). (e-i) NOD/SCID mice were subjected to PHZ-induced hemolytic anemia (50mg/kg/mice injections on day 0 and 1) and treated with human IgG or pIgA1 (400 µg intravenously at days -1 and 0 and every two days thereafter and sacrificed at day nine), as indicated. The erythropoietic response to acute anemia was evaluated in pIgA1-treated (gray bars) and IgG-treated (empty bars) mice: (e) hematocrit, (f) reticulocytes and (g) red blood cells number. (h) The number of erythroid progenitors in the spleen was determined using a methylcellulose assay for BFU-E detection (methocult M3434, Stem Cell) (IgG-treated mice closed diamonds, pIgA1-treated mice closed triangles). (i) The percentage of TER-119
+/TfR1
+ cells in the spleen was evaluated by flow cytometry
(IgG-treated mice closed diamonds, pIgA1-treated mice closed triangles). The data are expressed as the mean ± SEM (e-g) or as data obtained from individual mice (h and i; the bars represent the mean). *p < 0.05; **p < 0.01, ***p < 0.001 (n=6 to 8 in each group).
Nature Medicine doi:10.1038/nm.2462
bMock
hTfR1
hTfR1 (Y20F)
hTfR1 (S24A)
hTfR1 (S34A)
hTfR1 (S63A)
hTfR1 (S65A)
Time (s)
0 50 100 150 2000.5
1.0
1.5
2.0
∆F
/F0
a
0 50 100 150 2000.5
1.0
1.5
2.0
Time (s)
∆F
/F0
Mock
hTfR1
hTfR1 (Y20F)
hTfR1 (S24A)
hTfR1 (S34A)
hTfR1 (S63A)
hTfR1 (S65A)
epIgA1(30min)/PBS
PBS(30min)/Epo
pIgA1(30min)/Epo
0 50 100 150 200 2500.8
1.0
1.2
1.4
Time (s)
∆F
/F0
hTfR1/EpoRpIgA1(30min)/PBS
PBS(30min)/Epo
pIgA1(30min)/Epo
0 50 100 150 200 2500.8
1.0
1.2
1.4
Time (s)
∆F
/F0
f hTfR1(Y20F)/EpoR
cA24 0.01 µg ml-1
A24 0.1 µg ml-1
A24 1 µg ml-1
0 40 80 120 160 2000.6
1.0
1.4
1.8
2.2
Time (s)
∆F
/F0
hTfR1 d
0 40 80 120 160 2000.8
1.2
1.6
2.0
Epo 0.02 U ml-1
Epo 0.2 U ml-1
Epo 2 U ml-1
Time (s)
∆F
/F0
hTfR1/EpoR
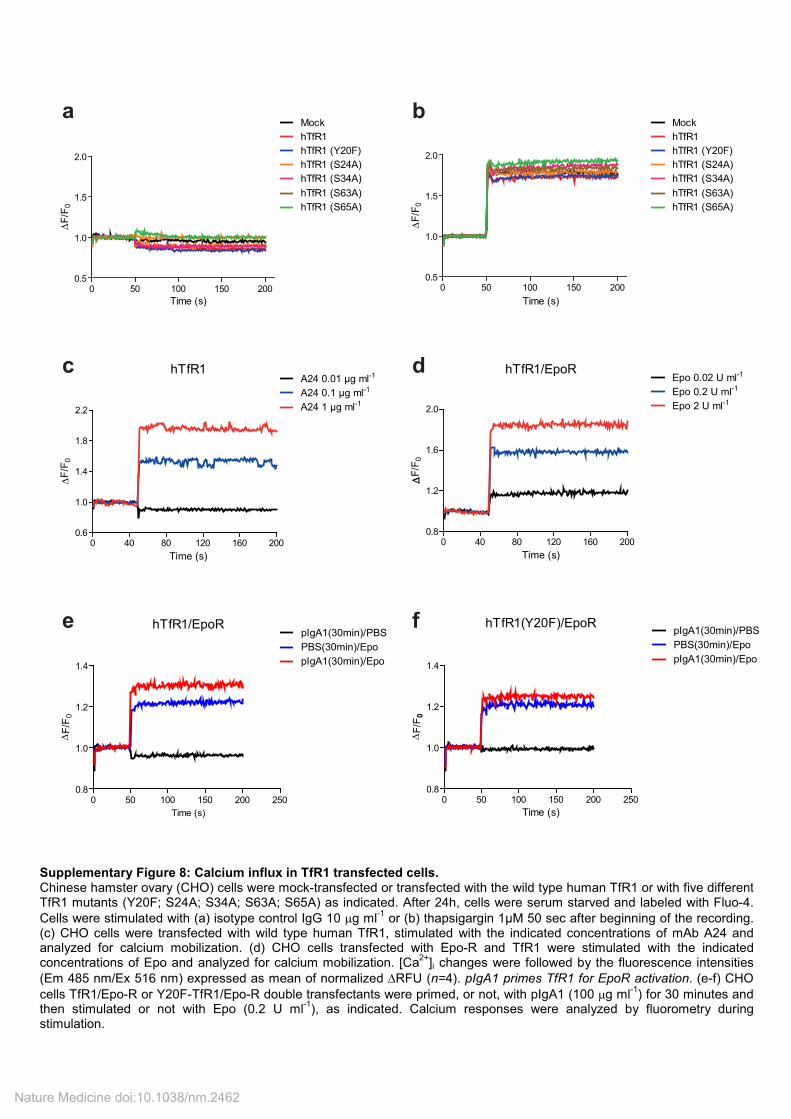
Supplementary Figure 8: Calcium influx in TfR1 transfected cells. Chinese hamster ovary (CHO) cells were mock-transfected or transfected with the wild type human TfR1 or with five different TfR1 mutants (Y20F; S24A; S34A; S63A; S65A) as indicated. After 24h, cells were serum starved and labeled with Fluo-4.
Cells were stimulated with (a) isotype control IgG 10 µg ml-1
or (b) thapsigargin 1µM 50 sec after beginning of the recording. (c) CHO cells were transfected with wild type human TfR1, stimulated with the indicated concentrations of mAb A24 and analyzed for calcium mobilization. (d) CHO cells transfected with Epo-R and TfR1 were stimulated with the indicated concentrations of Epo and analyzed for calcium mobilization. [Ca
2+]i changes were followed by the fluorescence intensities
(Em 485 nm/Ex 516 nm) expressed as mean of normalized ∆RFU (n=4). pIgA1 primes TfR1 for EpoR activation. (e-f) CHO
cells TfR1/Epo-R or Y20F-TfR1/Epo-R double transfectants were primed, or not, with pIgA1 (100 µg ml-1
) for 30 minutes and then stimulated or not with Epo (0.2 U ml
-1), as indicated. Calcium responses were analyzed by fluorometry during
stimulation.
Nature Medicine doi:10.1038/nm.2462
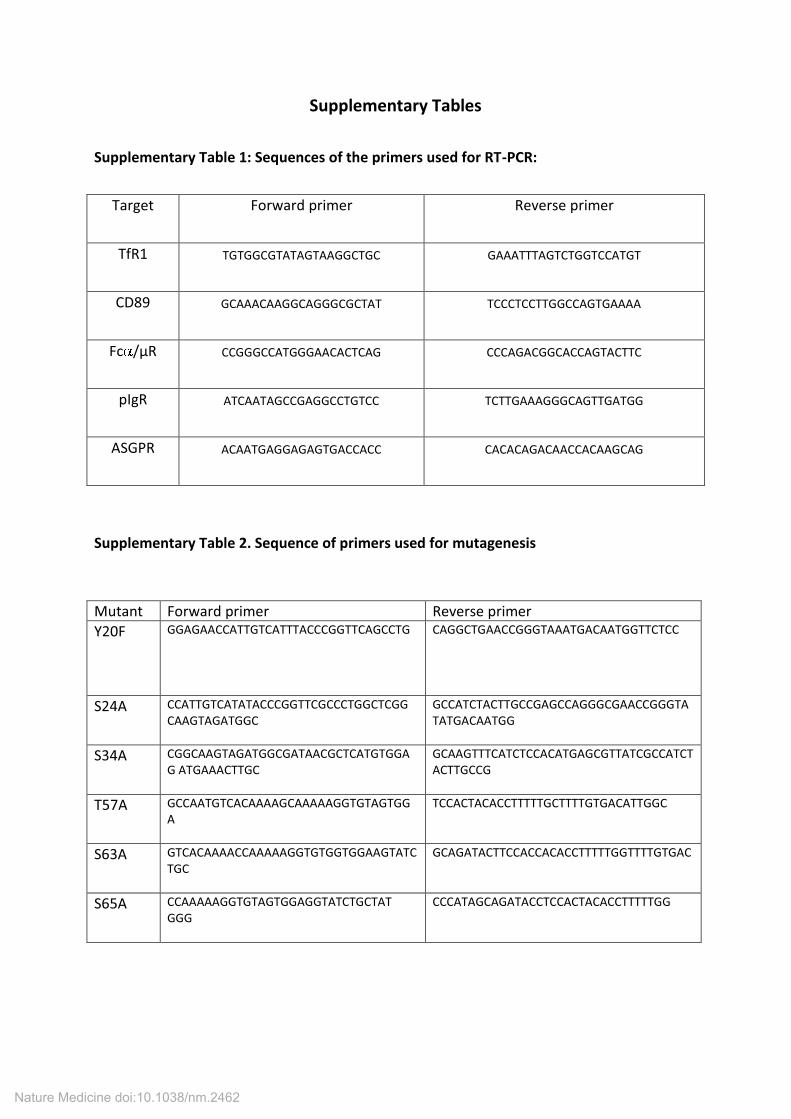
Supplementary Tables
Supplementary Table 1: Sequences of the primers used for RT-PCR:
Target Forward primer Reverse primer
TfR1 TGTGGCGTATAGTAAGGCTGC GAAATTTAGTCTGGTCCATGT
CD89 GCAAACAAGGCAGGGCGCTAT TCCCTCCTTGGCCAGTGAAAA
Fc /µR CCGGGCCATGGGAACACTCAG CCCAGACGGCACCAGTACTTC
pIgR ATCAATAGCCGAGGCCTGTCC TCTTGAAAGGGCAGTTGATGG
ASGPR ACAATGAGGAGAGTGACCACC CACACAGACAACCACAAGCAG
Supplementary Table 2. Sequence of primers used for mutagenesis
Mutant Forward primer Reverse primer
Y20F GGAGAACCATTGTCATTTACCCGGTTCAGCCTG CAGGCTGAACCGGGTAAATGACAATGGTTCTCC
S24A CCATTGTCATATACCCGGTTCGCCCTGGCTCGG
CAAGTAGATGGC
GCCATCTACTTGCCGAGCCAGGGCGAACCGGGTA
TATGACAATGG
S34A CGGCAAGTAGATGGCGATAACGCTCATGTGGA
G ATGAAACTTGC
GCAAGTTTCATCTCCACATGAGCGTTATCGCCATCT
ACTTGCCG
T57A GCCAATGTCACAAAAGCAAAAAGGTGTAGTGG
A
TCCACTACACCTTTTTGCTTTTGTGACATTGGC
S63A GTCACAAAACCAAAAAGGTGTGGTGGAAGTATC
TGC
GCAGATACTTCCACCACACCTTTTTGGTTTTGTGAC
S65A CCAAAAAGGTGTAGTGGAGGTATCTGCTAT
GGG
CCCATAGCAGATACCTCCACTACACCTTTTTGG
Nature Medicine doi:10.1038/nm.2462
Supplementary Methods
Patients
Patient samples were obtained after informed consent from the donors. BM aspirates and
sera were collected from patients admitted to the Hematology department at the Necker-
Enfants-Malades Hospital (Paris, France). Umbilical cord blood cells from normal full-term
deliveries were obtained from the Obstetrics department (Necker-Enfants-Malades Hospital
Paris, France). Human tonsils were obtained from patients undergoing tonsillectomy in the
Otorhinolaryngology department (Necker-Enfants-Malades Hospital, Paris, France). Serum
samples from chronically hypoxic patients were from Foch hospital (Suresnes, France) and
Clinique Geoffroy Saint-Hilaire (Paris, France).
Antibodies and reagents
Human myeloma-derived IgA1 (Dou, Oli, Ret and Prud) were purified as previously
described1. Fractions containing monomeric (m) and polymeric (p) IgA1 were prepared by
high-performance liquid chromatography (HPLC) (GE Healthcare; >99% pure) using ion-
exchange chromatography through diethylaminoethyl cellulose (DEAE) and size-exclusion
chromatography on Superdex 200 columns. Human serum IgG was from ICN Biomedicals.
The soluble IgA receptors sCD71 (sTfR1) and sCD89 were used. Both soluble receptors were
expressed in a lytic baculovirus/insect cell expression system, as described previously2. Anti-
TfR1 (A24; IgG2bκ) was produced, purified and characterized in our laboratory1.
For immunoblotting and immunoprecipitation studies we used the following antibodies:
Antibodies against p44/42 ERK (phospho-ERK1 at Thr 202 and Tyr 204 residues and phospho-
ERK2 at Thr 185 and Tyr 187 residues), ERK, phospho-AKT (Ser-473 residue), AKT, phospho-
mTor (Ser 2448 residue), phospho-STAT-5a (Tyr694/699 residues) and phospho-JAK2 (Tyr
Nature Medicine doi:10.1038/nm.2462
1007/1008 residues), all from Cell Signaling technology. The anti-HSC70 antibody was from
Stressgen. Anti-Ig J chain (FL-137) was from Santa Cruz biotechnology and the anti-human
IgA from Southern Biotech. Anti-TfR antibodies for immunoprecipitation and
immunoblotting studies were from Life technologies and polyclonal antibodies against CD89
were produced by hyper-immunizing rabbits with the baculovirus recombinant form of
soluble CD89. HRP-conjugated secondary Ab were from Santa Cruz biotechnology and HRP-
streptavidin from R&D Systems.
For flow cytometry studies the following antibodies were used: Anti-human IgA (cat n°2052-
08, Southern Biotech); PE-conjugated anti-human Glycophorin A (GPA, clone 11E4B-7-6),
FITC-conjugated anti-human TfR1 (clone YDJ1.2.2) and PE-conjugated anti-human CD11b
(clone Bear1) from Beckman Coulter; PE-conjugated anti-mouse TER-119 (cat n° 553673),
FITC-conjugated anti-mouse TfR1 (cat n°553266), allophycocyanin-labeled streptavidin (SA-
APC), from BD Pharmingen.
For flow cytometry studies of apoptosis Annexin V and propidium iodide (PI; Beckman
Coulter) were used.
For ELISA the following antibodies were used: Anti-human IgA (Southern Biotech) or
monoclonal anti-human kappa chain antibody (Beckman Coulter) for the coating, anti-
human IgA-alkaline phosphatase conjugate (BD Pharmingen) or anti-human IgG-alkaline
phosphatase conjugate (Sigma) antibodies
Nature Medicine doi:10.1038/nm.2462
Immunofluorescence analysis by flow cytometry
For binding assays, cells (0.25 x 10⁶) were pre-incubated with 1 mg ml
-1 of human IgG for 30
min on ice in order to block IgG receptors. IgA binding was examined using an indirect
immunofluorescence assay in which cells were incubated with 0.5 mg ml-1
of IgA (1.5µM) for
1 h on ice, washed and incubated with a biotinylated anti-IgA mAb for 20 min at 4°C. After
additional washes, SA-APC was used as a developing reagent. For inhibition studies, cells
were pre-incubated with A24 (10 µg ml-1
)1 for 1 h at 37°C before the addition of IgA1 to the
cells. Alternatively, IgA1 was pre-incubated with the recombinant sTfR1 (0.3 mg ml-1
at 4°C)3
for 30 min before addition to the cells. Stained cells were further analyzed by flow cytometry
(FACScalibur; Becton Dickinson). Data were analyzed with FlowJo software (Tree Star).
BM aspirates were depleted of erythrocytes following lysis in ammonium chloride. After 30
min of incubation with non-specific human IgG as described above, the cells were stained
with anti-TfR1 antibody and anti-GPA or anti-CD11b antibody. For the BM and splenocyte
suspensions from mice, blocking of IgG receptors was performed with anti-Fc R mAb 2.4G2,
and the cells were stained with anti-TER-119 antibody and anti-mouse TfR1 antibody.
Apoptosis assays
Cells were washed with ice-cold phosphate-buffered saline (PBS) and incubated with FITC-
conjugated annexin V and propidium iodide (PI; Beckman Coulter), according to the
manufacturer's recommendations. For the detection of caspase activity, the cells were
cultured overnight in the presence of 0.2 mg ml-1
pIgA1 (0.6µM) or IgG. The cells were then
cultured for 30 min in the presence of a fluorogenic caspase substrate (Cytoxilux,
OncoImmunin). Following incubation and washing, the samples were analyzed by flow
Nature Medicine doi:10.1038/nm.2462
cytometry. The cleavage of the substrate by activated caspases results in increased green
fluorescence in dying cells.
Measurement of free intracellular calcium
Approximatelly 5x10⁴ CHO cells were plated in 96 well black plate with clear bottom
(Corning) and transiently transfected using lipofectamine LTX with Plus reagent (Invitrogen)
with empty pcDNA 3.1 (mock), pcDNA 3.1 plasmids coding for wild-type hTfR1 or hTfR1 with
five different mutations (Y20F; S24A; S34A; S63A; S65A) or pcDNA 3.1 coding for Epo-R. Cells
were cultured for 24 hours with 10% FBS and serum starved for 2 hours. Measurement of
intracellular calcium was performed with Fluo-4 Direct™ Calcium Assay Kit (Invitrogen) by
labeling the cells with Fluo-4 dye for 60 minutes at 37°C as indicated by the manufacturer.
Changes of cytosolic free calcium were monitored as relative fluorescent units (RFU) using a
microplate plate reader (Tecan Infinite M200 and Magellan Software, Tecan). Wavelengths
of excitation and emission were 485 and 516 nm respectively. Measurements were carried
out for 200 seconds. mAb A24 and/or Epo at different concentrations were injected in each
sample at t=50 s. Calcium mobilization was calculated by the mean of RFU at each time
point and normalized by the basal levels of fluorescence ( F/F0) for each group. Curves are
representative of at least 3 independent samples.
Immunoprecipation and immunoblotting analysis.
CD34+ progenitors isolated from cord blood (Miltenyi CD34 Progenitor Cell Isolation Kit),
were cultured in the presence of IL-3 (10 ng ml-1
) + SCF (100 ng ml-1
) + Epo (2 U ml-1
) in
IMDM (Gibco cell culture) supplemented with 15% BIT 9500 (Stem Cell Technologies) as
described earlier4. In this medium Fe-Tf concentration is of 200µg ml
-1 which corresponds to
2.5µM (the concentration of Fe-Tf usually found in human serum). At day 4, cells were
Nature Medicine doi:10.1038/nm.2462
collected and starved 2-4 hours in IMDM containing 0.5% BSA for stimulation experiments.
UT7-Epo cells (1x10⁷ ml
-1) were cultured in IMDM supplemented with 15% BIT 9500 + Epo (2
U ml-1
). For stimulation experiments, pIgA1 (0.2 mg ml-1
; 0.6µM), A24 (10 µg ml-1
; 70nM) or
Fe-Tf (150 µg ml-1
; 2µM) and the stimulation was stopped by the addition of an excess of
cold PBS. The cells were lysed in 1 ml of lysis buffer (50 mM NaCl, 50 mM NaF, 1 mM sodium
orthovanadate, 0.5% Triton X-100, 50 mM HEPES, 10 µg ml-1
leupeptin and 10 µg ml-1
aprotinin) for 10 min at 4°C and centrifuged to obtain the soluble fraction. Proteins were
quantified by the bicinchoninic acid method according to the manufacturer’s instructions
(Pierce). The concentrations were equalized, and the extracts were boiled for 5 min in
Laemmli sample buffer (62 mM Tris-HCl pH 6.8, 10% glycerol, 2% SDS and 5% -
mercaptoethanol). The proteins (30 µg per lane) were loaded on a 10% SDS-PAGE gel and
transferred onto a PVDF membrane (GE Healthcare). The specific proteins were detected by
immunoblotting using specific antibodies and HRP-conjugated secondary Ab. Antibody
binding was visualized by chemoluminescence with an ECL kit (Pierce). The intensity of the
protein bands was quantified using ImageJ software.
Serum fractionation
A total of 0.3 ml of serum was diluted in phosphate buffer (0.05 M Na2SO4, 0.02 M NaH2PO4,
pH 7.5), filtered, and separated by gel filtration chromatography in a Superdex 200 HR 10/30
(GE Healthcare) connected to an HPLC AKTA-basic automated liquid chromatography system
(GE Healthcare). Fractions of 1.0 ml were collected for analysis. The molecular size of each
fraction was determined by calibration of the column with a calibration kit (GE Healthcare).
The IgA concentration in the fractions was determined using a sandwich ELISA.
Nature Medicine doi:10.1038/nm.2462
Measurement of IgA and Epo levels
To determine the IgA concentration in the column fractions and in sera, plates were coated
for 2 hours at room temperature with an anti-human IgA antibody diluted to a final
concentration of 10 µg ml-1
in borate-buffered saline (BBS). The wells were washed twice in
PBS containing 0.05% Tween 20 and blocked for 30 min at room temperature in PBS
containing 1% BSA and 0.1% sodium azide. Column fractions (diluted at 1:100) were added
to the wells and incubated overnight at 4°C. An alkaline phosphatase–conjugated IgA-
specific antibody was used as the developing Ab. The optical density at 405 nm was
measured after addition of the AP substrate (Sigma), following the manufacturer’s
instructions.
To determine IgA and IgG in the cell supernatants, 96-wells plates were coated with the
monoclonal anti-human kappa chain antibody (2 g ml-1
diluted in carbonate/ bicarbonate
buffer pH9.6) (Beckman Coulter) overnight at 4oC. Then, the plates were blocked for 30 min
with the blocking buffer (0.05% Tween 20, 1% BSA, 0.1% sodium azide in PBS) at 37oC,
followed by samples and standard incubation overnight at 4oC. Afterwards, plates were
incubated with anti-human IgA-alkaline phosphatase conjugate or anti-human IgG-alkaline
phosphatase conjugate antibodies (both diluted at 1:500) for 1 hour at 37oC. The reaction
was revealed with the addition of the substrate solution (Fast P-nitrophenyl phosphate
tablets, TBM, Sigma). The plates were read at 405 nm, every 5 minutes in a maximum
revelation time of 20 min.
The Epo concentration was measured by ELISA (Quantikine IVD, R&D system) following the
manufacturer's recommendations.
Nature Medicine doi:10.1038/nm.2462
Quantitative real-time RT-PCR
RNA was extracted from erythroid progenitors and B cells using Nucleospin RNA II
(Macherey-Nagel) and treated with DNAse. One microgram of total RNA was used for
reverse transcription using Superscript II reverse transcriptase (Invitrogen) and random
hexamers at 42°C for 15 minutes. The cDNA was then denatured at 99°C for 5 minutes and
cooled at 5°C for 5 minutes. For qPCR, the cDNA samples were amplified in a ChromoIV PCR
System (MJ Research). The PCR products were quantified using SybrGreen (SYBRGREEN
Jumpstart readymix, Sigma Aldrich). The forward and reverse primers sequences used are
described in Supplemental Table 1.
TfR1 silencing.
UT7 cells were transfected with 1 µg of a TfR1-specific siRNA (Hs_TFRC_6 FlexiTube siRNA
(SI02780715) Qiagen) by nucleofection using the V Nucleofector kit (Lonza). Knockdown
efficiency was monitored by immunoblotting 48 h after transfection.
Generation of TfR1 mutants
We created five different mutants of human TfR1 namely Y20F, S24A, S34A, S63A and S65A
in the vector pcDNA3.1 TfR1, containing the complete human TfR1 cDNA, using the
QuickChange site-directed mutagenesis kit (Stratagene) and using primers listed in
supplemental table 2.
Nature Medicine doi:10.1038/nm.2462
Supplementary Bibliography
1. Moura, I.C., et al. Identification of the transferrin receptor as a novel immunoglobulin
(Ig)A1 receptor and its enhanced expression on mesangial cells in IgA nephropathy. J
Exp Med 194, 417-425 (2001).
2. Moura, I.C., et al. Glycosylation and size of IgA1 are essential for interaction with
mesangial transferrin receptor in IgA nephropathy. J Am Soc Nephrol 15, 622-634
(2004).
3. Lebron, J.A., et al. Crystal structure of the hemochromatosis protein HFE and
characterization of its interaction with transferrin receptor. Cell 93, 111-123 (1998).
4. Zermati, Y., et al. Caspase activation is required for terminal erythroid differentiation.
J Exp Med 193, 247-254 (2001).
Nature Medicine doi:10.1038/nm.2462