Embed Size (px)
Citation preview
Preferential TradeAgreements:
The Case of EU-Mexico
Matthias BusseMatthias HuthGeorg Koopmann
HWWA DISCUSSION PAPER
103Hamburgisches Welt-Wirtschafts-Archiv (HWWA)
Hamburg Institute of International Economics2000
ISSN 1432-4458

The HWWA is a member of:
• Wissenschaftsgemeinschaft Gottfried Wilhelm Leibniz (WGL)• Arbeitsgemeinschaft deutscher wirtschaftswissenschaftlicher Forschungsinstitute (ARGE)• Association d‘Instituts Européens de Conjoncture Economique (AIECE)
Preferential Trade Agreements:The Case of EU-Mexico
Matthias BusseMatthias HuthGeorg Koopmann
This Discussison Paper is part of the HWWA’s research programme „International Tra-de and Competition Regimes“.
HWWA DISCUSSION PAPER
Edited by the DepartmentWorld Economy
Hamburgisches Welt-Wirtschafts-Archiv (HWWA)Hamburg Institute of International EconomicsÖffentlichkeitsarbeitNeuer Jungfernstieg 21 - 20347 HamburgTelefon: 040/428 34 355Telefax: 040/428 34 451e-mail: [email protected]: http://www.hwwa.de
Matthias BusseHamburgisches Welt-Wirtschafts-Archiv (HWWA)Telefon: 040/428 34 435Telefax: 040/428 34 451e-mail: [email protected]
Matthias HuthHamburgisches Welt-Wirtschafts-Archiv (HWWA)Telefon: 040/428 34 272Telefax: 040/428 34 451e-mail: [email protected]
Georg KoopmannHamburgisches Welt-Wirtschafts-Archiv (HWWA)Telefon: 040/428 34 302Telefax: 040/428 34 451e-mail: [email protected]
5
Contents
Abstract 6Zusammenfassung 6
1. INTRODUCTION 7
2. STRUCTURE OF BILATERAL TRADE AND ESSENTIALFEATURES OF THE FTA 8
3. EU AND MEXICAN TRADE POLICY AND THEMULTILATERAL CONTEXT 12
4. MODEL STRUCTURE 20
5. EMPIRICAL RESULTS 23
6. CONCLUDING REMARKS 28
References 30
List of Tables
Table 1: Regional Structure of EU and Mexican Trade, 1980-1998 8Table 2: Sectoral Structure of Bilateral EU-Mexican Trade, 1998 9Table 3: Intensity of EU-Mexican Bilateral Trade Links, 19981) 10Table 4: Preferential Trade Agreements (PTAs) notified
under GATT Article ΧΧΙ V, GATS Article V andthe Enabling Clause, 1958–2000 18
Table 5: Trade Effects of the FTA in the EU,Sized as a Share of Total Imports from Mexico 25
Table 6: Trade Effects of the FTA in Mexico,Sized as a Share of Total Imports from the EU 26
6
Abstract
The paper evaluates the political and economic incentives to conclude the EU-MexicoFree Trade Agreement (FTA). It discusses EU and Mexican trade policy as well as themultilateral context for FTAs. In addition, using a disaggregated approach at the three-digit Standard International Trade Classification, it identifies the commodities that willbe particularly affected by the FTA. The results show that considerable trade effects canbe expected in a narrow range of products and that the EU is likely to gain much morethan Mexico.
Zusammenfassung
In diesem Papier werden die politischen und ökonomischen Anreize zur Vereinbarungdes Freihandelsabkommens zwischen der EU und Mexiko bewertet. Dafür werden dieeuropäische und mexikanische Handelspolitik analysiert und der multilateraleZusammenhang der Bildung von Freihandelsabkommen betrachtet. Darüber hinauswerden die Auswirkungen des Freihandelsabkommens auf der disaggregiertendreistelligen Ebene des internationalen Warenverzeichnisses für den Außenhandelgeschätzt. Die Ergebnisse zeigen, daß in einem begrenzten Bereich von Produktgruppensignifikante Handelseffekte zu erwarten sind und daß die EU stärker als Mexiko vomAbkommen profitieren wird.
JEL classification: F15, F17
Key words: Free Trade Agreement, European Union, Mexico
7
1. INTRODUCTION
The Free Trade Agreement (FTA) between the European Union (EU) and Mexico is thefirst comprehensive and reciprocal trade pact of the EU with a country of the westernhemisphere and vice versa of Mexico with European states. For the EU, it is also a wayto get better access to the preferential trading area created by the North American FreeTrade Agreement (NAFTA) between Mexico, the United States and Canada, and aprecedent to further arrangements with Latin American countries such as the membersof MERCOSUR (Mercado Común del Sur). For Mexico, the agreement is part of adiversification strategy to reduce its dependence on the US. From an economicviewpoint, the internal effects of the FTA on its members, the external significance forthird countries and the “systemic” implications for the world trading system as a wholeare most interesting.
The quantitative analyses of the impact of a free trade area on trade flows are typicallyperformed in either a partial or general equilibrium framework. By their very nature,partial equilibrium models allow for highly detailed studies on the impact of tradepolicy changes. In contrast, general equilibrium models attempt to describe the effectsof discriminatory tariff preferences on the economy as a whole and the intersectorallinkages in particular. Since the overall trade effects of the EU-Mexico FTA are likelyto be small - with respect to total trade - due to relatively low trade barriers on average,sectoral repercussions will gain in significance. Therefore, we chose a partialequilibrium framework.
With regard to the EU-Mexico FTA the following three questions have to be answered:(1) What are the economic and political incentives of both the EU and Mexico toconclude a bilateral FTA, (2) what are the consequences of the agreement for membersand non-members, and (3) which disaggregated commodities will be affected by theFTA in particular.
The structure of the paper is as follows. Section 2 surveys the structure of EU-Mexicanbilateral trade and highlights central features of the FTA treaty. Section 3 discusses EUand Mexican trade policy as well as the multilateral context for FTAs. A method toanalyse the elimination of a preferential tariff is presented in Section 4. Morespecifically, the model of Clague (1971, 1972) will be used to estimate the impact of the
8
FTA on trade flows. Section 5 describes the estimated trade effects, and someconcluding remarks as well as a summary of the major results are found in Section 6.
2. STRUCTURE OF BILATERAL TRADE AND ESSENTIALFEATURES OF THE FTA
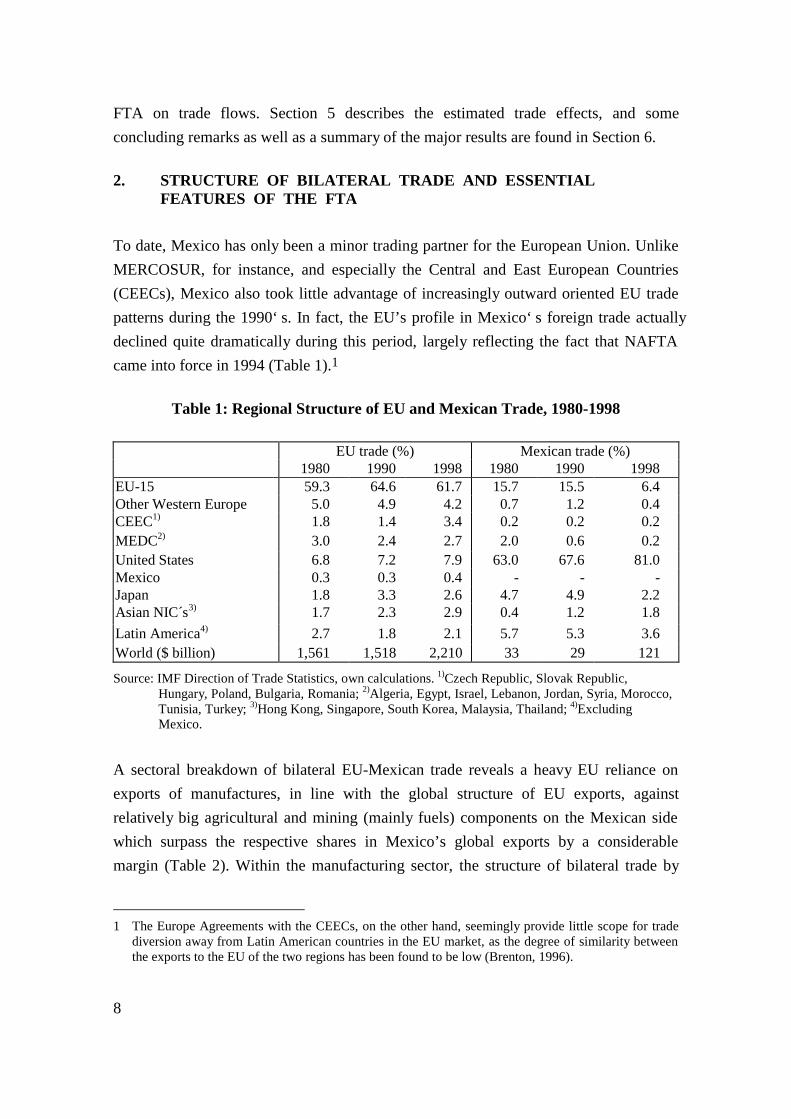
To date, Mexico has only been a minor trading partner for the European Union. UnlikeMERCOSUR, for instance, and especially the Central and East European Countries(CEECs), Mexico also took little advantage of increasingly outward oriented EU tradepatterns during the 1990‘s. In fact, the EU’s profile in Mexico‘s foreign trade actuallydeclined quite dramatically during this period, largely reflecting the fact that NAFTAcame into force in 1994 (Table 1).1
Table 1: Regional Structure of EU and Mexican Trade, 1980-1998
EU trade (%) Mexican trade (%)1980 1990 1998 1980 1990 1998
EU-15 59.3 64.6 61.7 15.7 15.5 6.4Other Western Europe 5.0 4.9 4.2 0.7 1.2 0.4CEEC1) 1.8 1.4 3.4 0.2 0.2 0.2MEDC2) 3.0 2.4 2.7 2.0 0.6 0.2United States 6.8 7.2 7.9 63.0 67.6 81.0Mexico 0.3 0.3 0.4 - - -Japan 1.8 3.3 2.6 4.7 4.9 2.2Asian NIC´s3) 1.7 2.3 2.9 0.4 1.2 1.8Latin America4) 2.7 1.8 2.1 5.7 5.3 3.6World ($ billion) 1,561 1,518 2,210 33 29 121
Source: IMF Direction of Trade Statistics, own calculations. 1)Czech Republic, Slovak Republic,Hungary, Poland, Bulgaria, Romania; 2)Algeria, Egypt, Israel, Lebanon, Jordan, Syria, Morocco,Tunisia, Turkey; 3)Hong Kong, Singapore, South Korea, Malaysia, Thailand; 4)ExcludingMexico.
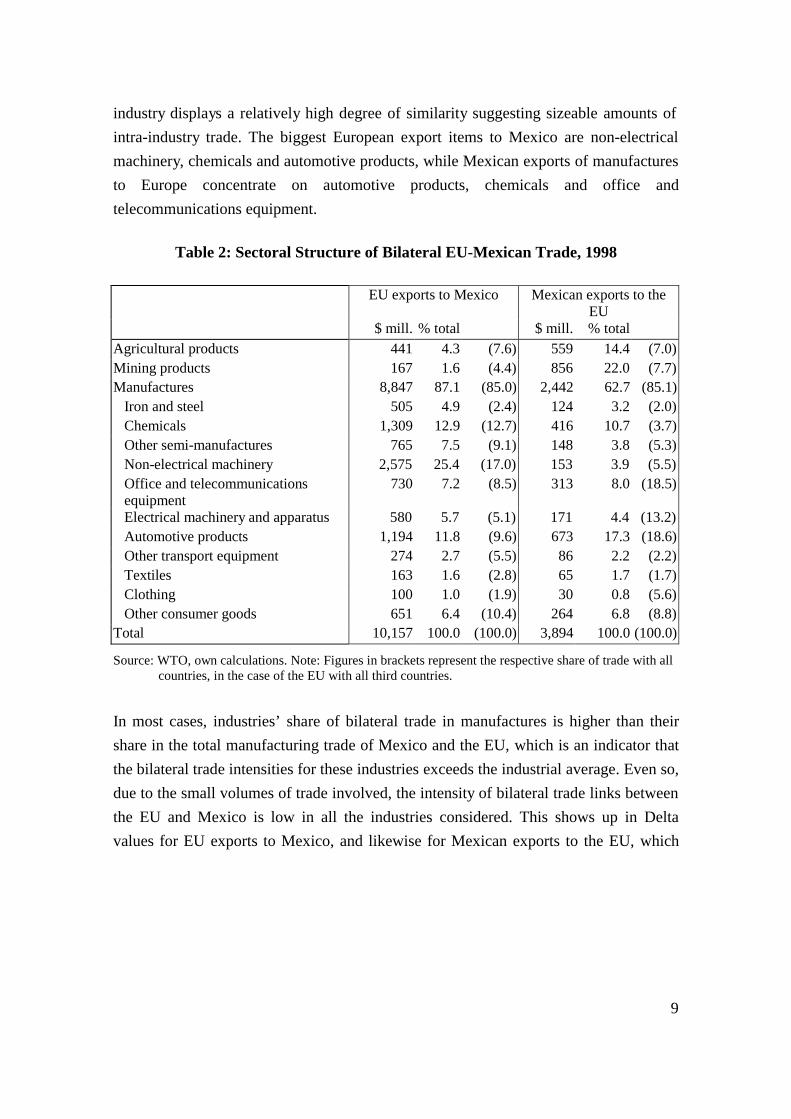
A sectoral breakdown of bilateral EU-Mexican trade reveals a heavy EU reliance onexports of manufactures, in line with the global structure of EU exports, againstrelatively big agricultural and mining (mainly fuels) components on the Mexican sidewhich surpass the respective shares in Mexico’s global exports by a considerablemargin (Table 2). Within the manufacturing sector, the structure of bilateral trade by
1 The Europe Agreements with the CEECs, on the other hand, seemingly provide little scope for trade
diversion away from Latin American countries in the EU market, as the degree of similarity betweenthe exports to the EU of the two regions has been found to be low (Brenton, 1996).
9
industry displays a relatively high degree of similarity suggesting sizeable amounts ofintra-industry trade. The biggest European export items to Mexico are non-electricalmachinery, chemicals and automotive products, while Mexican exports of manufacturesto Europe concentrate on automotive products, chemicals and office andtelecommunications equipment.
Table 2: Sectoral Structure of Bilateral EU-Mexican Trade, 1998
EU exports to Mexico Mexican exports to theEU
$ mill. % total $ mill. % totalAgricultural products 441 4.3 (7.6) 559 14.4 (7.0)Mining products 167 1.6 (4.4) 856 22.0 (7.7)Manufactures 8,847 87.1 (85.0) 2,442 62.7 (85.1) Iron and steel 505 4.9 (2.4) 124 3.2 (2.0) Chemicals 1,309 12.9 (12.7) 416 10.7 (3.7) Other semi-manufactures 765 7.5 (9.1) 148 3.8 (5.3) Non-electrical machinery 2,575 25.4 (17.0) 153 3.9 (5.5) Office and telecommunications equipment
730 7.2 (8.5) 313 8.0 (18.5)
Electrical machinery and apparatus 580 5.7 (5.1) 171 4.4 (13.2) Automotive products 1,194 11.8 (9.6) 673 17.3 (18.6) Other transport equipment 274 2.7 (5.5) 86 2.2 (2.2) Textiles 163 1.6 (2.8) 65 1.7 (1.7) Clothing 100 1.0 (1.9) 30 0.8 (5.6) Other consumer goods 651 6.4 (10.4) 264 6.8 (8.8)Total 10,157 100.0 (100.0) 3,894 100.0 (100.0)
Source: WTO, own calculations. Note: Figures in brackets represent the respective share of trade with allcountries, in the case of the EU with all third countries.
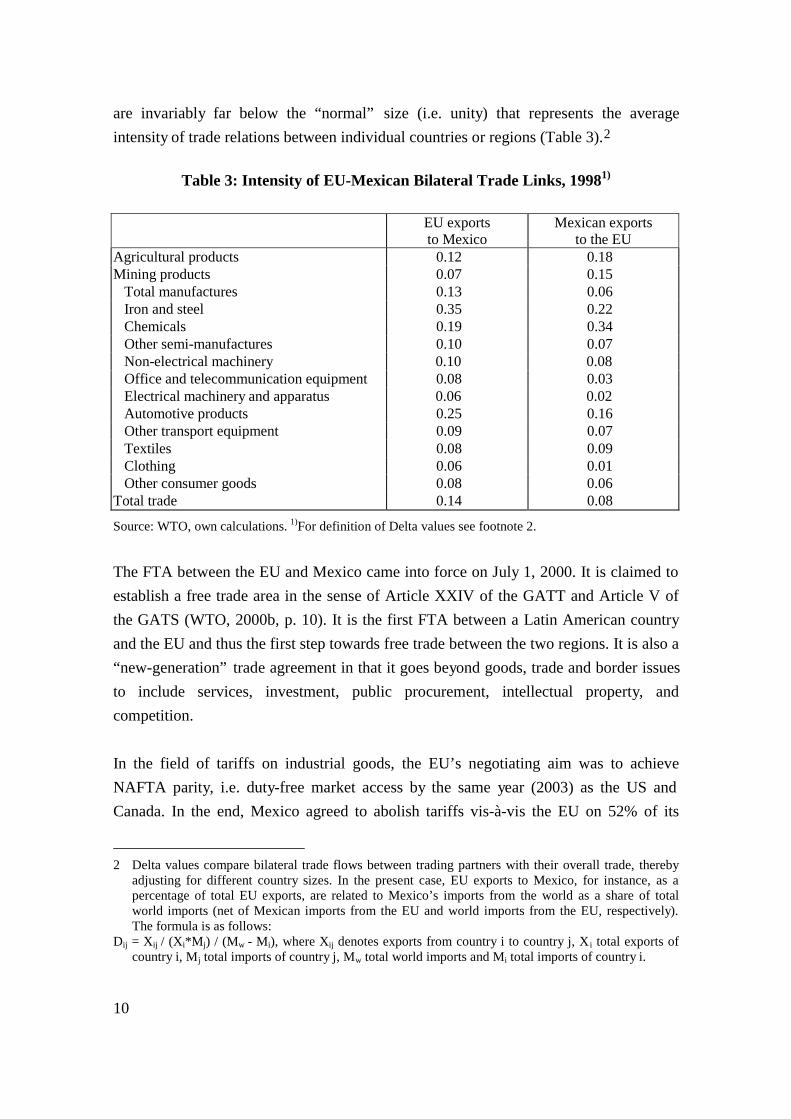
In most cases, industries’ share of bilateral trade in manufactures is higher than theirshare in the total manufacturing trade of Mexico and the EU, which is an indicator thatthe bilateral trade intensities for these industries exceeds the industrial average. Even so,due to the small volumes of trade involved, the intensity of bilateral trade links betweenthe EU and Mexico is low in all the industries considered. This shows up in Deltavalues for EU exports to Mexico, and likewise for Mexican exports to the EU, which
10
are invariably far below the “normal” size (i.e. unity) that represents the averageintensity of trade relations between individual countries or regions (Table 3).2
Table 3: Intensity of EU-Mexican Bilateral Trade Links, 19981)
EU exportsto Mexico
Mexican exportsto the EU
Agricultural products 0.12 0.18Mining products 0.07 0.15 Total manufactures 0.13 0.06 Iron and steel 0.35 0.22 Chemicals 0.19 0.34 Other semi-manufactures 0.10 0.07 Non-electrical machinery 0.10 0.08 Office and telecommunication equipment 0.08 0.03 Electrical machinery and apparatus 0.06 0.02 Automotive products 0.25 0.16 Other transport equipment 0.09 0.07 Textiles 0.08 0.09 Clothing 0.06 0.01 Other consumer goods 0.08 0.06Total trade 0.14 0.08
Source: WTO, own calculations. 1)For definition of Delta values see footnote 2.
The FTA between the EU and Mexico came into force on July 1, 2000. It is claimed toestablish a free trade area in the sense of Article XXIV of the GATT and Article V ofthe GATS (WTO, 2000b, p. 10). It is the first FTA between a Latin American countryand the EU and thus the first step towards free trade between the two regions. It is also a“new-generation” trade agreement in that it goes beyond goods, trade and border issuesto include services, investment, public procurement, intellectual property, andcompetition.
In the field of tariffs on industrial goods, the EU’s negotiating aim was to achieveNAFTA parity, i.e. duty-free market access by the same year (2003) as the US andCanada. In the end, Mexico agreed to abolish tariffs vis-à-vis the EU on 52% of its
2 Delta values compare bilateral trade flows between trading partners with their overall trade, thereby
adjusting for different country sizes. In the present case, EU exports to Mexico, for instance, as apercentage of total EU exports, are related to Mexico’s imports from the world as a share of totalworld imports (net of Mexican imports from the EU and world imports from the EU, respectively).The formula is as follows:
Dij = Xij / (Xi*Mj) / (Mw - Mi), where Xij denotes exports from country i to country j, Xi total exports ofcountry i, Mj total imports of country j, Mw total world imports and Mi total imports of country i.
11
industrial products by 2003 and on the remaining 48% either in 2005 or 2007,depending on the sector (EC Commission, 2000). The EU, for its part, will provideduty-free access for all Mexican industrial products by 2003. In agricultural trade,which accounts for 7% of total bilateral trade, tariffs on slightly more than 60% of eachother’s commodities will be removed over a period of up to 10 years (for the moresensitive goods). Altogether, the FTA will free about 95% of bilateral goods trade fromtariffs. With respect to rules of origin, the complex EU rules apply in most cases of EU-Mexican trade in goods.
Trade in services - with the exception of audiovisual services, cabotage and airtransport - between the partners will be liberalised over a maximum ten-year period.With regard to public procurement, EU suppliers obtain the same access to Mexicanmarkets as NAFTA firms while Mexico will enjoy similar treatment in the EU as theEU’s partners under the (plurilateral) WTO Public Procurement Agreement (to whichMexico is not a signatory). In competition policy, the EU-Mexican agreement – similarto NAFTA – merely seeks to ensure compliance with the two signatories’ domesticlegislations. To sum up, while the EU gains close-to-NAFTA rank in Mexico throughthe bilateral agreement, Mexico moves up from GSP (Generalised System ofPreferences) to associate status in the EU pyramid of preferences.
The formation of the European Common Market or European Economic Communitywas a first test of Viner’s (1950) proposition that in the case of a customs union tradediversion might exceed trade creation. It called into question the conventional wisdomof the time that regional free trade agreements were welfare-improving per se. Europeanintegration was also the major – and only successful – event in the first wave ofregionalism (“old regionalism”) that began in the late 1950s and was mainlycharacterised by the removal of border restrictions.
The EU-Mexico agreement, by contrast, is part of the second wave of regionalism(“new regionalism”) that began in the late 1980s. It is distinct from the first wave inseveral quantitative and qualitative respects. Whereas old regionalism was very muchcentred around (western) Europe, new regionalism has at least two centres, namelyEurope and America, even though European predominance is still evident. Newregionalism also has a growing inter-regional dimension of which the EU-Mexicoagreement is an example. It is a case of non-natural (i.e. non-proximate) trading partners
12
removing trade barriers between each other on a preferential basis while at the samecreating a link between two major centres of regionalism.
One characteristic of the EU-Mexico agreement that distinguishes it from regionalrelationships like those between the EU and the CEECs or between Mexico and the USis the lack of a connection with labour migration. Capital and company mobility, on theother hand, is a common element of regional and inter-regional integration schemesalike, reflecting the close interaction between trade and investment in a globalisingworld economy. Besides generating conventional trade-creation and trade-diversioneffects, the EU-Mexico FTA could greatly enhance the importance of Mexico as alocation for European foreign direct investment and thus indirectly improve Europeanaccess to the markets of other Mexican FTA partners as well and to the US market inparticular (IRELA, 2000, p. 6).
3. EU AND MEXICAN TRADE POLICY AND THE MULTILATERALCONTEXT
Trade policy in the European Union combines a variety of motives and policy areas.According to Pelkmans and Brenton (1997, pp. 28-29), the instruments of trade policyhave routinely been used for at least seven types of EU policy. These are: CommercialDiplomacy, Agricultural Policy, Economic Integration, Development Policy,Competition Policy, Industrial Policy, and Foreign Policy.
The conclusion of Free Trade Agreements, i.e. reciprocal preferentialism, is at the veryheart of EU trade policy. It is the centrepiece of “contractual” trade policy, its firstpillar. The second pillar is “autonomous” trade policy, of a defensive or offensivenature, which entails restrictive measures like anti-dumping, anti-subsidy and safeguardpolicies that in most cases discriminate amongst trading partners as well as instrumentslike the Trade Barriers Regulation3 or the granting of non-reciprocal trade preferenceswhich are designed to open up, often selectively and conditionally, foreign and domesticmarkets, respectively. The third pillar is “multilateral” trade policy, i.e. the very antidoteto preferentialism, discrimination, selectivity, and conditionality. In each of the three
3 The Trade Barriers Regulation of 1994, which is the successor to the New Trade Policy Instrument of
1984 and European “mirror“ legislation to Section 301 of the US Trade Act, aimso eliminate “unfair“trade barriers facing European suppliers on foreign markets. It permits the EU authorities, on owninitiative or upon request by industry, and pending prior approval from the WTO, to take punitiveaction against “non-conforming“ countries.
13
areas, apart from “border measures”, the subject of trade policy is increasingly behind-the-border policies such as the granting of subsidies or the imposition of productregulations and standards.
The most contentious of EU trade policies is the Common Agricultural Policy.According to a recent study (Borrell and Hubbard, 2000), the total economic cost of theCommon Agricultural Policy amounts to at least $75 billion annually of which morethan a third is borne by non-EU countries. The study claims that by restricting importsand subsidising exports the EU has depressed agricultural prices on world markets at acost to the rest of the world of $26 billion a year.4 Agriculture has also been largelyexcluded from EU preferential trade policies.
Nor have these policies, as could have been expected, led to a suppression of anti-dumping measures, the favoured policy of protectionists, by removing the economicrationale for action against dumping practices - namely the existence of barriers tomarket entry in the exporting country that prohibit arbitrage (via re-exports) betweenmarkets in the exporting and importing countries. Even where the agreements - such asthe Europe Agreements with the CEECs - introduced EU-style competition policies inthe partner countries in order to prevent distortions of competition in bilateral trade, theanti-dumping option was maintained in the EU.5 This, of course, also applies to the EU-Mexico FTA. Overall, the number of new investigations into dumping practices in theEU has risen sharply in recent time, from 21 in 1998 to 66 in 1999, which suggests arenewed upsurge in the actually application of EU anti-dumping measures (unilateralimposition of extra duties on the respective goods or negotiation of “price undertakings”with the exporting countries) in the near future. The product categories most affectedwould be iron and steel products, consumer electronics, and chemicals (WTO, 2000a,pp. 67-69).
The EU has signed Preferential Trade Agreements (PTAs) with a large number oftrading partners of which the four EFTA countries (Iceland, Liechtenstein, Norway, andSwitzerland) are outstanding examples, since liberalisation with these countries isnearly complete. It has also been fully reciprocal and symmetrical and goes beyond the
4 $49 billion of the estimated $75 billion annual cost of the Common Agricultural Policy in the study is
borne by the EU, in the form of subsidies and artificially high food prices.5 The exception is trade in industrial products with non-EU members of the European Economic Area
(Iceland, Liechtenstein, and Norway) where the EU’s competition policy framework applies.
14
stage of “shallow integration” (i.e. removal of border measures) into the area of “deepintegration” (i.e. harmonisation or mutual recognition of economic or regulatorypolicies). Strong elements of the latter are also contained in the Europe Agreementswith Bulgaria, the Czech Republic, Estonia, Hungary, Latvia, Lithuania, Poland,Romania, Slovakia, and Slovenia while in the field of trade liberalisation these treatiesprovide for non-symmetric reciprocity (i.e. the EU liberalises faster than its partners).This holds for the Euro-Mediterranean association agreements with Israel, Morocco,Tunisia, and the Palestinian Authority, too, as well as for the free trade agreements withSouth Africa and Mexico, whereas “deep integration” remains relatively weak in thesecases. The extension of reciprocal preferentialism beyond potential EU membercountries is nevertheless regarded as a “new development” and “radical departure” inEU trade policy pointing to a “hub-and-spoke” strategy similar to that followed by theUS (Sapir, 1998, p. 729).6
Altogether, the 20 trading partners with which the EU entertains a reciprocalpreferential relationship account for about a quarter of EU trade with third countries.7
Another 45% or so of this trade is with other developing countries which the EUunilaterally accords duty-free or reduced-duty treatment - depending on the degree of“sensitivity” of the traded (industrial and processed agricultural) products - under theGeneralised System of Preferences, within the framework of the Partnership Agreementof Suva, with 71 African, Caribbean and Pacific (ACP) countries. The latter agreement,moreover, which replaces the strictly non-reciprocal Fourth Lomé Convention, providesfor reciprocity after a transition period.8 As a consequence, only a minority of countries(Australia, Canada, China, Hong Kong, Japan, New Zealand, Singapore, South Korea,and the United States)9 face most-favoured-nation treatment in the EU, i.e. have to pay
6 As a possible solution to the internal and external problems caused by the hub-and-spoke approach,
Sapir (1998, p. 730) proposes to build customs unions instead of free-trade areas, since the formerwould not require intricate rules of origin (the main internal problem) and limit frictions with thirdcountries as the relatively low EU tariff would apply.
7 The share of these countries (not counting the Palestinian Authority) in EU exports to third countrieswas 27.4% in 1998 while the corresponding share in EU imports was 21.8% leaving an average shareof exports and imports amounting to 24.6% (Source: IMF Direction of Trade Statistics).
8 Under the new agreement, industrial and processed agricultural products of ACP countries will enjoynon-reciprocal duty-free access to the European market until December 31, 2007, by which time newreciprocal arrangements will have to be concluded (WTO, 2000a, p. 34).
9 With effect from 1 May 1998, Hong Kong, South Korea and Singapore were “graduated“ from the listof GSP beneficiaries.
15
the tariff rates agreed in the WTO. These have declined in manufacturing industry from6% in 1995, at the beginning of the WTO, to 4.2% in 1999.10
As with EU trade policy in general, EU preferentialism is not just a question ofcomparing economic costs and benefits since it blends non-economic with economicconsiderations.11 Preferential trade policies have always been a principal instrument offoreign policy for the European Community (Sapir, 1998). Moreover, the net economicgains to be derived by the EU from preferentialism seem to be rather modest given therelatively small size of the markets of its partner countries. At the same time, however,trade barriers in these countries are in many cases significantly higher than in the EU, atleast in the industrial sector, while the respective liberalisation agreements increasinglyprovide for a reciprocal removal of trade barriers, as noted above, and cover a growingnumber of product groups (though market access in agriculture is still only grantedselectively). In consequence, EU companies could earn considerable economic returnsfrom both the trade creation and diversion to which preferential trade policies give rise.
Concerning trade policy in Mexico, after signing a Free Trade Agreement with ElSalvador, Honduras, and Guatemala in June 2000, which will come into force onJanuary 1, 2001, the number of countries with which Mexico trades under preferentialregimes has risen to 27.12 A similar agreement with Panama is to follow by the end of2000. FTA negotiations are also under way with Ecuador, Uruguay, the EFTAcountries, and Singapore. These activities are part of Mexico’s strategy to diversify itstrade relations away from NAFTA, in order to reduce US dominance, and to establishitself as a hub and a bridge in an expanding system of regional and bilateral tradeliberalisation contracts. The proliferation of such preferential trading schemes, as far as
10 Measured as a simple average of most-favoured-nation tariffs on products in the Harmonised System
Chapters 25 through 97 excluding those classified as “agricultural” in the WTO. The average formanufactured products in ISIC category 3 fell from 7.4% in 1995 to 6.9% in 1999 (WTO, 2000a, p.99).
11 A Council of Ministers report submitted to the European Council meeting of Amsterdam in June 1997identifies seven “strategic questions” for the EU to consider, before new preferential agreementswould be concluded, namely WTO compatibility, support of the development of the multilateraltrading system, overall economic effect, achievement of “identifiable offensive economic interests ofthe EU”, political and other benefits, impact on other EU external commitments, and impact on EUcommon policies.
12 Apart from the three countries mentioned, these are the two other NAFTA partners (US and Canada),the two other countries of the Group of Three (Colombia and Venezuela), two other central Americancountries (Costa Rica and Nicaragua) and from South America Bolivia and Chile (Financial Times ofJune 28: “Technocrat leads Mexico’s world conquest“).
16
the western hemisphere is concerned, is also a reflection of unwillingness in the US toopen up NAFTA for new members.
Mexico - together with Chile - has been an early reformer of trade policy in LatinAmerica (Bleaney, 1999, p. 92). It acceded to GATT in 1986 and was a foundingmember of the WTO in 1995. After nearly four decades of import-substitutionindustrialisation in this country, the trade reforms in Mexico, initiated by thegovernment in 1985 and precipitated by the debt crisis of the early 1980s, led to areduction in the average tariff from 23.5% in 1985 to 12.5% in 1990.13 Import licensing,which effectively gives the government the discretion to impose import quotas at will,covered less than 20% of all imports in 1990 as against 92.2% in 1985 (Harrison andHanson, 1999, pp. 15-16).
Up to 1999, import licensing was further reduced while tariffs were again raised.13 Thelatter happened in two stages, in 1995 and in 1999, reflecting the “Tequila crisis” andthe “Asian crisis”, respectively. As a result, in May 1999, the (unweighted) averagetariff in Mexico stood at 16.1% for all goods, 29.3% for consumer goods, 13.9% forintermediates and 14.5% for capital goods.14 As only non-NAFTA trading partnerswere affected by the increases in tariff rates, the discriminatory effect of Mexican tariffshas grown since NAFTA started in 1994,15 and it was reinforced through highlyrestrictive rules of origin designed to back up high tariff protection in criticalindustries.16 This de facto protection (Krueger, 1993) has created an incentive suigeneris for “outsiders” to seek Free Trade Agreements with Mexico.
Mexico’s own demand for FTAs with foreign countries, on the other hand, was alsoinfluenced by the desire to firmly “anchor” or “lock-in” domestic pro-market economicreform policies in general and trade reforms in particular via external commitments.This was an important driving force behind NAFTA, together with the “safe-haven”
13 In cases where import permits are still required, the Ministry of Commerce reviews the applications
and relies on Mexican industry associations for advice regarding the local availability of the productand may reject applications if the product is already available.
14 Preliminary figures (Preuße, 2000, p. 28).15 Due to the discriminatory Mexican trade policy, US firms, for instance, “have obtained more than an
eight percentage point margin of preference compared to non-NAFTA competitors“ (United StatesTrade Representative, 2000, p. 172).
16 In industries with high tariff protection, the respective rules of origin agreed in NAFTA areparticularly restrictive, thereby excluding non-NAFTA suppliers of intermediate goods or forcingthem to relocate production into the NAFTA area (Estevadeordal, 2000).
17
argument stressing the need to guard exporters against the vicissitudes of US tradepolicy (Whalley, 1993), and has made itself felt in subsequent FTAs, not least in thatwith the EU. It comes on top of the diversification motive for FTAs as mentionedabove.
On a global scale, more than 200 Preferential Trade Agreements have been notified tothe GATT or WTO over time of which over 130 agreements are still in force.17 Mostwere concluded in the past 10 years. Whereas in the period from 1948 to 1994 theGATT received 124 notifications of PTAs (relating to trade in goods), 90 additionalarrangements (covering trade in goods and in services) were notified between thecreation of the WTO in 1995 and early 2000.
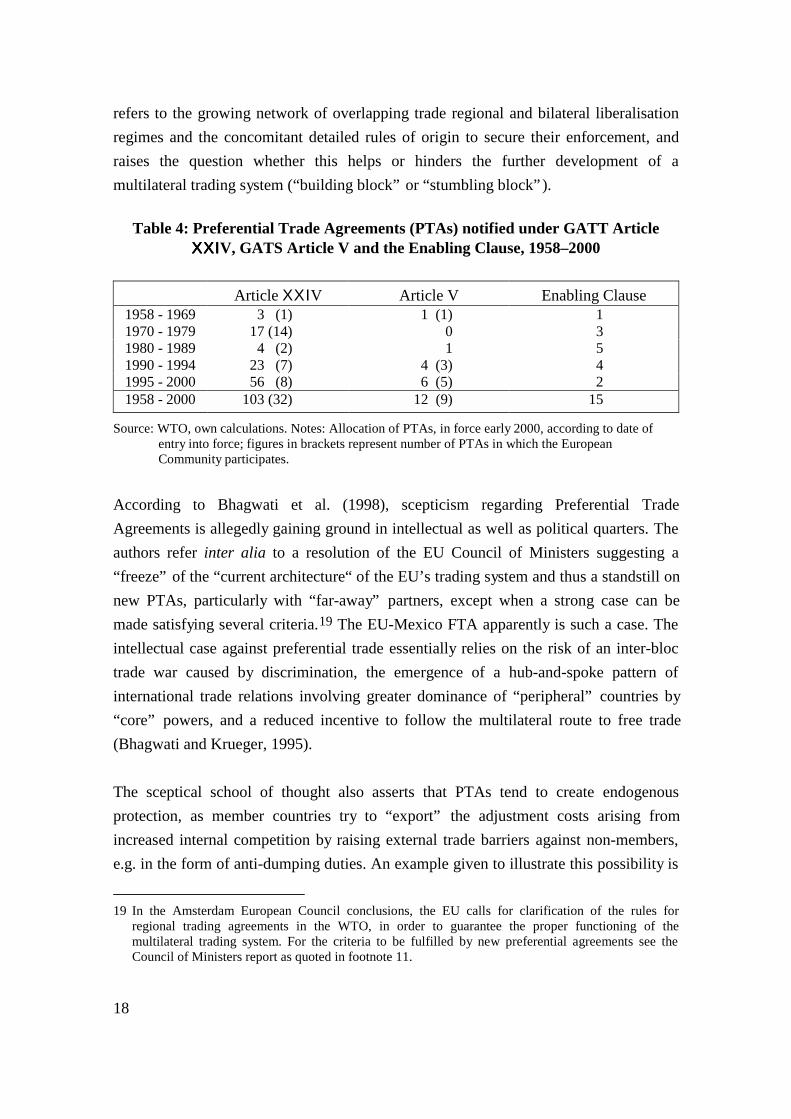
Table 4 gives an overview of the notified agreements that were in force in early 2000.The bulk of the agreements falls under Article XXIV of the GATT which exempts FreeTrade Areas and Customs Unions in the field of goods from the most-favoured-nationprinciple of GATT Article I provided that certain conditions are fulfilled (i.e. coverageof “substantially all the trade” between member countries and no increase of tradebarriers against third countries). The European Union participates in nearly one third ofthese agreements. The EU is even more prominent in those agreements that fall underthe corresponding Article V of the GATS which covers Free Trade Areas and CustomsUnions in the field of services. It is, by definition, not involved in the agreementsnotified under the Enabling Clause by which developing countries are freed from thenormal disciplines governing PTAs in the WTO.
The picture displayed in Table 4 is, however, incomplete as only a few of the numerousPTAs involving Mexico are accounted for.18 The WTO has apparently not (yet) beennotified of most of these agreements. The European Union and Mexico are neverthelessboth major contributors to the phenomenon which Bhagwati (1995) dubbed the“spaghetti bowl“ of preferential trade agreements or the “who is whose“ problem that
17 Most of the discontinued PTAs were superseded by redesigned agreements among the same
signatories. Out of the total of 214 agreements or enlargements so far notified to the GATT/WTO, 134are deemed to be currently in force (Source: WTO at http://wto.org).
18 Mexico is listed under Article XXIV (GATT) and Article V (GATS) as a Party to NAFTA and underthe Enabling Clause as a member of the Montevideo Treaty, establishing the Latin AmericanIntegration Association, and of two further agreements among developing countries, namely theProtocol relating to Trade Negotiations among Developing Countries and the Global System of TradePreferences.
18
refers to the growing network of overlapping trade regional and bilateral liberalisationregimes and the concomitant detailed rules of origin to secure their enforcement, andraises the question whether this helps or hinders the further development of amultilateral trading system (“building block” or “stumbling block”).
Table 4: Preferential Trade Agreements (PTAs) notified under GATT ArticleΧΧΧΧΧΧΧΧΙΙΙΙV, GATS Article V and the Enabling Clause, 1958–2000
Article ΧΧΙ V Article V Enabling Clause1958 - 1969 3 (1) 1 (1) 11970 - 1979 17 (14) 0 31980 - 1989 4 (2) 1 51990 - 1994 23 (7) 4 (3) 41995 - 2000 56 (8) 6 (5) 21958 - 2000 103 (32) 12 (9) 15
Source: WTO, own calculations. Notes: Allocation of PTAs, in force early 2000, according to date ofentry into force; figures in brackets represent number of PTAs in which the EuropeanCommunity participates.
According to Bhagwati et al. (1998), scepticism regarding Preferential TradeAgreements is allegedly gaining ground in intellectual as well as political quarters. Theauthors refer inter alia to a resolution of the EU Council of Ministers suggesting a“freeze” of the “current architecture“ of the EU’s trading system and thus a standstill onnew PTAs, particularly with “far-away” partners, except when a strong case can bemade satisfying several criteria.19 The EU-Mexico FTA apparently is such a case. Theintellectual case against preferential trade essentially relies on the risk of an inter-bloctrade war caused by discrimination, the emergence of a hub-and-spoke pattern ofinternational trade relations involving greater dominance of “peripheral” countries by“core” powers, and a reduced incentive to follow the multilateral route to free trade(Bhagwati and Krueger, 1995).
The sceptical school of thought also asserts that PTAs tend to create endogenousprotection, as member countries try to “export” the adjustment costs arising fromincreased internal competition by raising external trade barriers against non-members,e.g. in the form of anti-dumping duties. An example given to illustrate this possibility is
19 In the Amsterdam European Council conclusions, the EU calls for clarification of the rules for
regional trading agreements in the WTO, in order to guarantee the proper functioning of themultilateral trading system. For the criteria to be fulfilled by new preferential agreements see theCouncil of Ministers report as quoted in footnote 11.
19
the US accommodating imports from Mexico by reducing imports from Taiwan (usinganti-dumping actions against Taiwan), the most efficient non-member supplier, asMexico starts crowding out inefficient US producers. The increase of non-NAFTAtariffs in Mexico in 1995 (see above) is cited as a case in point to prove the practicalrelevance of the proposition (Bhagwati et al., 1998, p. 1131).20
A more benign view of PTAs is offered by the “domino theory” of regionalismaccording to which single (“idiosyncratic”) incidents of regionalism, such as thecompletion of the Single Market in Europe in 1992 or the Mexican proposal for an FTAwith the US (in the western hemisphere) in 1990, trigger a multiplier effect knockingdown bilateral import barriers like a row of dominos (Baldwin, 1993). It is thus the verydanger of trade diversion that would cause regionalism to spread further and initialdiscriminatory import restrictions to be removed in the process. Exporters in thirdcountries would lobby for membership or participation in the regional club in an attemptto secure a level playing field. Enlargement of the bloc would in turn further increasethe costs of non-participation and hence prompt a second round of pro-integration orpro-participation political activity, and so forth.
The process gains momentum from a supposed asymmetry in lobbying which isattributable, for instance, to the existence of sunk costs (owing to unrecoverableinvestments in connection with market entry) and related quasi-rents. Exporters wouldaccordingly fight harder to redress newly-created discrimination in trade than topromote further liberalisation erga omnes.21 Where membership or participation is notfeasible, as appears to be the case with NAFTA, the outsiders would turn elsewhere forcompensation, i.e. seek new preferential arrangements, as for instance Chile did in thecase of MERCOSUR, a move which has apparently also created domino effects of itsown. Regionalism or preferentialism, in this perspective, could be a “powerful force formultilateral liberalisation” (Baldwin, 1997, p. 885) by strengthening the power of pro-trade forces, i.e. exporters, while simultaneously weakening that of the key opponents offree trade, i.e. import competitors.
20 A formal demonstration is given in Bhagwati and Panagariya (1996, pp. 38-41) and Panagariya and
Findlay (1996).21 In this view, further liberalisation might end up in the dissipation of initially rising profits of exporting
companies, and hence limit their incentive to lobby for new export opportunities, whereas the samecompanies, in the event of a profit-reducing discrimination and subsequent reduction in trade, wouldface a relatively strong inducement to seek compensation and thus to preserve existing business.
20
The EU has contributed directly to the spread of preferentialism. It has created powerfulpressures for inclusion (Lawrence, 1996, p. 77) - witness the periodic expansions of theCommunity and the emergence of the European Economic Area in 1994; it has led to“responsive“ regionalism like that of EFTA (as a primer to inclusion) and possibly alsoNAFTA as well as - together with NAFTA - that of ASEAN;22 it has supported regionalintegration outside Europe, in particular in Latin America; and it is to some extent itselfa reaction to regionalism in other parts of the world, such as the western hemisphere, inorder to secure market access. The EU-Mexico FTA could accordingly be seen as aresponse to NAFTA and - by way of anticipation - to the Free Trade Area of theAmericas by forcing these regional agreements to open up.23 The reduction orelimination of potential negative effects for EU exporters of existing or planned FTAsin the western hemisphere is an important motive behind the EU’s FTA strategy.
European regionalism also induced other big players such as the US to push formultilateral liberalisation in order to limit the discriminatory consequences. This wasmost obvious in the early years of the European Community when US exporterssuccessfully sought to redress the harm caused to them by the Common Customs Tariffby inducing the US government to diminish the preference margins through most-favoured-nation tariff cuts agreed in the Kennedy Round of the GATT in the mid-1960s.It is less clear, to what extent the reverse causality holds - namely retardation in themultilateral process pushing regionalism as an alternative route. In this context, Baldwin(1997, p. 865) notes, that the same nations that steered multilateral liberalisation afterWorld War II also drove regional liberalisation. The big regional players are seeminglyalso big global players.
4. MODEL STRUCTURE
After highlighting essential features of the EU-Mexico FTA treaty and discussing EUand Mexican trade policy as well as the multilateral context, we now focus on theestimation of the trade effects of the agreement. The following ex ante estimates arebased on the model developed by Clague (1971, 1972). In the spirit of the “Armington”
22 „NAFTA and EC-1992 together induced ASEAN to initiate AFTA“ (Pelkmans and Brenton, 1997,
p. 1).23 For instance, raising (unbound) tariffs on non-NAFTA imports, as practised by Mexico during the
1995 peso crisis (see above), would no longer be possible vis-à-vis the EU.
21
assumption24, this model assumes product differentiation among supplying countries.More specifically, domestically produced and imported goods are considered to beimperfect substitutes in use. This assumption seems reasonable, since the vast majorityof EU-Mexico trade consists of manufactured goods and tariff rates for typicalhomogeneous products like raw materials or mineral fuels are either zero or very low.
Clague’s model is based on the normal assumptions of partial equilibrium analysis, suchas iso-elastic import-demand functions, no repercussions of changing trade flows onexchange rates or incomes, and, in its restricted version, infinite supply elasticities. Thelatter assumption, frequently applied in models of international trade, seems reasonablefor large countries like the European Union, but might be of some cause for concern inthe case of Mexico. The Mexican elasticity of supply is likely to be less than infinite.Within the analysis of the trade effects of the FTA, however, we can assume horizontalsupply curves for Mexico for two reasons. First, as shown above, the share of Mexicanexports to the EU as a percentage of total Mexican exports is rather small. Second, EUtariff rates on Mexican imports are, on aggregate, relatively low by world standards,reflecting the low overall level of the Common Customs Tariff and, in addition, reducedor zero tariff rates granted to Mexico under the Generalised System of Preferences. Forthese two reasons, the expected trade effects of the FTA on total Mexican exports arelikely to be small and the assumption of horizontal Mexican supply curves seemsappropriate.
To analyse the different trade effects of the FTA, let us consider a particular commoditycategory (M), such as shoes. The consumer wishes to maximize his utility
)1( ),M ,M ,(M f U 321=
where M1 and M2 denote imports of shoes from preferred and non-preferred countries;and M3 represents domestically produced shoes. The consumer allocates expenditureamong the three sub-categories Mi subject to his budget constraint
)2( ,MP MP MP Y 332211s ++=
24 See Armington (1969).
22
where Ys refers to the share of total income spent on shoes and Pi stands for the pricesof different shoes.
Consider now the impact of a tariff (t) elimination only on preferred imports M1. If thesupply elasticities are infinite, then the price of the beneficiaries’ imports P1 changes by
)3( .t+1
t=p
dp1
1 ∆
To measure the degree of substitution among the Mi, we use the Allen partial elasticityof substitution (σ).25 Therefore we can express the change in preferred imports thatreplaces domestic production, or trade creation (TC), as follows:26
)4( ,t+1
t h M TC dM 31311∆σ==
where h3 refers to the share of M3 in the consumption of shoes and σ31 to the elasticityof substitution between preferred imports and domestic production. The chain reactioncomes in two stages: first the tariff is eliminated only on M1 and P1 falls, and then theconsumer substitutes M1 against M3, and M3 declines.
Likewise, trade diversion (TD) is defined as the replacement of non-preferred with
preferred imports:
)5( ,t+1
t hM=TD=dM 21 1 22∆σ
where h1 refers to the share of M1 in the consumption of shoes and σ21 to the elasticityof substitution between preferred and non-preferred imports. The total trade expansionof M1 is therefore equal to the sum of trade creation and trade diversion.
25 See Allen (1962).26 See Clague (1971, 1972) for details. Income effects are neglected, since these would be extremely
small.
23
As can be seen from (4) and (5), estimation of TC and TD in the differentiated productmodel requires estimates of the partial elasticities of substitution between preferredimports and domestic production as well as between preferred and non-preferredimports. Empirical estimates for σ31 and σ21 at the disaggregated level, however, arelimited. As an alternative to σ31 we can use εm, which refers to the price elasticity oftotal import demand, since estimates for εm are available in the literature27, and rewrite(4) as follows:
)6( .t+1
t M=TC m1∆ε
Thus, we implicitly assume that the substitutability between beneficiaries’ imports anddomestic production is equal to the substitutability between total imports and domesticproduction.
For σ21 we apply the aggregated estimations of Faber and Siegers (1990), who estimatedEU elasticities of substitution between imports from various developing countries oforigin. In the case of Mexico we use the empirical estimates made by Hickman and Lau(1973) for developing countries with a similar resource endowment and import structureas Mexico. Even though these estimates are almost 30 years old, they are the only onesavailable. Consequently, we have to keep in mind that our estimations of trade creationand diversion contain possible biases, since tying the value of σ31 to the parameter εm
and the procedure for obtaining the value of σ21 have to be regarded as a simplifyingassumption.
5. EMPIRICAL RESULTS
Before we present the results of the projection of the trade effects of the free tradeagreement, let us first have a look at the methodology and the data used. The analysishas been carried out at the 3-digit level of the Standard International TradeClassification (SITC)28, tariff rates and domestic production were taken from the freetrade treaty (EC Commission, 2000) and the OECD Stan Database for IndustrialAnalysis (OECD, 1998), respectively. Furthermore, the conversion of key nontariff
27 See Faber and Siegers (1990) for the EU and Almon (1990) for Mexico.28 The trade data were optained from the OECD database on international trade (OECD, 1997).
24
barriers, in particular in the agricultural sector, into specific tariffs as part of the FTAaccord enables us to convert nontariff barriers into ad valorem tariff rates.
To simplify the calculation, only those commodity categories are included whose importvalue exceeds one million US-$. With this cut-off point, the analysis still covers 99.4%of total EU imports from Mexico and 99.8% of total Mexican imports from the EU in1997. Another simplification refers to the timing of trade liberalisation as stipulated inthe agreement. Under the terms of the FTA, tariffs and tariff-rate quotas will be reducedor eliminated within a period of 5 years for the most part, although a few import-sensitive goods are either excluded or tariffs for theses products will be phased out overten years. In our analysis, however, we have focused on the final stage of trade barrierelimination, instead of calculating the effects at each stage.
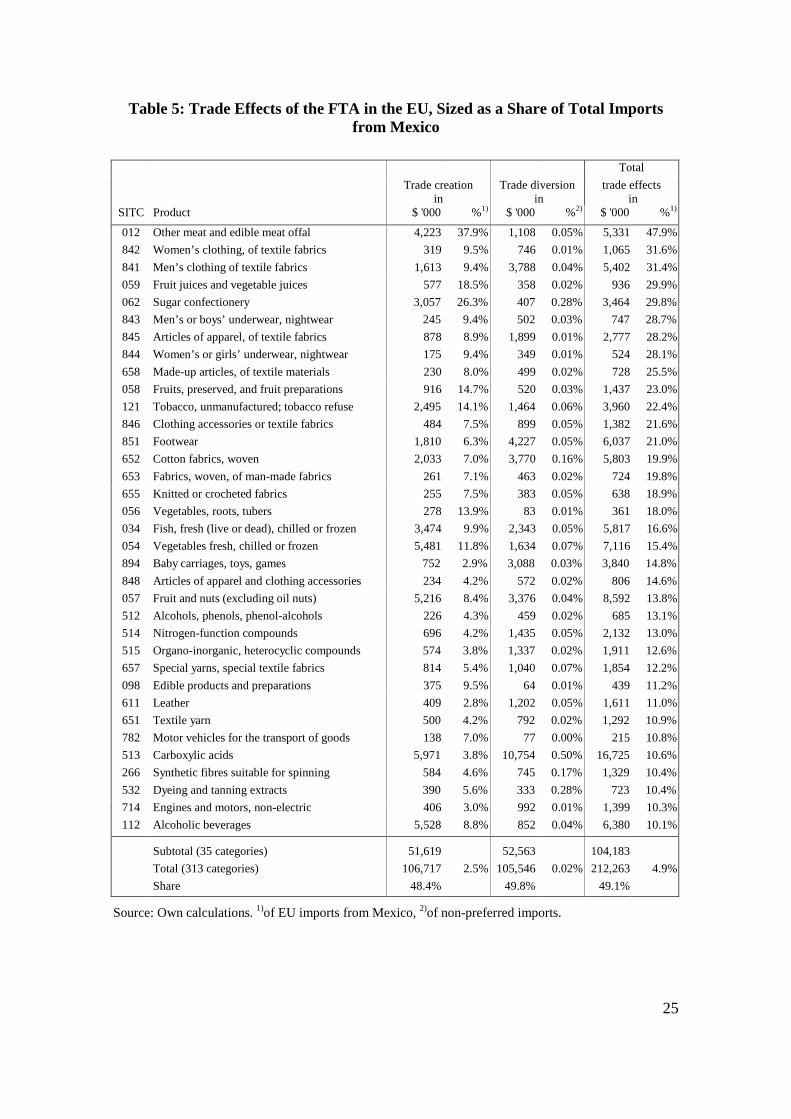
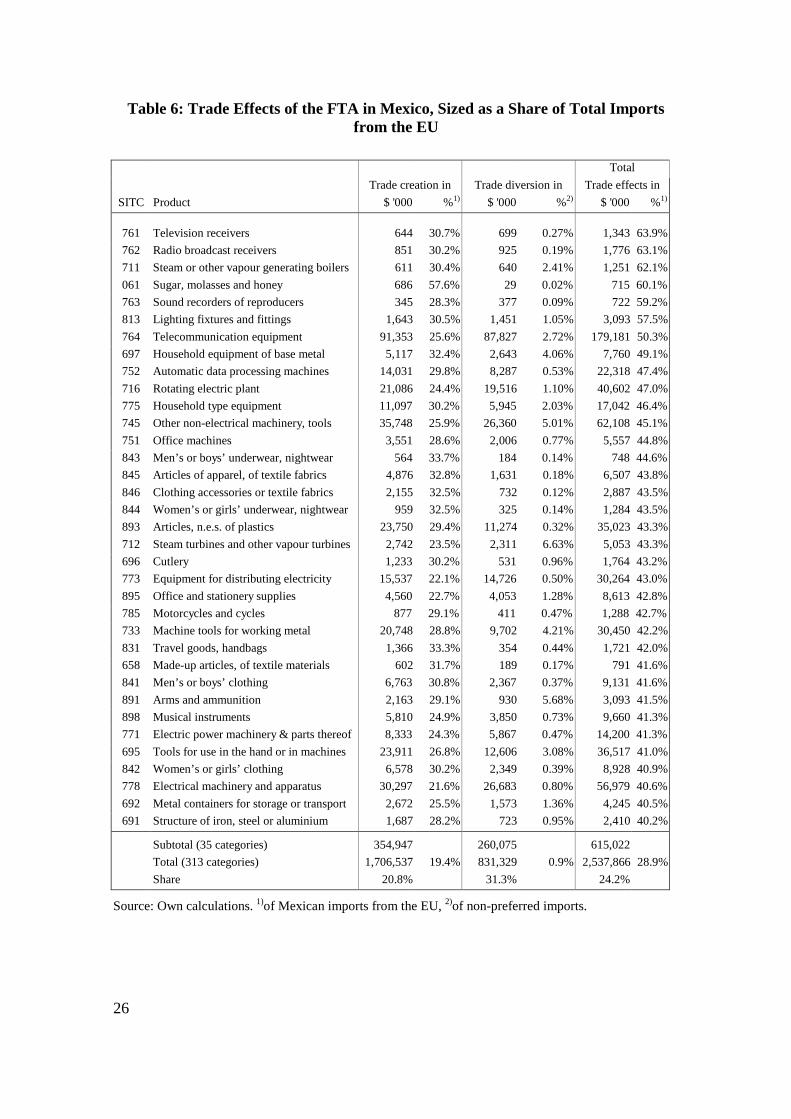
Let us now have a look at the projections of the FTA’s impact on trade. As can be seenfrom Table 5, total EU imports from Mexico increase by roughly $210 million or4.9%.29 Trade creation and trade diversion are both in the range of $105 million. EUgains in Mexico, on the other hand, are much higher with respect to both absolute andrelative trade effects: total Mexican imports from the EU are projected to rise by some$2.5 billion or 28.9%, with trade creation accounting for twice the value of tradediversion (see Table 6). The disproportionate EU gains are clearly due to considerablyhigher Mexican tariff rates, as Mexico already enjoyed privileged access to EU marketsdue to the Generalised System of Preferences. In addition, the higher estimatedelasticities of substitution between preferred and non-preferred imports (σ21),underlying the projections, as well as those between preferred imports and domesticproduction (σ31 or εm) indicate a greater degree of competition among exports toMexico.
Among EU exports to Mexico, Italy will be most affected by the FTA with total tradegains of 35.3% (EU average: 28.9%). This is clearly due to above-average Mexicantrade barriers in particular categories where Italian exporters dominate EU exports toMexico. French, Spanish, and German exports to Mexico are estimated to rise by29.6%, 29.3%, and 29.0%, respectively, whereas the corresponding figure for GreatBritain amounts to 26.2%.
29 As has been mentioned before, partial equilibrium analysis is best used to identify those disaggregated
commodities that will be particularly affected by the FTA. Nevertheless, we also present theaggregated trade effects to give some impressions about the order of magnitude.
25
Table 5: Trade Effects of the FTA in the EU, Sized as a Share of Total Importsfrom Mexico
TotalTrade creation
inTrade diversion
intrade effects
inSITC Product $ '000 %1) $ '000 %2) $ '000 %1)
012 Other meat and edible meat offal 4,223 37.9% 1,108 0.05% 5,331 47.9%842 Women’s clothing, of textile fabrics 319 9.5% 746 0.01% 1,065 31.6%841 Men’s clothing of textile fabrics 1,613 9.4% 3,788 0.04% 5,402 31.4%059 Fruit juices and vegetable juices 577 18.5% 358 0.02% 936 29.9%062 Sugar confectionery 3,057 26.3% 407 0.28% 3,464 29.8%843 Men’s or boys’ underwear, nightwear 245 9.4% 502 0.03% 747 28.7%845 Articles of apparel, of textile fabrics 878 8.9% 1,899 0.01% 2,777 28.2%844 Women’s or girls’ underwear, nightwear 175 9.4% 349 0.01% 524 28.1%658 Made-up articles, of textile materials 230 8.0% 499 0.02% 728 25.5%058 Fruits, preserved, and fruit preparations 916 14.7% 520 0.03% 1,437 23.0%121 Tobacco, unmanufactured; tobacco refuse 2,495 14.1% 1,464 0.06% 3,960 22.4%846 Clothing accessories or textile fabrics 484 7.5% 899 0.05% 1,382 21.6%851 Footwear 1,810 6.3% 4,227 0.05% 6,037 21.0%652 Cotton fabrics, woven 2,033 7.0% 3,770 0.16% 5,803 19.9%653 Fabrics, woven, of man-made fabrics 261 7.1% 463 0.02% 724 19.8%655 Knitted or crocheted fabrics 255 7.5% 383 0.05% 638 18.9%056 Vegetables, roots, tubers 278 13.9% 83 0.01% 361 18.0%034 Fish, fresh (live or dead), chilled or frozen 3,474 9.9% 2,343 0.05% 5,817 16.6%054 Vegetables fresh, chilled or frozen 5,481 11.8% 1,634 0.07% 7,116 15.4%894 Baby carriages, toys, games 752 2.9% 3,088 0.03% 3,840 14.8%848 Articles of apparel and clothing accessories 234 4.2% 572 0.02% 806 14.6%057 Fruit and nuts (excluding oil nuts) 5,216 8.4% 3,376 0.04% 8,592 13.8%512 Alcohols, phenols, phenol-alcohols 226 4.3% 459 0.02% 685 13.1%514 Nitrogen-function compounds 696 4.2% 1,435 0.05% 2,132 13.0%515 Organo-inorganic, heterocyclic compounds 574 3.8% 1,337 0.02% 1,911 12.6%657 Special yarns, special textile fabrics 814 5.4% 1,040 0.07% 1,854 12.2%098 Edible products and preparations 375 9.5% 64 0.01% 439 11.2%611 Leather 409 2.8% 1,202 0.05% 1,611 11.0%651 Textile yarn 500 4.2% 792 0.02% 1,292 10.9%782 Motor vehicles for the transport of goods 138 7.0% 77 0.00% 215 10.8%513 Carboxylic acids 5,971 3.8% 10,754 0.50% 16,725 10.6%266 Synthetic fibres suitable for spinning 584 4.6% 745 0.17% 1,329 10.4%532 Dyeing and tanning extracts 390 5.6% 333 0.28% 723 10.4%714 Engines and motors, non-electric 406 3.0% 992 0.01% 1,399 10.3%112 Alcoholic beverages 5,528 8.8% 852 0.04% 6,380 10.1%
Subtotal (35 categories) 51,619 52,563 104,183Total (313 categories) 106,717 2.5% 105,546 0.02% 212,263 4.9%Share 48.4% 49.8% 49.1%
Source: Own calculations. 1)of EU imports from Mexico, 2)of non-preferred imports.
26
Table 6: Trade Effects of the FTA in Mexico, Sized as a Share of Total Importsfrom the EU
TotalTrade creation in Trade diversion in Trade effects in
SITC Product $ '000 %1) $ '000 %2) $ '000 %1)
761 Television receivers 644 30.7% 699 0.27% 1,343 63.9%762 Radio broadcast receivers 851 30.2% 925 0.19% 1,776 63.1%711 Steam or other vapour generating boilers 611 30.4% 640 2.41% 1,251 62.1%061 Sugar, molasses and honey 686 57.6% 29 0.02% 715 60.1%763 Sound recorders of reproducers 345 28.3% 377 0.09% 722 59.2%813 Lighting fixtures and fittings 1,643 30.5% 1,451 1.05% 3,093 57.5%764 Telecommunication equipment 91,353 25.6% 87,827 2.72% 179,181 50.3%697 Household equipment of base metal 5,117 32.4% 2,643 4.06% 7,760 49.1%752 Automatic data processing machines 14,031 29.8% 8,287 0.53% 22,318 47.4%716 Rotating electric plant 21,086 24.4% 19,516 1.10% 40,602 47.0%775 Household type equipment 11,097 30.2% 5,945 2.03% 17,042 46.4%745 Other non-electrical machinery, tools 35,748 25.9% 26,360 5.01% 62,108 45.1%751 Office machines 3,551 28.6% 2,006 0.77% 5,557 44.8%843 Men’s or boys’ underwear, nightwear 564 33.7% 184 0.14% 748 44.6%845 Articles of apparel, of textile fabrics 4,876 32.8% 1,631 0.18% 6,507 43.8%846 Clothing accessories or textile fabrics 2,155 32.5% 732 0.12% 2,887 43.5%844 Women’s or girls’ underwear, nightwear 959 32.5% 325 0.14% 1,284 43.5%893 Articles, n.e.s. of plastics 23,750 29.4% 11,274 0.32% 35,023 43.3%712 Steam turbines and other vapour turbines 2,742 23.5% 2,311 6.63% 5,053 43.3%696 Cutlery 1,233 30.2% 531 0.96% 1,764 43.2%773 Equipment for distributing electricity 15,537 22.1% 14,726 0.50% 30,264 43.0%895 Office and stationery supplies 4,560 22.7% 4,053 1.28% 8,613 42.8%785 Motorcycles and cycles 877 29.1% 411 0.47% 1,288 42.7%733 Machine tools for working metal 20,748 28.8% 9,702 4.21% 30,450 42.2%831 Travel goods, handbags 1,366 33.3% 354 0.44% 1,721 42.0%658 Made-up articles, of textile materials 602 31.7% 189 0.17% 791 41.6%841 Men’s or boys’ clothing 6,763 30.8% 2,367 0.37% 9,131 41.6%891 Arms and ammunition 2,163 29.1% 930 5.68% 3,093 41.5%898 Musical instruments 5,810 24.9% 3,850 0.73% 9,660 41.3%771 Electric power machinery & parts thereof 8,333 24.3% 5,867 0.47% 14,200 41.3%695 Tools for use in the hand or in machines 23,911 26.8% 12,606 3.08% 36,517 41.0%842 Women’s or girls’ clothing 6,578 30.2% 2,349 0.39% 8,928 40.9%778 Electrical machinery and apparatus 30,297 21.6% 26,683 0.80% 56,979 40.6%692 Metal containers for storage or transport 2,672 25.5% 1,573 1.36% 4,245 40.5%691 Structure of iron, steel or aluminium 1,687 28.2% 723 0.95% 2,410 40.2%
Subtotal (35 categories) 354,947 260,075 615,022Total (313 categories) 1,706,537 19.4% 831,329 0.9% 2,537,866 28.9%Share 20.8% 31.3% 24.2%
Source: Own calculations. 1)of Mexican imports from the EU, 2)of non-preferred imports.
27
Looking beyond the overall trade effects, there are considerable differences at theproduct level in both Mexico and the EU. Mexico will benefit in the fields ofagricultural and semi-finished products in particular. More specifically, as shown inTable 5, of the leading 35 commodities affected in the EU and sized as a share of therespective total imports from Mexico, all but 9 are food and live animals (SITC 0),organic chemicals (51), textiles (65), and apparel and clothing (84). These keycommodity groups show above-average total trade gains in the range of 10% to 48%.Projected trade increases are largely due to high protection levels for individualcommodities.
European exporters, on the other hand, will see above-average gains in Mexico infinished products (see Table 6). These include metal manufactures (69), machinery andtransport equipment (7), and miscellaneous manufactured articles (8) with total tradeincreases up to 64%. Trade gains in these product categories arise from high Mexicantariff rates, high ratios of imports to domestic production and keen competition fromother exporters to Mexico for individual commodities.
Looking at trade effects in absolute terms, a similar picture emerges. With only 35 outof a total of 313 categories, we can explain almost 50% of total trade effects in the EUin absolute terms, which strengthens the impression that these are the categories thatwill be affected most. In Mexico, however, trade effects in absolute terms are morescattered: the above-mentioned 35 categories make up only 24% of total trade effects.
Trade creation and diversion are roughly equal in the EU (some $105 million), while inMexico the trade created ($1.7 billion) clearly dominates the trade diverted ($830million), as can be seen from Tables 5 and 6. From an economic perspective, tradecreation is welfare improving, as consumers substitute lower cost beneficiary importsfor domestically produced goods. Trade diversion, however, will reduce welfare as amore efficient source of imports will be displaced by a higher cost producer.
But which are the countries that will “loose” markets shares? While trade diversion inthe EU is relatively small and widely dispersed, in the case of Mexico it is concentratedon the United States, Japan, and Canada, since these are the leading exporters to Mexicoin the particularly affected categories. US exports to Mexico will decrease by $685million or 0.8%, whereas Japanese and Canadian exporters see their exports decline by$28 million (1.1%) and $12 million (0.9%), respectively. In the case of the United
28
States and Canada, the projected reductions in exports have to be seen as an erosion ofNAFTA members’ preferences and will offset some of their trade gains since NAFTAcame into force in 1994.
6. CONCLUDING REMARKS
Regionalism or preferentialism is a major element of European as well as Mexican tradepolicy. Moreover, it goes beyond economics into the area of politics such as foreignpolicy in the case of the EU and domestic policy in the Mexican case. EU and Mexicanpreferential trade policies have apparently caused no serious harm to third countries thusfar and are rather unlikely to do so in future. The bilateral EU-Mexico FTA seems to beno exception to this. It strengthens economic links across the Atlantic and adds an inter-regional dimension to regional integration processes on both sides, which may by andlarge make them more compatible with multilateral trade liberalisation.
Since the EU-Mexico FTA discriminates in favour of the member countries, beneficiaryimports will not only displace domestic production but also imports from non-membercountries. The estimation of the trade effects has been carried out within a partialequilibrium framework and the results can be summarised as follows: First,considerable trade effects can be expected in a narrow range of products - agriculturaland semi-finished products in the case of Mexico and finished products like machineryand transport equipment for the EU; second, the EU is likely to gain much more thanMexico; third, trade creation clearly dominates trade diversion; and, fourth, the UnitedStates in particular will see its trade diverted in Mexico in absolute terms.
As a result of using a static partial equilibrium model to estimate trade effects, we haveneglected potential positive dynamic effects in our analysis. Positive income effects,due to explored economies of scale in an expanded market, for instance, will accelerategrowth rates in member countries. Besides the fact that this will increase EU andMexican gains from the FTA, accelerating growth rates will also lead to a rise in overallimport demand. This could offset some or all of trade diverting effects on non-membercountries.
In addition, investment diversion might occur, as stimulation of inward foreign directinvestment follows from the removal of investment barriers and from tradeliberalisation alike. This occurs because the latter allows the import of intermediate
29
products without paying duties. Growing export-oriented foreign direct investment byEuropean companies in Mexico could in turn switch exports to the US from Europeanlocations to Mexican plants of EU subsidiaries. Such unexpected trade diversion at thefinal-product stage would, however, at least to some extent and constrained by the rulesof origin applying in NAFTA, be offset by trade creation at the intermediate-productstage.
In many cases, exports of European affiliates within Mexico would also come inaddition to, rather than at the expense of, respective sales of their parent or sistercompanies in Europe. Particularly in industries such as automobiles and machinery,Mexico could become increasingly important for European firms wishing to break intothe US market. Conversely, US firms could use the EU-Mexico FTA to relocateEuropean-bound exports from domestic to Mexican sources or increase exports toEurope via subsidiaries producing in Mexico. To sum up, whereas the EU will profitfrom trade creation for the most part, Mexico, as a point of entry to the World’s twobiggest trading blocs, will improve its position as a location for foreign directinvestment.
30
References
Allen, Roy G.D. (1962), Mathematical Analysis for Economists, London: Macmillan.Almon, Clopper (1990), Individual Effects of a North American Free Trade Agreement
Between Mexico and the USA, Springfield (VA): US Department of Labour.Armington, Paul S. (1969), A Theory of Demand for Products Distinguished by Place of
Production, International Monetary Fund Staff Papers, Vol. 16, pp. 159-178.
Baldwin, Richard E. (1993), A Domino Theory of Regionalism, NBER Working PaperNo. 4465, Cambridge, MA: NBER.
Baldwin, Richard E. (1997), The Causes of Regionalism, The World Economy, Vol. 20,No.7, pp. 865-888.
Baldwin, Robert E. and Tracy Murray (1977), MFN Tariff Reductions and DevelopingCountry Trade Benefits under the GSP, The Economic Journal, Vol. 87, pp. 30-46.
Bhagwati, Jagdish (1995), U.S. Trade Policy: the Infatuation with Free Trade Areas, inJagdish Bhagwati and Anne Krueger (eds.), The Dangerous Drift to PreferentialTrade Agreements, Washington, D.C.: American Enterprise Institute.
Bhagwati, Jagdish and Anne Krueger (1995), The Dangerous Drift to Preferential TradeAgreements, Washington, D.C.: American Enterprise Institute.
Bhagwati, Jagdish; David Greenaway and Arvind Panagariya (1998), TradingPreferentially: Theory and Policy, in The Economic Journal, Vol. 100, pp. 1128-1148.
Bhagwati, Jagdish and Arvind Panagariya (1996), Preferential Trading Areas andMultilateralism: Strangers, Friends or Foes? In: Jagdish Bhagwati and ArvindPanagariya (eds.), The Economics of Preferential Trade Agreements,Washington, D.C.: American Enterprise Institute.
Bleaney, Michael (1999), Trade Reform, Macroeconomic Performance and ExportGrowth in Ten Latin American Countries, 1979-95, The Journal of InternationalTrade & Economic Development, Vol. 8, No. 1, pp. 89-105.
Borrell, Brent and Lionel Hubbard (2000), Global Economic Effects of the EU CommonAgricultural Policy, Economic Affairs, Vol. 20, No. 2.
Brenton, Paul (1996), The Effects of the Association Agreements on the Exports ofIndustrial Products of Latin American Countries to the EU, Brussels: Centre forEuropean Policy Studies (mimeo).
Clague, Christopher K. (1971), Tariff Preferences and Separable Utility, AmericanEconomic Review, Papers and Proceedings, Vol. 61, pp. 188-194.
Clague, Christopher K. (1972), The Trade Effects of Tariff Preferences, SouthernEconomic Journal, Vol. 38, No. 3, pp. 379-388.
EC Commission (2000), Free Trade Agreement between the European Union and theUnited Mexican States, optained from the homepage of the EC Commission:http://europa.eu.int/comm/trade/bilateral/mexico/fta.htm.
Estevadeordal, Antoni (2000), Negotiating Preferential Market Access: the Case of theNorth American Free Trade Agreement, Journal of World Trade, Vol. 34, No. 1,pp. 141-166.
31
Faber, Gerrit and Siegers, Jacques J. (1990), Price Elasticities of EC Imports byRegion of Origin: a System Approach, Weltwirtschaftliches Archiv, Vol. 126, No.2, pp. 370-377.
Hanson, Gordon and Ann Harrison (1999), Trade Liberalisation and Wage Inequalityin Mexico, Industrial and Labour Relations Review, Vol. 52, No. 2, pp. 271-288.
Hanson, Gordon and Ann Harrison (1999), Who Gains from Trade Reform? SomeRemaining Puzzles, NBER Working Paper No. 6915, Cambridge, MA: NBER.
Hickman, Bert G. and Lawrence J. Lau (1973), Elasticities of Substitution and ExportDemands in a World Trade Model, European Economic Review, Vol. 4,pp. 347-380.
IRELA (2000), The Mexico-EU Free Trade Agreement: the Cornerstone of a FullPartnership, IRELA Briefing, 21 March, Madrid: IRELA.
Krueger, Ann O. (1993), Free Trade Agreements as Protectionist Devices: Rules ofOrigin, NBER Working Paper No. 4352, Cambridge, MA: NBER.
Lawrence, Robert Z. (1996), Regionalism, Multilateralism, and Deeper Integration,Washington, DC: The Brookings Institution.
OECD (1997), Foreign Trade by Commodities 1997, Paris: OECD (on CD ROM).OECD (1998), Stan Database for Industrial Analysis, Paris: OECD (on CD ROM).
Panagariya, Arvind and Ronald Findlay (1996), A Political Economy Analysis of FreeTrade Areas and Customs Unions, in Robert Feenstra, Gene Grossman andDouglas Irwin (eds.), The Political Economy of Trade Policy: Essays in Honourof Jagdish Bhagwati, Cambridge, MA: MIT Press.
Pelkmans, Jacques Paul Brenton (1997), Free Trade with the EU: Driving Forces andthe Effects of “me-too“, CEPS Working Document No. 110, Brussels: CEPS.
Preuße, Heinz-Gert (2000), Sechs Jahre Nordamerikanisches Freihandelsabkommen(NAFTA) – Eine Bestandsaufnahme, Tübinger Diskussionsbeitrag Nr. 183,Tübingen: University of Tübingen.
Sapir, André (1998), The Political Economy of EC Regionalism, European EconomicReview, Vol. 42, No. 3, pp. 717-732.
United States Trade Representative (2000), 1999 Trade Policy Agenda and 1998Annual Report of the President of the President of the United States on the TradeAgreements Program, Washington, D.C.: US Government Printing Office.
Viner, Jacob (1950), The Customs Union Issue, New York: Carnegie-MellonUniversity.
Whalley, John (1993), Regional Trade Arrangements in North America: CUSTA andNAFTA, in Jaime De Melo and Arvind Panagariya (eds.), New Dimensions inRegional Integration, Cambridge: Cambridge University Press.
WTO (2000a), Trade Policy Review: The European Union. Report by the Secretariat,WT/TPR/S/72, June 14 (mimeo).
WTO (2000b), Trade Policy Review: The European Union. Report by the Government,WT/TPR/G/72, June 14 (mimeo).